As filed with the Securities and
Exchange Commission on December 24, 2014
Securities Act Registration No.
333-60561
Investment Company Act Registration No.
811-08915
UNITED STATES
SECURITIES AND EXCHANGE COMMISSION
WASHINGTON, D.C. 20549
WASHINGTON, D.C. 20549
FORM N-1A
REGISTRATION STATEMENT UNDER THE
SECURITIES ACT OF 1933
PRE-EFFECTIVE AMENDMENT NO.
PRE-EFFECTIVE AMENDMENT NO.
POST-EFFECTIVE AMENDMENT NO. 34 (X)
and/or
REGISTRATION STATEMENT UNDER THE
INVESTMENT COMPANY ACT OF 1940
POST-EFFECTIVE AMENDMENT NO. 34 (X)
Check appropriate box or boxes
POST-EFFECTIVE AMENDMENT NO. 34 (X)
Check appropriate box or boxes
Prudential Investment Portfolios
16
Exact name of registrant as specified in
charter
Gateway Center Three, 4th
floor
100 Mulberry Street
100 Mulberry Street
Newark, New Jersey 07102
Address of Principal Executive Offices including
Zip Code
(973) 367-7521
Registrant’s Telephone Number, Including
Area Code
Deborah A. Docs
Gateway Center Three, 4th floor
100 Mulberry Street
100 Mulberry Street
Newark, New Jersey 07102
Name and Address of Agent for Service
It is proposed that this filing will
become effective:
__ immediately upon filing
pursuant to paragraph (b)
(X) on December 26, 2014 pursuant to paragraph (b)
__ 60 days after filing pursuant to paragraph (a)(1)
__ on (____) pursuant to paragraph (a)(1)
__ 75 days after filing pursuant to paragraph (a)(2)
__ on (date) pursuant to paragraph (a)(2) of Rule 485
(X) on December 26, 2014 pursuant to paragraph (b)
__ 60 days after filing pursuant to paragraph (a)(1)
__ on (____) pursuant to paragraph (a)(1)
__ 75 days after filing pursuant to paragraph (a)(2)
__ on (date) pursuant to paragraph (a)(2) of Rule 485
If appropriate, check the
following box:
__ this post-effective amendment designates a new effective date for a previously filed post-effective amendment.
__ this post-effective amendment designates a new effective date for a previously filed post-effective amendment.

PRUDENTIAL INVESTMENTS
» MUTUAL FUNDS
Prudential
Defensive Equity Fund
PROSPECTUS
• December 26, 2014


Table of Contents
FUND SUMMARY
INVESTMENT OBJECTIVE
The investment objective of the
Fund is to seek long-term capital appreciation.
FUND FEES AND EXPENSES
The tables below describe the sales
charges, fees and expenses that you may pay if you buy and hold shares of the Fund. You may qualify for sales charge discounts if you and an eligible group of related investors purchase, or agree to purchase in the
future, $25,000 or more in shares of the Fund or other funds in the Prudential Investments family of funds. More information about these discounts is available from your financial professional and is explained in
Reducing or Waiving Class A's Initial Sales Charge on page 23 of the Fund's Prospectus and in Rights of Accumulation on page 57 of the Fund's Statement of Additional Information (SAI).
| Shareholder Fees (fees paid directly from your investment) | |||||
| Class A | Class B | Class C | Class R | Class Z | |
| Maximum sales charge (load) imposed on purchases (as a percentage of offering price) | 5.50% | None | None | None | None |
| Maximum deferred sales charge (load) (as percentage of the lower of original purchase price or net asset value at redemption) | 1% | 5% | 1% | None | None |
| Maximum sales charge (load) imposed on reinvested dividends and other distributions | None | None | None | None | None |
| Redemption fee | None | None | None | None | None |
| Exchange fee | None | None | None | None | None |
| Maximum account fee (accounts under $10,000) | $15 | $15 | $15 | None | None |
| Annual Fund Operating Expenses (expenses that you pay each year as a percentage of the value of your investment) | |||||
| Class A | Class B | Class C | Class R | Class Z | |
| Management fees | .75% | .75% | .75% | .75% | .75% |
| + Distribution and service (12b-1) fees | .30 | 1.00 | 1.00 | .75 | None |
| + Other expenses | .40 | .40 | .40 | .40 | .40 |
| = Total annual Fund operating expenses | 1.45 | 2.15 | 2.15 | 1.90 | 1.15 |
| – Fee waiver and/or expense reimbursement | (.05) | None | None | (.25) | None |
| = Total annual Fund operating expenses after fee waiver reimbursement and/or expense reimbursement(1) | 1.40 | 2.15 | 2.15 | 1.65 | 1.15 |
(1)The distributor has contractually agreed through February 29, 2016 to reduce its distribution and service (12b-1) fees for Class A shares to an annual rate of
..25% of the average daily net assets of Class A shares and its distribution and service (12b-1) fees for Class R shares to an annual rate of .50% of the average daily net assets of Class R shares. These waivers may
not be terminated prior to February 29, 2016 without the prior approval of the Fund's Board of Trustees.
Example. The following hypothetical example is intended to help you compare the cost of investing in the Fund with the cost of investing in other mutual funds. It assumes that you invest $10,000 in
the Fund for the time periods indicated and then, except as indicated, redeem all your shares at the end of those periods. It assumes a 5% return on your investment each year, that the Fund's operating expenses remain
the same (except that fee waivers or reimbursements, if any, are only reflected in the 1-Year figures) and that all dividends and distributions are reinvested. Your actual costs may be higher or lower.
| If Shares Are Redeemed | If Shares Are Not Redeemed | |||||||
| Share Class | 1 Year | 3 Years | 5 Years | 10 Years | 1 Year | 3 Years | 5 Years | 10 Years |
| Class A | $685 | $979 | $1,294 | $2,186 | $685 | $979 | $1,294 | $2,186 |
| Class B | $718 | $973 | $1,254 | $2,222 | $218 | $673 | $1,154 | $2,222 |
| Class C | $318 | $673 | $1,154 | $2,483 | $218 | $673 | $1,154 | $2,483 |
| Class R | $168 | $573 | $1,003 | $2,202 | $168 | $573 | $1,003 | $2,202 |
| Class Z | $117 | $365 | $633 | $1,398 | $117 | $365 | $633 | $1,398 |
| Visit our website at www.prudentialfunds.com | 3 |
Portfolio
Turnover. The Fund pays transaction costs, such as commissions, when it buys and sells securities (or “turns over” its portfolio). A higher portfolio turnover rate may indicate higher
transaction costs and may result in higher taxes when Fund shares are held in a taxable account. These costs, which are not reflected in annual fund operating expenses or in the example, affect the Fund's performance.
During the Fund's most recent fiscal period, the Fund's portfolio turnover rate was 20% of the average value of its portfolio.
INVESTMENTS, RISKS AND
PERFORMANCE
Principal Investment
Strategies. The Fund seeks to achieve its investment objective by investing in a well diversified portfolio of equity and equity-related securities. Under normal market conditions, the Fund will
invest at least 80% of its investable assets (net assets plus borrowings for investment purposes, if any) in equity and equity-related securities. For purposes of this 80% policy, equity and equity-related securities
include (i) common and preferred stock (and securities convertible into, or that the subadviser expects to be exchanged for, common or preferred stock), (ii) exchange-traded funds (ETFs), and (iii) synthetic
instruments and derivatives that have economic characteristics that are similar to equity securities, including certain options, futures, swaps, and exchange-traded notes (ETNs) whose interest or principal payments
are linked to one or more equity securities or equity indices. The subadviser will evaluate investments across equity market sectors, based on a variety of factors, including but not limited to momentum, valuation,
volatility and correlation, and will allocate and periodically rebalance the Fund’s portfolio across the different sectors based on changes in these factors. The subadviser may also use risk mitigation
techniques to reduce downside risk. Investment decisions will be determined using a combination of quantitative tools and the judgment of the subadviser's investment professionals.
The Fund may invest in securities
of any market capitalization. The Fund may invest up to 20% of its investable assets in debt securities of varying credit quality. The Fund may invest up to 20% of total assets in securities of foreign issuers. The
Fund may invest up to 25% of its net assets in derivatives. Although the Fund is not limited in the types of derivatives it can use, the Fund currently expects that its principal investments in derivative instruments
will include investments in futures contracts, but the Fund may also invest in options and swaps.
The Fund will provide 60
days’ prior written notice to shareholders of a change in its non-fundamental policy of investing at least 80% of its investable assets in equity and equity-related securities. The Fund may actively and
frequently trade its portfolio securities.
Principal Risks of Investing in the
Fund. All investments have risks to some degree. Loss of money is a risk of investing in the Fund. Please remember that an investment in the Fund is not guaranteed to achieve its investment
objective; is not a deposit with a bank; is not insured, endorsed or guaranteed by the Federal Deposit Insurance Corporation or any other government agency; and is subject to investment risks, including possible loss
of your original investment.
Market
Events. The global financial crisis that began in 2008 has caused a significant decline in the value and liquidity of many securities and unprecedented volatility in the markets. In response to
the crisis, the US Government and the Federal Reserve, as well as certain foreign governments and their central banks, have taken steps to support financial markets, including keeping interest rates low. The
withdrawal of this support, failure of efforts in response to the crisis, or investor perception that such efforts are not succeeding could negatively affect financial markets generally as well as the value and
liquidity of certain securities.
This environment could make
identifying investment risks and opportunities especially difficult for the subadviser, and whether or not the Fund invests in securities of issuers located in or with significant exposure to countries experiencing
economic and financial difficulties, the value and liquidity of the Fund’s investments may be negatively affected. In addition, policy and legislative changes in the United States and other countries are
changing many aspects of financial regulation. The impact of these changes on the markets, and the practical implications for market participants, may not be fully known for some time.
| 4 | Prudential Defensive Equity Fund |
Risk of Increase in Expenses. Your actual cost of investing in the Fund may be higher than the expenses shown in the expense table for a variety of reasons. For example, expense ratios may be higher than those shown if
average net assets decrease. Net assets are more likely to decrease and Fund expense ratios are more likely to increase when markets are volatile. Active and frequent trading of Fund securities can increase
expenses.
Equity and Equity-Related Securities
Risks. The value of a particular security could go down and you could lose money. In addition to an individual security losing value, the value of the equity markets or a sector in which the
Fund invests could go down. The Fund's holdings can vary significantly from broad market indexes and the performance of the Fund can deviate from the performance of these indexes. Different parts of a market can react
differently to adverse issuer, market, regulatory, political and economic developments.
The Fund may invest in companies
that reinvest their earnings rather than distribute them to shareholders. To the extent the Fund does invest in such companies, the Fund is not likely to receive significant dividend income on its portfolio
securities.
Large Capitalization Company
Risk. Companies with large market capitalizations go in and out of favor based on market and economic conditions. Larger companies tend to be less volatile than companies with smaller market
capitalizations. In exchange for this potentially lower risk, the Fund's value may not rise or fall as much as the value of funds that emphasize companies with smaller market capitalizations.
Sector Focused Investing Risk. The risk that events negatively affecting an industry or market sector in which the Fund focuses its investments will cause the value of the Fund’s shares to decrease, perhaps
significantly.
Derivatives Risk. The Fund may engage in a variety of transactions using “derivatives,” such as futures, options, forwards and swaps. Derivatives are financial instruments whose value depends
upon, or is derived from, the value of something else, such as one or more underlying investments, indexes or currencies. Derivatives may be traded on organized exchanges, or in individually negotiated transactions
with other parties (these are known as “over-the-counter” derivatives). The Fund will use derivatives both for hedging purposes (to seek to reduce risk) and for non-hedging purposes (to seek to increase
return consistent with the Fund's investment objective). Although the Fund has the flexibility to make use of derivatives, it may choose not to for a variety of reasons, even under very volatile market
conditions.
Derivatives involve special risks
and costs and may result in losses to the Fund. The successful use of derivatives requires sophisticated management, and, to the extent that derivatives are used, the Fund will depend on the investment subadviser's
ability to analyze and manage derivatives transactions. The prices of derivatives may move in unexpected ways, especially in abnormal market conditions. Some derivatives are “leveraged” and therefore may
magnify or otherwise increase investment losses to the Fund. The Fund's use of derivatives may also increase the amount of taxes payable by shareholders.
Other risks arise from the
potential inability to terminate or sell derivatives positions. A liquid secondary market may not always exist for the Fund's derivatives positions at any time. In fact, many over-the-counter derivative instruments
will not have liquidity beyond the counterparty to the instrument. Over-the-counter derivative instruments also involve the risk that the other party will not meet its obligations to the Fund.
Recent legislation calls for new
regulation of the derivatives markets. The extent and impact of the regulation is not yet known and may not be known for some time. New regulation of derivatives may make them more costly, may limit their
availability, or may otherwise adversely affect their value or performance.
Management Risk. Actively managed mutual funds are subject to management risk. The subadviser will apply investment techniques and risk analyses in making investment decisions for the Fund, but there can
be no guarantee that these techniques will produce the desired results. Additionally, the securities selected by the subadviser may underperform the markets in general, the Fund’s benchmark and other mutual
funds with similar investment objectives.
| Visit our website at www.prudentialfunds.com | 5 |
Portfolio Turnover Risk. The length of time the Fund has held a particular security is not generally a consideration in investment decisions. Under certain market conditions, the Fund’s turnover rate may be
higher than that of other mutual funds. Portfolio turnover generally involves some expense to the Fund, including brokerage commissions or dealer mark-ups and other transaction costs on the sale of securities and
reinvestment in other securities. These transactions may result in realization of taxable capital gains. The trading costs and tax effects associated with portfolio turnover may adversely affect the Fund’s
investment performance.
Market Risk. The securities markets are volatile and the market prices of the Fund’s securities may decline. Securities fluctuate in price based on changes in an issuer’s financial
condition and overall market and economic conditions. If the market prices of the securities owned by the Fund fall, the value of your investment in the Fund will decline.
For more information on the risks
of investing in this Fund, please see How the Fund Invests—Investment Risks in the Prospectus and Investment Risks and Considerations in the SAI.
The Fund's Past
Performance. The following bar chart shows the Fund's performance for the Class A share class for each full calendar year of operations or for the last 10 calendar years, whichever is shorter. The bar chart and Average Annual Total Returns table demonstrate the risk
of investing in the Fund by showing how returns can change from year to year and by showing how the Fund's average annual total returns for the share class compare with a broad-based securities market index and a
group of similar mutual funds.
Past performance (before and after
taxes) does not mean that the Fund will achieve similar results in the future. Updated Fund performance information is available online at www.prudentialfunds.com.
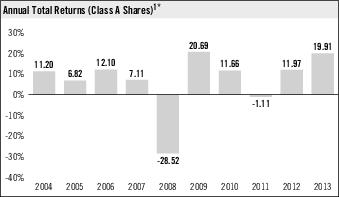
1 These annual total returns do not include sales charges. If the sales charges were included, the annual total returns would be lower than those shown. Without the distribution
and service (12b-1) fee waiver, the annual returns would have been lower, too. The total return for Class A shares from January 1, 2014 to September 30, 2014 was 6.97%.
| Average Annual Total Returns % (including sales charges) (as of 12-31-13)* | ||||
| Return Before Taxes | One Year | Five Year | Ten Years | Since Inception |
| Class B shares | 13.91 | 11.36 | 5.40 | — |
| Class C shares | 18.01 | 11.49 | 5.40 | — |
| Class R shares | 19.54 | 12.05 | N/A | 6.02 (10/4/04) |
| Class Z shares | 20.17 | 12.60 | 6.46 | — |
| Class A Shares % (including sales charges) | ||||
| Return Before Taxes | 13.32 | 11.08 | 5.60 | — |
| Return After Taxes on Distributions | 11.76 | 10.51 | 4.77 | — |
| Return After Taxes on Distributions and Sale of Fund Shares | 8.78 | 8.81 | 4.49 | — |
°
After-tax returns are calculated using the historical highest individual federal marginal income tax rates and do not reflect the impact of state and local taxes. Actual after-tax returns depend on an investor’s
tax situation and may differ from those shown. After-tax returns shown are not relevant to investors who hold their Fund shares through tax deferred arrangements, such as 401(k) plans or individual retirement
accounts. After-tax returns are shown only for Class A shares. After-tax returns for other classes will vary due to differing sales charges and expenses.
| 6 | Prudential Defensive Equity Fund |
*Effective May 8, 2013, the Fund’s
investment strategy and policies were changed and Quantitative Management Associates LLC (QMA) became the subadviser to the Fund. The Fund’s performance prior to May 8, 2013 is not attributable to QMA or to the
Fund’s current investment strategies.
| Index % (reflects no deduction for fees, expenses or taxes) | ||||
| S&P 500 Index | 32.37 | 17.93 | 7.40 | — |
| Russell 1000 Defensive Index | 30.90 | 16.09 | 7.69 | — |
| Lipper Average % (reflects no deduction for sales charges or taxes) | ||||
| Lipper Large Cap Core Funds Average | 31.38 | 16.90 | 6.98 | — |
MANAGEMENT OF THE FUND
| Investment Manager | Subadviser | Portfolio Managers | Title | Service Date |
| Prudential Investments LLC | Quantitative Management Associates LLC | Ted Lockwood | Managing Director | May 2013 |
| Edward L. Campbell, CFA | Principal and Portfolio Manager | May 2013 | ||
| Daniel Carlucci, CFA | Vice President and Portfolio Manager | May 2013 | ||
| Joel M. Kallman, CFA | Vice President and Portfolio Manager | May 2013 | ||
| John A. Hudock, CFA | Principal and Portfolio Manager | May 2013 |
BUYING AND SELLING FUND
SHARES
| Minimum Initial Investment | Minimum Subsequent Investment | |
| Fund shares (most cases)* | $2,500 | $100 |
| Retirement accounts and custodial accounts for minors | $1,000 | $100 |
| Automatic Investment Plan (AIP) | $50 | $50 |
*Note:
Class B shares are closed to new purchases. Please see “How to Buy, Sell and Exchange Fund Shares—Closure of Class B Shares” in the Prospectus for more information.
You can purchase or redeem shares
through the Fund's transfer agent or through servicing agents, including brokers, dealers and other financial intermediaries appointed by the distributor to receive purchase and redemption orders. Current shareholders
may also purchase or redeem shares through the Fund's website or by calling (800) 225-1852.
TAX INFORMATION
Dividends, Capital Gains and
Taxes. The Fund's dividends and distributions are taxable and will be taxed as ordinary income or capital gains, unless you are investing through a tax-deferred arrangement, such as a 401(k) plan
or an individual retirement account. Such tax-deferred arrangements may be taxed later upon withdrawal of monies from those arrangements.
FINANCIAL INTERMEDIARY
COMPENSATION
If you purchase Fund shares through
a financial services firm, the Fund, the Fund’s investment manager, or their related companies may pay the financial services firm for the sale of Fund shares and/or for services to shareholders. These payments
may create a conflict of interest by influencing the financial services firm or the firm's representatives to recommend the Fund over another investment. Ask your financial services firm or representative for more
information or visit your financial services firm's website.
| Visit our website at www.prudentialfunds.com | 7 |
HOW THE FUND INVESTS
INVESTMENT OBJECTIVE AND
POLICIES
The Fund’s investment
objective is to seek long-term capital appreciation. The Fund’s investment objective is not a fundamental policy, and therefore may be changed by the Board without prior shareholder approval.
Under normal market conditions,
the Fund will invest at least 80% of its investable assets (net assets plus borrowings for investment purposes, if any) in equity and equity-related securities. For purposes of this 80% policy, equity and
equity-related securities include (i) common and preferred stock (and securities convertible into, or that the subadviser expects to be exchanged for, common or preferred stock), (ii) exchange-traded funds (ETFs), and
(iii) synthetic instruments and derivatives that have economic characteristics that are similar to equity securities, including certain options, futures, swaps, and exchange-traded notes (ETNs) whose interest or
principal payments are linked to one or more equity securities or equity indices. The subadviser will evaluate investments across equity market sectors, based on a variety of factors including but not limited to
momentum, valuation, volatility and correlation. The subadviser will allocate and periodically rebalance the Fund’s portfolio across the different sectors, based on changes in these factors. The subadviser may
also use risk mitigation techniques to reduce downside risk. Investment decisions will be determined using a combination of quantitative tools and the judgment of the subadviser's investment professionals.
The Fund may invest in securities
of any market capitalization limit. The Fund may actively and frequently trade its portfolio securities.
The Fund may invest in American
Depository Receipts, warrants and other rights, and in various types of business ventures, including partnerships and joint ventures and securities of real estate investment trusts (REITs).
The Fund may invest up to 20% of
its investable assets in debt securities of varying credit quality. The Fund may invest up to 20% of total assets in securities of foreign issuers. The Fund may invest up to 25% of its net assets in derivatives.
Although the Fund is not limited in the types of derivatives it can use, the Fund currently expects that its principal investments in derivative instruments will include investments in futures contracts, but the Fund
may also invest in options and swaps.
Derivative Strategies
We may use various derivative
strategies to try to improve the Fund's returns. We may also use hedging techniques to try to protect the Fund's assets. We cannot guarantee that these strategies and techniques will work, that the instruments
necessary to implement these strategies and techniques will be available, or that the Fund will not lose money. The use of derivatives—such as futures, foreign currency forward contracts, options on futures,
indexed and inverse floating rate securities and various types of swaps—involves costs and can be volatile. With derivatives, we try to predict if the underlying investment—a security, market index,
currency, interest rate or some other benchmark—will go up or down at some future date. We may use derivatives to try to reduce risk or to increase return consistent with the Fund's overall investment objective.
We will consider other factors (such as cost) in deciding whether to employ any particular strategy or technique, or use any particular instrument. Any derivatives we may use may not match or offset the Fund's
underlying positions and this could result in losses to the Fund that would not otherwise have occurred. Derivatives that involve leverage could magnify losses. When the Fund uses derivative strategies, the Fund
designates certain assets as segregated or otherwise covers its exposure, as required by the rules of the Securities and Exchange Commission. For more detailed information about these strategies, see the SAI.
Futures Contracts and Related
Options. The Fund may purchase and sell financial futures contracts and related options on financial futures. A futures contract is an agreement to buy or sell a set quantity of an underlying asset
at a future date, or to make or receive a cash payment based on the value of a securities index, or some other asset, at a stipulated future date. The terms of futures contracts are standardized. In the case of a
financial futures contract based upon a broad index, there is no delivery of the securities comprising the underlying index, margin is uniform, a
| 8 | Prudential Defensive Equity Fund |
clearing corporation or an exchange is the
counterparty and the Fund makes daily margin payments based on price movements in the index. An option gives the purchaser the right to buy or sell securities or currencies, or in the case of an option on a futures
contract, the right to buy or sell a futures contract in exchange for a premium.
Swap Transactions. The Fund may enter into swap transactions. Swap agreements are two-party contracts entered into primarily by institutional investors for periods typically ranging from a few weeks to more
than one year. In a standard “swap” transaction, two parties agree to exchange the returns (or differentials in rates of return) earned or realized on particular predetermined investments or instruments,
which may be adjusted for an interest factor. There are various types of swaps, including but not limited to credit default swaps, interest rate swaps, total return swaps and index swaps.
Options on Securities and
Financial Indexes. The Fund may purchase and sell put and call options on securities and financial indexes traded on U.S. or foreign securities exchanges, on NASDAQ or in the over-the-counter market. An
option gives the purchaser the right to buy or sell securities in exchange for a premium. The Fund will sell only covered options.
While we make every effort to
achieve the Fund’s objective, we can’t guarantee success.
The Fund will provide 60
days’ prior written notice to shareholders of a change in its non-fundamental policy of investing at least 80% of its investable assets in equity and equity-related securities.
For more information, see
“Investment Risks” below and the SAI, which contains additional information about the Fund. To obtain a copy of the SAI, see the back cover of this prospectus.
Portfolio Turnover
As a result of the investment
policies described above, the Fund may engage in a substantial number of portfolio transactions. The portfolio turnover rate is generally the percentage computed by dividing the lesser of portfolio purchases or sales
(excluding all securities, including options, whose maturity or expiration date at acquisition was one year or less) by the monthly average value of the portfolio. High portfolio turnover (100% or more) usually
involves correspondingly greater brokerage commissions and other transaction costs, which are borne directly by the Fund. In addition, high portfolio turnover may also mean that a proportionately greater amount of
distributions to shareholders will be taxed as ordinary income rather than long-term capital gains compared to investment companies with lower portfolio turnover. The portfolio turnover rates for the Fund are shown in
the table below.
| Portfolio Turnover Rate | |
| 2014* | 20% |
| 2014** | 87% |
| 2013** | 239% |
*During 2014, the Fund
changed its fiscal year-end from July 31 to October 31. The percentage shown is for the period from August 1, 2014 through October 31, 2014.
**The percentages shown are for the
Fund’s prior fiscal year end of July 31.
OTHER INVESTMENTS AND
STRATEGIES
In addition to the above principal
investment strategies, the Fund also may use the following non-principal investment strategies to try to increase its returns or protect its assets if market conditions warrant.
Exchange-Traded Funds (ETFs) and
Exchange-Traded Notes (ETNs)
The Fund may invest in securities
of ETFs, subject to certain limits on investment in securities of non-affiliated investment companies. Securities of ETFs represent shares of ownership in either a mutual fund or unit investment trust that generally
holds a portfolio of securities that may include bonds, common stocks, other instruments or a combination of all three and which is designed to provide exposure to the market represented by the portfolio of those
securities. Such holdings are subject to any management fees of the mutual fund or unit investment trust. In addition, the Fund may invest in ETNs. ETNs, like ETFs, are traded on major exchanges. ETN returns are based
on the performance of a market index, although the credit rating of the issuer may affect the value of the ETN.
| Visit our website at www.prudentialfunds.com | 9 |
Fixed Income Securities
The Fund may invest in fixed income
or debt securities. The Fund may invest in debt securities that are rated below investment grade or comparable unrated securities. There is no minimum rating on the fixed income securities in which the Fund may
invest.
Foreign Equity Securities
We may invest in foreign equity securities including stocks and other equity-related securities. Foreign equity securities may include securities from emerging markets.
When-Issued and Delayed-Delivery
Securities
The Fund may
purchase securities, including money market obligations, bonds or other obligations, on a when-issued, delayed-delivery or forward commitment basis. When the Fund makes this type of purchase, the price and interest
rate are fixed at the time of purchase, but delivery and payment for the obligations take place at a later time. The Fund does not earn interest income until the date the obligations are expected to be delivered.
These types of investments potentially leverage the Fund, which could magnify losses. The Fund will segregate liquid assets, marked-to-market daily, with a value equal to any such investments. Segregating assets may
cause the Fund to forgo making other potentially favorable investments.
Money Market Instruments
The Fund may hold cash and/or
invest in money market instruments, including commercial paper of a US or foreign company, foreign government securities, certificates of deposit, bankers' acceptances, time deposits of domestic
and foreign banks, and obligations issued or guaranteed by the US Government or its agencies or instrumentalities. These obligations may be US dollar-denominated or denominated in a foreign currency. Money market
instruments typically have a maturity of one year or less as measured from the date of purchase.
Reverse Repurchase Agreements and
Dollar Rolls
The Fund may enter into reverse
repurchase agreements, which involve the sale of a portfolio security by the Fund coupled with an agreement to repurchase the security, as well as dollar rolls in which the Fund sells securities for delivery in the
current month and simultaneously agrees to repurchase a substantially similar security at a future date. Either strategy involves leverage and may magnify underlying investment gains or losses.
US Government Securities
The Fund may invest in securities
issued or guaranteed by the US Government or by an agency or instrumentality of the US Government. Some US Government securities are backed by the full faith and credit of the United States, which means that payment
of principal and interest is guaranteed but market value is not. Some are supported only by the credit of the issuing agency or instrumentality and depend entirely on the agency or instrumentality's own resources to
repay their debt and are subject to the risk of default like private issuers.
Additional Strategies
The Fund follows certain policies
when it borrows money (the Fund can borrow up to 33 1⁄3% of the value of its total assets); purchases shares of other investment companies; lends its securities to others (the Fund can lend up to 33 1⁄3% of the value of its total assets); and holds illiquid securities (the Fund may hold up to 15% of its net assets (assets less liabilities) in illiquid securities, including securities with legal or contractual restrictions
on resale, those without a readily available market and repurchase agreements with maturities longer than seven days). The Fund is subject to certain other investment restrictions that are fundamental policies, which
means they cannot be changed without shareholder approval. For more information about these restrictions, see the SAI.
INVESTMENT RISKS
All investments involve risk, and
investing in the Fund is no exception. Since the Fund's holdings can vary significantly from broad-based securities market indexes, performance of the Fund can deviate from performance of the indexes. The charts below
outline the key risks and potential rewards of the Fund's principal strategies and certain other non-principal strategies that the Fund may use. Following the charts is a table which sets forth the investment limits
applicable to certain types of investments discussed in the charts. For more information, see the SAI.
| 10 | Prudential Defensive Equity Fund |
Principal Investment Strategies
| Equity and Equity-Related Securities | |
| Risks | Potential Rewards |
| ■ Individual stocks could lose value.■ The equity markets could go down, resulting in a decline in value of the Fund's investments. ■ Changes in economic or political conditions, both domestic and international, may result in a decline in value of the Fund's investments. | ■ Historically, stocks have out-performed other investments over the long term.■ Generally, economic growth leads to higher corporate profits, which can lead to an increase in stock prices, known as capital appreciation. |
| Derivatives | |
| Risks | Potential Rewards |
| ■ The value of derivatives (such as forwards, futures, swaps and options) that are used to hedge a portfolio security is generally determined independently from the value of that security and could result in a loss to the Fund if the price movement of the derivative does not correlate with a change in the value of the portfolio security. ■ Derivatives may not have the intended effects and may result in losses or missed opportunities. ■ The counterparty to a derivatives contract could default. ■ Derivatives can increase share price volatility and those that involve leverage could magnify losses. ■ Certain types of derivatives involve costs to the Fund that can reduce returns. ■ Derivatives may be difficult to value precisely or sell at the time or price desired. ■ Recent legislation calls for new regulation of the derivatives markets. The extent and impact of the regulations are not yet fully known and may not be for some time. New regulation of derivatives may make them more costly, may limit their availability, or may otherwise adversely affect their value or performance. | ■ Derivatives could make money and protect against losses if the investment analysis proves correct.■ Derivatives used for return enhancement purposes involve a type of leverage and could generate substantial gains at low cost. ■ One way to manage the Fund's risk/return balance is by locking in the value of an investment ahead of time. ■ Hedges that correlate well with an underlying position can reduce or eliminate the volatility of investment income or capital gains at low cost. |
Non-Principal Investment
Strategies
| Fixed-Income Obligations | |
| Risks | Potential Rewards |
| ■ The Fund's holdings, share price, yield and total return may fluctuate in response to bond market movements.■ Credit risk—the risk that the default of an issuer will leave the Fund with unpaid interest or principal. The lower an instrument's quality, the higher its potential volatility. ■ Market risk—the risk that the market value of an investment may decline, sometimes rapidly or unpredictably. Market risk may affect an industry, a sector, or the market as a whole. ■ Interest rate risk—the risk that the value of most bonds will fall when interest rates rise: the longer a bond's maturity, the more its value typically falls. The Fund may be subject to a greater risk of rising interest rates due to the current period of historically low rates. The Fund may lose money if short-term or long-term interest rates rise sharply or in a manner not anticipated by the subadviser. Interest rate risk can lead to price volatility.■ Prepayment risk—During periods of declining interest | ■ Bonds have generally outperformed money market instruments over the long term with less risk than stocks.■ Most bonds will rise in value when interest rates fall. ■ May provide a source of regular interest income. ■ Generally more secure than stocks since companies must pay their debts before paying stockholders. ■ Investment-grade obligations have a lower risk of default. ■ Bonds with longer maturity dates typically have higher yields. ■ Intermediate-term securities may be less susceptible to loss of principal than longer-term securities. |
| Visit our website at www.prudentialfunds.com | 11 |
| Fixed-Income Obligations | |
| Risks | Potential Rewards |
| rates, the issuer of an instrument may exercise its option to prepay principal earlier than scheduled, forcing the Fund to reinvest the proceeds from such prepayment in lower yielding instruments, which may result in a decline in the Fund's income and distributions to shareholders. ■ Reinvestment risk—the risk that income from the Fund's portfolio will decline if and when the Fund invests the proceeds from matured, traded or called fixed income instruments at market interest rates that are below the portfolio's current earnings rate. A decline in income could affect the Fund's NAV or its overall return.■ Spread risk—Wider credit spreads and decreasing market values typically represent a deterioration of the fixed income instrument's credit soundness and a perceived greater likelihood or risk of default by the issuer. Fixed income instruments generally compensate for greater credit risk by paying interest at a higher rate. As the spread on a security widens (or increases), the price (or value) of the security generally falls.■ Not all US Government securities are insured or guaranteed by the full faith and credit of the US Government—some are backed only by the issuing agency, which must rely on its own resources to repay the debt. | |
| Exchange-Traded Funds (ETFs) | |
| Risks | Potential Rewards |
| ■ Shares of ETFs are traded on an exchange throughout a trading day, and bought and sold based on market values and not at the net asset value of the ETF. For this reason, shares of an ETF could trade at either a premium or discount to its net asset value. However, the trading prices of index-based ETFs tend to closely track the actual net asset value of the ETF.■ Duplicate management fees. ■ An ETF may use a passive investment strategy by attempting to track the performance of an unmanaged index of securities. The Fund may have exposure to the constituent securities of an ETF’s underlying index regardless of the current or projected performance of a specific security or a particular industry/market sector. Maintaining investments in securities regardless of market conditions could cause the ETF’s (and thus the Fund’s) returns to be lower than if the Fund invested in an ETF that employed an active strategy.■ Passive ETFs generally seek to track performance of an index as closely as possible. However, the returns may not match or achieve a high degree of correlation with the returns of the index that it tracks due to operating expenses, transaction costs, cash flows, regulatory requirements and operational inefficiencies. | ■ Helps to manage cash flows.■ Ability to get rapid exposure to an index. ■ Provides opportunity to buy or sell an entire portfolio of securities in a single transaction in a manner similar to buying or selling a share of stock. ■ The unsystematic risk (risk associated with certain issues rather than the financial markets generally) associated with investments in ETFs is generally low relative to investments in securities of individual issuers. |
| Exchange-Traded Notes (ETNs) | |
| Risks | Potential Rewards |
| ■ The value of an ETN depends on the performance of the index underlying the ETN and the credit rating of the ETN’s issuer. | ■ Ability to gain rapid exposure to an index. |
| 12 | Prudential Defensive Equity Fund |
| Exchange-Traded Notes (ETNs) | |
| Risks | Potential Rewards |
| ■ ETNs do not make periodic interest payments.■ Principal of ETNs is not protected. | |
| Foreign Securities | |
| Risks | Potential Rewards |
| ■ Foreign markets, economies and political systems, particularly those in developing countries, may not be as stable as those in the US.■ Currency risk—the risk that adverse changes in the values of foreign currencies can cause losses (non-US dollar denominated securities). ■ May be less liquid than US stocks and bonds. ■ Differences in foreign laws, accounting standards, public information, custody and settlement practices may result in less reliable information on foreign investments and involve more risks. ■ Investments in emerging market securities are subject to greater volatility and price declines. | ■ Investors may participate in the growth of foreign markets through the Fund's investments in companies operating in those markets.■ The Fund may profit from a favorable change in the value of foreign currencies (non-US dollar denominated securities). |
| US Government and Agency Securities | |
| Risks | Potential Rewards |
| ■ Not all US Government securities are insured or guaranteed by the US Government. Some are only insured or guaranteed by the issuing agency, which must rely on its own resources to repay the debt. ■ Limits potential for capital appreciation. ■ Credit risk—the risk that the borrower can't pay back the money borrowed or make interest payments (relatively low for US Government securities). ■ Market risk—the risk that the market value of an investment may move up or down, sometimes rapidly or unpredictably, because interest rates rise or there is a lack of confidence in the borrower. Market risk may affect an industry, a sector or the market as a whole.■ Interest rate risk—the risk that the value of most debt obligations will fall when interest rates rise. The longer a bond's maturity, the more its value typically falls. The Fund may be subject to a greater risk of rising interest rates due to the current period of historically low rates. The Fund may lose money if short-term or long-term interest rates rise sharply in a manner not anticipated by the subadviser. Price volatility may follow. ■ Inflation-indexed bonds, such as Treasury Inflation-Protected Securities (“TIPS”), may experience greater losses than other fixed income securities with similar durations. ■ Investments in inflation-indexed bonds are more likely to cause fluctuations in the Fund’s income distributions. | ■ May preserve the Fund's assets.■ May provide a source of regular interest income. ■ Generally more secure than lower quality debt securities and generally more secure than equity securities. ■ Principal and interest may be guaranteed by the US Government. ■ If interest rates decline, long-term yields should be higher than money market yields. ■ Bonds have generally outperformed money market instruments over the long term. ■ Most bonds rise in value when interest rates fall. |
| Money Market Instruments | |
| Risks | Potential Rewards |
| ■ May limit the Fund's potential for capital appreciation and achieving its objective.■ Credit risk (which is less of a concern for money market instruments)—the risk that the borrower or counterparty can’t pay back the money borrowed or make interest payments. | ■ May preserve the Fund's assets. |
| Visit our website at www.prudentialfunds.com | 13 |
| Money Market Instruments | |
| Risks | Potential Rewards |
| ■ Market risk (which is less of a concern for money market instruments)—the risk that bonds will lose value in the market, sometimes rapidly or unpredictably, because interest rates rise or there is a lack of confidence in the borrower or the bond's insurer. ■ Interest rate risk—the risk that the value of a bond may fall as interest rates rise. The Fund may be subject to a greater risk of rising interest rates due to the current period of historically low rates. The Fund may lose money if short-term or long-term interest rates rise sharply or in a manner not anticipated by the subadviser. | |
| Reverse Repurchase Agreements and Dollar Rolls | |
| Risks | Potential Rewards |
| ■ Risk that the counterparty may fail to return securities in a timely manner or at all.■ May magnify underlying investment losses. ■ Investment costs may exceed potential underlying investment gains. ■ Leverage risk—the risk that the market value of the securities purchased with proceeds of the sale declines below the price of the securities the Fund must repurchase. | ■ May magnify underlying investment gains. |
| When-Issued and Delayed Delivery Securities | |
| Risks | Potential Rewards |
| ■ Value of securities may decrease before delivery occurs.■ Counterparty may become insolvent prior to delivery. ■ If the security is not issued, or the counterparty fails to meet its obligation, the Fund loses the investment opportunity for the assets it has set aside to pay for the security and any gain in the security's price. | ■ May enhance investment gains. |
| Defensive Equity Fund: Principal & Non-Principal Strategies |
| ■ Equity and Equity-Related securities: At least 80% of investable assets■ Derivatives: Up to 25% of net assets ■ Fixed-income securities: Up to 20% of investable assets ■ Foreign Securities: Up to 20% of total assets ■ ETFs: Up to 5% of total assets in any one ETF or other mutual fund, and up to 10% of total assets in ETFs or other mutual funds collectively ■ US Government and agency securities: Percentage varies; up to 100% of total assets on a temporary basis ■ Money market instruments: Up to 100% of total assets on a temporary basis ■ Reverse repurchase agreements & dollar rolls: Up to 33 1/3%, usually less than 10% ■ When issued and delayed delivery securities: Percentage varies ■ ETNs: Up to 5% of total assets by any one securities-related issuer, along with all other securities issued by the issuer ■ Borrowing: Up to 33 1/3%, usually less than 10% ■ Illiquid Securities: Up to 15% of net assets |
| 14 | Prudential Defensive Equity Fund |
HOW THE FUND IS MANAGED
BOARD OF TRUSTEES
The Fund is overseen by a Board of
Trustees (hereafter referred to as Trustees, or the Board). The Board oversees the actions of the Manager, investment subadviser and distributor and decides on general policies. The Board also oversees the Fund's
officers, who conduct and supervise the daily business operations of the Fund.
MANAGER
Prudential Investments LLC (PI)
Gateway Center Three, 100 Mulberry Street
Newark, NJ 07102-4077
Gateway Center Three, 100 Mulberry Street
Newark, NJ 07102-4077
Under a
management agreement with the Fund, PI manages the Fund's investment operations and administers its business affairs and is responsible for supervising the Fund's investment subadviser. For the fiscal period ended
October 31, 2014, the Fund paid PI management fees at the effective rate of .75% of the Fund's average daily net assets for all share classes.
PI and its predecessors have
served as a manager or administrator to investment companies since 1987. As of November 30, 2014, PI, a wholly-owned subsidiary of Prudential, served as the investment manager to all of the Prudential US and offshore
open-end investment companies, and as the manager or administrator to closed-end investment companies, with aggregate assets of approximately $237.8 billion.
Subject to the supervision of the
Board, PI is responsible for conducting the initial review of prospective investment subadvisers for the Fund. In evaluating a prospective investment subadviser, PI considers many factors, including the firm's
experience, investment philosophy and historical performance. PI is also responsible for monitoring the performance of the Fund's investment subadviser.
PI and the Fund operate under an
exemptive order (the Order) from the Securities and Exchange Commission (the Commission) that generally permits PI to enter into or amend agreements with unaffiliated investment subadvisers without obtaining
shareholder approval each time. This authority is subject to certain conditions, including the requirement that the Board must approve any new or amended agreements with an investment subadviser. Shareholders of the
Fund still have the right to terminate these agreements at any time by a vote of the majority of outstanding shares of the Fund. The Fund will notify shareholders of any new investment subadvisers engaged or material
amendments to subadvisory agreements made pursuant to the Order.
PI and the Fund
have received an exemptive order from the Commission that would extend the relief granted with respect to unaffiliated subadvisers to certain subadvisers under the Order that are affiliates of PI (“affiliated
subadvisers”). This relief would permit PI, with the approval of the Fund's Board, to hire unaffiliated and/or affiliated subadvisers to manage all or a portion of the Fund's assets without obtaining shareholder
approval. PI would also have the discretion to terminate any subadviser and allocate and reallocate the Fund's assets among any other subadvisers (including terminating an unaffiliated subadviser and replacing it with
an affiliated subadviser). PI, subject to the approval of the Board, would also be able to materially amend an existing subadvisory agreement with any such subadviser without shareholder approval. Approval by the
Fund’s shareholders is required before PI and the Fund may rely on the Order with respect to affiliated subadvisers; shareholder approval is pending as of the date of this Prospectus.
A discussion of the basis for the
Board's approvals of the management and subadvisory agreements is available in the Fund's Annual Report to shareholders dated July 31.
INVESTMENT SUBADVISER
Quantitative
Management Associates LLC (QMA), a registered investment adviser, is a wholly-owned subsidiary of Prudential Investment Management, Inc. QMA has used advanced analytics to enhance the investment decision-making process,
which combines a systematic application of financial theory and fundamental analysis with
| Visit our website at www.prudentialfunds.com | 15 |
discipline and
seasoned judgment. As of December 31, 2014, QMA managed approximately $XXX billion in assets worldwide across a broad asset class spectrum ranging from global equity to multi-asset class solutions for institutional
investors, such as pension funds, financial services companies, endowments, foundations, and sovereign wealth funds. QMA's primary address is Gateway Center Two, 100 Mulberry Street, Newark, NJ 07102.
PORTFOLIO MANAGERS
QMA typically follows a team
approach in the management of its portfolios. QMA uses a disciplined investment process based on fundamental data, driven by its quantitative investment models. QMA incorporates into its investment process insights
gained from its original research and the seasoned judgment of its portfolio managers and analysts. The members of QMA's portfolio management team with primary responsibility for Fund management are listed below.
Ted Lockwood is a Managing Director for QMA and head of QMA’s asset allocation area. He is responsible for portfolio management, investment research, and new product development. QMA’s
asset allocation team focuses on tactical, strategic, and dynamic asset allocation across traditional and non-traditional asset classes, including real assets and alternatives. Mr. Lockwood’s experience also
includes managing tactical asset allocation overlays, dynamically managed volatility strategies, quantitative long-short equity portfolios, and synthetic convertible bonds. Earlier in his career, Mr. Lockwood was an AT&T Bell Laboratories Fellow and member of the technical staff at AT&T. Mr. Lockwood graduated summa cum laude with a BE in Engineering from Stony Brook University and earned an MS in Engineering and an MBA in Finance from Columbia University.
Edward L. Campbell, CFA, is a Principal and Portfolio Manager for QMA and a member of the asset allocation team. In addition to portfolio management, Mr. Campbell is a specialist in global macroeconomic and investment strategy research. He has also served as a Portfolio Manager with Prudential Investments (PI) and spent several years as a
Senior Analyst with PI’s Strategic Investment Research Group (SIRG). Prior to joining PI, Mr. Campbell was a Partner and Vice President at Trilogy Advisors LLC. He earned a BS in Economics and International Business from The City University of New York and an MBA in Finance, Global
Business, and Organizational Leadership from NYU's Stern School of Business. He also holds the Chartered Financial Analyst (CFA) designation.
Daniel Carlucci, CFA, is a Vice President and Portfolio Manager for QMA. Mr. Carlucci manages large-cap and small-cap core equity portfolios as well as domestic and international index funds. He is also responsible for directing QMA's managed account strategies. He
previously served as an Investment Analyst with QMA's value equity team, where he assisted with the management of quantitative large-cap institutional portfolios. Mr. Carlucci holds a BS in Finance and an MBA in Finance from Rutgers University and holds the Chartered Financial Analyst (CFA) designation.
Joel M. Kallman, CFA, is a Vice President for QMA. Mr. Kallman is a portfolio manager and a member of the asset allocation team. He also conducts economic and market valuation research. Mr. Kallman has also held various positions within Prudential's fixed-income group, in areas such as high-yield credit analysis and performance reporting. He earned a BS and MBA in Finance
from Rutgers University. He is also a member of the New York Society of Security Analysts and holds the Chartered Financial Analyst (CFA) designation.
John A. Hudock, CFA, is a Principal and Portfolio Manager for QMA and a member of the Asset Allocation team. His responsibilities include research and portfolio management for Asset Allocation strategies, with
a focus on developing and improving asset allocation models. Prior to joining QMA, John founded Amida Investments, a hedge fund and consulting company. Previously, John has led quantitative research and managed
long-only portfolios and long/short equity hedge funds as Director of Research at RQSI, Managing Director at Trilogy Advisors (which he co-founded), and Portfolio Manager at Credit Suisse Asset Management. John
started his career in commodities designing and programming analytic, trading and back-office systems for J. Aron, Marc Rich and Rothschild, Inc before moving to equities and asset allocation. He earned a BA in
Mathematics from New York University and holds the Chartered Financial Analyst (CFA) designation.
| 16 | Prudential Defensive Equity Fund |
Additional information about
portfolio manager compensation, other accounts managed, and portfolio manager ownership of Fund securities may be found in the SAI.
DISTRIBUTOR
Prudential Investment Management
Services LLC (PIMS or the Distributor) distributes each class of the Fund's shares under a Distribution Agreement with the Fund. The Fund has Distribution and Service Plans (the Plans) pursuant to Rule 12b-1 under the
1940 Act, applicable to certain of the Fund's shares. Under the Plans and the Distribution Agreement, the Distributor pays the expenses of distributing the shares of all share classes of the Fund. The Distributor also
provides certain shareholder support services. Each class of the Fund (except Class Z) pays distribution and other fees to the Distributor as compensation for its services. These fees—known as 12b-1
fees—are set forth in the “Fund Fees and Expenses” tables.
Because these fees are paid from
the Fund's assets on an ongoing basis, over time these fees will increase the cost of your investment and may cost you more than paying other types of sales charges.
DISCLOSURE OF PORTFOLIO
HOLDINGS
A description of the Fund's
policies and procedures with respect to the disclosure of the Fund's portfolio securities is described in the Fund's SAI and on the Fund's website at www.prudentialfunds.com.
| Visit our website at www.prudentialfunds.com | 17 |
FUND DISTRIBUTIONS AND TAX ISSUES
DISTRIBUTIONS
Investors who buy shares of the
Fund should be aware of some important tax issues. For example, the Fund distributes dividends of net investment income and realized net capital gains, if any, to shareholders. These distributions are subject to
federal income taxes, unless you hold your shares in a 401(k) plan, an Individual Retirement Account (IRA) or some other qualified or tax-deferred plan or account. Dividends and distributions from the Fund also may be
subject to state and local income tax in the state where you live.
Also, if you sell shares of the
Fund for a profit, you may have to pay capital gains taxes on the amount of your profit, unless you hold your shares in a qualified or tax-deferred plan or account.
The following briefly discusses
some of the important income tax issues you should be aware of, but is not meant to be tax advice. For tax advice, please speak with your tax adviser.
The Fund distributes dividends to shareholders out of any net investment income. For example, if the Fund owns ACME Corp. stock and the stock pays a dividend, the Fund will pay out a portion of this
dividend to its shareholders, assuming the Fund's income is more than its costs and expenses. The dividends you receive from the Fund will be subject to taxation whether or not they are reinvested in the Fund.
The Fund also distributes any
realized net capital gains to shareholders. Capital gains are generated when the Fund sells its assets for a profit. For example, if the Fund bought 100 shares of ACME Corp. stock for a total of
$1,000 and more than one year later sold the shares for a total of $1,500, the Fund has net long-term capital gains of $500, which it will pass on to shareholders (assuming the Fund's remaining total gains are greater
than any losses it may have). Capital gains are taxed differently depending on how long the Fund holds the security. If the Fund holds a security for more than one year before selling it, any gain is treated as long-term capital gain which is generally taxed at rates of up to 15% for individuals with incomes below approximately $400,000 ($450,000 if married filing jointly), adjusted annually
for inflation, and 20% for any income above those amounts that is long-term capital gain, provided that the Fund distributes the net capital gain to non-corporate US shareholders. If the Fund holds the security for
one year or less, any gain is treated as short-term capital gain, which is taxed at rates applicable to ordinary income, subject to a maximum tax rate of 39.6%. Different rates apply to corporate shareholders.
Dividends from net investment
income paid to a non-corporate US shareholder that are reported as qualified dividend income will generally be taxable to such shareholder at the long-term capital gain tax rate. Dividends of net investment income
that are not reported as qualified dividend income will be taxable to shareholders at ordinary income rates. Also, a portion of the dividends paid to corporate shareholders of the Fund will be eligible for the 70%
dividends received deduction to the extent the Fund's income is derived from certain dividends received from US corporations.
A US shareholder that is an
individual, estate or certain type of trust is subject to a 3.8% Medicare contribution tax on the lesser of (1) the US shareholder's “net investment income,” including Fund distributions and net gains from
the disposition of Fund shares, and (2) the excess of the US shareholder's modified adjusted gross income for the taxable year over $200,000 (or $250,000 for married couples filing jointly). For this purpose, net
investment income includes interest, dividends, annuities, royalties, capital gain and income from a passive activity business or a business of trading in financial instruments or commodities.
For your
convenience, the Fund's distributions of dividends and net capital gains are automatically reinvested in the Fund without any sales charge. If you ask us to pay the distributions in cash, we will send you a check if your account is with Prudential Mutual Fund
Services LLC (PMFS or the Transfer Agent). Otherwise, if your account is with a broker, you will receive a credit to your account. Either way, the distributions may be subject to income taxes unless your shares are
held in a qualified or tax-deferred plan or account. If your Fund distribution check(s) remains
| 18 | Prudential Defensive Equity Fund |
uncashed for more than six months, your check(s)
may be invested in additional shares of the Fund at the next net asset value (“NAV”) calculated on the day of the investment. For more information about automatic reinvestment and other shareholder
services, see “Additional Shareholder Services” in the next section.
The chart below sets forth the
expected frequency of dividend and capital gains distributions to shareholders. Various factors may impact the frequency of dividend distributions to shareholders, including but not limited to adverse market
conditions or portfolio holding-specific events.
| Expected Distribution Schedule* | |
| Dividends | Annually |
| Net Capital Gains | Annually |
*Under certain
circumstances, the Fund may make more than one distribution of short-term and/or long-term capital gains during a fiscal year.
TAX ISSUES
Form 1099
For every year the Fund declares a
dividend, you will receive a Form 1099, which reports the amount of ordinary income distributions and long-term capital gains we distributed to you during the prior year unless you own shares of the Fund as part of a
qualified or tax-deferred plan or account. If you do own shares of the Fund as part of a qualified or tax-deferred plan or account, your taxes are deferred, so you will not receive a Form 1099 annually, but instead
you will receive a Form 1099 when you take any distribution from your qualified or tax-deferred plan or account.
Fund distributions are generally
taxable to you in the calendar year in which they are received, except when we declare certain dividends and distributions in the fourth quarter, with a record date in such quarter, and actually pay them in January of
the following year. In such cases, the dividends and distributions are treated as if they were paid on December 31st of the prior year.
Cost Basis Reporting
Mutual funds must report cost basis
information to you and the IRS when you sell or exchange shares acquired on or after January 1, 2012 in your non-retirement accounts. The cost basis regulations do not affect retirement accounts, money market funds,
and shares acquired before January 1, 2012. The cost basis regulations also require mutual funds to report whether a gain or loss is short-term (shares held one year or less) or long-term (shares held more than one
year) for all shares acquired on or after January 1, 2012 that are subsequently sold or exchanged. The Transfer Agent is not required to report cost basis information on shares acquired before January 1, 2012.
However, in most cases the Transfer Agent will provide this information to you as a service.
Withholding Taxes
If federal tax law requires you to
provide the Fund with your taxpayer identification number and certifications as to your tax status and you fail to do this, or if you are otherwise subject to backup withholding, we will withhold and pay to the US
Treasury 28% of your distributions and sale proceeds.
Taxation of Foreign Shareholders
For a discussion regarding the
taxation of foreign shareholders, please see the SAI.
If You Purchase on or Before a
Record Date
If you buy shares of the Fund on or
before the record date for a distribution (the date that determines who receives the distribution), we will pay that distribution to you. As explained above, the distribution may be subject to taxes. You may think
you've done well since you bought shares one day and soon thereafter received a distribution. That is not so, because when dividends are paid out, the value of each share of the Fund decreases by the amount of the
dividend to reflect the payout, although this may not be apparent because the value of each share of the Fund also will be affected by market changes, if any. However, the timing of your purchase does mean that part
of your investment may have come back to you as taxable income.
| Visit our website at www.prudentialfunds.com | 19 |
Qualified and Tax-Deferred
Retirement Plans
Retirement plans and accounts allow
you to defer paying taxes on investment income and capital gains. Contributions to these plans may also be tax-deductible, although distributions from these plans generally are taxable. In the case of Roth IRA
accounts, contributions are not tax-deductible, but distributions from the plan may be tax-free. Please contact your financial adviser for information on a variety of Prudential Investments mutual funds that are
suitable for retirement plans offered by Prudential.
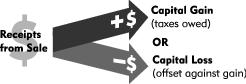
IF YOU SELL OR EXCHANGE YOUR
SHARES
If you sell any shares of the Fund
for a profit, you have realized a capital gain, which is subject to tax unless the shares are held in a qualified or tax-deferred plan or account. As mentioned above, the maximum capital gains tax rate is up to 15%
for individuals with incomes below approximately $400,000 ($450,000 if married filing jointly), adjusted annually for inflation, and 20% for any income above those amounts that is long-term capital gain.
If you sell shares of the Fund at
a loss, you may have a capital loss, which you may use to offset capital gains you have, plus, in the case of non-corporate taxpayers, ordinary income of up to $3,000. If you sell shares and realize a loss, you will
not be permitted to use the loss to the extent you replace the shares (including pursuant to the reinvestment of a dividend) within a 61-day period (beginning 30 days before and ending 30 days after the sale of the
shares). Under certain circumstances, if you acquire shares of the Fund and sell or exchange your shares within 90 days, you may not be allowed to include certain charges incurred in acquiring the shares for purposes
of calculating gain or loss realized upon the sale or exchange of the shares.
If you exchange your Fund shares
for shares of another class of the Fund, this is generally not a taxable event and should not result in realization of a capital gain or loss by you. If you exchange your shares of the Fund for shares of another
Prudential Investments mutual fund, this is considered a sale for tax purposes. In other words, it's a taxable event. Therefore, if the shares you exchanged have increased in value since you purchased them, you have
capital gains, which are subject to the taxes described above. Unless you hold your shares in a qualified or tax-deferred plan or account, you or your financial adviser should keep track of the dates on which you buy
and sell—or exchange—Fund shares, as well as the amount of any gain or loss on each transaction. For tax advice, please see your tax adviser.
Automatic Conversion of Class B
Shares
The conversion of Class B shares
into Class A shares—which happens automatically approximately seven years after purchase—is not a taxable event for federal income tax purposes. For more information about the automatic conversion of Class
B shares, see Class B Shares Automatically Convert to Class A Shares in How to Buy, Sell and Exchange Fund Shares.
| 20 | Prudential Defensive Equity Fund |
HOW TO BUY, SELL AND EXCHANGE FUND SHARES
HOW TO BUY SHARES
In order to buy Fund shares, simply
follow the steps described below.
Opening an Account
If you don't have an account with
us or a financial services firm that is permitted to buy or sell shares of the Fund for you, contact PMFS at (800) 225-1852 or write to:
Prudential Mutual Fund Services
LLC
P.O. Box 9658
Providence, RI 02940
P.O. Box 9658
Providence, RI 02940
You may purchase shares by check
or wire. We do not accept cash, money orders, foreign checks, credit card checks, payable through checks or travelers checks. To purchase by wire, call the number above to obtain an application. After PMFS receives
your completed application, you will receive an account number. For additional information, see the back cover page of this Prospectus. We have the right to reject any purchase order (including an exchange into a
Fund) or suspend or modify a Fund's sales of its shares under certain circumstances. These circumstances include, but are not limited to, failure by you to provide additional information requested, such as information
required to verify the source of funds used to purchase shares, your identity or the identity of any underlying beneficial owners of your shares. Furthermore, we are required by law to close your account if you do not
provide the required identifying information. This would result in the redemption of shares at the then-current NAV and the proceeds would be remitted to you via check. We will attempt to verify your identity within a
reasonable time frame (e.g., 60 days), which may change from time to time.
With certain limited exceptions,
Fund shares are only available to be sold in the United States, US Virgin Islands, Puerto Rico and Guam.
Choosing a Share Class
The Fund offers the following share
classes. Certain classes of shares may have additional specific eligibility or qualification requirements, which are explained below.
| Share Class | Eligibility |
| Class A | Individual investors |
| Class B | Individual investors* |
| Class C | Individual investors |
| Class R | Certain group retirement plans |
| Class Z | Institutional investors and certain other investors |
* Note: Class B shares are
closed to all purchase activity except for exchanges from Class B shares of another fund. See “Closure of Class B Shares” below for further information.
Multiple share classes let you
choose a cost structure that meets your needs:
| ■ | Class A shares purchased in amounts of less than $1 million require you to pay a sales charge at the time of purchase, but the operating expenses of Class A shares are lower than the operating expenses of Class C shares. Investors who purchase $1 million or more of Class A shares and sell these shares within 12 months of purchase are also subject to a contingent deferred sales charge (CDSC) of 1%. The CDSC is waived for certain retirement and/or benefit plans. |
| ■ | Class C shares do not require you to pay a sales charge at the time of purchase, but do require you to pay a sales charge if you sell your shares within 12 months of purchase. The operating expenses of Class C shares are higher than the operating expenses of Class A shares. |
When choosing a share class, you
should consider the following factors:
| Visit our website at www.prudentialfunds.com | 21 |
| ■ | The amount of your investment and any previous or planned future investments, which may qualify you for reduced sales charges for Class A shares under Rights of Accumulation or a Letter of Intent. |
| ■ | The length of time you expect to hold the shares and the impact of varying distribution fees. Over time, these fees will increase the cost of your investment and may cost you more than paying other types of sales charges. For this reason, Class C shares are generally appropriate only for investors who plan to hold their shares for no more than 3 years. |
| ■ | The different sales charges that apply to each share class—Class A's front-end sales charge (and, in certain cases, CDSC) vs. Class C's CDSC. |
| ■ | Class C shares purchased in single amounts greater than $1 million are generally less advantageous than purchasing Class A shares. Purchase orders for Class C shares above this amount generally will not be accepted. |
| ■ | Because Class Z shares have lower operating expenses than Class A or Class C shares, as applicable, you should consider whether you are eligible to purchase Class Z shares. |
See “How to Sell Your
Shares” for a description of the impact of CDSCs.
Some investors purchase or sell
shares of the Fund through financial intermediaries and omnibus accounts maintained by brokers that aggregate the orders of multiple investors and forward the aggregate orders to the Fund. If your shares are held
through a broker-dealer, financial adviser, financial planner or other financial intermediary, you should discuss with your financial intermediary which share classes of the Fund are available to you and which share
class may best meet your needs. The Fund has advised the financial intermediaries and broker-dealers who maintain such accounts of the share class features and guidelines, per the Prospectus, and it is their
responsibility to monitor and enforce these guidelines with respect to shareholders purchasing shares through financial intermediaries or omnibus accounts.
Share Class Comparison. Use the following chart to help you compare the different share classes. The discussion following this chart will tell you whether you are entitled to a reduction or waiver of any sales
charges.
| Class A | Class B* | Class C | Class R | Class Z | |
| Minimum purchase amount | $2,500 | $2,500 | $2,500 | None | None |
| Minimum amount for subsequent purchases |
$100 | $100 | $100 | None | None |
| Maximum initial sales charge | 5.5% of the public offering price |
None | None | None | None |
| Contingent Deferred Sales Charge (CDSC) (as a percentage of the lower of original purchase price or net asset value at redemption) | 1% on sales of $1 million or more made within 12 months of purchase | 5% (Year 1) 4% (Year 2) 3% (Year 3) 2% (Year 4) 1% (Years 5/6) 0% (Year 7) |
1% on sales made within 12 months of purchase |
None | None |
| Annual distribution and service (12b-1) fees (shown as a percentage of average daily net assets) |
.30% (.25% currently) |
1% | 1% | .75% (.50% currently) |
None |
Notes to Share Class
Comparison Table:
° The minimum initial and subsequent
investment requirements do not apply to employee savings plan accounts, payroll deduction plan accounts, or when exchanging all shares of an account to an existing account with the same registration. The minimum
initial investment for retirement accounts and custodial accounts for minors is $1,000. The minimum initial and subsequent investment for AIP accounts is $50 (if your shares are held through a broker or other
financial intermediary, the broker or intermediary is responsible for determining the minimum initial and subsequent investment for AIP accounts)
° If the value of your Class A,
Class B, Class C account with PMFS is less than $10,000, the Fund will deduct a $15 annual account maintenance fee from your account. The $15 annual account maintenance fee will be assessed during the 4th calendar
quarter of each year. Any applicable CDSC on the shares redeemed to pay the $15 account maintenance fee will be waived. The $15 account maintenance fee will not be charged on: (i) accounts during the first six months
from inception of the account, (ii) accounts which are authorized for electronic delivery of account statements, transaction confirmations, prospectuses and fund shareholder reports, (iii) omnibus accounts or accounts
for which a broker or other financial intermediary is responsible for recordkeeping, (iv) institutional accounts, (v) group retirement plans, (vi) AIP accounts or employee savings plan accounts, (vii) accounts with
the same
| 22 | Prudential Defensive Equity Fund |
registration associated with multiple
share classes within the Fund, provided that the aggregate value of share classes with the same registration within the Fund is $10,000 or more, or (viii) clients with assets of $50,000 or more across the Prudential
Investments family of mutual funds. For more information, see “Purchase, Redemption and Pricing of Fund Shares—Account Maintenance Fee” in the SAI.
° For more information about the CDSC
and how it is calculated, see “How to Sell Your Shares—Contingent Deferred Sales Charge (CDSC).”
° Investors who purchase $1 million or
more of Class A shares and redeem those shares within 12 months of purchase are subject to a CDSC of 1%, but are not subject to an initial sales charge. The CDSC is waived for certain retirement or benefit plans.
° Distribution and service (12b-1)
fees are paid from the Fund’s assets on a continuous basis. The service fee for each of Class A, Class B, Class C, and Class R shares is .25% and the remainder of each class’ distribution and service
(12b-1) fee consists of a distribution fee. For the period ending November 30, 2015, the Distributor has contractually agreed to reduce its distribution and service (12b-1) fees for Class A shares to .25% of the
average daily net assets of Class A shares and for Class R shares to .50% of the average daily net assets of the Class R shares.
*Note: Class B shares are closed to all
purchase activity except for exchanges from Class B shares of another fund. See “Closure of Class B Shares” below for more information.
Closure of Class B Shares
Class B shares are closed to all
purchase activity. This means that no new accounts in Class B shares may be established, and no additional Class B shares may be purchased or acquired, except through an exchange from the Class B shares of another
fund or through the reinvestment of dividends and/or capital gains.
Shareholders owning Class B shares
may continue to hold their Class B shares until the shares automatically convert to Class A shares under the conversion schedule, or until the shareholder redeems their Class B shares. Any redemption of Class B shares
will continue to be subject to any applicable contingent deferred sales charge (CDSC). In addition, as noted above, shareholders owning Class B shares will continue to have exchange privileges with the Class B shares
of any other fund that offers Class B shares.
Automatic
Investment Plan (AIP). Shareholders who purchase Class B shares through the Automatic Investment Plan (AIP) are no longer able to purchase Class B shares and are required to select a different share class of the
Fund or another fund in order to continue to make automatic investments. Selection of a different share class will be subject to the eligibility requirements of such share class. If a shareholder does not designate a
different share class for AIP investments, future purchases of Class B shares will be rejected. New AIPs in Class B shares may not be established.
IRAs & Employer-Sponsored
Retirement Plans. Class B shareholders may continue to hold Class B shares in IRA and SIMPLE IRA accounts or in employer-sponsored retirement plans, but contributions must be made in a different share
class.
Investment
Minimums. The minimum initial investment will be waived for existing Class B shareholders who select a new share class in the same fund. The minimum subsequent investment of $100 per fund applies in
the new share class of the same fund.
Reducing or Waiving Class A's
Initial Sales Charge
The following describes the
different ways investors can reduce or avoid paying Class A's initial sales charge.
Increase the Amount of Your
Investment. You can reduce Class A's initial sales charge by increasing the amount of your investment. This table shows how the sales charge decreases as the amount of your investment
increases:
| Amount of Purchase | Sales Charge as a % of Offering Price* |
Sales Charge as a % of Amount Invested* |
Dealer Reallowance |
| Less than $25,000 | 5.50% | 5.82% | 5.00% |
| $25,000 to $49,999 | 5.00% | 5.26% | 4.50% |
| $50,000 to $99,999 | 4.50% | 4.71% | 4.00% |
| $100,000 to $249,999 | 3.75% | 3.90% | 3.25% |
| $250,000 to $499,999 | 2.75% | 2.83% | 2.50% |
| $500,000 to $999,999 | 2.00% | 2.04% | 1.75% |
| $1 million to $4,999,999** | None | None | 1.00% |
| $5 million to $9,999,999** | None | None | 0.50% |
| $10 million and over** | None | None | 0.25% |
* Due to rounding in the
calculation of the offering price and the number of shares purchased, the actual sales charge you pay may be more or less than the percentage shown above.
| Visit our website at www.prudentialfunds.com | 23 |
** If you invest $1 million or more, you
can buy only Class A shares, unless you qualify to buy other share classes. If you purchase $1 million or more of Class A shares and sell these shares within 12 months of purchase, you will be subject to a 1% CDSC,
although you will not be subject to an initial sales charge. The CDSC is waived for purchases by certain retirement and/or benefit plans.
To satisfy the purchase amounts
above, you can:
| ■ | Use your Rights of Accumulation, which allow you or an eligible group of related investors to combine (1) the current value of Class A, Class B and Class C Prudential Investments mutual fund shares you or the group already own, (2) the value of money market shares (other than Direct Purchase money market shares) you or an eligible group of related investors have received for shares of other Prudential Investments mutual funds in an exchange transaction, and (3) the value of the shares you or an eligible group of related investors are purchasing; or |
| ■ | Sign a Letter of Intent, stating in writing that you or an eligible group of related investors will purchase a certain amount of shares in the Fund and other Prudential Investments mutual funds within 13 months. |
An “eligible group of
related investors” includes any combination of the following:
| ■ | All accounts held in your name (alone or with other account holders) and taxpayer identification number (TIN); |
| ■ | Accounts held in your spouse's name (alone or with other account holders) and TIN (see definition of spouse below); |
| ■ | Accounts for your children or your spouse's children, including children for whom you and/or your spouse are legal guardian(s) (e.g., UGMAs and UTMAs); |
| ■ | Accounts in the name and TINs of your parents; |
| ■ | Trusts with you, your spouse, your children, your spouse's children and/or your parents as the beneficiaries; |
| ■ | With limited exclusions, accounts with the same address (exclusions include, but are not limited to, addresses for brokerage firms and other intermediaries and Post Office boxes); and |
| ■ | Accounts held in the name of a company controlled by you (a person, entity or group that holds 25% or more of the outstanding voting securities of a company will be deemed to control the company, and a partnership will be deemed to be controlled by each of its general partners), including employee benefit plans of the company where the accounts are held in the plan's TIN. |
A “spouse” is defined
in this prospectus as follows:
| ■ | The person to whom you are legally married. We also consider your spouse to include the following: |
| ■ | An individual of the same gender with whom you have been joined in a civil union, or legal contract similar to marriage; |
| ■ | A domestic partner, who is an individual (including one of the same gender) with whom you have shared a primary residence for at least six months, in a relationship as a couple where you, your domestic partner or both provide for the personal or financial welfare of the other without a fee, to whom you are not related by blood; or |
| ■ | An individual with whom you have a common law marriage, which is a marriage in a state where such marriages are recognized between a man and a woman arising from the fact that the two live together and hold themselves out as being married. |
The value of shares held by you or
an eligible group of related investors will be determined by the value of your existing Class A shares calculated at current NAV plus maximum sales charge with Class B and Class C shares calculated at current NAV.
Note: Class Z shares or Class R shares cannot be aggregated with any other share class for purposes of reducing or waiving Class A's initial sales charge.
If your shares are held directly
by the Transfer Agent, and you believe you qualify for a reduction or waiver of Class A's initial sales charge, you must notify the Transfer Agent at the time of the qualifying share purchase in order to receive the
applicable reduction or waiver. If your shares are held through a broker or other financial intermediary, and you believe you qualify for a reduction or waiver of Class A's initial sales charge, you must notify your
broker or intermediary at the time of the qualifying purchase in order to receive the applicable reduction or waiver. Shares held through a broker or other financial intermediary will not be systematically aggregated
with shares held directly by the Transfer Agent for purposes of receiving a reduction or waiver of Class A's initial sales charge. The reduced or waived sales charge will be granted subject to confirmation of account
holdings.
| 24 | Prudential Defensive Equity Fund |
If your shares are held directly
by the Transfer Agent, you must identify the eligible group of related investors. Although the Transfer Agent does not require any specific form of documentation in order to establish your eligibility to receive a
waiver or reduction of Class A's initial sales charge, you may be required to provide appropriate documentation if the Transfer Agent is unable to establish your eligibility.
If your shares are held through a
broker or other intermediary, the broker or intermediary is responsible for determining the specific documentation, if any, that you may need in order to establish your eligibility to receive a waiver or reduction of
Class A's initial sales charge. Your broker or intermediary is also responsible for notifying the Transfer Agent if your share purchase qualifies for a reduction or waiver of Class A's initial sales charge.
Purchases of $1 Million or
More. If you purchase $1 million or more of Class A shares, you will not be subject to an initial sales charge, although a CDSC may apply, as previously noted.
Mutual Fund Programs. The initial sales charge will be waived for participants in any fee-based program or trust program sponsored by Prudential or an affiliate that includes the Fund as an available option. The
initial sales charge will also be waived for investors in certain programs sponsored by broker-dealers, investment advisers and financial planners who have agreements with Prudential, or whose programs are available
through financial intermediaries that have agreements with Prudential, relating to:
| ■ | Mutual fund “wrap” or asset allocation programs, where the sponsor places fund trades, links its clients' accounts to a master account in the sponsor's name and charges its clients a management, consulting or other fee for its services; or |
| ■ | Mutual fund “supermarket” programs, where the sponsor links its clients' accounts to a master account in the sponsor's name and the sponsor charges a fee for its services. |
Broker-dealers, investment
advisers or financial planners sponsoring these mutual fund programs may offer their clients more than one class of shares in the Fund in connection with different pricing options for their programs. Investors should
consider carefully any separate transaction and other fees charged by these programs in connection with investing in each available share class before selecting a share class.
Group Retirement Plans. The Class A initial sales charge will be waived for group retirement plans (including defined contribution plans, defined benefit plans and deferred compensation plans) available through a
retirement plan recordkeeper or third party administrator. If Prudential Retirement Services is the recordkeeper for your group retirement plan, you may call Prudential at (800) 353-2847 with any questions. Otherwise,
investors in group retirement plans should contact their financial intermediary with any questions regarding availability of Class A shares at net asset value.
Other Types of Investors. Certain other types of investors may purchase Class A shares without paying the initial sales charge, including:
| ■ | certain directors, officers, employees (including their spouses, children and parents) of Prudential and its affiliates, the Prudential Investments mutual funds, and the investment subadvisers of the Prudential Investments mutual funds; |
| ■ | persons who have retired directly from active service with Prudential or one of its subsidiaries; |
| ■ | certain real estate brokers, agents and employees of real estate brokerage companies affiliated with the Prudential Real Estate Affiliates; |
| ■ | registered representatives and employees of broker-dealers (including their spouses, children and parents) that have entered into dealer agreements with the Distributor; |
| ■ | investors in IRAs, provided that: (a) the purchase is made either from a directed rollover to such IRA or with the proceeds of a tax-free rollover of assets from a Benefit Plan for which Prudential Retirement (the institutional Benefit Plan recordkeeping entity of Prudential) provides administrative or recordkeeping services, in each case provided that such purchase is made within 60 days of receipt of the Benefit Plan distribution, and (b) the IRA is established through Prudential Retirement as part of its “Rollover IRA” program (regardless of whether or not the purchase consists of proceeds of a tax-free rollover of assets from a Benefit Plan described above); and |
| Visit our website at www.prudentialfunds.com | 25 |
| ■ | Clients of financial intermediaries, who (i) have entered into an agreement with the principal underwriter to offer Class A shares through a no-load network or platform, (ii) charge clients an ongoing fee for advisory, investment, consulting or similar services, or (iii) offer self-directed brokerage accounts that may or may not charge transaction fees to customers. |
To qualify for a waiver of the
Class A sales charge at the time of purchase, you must notify the Transfer Agent, or the Distributor must be notified by the broker facilitating the purchase, that the transaction qualifies for a waiver of the Class A
sales charge. The waiver will be granted subject to confirmation of your account holdings.
Additional Information About
Reducing or Waiving Class A's Sales Charge. The Fund also makes available free of charge, on the Fund's website, in a clear and prominent format, information relating to the Fund's Class A initial sales charge, and the different ways
that investors can reduce or avoid paying the initial sales charge. The Fund's website includes hyperlinks that facilitate access to this information.
You may need to provide your
broker-dealer or other financial intermediary through which you hold Fund shares with the information necessary to take full advantage of reduced or waived Class A sales charges.
The Distributor may reallow the
Class A sales charge to dealers.
Class B Shares Automatically Convert
to Class A Shares
If you bought Class B shares and
hold them for approximately seven years, we will automatically convert them into Class A shares without charge. At that time, we will also convert any Class B shares that you purchased with reinvested dividends and
other distributions. Since the distribution and service (12b-1) fees for Class A shares are lower than for Class B shares, converting to Class A shares lowers your Fund expenses. Class B shares acquired through the
reinvestment of dividends or distributions will be converted to Class A shares according to the procedures utilized by the broker-dealer through which the Class B shares were purchased, if the shares are carried on
the books of that broker-dealer and the broker-dealer provides subaccounting services to the Fund. Otherwise, the procedures utilized by PMFS or its affiliates will be used. The use of different procedures may result
in a timing differential in the conversion of Class B shares acquired through the reinvestment of dividends and distributions.
When we do the conversion, you
will get fewer Class A shares than the number of converted Class B shares if the price of the Class A shares is higher than the price of the Class B shares. The total dollar value will be the same, so you will not
have lost any money by getting fewer Class A shares. Conversions are quarterly for Class B shares.
If you hold Class B share
certificates, the certificates must be received by the Transfer Agent in order for your Class B shares to convert from Class B to Class A shares. Certificate deposited shares will convert during the next quarterly
conversion.
Qualifying for Class R Shares
Group Retirement
Plans. Class R shares are offered for sale to (i) certain group retirement plans (including defined contribution plans, defined benefit plans and deferred compensation plans) available through a
retirement plan recordkeeper or third party administrator, and (ii) IRAs that are held on the books of a Fund through omnibus level accounts, including The SmartSolution IRA offered by Prudential Retirement. If
Prudential Retirement Services is the recordkeeper for your group retirement plan, you may call Prudential at (800) 353-2847 with any questions. Investors in SmartSolution IRA accounts through Prudential’s
Personal Retirement Services unit can call 888-244-6237 with any questions regarding how to purchase shares. Otherwise, investors in group retirement plans should contact their financial intermediary with any
questions regarding availability of Class R shares.
Qualifying for Class Z Shares
Institutional Investors. Various institutional investors may purchase Class Z shares, including corporations, banks, governmental entities, municipalities, hospitals, insurance companies and IRS Section 501
entities, such as foundations and endowments. The minimum initial investment for such investors generally is $5 million; however, such minimum initial investment may be modified for certain financial firms that submit
orders on behalf of their
| 26 | Prudential Defensive Equity Fund |
clients. A Fund or the Distributor may lower,
waive, or otherwise modify the minimum initial investment for certain categories of investors at their discretion. Institutional investors are responsible for indicating their eligibility to purchase Class Z shares at
the time of purchase. Certain financial intermediaries may require that investments by their institutional investor clients in Class Z shares be placed directly with the Fund's Transfer Agent. Please contact the
Transfer Agent at (800) 225-1852 for further details.
Mutual Fund Programs. Class Z shares can be purchased by participants in any fee-based program or trust program sponsored by Prudential or an affiliate that includes the Fund as an available option. Class Z
shares also can be purchased by investors in certain programs sponsored by broker-dealers, investment advisers and financial planners who have agreements with Prudential, or whose programs are available through
financial intermediaries that have agreements with Prudential, relating to:
| ■ | Mutual fund “wrap” or asset allocation programs where the sponsor places fund trades, links its clients' accounts to a master account in the sponsor's name and charges its clients a management, consulting or other fee for its services; or |
| ■ | Mutual fund “supermarket” programs where the sponsor links its clients' accounts to a master account in the sponsor's name and the sponsor charges a fee for its services. |
Broker-dealers, investment
advisers or financial planners sponsoring these mutual fund programs may offer their clients more than one class of shares in the Fund in connection with different pricing options for their programs. Investors should
consider carefully any separate transaction and other fees charged by these programs in connection with investing in a share class offered by the program before selecting a share class.
Group Retirement Plans. Group retirement plans (including defined contribution plans, defined benefit plans and deferred compensation plans) available through a retirement plan recordkeeper or third party
administrator may purchase Class Z shares. If Prudential Retirement Services is the recordkeeper for your group retirement plan, you may call Prudential at (800) 353-2847 with any questions. Otherwise, investors in
group retirement plans should contact their financial intermediary with any questions regarding availability of Class Z shares.
Other Types of Investors. Class Z shares also can be purchased by any of the following:
| ■ | Certain participants in the MEDLEY Program (group variable annuity contracts) sponsored by Prudential for whom Class Z shares of the Prudential mutual funds are an available option; |
| ■ | Current and former Directors/Trustees of mutual funds managed by PI or any other affiliate of Prudential; |
| ■ | Prudential; |
| ■ | Prudential funds, including Prudential funds-of-funds; |
| ■ | Qualified state tuition programs (529 plans); and |
| ■ | Investors working with fee-based consultants for investment selection and allocations. |
How Financial Services Firms are
Compensated for Selling Fund Shares
The Prudential Investments and
Target Mutual Funds are distributed by Prudential Investment Management Services LLC (the Distributor), a broker-dealer that is licensed to sell securities. The Distributor generally does not sell shares of the Funds
directly to the public, but instead markets and sells the Funds through other broker-dealers, 401(k) providers, retirement plan administrators, and other financial intermediaries. For ease of reference, we refer to
all financial intermediaries collectively as “financial services firms.” Each Fund is managed by the Manager.
Only persons licensed with the
Financial Industry Regulatory Authority, Inc. (FINRA), as a registered representative (often referred to as a broker or financial adviser) and associated with a specific financial services firm may sell shares of a
mutual fund to you, or to a retirement plan in which you participate.
Rule 12b-1 Fees & Sales
Charges. The Distributor has agreements in place with financial services firms defining how much each firm will be paid for the sale of a particular mutual fund from front-end sales charges, if any,
paid by Fund shareholders and from fees paid to the Distributor by the Fund pursuant to Rule 12b-1 under the 1940 Act (Rule 12b-1). These financial services firms then pay their registered representatives who sold you
the Fund some or all of what they received from the Distributor. The registered representatives may receive a payment when the sale is made
| Visit our website at www.prudentialfunds.com | 27 |
and can, in some cases, continue to receive
ongoing payments while you are invested in the Fund. The Distributor may change at any time, without prior notice, the amount of Rule 12b-1 fees that it pays (when the sale is made and/or any ongoing payments) to
financial services firms and registered representatives so that the Distributor may retain all or a portion of such fees.
“Revenue Sharing”
Payments. In addition to the compensation received by financial services firms as described above, the Manager or certain of its affiliates (but not the Distributor) may make additional payments
(which are often referred to as “revenue sharing” payments) to the financial services firms from the Manager's or certain affiliates' own resources, including from the profits derived from management or
other fees received from the Fund, without additional direct or indirect cost to the Fund or its shareholders, provided that no such additional payments are made with respect to the Fund’s Class Q shares (if
applicable). Revenue sharing payments are in addition to the front-end sales charges paid by Fund shareholders or fees paid pursuant to plans adopted in accordance with Rule 12b-1. The Manager or certain of its
affiliates may revise the terms of any existing revenue sharing arrangement, and may enter into additional revenue sharing arrangements with other financial services firms in the future.
Revenue sharing arrangements are
intended to foster the sale of Fund shares and/or to compensate financial services firms for assisting in marketing or promotional activities in connection with the sale of Fund shares. In exchange for revenue sharing
payments, the Fund generally expects to receive the opportunity for the Fund to be sold through the financial services firms' sales force or access to third-party platforms or other marketing programs, including but
not limited to mutual fund “supermarket” platforms or other sales programs. To the extent that financial services firms receiving revenue sharing payments sell more shares of the Fund, the Manager and
Distributor benefit from the increase in Fund assets as a result of the management and distribution fees they receive from the Fund, respectively. Increased sales of Fund shares also may benefit shareholders, since an
increase in Fund assets may allow the Fund to expand its investment opportunities, and increased Fund assets may result in reduced Fund operating expenses.
Revenue sharing payments, as well
as the other types of payments described above, may provide an incentive for financial services firms and their registered representatives to recommend or sell shares of the Fund to you and in doing so may create
conflicts of interest between the firms' financial interests and their duties to customers.
If your Fund shares are purchased
through a retirement plan, the Manager or certain of its affiliates (but not the Distributor) may also make revenue sharing payments to the plan's recordkeeper or an affiliate, which generally is not a registered
broker-dealer. Rule 12b-1 fees and sales charges may only be paid to a registered broker-dealer.
It is likely that financial
services firms that execute portfolio transactions for the Fund will include those firms with which the Manager and/or certain of its affiliates have entered into revenue sharing arrangements. Neither the Manager nor
any subadviser may consider sales of Fund shares as a factor in the selection of broker-dealers to execute portfolio transactions for the Fund. The Manager and certain of its affiliates will not use Fund brokerage as
any part of revenue sharing payments to financial services firms.
Revenue sharing payments are
usually calculated based on a percentage of Fund sales and/or Fund assets attributable to a particular financial services firm. Payments may also be based on other criteria or factors, for example, a fee per each
transaction. Specific payment formulas are negotiated based on a number of factors, including, but not limited to, reputation in the industry, ability to attract and retain assets, target markets, customer
relationships and scope and quality of services provided. The Manager and/or certain of its affiliates make such payments to financial services firms in amounts that generally range from .02% up to .20% of Fund assets
serviced and maintained by the financial services firms or from .10% to .25% of sales of Fund shares attributable to the firm. In addition, the Manager and/or certain of its affiliates may pay flat fees on a one-time
or irregular basis for the initial set-up of the Fund on a financial services firm's systems, participation or attendance at a financial services firm's meeting, or for other reasons. These amounts are subject to
change. In addition, the costs associated with visiting the financial services firms to make presentations, and/or train and educate the personnel of the financial services firms, may be paid by the Manager and/or
certain of its affiliates, subject to applicable FINRA regulations.
| 28 | Prudential Defensive Equity Fund |
Please contact the registered
representative (or his or her firm) who sold shares of the Fund to you for details about any payments the financial services firm may receive from the Manager and/or certain of its affiliates. You should review your
financial services firm's disclosure and/or talk to your financial services firm to obtain more information on how this compensation may have influenced your financial services firm's recommendation of the Fund.
Additional information regarding these revenue sharing payments is included in the SAI which is available to you at no additional charge.
Other Payments Received by Financial
Services Firms
Administrative, Sub-Accounting and
Networking Fees. In addition to, rather than in lieu of, the fees that the Fund may pay to financial services firms as described above, and the fees the Fund pays to the Transfer Agent, the Transfer Agent
or its affiliates may enter into additional agreements on behalf of the Fund with financial services firms pursuant to which the Fund will pay financial services firms for certain administrative, sub-accounting and
networking services, provided that no such additional payments to financial services firms are made with respect to the Fund’s Class Q shares (if applicable). These services include maintenance of shareholder
accounts by the firms, such as recordkeeping and other activities that otherwise would be performed by the Transfer Agent. Sub-accounting services encompass activities that reduce the burden of recordkeeping to the
Fund. Administrative fees are paid to a firm that undertakes, for example, shareholder communications on behalf of the Fund. Networking services are services undertaken to support the electronic transmission of
shareholder purchase and redemption orders through the National Securities Clearing Corporation (NSCC).
These payments, as discussed
above, are paid out of Fund assets and generally based on either (1) a percentage of the average daily net assets of Fund shareholders serviced by a financial services firm or (2) a fixed dollar amount for each
account serviced by a financial services firm. From time to time, the Manager or certain of its affiliates (but not the Distributor) also may pay a portion of the fees for the services to the financial services firms
at their own expense and out of their own resources.
In addition, the Fund reimburses
the Distributor for NSCC fees that are invoiced to the Distributor as the party to the Agreement with NSCC for the administrative services provided by NSCC to the Fund and its shareholders. These administrative
services provided by NSCC to the Fund and its shareholders include transaction processing and settlement through Fund/SERV, electronic networking services to support the transmission of shareholder purchase and
redemption orders to and from financial intermediaries, and related recordkeeping provided by NSCC to the Fund and its shareholders. These payments are generally based on a transaction fee rate for certain
administrative services plus a fee for other administrative services.
Anti-Money Laundering
In accordance with federal law, the
Fund has adopted policies designed to deter money laundering. Under the policies, the Fund will not knowingly engage in financial transactions that involve proceeds from unlawful activity or support terrorist
activities, and shall file government reports, including those concerning suspicious activities, as required by applicable law. The Fund will seek to confirm the identity of potential shareholders to include both
individuals and entities through documentary and non-documentary methods. Non-documentary methods may include verification of name, address, date of birth and tax identification number with selected credit bureaus.
The Fund has also appointed an Anti-Money Laundering Compliance Officer to oversee the Fund's anti-money laundering policies.
Understanding the Price You'll
Pay
The price you pay for each share of
the Fund is based on the share value. The share value of a mutual fund—known as the net asset value or NAV—is determined by a simple calculation: it's the total value of the Fund (assets minus liabilities) divided by the total number of shares outstanding. For example, if the
value of the investments held by
| Visit our website at www.prudentialfunds.com | 29 |
Fund XYZ (minus its liabilities) is $1,000 and
there are 100 shares of Fund XYZ owned by shareholders, the value of one share of the Fund—or the NAV—is $10 ($1,000 divided by 100).
Mutual Fund Shares
The NAV of mutual fund shares changes every day because the value of a fund's portfolio changes constantly. For example, if Fund XYZ holds ACME Corp. bonds in its portfolio and the price of ACME
bonds goes up, while the value of the Fund's other holdings remains the same and expenses don't change, the NAV of Fund XYZ will increase.
The Fund's NAV will be determined
every day on which the Fund is open as of the close of regular trading on the New York Stock Exchange (NYSE) (generally, 4:00 p.m. Eastern time). The Fund's portfolio securities are valued based upon market quotations
or, if market quotations are not readily available, at fair value as determined in good faith under procedures established by the Board. These procedures include pricing methodologies for determining the fair value of
certain types of securities and other assets held by the Fund that do not have quoted market prices, and authorize the use of other pricing sources, such as bid prices supplied by a principal market maker and
evaluated prices supplied by pricing vendors that employ analytic methodologies that take into account the prices of similar securities and other market factors.
If the Fund determines that a
market quotation for a security is not reliable based on, among other things, events or market conditions that occur with respect to one or more securities held by the Fund or the market as a whole, after the
quotation is derived or after the closing of the primary market on which the security is traded, but before the time that the Fund's NAV is determined, the Fund may use “fair value pricing,” which is
implemented by a valuation committee (Valuation Committee) consisting of representatives of the Manager or by the Board. The subadviser often provides relevant information for the Valuation Committee meeting. In
addition, the Fund may use fair value pricing determined by the Valuation Committee or Board if the pricing source does not provide an evaluated price for a security or provides an evaluated price that, in the
judgment of the Manager (which may be based upon a recommendation from the subadviser), does not represent fair value. Securities that are primarily traded outside the United States may also be subject to a fair value
pricing adjustment using a service provided by a pricing vendor, if it is determined that market quotations from those non-US markets are not reliable, based on market movements after the close of the relevant non-US
markets. Non-US securities markets are open for trading on weekends and other days when the Fund does not price shares. Therefore, the value of the Fund’s shares may change on days when you will not be able to
purchase or redeem the Fund’s shares.
With respect to any portion of the
Fund's assets that are invested in one or more open-end investment companies, the Fund's NAV will be calculated based upon the NAV of the investment company in which the Fund invests, which will reflect the investment
company’s fair valuation procedures.
Different valuation methods may
result in differing values for the same security. The fair value of a portfolio security that the Fund uses to determine its NAV may differ from the security's quoted or published price. If the Fund needs to implement
fair value pricing after the NAV publishing deadline but before shares of the Fund are processed, the NAV you receive or pay may differ from the published NAV price. The prospectuses of any other mutual funds in which
the Fund invests will explain each fund’s procedures and policies with respect to the use of fair value pricing.
Fair value pricing procedures are
designed to result in prices for the Fund's securities and its NAV that are reasonable in light of the circumstances which make or have made market quotations unavailable or unreliable, and may have the effect of
reducing arbitrage opportunities available to short-term traders. There is no assurance, however, that fair value pricing will more accurately reflect the market value of a security than the market price of such
security on that day or that it will prevent dilution of the Fund's NAV by short-term traders.
| 30 | Prudential Defensive Equity Fund |
What Price Will
You Pay for Shares of the Fund? For Class A shares, you'll pay the public offering price, which is the NAV next determined after we receive your order to purchase, plus an initial sales charge (unless you're entitled to a
waiver). For all other share classes, you will pay the NAV next determined after we receive your order to purchase (remember, there are no up-front sales charges for these share classes). Your broker may charge you a
separate or additional fee for purchases of shares. Unless regular trading on the NYSE closes before 4:00 p.m. Eastern time, or later than 4:00 p.m. Eastern time, your order to purchase must be received by 4:00 p.m.
Eastern time in order to receive that day's NAV. In the event that regular trading on the NYSE closes before 4:00 p.m. Eastern time, you will receive the following day's NAV if your order to purchase is received after
the close of regular trading on the NYSE. We deem an order received when it is received by the Transfer Agent at its processing center. If you submit your order through a broker or other financial intermediary, it may
be deemed received when received by the broker or financial intermediary.
Each business day, the
Fund’s current NAV per share is made available at www.prudentialfunds.com (click on the “Funds” tab at the top of the home page, then select “Open-End Funds—Prices & Yields”).
Additional Shareholder Services
As a Fund shareholder, you can take
advantage of the following services and privileges:
Automatic Reinvestment. As we explained in the “Fund Distributions and Tax Issues” section, the Fund pays out—or distributes—its net investment income and net capital gains to all
shareholders. For your convenience, we will automatically reinvest your distributions in the Fund at NAV, without any sales charge. If you want your distributions paid in cash, you can indicate this preference on your
application, or by notifying your broker or the Transfer Agent in writing (at the address below) at least five business days before the date we determine who receives dividends. For accounts held at the Transfer Agent
(PMFS), distributions of $10.00 or less on non-retirement accounts will not be paid out in cash, but will be automatically reinvested into your account.
Prudential Mutual Fund Services
LLC
P.O. Box 9658
Providence, RI 02940
P.O. Box 9658
Providence, RI 02940
Automatic Investment Plan
(AIP). You can make regular purchases of the Fund by having a fixed amount of money automatically withdrawn from your bank or brokerage account at specified intervals. The minimum for subsequent
investments through newly-established AIP accounts must be at least $50 monthly.
Note: New AIPs in Class B shares
may not be established. Class B shareholders may not make automatic investments in Class B shares through an AIP. A Class B shareholder must designate a different share class of the same fund or another fund for
purchases. Shareholders may select another share class which they are eligible to purchase.
Retirement Plan Services. Prudential offers a wide variety of retirement plans for individuals and institutions, including large and small businesses. For information on IRAs, including Roth IRAs or SEP-IRAs for a
one-person business, please contact your financial adviser. If you are interested in opening a 401(k) or other company-sponsored retirement plan (SIMPLE IRAs, SEP plans, Keoghs, 403(b)(7) plans, pension and
profit-sharing plans), your financial adviser will help you determine which retirement plan best meets your needs. Complete instructions about how to establish and maintain your plan and how to open accounts for you
and your employees will be included in the retirement plan kit you receive in the mail.
Note: Class B shareholders can
continue to hold Class B shares in IRA and SIMPLE IRA accounts or in employer-sponsored retirement plans, but new contributions must be made in another share class.
Systematic Withdrawal Plan. A Systematic Withdrawal Plan is available that will provide you with monthly, quarterly, semi-annual or annual redemption checks. The Systematic Withdrawal Plan is not available to
participants in certain retirement plans. Please contact PMFS at (800) 225-1852 for more details.
| Visit our website at www.prudentialfunds.com | 31 |
Reports to Shareholders. Every year we will send you an annual report (along with an updated prospectus) and a semi-annual report, which contain important financial information about the Fund. To reduce Fund
expenses, we may send one annual shareholder report, one semi-annual shareholder report and one annual prospectus per household, unless you instruct us or your broker otherwise. If each Fund shareholder in your
household would like to receive a copy of the Fund's prospectus, shareholder report and proxy statement, please call us toll free at (800) 225-1852. We will begin sending additional copies of these documents within 30
days of receipt of your request.
HOW TO SELL YOUR SHARES
You can sell your Fund shares for
cash (in the form of a check) at any time, subject to certain restrictions. For more information about these restrictions, see “Restrictions on Sales” below.
When you sell shares of a
Fund—also known as redeeming your shares—the price you will receive will be the NAV next determined after the Transfer Agent or your broker or other financial intermediary receives your order to sell (less
any applicable CDSC). If your broker holds your shares, your broker must receive your order to sell no later than the time regular trading on the NYSE closes—which is usually 4:00 p.m. Eastern time—to
process the sale on that day. In the event that regular trading on the NYSE closes before 4:00 p.m. Eastern time, you will receive the following day's NAV if your order to sell is received after the close of regular
trading on the NYSE. Otherwise, contact:
Prudential Mutual Fund Services
LLC
P.O. Box 9658
Providence, RI 02940
P.O. Box 9658
Providence, RI 02940
Generally, we
will pay you for the shares that you sell within seven days after the Transfer Agent or your broker or other financial intermediary receives your sell order. If you hold shares through a broker, payment will be
credited to your account. If you are selling shares you recently purchased with a check, we may delay sending you the proceeds until your check clears, which can take up to seven days from the purchase date. Your
broker may charge you a separate or additional fee for sales of shares.
As a result of restrictions on
withdrawals and transfers imposed by Section 403(b) of the Internal Revenue Code of 1986, as amended, we may consider a redemption request to not be in good order until we obtain information from your employer that is
reasonably necessary to ensure that the payment is in compliance with such restrictions, if applicable. In such an event, the redemption request will not be in good order and we will not process it until we obtain
information from your employer.
Restrictions on Sales
There are certain times when you
may not be able to sell shares of the Fund or when we may delay paying you the proceeds from a sale. As permitted by the Securities and Exchange Commission, the former may happen only during unusual market conditions
or emergencies when the Fund can't determine the value of its assets or sell its holdings. For more information, see the SAI.
If you hold your shares directly
with the Transfer Agent, you will need to have the signature on your sell order medallion signature guaranteed if:
| ■ | You are selling more than $100,000 of shares; |
| ■ | You want the redemption proceeds made payable to someone that is not in our records; |
| ■ | You want the redemption proceeds sent to some place that is not in our records; |
| ■ | You are a business or a trust; or |
| ■ | You are redeeming due to the death of the shareholder or on behalf of the shareholder. |
The medallion signature guarantee
may be obtained from an authorized officer from a bank, broker, dealer, securities exchange or association, clearing agency, savings association, or credit union that is participating in one of the recognized
medallion guarantee programs (STAMP, SEMP, or NYSE MSP). The medallion signature guarantee must be
| 32 | Prudential Defensive Equity Fund |
appropriate for the dollar amount of the
transaction. The Transfer Agent reserves the right to reject transactions where the value of the transaction exceeds the value of the surety coverage indicated on the medallion imprint. For more information, see the
SAI.
Contingent Deferred Sales Charge
(CDSC)
If you sell Class B shares within
six years of purchase or Class C shares within 12 months of purchase, you will have to pay a CDSC. In addition, if you purchase $1 million or more of Class A shares, although you are not subject to an initial sales
charge, you are subject to a 1% CDSC for shares redeemed within 12 months of purchase (the CDSC is waived for purchases by certain retirement and/or benefit plans). To keep the CDSC as low as possible, we will sell
amounts representing shares in the following order:
| ■ | Amounts representing shares you purchased with reinvested dividends and distributions, |
| ■ | Amounts representing the increase in NAV above the total amount of payments for shares made during the past 12 months for Class A shares (in certain cases), six years for Class B shares, and 12 months for Class C shares, and |
| ■ | Amounts representing the cost of shares held beyond the CDSC period (12 months for Class A shares (in certain cases), six years for Class B shares, and 12 months for Class C shares). |
Since shares that fall into any of
the categories listed above are not subject to the CDSC, selling them first helps you to avoid—or at least minimize—the CDSC.
Having sold the exempt shares
first, if there are any remaining shares that are subject to the CDSC, we will apply the CDSC to amounts representing the cost of shares held for the longest period of time within the applicable CDSC period.
The CDSC is calculated based on
the lesser of the original purchase price or the redemption proceeds. The rate decreases on the anniversary date of your purchase.
The holding period for purposes of
determining the applicable CDSC will be calculated from the anniversary date of the purchase, excluding any time Class B or Class C shares were held in a money market fund.
Waiver of the CDSC—Class A
Shares
The CDSC will be waived if the
Class A shares are sold:
| ■ | After a shareholder is deceased or permanently disabled (or, in the case of a trust account, after the death or permanent disability of the grantor). This waiver applies to individual shareholders, as well as shares held in joint tenancy, provided the shares were purchased before the death or permanent disability; |
| ■ | To provide for certain distributions—made without IRS penalty—from a qualified or tax-deferred retirement plan, benefit plan, IRA or Section 403(b) custodial account; |
| ■ | To withdraw excess contributions from a qualified or tax-deferred retirement plan, IRA or Section 403(b) custodial account; and |
| ■ | For redemptions by certain retirement or benefit plans. |
For more information, see the
SAI.
Waiver of the CDSC—Class B
Shares
The CDSC will be waived if the
Class B shares are sold:
| ■ | After a shareholder is deceased or permanently disabled (or, in the case of a trust account, after the death or permanent disability of the grantor). This waiver applies to individual shareholders, as well as shares held in joint tenancy, provided the shares were purchased before the death or permanent disability; |
| ■ | To provide for certain distributions—made without IRS penalty—from a qualified or tax-deferred retirement plan, benefit plan, IRA or Section 403(b) custodial account; |
| ■ | To withdraw excess contributions from a qualified or tax-deferred retirement plan, IRA or Section 403(b) custodial account; and |
| ■ | On certain redemptions effected through a Systematic Withdrawal Plan. |
| Visit our website at www.prudentialfunds.com | 33 |
For more information, see the
SAI.
Waiver of the CDSC—Class C
Shares
The CDSC will be waived if the
Class C shares are sold:
| ■ | After a shareholder is deceased or permanently disabled (or, in the case of a trust account, after the death or permanent disability of the grantor). This waiver applies to individual shareholders, as well as shares held in joint tenancy, provided the shares were purchased before the death or permanent disability; |
| ■ | To provide for certain distributions—made without IRS penalty—from a qualified or tax-deferred retirement plan, benefit plan, IRA or Section 403(b) custodial account; |
| ■ | To withdraw excess contributions from a qualified or tax-deferred retirement plan, IRA or Section 403(b) custodial account; and |
| ■ | The CDSC will be waived for redemptions by certain group retirement plans for which Prudential or brokers not affiliated with Prudential provide administrative or recordkeeping services. The CDSC also will be waived for certain redemptions by benefit plans sponsored by Prudential and its affiliates. For more information, call Prudential at (800) 353-2847. |
For more information, see the
SAI.
Redemption In Kind
If the sales of Fund shares you
make during any 90-day period reach the lesser of $250,000 or 1% of the value of the Fund's net assets, we can then give you securities from the Fund's portfolio instead of cash. If you want to sell the securities for
cash, you would have to pay the costs charged by a broker. You would also be responsible for any tax consequences resulting from your ownership of the securities.
Involuntary Redemption of Small
Accounts
If the value of your account with
PMFS is less than $500 for any reason, we may sell your shares (without charging any CDSC) and close your account. We would do this to minimize the Fund's expenses paid by other shareholders. The involuntary sale
provisions do not apply to Automatic Investment Plan (AIP) accounts, employee savings plan accounts, payroll deduction plan accounts, retirement accounts (such as a 401(k) plan, an IRA or other qualified or
tax-deferred plan or account), omnibus accounts, and accounts for which a broker or other financial intermediary is responsible for recordkeeping. Prior thereto, if you make a sale that reduces your account value to
less than the threshold, we may sell the rest of your shares (without charging any CDSC) and close your account; this involuntary sale does not apply to shareholders who own their shares as part of a retirement
account. For more information, see “Purchase, Redemption and Pricing of Fund Shares—Involuntary Redemption” in the SAI.
Account Maintenance Fee
If the value of your account with
PMFS is less than $10,000, with certain exclusions, a $15 annual account maintenance fee will be deducted from your account during the 4th calendar quarter of each year. Any applicable CDSC on the shares redeemed to
pay the account maintenance fee will be waived. For more information, see “Purchase, Redemption and Pricing of Fund Shares—Account Maintenance Fee” in the SAI.
90-Day Repurchase Privilege
After you redeem your shares, you
have a 90-day period during which you may reinvest back into your account any of the redemption proceeds in shares of the same Fund without paying an initial sales charge. In order to take advantage of this one-time
privilege, you must notify the Transfer Agent or your broker at the time of the repurchase. For more information, see the SAI.
Retirement Plans
To sell shares and receive a
distribution from your retirement account, call your broker or the Transfer Agent for a distribution request form. There are special distribution and income tax withholding requirements for distributions from
retirement plans and you must submit a withholding form with your request to avoid delay. If your retirement plan account is held for you by your employer or plan trustee, you must arrange for the distribution request
to be signed and sent by the plan administrator or trustee. For additional information, see the SAI.
| 34 | Prudential Defensive Equity Fund |
HOW TO EXCHANGE YOUR SHARES
You can exchange your shares of the
Fund for shares of the same class in certain other Prudential Investments mutual funds—including Prudential MoneyMart Assets (a money market fund)—if you satisfy the minimum investment requirements. For
example, you can exchange Class A shares of the Fund for Class A shares of other funds in the Prudential Investments mutual fund family, but you can’t exchange Class A shares for a different share class of
another fund. After an exchange, at redemption, any CDSC will be calculated from the date of the initial purchase, excluding any time that Class B or Class C shares were held in Prudential MoneyMart Assets. We may
change the terms of any exchange privilege after giving you 60 days' notice.
Note: Class B
shares may not be purchased or acquired by any Class B shareholder except by exchange from Class B shares of another fund or through dividend and/or capital gains reinvestment.
There is no sales charge for
exchanges. However, if you exchange—and then sell—shares within the applicable CDSC period, you must still pay the applicable CDSC. At the time of exchange, CDSC liable shares and free shares move
proportionally according to the percentage of total shares you are exchanging. If you have exchanged Class B or Class C shares into Prudential MoneyMart Assets, the time you hold the Class B or Class C shares in the
money market fund will not be counted in calculating the required holding period for CDSC liability.
For investors in certain programs
sponsored by broker-dealers, investment advisers and financial planners who have agreements with Prudential, or whose programs are available through financial intermediaries that have agreements with Prudential
relating to mutual fund “wrap” or asset allocation programs or mutual fund “supermarket” programs, an exchange may be made from Class A to Class Z shares of the Fund in certain limited
circumstances. Contact your program sponsor or financial intermediary with any questions.
If you hold shares through a
broker, you must exchange shares through your broker. Otherwise contact:
Prudential Mutual Fund Services
LLC
P.O. Box 9658
Providence, RI 02940
P.O. Box 9658
Providence, RI 02940
If you participate in any
fee-based program where the Fund is an available investment option, you may arrange with the Transfer Agent or your recordkeeper to exchange your Class A shares, if any, for Class Z shares when you elect to
participate in the fee-based program. When you no longer participate in the program, you may arrange with the Transfer Agent or your recordkeeper to exchange all of your Class Z shares, including shares purchased
while you were in the program, for Class A shares.
Likewise, if you are entitled to
purchase Class Z shares as a participant in Wells Fargo Advisors’ 401(k) Plan and you seek to transfer your Class Z shares out of the 401(k) Plan after your voluntary or involuntary termination of employment or
retirement, you may arrange with the Transfer Agent or your recordkeeper to exchange your Class Z shares held in the 401(k) Plan for Class A shares.
Remember, as we explained in the
section entitled “Fund Distributions and Tax Issues—If You Sell or Exchange Your Shares,” exchanging shares is considered a sale for tax purposes. Therefore, if the shares you exchange are worth more
than the amount that you paid for them, you may have to pay capital gains tax. For additional information about exchanging shares, see the SAI.
Frequent Purchases and Redemptions
of Fund Shares
The Fund seeks to prevent patterns
of frequent purchases and redemptions of Fund shares by its shareholders. Frequent purchases and sales of shares of the Fund may adversely affect Fund performance and the interests of long-term investors. When a
shareholder engages in frequent or short-term trading, the Fund may have to sell portfolio securities to have the cash necessary to redeem the shareholder's shares. This can happen when it is not advantageous to sell
any securities, so the Fund's performance may be hurt. When large dollar amounts are involved, frequent trading can also make it difficult to use long-term investment strategies because the Fund cannot predict
| Visit our website at www.prudentialfunds.com | 35 |
how much cash it will have to invest. In addition,
if the Fund is forced to liquidate investments due to short-term trading activity, it may incur increased brokerage and tax costs. Similarly, the Fund may bear increased administrative costs as a result of the asset
level and investment volatility that accompanies patterns of short-term trading. Moreover, frequent or short-term trading by certain shareholders may cause dilution in the value of Fund shares held by other
shareholders. Funds that invest in foreign securities may be particularly susceptible to frequent trading because time zone differences among international stock markets can allow a shareholder engaging in frequent
trading to exploit fund share prices that may be based on closing prices of foreign securities established some time before the Fund calculates its own share price. Funds that invest in certain fixed-income
securities, such as high-yield bonds or certain asset-backed securities, may also constitute an effective vehicle for a shareholder's frequent trading strategy.
The Fund does not knowingly
accommodate or permit frequent trading, and the Board has adopted policies and procedures designed to discourage or prevent frequent trading activities by Fund shareholders. In an effort to prevent such practices, the
Fund's Transfer Agent monitors trading activity on a daily basis. The Fund has implemented a trading policy that limits the number of times a shareholder may purchase Fund shares or exchange into the Fund and then
sell those shares within a specified period of time (a “round-trip transaction”) as established by the Fund's Chief Compliance Officer (CCO). The CCO is authorized to set and modify the parameters of the
trading policy at any time as required to prevent the adverse impact of frequent trading on Fund shareholders.
The CCO has defined frequent
trading as one or more round-trip transactions in shares of the Fund within a 30-day period. If this occurs, the shareholder’s account will be subject to a 60-day warning period. If a second round-trip occurs
before the conclusion of the 60-day warning period, a trading suspension will be placed on the account by the Fund’s Transfer Agent that will remain in effect for 90 days. The trading suspension will relate to
purchases and exchange purchases (but not redemptions) in the Fund in which the frequent trading occurred. Exceptions to the trading policy will not normally be granted.
Transactions in the Prudential
Investments money market funds are excluded from this policy. In addition, transactions by the Prudential Asset Allocation Funds and the Prudential Real Assets Fund, which are structured as
“funds-of-funds,” and invest primarily in other mutual funds within the Prudential Investments fund family, are not subject to the limitations of the trading policy and are not considered frequent or
short-term trading.
The Fund reserves the right to
reject or cancel, without prior notice, all additional purchases or exchanges into the Fund by a shareholder. Moreover, the Fund may direct a broker-dealer or other intermediary to block a shareholder account from
future trading in the Fund. The Transfer Agent will monitor trading activity over $25,000 per account on a daily basis for a rolling 90-day period. If a purchase into the Fund is rejected or canceled, the shareholder
will receive a return of the purchase amount.
If the Fund is offered to
qualified plans on an omnibus basis or if Fund shares may be purchased through other omnibus arrangements, such as through a financial intermediary such as a broker-dealer, a bank, an insurance company separate
account, an investment adviser, or an administrator or trustee of a retirement plan (“Intermediaries”) that holds your shares in an account under its name, Intermediaries maintain the individual beneficial
owner records and submit to the Fund only aggregate orders combining the transactions of many beneficial owners. The Fund itself generally cannot monitor trading by particular beneficial owners. The Fund has notified
Intermediaries in writing that it expects the Intermediaries to impose restrictions on transfers by beneficial owners. Intermediaries may impose different or stricter restrictions on transfers by beneficial owners.
Consistent with the restrictions described above, investments in the Fund through retirement programs administered by Prudential Retirement will be similarly identified for frequent purchases and redemptions and
appropriately restricted.
The Transfer Agent also reviews
the aggregate net flows in excess of $1 million. In those cases, the trade detail is reviewed to determine if any of the activity relates to potential offenders. In cases of omnibus orders, the Intermediary may be
contacted by the Transfer Agent to obtain additional information. The Transfer Agent has the authority to cancel all or a portion of the trade if the information reveals that the activity relates to potential
offenders. Where appropriate, the Transfer Agent may request that the Intermediary block a financial adviser or client from accessing the Fund. If necessary, the Fund may be removed from a particular Intermediary's
platform.
| 36 | Prudential Defensive Equity Fund |
Shareholders seeking to engage in
frequent trading activities may use a variety of strategies to avoid detection and, despite the efforts of the Fund to prevent such trading, there is no guarantee that the Fund, the Transfer Agent or Intermediaries
will be able to identify these shareholders or curtail their trading practices. The Fund does not have any arrangements intended to permit trading of its shares in contravention of the policies described above.
Telephone Redemptions or
Exchanges
You may redeem your shares of the
Fund if the proceeds of the redemption do not exceed $100,000 or exchange your shares in any amount by calling the Fund at (800) 225-1852 and communicating your instructions in good order to a customer service
representative before 4:00 p.m. Eastern time. You will receive a redemption or exchange amount based on that day's NAV. Certain restrictions apply; please see the section entitled “How to Sell Your
Shares—Restrictions on Sales” above for additional information. In the event that regular trading on the NYSE closes before 4:00 p.m. Eastern time, you will receive the following day's NAV if your order to
sell or exchange is received after the close of regular trading on the NYSE.
The Transfer Agent will record
your telephone instructions and request specific account information before redeeming or exchanging shares. The Fund will not be liable for losses due to unauthorized or fraudulent telephone instructions if it follows
instructions that it reasonably believes are made by the shareholder. If the Fund does not follow reasonable procedures, it may be liable.
In the event of drastic economic
or market changes, you may have difficulty in redeeming or exchanging your shares by telephone. If this occurs, you should consider redeeming or exchanging your shares by mail or through your broker.
The telephone redemption and
exchange procedures may be modified or terminated at any time. If this occurs, you will receive a written notice from the Fund.
Expedited Redemption Privilege
If you have selected the Expedited
Redemption Privilege, you may have your redemption proceeds sent directly to your bank account. Expedited redemption requests may be made by telephone or letter, must be received by the Transfer Agent prior to 4:00
p.m. Eastern time to receive a redemption amount based on that day's NAV and are subject to the terms and conditions regarding the redemption of shares. In the event that regular trading on the NYSE closes before 4:00
p.m. Eastern time, you will receive the following day's NAV if your order to sell is received after the close of regular trading on the NYSE. For more information, see the SAI. The Expedited Redemption Privilege may
be modified or terminated at any time without notice.
| Visit our website at www.prudentialfunds.com | 37 |
FINANCIAL HIGHLIGHTS
Introduction
The financial
highlights will help you evaluate the Fund's financial performance for the fiscal period from August 1, 2014 through October 31, 2014 and the fiscal years ended July 31, 2014, 2013, 2012, 2011 and 2010.
Certain information reflects financial results for a single fund share. The total return in each chart represents the rate that a shareholder would have earned (or lost) on an investment in the Fund, assuming
investment at the start of the period and reinvestment of all dividends and other distributions. The information is for the periods indicated.
A copy of the Fund's annual
report, along with the Fund's audited financial statements and report of independent registered public accounting firm, is available upon request, at no charge, as described on the back cover of this Prospectus.
The financial highlights were
derived from the financial statements audited by KPMG LLP, independent registered public accounting firm, whose report on those financial statements was unqualified.
| Class A Shares | ||||||
| Three Months Ended October 31, 2014(b)(f) |
Year Ended July 31, | |||||
| 2014(b) | 2013(b) | 2012(b) | 2011(b) | 2010(b) | ||
| Per Share Operating Performance: | ||||||
| Net Asset Value, Beginning Of Period | $13.65 | $12.86 | $11.23 | $11.12 | $9.88 | $8.97 |
| Income (loss) from investment operations: | ||||||
| Net investment income | .03 | .12 | .13 | .13 | .13 | .14 |
| Net realized and unrealized gain on investment transactions | .58 | 1.46 | 1.72 | .09 | 1.20 | .90 |
| Total from investment operations | .61 | 1.58 | 1.85 | .22 | 1.33 | 1.04 |
| Less Dividends and Distributions: | ||||||
| Dividends from net investment income | – | (.13) | (.22) | (.11) | (.09) | (.13) |
| Distributions from net realized gains | – | (.66) | – | – | – | – |
| Total dividends and distributions | – | (.79) | (.22) | (.11) | (.09) | (.13) |
| Net asset value, end of period | $14.26 | $13.65 | $12.86 | $11.23 | $11.12 | $9.88 |
| Total Return(a) | 4.47% | 12.66% | 16.69% | 2.05% | 13.51% | 11.67% |
| Ratios/Supplemental Data: | ||||||
| Net assets, end of period (000) | $184,830 | $181,385 | $179,711 | $170,788 | $196,985 | $164,925 |
| Average net assets (000) | $181,880 | $182,251 | $172,847 | $188,087 | $186,704 | $159,007 |
| Ratios to average net assets(c): | ||||||
| Expense after advisory fee waiver and expense reimbursement | 1.40%(d) | 1.25% | 1.38% | 1.41% | 1.37% | 1.41% |
| Expense before advisory fee waiver and expense reimbursement | 1.45%(d) | 1.30% | 1.43% | 1.46% | 1.42% | 1.61% |
| Net investment income | .74%(d) | .90% | 1.05% | 1.19% | 1.16% | 1.39% |
| Portfolio turnover rate | 20%(e) | 87% | 239% | 174% | 151% | 140% |
(a) Total return does not
consider the effects of sales loads. Total return is calculated assuming a purchase of a share on the first day and a sale on the last day of each period reported and includes reinvestment of dividends and
distributions. Total returns may reflect adjustments to conform to generally accepted accounting principles. Total returns for periods less than one full year are not annualized.
(b) Calculated based upon average shares
outstanding during the period.
(c) Does not include expenses of the
underlying portfolios in which the Fund invests.
(d)
Annualized.
(e) Not annualized.
(f) For the three month period ended October
31, 2014. The Fund changed its fiscal year end from July 31 to October 31, effective October 31, 2014.
| 38 | Prudential Defensive Equity Fund |
| Class B Shares | ||||||
| Three Months Ended October 31, 2014(b)(f) |
Year Ended July 31, | |||||
| 2014(b) | 2013(b) | 2012(b) | 2011(b) | 2010(b) | ||
| Per Share Operating Performance: | ||||||
| Net Asset Value, Beginning Of Period | $13.58 | $12.80 | $11.17 | $11.06 | $9.84 | $8.97 |
| Income (loss) from investment operations: | ||||||
| Net investment income (loss) | –(g) | .02 | .04 | .05 | .04 | .06 |
| Net realized and unrealized gain on investment transactions | .57 | 1.45 | 1.73 | .09 | 1.20 | .91 |
| Total from investment operations | .57 | 1.47 | 1.77 | .14 | 1.24 | .97 |
| Less Dividends and Distributions: | ||||||
| Dividends from net investment income | – | (.03) | (.14) | (.03) | (.02) | (.10) |
| Distributions from net realized gains | – | (.66) | – | – | – | – |
| Total dividends and distributions | – | (.69) | (.14) | (.03) | (.02) | (.10) |
| Net asset value, end of period | $14.15 | $13.58 | $12.80 | $11.17 | $11.06 | $9.84 |
| Total Return(a) | 4.20% | 11.84% | 15.94% | 1.26% | 12.57% | 10.82% |
| Ratios/Supplemental Data: | ||||||
| Net assets, end of period (000) | $17,164 | $17,425 | $20,780 | $24,968 | $36,955 | $52,726 |
| Average net assets (000) | $17,140 | $19,454 | $22,938 | $29,979 | $46,927 | $62,087 |
| Ratios to average net assets(c): | ||||||
| Expense after advisory fee waiver and expense reimbursement | 2.15%(d) | 2.00% | 2.13% | 2.16% | 2.12% | 2.16% |
| Expense before advisory fee waiver and expense reimbursement | 2.15%(d) | 2.00% | 2.13% | 2.16% | 2.12% | 2.16% |
| Net investment income (loss) | –%(d)(h) | .16% | .30% | .45% | .41% | .65% |
| Portfolio turnover rate | 20%(e) | 87% | 239% | 174% | 151% | 140% |
(a) Total return does not
consider the effects of sales loads. Total return is calculated assuming a purchase of a share on the first day and a sale on the last day of each period reported and includes reinvestment of dividends and
distributions. Total returns may reflect adjustments to conform to generally accepted accounting principles. Total returns for periods less than one full year are not annualized.
(b) Calculated based upon average shares
outstanding during the period.
(c) Does not include expenses of the
underlying portfolios in which the Fund invests.
(d)
Annualized.
(e) Not annualized.
(f) For the three month period ended October
31, 2014. The Fund changed its fiscal year end from July 31 to October 31, effective October 31, 2014.
(g) Less than $.005.
(h) Less than .005%.
| Visit our website at www.prudentialfunds.com | 39 |
| Class C Shares | ||||||
| Three Months Ended October 31, 2014(b)(f) |
Year Ended July 31, | |||||
| 2014(b) | 2013(b) | 2012(b) | 2011(b) | 2010(b) | ||
| Per Share Operating Performance: | ||||||
| Net Asset Value, Beginning Of Period | $13.57 | $12.80 | $11.17 | $11.06 | $9.84 | $8.97 |
| Income (loss) from investment operations: | ||||||
| Net investment income (loss) | –(g) | .02 | .04 | .05 | .04 | .06 |
| Net realized and unrealized gain on investment transactions | .58 | 1.44 | 1.73 | .09 | 1.20 | .91 |
| Total from investment operations | .58 | 1.46 | 1.77 | .14 | 1.24 | .97 |
| Less Dividends and Distributions: | ||||||
| Dividends from net investment income | – | (.03) | (.14) | (.03) | (.02) | (.10) |
| Distributions from net realized gains | – | (.66) | – | – | – | – |
| Total dividends and distributions | – | (.69) | (.14) | (.03) | (.02) | (.10) |
| Net asset value, end of period | $14.15 | $13.57 | $12.80 | $11.17 | $11.06 | $9.84 |
| Total Return(a) | 4.27% | 11.75% | 15.94% | 1.26% | 12.57% | 10.82% |
| Ratios/Supplemental Data: | ||||||
| Net assets, end of period (000) | $50,550 | $49,855 | $48,666 | $50,632 | $58,827 | $63,077 |
| Average net assets (000) | $50,000 | $49,435 | $49,670 | $52,831 | $62,754 | $68,051 |
| Ratios to average net assets(c): | ||||||
| Expense after advisory fee waiver and expense reimbursement | 2.15%(d) | 2.00% | 2.13% | 2.16% | 2.12% | 2.16% |
| Expense before advisory fee waiver and expense reimbursement | 2.15%(d) | 2.00% | 2.13% | 2.16% | 2.12% | 2.16% |
| Net investment income (loss) | (.01)%(d) | .15% | .30% | .44% | .41% | .64% |
| Portfolio turnover rate | 20%(e) | 87% | 239% | 174% | 151% | 140% |
(a) Total return does not
consider the effects of sales loads. Total return is calculated assuming a purchase of a share on the first day and a sale on the last day of each period reported and includes reinvestment of dividends and
distributions. Total returns may reflect adjustments to conform to generally accepted accounting principles. Total returns for periods less than one full year are not annualized.
(b) Calculated based upon average shares
outstanding during the period.
(c) Does not include expenses of the
underlying portfolios in which the Fund invests.
(d)
Annualized.
(e) Not annualized.
(f) For the three month period ended October
31, 2014. The Fund changed its fiscal year end from July 31 to October 31, effective October 31, 2014.
(g) Less than $.005.
| 40 | Prudential Defensive Equity Fund |
| Class R Shares | ||||||
| Three Months Ended October 31, 2014(b)(f) |
Year Ended July 31, | |||||
| 2014(b) | 2013(b) | 2012(b) | 2011(b) | 2010(b) | ||
| Per Share Operating Performance: | ||||||
| Net Asset Value, Beginning Of Period | $13.63 | $12.85 | $11.21 | $11.10 | $9.87 | $8.97 |
| Income (loss) from investment operations: | ||||||
| Net investment income | .02 | .09 | .10 | .10 | .09 | .11 |
| Net realized and unrealized gain on investment transactions | .58 | 1.44 | 1.73 | .09 | 1.21 | .91 |
| Total from investment operations | .60 | 1.53 | 1.83 | .19 | 1.30 | 1.02 |
| Less Dividends and Distributions: | ||||||
| Dividends from net investment income | – | (.09) | (.19) | (.08) | (.07) | (.12) |
| Distributions from net realized gains | – | (.66) | – | – | – | – |
| Total dividends and distributions | – | (.75) | (.19) | (.08) | (.07) | (.12) |
| Net asset value, end of period | $14.23 | $13.63 | $12.85 | $11.21 | $11.10 | $9.87 |
| Total Return(a) | 4.40% | 12.32% | 16.52% | 1.78% | 13.16% | 11.43% |
| Ratios/Supplemental Data: | ||||||
| Net assets, end of period (000) | $434 | $415 | $373 | $311 | $341 | $578 |
| Average net assets (000) | $422 | $391 | $341 | $306 | $497 | $632 |
| Ratios to average net assets(c): | ||||||
| Expense after advisory fee waiver and expense reimbursement | 1.65%(d) | 1.50% | 1.63% | 1.66% | 1.62% | 1.66% |
| Expense before advisory fee waiver and expense reimbursement | 1.90%(d) | 1.75% | 1.88% | 1.91% | 1.87% | 1.91% |
| Net investment income | .48%(d) | .65% | .81% | .94% | .89% | 1.15% |
| Portfolio turnover rate | 20%(e) | 87% | 239% | 174% | 151% | 140% |
(a) Total return is
calculated assuming a purchase of a share on the first day and a sale on the last day of each period reported and includes reinvestment of dividends and distributions. Total returns may reflect adjustments to conform
to generally accepted accounting principles. Total returns for periods less than one full year are not annualized.
(b) Calculated based upon average shares
outstanding during the period.
(c) Does not include expenses of the
underlying portfolios in which the Fund invests.
(d)
Annualized.
(e) Not annualized.
(f) For the three month period ended October
31, 2014. The Fund changed its fiscal year end from July 31 to October 31, effective October 31, 2014.
| Visit our website at www.prudentialfunds.com | 41 |
| Class Z Shares | ||||||
| Three Months Ended October 31, 2014(b)(f) |
Year Ended July 31, | |||||
| 2014(b) | 2013(b) | 2012(b) | 2011(b) | 2010(b) | ||
| Per Share Operating Performance: | ||||||
| Net Asset Value, Beginning Of Period | $13.68 | $12.89 | $11.24 | $11.14 | $9.90 | $8.98 |
| Income (loss) from investment operations: | ||||||
| Net investment income | .03 | .15 | .16 | .16 | .15 | .16 |
| Net realized and unrealized gain on investment transactions | .59 | 1.46 | 1.74 | .08 | 1.21 | .90 |
| Total from investment operations | .62 | 1.61 | 1.90 | .24 | 1.36 | 1.06 |
| Less Dividends and Distributions: | ||||||
| Dividends from net investment income | – | (.16) | (.25) | (.14) | (.12) | (.14) |
| Distributions from net realized gains | – | (.66) | – | – | – | – |
| Total dividends and distributions | – | (.82) | (.25) | (.14) | (.12) | (.14) |
| Net asset value, end of period | $14.30 | $13.68 | $12.89 | $11.24 | $11.14 | $9.90 |
| Total Return(a) | 4.53% | 12.90% | 17.13% | 2.22% | 13.75% | 11.90% |
| Ratios/Supplemental Data: | ||||||
| Net assets, end of period (000) | $3,694 | $3,473 | $3,346 | $3,464 | $3,539 | $3,848 |
| Average net assets (000) | $4,210 | $3,596 | $3,533 | $3,240 | $3,846 | $4,425 |
| Ratios to average net assets(c): | ||||||
| Expense after advisory fee waiver and expense reimbursement | 1.15%(d) | 1.00% | 1.13% | 1.16% | 1.12% | 1.16% |
| Expense before advisory fee waiver and expense reimbursement | 1.15%(d) | 1.00% | 1.13% | 1.16% | 1.12% | 1.16% |
| Net investment income | .99%(d) | 1.16% | 1.30% | 1.44% | 1.42% | 1.64% |
| Portfolio turnover rate | 20%(e) | 87% | 239% | 174% | 151% | 140% |
(a) Total return is
calculated assuming a purchase of a share on the first day and a sale on the last day of each period reported and includes reinvestment of dividends and distributions. Total returns may reflect adjustments to conform
to generally accepted accounting principles. Total returns for periods less than one full year are not annualized.
(b) Calculated based upon average shares
outstanding during the period.
(c) Does not include expenses of the
underlying portfolios in which the Fund invests.
(d)
Annualized.
(e) Not annualized.
(f) For the three month period ended October
31, 2014. The Fund changed its fiscal year end from July 31 to October 31, effective October 31, 2014.
| 42 | Prudential Defensive Equity Fund |
GLOSSARY
FUND INDEXES
Standard & Poor's 500
Index. The Standard & Poor's 500 Index (S&P 500 Index) is an unmanaged index of 500 stocks of large US public companies. It gives a broad look at how stock prices in the United States
have performed. These returns do not include the effect of any sales charges, operating expenses of a mutual fund or taxes. These returns would be lower if they included the effect of these expenses.
Russell 1000 Defensive Index. The Russell 1000 Defensive Index measures the performance of the large-cap defensive segment of the U.S. equity universe. It includes those Russell 1000 Index companies with relatively
stable business conditions which are less sensitive to economic cycles, credit cycles, and market volatility based on their stability variables. Stability is measured in terms of volatility (price and earnings),
leverage, and return on assets.
Lipper Large-Cap Core Funds
Average. The Lipper Large-Cap Core Funds Average is based on the average return of all mutual funds in the Lipper Large-Cap Core Funds Universe. Returns do not include the effect of any
sales charges or taxes. The returns would be lower if they included the effect of sales charges or taxes.
| Visit our website at www.prudentialfunds.com | 43 |
| FOR MORE INFORMATION Please read this Prospectus before you invest in the Fund and keep it for future reference. For information or shareholder questions contact: | |
| ■ MAIL Prudential Mutual Fund Services LLC PO Box 9658 Providence, RI 02940■ TELEPHONE (800) 225-1852 (973) 367-3529 (from outside the U.S.)■ WEBSITE www.prudentialfunds.com |
■ OUTSIDE BROKERS SHOULD CONTACT Prudential Investment Management Services LLC PO Box 9658 Providence, RI 02940■ TELEPHONE (800) 778-8769 |
| ■ E-DELIVERY To receive your mutual fund documents on-line, go to www.prudentialfunds.com/edelivery and enroll. Instead of receiving printed documents by mail, you will receive notification via email when new materials are available. You can cancel your enrollment or change your email address at any time by visiting the website address above. |
| You can also obtain copies of Fund documents from the Securities and Exchange Commission as follows: | |
| ■ MAIL Securities and Exchange Commission Public Reference Section 100 F Street, N.E. Washington, DC 20549-1520■ ELECTRONIC REQUEST publicinfo@sec.gov (The SEC charges a fee to copy documents) |
■ IN PERSON Public Reference Room located at 100 F Street, N.E. in Washington, DC For hours of operation, call (202) 551-8090■ VIA THE INTERNET on the EDGAR Database at www.sec.gov |
| The Annual and Semi-Annual Reports and the SAI contain additional information about the Fund. Shareholders may obtain free copies of the SAI, Annual Report and Semi-Annual Report as well as other information about the Fund and may make other shareholder inquiries through the telephone number, address and website listed above. | |
| ■ STATEMENT OF ADDITIONAL INFORMATION (SAI) (incorporated by reference into this Prospectus) ■ SEMI-ANNUAL REPORT |
■ ANNUAL REPORT (contains a discussion of the market conditions and investment strategies that significantly affected the Fund's performance during the last fiscal year) |
| Prudential Defensive Equity Fund | |||||
| Share Class | A | B | C | R | Z |
| NASDAQ | PAMGX | DMGBX | PIMGX | SPMRX | PDMZX |
| CUSIP | 74442X868 | 74442X785 | 74442X793 | 74442X819 | 74442X827 |
| MFSP504STAT1 | The Fund's Investment Company Act File No. 811-08915 |

PRUDENTIAL
INVESTMENTS » MUTUAL FUNDS
Prudential
Investment Portfolios 16
STATEMENT OF
ADDITIONAL INFORMATION • December 26, 2014

MFSP504B1
Table of Contents
PART I
INTRODUCTION
This SAI sets forth information
about Prudential Defensive Equity Fund (the Fund), which is one of the funds that comprise Prudential Investment Portfolios 16 (PIP 16). It provides information about certain of the securities, instruments, policies
and strategies that are used by the Fund in seeking to achieve its objectives. This SAI also provides additional information about the Fund’s Board of Trustees, the advisory services provided to and the
management fees paid by the Fund, and information about other fees paid by and services provided to the Fund.
In addition to the
Fund, Prudential Income Builder Fund (previously known as Target Conservative Allocation Fund) is also a series of PIP 16. Prudential Income Builder Fund is offered pursuant to a separate prospectus and a
separate SAI.
Note: Prior to May 8, 2013,
Defensive Equity Fund was known as Target Moderate Allocation Fund.
This SAI should be read in
conjunction with the Prospectus for the Fund.
Before reading the SAI, you should
consult the Glossary below, which defines certain of the terms used in the SAI:
GLOSSARY
| Term | Definition |
| ADR | American Depositary Receipt |
| ADS | American Depositary Share |
| Board | Fund’s Board of Directors or Trustees |
| Board Member | A trustee or director of the Fund’s Board |
| CFTC | US Commodity Futures Trading Commission |
| Code | Internal Revenue Code of 1986, as amended |
| CDO | Collateralized Debt Obligation |
| CMO | Collateralized Mortgage Obligation |
| ETF | Exchange-Traded Fund |
| EDR | European Depositary Receipt |
| Fannie Mae | Federal National Mortgage Association |
| FDIC | Federal Deposit Insurance Corporation |
| Fitch | Fitch, Inc. |
| Freddie Mac | Federal Home Loan Mortgage Corporation |
| GDR | Global Depositary Receipt |
| Ginnie Mae | Government National Mortgage Association |
| IPO | Initial Public Offering |
| IRS | Internal Revenue Service |
| 1933 Act | Securities Act of 1933, as amended |
| 1934 Act | Securities Exchange Act of 1934, as amended |
| 1940 Act | Investment Company Act of 1940, as amended |
| 1940 Act Laws, Interpretations and Exemptions | Exemptive order, SEC release, no-action letter or similar relief or interpretations, collectively |
| LIBOR | London Interbank Offered Rate |
| Manager or PI | Prudential Investments LLC |
| Moody’s | Moody’s Investor Services, Inc. |
| NASDAQ | National Association of Securities Dealers Automated Quotations System |
| NAV | Net Asset Value |
| NYSE | New York Stock Exchange |
| OTC | Over the Counter |
| Prudential | Prudential Financial, Inc. |
3
| Term | Definition |
| PMFS | Prudential Mutual Fund Services LLC |
| REIT | Real Estate Investment Trust |
| RIC | Regulated Investment Company, as the term is used in the Internal Revenue Code of 1986, as amended |
| S&P | Standard & Poor’s Corporation |
| SEC | US Securities & Exchange Commission |
| World Bank | International Bank for Reconstruction and Development |
FUND CLASSIFICATION, INVESTMENT
Objectives & POLICIES
Prudential Investment Portfolios 16
is an open-end management investment company. The Fund is diversified.
The principal investment policies
and strategies of the Fund are described in its Prospectus. In addition, the Fund may from time to time use the securities, instruments, policies and strategies that are further identified and explained in the
following section. The Fund may not be successful in achieving its objective and you could lose money.
With respect to futures contracts
that are not legally required to “cash settle,” the Fund will cover the open position by setting aside or earmarking liquid assets in an amount equal to the market value of the futures contract. With
respect to futures that are required to “cash settle,” however, the Fund is permitted to set aside or earmark liquid assets in an amount equal to the Fund’s daily marked to market (net) obligation
(the Fund’s daily net liability, if any), rather than the total market value of the futures contract. By setting aside assets equal to only its net obligation under cash-settled futures, the Fund will have the
ability to employ leverage to a greater extent than if the Fund were required to segregate assets equal to the full market value of the futures contract.
Set forth below are specific
limitations or restrictions which are applicable to the Fund’s investments as further described in the following section:
| ■ | The Fund may invest up to 5% of total assets in event-linked bonds. |
| ■ | The Fund may invest up to 5% of total assets in CDOs. |
| ■ | The Fund may invest up to 5% of total assets in corporate loans. |
| ■ | The Fund may invest up to 5% of total assets in any one ETF, and up to 10% in ETFs or other mutual funds collectively. |
| ■ | The amount of Fund assets which may be utilized for short sales purposes is subject to the following restrictions: no more than 25% of the Fund’s total assets will be, when added together, (1) deposited as collateral for the obligation to replace securities borrowed to effect short sales, and (2) segregated in connection with short sales. |
| ■ | The Fund may invest up to 10% of its net assets in municipal securities. |
INVESTMENT RISKS AND
CONSIDERATIONS
Set forth below are descriptions of
some of the types of investments and investment strategies that the Fund may use and the risks and considerations associated with those investments and investment strategies. The Fund also may invest from time to time
in certain types of investments and investment strategies that are not discussed below. Please also see the Prospectus and the “Fund Classification, Investment Objective & Policies” section of this
SAI.
ASSET-BACKED SECURITIES. Asset-backed securities directly or indirectly represent a participation interest in, or are secured by and payable from, a stream of payments generated by particular assets such as motor
vehicle or credit card receivables. Payments of principal and interest may be guaranteed up to certain amounts and for a certain time period by a letter of credit issued by a financial institution unaffiliated with
the entities issuing the securities. Asset-backed securities may be classified as pass-through certificates or collateralized obligations.
Pass-through certificates are
asset-backed securities which represent an undivided fractional ownership interest in an underlying pool of assets. Pass-through certificates usually provide for payments of principal and interest received to be
passed through to their holders, usually after deduction for certain costs and expenses incurred in administering the pool. Because pass-through certificates represent an ownership interest in the underlying assets,
the holders thereof bear directly the risk of any defaults by the obligors on the underlying assets not covered by any credit support.
Asset-backed securities issued in
the form of debt instruments include collateralized bond obligations (“CBOs”), collateralized loan obligations (“CLOs”), other CDOs and other similarly structured securities. A CBO is a trust
which is often backed by a diversified pool of high risk, below investment grade fixed income securities. The collateral can be from many different types of fixed income securities such as high yield debt, residential
privately issued mortgage-related securities, commercial privately issued mortgage-related securities, trust preferred securities and emerging market debt. A CLO is a trust typically collateralized by a pool of
Prudential Investment Portfolios
16 4
loans, which may include, among others, domestic
and foreign senior secured loans, senior unsecured loans, and subordinate corporate loans, including loans that may be rated below investment grade or equivalent unrated loans. Other CDOs are trusts backed by other
types of assets representing obligations of various parties. CBOs, CLOs and other CDOs may charge management fees and administrative expenses.
For CBOs, CLOs and other CDOs, the
cash flows from the trust are split into two or more portions, called tranches, varying in risk and yield. The riskiest portion is the “equity” tranche which bears the bulk of defaults from the bonds or
loans in the trust and serves to protect the other, more senior tranches from default in all but the most severe circumstances. Since they are partially protected from defaults, senior tranches from a CBO trust, CLO
trust or trust of another CDO typically have higher ratings and lower yields than their underlying securities, and can be rated investment grade. Despite the protection from the equity tranche, CBO, CLO or other CDO
tranches can experience substantial losses due to actual defaults, increased sensitivity to defaults due to collateral default and disappearance of protecting tranches, market anticipation of defaults, as well as
aversion to CBO, CLO or other CDO securities as a class.
The risks of an investment in a
CBO, CLO or other CDO depend largely on the type of the collateral securities and the class of the instrument in which the Fund invests. Normally, CBOs, CLOs and other CDOs are privately offered and sold, and thus,
are not registered under the securities laws. As a result, investments in CBOs, CLOs and other CDOs may be characterized by the Fund as illiquid securities; however, an active dealer market may exist for CBOs, CLOs
and other CDOs, allowing them to qualify for Rule 144A transactions. In addition to the normal risks associated with fixed income securities discussed elsewhere in this SAI and the Fund’s Prospectus (e.g.,
interest rate risk and default risk), CBOs, CLOs and other CDOs carry additional risks including, but not limited to: (i) the possibility that distributions from collateral securities will not be adequate to make
interest or other payments; (ii) the possibility that the quality of the collateral may decline in value or default; (iii) the risk that the Fund may invest in CBOs, CLOs or other CDOs that are subordinate to other
classes; and (iv) the risk that the complex structure of the security may not be fully understood at the time of investment and may produce disputes with the issuer or unexpected investment results.
ASSET-BASED SECURITIES. The Fund may invest in debt, preferred or convertible securities, the principal amount, redemption terms or conversion terms of which are related to the market price of some natural
resource asset such as gold bullion. These securities are referred to as “asset-based securities.” The Fund will purchase asset-based securities only if they are rated, or are issued by issuers that have
outstanding debt obligations rated investment grade (i.e., AAA, AA, A or BBB by S&P or Fitch or Aaa, Aa, A or Baa by Moody’s or commercial paper rated A-1 by S&P or Prime-1 by Moody’s) or of
issuers that the subadviser has determined to be of similar creditworthiness. Obligations ranked in the fourth highest rating category, while considered “investment grade,” may have certain speculative
characteristics. If the asset-based security is backed by a bank letter of credit or other similar facility, the subadviser may take such backing into account in determining the creditworthiness of the issuer. While
the market prices for an asset-based security and the related natural resource asset generally are expected to move in the same direction, there may not be perfect correlation in the two price movements. Asset-based
securities may not be secured by a security interest in or claim on the underlying natural resource assets and do not represent an interest in the referenced assets. Certain asset-based securities may be
illiquid.
The asset-based securities in which
the Fund may invest may bear interest or pay preferred dividends at below market (or even relatively nominal) rates. As an example, assume gold is selling at a market price of $300 per ounce and an issuer sells a
$1,000 face amount gold-related note with a seven-year maturity, payable at maturity at the greater of either $1,000 in cash or the then market price of three ounces of gold. If at maturity, the market price of gold
is $400 per ounce, the amount payable on the note would be $1,200. Certain asset-based securities may be payable at maturity in cash at the stated principal amount or, at the option of the holder, directly in a stated
amount of the asset to which it is related. In such instance, because the Fund does not presently intend to invest directly in natural resource assets, the Fund may sell the asset-based security in the secondary
market, to the extent one exists, prior to maturity if the value of the stated amount of the asset exceeds the stated principal amount and thereby realize the appreciation in the underlying asset.
PRECIOUS METAL-RELATED SECURITIES.
The Fund may invest in the equity securities of companies that explore for, extract, process or deal in precious metals, e.g., gold, silver and platinum, and in asset-based securities
indexed to the value of such metals. Such securities may be purchased when they are believed to be attractively priced in relation to the value of a company's precious metal-related assets or when the values of
precious metals are expected to benefit from inflationary pressure or other economic, political or financial uncertainty or instability. Based on historical experience, during periods of economic or financial
instability the securities of companies involved in precious metals may be subject to extreme price fluctuations, reflecting the high volatility of precious metal prices during such periods. In addition, the
instability of precious metal prices may result in volatile earnings of precious metal-related companies, which may, in turn, adversely affect the financial condition of such companies.
5
The major producers of gold include
the Republic of South Africa, Russia, Canada, the United States, Brazil and Australia. Sales of gold by Russia are largely unpredictable and often relate to political and economic considerations rather than to market
forces. Economic, financial, social and political factors within South Africa may significantly affect South African gold production.
BORROWING AND LEVERAGE. Unless noted otherwise, the Fund may borrow up to 33 1⁄3% of the value of its total assets (calculated at the time of the borrowing). The Fund may pledge up to 33 1⁄3% of its total assets to secure these borrowings. If the Fund’s asset coverage for borrowings falls below 300%, the Fund will take prompt action to reduce borrowings. If the Fund
borrows to invest in securities, any investment gains made on the securities in excess of interest paid on the borrowing will cause the NAV of the shares to rise faster than would otherwise be the case. On the other
hand, if the investment performance of the additional securities purchased fails to cover their cost (including any interest paid on the money borrowed) to the Fund, the NAV of the Fund’s shares will decrease
faster than would otherwise be the case. This is the speculative factor known as “leverage.” In addition, the Fund may use certain investment management techniques (collectively, “effective
leverage”), such as certain derivatives, that may provide leverage.
The Fund may borrow from time to
time, at the discretion of the subadviser, to take advantage of investment opportunities, when yields on available investments exceed interest rates and other expenses of related borrowing, or when, in the
subadviser's opinion, unusual market conditions otherwise make it advantageous for the Fund to increase its investment capacity. The Fund will only borrow when there is an expectation that it will benefit the Fund
after taking into account considerations such as interest income and possible losses upon liquidation. Borrowing by the Fund creates an opportunity for increased net income but, at the same time, creates risks,
including the fact that leverage may exaggerate changes in the NAV of Fund shares and in the yield on the Fund. Unless otherwise stated, the Fund may borrow through forward rolls, dollar rolls or reverse repurchase
agreements.
CONVERTIBLE SECURITIES. The Fund may invest in convertible securities. Convertible securities entitle the holder to receive interest payments paid on corporate debt securities or the dividend preference on a
preferred stock until such time as the convertible security matures or is redeemed or until the holder elects to exercise the conversion privilege.
The characteristics of convertible
securities make them appropriate investments for an investment company seeking long-term capital appreciation and/or total return. These characteristics include the potential for capital appreciation as the value of
the underlying common stock increases, the relatively high yield received from dividend or interest payments as compared to common stock dividends and decreased risks of decline in value relative to the underlying
common stock due to their fixed-income nature. As a result of the conversion feature, however, the interest rate or dividend preference on a convertible security is generally less than would be the case if the
securities were issued in nonconvertible form.
In analyzing convertible
securities, the subadviser will consider both the yield on the convertible security relative to its credit quality and the potential capital appreciation that is offered by the underlying common stock, among other
things.
Convertible securities are issued
and traded in a number of securities markets. Even in cases where a substantial portion of the convertible securities held by the Fund are denominated in US dollars, the underlying equity securities may be quoted in
the currency of the country where the issuer is domiciled. With respect to convertible securities denominated in a currency different from that of the underlying equity securities, the conversion price may be based on
a fixed exchange rate established at the time the security is issued. As a result, fluctuations in the exchange rate between the currency in which the debt security is denominated and the currency in which the share
price is quoted will affect the value of the convertible security. As described below, the Fund is authorized to enter into foreign currency hedging transactions in which the Fund may seek to reduce the effect of such
fluctuations.
Apart from currency considerations,
the value of convertible securities is influenced by both the yield of nonconvertible securities of comparable issuers and by the value of the underlying common stock. The value of a convertible security viewed
without regard to its conversion feature (i.e., strictly on the basis of its yield) is sometimes referred to as its “investment value.” To the extent interest rates change, the investment value of the
convertible security typically will fluctuate. However, at the same time, the value of the convertible security will be influenced by its “conversion value,” which is the market value of the underlying
common stock that would be obtained if the convertible security were converted. Conversion value fluctuates directly with the price of the underlying common stock. If, because of a low price of the common stock, the
conversion value is substantially below the investment value of the convertible security, the price of the convertible security is governed principally by its investment value.
To the extent the conversion value
of a convertible security increases to a point that approximates or exceeds its investment value, the price of the convertible security will be influenced principally by its conversion value. A convertible security
will sell at a premium over the conversion value to the extent investors place value on the right to acquire the underlying common stock while holding a fixed-income security. The yield and conversion premium of
convertible securities issued in Japan and the Euromarket are frequently determined at levels that cause the conversion value to affect their market value more than the securities' investment value.
Prudential Investment Portfolios
16 6
Holders of convertible securities
generally have a claim on the assets of the issuer prior to the common stockholders but may be subordinated to other debt securities of the same issuer. A convertible security may be subject to redemption at the
option of the issuer at a price established in the charter provision, indenture or other governing instrument pursuant to which the convertible security was issued. If a convertible security held by the Fund is called
for redemption, the Fund will be required to redeem the security, convert it into the underlying common stock or sell it to a third party. Certain convertible debt securities may provide a put option to the holder,
which entitles the holder to cause the security to be redeemed by the issuer at a premium over the stated principal amount of the debt security under certain circumstances.
Synthetic convertible securities
may be either (i) a debt security or preferred stock that may be convertible only under certain contingent circumstances or that may pay the holder a cash amount based on the value of shares of underlying common stock
partly or wholly in lieu of a conversion right (a “Cash-Settled Convertible”), (ii) a combination of separate securities chosen by the subadviser in order to create the economic characteristics of a
convertible security, i.e., a fixed income security paired with a security with equity conversion features, such as an option or warrant (a “Manufactured Convertible”) or (iii) a synthetic security
manufactured by another party.
Synthetic convertible securities
may include either Cash-Settled Convertibles or Manufactured Convertibles. Cash-Settled Convertibles are instruments that are created by the issuer and have the economic characteristics of traditional convertible
securities but may not actually permit conversion into the underlying equity securities in all circumstances. As an example, a private company may issue a Cash-Settled Convertible that is convertible into common stock
only if the company successfully completes a public offering of its common stock prior to maturity and otherwise pays a cash amount to reflect any equity appreciation. Manufactured Convertibles are created by the
subadviser by combining separate securities that possess one of the two principal characteristics of a convertible security, i.e., fixed income (“fixed income component”) or a right to acquire equity
securities (“convertibility component”). The fixed income component is achieved by investing in nonconvertible fixed income securities, such as nonconvertible bonds, preferred stocks and money market
instruments. The convertibility component is achieved by investing in call options, warrants, or other securities with equity conversion features (“equity features”) granting the holder the right to
purchase a specified quantity of the underlying stocks within a specified period of time at a specified price or, in the case of a stock index option, the right to receive a cash payment based on the value of the
underlying stock index.
A Manufactured Convertible differs
from traditional convertible securities in several respects. Unlike a traditional convertible security, which is a single security having a unitary market value, a Manufactured Convertible is comprised of two or more
separate securities, each with its own market value. Therefore, the total “market value” of such a Manufactured Convertible is the sum of the values of its fixed-income component and its convertibility
component.
More flexibility is possible in the
creation of a Manufactured Convertible than in the purchase of a traditional convertible security. Because many corporations have not issued convertible securities, the subadviser may combine a fixed income instrument
and an equity feature with respect to the stock of the issuer of the fixed income instrument to create a synthetic convertible security otherwise unavailable in the market. The subadviser may also combine a fixed
income instrument of an issuer with an equity feature with respect to the stock of a different issuer when the subadviser believes such a Manufactured Convertible would better promote the Fund’s objective(s)
than alternate investments. For example, the subadviser may combine an equity feature with respect to an issuer's stock with a fixed income security of a different issuer in the same industry to diversify the
Fund’s credit exposure, or with a US Treasury instrument to create a Manufactured Convertible with a higher credit profile than a traditional convertible security issued by that issuer. A Manufactured
Convertible also is a more flexible investment in that its two components may be purchased separately and, upon purchasing the separate securities, “combined” to create a Manufactured Convertible. For
example, the Fund may purchase a warrant for eventual inclusion in a Manufactured Convertible while postponing the purchase of a suitable bond to pair with the warrant pending development of more favorable market
conditions.
The value of a Manufactured
Convertible may respond differently to certain market fluctuations than would a traditional convertible security with similar characteristics. For example, in the event the Fund created a Manufactured Convertible by
combining a short-term US Treasury instrument and a call option on a stock, the Manufactured Convertible would likely outperform a traditional convertible of similar maturity that is convertible into that stock during
periods when Treasury instruments outperform corporate fixed income securities and underperform during periods when corporate fixed-income securities outperform Treasury instruments.
CERTIFICATES OF DEPOSIT. The FDIC, an independent agency of the US Government, provides deposit insurance on all types of deposits, including certificates of deposit, received at an FDIC-insured bank or savings
association (“insured depository institutions”) up to applicable limits. The standard deposit insurance amount is $250,000 per depositor (including principal and accrued interest) for each insurable
capacity of such depositor, per insured depository institution, which is backed by the full faith and credit of the US
7
Government. All of a depositor’s deposits in
the same insurable capacity at the same insured depository institution are aggregated for purposes of the $250,000 insurance limit, including deposits held directly in the depositor’s name and for the
depositor’s benefit by intermediaries. Any amounts in excess of the $250,000 deposit insurance limit may be uninsured.
CORPORATE LOANS. Commercial banks and other financial institutions make loans to companies that need capital to grow or restructure (“corporate loans”). Borrowers generally pay interest on
corporate loans at rates that change in response to changes in market interest rates such as the LIBOR or the prime rate of US banks. As a result, the value of corporate loan investments is generally responsive to
shifts in market interest rates. Because the trading market for corporate loans is less developed than the secondary market for bonds and notes, the Fund may experience difficulties from time to time in selling its
corporate loans. Borrowers frequently provide collateral to secure repayment of these obligations. Leading financial institutions often act as agent for a broader group of lenders, generally referred to as a
“syndicate.” The syndicate's agent arranges the corporate loans, holds collateral and accepts payments of principal and interest. If the agent develops financial problems, the Fund may not recover its
investment, or there might be a delay in the Fund’s recovery. By investing in a corporate loan, the Fund becomes a member of the syndicate.
As in the case of junk bonds, the
corporate loans in which the Fund may invest can be expected to provide higher yields than higher-rated fixed income securities but may be subject to greater risk of loss of principal and interest. There are, however,
some significant differences between corporate loans and junk bonds. Corporate loans are frequently secured by pledges of liens and security interests in the assets of the borrower, and the holders of corporate loans
are frequently the beneficiaries of debt service subordination provisions imposed on the borrower's bondholders. These arrangements are designed to give corporate loan investors preferential treatment over junk bond
investors in the event of a deterioration in the credit quality of the issuer. Even when these arrangements exist, however, there can be no assurance that the principal and interest owed on the corporate loans will be
repaid in full. Corporate loans generally bear interest at rates set at a margin above a generally recognized base lending rate that may fluctuate on a day-to-day basis, in the case of the prime rate of a US bank, or
that may be adjusted on set dates, typically 30 days but generally not more than one year, in the case of LIBOR. Consequently, the value of corporate loans held by the Fund may be expected to fluctuate significantly
less than the value of fixed rate junk bond instruments as a result of changes in the interest rate environment. On the other hand, the secondary dealer market for corporate loans is not as well developed as the
secondary dealer market for junk bonds, and therefore presents increased market risk relating to liquidity and pricing concerns.
The Fund may acquire interests in
corporate loans by means of a novation, assignment or participation. In a novation, the Fund would succeed to all the rights and obligations of the assigning institution and become a contracting party under the credit
agreement with respect to the debt obligation. As an alternative, the Fund may purchase an assignment, in which case the Fund may be required to rely on the assigning institution to demand payment and enforce its
rights against the borrower but would otherwise typically be entitled to all of such assigning institution's rights under the credit agreement. Participation interests in a portion of a debt obligation typically
result in a contractual relationship only with the institution selling the participation interest and not with the borrower. In purchasing a loan participation, the Fund generally will have no right to enforce
compliance by the borrower with the terms of the loan agreement, nor any rights of set-off against the borrower, and the Fund may not directly benefit from the collateral supporting the debt obligation in which it has
purchased the participation. As a result, the Fund will assume the credit risk of both the borrower and the institution selling the participation to the Fund.
CUSTODIAL RECEIPTS. Obligations issued or guaranteed as to principal and interest by the US Government, foreign governments or semi-governmental entities may be acquired by the Fund in the form of custodial
receipts that evidence ownership of future interest payments, principal payments or both on certain notes or bonds. Typically, custodial receipts have their unmatured interest coupons separated
(“stripped”) by their holder. Having separated the interest coupons from the underlying principal of the government securities, the holder will resell the stripped securities in custodial receipt programs
with a number of different names, including “Treasury Income Growth Receipts” (“TIGRs”) and “Certificate of Accrual on Treasury Securities” (“CATS”). The stripped
coupons are sold separately from the underlying principal, which is usually sold at a deep discount because the buyer receives only the right to receive a future fixed payment on the security and does not receive any
rights to periodic interest (cash) payments. CATS and TIGRs are not considered US Government securities by the staff of the SEC. Such notes and bonds are held in custody by a bank or a brokerage firm on behalf of the
owners.
DEBT SECURITIES. Debt securities, such as bonds, involve credit risk. This is the risk that the issuer will not make timely payments of principal and interest. The degree of credit risk depends on the
issuer's financial condition and on the terms of the bonds. Changes in an issuer's credit rating or the market's perception of an issuer's creditworthiness may also affect the value of the Fund’s investment in
that issuer. Credit risk is reduced to the extent the Fund invests its assets in US Government securities. All debt securities, however, are subject to interest rate risk. This is the risk that the value of the
security may fall when interest rates rise. In general, the market price of debt securities with longer maturities will go up or down more in response to changes in interest rates than the market price of shorter-term
securities.
Prudential Investment Portfolios
16 8
DEPOSITARY RECEIPTS. The Fund may invest in the securities of foreign issuers in the form of Depositary Receipts or other securities convertible into securities of foreign issuers. Depositary Receipts may not
necessarily be denominated in the same currency as the underlying securities into which they may be converted. ADRs and ADSs are receipts or shares typically issued by an American bank or trust company that evidence
ownership of underlying securities issued by a foreign corporation. EDRs are receipts issued in Europe that evidence a similar ownership arrangement. GDRs are receipts issued throughout the world that evidence a
similar arrangement. Generally, ADRs and ADSs, in registered form, are designed for use in the US securities markets, and EDRs, in bearer form, are designed for use in European securities markets. GDRs are tradable
both in the United States and in Europe and are designed for use throughout the world.
The Fund may invest in unsponsored
Depositary Receipts. The issuers of unsponsored Depositary Receipts are not obligated to disclose material information in the United States, and, therefore, there may be less information available regarding such
issuers and there may not be a correlation between such information and the market value of the Depositary Receipts. Depositary Receipts are generally subject to the same risks as the foreign securities that they
evidence or into which they may be converted or exchanged.
DERIVATIVES. The Fund may use instruments referred to as derivatives. Derivatives are financial instruments the value of which is derived from another security, a commodity (such as gold or oil), a
currency or an index (a measure of value or rates, such as the S&P 500 Index or the prime lending rate). Derivatives allow the Fund to increase or decrease the level of risk to which the Fund is exposed more
quickly and efficiently than transactions in other types of instruments. The Fund may use derivatives for hedging purposes. The Fund may also use derivatives to seek to enhance returns. The use of a derivative is
speculative if the Fund is primarily seeking to achieve gains, rather than offset the risk of other positions. When the Fund invests in a derivative for speculative purposes, the Fund will be fully exposed to the
risks of loss of that derivative, which may sometimes be greater than the derivative's cost. The Fund may not use any derivative to gain exposure to an asset or class of assets that the Fund would be prohibited by its
investment restrictions from purchasing directly.
A discussion of the risk factors
relating to derivatives is set out in the sub-section entitled “Risk Factors Involving Derivatives.”
EXCHANGE-TRADED FUNDS. The Fund may invest in ETFs. ETFs, which may be unit investment trusts or mutual funds, typically hold portfolios of securities designed to track the performance of various broad
securities indexes or sectors of such indexes. ETFs provide another means, in addition to futures and options on indexes, of including stock index exposure in the Fund’s investment strategies. The Fund will
indirectly bear its proportionate share of any management fees and other expenses paid by such ETF.
HEDGING. Hedging is a strategy in which a derivative or security is used to offset the risks associated with other Fund holdings. Losses on the other investment may be substantially reduced by
gains on a derivative that reacts in an opposite manner to market movements. While hedging can reduce losses, it can also reduce or eliminate gains or cause losses if the market moves in a different manner than
anticipated by the Fund or if the cost of the derivative outweighs the benefit of the hedge. Hedging also involves the risk that changes in the value of the derivative will not match those of the holdings being hedged
as expected by the Fund, in which case any losses on the holdings being hedged may not be reduced or may be increased. The inability to close options and futures positions also could have an adverse impact on the
Fund’s ability to hedge effectively its portfolio. There is also a risk of loss by the Fund of margin deposits or collateral in the event of bankruptcy of a broker with whom the Fund has an open position in an
option, a futures contract or a related option.
There can be no assurance that the
Fund’s hedging strategies will be effective or that hedging transactions will be available to the Fund. The Fund is not required to engage in hedging transactions and the Fund may choose not to do so from time
to time.
INDEXED AND INVERSE SECURITIES. The Fund may invest in securities the potential return of which is based on an index or interest rate. As an illustration, the Fund may invest in a security whose value is based on changes
in a specific index or that pays interest based on the current value of an interest rate index, such as the prime rate. The Fund may also invest in a debt security that returns principal at maturity based on the level
of a securities index or a basket of securities, or based on the relative changes of two indices. In addition, the Fund may invest in securities the potential return of which is based inversely on the change in an
index or interest rate (that is, a security the value of which will move in the opposite direction of changes to an index or interest rate). For example, the Fund may invest in securities that pay a higher rate of
interest when a particular index decreases and pay a lower rate of interest (or do not fully return principal) when the value of the index increases. Investing in such securities may subject the Fund to reduced or
eliminated interest payments or loss of principal in the event of an adverse movement in the relevant interest rate, index or indices. Indexed and inverse securities may involve credit risk, and certain indexed and
inverse securities may involve leverage risk, liquidity risk and currency risk. The Fund may invest in indexed and inverse securities for hedging purposes or to seek to increase returns. When used for hedging
purposes, indexed and inverse securities involve correlation risk. (Furthermore, where such a security includes a contingent liability, in the event of such an adverse movement, the Fund may be required to pay
substantial additional margin to maintain the position.)
9
SWAP AGREEMENTS. The Fund may enter into swap transactions, including, but not limited to, equity, interest rate, index, credit default, total return and, to the extent that it invests in foreign
currency-denominated securities, currency exchange rate swap agreements. In addition, the Fund may enter into options on swap agreements (swap options). These swap transactions are entered into in an attempt to obtain
a particular return when it is considered desirable to do so, possibly at a lower cost to the Fund than if the Fund had invested directly in an instrument that yielded that desired return. Swap transactions are a type
of derivative. Derivatives are further discussed in the sub-sections entitled “Derivatives” and “Risk Factors Involving Derivatives.”
Swap agreements are two party
contracts entered into primarily by institutional investors. In a standard “swap” transaction, two parties agree to exchange the returns (or differentials in rates of return) earned or realized on or
calculated with respect to particular predetermined investments or instruments, which may be adjusted for an interest factor. The gross returns to be exchanged or “swapped” between the parties are
generally calculated with respect to a “notional amount,” that is, the return on or increase in value of a particular dollar amount invested at a particular interest rate or in a “basket” of
securities representing a particular index or other investments or instruments. Most swap agreements entered into by the Fund would calculate the obligations of the parties to the agreement on a “net
basis.” Consequently the Fund’s current obligations (or rights) under a swap agreement will generally be equal only to the net amount to be paid or received under the agreement based on the relative values
of the positions held by each party to the agreement (the “net amount”). The Fund’s current obligations under a swap agreement will be accrued daily (offset against any amounts owed to the Fund) and
any accrued but unpaid net amounts owed to a swap counterparty will be covered by the segregation of liquid assets.
To the extent that the Fund enters
into swaps on other than a net basis, the amount maintained in a segregated account will be the full amount of the Fund’s obligations, if any, with respect to such swaps, accrued on a daily basis. Inasmuch as
segregated accounts are established for these hedging transactions, the subadviser and the Fund believe such obligations do not constitute senior securities and, accordingly, will not treat them as being subject to
the Fund’s borrowing restrictions. If there is a default by the other party to such a transaction, the Fund will have contractual remedies pursuant to the agreement related to the transaction. Since swaps are
individually negotiated, the Fund expects to achieve an acceptable degree of correlation between its rights to receive a return on its portfolio securities and its rights and obligations to receive and pay a return
pursuant to swaps. The Fund will enter into swaps only with counterparties meeting certain creditworthiness standards (generally, such counterparties would have to be eligible counterparties under the terms of the
Fund’s repurchase agreement guidelines approved by the Board).
Some swaps will be subject to
mandatory or optional clearing through derivatives clearing organizations. While this is expected to better protect collateral, margin and other applicable requirements may increase the financial and operational costs
for such transactions.
Recent legislation requires certain
swaps to be executed through a centralized exchange or regulated facility and be cleared through a regulated clearinghouse. Although this clearing mechanism is generally expected to reduce counterparty credit risk, it
may disrupt or limit the swap market and may not result in swaps being easier to trade or value. As swaps become more standardized, the Fund may not be able to enter into swaps that meet its investment needs. The Fund
also may not be able to find a clearinghouse willing to accept a swap for clearing. In a cleared swap, a central clearing organization will be the counterparty to the transaction. The Fund will assume the risk that
the clearinghouse may be unable to perform its obligations. The Fund will be required to maintain its positions with a clearing organization through one or more clearing brokers. The clearing organization will require
the Fund to post margin and the broker may require the Fund to post additional margin to secure the Fund’s obligations. The amount of margin required may change from time to time. In addition, cleared
transactions may be more expensive to maintain than OTC transactions and may require the Fund to deposit larger amounts of margin. The Fund may not be able to recover margin amounts if the broker has financial
difficulties. Also, the broker may require the Fund to terminate a derivatives position under certain circumstances. This may cause the Fund to lose money.
CREDIT DEFAULT SWAP AGREEMENTS AND
SIMILAR INSTRUMENTS. The Fund may enter into credit default swap agreements and similar agreements. The credit default swap agreement or similar instrument may have as reference obligations one or more
securities that are not currently held by the Fund. The protection “buyer” in a credit default contract may be obligated to pay the protection “seller” an up-front or a periodic stream of
payments over the term of the contract provided generally that no credit event on a reference obligation has occurred. If a credit event occurs, the seller generally must pay the buyer the “par value”
(full notional value) of the swap in exchange for an equal face amount of deliverable obligations of the reference entity described in the swap, or the seller may be required to deliver the related net cash amount, if
the swap is cash settled. The Fund may be either the buyer or seller in the transaction. If the Fund is a buyer and no credit event occurs, the Fund recovers nothing if the swap is held through its termination date.
However, if a credit event occurs, the buyer may elect to receive the full notional value of the swap in exchange for an equal face amount of deliverable obligations of the reference entity that may have little or no
value. As a seller, the Fund generally receives
Prudential Investment Portfolios
16 10
an up-front payment or a fixed rate of income
throughout the term of the swap provided that there is no credit event. If a credit event occurs, generally the seller must pay the buyer the full notional value of the swap in exchange for an equal face amount of
deliverable obligations of the reference entity that may have little or no value.
Credit default swaps and similar
instruments involve greater risks than if the Fund had invested in the reference obligation directly, since, in addition to general market risks, they are subject to illiquidity risk, counterparty risk and credit
risk. The Fund will enter into credit default swap agreements and similar instruments only with counterparties that are rated investment grade quality by at least one credit rating agency at the time of entering into
such transaction or whose creditworthiness is believed by the subadviser to be equivalent to such rating. If a credit event were to occur, the value of any deliverable obligation received by the seller, coupled with
the up-front or periodic payments previously received, may be less than the full notional value it pays to the buyer, resulting in a loss of value to the Fund. When acting as a seller of a credit default swap or a
similar instrument, the Fund is exposed to many of the same risks of leverage since, if a credit event occurs, the seller may be required to pay the buyer the full notional value of the contract net of any amounts
owed by the buyer related to its delivery of deliverable obligations.
CREDIT-LINKED SECURITIES. Among the income producing securities in which the Fund may invest are credit-linked securities, which are issued by a limited purpose trust or other vehicle that, in turn, invests in a
derivative instrument or basket of derivative instruments, such as credit default swaps, interest rate swaps and other securities, in order to provide exposure to certain fixed income markets. For instance, the Fund
may invest in credit-linked securities as a cash management tool in order to gain exposure to a certain market and/or to remain fully invested when more traditional income producing securities are not
available.
Like an investment in a bond,
investments in these credit-linked securities represent the right to receive periodic income payments (in the form of distributions) and payment of principal at the end of the term of the security. However, these
payments are conditioned on the issuer's receipt of payments from, and the issuer's potential obligations to, the counterparties to the derivative instruments and other securities in which the issuer invests. For
instance, the issuer may sell one or more credit default swaps, under which the issuer would receive a stream of payments over the term of the swap agreements provided that no event of default has occurred with
respect to the referenced debt obligation upon which the swap is based. If a default occurs, the stream of payments may stop and the issuer would be obligated to pay the counterparty the par (or other agreed upon
value) of the referenced debt obligation. This, in turn, would reduce the amount of income and principal that the Fund would receive. The Fund’s investments in these instruments are indirectly subject to the
risks associated with derivative instruments, including, among others, credit risk, default or similar event risk, counterparty risk, interest rate risk, leverage risk and management risk. It is also expected that the
securities will be exempt from registration under the 1933 Act. Accordingly, there may be no established trading market for the securities and they may constitute illiquid investments.
TOTAL RETURN SWAP AGREEMENTS. The Fund may enter into total return swap agreements. Total return swap agreements are contracts in which one party agrees to make periodic payments based on the change in market value of
the underlying assets, which may include a specified security, basket of securities or securities indices during the specified period, in return for periodic payments based on a fixed or variable interest rate or the
total return from other underlying assets. Total return swap agreements may be used to obtain exposure to a security or market without owning or taking physical custody of such security or market. Total return swap
agreements may effectively add leverage to the Fund’s portfolio because, in addition to its total net assets, the Fund would be subject to investment exposure on the notional amount of the swap. Total return
swap agreements entail the risk that a party will default on its payment obligations to the Fund thereunder. Swap agreements also bear the risk that the Fund will not be able to meet its obligation to the
counterparty. Generally, the Fund will enter into total return swaps on a net basis (i.e., the two payment streams are netted out with the Fund receiving or paying, as the case may be, only the net amount of the two
payments). The net amount of the excess, if any, of the Fund’s obligations over its entitlements with respect to each total return swap will be accrued on a daily basis, and an amount of cash or liquid
instruments having an aggregate NAV at least equal to the accrued excess will be segregated by the Fund. If the total return swap transaction is entered into on other than a net basis, the full amount of the
Fund’s obligations will be accrued on a daily basis, and the full amount of the Fund’s obligations will be segregated by the Fund in an amount equal to or greater than the market value of the liabilities
under the total return swap agreement or the amount it would have cost the Fund initially to make an equivalent direct investment, plus or minus any amount the Fund is obligated to pay or is to receive under the total
return swap agreement.
Segregation and other requirements
pertaining to total return swap agreements are subject to change in the event of future changes in applicable laws or regulations. It is possible that any such changes in laws or regulations could require
modifications to the operation of the Fund.
OPTIONS ON SECURITIES AND SECURITIES
INDEXES.
TYPES OF OPTIONS. The Fund may engage in transactions in options on individual securities, baskets of securities or securities indices, or particular measurements of value or rate (an “index”),
such as an index of the price of treasury securities or an index representative of short term interest rates. Such investments may be made on exchanges and in OTC markets. In general,
11
exchange-traded options have standardized exercise
prices and expiration dates and require the parties to post margin against their obligations, and the performance of the parties' obligations in connection with such options is guaranteed by the exchange or a related
clearing corporation. OTC options have more flexible terms negotiated between the buyer and the seller, but generally do not require the parties to post margin and are subject to greater credit risk. OTC options also
involve greater liquidity risk. See “Additional Risk Factors of OTC Transactions; Limitations on the Use of OTC Derivatives.”
CALL OPTIONS. The Fund may purchase call options on any of the types of securities or instruments in which it may invest. A call option gives the Fund the right to buy, and obligates the seller to sell,
the underlying security at the exercise price at any time during the option period. The Fund also may purchase and sell call options on indices. Index options are similar to options on securities except that, rather
than taking or making delivery of securities underlying the option at a specified price upon exercise, an index option gives the holder the right to receive cash upon exercise of the option if the level of the index
upon which the option is based is greater than the exercise price of the option.
The Fund may only write (i.e.,
sell) covered call options on the securities or instruments in which it may invest and enter into closing purchase transactions with respect to certain of such options. A covered call option is an option in which the
Fund owns the underlying security or has an absolute and immediate right to acquire that security, without additional consideration (or for additional consideration held in a segregated account by its custodian), upon
conversion or exchange of other securities currently held in its portfolio or with respect to which the Fund has established cover by segregating liquid instruments on its books. The principal reason for writing call
options is the attempt to realize, through the receipt of premiums, a greater return than would be realized on the securities alone. By writing covered call options, the Fund gives up the opportunity, while the option
is in effect, to profit from any price increase in the underlying security above the option exercise price. In addition, the Fund’s ability to sell the underlying security will be limited while the option is in
effect unless the Fund enters into a closing purchase transaction. A closing purchase transaction cancels out the Fund’s position as the writer of an option by means of an offsetting purchase of an identical
option prior to the expiration of the option it has written. Covered call options also serve as a partial hedge to the extent of the premium received against a decline in the price of the underlying security. Also,
with respect to call options written by the Fund that are covered only by segregated portfolio securities, the Fund is exposed to the risk of loss equal to the amount by which the price of the underlying securities
rises above the exercise price.
PUT OPTIONS. The Fund may purchase put options to seek to hedge against a decline in the value of its securities or to enhance its return. By buying a put option, the Fund acquires a right to sell such
underlying securities or instruments at the exercise price, thus limiting the Fund’s risk of loss through a decline in the market value of the securities or instruments until the put option expires. The amount
of any appreciation in the value of the underlying securities or instruments will be partially offset by the amount of the premium paid for the put option and any related transaction costs. Prior to its expiration, a
put option may be sold in a closing sale transaction and profit or loss from the sale will depend on whether the amount received is more or less than the premium paid for the put option plus the related transaction
costs. A closing sale transaction cancels out the Fund’s position as the purchaser of an option by means of an offsetting sale of an identical option prior to the expiration of the option it has purchased. The
Fund also may purchase uncovered put options.
The Fund may write (i.e., sell) put
options on the types of securities or instruments that may be held by the Fund, provided that such put options are covered, meaning that such options are secured by segregated, liquid instruments. The Fund will
receive a premium for writing a put option, which increases the Fund’s return.
FUTURES. The Fund may engage in transactions in futures and options thereon. Futures are standardized, exchange-traded contracts which obligate a purchaser to take delivery, and a seller to make
delivery, of a specific amount of an asset at a specified future date at a specified price. No price is paid upon entering into a futures contract. Rather, upon purchasing or selling a futures contract the Fund is
required to deposit collateral (“margin”) equal to a percentage (generally less than 10%) of the contract value. Each day thereafter until the futures position is closed, the Fund will pay additional
margin representing any loss experienced as a result of the futures position the prior day or be entitled to a payment representing any profit experienced as a result of the futures position the prior day. Futures
involve substantial leverage risk.
The sale of a futures contract
limits the Fund’s risk of loss through a decline in the market value of portfolio holdings correlated with the futures contract prior to the futures contract's expiration date. In the event the market value of
the portfolio holdings correlated with the futures contract increases rather than decreases, however, the Fund will realize a loss on the futures position and a lower return on the portfolio holdings than would have
been realized without the purchase of the futures contract.
Prudential Investment Portfolios
16 12
The purchase of a futures contract
may protect the Fund from having to pay more for securities as a consequence of increases in the market value for such securities during a period when the Fund was attempting to identify specific securities in which
to invest in a market the Fund believes to be attractive. In the event that such securities decline in value or the Fund determines not to complete an anticipatory hedge transaction relating to a futures contract,
however, the Fund may realize a loss relating to the futures position.
The Fund is also authorized to
purchase or sell call and put options on futures contracts including financial futures and stock indices in connection with its hedging activities. Generally, these strategies would be used under the same market and
market sector conditions (i.e., conditions relating to specific types of investments) in which the Fund entered into futures transactions. The Fund may purchase put options or write (i.e., sell) call options on
futures contracts and stock indices rather than selling the underlying futures contract in anticipation of a decrease in the market value of its securities. Similarly, the Fund can purchase call options, or write put
options on futures contracts and stock indices, as a substitute for the purchase of such futures to hedge against the increased cost resulting from an increase in the market value of securities which the Fund intends
to purchase.
The Fund may only write
“covered” put and call options on futures contracts. The Fund will be considered “covered” with respect to a call option written on a futures contract if the Fund owns the assets that are
deliverable under the futures contract or an option to purchase that futures contract having a strike price equal to or less than the strike price of the “covered” option and having an expiration date not
earlier than the expiration date of the “covered” option, or if it segregates for the term of the option cash or other liquid assets equal to the fluctuating value of the optioned future. The Fund will be
considered “covered” with respect to a put option written on a futures contract if the Fund owns an option to sell that futures contract having a strike price equal to or greater than the strike price of
the “covered” option, or if the Fund segregates for the term of the option cash or other liquid assets at all times equal in value to the exercise price of the put (less any initial margin deposited by the
Fund with its futures custody manager or as otherwise permitted by applicable law with respect to such option). There is no limitation on the amount of the Fund’s assets that can be segregated.
The Manager has filed a notice of
exclusion from registration as a “commodity pool operator” with respect to the Fund under CFTC Rule 4.5 and, therefore, is not subject to registration or regulation with respect to the Fund under the
Commodity Exchange Act (the “CEA”). In order for the Manager to claim exclusion from registration as a “commodity pool operator” under the CEA, the Fund is limited in its ability to trade
instruments subject to the CFTC’s jurisdiction, including commodity futures (which include futures on broad-based securities indexes, interest rate futures and currency futures), options on commodity futures,
certain swaps or other investments (whether directly or indirectly through investments in other investment vehicles). Under this exclusion, the Fund must satisfy one of the following two trading limitations whenever
it enters into a new commodity trading position: (1) the aggregate initial margin and premiums required to establish the Fund’s positions in CFTC-regulated instruments may not exceed 5% of the liquidation value
of the Fund’s portfolio (after accounting for unrealized profits and unrealized losses on any such investments); or (2) the aggregate net notional value of such instruments, determined at the time the most
recent position was established, may not exceed 100% of the liquidation value of the Fund’s portfolio (after accounting for unrealized profits and unrealized losses on any such positions). The Fund would not be
required to consider its exposure to such instruments if they were held for “bona fide hedging” purposes, as such term is defined in the rules of the CFTC. In addition to meeting one of the foregoing
trading limitations, the Fund may not market itself as a commodity pool or otherwise as a vehicle for trading in the markets for CFTC-regulated instruments.
FOREIGN EXCHANGE TRANSACTIONS. The Fund may engage in spot and forward foreign exchange transactions and currency swaps, purchase and sell options on currencies and purchase and sell currency futures and related options
thereon (collectively, Currency Instruments) for purposes of hedging against the decline in the value of currencies in which its portfolio holdings are denominated against the US dollar or to seek to enhance returns.
Such transactions could be effected with respect to hedges on non-US dollar denominated securities owned by the Fund, sold by the Fund but not yet delivered, or committed or anticipated to be purchased by the
Fund.
As an illustration, the Fund may
use such techniques to hedge the stated value in US dollars of an investment in a yen-denominated security. In such circumstances, for example, the Fund may purchase a foreign currency put option enabling the Fund to
sell a specified amount of yen for dollars at a specified price by a future date. To the extent the hedge is successful, a loss in the value of the yen relative to the dollar will tend to be offset by an increase in
the value of the put option. To offset, in whole or in part, the cost of acquiring such a put option, the Fund may also sell a call option which, if exercised, requires the Fund to sell a specified amount of yen for
dollars at a specified price by a future date (a technique called a “straddle”). By selling such a call option in this illustration, the Fund gives up the opportunity to profit without limit from increases
in the relative value of the yen to the dollar. Straddles of the type that may be used by the Fund are considered to constitute hedging transactions and are consistent with the policies described above. The Fund will
not attempt to hedge all of its foreign portfolio positions.
13
FORWARD FOREIGN EXCHANGE
TRANSACTIONS. Forward foreign exchange transactions are OTC contracts to purchase or sell a specified amount of a specified currency or multinational currency unit at a price and future date set at the
time of the contract. Spot foreign exchange transactions are similar but require current, rather than future, settlement. The Fund will enter into foreign exchange transactions for purposes of hedging either a
specific transaction or a portfolio position, or to seek to enhance returns. The Fund may enter into a foreign exchange transaction for purposes of hedging a specific transaction by, for example, purchasing a currency
needed to settle a security transaction or selling a currency in which the Fund has received or anticipates receiving a dividend or distribution.
The Fund may enter into a foreign
exchange transaction for purposes of hedging a portfolio position by selling forward a currency in which a portfolio position of the Fund is denominated or by purchasing a currency in which the Fund anticipates
acquiring a portfolio position in the near future. The Fund may also hedge portfolio positions through currency swaps, which are transactions in which one currency is simultaneously bought for a second currency on a
spot basis and sold for the second currency on a forward basis. Forward foreign exchange transactions involve substantial currency risk, and also involve credit and liquidity risk.
CURRENCY FUTURES. The Fund may seek to enhance returns or hedge against the decline in the value of a currency against the US dollar through use of currency futures or options thereon. Currency futures are
similar to forward foreign exchange transactions except that futures are standardized, exchange-traded contracts. See the sub-section entitled “Futures.” Currency futures involve substantial currency risk,
and also involve leverage risk.
CURRENCY OPTIONS. The Fund may seek to enhance returns or hedge against the decline in the value of a currency against the US dollar through the use of currency options. Currency options are similar to
options on securities, but in consideration for an option premium the writer of a currency option is obligated to sell (in the case of a call option) or purchase (in the case of a put option) a specified amount of a
specified currency on or before the expiration date for a specified amount of another currency. The Fund may engage in transactions in options on currencies either on exchanges or OTC markets. See “Types of
Options” and “Additional Risk Factors of OTC Transactions; Limitations on the Use of OTC Derivatives” in this SAI. Currency options involve substantial currency risk, and may also involve credit,
leverage or liquidity risk.
LIMITATIONS ON CURRENCY HEDGING. The Fund may use currency hedging instruments to seek to enhance returns. Accordingly, the Fund will not hedge a currency in excess of the aggregate market value of the securities that it
owns (including receivables for unsettled securities sales), or has committed to or anticipates purchasing, which are denominated in such currency. The Fund may, however, hedge a currency by entering into a
transaction in a Currency Instrument denominated in a currency other than the currency being hedged (a “cross-hedge”). The Fund will only enter into a cross-hedge if the subadviser believes that (i) there
is a demonstrable high correlation between the currency in which the cross-hedge is denominated and the currency being hedged, and (ii) executing a cross-hedge through the currency in which the cross-hedge is
denominated will be significantly more cost-effective or provide substantially greater liquidity than executing a similar hedging transaction by means of the currency being hedged.
RISK FACTORS IN HEDGING FOREIGN
CURRENCY. Hedging transactions involving Currency Instruments have substantial risks, including correlation risk. While the Fund’s use of Currency Instruments to effect hedging strategies is
intended to reduce the volatility of the NAV of the Fund’s shares, the NAV of the Fund’s shares will fluctuate. Moreover, although Currency Instruments will be used with the intention of hedging against
adverse currency movements, transactions in Currency Instruments involve the risk that anticipated currency movements will not be accurately predicted and that the Fund’s hedging strategies will be ineffective.
To the extent that the Fund hedges against anticipated currency movements that do not occur, the Fund may realize losses and decrease its total return as the result of its hedging transactions. Furthermore, the Fund
will only engage in hedging activities from time to time and may not be engaging in hedging activities when movements in currency exchange rates occur.
In connection with its trading in
forward foreign currency contracts, the Fund will contract with a foreign or domestic bank, or a foreign or domestic securities dealer, to make or take future delivery of a specified amount of a particular currency.
There are no limitations on daily price moves in such forward contracts, and banks and dealers are not required to continue to make markets in such contracts. There have been periods during which certain banks or
dealers have refused to quote prices for such forward contracts or have quoted prices with an unusually wide spread between the price at which the bank or dealer is prepared to buy and that at which it is prepared to
sell. Governmental imposition of credit controls might limit any such forward contract trading. With respect to its trading of forward contracts, if any, the Fund will be subject to the risk of bank or dealer failure
and the inability of, or refusal by, a bank or dealer to perform with respect to such contracts. Any such default would deprive the Fund of any profit potential or force the Fund to cover its commitments for resale,
if any, at the then market price and could result in a loss to the Fund.
It may not be possible for the Fund
to hedge against currency exchange rate movements, even if correctly anticipated, in the event that (i) the currency exchange rate movement is so generally anticipated that the Fund is not able to enter into a hedging
transaction at an effective price, or (ii) the currency exchange rate movement relates to a market with respect to which Currency Instruments are not
Prudential Investment Portfolios
16 14
available and it is not possible to engage in
effective foreign currency hedging. The cost to the Fund of engaging in foreign currency transactions varies with such factors as the currencies involved, the length of the contract period and the market conditions
then prevailing. Since transactions in foreign currency exchange usually are conducted on a principal basis, no fees or commissions are involved.
RISK FACTORS INVOLVING
DERIVATIVES. Derivatives are volatile and involve significant risks, including:
Credit Risk—the risk that the counterparty on a derivative transaction will be unable to honor its financial obligation to the Fund.
Currency Risk—the risk that changes in the exchange rate between two currencies will adversely affect the value (in US dollar terms) of an investment.
Leverage Risk—the risk associated with certain types of investments or trading strategies (such as borrowing money to increase the amount of investments) that relatively small market movements may
result in large changes in the value of an investment. Certain investments or trading strategies that involve leverage can result in losses that greatly exceed the amount originally invested.
Liquidity Risk—the risk that certain securities may be difficult or impossible to sell at the time that the seller would like or at the price that the seller believes the security is currently
worth.
Regulatory Risk—the risk that new regulation of derivatives may make them more costly, may limit their availability, or may otherwise affect their value or performance.
The use of derivatives for hedging
purposes involves correlation risk. If the value of the derivative moves more or less than the value of the hedged instruments, the Fund will experience a gain or loss that will not be completely offset by movements
in the value of the hedged instruments.
The Fund intends to enter into
transactions involving derivatives only if there appears to be a liquid secondary market for such instruments or, in the case of illiquid instruments traded in OTC transactions, such instruments satisfy the criteria
set forth below under “Additional Risk Factors of OTC Transactions; Limitations on the Use of OTC Derivatives.” However, there can be no assurance that, at any specific time, either a liquid secondary
market will exist for a derivative or the Fund will otherwise be able to sell such instrument at an acceptable price. It may therefore not be possible to close a position in a derivative without incurring substantial
losses, if at all.
Certain transactions in derivatives
(such as futures transactions or sales of put options) involve substantial leverage risk and may expose the Fund to potential losses, which exceed the amount originally invested by the Fund. When the Fund engages in
such a transaction, the Fund will deposit in a segregated account at its custodian liquid securities or cash and cash equivalents with a value at least equal to the Fund’s exposure, on a mark-to-market basis, to
the transaction (as calculated pursuant to requirements of the SEC). Such segregation will ensure that the Fund has assets available to satisfy its obligations with respect to the transaction, but will not limit the
Fund’s exposure to loss.
ADDITIONAL RISK FACTORS OF OTC
TRANSACTIONS; LIMITATIONS ON THE USE OF OTC DERIVATIVES. Certain derivatives traded in OTC markets, including indexed securities, certain swaps and OTC options, involve substantial liquidity risk. The absence of liquidity may make it difficult
or impossible for the Fund to sell such instruments promptly at an acceptable price. The absence of liquidity may also make it more difficult for the Fund to ascertain a market value for such instruments. The Fund
will, therefore, acquire illiquid OTC instruments (i) if the agreement pursuant to which the instrument is purchased contains a formula price at which the instrument may be terminated or sold, or (ii) for which the
subadviser anticipates the Fund can receive on each business day at least two independent bids or offers, unless a quotation from only one dealer is available, in which case that dealer's quotation may be
used.
Because derivatives traded in OTC
markets are not guaranteed by an exchange or clearing corporation and generally do not require payment of margin, to the extent that the Fund has unrealized gains in such instruments or has deposited collateral with
its counterparties, the Fund is at risk that its counterparties will become bankrupt or otherwise fail to honor their obligations. The Fund will attempt to minimize the risk that a counterparty will become bankrupt or
otherwise fail to honor its obligations by engaging in transactions in derivatives traded in OTC markets only with financial institutions that appear to have substantial capital or that have provided the Fund with a
third-party guaranty or other credit enhancement.
DISTRESSED SECURITIES. The Fund may invest in securities, including corporate loans purchased in the secondary market, which are the subject of bankruptcy proceedings or otherwise in default as to the repayment
of principal and/or interest at the time of acquisition by the Fund or are rated in the lower rating categories (generally, Ca or lower by Moody's and CC or lower by S&P or Fitch) or which,
15
if unrated, are in the judgment of the subadviser
of equivalent quality (“Distressed Securities”). Investing in Distressed Securities is speculative and involves significant risks. Distressed Securities frequently do not produce income while they are
outstanding and may require the Fund to bear certain extraordinary expenses in order to protect and recover its investment.
The Fund will generally make such
investments only when the subadviser believes it is reasonably likely that the issuer of the Distressed Securities will make an exchange offer or will be the subject of a plan of reorganization pursuant to which the
Fund will receive new securities. However, there can be no assurance that such an exchange offer will be made or that such a plan of reorganization will be adopted. In addition, a significant period of time may pass
between the time at which the Fund makes its investment in Distressed Securities and the time that any such exchange offer or plan of reorganization is completed. During this period, it is unlikely that the Fund will
receive any interest payments on the Distressed Securities, the Fund will be subject to significant uncertainty as to whether or not the exchange offer or plan of reorganization will be completed and the Fund may be
required to bear certain extraordinary expenses to protect and recover its investment. Even if an exchange offer is made or plan of reorganization is adopted with respect to Distressed Securities held by the Fund,
there can be no assurance that the securities or other assets received by the Fund in connection with such exchange offer or plan of reorganization will not have a lower value or income potential than may have been
anticipated when the investment was made. Moreover, any securities received by the Fund upon completion of an exchange offer or plan of reorganization may be restricted as to resale. As a result of the Fund’s
participation in negotiations with respect to any exchange offer or plan of reorganization with respect to an issuer of Distressed Securities, the Fund may be restricted from disposing of such securities.
FOREIGN INVESTMENTS. The Fund may invest in foreign equity and/or debt securities. Foreign debt securities include certain foreign bank obligations and US dollar or foreign currency-denominated obligations of
foreign governments or their subdivisions, agencies and instrumentalities, international agencies and supranational entities.
Foreign Market Risk. Foreign securities offer the potential for more diversification than if the Fund invests only in the United States because securities traded on foreign markets have often (though not
always) performed differently from securities in the United States. However, such investments involve special risks not present in US investments that can increase the chances that the Fund will lose money. In
particular, the Fund is subject to the risk that, because there are generally fewer investors on foreign exchanges and a smaller number of shares traded each day, it may be difficult for the Fund to buy and sell
securities on those exchanges. In addition, prices of foreign securities may fluctuate more than prices of securities traded in the United States.
Foreign Economy Risk. The economies of certain foreign markets often do not compare favorably with that of the United States with respect to such issues as growth of gross national product, reinvestment of
capital, resources, and balance of payments position. Certain such economies may rely heavily on particular industries or foreign capital and are more vulnerable to diplomatic developments, the imposition of economic
sanctions against a particular country or countries, changes in international trading patterns, trade barriers, and other protectionist or retaliatory measures. Investments in foreign markets may also be adversely
affected by governmental actions such as the imposition of capital controls, nationalization of companies or industries, expropriation of assets, or the imposition of punitive taxes. In addition, the governments of
certain countries may prohibit or impose substantial restrictions on foreign investing in their capital markets or in certain industries. Any of these actions could severely affect security prices, impair the
Fund’s ability to purchase or sell foreign securities or transfer the Fund’s assets or income back into the United States, or otherwise adversely affect the Fund’s operations. Other foreign market
risks include foreign exchange controls, difficulties in pricing securities, defaults on foreign government securities, difficulties in enforcing favorable legal judgments in foreign courts, and political and social
instability. Legal remedies available to investors in certain foreign countries may be less extensive than those available to investors in the United States or other foreign countries.
Currency Risk and Exchange
Risk. Securities in which the Fund invests may be denominated or quoted in currencies other than the US dollar. Changes in foreign currency exchange rates will affect the value of the
Fund’s portfolio. Generally, when the US dollar rises in value against a foreign currency, a security denominated in that currency loses value because the currency is worth fewer US dollars. Conversely, when the
US dollar decreases in value against a foreign currency, a security denominated in that currency gains value because the currency is worth more US dollars. This risk, generally known as “currency risk,”
means that a stronger US dollar will reduce returns for US investors while a weak US dollar will increase those returns.
Governmental Supervision and
Regulation/Accounting Standards. Many foreign governments supervise and regulate stock exchanges, brokers and the sale of securities less rigorously than the United States. Some countries may not have laws to protect
investors comparable to the US securities laws. For example, some foreign countries may have no laws or rules against insider trading. Insider trading occurs when a person buys or sells a company's securities based on
nonpublic information about that company. Accounting standards in other countries are not necessarily the same as in the United States. If the accounting standards in another country do not require as much detail as
US accounting standards, it may be harder for Fund management to completely and accurately determine a company's financial condition.
Prudential Investment Portfolios
16 16
Certain Risks of Holding Fund Assets
Outside the United States. The Fund generally holds its foreign securities and cash in foreign banks and securities depositories. Some foreign banks and securities depositories may be recently organized or new to
the foreign custody business. In addition, there may be limited or no regulatory oversight over their operations. Also, the laws of certain countries may put limits on the Fund’s ability to recover its assets if
a foreign bank or depository or issuer of a security or any of their agents goes bankrupt. In addition, it is often more expensive for the Fund to buy, sell and hold securities in certain foreign markets than in the
United States. The increased expense of investing in foreign markets reduces the amount the Fund can earn on its investments and typically results in a higher operating expense ratio for the Fund as compared to
investment companies that invest only in the United States.
Settlement Risk. Settlement and clearance procedures in certain foreign markets differ significantly from those in the United States. Foreign settlement procedures and trade regulations also may involve
certain risks (such as delays in payment for or delivery of securities) not typically generated by the settlement of US investments. Communications between the United States and emerging market countries may be
unreliable, increasing the risk of delayed settlements or losses of security certificates. Settlements in certain foreign countries at times have not kept pace with the number of securities transactions; these
problems may make it difficult for the Fund to carry out transactions. If the Fund cannot settle or there is a delay in settling a purchase of securities, the Fund may miss attractive investment opportunities and
certain assets may be uninvested with no return earned thereon for some period. If the Fund cannot settle or there is a delay in settling a sale of securities, the Fund may lose money if the value of the security then
declines or, if there is a contract to sell the security to another party, the Fund could be liable to that party for any losses incurred.
Dividends or interest on, or
proceeds from the sale of, foreign securities may be subject to foreign withholding taxes, thereby reducing the amount available for distribution to shareholders.
INITIAL PUBLIC OFFERINGS. The Fund may invest in securities sold in IPOs. An IPO is the first sale of stock by a private company to the public. IPOs are often issued by smaller, younger companies seeking capital to
expand, but can also be done by large privately owned companies looking to become publicly traded.
In an IPO, the issuer obtains the
assistance of an underwriting firm, which helps it determine what type of security to issue (common or preferred), best offering price and time to bring it to market. The volume of IPOs and the levels at which the
newly issued stocks trade in the secondary market are affected by the performance of the stock market overall. If IPOs are brought to the market, availability may be limited and the Fund may not be able to buy any
shares at the offering price, or if the Fund is able to buy shares, the Fund may not be able to buy as many shares at the offering price as the Fund would like.
Investing in IPOs entails risks.
Importantly, the prices of securities involved in IPOs are often subject to greater and more unpredictable price changes than more established stocks. It is difficult to predict what the stock will do on its initial
day of trading and in the near future since there is often little historical data with which to analyze the company. Also, most IPOs are of companies going through a transitory growth period, and they are therefore
subject to additional uncertainty regarding their future value.
INVESTMENT IN EMERGING MARKETS. The Fund may invest in the securities of issuers domiciled in various countries with emerging capital markets. Specifically, a country with an emerging capital market is any country that
the World Bank, the International Finance Corporation, the United Nations or its authorities has determined to have a low or middle income economy. Countries with emerging markets can be found in regions such as Asia,
Latin America, Eastern Europe and Africa.
Investments in the securities of
issuers domiciled in countries with emerging capital markets involve certain additional risks not involved in investments in securities of issuers in more developed capital markets, such as (i) low or non-existent
trading volume, resulting in a lack of liquidity and increased volatility in prices for such securities, as compared to securities of comparable issuers in more developed capital markets, (ii) uncertain national
policies and social, political and economic instability, increasing the potential for expropriation of assets, confiscatory taxation, high rates of inflation or unfavorable diplomatic developments, (iii) possible
fluctuations in exchange rates, differing legal systems and the existence or possible imposition of exchange controls, custodial restrictions or other foreign or US governmental laws or restrictions applicable to such
investments, (iv) national policies that may limit the Fund’s investment opportunities such as restrictions on investment in issuers or industries deemed sensitive to national interests, and (v) the lack or
relatively early development of legal structures governing private and foreign investments and private property. In addition to withholding taxes on investment income, some countries with emerging markets may impose
differential capital gains taxes on foreign investors.
Such capital markets are emerging
in a dynamic political and economic environment brought about by events over recent years that have reshaped political boundaries and traditional ideologies. In such a dynamic environment, there can be no assurance
that these capital markets will continue to present viable investment opportunities for the Fund. In the past, governments of such nations have
17
expropriated substantial amounts of private
property, and most claims of the property owners have never been fully settled. There is no assurance that such expropriations will not reoccur. In such an event, it is possible that the Fund could lose the entire
value of its investments in the affected markets.
Also, there may be less publicly
available information about issuers in emerging markets than would be available about issuers in more developed capital markets, and such issuers may not be subject to accounting, auditing and financial reporting
standards and requirements comparable to those to which US companies are subject. In certain countries with emerging capital markets, reporting standards vary widely. As a result, traditional investment measurements
used in the United States, such as price/earnings ratios, may not be applicable. Emerging market securities may be substantially less liquid and more volatile than those of mature markets, and companies may be held by
a limited number of persons. This may adversely affect the timing and pricing of the Fund’s acquisition or disposal of securities.
Practices in relation to settlement
of securities transactions in emerging markets involve higher risks than those in developed markets, in part because the Fund will need to use brokers and counterparties that are less well capitalized, and custody and
registration of assets in some countries may be unreliable. The possibility of fraud, negligence, undue influence being exerted by the issuer or refusal to recognize ownership exists in some emerging markets, and,
along with other factors, could result in ownership registration being completely lost. The Fund would absorb any loss resulting from such registration problems and may have no successful claim for compensation.
RESTRICTIONS ON CERTAIN
INVESTMENTS. A number of publicly traded closed-end investment companies have been organized to facilitate indirect foreign investment in developing countries, and certain of such countries, such as
Thailand, South Korea, Chile and Brazil have specifically authorized such funds. There also are investment opportunities in certain of such countries in pooled vehicles that resemble open-end investment companies. In
accordance with the 1940 Act, the Fund may invest up to 10% of its total assets in securities of other investment companies, not more than 5% of which may be invested in any one such company. In addition, under the
1940 Act, the Fund may not own more than 3% of the total outstanding voting stock of any investment company. These restrictions on investments in securities of investment companies may limit opportunities for the Fund
to invest indirectly in certain developing countries. New shares of certain investment companies may at times be acquired only at market prices representing premiums to their NAVs. If the Fund acquires shares of other
investment companies, shareholders would bear both their proportionate share of expenses of the Fund (including management and advisory fees) and, indirectly, the expenses of such other investment companies. See also
“Investment in Other Investment Companies.”
RECENT EVENTS IN EUROPEAN
COUNTRIES. A number of countries in Europe have experienced severe economic and financial difficulties. Many non-governmental issuers, and even certain governments, have defaulted on, or been forced
to restructure, their debts; many other issuers have faced difficulties obtaining credit or refinancing existing obligations; financial institutions have in many cases required government or central bank support, have
needed to raise capital, and/or have been impaired in their ability to extend credit; and financial markets in Europe and elsewhere have experienced extreme volatility and declines in asset values and liquidity. These
difficulties may continue, worsen or spread within and without Europe. Responses to the financial problems by European governments, central banks and others, including austerity measures and reforms, may not work, may
result in social unrest and may limit future growth and economic recovery or have other unintended consequences. Further defaults or restructurings by governments and others of their debt could have additional adverse
effects on economies, financial markets and asset valuations around the world. In addition, one or more countries may abandon the euro, the common currency of the European Union, and/or withdraw from the European
Union. The impact of these actions, especially if they occur in a disorderly fashion, is not clear but could be significant and far-reaching. Whether or not the Fund invests in securities of issuers located in Europe
or with significant exposure to European issuers or countries, these events could negatively affect the value and liquidity of the Fund’s investments.
RISKS OF INVESTING IN ASIA-PACIFIC
COUNTRIES. In addition to the risks of foreign investing and the risks of investing in emerging markets, the developing market Asia-Pacific countries in which the Fund may invest are subject to
certain additional or specific risks. There is a high concentration of market capitalization and trading volume in a small number of issuers representing a limited number of industries, as well as a high concentration
of investors and financial intermediaries. Many of these markets also may be affected by developments with respect to more established markets in the region such as in Japan and Hong Kong. Brokers in developing market
Asia-Pacific countries typically are fewer in number and less well capitalized than brokers in the United States. These factors, combined with the US regulatory requirements for open-end investment companies and the
restrictions on foreign investment discussed below, result in potentially fewer investment opportunities for the Fund and may have an adverse impact on the investment performance of the Fund.
Many of the developing market
Asia-Pacific countries may be subject to a greater degree of economic, political and social instability than is the case in the United States and Western European countries. Such instability may result from, among
other things: (i) authoritarian governments or military involvement in political and economic decision-making, including changes in government
Prudential Investment Portfolios
16 18
through extra-constitutional means; (ii) popular
unrest associated with demands for improved political, economic and social conditions; (iii) internal insurgencies; (iv) hostile relations with neighboring countries; and (v) ethnic, religious and racial disaffection.
In addition, the governments of many of such countries, such as Indonesia, have a heavy role in regulating and supervising the economy. Another risk common to most such countries is that the economy is heavily export
oriented and, accordingly, is dependent upon international trade. The existence of overburdened infrastructure and obsolete financial systems also present risks in certain countries, as do environmental problems.
Certain economies also depend to a significant degree upon exports of primary commodities and, therefore, are vulnerable to changes in commodity prices that, in turn, may be affected by a variety of factors.
The legal systems in certain
developing market Asia-Pacific countries also may have an adverse impact on the Fund. For example, while the potential liability of a shareholder in a US corporation with respect to acts of the corporation is
generally limited to the amount of the shareholder’s investment, the notion of limited liability is less clear in certain emerging market Asia-Pacific countries. Similarly, the rights of investors in developing
market Asia-Pacific companies may be more limited than those of shareholders of US corporations. It may be difficult or impossible to obtain and/or enforce a judgment in a developing market Asia-Pacific country.
Governments of many developing
market Asia-Pacific countries have exercised and continue to exercise substantial influence over many aspects of the private sector. In certain cases, the government owns or controls many companies, including the
largest in the country. Accordingly, government actions in the future could have a significant effect on economic conditions in developing market Asia-Pacific countries, which could affect private sector companies and
the Fund itself, as well as the value of securities in the Fund’s portfolio. In addition, economic statistics of developing market Asia-Pacific countries may be less reliable than economic statistics of more
developed nations.
In addition to the relative lack of
publicly available information about developing market Asia-Pacific issuers and the possibility that such issuers may not be subject to the same accounting, auditing and financial reporting standards as US companies,
inflation accounting rules in some developing market Asia-Pacific countries require companies that keep accounting records in the local currency, for both tax and accounting purposes, to restate certain assets and
liabilities on the company’s balance sheet in order to express items in terms of currency of constant purchasing power. Inflation accounting may indirectly generate losses or profits for certain developing
market Asia-Pacific companies. Satisfactory custodial services for investment securities may not be available in some developing Asia-Pacific countries, which may result in the Fund incurring additional costs and
delays in providing transportation and custody services for such securities outside such countries.
Certain developing Asia-Pacific
countries, such as the Philippines, India and Turkey, are especially large debtors to commercial banks and foreign governments. Fund management may determine that, notwithstanding otherwise favorable investment
criteria, it may not be practicable or appropriate to invest in a particular developing Asia-Pacific country. The Fund may invest in countries in which foreign investors, including management of the Fund, have had no
or limited prior experience.
Restrictions on Foreign Investments
in Asia-Pacific Countries. Some developing Asia-Pacific countries prohibit or impose substantial restrictions on investments in their capital markets, particularly their equity markets, by foreign entities such as
the Fund. As illustrations, certain countries may require governmental approval prior to investments by foreign persons or limit the amount of investment by foreign persons in a particular company or limit the
investment by foreign persons to only a specific class of securities of a company which may have less advantageous terms (including price) than securities of the company available for purchase by nationals. There can
be no assurance that the Fund will be able to obtain required governmental approvals in a timely manner. In addition, changes to restrictions on foreign ownership of securities subsequent to the Fund’s purchase
of such securities may have an adverse effect on the value of such shares. Certain countries may restrict investment opportunities in issuers or industries deemed important to national interests.
The manner in which foreign
investors may invest in companies in certain developing Asia-Pacific countries, as well as limitations on such investments, also may have an adverse impact on the operations of the Fund. For example, the Fund may be
required in certain of such countries to invest initially through a local broker or other entity and then have the shares purchased re-registered in the name of the Fund. Re-registration may in some instances not be
able to occur on a timely basis, resulting in a delay during which the Fund may be denied certain of its rights as an investor, including rights as to dividends or to be made aware of certain corporate actions. There
also may be instances where the Fund places a purchase order but subsequently learns, at the time of re-registration, that the permissible allocation of the investment to foreign investors has been filled, depriving
the Fund of the ability to make its desired investment at that time.
Substantial limitations may exist
in certain countries with respect to the Fund’s ability to repatriate investment income, capital or the proceeds of sales of securities by foreign investors. The Fund could be adversely affected by delays in, or
a refusal to grant, any required governmental approval for repatriation of capital, as well as by the application to the Fund of any restrictions on investments. For example, in September 1998, Malaysia imposed
currency controls that limited funds’ ability to repatriate proceeds of Malaysian
19
investments. It is possible that Malaysia, or
certain other countries may impose similar restrictions or other restrictions relating to their currencies or to securities of issuers in those countries. To the extent that such restrictions have the effect of making
certain investments illiquid, securities may not be available to meet redemptions. Depending on a variety of financial factors, the percentage of the Fund’s portfolio subject to currency controls may increase.
In the event other countries impose similar controls, the portion of the Fund’s assets that may be used to meet redemptions may be further decreased. Even where there is no outright restriction on repatriation
of capital, the mechanics of repatriation may affect certain aspects of the operations of the Fund. For example, funds may be withdrawn from the People’s Republic of China only in US or Hong Kong dollars and
only at an exchange rate established by the government once each week. In certain countries, banks or other financial institutions may be among the leading companies or have actively traded securities. The 1940 Act
restricts the Fund’s investments in any equity securities of an issuer that, in its most recent fiscal year, derived more than 15% of its revenues from “securities related activities,” as defined by
the rules thereunder. These provisions may restrict the Fund’s investments in certain foreign banks and other financial institutions.
RISK OF INVESTMENTS IN RUSSIA. The Fund may invest a portion of its assets in securities issued by companies located in the Russian Federation. Settlement, clearing and registration of securities transactions in Russia
are subject to significant risks. Ownership of shares is defined according to entries in the company’s share register and normally evidenced by extracts from the register. These extracts are not negotiable
instruments and are not effective evidence of securities ownership. The registrars are not necessarily subject to effective state supervision nor are they licensed with any governmental entity. Also, there is no
central registration system for shareholders and it is possible for the Fund to lose its registration through fraud, negligence or mere oversight. While the Fund will endeavor to ensure that its interests continue to
be appropriately recorded, either by itself or through a custodian or other agent inspecting the share register and by obtaining extracts of share registers through regular confirmations, these extracts are not
legally enforceable and it is possible that a subsequent illegal amendment or other fraudulent act may deprive the Fund of its ownership rights or improperly dilute its interests. In addition, while applicable Russian
regulations impose liability on registrars for losses resulting from their errors, it may be difficult for the Fund to enforce any rights it may have against the registrar or issuer of the securities in the event of
loss of share registration. While the Fund intends to invest directly in Russian companies that use an independent registrar, there can be no assurance that such investments will not result in a loss to the
Fund.
As a result of recent political and
military actions undertaken by the Russian Federation, the US and the European Union have instituted various economic sanctions against Russian individuals and entities. The US and/or the European Union may impose
additional economic sanctions, or take other actions, against individuals and/or companies in specific sectors of the Russian economy, including, but not limited to, the financial services, energy, metals and mining,
engineering, and defense and defense-related materials sectors. These sanctions, and the threat of additional sanctions, could have adverse consequences for the Russian economy, including continued weakening of the
Russian currency, downgrades in Russia’s credit rating, and a significant decline in the value and liquidity of securities issued by Russian companies or the Russian government. Any of these events could
negatively impact the Fund’s investment in Russian securities. These sanctions have the possibility of impairing the Fund’s ability to invest in accordance with its investment strategy and/or to meet its
investment objective. For example, the Fund may be prohibited from investing in securities issued by companies subject to such sanctions. In addition, these sanctions may require a fund to freeze its existing
investments in Russian securities, thereby prohibiting the Fund from buying, selling, receiving or delivering those securities or other financial instruments. It is also possible that any counter measures or
retaliatory action by Russia could further impair the value and liquidity of securities issued by Russian companies and may have an impact on the economies of other emerging markets as well.
INVESTMENT IN OTHER INVESTMENT
COMPANIES. The Fund may invest in other investment companies, including ETFs. In accordance with the 1940 Act, the Fund may invest up to 10% of its total assets in securities of other investment
companies. In addition, under the 1940 Act, the Fund may not own more than 3% of the total outstanding voting stock of any investment company and not more than 5% of the value of the Fund’s total assets may be
invested in securities of any single investment company.
Notwithstanding the limits
discussed above, the Fund may invest in other investment companies without regard to the limits set forth above provided that the Fund complies with Rules 12d1-1, 12d1-2 and 12d1-3 promulgated by the SEC under the
1940 Act or otherwise permitted by the 1940 Act Laws, Interpretations and Exemptions.
As with other investments,
investments in other investment companies are subject to market and selection risk. In addition, if the Fund acquires shares in other investment companies, shareholders would bear both their proportionate share of
expenses in the Fund (including management and advisory fees) and, indirectly, their proportionate shares of the expenses of such investment companies (including management and advisory fees).
JUNK BONDS. Junk bonds are debt securities that are rated below investment grade by the major rating agencies or are unrated securities that the subadviser believes are of comparable quality. Although
junk bonds generally pay higher rates of interest than investment grade bonds, they are high risk investments that may cause income and principal losses for the Fund. The major risks in junk bond investments include
the following:
Prudential Investment Portfolios
16 20
| ■ | Junk bonds are issued by less creditworthy issuers. These securities are vulnerable to adverse changes in the issuer's economic condition and to general economic conditions. Issuers of junk bonds may be unable to meet their interest or principal payment obligations because of an economic downturn, specific issuer developments or the unavailability of additional financing. |
| ■ | The issuers of junk bonds may have a larger amount of outstanding debt relative to their assets than issuers of investment grade bonds. If the issuer experiences financial stress, it may be unable to meet its debt obligations. |
| ■ | Junk bonds are frequently ranked junior to claims by other creditors. If the issuer cannot meet its obligations, the senior obligations are generally paid off before the junior obligations. |
| ■ | Junk bonds frequently have redemption features that permit an issuer to repurchase the security from the Fund before it matures. If an issuer redeems the junk bonds, the Fund may have to invest the proceeds in bonds with lower yields and may lose income. |
| ■ | Prices of junk bonds are subject to extreme price fluctuations. Negative economic developments may have a greater impact on the prices of junk bonds than on other higher rated fixed income securities. |
| ■ | Junk bonds may be less liquid than higher rated fixed income securities even under normal economic conditions. There are fewer dealers in the junk bond market, and there may be significant differences in the prices quoted for junk bonds by the dealers. Because they are less liquid, judgment may play a greater role in valuing certain of the Fund’s portfolio securities than in the case of securities trading in a more liquid market. |
| ■ | The Fund may incur expenses to the extent necessary to seek recovery upon default or to negotiate new terms with a defaulting issuer. |
LIQUIDITY PUTS OR CALLS. The Fund may purchase a permissible instrument or investment together with the right to resell or purchase the instruments at an agreed-upon price or yield within a specified period prior
to the maturity date of the instruments. Such a right to resell is commonly known as a put, and such a right to purchase is commonly known as a call. The aggregate price which the Fund pays for instruments with puts
or calls may be higher than the price which otherwise would be paid for the instruments. The purpose of this practice is to permit the Fund to be fully invested while preserving the necessary liquidity to meet
unusually large redemptions and to purchase at a later date securities other than those subject to the put. The Fund may choose to exercise puts during periods in which proceeds from sales of its shares and from
recent sales of portfolio securities are insufficient to meet redemption requests or when the funds available are otherwise allocated for investment. The Fund may choose to exercise calls during periods in which funds
are available for investment. In determining whether to exercise puts or calls prior to their expiration date and in selecting which puts or calls to exercise in such circumstances, the subadviser considers, among
other things, the amount of cash available to the Fund, the expiration dates of the available puts or calls, any future commitments for securities purchases, the yield, quality and maturity dates of the underlying
securities, alternative investment opportunities and the desirability of retaining the underlying securities in the Fund.
MONEY MARKET INSTRUMENTS. The Fund may invest in money market instruments. Money market instruments include cash equivalents and short-term obligations of US banks, certificates of deposit and short-term
obligations issued or guaranteed by the US Government or its agencies. Money market instruments also include bankers' acceptances, commercial paper, certificates of deposit and Eurodollar obligations issued or
guaranteed by bank holding companies in the US, their subsidiaries and foreign branches, by foreign banking institutions, and by the World Bank and other multinational instrumentalities, as well as commercial paper
and other short-term obligations of, and variable amount master demand notes, variable rate notes and funding agreements issued by, US and foreign corporations.
MORTGAGE-BACKED SECURITIES. Investing in mortgage-backed securities involves certain unique risks in addition to those generally associated with investing in fixed-income securities and in the real estate industry in
general. These unique risks include the failure of a party to meet its commitments under the related operative documents, adverse interest rate changes and the effects of prepayments on mortgage cash flows.
Mortgage-backed securities are “pass-through” securities, meaning that principal and interest payments made by the borrower on the underlying mortgages are passed through to the Fund. The value of
mortgage-backed securities, like that of traditional fixed-income securities, typically increases when interest rates fall and decreases when interest rates rise. However, mortgage-backed securities differ from
traditional fixed-income securities because of their potential for prepayment without penalty. The price paid by the Fund for its mortgage-backed securities, the yield the Fund expects to receive from such securities
and the average life of the securities are based on a number of factors, including the anticipated rate of prepayment of the underlying mortgages. In a period of declining interest rates, borrowers may prepay the
underlying mortgages more quickly than anticipated, thereby reducing the yield to maturity and the average life of the mortgage-backed securities. Moreover, when the Fund reinvests the proceeds of a prepayment in
these circumstances, the likely rate of interest received will be lower than the rate on the security that was prepaid.
Mortgage-backed securities,
including CMOs, can be collateralized by either fixed-rate mortgages or adjustable rate mortgages. Fixed-rate mortgage securities are collateralized by fixed-rate mortgages and tend to have high prepayment rates when
the level of prevailing interest rates declines significantly below the interest rates on the mortgages. Thus, under those circumstances, the
21
securities are generally less sensitive to interest
rate movements than lower coupon fixed-rate mortgages. CMOs may be collateralized by whole mortgage loans or private mortgage pass-through securities, but are more typically collateralized by portfolios of mortgage
pass-through securities guaranteed by Ginnie Mae, Freddie Mac or Fannie Mae.
Generally, adjustable rate mortgage
securities (ARMs) have a specified maturity date and amortize principal over their life. In periods of declining interest rates, there is a reasonable likelihood that ARMs will experience increased rates of prepayment
of principal. However, the major difference between ARMs and fixed-rate mortgage securities (FRMs) is that the interest rate and the rate of amortization of principal of ARMs can and do change in accordance with
movements in a particular, pre-specified, published interest rate index. The amount of interest on an ARM is calculated by adding a specified amount, the “margin,” to the index, subject to limitations on
the maximum and minimum interest that is charged during the life of the mortgage or to maximum and minimum changes to that interest rate during a given period.
The underlying mortgages which
collateralize the ARMs in which the Fund invests will frequently have caps and floors which limit the maximum amount by which the loan rate to the residential borrower may change up or down (1) per reset or adjustment
interval and (2) over the life of the loan. Some residential mortgage loans restrict periodic adjustments by limiting changes in the borrower's monthly principal and interest payments rather than limiting interest
rate changes. These payment caps may result in negative amortization.
To the extent that the Fund
purchases mortgage-backed securities at a premium, mortgage foreclosures and principal prepayments may result in a loss to the extent of the premium paid. If the Fund buys such securities at a discount, both scheduled
payments of principal and unscheduled prepayments will increase current and total returns and will accelerate the recognition of income which, when distributed to shareholders, will be taxable as ordinary income. In a
period of rising interest rates, prepayments of the underlying mortgages may occur at a slower than expected rate, creating maturity extension risk. This particular risk may effectively change a security that was
considered short- or intermediate-term at the time of purchase into a long-term security. Since long-term securities generally fluctuate more widely in response to changes in interest rates than shorter-term
securities, maturity extension risk could increase the inherent volatility of the Fund. Under certain interest rate and prepayment scenarios, the Fund may fail to recoup fully its investment in mortgage-backed
securities notwithstanding any direct or indirect governmental or agency guarantee.
Most mortgage-backed securities are
issued by federal government agencies such as Ginnie Mae, or by government sponsored enterprises such as Freddie Mac and Fannie Mae. Principal and interest payments on mortgage-backed securities issued by the federal
government and some federal agencies, such as Ginnie Mae, are guaranteed by the federal government and backed by the full faith and credit of the United States. Mortgage-backed securities issued by other government
agencies or government sponsored enterprises are backed only by the credit of the government agency or enterprise and are not backed by the full faith and credit of the United States. Fannie Mae and Freddie Mac are
authorized to borrow from the US Treasury to meet their obligations. Private mortgage-backed securities are issued by private corporations rather than government agencies and are subject to credit risk and interest
rate risk.
Fannie Mae and Freddie Mac are
stockholder-owned companies chartered by Congress. Fannie Mae and Freddie Mac guarantee the securities they issue as to timely payment of principal and interest, but such guarantee is not backed by the full faith and
credit of the United States. In September 2008, Fannie Mae and Freddie Mac were placed into conservatorship by their regulator, the Federal Housing Finance Agency. It is unclear what effect this conservatorship, which
remains ongoing as of the date of this SAI, will have on the securities issued or guaranteed by Fannie Mae or Freddie Mac. Although the US Government has provided financial support to Fannie Mae and Freddie Mac, there
can be no assurance that it will support these or other government-sponsored enterprises (GSEs) in the future.
MUNICIPAL SECURITIES. The Fund may, from time to time, invest in municipal bonds, which may be general obligation or revenue bonds. General obligation bonds are secured by the issuer's pledge of its faith,
credit and taxing power for the payment of principal and interest, whereas revenue bonds are payable only from the revenues derived from a particular facility or class of facilities or, in some cases, from the
proceeds of a special excise or other specific revenue source.
The Fund may invest in municipal
notes including tax, revenue and bond anticipation notes which are issued to obtain funds for various public purposes. The Fund may invest in municipal asset-backed securities, which are debt obligations, often issued
through a trust or other investment vehicles that are backed by municipal debt obligations and accompanied by a liquidity facility. The Fund may invest in municipal securities with the right to resell such securities
to the seller at an agreed-upon price or yield within a specified period prior to the maturity date. Such a right to resell is commonly referred to as a “put” or “tender option.”
Prudential Investment Portfolios
16 22
Municipal securities include notes
and bonds issued by or on behalf of states, territories and possessions of the United States and their political subdivisions, agencies and instrumentalities and the District of Columbia, the interest on which is
generally eligible for exclusion from federal income tax and, in certain instances, applicable state or local income and personal property taxes. Interest from municipal securities received by the Fund will not be
eligible from exclusion from federal income tax when distributed to shareholders. Such securities are traded primarily in the OTC market.
The interest rates payable on
certain municipal bonds and municipal notes are not fixed and may fluctuate based upon changes in market rates. Municipal bonds and notes of this type are called “variable rate” obligations. The interest
rate payable on a variable rate obligation is adjusted either at pre-designated intervals or whenever there is a change in the market rate of interest on which the interest rate payable is based. Other features may
include the right whereby the Fund may demand prepayment of the principal amount of the obligation prior to its stated maturity (a demand feature) and the right of the issuer to prepay the principal amount prior to
maturity. The principal benefit of a variable rate obligation is that the interest rate adjustment minimizes changes in the market value of the obligation. As a result, the purchase of variable rate obligations should
enhance the ability of the Fund to maintain a stable NAV per share and to sell an obligation prior to maturity at a price approximating the full principal amount of the obligation.
Variable rate securities provide
for a specific periodic adjustment in the interest rate based on prevailing market rates and generally would allow the Fund to demand payment of the obligation on short notice at par plus accrued interest, which
amount may, at times, be more or less than the amount the Fund paid for them.
An inverse floater is a debt
instrument with a floating or variable interest rate that moves in the opposite direction of the interest rate on another security or the value of an index. Changes in the interest rate on the other security or index
inversely affect the residual interest rate paid on the inverse floater, with the result that the inverse floater's price will be considerably more volatile than that of a fixed rate bond. Generally, income from
inverse floating rate bonds will decrease when short-term interest rates increase, and will increase when short-term interest rates decrease. Such securities have the effect of providing investment leverage, since
they may increase or decrease in value in response to changes, as an illustration, in market interest rates at a rate that is a multiple (typically two) of the rate at which fixed-rate, long-term, tax-exempt
securities increase or decrease in response to such changes. As a result, the market values of such securities generally will be more volatile than the market values of fixed-rate tax-exempt securities.
REAL ESTATE RELATED SECURITIES. Although the Fund may not invest directly in real estate, the Fund may invest in securities of issuers that are principally engaged in the real estate industry. Therefore, an investment by
the Fund is subject to certain risks associated with the ownership of real estate and with the real estate industry in general. These risks include, among others: possible declines in the value of real estate; risks
related to general and local economic conditions; possible lack of availability of mortgage funds or other limitations on access to capital; overbuilding; risks associated with leverage; market illiquidity; extended
vacancies of properties; increase in competition, property taxes, capital expenditures and operating expenses; changes in zoning laws or other governmental regulation; costs resulting from the clean-up of, and
liability to third parties for damages resulting from, environmental problems; tenant bankruptcies or other credit problems; casualty or condemnation losses; uninsured damages from floods, earthquakes or other natural
disasters; limitations on and variations in rents, including decreases in market rates for rents; investment in developments that are not completed or that are subject to delays in completion; and unfavorable changes
in interest rates. To the extent that assets underlying the Fund’s investments are concentrated geographically, by property type or in certain other respects, the Fund may be subject to certain of the foregoing
risks to a greater extent.
Investments by the Fund in
securities of companies providing mortgage servicing will be subject to the risks associated with refinancings and their impact on servicing rights. In addition, if the Fund receives rental income or income from the
disposition of real property acquired as a result of a default on securities the Fund owns, the receipt of such income may adversely affect the Fund’s ability to retain its federal income tax status as a RIC
because of certain income source requirements applicable to regulated investment companies under the Code.
REAL ESTATE INVESTMENT TRUSTS. Investing in REITs involves certain unique risks in addition to those risks associated with investing in the real estate industry in general. Equity REITs may be affected by changes in the
value of the underlying property owned by the REITs, while mortgage REITs may be affected by the quality of any credit extended. REITs are dependent upon management skills, may not be diversified geographically or by
property type, and are subject to heavy cash flow dependency, default by borrowers and self-liquidation. REITs must also meet certain requirements under the Code to avoid entity level tax and be eligible to
pass-through certain tax attributes of their income to shareholders. REITs are consequently subject to the risk of failing to meet these requirements for favorable tax treatment and of failing to maintain their
exemptions from registration under the 1940 Act. REITs are also subject to the risks of changes in the Code affecting their tax status.
23
REITs (especially mortgage REITs)
are also subject to interest rate risks. When interest rates decline, the value of a REIT's investment in fixed rate obligations can be expected to rise. Conversely, when interest rates rise, the value of a REIT's
investment in fixed rate obligations can be expected to decline. In contrast, as interest rates on adjustable rate mortgage loans are reset periodically, yields on a REIT's investments in such loans will gradually
align themselves to reflect changes in market interest rates, causing the value of such investments to fluctuate less dramatically in response to interest rate fluctuations than would investments in fixed rate
obligations.
Investing in certain REITs involves
risks similar to those associated with investing in small capitalization companies. These REITs may have limited financial resources, may trade less frequently and in limited volume and may be subject to more abrupt
or erratic price movements than larger company securities. Historically, small capitalization stocks, such as REITs, have been more volatile in price than the larger capitalization stocks included in the S&P 500
Index. The management of a REIT may be subject to conflicts of interest with respect to the operation of the business of the REIT and may be involved in real estate activities competitive with the REIT. REITs may own
properties through joint ventures or in other circumstances in which the REIT may not have control over its investments. REITs may incur significant amounts of leverage. The Fund’s investments in REITs may
subject the Fund to duplicate management and/or advisory fees.
REPURCHASE AGREEMENTS. The Fund may invest in securities pursuant to repurchase agreements. The Fund will enter into repurchase agreements only with parties meeting creditworthiness standards as set forth in the
Fund’s repurchase agreement procedures.
Under such agreements, the other
party agrees, upon entering into the contract with the Fund, to repurchase the security at a mutually agreed-upon time and price in a specified currency, thereby determining the yield during the term of the agreement.
This results in a fixed rate of return insulated from market fluctuations during such period, although such return may be affected by currency fluctuations. In the case of repurchase agreements, the prices at which
the trades are conducted do not reflect accrued interest on the underlying obligation. Such agreements usually cover short periods, such as under one week. Repurchase agreements may be construed to be collateralized
loans by the purchaser to the seller secured by the securities transferred to the purchaser.
In the case of a repurchase
agreement, as a purchaser, the Fund will require all repurchase agreements to be fully collateralized at all times by cash or other liquid assets in an amount at least equal to the resale price. The seller is required
to provide additional collateral if the market value of the securities falls below the repurchase price at any time during the term of the repurchase agreement. In the event of default by the seller under a repurchase
agreement construed to be a collateralized loan, the underlying securities are not owned by the Fund but only constitute collateral for the seller's obligation to pay the repurchase price. Therefore, the Fund may
suffer time delays and incur costs or possible losses in connection with disposition of the collateral.
The Fund may participate in a joint
repurchase agreement account with other investment companies managed by the Manager pursuant to an order of the SEC. On a daily basis, any uninvested cash balances of the Fund may be aggregated with those of such
investment companies and invested in one or more repurchase agreements. The Fund participates in the income earned or accrued in the joint account based on the percentage of its investment.
REVERSE REPURCHASE AGREEMENTS AND
DOLLAR ROLLS. The Fund may enter into reverse repurchase agreements. A reverse repurchase agreement involves the sale of a portfolio-eligible security by the Fund, coupled with its agreement to
repurchase the instrument at a specified time and price. See “Repurchase Agreements.”
The Fund may enter into dollar
rolls. In a dollar roll, the Fund sells securities for delivery in the current month and simultaneously contracts to repurchase substantially similar (same type and coupon) securities on a specified future date from
the same party. During the roll period, the Fund forgoes principal and interest paid on the securities. The Fund is compensated by the difference between the current sale price and the forward price for the future
purchase (often referred to as the drop) as well as by the interest earned on the cash proceeds of the initial sale. The Fund will segregate cash or other liquid assets, marked to market daily, having a value equal to
the obligations of the Fund in respect of dollar rolls.
Dollar rolls involve the risk that
the market value of the securities retained by the Fund may decline below the price of the securities sold by the Fund but which the Fund is obligated to repurchase under the agreement. In the event the buyer of
securities under a dollar roll files for bankruptcy or becomes insolvent, the Fund’s use of the proceeds of the agreement may be restricted pending a determination by the other party, or its trustee or receiver,
whether to enforce the Fund’s obligation to repurchase the securities. Cash proceeds from dollar rolls may be invested in cash or other liquid assets.
SECURITIES LENDING. Unless otherwise noted, the Fund may lend its portfolio securities to brokers, dealers and other financial institutions subject to applicable regulatory requirements and guidance,
including the requirements that: (1) the aggregate market value of securities loaned will not at any time exceed 33 1/3% of the total assets of the Fund; (2) the borrower pledge and maintain with the Fund collateral
consisting of cash, an irrevocable letter of credit, or securities issued or guaranteed by the US government
Prudential Investment Portfolios
16 24
having at all times a value of not less than 100%
of the value of the securities lent; and (3) the loan be made subject to termination by the Fund at any time. Prudential Investment Management, Inc. (PIM), an affiliate of the Fund’s investment manager, serves
as securities lending agent for the Fund, and in that role administers the Fund’s securities lending program. As compensation for these services, PIM receives a portion of any amounts earned by the Fund through
lending securities.
The Fund may invest the cash
collateral and/or it may receive a fee from the borrower. To the extent that cash collateral is invested, it will be invested in an affiliated money market fund and be subject to market depreciation or appreciation.
The Fund will be responsible for any loss that results from this investment of collateral.
On termination of the loan, the
borrower is required to return the securities to the Fund, and any gain or loss in the market price during the loan would inure to the Fund. If the borrower defaults on its obligation to return the securities lent
because of insolvency or other reasons, the Fund could experience delays and costs in recovering the securities lent or in gaining access to the collateral. In such situations, the Fund may sell the collateral and
purchase a replacement investment in the market. There is a risk that the value of the collateral could decrease below the value of the replacement investment by the time the replacement investment is purchased.
During the time portfolio
securities are on loan, the borrower will pay the Fund an amount equivalent to any dividend or interest paid on such securities. Voting or consent rights which accompany loaned securities pass to the borrower.
However, all loans may be terminated at any time to facilitate the exercise of voting or other consent rights with respect to matters considered to be material. The Fund bears the risk that there may be a delay in the
return of the securities which may impair the Fund’s ability to exercise such rights.
SECURITIES OF SMALLER OR EMERGING
GROWTH COMPANIES. Investment in smaller or emerging growth companies involves greater risk than is customarily associated with investments in more established companies. The securities of smaller or
emerging growth companies may be subject to more abrupt or erratic market movements than larger, more established companies or the market average in general. These companies may have limited product lines, markets or
financial resources, or they may be dependent on a limited management group.
While smaller or emerging growth
company issuers may offer greater opportunities for capital appreciation than large cap issuers, investments in smaller or emerging growth companies may involve greater risks and thus may be considered speculative.
The subadviser believes that properly selected companies of this type have the potential to increase their earnings or market valuation at a rate substantially in excess of the general growth of the economy. Full
development of these companies and trends frequently takes time.
Small cap and emerging growth
securities will often be traded only in the OTC market or on a regional securities exchange and may not be traded every day or in the volume typical of trading on a national securities exchange. As a result, the
disposition by the Fund of portfolio securities to meet redemptions or otherwise may require the Fund to make many small sales over a lengthy period of time, or to sell these securities at a discount from market
prices or during periods when, in the subadviser's judgment, such disposition is not desirable.
While the process of selection and
continuous supervision by the subadviser does not, of course, guarantee successful investment results, it does provide access to an asset class not available to the average individual due to the time and cost
involved. Careful initial selection is particularly important in this area as many new enterprises have promise but lack certain of the fundamental factors necessary to prosper. Investing in small cap and emerging
growth companies requires specialized research and analysis. In addition, many investors cannot invest sufficient assets in such companies to provide wide diversification.
Small companies are generally
little known to most individual investors although some may be dominant in their respective industries. The subadviser believes that relatively small companies will continue to have the opportunity to develop into
significant business enterprises. The Fund may invest in securities of small issuers in the relatively early stages of business development that have a new technology, a unique or proprietary product or service, or a
favorable market position. Such companies may not be counted upon to develop into major industrial companies, but Fund management believes that eventual recognition of their special value characteristics by the
investment community can provide above-average long-term growth to the portfolio.
Equity securities of specific small
cap issuers may present different opportunities for long-term capital appreciation during varying portions of economic or securities markets cycles, as well as during varying stages of their business development. The
market valuation of small cap issuers tends to fluctuate during economic or market cycles, presenting attractive investment opportunities at various points during these cycles. Smaller companies, due to the size and
kinds of markets that they serve, may be less susceptible than large companies to intervention from the federal government by means of price controls, regulations or litigation.
25
SHORT SALES AND
SHORT SALES AGAINST-THE-BOX. The Fund may make short sales of securities, either as a hedge against potential declines in value of a portfolio security or to realize appreciation when a security that the Fund does not
own declines in value. Because making short sales in securities not owned by the Fund exposes the Fund to the risks associated with those securities, such short sales involve speculative exposure risk. As a result, if
the Fund makes short sales in securities that increase in value, the Fund will likely underperform similar mutual funds that do not make short sales in securities they do not own. The Fund will incur a loss as a
result of a short sale if the price of the security increases between the date of the short sale and the date on which the Fund replaces the borrowed security. The Fund will realize a gain if the security declines in
price between those dates. There can be no assurance that the Fund will be able to close out a short sale position at any particular time or at a desired price. Although the Fund’s gain is limited to the price
at which the Fund sold the security short, its potential loss is limited only by the maximum attainable price of the security, less the price at which the security was sold and may, theoretically, be unlimited. There
is also a risk that a borrowed security will need to be returned to the broker/dealer on short notice. If the request for the return of a security occurs at a time when other short sellers of the security are
receiving similar requests, a “short squeeze” can occur, meaning that the Fund might be compelled, at the most disadvantageous time, to replace the borrowed security with a security purchased on the open
market, possibly at prices significantly in excess of the proceeds received earlier.
The Fund has a short position in
the securities sold short until it delivers to the broker/dealer the securities sold, at which time the Fund receives the proceeds of the sale. In addition, the Fund is required to pay to the broker/dealer the amount
of any dividends or interest paid on shares sold short. The Fund will normally close out a short position by purchasing on the open market and delivering to the broker/dealer an equal amount of the securities sold
short.
The Fund may also make short sales
against-the-box. A short sale against-the-box is a short sale in which the Fund owns an equal amount of the securities sold short, or securities convertible or exchangeable for, with or without payment of any further
consideration, such securities. However, if further consideration is required in connection with the conversion or exchange, cash or other liquid assets, in an amount equal to such consideration, must be segregated on
the Fund’s records or with its Custodian.
SOVEREIGN DEBT. Investment in sovereign debt can involve a high degree of risk. The governmental entity that controls the repayment of sovereign debt may not be able or willing to repay the principal
and/or interest when due in accordance with the terms of such debt. A governmental entity's willingness or ability to repay principal and interest due in a timely manner may be affected by, among other factors, its
cash flow situation, the extent of its foreign reserves, the availability of sufficient foreign exchange on the date a payment is due, the relative size of the debt service burden to the economy as a whole, the
governmental entity's policy towards the International Monetary Fund and the political constraints to which a governmental entity may be subject. Governmental entities may also be dependent on expected disbursements
from foreign governments, multilateral agencies and others abroad to reduce principal and interest arrearages on their debt. The commitment on the part of these governments, agencies and others to make such
disbursements may be conditioned on the implementation of economic reforms and/or economic performance and the timely service of such debtor's obligations. Failure to implement such reforms, achieve such levels of
economic performance or repay principal or interest when due may result in the cancellation of such third parties' commitments to lend funds to the governmental entity, which may further impair such debtor's ability
or willingness to timely service its debts. Consequently, governmental entities may default on their sovereign debt. Holders of sovereign debt may be requested to participate in the rescheduling of such debt and to
extend further loans to governmental entities. In the event of a default by a governmental entity, there may be few or no effective legal remedies for collecting on such debt.
STANDBY COMMITMENT AGREEMENTS. The Fund may enter into standby commitment agreements. These agreements commit the Fund, for a stated period of time, to purchase a stated amount of securities that may be issued and sold
to the Fund at the option of the issuer. The price of the security is fixed at the time of the commitment. At the time of entering into the agreement the Fund is paid a commitment fee, regardless of whether or not the
security is ultimately issued. The Fund will enter into such agreements for the purpose of investing in the security underlying the commitment at a price that is considered advantageous to the Fund. The Fund will
limit investment in such commitments so that the aggregate purchase price of securities subject to such commitments, together with the value of portfolio securities subject to legal restrictions on resale that affect
their marketability, will not exceed 15% of its net assets taken at the time of the commitment. Liquid assets are segregated by the Fund in an aggregate amount equal to the purchase price of the securities underlying
the commitment. There can be no assurance that the securities subject to a standby commitment will be issued, and the value of the security, if issued, on the delivery date may be more or less than its purchase price.
Since the issuance of the security underlying the commitment is at the option of the issuer, the Fund may bear the risk of a decline in the value of such security and may not benefit from any appreciation in the value
of the security during the commitment period. The purchase of a security subject to a standby commitment agreement and the related commitment fee will be recorded on the date on which the security can reasonably be
expected to be issued, and the value of the security thereafter will be reflected in the calculation of the Fund’s NAV. The cost basis of the security will be adjusted by the amount of the commitment fee. In the
event the security is not issued, the commitment fee will be recorded as income on the expiration date of the standby commitment.
Prudential Investment Portfolios
16 26
STRIPPED SECURITIES. Stripped securities are created when the issuer separates the interest and principal components of an instrument and sells them as separate securities. In general, one security is entitled
to receive the interest payments on the underlying assets (the interest only or “IO” security) and the other to receive the principal payments (the principal only or “PO” security). Some
stripped securities may receive a combination of interest and principal payments. The yields to maturity on IOs and POs are sensitive to the expected or anticipated rate of principal payments (including prepayments)
on the related underlying assets, and principal payments may have a material effect on yield to maturity. If the underlying assets experience greater than anticipated prepayments of principal, the Fund may not fully
recoup its initial investment in IOs. Conversely, if the underlying assets experience less than anticipated prepayments of principal, the yield on POs could be adversely affected. Stripped securities may be highly
sensitive to changes in interest rates and rates of prepayment.
STRUCTURED NOTES / STRUCTURED
SECURITIES. The Fund may invest in structured securities, including participation notes, structured notes, low exercise price warrants and other related instruments purchased by the Fund that are
generally privately negotiated financial instruments where the interest or value of the structured security is linked to equity securities or equity indices or other instruments or indices (reference instruments).
Issuers of structured securities include corporations and banks. Structured securities are subject to the creditworthiness of the counterparty of the structured security, and their values may decline substantially if
the counterparty's creditworthiness deteriorates.
Structured securities differ from
debt securities in several aspects. The interest rate or the principal amount payable upon maturity or redemption may increase or decrease, depending upon changes in the value of the reference instrument. The terms of
a structured security may provide that, in certain circumstances, no principal is due at maturity and, therefore, may result in a loss of invested capital by the Fund. Receipt of the reference instrument is also, in
certain circumstances, exchanged upon maturity of the security.
A structured security may be
positively, negatively, or both positively and negatively indexed; that is, its value or interest rate may increase or decrease if the value of the reference instrument increases. Similarly, its value or interest rate
may increase or decrease if the value of the reference instrument decreases. Further, the change in the principal amount payable with respect to, or the interest rate of, a structured security may be calculated as a
multiple of the percentage change (positive or negative) in the value of the underlying reference instrument(s); therefore, the value of such structured security may be very volatile. Also, caps can be placed on the
amount of appreciation with regard to the reference instrument.
Structured securities may entail a
greater degree of market risk because the investor bears the risk of the reference instrument. Structured securities may also be more volatile, less liquid, and more difficult to accurately price than less complex
securities. The secondary market for structured securities could be illiquid, making them difficult to sell when the Fund determines to sell them. The possible lack of a liquid secondary market for structured
securities and the resulting inability of the Fund to sell a structured security could expose the Fund to losses and could make structured securities more difficult for the Fund to value accurately.
SUPRANATIONAL ENTITIES. The Fund may invest in debt securities of supranational entities. Examples include the World Bank, the European Steel and Coal Community, the Asian Development Bank and the Inter-American
Development Bank. The government members, or “stockholders,” usually make initial capital contributions to the supranational entity and in many cases are committed to make additional capital contributions
if the supranational entity is unable to repay its borrowings.
YANKEE OBLIGATIONS. The Fund may invest in US dollar-denominated debt securities of foreign corporations issued in the United States and US dollar-denominated debt securities issued or guaranteed as to
payment of principal and interest by governments, quasi-governmental entities, government agencies, and other governmental entities of foreign countries and supranational entities, which securities are issued in the
United States (Yankee obligations). Debt securities of quasi-governmental entities are issued by entities owned by either a national, state or equivalent government or are obligations of a political unit that is not
backed by the national government’s full faith and credit and general taxing powers. These include, among others, the Province of Ontario and the City of Tokyo.
TEMPORARY DEFENSIVE STRATEGY AND
SHORT-TERM INVESTMENTS. The Fund may temporarily invest without limit in money market instruments, including commercial paper of US corporations, certificates of deposit, bankers' acceptances and other
obligations of domestic banks, and obligations issued or guaranteed by the US Government, its agencies or its instrumentalities, as part of a temporary defensive strategy.
The Fund may invest in money market
instruments to maintain appropriate liquidity to meet anticipated redemptions. Money market instruments typically have a maturity of one year or less as measured from the date of purchase. The Fund also may
temporarily hold cash or invest in money market instruments pending investment of proceeds from new sales of Fund shares or during periods of portfolio restructuring.
27
UTILITY INDUSTRIES. Risks that are intrinsic to the utility industries include difficulty in obtaining an adequate return on invested capital, difficulty in financing large construction programs during an
inflationary period, restrictions on operations and increased cost and delays attributable to environmental considerations and regulation, difficulty in raising capital in adequate amounts on reasonable terms in
periods of high inflation and unsettled capital markets, technological innovations that may render existing plants, equipment or products obsolete, the potential impact of natural or man-made disasters, increased
costs and reduced availability of certain types of fuel, occasionally reduced availability and high costs of natural gas for resale, the effects of energy conservation, the effects of a national energy policy and
lengthy delays and greatly increased costs and other problems associated with the design, construction, licensing, regulation and operation of nuclear facilities for electric generation, including, among other
considerations, the problems associated with the use of radioactive materials and the disposal of radioactive wastes. There are substantial differences between the regulatory practices and policies of various
jurisdictions, and any given regulatory agency may make major shifts in policy from time to time. There is no assurance that regulatory authorities will, in the future, grant rate increases or that such increases will
be adequate to permit the payment of dividends on common stocks. Additionally, existing and possible future regulatory legislation may make it even more difficult for these utilities to obtain adequate relief. Certain
of the issuers of securities held in the Fund’s portfolio may own or operate nuclear generating facilities. Governmental authorities may from time to time review existing policies and impose additional
requirements governing the licensing, construction and operation of nuclear power plants. Prolonged changes in climatic conditions can also have a significant impact on both the revenues of an electric and gas utility
as well as the expenses of a utility, particularly a hydro-based electric utility.
Utility companies in the United
States and in foreign countries are generally subject to regulation. In the United States, most utility companies are regulated by state and/or federal authorities. Such regulation is intended to ensure appropriate
standards of service and adequate capacity to meet public demand. Generally, prices are also regulated in the United States and in foreign countries with the intention of protecting the public while ensuring that the
rate of return earned by utility companies is sufficient to allow them to attract capital in order to grow and continue to provide appropriate services. There can be no assurance that such pricing policies or rates of
return will continue in the future.
The nature of regulation of the
utility industries continues to evolve both in the United States and in foreign countries. In recent years, changes in regulation in the United States increasingly have allowed utility companies to provide services
and products outside their traditional geographic areas and lines of business, creating new areas of competition within the industries. In some instances, utility companies are operating on an unregulated basis.
Because of trends toward deregulation and the evolution of independent power producers as well as new entrants to the field of telecommunications, non-regulated providers of utility services have become a significant
part of their respective industries. The subadviser believes that the emergence of competition and deregulation will result in certain utility companies being able to earn more than their traditional regulated rates
of return, while others may be forced to defend their core business from increased competition and may be less profitable. Reduced profitability, as well as new uses of funds (such as for expansion, operations or
stock buybacks) could result in cuts in dividend payout rates. The subadviser seeks to take advantage of favorable investment opportunities that may arise from these structural changes. Of course, there can be no
assurance that favorable developments will occur in the future.
Foreign utility companies are also
subject to regulation, although such regulations may or may not be comparable to those in the United States. Foreign utility companies may be more heavily regulated by their respective governments than utilities in
the United States and, as in the United States, generally are required to seek government approval for rate increases. In addition, many foreign utilities use fuels that may cause more pollution than those used in the
United States, which may require such utilities to invest in pollution control equipment to meet any proposed pollution restrictions. Foreign regulatory systems vary from country to country and may evolve in ways
different from regulation in the United States.
The Fund’s investment
policies are designed to enable it to capitalize on evolving investment opportunities throughout the world. For example, the rapid growth of certain foreign economies will necessitate expansion of capacity in the
utility industries in those countries. Although many foreign utility companies currently are government-owned, thereby limiting current investment opportunities for the Fund, the subadviser believes that, in order to
attract significant capital for growth, foreign governments are likely to seek global investors through the privatization of their utility industries. Privatization, which refers to the trend toward investor ownership
of assets rather than government ownership, is expected to occur in newer, faster-growing economies and in mature economies. Of course, there is no assurance that such favorable developments will occur or that
investment opportunities in foreign markets for the Fund will increase.
The revenues of domestic and
foreign utility companies generally reflect the economic growth and development in the geographic areas in which they do business.
Prudential Investment Portfolios
16 28
Electric. The electric utility industry consists of companies that are engaged principally in the generation, transmission and sale of electric energy, although many also provide other
energy-related services. In the past, electric utility companies, in general, have been favorably affected by lower fuel and financing costs and the full or near completion of major construction programs. In addition,
many of these companies have generated cash flows in excess of current operating expenses and construction expenditures, permitting some degree of diversification into unregulated businesses. Some electric utilities
have also taken advantage of the right to sell power outside of their traditional geographic areas. Electric utility companies have historically been subject to the risks associated with increases in fuel and other
operating costs, high interest costs on borrowings needed for capital construction programs, costs associated with compliance with environmental and safety regulations and changes in the regulatory climate. As
interest rates declined, many utilities refinanced high cost debt and in doing so improved their fixed charges coverage. Regulators, however, lowered allowed rates of return as interest rates declined and thereby
caused the benefits of the rate declines to be shared wholly or in part with customers. In a period of rising interest rates, the allowed rates of return may not keep pace with the utilities’ increased costs.
The construction and operation of nuclear power facilities are subject to increased scrutiny by, and evolving regulations of, the Nuclear Regulatory Commission and state agencies having comparable jurisdiction.
Increased scrutiny might result in higher operating costs and higher capital expenditures, with the risk that the regulators may disallow inclusion of these costs in rate authorizations or the risk that a company may
not be permitted to operate or complete construction of a facility. In addition, operators of nuclear power plants may be subject to significant costs for disposal of nuclear fuel and for decommissioning such
plants.
The rating agencies look closely at
the business profile of utilities. Ratings for companies are expected to be impacted to a greater extent in the future by the division of their asset base. Electric utility companies that focus more on the generation
of electricity may be assigned less favorable ratings as this business is expected to be competitive and the least regulated. On the other hand, companies that focus on transmission and distribution which is expected
to be the least competitive and the more regulated part of the business may see higher ratings given the greater predictability of cash flow.
A number of states are considering
or have enacted deregulation proposals. The introduction of competition into the industry as a result of such deregulation has at times resulted in lower revenue, lower credit ratings, increased default risk, and
lower electric utility security prices. Such increased competition may also cause long-term contracts, which electric utilities previously entered into to buy power, to become “stranded assets,” which have
no economic value. Any loss associated with such contracts must be absorbed by ratepayers and investors. In addition, in anticipation of increasing competition, some electric utilities have acquired electric utilities
overseas to diversify, enhance earnings and gain experience in operating in a deregulated environment. In some instances, such acquisitions have involved significant borrowings, which have burdened the
acquirer’s balance sheet. There is no assurance that current deregulation proposals will be adopted. However, deregulation in any form could significantly impact the electric utilities industry.
Telecommunications. The telecommunications industry today includes both traditional telephone companies, with a history of broad market coverage and highly regulated businesses, and cable companies, which
began as small, lightly regulated businesses focused on limited markets. Today these two historically different businesses are converging in an industry that is trending toward larger, competitive, national and
international markets with an emphasis on deregulation. Companies that distribute telephone services and provide access to the telephone networks still comprise the greatest portion of this segment, but non-regulated
activities such as wireless telephone services, paging, data transmission and processing, equipment retailing, computer software and hardware and internet services are becoming increasingly significant components as
well. In particular, wireless and internet telephone services continue to gain market share at the expense of traditional telephone companies. The presence of unregulated companies in this industry and the entry of
traditional telephone companies into unregulated or less regulated businesses provide significant investment opportunities with companies which may increase their earnings at faster rates than had been allowed in
traditional regulated businesses. Still, increasing competition, technological innovations and other structural changes could adversely affect the profitability of such utilities and the growth rate of their
dividends. Given mergers and proposed legislation and enforcement changes, it is likely that both traditional telephone companies and cable companies will continue to provide an expanding range of utility services to
both residential, corporate and governmental customers.
Gas. Gas transmission companies and gas distribution companies are undergoing significant changes. In the United States, interstate transmission companies are regulated by the Federal Energy
Regulatory Commission, which is reducing its regulation of the industry. Many companies have diversified into oil and gas exploration and development, making returns more sensitive to energy prices. In the recent
decade, gas utility companies have been adversely affected by disruptions in the oil industry and have also been affected by increased concentration and competition. In the opinion of the subadviser, however,
environmental considerations could improve the gas industry outlook in the future. For example, natural gas is the cleanest of the hydrocarbon fuels, and this may result in incremental shifts in fuel consumption
toward natural gas and away from oil and coal, even for electricity generation. However, technological or regulatory changes within the industry may delay or prevent this result.
29
Water. Water supply utilities are companies that collect, purify, distribute and sell water. In the United States and around the world the industry is highly fragmented because most of the
supplies are owned by local authorities. Companies in this industry are generally mature and are experiencing little or no per capita volume growth. In the opinion of the subadviser, there may be opportunities for
certain companies to acquire other water utility companies and for foreign acquisition of domestic companies. The subadviser believes that favorable investment opportunities may result from consolidation of this
segment. As with other utilities, however, increased regulation, increased costs and potential disruptions in supply may adversely affect investments in water supply utilities. There can be no assurance that the
positive developments noted above, including those relating to privatization and changing regulation, will occur or that risk factors other than those noted above will not develop in the future.
WARRANTS AND RIGHTS. Warrants and rights are securities permitting, but not obligating, the warrant holder to subscribe for other securities. Buying a warrant does not make the Fund a shareholder of the
underlying stock. The warrant holder has no right to dividends or votes on the underlying stock. A warrant does not carry any right to assets of the issuer, and for this reason investment in warrants may be more
speculative than other equity-based investments.
WHEN-ISSUED SECURITIES, DELAYED
DELIVERY SECURITIES AND FORWARD COMMITMENTS. The Fund may purchase or sell securities that the Fund is entitled to receive on a when-issued basis. The Fund may also purchase or sell securities on a delayed delivery basis or through a
forward commitment. These transactions involve the purchase or sale of securities by the Fund at an established price with payment and delivery taking place in the future. The Fund enters into these transactions to
obtain what is considered an advantageous price to the Fund at the time of entering into the transaction. The Fund has not established any limit on the percentage of its assets that may be committed in connection with
these transactions. When the Fund purchases securities in these transactions, the Fund segregates liquid securities in an amount equal to the amount of its purchase commitments.
There can be no assurance that a
security purchased on a when-issued basis will be issued or that a security purchased or sold through a forward commitment will be delivered. The value of securities in these transactions on the delivery date may be
more or less than the Fund’s purchase price. The Fund may bear the risk of a decline in the value of the security in these transactions and may not benefit from an appreciation in the value of the security
during the commitment period.
US GOVERNMENT SECURITIES. The Fund may invest in adjustable rate and fixed rate US Government securities. US Government securities are instruments issued or guaranteed by the US Treasury or by an agency or
instrumentality of the US Government. US Government guarantees do not extend to the yield or value of the securities or the Fund’s shares. Not all US Government securities are backed by the full faith and credit
of the United States. Some are supported only by the credit of the issuing agency.
US Treasury securities include
bills, notes, bonds and other debt securities issued by the US Treasury. These instruments are direct obligations of the US Government and, as such, are backed by the full faith and credit of the United States. They
differ primarily in their interest rates, the lengths of their maturities and the dates of their issuances.
Securities issued by agencies of
the US Government or instrumentalities of the US Government, including those which are guaranteed by Federal agencies or instrumentalities, may or may not be backed by the full faith and credit of the United States.
Obligations of Ginnie Mae, the Farmers Home Administration and the Small Business Administration are backed by the full faith and credit of the United States. In the case of securities not backed by the full faith and
credit of the United States, the Fund must look principally to the agency issuing or guaranteeing the obligation for ultimate repayment and may not be able to assert a claim against the United States if the agency or
instrumentality does not meet its commitments.
The Fund may also invest in
component parts of US Government securities, namely either the corpus (principal) of such obligations or one or more of the interest payments scheduled to be paid on such obligations. These obligations may take the
form of (1) obligations from which the interest coupons have been stripped; (2) the interest coupons that are stripped; (3) book-entries at a Federal Reserve member bank representing ownership of obligation components;
or (4) receipts evidencing the component parts (corpus or coupons) of US Government obligations that have not actually been stripped. Such receipts evidence ownership of component parts of US Government obligations
(corpus or coupons) purchased by a third party (typically an investment banking firm) and held on behalf of the third party in physical or book-entry form by a major commercial bank or trust company pursuant to a
custody agreement with the third party. The Fund may also invest in custodial receipts held by a third party that are not US Government securities.
ZERO COUPON SECURITIES, PAY-IN-KIND
SECURITIES AND DEFERRED PAYMENT SECURITIES. The Fund may invest in zero coupon securities. Zero coupon securities are securities that are sold at a discount to par value and on which interest payments are not made during the life of
the security. The discount approximates the total amount of interest the security will accrue and compound over the period until maturity on the particular interest payment date at a rate of interest reflecting the
market rate of the security at the time of issuance. Upon maturity, the holder is entitled to receive the par value of the security. While interest payments are not made on such securities, holders of such securities
are deemed to have received income (“phantom income”) annually, notwithstanding that
Prudential Investment Portfolios
16 30
cash may not be received currently. To the extent a
distribution is paid, there may be uncertainty about the source of the distribution. The effect of owning instruments that do not make current interest payments is that a fixed yield is earned not only on the original
investment but also, in effect, on all discount accretion during the life of the obligations. This implicit reinvestment of earnings at the same rate eliminates the risk of being unable to invest distributions at a
rate as high as the implicit yield on the zero coupon bond, but at the same time eliminates the holder's ability to reinvest at higher rates in the future. For this reason, some of these securities may be subject to
substantially greater price fluctuations during periods of changing market interest rates than are comparable securities that pay interest currently, which fluctuation increases the longer the period to maturity.
These investments benefit the issuer by mitigating its need for cash to meet debt service, but also require a higher rate of return to attract investors who are willing to defer receipt of cash. Because these
securities do not pay current cash income, their price can be volatile when interest rates fluctuate and an investment in these securities generally has a greater potential for complete loss of principal and/or return
than an investment in debt securities that make periodic interest payments. Such investments are more vulnerable to the creditworthiness of the issuer and any other parties upon which performance relies. If the issuer
defaults, the Fund may not obtain any return on its investment. These securities may be subject to less liquidity in the event of adverse market conditions than comparably rated securities that pay cash interest at
regular intervals. The Fund accrues income with respect to these securities for federal income tax and accounting purposes prior to the receipt of cash payments.
Pay-in-kind securities are
securities that have interest payable by delivery of additional securities. Upon maturity, the holder is entitled to receive the aggregate par value of the securities. Deferred payment securities are securities that
remain a zero coupon security until a predetermined date, at which time the stated coupon rate becomes effective and interest becomes payable at regular intervals. Pay-in-kind and deferred payment securities may be
subject to greater fluctuation in value and lesser liquidity in the event of adverse market conditions than comparable rated securities paying cash interest at regular intervals.
In addition to the above described
risks, there are certain other risks related to investing in zero coupon, pay-in-kind and deferred payment securities. During a period of severe market conditions, the market for such securities may become even less
liquid. In addition, as these securities do not pay cash interest, the Fund’s investment exposure to these securities and their risks, including credit risk, will increase during the time these securities are
held in the Fund’s portfolio. Further, to maintain its qualification for pass-through treatment under the federal tax laws, the Fund is required to distribute income to its shareholders and, consequently, may
have to dispose of its portfolio securities under disadvantageous circumstances to generate the cash, or may have to leverage itself by borrowing the cash to satisfy these distributions, as they relate to the
distribution of phantom income and the value of the paid-in-kind interest. The required distributions will result in an increase in the Fund’s exposure to such securities.
INVESTMENT RESTRICTIONS
The Fund has adopted the
restrictions listed below as fundamental policies. Under the 1940 Act, a fundamental policy is one which cannot be changed without the approval of the holders of a majority of the Fund’s outstanding voting
securities. A “majority of the Fund’s outstanding voting securities,” when used in this SAI, means the lesser of (i) 67% of the voting shares represented at a meeting at which more than 50% of the
outstanding voting shares are present in person or represented by proxy or (ii) more than 50% of the outstanding voting shares.
The Fund may not:
1. Purchase the securities of any
issuer if, as a result, the Fund would fail to be a diversified company within the meaning of the 1940 Act, and the rules and regulations promulgated thereunder, as such statute, rules and regulations are amended from
time to time or are interpreted from time to time by the SEC staff (collectively, the 1940 Act Laws and Interpretations) or to the extent that the Fund may be permitted to do so by exemptive order or similar relief
(collectively, with the 1940 Act Laws and Interpretations, the 1940 Act Laws, Interpretations and Exemptions). The Fund is a “diversified company” as defined in the 1940 Act.
2. Issue senior securities or
borrow money or pledge its assets, except as permitted by the 1940 Act Laws, Interpretations and Exemptions.
3. Buy or sell real estate, except
that investments in securities of issuers that invest in real estate and investments in mortgage-backed securities, mortgage participations or other instruments supported by interests in real estate are not subject to
this limitation, and except that the Fund may exercise rights under agreements relating to such securities, including the right to enforce security interests and to hold real estate acquired by reason of such
enforcement until that real estate can be liquidated in an orderly manner.
4. Make loans, except through loans
of assets of the Fund or through repurchase agreements, provided that for purposes of this limitation, the acquisition of bonds, debentures, other debt securities or instruments, or participations or other interests
therein and investments in government obligations, commercial paper, certificates of deposit, bankers’ acceptances or similar instruments will not be considered the making of a loan.
31
5. Purchase any security if as a
result 25% or more of the Fund’s total assets would be invested in the securities of issuers having their principal business activities in the same industry, except for temporary defensive purposes, and except
that this limitation does not apply to securities issued or guaranteed by the U.S. government, its agencies or instrumentalities.
6. Act as underwriter except to the
extent that, in connection with the disposition of portfolio securities, it may be deemed to be an underwriter under certain federal securities laws. The Fund may purchase restricted securities without limit.
For purposes of investment
restriction number 1, the Fund may not purchase any security (other than obligations of the U.S. government, its agencies or instrumentalities) if as a result: (i) with respect to 75% of a Fund’s total assets,
more than 5% of such assets (determined at the time of investment) would then be invested in securities of a single issuer, or (ii ) 25% or more of the Fund’s total assets (determined at the time of investment)
would be invested in a single industry.
For purposes of investment
restriction number 2, under the 1940 Act, the Fund can borrow money from a bank provided that immediately after such borrowing there is asset coverage of at least 300% for all borrowings. If the asset coverage falls
below 300%, the Fund must, within three business days, reduce the amount of its borrowings to satisfy the 300% requirement.
Whenever any fundamental investment
policy or investment restriction states a maximum percentage of the Fund’s assets, it is intended that if the percentage limitation is met at the time the investment is made, a later change in percentage
resulting from changing total or NAV will not be considered a violation of such policy. As a matter of non-fundamental operating policy, a Fund will not purchase rights if as a result the Fund would then have more
than 5% of its assets (determined at the time of investment) invested in rights.
Prudential Investment Portfolios
16 32
INFORMATION ABOUT BOARD MEMBERS
AND OFFICERS
Information about Board Members and
Officers of the Fund is set forth below. Board Members who are not deemed to be “interested persons” of the Fund, as defined in the 1940 Act, are referred to as “Independent Board Members.”
Board Members who are deemed to be “interested persons” of the Fund are referred to as “Interested Board Members.” The Board Members are responsible for the overall supervision of the
operations of the Fund and perform the various duties imposed on the directors of investment companies by the 1940 Act. The Board in turn elects the Officers, who are responsible for administering the day-to-day
operations of the Fund.
| Independent Board Members(1) | ||
| Name, Address, Age Position(s) Portfolios Overseen |
Principal Occupation(s) During Past Five Years | Other Directorships Held |
| Ellen S. Alberding (56) Board Member Portfolios Overseen: 69 |
President and Board Member, The Joyce Foundation (charitable foundation) (since 2002); Vice Chair, City Colleges of Chicago (community college system) (since 2011); Trustee, Skills for America’s Future (national initiative to connect employers to community colleges) (since 2011); Trustee, National Park Foundation (charitable foundation for national park system) (since 2009); Trustee, Economic Club of Chicago (since 2009). | None. |
| Kevin J. Bannon (62) Board Member Portfolios Overseen: 70 |
Managing Director (since April 2008) and Chief Investment Officer (October 2008-November 2013) of Highmount Capital LLC (registered investment adviser); formerly Executive Vice President and Chief Investment Officer (April 1993-August 2007) of Bank of New York Company; President (May 2003-May 2007) of BNY Hamilton Family of Mutual Funds. | Director of Urstadt Biddle Properties (equity real estate investment trust) (since September 2008). |
| Linda W. Bynoe (62) Board Member Portfolios Overseen: 70 |
President and Chief Executive Officer (since March 1995) and formerly Chief Operating Officer (December 1989-February 1995) of Telemat Ltd. (management consulting); formerly Vice President (January 1985-June 1989) at Morgan Stanley & Co. (broker-dealer). | Director of Simon Property Group, Inc. (retail real estate) (May 2003-May 2012); Director of Anixter International, Inc. (communication products distributor) (since January 2006); Director of Northern Trust Corporation (financial services) (since April 2006); Trustee of Equity Residential (residential real estate) (since December 2009). |
| Keith F. Hartstein (58) Board Member Portfolios Overseen: 70 |
Retired; Member (since November 2014) of the Governing Council of the Independent Directors Council (organization of independent mutual fund directors); formerly President and Chief Executive Officer (2005-2012), Senior Vice President (2004-2005), Senior Vice President of Sales and Marketing (1997-2004), and various executive management positions (1990-1997), John Hancock Funds, LLC (asset management); Chairman, Investment Company Institute’s Sales Force Marketing Committee (2003-2008). | None. |
| Michael S. Hyland, CFA (69) Board Member Portfolios Overseen: 69 |
Retired (since February 2005); formerly Senior Managing Director (July 2001-February 2005) of Bear Stearns & Co, Inc.; Global Partner, INVESCO (1999-2001); Managing Director and President of Salomon Brothers Asset Management (1989-1999). | None. |
| Douglas H. McCorkindale (75) Board Member Portfolios Overseen: 69 |
Retired; formerly Chairman (February 2001-June 2006), Chief Executive Officer (June 2000-July 2005), President (September 1997-July 2005) and Vice Chairman (March 1984-May 2000) of Gannett Co. Inc. (publishing and media). | Director of Lockheed Martin Corp. (aerospace and defense) (since May 2001). |
| Stephen P. Munn (72) Board Member Portfolios Overseen: 70 |
Lead Director (since 2007) and formerly Chairman (1993-2007) of Carlisle Companies Incorporated (manufacturer of industrial products). | Lead Director (since 2007) of Carlisle Companies Incorporated (manufacturer of industrial products). |
| James E. Quinn (62) Board Member Portfolios Overseen: 69 |
Retired; formerly President (2003-2012) and Director (2003-2008), and Vice Chairman and Director (1998-2003), Tiffany & Company (jewelry retailing); Director, Mutual of America Capital Management Corporation (asset management) (since 1996); Director, Hofstra University (since 2008); Vice Chairman, Museum of the City of New York (since 1994). | Director of Deckers Outdoor Corporation (footwear manufacturer) (since 2011). |
| Richard A. Redeker (71) Board Member & Independent Chair Portfolios Overseen: 70 |
Retired Mutual Fund Senior Executive (44 years); Management Consultant; Director, Mutual Fund Directors Forum (since 2014); Independent Directors Council (organization of independent mutual fund directors)-Executive Committee, Chair of Policy Steering Committee, Governing Council. | None. |
33
| Independent Board Members(1) | ||
| Name, Address, Age Position(s) Portfolios Overseen |
Principal Occupation(s) During Past Five Years | Other Directorships Held |
| Robin B. Smith (75) Board Member Portfolios Overseen:70 |
Chairman of the Board (since January 2003) of Publishers Clearing House (direct marketing); Member of the Board of Directors of ADLPartner (marketing) (since December 2010); formerly Chairman and Chief Executive Officer (August 1996-January 2003) of Publishers Clearing House. | Formerly Director of BellSouth Corporation (telecommunications) (1992-2006). |
| Stephen G. Stoneburn (71) Board Member Portfolios Overseen: 70 |
Chairman, (since July 2011), President and Chief Executive Officer (since June 1996) of Quadrant Media Corp. (publishing company); formerly President (June 1995-June 1996) of Argus Integrated Media, Inc.; Senior Vice President and Managing Director (January 1993-1995) of Cowles Business Media; Senior Vice President of Fairchild Publications, Inc. (1975-1989). | None. |
| Interested Board Members(1) | ||
| Name, Address, Age Position(s) Portfolios Overseen |
Principal Occupation(s) During Past Five Years | Other Directorships Held |
| Stuart S. Parker (52) Board Member & President Portfolios Overseen: 64 |
President of Prudential Investments LLC (since January 2012); Executive Vice President of Prudential Investment Management Services LLC (since December 2012); Executive Vice President of Jennison Associates LLC and Head of Retail Distribution of Prudential Investments LLC (June 2005-December 2011). | None. |
| Scott E. Benjamin (41) Board Member & Vice President Portfolios Overseen: 70 |
Executive Vice President (since June 2009) of Prudential Investments LLC; Executive Vice President (June 2009-June 2012) and Vice President (since June 2012) of Prudential Investment Management Services LLC; Executive Vice President (since September 2009) of AST Investment Services, Inc.; Senior Vice President of Product Development and Marketing, Prudential Investments (since February 2006); Vice President of Product Development and Product Management, Prudential Investments (2003-2006). | None. |
| Grace C. Torres* (55) Board Member Portfolios Overseen: 65 |
Retired; formerly Treasurer and Principal Financial and Accounting Officer of the Prudential Investments Funds, Target Funds, Advanced Series Trust, Prudential Variable Contract Accounts and The Prudential Series Fund (1998-June 2014); Assistant Treasurer (March 1999-June 2014) and Senior Vice President (September 1999-June 2014) of Prudential Investments LLC; Assistant Treasurer (May 2003-June 2014) and Vice President (June 2005-June 2014) of AST Investment Services, Inc.; Senior Vice President and Assistant Treasurer (May 2003-June 2014) of Prudential Annuities Advisory Services, Inc. | None. |
* Note: Prior to her
retirement in 2014, Ms. Torres was employed by Prudential Investments LLC. Due to her prior employment, she is considered to be an “interested person” under the 1940 Act. Ms. Torres is a non-management
Interested Board Member.
(1) The year that each Board Member joined the Funds’ Board is as follows:
Ellen S.
Alberding, 2013; Kevin J. Bannon, 2008; Linda W. Bynoe, 2005; Keith F. Hartstein, 2013; Michael S. Hyland, 2008; Douglas H. McCorkindale, 1998; Stephen P. Munn, 2008; James E. Quinn, 2013; Richard A. Redeker, 2003;
Robin B. Smith, 2003; Stephen G. Stoneburn, 1999; Stuart S. Parker, Board Member and President since 2012; Scott E. Benjamin, Board Member since 2010 and Vice President since 2009’ Grace C. Torres, 2014.
Prudential Investment Portfolios
16 34
| Fund Officers(a) | ||
| Name, Address and Age Position with Fund |
Principal Occupation(s) During Past Five Years | Length of Service as Fund Officer |
| Raymond A. O’Hara (59) Chief Legal Officer |
Vice President and Corporate Counsel (since July 2010) of Prudential Insurance Company of America (Prudential); Vice President (March 2011-Present) of Pruco Life Insurance Company and Pruco Life Insurance Company of New Jersey; Vice President and Corporate Counsel (March 2011-Present) of Prudential Annuities Life Assurance Corporation; Chief Legal Officer of Prudential Investments LLC (since June 2012); Chief Legal Officer of Prudential Mutual Fund Services LLC (since June 2012) and Corporate Counsel of AST Investment Services, Inc. (since June 2012); formerly Assistant Vice President and Corporate Counsel (September 2008-July 2010) of The Hartford Financial Services Group, Inc.; formerly Associate (September 1980-December 1987) and Partner (January 1988–August 2008) of Blazzard & Hasenauer, P.C. (formerly, Blazzard, Grodd & Hasenauer, P.C.). | Since 2012 |
| Chad A. Earnst (39) Chief Compliance Officer |
Chief Compliance Officer (September 2014-Present) of Prudential Investments LLC; Chief Compliance Officer (September 2014-Present) of the Prudential Investments Funds, Target Funds, Advanced Series Trust, The Prudential Series Fund, Prudential's Gibraltar Fund, Inc., Prudential Global Short Duration High Yield Income Fund, Inc., Prudential Short Duration High Yield Fund, Inc. and Prudential Jennison MLP Income Fund, Inc.; formerly Assistant Director (March 2010-August 2014) of the Asset Management Unit, Division of Enforcement, US Securities & Exchange Commission; Assistant Regional Director (January 2010-August 2014), Branch Chief (June 2006–December 2009) and Senior Counsel (April 2003-May 2006) of the Miami Regional Office, Division of Enforcement, US Securities & Exchange Commission. | Since 2014 |
| Deborah A. Docs (56) Secretary |
Vice President and Corporate Counsel (since January 2001) of Prudential; Vice President (since December 1996) and Assistant Secretary (since March 1999) of Prudential Investments LLC; formerly Vice President and Assistant Secretary (May 2003-June 2005) of AST Investment Services, Inc. | Since 2004 |
| Jonathan D. Shain (56) Assistant Secretary |
Vice President and Corporate Counsel (since August 1998) of Prudential; Vice President and Assistant Secretary (since May 2001) of Prudential Investments LLC; Vice President and Assistant Secretary (since February 2001) of Prudential Mutual Fund Services LLC; formerly Vice President and Assistant Secretary (May 2003-June 2005) of AST Investment Services, Inc. | Since 2005 |
| Claudia DiGiacomo (40) Assistant Secretary |
Vice President and Corporate Counsel (since January 2005) of Prudential; Vice President and Assistant Secretary of Prudential Investments LLC (since December 2005); Associate at Sidley Austin Brown & Wood LLP (1999-2004). | Since 2005 |
| Andrew R. French (52) Assistant Secretary |
Vice President and Corporate Counsel (since February 2010) of Prudential; formerly Director and Corporate Counsel (2006-2010) of Prudential; Vice President and Assistant Secretary (since January 2007) of Prudential Investments LLC; Vice President and Assistant Secretary (since January 2007) of Prudential Mutual Fund Services LLC. | Since 2006 |
| Amanda S. Ryan (36) Assistant Secretary |
Director and Corporate Counsel (since March 2012) of Prudential; Director and Assistant Secretary (since June 2012) of Prudential Investments LLC; Associate at Ropes & Gray LLP (2008-2012). | Since 2012 |
| Theresa C. Thompson (52) Deputy Chief Compliance Officer |
Vice President, Compliance, Prudential Investments LLC (since April 2004); and Director, Compliance, Prudential Investments LLC (2001-2004). | Since 2008 |
| Richard W. Kinville (46) Anti-Money Laundering Compliance Officer |
Vice President, Corporate Compliance, Anti-Money Laundering Unit (since January 2005) of Prudential; committee member of the American Council of Life Insurers Anti-Money Laundering and Critical Infrastructure Committee (since January 2007); formerly Investigator and Supervisor in the Special Investigations Unit for the New York Central Mutual Fire Insurance Company (August 1994-January 1999); Investigator in AXA Financial's Internal Audit Department and Manager in AXA's Anti-Money Laundering Office (January 1999-January 2005); first chair of the American Council of Life Insurers Anti-Money Laundering and Critical Infrastructure Committee (June 2007-December 2009). | Since 2011 |
| M. Sadiq Peshimam (50) Treasurer and Principal Financial and Accounting Officer |
Assistant Treasurer of funds in the Prudential Mutual Fund Complex (2006-2014); Vice President (since 2005) of Prudential Investments LLC. | Since 2006 |
| Peter Parrella (56) Assistant Treasurer |
Vice President (since 2007) and Director (2004-2007) within Prudential Mutual Fund Administration; formerly Tax Manager at SSB Citi Fund Management LLC (1997-2004). | Since 2007 |
| Lana Lomuti (47) Assistant Treasurer |
Vice President (since 2007) and Director (2005-2007), within Prudential Mutual Fund Administration; formerly Assistant Treasurer (December 2007-February 2014) of The Greater China Fund, Inc. | Since 2014 |
| Linda McMullin (53) Assistant Treasurer |
Vice President (since 2011) and Director (2008-2011) within Prudential Mutual Fund Administration. | Since 2014 |
(a) Excludes Mr. Parker and Mr. Benjamin, interested Board Members who also serve as President and Vice President, respectively.
Explanatory Notes to Tables:
| ■ | Board Members are deemed to be “Interested,” as defined in the 1940 Act, by reason of their affiliation with Prudential Investments LLC and/or an affiliate of Prudential Investments LLC. |
| ■ | Unless otherwise noted, the address of all Board Members and Officers is c/o Prudential Investments LLC, Gateway Center Three, 100 Mulberry Street, Newark, New Jersey 07102-4077. |
35
| ■ | There is no set term of office for Board Members or Officers. The Board Members have adopted a retirement policy, which calls for the retirement of Board Members on December 31 of the year in which they reach the age of 75. |
| ■ | “Other Directorships Held” includes only directorships of companies required to register or file reports with the SEC under the 1934 Act (that is, “public companies”) or other investment companies registered under the 1940 Act. |
| ■ | “Portfolios Overseen” includes all investment companies managed by Prudential Investments LLC. The investment companies for which Prudential Investments LLC serves as manager include the Prudential Investments Mutual Funds, The Prudential Variable Contract Accounts, Target Mutual Funds, Prudential Short Duration High Yield Fund, Inc., Prudential Global Short Duration High Yield Fund, Inc., The Prudential Series Fund, Prudential's Gibraltar Fund, Inc. and the Advanced Series Trust. |
COMPENSATION OF BOARD MEMBERS AND
OFFICERS. Pursuant to a management agreement with the Fund, the Manager pays all compensation of Fund Officers and employees as well as the fees and expenses of all Interested Board
Members.
The Fund pay each Independent Board
Member annual compensation in addition to certain out-of-pocket expenses. Independent Board Members who serve on Board Committees may receive additional compensation. The amount of annual compensation paid to each
Independent Board Member may change as a result of the introduction of additional funds on whose Boards the Board Member may be asked to serve.
Independent Board Members may defer
receipt of their fees pursuant to a deferred fee agreement with the Fund. Under the terms of the agreement, the Fund accrues deferred Board Members' fees daily which, in turn, accrue interest at a rate equivalent to
the prevailing rate of 90-day US Treasury Bills at the beginning of each calendar quarter or at the daily rate of return of any mutual fund managed by PI chosen by the Board Member. Payment of the interest so accrued
is also deferred and becomes payable at the option of the Board Member. The obligation to make payments of deferred Board Members' fees, together with interest thereon, is a general obligation of the Fund. The Fund
does not have a retirement or pension plan for Board Members.
The following table sets forth the
aggregate compensation paid by the Fund for the most recently completed fiscal year to the Independent Board Members for service on the Board, and the Board of any other investment company in the Fund Complex for the
most recently completed calendar year. Board Members and officers who are “interested persons” of the Fund (as defined in the 1940 Act) do not receive compensation from PI-managed funds and therefore are
not shown in the following table.
| Compensation Received by Independent Board Members | ||||
| Name | Aggregate Fiscal Year Compensation from Fund+ |
Pension or Retirement Benefits Accrued as Part of Fund Expenses |
Estimated Annual Benefits Upon Retirement |
Total Compensation from Fund and Fund Complex for Most Recent Calendar Year |
| Ellen S. Alberding | $410 | None | None | $67,834 (32/67)* |
| Kevin J. Bannon | $410 | None | None | $210,000 (32/67)* |
| Linda W. Bynoe** | $410 | None | None | $210,000 (32/67)* |
| Keith F. Hartstein** | $410 | None | None | $68,834 (32/67)* |
| Michael S. Hyland | $420 | None | None | $216,000 (32/67)* |
| Douglas H. McCorkindale** | $410 | None | None | $208,000 (32/67)* |
| Stephen P. Munn | $420 | None | None | $214,000 (32/67)* |
| James E. Quinn | $410 | None | None | $68,834 (32/67)* |
| Richard A. Redeker | $470 | None | None | $250,000 (32/67)* |
| Robin B. Smith** | $410 | None | None | $208,000 (32/67)* |
| Stephen G. Stoneburn** | $410 | None | None | $212,000(32/67)* |
| Grace C. Torres† | None | None | None | None |
+During 2014, the Fund changed its fiscal
year-end from July 31 to October 31. Compensation shown above is for the period from August 1, 2014 through October 31, 2014.
†Ms. Torres joined the
Board in December 2014. Ms. Torres serves as a non-management Interested Board Member. Non-management Interested Board Members receive compensation from the Fund for their service on the Board.
Explanatory Notes to Board Member Compensation
Table
* Compensation relates to portfolios that
were in existence for any period during 2013. Number of funds and portfolios represent those in existence as of December 31, 2013, and excludes funds that have merged or liquidated during the year. Additionally, the
number of funds and portfolios includes those which have been approved as of December 31, 2013; however, certain of those funds/portfolios may commence operations after that date. No compensation is paid out from such
funds/portfolios.
** Under the Fund Complex’s
deferred fee agreement, certain Board Members have elected to defer all or part of their total compensation. The total amount of deferred compensation accrued during the calendar year ended December 31, 2013,
including investment results during the year on cumulative deferred fees, amounted to $(26,698), $1,068, $584,562, $1,070,182 and $409,269 for Ms. Bynoe, Mr. Hartstein, Mr. McCorkindale, Ms. Smith, and Mr. Stoneburn,
respectively.
BOARD COMMITTEES. The Board has established three standing committees in connection with Fund governance—Audit, Nominating and Governance, and Investment. Information on the membership of each
standing committee and its functions is set forth below.
Prudential Investment Portfolios
16 36
Audit Committee: The Board has determined that each member of the Audit Committee is not an “interested person” as defined in the 1940 Act. The responsibilities of the Audit Committee are to
assist the Board in overseeing the Fund's independent registered public accounting firm, accounting policies and procedures and other areas relating to the Fund's auditing processes. The Audit Committee is responsible
for pre-approving all audit services and any permitted non-audit services to be provided by the independent registered public accounting firm directly to the Fund. The Audit Committee is also responsible for
pre-approving permitted services to be provided by the independent registered public accounting firm to (1) the Manager and (2) any entity in a control relationship with the Manager that provides ongoing services to
the Fund, provided that the engagement of the independent registered public accounting firm relates directly to the operation and financial reporting of the Fund. The scope of the Audit Committee's responsibilities is
oversight. It is management's responsibility to maintain appropriate systems for accounting and internal control and the independent registered public accounting firm's responsibility to plan and carry out an audit in
accordance with the standards of the Public Company Accounting Oversight Board (United States). The number of Audit Committee meetings held during the Fund's most recently completed fiscal year is set forth in the
table below.
The membership of the Audit
Committee is set forth below:
Stephen P. Munn (Chair)
Douglas H. McCorkindale
Kevin J. Bannon
Robin B. Smith
Ellen S. Alberding
James E. Quinn
Richard A. Redeker (ex-officio)
Stephen P. Munn (Chair)
Douglas H. McCorkindale
Kevin J. Bannon
Robin B. Smith
Ellen S. Alberding
James E. Quinn
Richard A. Redeker (ex-officio)
Nominating and Governance
Committee: The Nominating and Governance Committee of the Board is responsible for nominating Board Members and making recommendations to the Board concerning Board composition, committee structure
and governance, director education, and governance practices. The Board has determined that each member of the Nominating and Governance Committee is not an “interested person” as defined in the 1940 Act.
The number of Nominating and Governance Committee meetings held during the Fund's most recently completed fiscal year is set forth in the table below. The Nominating and Governance Committee Charter is available on
the Fund's website.
The membership of the Nominating
and Governance Committee is set forth below:
Michael S. Hyland, CFA (Chair)
Stephen G. Stoneburn
Linda W. Bynoe
Keith F. Hartstein
Richard A. Redeker (ex-officio)
Michael S. Hyland, CFA (Chair)
Stephen G. Stoneburn
Linda W. Bynoe
Keith F. Hartstein
Richard A. Redeker (ex-officio)
Prudential and
Target Investment Committees: In September 2005, the Board of each fund in the Prudential retail mutual funds complex formed joint committees to review the performance of each Fund in the Fund Complex. The Prudential
Investment Committee reviews the performance of each Fund whose subadvisers are affiliates of the Manager, while the Target Investment Committee reviews the performance of funds whose subadvisers are not affiliates of
the Manager. Each committee meets at least four times per year and reports the results of its review to the full Board of each Fund at each regularly scheduled Board meeting. Every Independent Board Member sits on one
of the two committees. The non-management Interested Board Member sits on one of the committees.
The number of Prudential and Target
Investment Committee meetings, as applicable, held during the Fund's most recently completed fiscal year is set forth in the table below.
The membership of the Prudential
and Target Investment Committees is set forth below:
Prudential Investment Committee
Keith F. Hartstein (Chair)
Richard A. Redeker
Stephen G. Stoneburn
Linda W. Bynoe
Michael S. Hyland, CFA
James E. Quinn
Target Investment Committee
Ellen S. Alberding (Chair)
Kevin J. Bannon
Prudential Investment Committee
Keith F. Hartstein (Chair)
Richard A. Redeker
Stephen G. Stoneburn
Linda W. Bynoe
Michael S. Hyland, CFA
James E. Quinn
Target Investment Committee
Ellen S. Alberding (Chair)
Kevin J. Bannon
37
Douglas H.
McCorkindale
Robin B. Smith
Stephen P. Munn
Grace C. Torres
Robin B. Smith
Stephen P. Munn
Grace C. Torres
| Board Committee Meetings (for most recently completed fiscal year) | ||
| Audit Committee | Nominating & Governance Committee | Target/Prudential Investment Committee |
| 4 | 4 | 4 |
LEADERSHIP STRUCTURE AND
QUALIFICATIONS OF BOARD MEMBERS. The Board is responsible for oversight of the Fund. The Fund has engaged the Manager to manage the Fund on a day-to-day basis. The Board oversees the Manager and certain other principal
service providers in the operations of the Fund. The Board is currently composed of thirteen members, eleven of whom are Independent Board Members. The Board meets in-person at regularly scheduled meetings four times
throughout the year. In addition, the Board Members may meet in-person or by telephone at special meetings or on an informal basis at other times. As described above, the Board has established three standing
committees—Audit, Nominating and Governance, and Investment—and may establish ad hoc committees or working groups from time to time, to assist the Board in fulfilling its oversight responsibilities. The
Independent Board Members have also engaged independent legal counsel to assist them in fulfilling their responsibilities.
The Board is chaired by an
Independent Board Member. As Chair, this Independent Board Member leads the Board in its activities. Also, the Chair acts as a member or as an ex-officio member of each standing committee and any ad hoc committee of
the Board. The Board Members have determined that the Board's leadership and committee structure is appropriate because the Board believes it sets the proper tone to the relationships between the Fund, on the one
hand, and the Manager, the subadviser(s) and certain other principal service providers, on the other, and facilitates the exercise of the Board's independent judgment in evaluating and managing the relationships. In
addition, the structure efficiently allocates responsibility among committees.
The Board has concluded that, based
on each Board Member's experience, qualifications, attributes or skills on an individual basis and in combination with those of the other Board Members, each Board Member should serve as a Board Member. Among other
attributes common to all Board Members are their ability to review critically, evaluate, question and discuss information provided to them, to interact effectively with the various service providers to the Fund, and
to exercise reasonable business judgment in the performance of their duties as Board Members. In addition, the Board has taken into account the actual service and commitment of the Board Members during their tenure in
concluding that each should continue to serve. A Board Member's ability to perform his or her duties effectively may have been attained through a Board Member's educational background or professional training;
business, consulting, public service or academic positions; experience from service as a Board Member of the Fund, other funds in the Fund Complex, public companies, or non-profit entities or other organizations; or
other experiences. Set forth below is a brief discussion of the specific experience, qualifications, attributes or skills of each Board Member that led the Board to conclude that he or she should serve as a Board
Member.
Ms. Smith and Messrs. McCorkindale,
Redeker, and Stoneburn have each served as a Board Member of mutual funds in the Fund Complex for more than 14 years, including as members and/or Chairs of various Board committees. In addition, Ms. Smith and Mr.
McCorkindale each has more than 35 years and Mr. Stoneburn has more than 30 years of experience as senior executive officers of operating companies and/or as directors of public companies. Mr. Redeker has more than 44
years of experience as a senior executive in the mutual fund industry. Ms. Bynoe has been a Board Member of the Fund and other funds in the Fund Complex since 2005, having served on the boards of other mutual fund
complexes since 1993. She has worked in the financial services industry over 11 years, has approximately 20 years experience as a management consultant and serves as a Director of financial services and other complex
global corporations. Mr. Munn joined the Board of the Fund and other funds in the Fund Complex in 2008. He previously served as a Board Member of funds managed by PI or its affiliates from 1991 until 2003. In
addition, he is the lead director and was the Chairman of an operating business for 14 years. Messrs. Bannon and Hyland joined the Board of the Fund and other funds in the Fund Complex in 2008. Each has held senior
executive positions in the financial services industry, including serving as senior executives of asset management firms, for over 17 years. Ms. Alberding and Messrs. Hartstein and Quinn joined the Board of the Fund
and other funds in the Fund Complex in 2013. Ms. Alberding has 30 years of experience in the non-profit sector, including over 20 years as the president of a charitable foundation, where she oversees multiple
investment managers. Ms. Alberding also served as a Trustee of the Aon Funds from 2000 to 2003. Mr. Hartstein has worked in the asset management industry for almost 30 years and served as a senior executive in an
asset management firm. Mr. Quinn has over 20 years of experience as a senior executive officer and a director of a public company. Mr. Parker, who has served as an Interested Board Member and President of the Fund and
the other funds in the Fund Complex since 2012, is President, Chief Operating Officer and Officer-in-Charge of PI and several of its affiliates that provide services to the Fund and has held senior positions in PI
since 2005. Mr. Benjamin, an Interested Board Member of the Fund and other funds in the Fund Complex since 2010, has served as a Vice President of the Fund and other funds in the Fund
Prudential Investment Portfolios
16 38
Complex since 2009
and has held senior positions in PI since 2003. Ms. Torres, a non-management Interested Board Member of the Fund and other funds in the Fund Complex, formerly served as Treasurer and Principal Financial and Accounting
Officer for the Fund and other funds in the Fund Complex for 16 years and held senior positions with the Manager from 1999 to 2014. Specific details about each Board Member's professional experience appear in the
professional biography tables, above.
Risk Oversight. Investing in general and the operation of a mutual fund involve a variety of risks, such as investment risk, compliance risk, and operational risk, among others. The Board oversees risk as
part of its oversight of the Fund. Risk oversight is addressed as part of various regular Board and committee activities. The Board, directly or through its committees, reviews reports from among others, the Manager,
subadvisers, the Fund's Chief Compliance Officer, the Fund's independent registered public accounting firm, counsel, and internal auditors of the Manager or its affiliates, as appropriate, regarding risks faced by the
Fund and the risk management programs of the Manager and certain service providers. The actual day-to-day risk management with respect to the Fund resides with the Manager and other service providers to the Fund.
Although the risk management policies of the Manager and the service providers are designed to be effective, those policies and their implementation vary among service providers and over time, and there is no
guarantee that they will be effective. Not all risks that may affect the Fund can be identified or processes and controls developed to eliminate or mitigate their occurrence or effects, and some risks are simply
beyond any control of the Fund or the Manager, its affiliates or other service providers.
Selection of Board Member
Nominees. The Nominating and Governance Committee is responsible for considering nominees for Board Members at such times as it considers electing new members to the Board. The Nominating and
Governance Committee may consider recommendations by business and personal contacts of current Board Members, and by executive search firms which the Committee may engage from time to time and will also consider
shareholder recommendations. The Nominating and Governance Committee has not established specific, minimum qualifications that it believes must be met by a nominee. In evaluating nominees, the Nominating and
Governance Committee considers, among other things, an individual's background, skills, and experience; whether the individual is an “interested person” as defined in the 1940 Act; and whether the
individual would be deemed an “audit committee financial expert” within the meaning of applicable SEC rules. The Nominating and Governance Committee also considers whether the individual's background,
skills, and experience will complement the background, skills, and experience of other nominees and will contribute to the diversity of the Board. There are no differences in the manner in which the Nominating and
Governance Committee evaluates nominees for the Board based on whether the nominee is recommended by a shareholder.
A shareholder who wishes to
recommend a board member for nomination should submit his or her recommendation in writing to the Chair of the Board (Richard Redeker) or the Chair of the Nominating and Governance Committee (Michael Hyland), in
either case in care of the specified Fund(s), at Gateway Center Three, 100 Mulberry Street, 4th Floor, Newark, New Jersey 07102-4077. At a minimum, the recommendation should include: the name, address and business,
educational and/or other pertinent background of the person being recommended; a statement concerning whether the person is an “interested person” as defined in the 1940 Act; any other information that the
Fund would be required to include in a proxy statement concerning the person if he or she was nominated; and the name and address of the person submitting the recommendation, together with the number of Fund shares
held by such person and the period for which the shares have been held. The recommendation also can include any additional information which the person submitting it believes would assist the Nominating and Governance
Committee in evaluating the recommendation.
Shareholders should note that a
person who owns securities issued by Prudential Financial, Inc. (the parent company of the Fund's Manager) would be deemed an “interested person” under the 1940 Act. In addition, certain other
relationships with Prudential Financial, Inc. or its subsidiaries, with registered broker-dealers, or with the Fund's outside legal counsel may cause a person to be deemed an “interested person.” Before
the Nominating and Governance Committee decides to nominate an individual to the Board, Committee members and other Board Members customarily interview the individual in person. In addition, the individual customarily
is asked to complete a detailed questionnaire which is designed to elicit information which must be disclosed under SEC and stock exchange rules and to determine whether the individual is subject to any statutory
disqualification from serving on the board of a registered investment company.
Share Ownership. Information relating to each Board Member's Fund share ownership and in all registered funds in the PI-advised funds that are overseen by the respective Board Member as of the most
recently completed calendar year is set forth in the chart below.
39
| Name | Dollar Range of Equity Securities in the Fund |
Aggregate Dollar Range of Equity Securities in All Registered Investment Companies Overseen by Board Member in Fund Complex |
| Board Member Share Ownership: Independent Board Members | ||
| Ellen Alberding | None | Over $100,000 |
| Kevin J. Bannon | None | Over $100,000 |
| Linda W. Bynoe | None | Over $100,000 |
| Keith Hartstein | None | Over $100,000 |
| Michael S. Hyland | None | Over $100,000 |
| Douglas H. McCorkindale | None | Over $100,000 |
| Stephen P. Munn | None | Over $100,000 |
| James E. Quinn | None | Over $100,000 |
| Richard A. Redeker | None | Over $100,000 |
| Robin B. Smith | None | Over $100,000 |
| Stephen G. Stoneburn | None | Over $100,000 |
| Board Member Share Ownership: Interested Board Members | ||
| Stuart S. Parker | None | Over $100,000 |
| Scott E. Benjamin | None | Over $100,000 |
| Grace C. Torres | None | None |
None of the Independent Board Members, or any
member of his/her immediate family, owned beneficially or of record any securities in an investment adviser or principal underwriter of the Fund or a person (other than a registered investment company) directly or
indirectly controlling, controlled by, or under common control with an investment adviser or principal underwriter of the Fund as of the most recently completed calendar year.
Shareholder Communications with Board
Members. Shareholders can communicate directly with Board Members by writing to the Chair of the Board, c/o the Fund, Gateway Center Three, 100 Mulberry Street, 4th Floor, Newark, New Jersey
07102-4077. Shareholders can communicate directly with an individual Board Member by writing to that Board Member, c/o the Fund, Gateway Center Three, 100 Mulberry Street, Newark, New Jersey 07102-4077. Such
communications to the Board or individual Board Members are not screened before being delivered to the addressee.
MANAGEMENT & ADVISORY
ARRANGEMENTS
MANAGER. The Manager’s address is Gateway Center Three, 100 Mulberry Street, Newark, NJ 07102-4077. The Manager serves as manager to all of the other investment companies that, together with
the Fund, comprise the Prudential Investments mutual funds. See the Prospectus for more information about PI. As of November 30, 2014, the Manager served as the investment manager to all of the Prudential US and
offshore open-end investment companies, and as administrator to closed-end investment companies, with aggregate assets of approximately $237.8 billion.
The Manager is a wholly-owned
subsidiary of PIFM Holdco LLC, which is a wholly-owned subsidiary of Prudential Asset Management Holding Company LLC, which is a wholly-owned subsidiary of Prudential. PMFS, an affiliate of PI, serves as the transfer
agent and dividend distribution agent for the Prudential Investments mutual funds and, in addition, provides customer service, record keeping and management and administrative services to qualified plans.
Pursuant to a management agreement
with the Fund (the Management Agreement), PI, subject to the supervision of the Fund's Board and in conformity with the stated policies of the Fund, manages both the investment operations of the Fund and the
composition of the Fund's portfolios, including the purchase, retention, disposition and loan of securities and other assets. In connection therewith, the Manager is obligated to keep certain books and records of the
Fund. The Manager is authorized to enter into subadvisory agreements for investment advisory services in connection with the management of the Fund. The Manager will continue to have responsibility for all investment
advisory services performed pursuant to any such subadvisory agreements. PI will review the performance of the investment subadviser(s) and make recommendations to the Board with respect to the retention of investment
subadvisers and the renewal of contracts. The Manager also administers the Fund's corporate affairs and, in connection therewith,
Prudential Investment Portfolios
16 40
furnishes the Fund with office facilities, together
with those ordinary clerical and bookkeeping services which are not being furnished by the Fund's custodian (the Custodian) and PMFS. The management services of PI to the Fund are not exclusive under the terms of the
Management Agreement and PI is free to, and does, render management services to others.
PI may from time to time waive all
or a portion of its management fee and subsidize all or a portion of the operating expenses of the Fund. Fee waivers and subsidies will increase the Fund's total return. These voluntary waivers may be terminated at
any time without notice. To the extent that PI agrees to waive its fee or subsidize the Fund's expenses, it may enter into a relationship agreement with the subadviser to share the economic impact of the fee waiver or
expense subsidy.
In connection with its management
of the corporate affairs of the Fund, PI bears the following expenses:
| ■ | the salaries and expenses of all of its and the Fund's personnel except the fees and expenses of Independent Board Members; |
| ■ | all expenses incurred by the Manager or the Fund in connection with managing the ordinary course of a Fund’s business, other than those assumed by the Fund as described below; and |
| ■ | the fees, costs and expenses payable to any investment subadviser pursuant to a subadvisory agreement between PI and such investment subadviser. |
Under the terms of the Management
Agreement, the Fund is responsible for the payment of the following expenses:
| ■ | the fees and expenses incurred by the Fund in connection with the management of the investment and reinvestment of the Fund's assets payable to the Manager; |
| ■ | the fees and expenses of Independent Board Members; |
| ■ | the fees and certain expenses of the Custodian and transfer and dividend disbursing agent, including the cost of providing records to the Manager in connection with its obligation of maintaining required records of the Fund and of pricing the Fund's shares; |
| ■ | the charges and expenses of the Fund's legal counsel and independent auditors and of legal counsel to the Independent Board Members; |
| ■ | brokerage commissions and any issue or transfer taxes chargeable to the Fund in connection with securities (and futures, if applicable) transactions; |
| ■ | all taxes and corporate fees payable by the Fund to governmental agencies; |
| ■ | the fees of any trade associations of which the Fund may be a member; |
| ■ | the cost of share certificates representing, and/or non-negotiable share deposit receipts evidencing, shares of the Fund; |
| ■ | the cost of fidelity, directors and officers and errors and omissions insurance; |
| ■ | the fees and expenses involved in registering and maintaining registration of the Fund and of Fund shares with the SEC and paying notice filing fees under state securities laws, including the preparation and printing of the Fund's registration statements and prospectuses for such purposes; allocable communications expenses with respect to investor services and all expenses of shareholders' and Board meetings and of preparing, printing and mailing reports and notices to shareholders; and |
| ■ | litigation and indemnification expenses and other extraordinary expenses not incurred in the ordinary course of the Fund's business and distribution and service (12b-1) fees. |
The Management Agreement provides
that PI will not be liable for any error of judgment by PI or for any loss suffered by the Fund in connection with the matters to which the Management Agreement relates, except a loss resulting from a breach of
fiduciary duty with respect to the receipt of compensation for services (in which case any award of damages shall be limited to the period and the amount set forth in Section 36(b)(3) of the 1940 Act) or loss
resulting from willful misfeasance, bad faith or gross negligence or reckless disregard of duties. The Management Agreement provides that it will terminate automatically if assigned (as defined in the 1940 Act), and
that it may be terminated without penalty by either PI or the Fund by the Board or vote of a majority of the outstanding voting securities of the Fund (as defined in the 1940 Act) upon not more than 60 days', nor less
than 30 days', written notice. The Management Agreement will continue in effect for a period of more than two years from the date of execution only so long as such continuance is specifically approved at least
annually in accordance with the requirements of the 1940 Act.
Fees payable under the Management
Agreement are computed daily and paid monthly. The applicable fee rate and the management fees received by PI from the Fund for the indicated fiscal years are set forth below.
The management fee rate for the
Fund is:
0.75% up to $500 million; 0.70% on
next $500 million; 0.65% over $1 billion
| Management Fees Paid by the Fund | ||||
| Fund Name | 2014* | 2014** | 2013** | 2012** |
| Defensive Equity Fund | $479,506 | $1,913,753 | $1,871,344 | $2,062,669 |
*During 2014, the Fund
changed its fiscal year-end from July 31 to October 31. The figure shown is for the fiscal period from August 1, 2014 through October 31, 2014.
41
**The
figures shown are for the fiscal years ended July 31, 2014, 2013 and 2012.
SUBADVISORY ARRANGEMENTS. The Manager has entered into a subadvisory agreement (Subadvisory Agreement) with the Fund's investment subadviser. The Subadvisory Agreement provides that the Subadviser will furnish
investment advisory services in connection with the management of the Fund. In connection therewith, the Subadviser is obligated to keep certain books and records of the Fund. Under the Subadvisory Agreement, the
Subadviser, subject to the supervision of PI, is responsible for managing the assets of the Fund in accordance with the Fund's investment objectives, investment program and policies. The Subadviser determines what
securities and other instruments are purchased and sold for the Fund and is responsible for obtaining and evaluating financial data relevant to the Fund. PI continues to have responsibility for all investment advisory
services pursuant to the Management Agreement and supervises the Subadviser's performance of such services.
As discussed in the Prospectus, PI
employs the Subadviser under a “manager of managers” structure that allows PI to replace the Subadviser or amend a Subadvisory Agreement without seeking shareholder approval. The Subadvisory Agreement
provides that it will terminate in the event of its assignment (as defined in the 1940 Act) or upon the termination of the Management Agreement. The Subadvisory Agreement may be terminated by the Fund, PI, or the
Subadviser upon not more than 60 days nor less than 30 days written notice. The Subadvisory Agreement provides that it will continue in effect for a period of not more than two years from its execution only so long as
such continuance is specifically approved at least annually in accordance with the requirements of the 1940 Act.
The applicable fee rate and the
subadvisory fees paid by PI for the indicated fiscal years are set forth below. Subadvisory fees are based on the average daily net assets of the Fund, calculated and paid on a monthly basis, at the fee rate as set
forth in the Subadvisory Agreement. Subadvisory fees are deducted out of the management fee paid by the Fund.
| Subadvisory Fee Rates and Subadvisory Fees Paid | ||||||
| Defensive Equity Fund** | Subadviser | Fee Rate | 2014*** | 2014*** | 2013*** | 2012*** |
| Quantitative Management Associates LLC (started May 2013) | 0.35% to $500 million; 0.30% over $500 million |
$223,770 | $893,085 | $204,619 | N/A | |
| Eagle Asset Management, Inc. (terminated May 2013) | 0.50% to $50 million; 0.45% over $50 million |
__ | __ | $17,886 | $25,902 | |
| EARNEST Partners, LLC (terminated May 2013) | 0.40% | __ | __ | $7,781 | $10,263 | |
| Eaton Vance Management (terminated July 2012) |
0.25% on first $250 million; 0.24% on next $250 million; 0.23% on next $500 million; 0.22% over $1 billion |
__ | __ | __ | $55,104 | |
| Epoch Investment Partners, Inc. (started July 2012) (terminated May 2013) |
0.275% to $1 billion; 0.20% over $1 billion |
__ | __ | $39,469 | $1,817 | |
| Pacific Investment Management Company LLC (terminated May 2013) | 0.25% to $1 billion; 0.225% over $1 billion |
__ | __ | $136,954 | $213,387 | |
| Hotchkis and Wiley Capital Management, LLC (terminated May 2013) | 0.30% | __ | __ | $43,405 | $51,765 | |
| Marsico Capital Management, LLC (terminated May 2013) | 0.40% to $1.5 billion; 0.35% over $1.5 billion |
__ | __ | $94,803 | $156,907 | |
| Massachusetts Financial Services Company* (terminated May 2013) | 0.375% on first $250 million; 0.325% on next $250 milliion; 0.300% on next $250 million; 0.275% on next $250 million; 0.25% on next $500 million; 0.225% over $1.5 billion |
__ | __ | $55,099 | $85,159 | |
| Vaughan Nelson Investment Management, L.P. (terminated May 2013) | 0.40% to $250 million; 0.35% over $250 million |
__ | __ | $7,695 | $10,250 | |
| LSV Asset Management (terminated May 2013) | 0.45% on first $150 million; 0.425% on next $150 million; 0.40% on next $150 million; 0.375% on next $300 million; 0.35% over $750 million |
__ | __ | $51,847 | $69,961 | |
| Thornburg Investment Management, Inc. (terminated May 2013) | 0.35% to $100 million; 0.30% over $100 million |
__ | __ | $34,792 | $46,778 | |
Prudential Investment Portfolios
16 42
| Subadvisory Fee Rates and Subadvisory Fees Paid | ||||||
| Defensive Equity Fund** | Subadviser | Fee Rate | 2014*** | 2014*** | 2013*** | 2012*** |
| NFJ Investment Group LLC (terminated May 2013) | 0.40% on first $50 million; 0.38% on next $50 million; 0.34% on next $50 million; 0.30% on next $200 million; 0.28% over $350 million |
__ | __ | $60,395 | $69,867 | |
Notes to Subadvisory Fee
Table
For
purposes of the fee calculation, assets managed by the same subadviser in the same “sleeve” or segment in the Fund were aggregated. In addition, the asset aggregation arrangements set forth below were
applicable as noted:
Eagle Asset Management, Inc.: For purposes of the fee calculation, the assets managed by Eagle are aggregated with the funds managed or co-managed by PI for which Eagle serves as subadviser that are managed pursuant to
substantially the same investment strategy.
Eaton Vance Management: For purposes of the fee calculation, the combined average daily assets of the following will be aggregated: all portfolios sub-advised by Eaton Vance that are managed by Prudential
Investments LLC, or by Prudential Investments and AST Investment Services, Inc., that have substantially the same investment strategy (i.e., domestic large cap value).
Epoch
Investment Partners, Inc.: For purposes of the fee calculation, the average daily net assets in all portfolios subadvised by Epoch that are managed by PI that have substantially the same investment strategy (i.e.,
domestic large cap value) will be combined (i.e., Target Portfolio Trust-Large Capitalization Value Portfolio).
Marsico Capital Management, LLC: As of April 15, 2013, Marsico ceased to be a subadviser to the Fund. For purposes of the fee calculation, the assets managed by Marsico in the following funds were aggregated: (i) the AST
Marsico Capital Growth Portfolio of the Advanced Series Trust, (ii) the portion of the Fund that was sub-advised by Marsico, (iii) the portion of the Large Capitalization Growth Portfolio of The Target Portfolio Trust
that was sub-advised by Marsico, (vi) the portion of the Global Portfolio of The Prudential Series Fund that was sub-advised by Marsico, (vii) the portion of the AST Advanced Strategies Portfolio of the Advanced
Series Trust that was sub-advised by Marsico and (viii) other future large cap growth accounts under which Marsico provided substantially similar advisory or sub-advisory services and which Marsico, Prudential
Investments LLC, and AST Investment Services, Inc., as applicable, mutually agree in writing.
Massachusetts Financial Services
Company: For purposes of the fee calculation, the combined average daily assets of the following will be aggregated: assets in all portfolios sub-advised by MFS that are managed by Prudential
Investments LLC, or by Prudential Investments and AST Investment Services, Inc., that have substantially the same investment strategy (i.e., domestic large capitalization growth).
NFJ
Investment Group LLC: For purposes of the fee calculation, the assets managed by NFJ Investment Group will be aggregated with the assets managed by NFJ Investment Group in The Target Portfolio Trust—Large
Capitalization Value Portfolio and The Target Portfolio Trust—Small Capitalization Value Portfolio.
Vaughan Nelson Investment Management,
L.P.: For purposes of the fee calculation, the assets managed by Vaughan Nelson will be aggregated with the assets managed by Vaughan Nelson in: (i) Small Capitalization Value Portfolio of The
Target Portfolio Trust; and (ii) any other portfolio subadvised by Vaughan Nelson on behalf of PI or one of its affiliates pursuant to substantially the same investment strategy.
Pacific Investment Management Company LLC
(PIMCO): For purposes of the fee calculation, if on any day the aggregate assets of all funds/portfolios subadvised by PIMCO on behalf of PI and/or AST Investment Services, Inc. pursuant to a
“total return” strategy or mandate (as mutually agreed upon by PIMCO and PI/AST Investment Services, Inc.) total at least $3 billion, the contractual annual subadvisory fee, calculated daily, shall be:
0.250% on aggregate assets up to $1 billion; and 0.225% on aggregate assets over $1 billion. If, however, such aggregate assets on any day total less than $3 billion, then the subadvisory fee calculation for that day
shall be at the rate of 0.25% of the assets ofeach such fund/portfolio.
*Arrangements in Effect Prior to October 1,
2011:
Massachusetts Financial Services Company
(MFS). Prior to October 1, 2011, the subadvisory fee rate applicable to MFS was as follows:
.375% on first $250 million;
..325% on next $250 milliion;
..300% on next $250 million;
..275% over $750 million
..325% on next $250 milliion;
..300% on next $250 million;
..275% over $750 million
** Effective May 8, 2013, Quantitative
Management Associates LLC became the sole subadviser to the Fund.
***During
2014, the Fund changed its fiscal year-end from July 31 to October 31. The figures shown above are for the fiscal period from August 1, 2014 through October 31, 2014 and the fiscal years ended July 31, 2014, 2013 and
2012.
ADDITIONAL INFORMATION ABOUT
PORTFOLIO MANAGERS—OTHER ACCOUNTS AND OWNERSHIP OF FUND SECURITIES. Set forth below is information about other accounts managed by each portfolio manager and ownership of Fund securities. The information shows, for each portfolio manager, the number of
accounts managed and the total assets in such accounts, within each of the indicated categories. For each category, the number of accounts and total assets in the accounts whose fees are based on performance is
indicated in italics typeface. The Ownership of Fund Securities column shows the dollar range of equity securities of the Fund beneficially owned by the portfolio manager.
Information shown below is as of
the most recently completed fiscal year, unless noted otherwise.
| Defensive Equity Fund (as of October 31, 2014)** | |||||
| Subadviser | Portfolio Managers | Registered Investment Companies/Total Assets* |
Other Pooled Investment Vehicles/Total Assets* |
Other Accounts/Total Assets* | Ownership of Fund Securities |
| Quantitative Management Associates LLC | Ted Lockwood | 26/$68,641,971,291 | 1/$46,815,239 | 32/$1,909,614,545 | None |
| Edward L. Campbell, CFA | 26/$68,265,681,681 | 1/$46,815,239 | 29/$1,807,351,075 | None | |
| Daniel Carlucci, CFA | 15/$17,472,754,615 | 27/$16,494,373,046 | 29/$10,176,644,195 5/$1,021,440,482 |
None | |
| Joel M. Kallman, CFA | 25/$68,265,681,681 | 1/$46,815,239 | 29/$1,807,351,075 | None | |
43
| Defensive Equity Fund (as of October 31, 2014)** | |||||
| Subadviser | Portfolio Managers | Registered Investment Companies/Total Assets* |
Other Pooled Investment Vehicles/Total Assets* |
Other Accounts/Total Assets* | Ownership of Fund Securities |
| John A. Hudock, CFA | 26/$68,265,681,681 | 1/$46,815,239 | 29/$1,807,351,075 | None | |
*Accounts are managed on
a team basis. If a portfolio manager is a member of a team, any account managed by that team in included in the number of accounts and total assets for such portfolio manager (even if such portfolio manager is not
primarily involved in the day-to-day management of the account). “Other Pooled Investment Vehicles” includes commingled insurance company separate accounts, commingled trust funds and other commingled
investment vehicles. “Other Accounts” includes single client accounts, managed accounts (which are counted as one account per managed account platform), asset allocation clients, and accounts of
affiliates. The assets in certain accounts have been estimated due to the availability of information only at the end of calendar quarters.
**During
2014, the Fund changed its fiscal year-end from July 31 to October 31. The figures shown above are as of October 31, 2014.
ADDITIONAL INFORMATION ABOUT THE
PORTFOLIO MANAGERS—COMPENSATION AND CONFLICTS OF INTEREST. Set forth below, for each portfolio manager, is an explanation of the structure of, and methods used to determine, portfolio manager compensation. Also set forth below, for each portfolio
manager, is an explanation of any material conflicts of interest that may arise between a portfolio manager's management of the Fund's investments and investments in other accounts.
Quantitative Management Associates
LLC (QMA)
COMPENSATION. QMA’s investment professionals are compensated through a combination of base salary, a performance-based annual cash incentive bonus and an annual long-term incentive grant. QMA
regularly utilizes third party surveys to compare its compensation program against leading asset management firms to monitor competitiveness.
An investment professional’s
incentive compensation, including both the annual cash bonus and long-term incentive grant, is largely driven by a person’s contribution to QMA’s goal of providing investment performance to clients
consistent with portfolio objectives, guidelines and risk parameters. In addition, a person’s qualitative contributions would also be considered in determining compensation. An investment professional’s
long-term incentive grant is currently divided into two components: (i) 80% of the value of the grant is subject to increase or decrease based on the annual performance of certain QMA strategies, and (ii) 20% of the
value of the grant consists of stock options and/or restricted stock of Prudential Financial, Inc. (QMA’s ultimate parent company). The long-term incentive grants are subject to vesting requirements. The
incentive compensation of each investment professional is not based solely or directly on the performance of the Fund (or any other individual account managed by QMA) or the value of the assets of the Fund (or any
other individual account managed by QMA).
The annual cash bonus pool is
determined quantitatively based on two primary factors: 1) investment performance of composites representing QMA’s various investment strategies on a 1-year and 3-year basis relative to appropriate market peer
groups and the indices against which our strategies are managed, and 2) business results as measured by QMA’s pre-tax income.
CONFLICTS OF INTEREST. Like other investment advisers, QMA is subject to various conflicts of interest in the ordinary course of its business. QMA strives to identify potential risks, including conflicts of
interest, that are inherent in its business, and conducts annual conflict of interest reviews. When actual or potential conflicts of interest are identified, QMA seeks to address such conflicts through one or more of
the following methods:
| ■ | Elimination of the conflict; |
| ■ | Disclosure of the conflict; or |
| ■ | Management of the conflict through the adoption of appropriate policies and procedures. |
QMA follows Prudential
Financial’s policies on business ethics, personal securities trading, and information barriers. QMA has adopted a code of ethics, allocation policies and conflicts of interest policies, among others, and has
adopted supervisory procedures to monitor compliance with its policies. QMA cannot guarantee, however, that its policies and procedures will detect and prevent, or assure disclosure of, each and every situation in
which a conflict may arise.
Side-by-Side Management of Accounts
and Related Conflicts of Interest
Side-by-side management of multiple
accounts can create incentives for QMA to favor one account over another. Examples are detailed below, followed by a discussion of how QMA addresses these conflicts.
| ■ | Asset-Based Fees vs. Performance-Based Fees; Other Fee Considerations. QMA manages accounts with asset-based fees alongside accounts with performance-based fees. Asset-based fees are calculated based on the value of a client’s portfolio at periodic measurement dates or over specified periods of time. Performance-based fees are generally based on a share of the capital appreciation of a portfolio, and may offer greater upside potential to an investment manager than asset-based fees, depending on how the fees are structured. This side-by-side management can create an incentive for QMA and its investment professionals to favor one account over another. Specifically, QMA has the incentive to favor accounts for which it receives performance fees, and |
Prudential Investment Portfolios
16 44
| possibly take greater investment risks in those accounts, in order to bolster performance and increase its fees. In addition, since fees are negotiable, one client may be paying a higher fee than another client with similar investment objectives or goals. In negotiating fees, QMA takes into account a number of factors including, but not limited to, the investment strategy, the size of a portfolio being managed, the relationship with the client, and the required level of service. Fees may also differ based on account type. For example, fees for commingled vehicles, including those that QMA subadvises, may differ from fees charged for single client accounts. | |
| ■ | Long Only/Long-Short Accounts. QMA manages accounts that only allow it to hold securities long as well as accounts that permit short selling. QMA may, therefore, sell a security short in some client accounts while holding the same security long in other client accounts, creating the possibility that QMA is taking inconsistent positions with respect to a particular security in different client accounts. |
| ■ | Compensation/Benefit Plan Accounts/Other Investments by Investment Professionals. QMA manages certain funds and strategies whose performance is considered in determining long-term incentive plan benefits for certain investment professionals. Investment professionals involved in the management of those accounts in these strategies have an incentive to favor them over other accounts they manage in order to increase their compensation. Additionally, QMA’s investment professionals may have an interest in funds in those strategies if the funds are chosen as options in their 401(k) or deferred compensation plans offered by Prudential or if they otherwise invest in those funds directly. |
| ■ | Affiliated Accounts. QMA manages accounts on behalf of its affiliates as well as unaffiliated accounts.QMA could have an incentive to favor accounts of affiliates over others. |
| ■ | Non-Discretionary Accounts or Models. QMA provides non-discretionary model portfolios to some clients and manages other portfolios on a discretionary basis. The non-discretionary clients may be disadvantaged if QMA delivers the model investment portfolio to them after it initiates trading for the discretionary clients, or vice versa. |
| ■ | Large Accounts. Large accounts typically generate more revenue than do smaller accounts. As a result, a portfolio manager has an incentive when allocating scarce investment opportunities to favor accounts that pay a higher fee or generate more income for QMA. |
| ■ | Securities of the Same Kind or Class. QMA may buy or sell, or may direct or recommend that one client buy or sell, securities of the same kind or class that are purchased or sold for another client, at prices that may be different. QMA may also, at any time, execute trades of securities of the same kind or class in one direction for an account and in the opposite direction for another account, due to differences in investment strategy or client direction. Different strategies effecting trading in the same securities or types of securities may appear as inconsistencies in QMA’s management of multiple accounts side-by-side. |
How QMA Addresses These Conflicts
of Interest
The conflicts of interest described
above with respect to different types of side-by-side management could influence QMA’s allocation of investment opportunities as well as its timing, aggregation and allocation of trades. QMA has developed
policies and procedures designed to address these conflicts of interest.
In keeping with its fiduciary
obligations, QMA’s policies with respect to allocation and aggregation are to treat all of its accounts fairly and equitably. QMA’s investment strategies generally require that QMA invest its
clients’ assets in securities that are publicly traded. QMA generally does not participate in initial public offerings. These factors significantly reduce the risk that QMA could favor one client over another in
the allocation of investment opportunities.
QMA’s compliance procedures
with respect to these policies include independent monitoring by its compliance unit of the timing, allocation and aggregation of trades and the allocation of investment opportunities. These procedures are designed to
detect patterns and anomalies in QMA’s side-by-side management and trading so that QMA may take measures to correct or improve its processes. QMA’s trade management oversight committee, which consists of
senior members of its management team, reviews trading patterns on a periodic basis.
QMA rebalances portfolios
periodically with frequencies that vary with market conditions and investment objectives and may differ across portfolios in the same strategy based on variations in portfolio characteristics and constraints. QMA may
aggregate trades for all portfolios rebalanced on any given day, where appropriate and consistent with its duty of best execution. Orders are generally allocated at the time of the transaction, or as soon as possible
thereafter, on a pro rata basis equal to each account’s appetite for the issue when such appetite can be determined. As mentioned above, QMA’s compliance unit performs periodic monitoring to determine that
all portfolios are rebalanced consistently, over time, within all strategies.
With respect to QMA’s
management of long-short and long only accounts, the security weightings (positive or negative) in each account are always determined by a quantitative algorithm. An independent review is performed by the compliance
unit to assess whether any such positions would represent a departure from the quantitative algorithm used to derive the positions in each portfolio. QMA’s review is also intended to identify situations where
QMA would seem to have conflicting views of the same security in different portfolios although such views may actually be reasonable due to differing portfolio constraints.
45
QMA’s Relationships with
Affiliates and Related Conflicts of Interest
As an indirect wholly-owned
subsidiary of Prudential Financial, QMA is part of a diversified, global financial services organization. It is affiliated with many types of financial service providers, including broker-dealers, insurance companies,
commodity pool operators and other investment advisers. Some of its employees are officers of some of these affiliates.
Conflicts Related to QMA’s
Affiliations
| ■ | Conflicts Arising Out of Legal Restrictions. QMA may be restricted by law, regulation or contract as to how much, if any, of a particular security it may purchase or sell on behalf of a client, and as to the timing of such purchase or sale. These restrictions may apply as a result of QMA’s relationship with Prudential Financial and its other affiliates. For example, QMA’s holdings of a security on behalf of its clients may, under some SEC rules, be aggregated with the holdings of that security by other Prudential Financial affiliates. These holdings could, on an aggregate basis, exceed certain reporting thresholds for which QMA and Prudential monitor, and QMA and Prudential may restrict purchases to avoid crossing such thresholds. In addition, QMA could receive material, non-public information with respect to a particular issuer from an affiliate and, as a result, be unable to execute purchase or sale transactions in securities of that issuer for our clients. QMA is generally able to avoid receiving material, non-public information from its affiliates by maintaining information barriers to prevent the transfer of information between affiliates. |
| ■ | The Fund may be prohibited from engaging in transactions with its affiliates even when such transactions may be beneficial for the Fund. Certain affiliated transactions are permitted in accordance with procedures adopted by the Fund and reviewed by the independent board members of the Fund. |
Conflicts Related
to QMA’s Asset Allocation Services
| ■ | QMA performs asset allocation services as subadviser for affiliated mutual funds managed or co-managed by the Manager, including for some Portfolios offered by the Fund. QMA may, under these arrangements, allocate assets to an asset class within which funds or accounts that QMA directly manages will be selected. In these circumstances, QMA receives both an asset allocation fee and a management fee. As a result, QMA has an incentive to allocate assets to an asset class that it manages in order to increase its fees. To help mitigate this conflict, the compliance group monitors the asset allocation to determine that the investments were made within the established guidelines by asset class. QMA also believes that it makes such allocations in a manner consistent with its fiduciary obligations. |
| ■ | In certain arrangements QMA subadvises mutual funds for the Manager through a program where they have selected QMA as a manager, resulting in QMA’s collection of subadvisory fees from them. From time to time, the Manager may also select managers for some of QMA’s asset allocation products. The Manager and QMA may have a mutual incentive to continue these types of arrangements that benefit both companies. These and other types of conflicts of interest are considered during initial project launch. |
Conflicts Arising Out of Securities
Holdings and Other Financial Interests
| ■ | QMA, Prudential Financial, Inc., the general account of the Prudential Insurance Company of America (PICA) and accounts of other affiliates of QMA (collectively, affiliated accounts) may, at times, have financial interests in, or relationships with, companies whose securities QMA may hold, purchase or sell in our client accounts. This may occur, for example, because affiliated accounts hold public and private debt and equity securities of a large number of issuers and may invest in some of the same companies as QMA’s client accounts. At any time, these interests and relationships could be inconsistent or in potential or actual conflict with positions held or actions taken by us on behalf of QMA’s client accounts. For instance, QMA may invest client assets in the equity of companies whose debt is held by an affiliate. QMA may also invest in the securities of one or more clients for the accounts of other clients. While these conflicts cannot be eliminated, QMA has implemented policies and procedures, including adherence to PIM’s information barrier policy, that are designed to ensure that investments of clients are managed in their best interests. |
| ■ | Certain of QMA’s employees may offer and sell securities of, and units in, commingled funds that QMA manages or subadvises. Employees may offer and sell securities in connection with their roles as registered representatives of Prudential Investment Management Services LLC (a broker-dealer affiliate), or as officers, agents, or approved persons of other affiliates. There is an incentive for QMA’s employees to offer these securities to investors regardless of whether the investment is appropriate for such investor since increased assets in these vehicles will result in increased advisory fees to QMA. In addition, such sales could result in increased compensation to the employee. |
| ■ | A portion of the long-term incentive grant of some of QMA’s investment professionals will increase or decrease based on the annual performance of several of QMA’s advised accounts over a defined time period. Consequently, some of QMA’s portfolio managers from time to time have financial interests in the accounts they advise. To address potential conflicts related to these financial interests, QMA has procedures, including supervisory review procedures, designed to ensure that each of its accounts is managed in a manner that is consistent with QMA’s fiduciary obligations, as well as with the account’s investment objectives, investment strategies and restrictions. Specifically, QMA’s Chief Investment Officer will perform a comparison of trading costs between the advised accounts whose performance is considered in connection with the long-term incentive grant and other accounts, to ensure that such costs are consistent with each other or otherwise in line with expectations. The results of the analysis are discussed at a trade management meeting. Additionally, QMA’s compliance group will review the performance of these accounts to ensure that it is consistent with the performance of other accounts in the same strategy that are not considered in connection with the grant. |
Conflicts of Interest in the Voting
Process
Prudential Investment Portfolios
16 46
Occasionally, a conflict of
interest may arise in connection with proxy voting. For example, the issuer of the securities being voted may also be a client of QMA. When QMA identifies an actual or potential conflict of interest between QMA and
its clients, QMA votes in accordance with the policy of its proxy voting facilitator rather than its own policy. In that manner, QMA seeks to assure the independence and objectivity of the vote.
OTHER SERVICE PROVIDERS
CUSTODIAN. The Bank of New York Mellon (BNY), One Wall Street, New York, New York 10286, serves as Custodian for the Fund's portfolio securities and cash, and in that capacity, maintains certain
financial accounting books and records pursuant to an agreement with the Fund. Subcustodians provide custodial services for any foreign assets held outside the United States.
SECURITIES LENDING AGENT. Prudential Investment Management, Inc. (PIM) serves as securities lending agent for the Fund, and in that role administers the Fund's securities lending program. PIM is an affiliate of PI.
For its services, PIM receives a portion of the amount earned by lending securities. The compensation received by PIM for services as securities lending agent for the three most recently completed fiscal years is set
forth below.
| Compensation Received by PIM for Securities Lending: Defensive Equity Fund* | ||||
| 2014 | 2014 | 2013 | 2012 | |
| None | None | None | None |
*During 2014, the Fund
changed its fiscal year-end from July 31 to October 31. The figures shown above are for the fiscal period from August 1, 2014 through October 31, 2014, and the fiscal years ended July 31, 2014, 2013 and 2012.
TRANSFER AGENT. PMFS, Gateway Center Three, 100 Mulberry Street, Newark, New Jersey 07102, serves as the transfer and dividend disbursing agent of the Fund. PMFS is an affiliate of the Manager. PMFS
provides customary transfer agency services to the Fund, including the handling of shareholder communications, the processing of shareholder transactions, the maintenance of shareholder account records, the payment of
dividends and distributions, and related functions. For these services, PMFS receives compensation from the Fund and is reimbursed for its transfer agent expenses which include an annual fee and certain out-of-pocket
expenses including, but not limited to, postage, stationery, printing, allocable communication expenses and other costs.
The Fund's Board has appointed BNY
Mellon Asset Servicing (US) Inc. (BNYAS), 301 Bellevue Parkway, Wilmington, Delaware 19809, as sub-transfer agent to the Fund. PMFS has contracted with BNYAS to provide certain administrative functions to PMFS. PMFS
will compensate BNYAS for such services.
For the most recently completed
fiscal year, the Fund incurred the following approximate amount of fees for services provided by PMFS:
| Fees Paid to PMFS | |
| Fund Name | Amount |
| Defensive Equity Fund* | $44,500 |
*During 2014, the Fund
changed its fiscal year-end from July 31 to October 31. The figure shown above is for the fiscal period from August 1, 2014 through October 31, 2014.
INDEPENDENT REGISTERED PUBLIC
ACCOUNTING FIRM. KPMG LLP, 345 Park Avenue, New York, New York 10154, served as independent registered public accounting firm for the Fund, and in that capacity will audit the annual financial statements
for the Fund for the next fiscal year.
DISTRIBUTION OF FUND SHARES
DISTRIBUTOR. Prudential Investment Management Services LLC (PIMS or the Distributor), Gateway Center Three, 14th Floor, 100 Mulberry Street, Newark, New Jersey 07102-4077, acts as the distributor of all of the shares of the Fund. The Distributor is a subsidiary of
Prudential.
The Distributor incurs the expenses
of distributing each of the Fund's share classes pursuant to separate Distribution and Service Plans for each share class (collectively, the Plans) adopted by the Fund pursuant to Rule 12b-1 under the 1940 Act and a
distribution agreement (the Distribution Agreement). PIMS also incurs the expenses of distributing any share class offered by the Fund which is not subject to a Distribution and Service (12b-1) Plan, and none of the
expenses incurred by PIMS in distributing such share classes are reimbursed or paid for by the Fund.
47
The expenses incurred under the
Plans include commissions and account servicing fees paid to, or on account of, brokers or financial institutions which have entered into agreements with the Distributor, as applicable, advertising expenses, the cost
of printing and mailing prospectuses to potential investors and indirect and overhead costs of the Distributor associated with the sale of Fund shares, including sales promotion expenses.
Under the Plans, the Fund is
obligated to pay distribution and/or service fees to the Distributor, as applicable, as compensation for its distribution and service activities, not as reimbursement for specific expenses incurred. If the
Distributor’s expenses exceed its distribution and service fees, the Fund will not be obligated to pay any additional expenses. If the Distributor’s expenses are less than such distribution and service
fees, then it will retain its full fees and realize a profit.
The distribution and/or service
fees may also be used by the Distributor to compensate on a continuing basis brokers in consideration for the distribution, marketing, administrative and other services and activities provided by brokers with respect
to the promotion of the sale of Fund shares and the maintenance of related shareholder accounts.
Distribution expenses attributable
to the sale of each share class are allocated to each such class based upon the ratio of sales of each such class to the combined sales of all classes of the Fund, other than expenses allocable to a particular class.
The distribution fee and sales charge of one class will not be used to subsidize the sale of another class.
Each Plan continues in effect from
year to year, provided that each such continuance is approved at least annually by a vote of the Board, including a majority vote of the Board Members who are not interested persons of the Fund and who have no direct
or indirect financial interest in any of the Plans or in any agreement related to the Plans (the Rule 12b-1 Board Members), cast in person at a meeting called for the purpose of voting on such continuance. A Plan may
be terminated at any time, without penalty, by the vote of a majority of the Rule 12b-1 Board Members or by the vote of the holders of a majority of the outstanding shares of the applicable class of the Fund on not
more than 30 days' written notice to any other party to the Plan. The Plans may not be amended to increase materially the amounts to be spent for the services described therein without approval by the shareholders of
the applicable class, and all material amendments are required to be approved by the Board in the manner described above. Each Plan will automatically terminate in the event of its assignment. The Fund will not be
contractually obligated to pay expenses incurred under any Plan if it is terminated or not continued.
Pursuant to each Plan, the Board
will review at least quarterly a written report of the distribution expenses incurred on behalf of each class of shares of the Fund by the Distributor. The report will include an itemization of the distribution
expenses and the purposes of such expenditures. In addition, as long as the Plans remain in effect, the selection and nomination of Rule 12b-1 Board Members shall be committed to the Rule 12b-1 Board Members.
Pursuant to the Distribution
Agreement, the Fund has agreed to indemnify the Distributor to the extent permitted by applicable law against certain liabilities under federal securities laws. In addition to distribution and service fees paid by the
Fund under the Plans, the Manager (or one of its affiliates) may make payments out of its own resources to dealers and other persons which distribute shares of the Fund. Such payments may be calculated by reference to
the NAV of shares sold by such persons or otherwise.
CLASS A SALES CHARGE
AND DISTRIBUTION EXPENSE INFORMATION. Under the Class A Plan, the Fund may pay the Distributor for its distribution-related activities with respect to Class A shares at an annual rate of .30% of the average daily net assets of
the Class A shares. The Class A Plan provides that (1) .25% of the average daily net assets of the Class A shares may be used to pay for personal service and/or the maintenance of shareholder accounts (service fee)
and (2) total distribution fees (including the service fee of .25%) may not exceed .30% of the average daily net assets of the Class A shares. The Prospectus discusses any contractual or voluntary fee waivers that may
be in effect. In addition, if you purchase $1 million or more of Class A shares, you are subject to a 1% CDSC (defined below) for shares redeemed within 12 months of purchase (the CDSC is waived for purchase by
certain retirement and/or benefit plans). (Note: For Prudential Short-Term Corporate Bond Fund only, if you purchase $1 million or more of Class A shares, you are subject to a .50% CDSC for shares redeemed within
18 months of purchase.)
For the most recently completed
fiscal year, the Distributor received payments under the Class A Plan. These amounts were expended primarily for payments of account servicing fees to financial advisers and other persons who sell Class A shares. For
the most recently completed fiscal year, the Distributor also received initial sales charges and proceeds of contingent deferred sales charges paid by shareholders upon certain redemptions of Class A shares. The
amounts received and spent by the Distributor are detailed in the tables below.
CLASS B AND CLASS C SALES CHARGE AND
DISTRIBUTION EXPENSE INFORMATION. Under the Class B and Class C Plans, the Fund may pay the Distributor for its distribution-related activities with respect to Class B and Class C shares at an annual rate of 1% of the
average daily net assets of each of the Class B and Class C shares. The Class B and Class C Plans provide that (1) .25% of the average daily net assets of the shares may be paid as a service fee and (2) .75% (not
including the service fee) of the average daily net
Prudential Investment Portfolios
16 48
assets of the shares (asset based sales charge) may
be paid for distribution-related expenses with respect to the Class B shares and Class C shares. The service fee (.25% of average daily net assets) is used to pay for personal service and/or the maintenance of
shareholder accounts. The Prospectus discusses any voluntary or contractual fee waivers that may be in effect. The Distributor also receives contingent deferred sales charges from certain redeeming shareholders.
For the most recently completed
fiscal year, the Distributor received payments under the Class B and C Plans. These amounts were expended primarily for payments of account servicing fees to financial advisers and other persons who sell Class B and
Class C shares. For the most recently completed fiscal year, the Distributor also received the proceeds of contingent deferred sales charges paid by shareholders upon certain redemptions of Class B and Class C shares.
The amounts received and spent by the Distributor are detailed in the tables below.
CLASS R SALES CHARGE
AND DISTRIBUTION EXPENSE INFORMATION. Under the Class R Plan, the Fund may pay the Distributor for its distribution-related expenses with respect to Class R shares at an annual rate of up to .75% of the average daily net
assets of the Class R shares. The Class R Plan provides that (1) up to .25% of the average daily net assets of the Class R shares may be used as a service fee and (2) total distribution fees (including the service fee
of .25%) may not exceed .75% of the average daily net assets of the Class R shares. There is no CDSC for the redemption of Class R shares. The Prospectus discusses any contractual or voluntary fee waivers that may be
in effect. For the most recently completed fiscal year, the Distributor received payments under the Class R Plan. These amounts were expended primarily for payments of account servicing fees to financial advisors and
other persons who sell Class R shares. The amounts received and spent by the Distributor are detailed in the tables below.
| Payments Received by the Distributor* | |
| Defensive Equity Fund | |
| Class A Distribution and service (12b-1) fees | $114,609 |
| Class A Initial Sales Charges | $32,299 |
| Class A Contingent Deferred Sales Charges (CDSC’s) | $102 |
| Class B Distribution and service (12b-1) fees | $43,203 |
| Class B Contingent Deferred Sales Charges (CDSC’s) | $4,302 |
| Class C Distribution and service (12b-1) fees | $126,026 |
| Class C Contingent Deferred Sales Charges (CDSC’s) | $462 |
| Class R Distribution and service (12b-1) fees | $533 |
*During 2014, the Fund
changed its fiscal year-end from July 31 to October 31. The amounts shown are for the period from August 1, 2014 through October 31, 2014.
| Amounts Spent by Distributor+ | |||||
| Defensive Equity Fund | Share Class | Printing & Mailing Prospectuses to Other than Current Shareholders |
Compensation to Broker/Dealers for Commissions to Representatives and Other Expenses* |
Overhead Costs** | Total Amount Spent by Distributor |
| Class A | $0 | $114,336 | $30,869 | $145,205 | |
| Class B | $12 | $10,796 | $2,886 | $13,694 | |
| Class C | $35 | $119,707 | $8,411 | $128,153 | |
| Class R | $0 | $533 | $70 | $603 | |
+During 2014, the Fund
changed its fiscal year-end from July 31 to October 31. The amounts shown are for the period from August 1, 2014 through October 31, 2014.
* Includes amounts paid to affiliated
broker/dealers.
** Includes sales promotion expenses.
FEE WAIVERS AND SUBSIDIES. PI may from time to time waive all or a portion of its management fee and subsidize all or a portion of the operating expenses of the Fund. In addition, the Distributor may from time to
time waive a portion of the distribution and service (12b-1) fees as described in the Prospectus. Fee waivers and subsidies will increase the Fund's total return.
PAYMENTS TO FINANCIAL SERVICES
FIRMS. As described in the Fund's Prospectus, the Manager or certain of its affiliates (but not the Distributor) have entered into revenue sharing or other similar arrangements with financial
services firms, including affiliates of the Manager. These revenue sharing arrangements are intended to promote the sale of Fund shares or to compensate the financial services firms for marketing or marketing support
activities in connection with the sale of Fund shares.
49
The list below includes the names
of the firms (or their affiliated broker/dealers) that received from the Manager, and/or certain of its affiliates, revenue sharing payments of more than $10,000 in calendar year 2013 for marketing and product support
of the Fund and other Prudential Investments funds as described above.
| ■ | Prudential Retirement |
| ■ | Wells Fargo Advisors, LLC |
| ■ | Ameriprise Financial Services Inc. |
| ■ | Merrill Lynch Pierce Fenner & Smith Inc. |
| ■ | MSSB |
| ■ | UBS Financial Services Inc. |
| ■ | Fidelity |
| ■ | Raymond James |
| ■ | Principal Life Insurance Company |
| ■ | LPL Financial |
| ■ | GWFS Equities, Inc. (Great West) |
| ■ | Nationwide Financial Services Inc. |
| ■ | ADP Broker-Dealer, Inc. |
| ■ | Hartford Life |
| ■ | MSCS Financial Services LLC |
| ■ | ING |
| ■ | Commonwealth Financial Network |
| ■ | American United Life Insurance Company |
| ■ | Charles Schwab & Co., Inc. |
| ■ | Ascensus |
| ■ | JP Morgan Chase Bank, N.A. |
| ■ | MidAtlantic Capital Corp. |
| ■ | NYLIFE Distributors LLC |
| ■ | T. Rowe Price Retirement Plan Services |
| ■ | Lincoln Retirement Services Company LLC |
| ■ | John Hancock USA |
| ■ | Benefit Trust Company |
| ■ | Diversified Investment Advisors |
| ■ | Mercer HR Services, LLC |
| ■ | The Ohio National Life Insurance Company |
| ■ | Security Benefit Life Insurance Company |
| ■ | RBC Capital Markets Corporation |
| ■ | Janney Montgomery & Scott, Inc. |
| ■ | TD Ameritrade Trust Company |
| ■ | Cambridge |
| ■ | Hewitt Associates LLC |
| ■ | Newport Retirement Plan Services, Inc. |
| ■ | Vanguard Group, Inc. |
| ■ | Standard Insurance Company |
| ■ | Securities America, Inc. |
| ■ | Genworth |
| ■ | Massachusetts Mutual Life Insurance Company |
| ■ | Reliance Trust Company |
| ■ | VALIC Retirement Services Company |
| ■ | Wilmington Trust Company |
| ■ | CPI Qualified Plan Consultants, Inc. |
| ■ | First Allied Securities |
| ■ | 1st Global Capital Corp. |
| ■ | ExpertPlan, Inc. |
| ■ | Daily Access Corporation |
| ■ | Oppenheimer & Co. |
| ■ | Northern Trust |
| ■ | Sammons Retirement Solutions, Inc. |
| ■ | Triad Advisors Inc. |
Prudential Investment Portfolios
16 50
| ■ | AXA Equitable Life Insurance Company |
| ■ | United Planners Financial Services of America |
| ■ | Investacorp |
| ■ | Morgan Keegan & Co. |
| ■ | BPAS |
| ■ | National Security Life |
COMPUTATION OF OFFERING PRICE
PER SHARE
Using the NAV at
October 31, 2014, the offering prices of Fund shares were as follows:
| Defensive Equity Fund | |
| Class A | |
| NAV and redemption price per Class A share | $14.26 |
| Maximum initial sales charge (5.50% of public offering price) | $.83 |
| Maximum offering price to public | $15.09 |
| Class B | |
| NAV, offering price and redemption price per Class B share | $14.15 |
| Class C | |
| NAV, offering price and redemption price per Class C share | $14.15 |
| Class R | |
| NAV, offering price and redemption price per Class R share | $14.23 |
| Class Z | |
| NAV, offering price and redemption price per Class Z share | $14.30 |
PORTFOLIO TRANSACTIONS &
BROKERAGE
The Fund has adopted a policy
pursuant to which the Fund and its Manager, Subadvisers and principal underwriter are prohibited from directly or indirectly compensating a broker-dealer for promoting or selling Fund shares by directing brokerage
transactions to that broker. The Fund has adopted procedures for the purpose of deterring and detecting any violations of the policy. The policy permits the Fund, the Manager and the Subadvisers to use selling brokers
to execute transactions in portfolio securities so long as the selection of such selling brokers is the result of a decision that executing such transactions is in the best interest of the Fund and is not influenced
by considerations about the sale of Fund shares. For purposes of this section, the term “Manager” includes the Subadvisers.
The Manager is responsible for
decisions to buy and sell securities, futures contracts and options on such securities and futures for the Fund, the selection of brokers, dealers and futures commission merchants to effect the transactions and the
negotiation of brokerage commissions, if any. On a national securities exchange, broker-dealers may receive negotiated brokerage commissions on Fund portfolio transactions, including options, futures, and options on
futures transactions and the purchase and sale of underlying securities upon the exercise of options. On a foreign securities exchange, commissions may be fixed. Orders may be directed to any broker or futures
commission merchant including, to the extent and in the manner permitted by applicable laws, one of the Manager's affiliates (an affiliated broker). Brokerage commissions on US securities, options and futures
exchanges or boards of trade are subject to negotiation between the Manager and the broker or futures commission merchant.
In the OTC market, securities are
generally traded on a “net” basis with dealers acting as principal for their own accounts without a stated commission, although the price of the security usually includes a profit to the dealer. In
underwritten offerings, securities are purchased at a fixed price which includes an amount of compensation to the underwriter, generally referred to as the underwriter's concession or discount. On occasion, certain
money market instruments and US Government agency securities may be purchased directly from the issuer, in which case no commissions or discounts are paid. The Fund will not deal with an affiliated broker in any
transaction in which an affiliated broker acts as principal except in accordance with the rules of the SEC.
In placing orders for portfolio
securities of the Fund, the Manager's overriding objective is to obtain the best possible combination of favorable price and efficient execution. The Manager seeks to effect such transaction at a price and commission
that provides the most favorable total cost of proceeds reasonably attainable in the circumstances. The factors that the Manager may consider in selecting a particular broker, dealer or futures commission merchant
(firms) are the Manager's knowledge of negotiated commission rates currently available and other current transaction costs; the nature of the portfolio transaction; the size of the transaction; the desired timing of
the trade; the activity existing and expected in the market for the particular transaction; confidentiality; the execution, clearance and settlement capabilities of the firms; the availability of research and
research-related services provided through such
51
firms; the Manager's knowledge of the financial
stability of the firms; the Manager's knowledge of actual or apparent operational problems of firms; and the amount of capital, if any, that would be contributed by firms executing the transaction. Given these
factors, the Fund may pay transaction costs in excess of that which another firm might have charged for effecting the same transaction.
When the Manager selects a firm
that executes orders or is a party to portfolio transactions, relevant factors taken into consideration are whether that firm has furnished research and research-related products and/or services, such as research
reports, research compilations, statistical and economic data, computer databases, quotation equipment and services, research-oriented computer software and services, reports concerning the performance of accounts,
valuations of securities, investment-related periodicals, investment seminars and other economic services and consultations. Such services are used in connection with some or all of the Manager's investment activities;
some of such services, obtained in connection with the execution of transactions for one investment account, may be used in managing other accounts, and not all of these services may be used in connection with the
Fund. The Manager maintains an internal allocation procedure to identify those firms who have provided it with research and research-related products and/or services, and the amount that was provided, and to endeavor
to direct sufficient commissions to them to ensure the continued receipt of those services that the Manager believes provide a benefit to the Fund and its other clients. The Manager makes a good faith determination
that the research and/or service is reasonable in light of the type of service provided and the price and execution of the related portfolio transactions.
When the Manager deems the purchase
or sale of equities to be in the best interests of the Fund or its other clients, including Prudential, the Manager may, but is under no obligation to, aggregate the transactions in order to obtain the most favorable
price or lower brokerage commissions and efficient execution. In such event, allocation of the transactions, as well as the expenses incurred in the transaction, will be made by the Manager in the manner it considers
to be most equitable and consistent with its fiduciary obligations to clients. The allocation of orders among firms and the commission rates paid are reviewed periodically by the Fund's Board. Portfolio securities may
not be purchased from any underwriting or selling syndicate of which any affiliate, during the existence of the syndicate, is a principal underwriter (as defined in the 1940 Act), except in accordance with rules of
the SEC. This limitation, in the opinion of the Fund, will not significantly affect the Fund's ability to pursue its present investment objectives. However, in the future in other circumstances, the Fund may be at a
disadvantage because of this limitation in comparison to other funds with similar objectives but not subject to such limitations.
Subject to the above
considerations, an affiliate may act as a broker or futures commission merchant for the Fund. In order for an affiliate of the Manager to effect any portfolio transactions for the Fund, the commissions, fees or other
remuneration received by the affiliated broker must be reasonable and fair compared to the commissions, fees or other remuneration paid to other firms in connection with comparable transactions involving similar
securities or futures being purchased or sold on an exchange or board of trade during a comparable period of time. This standard would allow the affiliated broker to receive no more than the remuneration which would
be expected to be received by an unaffiliated firm in a commensurate arm's-length transaction. Furthermore, the Board, including a majority of the Independent Board Members, has adopted procedures which are reasonably
designed to provide that any commissions, fees or other remuneration paid to the affiliated broker (or any affiliate) are consistent with the foregoing standard. In accordance with Section 11(a) of the 1934 Act, an
affiliate may not retain compensation for effecting transactions on a national securities exchange for the Fund unless the Fund has expressly authorized the retention of such compensation. The affiliate must furnish
to the Fund at least annually a statement setting forth the total amount of all compensation retained by the affiliate from transactions effected for the Fund during the applicable period. Brokerage transactions with
an affiliated broker are also subject to such fiduciary standards as may be imposed upon the affiliate by applicable law. Transactions in options by the Fund will be subject to limitations established by each of the
exchanges governing the maximum number of options which may be written or held by a single investor or group of investors acting in concert, regardless of whether the options are written or held on the same or
different exchanges or are written or held in one or more accounts or through one or more brokers. Thus, the number of options which the Fund may write or hold may be affected by options written or held by the Manager
and other investment advisory clients of the Manager. An exchange may order the liquidation of positions found to be in excess of these limits, and it may impose certain other sanctions.
Set forth below is
information concerning the payment of commissions by the Fund, including the amount of such commissions paid to an affiliate, if any, for the indicated fiscal years or periods:
| Defensive Equity Fund* | ||||
| 2014 | 2014 | 2013 | 2012 | |
| Total brokerage commissions paid by the Fund | $3,652 | $19,102 | $135,528 | $134,391 |
| Total brokerage commissions paid to affiliated brokers | None | None | None | None |
| Percentage of total brokerage commissions paid to affiliated brokers | 0.00% | 0.00% | 0.00% | 0.00% |
Prudential Investment Portfolios
16 52
| Defensive Equity Fund* | ||||
| 2014 | 2014 | 2013 | 2012 | |
| Percentage of the aggregate dollar amount of portfolio transactions involving the payment of commissions to affiliated brokers | 0.00% | 0.00% | 0.00% | 0.00% |
* During 2014, the Fund
changed its fiscal year-end from July 31 to October 31. The figures shown above are for the fiscal period from August 1, 2014 through October 31, 2014, and the fiscal years ended July 31, 2014, 2013 and 2012.
The Fund is required to disclose
its holdings of securities of its regular brokers and dealers (as defined under Rule 10b-1 under the 1940 Act) and their parents as of the most recently completed fiscal year. As of the most recently completed fiscal
year, the Fund held the following securities of its regular brokers and dealers.
| Broker-Dealer Securities Holdings ($) (as of most recently completed fiscal year)* | |||
| Defensive Equity Fund | Broker/Dealer Name | Equity (E)/Debt (D) | Amount (000’s) |
| Banc of America Securities LLC | E | $2,702,700 | |
| Citigroup Global Markets, Inc. | E | $2,430,262 | |
| Goldman Sachs & Co. | E | $1,170,339 | |
| JPMorgan Chase & Co. | E | $3,405,024 | |
| Morgan Stanley & Co. LLC | E | $807,345 | |
| Wells Fargo Securities LLC | E | $3,774,699 | |
* During 2014, the Fund
changed its fiscal year-end from July 31 to October 31. The figures shown above are as of October 31, 2014.
53
ADDITIONAL INFORMATION
FUND HISTORY. Prudential Investment Portfolios 16 (the “Trust”) was organized as a Delaware statutory trust on July 29, 1998 under the name Prudential Diversified Funds. On September 4,
2001, the Trust amended its Certificate of Trust, changing its name to Strategic Partners Asset Allocation Funds. On September 29, 2006, the Trust further amended its Certificate of Trust, changing its name to Target
Asset Allocation Funds. Effective May 8, 2013, the Trust amended its Certificate of Trust, changing its name to Prudential Investment Portfolios 16. Also on May 8, 2013, Target Moderate Allocation Fund changed its
name to Prudential Defensive Equity Fund. Effective June 21, 2013, Target Growth Allocation Fund was reorganized into Prudential Jennison Equity Income Fund, a series of Prudential Investment Portfolios, Inc. 10. The
Trust presently consists of Prudential Defensive Equity Fund and Prudential Income Builder Fund. On September 23, 2014, the Target Conservative Allocation Fund changed its name to the Prudential Income Builder
Fund.
DESCRIPTION OF SHARES AND
ORGANIZATION. The Trust is authorized to issue an unlimited number of shares of beneficial interest, $.001 par value per share, divided into two series (the Funds). Each Fund is divided into five
classes, designated Class A, Class B, Class C, Class R and Class Z shares. Each class of shares represents an interest in the same assets of the Fund and is identical in all respects except that (1) each class is
subject to different sales charges and distribution and/or service fees (except for Class Z shares, which are not subject to any sales charges or distribution and/or service fees), which may affect performance, (2)
each class has exclusive voting rights on any matter submitted to shareholders that relates solely to its arrangement and has separate voting rights on any matter submitted to shareholders in which the interests of
one class differ from the interests of any other class, (3) each class has a different exchange privilege, (4) Class B shares have a conversion feature and (5) Class R and Class Z shares are offered exclusively for
sale to a limited group of investors. In accordance with the Trust’s Agreement and Declaration of Trust, the Board Members may authorize the creation of additional series and classes within such series, with
such preferences, privileges, limitations and voting and dividend rights as the Board Members may determine. The voting rights of the shareholders of a series or class can be modified only by the vote of shareholders
of that series or class.
Shares of each Fund, when issued,
are fully paid, nonassessable, fully transferable and redeemable at the option of the holder. Shares are also redeemable at the option of the Trust under certain circumstances. Each share of each class is equal as to
earnings, assets and voting privileges, except as noted above, and each class of shares (with the exception of Class Z shares, which are not subject to any distribution or service fees) bears the expenses related to
the distribution of its shares. Except for the conversion feature applicable to the Class B shares, there are no conversion, preemptive or other subscription rights. In the event of liquidation, each share of a Fund
is entitled to its portion of all of the Fund’s assets after all debt and expenses of the Fund have been paid. Since Class B, and Class C shares generally bear higher distribution expenses than Class A and Class
R shares, the liquidation proceeds to shareholders of those classes are likely to be lower than to Class A and Class R shareholders and to Class Z shareholders, whose shares are not subject to any distribution and/or
service fees.
The Trust does not intend to hold
annual meetings of shareholders unless otherwise required by law. The Trust will not be required to hold meetings of shareholders unless, for example, the election of Board Members is required to be acted on by
shareholders under the 1940 Act. Shareholders have certain rights, including the right to call a meeting upon the vote of 10% of the Fund’s outstanding shares for the purpose of voting on the removal of one or
more Board Members or to transact any other business. The Trust will render assistance to those shareholders who call such a meeting.
Under the Agreement and Declaration
of Trust, the Board may authorize the creation of additional series of shares (the proceeds of which would be invested in separate, independently managed portfolios with distinct investment objectives and policies and
share purchase, redemption and NAV procedures) with such preferences, privileges, limitations and voting and dividend rights as the Board Members may determine. All consideration received by the Trust for shares of
any additional series, and all assets in which such consideration is invested, would belong to that series (subject only to the rights of creditors of that series) and would be subject to the liabilities related
thereto.
The Board has the power to alter
the number and the terms of office of the Board Members, provided that at all times at least a majority of the Board Members have been elected by the shareholders of the Trust. The voting rights of shareholders are
not cumulative, so that holders of more than 50 percent of the shares voting can, if they choose, elect all Board Members being selected, while the holders of the remaining shares would be unable to elect any Board
Members.
Prudential Investment Portfolios
16 54
PRINCIPAL SHAREHOLDERS AND
CONTROL PERSONS
To the knowledge of the Fund, the
following persons/entities owned beneficially or of record 5% or more of any class of Fund shares as of the date indicated:
| Prinicipal Fund Shareholders (as of December 11, 2014) | |||
| Shareholder Name | Address | Share Class |
No. of Shares/ % of Fund |
| National Financial Services LLC For Exclusive Benefit Of Our Customers Attn Mutual Funds Dept |
499 Washington Blvd, 4th Fl Jersey City, NJ 07310 |
A | 2,430,311 / 19.05% |
| Special Custody Account For The Exclusive Benefit Of Customers | 2801 Market Street Saint Louis, MO 63103 |
A | 1,576,503 / 12.36% |
| National Financial Services LLC For Exclusive Benefit Of Our Customers Attn Mutual Funds Dept |
499 Washington Blvd, 4th Fl Jersey City, NJ 07310 |
B | 277,412 / 23.09% |
| Special Custody Account For The Exclusive Benefit Of Customers | 2801 Market Street Saint Louis, MO 63103 |
B | 124,325 / 10.35% |
| Special Custody Account For The Exclusive Benefit Of Customers | 2801 Market Street Saint Louis, MO 63103 |
C | 1,932,826 / 54.53% |
| Merrill Lynch, Pierce, Fenner & Smith For The Sole Benefit Of Its Customers |
4800 Deer Lake Drive East Jacksonville, Fl 32246 |
C | 245,650 / 6.93% |
| National Financial Services LLC For Exclusive Benefit Of Our Customers Attn Mutual Funds Dept |
499 Washington Blvd, 4th Fl Jersey City, NJ 07310 |
C | 228,865 / 6.46% |
| Ascensus Trust Company FBO Bent Marine, Inc 401(K) & P/S Plan |
PO Box 10758 Fargo, ND 58106 |
R | 28,916 / 99.09% |
| Special Custody Account For The Exclusive Benefit Of Customers | 2801 Market Street Saint Louis, MO 63103 |
Z | 122,813 / 47.29% |
| National Financial Services LLC For Exclusive Benefit Of Our Customers Attn Mutual Funds Dept |
499 Washington Blvd, 4th Fl Jersey City, NJ 07310 |
Z | 62,752 / 24.16% |
| Merrill Lynch, Pierce, Fenner & Smith For The Sole Benefit Of Its Customers |
4800 Deer Lake Drive East Jacksonville, Fl 32246 |
Z | 23,485 / 9.04% |
As of the date of this SAI, the
Board Members and Officers of the Fund, as a group, owned less than 1% of the outstanding shares of the Fund.
FINANCIAL STATEMENTS
The financial
statements for the Fund for the fiscal period ended October 31, 2014 incorporated in this SAI by reference to the 2014 annual report to shareholders (File No. 811-08915), were audited by KPMG LLP, an independent
registered public accounting firm. You may obtain a copy of the annual report at no charge by request to the Fund by calling (800) 225-1852 or by writing to Prudential Mutual Fund Services LLC, P.O. Box 9658,
Providence, RI 02940.
55
PART II
PURCHASE, REDEMPTION AND
PRICING OF FUND SHARES
SHARE CLASSES. The Fund may offer shares of one or more classes to investors. Not every share class described in this SAI may be offered, and investors should consult their Prospectus for specific
information concerning the share classes that are available to them.
Shares of the Fund may be purchased
at a price equal to the next determined NAV per share plus a sales charge (if applicable) which, at the election of the investor, may be imposed either (1) at the time of purchase (Class A shares) or (2) on a deferred
basis (Class B and Class C shares or Class A shares, in certain circumstances). Class R, Class Y and Class Z shares, if offered, are offered only to a limited group of investors at NAV without any sales charges.
Additional or different classes of
shares may also be offered, including Class I, Class Q, and Class R. If offered, specific information with respect to these share classes is set forth in the Prospectus and SAI.
For more information, see
“How to Buy, Sell and Exchange Fund Shares—How to Buy Shares” in the Prospectus.
PURCHASE BY WIRE. For an initial purchase of shares of the Fund by wire, you must complete an application and telephone PMFS at (800) 225-1852 (toll-free) to receive an account number. PMFS will request
the following information: your name, address, tax identification number, Fund name, class election (if applicable), dividend distribution election, amount being wired and wiring bank. PMFS will also furnish you with
instructions for wiring the funds from your bank to the Fund's Custodian.
If you arrange for receipt by the
Custodian of federal funds prior to the calculation of NAV (once each business day at the close of regular trading on the NYSE, usually 4:00 p.m. Eastern time), on a business day, you may purchase shares of the Fund
as of that day. In the event that regular trading on the NYSE closes before 4:00 p.m. Eastern time, you will receive the following day's NAV if your order to purchase is received after the close of regular trading on
the NYSE.
In making a
subsequent purchase order by wire, you should wire the Custodian directly and should be sure that the wire specifies the Fund name, the share class to be purchased, your name, individual account number, Direct Deposit
Account (DDA) Number and the Fund's Bank Account registration. You do not need to call PMFS to make subsequent purchase orders utilizing federal funds. The minimum amount for subsequent purchase by wire is $100.
ISSUANCE OF FUND SHARES FOR
SECURITIES. Transactions involving the issuance of Fund shares for securities (rather than cash) will be limited to (1) reorganizations, (2) statutory mergers, or (3) other acquisitions of portfolio
securities that: (a) meet the investment objectives and policies of the Fund, (b) are liquid and not subject to restrictions on resale, (c) have a value that is readily ascertainable via listing on or trading in a
recognized United States or international exchange or market, and (d) are approved by the Fund's Manager.
MULTIPLE ACCOUNTS. An institution may open a single master account by filing an application with PMFS, signed by personnel authorized to act for the institution. Individual subaccounts may be opened at the
time the master account is opened by listing them, or they may be added at a later date by written advice. Procedures will be available to identify subaccounts by name and number within the master account name. The
foregoing procedures would also apply to related institutional accounts (i.e., accounts of shareholders with a common institutional or corporate parent). The investment minimums as set forth in the relevant Prospectus
under “How to Buy and Sell Fund Shares—How to Buy Shares” are applicable to the aggregate amounts invested by a group, and not to the amount credited to each subaccount.
REOPENING AN ACCOUNT. Subject to the minimum investment restrictions, an investor may reopen an account, without filing a new application, at any time during the calendar year the account is closed, provided
that the information on that application is still applicable.
RESTRICTIONS ON SALE
OF FUND SHARES. The right of redemption may be suspended or the date of payment may be postponed for a period of up to seven days. Suspensions or postponements may not exceed seven days except at times
(1) when the NYSE is closed for other than customary weekends and holidays, (2) when trading on the NYSE is restricted, (3) when an emergency exists as a result of which disposal of Fund securities is not reasonably
practicable or it is not reasonably practicable for the Fund fairly to determine the value of its net assets, or (4) during any other period when the SEC, by order, so permits; provided that applicable rules and
regulations of the SEC shall govern as to whether the conditions prescribed in (2), (3) or (4) exist.
Prudential Investment Portfolios
16 56
REDEMPTION IN KIND. The Fund may pay the redemption price in whole or in part by a distribution in kind of securities from the investment portfolio of the Fund, in lieu of cash, in conformity with applicable
rules of the SEC and procedures adopted by the Board. Securities will be readily marketable and will be valued in the same manner as in a regular redemption. If your shares are redeemed in kind, you would incur
transaction costs in converting the assets into cash. The Fund, however, has elected to be governed by Rule 18f-1 under the 1940 Act, under which the Fund is obligated to redeem shares solely in cash up to the lesser
of $250,000 or 1% of the NAV of the Fund during any 90-day period for any one shareholder. Redemption in kind is generally not available for the Prudential Jennison MLP Fund.
RIGHTS OF ACCUMULATION. Reduced sales charges are also available through Rights of Accumulation, under which an investor or an eligible group of related investors, as described under “Reducing or Waiving
Class A's Initial Sales Charge” in the Prospectus, may aggregate the value of their existing holdings of Class A, Class B, and Class C shares of the Fund and shares of other Prudential Investments mutual funds
(excluding money market funds other than those acquired pursuant to the exchange privilege) to determine the reduced sales charge. However, the value of shares held directly with PMFS and through your broker will not
be aggregated to determine the reduced sales charge. The value of existing holdings for purposes of determining the reduced sales charge is calculated using the maximum offering price (NAV plus maximum sales charge).
The Distributor, your broker or PMFS must be notified at the time of purchase that the investor is entitled to a reduced sales charge. Reduced sales charges will be granted subject to confirmation of the investor's
holdings. This does not apply to Prudential MoneyMart Assets, Inc.
SALE OF SHARES. You can redeem your shares at any time for cash at the NAV next determined after the redemption request is received in proper form (in accordance with procedures established by PMFS in
connection with investors' accounts) by PMFS or your broker or other financial intermediary. See “Net Asset Value” below. In certain cases, however, redemption proceeds will be reduced by the amount of any
applicable contingent deferred sales charge (CDSC), as described in “Contingent Deferred Sales Charge” below. If you are redeeming your shares through a broker, your broker must receive your sell order
before the NAV is computed for that day (at the close of regular trading on the NYSE, usually, 4:00 p.m. Eastern time) in order to receive that day's NAV. In the event that regular trading on the NYSE closes before
4:00 p.m. Eastern time, you will receive the following day's NAV if your order to sell is received after the close of regular trading on the NYSE. Your broker will be responsible for furnishing all necessary
documentation to the Distributor and may charge you for its services in connection with redeeming shares of the Fund.
All correspondence and documents
concerning redemptions should be sent to the Fund in care of PMFS, P.O. Box 9658, Providence, Rhode Island 02940 or to your broker or other financial intermediary.
If you hold shares in
non-certificate form, a written request for redemption signed by you exactly as the account is registered is required. If you hold certificates, the certificates must be received by PMFS, the Distributor or your
broker in order for the redemption request to be processed. If redemption is requested by a corporation, partnership, trust or fiduciary, written evidence of authority acceptable to PMFS must be submitted before such
request will be accepted. All correspondence and documents concerning redemptions should be sent to the Fund in care of PMFS, P.O. Box 9658, Providence, RI 02940, to the Distributor or to your broker.
Payment for redemption of recently
purchased shares will be delayed until the Fund or PMFS has been advised that the purchase check has been honored, which may take up to 7 calendar days from the time of receipt of the purchase check by PMFS. Such
delay may be avoided by purchasing shares by wire or by certified or cashier's check.
SIGNATURE GUARANTEE. If the proceeds of the redemption (1) exceed $100,000, (2) are to be paid to a person other than the record owner, (3) are to be sent to an address other than the address on PMFS’
records, (4) are to be paid to a corporation, partnership, trust or fiduciary, or (5) are to be paid due to the death of the shareholder or on behalf of the shareholder, and your shares are held directly with PMFS,
the signature(s) on the redemption request or stock power must be medallion signature guaranteed. The medallion signature guarantee must be obtained from an authorized officer of a bank, broker, dealer, securities
exchange or association, clearing agency, savings association, or credit union that is participating in one of the recognized medallion programs (STAMP, SEMP, or NYSE MSP). The medallion signature guarantee must be
appropriate for the dollar amount of the transaction. PMFS reserves the right to reject transactions where the value of the transaction exceeds the value of the surety coverage indicated on the medallion imprint. PMFS
also reserves the right to request additional information from, and make reasonable inquires of, any institution that provides a medallion signature guarantee. In the case of redemptions from a PruArray Plan, if the
proceeds of the redemption are invested in another investment option of the plan in the name of the record holder and at the same address as reflected in PMFS' records, a medallion signature guarantee is not
required.
Payment for shares presented for
redemption will be made by check within seven days after receipt by PMFS or your broker of the written request and certificates, if issued, except as indicated below. If you hold shares through a broker, payment for
shares presented for redemption will be credited to your account at your broker, unless you indicate otherwise. Such payment may be postponed or the right of redemption suspended at times (1) when the NYSE is closed
for other than customary weekends and holidays, (2) when
57
trading on the NYSE is restricted, (3) when an
emergency exists as a result of which disposal by the Fund of securities owned by it is not reasonably practicable or it is not reasonably practicable for the Fund fairly to determine the value of its net assets, or
(4) during any other period when the SEC, by order, so permits; provided that applicable rules and regulations of the SEC shall govern as to whether the conditions prescribed in (2), (3) or (4) exist.
EXPEDITED REDEMPTION PRIVILEGE. By electing the Expedited Redemption Privilege, you may arrange to have redemption proceeds sent to your bank account. The Expedited Redemption Privilege may be used to redeem shares in an
amount of $100 or more, except if an account for which an expedited redemption is requested has an NAV of less than $100, the entire account will be redeemed. Redemption proceeds in the amount of $500 or more will be
remitted by wire to your bank account at a domestic commercial bank which is a member of the Federal Reserve system. The money would generally be received by your bank within one business day of the redemption.
Redemption proceeds of less than $500 will be sent by ACH to your bank which must be a member of the Automated Clearing House (ACH) system. The money would generally be received by your bank within three business days
of the redemption. Any applicable CDSC will be deducted from the redemption proceeds. Expedited redemption requests may be made by telephone or letter, must be received by the Transfer Agent prior to 4:00 p.m. Eastern
time to receive a redemption amount based on that day's NAV and are subject to the terms and conditions as set forth in the Prospectus regarding redemption of shares. In the event that regular trading on the NYSE
closes before 4:00 p.m. Eastern time, you will receive the following day's NAV if your order to sell is received after the close of regular trading on the NYSE. For more information, see “How to Buy, Sell and
Exchange Fund Shares-Telephone Redemptions or Exchanges” in the Prospectus. The Expedited Redemption Privilege may be modified or terminated at any time without notice. To receive further information,
shareholders should contact PMFS.
INVOLUNTARY REDEMPTION. If the value of your account with PMFS is less than $500 for any reason, we may sell the rest of your shares (without charging any CDSC) and close your account. The involuntary sale
provisions do not apply to: (i) an individual retirement account (IRA) or other qualified or tax-deferred retirement plan or account, (ii) Automatic Investment Plan (AIP) accounts, employee savings plan accounts or
payroll deduction plan accounts, (iii) accounts with the same registration associated with multiple share classes within the Fund, or (iv) clients with assets more than $50,000 across the Prudential Investments family
of mutual funds. “Client” for this purpose has the same definition as for purposes of Rights of Accumulation, i.e., an investor and an eligible group of related investors.
We have the right
to reject any purchase order (including an exchange into a Fund) or suspend or modify a Fund's sales of its shares under certain circumstances. These circumstances include, but are not limited to, failure by you to
provide additional information requested, such as information required to verify the source of funds used to purchase shares, your identity or the identity of any underlying beneficial owners of your shares.
Furthermore, we are required by law to close your account if you do not provide the required identifying information; this would result in the redemption of shares at the then-current day's NAV and the proceeds would
be remitted to you via check. We will attempt to verify your identity within a reasonable time frame (e.g., 60 days) which may change from time to time.
ACCOUNT MAINTENANCE FEE. In order to offset the disproportionate effect (in basis points) of expenses associated with servicing lower balance accounts, if the value of your account with PMFS is less than $10,000,
a $15 annual account maintenance fee (“account maintenance fee”) will be deducted from your account. The account maintenance fee will be assessed during the 4th calendar quarter of each year. Any
applicable CDSC on the shares redeemed to pay the account maintenance fee will be waived. The account maintenance fee will not be charged on: (i) accounts during the first six months from inception of the account,
(ii) accounts for which you have elected to receive your account statements, transaction confirmations, prospectuses, and fund shareholder reports electronically rather than by mail, (iii) omnibus accounts or other
accounts for which the dealer is responsible for recordkeeping, (iv) institutional accounts, (v) group retirement plans (including SIMPLE IRA plans, profit-sharing plans, money purchase pension plans, Keogh plans,
defined compensation plans, defined benefit plans and 401(k) plans), (vi) AIP accounts or employee savings plan accounts, (vii) accounts with the same registration associated with multiple share classes within the
Fund, provided that the aggregate value of share classes with the same registration within the Fund is $10,000 or more, or (viii) clients with assets of $50,000 or more across the Prudential Investments family of
mutual funds. “Client” for this purpose has the same definition as for purposes of Rights of Accumulation, i.e., an investor and an eligible group of related investors or other financial
intermediary.
90 DAY REPURCHASE PRIVILEGE. If you redeem your shares and have not previously exercised the repurchase privilege, you may reinvest back into your account any portion or all of the proceeds of such redemption in
shares of the Fund at the NAV next determined after the order is received, which must be within 90 days after the date of the redemption. Any CDSC paid in connection with such redemption in Class A, Class B or Class C
shares will be credited (in shares) to your account. (If less than a full repurchase is made, the credit will be on a pro rata basis.) You must notify PMFS, either directly or through the Distributor or your broker,
at the time the repurchase privilege is exercised to adjust your account for the CDSC you previously paid. Thereafter, any redemptions will be subject to the CDSC applicable at the time of the redemption. See
“Contingent Deferred Sales Charge” below. Exercise of the
Prudential Investment Portfolios
16 58
repurchase privilege will generally not affect
federal tax treatment of any gain realized upon redemption. However, if the redemption was made within a 30 day period of the repurchase and if the redemption resulted in a loss, some or all of the loss, depending on
the amount reinvested, may not be allowed for federal income tax purposes.
CONTINGENT DEFERRED SALES CHARGE
(CDSC)
Class A. Investors who purchase $1 million or more of Class A shares and sell these shares within 12 months of purchase are subject to a 1% CDSC. (Note: For Prudential Short-Term Corporate Bond Fund, Inc. only, investors who purchase $1 million or more of Class A shares and then sell these shares within 18 months of
purchase are subject to a 0.50% CDSC).
Class B. Redemptions of Class B shares will be subject to a CDSC declining from 5% to zero over a six-year period (or a four-year period in the case of Prudential Short-Term Corporate Bond Fund, Inc.).
Class C. Class C shares redeemed within 12 months of purchase will be subject to a 1% CDSC. The CDSC will be deducted from the redemption proceeds and reduce the amount paid to you.
Waiver of CDSC. The Class A, Class B, or Class C CDSC is waived if the shares are sold:
| ■ | After a shareholder is deceased or permanently disabled (or, in the case of a trust account, after the death or disability of the grantor). This waiver applies to individual shareholders as well as shares held in joint tenancy, provided the shares were purchased before the death or permanent disability, |
| ■ | To provide for certain distributions—made without IRS penalty—from a qualified or tax-deferred retirement plan, benefit plan, IRA or Section 403(b) custodial account, |
| ■ | To withdraw excess contributions from a qualified or tax-deferred retirement plan, IRA or Section 403(b) custodial account, |
| ■ | For redemptions by certain retirement or benefit plans (Class A shares only), |
| ■ | On certain redemptions effected through a Systematic Withdrawal Plan (Class B shares only), and |
| ■ | For redemptions by certain group retirement plans for which Prudential or brokers not affiliated with Prudential provide administrative or record keeping services. The CDSC will also be waived for certain redemptions by benefit plans sponsored by Prudential and its affiliates. For more information, call Prudential Retirement at (800) 353-2847. (Class C shares only) |
If you purchase Class Z shares (see
“Qualifying for Class Z Shares” in the Prospectus) within 5 days of redemption of your Class A shares that you had purchased directly through the Fund's transfer agent, we will credit your account with the
appropriate number of shares to reflect any CDSC you paid on the reinvested portion of your redemption proceeds.
Calculation of CDSC. The CDSC will be imposed on any redemption that reduces the current value of your Class A, Class B or Class C shares to an amount which is lower than the amount of all payments by you for
shares during the preceding 12 months in the case of Class A shares (in certain cases), 6 years in the case of Class B shares (or four years in the case of Prudential Short-Term Corporate Bond Fund, Inc. Class B shares), and 12 months in the case of Class C shares. A CDSC will be applied on the lesser of the original purchase price or the current value of the shares being redeemed. Increases in the value
of your shares or shares acquired through reinvestment of dividends or distributions are not subject to a CDSC. The amount of any CDSC will be paid to and retained by the Distributor. If you purchased or hold your
shares through a broker, third party administrator or other authorized entity that maintains subaccount recordkeeping, any applicable CDSC that you will pay will be calculated and reported to PMFS by such broker,
administrator or other authorized entity.
The amount of the CDSC, if any,
will vary depending on the number of years from the time of payment for the purchase of shares until the time of redemption of such shares. The CDSC will be calculated from the date of the initial purchase, excluding
the time shares were held in Class B or Class C shares of a money market fund. See “Shareholder Services—Exchange Privileges” below.
In determining whether a CDSC is
applicable to a redemption, the calculation will be made in a manner that results in the lowest possible rate. It will be assumed that the redemption is made first of amounts representing shares acquired pursuant to
the reinvestment of dividends and distributions; then of amounts representing the increase in NAV above the total amount of payments for the purchase of Class A shares made during the preceding 12 months (in certain
cases), 6 years for Class B shares (four years in the case of Prudential Short-Term Corporate Bond Fund, Inc.) and 12 months for Class C shares; then of amounts representing the cost of shares held beyond the applicable
CDSC period; and finally, of amounts representing the cost of shares held for the longest period of time within the applicable CDSC period.
For example, assume you purchased
100 Class B shares at $10 per share for a cost of $1,000. Subsequently, you acquired 5 additional Class B shares through dividend reinvestment. During the second year after the purchase you decided to redeem $500 of
your investment. Assuming at the time of the redemption the NAV had appreciated to $12 per share, the value of your Class B shares would
59
be $1,260 (105 shares at $12 per share). The CDSC
would not be applied to the value of the reinvested dividend shares and the amount which represent appreciation ($260). Therefore, $240 of the $500 redemption proceeds ($500 minus $260) would be charged at a rate of
4% (the applicable rate in the second year after purchase) for a total CDSC of $9.60.
For federal income tax purposes,
the amount of the CDSC will reduce the gain or increase the loss, as the case may be, on the amount recognized on the redemption of shares.
As noted above, the CDSC will be
waived in the case of a redemption following the death or permanent disability of a shareholder or, in the case of a trust account, following the death or permanent disability of the grantor. The waiver is available
for total or partial redemptions of shares owned by a person, either individually or in joint tenancy at the time of death or initial determination of permanent disability, provided that the shares were purchased
prior to death or permanent disability.
The CDSC will be waived in the case
of a total or partial redemption in connection with certain distributions under the Code from a tax-deferred retirement plan, an IRA or Section 403(b) custodial account. For distributions from an IRA or 403(b)
custodial account, the shareholder must submit a copy of the distribution form from the custodial firm indicating (i) the date of birth of the shareholder and (ii) that the shareholder is over age 70 1⁄2. The distribution form must be signed by the shareholder.
SYSTEMATIC WITHDRAWAL PLAN. The CDSC will be waived (or reduced) on certain redemptions of Class B shares effected through a Systematic Withdrawal Plan. On an annual basis, up to 12% of the total dollar amount
subject to the CDSC may be redeemed without charge. PMFS will calculate the total amount available for this waiver annually on the anniversary date of your purchase. The CDSC will be waived (or reduced) on redemptions
until this threshold of 12% is reached. The Systematic Withdrawal Plan is not available to participants in certain retirement plans. Please contact PMFS at (800) 225-1852 for more details.
In addition, the CDSC will be
waived on redemptions of shares held by Board Members of the Funds.
You must notify PMFS either
directly or through your broker, at the time of redemption that you are entitled to a waiver of the CDSC and provide PMFS or your broker with such supporting documentation as it may deem appropriate. The waiver will
be granted subject to confirmation of your entitlement.
PMFS reserves the right to request
such additional documents as it may deem appropriate.
AUTOMATIC CONVERSION OF CLASS B
SHARES. Class B shares will automatically convert to Class A shares on a quarterly basis approximately seven years after purchase.
Note: Class B shares of Prudential Short-Term Corporate Bond Fund, Inc. will automatically convert to Class A shares on a quarterly basis approximately five years after purchase.
The number of Class B shares
eligible to convert to Class A shares will be the total number of shares that have completed their aging schedule (including any time spent at 0% liability), plus all shares acquired through the reinvestment of
dividends for Class B shares.
Since annual distribution-related
fees are lower for Class A shares than Class B shares, the per share NAV of the Class A shares may be higher than that of the Class B shares at the time of conversion. Thus, although the aggregate dollar value will be
the same, you may receive fewer Class A shares than Class B shares converted.
For purposes of calculating the
applicable holding period for conversions, for Class B shares previously exchanged for shares of a money market fund, the time period during which such shares were held in a money market fund will be excluded for the
Class B shares. For example, Class B shares held in a money market fund for one year would not convert to Class A shares until approximately eight years. Class B shares acquired through exchange will convert to Class
A shares after expiration of the conversion period applicable to the original purchaser of such shares.
The conversion feature may be
subject to the continuing availability of opinions of counsel or rulings of the IRS (1) that the dividends and other distributions paid on Class A, Class B, Class C, Class I, Class Q, Class R, Class Y and Class Z
shares will not constitute “preferential dividends” under the Code and (2) that the conversion of shares does not constitute a taxable event for federal income tax purposes. The conversion of Class B
shares into Class A shares may be suspended if such opinions or rulings are no longer available. If conversions are suspended, Class B shares of the Fund will continue to be subject, possibly indefinitely, to their
higher annual distribution and service fee. Shareholders should consult their tax advisers regarding the tax consequences of the conversion or exchange of shares.
Prudential Investment Portfolios
16 60
Class A, Class Z and Class R shares
may be converted to Class Q shares under certain limited circumstances. Please contact PMFS at (800) 225-1852 for more details.
NET ASSET VALUE
The price an investor pays for a
Fund share is based on the share value. The share value—known as the net asset value per share or NAV—is determined by subtracting Fund liabilities from the value of Fund assets and dividing the remainder
by the number of outstanding shares. NAV is calculated separately for each class. The Fund will compute its NAV once each business day at the close of regular trading on the NYSE, usually 4:00 p.m. Eastern time. For
purposes of computing NAV, the Fund will value futures contracts generally 15 minutes after the close of regular trading on the NYSE. The Fund may not compute its NAV on days on which no orders to purchase, sell or
exchange shares of the Fund have been received or on days on which changes in the value of the Fund's portfolio securities do not materially affect NAV. Please see the NYSE website (www.nyse.com) for a specific list
of the holidays on which the NYSE is closed.
In accordance with
procedures adopted by the Board, the value of investments listed on a securities exchange and NASDAQ System securities (other than options on stock and stock indices) are valued at the last sale price on the day of
valuation or, if there was no sale on such day, the mean between the last bid and asked prices on such day, or at the bid price on such day in the absence of an asked price, as provided by a pricing service or
principal market marker. Securities included on the NASDAQ Market are valued at the NASDAQ Official Closing Price (NOCP) on the day of valuation, or if there was no NOCP, at the last sale price. NASDAQ Market
Securities for which there was no NOCP or last sale price are valued at the mean between the last bid and asked prices on the day of valuation, or the last bid price in the absence of an asked price. Corporate bonds
(other than convertible debt securities) and US Government securities that are actively traded in the OTC market, including listed securities for which the primary market is believed by the Manager in consultation
with the subadviser to be over-the-counter, are valued on the basis of valuations provided by an independent pricing agent which uses information with respect to transactions in bonds, quotations from bond dealers,
agency ratings, market transactions in comparable securities and various relationships between securities in determining value. Convertible debt securities that are actively traded in the over-the-counter market,
including listed securities for which the primary market is believed by the Manager in consultation with the subadviser to be OTC, are valued on the day of valuation at an evaluated bid price provided by an
independent pricing agent, or, in the absence of valuation provided by an independent pricing agent, at the bid price provided by a principal market maker or primary market dealer.
OTC options on stock and stock
indices traded on an exchange are valued at the mean between the most recently quoted bid and asked prices on the respective exchange and futures contracts and options thereon are valued at their last sale prices as
of the close of trading on the applicable commodities exchange or if there was no sale on the applicable commodities exchange on such day, at the mean between the most recently quoted bid and asked prices on such
exchange or at the last bid price in the absence of an asked price. Quotations of foreign securities in a foreign currency are converted to US dollar equivalents at the current rate obtained from a recognized bank,
dealer or independent service, and forward currency exchange contracts are valued at the current cost of covering or offsetting such contacts. Should an extraordinary event, which is likely to affect the value of the
security, occur after the close of an exchange on which a portfolio security is traded, such security will be valued at fair value considering factors determined in good faith by the subadviser or Manager under
procedures established by and under the general supervision of the Fund's Board.
Under the 1940 Act, the Board is
responsible for determining in good faith the fair value of securities of the Fund. Portfolio securities for which reliable market quotations are not readily available or for which the pricing agent or principal
market maker does not provide a valuation or methodology or provides a valuation or methodology that, in the judgment of the Manager or subadviser (or Valuation Committee or Board) does not represent fair value (Fair
Value Securities), are valued by the Valuation Committee or Board in consultation with the subadviser or Manager, as applicable, including, as applicable, their portfolio managers, traders, research and credit
analysts, and legal and compliance personnel, on the basis of the following factors: the nature of any restrictions on disposition of the securities; assessment of the general liquidity/illiquidity of the securities;
the issuer's financial condition and the markets in which it does business; the cost of the investment; the size of the holding and the capitalization of issuer; the prices of any recent transactions or bids/offers
for such securities or any comparable securities; any available analyst, media or other reports or information deemed reliable by the Manager or subadviser regarding the issuer or the markets or industry in which it
operates; other analytical data; consistency with valuation of similar securities held by other Prudential Investments mutual funds; and such other factors as may be determined by the subadviser, Manager, Board or
Valuation Committee to materially affect the value of the security. Fair Value Securities may include, but are not limited to, the following: certain private placements and restricted securities that do not have an
active trading market; securities whose trading has been suspended or for which market quotes are no longer available; debt securities that have recently gone into default and for which there is no current market;
securities whose prices are stale; securities affected by significant events; and securities that the subadviser or Manager believes were priced incorrectly.
61
A “significant event”
(which includes, but is not limited to, an extraordinary political or market event) is an event that the subadviser or Manager believes with a reasonably high degree of certainty has caused the closing market prices
of portfolio securities to no longer reflect their value at the time of the NAV calculation. On a day that the Manager determines that one or more portfolio securities constitute Fair Value Securities, the
Manager’s Fair Valuation Committee may determine the fair value of these securities if the fair valuation of each security results in a change of less than $0.01 to the Fund's NAV and/or the fair valuation of
the securities in the aggregate results in a change of less than one half of one percent of the Fund's daily net assets and the Fair Valuation Committee presents these valuations to the Board for its ratification. In
the event that the fair valuation of a security results in a NAV change of $0.01 or more per share and/or in the aggregate results in a change of one half of one percent or more of the daily NAV, the Board shall
promptly be notified, in detail, of the fair valuation, and the fair valuation will be reported on and presented for ratification at the next regularly scheduled Board meeting. Also, the Board receives, on an interim
basis, minutes of the meetings of the Valuation Committee that occur between regularly scheduled Board meetings.
In addition, the Fund use a service
provided by a pricing vendor to fair value Foreign Fair Value Securities, which are securities that are primarily traded in non-US markets and subject to a valuation adjustment upon the reaching of a valuation
“trigger” determined by the Board. The fair value prices of Foreign Fair Value Securities reflect an adjustment to closing market prices that is intended to reflect the causal link between movements in the
US market and the non-US market on which the securities trade.
The use of fair value pricing
procedures involves subjective judgments and it is possible that the fair value determined for a security may be materially different from the value that could be realized upon the sale of that security. Accordingly,
there can be no assurance that the Fund could obtain the fair value assigned to a security if the security were sold at approximately the same time at which the NAV per share is determined.
Securities for which reliable
market quotations are not available or for which the pricing agent or principal market maker does not provide a valuation or provides a valuation that, in the judgment of the Manager, does not present fair value,
shall be valued in accordance with the following procedures: At the time of purchase, the duration of the security is to be determined. A Treasury issue (or similar security or index for which market quotes are
readily available) (the “Proxy”) of similar duration will then be selected to serve as a Proxy for the price movements of the security. The price of the security will fluctuate exactly as does the Proxy
while maintaining the initial price spread constant. The duration of the security will be reviewed once a month by one or more of the portfolio managers, and at any other time that a portfolio manager believes that
there may have been a material change in the duration of the security. Should the duration change, another security or index of similar duration will be chosen to serve as Proxy, at which point the price spread will
be determined. In addition, the validity of the pricing methodology will be monitored by (1) comparing the actual sales proceeds of the security to its price reported by the Fund at the time of the sale and (2)
periodically obtaining actual market quotes for the security.
Generally, we will value the Fund's
futures contracts at the close of trading for those contracts (normally 15 minutes after the close of regular trading on the NYSE). If, in the judgment of the subadviser or Manager, the closing price of a contract is
materially different from the contract price at the NYSE close, a fair value price for the contract will be determined.
If dividends are declared daily,
the NAV of each class of shares will generally be the same. It is expected, however, that the dividends, if any, will differ by approximately the amount of the distribution and/or service fee expense accrual
differential among the classes.
SHAREHOLDER SERVICES
Upon the initial
purchase of Fund shares, a Shareholder Investment Account is established for each investor under which a record of the shares is maintained by PMFS. Share certificates are no longer issued for shares of the Fund. The
Fund furnishes to shareholders the following privileges and plans:
AUTOMATIC REINVESTMENT OF DIVIDENDS
AND/OR DISTRIBUTIONS. For the convenience of investors, all dividends and distributions are automatically reinvested in full and fractional shares of the Fund at NAV per share. An investor may direct PMFS in
writing not less than five full business days prior to the record date to have subsequent dividends and/or distributions sent in cash rather than reinvested. In the case of recently purchased shares for which
registration instructions have not been received by the record date, cash payment will be made directly to the broker. Any shareholder who receives dividends or distributions in cash may subsequently reinvest any such
dividend or distribution at NAV by returning the check or the proceeds to PMFS within 30 days after the payment date. Such reinvestment will be made at the NAV per share next determined after receipt of the check or
the proceeds by PMFS. Shares purchased with reinvested dividends and/or distributions will not be subject to any CDSC upon redemption.
EXCHANGE
PRIVILEGES. The Fund furnishes to shareholders the privilege of exchanging their shares of the Fund for shares of certain other Prudential Investments mutual funds, including one or more specified
money market funds, subject in each case to the minimum investment requirements of such funds. Shares of such other Prudential Investments mutual funds may also be exchanged
Prudential Investment Portfolios
16 62
for shares of the Fund. All exchanges are made on
the basis of the relative NAV next determined after receipt of an order in proper form. An exchange will be treated as a redemption and purchase for federal income tax purposes. Shares may be exchanged for shares of
another fund only if shares of such fund may legally be sold under applicable state laws. For retirement and group plans having a limited menu of Prudential Investments mutual funds, the exchange privilege is
available for those funds eligible for investment in the particular program.
It is contemplated that the
exchange privilege may be applicable to new Prudential Investments mutual funds, the shares of which may be distributed by the Distributor.
In order to exchange shares by
telephone, you must authorize telephone exchanges on your initial application form or by written notice to PMFS and hold shares in non-certificated form. Thereafter, you may call the Fund at (800) 225-1852 to execute
a telephone exchange of shares, on weekdays, except holidays, between the hours of 8:00 a.m. and 6:00 p.m. Eastern time. For your protection and to prevent fraudulent exchanges, your telephone call will be recorded
and you will be asked to authenticate your account. A written confirmation of the exchange transaction will be sent to you. Neither the Fund nor its agents will be liable for any loss, liability or cost which results
from acting upon instructions reasonably believed to be genuine under the foregoing procedures. All exchanges will be made on the basis of the relative NAV of the two funds next determined after the request is
received in good order.
If you hold shares through a
brokerage firm, you must exchange your shares by contacting your financial adviser.
If you hold share certificates, the
certificates must be returned in order for the shares to be exchanged. See “Purchase, Redemption and Pricing of Fund Shares—Sale of Shares” above.
You may also exchange shares by
mail by writing to PMFS, P.O. Box 9658, Providence, RI 02940.
In periods of severe market or
economic conditions the telephone exchange of shares may be difficult to implement and you should make exchanges by mail by writing to PMFS at the address noted above.
Class A shares: Shareholders of the Fund may exchange their Class A shares for Class A shares of certain other Prudential Investments mutual funds and shares of the money market funds specified below. No
fee or sales load will be imposed upon the exchange. Shareholders of money market funds who acquired such shares upon exchange of Class A shares may use the exchange privilege only to acquire Class A shares of the
Prudential Investments mutual funds participating in the exchange privilege.
The following money market fund
participates in the Class A exchange privilege: Prudential MoneyMart Assets, Inc. (Class A shares).
Participants in certain programs
sponsored by broker-dealers, investment advisers and financial planners who have agreements with Prudential, or whose programs are available through financial intermediaries that have agreements with Prudential
relating to mutual fund “wrap” or asset allocation programs or mutual fund “supermarket” programs, for which the Fund is an available option, may have their Class A shares, if any, exchanged
for Class Z shares of the Fund, if available as an investment option, when they elect to have those assets become a part of the program. Upon leaving the program (whether voluntarily or not), such Class Z shares (and,
to the extent provided for in the program, Class Z shares acquired through participation in the program) may be exchanged for Class A shares of the Fund at NAV if Class Z shares are not available to the shareholder as
an investment option outside the program. Contact your program sponsor or financial intermediary with any questions.
Class B and Class C shares: Shareholders of the Fund may exchange their Class B and Class C shares of the Fund for Class B and Class C shares, respectively, of other Prudential Investments mutual funds. No CDSC will
be payable upon such exchange, but a CDSC may be payable upon the redemption of the Class B and Class C shares acquired as a result of an exchange. The applicable sales charge will be that imposed by the fund in which
shares were initially purchased and the purchase date will be deemed to be the date of the initial purchase, rather than the date of the exchange, excluding any time Class B or Class C shares were held in a money
market fund.
Class B and Class C shares may also
be exchanged for shares of Prudential MoneyMart Assets, Inc. without imposition of any CDSC at the time of exchange. Upon subsequent redemption from such money market fund or after re-exchange into a Fund, such shares
will be subject to the CDSC calculated without regard to the time such shares were held in the money market fund. For purposes of calculating the seven year holding period applicable to the Class B conversion feature,
the time period during which Class B shares were held in a money market fund will be excluded.
63
At any time after acquiring shares
of other funds participating in the Class B or Class C exchange privilege, a shareholder may again exchange those shares (and any reinvested dividends and distributions) for Class B or Class C shares of a Fund without
subjecting such shares to any CDSC. Shares of any fund participating in the Class B or Class C exchange privilege that were acquired through reinvestment of dividends or distributions may be exchanged for Class B or
Class C shares of other funds without being subject to any CDSC.
Class Q shares: Class Q shares may be exchanged for Class Q shares of other Prudential Investments mutual funds.
Class R shares: Class R shares may be exchanged for Class R shares of other Prudential Investments mutual funds.
Class Z shares: Class Z shares may be exchanged for Class Z shares of other Prudential Investments mutual funds.
Shareholders who qualify to
purchase Class Z shares may have their Class B and Class C shares which are not subject to a CDSC and their Class A shares exchanged for Class Z shares upon notification. Eligibility for this exchange privilege will
be calculated on the business day prior to the date of the exchange. Amounts representing Class B or Class C shares which are not subject to a CDSC include the following: (1) amounts representing Class B or Class C
shares acquired pursuant to the automatic reinvestment of dividends and distributions, (2) amounts representing the increase in the NAV above the total amount of payments for the purchase of Class B or Class C shares
and (3) amounts representing Class B or Class C shares held beyond the applicable CDSC period. Class B and Class C shareholders must notify PMFS either directly or through Wells Fargo Advisors, Pruco Securities, LLC
or another broker that they are eligible for this special exchange privilege.
Participants in any fee-based
program for which the Fund is an available option may arrange with the Transfer Agent or their recordkeeper to have their Class A shares, if any, exchanged for Class Z shares when they elect to have those assets
become a part of the fee-based program. Upon leaving the program (whether voluntarily or not), the participant may arrange with the Transfer Agent or their recordkeeper to have such Class Z shares acquired through
participation in the program exchanged for Class A shares at NAV. Similarly, participants in Wells Fargo Advisors' 401(k) Plan for which the Fund's Class Z shares are an available option and who wish to transfer their
Class Z shares out of the Wells Fargo Advisors 401(k) Plan following separation from service (i.e., voluntary or involuntary termination of employment or retirement) may arrange with the Transfer Agent or their
recordkeeper to have their Class Z shares exchanged for Class A shares at NAV.
Additional details about the
exchange privilege and prospectuses for each of the Prudential Investments mutual funds are available from PMFS, the Distributor or your broker. The special exchange privilege may be modified, terminated or suspended
on sixty days' notice, and the Fund, or the Distributor, has the right to reject any exchange application relating to the Fund's shares.
AUTOMATIC INVESTMENT PLAN
(AIP). Under AIP, an investor may arrange to have a fixed amount automatically invested in shares of the Fund by authorizing his or her bank account or brokerage account to be debited to invest
specified dollar amounts in shares of the Fund. The investor's bank must be a member of the Automated Clearing House System.
Further information about this
program and an application form can be obtained from PMFS, the Distributor or your broker.
SYSTEMATIC WITHDRAWAL PLAN. A Systematic Withdrawal Plan is available to shareholders through the PMFS or your broker. The Systematic Withdrawal Plan provides for monthly, quarterly, semi-annual or annual redemptions
in any amount, except as provided below, up to the value of the shares in the shareholder's account. Systematic withdrawals of Class A (in certain instances), Class B and Class C shares may be subject to a CDSC. The
Systematic Withdrawal Plan is not available to participants in certain retirement plans. Please contact PMFS at (800) 225-1852 for more details.
PMFS, the Distributor or your
broker acts as an agent for the shareholder in redeeming sufficient full and fractional shares to provide the amount of the systematic withdrawal payment. The Systematic Withdrawal Plan may be terminated at any
time.
Systematic withdrawals should not
be considered as dividends, yield or income. If systematic withdrawals continuously exceed reinvested dividends and distributions, the shareholder's original investment will be correspondingly reduced and ultimately
exhausted.
Furthermore, each withdrawal
constitutes a redemption of shares, and any gain or loss realized must be recognized for federal income tax purposes. In addition, withdrawals made concurrently with purchases of additional shares are inadvisable
because of the sales charges applicable to (i) the purchase of Class A shares and (ii) the redemption of Class A (in certain instances), Class B and Class C shares. Each shareholder should consult his or her own tax
adviser with regard to the tax consequences of the Systematic Withdrawal Plan, particularly if used in connection with a retirement plan.
Prudential Investment Portfolios
16 64
MUTUAL FUND PROGRAMS. From time to time, the Fund may be included in a mutual fund program with other Prudential Investments mutual funds. Under such a program, a group of portfolios will be selected and
thereafter marketed collectively. Typically, these programs are marketed with an investment theme, such as pursuit of greater diversification, protection from interest rate movements or access to different management
styles. In the event such a program is instituted, there may be a minimum investment requirement for the program as a whole. The Fund may waive or reduce the minimum initial investment requirements in connection with
such a program.
The mutual funds in the program may
be purchased individually or as a part of a program. Since the allocation of portfolios included in the program may not be appropriate for all investors, investors should consult their financial adviser concerning the
appropriate blends of portfolios for them. If investors elect to purchase the individual mutual funds that constitute the program in an investment ratio different from that offered by the program, the standard minimum
investment requirements for the individual mutual funds will apply.
TAX-DEFERRED RETIREMENT
PROGRAMS. Various tax-deferred retirement plans, including a 401(k) plan, self-directed individual retirement accounts and “tax-deferred accounts” under Section 403(b)(7) of the Code are
available through the Distributor. These plans are for use by both self-employed individuals and corporate employers. These plans permit either self-direction of accounts by participants or a pooled account
arrangement. Information regarding the establishment of these plans, their administration, custodial fees and other details is available from the Distributor or PMFS.
Investors who are considering the
adoption of such a plan should consult with their own legal counsel and/or tax adviser with respect to the establishment and maintenance of any such plan.
TAXES, DIVIDENDS AND
DISTRIBUTIONS
The following is a summary of
certain tax considerations generally affecting each Fund and its shareholders. This section is based on the Code, published rulings and court decisions, all as currently in effect. These laws are subject to change,
possibly on a retroactive basis. Please consult your own tax adviser concerning the consequences of investing in a Fund in your particular circumstances under the Code and the laws of any other taxing jurisdiction.
QUALIFICATION AS A REGULATED
INVESTMENT COMPANY. Each Fund has elected to be taxed as a regulated investment company under Subchapter M of the Code and intends to meet all other requirements that are necessary for it to be relieved of
federal taxes on income and gains it distributes to shareholders. As a regulated investment company, a Fund is not subject to federal income tax on the portion of its net investment income (i.e., investment company
taxable income, as that term is defined in the Code, without regard to the deduction for dividends paid) and net capital gain (i.e., the excess of net long-term capital gain over net short-term capital loss) that it
distributes to shareholders, provided that it distributes at least 90% of its net tax-exempt income and investment company taxable income for the year (the “Distribution Requirement”), and satisfies
certain other requirements of the Code that are described below.
Net capital gains of a Fund that
are available for distribution to shareholders will be computed by taking into account any applicable capital loss carryforward. If a Fund has a capital loss carryforward, the amount and duration of any such capital
loss carryforward will be set forth at the end of this section.
In addition to satisfying the
Distribution Requirement, each Fund must derive at least 90% of its gross income from dividends, interest, certain payments with respect to loans of stock and securities, gains from the sale or disposition of stock,
securities or foreign currencies and other income (including but not limited to gains from options, futures or forward contracts) derived with respect to its business of investing in such stock, securities or
currencies and net income derived from an interest in a “qualified publicly traded partnership” (as such term is defined in the Code).
Each Fund must also satisfy an
asset diversification test on a quarterly basis. Failure to do so may result in a Fund being subject to penalty taxes, being required to sell certain of its positions, and may cause the Fund to fail to qualify as a
regulated investment company. Under this asset diversification test, at the close of each quarter of a Fund’s taxable year, (1) 50% or more of the value of the Fund’s assets must be represented by cash,
United States government securities, securities of other regulated investment companies, and other securities, with such other securities limited, in respect of any one issuer, to an amount not greater than 5% of the
value of the Fund’s assets and 10% of the outstanding voting securities of such issuer and (2) not more than 25% of the value of the Fund’s assets may be invested in securities of (x) any one issuer (other
than United States government securities or securities of other regulated investment companies), or two or more issuers (other than securities of other regulated investment companies) of which the Fund owns 20% or
more of the voting stock and which are engaged in the same, similar or related trades or businesses or (y) one or more “qualified publicly traded partnerships” (as such term is defined in the Code) and
commonly referred to as “master limited partnerships.”
65
A Fund may be able to cure a
failure to derive 90% of its income from the sources specified above or a failure to diversify its holdings in the manner described above by paying a tax, by disposing of certain assets, or by paying a tax and
disposing of assets. If, in any taxable year, a Fund fails one of these tests and does not timely cure the failure, the Fund will be taxed in the same manner as an ordinary corporation and distributions to its
shareholders will not be deductible by the Fund in computing its taxable income.
Although in general the passive
loss rules of the Code do not apply to regulated investment companies, such rules do apply to a regulated investment company with respect to items attributable to an interest in a qualified publicly traded
partnership. A Fund’s investments in partnerships, including in qualified publicly traded partnerships, may result in the Fund being subject to state, local or foreign income, franchise or withholding tax
liabilities.
If for any year a Fund does not
qualify as a regulated investment company, or fails to meet the Distribution Requirement, all of its taxable income (including its net capital gain) will be subject to tax at regular corporate rates without any
deduction for distributions to shareholders. In addition, in the event of a failure to qualify, a Fund’s distributions, to the extent derived from the Fund’s current or accumulated earnings and profits,
including any distributions of net long-term capital gains, will be taxable to shareholders as dividend income. However, such dividends will be eligible (i) to be treated as qualified dividend income in the case of
shareholders taxed as individuals and (ii) for the dividends received deduction in the case of corporate shareholders. Moreover, if a Fund fails to qualify as a regulated investment company in any year, it must pay
out its earnings and profits accumulated in that year in order to qualify again as a regulated investment company. If a Fund fails to qualify as a regulated investment company for a period greater than two taxable
years, the Fund may be subject to taxation on any net built-in-gains (i.e., the excess of the aggregate gain, including items of income, over aggregate loss that would have been realized if the Fund had been
liquidated) recognized for a period of ten years, or, under certain circumstances, may have to recognize and pay tax on such net built-in-gain, in order to qualify as a regulated investment company in a subsequent
year.
EXCISE TAX ON REGULATED INVESTMENT
COMPANIES. A 4% non-deductible excise tax is imposed on a regulated investment company to the extent that it distributes income in such a way that it is taxable to shareholders in a calendar year
other than the calendar year in which a Fund earned the income. Specifically, the excise tax will be imposed if a Fund fails to distribute in each calendar year an amount equal to 98% of ordinary taxable income,
including qualified dividend income, for the calendar year and 98.2% of capital gain net income for the one-year period ending on October 31 of such calendar year (or, at the election of a regulated investment company
having a taxable year ending November 30 or December 31, for its taxable year). The balance of such income must be distributed during the next calendar year. For the foregoing purposes, a regulated investment company
is treated as having distributed otherwise retained amounts if it is subject to income tax on those amounts for any taxable year ending in such calendar year.
Each Fund intends to make
sufficient distributions or deemed distributions of its qualified dividend income, ordinary income and capital gain net income prior to the end of each calendar year to avoid liability for this excise tax. However,
investors should note that a Fund may in certain circumstances be required to borrow money or liquidate portfolio investments to make sufficient distributions to avoid excise tax liability.
FUND INVESTMENTS. Each Fund may make investments or engage in transactions that affect the character, amount and timing of gains or losses realized by a Fund. A Fund may make investments that produce income
that is not matched by a corresponding cash receipt by the Fund. Any such income would be treated as income earned by the Fund and therefore would be subject to the Distribution Requirement. Such investments may
require a Fund to borrow money or dispose of other securities in order to comply with those requirements. Each Fund may also make investments that prevent or defer the recognition of losses or the deduction of
expenses. These investments may likewise require a Fund to borrow money or dispose of other securities in order to comply with the Distribution Requirement. Additionally, a Fund may make investments that result in the
recognition of ordinary income rather than capital gain, or that prevent the Fund from accruing a long-term holding period. These investments may prevent the Fund from making capital gain distributions as described
below. Each Fund intends to monitor its transactions, will make the appropriate tax elections and will make the appropriate entries in its books and records when it makes any such investments in order to mitigate the
effect of these rules. The foregoing concepts are explained in greater detail in the following paragraphs.
Gains or losses on sales of stock
or securities by a Fund generally will be treated as long-term capital gains or losses if the stock or securities have been held by it for more than one year, except in certain cases where the Fund acquires a put or
writes a call or otherwise holds an offsetting position, with respect to the stock or securities. Other gains or losses on the sale of stock or securities will be short-term capital gains or losses.
In certain situations, a Fund may,
for a taxable year, defer all or a portion of its net capital loss realized after October and its late-year ordinary loss (defined as the excess of post-October foreign currency and passive foreign investment company
(“PFIC”) losses and other post-December ordinary losses over post-October foreign currency and PFIC gains and other post-December ordinary income)
Prudential Investment Portfolios
16 66
until the next taxable year in computing its
investment company taxable income and net capital gain, which will defer the recognition of such realized losses. Such deferrals and other rules regarding gains and losses realized after October (or December) may
affect the tax character of shareholder distributions.
If an option written by a Fund on
securities lapses or is terminated through a closing transaction, such as a repurchase by the Fund of the option from its holder, the Fund will generally realize short-term capital gain or loss. If securities are sold
by the Fund pursuant to the exercise of a call option written by it, the Fund will include the premium received in the sale proceeds of the securities delivered in determining the amount of gain or loss on the sale.
Gain or loss on the sale, lapse or other termination of options acquired by a Fund on stock or securities and on narrowly-based stock indexes will be capital gain or loss and will be long-term or short-term depending
on the holding period of the option.
Certain Fund transactions may be
subject to wash sale, short sale, constructive sale, conversion transaction, constructive ownership transaction and straddle provisions of the Code that may, among other things, require a Fund to defer recognition of
losses or convert long-term capital gain into ordinary income or short-term capital gain taxable as ordinary income.
As a result of entering into swap
contracts, a Fund may make or receive periodic net payments. A Fund may also make or receive a payment when a swap is terminated prior to maturity through an assignment of the swap or other closing transaction.
Periodic net payments will generally constitute taxable ordinary income or deductions, while termination of a swap will generally result in capital gain or loss (which will be a long-term capital gain or loss if the
Fund has been a party to the swap for more than one year). With respect to certain types of swaps, a Fund may be required to currently recognize income or loss with respect to future payments on such swaps or may
elect under certain circumstances to mark such swaps to market annually for tax purposes as ordinary income or loss. Periodic net payments that would otherwise constitute ordinary deductions but are allocable under
the Code to exempt-interest dividends will not be allowed as a deduction but instead will reduce net tax-exempt income.
In general, gain or loss on a short
sale is recognized when a Fund closes the sale by delivering the borrowed property to the lender, not when the borrowed property is sold. Gain or loss from a short sale is generally capital gain or loss to the extent
that the property used to close the short sale constitutes a capital asset in a Fund’s hands. Except with respect to certain situations where the property used by a Fund to close a short sale has a long-term
holding period on the date of the short sale, special rules would generally treat the gains on short sales as short-term capital gains. These rules may also terminate the running of the holding period of
“substantially identical property” held by a Fund. Moreover, a loss on a short sale will be treated as a long-term capital loss if, on the date of the short sale, “substantially identical
property” has been held by a Fund for more than one year. In general, a Fund will not be permitted to deduct payments made to reimburse the lender of securities for dividends paid on borrowed stock if the short
sale is closed on or before the 45th day after the short sale is entered into.
Debt securities acquired by a Fund
may be subject to original issue discount and market discount rules which, respectively, may cause the Fund to accrue income in advance of the receipt of cash with respect to interest or cause gains to be treated as
ordinary income subject to the Distribution Requirement referred to above. Market discount generally is the excess, if any, of the principal amount of the security (or, in the case of a security issued at an original
issue discount, the adjusted issue price of the security) over the price paid by the Fund for the security. Original issue discount that accrues in a taxable year is treated as income earned by a Fund and therefore is
subject to the Distribution Requirement. Because the original issue discount income earned by a Fund in a taxable year may not be represented by cash income, the Fund may have to borrow money or dispose of other
securities and use the proceeds to make distributions to satisfy the Distribution Requirement.
Certain futures contracts and
certain listed options (referred to as Section 1256 contracts) held by the Funds will be required to be “marked to market” for federal income tax purposes at the end of a Fund’s taxable year, that
is, treated as having been sold at the fair market value on the last business day of the Fund’s taxable year. Except with respect to certain foreign currency forward contracts, sixty percent of any gain or loss
recognized on these deemed sales and on actual dispositions will be treated as long-term capital gain or loss, and forty percent will be treated as short-term capital gain or loss. Any net mark-to-market gains may be
subject to the Distribution Requirement referred to above, even though a Fund may receive no corresponding cash amounts, possibly requiring the disposition of portfolio securities or borrowing to obtain the necessary
cash.
Gains or losses attributable to
fluctuations in exchange rates that occur between the time a Fund accrues interest or other receivables or accrues expenses or other liabilities denominated in a foreign currency and the time the Fund actually
collects such receivables or pays such liabilities are treated as ordinary income or loss. Similarly, gains or losses on foreign currency forward contracts or dispositions of debt securities denominated in a foreign
currency that are attributable to fluctuations in the value of the foreign currency between the date of acquisition of the security or contract and the date of disposition thereof generally also are treated as
ordinary income or loss. These gains or losses, referred to under the Code as “Section 988” gains or losses, increase or decrease the amount of a Fund’s investment company taxable income available to
be distributed to its shareholders as ordinary income, rather than
67
increasing or decreasing the amount of the
Fund’s net capital gain. If Section 988 losses exceed other investment company taxable income during a taxable year, a Fund would not be able to make any ordinary dividend distributions from current earnings and
profits, and distributions made before the losses were realized could be recharacterized as a return of capital to shareholders, rather than as an ordinary dividend, thereby reducing each shareholder’s basis in
his or her Fund shares.
If the Fund holds (directly or
indirectly) one or more “tax credit bonds” (defined below) on one or more specified dates during the Fund’s taxable year, and the Fund satisfies the minimum distribution requirement, the Fund may
elect for US federal income tax purposes to pass through to shareholders tax credits otherwise allowable to the Fund for that year with respect to such bonds. A tax credit bond is defined in the Code as a
“qualified tax credit bond” (which includes a qualified forestry conservation bond, a new clean renewable energy bond, a qualified energy conservation bond, a qualified zone academy bond, or a qualified
school construction bond, each of which must meet certain requirements specified in the Code), a “build America bond” or certain other specified bonds. If the Fund were to make an election, a shareholder
of the Fund would be required to include in gross income an amount equal to such shareholder’s proportionate share of the interest income attributable to such credits and would be entitled to claim as a tax
credit an amount equal to the shareholder’s proportionate share of such credits. Certain limitations may apply on the extent to which the credit may be claimed.
A Fund may make investments in
equity securities of foreign issuers. If a Fund purchases shares in PFICs, the Fund may be subject to federal income tax on a portion of any “excess distribution” from such foreign corporation, including
any gain from the disposition of such shares, even if such income is distributed by the Fund to its shareholders. In addition, certain interest charges may be imposed on the Fund as a result of such distributions. If
a Fund were to invest in an eligible PFIC and elected to treat the PFIC as a qualified electing fund (a “QEF”), in lieu of the foregoing requirements, the Fund would be required to include each year in its
income and distribute to shareholders in accordance with the Distribution Requirement, a pro rata portion of the QEF’s ordinary earnings and net capital gain, whether or not distributed by the QEF to the Fund. A
Fund may not be able to make this election with respect to many PFICs because of certain requirements that the PFICs would have to satisfy.
Alternatively, a Fund generally
will be permitted to “mark to market” any shares it holds in a PFIC. If a Fund made such an election, with such election being made separately for each PFIC owned by the Fund, the Fund would be required to
include in income each year and distribute to shareholders in accordance with the Distribution Requirement, an amount equal to the excess, if any, of the fair market value of the PFIC stock as of the close of the
taxable year over the adjusted basis of such stock at that time. A Fund would be allowed a deduction for the excess, if any, of the adjusted basis of the PFIC stock over its fair market value as of the close of the
taxable year, but only to the extent of any net mark-to-market gains with respect to the stock included by the Fund for prior taxable years. A Fund will make appropriate basis adjustments in the PFIC stock to take
into account the mark-to-market amounts.
Notwithstanding any election made
by a Fund, dividends attributable to distributions from a foreign corporation will not be eligible for the special tax rates applicable to qualified dividend income if the foreign corporation is a PFIC either in the
taxable year of the distribution or the preceding taxable year, but instead will be taxable at rates applicable to ordinary income.
A Fund may invest in REITs. Such
Fund’s investments in REIT equity securities may require a Fund to accrue and distribute income not yet received. In order to generate sufficient cash to make the requisite distributions, a Fund may be required
to sell securities in its portfolio that it otherwise would have continued to hold (including when it is not advantageous to do so). A Fund’s investments in REIT equity securities may at other times result in
the Fund’s receipt of cash in excess of the REIT’s earnings; if the Fund distributes such amounts, such distribution could constitute a return of capital to Fund shareholders for federal income tax
purposes. Dividends received by the Fund from a REIT will generally not constitute qualified dividend income. REITs will generally be able to pass through the tax treatment of tax-qualified dividends they receive.
Some of the REITs in which the
Funds may invest will be permitted to hold residual interests in real estate mortgage investment conduits (“REMICs”). Under Treasury regulations not yet issued, but that may apply retroactively, a portion
of a Fund’s income from a REIT that is attributable to the REIT’s residual interest in a REMIC (referred to in the Code as an “excess inclusion”) will be subject to federal income tax in all
events. These regulations are expected to provide that excess inclusion income of a regulated investment company, such as a Fund, will be allocated to shareholders of the regulated investment company in proportion to
the dividends received by shareholders, with the same consequences as if shareholders held the related REMIC residual interest directly.
In general, excess inclusion income
allocated to shareholders (i) cannot be offset by net operating losses (subject to a limited exception for certain thrift institutions), (ii) will constitute unrelated business taxable income to entities (including a
qualified pension plan, an individual retirement account, a 401(k) plan, a Keogh plan or other tax-exempt entity) subject to tax on unrelated business income, thereby potentially requiring such an entity that is
allocated excess inclusion income, and that otherwise might not be required to file a tax return, to file a tax return and pay tax on such income, and (iii) in the case of a non-US shareholder, will not qualify for
any reduction in US federal withholding tax.
Prudential Investment Portfolios
16 68
Under current law, if a charitable
remainder trust (defined in Section 664 of the Code) realizes any unrelated business taxable income for a taxable year, it will be subject to an excise tax equal to 100% of such unrelated business taxable income. In
addition, if at any time during any taxable year a “disqualified organization” (as defined in the Code) is a record holder of a share in a regulated investment company, then the regulated investment
company will be subject to a tax equal to that portion of its excess inclusion income for the taxable year that is allocable to the disqualified organization, multiplied by the highest federal income tax rate imposed
on corporations. The Funds do not intend to invest directly in residual interests in REMICs or to invest in REITs in which a substantial portion of the assets will consist of residual interests in REMICs.
FUND DISTRIBUTIONS. Each Fund anticipates distributing substantially all of its net investment income for each taxable year. Dividends of net investment income paid to a non-corporate US shareholder that are
reported as qualified dividend income will generally be taxable to such shareholder at capital gain income tax rates. The amount of dividend income that may be reported by a Fund as qualified dividend income will
generally be limited to the aggregate of the eligible dividends received by the Fund. In addition, a Fund must meet certain holding period requirements with respect to the shares on which the Fund received the
eligible dividends, and the non-corporate US shareholder must meet certain holding period requirements with respect to the Fund shares. Dividends of net investment income that are not reported as qualified dividend
income or exempt-interest dividends and dividends of net short-term capital gains will be taxable to shareholders at ordinary income rates. Dividends paid by a Fund with respect to a taxable year will qualify for the
70% dividends received deduction generally available to corporations to the extent of the amount of dividends received by the Fund from certain domestic corporations for the taxable year. Shareholders will be advised
annually as to the US federal income tax consequences of distributions made (or deemed made) during the year, including the portion of dividends paid that qualify for the reduced tax rate.
Ordinarily, shareholders are
required to take taxable distributions by a Fund into account in the year in which the distributions are made. However, for federal income tax purposes, dividends that are declared by a Fund in October, November or
December as of a record date in such month and actually paid in January of the following year will be treated as if they were paid on December 31 of the year declared. Therefore, such dividends will generally be
taxable to a shareholder in the year declared rather than the year paid.
Dividends paid by a Fund that are
properly reported as exempt-interest dividends will not be subject to regular federal income tax. Dividends paid by a Fund will be exempt from federal income tax (though not necessarily exempt from state and local
taxation) to the extent of the Fund’s tax-exempt interest income as long as 50% or more of the value of the Fund’s assets at the end of each quarter is invested in (1) state, municipal and other bonds that
are excluded from gross income for federal income tax purposes or (2) interests in other regulated investment companies, and, in each case, as long as the Fund properly reports such dividends as exempt-interest
dividends. Exempt-interest dividends from interest earned on municipal securities of a state, or its political subdivisions, are generally exempt from income tax in that state. However, income from municipal
securities from other states generally will not qualify for tax-free treatment.
Interest on indebtedness incurred
by a shareholder to purchase or carry shares of a Fund will not be deductible for US federal income tax purposes to the extent it relates to exempt-interest dividends received by a shareholder. If a shareholder
receives exempt-interest dividends with respect to any share of a Fund (other than a Fund that declares income dividends daily and pays such dividends at least as frequently as monthly) and if the share is held by the
shareholder for six months or less, then any loss on the sale or exchange of the share may, to the extent of the exempt-interest dividends, be disallowed. In addition, the Code may require a shareholder that receives
exempt-interest dividends to treat as taxable income a portion of certain otherwise non-taxable social security and railroad retirement benefit payments. Furthermore, a portion of any exempt-interest dividend paid by
a Fund that represents income derived from certain revenue or private activity bonds held by the Fund may not retain its tax-exempt status in the hands of a shareholder who is a “substantial user” of a
facility financed by such bonds, or a “related person” thereof. In addition, the receipt of dividends and distributions from a Fund may affect a foreign corporate shareholder’s federal “branch
profits” tax liability and the federal “excess net passive income” tax liability of a shareholder of an S corporation. Shareholders should consult their own tax advisers as to whether they are (i)
“substantial users” with respect to a facility or “related” to such users within the meaning of the Code or (ii) subject to the federal “branch profits” tax, or the federal
“excess net passive income” tax.
A Fund may either retain or
distribute to shareholders its net capital gain (i.e., excess net long-term capital gain over net short-term capital loss) for each taxable year. Each Fund currently intends to distribute any such amounts. If net
capital gain is distributed and reported as a “capital gain dividend,” it will be taxable to shareholders as long-term capital gain, regardless of the length of time the shareholder has held its shares or
whether such gain was recognized by the Fund prior to the date on which the shareholder acquired its shares. Conversely, if a Fund elects to retain its net capital gain, the Fund will be taxed thereon (except to the
extent of any available capital loss carryovers) at the 35% corporate tax rate. In such a case, it is expected that the Fund also will elect to have shareholders of record on the last day of its taxable year treated
as if each received a distribution of its pro rata share of such gain,
69
with the result that each shareholder will be
required to report its pro rata share of such gain on its tax return as long-term capital gain, will receive a refundable tax credit for its pro rata share of tax paid by the Fund on the gain, and will increase the
tax basis for its shares by an amount equal to the deemed distribution less the tax credit.
Distributions by a Fund that exceed
the Fund’s current and accumulated earnings and profits will be treated as a return of capital to the extent of (and in reduction of) the shareholder’s tax basis in its shares; any distribution in excess
of such tax basis will be treated as gain from the sale of its shares, as discussed below. Distributions in excess of a Fund’s minimum distribution requirements but not in excess of the Fund’s earnings and
profits will be taxable to shareholders and will not constitute nontaxable returns of capital. A Fund’s capital loss carryforwards, if any, carried from taxable years beginning before 2011 do not reduce current
earnings and profits, even if such carryforwards offset current year realized gains. In the event that the Fund were to experience an ownership change as defined under the Code, the Fund’s loss carryforwards, if
any, may be subject to limitation.
Distributions by a Fund will be
treated in the manner described above regardless of whether such distributions are paid in cash or reinvested in additional shares of the Fund (or of another fund). Shareholders receiving a distribution in the form of
additional shares will be treated as receiving a distribution in an amount equal to the amount of cash that could have been received. In addition, prospective investors in a Fund should be aware that distributions
from the Fund will, all other things being equal, have the effect of reducing the NAV of the Fund’s shares by the amount of the distribution. If the NAV is reduced below a shareholder’s cost, the
distribution will nonetheless be taxable as described above, even if the distribution effectively represents a return of invested capital. Investors should consider the tax implications of buying shares just prior to
a distribution, when the price of shares may reflect the amount of the forthcoming distribution.
SALE OR REDEMPTION OF SHARES. A shareholder will generally recognize gain or loss on the sale or redemption of shares in an amount equal to the difference between the proceeds of the sale or redemption and the
shareholder’s adjusted tax basis in the shares. All or a portion of any loss so recognized may be disallowed if the shareholder acquires other shares of the Fund or substantially identical stock or securities
within a period of 61 days beginning 30 days before such disposition, such as pursuant to reinvestment of a dividend in shares of the Fund. Additionally, if a shareholder disposes of shares of a Fund within 90 days
following their acquisition, and the shareholder subsequently re-acquires Fund shares (1) before January 31 of the calendar year following the calendar year in which the original stock was disposed of, (2) pursuant to
a reinvestment right received upon the purchase of the original shares and (3) at a reduced load charge (i.e., sales or additional charge), then any load charge incurred upon the acquisition of the original shares
will not be taken into account as part of the shareholder’s basis for computing gain or loss upon the sale of such shares, to the extent the original load charge does not exceed any reduction of the load charge
with respect to the acquisition of the subsequent shares. To the extent the original load charge is not taken into account on the disposition of the original shares, such charge shall be treated as incurred in
connection with the acquisition of the subsequent shares. In general, any gain or loss arising from (or treated as arising from) the sale or redemption of shares of a Fund will be considered capital gain or loss and
will be long term capital gain or loss if the shares were held for more than one year. However, any capital loss arising from the sale or redemption of shares held for six months or less will be treated as a long-term
capital loss to the extent of the amount of long-term capital gain dividends received on (or undistributed long-term capital gains credited with respect to) such shares.
Capital gain of a non-corporate US
shareholder is generally taxed at a federal income tax rate of up to 15% for individuals with incomes below approximately $400,000 ($450,000 if married filing jointly), adjusted annually for inflation, and 20% for any
income above such levels that is generally net long-term capital gain or qualified dividend income, where the property is held by the shareholder for more than one year. Capital gain of a corporate shareholder is
taxed at the same rate as ordinary income.
Cost Basis Reporting. Mutual funds must report cost basis information to you and the IRS when you sell or exchange shares acquired on or after January 1, 2012 in your non-retirement accounts. The cost basis
regulations do not affect retirement accounts, money market funds, and shares acquired before January 1, 2012. The regulations also require mutual funds to report whether a gain or loss is short-term (shares held one
year or less) or long-term (shares held more than one year) for all shares acquired on or after January 1, 2012 that are subsequently sold or exchanged. To calculate the gain or loss on shares sold, you need to know
the cost basis of the shares. Cost basis is the original value of an asset for tax purposes (usually the gross purchase price), adjusted for stock splits, reinvested dividends, and return of capital distributions.
This value is used to determine the capital gain (or loss), which is the difference between the cost basis of the shares and the gross proceeds when the shares are sold. The Fund’s Transfer Agent supports
several different cost basis methods from which you may select a cost basis method you believe best suited to your needs. If you decide to elect the Transfer Agent’s default method, which is average cost, no
action is required on your part. For shares acquired on or after January 1, 2012, if you change your cost basis method, the new method will apply to all shares in the account if you request the change prior to the
first redemption. If, however, you request the change after the first redemption, the new method will apply to shares acquired on or after the date of the change. Keep in mind that the Fund’s Transfer Agent is
not required to report cost basis
Prudential Investment Portfolios
16 70
information to you or the IRS on shares acquired
before January 1, 2012. However, the Transfer Agent will provide this information to you, as a service, if its cost basis records are complete for such shares. This information will be separately identified on the
Form 1099-B (Proceeds from Broker and Barter Exchange Transactions) sent to you by the Transfer Agent and not transmitted to the IRS.
BACKUP WITHHOLDING. A Fund will be required in certain cases to withhold and remit to the US Treasury 28% of all dividends and capital gain dividends, and the proceeds of redemption of shares, paid to any
shareholder (1) who has provided the Fund with either an incorrect tax identification number or no number at all, (2) who is subject to backup withholding by the IRS for failure to report the receipt of interest or
dividend income properly or (3) who has failed to certify to the Fund that it is not subject to backup withholding or that it is a corporation or other exempt recipient. In addition, dividends and capital gain
dividends made to corporate United States holders may be subject to information reporting and backup withholding. Backup withholding is not an additional tax and any amounts withheld may be refunded or credited
against a shareholder’s federal income tax liability, provided the appropriate information is furnished to the IRS.
If a shareholder recognizes a loss
with respect to a Fund’s shares of $2 million or more for an individual shareholder or $10 million or more for a corporate shareholder, the shareholder must file with the IRS a disclosure statement on Form 8886.
Direct shareholders of portfolio securities are in many cases exempted from this reporting requirement, but under current guidance, shareholders of a regulated investment company are not exempted. The fact that a loss
is reportable under these regulations does not affect the legal determination of whether the taxpayer’s treatment of the loss is proper. Shareholders should consult their tax advisers to determine the
applicability of these regulations in light of their individual circumstances.
MEDICARE CONTRIBUTION TAX. A US person that is an individual or estate, or a trust that does not fall into a special class of trusts that is exempt from such tax, is subject to a 3.8% tax on the lesser of (1) the US
person’s “net investment income” for the relevant taxable year and (2) the excess of the US person’s modified adjusted gross income for the taxable year over $200,000 (or $250,000 if married
filing jointly). A Fund shareholder’s net investment income will generally include, among other things, dividend income from the Fund and net gains from the disposition of Fund shares, unless such dividend
income or net gains are derived in the ordinary course of the conduct of a trade or business (other than a trade or business that consists of certain passive or trading activities). If you are a US person that is an
individual, estate or trust, you are urged to consult your tax advisers regarding the applicability of the Medicare contribution tax to your income and gains in respect of your investment in the Fund shares.
FOREIGN SHAREHOLDERS. Dividends paid to a shareholder who, as to the United States, is a nonresident alien individual, foreign trust or estate, foreign corporation, or foreign partnership (“foreign
shareholder”) will be subject to US withholding tax at the rate of 30% (or lower applicable treaty rate) on the gross amount of the dividend. Such a foreign shareholder would generally be exempt from US federal
income tax, including withholding tax, on gains realized on the sale of shares of a Fund, net capital gain dividends, exempt-interest dividends, and amounts retained by the Fund that are reported as undistributed
capital gains.
The foregoing applies when the
foreign shareholder’s income from a Fund is not effectively connected with a US trade or business. If the income from a Fund is effectively connected with a US trade or business carried on by a foreign
shareholder, then ordinary income dividends, qualified dividend income, net capital gain dividends, undistributed capital gains credited to such shareholder and any gains realized upon the sale of shares of the Fund
will be subject to US federal income tax at the graduated rates applicable to US citizens or domestic corporations.
For taxable years beginning before
January 1, 2014, distributions that a Fund reports as “short-term capital gain dividends” or “long-term capital gain dividends” will not be treated as such to a recipient foreign shareholder if
the distribution is attributable to a REIT’s distribution to a Fund of a gain from the sale or exchange of US real property or an interest in a US real property holding corporation and a Fund’s direct or
indirect interests in US real property exceed certain levels. Instead, if the foreign shareholder has not owned more than 5% of the outstanding shares of a Fund at any time during the one year period ending on the
date of distribution, such distributions will be subject to 30% withholding by a Fund and will be treated as ordinary dividends to the foreign shareholder; if the foreign shareholder owned more than 5% of the
outstanding shares of a Fund at any time during the one-year period ending on the date of the distribution, such distribution will be treated as real property gain subject to 35% withholding tax and could subject the
foreign shareholder to US filing requirements. Additionally, if a Fund’s direct or indirect interests in US real property were to exceed certain levels, a foreign shareholder realizing gains upon redemption from
a Fund before January 1, 2014 could be subject to the 35% withholding tax and US filing requirements unless more than 50% of a Fund’s shares were owned by US persons at such time or unless the foreign person had
not held more than 5% of a Fund’s outstanding shares throughout either such person’s holding period for the redeemed shares or, if shorter, the previous five years.
Legislation has been proposed to
extend the above expiration dates but no assurance can be provided that such legislation will be enacted.
71
The rules laid out in the previous
paragraph, other than the withholding rules, will apply notwithstanding a Fund’s participation in a wash sale transaction or its payment of a substitute dividend.
Provided that 50% or more of the
value of the Fund’s stock is held by US shareholders, distributions of US real property interests (including securities in a US real property holding corporation, unless such corporation is regularly traded on
an established securities market and the Fund has held 5% or less of the outstanding shares of the corporation during the five-year period ending on the date of distribution) occurring on or before December 31, 2013,
in redemption of a foreign shareholder’s shares of the Fund will cause the Fund to recognize gain. If the Fund is required to recognize gain, the amount of gain recognized will be equal to the fair market value
of such interests over the Fund’s adjusted bases to the extent of the greatest foreign ownership percentage of the Fund during the five-year period ending on the date of redemption.
In the case of foreign
non-corporate shareholders, a Fund may be required to backup withhold US federal income tax on distributions that are otherwise exempt from withholding tax unless such shareholders furnish the Fund with proper
notification of their foreign status.
The tax consequences to a foreign
shareholder entitled to claim the benefits of an applicable tax treaty may be different from those described herein. Foreign shareholders are urged to consult their own tax advisers with respect to the particular tax
consequences to them of an investment in a Fund, the procedure for claiming the benefit of a lower treaty rate and the applicability of foreign taxes.
FOREIGN TAXES. A Fund may be subject to foreign withholding taxes or other foreign taxes with respect to income (possibly including, in some cases, capital gain) received from sources within foreign
countries. So long as more than 50% by value of the total assets of the Fund at the close of the taxable year consists of (1) stock or securities of foreign issuers or (2) interests in other regulated investment
companies, the Fund may elect to treat any foreign income taxes paid by it as paid directly by its shareholders.
If the Fund makes the election,
each shareholder will be required to (i) include in gross income, even though not actually received, its pro rata share of the Fund’s foreign income taxes, and (ii) either deduct (in calculating US taxable
income) or credit (in calculating US federal income tax) its pro rata share of the Fund’s income taxes. A foreign tax credit may not exceed the US federal income tax otherwise payable with respect to the foreign
source income. For this purpose, each shareholder must treat as foreign source gross income (i) its proportionate share of foreign taxes paid by the Fund and (ii) the portion of any actual dividend paid by the Fund
which represents income derived from foreign sources; the gain from the sale of securities will generally be treated as US source income and certain foreign currency gains and losses likewise will be treated as
derived from US sources. This foreign tax credit limitation is, with certain exceptions, applied separately to separate categories of income; dividends from the Fund will be treated as “passive” or
“general” income for this purpose. The effect of this limitation may be to prevent shareholders from claiming as a credit the full amount of their pro rata share of the Fund’s foreign income taxes.
In addition, shareholders will not be eligible to claim a foreign tax credit with respect to foreign income taxes paid by the Fund unless certain holding period requirements are met at both the Fund and the
shareholder levels.
A Fund will make such an election
only if it deems it to be in the best interest of its shareholders. A shareholder not subject to US tax may prefer that this election not be made. The Fund will notify shareholders in writing each year if it makes the
election and of the amount of foreign income taxes, if any, to be passed through to the shareholders and the amount of foreign taxes, if any, for which shareholders of the Fund will not be eligible to claim a foreign
tax credit because the holding period requirements (described above) have not been satisfied.
A 30% withholding
tax is imposed on US-source dividends, interest and other income items paid after June 30, 2014, and will be imposed on proceeds from the sale of property producing US-source dividends and interest paid after December
31, 2016, to (i) foreign financial institutions including non-US investment funds unless they agree to collect and disclose to the IRS information regarding their direct and indirect US account holders and (ii)
certain other foreign entities, unless they certify certain information regarding their direct and indirect US owners. To avoid withholding, foreign financial institutions will need to (i) enter into agreements with
the IRS that state that they will provide the IRS information, including the names, addresses and taxpayer identification numbers of direct and indirect US account holders, comply with due diligence procedures with
respect to the identification of US accounts, report to the IRS certain information with respect to US accounts maintained, agree to withhold tax on certain payments made to non-compliant foreign financial
institutions or to account holders, or (ii) in the event that an intergovernmental agreement and implementing legislation are adopted, provide local revenue authorities with similar account holder information. Other
foreign entities will need to either provide the name, address, and taxpayer identification number of each substantial US owner or certifications of no substantial US ownership unless certain exceptions apply.
Shares of a Fund held by a non-US
shareholder at death will be considered situated within the United States and subject to the US estate tax.
Prudential Investment Portfolios
16 72
STATE AND LOCAL TAX MATTERS. Depending on the residence of the shareholders for tax purposes, distributions may also be subject to state and local taxes. Rules of state and local taxation regarding qualified dividend
income, ordinary income dividends and capital gains distributions from regulated investment companies and other items may differ from federal income tax rules. Shareholders are urged to consult their tax advisers as
to the consequences of these and other state and local tax rules affecting investment in a Fund.
CAPITAL LOSS
CARRYFORWARDS.The Fund did not utilize any of its capital loss carryforward to offset net taxable gains realized in the fiscal year ended October 31, 2014.
DISCLOSURE OF PORTFOLIO
HOLDINGS
The Fund's portfolio holdings as of
the end of the second and fourth fiscal quarters are made public, as required by law, in the Fund's annual and semi-annual reports. These reports are filed with the SEC on Form N-CSR and mailed to shareholders within
60 days after the end of the second and fourth fiscal quarters. The Fund's annual and semi-annual reports are posted on the Fund's website at www.prudentialfunds.com. The Fund's portfolio holdings as of the end of the
first and third fiscal quarters are made public and filed with the SEC on Form N-Q within 60 days after the end of the Fund's first and third fiscal quarters, and may be accessed at www.sec.gov.
The Fund generally post on the
website a detailed list of the Fund's portfolio holdings as of the end of each calendar month no sooner than approximately three business days prior to the end of the following month. The detailed list of portfolio
holdings will generally remain available on the website for approximately one month, at which time the list will be replaced. (Note: The Prudential Core Short-Term Bond Fund does not post portfolio holdings as of the end of each calendar month.)
In addition, the Fund may also
release its top ten holdings, sector and country breakdowns, and largest industries on a quarterly or monthly basis, with the information as of a date 15 days prior to the release. Such information will be posted on
the website and will generally be available for viewing until replaced at the end of the subsequent quarter. If the Fund recently commenced operations or recently completed a repositioning of investment policies, then
the Fund may publicly release one or more of the items described above in this section subject to a 15-day delay for the period from the commencement of operations or the repositioning until the timing discussed
earlier in this section becomes effective. However, if a money market fund is required to release any such information on a more frequent basis pursuant to Rule 2a-7, then the money market fund will release such
information in a manner consistent with Rule 2a-7.
Portfolio holdings information
which appears on the Fund's website may also be made available in printed form. When authorized by the Fund's Chief Compliance Officer and another officer of the Fund, portfolio holdings information may be
disseminated more frequently or at different periods than as described above.
The Fund has entered into ongoing
arrangements to make available information about the Fund's portfolio holdings. Parties receiving this information may include intermediaries that distribute Fund shares, third-party providers of auditing, custody,
proxy voting and other services for the Fund, rating and ranking organizations, and certain affiliated persons of the Fund, as described below. The procedures utilized to determine eligibility are set forth below:
Procedures for Release of Portfolio
Holdings Information:
1. A request for release of fund holdings shall be provided by such third party setting forth a legitimate business purpose for such release which shall specify the Fund, the terms of such release, and frequency (e.g., level of detail, staleness). The request shall address whether there are any conflicts of interest between Fund shareholders and the investment adviser, subadviser, principal underwriter or any affiliated person thereof and how such conflicts shall be dealt with to demonstrate that the disclosure is in the best interest of the shareholders of the Fund.
1. A request for release of fund holdings shall be provided by such third party setting forth a legitimate business purpose for such release which shall specify the Fund, the terms of such release, and frequency (e.g., level of detail, staleness). The request shall address whether there are any conflicts of interest between Fund shareholders and the investment adviser, subadviser, principal underwriter or any affiliated person thereof and how such conflicts shall be dealt with to demonstrate that the disclosure is in the best interest of the shareholders of the Fund.
2. The request shall be forwarded
to the Chief Compliance Officer of the Fund, or his delegate, for review and approval.
3. A confidentiality agreement in
the form approved by an officer of the Fund must be executed with the recipient of the fund holdings information.
4. An officer of the Fund shall
approve the release and agreement. Copies of the release and agreement shall be sent to PI's law department.
5. Written notification of the
approval shall be sent by such officer to PI's Fund Administration Department to arrange the release of fund holdings information.
6. PI's Fund Administration
Department shall arrange for the release of fund holdings information by the Fund's custodian bank(s).
73
As of the date of this SAI, the
Fund will provide:
1. Traditional External
Recipients/Vendors
| ■ | Full holdings on a daily basis to Institutional Shareholder Services (ISS), Broadridge and Glass, Lewis & Co. (proxy voting administrator/agents) at the end of each day; |
| ■ | Full holdings on a daily basis to ISS (securities class action claims administrator) at the end of each day; |
| ■ | Full holdings on a daily basis to a Fund's Subadviser(s), Custodian Bank, sub-custodian (if any) and accounting agents (which includes the Custodian Bank and any other accounting agent that may be appointed) at the end of each day. When a Fund has more than one Subadviser, each Subadviser receives holdings information only with respect to the “sleeve” or segment of the Fund for which the Subadviser has responsibility; |
| ■ | Full holdings to a Fund's independent registered public accounting firm as soon as practicable following the Fund's fiscal year-end or on an as-needed basis; and |
| ■ | Full holdings to financial printers as soon as practicable following the end of a Fund's quarterly, semi-annual and annual period-ends. |
2. Analytical Service Providers
| ■ | Fund trades on a quarterly basis to Abel/Noser Corp. (an agency-only broker and transaction cost analysis company) as soon as practicable following a Fund's fiscal quarter-end; |
| ■ | Full holdings on a daily basis to FT Interactive Data (a fair value information service) at the end of each day; |
| ■ | Full holdings on a daily basis to FactSet Research Systems Inc. and Lipper, Inc. (investment research providers) at the end of each day; |
| ■ | Full holdings on a daily basis to Performance Explorer Limited (investment research provider for funds engaged in securities lending) at the end of each day, for certain funds; |
| ■ | Full holdings on a daily basis to Vestek (for preparation of fact sheets) at the end of each day (Target Portfolio Trust, and selected Prudential Investments Funds only); |
| ■ | Full holdings to Frank Russell Company (investment research provider) at the end of each month (Prudential Jennison Small Company Fund, Prudential Variable Contract Accounts -2 and -10 only); |
| ■ | Full holdings on a monthly basis to Fidelity Advisors (wrap program provider) approximately five days after the end of each month (Prudential Jennison Growth Fund and certain other selected Prudential Investments Funds only); |
| ■ | Full holdings on a daily basis to Brown Brothers Harriman & Co. (operations support) (Prudential Financial Services Fund only); |
| ■ | Full holdings on a daily basis to Markit WSO Corporation (certain operational functions)(Prudential Financial Services Fund only); |
| ■ | Full holdings on a daily basis to Investment Technology Group, Inc. (analytical service provider) (Prudential Financial Services Fund only); |
| ■ | Full holdings on a daily basis to State Street Bank and Trust Company (operations service provider) (Prudential Financial Services Fund only); and |
| ■ | Full holdings on a quarterly basis to Prudential Retirement Services / Watson Wyatt Investment Retirement Services (401(k) plan recordkeeping) approximately 30 days after the close of the Fund's fiscal quarter-end (Prudential Jennison Growth Fund only). |
In each case, the information
disclosed must be for a legitimate business purpose and is subject to a confidentiality agreement intended to prohibit the recipient from trading on or further disseminating such information (except for legitimate
business purposes). Such arrangements will be monitored on an ongoing basis and will be reviewed by the Chief Compliance Officer and PI's Law Department on an annual basis.
In addition, certain authorized
employees of PI receive portfolio holdings information on a quarterly, monthly or daily basis or upon request, in order to perform their business functions. All PI employees are subject to the requirements of the
personal securities trading policy of Prudential Financial, Inc., which prohibits employees from trading on or further disseminating confidential information, including portfolio holdings information.
Also, affiliated shareholders may,
subject to execution of a non-disclosure agreement, receive current portfolio holdings for the sole purpose of enabling the Fund to effect the payment of the redemption price to such shareholder in whole or in part by
a distribution in kind of securities from the investment portfolio of the Fund, in lieu of cash, in conformity with the rules of the SEC and procedures adopted by the Board. For more information regarding the payment
of the redemption price by a distribution in kind of securities from the investment portfolio of the Fund, see “Purchase, Redemption and Pricing of Fund Shares—Redemption in Kind.”
The Board has approved PI's Policy
for the Dissemination of Portfolio Holdings. The Board shall, on a quarterly basis, receive a report from PI detailing the recipients of the portfolio holdings information and the reason for such disclosure. The Board
has delegated oversight over the Fund's disclosure of portfolio holdings to the Chief Compliance Officer.
Prudential Investment Portfolios
16 74
There can be no assurance that the
policies and procedures on portfolio holdings information will protect the Fund from the potential misuse of such information by individuals or entities that come into possession of the information.
PROXY VOTING
The Board has delegated to the
Manager the responsibility for voting any proxies and maintaining proxy recordkeeping with respect to the Fund. The Manager is authorized by the Fund to delegate, in whole or in part, its proxy voting authority to the
investment subadviser(s) or third party vendors consistent with the policies set forth below. The proxy voting process shall remain subject to the supervision of the Board, including any committee thereof established
for that purpose.
The Manager and the Board view the
proxy voting process as a component of the investment process and, as such, seek to ensure that all proxy proposals are voted with the primary goal of seeking the optimal benefit for the Fund. Consistent with this
goal, the Board views the proxy voting process as a means to encourage strong corporate governance practices and ethical conduct by corporate management. The Manager and the Board maintain a policy of seeking to
protect the best interests of the Fund should a proxy issue potentially implicate a conflict of interest between the Fund and the Manager or its affiliates.
The Manager delegates to the Fund's
Subadviser(s) the responsibility for voting proxies. The Subadviser is expected to identify and seek to obtain the optimal benefit for the Fund, and to adopt written policies that meet certain minimum standards,
including that the policies be reasonably designed to protect the best interests of the Fund and delineate procedures to be followed when a proxy vote presents a conflict between the interests of the Fund and the
interests of the Subadviser or its affiliates. The Manager and the Board expect that the Subadviser will notify the Manager and Board at least annually of any such conflicts identified and confirm how the issue was
resolved. In addition, the Manager expects that the Subadviser will deliver to the Manager, or its appointed vendor, information required for filing the Form N-PX with the SEC. Information regarding how the Fund voted
proxies relating to its portfolio securities during the most recent twelve-month period ending June 30 is available without charge on the Fund's website and on the SEC's website at www.sec.gov.
A summary of the proxy voting
policies of the Subadviser(s) is set forth in its respective Appendix to this SAI.
CODES OF ETHICS
The Board has adopted a Code of
Ethics. In addition, the Manager, investment subadviser(s) and Distributor have each adopted a Code of Ethics. The Codes of Ethics apply to access persons (generally, persons who have access to information about the
Fund's investment program) and permit personnel subject to the Codes of Ethics to invest in securities, including securities that may be purchased or held by the Fund. However, the protective provisions of the Codes
of Ethics prohibit certain investments and limit such personnel from making investments during periods when the Fund is making such investments. The Codes of Ethics are on public file with, and are available from, the
SEC.
APPENDIX I: PROXY VOTING
POLICIES OF THE SUBADVISER
QUANTITATIVE MANAGEMENT ASSOCIATES LLC
(QMA)
Description of QMA Proxy Voting
Policies. It is the policy of Quantitative Management Associates LLC (“QMA”) to vote proxies on client securities in the best long-term economic interest of its clients, in accordance
with QMA’s established proxy voting policy and procedures. In the case of pooled accounts, QMA’s policy is to vote proxies on securities in such account in the best long-term economic interest of the
pooled account. In the event of any actual or apparent material conflict between its clients' interest and QMA’s own, QMA’s policy is to act solely in its clients' interest. To this end, the proxy voting
policy and procedures adopted by QMA include procedures to address potential material conflicts of interest arising in connection with the voting of proxies.
QMA's proxy voting policy contains
detailed voting guidelines on a wide variety of issues commonly voted upon by shareholders. These guidelines reflect QMA's judgment of how to further the best long-range economic interest of its clients (i.e. the
mutual interest of clients in seeing the appreciation in value of a common investment over time) through the shareholder voting process. Where issues are not addressed by its policy, or when circumstances suggest a
vote not in accordance with its established guidelines, voting decisions are made on a case-by-case basis taking into consideration the potential economic impact of the proposal. With respect to international
holdings, QMA takes into account additional restrictions in some countries that might impair its ability to trade those securities or have other potentially adverse economic consequences, and generally vote foreign
securities on a best efforts basis if QMA determines that voting is in the best economic interest of its clients. The Fund determines whether fund securities out on loan are to be recalled for voting purposes and QMA
is not involved in any such decision. QMA’s proxy voting committee includes representatives of QMA’s investment, operations, compliance, risk and legal teams. QMA’s proxy voting committee is
responsible for interpreting the proxy voting policy as well as monitoring conflicts of interest, and periodically assesses the policy's effectiveness.
75
QMA utilizes the services of a
third party proxy voting facilitator, and upon receipt of proxies will direct the voting facilitator to vote in a manner consistent with QMA's established proxy voting guidelines described above (assuming timely
receipt of proxy materials from issuers and custodians). In accordance with its obligations under the Advisers Act, QMA provides full disclosure of its proxy voting policy, guidelines and procedures to its clients
upon their request, and will also provide to any client, upon request, the proxy voting records for that client's securities.
Prudential Investment Portfolios
16 76
APPENDIX II: DESCRIPTIONS OF
SECURITY RATINGS
MOODY'S INVESTORS SERVICE, INC.
(MOODY'S)
Debt Ratings
Aaa: Bonds which are rated Aaa are judged to be of the best quality. They carry the smallest degree of investment risk and are generally referred to as “gilt edged.” Interest
payments are protected by a large or by an exceptionally stable margin and principal is secure. While the various protective elements are likely to change, such changes as can be visualized are most unlikely to impair
the fundamentally strong position of such issues.
Aa: Bonds which are rated Aa are judged to be of high quality by all standards. Together with the Aaa group they comprise what are generally known as high-grade bonds. They are rated lower
than the best bonds because margins of protection may not be as large as in Aaa securities or fluctuation of protective elements may be of greater amplitude or there may be other elements present which make the
long-term risks appear somewhat larger than the Aaa securities.
A: Bonds which are rated A possess many favorable investment attributes and are to be considered as upper-medium-grade obligations. Factors giving security to principal and interest are
considered adequate, but elements may be present which suggest a susceptibility to impairment some time in the future.
Baa: Bonds which are rated Baa are considered as medium-grade obligations, i.e., they are neither highly protected nor poorly secured. Interest payments and principal security appear adequate
for the present but certain protective elements may be lacking or may be characteristically unreliable over any great length of time. Such bonds lack outstanding investment characteristics and in fact have speculative
characteristics as well.
Ba: Bonds which are rated Ba are judged to have speculative elements; their future cannot be considered as well assured. Often the protection of interest and principal payments may be very
moderate and thereby not well safeguarded during both good and bad times over the future. Uncertainty of position characterizes bonds in this class.
B: Bonds which are rated B generally lack characteristics of the desirable investment. Assurance of interest and principal payments or of maintenance of other terms of the contract over any
long period of time may be small.
Caa: Bonds which are rated Caa are of poor standing. Such issues may be in default or there may be present elements of danger with respect to principal or interest.
Ca: Bonds which are rated Ca represent obligations which are speculative in a high degree. Such issues are often in default or have other marked shortcomings.
C: Bonds which are rated C are the lowest-rated class of bonds, and issues so rated can be regarded as having extremely poor prospects of ever attaining any real investment
standing.
Moody's applies numerical modifiers
1, 2, and 3 in each generic rating category from Aa to Caa. The modifier 1 indicates that the issuer is in the higher end of its letter rating category; the modifier 2 indicates a mid-range ranking; the modifier 3
indicates that the issuer is in the lower end of the letter ranking category.
Short-Term Ratings
Moody's short-term debt ratings are
opinions of the ability of issuers to honor senior financial obligations and contracts. Such obligations generally have an original maturity not exceeding one year, unless explicitly noted.
PRIME-1: Issuers rated Prime-1 (or supporting institutions) have a superior ability for repayment of senior short-term debt obligations. Prime-1 repayment ability will often be evidenced by many of
the following characteristics:
| ■ | Leading market positions in well-established industries. |
| ■ | High rates of return on funds employed. |
| ■ | Conservative capitalization structure with moderate reliance on debt and ample asset protection. |
| ■ | Broad margins in earnings coverage of fixed financial charges and high internal cash generation. |
| ■ | Well-established access to a range of financial markets and assured sources of alternate liquidity. |
PRIME-2: Issuers rated Prime-2 (or supporting institutions) have a strong ability for repayment of senior short-term debt obligations. This normally will be evidenced by many of the characteristics
cited above but to a lesser degree. Earnings trends and coverage ratios, while sound, may be more subject to variation. Capitalization characteristics, while still appropriate, may be more affected by external
conditions. Ample alternate liquidity is maintained.
77
MIG 1: This designation denotes best quality. There is strong protection by established cash flows, superior liquidity support or demonstrated broad-based access to the market for
refinancing.
MIG 2: This designation denotes high quality. Margins of protection are ample although not so large as in the preceding group.
STANDARD & POOR'S RATINGS
SERVICES (S&P)
Long-Term Issue Credit Ratings
AAA: An obligation rated AAA has the highest rating assigned by S&P. The obligor's capacity to meet its financial commitment on the obligation is extremely strong.
AA: An obligation rated AA differs from the highest rated obligations only in small degree. The obligor's capacity to meet its financial commitment on the obligation is very strong.
A: An obligation rated A is somewhat more susceptible to the adverse effects of changes in circumstances and economic conditions than obligations in higher-rated categories. However, the
obligor's capacity to meet its financial commitment on the obligation is still strong.
BBB: An obligation rated BBB exhibits adequate protection parameters. However, adverse economic conditions or changing circumstances are more likely to lead to a weakened capacity of the
obligor to meet its financial commitment on the obligation.
BB: An obligation rated BB is less vulnerable to nonpayment than other speculative issues. However, it faces major ongoing uncertainties or exposure to adverse business, financial, or economic
conditions which could lead to the obligor's inadequate capacity to meet its financial commitment on the obligation.
B: An obligation rated B is more vulnerable to nonpayment than obligations rated BB, but the obligor currently has the capacity to meet its financial commitment on the obligation. Adverse
business, financial, or economic conditions will likely impair the obligor's capacity or willingness to meet its financial commitment on the obligation.
CCC: An obligation rated CCC is currently vulnerable to nonpayment, and is dependent upon favorable business, financial, and economic conditions for the obligor to meet its financial commitment
on the obligation. In the event of adverse business, financial, or economic conditions, the obligor is not likely to have the capacity to meet its financial commitment on the obligation.
CC: An obligation rated CC is currently highly vulnerable to nonpayment.
C: The C rating may be used to cover a situation where a bankruptcy petition has been filed or similar action has been taken, but payments on this obligation are being continued.
Plus (+) or Minus (–): The ratings from AA to CCC may be modified by the addition of a plus or minus sign to show relative standing within the major rating categories.
Commercial Paper Ratings
A-1: This designation indicates that the degree of safety regarding timely payment is strong. Those issues determined to possess extremely strong safety characteristics are denoted with a plus
sign (+) designation.
A-2: Capacity for timely payment on issues with this designation is satisfactory. However, the relative degree of safety is not as high as for issues designated A-1.
Notes Ratings
An S&P notes rating reflects the
liquidity factors and market risks unique to notes. Notes due in three years or less will likely receive a notes rating. Notes maturing beyond three years will most likely receive a long-term debt rating. The
following criteria will be used in making that assessment.
| ■ | Amortization schedule-the longer the final maturity relative to other maturities the more likely it will be treated as a note. |
| ■ | Source of payment-the more dependent the issue is on the market for its refinancing, the more likely it will be treated as a note. |
Note rating symbols are as
follows:
SP-1: Strong capacity to pay principal and interest. An issue determined to possess a very strong capacity to pay debt service is given a plus (+) designation.
Prudential Investment Portfolios
16 78
SP-2: Satisfactory capacity to pay principal and interest, with some vulnerability to adverse financial and economic changes over the term of the notes.
FITCH RATINGS LTD.
International Long-Term Credit
Ratings
AAA: Highest Credit Quality. AAA ratings denote the lowest expectation of credit risk. They are assigned only in case of exceptionally strong capacity for timely payment of financial
commitments. This capacity is highly unlikely to be adversely affected by foreseeable events.
AA: Very High Credit Quality. AA ratings denote a very low expectation of credit risk. They indicate very strong capacity for timely payment of financial commitments. This capacity is not
significantly vulnerable to foreseeable events.
A: High Credit Quality. A ratings denote a low expectation of credit risk. The capacity for timely payment of financial commitments is considered strong. This capacity may, nevertheless, be
more vulnerable to changes in circumstances or in economic conditions than is the case for higher ratings.
BBB: Good Credit Quality. BBB ratings indicate that there is currently a low expectation of credit risk. The capacity for timely payment of financial commitments is considered adequate, but
adverse changes in circumstances and in economic conditions are more likely to impair this capacity. This is the lowest investment-grade category.
BB: Speculative. BB ratings indicate that there is a possibility of credit risk developing, particularly as the result of adverse economic change over time; however, business or financial
alternatives may be available to allow financial commitments to be met. Securities rated in this category are not investment grade.
B: Highly Speculative. B ratings indicate that significant credit risk is present, but a limited margin of safety remains. Financial commitments are currently being met; however, capacity for
continued payment is contingent upon a sustained, favorable business and economic environment.
CCC, CC, C: High Default Risk. Default is a real possibility. Capacity for meeting financial commitments is solely reliant upon sustained, favorable business or economic developments. A CC rating
indicates that default of some kind appears probable. C ratings signal imminent default.
International Short-Term Credit
Ratings
F1: Highest Credit Quality. Indicates the strongest capacity for timely payment of financial commitments; may have an added “+” to denote any exceptionally strong credit
feature.
F2: Good Credit Quality. A satisfactory capacity for timely payment of financial commitments, but the margin of safety is not as great as in the case of the higher ratings.
F3: Fair Credit Quality. The capacity for timely payment of financial commitments is adequate; however, near-term adverse changes could result in a reduction to non-investment grade.
B: Speculative. Minimal capacity for timely payment of financial commitments, plus vulnerability to near-term adverse changes in financial and economic conditions.
C: High Default Risk. Default is a real possibility. Capacity for meeting financial commitments is solely reliant upon a sustained, favorable business and economic investment.
Plus (+) or Minus (–): Plus or minus signs may be appended to a rating to denote relative status within major rating categories. Such suffixes are not added to the AAA long-term rating category, to categories
below CCC, or to short-term ratings other than F1.
79

PRUDENTIAL INVESTMENTS
» MUTUAL FUNDS
Prudential Income
Builder Fund
PROSPECTUS
• December 26, 2014


Table of Contents
FUND SUMMARY
INVESTMENT OBJECTIVE
The investment objective of the
Fund is to seek income and long-term capital growth.
FUND FEES AND EXPENSES
The tables below describe the sales
charges, fees and expenses that you may pay if you buy and hold shares of the Fund. You may qualify for sales charge discounts if you and an eligible group of related investors purchase, or agree to purchase in the
future, $25,000 or more in shares of the Fund or other funds in the Prudential Investments family of funds. More information about these discounts is available from your financial professional and is explained in
Reducing or Waiving Class A's Initial Sales Charge on page 41 of the Fund's Prospectus and in Rights of Accumulation on page 62 of the Fund's Statement of Additional Information (SAI).
| Shareholder Fees (fees paid directly from your investment) | |||||
| Class A | Class B | Class C | Class R | Class Z | |
| Maximum sales charge (load) imposed on purchases (as a percentage of offering price) | 5.50% | None | None | None | None |
| Maximum deferred sales charge (load) (as a percentage of the lower of original purchase price or net asset value at redemption) | 1% | 5% | 1% | None | None |
| Maximum sales charge (load) imposed on reinvested dividends and other distributions | None | None | None | None | None |
| Redemption fee | None | None | None | None | None |
| Exchange fee | None | None | None | None | None |
| Maximum account fee (accounts under $10,000) | $15 | $15 | $15 | None | None |
| Annual Fund Operating Expenses (expenses that you pay each year as a percentage of the value of your investment) | |||||
| Class A | Class B | Class C | Class R | Class Z | |
| Management fees | .70% | .70% | .70% | .70% | .70% |
| + Distribution and Service (12b-1) fees | .30% | 1.00% | 1.00% | .75% | None |
| + Other expenses | .51% | .51% | .51% | .51% | .51% |
| + Acquired Fund Fees and Expenses | .24% | .24% | .24% | .24% | .24% |
| = Total annual Fund operating expenses | 1.75% | 2.45% | 2.45% | 2.20% | 1.45% |
| – Fee waiver and/or expense reimbursement | (.80)% | (.75)% | (.75)% | (1.00)% | (.75)% |
| = Total annual Fund operating expenses after fee waiver and/or expense reimbursement(1)(2) | .95% | 1.70% | 1.70% | 1.20% | .70% |
(1)The manager has contractually agreed through February 29, 2016 to limit the net annual operating expenses and acquired fund fees and expenses (exclusive of
distribution and service (12b-1) fees, taxes (including acquired fund taxes), interest, brokerage, dividend and interest expense on short sales (including acquired fund dividend and interest expense on short sales),
extraordinary expenses and certain other expenses) of each class of shares of the Fund to .70% of the Fund's average daily net assets. Separately, the distributor has contractually agreed through February 29, 2016 to
reduce its distribution and service (12b-1) fees for Class A shares to an annual rate of .25% of the average daily net assets of Class A shares and its distribution and service (12b-1) fees for Class R shares to an
annual rate of .50% of the average daily net assets of Class R shares. These waivers may not be terminated prior to February 29, 2016 without the prior approval of the Fund's Board of Trustees.
(2) The Fund's Total annual Fund operating expenses (after fee waiver and/or expense reimbursement) do not correlate to the ratio of expenses to average net assets
in the Financial Highlights table, which reflects the operating expenses of the Fund and does not include Acquired Fund Fees and Expenses.
Example. The following hypothetical example is intended to help you compare the cost of investing in the Fund with the cost of investing in other mutual funds. It assumes that you invest $10,000 in
the Fund for the time periods indicated and then, except as indicated, redeem all your shares at the end of those periods. It assumes a 5% return on your investment each year, that the Fund's operating expenses remain
the same (except that fee waivers or reimbursements, if any, are only reflected in the 1-Year figures) and that all dividends and distributions are reinvested. Your actual costs may be higher or lower.
| If Shares Are Redeemed | If Shares Are Not Redeemed | |||||||
| Share Class | 1 Year | 3 Years | 5 Years | 10 Years | 1 Year | 3 Years | 5 Years | 10 Years |
| Class A | $642 | $997 | $1,376 | $2,436 | $642 | $997 | $1,376 | $2,436 |
| Class B | $673 | $992 | $1,338 | $2,474 | $173 | $692 | $1,238 | $2,474 |
| Class C | $273 | $692 | $1,238 | $2,729 | $173 | $692 | $1,238 | $2,729 |
| Class R | $122 | $592 | $1,088 | $2,456 | $122 | $592 | $1,088 | $2,456 |
| Visit our website at www.prudentialfunds.com | 3 |
| If Shares Are Redeemed | If Shares Are Not Redeemed | |||||||
| Share Class | 1 Year | 3 Years | 5 Years | 10 Years | 1 Year | 3 Years | 5 Years | 10 Years |
| Class Z | $72 | $385 | $721 | $1,671 | $72 | $385 | $721 | $1,671 |
Portfolio
Turnover. The Fund pays transaction costs, such as commissions, when it buys and sells securities (or “turns over” its portfolio). A higher portfolio turnover rate may indicate higher
transaction costs and may result in higher taxes when Fund shares are held in a taxable account. These costs, which are not reflected in annual fund operating expenses or in the example, affect the Fund's performance.
During the Fund's most recent fiscal period, the Fund's portfolio turnover rate was 140% of the average value of its portfolio.
INVESTMENTS, RISKS AND
PERFORMANCE
Principal Investment
Strategies. In order to achieve its investment objective, the Fund seeks investments that are expected to both generate income and appreciate in value. The Fund seeks to achieve its investment
objectives by investing in a diversified portfolio consisting of a wide variety of income-oriented investments and strategies within the equity and fixed income market segments. The Fund may invest approximately 20%
to 80% of its total assets in equity and equity-related securities. The Fund also may invest approximately 20% to 80% of its total assets in fixed income investments. The Fund gains exposure to the equities and fixed
income market segments by investing in varying combinations of other Prudential mutual funds (the Underlying Prudential Funds), exchange traded funds (ETFs, and together with the Underlying Prudential Funds, the
Underlying Funds) and direct investments by the Fund's subadvisers. Investments in Underlying Funds will be included in the applicable market segment based on the primary investment focus of the Underlying
Funds.
Quantitative Management Associates
LLC (QMA), one of the Fund’s subadvisers, will tactically allocate the Fund's assets among the different sub-classes within equities and equity-related securities and fixed income investments. Asset allocation
decisions will be determined using a combination of quantitative tools and the judgment of QMA's investment professionals.
Equity and Equity-Related
Securities. The Fund's equity and equity-related securities include common stock, securities convertible or exchangeable for common stock or the cash value of such common stock, structured notes,
preferred securities, warrants and rights, Underlying Prudential Funds, ETFs, investments in various types of business ventures including partnerships and joint ventures and business development companies, real estate
securities, securities of real estate investment trusts (REITs) and income and royalty trusts, American Depositary Receipts and other similar securities issued by US or foreign companies of any market capitalization.
The Fund may invest in securities issued in an initial public offering (IPO). The Fund may invest up to 25% of total assets in publicly-traded master limited partnerships (MLPs).
Fixed Income Investments. The Fund's fixed income investments include Underlying Funds and all types of bonds of varying maturities and credit quality (including “junk” bonds), such as US Government
securities, debentures, notes, commercial paper, mortgage-related and asset-backed securities, convertibles, loan assignments and participations, corporate debt securities, money market instruments, foreign securities
(including emerging market securities) and other similar investments. Such investments may be denominated in US currency or foreign currencies (including currencies of emerging markets) and may consist of fixed income
instruments of companies or governments of US or foreign issuers, including emerging markets.
The Fund's
investments in high yield fixed income investments (commonly referred to as “junk” bonds) generally are rated either Ba1 or lower by Moody’s Investors Service (Moody’s), BB+ or lower by
Standard & Poor’s Ratings Services, a division of The McGraw Hill Companies, Inc. (Standard & Poor’s), or comparably rated by another nationally recognized statistical rating organization (NRSRO),
or, if unrated, are considered by Prudential Fixed Income (PFI), a business unit of Prudential Investment Management, Inc. (PIM), one of the Fund’s subadvisers, to be of comparable quality.
More detailed information appears
in the section entitled How the Fund Invests.
| 4 | Prudential Income Builder Fund |
Principal Risks of Investing in the
Fund. All investments have risks to some degree. Loss of money is a risk of investing in the Fund. Please remember that an investment in the Fund is not guaranteed to achieve its investment
objective; is not a deposit with a bank; is not insured, endorsed or guaranteed by the Federal Deposit Insurance Corporation or any other government agency; and is subject to investment risks, including possible loss
of your original investment.
Set forth below is a description
of the principal risks associated with an investment in the Fund either through direct investments or indirectly through the Fund’s investments in the Underlying Funds.
Market
Events. The global financial crisis that began in 2008 has caused a significant decline in the value and liquidity of many securities and unprecedented volatility in the markets. In response to
the crisis, the US Government and the Federal Reserve, as well as certain foreign governments and their central banks, have taken steps to support financial markets, including keeping interest rates low. The
withdrawal of this support, failure of efforts in response to the crisis, or investor perception that such efforts are not succeeding could negatively affect financial markets generally as well as the value and
liquidity of certain securities.
This environment could make
identifying investment risks and opportunities especially difficult for the subadviser, and whether or not the Fund invests in securities of issuers located in or with significant exposure to countries experiencing
economic and financial difficulties, the value and liquidity of the Fund’s investments may be negatively affected. In addition, policy and legislative changes in the United States and other countries are
changing many aspects of financial regulation. The impact of these changes on the markets, and the practical implications for market participants, may not be fully known for some time.
Risk of Increase in Expenses. Your actual cost of investing in the Fund may be higher than the expenses shown in the expense table for a variety of reasons. For example, expense ratios may be higher than those shown if
average net assets decrease. Net assets are more likely to decrease and Fund expense ratios are more likely to increase when markets are volatile. Active and frequent trading of Fund securities can increase
expenses.
Asset Allocation Risk. Asset allocation risk is the risk that the Fund’s assets may be allocated to an asset class that underperforms other asset classes. For example, fixed income securities may
underperform equities.
Fund of Funds Risk. The value of an investment in the Fund will be related, to a degree, to the investment performance of the Underlying Funds in which it invests. Therefore, the principal risks of investing
in the Fund are closely related to the principal risks associated with these Underlying Funds and their investments. Because the Fund’s allocation among different Underlying Funds and direct investments in
securities and derivatives will vary, an investment in the Fund may be subject to any and all of these risks at different times and to different degrees. Investing in an Underlying Fund will also expose the Fund to a
pro rata portion of the Underlying Fund’s fees and expenses. In addition, one Underlying Fund may buy the same securities that another Underlying Fund sells. Therefore, the Fund would indirectly bear the costs
of these trades without accomplishing the investment purpose.
Affiliated Funds
Risk. The Fund’s manager serves as the manager of the Underlying Prudential Funds. It is possible that a conflict of interest among the Fund and the Underlying Prudential Funds could
affect how the manager and subadvisers fulfill their fiduciary duties to the Fund and the Underlying Prudential Funds. Because the amount of the investment management fees to be retained by the manager and the
subadvisers may differ depending upon the Underlying Prudential Funds in which the Fund invests, there is a conflict of interest for the manager and the subadvisers in selecting the Underlying Prudential Funds. In
addition, the manager and the subadvisers may have an incentive to take into account the effect on an Underlying Prudential Fund in which the Fund may invest in determining whether, and under what circumstances, to
purchase or sell shares in that Underlying Prudential Fund. Although the manager and the subadvisers take steps to address the conflicts of interest, it is possible that the conflicts could impact the Fund. In
addition, the subadvisers may invest in Underlying Prudential Funds that have a limited or no performance history.
| Visit our website at www.prudentialfunds.com | 5 |
Asset Class Variation Risk. The Underlying Funds invest principally in the securities constituting their asset class (i.e., domestic or international real estate, utilities, infrastructure, natural resources, MLPs
and various types of fixed-income investments). However, under normal market conditions, an Underlying Fund may vary the percentage of its assets in these securities (subject to any applicable regulatory
requirements). Depending upon the percentage of securities in a particular asset class held by the Underlying Funds at any given time and the percentage of the Fund’s assets invested in the Underlying Funds, the
Fund’s actual exposure to the securities in a particular asset class may vary substantially from its allocation to that asset class.
Multi-Manager Risk. While the manager monitors the investments of each subadviser and monitors the overall management of the Fund, each subadviser makes investment decisions for the asset classes it manages
independently from one another. It is possible that the investment styles used by a subadviser in an asset class will not always be complementary to those used by others, which could adversely affect the performance
of the Fund.
Master Limited Partnerships
Risk. The risks of investing in an MLP are generally those involved in investing in a partnership as opposed to a corporation. For example, state law governing partnerships is often less
restrictive than state law governing corporations. MLPs may have limited financial resources, their securities may trade infrequently and in limited volume and they may be relatively illiquid, and they may be subject
to more abrupt or erratic price movements than securities of larger or more broadly-based companies. The Fund’s investments in MLPs also subjects the Fund to risks associated with the specific industry or
industries in which the MLPs invest, risks related to limited control and limited rights to vote on matters affecting the MLP, risks related to potential conflicts of interest between the MLP and the MLP’s
general partner, cash flow risks, dilution risks and risks related to the general partner’s right to require unit-holders to sell their common units at an undesirable time or price. MLPs are generally considered
interest-rate sensitive investments. During periods of interest rate volatility, these investments may not provide attractive returns. Since MLPs generally conduct business in multiple states, the Fund may be subject
to income or franchise tax in each of the states in which the partnership does business. The additional cost of preparing and filing the tax returns and paying the related taxes may adversely impact the Fund’s
return on its investment in MLPs.
Initial Public Offerings Risk. The Fund may participate in the initial public offering (IPO) market. The volume of IPOs and the levels at which the newly issued stocks trade in the secondary market are affected by the
performance of the stock market overall. If IPOs are brought to the market, availability may be limited and if the Fund desires to acquire shares in such an offering, it may not be able to buy any shares at the
offering price, or if it is able to buy shares, it may not be able to buy as many shares at the offering price as it would like. The prices of securities involved in IPOs are often subject to greater and more
unpredictable price changes than more established stocks. Such unpredictability can have a dramatic impact on the Fund's performance (higher or lower) and any assumptions by investors based on the affected performance
may be unwarranted. In addition, as Fund assets grow, the impact of IPO investments on performance will decline, which could reduce total returns.
Management Risk. Actively managed mutual funds are subject to management risk. The subadvisers will apply investment techniques and risk analyses in making investment decisions for the Fund, but there can
be no guarantee that these techniques will produce the desired results. Additionally, the securities or Underlying Funds selected by the manager and/or subadvisers may underperform the markets in general, the
Fund’s benchmark and other mutual funds with similar investment objectives.
Bond Obligations
Risk. As with credit risk, market risk and interest rate risk, the Fund's holdings, share price, yield and total return may fluctuate in response to bond market movements. The value of bonds may
decline for issuer-related reasons, including management performance, financial leverage and reduced demand for the issuer’s goods and services. Certain types of fixed income obligations also may be subject to
call and redemption risk, which is the risk that the issuer may call a bond held by the Fund for redemption before it matures and the Fund may lose income.
Junk Bonds Risk. High-yield, high-risk bonds have predominantly speculative characteristics, including particularly high credit risk. Junk bonds tend to be less liquid than higher-rated securities. The
liquidity of particular issuers or industries within a particular investment category may shrink or disappear suddenly and without warning. The
| 6 | Prudential Income Builder Fund |
non-investment grade bond market can experience
sudden and sharp price swings and become illiquid due to a variety of factors, including changes in economic forecasts, stock market activity, large sustained sales by major investors, a high profile default or a
change in the market's psychology.
Credit Risk. This is the risk that the issuer, the guarantor or the insurer of a fixed-income security, or the counterparty to a contract, may be unable or unwilling to make timely principal and
interest payments or to otherwise honor its obligations. Additionally, the securities could lose value due to a loss of confidence in the ability of the issuer, guarantor, insurer or counterparty to pay back debt. The
longer the maturity and the lower the credit quality of a bond, the more sensitive it is to credit risk.
Interest Rate Risk. This is the risk that the securities in which the Fund invests could lose value because of interest rate changes. For example, bonds tend to decrease in value if interest rates rise. Debt
obligations with longer maturities generally are more sensitive to interest rate changes. In addition, short-term and long-term interest rates do not necessarily move in the same direction or by the same amount. An
instrument's reaction to interest rate changes depends on the timing of its interest and principal payments and the current interest rate for each of those time periods. Instruments with floating interest rates can be
less sensitive to interest rate changes. The Fund may be subject to a greater risk of rising interest rates due to the current period of historically low rates. The Fund may lose money if short-term or long-term
interest rates rise sharply in a manner not anticipated by the subadvisers. Certain types of debt obligations are also subject to prepayment and extension risk. When interest rates fall, the issuers of debt
obligations may prepay principal more quickly than expected, and the Fund may be required to reinvest the proceeds at a lower interest rate. This is referred to as “prepayment risk.” When interest rates
rise, debt obligations may be repaid more slowly than expected, and the value of the Fund's holdings may fall sharply. This is referred to as “extension risk.”
Foreign Securities Risk. Investing in securities of non-US issuers generally involves more risk than investing in securities of US issuers. Foreign political, economic and legal systems, especially those in
developing and emerging countries, may be less stable and more volatile than in the US. Foreign legal systems generally have fewer regulatory requirements than the US legal system. Additionally, the changing value of
foreign currencies could also affect the value of the assets the Fund holds and the Fund's performance. Certain foreign countries may impose restrictions on the ability of issuers of foreign securities to make payment
of principal and interest or dividends to investors located outside the country, due to blockage of foreign currency exchanges or otherwise. Investments in foreign securities may be subject to non-US withholding and
other taxes. Investments in emerging markets countries are subject to greater volatility and price declines. Low trading volumes may result in a lack of liquidity and in price volatility. In addition, such countries
may have policies that restrict investment by foreign investors, or that prevent foreign investors from withdrawing their money at will.
Liquidity Risk. This is the risk that the Fund may invest to a greater degree in instruments that trade in lower volumes and may make investments that may be less liquid than other investments. It also
includes the risk that the Fund may make investments that may become less liquid in response to market developments or adverse investor perceptions. When there is no willing buyer and investments cannot be readily
sold at the desired time or price, the Fund may have to accept a lower price or may not be able to sell the instrument at all. An inability to sell a portfolio position can adversely affect the Fund’s value or
prevent the Fund from being able to take advantage of other investment opportunities. Liquidity risk may also refer to the risk that the Fund will not be able to pay redemption proceeds within the allowable time
period because of unusual market conditions, an unusually high volume of redemption requests, or other reasons. To meet redemption requests, the Fund may be forced to sell liquid securities at an unfavorable time and
conditions.
Emerging Markets Risk. The risks of non-US investments are greater for investments in emerging markets. Emerging market countries typically have economic and political systems that are less fully developed, and
can be expected to be less stable, than those of more developed countries. For example, the economies of such countries can be subject to rapid and unpredictable rates of inflation or deflation. Low trading volumes
may result in a lack of liquidity and price volatility. Emerging market countries may have policies that restrict investment by foreigners, or that prevent foreign investors from withdrawing their money at
will.
| Visit our website at www.prudentialfunds.com | 7 |
Equity Securities Risk. The price of a particular stock the Fund owns could go down and you could lose money. In addition to an individual stock losing value, the value of the equity markets or a sector of them in
which the Fund invests could go down. Different sectors of a market can react differently to adverse issuer, market, regulatory, political and economic developments.
Market Capitalization Risk. The Fund may invest in companies of any market capitalization. Generally, the stock prices of small- and medium-sized companies are less stable than the prices of large company stocks and
may present greater risks. In exchange for the potentially lower risks of investing in large capitalization companies, the Fund's value may not rise as much as the value of funds that emphasize smaller capitalization
companies. Large capitalization companies as a group could fall out of favor with the market, causing the Fund to underperform compared to investments that focus on smaller capitalized companies.
Active Trading Risk. The Fund actively and frequently trades its portfolio securities. High portfolio turnover results in higher transaction costs, which can affect the Fund’s performance and have
adverse tax consequences.
Risks of Investing in Infrastructure
Companies. Securities of infrastructure companies are more susceptible to adverse economic, social, political and regulatory occurrences affecting their industries. Infrastructure companies may be
subject to a variety of factors that may adversely affect their business or operations, including high interest costs in connection with capital construction programs, high leverage, costs associated with
environmental and other regulations, the effects of economic slowdown, surplus capacity, insufficient supply of necessary resources, increased competition from other providers of similar services, uncertainties
concerning the availability of fuel at reasonable prices, the effects of energy conservation policies and other factors. Certain infrastructure companies may operate in limited areas or have few sources of
revenue.
Infrastructure companies may also
be affected by or subject to:
| ■ | regulation by various government authorities; |
| ■ | government regulation of rates charged to customers; |
| ■ | service interruption due to environmental, operational or other mishaps as well as political and social unrest; |
| ■ | the imposition of special tariffs and changes in tax laws, regulatory policies and accounting standards; and |
| ■ | general changes in market sentiment towards the assets of infrastructure companies. |
Real Estate Risk. The value of real estate securities in general, and REITs in particular, is subject to the same risks as direct investments in real estate and mortgages, and their value will depend on
the value of the underlying properties or the underlying loans or interests. The underlying loans may be subject to the risks of default or of prepayments that occur earlier or later than expected, and such loans may
also include so-called “subprime” mortgages. The value of these securities will rise and fall in response to many factors, including economic conditions, the demand for rental property, interest rates and,
with respect to REITs, the management skill and creditworthiness of the issuer. In particular, the value of these securities may decline when interest rates rise and will also be affected by the real estate market and
by the management of the underlying properties. REITs may be more volatile and/or more illiquid than other types of equity securities. The Fund will indirectly bear a portion of the expenses, which may include
management fees, paid by each REIT in which it invests, in addition to the expenses of the Fund.
Real Estate Investment Trust (REIT)
Risk. Investing in REITs involves certain unique risks in addition to those risks associated with investing in the real estate industry in general. Equity REITs may be affected by changes in
the value of the underlying property owned by the REITs, while mortgage REITs may be affected by the quality of any credit extended. REITs are dependent upon management skills, may not be diversified geographically or
by property/mortgage asset type, and are subject to heavy cash flow dependency, default by borrowers and self-liquidation. REITs must also meet certain requirements under the Internal Revenue Code of 1986, as amended
(the “Code”) to avoid entity level tax and be eligible to pass-through certain tax attributes of their income to shareholders. REITs are consequently subject to the risk of failing to meet these
requirements for favorable tax treatment and of failing to maintain their exemptions from registration under the Investment Company Act of 1940 (the 1940 Act). REITs are subject to the risks of changes in the Code
affecting their tax status. REITs (especially mortgage REITs) are subject to interest rate risks. Small capitalization REITs may have limited financial resources, may
| 8 | Prudential Income Builder Fund |
trade less frequently and in limited volume and
may be subject to more abrupt or erratic price movements than larger company securities. REITs may incur significant amounts of leverage. The Fund’s investments in REITs may subject the Fund to duplicate
management and/or advisory fees.
Although we try to invest wisely,
all investments involve risk. Because the Fund invests in real estate securities, including REITs, the Fund is subject to the risks of investing in the real estate industry, such as changes in general and local
economic conditions, the supply and demand for real estate and changes in zoning and tax laws. Real estate companies, including REITs, utilize leverage (and some may be highly leveraged), which increases investment
risk. Because we invest in stocks, there is the risk that the price of a particular stock we own could go down or pay lower-than-expected or no dividends. In addition to an individual stock losing value, the value of
the equity markets or of companies comprising the real estate industry could go down.
For more information on the risks
of investing in this Fund, including the risks of foreign securities, please see How the Fund Invests—Investment Risks in the Prospectus and Investment Risks and Considerations in the SAI.
The Fund's Past
Performance. The following bar chart shows the Fund's performance for the Class A share class for each full calendar year of operations or for the last 10 calendar years, whichever is shorter. The bar chart and Average Annual Total Returns table demonstrate the risk
of investing in the Fund by showing how returns can change from year to year and by showing how the Fund's average annual total returns for the share class compare with a broad-based securities market index and a
group of similar mutual funds.
Past performance (before and after
taxes) does not mean that the Fund will achieve similar results in the future. Updated Fund performance information is available online at www.prudentialfunds.com.
Effective
September 23, 2014, the Fund’s investment objective, strategies and policies were changed and QMA, Jennison Associates LLC, PFI and Prudential Real Estate Investors became the subadvisers to the Fund. The
Fund’s performance prior to September 23, 2014 is not attributable to the Fund's current subadvisers or to its current investment strategies. The Fund no longer compares its performance to the Customized Blend
Index because the Fund’s manager believes that the Barclays US Aggregate Bond Index provides a more appropriate basis for performance comparisons in light of the Fund’s adoption of the new investment
objective, policies and strategies.
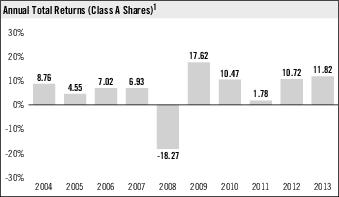
1 These annual total returns do not include sales charges. If the sales charges were included, the annual total returns would be lower than those shown. Without the distribution
and service (12b-1) fee waiver, the annual returns would have been lower, too. The total return for Class A shares from January 1, 2014 to September 30, 2014 was 3.32%.
| Average Annual Total Returns % (including sales charges) (as of 12-31-13) | ||||
| Return Before Taxes | One Year | Five Years | Ten Years | Since Inception |
| Class B shares | 6.07 | 9.40 | 4.91 | — |
| Class C shares | 9.97 | 9.52 | 4.90 | — |
| Class R shares | 11.47 | 10.06 | N/A | 5.50 (10/4/04) |
| Class Z shares | 12.03 | 10.63 | 5.96 | — |
| Visit our website at www.prudentialfunds.com | 9 |
| Class A Shares % (including sales charges) | ||||
| Return Before Taxes | 5.67 | 9.12 | 5.11 | — |
| Return After Taxes on Distributions | 4.15 | 8.55 | 3.91 | — |
| Return After Taxes on Distribution and Sale of Fund Shares | 4.37 | 7.16 | 3.77 | — |
° After-tax returns
are calculated using the historical highest individual federal marginal income tax rates and do not reflect the impact of state and local taxes. Actual after-tax returns depend on an investor’s tax situation and
may differ from those shown. After-tax returns shown are not relevant to investors who hold their Fund shares through tax deferred arrangements, such as 401(k) plans or individual retirement accounts. After-tax
returns are shown only for Class A shares. After-tax returns for other classes will vary due to differing sales charges and expenses.
| Index % (reflects no deduction for fees, expenses or taxes) | ||||
| S&P 500 Index | 32.37 | 17.93 | 7.40 | — |
| Barclays US Aggregate Bond Index | -2.02 | 4.44 | 4.55 | — |
| Customized Blend Index | 11.09 | 10.31 | 6.18 | — |
| Lipper Average % (reflects no deduction for sales charges or taxes) | ||||
| Lipper Flexible Portfolio Funds Average | 6.76 | 9.58 | 4.86 | — |
MANAGEMENT OF THE FUND
| Investment Manager | Subadviser | Portfolio Managers | Title | Service Date |
| Prudential Investments LLC | Quantitative Management Associates LLC | Ted Lockwood | Managing Director | September 2014 |
| Edward L. Campbell, CFA | Principal | September 2014 | ||
| Rory Cummings | Investment Associate | September 2014 | ||
| Jennison Associates LLC | Ubong “Bobby” Edemeka | Managing Director | September 2014 | |
| Shaun Hong, CFA | Managing Director | September 2014 | ||
| Prudential Investment Management, Inc. – Prudential Fixed Income | Paul Appleby, CFA | Managing Director and co-Head of Prudential Fixed Income’s Leveraged Finance Team | September 2014 | |
| David Bessey | Managing Director and Head of Prudential Fixed Income’s Emerging Markets Debt Team | September 2014 | ||
| Robert Cignarella, CFA | Managing Director and co-Head of Prudential Fixed Income’s Leveraged Finance Team | September 2014 | ||
| Brian Clapp, CFA | Principal | September 2014 | ||
| Michael J. Collins, CFA | Managing Director and Senior Investment Officer of Prudential Fixed Income | September 2014 | ||
| Cathy L. Hepworth, CFA | Managing Director of Prudential Fixed Income’s Emerging Markets Debt Team | September 2014 | ||
| Terence Wheat, CFA | Principal | September 2014 | ||
| Robert Spano, CFA, CPA | Principal | September 2014 | ||
| Daniel Thorogood, CFA | Vice-President of Prudential Fixed Income’s Leveraged Finance Team | September 2014 |
| 10 | Prudential Income Builder Fund |
| Investment Manager | Subadviser | Portfolio Managers | Title | Service Date |
| Ryan Kelly, CFA | Principal | September 2014 | ||
| Prudential Investment Management, Inc. – Prudential Real Estate Investors | Marc R. Halle | Managing Director and Head of Global Real Estate Securities | September 2014 | |
| Rick J. Romano | Portfolio Manager: US Real Estate Securities | September 2014 | ||
| Gek Lang Lee, CFA | Portfolio Manager: Asia Real Estate Securities | September 2014 | ||
| Michael Gallagher | Portfolio Manager: European Real Estate Securities | September 2014 |
BUYING AND SELLING FUND
SHARES
| Minimum Initial Investment | Minimum Subsequent Investment | |
| Fund shares (most cases)* | $2,500 | $100 |
| Retirement accounts and custodial accounts for minors | $1,000 | $100 |
| Automatic Investment Plan (AIP) | $50 | $50 |
*Note:
Class B shares are closed to new purchases. Please see “How to Buy, Sell and Exchange Fund Shares—Closure of Class B Shares” in the Prospectus for more information.
You can purchase or redeem shares
through the Fund's transfer agent or through servicing agents, including brokers, dealers and other financial intermediaries appointed by the distributor to receive purchase and redemption orders. Current shareholders
may also purchase or redeem shares through the Fund's website or by calling (800) 225-1852.
TAX INFORMATION
Dividends, Capital Gains and
Taxes. The Fund's dividends and distributions are taxable and will be taxed as ordinary income or capital gains, unless you are investing through a tax-deferred arrangement, such as a 401(k) plan
or an individual retirement account. Such tax-deferred arrangements may be taxed later upon withdrawal of monies from those arrangements.
FINANCIAL INTERMEDIARY
COMPENSATION
If you purchase Fund shares through
a financial services firm, the Fund, the Fund’s investment manager, or their related companies may pay the financial services firm for the sale of Fund shares and/or for services to shareholders. These payments
may create a conflict of interest by influencing the financial services firm or the firm's representatives to recommend the Fund over another investment. Ask your financial services firm or representative for more
information or visit your financial services firm's website.
| Visit our website at www.prudentialfunds.com | 11 |
HOW THE FUND INVESTS
INVESTMENT OBJECTIVE AND
POLICIES
The Fund’s investment
objective is to seek income and long-term capital growth. This means that we seek investments that are expected to both generate income and appreciate in value. The Fund seeks to achieve its
objectives by investing in a diversified portfolio consisting of a variety of income-oriented investments and strategies within the equity and fixed-income market segments. QMA will tactically allocate the
Fund’s assets among various sub-classes within equity and equity-related securities and fixed-income investments. QMA’s dynamic allocation will adjust allocations as yields change in response to market
conditions.
Equity and Equity-Related
Securities. The Fund's equity and equity-related securities include common stock, securities convertible into or exchangeable for common stock, structured notes, preferred securities, warrants and
rights, Underlying Prudential Funds, ETFs, investments in various types of business ventures including partnerships and joint ventures and business development companies, real estate securities, securities of real
estate investment trusts (REITs) and income and royalty trusts, American Depositary Receipts and other similar securities issued by US or foreign companies of any market capitalization. The Fund may invest in
securities issued in an initial public offering (IPO). The Fund may invest up to 25% of total assets in publicly-traded master limited partnerships (MLPs).
Master Limited Partnerships. The Fund’s MLP investments may include, but are not limited to: MLPs structured as limited partnerships (LPs) or limited liability companies (LLCs); MLPs that are taxed as
“C” corporations; institutional units (I-Units) issued by MLP affiliates, parent companies of MLPs, shares of companies owning MLP general partnership interests and other securities representing indirect
beneficial ownership interests in MLP common units; “C” corporations that hold significant interests in MLPs; and other equity and fixed income securities and derivative instruments, including pooled
investment vehicles and exchange traded products (ETPs), that provide exposure to MLP investments. MLPs generally own and operate assets that are used in the energy sector, including assets used in exploring,
developing, producing, generating, transporting (including marine), transmitting, terminal operation, storing, gathering, processing, refining, distributing, mining or marketing of natural gas, natural gas liquids,
crude oil, refined products, coal or electricity, or that provide energy related equipment or services.
MLPs formed as LPs or LLCs are
generally treated as partnerships for US federal income tax purposes. To be treated as a partnership for US federal income tax purposes, an MLP must derive at least 90% of its gross income for each taxable year from
qualifying sources, including activities such as the exploration, development, mining, production, processing, refining, transportation, storage and certain marketing of mineral or natural resources. MLPs are
generally publicly traded, and as a result are subject to the SEC’s rules and regulations and make public filings like any publicly traded corporation. The Fund may also invest in privately placed securities of
publicly traded MLPs.
Many of the MLPs in which the Fund
invests operate oil, gas or petroleum facilities, or other facilities within the energy sector. The Fund may invest in “downstream,” “midstream” and “upstream” MLPs. Downstream MLPs
are primarily engaged in the processing, treatment, and refining of natural gas liquids and crude oil. Midstream MLPs are generally engaged in the treatment, gathering, compression, processing, transportation,
transmission, fractionation, storage and terminating of natural gas, natural gas liquids, crude oil, refined products or coal. Midstream MLPs may also operate ancillary businesses including marketing of energy
products and logistical services. Upstream MLPs are primarily engaged in the exploration, recovery, development and production of crude oil, natural gas and natural gas liquids. The MLPs in which the Fund invests may
also engage in owning, managing and transporting alternative energy assets, including alternative fuels such as ethanol, hydrogen and biodiesel.
Real Estate Companies. The Fund considers a real estate company to be a company that: (i) derives at least 50% of its revenues from the ownership, construction, financing, management or sale of commercial,
industrial or residential real estate, or (ii) has at least 50% of its assets in these types of real estate. The Fund invests in the equity-related securities of real estate companies on a global basis, which means
that the companies may be US companies or foreign companies, and there is no limit on the amount of Fund assets that may be invested in the securities of foreign real estate companies.
| 12 | Prudential Income Builder Fund |
Real Estate Investment Trusts.
The Fund may invest in the securities of real estate investment trusts known as REITs. REITs are like corporations, except that they do not pay income taxes if they meet certain tax
requirements. However, while REITs themselves do not pay income taxes, the distributions they make to investors are taxable. REITs invest primarily in real estate (offices, hotels, shopping centers, apartments, malls,
factories, etc.) or real estate mortgages and distribute almost all of their income—most of which comes from rents, mortgages and gains on sales of property—to shareholders. Investing in REITs may result
in the layering of management fees paid by the Fund.
Fixed Income Investments. The Fund's fixed income investments include Underlying Prudential Funds, ETFs, and all types of bonds of varying maturities and credit quality (including “junk” bonds), such as
US Government securities, debentures, notes, commercial paper, mortgage-related and asset-backed securities, convertibles, loan assignments and participations, corporate debt securities, money market instruments,
foreign securities and other similar investments. Such investments may be denominated in US currency or foreign currencies (including currencies of emerging markets) and may consist of fixed income instruments of
companies or governments of US or foreign issuers, including emerging markets.
The Fund's investments in high
yield fixed income investments (commonly referred to as “junk” bonds) generally are rated either Ba1 or lower by Moody’s Investors Service (Moody’s), BB+ or lower by Standard & Poor’s
Ratings Services, a division of The McGraw Hill Companies, Inc. (Standard & Poor’s) or comparably rated by another nationally recognized statistical rating organization (NRSRO), or, if unrated, are
considered by Prudential Fixed Income (PFI), a business unit of PIM, to be of comparable quality. In the event that a security receives different ratings from different NRSROs, the Fund will treat the security as
being rated in the highest rating category received from an NRSRO. With respect to the Fund’s investments in emerging markets, the Fund expects to utilize derivatives, such as forward contracts, options, futures
contracts or swap agreements, denominated in any currency, to obtain all or a portion of exposure to emerging market instruments. Emerging market countries are generally considered to be countries that are on the
World Bank’s list of low or middle income countries as well as any other country that PFI considers to be an emerging economy or market. Emerging market countries are expected to include, but are not limited to,
Argentina, Brazil, Chile, China, Colombia, Czech Republic, Egypt, Hungary, India, Indonesia, Israel, Malaysia, Mexico, Peru, Philippines, Poland, Romania, Russia, Singapore, Slovakia, South Africa, South Korea,
Taiwan, Thailand, and Turkey. The Fund may invest to a lesser extent in lesser-developed emerging market countries that are not included in standard emerging market benchmarks and are not widely followed by investors
(commonly referred to as “frontier countries”). Emerging market debt securities include public or private sector entities as well as junk bonds.
Foreign Securities. The Fund may invest in securities of non-US issuers, which we refer to as foreign securities, including stocks and other equity-related securities, money market instruments and other
fixed-income securities of foreign issuers. Foreign securities may include securities from emerging markets. We do not consider American Depositary Receipts (ADRs), American Depositary Shares (ADSs) and other similar
receipts or shares traded in US markets to be foreign securities.
Exchange-Traded Funds. The Fund may invest in securities of exchange traded funds (ETFs), subject to certain limits on investment in securities of non-affiliated investment companies. Securities of ETFs
represent shares of ownership in either mutual funds or unit investment trusts (UITs) that generally hold a portfolio of common stocks or bonds designed to generally correspond to the price and yield performance of a
specific securities index. Such holdings are subject to any management fees of the mutual fund or UIT. The underlying portfolio may have a broad market, sector or international orientation. ETFs give investors the
opportunity to buy or sell an entire portfolio of stocks in a single security transaction in a manner similar to buying or selling a share of stock. Investments in ETFs may entail duplicate management
fees.
The Fund expects to purchase and
sell shares of ETFs on a national securities exchange through a broker-dealer. The price of ETF shares is based on market price, and because ETF shares trade at market prices rather than at net asset value, ETF shares
may trade at a price greater than net asset value (a premium) or less than net asset value (a
| Visit our website at www.prudentialfunds.com | 13 |
discount). ETFs only issue or redeem shares
that have been aggregated into large blocks (“Creation Units”) to authorized participants that have entered into agreements with the ETF’s distributor. ETFs generally issue or redeem Creation Units
in return for a designated portfolio of securities (and an amount of cash) that the ETF specifies each day.
Underlying Funds and Exchange Traded
Funds
The Fund may invest in the
following Underlying Funds to obtain exposure to the market segment noted below.
| Underlying Funds | ||
| Market Segment/ Strategy | Name of Underlying Fund | Investment Objective and Investment Strategies of Underlying Fund |
| Equity | Prudential Jennison MLP Fund(1) | The Fund seeks to provide total return through a combination of current income and capital appreciation. The Fund normally invests at least 80% of its investable assets in MLPs and MLP related investments (together, MLP investments). The Fund’s investments may be of any capitalization size. The Fund’s MLP investments may include, but are not limited to: MLPs structured as LPs or LLCs; MLPs that are taxed as “C” corporations; I-Units issued by MLP affiliates; parent companies of MLPs; shares of companies owning MLP general partnership interests and other securities representing indirect beneficial interest ownership interests in MLP common units, “C” corporations that hold significant interests in MLPs; and other equity and fixed income securities and derivative instruments, including pooled investment vehicles and ETPs, that provide exposure to MLP investments. MLPs generally own and operate assets that are used in the energy sector, including assets used in exploring, developing, producing, generating, transporting (including marine), transmitting, terminal operation, storing, gathering, processing, refining, distributing, mining or marketing of natural gas, natural gas liquids, crude oil, refined products, coal or electricity, or that provide energy related equipment or services. Many of the MLPs in which the Fund invests operate oil, gas or petroleum facilities, or other facilities within the energy sector. The Fund intends to concentrate its investments in the energy sector. In deciding which stocks to buy, the investment subadviser relies on proprietary fundamental research, focused on the discovery of quality companies with predictable and sustainable cash flows. In narrowing the investment universe, the investment team compares prospective candidates’ competitive positioning, including strategically located assets; distribution coverage ratios; organic growth opportunities; expected dividend or distribution growth; the quality of the management team; balance sheet strength; and the support of the general partner. Valuation and the investment’s degree of liquidity factor into the portfolio managers’ decision calculus, as well. The team also monitors wider industry dynamics and interacts continually with the investment subadviser’s Natural Resources investment professionals to gain insights into emerging trends, such as the anticipation of an acceleration or reduction in production of particular oil and gas plays or a shift in regulatory or tax policy, which could affect potential or current positions. |
| Equity | Prudential Jennison Utility Fund(1) | The Fund seeks total return through a combination of capital appreciation and current income. The Fund seeks investments whose prices will increase as well as pay the Fund dividends and other income. The Fund normally invest at least 80% of the Fund's investable assets in equity and equity-related and investment-grade debt securities of utility companies. Utility companies, based on the Global Industry Classification Standard (GICS) industry classifications, as they may be amended from time to time, include electric utilities, gas utilities, water utilities, multi-utilities, independent power producers, diversified telecommunication services, wireless telecommunication services, transportation infrastructure, energy equipment and services and oil, gas and consumable fuels. The Fund may invest more than 5% of the Fund's assets in any one issuer. The Fund may invest up to 50% of its investable assets in foreign securities. |
| 14 | Prudential Income Builder Fund |
| Underlying Funds | ||
| Market Segment/ Strategy | Name of Underlying Fund | Investment Objective and Investment Strategies of Underlying Fund |
| Equity | Prudential Jennison Global Infrastructure Fund(1) | The Fund seeks total return. The Fund normally will invest at least 80% of its investable assets in securities of US and foreign (non-US based) infrastructure companies. The Fund will consider a company an infrastructure company if the company is categorized, based on the GICS industry classifications, as they may be amended from time to time, within the following industries: Aerospace and Defense, Air Freight and Logistics, Airlines, Building Products, Commercial Services and Supplies, Communications Equipment, Construction and Engineering, Construction Equipment, Diversified Telecommunication Services, Electrical Equipment, Electric Utilities, Energy Equipment and Services, Gas Utilities, Health Care Providers and Services, Independent Power Producers and Energy Traders, Industrial Conglomerates, Machinery, Marine, Metals and Mining, Multi-Utilities, Oil, Gas and Consumable Fuels, Rail and Road, Transportation Infrastructure, Water Utilities and Wireless Telecommunication Services. Examples of assets held by infrastructure companies include toll roads, airports, rail track, shipping ports, telecom infrastructure, hospitals, schools, utilities such as electricity, gas distribution networks and water, and oil and gas pipelines. |
| Equity | PowerShares Preferred Portfolio(3) | The Fund seeks investment results that generally correspond to the price and yield (before fees and expenses) of The BofA Merrill Lynch Core Plus Fixed Rate Preferred Securities Index (the “Index”). The Fund normally will invest at least 80% of its total assets in fixed rate US dollar-denominated preferred securities that comprise the Index. The Index tracks the performance of fixed rate US dollar-denominated preferred securities issued in the US domestic market. Securities must be rated at least B3, based on an average of three leading ratings agencies: Moody’s, S&P and Fitch, Inc. (Fitch) and must have an investment-grade country risk profile (based on an average of Moody’s, S&P and Fitch foreign currency long-term sovereign debt ratings). The Fund will concentrate its investments (i.e., invest 25% or more of the value of its total assets) in securities of issuers in any one industry or sector only to the extent that the Index reflects a concentration in that industry or sector. |
| Fixed Income | Prudential Short-Term Corporate Bond Fund, Inc.(2) | The Fund seeks high current income consistent with the preservation of principal. The Fund invests, under normal circumstances, at least 80% of its investable assets in bonds of corporations with varying maturities. For purposes of this policy, bonds include all fixed-income securities, other than preferred stock, and corporations include all private issuers. The effective duration of the Fund's portfolio will generally be less than three years. The Fund will buy and sell securities to take advantage of investment opportunities based on the subadviser's analysis of market conditions, interest rates and general economic factors. |
| Fixed Income | Prudential Short Duration High Yield Income Fund(2) | The Funds seeks to provide a high level of current income. The Fund will seek to achieve its investment objective by investing primarily in a diversified portfolio of high yield fixed income instruments that are rated below investment grade by a NRSRO or, if unrated, are considered by the investment subadviser to be of comparable quality. Under normal market conditions, the Fund will invest at least 80% of its investable assets in a diversified portfolio of high yield fixed income instruments that are below investment grade with varying maturities and other investments (including derivatives) with similar economic characteristics. The term “below investment grade” in this prospectus refers to instruments either rated Ba1 or lower by Moody’s, BB+ or lower by Standard & Poor’s or Fitch, or comparably rated by another NRSRO, or, if unrated, are considered by the investment subadviser to be of comparable quality. Although the Fund may invest in instruments of any duration or maturity, the Fund normally will seek to maintain a weighted average portfolio duration of three years or less and a weighted average maturity of five years or less. |
| Fixed Income | Prudential Floating Rate Income Fund(2) | The Fund seeks to maximize current income. In addition the Fund seeks capital appreciation as a secondary investment objective, but only when consistent with the Fund's primary investment objective of seeking to maximize current income. Under normal market conditions, the Fund will invest at least 80% of its investable assets (net assets plus borrowings for investment purposes, if any) in floating rate loans and other floating rate debt securities. Floating rate loans are debt obligations that have interest rates which adjust or “float” periodically (normally on a monthly or quarterly basis) based on a generally recognized base rate such as the London Interbank Offered Rate (LIBOR) or the prime rate offered by one or more major US banks. |
| Visit our website at www.prudentialfunds.com | 15 |
| Underlying Funds | ||
| Market Segment/ Strategy | Name of Underlying Fund | Investment Objective and Investment Strategies of Underlying Fund |
| Fixed Income | Prudential Short Duration Multi-Sector Bond Fund(2) | The Fund seeks total return. The Fund seeks to achieve its objective by investing in fixed-income instruments, whereby issuers borrow money from investors in return for either a fixed or variable rate of interest and eventual repayment of the amount borrowed. The Fund invests, under normal circumstances, at least 80% of the Fund's investable assets in fixed income instruments with varying maturities. The Fund has the flexibility to allocate its investments across different sectors of the fixed income securities markets. The Fund's investment subadviser allocates assets among different sectors of the fixed income markets, including (but not limited to) US Government securities, mortgage-related and asset-backed securities, corporate debt securities, foreign debt securities and loan participations and assignments. The Fund is not obligated to invest in all of these sectors at a given time and, at times, may invest all of its assets in only one sector. Although the Fund may invest in instruments of any duration or maturity, the Fund normally will seek to maintain a weighted average portfolio duration of three years or less and a weighted average maturity of five years or less. The Fund's weighted average portfolio duration, however, may be longer at any time or from time to time depending on market conditions. |
| Fixed Income | Prudential Absolute Return Bond Fund(2) | The Fund seeks positive returns over the long term, regardless of market conditions. The Fund has a flexible investment strategy and will invest in a variety of securities and instruments. The Fund will also use a variety of investment techniques in pursuing its investment objective, which may include managing duration, credit quality, yield curve positioning and currency exposure, as well as sector and security selection. Under normal market conditions, the Fund will invest at least 80% of its investable assets in debt securities and/or investments that provide exposure to bonds. |
| Fixed Income | SPDR® Barclays Convertible Securities ETF(4) | The Fund seeks to provide investment results that, before fees and expenses, correspond generally to the price and yield performance of an index that tracks US convertible securities markets with outstanding issue sizes greater than $500 million. The Fund purchases the underlying securities of the index in order to gain exposure to US convertible bonds with outstanding issue sizes greater than $500 million.Under normal market conditions, the Fund generally invests substantially all, but at least 80%, of its total assets in the securities comprising the Index or in securities that are determined to have economic characteristics that are substantially identical to the economic characteristics of the securities that comprise the Index. In addition, the Fund may invest in debt securities that are not included in the Index, cash and cash equivalents or money market instruments, such as repurchase agreements and money market funds. |
| Fixed Income | Prudential Government Income Fund(2) | The investment objective of the Fund is to seek high current return. The Fund invests, under normal circumstances, at least 80% of its investable assets (net assets plus borrowings for investment purposes, if any) in US Government securities, including US Treasury bills, notes, bonds, strips and other debt securities issued by the US Treasury, and obligations, including mortgage-related securities, issued or guaranteed by US Government agencies or instrumentalities. Some (but not all) of the US Government securities and mortgage-related securities in which the Fund will invest are backed by the full faith and credit of the US Government, which means that payment of interest and principal is guaranteed, but yield and market value are not. Most, if not all, of the Fund's debt securities are “investment-grade.” This means major rating services, like Standard & Poor's Ratings Services (S&P) or Moody's Investors Service, Inc. (Moody's), have rated the securities within one of their four highest quality grades. Debt obligations in the fourth highest grade are regarded as investment-grade, but have speculative characteristics and are riskier than higher rated securities. |
| 16 | Prudential Income Builder Fund |
| Underlying Funds | ||
| Market Segment/ Strategy | Name of Underlying Fund | Investment Objective and Investment Strategies of Underlying Fund |
| Fixed Income | Prudential Total Return Bond Fund(2) | The investment objective of the Fund is total return. The Fund will seek to achieve its objective through a mix of current income and capital appreciation as determined by the Fund's investment subadviser. The Fund invests, under normal circumstances, at least 80% of the Fund's investable assets (net assets plus borrowings for investment purposes, if any) in bonds. For purposes of this policy, bonds include all fixed-income securities, other than preferred stock, with a maturity at date of issue of greater than one year. The Fund's investment subadviser allocates assets among different debt securities, including (but not limited to) US Government securities, mortgage-related and asset-backed securities, corporate debt securities and foreign securities. The Fund may invest up to 30% of its investable assets in high risk, below investment-grade securities having a rating of not lower than CCC. These securities are also known as high-yield debt securities or junk bonds. The Fund may invest up to 30% of its investable assets in foreign debt securities. Some (but not all) of the US Government securities and mortgage-related securities in which the Fund will invest are backed by the full faith and credit of the US Government, which means that payment of interest and principal is guaranteed, but yield and market value are not. |
| Fixed Income | Prudential Global Total Return Fund, Inc.(2) | The Fund's investment objective is to seek total return, made up of current income and capital appreciation. The Fund seeks investments that will increase in value, as well as pay the Fund interest and other income. The Fund may invest in countries anywhere in the world, and normally invests at least 65% of its total assets in income-producing debt securities of US and foreign corporations and governments, supranational organizations, semi-governmental entities or government agencies, authorities or instrumentalities, investment-grade US or foreign mortgages and mortgage-related securities and US or foreign short-term and long-term bank debt securities or bank deposits. The Fund invests in securities of emerging market countries. The Fund may invest in debt securities that are denominated in US dollars or foreign currencies. The Fund invests up to 50% of its total assets in lower-rated securities, also known as “junk” bonds. |
(1) The Fund is solely subadvised by Jennison.
(2) The Fund is solely subadvised by PFI.
(3) Neither PowerShares nor the PowerShares Funds makes any representation regarding the advisability of investing in the Fund.
(4) Neither SSgA nor the SPDRs Funds makes any representation regarding the advisability of investing in the Fund.
The Fund purchases Class Q shares
of the Underlying Prudential Funds. If an Underlying Prudential Fund does not offer Class Q shares, then the Fund will invest in Class Z shares of the Underlying Prudential Fund. Class Q and Class Z shares are sold
without a sales load or distribution fee to a limited group of investors and have lower operating expenses than other classes of shares.
Consistent with the Fund’s
investment objective and policies, from time to time the Manager and QMA may add other Underlying Prudential Funds and/or ETFs to, or remove current Underlying Prudential Funds and/or ETFs from, the list of Underlying
Prudential Funds and/or ETFs in which the Fund may invest, subject to Board approval.
For more information, see Investment Risks and Considerations in the SAI, which contains additional information about the Fund. To obtain a copy, see the back cover of this prospectus.
OTHER INVESTMENTS AND
STRATEGIES
Derivative Strategies
We may use various derivative
strategies to try to improve the Fund’s returns. We may also use hedging techniques to try to protect the Fund’s assets. We cannot guarantee that these strategies and techniques will work, that the
instruments necessary to implement these strategies and techniques will be available, or that the Fund will not lose money. The use of derivatives—such as futures, options, foreign currency forward contracts,
and various types of swaps—involves costs and can be volatile. With derivatives, we try to predict if the underlying investment—a security, market index, currency, interest rate or some other
benchmark—will go up or down at some future date. We may use derivatives to try to reduce risk or to increase return consistent with the Fund’s overall investment objectives. We will consider other factors
(such as cost) in deciding whether to employ any particular strategy or technique, or
| Visit our website at www.prudentialfunds.com | 17 |
use any particular instrument. Any derivatives we
may use may not match or offset the Fund’s underlying positions and this could result in losses to the Fund that would not otherwise have occurred. Derivatives that involve leverage could magnify losses. When
the Fund uses derivative strategies, the Fund designates certain assets as segregated or otherwise covers its exposure, as required by the rules of the Securities and Exchange Commission.
Futures Contracts and Related
Options. The Fund may purchase and sell financial futures contracts and related options on financial futures. A futures contract is an agreement to buy or sell a set quantity of an underlying asset
at a future date, or to make or receive a cash payment based on the value of a securities index, or some other asset, at a stipulated future date. The terms of futures contracts are standardized. In the case of a
financial futures contract based upon a broad index, there is no delivery of the securities comprising the underlying index, margin is uniform, a clearing corporation or an exchange is the counterparty and the Fund
makes daily margin payments based on price movements in the index. An option gives the purchaser the right to buy or sell securities or currencies, or in the case of an option on a futures contract or an option on a
swap, the right to buy or sell a futures contract or swap, respectively, in exchange for a premium.
Foreign Currency Forward
Contracts. The Fund may enter into foreign currency forward contracts to protect the value of its assets against future changes in the level of foreign exchange rates. A foreign currency forward
contract is an obligation to buy or sell a given currency on a future date and at a set price or to make or receive a cash payment based on the value of a given currency at a future date. Delivery of the underlying
currency is expected, the terms are individually negotiated, the counterparty is not a clearing corporation or an exchange, and payment on the contract is made upon delivery, rather than daily.
Swap Transactions. The Fund may enter into swap transactions. Swap agreements are two-party contracts entered into primarily by institutional investors for periods typically ranging from a few weeks to more
than one year. In a standard “swap” transaction, two parties agree to exchange the returns (or differentials in rates of return) earned or realized on particular predetermined investments or instruments,
which may be adjusted for an interest factor. There are various types of swaps in which the Fund may invest, including but not limited to equity swaps, total return swaps, index swaps, credit default swaps and
interest rate swaps.
Swap Options. The Fund may enter into swap options. A swap option is a contract that gives a counterparty the right (but not the obligation) to enter into a new swap agreement or to shorten, extend,
cancel or otherwise modify an existing swap agreement, at some designated future time on specified terms.
Options on Securities and
Financial Indexes. The Fund may purchase and sell put and call options on securities and financial indexes traded on U.S. or foreign securities exchanges, on the NASDAQ Stock Market or in the over-the-counter
market. An option gives the purchaser the right to buy or sell securities in exchange for a premium. The Fund will sell only covered options.
Preferred Securities
Preferred securities, like common
stock or other equity securities, represents an equity ownership in an issuer. Generally, preferred securities have a priority of claim over common stock or other equity securities in dividend payments and upon
liquidation of the issuer. Unlike common stock or other equity securities, preferred securities do not usually have voting rights. Although they are equity securities, preferred securities have characteristics of both
debt and common stock or other equity securities. Like debt, their promised income is contractually fixed. Like common stock or other equity securities, they do not have rights to participate in bankruptcy proceedings
or collection activities in the event of missed payments.
Convertible Securities
The Fund may invest in convertible securities, which include convertible preferred stocks, nonconvertible preferred stocks, and debt securities of a corporation that may be converted into underlying shares
of common stock either because they have warrants attached or otherwise permit the holder to buy common stock of the corporation at a set
| 18 | Prudential Income Builder Fund |
price. Convertible securities provide an income
stream (usually lower than non-convertible bonds) and give investors opportunities to participate in the capital appreciation of the underlying common stock. Convertible securities typically offer greater potential
for appreciation than nonconvertible debt securities.
Short Sales
The Fund may make short sales of a security. This means that the Fund may sell a security that it does not own, which it may do, for example, when the investment subadviser thinks the value of the
security will decline. The Fund generally borrows the security to deliver to the buyers in a short sale. The Fund must then replace the borrowed security by purchasing it at the market price at the time of
replacement. Short sales involve costs and risks, including potentially unlimited losses. The Fund must pay the lender any dividends or interest that accrues on the security it borrows, and the Fund will lose money if
the price of the security increases between the time of the short sale and the date when the Fund replaces the borrowed security. The Fund may make short sales “against the box.” In a short sale against the box, at the time of sale, the Fund owns or has the right to acquire the identical security at no additional cost
through conversion or exchange of other securities it owns. When selling short against the box, the Fund gives up the opportunity for capital appreciation in the security.
In addition to the above principal
investment strategies, the Fund also may use the following non-principal investment strategies to try to increase its returns or protect its assets if market conditions warrant.
Forward Commitments
The Fund may purchase or sell
securities through a forward commitment. These transactions involve the purchase or sale of securities by the Fund at an established price with payment and delivery taking place in the future. The Fund enters into
these transactions to obtain what is considered an advantageous price to the Fund at the time of entering into the transaction. When the Fund purchases securities in these transactions, the Fund segregates liquid
securities in an amount equal to the amount of its purchase commitments.
There can be no assurance that a
security purchased or sold through a forward commitment will be delivered. If the dealer through which the trade is made fails to consummate the transaction, the Fund may lose an advantageous yield or price.
Securities purchased on a forward commitment basis also involve a risk that the value of the security to be purchased may decline prior to the settlement date. The Fund does not accrue income prior to delivery of the
securities in the case of forward commitment purchases.
Credit-Linked Securities
The Fund may invest in
credit-linked securities. Credit-linked securities are securities that are collateralized by one or more credit default swaps on corporate debt securities, such as bonds. The Fund has the right to receive periodic
interest payments from the issuer of the credit-linked security at an agreed-upon interest rate, and a return of principal at the maturity date. The source of payment for credit-linked securities is the interest on
the notes.
Loan Participations and
Assignments
The Fund may invest in fixed and
floating rate loans (secured or unsecured) arranged through private negotiations between a company as the borrower and one or more financial institutions as lenders. These types of investments can be in the form of
loan participations or assignments.
Loan participations and
assignments are nonconvertible corporate debt instruments of varying maturities. With participations, the Fund has the right to receive payments of principal, interest and fees from the lender conditioned upon the
lender's receipt of payment from the borrower. In participations, the Fund generally does not have direct rights against the borrower on the loan, which means that if the borrower does not pay back the loan or
otherwise comply with the loan agreement, the Fund will not have the right to make it do so. With assignments, the Fund has direct rights against the borrower on the loan, but its rights may be more limited than the
original lender's.
| Visit our website at www.prudentialfunds.com | 19 |
Mortgage-Related Securities
We may invest in mortgage-related
securities issued or guaranteed by US governmental entities. These securities are usually pass-through instruments that pay investors a share of all interest and principal payments from an underlying pool of fixed or
adjustable rate mortgages.
Mortgage-related securities
include collateralized mortgage obligations, multi-class pass-through securities and stripped mortgage-backed securities. A collateralized mortgage obligation (CMO) is a security backed by an underlying portfolio of
mortgages or mortgage-backed securities that may be issued or guaranteed by US governmental entities. A multi-class pass-through security is an equity interest in a trust composed of underlying mortgage assets.
Payments of principal and interest on the mortgage assets and any reinvestment income therefrom provide the funds to pay debt service on the CMO or to make scheduled distributions on the multi-class pass-through
security. The Fund also may invest in stripped mortgage-backed securities (MBS strips). MBS strips take the pieces of a debt security (principal and interest) and break them apart. The resulting securities may be sold
separately and may perform differently.
Asset-Backed Securities
The Fund may invest in asset-backed
securities. An asset-backed security is a type of pass-through instrument that pays interest based upon the cash flow of an underlying pool of assets, such as mortgages, automobile loans or credit card receivables.
Asset-backed securities may also be collateralized by a portfolio of corporate bonds, including junk bonds, or other corporate and municipal securities.
Municipal Asset-Backed Securities
The Fund may invest in municipal
asset-backed securities. A municipal asset-backed security is a type of pass-through instrument structured as a loan or note that pays interest that is eligible for exclusion from federal and state income taxation
based upon the income from a collateralized underlying municipal bond or pool of municipal bonds.
Municipal Lease Obligations
The Fund may invest in municipal
lease obligations. Municipal lease obligations are obligations where the interest and principal are paid out of lease payments made by the party leasing the equipment or facilities that were acquired or built with the
bonds. Typically, municipal lease obligations are issued by states or financing authorities to provide money for construction projects such as schools, offices or stadiums. The entity that leases the building or
facility would be responsible for paying the interest and principal on the obligation.
Repurchase Agreements
The Fund may use repurchase
agreements, where a party agrees to sell a security to the Fund and then repurchases it at an agreed-upon price at a stated time. This creates a fixed return for the Fund, and is, in effect, a loan by the Fund.
Repurchase agreements are used for cash management purposes only.
Reverse Repurchase Agreements and
Dollar Rolls
The Fund may enter into reverse
repurchase agreements, which involve the sale of a portfolio security by the Fund coupled with an agreement to repurchase the security, as well as dollar rolls in which the Fund sells securities for delivery in the
current month and simultaneously agrees to repurchase a substantially similar security at a future date. Either strategy involves leverage and may magnify underlying investment gains or losses.
US Government Securities
The Fund may invest in securities
issued or guaranteed by the US Government or by an agency or instrumentality of the US Government. Some US Government securities are backed by the full faith and credit of the United States, which means that payment
of principal and interest is guaranteed but market value is not. Some are supported only by the credit of the issuing agency or instrumentality and depend entirely on the agency or instrumentality's own resources to
repay their debt and are subject to the risk of default like private issuers.
| 20 | Prudential Income Builder Fund |
When-Issued and Delayed-Delivery
Securities
The Fund may
purchase securities, including money market obligations, bonds or other obligations, on a when-issued, delayed-delivery or forward commitment basis. When the Fund makes this type of purchase, the price and interest
rate are fixed at the time of purchase, but delivery and payment for the obligations take place at a later time. The Fund does not earn interest income until the date the obligations are expected to be delivered.
These types of investments potentially leverage the Fund, which could magnify losses. The Fund will segregate liquid assets, marked-to-market daily, with a value equal to any such investments. Segregating assets may
cause the Fund to forgo making other potentially favorable investments.
Temporary Defensive Investments
In response to adverse market,
economic or political conditions, the Fund may take a temporary defensive position and invest up to 100% of its assets in money market instruments, including short-term obligations of, or securities guaranteed by, the
US Government, its agencies or instrumentalities or in high-quality obligations of domestic or foreign banks and corporations, and may hold up to 100% of its assets in cash or cash equivalents. Investing heavily in
these securities is inconsistent with and limits the Fund’s ability to achieve its investment objectives, but may help to preserve the Fund's assets.
Investments in Affiliated Funds
The Fund may also
invest its assets in affiliated money market funds or open-end short-term bond funds. The affiliated funds are registered investment companies under the Investment Company Act of 1940 (the 1940 Act). The Fund can
invest its free cash balances in the affiliated funds to obtain income on short-term cash balances while awaiting attractive investment opportunities, to provide liquidity in preparation for anticipated redemptions or
for defensive purposes. Such an investment could also allow the Fund to obtain the benefits of a more diversified portfolio available in the affiliated funds than might otherwise be available through direct
investments in those asset classes, and will subject the Fund to the risks associated with the particular asset class. As a shareholder in the affiliated funds, the Fund will pay its proportional share of the expenses
of the affiliated funds, but the affiliated funds do not pay a management fee to the investment manager, since the investment manager only receives reimbursement for its expenses. Thus, shareholders of the Fund are
not paying management fees for the Fund and the affiliated funds. The investment results of the portions of the Fund’s assets invested in the affiliated funds will be based on the investment results of the
affiliated funds.
Additional Strategies
The Fund follows certain policies
when it borrows money (the Fund can borrow up to 33 1⁄3% of the value of its total assets); purchases shares of other investment companies; lends its securities to others (the Fund can lend up to 33 1⁄3% of the value of its total assets); and holds illiquid securities (the Fund may hold up to 15% of its net assets (assets less liabilities) in illiquid securities, including securities with legal or contractual restrictions
on resale, those without a readily available market and repurchase agreements with maturities longer than seven days). The Fund is subject to certain other investment restrictions that are fundamental policies, which
means they cannot be changed without shareholder approval. For more information about these restrictions, see the SAI.
Portfolio Turnover
As a result of the investment
policies described above, the Fund may engage in a substantial number of portfolio transactions. The portfolio turnover rate is generally the percentage computed by dividing the lesser of portfolio purchases or sales
(excluding all securities, including options, whose maturity or expiration date at acquisition was one year or less) by the monthly average value of the portfolio. High portfolio turnover (100% or more) usually
involves correspondingly greater brokerage commissions and other transaction costs, which are borne directly by the Fund. In addition, high portfolio turnover may also mean that a proportionately greater amount of
distributions to shareholders will be taxed as ordinary income rather than long-term capital gains compared to investment companies with lower portfolio turnover. The portfolio turnover rates for the Fund are shown in
the table below.
| Portfolio Turnover Rate* | |
| 2014 | 140%** |
| 2014 | 478%*** |
| Visit our website at www.prudentialfunds.com | 21 |
| Portfolio Turnover Rate* | |
| 2013 | 210%*** |
*The Portfolio Turnover
relates to the prior strategy. The Portfolio Turnover for the new strategy is not expected to exceed 100%.
**During
2014, the Fund changed its fiscal year-end from July 31 to October 31. The figure shown is for the fiscal period from August 1, 2014 through October 31, 2014.
***The figures shown are for the fiscal
years ended July 31, 2014 and 2013.
INVESTMENT RISKS
All investments involve risk, and
investing in the Fund is no exception. Since the Fund’s holdings can vary significantly from broad-based securities market indexes, performance of the Fund can deviate from performance of the indexes. The charts
below outline the key risks and potential rewards of the Fund’s principal strategies and certain other non-principal strategies that the Fund and the Underlying Prudential Funds may use. Following the charts is
a table which sets forth the investment limits applicable to each of the types of investments discussed in the charts. Unless otherwise noted, a percentage stated as a limit on the Fund’s ability to engage in a
particular type of investment is a percentage of investable assets. For more information, see the SAI.
Principal Investment Strategies
| Common Stocks and Other Equity-Related Securities | |
| Risks | Potential Rewards |
| ■ Individual stocks could lose value.■ Equity markets could go down, resulting in a decline in value of the Fund's investments. ■ Investment style risk—the risk that returns from the types of stocks in which the Fund invests will trail returns from the overall stock market. ■ Companies that normally pay dividends may not do so if they don't have profits or adequate cash flow or to conserve cash. ■ Changes in economic or political conditions, both domestic and international, may result in a decline in value of the Fund's investments. | ■ Historically, stocks have outperformed other investments over the long term.■ Generally, economic growth leads to higher corporate profits, which in turn can lead to an increase in stock prices, known as capital appreciation. ■ May be a source of dividend income. |
| Fixed-Income Obligations | |
| Risks | Potential Rewards |
| ■ The Fund's holdings, share price, yield and total return may fluctuate in response to bond market movements.■ Credit risk—the risk that the default of an issuer will leave the Fund with unpaid interest or principal. The lower an instrument's quality, the higher its potential volatility. ■ Market risk—the risk that the market value of an investment may decline, sometimes rapidly or unpredictably. Market risk may affect an industry, a sector, or the market as a whole. ■ Interest rate risk—the risk that the value of most bonds will fall when interest rates rise: the longer a bond's maturity, the more its value typically falls. The Fund may be subject to a greater risk of rising interest rates due to the current period of historically low rates. The Fund may lose money if short-term or long-term interest rates rise sharply or in a manner not anticipated by the subadviser. Interest rate risk can lead to price volatility.■ Prepayment risk—During periods of declining interest rates, the issuer of an instrument may exercise its option to prepay principal earlier than scheduled, forcing the Fund to reinvest the proceeds from such prepayment in lower yielding instruments, which may result in a | ■ Bonds have generally outperformed money market instruments over the long term with less risk than stocks.■ Most bonds will rise in value when interest rates fall. ■ May provide a source of regular interest income. ■ Generally more secure than stocks since companies must pay their debts before paying stockholders. ■ Investment-grade obligations have a lower risk of default. ■ Bonds with longer maturity dates typically have higher yields. ■ Intermediate-term securities may be less susceptible to loss of principal than longer-term securities. |
| 22 | Prudential Income Builder Fund |
| Fixed-Income Obligations | |
| Risks | Potential Rewards |
| decline in the Fund's income and distributions to shareholders. ■ Reinvestment risk—the risk that income from the Fund's portfolio will decline if and when the Fund invests the proceeds from matured, traded or called fixed income instruments at market interest rates that are below the portfolio's current earnings rate. A decline in income could affect the Fund's NAV or its overall return.■ Spread risk—Wider credit spreads and decreasing market values typically represent a deterioration of the fixed income instrument's credit soundness and a perceived greater likelihood or risk of default by the issuer. Fixed income instruments generally compensate for greater credit risk by paying interest at a higher rate. As the spread on a security widens (or increases), the price (or value) of the security generally falls.■ Not all US Government securities are insured or guaranteed by the full faith and credit of the US Government—some are backed only by the issuing agency, which must rely on its own resources to repay the debt. | |
| Foreign Securities | |
| Risks | Potential Rewards |
| ■ Foreign markets, economies and political systems, particularly those in developing countries, may not be as stable as those in the US.■ Currency risk—the risk that adverse changes in the values of foreign currencies can cause losses (non-US dollar denominated securities). ■ May be less liquid than US stocks and bonds. ■ Differences in foreign laws, accounting standards, public information, custody and settlement practices may result in less reliable information on foreign investments and involve more risks. ■ Investments in emerging market securities are subject to greater volatility and price declines. | ■ Investors may participate in the growth of foreign markets through the Fund's investments in companies operating in those markets.■ The Fund may profit from a favorable change in the value of foreign currencies (non-US dollar denominated securities). |
| Initial Public Offerings | |
| Risks | Potential Rewards |
| ■ Prices of securities sold in IPOs may be highly volatile or decline shortly after the IPO is completed.■ Depending on the Fund size, investments in IPOs may have a dramatic effect on the Fund’s performance. ■ As the Fund grows in size, the impact of IPOs on performance will decline. ■ Availability of shares in an IPO may be limited and the Fund may not be able to buy shares at all, or as many shares as it would like. ■ Securities issued in IPOs are subject to many of the same risks as investments in small capitalization issuers, such as: a smaller range of products and services than larger companies, limited financial results, and a lack of management depth. | ■ Investments in IPOs have the potential to produce substantial gains. |
| Visit our website at www.prudentialfunds.com | 23 |
| Real Estate Securities including REITs | |
| Risks | Potential Rewards |
| ■ Performance and values depend on the value of the underlying properties or the underlying loans or interests, the strength of real estate markets, REIT management and property management, each of which can be affected by many factors, including national and regional economic conditions. ■ Securities of individual REITs could lose value. ■ Changes in economic or political conditions, both domestic and international, may result in a decline in value of REIT investments. ■ REITs may charge management fees which may result in layering the management fees paid by the Fund. ■ Real estate companies, including REITs, may be leveraged, which increases risk. | ■ Real estate holdings can generate good returns from rents, rising market values, etc.■ Greater diversification than direct ownership of real estate. ■ Potential for dividend income. |
| MLP Investments | |
| Risks | Potential Rewards |
| ■ Liquidity risk: MLPs may experience limited trading volumes and display abrupt or erratic price movements. The subadviser may find it difficult to sell MLPs at a fair price at times when the subadviser believes it is desirable to do so.■ Changes in the regulatory environment may adversely affect the Fund's investments in MLPs. ■ Investments in MLPs include risks related to limited control and limited rights to vote on matters affecting the MLP, risks related to potential conflicts of interest between the MLP and the MLP’s general partner, cash flow risks, dilution risks and risks related to the general partner’s right to require unit holders to sell their common units at an undesirable time or price.■ Tax risk: A change in current tax law or change in the underlying business mix of an MLP could result in the MLP being treated as a corporation for tax purposes, which could adversely affect the value of the Fund.■ Industry risk: Investments in MLPs are subject to the risks associated with the specific industries in which the MLPs invest. | ■ Potential for both current income and capital appreciation. |
| High Yield Debt Securities (Junk Bonds) | |
| Risks | Potential Rewards |
| ■ Credit risk (particularly high)—the risk that the borrower can’t pay back the money borrowed or make interest payments. The lower a bond’s quality, the higher its potential volatility.■ Market risk (particularly high)—the risk that bonds will lose value in the market, sometimes rapidly or unpredictably, because interest rates rise or there is a lack of confidence in the borrower or the bond's insurer. ■ Illiquidity risk—the risk that bonds may be difficult to value precisely and to sell at the time or price desired. ■ Are generally less secure than higher quality debt securities. ■ Interest rate risk—the risk that the value of most bonds will fall when interest rates rise. The longer a bond’s maturity, the more its value typically falls. The Fund | ■ May offer higher interest income and higher potential gains than higher grade debt securities.■ Most bonds rise in value when interest rates fall. |
| 24 | Prudential Income Builder Fund |
| High Yield Debt Securities (Junk Bonds) | |
| Risks | Potential Rewards |
| may be subject to a greater risk of rising interest rates due to the current period of historically low rates. The Fund may lose money if short-term or long-term interest rates rise sharply in a manner not anticipated by the subadviser. Price volatility may result. | |
| Exchange-Traded Funds (ETFs) | |
| Risks | Potential Rewards |
| ■ Shares of ETFs are traded on an exchange throughout a trading day, and bought and sold based on market values and not at the net asset value of the ETF. For this reason, shares of an ETF could trade at either a premium or discount to its net asset value. However, the trading prices of index-based ETFs tend to closely track the actual net asset value of the ETF.■ Duplicate management fees. ■ An ETF may use a passive investment strategy by attempting to track the performance of an unmanaged index of securities. The Fund may have exposure to the constituent securities of an ETF’s underlying index regardless of the current or projected performance of a specific security or a particular industry/market sector. Maintaining investments in securities regardless of market conditions could cause the ETF’s (and thus the Fund’s) returns to be lower than if the Fund invested in an ETF that employed an active strategy.■ Passive ETFs generally seek to track performance of an index as closely as possible. However, the returns may not match or achieve a high degree of correlation with the returns of the index that it tracks due to operating expenses, transaction costs, cash flows, regulatory requirements and operational inefficiencies. | ■ Helps to manage cash flows.■ Ability to get rapid exposure to an index. ■ Provides opportunity to buy or sell an entire portfolio of securities in a single transaction in a manner similar to buying or selling a share of stock. ■ The unsystematic risk (risk associated with certain issues rather than the financial markets generally) associated with investments in ETFs is generally low relative to investments in securities of individual issuers. |
| Equity & Equity-Related Securities of Emerging Markets | |
| Risks | Potential Rewards |
| ■ Emerging markets, economies and political systems may not be as stable as those in the US. ■ Currency risk—changing value of foreign currencies can cause losses (non-US dollar denominated securities). ■ May be less liquid than US equity securities and securities in more developed markets. ■ Differences in foreign laws, accounting standards, public information, custody and settlement practices may result in less reliable information on foreign investments and involve more risks. | ■ Investors may participate in the growth of emerging markets through the Fund's investments in companies operating in those markets.■ Profit from changing value of foreign currencies (non-US dollar denominated securities). |
Non-Principal Investment
Strategies
| Derivatives | |
| Risks | Potential Rewards |
| ■ The value of derivatives (such as forwards, futures, swaps and options) that are used to hedge a portfolio security is generally determined independently from the value of that security and could result in a loss to the Fund if the price movement of the derivative does not | ■ Derivatives could make money and protect against losses if the investment analysis proves correct.■ Derivatives used for return enhancement purposes involve a type of leverage and could generate substantial gains at low cost. |
| Visit our website at www.prudentialfunds.com | 25 |
| Derivatives | |
| Risks | Potential Rewards |
| correlate with a change in the value of the portfolio security. ■ Derivatives may not have the intended effects and may result in losses or missed opportunities. ■ The counterparty to a derivatives contract could default. ■ Derivatives can increase share price volatility and those that involve leverage could magnify losses. ■ Certain types of derivatives involve costs to the Fund that can reduce returns. ■ Derivatives may be difficult to value precisely or sell at the time or price desired. ■ Recent legislation calls for new regulation of the derivatives markets. The extent and impact of the regulations are not yet fully known and may not be for some time. New regulation of derivatives may make them more costly, may limit their availability, or may otherwise adversely affect their value or performance. | ■ One way to manage the Fund's risk/return balance is by locking in the value of an investment ahead of time.■ Hedges that correlate well with an underlying position can reduce or eliminate the volatility of investment income or capital gains at low cost. |
| Mortgage-Related Securities | |
| Risks | Potential Rewards |
| ■ Prepayment risk—the risk that the underlying mortgages may be prepaid, partially or completely, generally during periods of falling interest rates, which could adversely affect yield to maturity and could require the Fund to reinvest in lower yielding securities. ■ Extension risk—the risk that rising interest rates may cause the underlying mortgages to be paid off more slowly by the borrower, causing the value of the securities to fall. ■ Credit risk—the risk that the underlying mortgages will not be paid by debtors or by credit insurers or guarantors of such instruments. Some private mortgage securities are unsecured or secured by lower-rated insurers or guarantors and thus may involve greater risk. ■ Market risk—the risk that bonds will lose value in the market, sometimes rapidly or unpredictably, because interest rates rise or there is a lack of confidence in the borrower or the bond's insurer. Market risk may affect an industry, a sector or the market as a whole. ■ Interest rate risk—the risk that the value of most bonds will fall when interest rates rise. The longer a bond's maturity, the more its value typically falls. The Fund may be subject to a greater risk of rising interest rates due to the current period of historically low rates. The Fund may lose money if short-term or long-term interest rates rise sharply in a manner not anticipated by the subadviser. Price volatility may result. ■ Illiquidity risk—the risk that securities may be difficult to value precisely and to sell at the time or price desired. | ■ A source of regular interest income.■ The US Government guarantees interest and principal payments on certain securities. ■ May benefit from security interest in real estate collateral. ■ Pass-through instruments provide greater diversification than direct ownership of loans. |
| Asset-Backed Securities | |
| Risks: | Potential Rewards: |
| ■ Credit risk—the risk that the underlying receivables will not be paid by debtors or by credit insurers or guarantors of such instruments. Some asset-backed | ■ A potential source of regular interest income.■ Prepayment risk is generally lower than with mortgage related securities. |
| 26 | Prudential Income Builder Fund |
| Asset-Backed Securities | |
| Risks: | Potential Rewards: |
| securities are unsecured or secured by lower-rated insurers or guarantors and thus may involve greater risk. ■ Prepayment risk—the risk that the underlying debt instruments may be prepaid, partially or completely, generally during periods of falling interest rates, which could adversely affect yield to maturity and could require the Fund to reinvest in lower yielding debt instruments. ■ Extension risk—the risk that rising interest rates may cause the underlying debt instruments to be paid off more slowly by the debtor, causing the value of the securities to fall. ■ Market risk—the risk that bonds will lose value in the market, sometimes rapidly or unpredictably, because interest rates rise or there is a lack of confidence in the borrower or the bond’s insurer. Market risk may affect an industry, a sector or the market as a whole. ■ Interest rate risk—the risk that the value of most bonds will fall when interest rates rise. The longer a bond's maturity, the more its value typically falls. The Fund may be subject to a greater risk of rising interest rates due to the current period of historically low rates. The Fund may lose money if short-term or long-term interest rates rise sharply in a manner not anticipated by the subadviser. Price volatility may result. ■ Illiquidity risk—the risk that securities may be difficult to value precisely and to sell at the time or price desired. | ■ Pass-through instruments may provide greater diversification than direct ownership of loans.■ May offer higher yields due to their structure than other instruments. |
| Illiquid Securities | |
| Risks | Potential Rewards |
| ■ May be difficult to value precisely.■ May be difficult to sell at the time or price desired. | ■ May offer a more attractive yield or potential for growth than more widely traded securities. |
| When-Issued and Delayed Delivery Securities | |
| Risks | Potential Rewards |
| ■ Value of securities may decrease before delivery occurs.■ Counterparty may become insolvent prior to delivery. ■ If the security is not issued, or the counterparty fails to meet its obligation, the Fund loses the investment opportunity for the assets it has set aside to pay for the security and any gain in the security's price. | ■ May enhance investment gains. |
| Short Sales, including Short Sales Against the Box | |
| Risks | Potential Rewards |
| ■ May magnify underlying investment losses.■ Share price volatility can magnify losses because the underlying security must be replaced at a specific time. ■ Investment costs may exceed potential underlying investment gains. ■ Short sales pose the risk of potentially unlimited loss. ■ Short sales “against the box” give up the opportunity for capital appreciation in the security. ■ Regardless of the length of time that a short sale is open before being closed, any realized gain or loss will be short-term capital gain or loss for federal income tax purposes. | ■ May magnify underlying investment gains. |
| Visit our website at www.prudentialfunds.com | 27 |
| Repurchase Agreements | |
| Risks | Potential Rewards |
| ■ The counterparty to the repurchase agreement may fail to repurchase the securities in a timely manner or at all. | ■ Creates a fixed rate of return for the Fund. |
| Reverse Repurchase Agreements and Dollar Rolls | |
| Risks | Potential Rewards |
| ■ Risk that the counterparty may fail to return securities in a timely manner or at all.■ May magnify underlying investment losses. ■ Investment costs may exceed potential underlying investment gains. ■ Leverage risk—the risk that the market value of the securities purchased with proceeds of the sale declines below the price of the securities the Fund must repurchase. | ■ May magnify underlying investment gains. |
| Forward Commitments | |
| Risks | Potential Rewards |
| ■ The counterparty to the forward commitment may fail to make payment or delivery in a timely manner or at all.■ The value of the security to be purchased may decline prior to the settlement date. | ■ Creates a fixed rate of return for the Fund. |
| US Government and Agency Securities | |
| Risks | Potential Rewards |
| ■ Not all US Government securities are insured or guaranteed by the US Government. Some are only insured or guaranteed by the issuing agency, which must rely on its own resources to repay the debt. ■ Limits potential for capital appreciation. ■ Credit risk—the risk that the borrower can't pay back the money borrowed or make interest payments (relatively low for US Government securities). ■ Market risk—the risk that the market value of an investment may move up or down, sometimes rapidly or unpredictably, because interest rates rise or there is a lack of confidence in the borrower. Market risk may affect an industry, a sector or the market as a whole.■ Interest rate risk—the risk that the value of most debt obligations will fall when interest rates rise. The longer a bond's maturity, the more its value typically falls. The Fund may be subject to a greater risk of rising interest rates due to the current period of historically low rates. The Fund may lose money if short-term or long-term interest rates rise sharply in a manner not anticipated by the subadviser. Price volatility may follow. ■ Inflation-indexed bonds, such as Treasury Inflation-Protected Securities (“TIPS”), may experience greater losses than other fixed income securities with similar durations. ■ Investments in inflation-indexed bonds are more likely to cause fluctuations in the Fund’s income distributions. | ■ May preserve the Fund's assets.■ May provide a source of regular interest income. ■ Generally more secure than lower quality debt securities and generally more secure than equity securities. ■ Principal and interest may be guaranteed by the US Government. ■ If interest rates decline, long-term yields should be higher than money market yields. ■ Bonds have generally outperformed money market instruments over the long term. ■ Most bonds rise in value when interest rates fall. |
| Principal & Non-Principal Strategies |
| ■ Equity and Equity-Related Securities: may range between 20% to 80% of total assets■ Fixed-Income Instruments: may range between 20% to 80% of total assets ■ MLPs: up to 25% of total assets |
| 28 | Prudential Income Builder Fund |
| Principal & Non-Principal Strategies |
| ■ Derivatives: up to 25% of total assets ■ Illiquid Securities: up to 15% of net assets ■ Money Market Instruments: Up to 100% of total assets on a temporary basis ■ Short Sales (excluding Short Sales “against the box”): Up to 25% of net assets ■ ETFs: Percentages vary |
| Visit our website at www.prudentialfunds.com | 29 |
HOW THE FUND IS MANAGED
BOARD OF TRUSTEES
The Fund is overseen by a Board of
Trustees (hereafter referred to as Trustees, or the Board). The Board oversees the actions of the Manager, investment subadvisers and distributor and decides on general policies. The Board also oversees the Fund's
officers, who conduct and supervise the daily business operations of the Fund.
MANAGER
Prudential Investments LLC (PI)
Gateway Center Three, 100 Mulberry Street
Newark, NJ 07102-4077
Gateway Center Three, 100 Mulberry Street
Newark, NJ 07102-4077
Under a
management agreement with the Fund, PI manages the Fund's investment operations and administers its business affairs and is responsible for supervising the Fund's investment subadviser. For the fiscal period ended
October 31, 2014, the Fund paid PI management fees at the effective rate of .70% of the Fund's average daily net assets for all share classes.
PI and its predecessors have
served as a manager or administrator to investment companies since 1987. As of November 30, 2014, PI, a wholly-owned subsidiary of Prudential, served as the investment manager to all of the Prudential US and offshore
open-end investment companies, and as the manager or administrator to closed-end investment companies, with aggregate assets of approximately $237.8 billion.
Subject to the supervision of the
Board, PI is responsible for conducting the initial review of prospective investment subadvisers for the Fund. In evaluating a prospective investment subadviser, PI considers many factors, including the firm's
experience, investment philosophy and historical performance. PI is also responsible for monitoring the performance of the Fund's investment subadvisers.
PI and the Fund
operate under an exemptive order (the Order) from the SEC that generally permits PI to enter into or amend agreements with unaffiliated investment subadvisers and certain subadvisers that are affiliates of PI without
obtaining shareholder approval. This authority is subject to certain conditions, including the requirement that the Board must approve any new or amended agreements with an investment subadviser. Shareholders of the
Fund still have the right to terminate these agreements at any time by a vote of the majority of the outstanding shares of the Fund. The Fund will notify shareholders of any new investment subadvisers engaged or
material amendments to subadvisory agreements made pursuant to the Order.
A discussion of the basis for the
Board's approvals of the management and subadvisory agreements is available in the Fund's Annual Report to shareholders dated July 31.
INVESTMENT SUBADVISERS
Quantitative
Management Associates LLC (QMA), Prudential Fixed Income (PFI), Jennison Associates LLC (Jennison), and Prudential Real Estate Investors, also known as PREI®, are the subadvisers for the Fund (each, a Subadviser and together, the Subadvisers). QMA provides asset allocation services to the Fund. The Subadvisers will handle the day-to-day
investment management for the portions of the Fund allocated to each of them by QMA.
Quantitative Management Associates
LLC (QMA), a registered investment adviser, is a wholly-owned subsidiary of Prudential Investment Management, Inc. QMA has used advanced analytics to enhance the investment decision-making process,
which combines a systematic application of financial theory and fundamental analysis with discipline and seasoned judgment. As of December 31, 2014, QMA managed approximately $XXX billion in assets worldwide across a
broad asset class spectrum ranging from global equity to multi-asset class solutions for institutional investors, such as pension funds, financial services companies, endowments, foundations, and sovereign wealth
funds. QMA's primary address is Gateway Center Two, 100 Mulberry Street, Newark, NJ 07102.
| 30 | Prudential Income Builder Fund |
Jennison Associates
LLC (Jennison) is the Fund's investment subadviser. Its address is 466 Lexington Avenue, New York, New York 10017. PI has responsibility for all investment advisory services, supervises Jennison and pays
Jennison for its services. As of October 31, 2014, Jennison managed in excess of $185 billion in assets. Jennison (including its predecessor, Jennison Associates Capital Corp.) is a registered investment adviser
founded in 1969.
Prudential Investment Management,
Inc. (PIM) is an indirect, wholly-owned subsidiary of Prudential Financial, Inc. (Prudential Financial) that was organized in 1984. Its address is Gateway Center Two, 100 Mulberry Street, Newark, New
Jersey 07102. As of September 30, 2014, PIM managed approximately $918 billion in assets.
Prudential Fixed Income is the primary public fixed income asset management unit of PIM, with $534 billion in assets under management as of September 30, 2014, and is the unit of PIM that provides investment
advisory services to the Fund.
Prudential Fixed Income is
organized into groups specializing in different sectors of the fixed income market: US and non-US government bonds, mortgages and asset-backed securities, US and non-US investment grade corporate bonds, high-yield
bonds, emerging markets bonds, municipal bonds, and money market securities.
Prudential Real
Estate Investors. PREI® is a business unit of Prudential Investment Management, Inc. (PIM), which in turn is an indirect wholly-owned subsidiary of Prudential Financial, Inc. PREI's
address is 7 Giralda Farms, Madison NJ 07940. PREI, comprised of fund management centers in the United States in Madison, NJ and Atlanta, GA, and globally in Munich, London, Singapore and Mexico City, is supported by
a network of local offices throughout the world. Its specialized operating units offer a broad range of real estate investment opportunities and investment management services in the United States, Europe, Asia and
Latin America. PREI managed $XXXX billion in gross real estate assets ($XXXX billion net) as of December 31, 2014.
PORTFOLIO MANAGERS
Ted Lockwood is a Managing Director for QMA and head of QMA’s asset allocation area. He is responsible for portfolio management, investment research, and new product development. QMA’s
asset allocation team focuses on tactical, strategic, and dynamic asset allocation across traditional and non-traditional asset classes, including real assets and alternatives. Mr. Lockwood’s experience also
includes managing tactical asset allocation overlays, dynamically managed volatility strategies, quantitative long-short equity portfolios, and synthetic convertible bonds. Earlier in his career, Mr. Lockwood was an AT&T Bell Laboratories Fellow and member of the technical staff at AT&T. Mr. Lockwood graduated summa cum laude with a BE in Engineering from Stony Brook University and earned an MS in Engineering and an MBA in Finance from Columbia University.
Edward L. Campbell, CFA, is a Principal and Portfolio Manager for QMA and a member of the asset allocation team. In addition to portfolio management, Mr. Campbell is a specialist in global macroeconomic and investment strategy research. He has also served as a Portfolio Manager with Prudential Investments (PI) and spent several years as a
Senior Analyst with PI’s Strategic Investment Research Group (SIRG). Prior to joining PI, Mr. Campbell was a Partner and Vice President at Trilogy Advisors LLC. He earned a BS in Economics and International Business from The City University of New York and an MBA in Finance, Global
Business, and Organizational Leadership from NYU's Stern School of Business. He also holds the Chartered Financial Analyst (CFA) designation.
Rory Cummings is a Portfolio Manager for QMA and a member of the Asset Allocation team. He also conducts macroeconomic, market valuation, and capital markets research. Mr. Cummings has worked in various roles within the Asset Allocation team and, prior to joining, served as a Client Relations Specialist covering a variety of institutional clients. He earned
a BA in Finance from Seton Hall University and a MBA in Financial Markets and Corporate Finance from New York University.
Ubong “Bobby”
Edemeka is a Managing Director & Income and Infrastructure Portfolio Manager/Research Analyst of Jennison, which he joined in March 2002. He is a portfolio manager of Jennison's income and
infrastructure strategies. Before joining Jennison, Mr. Edemeka was a sell-side research analyst on the US Power & Utilities team at Goldman Sachs, where he covered electric utilities and independent power
producers. Prior to Goldman Sachs, he
| Visit our website at www.prudentialfunds.com | 31 |
was an analyst on the global utilities team of SSB
Citi Asset Management Group, a division of Citigroup. Mr. Edemeka began his career as an analyst on the Prudential Utility Fund (now Prudential Jennison Utility Fund) at Prudential Investments in 1997 after completing
Prudential's investment management training program. Mr. Edemeka received his BA in government from Harvard University.
Shaun Hong,
CFA is a Managing Director & Income and Infrastructure Portfolio Manager of Jennison. Mr. Hong joined Jennison in September 2000. He is a portfolio manager of Jennison's income and
infrastructure strategies. Mr. Hong joined Prudential in 1999 as an analyst responsible for power, natural gas and telecommunications industries within Prudential's public equity unit. He began his career in 1992 as a
research analyst covering telecommunications and technology companies at Parker/Hunter Inc., a regional brokerage firm based in Pittsburgh. In 1994, Mr. Hong joined Equinox Capital Management, where he worked for five
years researching utility, consumer products, commodities and technology sectors. He received his BS in industrial management from Carnegie Mellon University. Mr. Hong is a member of the New York Society of Security
Analysts and CFA Institute.
Paul Appleby, CFA, is a Managing Director and co-Head of Prudential Fixed Income's Leveraged Finance Team, which includes the US and European High Yield Bond and Bank Loan sector teams. Previously, he was
Director of Credit Research and Chief Equity Strategist for Prudential Financial's proprietary portfolios. Mr. Appleby was also a high yield bond credit analyst and worked in Prudential Financial's private placement
group. Before joining Prudential Financial in 1987, he was a strategic planner for Amerada Hess. Mr. Appleby received a BS in Economics from The Wharton School of the University of Pennsylvania and an MBA from the
Sloan School at the Massachusetts Institute of Technology (MIT). He holds the Chartered Financial Analyst (CFA) designation.
Robert Cignarella, CFA, is Managing Director and co-Head of Prudential Fixed Income's Leveraged Finance Team, which includes the US and European High Yield Bond and Bank Loan sector teams. Previously, Mr.
Cignarella was a managing director and co-head of high yield and bank loans at Goldman Sachs Asset Management and also held positions as high yield portfolio manager and high yield and investment grade credit analyst.
Earlier, he was a financial analyst in the investment banking division of Salomon Brothers. Mr. Cignarella received an MBA from the University of Chicago, and a bachelor’s degree in operations research, and
industrial engineering from Cornell University. He holds the Chartered Financial Analyst (CFA) designation.
Brian Clapp, CFA, is Principal and high yield portfolio manager for Prudential Fixed Income's High Yield Team. Previously, Mr. Clapp was a senior high yield credit analyst on Prudential Fixed
Income’s Credit Research team. He joined Prudential Financial in 2006 from Muzinich & Co. While there, Mr. Clapp held several positions, including portfolio manager for a high yield bond based hedge fund,
hedge fund credit analyst, and credit analyst covering the chemical, industrial, and transportation sectors. Earlier at Triton Partners, an institutional high yield fund manager, Mr. Clapp was a credit analyst
covering the metals and mining, healthcare, homebuilding, building products and transportation sectors. He received a BS in Finance from Bryant College, and an MS in Computational Finance, and an MBA from Carnegie
Mellon. Mr. Clapp holds the Chartered Financial Analyst (CFA) designation.
Michael J. Collins, CFA, is Managing Director and Senior Investment Officer for Prudential Fixed Income. He is also senior portfolio manager for Core Plus, Absolute Return, and other multi-sector Fixed Income
strategies. Previously, Mr. Collins was a High Yield Portfolio Manager and Fixed Income Investment Strategist. He continues to work closely with the high yield team and other credit teams on portfolio strategy and
construction. Earlier he was a credit research analyst, covering investment grade and high yield corporate credits. Additionally, he developed proprietary quantitative international interest rate and currency
valuation models for our global bond unit. Mr. Collins began his career at Prudential Financial in 1986 as a software applications designer. He received a BS in Mathematics and Computer Science from the State
University of New York at Binghamton and an MBA in Finance from New York University. Mr. Collins holds the Chartered Financial Analyst (CFA) designation and is a Fellow of the Life Management Institute
(FLMI).
Terence Wheat, CFA, is Principal, global high yield portfolio manager and emerging markets corporate portfolio manager at Prudential Fixed Income. Previously, he was a high yield portfolio manager for
Prudential Fixed Income's High Yield Team for six years. Mr. Wheat also spent 12 years as a credit analyst in Prudential Fixed Income's Credit
| 32 | Prudential Income Builder Fund |
Research Group, where he was responsible for the
consumer products, gaming and leisure, retail, supermarkets, and textile/apparel industries. Mr. Wheat covered high yield bonds from 1998 to 2003, and investment grade issues from 1993 to 1998. Earlier, he worked for
Prudential's Financial Management Group. Mr. Wheat joined Prudential in 1988. He received a BS in Accounting and an MBA from Rider University. Mr. Wheat holds the Chartered Financial Analyst (CFA) designation.
Robert Spano, CFA, CPA, is Principal and high yield portfolio manager for Prudential Fixed Income's High Yield Team. Prior to assuming his current position in 2007, Mr. Spano was a high yield credit analyst
for 10 years in Prudential Fixed Income's Credit Research Group, covering the health, lodging, consumer, gaming, restaurants, and chemical industries. Earlier, he worked as an investment analyst in the Project Finance
Unit of Prudential Financial’s private placement group. Mr. Spano also held positions in the internal audit and risk management units of Prudential Securities. He received a BS in Accounting from the University
of Delaware and an MBA from New York University. Mr. Spano holds the Chartered Financial Analyst (CFA) and Certified Public Accountant (CPA) designations.
Ryan Kelly, CFA,
is a Principal and a high yield portfolio manager for Prudential Fixed Income's High Yield Team. Prior to his current position, Mr. Kelly was a senior high yield credit analyst in
Prudential Fixed Income's Credit Research Group, covering the automotive, energy, technology and finance sectors. Previously, Mr. Kelly was a senior high yield bond analyst at Muzinich & Company. Earlier, he was
an investment banker at PNC Capital Markets/PNC Bank where he worked in the high yield bond, mergers and acquisition (M&A) and loan syndication groups. Mr. Kelly began his career in investment banking at Chase
Manhattan Bank, working on project finance transactions and M&A advisory mandates for the electric power sector. He received a BA in Economics from Michigan State University and holds the Chartered Financial
Analyst (CFA) designation.
Daniel Thorogood, CFA, is Vice President for Prudential Fixed Income’s High Yield Team, responsible for portfolio strategy and managing high yield bond allocations in multi-sector portfolios. Prior to
joining the High Yield Team, Mr. Thorogood was a member of Prudential Fixed Income’s Quantitative Research and Risk Management Group. Mr. Thorogood was the head of a team of portfolio analysts who support the
firm's credit-related strategies, including investment grade corporate, high yield corporate, and emerging market debt sectors. The team was primarily responsible for performing detailed portfolio analysis relative to
benchmarks, monitoring portfolio risk exposures, and analyzing performance through proprietary return attribution models. Prior to joining the Quantitative Research and Risk Management Group in 1996, Mr. Thorogood was
Associate Manager in Prudential Fixed Income's Trade Support and Operations Unit. He received a BS in Finance from Florida State University and an MBA in Finance from Rutgers University. Mr. Thorogood holds the
Chartered Financial Analyst (CFA) designation.
David Bessey is a Managing Director and the Head of Prudential Fixed Income's Emerging Markets Debt Team, investing in emerging market debt denominated in both US dollars and local currencies. Mr.
Bessey is also senior portfolio manager the Emerging Markets Debt Long/Short Strategy. Mr. Bessey started Prudential's Emerging Market effort in 1995 with sovereign strategist Cathy Hepworth and has grown this
business to $30 billion (as of September 30, 2014). Prior to joining Prudential Financial in 1989, Mr. Bessey was a project manager on various engineering projects in the United States, Asia, and Latin America. Mr.
Bessey received a BS in Geological Engineering from Cornell University and an MBA in Finance from the Sloan School at the Massachusetts Institute of Technology (MIT).
Cathy L. Hepworth, CFA, is a Managing Director and an Emerging Market Sovereign Strategist/Portfolio Manager for Prudential Fixed Income's Emerging Markets Team. Ms. Hepworth co-founded the firm's emerging
markets debt management effort with David Bessey in 1995, together with the team growing the business to $30 billion (as of September 30, 2014). Previously, Ms. Hepworth was an analyst in the credit unit of Prudential
Financial’s Capital Management Group, focusing on various sovereign, financial and corporate sectors. Prior to joining Prudential Financial in 1989, she held analyst positions at Bankers Trust, Merrill Lynch,
and Golembe Associates. Ms. Hepworth received a BSFS from Georgetown University, School of Foreign Service. She holds the Chartered Financial Analyst (CFA) designation
| Visit our website at www.prudentialfunds.com | 33 |
Marc R. Halle is a Managing Director for Prudential Real Estate Investors where he is the Senior Portfolio Manager and Chief Investment Officer for all global real estate securities funds and
investments. Marc is also a member of the firm’s Global Investment Committee for all significant direct real estate investments.
Marc has extensive experience in
real estate capital markets, securities, development, acquisition and finance. Marc joined Prudential in 1999 to launch the real estate private equity group, an opportunistic investment strategy that arbitraged the
public and private real estate markets. Marc formed the global real estate securities team in 2006 and has led the group since its inception.
Marc joined Prudential from Alpine
Management & Research, where he was the COO of the firm and Portfolio Manager for real estate securities funds. Prior to forming Alpine, Marc was with Evergreen Asset Management, where he was jointly responsible
for research, investment analysis and portfolio recommendations for real estate securities. Previously, Marc was Senior Vice President and COO of W&M Properties (Empire State Realty Trust-NYSE: ESRT), a national
real estate investment firm. Prior to W&M, Marc was a VP with Greenthal Realty, a New York based real estate firm that owned and operated multi-family properties throughout the NYC metropolitan area.
In January 2011, Marc was featured
in both The Wall Street Journal and Smart Money Magazine and named as one of “America’s Best Mutual Fund Mangers” for long term consistent performance. Marc is a member of the Investor Advisory
Council of the National Association of Real Estate Investment Trusts (NAREIT), and is affiliated with the International Council of Shopping Centers (ICSC).
Marc has been
widely quoted in the financial media including CNBC, Fox Business, the Wall Street Journal, Smart Money, Forbes and Barron’s. Marc holds an MBA degree in Finance from New York University’s Executive MBA
Program and a BS, magna cum laude, from Tufts University, College of Engineering.
Rick J. Romano, CFA, is a Managing Director for PREI. He is responsible for management of the group's public securities investments.
Mr. Romano joined Prudential in
1998 from Rockefeller & Co., an investment management firm for the Rockefeller family and other high net worth clients. At Rockefeller & Co., Mr. Romano was an Equity Analyst for three investment partnerships
totaling over US $4.0 billion in publicly traded securities. He was responsible for covering real estate and leisure stocks globally and served as a generalist covering domestic equity securities. Prior to joining
Rockefeller & Co., Mr. Romano was a Senior Investment Analyst at the Prudential Realty Group where he worked on the valuation, asset management and portfolio management of a US $1.0 billion equity hotel
portfolio.
Mr. Romano has served on the board
of several private real estate companies. He is also a member of the CFA Institute (CFA), the New York Society of Security Analysts (NYSSA) and NAREIT. Mr. Romano received a BA from Rutgers College and a MBA in
Finance from New York University's Stern School of Business. In addition, he is a CFA charter holder.
Gek Lang Lee, CFA, is a Principal for PREI. Ms. Lee has been working in the public real estate sector in Asia for more than 20 years. Ms. Lee joined Prudential in June 2007 from Moon Capital LLC where she
was the Global Real Estate sector head responsible for managing a portfolio of real estate stocks spanning Asia and Latin America. Prior to joining Moon Capital, Ms. Lee was the Head of Singapore Equities Research and
Property analyst at UBS AG where she was credited with building up the Singapore institutional research team. Ms. Lee's work also included working with the UBS Investment Banking team on helping in the listing of
REITs in Singapore.
Prior to UBS, Ms. Lee was Head of
Singapore Equities at Indosuez WICarr where she was responsible for the profitability of the Singapore Equity Business and also Regional Real Estate research.
Ms. Lee holds a Bachelor of
Science degree from the National University of Singapore and is also a CFA charter holder.
| 34 | Prudential Income Builder Fund |
Michael Gallagher is a Director and Portfolio Manager for PREI based in London. He is the Portfolio Manager for the European real estate securities. Mr. Gallagher has been working in the public
securities market for over 13 years and specifically within real estate for 8 years. Prior to joining Prudential, Mr. Gallagher was the Assistant Fund Manager for Global Real Estate Securities at Aviva Investors
(London) where he was responsible for portfolio construction and stock selection of European real estate securities.
Prior to Aviva, Mr. Gallagher was
a Vice President of Citigroup (London) where he covered diversified financials and the real estate sector. At Citigroup, Mr. Gallagher was responsible for modeling and research for companies under his
coverage. Mr. Gallagher came to Citigroup from Deutsche Bank (London-Frankfurt) where he was a pan-European equity analyst covering bank stocks and diversified German companies. Mr. Gallagher holds a BA in
Economics from Harvard University, magna cum laude, and was the recipient of the Harvard College Scholarship. Mr. Gallagher also holds a MA in International Political Economy from Cornell University where he was
awarded the Mellon Foundation Scholarship. Mr. Gallagher speaks several languages including English (native), German, French, Italian and Portuguese.
Additional information about
portfolio manager compensation, other accounts managed, and portfolio manager ownership of Fund securities may be found in the SAI.
DISTRIBUTOR
Prudential Investment Management
Services LLC (PIMS or the Distributor) distributes each class of the Fund's shares under a Distribution Agreement with the Fund. The Fund has Distribution and Service Plans (the Plans) pursuant to Rule 12b-1 under the
1940 Act, applicable to certain of the Fund's shares. Under the Plans and the Distribution Agreement, the Distributor pays the expenses of distributing the shares of all share classes of the Fund. The Distributor also
provides certain shareholder support services. Each class of the Fund (except Class Z) pays distribution and other fees to the Distributor as compensation for its services. These fees—known as 12b-1
fees—are set forth in the “Fund Fees and Expenses” tables.
Because these fees are paid from
the Fund's assets on an ongoing basis, over time these fees will increase the cost of your investment and may cost you more than paying other types of sales charges.
DISCLOSURE OF PORTFOLIO
HOLDINGS
A description of the Fund's
policies and procedures with respect to the disclosure of the Fund's portfolio securities is described in the Fund's SAI and on the Fund's website at www.prudentialfunds.com.
| Visit our website at www.prudentialfunds.com | 35 |
FUND DISTRIBUTIONS AND TAX ISSUES
DISTRIBUTIONS
Investors who buy shares of the
Fund should be aware of some important tax issues. For example, the Fund distributes dividends of net investment income and realized net capital gains, if any, to shareholders. These distributions are subject to
federal income taxes, unless you hold your shares in a 401(k) plan, an Individual Retirement Account (IRA) or some other qualified or tax-deferred plan or account. Dividends and distributions from the Fund also may be
subject to state and local income tax in the state where you live.
Also, if you sell shares of the
Fund for a profit, you may have to pay capital gains taxes on the amount of your profit, unless you hold your shares in a qualified or tax-deferred plan or account.
The following briefly discusses
some of the important income tax issues you should be aware of, but is not meant to be tax advice. For tax advice, please speak with your tax adviser.
The Fund distributes dividends to shareholders out of any net investment income. For example, if the Fund owns ACME Corp. stock and the stock pays a dividend, the Fund will pay out a portion of this
dividend to its shareholders, assuming the Fund's income is more than its costs and expenses. The dividends you receive from the Fund will be subject to taxation whether or not they are reinvested in the Fund.
The Fund also distributes any
realized net capital gains to shareholders. Capital gains are generated when the Fund sells its assets for a profit. For example, if the Fund bought 100 shares of ACME Corp. stock for a total of
$1,000 and more than one year later sold the shares for a total of $1,500, the Fund has net long-term capital gains of $500, which it will pass on to shareholders (assuming the Fund's remaining total gains are greater
than any losses it may have). Capital gains are taxed differently depending on how long the Fund holds the security. If the Fund holds a security for more than one year before selling it, any gain is treated as long-term capital gain which is generally taxed at rates of up to 15% for individuals with incomes below approximately $400,000 ($450,000 if married filing jointly), adjusted annually
for inflation, and 20% for any income above those amounts that is long-term capital gain, provided that the Fund distributes the net capital gain to non-corporate US shareholders. If the Fund holds the security for
one year or less, any gain is treated as short-term capital gain, which is taxed at rates applicable to ordinary income, subject to a maximum tax rate of 39.6%. Different rates apply to corporate shareholders.
Dividends from net investment
income paid to a non-corporate US shareholder that are reported as qualified dividend income will generally be taxable to such shareholder at the long-term capital gain tax rate. Dividends of net investment income
that are not reported as qualified dividend income will be taxable to shareholders at ordinary income rates. Also, a portion of the dividends paid to corporate shareholders of the Fund will be eligible for the 70%
dividends received deduction to the extent the Fund's income is derived from certain dividends received from US corporations. Because the Fund is expected to invest in Underlying Funds, the Fund’s realized
losses on sales of shares of such funds may be indefinitely or permanently deferred as “wash sales.” Distributions of short-term capital gains by Underlying Funds will be recognized as ordinary income by
the Fund and would not be offset by the Fund’s capital loss carryforwards if any. Capital loss carryforwards of Underlying Funds if any would not offset net capital gains of the Fund. Each of these effects is
caused by the Fund’s expected investment in the Underlying Funds and may result in fund distributions to Fund shareholders being of higher magnitudes and less likely to qualify for lower capital gain tax rates
than if the Fund were to invest otherwise.
A US shareholder that is an
individual, estate or certain type of trust is subject to a 3.8% Medicare contribution tax on the lesser of (1) the US shareholder's “net investment income,” including Fund distributions and net gains from
the disposition of Fund shares, and (2) the excess of the US shareholder's modified adjusted gross income for the taxable year over $200,000 (or $250,000 for married couples filing jointly). For this purpose, net
investment income includes interest, dividends, annuities, royalties, capital gain and income from a passive activity business or a business of trading in financial instruments or commodities.
| 36 | Prudential Income Builder Fund |
For your convenience, the Fund's
distributions of dividends and net capital gains are automatically reinvested in the Fund without any sales charge. If you ask us to pay the distributions in cash, we will send you a check if your account is with Prudential Mutual Fund
Services LLC (PMFS or the Transfer Agent). Otherwise, if your account is with a broker, you will receive a credit to your account. Either way, the distributions may be subject to income taxes unless your shares are
held in a qualified or tax-deferred plan or account. If your dividend distribution check(s) remains uncashed for more than six months, your check(s) may be invested in additional shares of the Fund at the next net
asset value (“NAV”) calculated on the day of the investment. For more information about automatic reinvestment and other shareholder services, see “Additional Shareholder Services” in the next
section.
The chart below sets forth the
expected frequency of dividend and capital gains distributions to shareholders. Various factors may impact the frequency of dividend distributions to shareholders, including but not limited to adverse market
conditions or portfolio holding-specific events.
| Expected Distribution Schedule* | |
| Dividends | Monthly |
| Short-Term Capital Gains | Annually |
| Long-Term Capital Gains | Annually |
*Under certain
circumstances, the Fund may make more than one distribution of long-term and/or short-term capital gains during a fiscal year.
TAX ISSUES
Form 1099
For every year the Fund declares a
dividend, you will receive a Form 1099, which reports the amount of ordinary income distributions and long-term capital gains we distributed to you during the prior year unless you own shares of the Fund as part of a
qualified or tax-deferred plan or account. If you do own shares of the Fund as part of a qualified or tax-deferred plan or account, your taxes are deferred, so you will not receive a Form 1099 annually, but instead
you will receive a Form 1099 when you take any distribution from your qualified or tax-deferred plan or account.
Fund distributions are generally
taxable to you in the calendar year in which they are received, except when we declare certain dividends and distributions in the fourth quarter, with a record date in such quarter, and actually pay them in January of
the following year. In such cases, the dividends and distributions are treated as if they were paid on December 31st of the prior year.
Cost Basis Reporting
Mutual funds must report cost basis
information to you and the IRS when you sell or exchange shares acquired on or after January 1, 2012 in your non-retirement accounts. The cost basis regulations do not affect retirement accounts, money market funds,
and shares acquired before January 1, 2012. The cost basis regulations also require mutual funds to report whether a gain or loss is short-term (shares held one year or less) or long-term (shares held more than one
year) for all shares acquired on or after January 1, 2012 that are subsequently sold or exchanged. The Transfer Agent is not required to report cost basis information on shares acquired before January 1, 2012.
However, in most cases the Transfer Agent will provide this information to you as a service.
Withholding Taxes
If federal tax law requires you to
provide the Fund with your taxpayer identification number and certifications as to your tax status and you fail to do this, or if you are otherwise subject to backup withholding, we will withhold and pay to the US
Treasury 28% of your distributions and sale proceeds.
Taxation of Foreign Shareholders
For a discussion regarding the
taxation of foreign shareholders, please see the SAI.
If You Purchase on or Before a
Record Date
If you buy shares of the Fund on or
before the record date for a distribution (the date that determines who receives the distribution), we will pay that distribution to you. As explained above, the distribution may be subject to taxes. You may think
you've done well since you bought shares one day and soon thereafter received a distribution. That is
| Visit our website at www.prudentialfunds.com | 37 |
not so, because when dividends are paid out, the
value of each share of the Fund decreases by the amount of the dividend to reflect the payout, although this may not be apparent because the value of each share of the Fund also will be affected by market changes, if
any. However, the timing of your purchase does mean that part of your investment may have come back to you as taxable income.
Qualified and Tax-Deferred
Retirement Plans
Retirement plans and accounts allow
you to defer paying taxes on investment income and capital gains. Contributions to these plans may also be tax-deductible, although distributions from these plans generally are taxable. In the case of Roth IRA
accounts, contributions are not tax-deductible, but distributions from the plan may be tax-free. Please contact your financial adviser for information on a variety of Prudential Investments mutual funds that are
suitable for retirement plans offered by Prudential.
IF YOU SELL OR EXCHANGE YOUR
SHARES
If you sell any shares of the Fund
for a profit, you have realized a capital gain, which is subject to tax unless the shares are held in a qualified or tax-deferred plan or account. As mentioned above, the maximum capital gains tax rate is up to 15%
for individuals with incomes below approximately $400,000 ($450,000 if married filing jointly), adjusted annually for inflation, and 20% for any income above those amounts that is long-term capital gain.
If you sell shares of the Fund at
a loss, you may have a capital loss, which you may use to offset capital gains you have, plus, in the case of non-corporate taxpayers, ordinary income of up to $3,000. If you sell shares and realize a loss, you will
not be permitted to use the loss to the extent you replace the shares (including pursuant to the reinvestment of a dividend) within a 61-day period (beginning 30 days before and ending 30 days after the sale of the
shares). Under certain circumstances, if you acquire shares of the Fund and sell or exchange your shares within 90 days, you may not be allowed to include certain charges incurred in acquiring the shares for purposes
of calculating gain or loss realized upon the sale or exchange of the shares.
If you exchange your Fund shares
for shares of another class of the Fund, this is generally not a taxable event and should not result in realization of a capital gain or loss by you. If you exchange your shares of the Fund for shares of another
Prudential Investments mutual fund, this is considered a sale for tax purposes. In other words, it's a taxable event. Therefore, if the shares you exchanged have increased in value since you purchased them, you have
capital gains, which are subject to the taxes described above. Unless you hold your shares in a qualified or tax-deferred plan or account, you or your financial adviser should keep track of the dates on which you buy
and sell—or exchange—Fund shares, as well as the amount of any gain or loss on each transaction. For tax advice, please see your tax adviser.
Automatic Conversion of Class B
Shares
The conversion of Class B shares
into Class A shares—which happens automatically approximately seven years after purchase—is not a taxable event for federal income tax purposes. For more information about the automatic conversion of Class
B shares, see Class B Shares Automatically Convert to Class A Shares in How to Buy, Sell and Exchange Fund Shares.
| 38 | Prudential Income Builder Fund |
HOW TO BUY, SELL AND EXCHANGE FUND SHARES
HOW TO BUY SHARES
In order to buy Fund shares, simply
follow the steps described below.
Opening an Account
If you don't have an account with
us or a financial services firm that is permitted to buy or sell shares of the Fund for you, contact PMFS at (800) 225-1852 or write to:
Prudential Mutual Fund Services
LLC
P.O. Box 9658
Providence, RI 02940
P.O. Box 9658
Providence, RI 02940
You may purchase shares by check
or wire. We do not accept cash, money orders, foreign checks, credit card checks, payable through checks or travelers checks. To purchase by wire, call the number above to obtain an application. After PMFS receives
your completed application, you will receive an account number. For additional information, see the back cover page of this Prospectus. We have the right to reject any purchase order (including an exchange into a
Fund) or suspend or modify a Fund's sales of its shares under certain circumstances. These circumstances include, but are not limited to, failure by you to provide additional information requested, such as information
required to verify the source of funds used to purchase shares, your identity or the identity of any underlying beneficial owners of your shares. Furthermore, we are required by law to close your account if you do not
provide the required identifying information. This would result in the redemption of shares at the then-current NAV and the proceeds would be remitted to you via check. We will attempt to verify your identity within a
reasonable time frame (e.g., 60 days), which may change from time to time.
With certain limited exceptions,
Fund shares are only available to be sold in the United States, US Virgin Islands, Puerto Rico and Guam.
Choosing a Share Class
The Fund offers the following share
classes. Certain classes of shares may have additional specific eligibility or qualification requirements, which are explained below.
| Share Class | Eligibility |
| Class A | Individual investors |
| Class B | Individual investors* |
| Class C | Individual investors |
| Class R | Certain group retirement plans |
| Class Z | Institutional investors and certain other investors |
* Note: Class B shares are
closed to all purchase activity except for exchanges from Class B shares of another fund. See “Closure of Class B Shares” below for further information.
Multiple share classes let you
choose a cost structure that meets your needs:
| ■ | Class A shares purchased in amounts of less than $1 million require you to pay a sales charge at the time of purchase, but the operating expenses of Class A shares are lower than the operating expenses of Class C shares. Investors who purchase $1 million or more of Class A shares and sell these shares within 12 months of purchase are also subject to a contingent deferred sales charge (CDSC) of 1%. The CDSC is waived for certain retirement and/or benefit plans. |
| ■ | Class C shares do not require you to pay a sales charge at the time of purchase, but do require you to pay a sales charge if you sell your shares within 12 months of purchase. The operating expenses of Class C shares are higher than the operating expenses of Class A shares. |
When choosing a share class, you
should consider the following factors:
| Visit our website at www.prudentialfunds.com | 39 |
| ■ | The amount of your investment and any previous or planned future investments, which may qualify you for reduced sales charges for Class A shares under Rights of Accumulation or a Letter of Intent. |
| ■ | The length of time you expect to hold the shares and the impact of varying distribution fees. Over time, these fees will increase the cost of your investment and may cost you more than paying other types of sales charges. For this reason, Class C shares are generally appropriate only for investors who plan to hold their shares for no more than 3 years. |
| ■ | The different sales charges that apply to each share class—Class A's front-end sales charge (and, in certain cases, CDSC) vs. Class C's CDSC. |
| ■ | Class C shares purchased in single amounts greater than $1 million are generally less advantageous than purchasing Class A shares. Purchase orders for Class C shares above this amount generally will not be accepted. |
| ■ | Because Class Z shares have lower operating expenses than Class A or Class C shares, as applicable, you should consider whether you are eligible to purchase Class Z shares. |
See “How to Sell Your
Shares” for a description of the impact of CDSCs.
Some investors purchase or sell
shares of the Fund through financial intermediaries and omnibus accounts maintained by brokers that aggregate the orders of multiple investors and forward the aggregate orders to the Fund. If your shares are held
through a broker-dealer, financial adviser, financial planner or other financial intermediary, you should discuss with your financial intermediary which share classes of the Fund are available to you and which share
class may best meet your needs. The Fund has advised the financial intermediaries and broker-dealers who maintain such accounts of the share class features and guidelines, per the Prospectus, and it is their
responsibility to monitor and enforce these guidelines with respect to shareholders purchasing shares through financial intermediaries or omnibus accounts.
Share Class Comparison. Use the following chart to help you compare the different share classes. The discussion following this chart will tell you whether you are entitled to a reduction or waiver of any sales
charges.
| Class A | Class B* | Class C | Class R | Class Z | |
| Minimum purchase amount | $2,500 | $2,500 | $2,500 | None | None |
| Minimum amount for subsequent purchases | $100 | $100 | $100 | None | None |
| Maximum initial sales charge | 5.5% of the public offering price | None | None | None | None |
| Contingent Deferred Sales Charge (CDSC) (as a percentage of the lower of the original purchase price or the net asset value at redemption) | 1% on sales of $1 million or more made within 12 months of purchase | 5%(Year 1) 4%(Year 2) 3%(Year 3) 2%(Year 4) 1%(Years 5/6) 0%(Year 7) |
1% on sales made within 12 months of purchase | None | None |
| Annual distribution and service (12b-1) fees (shown as a percentage of average daily net assets) | .30% (.25% currently) |
1% | 1% | .75% (.50% currently) |
None |
Notes to Share Class
Comparison Table:
° The minimum initial and subsequent
investment requirements do not apply to employee savings plan accounts, payroll deduction plan accounts, or when exchanging all shares of an account to an existing account with the same registration. The minimum
initial investment for retirement accounts and custodial accounts for minors is $1,000. The minimum initial and subsequent investment for AIP accounts is $50 (if your shares are held through a broker or other
financial intermediary, the broker or intermediary is responsible for determining the minimum initial and subsequent investment for AIP accounts). For more information on Class Z shares, see “Qualifying for
Class Z Shares.”
° If the value of your Class A,
Class B or Class C account with PMFS is less than $10,000, the Fund will deduct a $15 annual account maintenance fee from your account. The $15 annual account maintenance fee will be assessed during the 4th calendar
quarter of each year. Any applicable CDSC on the shares redeemed to pay the $15 account maintenance fee will be waived. The $15 account maintenance fee will not be charged on: (i) accounts during the first six months
from inception of the account, (ii) accounts which are authorized for electronic delivery of account statements, transaction confirmations, prospectuses and fund shareholder reports, (iii) omnibus accounts or accounts
for which a broker or other financial intermediary is responsible for recordkeeping, (iv) institutional accounts, (v) group retirement plans, (vi) AIP accounts or employee savings plan accounts, (vii) accounts with
the same registration associated with multiple share classes within the Fund, provided that the aggregate value of share classes with the same registration with the Fund is $10,000 or more, or (viii) clients with
assets of $50,000 or more across the Prudential Investments family of mutual funds. For more information, see “Purchase, Redemption and Pricing of Fund Shares—Account Maintenance Fee” in the SAI.
° For more information about the CDSC
and how it is calculated, see “How to Sell Your Shares—Contingent Deferred Sales Charge (CDSC).”
° Investors who purchase $1 million or
more of Class A shares and redeem those shares within 12 months of purchase are subject to a 1% CDSC, although they are not subject to an initial sales charge. The CDSC is waived for purchases by certain retirement or
benefit plans.
| 40 | Prudential Income Builder Fund |
° Distribution and service fees
(12b-1) are paid from the Fund’s assets on a continuous basis. Over time, the fees will increase the cost of your investment and may cost you more than paying other types of sales charges. The service fee for
Class A, Class B, Class C and Class R shares is .25%. The distribution fee is limited to .30% (including the .25% service fee) for Class A shares, .75% for Class B and Class C shares, and .50% for Class R shares. The
Distributor of the Fund has contractually agreed until February 29, 2016 to reduce its distribution and service (12b-1) fees for Class A shares to .25% of the average daily net assets of the Class A shares and its
distribution and service (12b-1) fees for Class R shares to an annual rate of .50% of the average daily net assets of Class R shares.
* Note: Class B shares are closed to
all purchase activity except for exchanges from Class B shares of another fund. See “Closure of Class B Shares” below for more information.
Closure of Class B Shares
Class B shares are closed to all
purchase activity. This means that no new accounts in Class B shares may be established, and no additional Class B shares may be purchased or acquired, except through an exchange from the Class B shares of another
fund or through the reinvestment of dividends and/or capital gains.
Shareholders owning Class B shares
may continue to hold their Class B shares until the shares automatically convert to Class A shares under the conversion schedule, or until the shareholder redeems their Class B shares. Any redemption of Class B shares
will continue to be subject to any applicable contingent deferred sales charge (CDSC). In addition, as noted above, shareholders owning Class B shares will continue to have exchange privileges with the Class B shares
of any other fund that offers Class B shares.
Automatic
Investment Plan (AIP). Shareholders who purchase Class B shares through the Automatic Investment Plan (AIP) are no longer able to purchase Class B shares and are required to select a different share class of the
Fund or another fund in order to continue to make automatic investments. Selection of a different share class will be subject to the eligibility requirements of such share class. If a shareholder does not designate a
different share class for AIP investments, future purchases of Class B shares will be rejected. New AIPs in Class B shares may not be established.
IRAs & Employer-Sponsored
Retirement Plans. Class B shareholders may continue to hold Class B shares in IRA and SIMPLE IRA accounts or in employer-sponsored retirement plans, but contributions must be made in a different share
class.
Investment
Minimums. The minimum initial investment will be waived for existing Class B shareholders who select a new share class in the same fund. The minimum subsequent investment of $100 per fund applies in
the new share class of the same fund.
Reducing or Waiving Class A's
Initial Sales Charge
The following describes the
different ways investors can reduce or avoid paying Class A's initial sales charge.
Increase the Amount of Your
Investment. You can reduce Class A's initial sales charge by increasing the amount of your investment. This table shows how the sales charge decreases as the amount of your investment
increases:
| Amount of Purchase | Sales Charge as a % of Offering Price* |
Sales Charge as a % of Amount Invested* |
Dealer Reallowance |
| Less than $25,000 | 5.50% | 5.82% | 5.00% |
| $25,000 to $49,999 | 5.00% | 5.26% | 4.50% |
| $50,000 to $99,999 | 4.50% | 4.71% | 4.00% |
| $100,000 to $249,999 | 3.75% | 3.90% | 3.25% |
| $250,000 to $499,999 | 2.75% | 2.83% | 2.50% |
| $500,000 to $999,999 | 2.00% | 2.04% | 1.75% |
| $1 million to $4,999,999** | None | None | 1.00% |
| $5 million to $9,999,999** | None | None | 0.50% |
| $10 million and over** | None | None | 0.25% |
* Due to rounding in the
calculation of the offering price and the number of shares purchased, the actual sales charge you pay may be more or less than the percentage shown above.
** If you invest $1 million or more, you
can buy only Class A shares, unless you qualify to buy other share classes. If you purchase $1 million or more of Class A shares and sell these shares within 12 months of purchase, you will be subject to a 1% CDSC,
although you will not be subject to an initial sales charge. The CDSC is waived for purchases by certain retirement and/or benefit plans.
| Visit our website at www.prudentialfunds.com | 41 |
To satisfy the purchase amounts
above, you can:
| ■ | Use your Rights of Accumulation, which allow you or an eligible group of related investors to combine (1) the current value of Class A, Class B and Class C Prudential Investments mutual fund shares you or the group already own, (2) the value of money market shares (other than Direct Purchase money market shares) you or an eligible group of related investors have received for shares of other Prudential Investments mutual funds in an exchange transaction, and (3) the value of the shares you or an eligible group of related investors are purchasing; or |
| ■ | Sign a Letter of Intent, stating in writing that you or an eligible group of related investors will purchase a certain amount of shares in the Fund and other Prudential Investments mutual funds within 13 months. |
An “eligible group of
related investors” includes any combination of the following:
| ■ | All accounts held in your name (alone or with other account holders) and taxpayer identification number (TIN); |
| ■ | Accounts held in your spouse's name (alone or with other account holders) and TIN (see definition of spouse below); |
| ■ | Accounts for your children or your spouse's children, including children for whom you and/or your spouse are legal guardian(s) (e.g., UGMAs and UTMAs); |
| ■ | Accounts in the name and TINs of your parents; |
| ■ | Trusts with you, your spouse, your children, your spouse's children and/or your parents as the beneficiaries; |
| ■ | With limited exclusions, accounts with the same address (exclusions include, but are not limited to, addresses for brokerage firms and other intermediaries and Post Office boxes); and |
| ■ | Accounts held in the name of a company controlled by you (a person, entity or group that holds 25% or more of the outstanding voting securities of a company will be deemed to control the company, and a partnership will be deemed to be controlled by each of its general partners), including employee benefit plans of the company where the accounts are held in the plan's TIN. |
A “spouse” is defined
in this prospectus as follows:
| ■ | The person to whom you are legally married. We also consider your spouse to include the following: |
| ■ | An individual of the same gender with whom you have been joined in a civil union, or legal contract similar to marriage; |
| ■ | A domestic partner, who is an individual (including one of the same gender) with whom you have shared a primary residence for at least six months, in a relationship as a couple where you, your domestic partner or both provide for the personal or financial welfare of the other without a fee, to whom you are not related by blood; or |
| ■ | An individual with whom you have a common law marriage, which is a marriage in a state where such marriages are recognized between a man and a woman arising from the fact that the two live together and hold themselves out as being married. |
The value of shares held by you or
an eligible group of related investors will be determined by the value of your existing Class A shares calculated at current NAV plus maximum sales charge with Class B and Class C shares calculated at current NAV.
Note: Class Z shares and Class R shares cannot be aggregated with any other share class for purposes of reducing or waiving Class A's initial sales charge.
If your shares are held directly
by the Transfer Agent, and you believe you qualify for a reduction or waiver of Class A's initial sales charge, you must notify the Transfer Agent at the time of the qualifying share purchase in order to receive the
applicable reduction or waiver. If your shares are held through a broker or other financial intermediary, and you believe you qualify for a reduction or waiver of Class A's initial sales charge, you must notify your
broker or intermediary at the time of the qualifying purchase in order to receive the applicable reduction or waiver. Shares held through a broker or other financial intermediary will not be systematically aggregated
with shares held directly by the Transfer Agent for purposes of receiving a reduction or waiver of Class A's initial sales charge. The reduced or waived sales charge will be granted subject to confirmation of account
holdings.
| 42 | Prudential Income Builder Fund |
If your shares are held directly
by the Transfer Agent, you must identify the eligible group of related investors. Although the Transfer Agent does not require any specific form of documentation in order to establish your eligibility to receive a
waiver or reduction of Class A's initial sales charge, you may be required to provide appropriate documentation if the Transfer Agent is unable to establish your eligibility.
If your shares are held through a
broker or other intermediary, the broker or intermediary is responsible for determining the specific documentation, if any, that you may need in order to establish your eligibility to receive a waiver or reduction of
Class A's initial sales charge. Your broker or intermediary is also responsible for notifying the Transfer Agent if your share purchase qualifies for a reduction or waiver of Class A's initial sales charge.
Purchases of $1 Million or
More. If you purchase $1 million or more of Class A shares, you will not be subject to an initial sales charge, although a CDSC may apply, as previously noted.
Mutual Fund Programs. The initial sales charge will be waived for participants in any fee-based program or trust program sponsored by Prudential or an affiliate that includes the Fund as an available option. The
initial sales charge will also be waived for investors in certain programs sponsored by broker-dealers, investment advisers and financial planners who have agreements with Prudential, or whose programs are available
through financial intermediaries that have agreements with Prudential, relating to:
| ■ | Mutual fund “wrap” or asset allocation programs, where the sponsor places fund trades, links its clients' accounts to a master account in the sponsor's name and charges its clients a management, consulting or other fee for its services; or |
| ■ | Mutual fund “supermarket” programs, where the sponsor links its clients' accounts to a master account in the sponsor's name and the sponsor charges a fee for its services. |
Broker-dealers, investment
advisers or financial planners sponsoring these mutual fund programs may offer their clients more than one class of shares in the Fund in connection with different pricing options for their programs. Investors should
consider carefully any separate transaction and other fees charged by these programs in connection with investing in each available share class before selecting a share class.
Group Retirement Plans. The Class A initial sales charge will be waived for group retirement plans (including defined contribution plans, defined benefit plans and deferred compensation plans) available through a
retirement plan recordkeeper or third party administrator. If Prudential Retirement Services is the recordkeeper for your group retirement plan, you may call Prudential at (800) 353-2847 with any questions. Otherwise,
investors in group retirement plans should contact their financial intermediary with any questions regarding availability of Class A shares at net asset value.
Other Types of Investors. Certain other types of investors may purchase Class A shares without paying the initial sales charge, including:
| ■ | certain directors, officers, employees (including their spouses, children and parents) of Prudential and its affiliates, the Prudential Investments mutual funds, and the investment subadvisers of the Prudential Investments mutual funds; |
| ■ | persons who have retired directly from active service with Prudential or one of its subsidiaries; |
| ■ | certain real estate brokers, agents and employees of real estate brokerage companies affiliated with the Prudential Real Estate Affiliates; |
| ■ | registered representatives and employees of broker-dealers (including their spouses, children and parents) that have entered into dealer agreements with the Distributor; |
| ■ | investors in IRAs, provided that: (a) the purchase is made either from a directed rollover to such IRA or with the proceeds of a tax-free rollover of assets from a Benefit Plan for which Prudential Retirement (the institutional Benefit Plan recordkeeping entity of Prudential) provides administrative or recordkeeping services, in each case provided that such purchase is made within 60 days of receipt of the Benefit Plan distribution, and (b) the IRA is established through Prudential Retirement as part of its “Rollover IRA” program (regardless of whether or not the purchase consists of proceeds of a tax-free rollover of assets from a Benefit Plan described above); and |
| Visit our website at www.prudentialfunds.com | 43 |
| ■ | Clients of financial intermediaries, who (i) have entered into an agreement with the principal underwriter to offer Class A shares through a no-load network or platform, (ii) charge clients an ongoing fee for advisory, investment, consulting or similar services, or (iii) offer self-directed brokerage accounts that may or may not charge transaction fees to customers. |
To qualify for a waiver of the
Class A sales charge at the time of purchase, you must notify the Transfer Agent, or the Distributor must be notified by the broker facilitating the purchase, that the transaction qualifies for a waiver of the Class A
sales charge. The waiver will be granted subject to confirmation of your account holdings.
Additional Information About
Reducing or Waiving Class A's Sales Charge. The Fund also makes available free of charge, on the Fund's website, in a clear and prominent format, information relating to the Fund's Class A initial sales charge, and the different ways
that investors can reduce or avoid paying the initial sales charge. The Fund's website includes hyperlinks that facilitate access to this information.
You may need to provide your
broker-dealer or other financial intermediary through which you hold Fund shares with the information necessary to take full advantage of reduced or waived Class A sales charges.
The Distributor may reallow the
Class A sales charge to dealers.
Class B Shares Automatically Convert
to Class A Shares
If you bought Class B shares and
hold them for approximately seven years, we will automatically convert them into Class A shares without charge. At that time, we will also convert any Class B shares that you purchased with reinvested dividends and
other distributions. Since the distribution and service (12b-1) fees for Class A shares are lower than for Class B shares, converting to Class A shares lowers your Fund expenses. Class B shares acquired through the
reinvestment of dividends or distributions will be converted to Class A shares according to the procedures utilized by the broker-dealer through which the Class B shares were purchased, if the shares are carried on
the books of that broker-dealer and the broker-dealer provides subaccounting services to the Fund. Otherwise, the procedures utilized by PMFS or its affiliates will be used. The use of different procedures may result
in a timing differential in the conversion of Class B shares acquired through the reinvestment of dividends and distributions.
When we do the conversion, you
will get fewer Class A shares than the number of converted Class B shares if the price of the Class A shares is higher than the price of the Class B shares. The total dollar value will be the same, so you will not
have lost any money by getting fewer Class A shares. Conversions are quarterly for Class B shares.
If you hold Class B share
certificates, the certificates must be received by the Transfer Agent in order for your Class B shares to convert from Class B to Class A shares. Certificate deposited shares will convert during the next quarterly
conversion.
Qualifying for Class R Shares
Group Retirement
Plans. Class R shares are offered for sale to (i) certain group retirement plans (including defined contribution plans, defined benefit plans and deferred compensation plans) available through a
retirement plan recordkeeper or third party administrator, and (ii) IRAs that are held on the books of a Fund through omnibus level accounts, including The SmartSolution IRA offered by Prudential Retirement. If
Prudential Retirement Services is the recordkeeper for your group retirement plan, you may call Prudential at (800) 353-2847 with any questions. Investors in SmartSolution IRA accounts through Prudential’s
Personal Retirement Services unit can call 888-244-6237 with any questions regarding how to purchase shares. Otherwise, investors in group retirement plans should contact their financial intermediary with any
questions regarding availability of Class R shares.
Qualifying for Class Z Shares
Institutional Investors. Various institutional investors may purchase Class Z shares, including corporations, banks, governmental entities, municipalities, hospitals, insurance companies and IRS Section 501
entities, such as foundations and endowments. The minimum initial investment for such investors generally is $5 million; however, such minimum initial investment may be modified for certain financial firms that submit
orders on behalf of their
| 44 | Prudential Income Builder Fund |
clients. A Fund or the Distributor may lower,
waive, or otherwise modify the minimum initial investment for certain categories of investors at their discretion. Institutional investors are responsible for indicating their eligibility to purchase Class Z shares at
the time of purchase. Certain financial intermediaries may require that investments by their institutional investor clients in Class Z shares be placed directly with the Fund's Transfer Agent. Please contact the
Transfer Agent at (800) 225-1852 for further details.
Mutual Fund Programs. Class Z shares can be purchased by participants in any fee-based program or trust program sponsored by Prudential or an affiliate that includes the Fund as an available option. Class Z
shares also can be purchased by investors in certain programs sponsored by broker-dealers, investment advisers and financial planners who have agreements with Prudential, or whose programs are available through
financial intermediaries that have agreements with Prudential, relating to:
| ■ | Mutual fund “wrap” or asset allocation programs where the sponsor places fund trades, links its clients' accounts to a master account in the sponsor's name and charges its clients a management, consulting or other fee for its services; or |
| ■ | Mutual fund “supermarket” programs where the sponsor links its clients' accounts to a master account in the sponsor's name and the sponsor charges a fee for its services. |
Broker-dealers, investment
advisers or financial planners sponsoring these mutual fund programs may offer their clients more than one class of shares in the Fund in connection with different pricing options for their programs. Investors should
consider carefully any separate transaction and other fees charged by these programs in connection with investing in a share class offered by the program before selecting a share class.
Group Retirement Plans. Group retirement plans (including defined contribution plans, defined benefit plans and deferred compensation plans) available through a retirement plan recordkeeper or third party
administrator may purchase Class Z shares. If Prudential Retirement Services is the recordkeeper for your group retirement plan, you may call Prudential at (800) 353-2847 with any questions. Otherwise, investors in
group retirement plans should contact their financial intermediary with any questions regarding availability of Class Z shares.
Other Types of Investors. Class Z shares also can be purchased by any of the following:
| ■ | Certain participants in the MEDLEY Program (group variable annuity contracts) sponsored by Prudential for whom Class Z shares of the Prudential mutual funds are an available option; |
| ■ | Current and former Directors/Trustees of mutual funds managed by PI or any other affiliate of Prudential; |
| ■ | Prudential; |
| ■ | Prudential funds, including Prudential funds-of-funds; |
| ■ | Qualified state tuition programs (529 plans); and |
| ■ | Investors working with fee-based consultants for investment selection and allocations. |
How Financial Services Firms are
Compensated for Selling Fund Shares
The Prudential Investments and
Target Mutual Funds are distributed by Prudential Investment Management Services LLC (the Distributor), a broker-dealer that is licensed to sell securities. The Distributor generally does not sell shares of the Funds
directly to the public, but instead markets and sells the Funds through other broker-dealers, 401(k) providers, retirement plan administrators, and other financial intermediaries. For ease of reference, we refer to
all financial intermediaries collectively as “financial services firms.” Each Fund is managed by the Manager.
Only persons licensed with the
Financial Industry Regulatory Authority, Inc. (FINRA), as a registered representative (often referred to as a broker or financial adviser) and associated with a specific financial services firm may sell shares of a
mutual fund to you, or to a retirement plan in which you participate.
Rule 12b-1 Fees & Sales
Charges. The Distributor has agreements in place with financial services firms defining how much each firm will be paid for the sale of a particular mutual fund from front-end sales charges, if any,
paid by Fund shareholders and from fees paid to the Distributor by the Fund pursuant to Rule 12b-1 under the 1940 Act (Rule 12b-1). These financial services firms then pay their registered representatives who sold you
the Fund some or all of what they received from the Distributor. The registered representatives may receive a payment when the sale is made
| Visit our website at www.prudentialfunds.com | 45 |
and can, in some cases, continue to receive
ongoing payments while you are invested in the Fund. The Distributor may change at any time, without prior notice, the amount of Rule 12b-1 fees that it pays (when the sale is made and/or any ongoing payments) to
financial services firms and registered representatives so that the Distributor may retain all or a portion of such fees.
“Revenue Sharing”
Payments. In addition to the compensation received by financial services firms as described above, the Manager or certain of its affiliates (but not the Distributor) may make additional payments
(which are often referred to as “revenue sharing” payments) to the financial services firms from the Manager's or certain affiliates' own resources, including from the profits derived from management or
other fees received from the Fund, without additional direct or indirect cost to the Fund or its shareholders, provided that no such additional payments are made with respect to the Fund’s Class Q shares (if
applicable). Revenue sharing payments are in addition to the front-end sales charges paid by Fund shareholders or fees paid pursuant to plans adopted in accordance with Rule 12b-1. The Manager or certain of its
affiliates may revise the terms of any existing revenue sharing arrangement, and may enter into additional revenue sharing arrangements with other financial services firms in the future.
Revenue sharing arrangements are
intended to foster the sale of Fund shares and/or to compensate financial services firms for assisting in marketing or promotional activities in connection with the sale of Fund shares. In exchange for revenue sharing
payments, the Fund generally expects to receive the opportunity for the Fund to be sold through the financial services firms' sales force or access to third-party platforms or other marketing programs, including but
not limited to mutual fund “supermarket” platforms or other sales programs. To the extent that financial services firms receiving revenue sharing payments sell more shares of the Fund, the Manager and
Distributor benefit from the increase in Fund assets as a result of the management and distribution fees they receive from the Fund, respectively. Increased sales of Fund shares also may benefit shareholders, since an
increase in Fund assets may allow the Fund to expand its investment opportunities, and increased Fund assets may result in reduced Fund operating expenses.
Revenue sharing payments, as well
as the other types of payments described above, may provide an incentive for financial services firms and their registered representatives to recommend or sell shares of the Fund to you and in doing so may create
conflicts of interest between the firms' financial interests and their duties to customers.
If your Fund shares are purchased
through a retirement plan, the Manager or certain of its affiliates (but not the Distributor) may also make revenue sharing payments to the plan's recordkeeper or an affiliate, which generally is not a registered
broker-dealer. Rule 12b-1 fees and sales charges may only be paid to a registered broker-dealer.
It is likely that financial
services firms that execute portfolio transactions for the Fund will include those firms with which the Manager and/or certain of its affiliates have entered into revenue sharing arrangements. Neither the Manager nor
any subadviser may consider sales of Fund shares as a factor in the selection of broker-dealers to execute portfolio transactions for the Fund. The Manager and certain of its affiliates will not use Fund brokerage as
any part of revenue sharing payments to financial services firms.
Revenue sharing payments are
usually calculated based on a percentage of Fund sales and/or Fund assets attributable to a particular financial services firm. Payments may also be based on other criteria or factors, for example, a fee per each
transaction. Specific payment formulas are negotiated based on a number of factors, including, but not limited to, reputation in the industry, ability to attract and retain assets, target markets, customer
relationships and scope and quality of services provided. The Manager and/or certain of its affiliates make such payments to financial services firms in amounts that generally range from .02% up to .20% of Fund assets
serviced and maintained by the financial services firms or from .10% to .25% of sales of Fund shares attributable to the firm. In addition, the Manager and/or certain of its affiliates may pay flat fees on a one-time
or irregular basis for the initial set-up of the Fund on a financial services firm's systems, participation or attendance at a financial services firm's meeting, or for other reasons. These amounts are subject to
change. In addition, the costs associated with visiting the financial services firms to make presentations, and/or train and educate the personnel of the financial services firms, may be paid by the Manager and/or
certain of its affiliates, subject to applicable FINRA regulations.
| 46 | Prudential Income Builder Fund |
Please contact the registered
representative (or his or her firm) who sold shares of the Fund to you for details about any payments the financial services firm may receive from the Manager and/or certain of its affiliates. You should review your
financial services firm's disclosure and/or talk to your financial services firm to obtain more information on how this compensation may have influenced your financial services firm's recommendation of the Fund.
Additional information regarding these revenue sharing payments is included in the SAI which is available to you at no additional charge.
Other Payments Received by Financial
Services Firms
Administrative, Sub-Accounting and
Networking Fees. In addition to, rather than in lieu of, the fees that the Fund may pay to financial services firms as described above, and the fees the Fund pays to the Transfer Agent, the Transfer Agent
or its affiliates may enter into additional agreements on behalf of the Fund with financial services firms pursuant to which the Fund will pay financial services firms for certain administrative, sub-accounting and
networking services, provided that no such additional payments to financial services firms are made with respect to the Fund’s Class Q shares (if applicable). These services include maintenance of shareholder
accounts by the firms, such as recordkeeping and other activities that otherwise would be performed by the Transfer Agent. Sub-accounting services encompass activities that reduce the burden of recordkeeping to the
Fund. Administrative fees are paid to a firm that undertakes, for example, shareholder communications on behalf of the Fund. Networking services are services undertaken to support the electronic transmission of
shareholder purchase and redemption orders through the National Securities Clearing Corporation (NSCC).
These payments, as discussed
above, are paid out of Fund assets and generally based on either (1) a percentage of the average daily net assets of Fund shareholders serviced by a financial services firm or (2) a fixed dollar amount for each
account serviced by a financial services firm. From time to time, the Manager or certain of its affiliates (but not the Distributor) also may pay a portion of the fees for the services to the financial services firms
at their own expense and out of their own resources.
In addition, the Fund reimburses
the Distributor for NSCC fees that are invoiced to the Distributor as the party to the Agreement with NSCC for the administrative services provided by NSCC to the Fund and its shareholders. These administrative
services provided by NSCC to the Fund and its shareholders include transaction processing and settlement through Fund/SERV, electronic networking services to support the transmission of shareholder purchase and
redemption orders to and from financial intermediaries, and related recordkeeping provided by NSCC to the Fund and its shareholders. These payments are generally based on a transaction fee rate for certain
administrative services plus a fee for other administrative services.
Anti-Money Laundering
In accordance with federal law, the
Fund has adopted policies designed to deter money laundering. Under the policies, the Fund will not knowingly engage in financial transactions that involve proceeds from unlawful activity or support terrorist
activities, and shall file government reports, including those concerning suspicious activities, as required by applicable law. The Fund will seek to confirm the identity of potential shareholders to include both
individuals and entities through documentary and non-documentary methods. Non-documentary methods may include verification of name, address, date of birth and tax identification number with selected credit bureaus.
The Fund has also appointed an Anti-Money Laundering Compliance Officer to oversee the Fund's anti-money laundering policies.
Understanding the Price You'll
Pay
The price you pay for each share of
the Fund is based on the share value. The share value of a mutual fund—known as the net asset value or NAV—is determined by a simple calculation: it's the total value of the Fund (assets minus liabilities) divided by the total number of shares outstanding. For example, if the
value of the investments held by
| Visit our website at www.prudentialfunds.com | 47 |
Fund XYZ (minus its liabilities) is $1,000 and
there are 100 shares of Fund XYZ owned by shareholders, the value of one share of the Fund—or the NAV—is $10 ($1,000 divided by 100).
Mutual Fund Shares
The NAV of mutual fund shares changes every day because the value of a fund's portfolio changes constantly. For example, if Fund XYZ holds ACME Corp. bonds in its portfolio and the price of ACME
bonds goes up, while the value of the Fund's other holdings remains the same and expenses don't change, the NAV of Fund XYZ will increase.
The Fund's NAV will be determined
every day on which the Fund is open as of the close of regular trading on the New York Stock Exchange (NYSE) (generally, 4:00 p.m. Eastern time). The Fund's portfolio securities are valued based upon market quotations
or, if market quotations are not readily available, at fair value as determined in good faith under procedures established by the Board. These procedures include pricing methodologies for determining the fair value of
certain types of securities and other assets held by the Fund that do not have quoted market prices, and authorize the use of other pricing sources, such as bid prices supplied by a principal market maker and
evaluated prices supplied by pricing vendors that employ analytic methodologies that take into account the prices of similar securities and other market factors.
If the Fund determines that a
market quotation for a security is not reliable based on, among other things, events or market conditions that occur with respect to one or more securities held by the Fund or the market as a whole, after the
quotation is derived or after the closing of the primary market on which the security is traded, but before the time that the Fund's NAV is determined, the Fund may use “fair value pricing,” which is
implemented by a valuation committee (Valuation Committee) consisting of representatives of the Manager or by the Board. The subadviser often provides relevant information for the Valuation Committee meeting. In
addition, the Fund may use fair value pricing determined by the Valuation Committee or Board if the pricing source does not provide an evaluated price for a security or provides an evaluated price that, in the
judgment of the Manager (which may be based upon a recommendation from the subadviser), does not represent fair value. Securities that are primarily traded outside the United States may also be subject to a fair value
pricing adjustment using a service provided by a pricing vendor, if it is determined that market quotations from those non-US markets are not reliable, based on market movements after the close of the relevant non-US
markets. Non-US securities markets are open for trading on weekends and other days when the Fund does not price shares. Therefore, the value of the Fund’s shares may change on days when you will not be able to
purchase or redeem the Fund’s shares.
With respect to any portion of the
Fund's assets that are invested in one or more open-end investment companies, the Fund's NAV will be calculated based upon the NAV of the investment company in which the Fund invests, which will reflect the investment
company’s fair valuation procedures.
Different valuation methods may
result in differing values for the same security. The fair value of a portfolio security that the Fund uses to determine its NAV may differ from the security's quoted or published price. If the Fund needs to implement
fair value pricing after the NAV publishing deadline but before shares of the Fund are processed, the NAV you receive or pay may differ from the published NAV price. The prospectuses of any other mutual funds in which
the Fund invests will explain each fund’s procedures and policies with respect to the use of fair value pricing.
Fair value pricing procedures are
designed to result in prices for the Fund's securities and its NAV that are reasonable in light of the circumstances which make or have made market quotations unavailable or unreliable, and may have the effect of
reducing arbitrage opportunities available to short-term traders. There is no assurance, however, that fair value pricing will more accurately reflect the market value of a security than the market price of such
security on that day or that it will prevent dilution of the Fund's NAV by short-term traders.
| 48 | Prudential Income Builder Fund |
What Price Will
You Pay for Shares of the Fund? For Class A shares, you'll pay the public offering price, which is the NAV next determined after we receive your order to purchase, plus an initial sales charge (unless you're entitled to a
waiver). For all other share classes, you will pay the NAV next determined after we receive your order to purchase (remember, there are no up-front sales charges for these share classes). Your broker may charge you a
separate or additional fee for purchases of shares. Unless regular trading on the NYSE closes before 4:00 p.m. Eastern time, or later than 4:00 p.m. Eastern time, your order to purchase must be received by 4:00 p.m.
Eastern time in order to receive that day's NAV. In the event that regular trading on the NYSE closes before 4:00 p.m. Eastern time, you will receive the following day's NAV if your order to purchase is received after
the close of regular trading on the NYSE. We deem an order received when it is received by the Transfer Agent at its processing center. If you submit your order through a broker or other financial intermediary, it may
be deemed received when received by the broker or financial intermediary.
Each business day, the
Fund’s current NAV per share is made available at www.prudentialfunds.com (click on the “Funds” tab at the top of the home page, then select “Open-End Funds—Prices & Yields”).
Additional Shareholder Services
As a Fund shareholder, you can take
advantage of the following services and privileges:
Automatic Reinvestment. As we explained in the “Fund Distributions and Tax Issues” section, the Fund pays out—or distributes—its net investment income and net capital gains to all
shareholders. For your convenience, we will automatically reinvest your distributions in the Fund at NAV, without any sales charge. If you want your distributions paid in cash, you can indicate this preference on your
application, or by notifying your broker or the Transfer Agent in writing (at the address below) at least five business days before the date we determine who receives dividends. For accounts held at the Transfer Agent
(PMFS), distributions of $10.00 or less on non-retirement accounts will not be paid out in cash, but will be automatically reinvested into your account.
Prudential Mutual Fund Services
LLC
P.O. Box 9658
Providence, RI 02940
P.O. Box 9658
Providence, RI 02940
Automatic Investment Plan
(AIP). You can make regular purchases of the Fund by having a fixed amount of money automatically withdrawn from your bank or brokerage account at specified intervals. The minimum for subsequent
investments through newly-established AIP accounts must be at least $50 monthly.
Note: New AIPs in Class B shares
may not be established. Class B shareholders may not make automatic investments in Class B shares through an AIP. A Class B shareholder must designate a different share class of the same fund or another fund for
purchases. Shareholders may select another share class which they are eligible to purchase.
Retirement Plan Services. Prudential offers a wide variety of retirement plans for individuals and institutions, including large and small businesses. For information on IRAs, including Roth IRAs or SEP-IRAs for a
one-person business, please contact your financial adviser. If you are interested in opening a 401(k) or other company-sponsored retirement plan (SIMPLE IRAs, SEP plans, Keoghs, 403(b)(7) plans, pension and
profit-sharing plans), your financial adviser will help you determine which retirement plan best meets your needs. Complete instructions about how to establish and maintain your plan and how to open accounts for you
and your employees will be included in the retirement plan kit you receive in the mail.
Note: Class B shareholders can
continue to hold Class B shares in IRA and SIMPLE IRA accounts or in employer-sponsored retirement plans, but new contributions must be made in another share class.
Systematic Withdrawal Plan. A Systematic Withdrawal Plan is available that will provide you with monthly, quarterly, semi-annual or annual redemption checks. The Systematic Withdrawal Plan is not available to
participants in certain retirement plans. Please contact PMFS at (800) 225-1852 for more details.
| Visit our website at www.prudentialfunds.com | 49 |
Reports to Shareholders. Every year we will send you an annual report (along with an updated prospectus) and a semi-annual report, which contain important financial information about the Fund. To reduce Fund
expenses, we may send one annual shareholder report, one semi-annual shareholder report and one annual prospectus per household, unless you instruct us or your broker otherwise. If each Fund shareholder in your
household would like to receive a copy of the Fund's prospectus, shareholder report and proxy statement, please call us toll free at (800) 225-1852. We will begin sending additional copies of these documents within 30
days of receipt of your request.
HOW TO SELL YOUR SHARES
You can sell your Fund shares for
cash (in the form of a check) at any time, subject to certain restrictions. For more information about these restrictions, see “Restrictions on Sales” below.
When you sell shares of a
Fund—also known as redeeming your shares—the price you will receive will be the NAV next determined after the Transfer Agent or your broker or other financial intermediary receives your order to sell (less
any applicable CDSC). If your broker holds your shares, your broker must receive your order to sell no later than the time regular trading on the NYSE closes—which is usually 4:00 p.m. Eastern time—to
process the sale on that day. In the event that regular trading on the NYSE closes before 4:00 p.m. Eastern time, you will receive the following day's NAV if your order to sell is received after the close of regular
trading on the NYSE. Otherwise, contact:
Prudential Mutual Fund Services
LLC
P.O. Box 9658
Providence, RI 02940
P.O. Box 9658
Providence, RI 02940
Generally, we
will pay you for the shares that you sell within seven days after the Transfer Agent or your broker or other financial intermediary receives your sell order. If you hold shares through a broker, payment will be
credited to your account. If you are selling shares you recently purchased with a check, we may delay sending you the proceeds until your check clears, which can take up to seven days from the purchase date. Your
broker may charge you a separate or additional fee for sales of shares.
As a result of restrictions on
withdrawals and transfers imposed by Section 403(b) of the Internal Revenue Code of 1986, as amended, we may consider a redemption request to not be in good order until we obtain information from your employer that is
reasonably necessary to ensure that the payment is in compliance with such restrictions, if applicable. In such an event, the redemption request will not be in good order and we will not process it until we obtain
information from your employer.
Restrictions on Sales
There are certain times when you
may not be able to sell shares of the Fund or when we may delay paying you the proceeds from a sale. As permitted by the Securities and Exchange Commission, the former may happen only during unusual market conditions
or emergencies when the Fund can't determine the value of its assets or sell its holdings. For more information, see the SAI.
If you hold your shares directly
with the Transfer Agent, you will need to have the signature on your sell order medallion signature guaranteed if:
| ■ | You are selling more than $100,000 of shares; |
| ■ | You want the redemption proceeds made payable to someone that is not in our records; |
| ■ | You want the redemption proceeds sent to some place that is not in our records; |
| ■ | You are a business or a trust; or |
| ■ | You are redeeming due to the death of the shareholder or on behalf of the shareholder. |
The medallion signature guarantee
may be obtained from an authorized officer from a bank, broker, dealer, securities exchange or association, clearing agency, savings association, or credit union that is participating in one of the recognized
medallion guarantee programs (STAMP, SEMP, or NYSE MSP). The medallion signature guarantee must be
| 50 | Prudential Income Builder Fund |
appropriate for the dollar amount of the
transaction. The Transfer Agent reserves the right to reject transactions where the value of the transaction exceeds the value of the surety coverage indicated on the medallion imprint. For more information, see the
SAI.
Contingent Deferred Sales Charge
(CDSC)
If you sell Class B shares within
six years of purchase or Class C shares within 12 months of purchase, you will have to pay a CDSC. In addition, if you purchase $1 million or more of Class A shares, although you are not subject to an initial sales
charge, you are subject to a 1% CDSC for shares redeemed within 12 months of purchase (the CDSC is waived for purchases by certain retirement and/or benefit plans). To keep the CDSC as low as possible, we will sell
amounts representing shares in the following order:
| ■ | Amounts representing shares you purchased with reinvested dividends and distributions, |
| ■ | Amounts representing the increase in NAV above the total amount of payments for shares made during the past 12 months for Class A shares (in certain cases), six years for Class B shares, and 12 months for Class C shares, and |
| ■ | Amounts representing the cost of shares held beyond the CDSC period (12 months for Class A shares (in certain cases), six years for Class B shares, and 12 months for Class C shares). |
Since shares that fall into any of
the categories listed above are not subject to the CDSC, selling them first helps you to avoid—or at least minimize—the CDSC.
Having sold the exempt shares
first, if there are any remaining shares that are subject to the CDSC, we will apply the CDSC to amounts representing the cost of shares held for the longest period of time within the applicable CDSC period.
The CDSC is calculated based on
the lesser of the original purchase price or the redemption proceeds. The rate decreases on the anniversary date of your purchase.
The holding period for purposes of
determining the applicable CDSC will be calculated from the anniversary date of the purchase, excluding any time Class B or Class C shares were held in a money market fund.
Waiver of the CDSC—Class A
Shares
The CDSC will be waived if the
Class A shares are sold:
| ■ | After a shareholder is deceased or permanently disabled (or, in the case of a trust account, after the death or permanent disability of the grantor). This waiver applies to individual shareholders, as well as shares held in joint tenancy, provided the shares were purchased before the death or permanent disability; |
| ■ | To provide for certain distributions—made without IRS penalty—from a qualified or tax-deferred retirement plan, benefit plan, IRA or Section 403(b) custodial account; |
| ■ | To withdraw excess contributions from a qualified or tax-deferred retirement plan, IRA or Section 403(b) custodial account; and |
| ■ | For redemptions by certain retirement or benefit plans. |
For more information, see the
SAI.
Waiver of the CDSC—Class B
Shares
The CDSC will be waived if the
Class B shares are sold:
| ■ | After a shareholder is deceased or permanently disabled (or, in the case of a trust account, after the death or permanent disability of the grantor). This waiver applies to individual shareholders, as well as shares held in joint tenancy, provided the shares were purchased before the death or permanent disability; |
| ■ | To provide for certain distributions—made without IRS penalty—from a qualified or tax-deferred retirement plan, benefit plan, IRA or Section 403(b) custodial account; |
| ■ | To withdraw excess contributions from a qualified or tax-deferred retirement plan, IRA or Section 403(b) custodial account; and |
| ■ | On certain redemptions effected through a Systematic Withdrawal Plan. |
| Visit our website at www.prudentialfunds.com | 51 |
For more information, see the
SAI.
Waiver of the CDSC—Class C
Shares
The CDSC will be waived if the
Class C shares are sold:
| ■ | After a shareholder is deceased or permanently disabled (or, in the case of a trust account, after the death or permanent disability of the grantor). This waiver applies to individual shareholders, as well as shares held in joint tenancy, provided the shares were purchased before the death or permanent disability; |
| ■ | To provide for certain distributions—made without IRS penalty—from a qualified or tax-deferred retirement plan, benefit plan, IRA or Section 403(b) custodial account; |
| ■ | To withdraw excess contributions from a qualified or tax-deferred retirement plan, IRA or Section 403(b) custodial account; and |
| ■ | The CDSC will be waived for redemptions by certain group retirement plans for which Prudential or brokers not affiliated with Prudential provide administrative or recordkeeping services. The CDSC also will be waived for certain redemptions by benefit plans sponsored by Prudential and its affiliates. For more information, call Prudential at (800) 353-2847. |
For more information, see the
SAI.
Redemption In Kind
If the sales of Fund shares you
make during any 90-day period reach the lesser of $250,000 or 1% of the value of the Fund's net assets, we can then give you securities from the Fund's portfolio instead of cash. If you want to sell the securities for
cash, you would have to pay the costs charged by a broker. You would also be responsible for any tax consequences resulting from your ownership of the securities.
Involuntary Redemption of Small
Accounts
If the value of your account with
PMFS is less than $500 for any reason, we may sell your shares (without charging any CDSC) and close your account. We would do this to minimize the Fund's expenses paid by other shareholders. The involuntary sale
provisions do not apply to Automatic Investment Plan (AIP) accounts, employee savings plan accounts, payroll deduction plan accounts, retirement accounts (such as a 401(k) plan, an IRA or other qualified or
tax-deferred plan or account), omnibus accounts, and accounts for which a broker or other financial intermediary is responsible for recordkeeping. Prior thereto, if you make a sale that reduces your account value to
less than the threshold, we may sell the rest of your shares (without charging any CDSC) and close your account; this involuntary sale does not apply to shareholders who own their shares as part of a retirement
account. For more information, see “Purchase, Redemption and Pricing of Fund Shares—Involuntary Redemption” in the SAI.
Account Maintenance Fee
If the value of your account with
PMFS is less than $10,000, with certain exclusions, a $15 annual account maintenance fee will be deducted from your account during the 4th calendar quarter of each year. Any applicable CDSC on the shares redeemed to
pay the account maintenance fee will be waived. For more information, see “Purchase, Redemption and Pricing of Fund Shares—Account Maintenance Fee” in the SAI.
90-Day Repurchase Privilege
After you redeem your shares, you
have a 90-day period during which you may reinvest back into your account any of the redemption proceeds in shares of the same Fund without paying an initial sales charge. If you paid a CDSC when you redeemed your
shares, we will credit your account with the appropriate number of shares to reflect the amount of the CDSC you paid on that reinvested portion of your redemption proceeds. In order to take advantage of this one-time
privilege, you must notify the Transfer Agent or your broker at the time of the repurchase. For more information, see the SAI.
| 52 | Prudential Income Builder Fund |
Retirement Plans
To sell shares and receive a
distribution from your retirement account, call your broker or the Transfer Agent for a distribution request form. There are special distribution and income tax withholding requirements for distributions from
retirement plans and you must submit a withholding form with your request to avoid delay. If your retirement plan account is held for you by your employer or plan trustee, you must arrange for the distribution request
to be signed and sent by the plan administrator or trustee. For additional information, see the SAI.
HOW TO EXCHANGE YOUR SHARES
You can exchange your shares of the
Fund for shares of the same class in certain other Prudential Investments mutual funds—including Prudential MoneyMart Assets (a money market fund)—if you satisfy the minimum investment requirements. For
example, you can exchange Class A shares of the Fund for Class A shares of other funds in the Prudential Investments mutual fund family, but you can’t exchange Class A shares for a different share class of
another fund. After an exchange, at redemption, any CDSC will be calculated from the date of the initial purchase, excluding any time that Class B or Class C shares were held in Prudential MoneyMart Assets. We may
change the terms of any exchange privilege after giving you 60 days' notice.
Note: Class B
shares may not be purchased or acquired by any Class B shareholder except by exchange from Class B shares of another fund or through dividend and/or capital gains reinvestment.
There is no sales charge for
exchanges. However, if you exchange—and then sell—shares within the applicable CDSC period, you must still pay the applicable CDSC. At the time of exchange, CDSC liable shares and free shares move
proportionally according to the percentage of total shares you are exchanging. If you have exchanged Class B or Class C shares into Prudential MoneyMart Assets, the time you hold the Class B or Class C shares in the
money market fund will not be counted in calculating the required holding period for CDSC liability.
For investors in certain programs
sponsored by broker-dealers, investment advisers and financial planners who have agreements with Prudential, or whose programs are available through financial intermediaries that have agreements with Prudential
relating to mutual fund “wrap” or asset allocation programs or mutual fund “supermarket” programs, an exchange may be made from Class A to Class Z shares of the Fund in certain limited
circumstances. Contact your program sponsor or financial intermediary with any questions.
If you hold shares through a
broker, you must exchange shares through your broker. Otherwise contact:
Prudential Mutual Fund Services
LLC
P.O. Box 9658
Providence, RI 02940
P.O. Box 9658
Providence, RI 02940
If you participate in any
fee-based program where the Fund is an available investment option, you may arrange with the Transfer Agent or your recordkeeper to exchange your Class A shares, if any, for Class Z shares when you elect to
participate in the fee-based program. When you no longer participate in the program, you may arrange with the Transfer Agent or your recordkeeper to exchange all of your Class Z shares, including shares purchased
while you were in the program, for Class A shares.
Likewise, if you are entitled to
purchase Class Z shares as a participant in Wells Fargo Advisors’ 401(k) Plan and you seek to transfer your Class Z shares out of the 401(k) Plan after your voluntary or involuntary termination of employment or
retirement, you may arrange with the Transfer Agent or your recordkeeper to exchange your Class Z shares held in the 401(k) Plan for Class A shares.
Remember, as we explained in the
section entitled “Fund Distributions and Tax Issues—If You Sell or Exchange Your Shares,” exchanging shares is considered a sale for tax purposes. Therefore, if the shares you exchange are worth more
than the amount that you paid for them, you may have to pay capital gains tax. For additional information about exchanging shares, see the SAI.
| Visit our website at www.prudentialfunds.com | 53 |
Frequent Purchases and Redemptions
of Fund Shares
The Fund seeks to prevent patterns
of frequent purchases and redemptions of Fund shares by its shareholders. Frequent purchases and sales of shares of the Fund may adversely affect Fund performance and the interests of long-term investors. When a
shareholder engages in frequent or short-term trading, the Fund may have to sell portfolio securities to have the cash necessary to redeem the shareholder's shares. This can happen when it is not advantageous to sell
any securities, so the Fund's performance may be hurt. When large dollar amounts are involved, frequent trading can also make it difficult to use long-term investment strategies because the Fund cannot predict how
much cash it will have to invest. In addition, if the Fund is forced to liquidate investments due to short-term trading activity, it may incur increased brokerage and tax costs. Similarly, the Fund may bear increased
administrative costs as a result of the asset level and investment volatility that accompanies patterns of short-term trading. Moreover, frequent or short-term trading by certain shareholders may cause dilution in the
value of Fund shares held by other shareholders. Funds that invest in foreign securities may be particularly susceptible to frequent trading because time zone differences among international stock markets can allow a
shareholder engaging in frequent trading to exploit fund share prices that may be based on closing prices of foreign securities established some time before the Fund calculates its own share price. Funds that invest
in certain fixed-income securities, such as high-yield bonds or certain asset-backed securities, may also constitute an effective vehicle for a shareholder's frequent trading strategy.
The Fund does not knowingly
accommodate or permit frequent trading, and the Board has adopted policies and procedures designed to discourage or prevent frequent trading activities by Fund shareholders. In an effort to prevent such practices, the
Fund's Transfer Agent monitors trading activity on a daily basis. The Fund has implemented a trading policy that limits the number of times a shareholder may purchase Fund shares or exchange into the Fund and then
sell those shares within a specified period of time (a “round-trip transaction”) as established by the Fund's Chief Compliance Officer (CCO). The CCO is authorized to set and modify the parameters of the
trading policy at any time as required to prevent the adverse impact of frequent trading on Fund shareholders.
The CCO has defined frequent
trading as one or more round-trip transactions in shares of the Fund within a 30-day period. If this occurs, the shareholder’s account will be subject to a 60-day warning period. If a second round-trip occurs
before the conclusion of the 60-day warning period, a trading suspension will be placed on the account by the Fund’s Transfer Agent that will remain in effect for 90 days. The trading suspension will relate to
purchases and exchange purchases (but not redemptions) in the Fund in which the frequent trading occurred. Exceptions to the trading policy will not normally be granted.
Transactions in the Prudential
Investments money market funds are excluded from this policy. In addition, transactions by the Prudential Asset Allocation Funds and the Prudential Real Assets Fund, which are structured as
“funds-of-funds,” and invest primarily in other mutual funds within the Prudential Investments fund family, are not subject to the limitations of the trading policy and are not considered frequent or
short-term trading.
The Fund reserves the right to
reject or cancel, without prior notice, all additional purchases or exchanges into the Fund by a shareholder. Moreover, the Fund may direct a broker-dealer or other intermediary to block a shareholder account from
future trading in the Fund. The Transfer Agent will monitor trading activity over $25,000 per account on a daily basis for a rolling 90-day period. If a purchase into the Fund is rejected or canceled, the shareholder
will receive a return of the purchase amount.
If the Fund is offered to
qualified plans on an omnibus basis or if Fund shares may be purchased through other omnibus arrangements, such as through a financial intermediary such as a broker-dealer, a bank, an insurance company separate
account, an investment adviser, or an administrator or trustee of a retirement plan (“Intermediaries”) that holds your shares in an account under its name, Intermediaries maintain the individual beneficial
owner records and submit to the Fund only aggregate orders combining the transactions of many beneficial owners. The Fund itself generally cannot monitor trading by particular beneficial owners. The Fund has notified
Intermediaries in writing that it expects the Intermediaries to impose restrictions on transfers by beneficial owners. Intermediaries may impose different or stricter restrictions on transfers by beneficial owners.
Consistent with the restrictions described above, investments in the Fund through retirement programs administered by Prudential Retirement will be similarly identified for frequent purchases and redemptions and
appropriately restricted.
| 54 | Prudential Income Builder Fund |
The Transfer Agent also reviews
the aggregate net flows in excess of $1 million. In those cases, the trade detail is reviewed to determine if any of the activity relates to potential offenders. In cases of omnibus orders, the Intermediary may be
contacted by the Transfer Agent to obtain additional information. The Transfer Agent has the authority to cancel all or a portion of the trade if the information reveals that the activity relates to potential
offenders. Where appropriate, the Transfer Agent may request that the Intermediary block a financial adviser or client from accessing the Fund. If necessary, the Fund may be removed from a particular Intermediary's
platform.
Shareholders seeking to engage in
frequent trading activities may use a variety of strategies to avoid detection and, despite the efforts of the Fund to prevent such trading, there is no guarantee that the Fund, the Transfer Agent or Intermediaries
will be able to identify these shareholders or curtail their trading practices. The Fund does not have any arrangements intended to permit trading of its shares in contravention of the policies described above.
Telephone Redemptions or
Exchanges
You may redeem your shares of the
Fund if the proceeds of the redemption do not exceed $100,000 or exchange your shares in any amount by calling the Fund at (800) 225-1852 and communicating your instructions in good order to a customer service
representative before 4:00 p.m. Eastern time. You will receive a redemption or exchange amount based on that day's NAV. Certain restrictions apply; please see the section entitled “How to Sell Your
Shares—Restrictions on Sales” above for additional information. In the event that regular trading on the NYSE closes before 4:00 p.m. Eastern time, you will receive the following day's NAV if your order to
sell or exchange is received after the close of regular trading on the NYSE.
The Transfer Agent will record
your telephone instructions and request specific account information before redeeming or exchanging shares. The Fund will not be liable for losses due to unauthorized or fraudulent telephone instructions if it follows
instructions that it reasonably believes are made by the shareholder. If the Fund does not follow reasonable procedures, it may be liable.
In the event of drastic economic
or market changes, you may have difficulty in redeeming or exchanging your shares by telephone. If this occurs, you should consider redeeming or exchanging your shares by mail or through your broker.
The telephone redemption and
exchange procedures may be modified or terminated at any time. If this occurs, you will receive a written notice from the Fund.
Expedited Redemption Privilege
If you have selected the Expedited
Redemption Privilege, you may have your redemption proceeds sent directly to your bank account. Expedited redemption requests may be made by telephone or letter, must be received by the Transfer Agent prior to 4:00
p.m. Eastern time to receive a redemption amount based on that day's NAV and are subject to the terms and conditions regarding the redemption of shares. In the event that regular trading on the NYSE closes before 4:00
p.m. Eastern time, you will receive the following day's NAV if your order to sell is received after the close of regular trading on the NYSE. For more information, see the SAI. The Expedited Redemption Privilege may
be modified or terminated at any time without notice.
| Visit our website at www.prudentialfunds.com | 55 |
FINANCIAL HIGHLIGHTS
Introduction
The financial
highlights will help you evaluate the Fund's financial performance for the fiscal period from August 1, 2014 through October 31, 2014 and the fiscal years ended July 31, 2014, 2013, 2012, 2011, and 2010.
Certain information reflects financial results for a single fund share. The total return in each chart represents the rate that a shareholder would have earned (or lost) on an investment in the Fund, assuming
investment at the start of the period and reinvestment of all dividends and other distributions. The information is for the periods indicated.
A copy of the Fund's annual
report, along with the Fund's audited financial statements and report of independent registered public accounting firm, is available upon request, at no charge, as described on the back cover of this Prospectus.
The financial highlights were
derived from the financial statements audited by KPMG LLP, independent registered public accounting firm, whose report on those financial statements was unqualified.
Note: Effective
September 23, 2014, the Fund’s investment objective, strategies and policies were changed and QMA, Jennison, PFI and PREI became the subadvisers to the Fund. The financial highlights below for periods prior to
September 23, 2014 are attributable to the Fund’s prior investment strategies and prior subadvisers.
PRUDENTIAL INCOME BUILDER FUND
(formerly known as TARGET CONSERVATIVE ALLOCATION FUND)
| 56 | Prudential Income Builder Fund |
| Class A Shares | ||||||
| Three Months Ended October 31, 2014(b)(f) |
Year Ended July 31, | |||||
| 2014(b) | 2013(b) | 2012(b) | 2011(b) | 2010(b) | ||
| Per Share Operating Performance: | ||||||
| Net Asset Value, Beginning Of Period | $11.78 | $11.55 | $10.69 | $10.30 | $9.53 | $8.48 |
| Income (loss) from investment operations: | ||||||
| Net investment income | .05 | .05 | .14 | .17 | .16 | .18 |
| Net realized and unrealized gain on investments | .14 | .89 | .86 | .38 | .79 | .90 |
| Total from investment operations | .19 | .94 | 1.00 | .55 | .95 | 1.08 |
| Less Dividends and Distributions: | ||||||
| Dividends from net investment income | (.07) | (.12) | (.14) | (.16) | (.18) | (.03) |
| Distributions from net realized gains | – | (.59) | – | – | – | – |
| Total dividends and distributions | (.07) | (.71) | (.14) | (.16) | (.18) | (.03) |
| Net asset value, end of period | $11.90 | $11.78 | $11.55 | $10.69 | $10.30 | $9.53 |
| Total Return(a) | 1.63% | 8.37% | 9.41% | 5.53% | 10.04% | 12.72% |
| Ratios/Supplemental Data: | ||||||
| Net assets, end of period (000) | $84,863 | $85,292 | $86,386 | $86,352 | $86,746 | $75,228 |
| Average net assets (000) | $84,889 | $86,591 | $85,636 | $84,243 | $83,395 | $70,865 |
| Ratios to average net assets(c): | ||||||
| Expenses after waivers and/or expense reimbursement | 1.03%(d) | 1.51% | 1.52% | 1.54% | 1.52% | 1.52% |
| Expenses before waivers and/or expense reimbursement | 1.92%(d) | 1.56% | 1.57% | 1.59% | 1.57% | 1.57% |
| Net investment income | 1.58%(d) | .43% | 1.25% | 1.64% | 1.59% | 2.00% |
| Portfolio turnover rate | 140%(e) | 478% | 210% | 248% | 188% | 200% |
(a) Total return does not
consider the effects of sales loads. Total return is calculated assuming a purchase of a share on the first day and a sale on the last day of each period reported and includes reinvestment of dividends and
distributions. Total returns may reflect adjustments to conform to generally accepted accounting principles. Total returns for periods less than one full year are not annualized.
(b) Calculated based upon the average shares
outstanding during the period.
(c) Does not include expenses of the
underlying portfolios in which the Fund invests.
(d)
Annualized.
(e) Not annualized.
(f) For the three month period ended October
31, 2014. The Fund changed its fiscal year end from July 31 to October 31, effective October 31, 2014.
| Visit our website at www.prudentialfunds.com | 57 |
| Class B Shares | ||||||
| Three Months Ended October 31, 2014(b)(f) |
Year Ended July 31, | |||||
| 2014(b) | 2013(b) | 2012(b) | 2011(b) | 2010(b) | ||
| Per Share Operating Performance: | ||||||
| Net Asset Value, Beginning Of Period | $11.59 | $11.38 | $10.54 | $10.15 | $9.41 | $8.43 |
| Income (loss) from investment operations: | ||||||
| Net investment income | .02 | (.04) | .06 | .09 | .08 | .11 |
| Net realized and unrealized gain on investments | .15 | .88 | .84 | .39 | .78 | .89 |
| Total from investment operations | .17 | .84 | .90 | .48 | .86 | 1.00 |
| Less Dividends and Distributions: | ||||||
| Dividends from net investment income | (.02) | (.04) | (.06) | (.09) | (.12) | (.02) |
| Distributions from net realized gains | – | (.59) | – | – | – | – |
| Total dividends and distributions | (.02) | (.63) | (.06) | (.09) | (.12) | (.02) |
| Net asset value, end of period | $11.74 | $11.59 | $11.38 | $10.54 | $10.15 | $9.41 |
| Total Return(a) | 1.47% | 7.52% | 8.57% | 4.86% | 9.20% | 11.82% |
| Ratios/Supplemental Data: | ||||||
| Net assets, end of period (000) | $4,810 | $5,180 | $6,012 | $7,856 | $13,995 | $23,212 |
| Average net assets (000) | $5,005 | $5,826 | $6,958 | $10,840 | $18,900 | $28,746 |
| Ratios to average net assets(c): | ||||||
| Expenses after waivers and/or expense reimbursement | 1.78%(d) | 2.26% | 2.27% | 2.29% | 2.27% | 2.27% |
| Expenses before waivers and/or expense reimbursement | 2.59%(d) | 2.26% | 2.27% | 2.29% | 2.27% | 2.27% |
| Net investment income (loss) | .80%(d) | (.31)% | .52% | .93% | .82% | 1.26% |
| Portfolio turnover rate | 140%(e) | 478% | 210% | 248% | 188% | 200% |
(a) Total return does not
consider the effects of sales loads. Total return is calculated assuming a purchase of a share on the first day and a sale on the last day of each period reported and includes reinvestment of dividends and
distributions. Total returns may reflect adjustments to conform to generally accepted accounting principles. Total returns for periods less than one full year are not annualized.
(b) Calculated based upon the average shares
outstanding during the period.
(c) Does not include expenses of the
underlying portfolios in which the Fund invests.
(d)
Annualized.
(e) Not annualized.
(f) For the three month period ended October
31, 2014. The Fund changed its fiscal year end from July 31 to October 31, effective October 31, 2014.
| 58 | Prudential Income Builder Fund |
| Class C Shares | ||||||
| Three Months Ended October 31, 2014(b)(f) |
Year Ended July 31, | |||||
| 2014(b) | 2013(b) | 2012(b) | 2011(b) | 2010(b) | ||
| Per Share Operating Performance: | ||||||
| Net Asset Value, Beginning Of Period | $11.59 | $11.38 | $10.54 | $10.15 | $9.41 | $8.43 |
| Income (loss) from investment operations: | ||||||
| Net investment income (loss) | .02 | (.04) | .06 | .09 | .08 | .11 |
| Net realized and unrealized gain on investments | .15 | .88 | .84 | .39 | .78 | .89 |
| Total from investment operations | .17 | .84 | .90 | .48 | .86 | 1.00 |
| Less Dividends and Distributions: | ||||||
| Dividends from net investment income | (.02) | (.04) | (.06) | (.09) | (.12) | (.02) |
| Distributions from net realized gains | – | (.59) | – | – | – | – |
| Total dividends and distributions | (.02) | (.63) | (.06) | (.09) | (.12) | (.02) |
| Net asset value, end of period | $11.74 | $11.59 | $11.38 | $10.54 | $10.15 | $9.41 |
| Total Return(a) | 1.47% | 7.53% | 8.57% | 4.86% | 9.20% | 11.82% |
| Ratios/Supplemental Data: | ||||||
| Net assets, end of period (000) | $17,474 | $17,887 | $17,217 | $17,307 | $19,133 | $20,499 |
| Average net assets (000) | $17,513 | $17,793 | $17,251 | $17,651 | $20,208 | $21,746 |
| Ratios to average net assets(c): | ||||||
| Expenses after waivers and/or expense reimbursement | 1.78%(d) | 2.26% | 2.27% | 2.29% | 2.27% | 2.27% |
| Expenses before waivers and/or expense reimbursement | 2.61%(d) | 2.26% | 2.27% | 2.29% | 2.27% | 2.27% |
| Net investment income (loss) | .82%(d) | (.32)% | .51% | .89% | .83% | 1.26% |
| Portfolio turnover rate | 140%(e) | 478% | 210% | 248% | 188% | 200% |
(a) Total return does not
consider the effects of sales loads. Total return is calculated assuming a purchase of a share on the first day and a sale on the last day of each period reported and includes reinvestment of dividends and
distributions. Total returns may reflect adjustments to conform to generally accepted accounting principles. Total returns for periods less than one full year are not annualized.
(b) Calculated based upon the average shares
outstanding during the period.
(c) Does not include expenses of the
underlying portfolios in which the Fund invests.
(d)
Annualized.
(e) Not annualized.
(f) For the three month period ended October
31, 2014. The Fund changed its fiscal year end from July 31 to October 31, effective October 31, 2014.
| Visit our website at www.prudentialfunds.com | 59 |
| Class R Shares | ||||||
| Three Months Ended October 31, 2014(b)(f) |
Year Ended July 31, | |||||
| 2014(b) | 2013(b) | 2012(b) | 2011(b) | 2010(b) | ||
| Per Share Operating Performance: | ||||||
| Net Asset Value, Beginning Of Period | $11.75 | $11.52 | $10.67 | $10.28 | $9.51 | $8.48 |
| Income (loss) from investment operations: | ||||||
| Net investment income | .04 | .02 | .11 | .14 | .13 | .16 |
| Net realized and unrealized gain on investments | .15 | .89 | .85 | .39 | .80 | .89 |
| Total from investment operations | .19 | .91 | .96 | .53 | .93 | 1.05 |
| Less Dividends and Distributions: | ||||||
| Dividends from net investment income | (.05) | (.09) | (.11) | (.14) | (.16) | (.02) |
| Distributions from net realized gains | – | (.59) | – | – | – | – |
| Total dividends and distributions | (.05) | (.68) | (.11) | (.14) | (.16) | (.02) |
| Net asset value, end of period | $11.89 | $11.75 | $11.52 | $10.67 | $10.28 | $9.51 |
| Total Return(a) | 1.60% | 8.13% | 9.07% | 5.29% | 9.84% | 12.44% |
| Ratios/Supplemental Data: | ||||||
| Net assets, end of period (000) | $393 | $288 | $167 | $231 | $232 | $687 |
| Average net assets (000) | $347 | $275 | $196 | $219 | $669 | $686 |
| Ratios to average net assets(c): | ||||||
| Expenses after waivers and/or expense reimbursement | 1.25%(d) | 1.76% | 1.77% | 1.79% | 1.77% | 1.77% |
| Expenses before waivers and/or expense reimbursement | 2.45%(d) | 2.01% | 2.02% | 2.04% | 2.02% | 2.02% |
| Net investment income | 1.45%(d) | .19% | 1.04% | 1.39% | 1.29% | 1.76% |
| Portfolio turnover rate | 140%(e) | 478% | 210% | 248% | 188% | 200% |
(a) Total return is
calculated assuming a purchase of a share on the first day and a sale on the last day of each period reported and includes reinvestment of dividends and distributions. Total returns may reflect adjustments to conform
to generally accepted accounting principles. Total returns for periods less than one full year are not annualized.
(b) Calculated based upon the average shares
outstanding during the period.
(c) Does not include expenses of the
underlying portfolios in which the Fund invests.
(d)
Annualized.
(e) Not annualized.
(f) For the three month period ended October
31, 2014. The Fund changed its fiscal year end from July 31 to October 31, effective October 31, 2014.
| 60 | Prudential Income Builder Fund |
| Class Z Shares | ||||||
| Three Months Ended October 31, 2014(b)(f) |
Year Ended July 31, | |||||
| 2014(b) | 2013(b) | 2012(b) | 2011(b) | 2010(b) | ||
| Per Share Operating Performance: | ||||||
| Net Asset Value, Beginning Of Period | $11.85 | $11.62 | $10.75 | $10.35 | $9.57 | $8.50 |
| Income (loss) from investment operations: | ||||||
| Net investment income | .06 | .08 | .17 | .20 | .19 | .21 |
| Net realized and unrealized gain on investments | .15 | .89 | .87 | .39 | .79 | .89 |
| Total from investment operations | .21 | .97 | 1.04 | .59 | .98 | 1.10 |
| Less Dividends and Distributions: | ||||||
| Dividends from net investment income | (.10) | (.15) | (.17) | (.19) | (.20) | (.03) |
| Distributions from net realized gains | – | (.59) | – | – | – | – |
| Total dividends and distributions | (.10) | (.74) | (.17) | (.19) | (.20) | (.03) |
| Net asset value, end of period | $11.96 | $11.85 | $11.62 | $10.75 | $10.35 | $9.57 |
| Total Return(a) | 1.74% | 8.59% | 9.72% | 5.85% | 10.31% | 12.97% |
| Ratios/Supplemental Data: | ||||||
| Net assets, end of period (000) | $5,965 | $5,287 | $3,178 | $3,717 | $3,921 | $2,877 |
| Average net assets (000) | $5,426 | $4,306 | $3,181 | $4,379 | $3,567 | $3,031 |
| Ratios to average net assets(c): | ||||||
| Expenses after waivers and/or expense reimbursement | .77%(d) | 1.26% | 1.27% | 1.29% | 1.27% | 1.27% |
| Expenses before waivers and/or expense reimbursement | 1.64%(d) | 1.26% | 1.27% | 1.29% | 1.27% | 1.27% |
| Net investment income | 1.87%(d) | .69% | 1.51% | 1.90% | 1.84% | 2.26% |
| Portfolio turnover rate | 140%(e) | 478% | 210% | 248% | 188% | 200% |
(a) Total return is
calculated assuming a purchase of a share on the first day and a sale on the last day of each period reported and includes reinvestment of dividends and distributions. Total returns may reflect adjustments to conform
to generally accepted accounting principles. Total returns for periods less than one full year are not annualized.
(b) Calculated based upon the average shares
outstanding during the period.
(c) Does not include expenses of the
underlying portfolios in which the Fund invests.
(d)
Annualized.
(e) Not annualized.
(f) For the three month period ended October
31, 2014. The Fund changed its fiscal year end from July 31 to October 31, effective October 31, 2014.
| Visit our website at www.prudentialfunds.com | 61 |
GLOSSARY
FUND INDEXES
Standard & Poor's 500
Index. The Standard & Poor's 500 Index (S&P 500 Index) is an unmanaged index of 500 stocks of large US public companies. It gives a broad look at how stock prices in the United States
have performed. These returns do not include the effect of any sales charges, operating expenses of a mutual fund or taxes. These returns would be lower if they included the effect of these expenses.
Barclays US
Aggregate Bond Index. The Barclays US Aggregate Bond Index represents an unmanaged diversified portfolio of fixed income securities, including US Treasuries, investment-grade corporate bonds and mortgage-backed
and asset-backed securities. These returns do not include the effect of any sales charges, mutual fund operating expenses or taxes. These returns would be lower if they included the effect of these expenses.
Lipper Average. The Lipper Average for Prudential Income Builder Fund is based on the returns of all mutual funds in the Lipper Flexible Portfolio Funds category. Returns do not include the effect of any
sales charges or taxes. Returns would be lower if sales charges or taxes were reflected.
| 62 | Prudential Income Builder Fund |
This page intentionally left blank
| FOR MORE INFORMATION Please read this Prospectus before you invest in the Fund and keep it for future reference. For information or shareholder questions contact: | |
| ■ MAIL Prudential Mutual Fund Services LLC PO Box 9658 Providence, RI 02940■ WEBSITE www.prudentialfunds.com |
■ TELEPHONE (800) 225-1852 (973) 367-3529 (from outside the US) |
| ■ E-DELIVERY To receive your mutual fund documents on-line, go to www.prudentialfunds.com/edelivery and enroll. Instead of receiving printed documents by mail, you will receive notification via email when new materials are available. You can cancel your enrollment or change your email address at any time by visiting the website address above. |
| You can also obtain copies of Fund documents from the Securities and Exchange Commission as follows (the SEC charges a fee to copy documents): | |
| ■ MAIL Securities and Exchange Commission Public Reference Section 100 F Street, NE Washington, DC 20549-1520■ ELECTRONIC REQUEST publicinfo@sec.gov |
■ IN PERSON Public Reference Room located at 100 F Street, NE in Washington, DC For hours of operation, call (202) 551-8090■ VIA THE INTERNET on the EDGAR Database at www.sec.gov |
| The Annual and Semi-Annual Reports and the SAI contain additional information about the Fund. Shareholders may obtain free copies of the SAI, Annual Report and Semi-Annual Report as well as other information about the Fund and may make other shareholder inquiries through the telephone number, address and website listed above. | |
| ■ STATEMENT OF ADDITIONAL INFORMATION (SAI) (incorporated by reference into this Prospectus) ■ SEMI-ANNUAL REPORT |
■ ANNUAL REPORT (contains a discussion of the market conditions and investment strategies that significantly affected the Fund's performance during the last fiscal year) |
| Prudential Income Builder Fund | |||||
| Share Class | A | B | C | R | Z |
| NASDAQ | PCGAX | PBCFX | PCCFX | PCLRX | PDCZX |
| CUSIP | 74442X108 | 74442X207 | 74442X306 | 74442X405 | 74442X504 |
| MFSP504STAT | The Fund's Investment Company Act File No. 811-08915 |

PRUDENTIAL
INVESTMENTS » MUTUAL FUNDS
Prudential Income
Builder Fund
STATEMENT OF
ADDITIONAL INFORMATION • December 26, 2014

MFSP504B
Table of Contents
PART I
INTRODUCTION
This SAI sets forth information
about Prudential Income Builder Fund (the Fund), which is one of the funds that comprise Prudential Investment Portfolios 16 (PIP 16). It provides information about certain of the securities, instruments, policies and
strategies that are used by the Fund in seeking to achieve its objectives. This SAI also provides additional information about the Fund’s Board of Trustees, the advisory services provided to and the management
fees paid by the Fund, and information about other fees paid by and services provided to the Fund.
In addition to the
Fund, Prudential Defensive Equity Fund is also a series of PIP 16. Prudential Defensive Equity Fund is offered pursuant to a separate prospectus and a separate SAI.
Note: Prior to September 23, 2014,
the Fund had a different investment objective, different investment policies and strategies and subadvisers, and was known as Target Conservative Allocation Fund.
PIP 16 is an open-end management
investment company. The Fund is a diversified registered investment company.
The principal investment policies
and strategies of the Fund are described in the Fund’s prospectus. In addition, the Fund may from time to time use the securities, instruments, policies and strategies that are further described below in seeking
its objectives. The Fund also may invest from time to time in certain types of investments and strategies that are not listed below. The Fund may not be successful in achieving its objective and you could lose
money.
This SAI should be read in
conjunction with the Prospectus for the Fund.
Before reading the SAI, you should
consult the Glossary below, which defines certain of the terms used in the SAI:
GLOSSARY
| Term | Definition |
| ADR | American Depositary Receipt |
| ADS | American Depositary Share |
| Board | Fund’s Board of Directors or Trustees |
| Board Member | A trustee or director of the Fund’s Board |
| CFTC | US Commodity Futures Trading Commission |
| Code | Internal Revenue Code of 1986, as amended |
| CDO | Collateralized Debt Obligation |
| CMO | Collateralized Mortgage Obligation |
| ETF | Exchange-Traded Fund |
| EDR | European Depositary Receipt |
| Fannie Mae | Federal National Mortgage Association |
| FDIC | Federal Deposit Insurance Corporation |
| Fitch | Fitch, Inc. |
| Freddie Mac | Federal Home Loan Mortgage Corporation |
| GDR | Global Depositary Receipt |
| Ginnie Mae | Government National Mortgage Association |
| IPO | Initial Public Offering |
| IRS | Internal Revenue Service |
| 1933 Act | Securities Act of 1933, as amended |
| 1934 Act | Securities Exchange Act of 1934, as amended |
| 1940 Act | Investment Company Act of 1940, as amended |
| 1940 Act Laws, Interpretations and Exemptions | Exemptive order, SEC release, no-action letter or similar relief or interpretations, collectively |
| LIBOR | London Interbank Offered Rate |
3
| Term | Definition |
| Manager or PI | Prudential Investments LLC |
| Moody’s | Moody’s Investor Services, Inc. |
| NASDAQ | National Association of Securities Dealers Automated Quotations System |
| NAV | Net Asset Value |
| NYSE | New York Stock Exchange |
| OTC | Over the Counter |
| Prudential | Prudential Financial, Inc. |
| PMFS | Prudential Mutual Fund Services LLC |
| REIT | Real Estate Investment Trust |
| RIC | Regulated Investment Company, as the term is used in the Internal Revenue Code of 1986, as amended |
| S&P | Standard & Poor’s Corporation |
| SEC | US Securities & Exchange Commission |
| World Bank | International Bank for Reconstruction and Development |
FUND CLASSIFICATION, INVESTMENT
Objective & POLICIES
The investment objective of
Prudential Income Builder Fund is to seek income and long-term capital growth. The Fund is diversified.
The following section discusses
certain types of investments and investment strategies that the Fund may use, including explanations of these investments and investment strategies, as well as the risks and considerations associated with these
investments and investment strategies. The Fund also may invest from time to time in certain types of investments and investment strategies that are not discussed or otherwise identified.
In addition, the discussion
includes investments and investment strategies that may be used by the Underlying Prudential Funds and ETFs in which the Fund invests. References in the discussion to the “subadviser” include all the
Fund’s subadvisers unless otherwise specified.
INVESTMENT RISKS AND
CONSIDERATIONS
Set forth below are descriptions of
some of the types of investments and investment strategies that the Fund may use and the risks and considerations associated with those investments and investment strategies. Please also see the Prospectus of the Fund
and the “Fund Classification, Investment Objectives & Policies” section of this SAI.
ASSET-BACKED SECURITIES. Asset-backed securities directly or indirectly represent a participation interest in, or are secured by and payable from, a stream of payments generated by particular assets such as motor
vehicle or credit card receivables. Payments of principal and interest may be guaranteed up to certain amounts and for a certain time period by a letter of credit issued by a financial institution unaffiliated with
the entities issuing the securities. Asset-backed securities may be classified as pass-through certificates or collateralized obligations.
Pass-through certificates are
asset-backed securities which represent an undivided fractional ownership interest in an underlying pool of assets. Pass-through certificates usually provide for payments of principal and interest received to be
passed through to their holders, usually after deduction for certain costs and expenses incurred in administering the pool. Because pass-through certificates represent an ownership interest in the underlying assets,
the holders thereof bear directly the risk of any defaults by the obligors on the underlying assets not covered by any credit support.
Asset-backed securities issued in
the form of debt instruments include collateralized bond obligations (“CBOs”), collateralized loan obligations (“CLOs”), other CDOs and other similarly structured securities. A CBO is a trust
which is often backed by a diversified pool of high risk, below investment grade fixed income securities. The collateral can be from many different types of fixed income securities such as high yield debt, residential
privately issued mortgage-related securities, commercial privately issued mortgage-related securities, trust preferred securities and emerging market debt. A CLO is a trust typically collateralized by a pool of loans,
which may include, among others, domestic and foreign senior secured loans, senior unsecured loans, and subordinate corporate loans, including loans that may be rated below investment grade or equivalent unrated
loans. Other CDOs are trusts backed by other types of assets representing obligations of various parties. CBOs, CLOs and other CDOs may charge management fees and administrative expenses.
4
For CBOs, CLOs and other CDOs, the
cash flows from the trust are split into two or more portions, called tranches, varying in risk and yield. The riskiest portion is the “equity” tranche which bears the bulk of defaults from the bonds or
loans in the trust and serves to protect the other, more senior tranches from default in all but the most severe circumstances. Since they are partially protected from defaults, senior tranches from a CBO trust, CLO
trust or trust of another CDO typically have higher ratings and lower yields than their underlying securities, and can be rated investment grade. Despite the protection from the equity tranche, CBO, CLO or other CDO
tranches can experience substantial losses due to actual defaults, increased sensitivity to defaults due to collateral default and disappearance of protecting tranches, market anticipation of defaults, as well as
aversion to CBO, CLO or other CDO securities as a class.
The risks of an investment in a
CBO, CLO or other CDO depend largely on the type of the collateral securities and the class of the instrument in which the Fund invests. Normally, CBOs, CLOs and other CDOs are privately offered and sold, and thus,
are not registered under the securities laws. As a result, investments in CBOs, CLOs and other CDOs may be characterized by the Fund as illiquid securities; however, an active dealer market may exist for CBOs, CLOs
and other CDOs, allowing them to qualify for Rule 144A transactions. In addition to the normal risks associated with fixed income securities discussed elsewhere in this SAI and the Fund’s Prospectus (e.g.,
interest rate risk and default risk), CBOs, CLOs and other CDOs carry additional risks including, but not limited to: (i) the possibility that distributions from collateral securities will not be adequate to make
interest or other payments; (ii) the possibility that the quality of the collateral may decline in value or default; (iii) the risk that the Fund may invest in CBOs, CLOs or other CDOs that are subordinate to other
classes; and (iv) the risk that the complex structure of the security may not be fully understood at the time of investment and may produce disputes with the issuer or unexpected investment results.
ASSET-BASED SECURITIES. The Fund may invest in debt, preferred or convertible securities, the principal amount, redemption terms or conversion terms of which are related to the market price of some natural
resource asset such as gold bullion. These securities are referred to as “asset-based securities.” The Fund will purchase asset-based securities only if they are rated, or are issued by issuers that have
outstanding debt obligations rated investment grade (i.e., AAA, AA, A or BBB by S&P or Fitch or Aaa, Aa, A or Baa by Moody’s or commercial paper rated A-1 by S&P or Prime-1 by Moody’s) or of
issuers that the subadviser has determined to be of similar creditworthiness. Obligations ranked in the fourth highest rating category, while considered “investment grade,” may have certain speculative
characteristics. If the asset-based security is backed by a bank letter of credit or other similar facility, the subadviser may take such backing into account in determining the creditworthiness of the issuer. While
the market prices for an asset-based security and the related natural resource asset generally are expected to move in the same direction, there may not be perfect correlation in the two price movements. Asset-based
securities may not be secured by a security interest in or claim on the underlying natural resource assets and do not represent an interest in the referenced assets. Certain asset-based securities may be
illiquid.
The asset-based securities in which
the Fund may invest may bear interest or pay preferred dividends at below market (or even relatively nominal) rates. As an example, assume gold is selling at a market price of $300 per ounce and an issuer sells a
$1,000 face amount gold-related note with a seven-year maturity, payable at maturity at the greater of either $1,000 in cash or the then market price of three ounces of gold. If at maturity, the market price of gold
is $400 per ounce, the amount payable on the note would be $1,200. Certain asset-based securities may be payable at maturity in cash at the stated principal amount or, at the option of the holder, directly in a stated
amount of the asset to which it is related. In such instance, because the Fund does not presently intend to invest directly in natural resource assets, the Fund may sell the asset-based security in the secondary
market, to the extent one exists, prior to maturity if the value of the stated amount of the asset exceeds the stated principal amount and thereby realize the appreciation in the underlying asset.
PRECIOUS METAL-RELATED SECURITIES.
The Fund may invest in the equity securities of companies that explore for, extract, process or deal in precious metals, e.g., gold, silver and platinum, and in asset-based securities
indexed to the value of such metals. Such securities may be purchased when they are believed to be attractively priced in relation to the value of a company's precious metal-related assets or when the values of
precious metals are expected to benefit from inflationary pressure or other economic, political or financial uncertainty or instability. Based on historical experience, during periods of economic or financial
instability the securities of companies involved in precious metals may be subject to extreme price fluctuations, reflecting the high volatility of precious metal prices during such periods. In addition, the
instability of precious metal prices may result in volatile earnings of precious metal-related companies, which may, in turn, adversely affect the financial condition of such companies.
The major producers of gold include
the Republic of South Africa, Russia, Canada, the United States, Brazil and Australia. Sales of gold by Russia are largely unpredictable and often relate to political and economic considerations rather than to market
forces. Economic, financial, social and political factors within South Africa may significantly affect South African gold production.
BORROWING AND LEVERAGE. Unless noted otherwise, the Fund may borrow up to 33 1⁄3% of the value of its total assets (calculated at the time of the borrowing). The Fund may pledge up to 33 1⁄3% of its total assets to secure these borrowings. If the Fund’s asset coverage for borrowings falls below 300%, the Fund will take prompt action to reduce borrowings. If the Fund
borrows to invest in
5
securities, any investment gains made on the
securities in excess of interest paid on the borrowing will cause the NAV of the shares to rise faster than would otherwise be the case. On the other hand, if the investment performance of the additional securities
purchased fails to cover their cost (including any interest paid on the money borrowed) to the Fund, the NAV of the Fund’s shares will decrease faster than would otherwise be the case. This is the speculative
factor known as “leverage.” In addition, the Fund may use certain investment management techniques (collectively, “effective leverage”), such as certain derivatives, that may provide
leverage.
The Fund may borrow from time to
time, at the discretion of the subadviser, to take advantage of investment opportunities, when yields on available investments exceed interest rates and other expenses of related borrowing, or when, in the
subadviser's opinion, unusual market conditions otherwise make it advantageous for the Fund to increase its investment capacity. The Fund will only borrow when there is an expectation that it will benefit the Fund
after taking into account considerations such as interest income and possible losses upon liquidation. Borrowing by the Fund creates an opportunity for increased net income but, at the same time, creates risks,
including the fact that leverage may exaggerate changes in the NAV of Fund shares and in the yield on the Fund. Unless otherwise stated, the Fund may borrow through forward rolls, dollar rolls or reverse repurchase
agreements.
CONVERTIBLE SECURITIES. The Fund may invest in convertible securities. Convertible securities entitle the holder to receive interest payments paid on corporate debt securities or the dividend preference on a
preferred stock until such time as the convertible security matures or is redeemed or until the holder elects to exercise the conversion privilege.
The characteristics of convertible
securities make them appropriate investments for an investment company seeking long-term capital appreciation and/or total return. These characteristics include the potential for capital appreciation as the value of
the underlying common stock increases, the relatively high yield received from dividend or interest payments as compared to common stock dividends and decreased risks of decline in value relative to the underlying
common stock due to their fixed-income nature. As a result of the conversion feature, however, the interest rate or dividend preference on a convertible security is generally less than would be the case if the
securities were issued in nonconvertible form.
In analyzing convertible
securities, the subadviser will consider both the yield on the convertible security relative to its credit quality and the potential capital appreciation that is offered by the underlying common stock, among other
things.
Convertible securities are issued
and traded in a number of securities markets. Even in cases where a substantial portion of the convertible securities held by the Fund are denominated in US dollars, the underlying equity securities may be quoted in
the currency of the country where the issuer is domiciled. With respect to convertible securities denominated in a currency different from that of the underlying equity securities, the conversion price may be based on
a fixed exchange rate established at the time the security is issued. As a result, fluctuations in the exchange rate between the currency in which the debt security is denominated and the currency in which the share
price is quoted will affect the value of the convertible security. As described below, the Fund is authorized to enter into foreign currency hedging transactions in which the Fund may seek to reduce the effect of such
fluctuations.
Apart from currency considerations,
the value of convertible securities is influenced by both the yield of nonconvertible securities of comparable issuers and by the value of the underlying common stock. The value of a convertible security viewed
without regard to its conversion feature (i.e., strictly on the basis of its yield) is sometimes referred to as its “investment value.” To the extent interest rates change, the investment value of the
convertible security typically will fluctuate. However, at the same time, the value of the convertible security will be influenced by its “conversion value,” which is the market value of the underlying
common stock that would be obtained if the convertible security were converted. Conversion value fluctuates directly with the price of the underlying common stock. If, because of a low price of the common stock, the
conversion value is substantially below the investment value of the convertible security, the price of the convertible security is governed principally by its investment value.
To the extent the conversion value
of a convertible security increases to a point that approximates or exceeds its investment value, the price of the convertible security will be influenced principally by its conversion value. A convertible security
will sell at a premium over the conversion value to the extent investors place value on the right to acquire the underlying common stock while holding a fixed-income security. The yield and conversion premium of
convertible securities issued in Japan and the Euromarket are frequently determined at levels that cause the conversion value to affect their market value more than the securities' investment value.
Holders of convertible securities
generally have a claim on the assets of the issuer prior to the common stockholders but may be subordinated to other debt securities of the same issuer. A convertible security may be subject to redemption at the
option of the issuer at a price established in the charter provision, indenture or other governing instrument pursuant to which the convertible security was issued. If a convertible security held by the Fund is called
for redemption, the Fund will be required to redeem the security, convert it into the underlying common stock or sell it to a third party. Certain convertible debt securities may provide a put option to the holder,
which entitles the holder to cause the security to be redeemed by the issuer at a premium over the stated principal amount of the debt security under certain circumstances.
6
Synthetic convertible securities
may be either (i) a debt security or preferred stock that may be convertible only under certain contingent circumstances or that may pay the holder a cash amount based on the value of shares of underlying common stock
partly or wholly in lieu of a conversion right (a “Cash-Settled Convertible”), (ii) a combination of separate securities chosen by the subadviser in order to create the economic characteristics of a
convertible security, i.e., a fixed income security paired with a security with equity conversion features, such as an option or warrant (a “Manufactured Convertible”) or (iii) a synthetic security
manufactured by another party.
Synthetic convertible securities
may include either Cash-Settled Convertibles or Manufactured Convertibles. Cash-Settled Convertibles are instruments that are created by the issuer and have the economic characteristics of traditional convertible
securities but may not actually permit conversion into the underlying equity securities in all circumstances. As an example, a private company may issue a Cash-Settled Convertible that is convertible into common stock
only if the company successfully completes a public offering of its common stock prior to maturity and otherwise pays a cash amount to reflect any equity appreciation. Manufactured Convertibles are created by the
subadviser by combining separate securities that possess one of the two principal characteristics of a convertible security, i.e., fixed income (“fixed income component”) or a right to acquire equity
securities (“convertibility component”). The fixed income component is achieved by investing in nonconvertible fixed income securities, such as nonconvertible bonds, preferred stocks and money market
instruments. The convertibility component is achieved by investing in call options, warrants, or other securities with equity conversion features (“equity features”) granting the holder the right to
purchase a specified quantity of the underlying stocks within a specified period of time at a specified price or, in the case of a stock index option, the right to receive a cash payment based on the value of the
underlying stock index.
A Manufactured Convertible differs
from traditional convertible securities in several respects. Unlike a traditional convertible security, which is a single security having a unitary market value, a Manufactured Convertible is comprised of two or more
separate securities, each with its own market value. Therefore, the total “market value” of such a Manufactured Convertible is the sum of the values of its fixed-income component and its convertibility
component.
More flexibility is possible in the
creation of a Manufactured Convertible than in the purchase of a traditional convertible security. Because many corporations have not issued convertible securities, the subadviser may combine a fixed income instrument
and an equity feature with respect to the stock of the issuer of the fixed income instrument to create a synthetic convertible security otherwise unavailable in the market. The subadviser may also combine a fixed
income instrument of an issuer with an equity feature with respect to the stock of a different issuer when the subadviser believes such a Manufactured Convertible would better promote the Fund’s objective(s)
than alternate investments. For example, the subadviser may combine an equity feature with respect to an issuer's stock with a fixed income security of a different issuer in the same industry to diversify the
Fund’s credit exposure, or with a US Treasury instrument to create a Manufactured Convertible with a higher credit profile than a traditional convertible security issued by that issuer. A Manufactured
Convertible also is a more flexible investment in that its two components may be purchased separately and, upon purchasing the separate securities, “combined” to create a Manufactured Convertible. For
example, the Fund may purchase a warrant for eventual inclusion in a Manufactured Convertible while postponing the purchase of a suitable bond to pair with the warrant pending development of more favorable market
conditions.
The value of a Manufactured
Convertible may respond differently to certain market fluctuations than would a traditional convertible security with similar characteristics. For example, in the event the Fund created a Manufactured Convertible by
combining a short-term US Treasury instrument and a call option on a stock, the Manufactured Convertible would likely outperform a traditional convertible of similar maturity that is convertible into that stock during
periods when Treasury instruments outperform corporate fixed income securities and underperform during periods when corporate fixed-income securities outperform Treasury instruments.
CERTIFICATES OF DEPOSIT. The FDIC, an independent agency of the US Government, provides deposit insurance on all types of deposits, including certificates of deposit, received at an FDIC-insured bank or savings
association (“insured depository institutions”) up to applicable limits. The standard deposit insurance amount is $250,000 per depositor (including principal and accrued interest) for each insurable
capacity of such depositor, per insured depository institution, which is backed by the full faith and credit of the US Government. All of a depositor’s deposits in the same insurable capacity at the same insured
depository institution are aggregated for purposes of the $250,000 insurance limit, including deposits held directly in the depositor’s name and for the depositor’s benefit by intermediaries. Any amounts
in excess of the $250,000 deposit insurance limit may be uninsured.
CORPORATE LOANS. Commercial banks and other financial institutions make loans to companies that need capital to grow or restructure (“corporate loans”). Borrowers generally pay interest on
corporate loans at rates that change in response to changes in market interest rates such as the LIBOR or the prime rate of US banks. As a result, the value of corporate loan investments is generally responsive to
shifts in market interest rates. Because the trading market for corporate loans is less developed than the secondary market for bonds and notes, the Fund may experience difficulties from time to time in selling its
corporate loans. Borrowers frequently provide collateral to secure repayment of these obligations. Leading financial institutions often act as agent for a broader group of
7
lenders, generally referred to as a
“syndicate.” The syndicate's agent arranges the corporate loans, holds collateral and accepts payments of principal and interest. If the agent develops financial problems, the Fund may not recover its
investment, or there might be a delay in the Fund’s recovery. By investing in a corporate loan, the Fund becomes a member of the syndicate.
As in the case of junk bonds, the
corporate loans in which the Fund may invest can be expected to provide higher yields than higher-rated fixed income securities but may be subject to greater risk of loss of principal and interest. There are, however,
some significant differences between corporate loans and junk bonds. Corporate loans are frequently secured by pledges of liens and security interests in the assets of the borrower, and the holders of corporate loans
are frequently the beneficiaries of debt service subordination provisions imposed on the borrower's bondholders. These arrangements are designed to give corporate loan investors preferential treatment over junk bond
investors in the event of a deterioration in the credit quality of the issuer. Even when these arrangements exist, however, there can be no assurance that the principal and interest owed on the corporate loans will be
repaid in full. Corporate loans generally bear interest at rates set at a margin above a generally recognized base lending rate that may fluctuate on a day-to-day basis, in the case of the prime rate of a US bank, or
that may be adjusted on set dates, typically 30 days but generally not more than one year, in the case of LIBOR. Consequently, the value of corporate loans held by the Fund may be expected to fluctuate significantly
less than the value of fixed rate junk bond instruments as a result of changes in the interest rate environment. On the other hand, the secondary dealer market for corporate loans is not as well developed as the
secondary dealer market for junk bonds, and therefore presents increased market risk relating to liquidity and pricing concerns.
The Fund may acquire interests in
corporate loans by means of a novation, assignment or participation. In a novation, the Fund would succeed to all the rights and obligations of the assigning institution and become a contracting party under the credit
agreement with respect to the debt obligation. As an alternative, the Fund may purchase an assignment, in which case the Fund may be required to rely on the assigning institution to demand payment and enforce its
rights against the borrower but would otherwise typically be entitled to all of such assigning institution's rights under the credit agreement. Participation interests in a portion of a debt obligation typically
result in a contractual relationship only with the institution selling the participation interest and not with the borrower. In purchasing a loan participation, the Fund generally will have no right to enforce
compliance by the borrower with the terms of the loan agreement, nor any rights of set-off against the borrower, and the Fund may not directly benefit from the collateral supporting the debt obligation in which it has
purchased the participation. As a result, the Fund will assume the credit risk of both the borrower and the institution selling the participation to the Fund.
CUSTODIAL RECEIPTS. Obligations issued or guaranteed as to principal and interest by the US Government, foreign governments or semi-governmental entities may be acquired by the Fund in the form of custodial
receipts that evidence ownership of future interest payments, principal payments or both on certain notes or bonds. Typically, custodial receipts have their unmatured interest coupons separated
(“stripped”) by their holder. Having separated the interest coupons from the underlying principal of the government securities, the holder will resell the stripped securities in custodial receipt programs
with a number of different names, including “Treasury Income Growth Receipts” (“TIGRs”) and “Certificate of Accrual on Treasury Securities” (“CATS”). The stripped
coupons are sold separately from the underlying principal, which is usually sold at a deep discount because the buyer receives only the right to receive a future fixed payment on the security and does not receive any
rights to periodic interest (cash) payments. CATS and TIGRs are not considered US Government securities by the staff of the SEC. Such notes and bonds are held in custody by a bank or a brokerage firm on behalf of the
owners.
DEBT SECURITIES. Debt securities, such as bonds, involve credit risk. This is the risk that the issuer will not make timely payments of principal and interest. The degree of credit risk depends on the
issuer's financial condition and on the terms of the bonds. Changes in an issuer's credit rating or the market's perception of an issuer's creditworthiness may also affect the value of the Fund’s investment in
that issuer. Credit risk is reduced to the extent the Fund invests its assets in US Government securities. All debt securities, however, are subject to interest rate risk. This is the risk that the value of the
security may fall when interest rates rise. In general, the market price of debt securities with longer maturities will go up or down more in response to changes in interest rates than the market price of shorter-term
securities.
DEPOSITARY RECEIPTS. The Fund may invest in the securities of foreign issuers in the form of Depositary Receipts or other securities convertible into securities of foreign issuers. Depositary Receipts may not
necessarily be denominated in the same currency as the underlying securities into which they may be converted. ADRs and ADSs are receipts or shares typically issued by an American bank or trust company that evidence
ownership of underlying securities issued by a foreign corporation. EDRs are receipts issued in Europe that evidence a similar ownership arrangement. GDRs are receipts issued throughout the world that evidence a
similar arrangement. Generally, ADRs and ADSs, in registered form, are designed for use in the US securities markets, and EDRs, in bearer form, are designed for use in European securities markets. GDRs are tradable
both in the United States and in Europe and are designed for use throughout the world.
8
The Fund may invest in unsponsored
Depositary Receipts. The issuers of unsponsored Depositary Receipts are not obligated to disclose material information in the United States, and, therefore, there may be less information available regarding such
issuers and there may not be a correlation between such information and the market value of the Depositary Receipts. Depositary Receipts are generally subject to the same risks as the foreign securities that they
evidence or into which they may be converted or exchanged.
DERIVATIVES. The Fund may use instruments referred to as derivatives. Derivatives are financial instruments the value of which is derived from another security, a commodity (such as gold or oil), a
currency or an index (a measure of value or rates, such as the S&P 500 Index or the prime lending rate). Derivatives allow the Fund to increase or decrease the level of risk to which the Fund is exposed more
quickly and efficiently than transactions in other types of instruments. The Fund may use derivatives for hedging purposes. The Fund may also use derivatives to seek to enhance returns. The use of a derivative is
speculative if the Fund is primarily seeking to achieve gains, rather than offset the risk of other positions. When the Fund invests in a derivative for speculative purposes, the Fund will be fully exposed to the
risks of loss of that derivative, which may sometimes be greater than the derivative's cost. The Fund may not use any derivative to gain exposure to an asset or class of assets that the Fund would be prohibited by its
investment restrictions from purchasing directly.
A discussion of the risk factors
relating to derivatives is set out in the sub-section entitled “Risk Factors Involving Derivatives.”
EXCHANGE-TRADED FUNDS. The Fund may invest in ETFs. ETFs, which may be unit investment trusts or mutual funds, typically hold portfolios of securities designed to track the performance of various broad
securities indexes or sectors of such indexes. ETFs provide another means, in addition to futures and options on indexes, of including stock index exposure in the Fund’s investment strategies. The Fund will
indirectly bear its proportionate share of any management fees and other expenses paid by such ETF.
HEDGING. Hedging is a strategy in which a derivative or security is used to offset the risks associated with other Fund holdings. Losses on the other investment may be substantially reduced by
gains on a derivative that reacts in an opposite manner to market movements. While hedging can reduce losses, it can also reduce or eliminate gains or cause losses if the market moves in a different manner than
anticipated by the Fund or if the cost of the derivative outweighs the benefit of the hedge. Hedging also involves the risk that changes in the value of the derivative will not match those of the holdings being hedged
as expected by the Fund, in which case any losses on the holdings being hedged may not be reduced or may be increased. The inability to close options and futures positions also could have an adverse impact on the
Fund’s ability to hedge effectively its portfolio. There is also a risk of loss by the Fund of margin deposits or collateral in the event of bankruptcy of a broker with whom the Fund has an open position in an
option, a futures contract or a related option.
There can be no assurance that the
Fund’s hedging strategies will be effective or that hedging transactions will be available to the Fund. The Fund is not required to engage in hedging transactions and the Fund may choose not to do so from time
to time.
INDEXED AND INVERSE SECURITIES. The Fund may invest in securities the potential return of which is based on an index or interest rate. As an illustration, the Fund may invest in a security whose value is based on changes
in a specific index or that pays interest based on the current value of an interest rate index, such as the prime rate. The Fund may also invest in a debt security that returns principal at maturity based on the level
of a securities index or a basket of securities, or based on the relative changes of two indices. In addition, the Fund may invest in securities the potential return of which is based inversely on the change in an
index or interest rate (that is, a security the value of which will move in the opposite direction of changes to an index or interest rate). For example, the Fund may invest in securities that pay a higher rate of
interest when a particular index decreases and pay a lower rate of interest (or do not fully return principal) when the value of the index increases. Investing in such securities may subject the Fund to reduced or
eliminated interest payments or loss of principal in the event of an adverse movement in the relevant interest rate, index or indices. Indexed and inverse securities may involve credit risk, and certain indexed and
inverse securities may involve leverage risk, liquidity risk and currency risk. The Fund may invest in indexed and inverse securities for hedging purposes or to seek to increase returns. When used for hedging
purposes, indexed and inverse securities involve correlation risk. (Furthermore, where such a security includes a contingent liability, in the event of such an adverse movement, the Fund may be required to pay
substantial additional margin to maintain the position.)
SWAP AGREEMENTS. The Fund may enter into swap transactions, including, but not limited to, equity, interest rate, index, credit default, total return and, to the extent that it invests in foreign
currency-denominated securities, currency exchange rate swap agreements. In addition, the Fund may enter into options on swap agreements (swap options). These swap transactions are entered into in an attempt to obtain
a particular return when it is considered desirable to do so, possibly at a lower cost to the Fund than if the Fund had invested directly in an instrument that yielded that desired return. Swap transactions are a type
of derivative. Derivatives are further discussed in the sub-sections entitled “Derivatives” and “Risk Factors Involving Derivatives.”
9
Swap agreements are two party
contracts entered into primarily by institutional investors. In a standard “swap” transaction, two parties agree to exchange the returns (or differentials in rates of return) earned or realized on or
calculated with respect to particular predetermined investments or instruments, which may be adjusted for an interest factor. The gross returns to be exchanged or “swapped” between the parties are
generally calculated with respect to a “notional amount,” that is, the return on or increase in value of a particular dollar amount invested at a particular interest rate or in a “basket” of
securities representing a particular index or other investments or instruments. Most swap agreements entered into by the Fund would calculate the obligations of the parties to the agreement on a “net
basis.” Consequently the Fund’s current obligations (or rights) under a swap agreement will generally be equal only to the net amount to be paid or received under the agreement based on the relative values
of the positions held by each party to the agreement (the “net amount”). The Fund’s current obligations under a swap agreement will be accrued daily (offset against any amounts owed to the Fund) and
any accrued but unpaid net amounts owed to a swap counterparty will be covered by the segregation of liquid assets.
To the extent that the Fund enters
into swaps on other than a net basis, the amount maintained in a segregated account will be the full amount of the Fund’s obligations, if any, with respect to such swaps, accrued on a daily basis. Inasmuch as
segregated accounts are established for these hedging transactions, the subadviser and the Fund believe such obligations do not constitute senior securities and, accordingly, will not treat them as being subject to
the Fund’s borrowing restrictions. If there is a default by the other party to such a transaction, the Fund will have contractual remedies pursuant to the agreement related to the transaction. Since swaps are
individually negotiated, the Fund expects to achieve an acceptable degree of correlation between its rights to receive a return on its portfolio securities and its rights and obligations to receive and pay a return
pursuant to swaps. The Fund will enter into swaps only with counterparties meeting certain creditworthiness standards (generally, such counterparties would have to be eligible counterparties under the terms of the
Fund’s repurchase agreement guidelines approved by the Board).
Some swaps will be subject to
mandatory or optional clearing through derivatives clearing organizations. While this is expected to better protect collateral, margin and other applicable requirements may increase the financial and operational costs
for such transactions.
Recent legislation requires certain
swaps to be executed through a centralized exchange or regulated facility and be cleared through a regulated clearinghouse. Although this clearing mechanism is generally expected to reduce counterparty credit risk, it
may disrupt or limit the swap market and may not result in swaps being easier to trade or value. As swaps become more standardized, the Fund may not be able to enter into swaps that meet its investment needs. The Fund
also may not be able to find a clearinghouse willing to accept a swap for clearing. In a cleared swap, a central clearing organization will be the counterparty to the transaction. The Fund will assume the risk that
the clearinghouse may be unable to perform its obligations. The Fund will be required to maintain its positions with a clearing organization through one or more clearing brokers. The clearing organization will require
the Fund to post margin and the broker may require the Fund to post additional margin to secure the Fund’s obligations. The amount of margin required may change from time to time. In addition, cleared
transactions may be more expensive to maintain than OTC transactions and may require the Fund to deposit larger amounts of margin. The Fund may not be able to recover margin amounts if the broker has financial
difficulties. Also, the broker may require the Fund to terminate a derivatives position under certain circumstances. This may cause the Fund to lose money.
CREDIT DEFAULT SWAP AGREEMENTS AND
SIMILAR INSTRUMENTS. The Fund may enter into credit default swap agreements and similar agreements. The credit default swap agreement or similar instrument may have as reference obligations one or more
securities that are not currently held by the Fund. The protection “buyer” in a credit default contract may be obligated to pay the protection “seller” an up-front or a periodic stream of
payments over the term of the contract provided generally that no credit event on a reference obligation has occurred. If a credit event occurs, the seller generally must pay the buyer the “par value”
(full notional value) of the swap in exchange for an equal face amount of deliverable obligations of the reference entity described in the swap, or the seller may be required to deliver the related net cash amount, if
the swap is cash settled. The Fund may be either the buyer or seller in the transaction. If the Fund is a buyer and no credit event occurs, the Fund recovers nothing if the swap is held through its termination date.
However, if a credit event occurs, the buyer may elect to receive the full notional value of the swap in exchange for an equal face amount of deliverable obligations of the reference entity that may have little or no
value. As a seller, the Fund generally receives an up-front payment or a fixed rate of income throughout the term of the swap provided that there is no credit event. If a credit event occurs, generally the seller must
pay the buyer the full notional value of the swap in exchange for an equal face amount of deliverable obligations of the reference entity that may have little or no value.
Credit default swaps and similar
instruments involve greater risks than if the Fund had invested in the reference obligation directly, since, in addition to general market risks, they are subject to illiquidity risk, counterparty risk and credit
risk. The Fund will enter into credit default swap agreements and similar instruments only with counterparties that are rated investment grade quality by at least one credit rating agency at the time of entering into
such transaction or whose creditworthiness is believed by the subadviser to be equivalent to such rating. If a credit event were to occur, the value of any deliverable obligation received by the seller, coupled
with
10
the up-front or periodic payments previously
received, may be less than the full notional value it pays to the buyer, resulting in a loss of value to the Fund. When acting as a seller of a credit default swap or a similar instrument, the Fund is exposed to many
of the same risks of leverage since, if a credit event occurs, the seller may be required to pay the buyer the full notional value of the contract net of any amounts owed by the buyer related to its delivery of
deliverable obligations.
CREDIT-LINKED SECURITIES. Among the income producing securities in which the Fund may invest are credit-linked securities, which are issued by a limited purpose trust or other vehicle that, in turn, invests in a
derivative instrument or basket of derivative instruments, such as credit default swaps, interest rate swaps and other securities, in order to provide exposure to certain fixed income markets. For instance, the Fund
may invest in credit-linked securities as a cash management tool in order to gain exposure to a certain market and/or to remain fully invested when more traditional income producing securities are not
available.
Like an investment in a bond,
investments in these credit-linked securities represent the right to receive periodic income payments (in the form of distributions) and payment of principal at the end of the term of the security. However, these
payments are conditioned on the issuer's receipt of payments from, and the issuer's potential obligations to, the counterparties to the derivative instruments and other securities in which the issuer invests. For
instance, the issuer may sell one or more credit default swaps, under which the issuer would receive a stream of payments over the term of the swap agreements provided that no event of default has occurred with
respect to the referenced debt obligation upon which the swap is based. If a default occurs, the stream of payments may stop and the issuer would be obligated to pay the counterparty the par (or other agreed upon
value) of the referenced debt obligation. This, in turn, would reduce the amount of income and principal that the Fund would receive. The Fund’s investments in these instruments are indirectly subject to the
risks associated with derivative instruments, including, among others, credit risk, default or similar event risk, counterparty risk, interest rate risk, leverage risk and management risk. It is also expected that the
securities will be exempt from registration under the 1933 Act. Accordingly, there may be no established trading market for the securities and they may constitute illiquid investments.
TOTAL RETURN SWAP AGREEMENTS. The Fund may enter into total return swap agreements. Total return swap agreements are contracts in which one party agrees to make periodic payments based on the change in market value of
the underlying assets, which may include a specified security, basket of securities or securities indices during the specified period, in return for periodic payments based on a fixed or variable interest rate or the
total return from other underlying assets. Total return swap agreements may be used to obtain exposure to a security or market without owning or taking physical custody of such security or market. Total return swap
agreements may effectively add leverage to the Fund’s portfolio because, in addition to its total net assets, the Fund would be subject to investment exposure on the notional amount of the swap. Total return
swap agreements entail the risk that a party will default on its payment obligations to the Fund thereunder. Swap agreements also bear the risk that the Fund will not be able to meet its obligation to the
counterparty. Generally, the Fund will enter into total return swaps on a net basis (i.e., the two payment streams are netted out with the Fund receiving or paying, as the case may be, only the net amount of the two
payments). The net amount of the excess, if any, of the Fund’s obligations over its entitlements with respect to each total return swap will be accrued on a daily basis, and an amount of cash or liquid
instruments having an aggregate NAV at least equal to the accrued excess will be segregated by the Fund. If the total return swap transaction is entered into on other than a net basis, the full amount of the
Fund’s obligations will be accrued on a daily basis, and the full amount of the Fund’s obligations will be segregated by the Fund in an amount equal to or greater than the market value of the liabilities
under the total return swap agreement or the amount it would have cost the Fund initially to make an equivalent direct investment, plus or minus any amount the Fund is obligated to pay or is to receive under the total
return swap agreement.
Segregation and other requirements
pertaining to total return swap agreements are subject to change in the event of future changes in applicable laws or regulations. It is possible that any such changes in laws or regulations could require
modifications to the operation of the Fund.
OPTIONS ON SECURITIES AND SECURITIES
INDEXES.
TYPES OF OPTIONS. The Fund may engage in transactions in options on individual securities, baskets of securities or securities indices, or particular measurements of value or rate (an “index”),
such as an index of the price of treasury securities or an index representative of short term interest rates. Such investments may be made on exchanges and in OTC markets. In general, exchange-traded options have
standardized exercise prices and expiration dates and require the parties to post margin against their obligations, and the performance of the parties' obligations in connection with such options is guaranteed by the
exchange or a related clearing corporation. OTC options have more flexible terms negotiated between the buyer and the seller, but generally do not require the parties to post margin and are subject to greater credit
risk. OTC options also involve greater liquidity risk. See “Additional Risk Factors of OTC Transactions; Limitations on the Use of OTC Derivatives.”
CALL OPTIONS. The Fund may purchase call options on any of the types of securities or instruments in which it may invest. A call option gives the Fund the right to buy, and obligates the seller to sell,
the underlying security at the exercise price at any time during the option period. The Fund also may purchase and sell call options on indices. Index options are similar to options on securities
11
except that, rather than taking or making delivery
of securities underlying the option at a specified price upon exercise, an index option gives the holder the right to receive cash upon exercise of the option if the level of the index upon which the option is based
is greater than the exercise price of the option.
The Fund may only write (i.e.,
sell) covered call options on the securities or instruments in which it may invest and enter into closing purchase transactions with respect to certain of such options. A covered call option is an option in which the
Fund owns the underlying security or has an absolute and immediate right to acquire that security, without additional consideration (or for additional consideration held in a segregated account by its custodian), upon
conversion or exchange of other securities currently held in its portfolio or with respect to which the Fund has established cover by segregating liquid instruments on its books. The principal reason for writing call
options is the attempt to realize, through the receipt of premiums, a greater return than would be realized on the securities alone. By writing covered call options, the Fund gives up the opportunity, while the option
is in effect, to profit from any price increase in the underlying security above the option exercise price. In addition, the Fund’s ability to sell the underlying security will be limited while the option is in
effect unless the Fund enters into a closing purchase transaction. A closing purchase transaction cancels out the Fund’s position as the writer of an option by means of an offsetting purchase of an identical
option prior to the expiration of the option it has written. Covered call options also serve as a partial hedge to the extent of the premium received against a decline in the price of the underlying security. Also,
with respect to call options written by the Fund that are covered only by segregated portfolio securities, the Fund is exposed to the risk of loss equal to the amount by which the price of the underlying securities
rises above the exercise price.
PUT OPTIONS. The Fund may purchase put options to seek to hedge against a decline in the value of its securities or to enhance its return. By buying a put option, the Fund acquires a right to sell such
underlying securities or instruments at the exercise price, thus limiting the Fund’s risk of loss through a decline in the market value of the securities or instruments until the put option expires. The amount
of any appreciation in the value of the underlying securities or instruments will be partially offset by the amount of the premium paid for the put option and any related transaction costs. Prior to its expiration, a
put option may be sold in a closing sale transaction and profit or loss from the sale will depend on whether the amount received is more or less than the premium paid for the put option plus the related transaction
costs. A closing sale transaction cancels out the Fund’s position as the purchaser of an option by means of an offsetting sale of an identical option prior to the expiration of the option it has purchased. The
Fund also may purchase uncovered put options.
The Fund may write (i.e., sell) put
options on the types of securities or instruments that may be held by the Fund, provided that such put options are covered, meaning that such options are secured by segregated, liquid instruments. The Fund will
receive a premium for writing a put option, which increases the Fund’s return.
FUTURES. The Fund may engage in transactions in futures and options thereon. Futures are standardized, exchange-traded contracts which obligate a purchaser to take delivery, and a seller to make
delivery, of a specific amount of an asset at a specified future date at a specified price. No price is paid upon entering into a futures contract. Rather, upon purchasing or selling a futures contract the Fund is
required to deposit collateral (“margin”) equal to a percentage (generally less than 10%) of the contract value. Each day thereafter until the futures position is closed, the Fund will pay additional
margin representing any loss experienced as a result of the futures position the prior day or be entitled to a payment representing any profit experienced as a result of the futures position the prior day. Futures
involve substantial leverage risk.
The sale of a futures contract
limits the Fund’s risk of loss through a decline in the market value of portfolio holdings correlated with the futures contract prior to the futures contract's expiration date. In the event the market value of
the portfolio holdings correlated with the futures contract increases rather than decreases, however, the Fund will realize a loss on the futures position and a lower return on the portfolio holdings than would have
been realized without the purchase of the futures contract.
The purchase of a futures contract
may protect the Fund from having to pay more for securities as a consequence of increases in the market value for such securities during a period when the Fund was attempting to identify specific securities in which
to invest in a market the Fund believes to be attractive. In the event that such securities decline in value or the Fund determines not to complete an anticipatory hedge transaction relating to a futures contract,
however, the Fund may realize a loss relating to the futures position.
The Fund is also authorized to
purchase or sell call and put options on futures contracts including financial futures and stock indices in connection with its hedging activities. Generally, these strategies would be used under the same market and
market sector conditions (i.e., conditions relating to specific types of investments) in which the Fund entered into futures transactions. The Fund may purchase put options or write (i.e., sell) call options on
futures contracts and stock indices rather than selling the underlying futures contract in anticipation of a decrease in the market value of its securities. Similarly, the Fund can purchase call options, or write put
options on futures contracts and stock indices, as a substitute for the purchase of such futures to hedge against the increased cost resulting from an increase in the market value of securities which the Fund intends
to purchase.
12
The Fund may only write
“covered” put and call options on futures contracts. The Fund will be considered “covered” with respect to a call option written on a futures contract if the Fund owns the assets that are
deliverable under the futures contract or an option to purchase that futures contract having a strike price equal to or less than the strike price of the “covered” option and having an expiration date not
earlier than the expiration date of the “covered” option, or if it segregates for the term of the option cash or other liquid assets equal to the fluctuating value of the optioned future. The Fund will be
considered “covered” with respect to a put option written on a futures contract if the Fund owns an option to sell that futures contract having a strike price equal to or greater than the strike price of
the “covered” option, or if the Fund segregates for the term of the option cash or other liquid assets at all times equal in value to the exercise price of the put (less any initial margin deposited by the
Fund with its futures custody manager or as otherwise permitted by applicable law with respect to such option). There is no limitation on the amount of the Fund’s assets that can be segregated.
The Manager has filed a notice of
exclusion from registration as a “commodity pool operator” with respect to the Fund under CFTC Rule 4.5 and, therefore, is not subject to registration or regulation with respect to the Fund under the
Commodity Exchange Act (the “CEA”). In order for the Manager to claim exclusion from registration as a “commodity pool operator” under the CEA, the Fund is limited in its ability to trade
instruments subject to the CFTC’s jurisdiction, including commodity futures (which include futures on broad-based securities indexes, interest rate futures and currency futures), options on commodity futures,
certain swaps or other investments (whether directly or indirectly through investments in other investment vehicles). Under this exclusion, the Fund must satisfy one of the following two trading limitations whenever
it enters into a new commodity trading position: (1) the aggregate initial margin and premiums required to establish the Fund’s positions in CFTC-regulated instruments may not exceed 5% of the liquidation value
of the Fund’s portfolio (after accounting for unrealized profits and unrealized losses on any such investments); or (2) the aggregate net notional value of such instruments, determined at the time the most
recent position was established, may not exceed 100% of the liquidation value of the Fund’s portfolio (after accounting for unrealized profits and unrealized losses on any such positions). The Fund would not be
required to consider its exposure to such instruments if they were held for “bona fide hedging” purposes, as such term is defined in the rules of the CFTC. In addition to meeting one of the foregoing
trading limitations, the Fund may not market itself as a commodity pool or otherwise as a vehicle for trading in the markets for CFTC-regulated instruments.
FOREIGN EXCHANGE TRANSACTIONS. The Fund may engage in spot and forward foreign exchange transactions and currency swaps, purchase and sell options on currencies and purchase and sell currency futures and related options
thereon (collectively, Currency Instruments) for purposes of hedging against the decline in the value of currencies in which its portfolio holdings are denominated against the US dollar or to seek to enhance returns.
Such transactions could be effected with respect to hedges on non-US dollar denominated securities owned by the Fund, sold by the Fund but not yet delivered, or committed or anticipated to be purchased by the
Fund.
As an illustration, the Fund may
use such techniques to hedge the stated value in US dollars of an investment in a yen-denominated security. In such circumstances, for example, the Fund may purchase a foreign currency put option enabling the Fund to
sell a specified amount of yen for dollars at a specified price by a future date. To the extent the hedge is successful, a loss in the value of the yen relative to the dollar will tend to be offset by an increase in
the value of the put option. To offset, in whole or in part, the cost of acquiring such a put option, the Fund may also sell a call option which, if exercised, requires the Fund to sell a specified amount of yen for
dollars at a specified price by a future date (a technique called a “straddle”). By selling such a call option in this illustration, the Fund gives up the opportunity to profit without limit from increases
in the relative value of the yen to the dollar. Straddles of the type that may be used by the Fund are considered to constitute hedging transactions and are consistent with the policies described above. The Fund will
not attempt to hedge all of its foreign portfolio positions.
FORWARD FOREIGN EXCHANGE
TRANSACTIONS. Forward foreign exchange transactions are OTC contracts to purchase or sell a specified amount of a specified currency or multinational currency unit at a price and future date set at the
time of the contract. Spot foreign exchange transactions are similar but require current, rather than future, settlement. The Fund will enter into foreign exchange transactions for purposes of hedging either a
specific transaction or a portfolio position, or to seek to enhance returns. The Fund may enter into a foreign exchange transaction for purposes of hedging a specific transaction by, for example, purchasing a currency
needed to settle a security transaction or selling a currency in which the Fund has received or anticipates receiving a dividend or distribution.
The Fund may enter into a foreign
exchange transaction for purposes of hedging a portfolio position by selling forward a currency in which a portfolio position of the Fund is denominated or by purchasing a currency in which the Fund anticipates
acquiring a portfolio position in the near future. The Fund may also hedge portfolio positions through currency swaps, which are transactions in which one currency is simultaneously bought for a second currency on a
spot basis and sold for the second currency on a forward basis. Forward foreign exchange transactions involve substantial currency risk, and also involve credit and liquidity risk.
13
CURRENCY FUTURES. The Fund may seek to enhance returns or hedge against the decline in the value of a currency against the US dollar through use of currency futures or options thereon. Currency futures are
similar to forward foreign exchange transactions except that futures are standardized, exchange-traded contracts. See the sub-section entitled “Futures.” Currency futures involve substantial currency risk,
and also involve leverage risk.
CURRENCY OPTIONS. The Fund may seek to enhance returns or hedge against the decline in the value of a currency against the US dollar through the use of currency options. Currency options are similar to
options on securities, but in consideration for an option premium the writer of a currency option is obligated to sell (in the case of a call option) or purchase (in the case of a put option) a specified amount of a
specified currency on or before the expiration date for a specified amount of another currency. The Fund may engage in transactions in options on currencies either on exchanges or OTC markets. See “Types of
Options” and “Additional Risk Factors of OTC Transactions; Limitations on the Use of OTC Derivatives” in this SAI. Currency options involve substantial currency risk, and may also involve credit,
leverage or liquidity risk.
LIMITATIONS ON CURRENCY HEDGING. The Fund may use currency hedging instruments to seek to enhance returns. Accordingly, the Fund will not hedge a currency in excess of the aggregate market value of the securities that it
owns (including receivables for unsettled securities sales), or has committed to or anticipates purchasing, which are denominated in such currency. The Fund may, however, hedge a currency by entering into a
transaction in a Currency Instrument denominated in a currency other than the currency being hedged (a “cross-hedge”). The Fund will only enter into a cross-hedge if the subadviser believes that (i) there
is a demonstrable high correlation between the currency in which the cross-hedge is denominated and the currency being hedged, and (ii) executing a cross-hedge through the currency in which the cross-hedge is
denominated will be significantly more cost-effective or provide substantially greater liquidity than executing a similar hedging transaction by means of the currency being hedged.
RISK FACTORS IN HEDGING FOREIGN
CURRENCY. Hedging transactions involving Currency Instruments have substantial risks, including correlation risk. While the Fund’s use of Currency Instruments to effect hedging strategies is
intended to reduce the volatility of the NAV of the Fund’s shares, the NAV of the Fund’s shares will fluctuate. Moreover, although Currency Instruments will be used with the intention of hedging against
adverse currency movements, transactions in Currency Instruments involve the risk that anticipated currency movements will not be accurately predicted and that the Fund’s hedging strategies will be ineffective.
To the extent that the Fund hedges against anticipated currency movements that do not occur, the Fund may realize losses and decrease its total return as the result of its hedging transactions. Furthermore, the Fund
will only engage in hedging activities from time to time and may not be engaging in hedging activities when movements in currency exchange rates occur.
In connection with its trading in
forward foreign currency contracts, the Fund will contract with a foreign or domestic bank, or a foreign or domestic securities dealer, to make or take future delivery of a specified amount of a particular currency.
There are no limitations on daily price moves in such forward contracts, and banks and dealers are not required to continue to make markets in such contracts. There have been periods during which certain banks or
dealers have refused to quote prices for such forward contracts or have quoted prices with an unusually wide spread between the price at which the bank or dealer is prepared to buy and that at which it is prepared to
sell. Governmental imposition of credit controls might limit any such forward contract trading. With respect to its trading of forward contracts, if any, the Fund will be subject to the risk of bank or dealer failure
and the inability of, or refusal by, a bank or dealer to perform with respect to such contracts. Any such default would deprive the Fund of any profit potential or force the Fund to cover its commitments for resale,
if any, at the then market price and could result in a loss to the Fund.
It may not be possible for the Fund
to hedge against currency exchange rate movements, even if correctly anticipated, in the event that (i) the currency exchange rate movement is so generally anticipated that the Fund is not able to enter into a hedging
transaction at an effective price, or (ii) the currency exchange rate movement relates to a market with respect to which Currency Instruments are not available and it is not possible to engage in effective foreign
currency hedging. The cost to the Fund of engaging in foreign currency transactions varies with such factors as the currencies involved, the length of the contract period and the market conditions then prevailing.
Since transactions in foreign currency exchange usually are conducted on a principal basis, no fees or commissions are involved.
RISK FACTORS INVOLVING
DERIVATIVES. Derivatives are volatile and involve significant risks, including:
Credit Risk—the risk that the counterparty on a derivative transaction will be unable to honor its financial obligation to the Fund.
Currency Risk—the risk that changes in the exchange rate between two currencies will adversely affect the value (in US dollar terms) of an investment.
Leverage Risk—the risk associated with certain types of investments or trading strategies (such as borrowing money to increase the amount of investments) that relatively small market movements may
result in large changes in the value of an investment. Certain investments or trading strategies that involve leverage can result in losses that greatly exceed the amount originally invested.
14
Liquidity Risk—the risk that certain securities may be difficult or impossible to sell at the time that the seller would like or at the price that the seller believes the security is currently
worth.
Regulatory Risk—the risk that new regulation of derivatives may make them more costly, may limit their availability, or may otherwise affect their value or performance.
The use of derivatives for hedging
purposes involves correlation risk. If the value of the derivative moves more or less than the value of the hedged instruments, the Fund will experience a gain or loss that will not be completely offset by movements
in the value of the hedged instruments.
The Fund intends to enter into
transactions involving derivatives only if there appears to be a liquid secondary market for such instruments or, in the case of illiquid instruments traded in OTC transactions, such instruments satisfy the criteria
set forth below under “Additional Risk Factors of OTC Transactions; Limitations on the Use of OTC Derivatives.” However, there can be no assurance that, at any specific time, either a liquid secondary
market will exist for a derivative or the Fund will otherwise be able to sell such instrument at an acceptable price. It may therefore not be possible to close a position in a derivative without incurring substantial
losses, if at all.
Certain transactions in derivatives
(such as futures transactions or sales of put options) involve substantial leverage risk and may expose the Fund to potential losses, which exceed the amount originally invested by the Fund. When the Fund engages in
such a transaction, the Fund will deposit in a segregated account at its custodian liquid securities or cash and cash equivalents with a value at least equal to the Fund’s exposure, on a mark-to-market basis, to
the transaction (as calculated pursuant to requirements of the SEC). Such segregation will ensure that the Fund has assets available to satisfy its obligations with respect to the transaction, but will not limit the
Fund’s exposure to loss.
ADDITIONAL RISK FACTORS OF OTC
TRANSACTIONS; LIMITATIONS ON THE USE OF OTC DERIVATIVES. Certain derivatives traded in OTC markets, including indexed securities, certain swaps and OTC options, involve substantial liquidity risk. The absence of liquidity may make it difficult
or impossible for the Fund to sell such instruments promptly at an acceptable price. The absence of liquidity may also make it more difficult for the Fund to ascertain a market value for such instruments. The Fund
will, therefore, acquire illiquid OTC instruments (i) if the agreement pursuant to which the instrument is purchased contains a formula price at which the instrument may be terminated or sold, or (ii) for which the
subadviser anticipates the Fund can receive on each business day at least two independent bids or offers, unless a quotation from only one dealer is available, in which case that dealer's quotation may be
used.
Because derivatives traded in OTC
markets are not guaranteed by an exchange or clearing corporation and generally do not require payment of margin, to the extent that the Fund has unrealized gains in such instruments or has deposited collateral with
its counterparties, the Fund is at risk that its counterparties will become bankrupt or otherwise fail to honor their obligations. The Fund will attempt to minimize the risk that a counterparty will become bankrupt or
otherwise fail to honor its obligations by engaging in transactions in derivatives traded in OTC markets only with financial institutions that appear to have substantial capital or that have provided the Fund with a
third-party guaranty or other credit enhancement.
DISTRESSED SECURITIES. The Fund may invest in securities, including corporate loans purchased in the secondary market, which are the subject of bankruptcy proceedings or otherwise in default as to the repayment
of principal and/or interest at the time of acquisition by the Fund or are rated in the lower rating categories (generally, Ca or lower by Moody's and CC or lower by S&P or Fitch) or which, if unrated, are in the
judgment of the subadviser of equivalent quality (“Distressed Securities”). Investing in Distressed Securities is speculative and involves significant risks. Distressed Securities frequently do not produce
income while they are outstanding and may require the Fund to bear certain extraordinary expenses in order to protect and recover its investment.
The Fund will generally make such
investments only when the subadviser believes it is reasonably likely that the issuer of the Distressed Securities will make an exchange offer or will be the subject of a plan of reorganization pursuant to which the
Fund will receive new securities. However, there can be no assurance that such an exchange offer will be made or that such a plan of reorganization will be adopted. In addition, a significant period of time may pass
between the time at which the Fund makes its investment in Distressed Securities and the time that any such exchange offer or plan of reorganization is completed. During this period, it is unlikely that the Fund will
receive any interest payments on the Distressed Securities, the Fund will be subject to significant uncertainty as to whether or not the exchange offer or plan of reorganization will be completed and the Fund may be
required to bear certain extraordinary expenses to protect and recover its investment. Even if an exchange offer is made or plan of reorganization is adopted with respect to Distressed Securities held by the Fund,
there can be no assurance that the securities or other assets received by the Fund in connection with such exchange offer or plan of reorganization will not have a lower value or income potential than may have been
anticipated when the investment was made. Moreover, any securities received by the Fund upon
15
completion of an exchange offer or plan of
reorganization may be restricted as to resale. As a result of the Fund’s participation in negotiations with respect to any exchange offer or plan of reorganization with respect to an issuer of Distressed
Securities, the Fund may be restricted from disposing of such securities.
EQUITY AND EQUITY-RELATED
SECURITIES. The Fund may invest in or hold common stock and other equity and equity-related securities. Common stock represents an equity ownership interest in a company. Historical trends would
indicate that common stock is subject to higher levels of volatility and market and issuer-specific risk than debt securities. The value of equity securities may be affected more rapidly, and to a greater extent, by
company-specific developments and general market conditions. These risks may increase fluctuations in the Fund's NAV. The equity interests held by the Fund, if any, may not pay dividends or otherwise generate income
or appreciate in value and, in fact, may decline in value. Accordingly, the Fund may not be able to realize gains from its equity investments, and any gains that the Fund does realize may not be sufficient to
contribute materially to the Fund's investment objective. Equity securities held by the Fund may be illiquid.
FOREIGN INVESTMENTS. The Fund may invest in foreign equity and/or debt securities. Foreign debt securities include certain foreign bank obligations and US dollar or foreign currency-denominated obligations of
foreign governments or their subdivisions, agencies and instrumentalities, international agencies and supranational entities.
Foreign Market Risk. Foreign securities offer the potential for more diversification than if the Fund invests only in the United States because securities traded on foreign markets have often (though not
always) performed differently from securities in the United States. However, such investments involve special risks not present in US investments that can increase the chances that the Fund will lose money. In
particular, the Fund is subject to the risk that, because there are generally fewer investors on foreign exchanges and a smaller number of shares traded each day, it may be difficult for the Fund to buy and sell
securities on those exchanges. In addition, prices of foreign securities may fluctuate more than prices of securities traded in the United States.
Foreign Economy Risk. The economies of certain foreign markets often do not compare favorably with that of the United States with respect to such issues as growth of gross national product, reinvestment of
capital, resources, and balance of payments position. Certain such economies may rely heavily on particular industries or foreign capital and are more vulnerable to diplomatic developments, the imposition of economic
sanctions against a particular country or countries, changes in international trading patterns, trade barriers, and other protectionist or retaliatory measures. Investments in foreign markets may also be adversely
affected by governmental actions such as the imposition of capital controls, nationalization of companies or industries, expropriation of assets, or the imposition of punitive taxes. In addition, the governments of
certain countries may prohibit or impose substantial restrictions on foreign investing in their capital markets or in certain industries. Any of these actions could severely affect security prices, impair the
Fund’s ability to purchase or sell foreign securities or transfer the Fund’s assets or income back into the United States, or otherwise adversely affect the Fund’s operations. Other foreign market
risks include foreign exchange controls, difficulties in pricing securities, defaults on foreign government securities, difficulties in enforcing favorable legal judgments in foreign courts, and political and social
instability. Legal remedies available to investors in certain foreign countries may be less extensive than those available to investors in the United States or other foreign countries.
Currency Risk and Exchange
Risk. Securities in which the Fund invests may be denominated or quoted in currencies other than the US dollar. Changes in foreign currency exchange rates will affect the value of the
Fund’s portfolio. Generally, when the US dollar rises in value against a foreign currency, a security denominated in that currency loses value because the currency is worth fewer US dollars. Conversely, when the
US dollar decreases in value against a foreign currency, a security denominated in that currency gains value because the currency is worth more US dollars. This risk, generally known as “currency risk,”
means that a stronger US dollar will reduce returns for US investors while a weak US dollar will increase those returns.
Governmental Supervision and
Regulation/Accounting Standards. Many foreign governments supervise and regulate stock exchanges, brokers and the sale of securities less rigorously than the United States. Some countries may not have laws to protect
investors comparable to the US securities laws. For example, some foreign countries may have no laws or rules against insider trading. Insider trading occurs when a person buys or sells a company's securities based on
nonpublic information about that company. Accounting standards in other countries are not necessarily the same as in the United States. If the accounting standards in another country do not require as much detail as
US accounting standards, it may be harder for Fund management to completely and accurately determine a company's financial condition.
Certain Risks of Holding Fund Assets
Outside the United States. The Fund generally holds its foreign securities and cash in foreign banks and securities depositories. Some foreign banks and securities depositories may be recently organized or new to
the foreign custody business. In addition, there may be limited or no regulatory oversight over their operations. Also, the laws of certain countries may put limits on the Fund’s ability to recover its assets if
a foreign bank or depository or issuer of a security or any of their agents
16
goes bankrupt. In addition, it is often more
expensive for the Fund to buy, sell and hold securities in certain foreign markets than in the United States. The increased expense of investing in foreign markets reduces the amount the Fund can earn on its
investments and typically results in a higher operating expense ratio for the Fund as compared to investment companies that invest only in the United States.
Settlement Risk. Settlement and clearance procedures in certain foreign markets differ significantly from those in the United States. Foreign settlement procedures and trade regulations also may involve
certain risks (such as delays in payment for or delivery of securities) not typically generated by the settlement of US investments. Communications between the United States and emerging market countries may be
unreliable, increasing the risk of delayed settlements or losses of security certificates. Settlements in certain foreign countries at times have not kept pace with the number of securities transactions; these
problems may make it difficult for the Fund to carry out transactions. If the Fund cannot settle or there is a delay in settling a purchase of securities, the Fund may miss attractive investment opportunities and
certain assets may be uninvested with no return earned thereon for some period. If the Fund cannot settle or there is a delay in settling a sale of securities, the Fund may lose money if the value of the security then
declines or, if there is a contract to sell the security to another party, the Fund could be liable to that party for any losses incurred.
Dividends or interest on, or
proceeds from the sale of, foreign securities may be subject to foreign withholding taxes, thereby reducing the amount available for distribution to shareholders.
INITIAL PUBLIC OFFERINGS. The Fund may invest in securities sold in IPOs. An IPO is the first sale of stock by a private company to the public. IPOs are often issued by smaller, younger companies seeking capital to
expand, but can also be done by large privately owned companies looking to become publicly traded.
In an IPO, the issuer obtains the
assistance of an underwriting firm, which helps it determine what type of security to issue (common or preferred), best offering price and time to bring it to market. The volume of IPOs and the levels at which the
newly issued stocks trade in the secondary market are affected by the performance of the stock market overall. If IPOs are brought to the market, availability may be limited and the Fund may not be able to buy any
shares at the offering price, or if the Fund is able to buy shares, the Fund may not be able to buy as many shares at the offering price as the Fund would like.
Investing in IPOs entails risks.
Importantly, the prices of securities involved in IPOs are often subject to greater and more unpredictable price changes than more established stocks. It is difficult to predict what the stock will do on its initial
day of trading and in the near future since there is often little historical data with which to analyze the company. Also, most IPOs are of companies going through a transitory growth period, and they are therefore
subject to additional uncertainty regarding their future value.
INVESTMENT IN EMERGING MARKETS. The Fund may invest in the securities of issuers domiciled in various countries with emerging capital markets. Specifically, a country with an emerging capital market is any country that
the World Bank, the International Finance Corporation, the United Nations or its authorities has determined to have a low or middle income economy. Countries with emerging markets can be found in regions such as Asia,
Latin America, Eastern Europe and Africa.
Investments in the securities of
issuers domiciled in countries with emerging capital markets involve certain additional risks not involved in investments in securities of issuers in more developed capital markets, such as (i) low or non-existent
trading volume, resulting in a lack of liquidity and increased volatility in prices for such securities, as compared to securities of comparable issuers in more developed capital markets, (ii) uncertain national
policies and social, political and economic instability, increasing the potential for expropriation of assets, confiscatory taxation, high rates of inflation or unfavorable diplomatic developments, (iii) possible
fluctuations in exchange rates, differing legal systems and the existence or possible imposition of exchange controls, custodial restrictions or other foreign or US governmental laws or restrictions applicable to such
investments, (iv) national policies that may limit the Fund’s investment opportunities such as restrictions on investment in issuers or industries deemed sensitive to national interests, and (v) the lack or
relatively early development of legal structures governing private and foreign investments and private property. In addition to withholding taxes on investment income, some countries with emerging markets may impose
differential capital gains taxes on foreign investors.
Such capital markets are emerging
in a dynamic political and economic environment brought about by events over recent years that have reshaped political boundaries and traditional ideologies. In such a dynamic environment, there can be no assurance
that these capital markets will continue to present viable investment opportunities for the Fund. In the past, governments of such nations have expropriated substantial amounts of private property, and most claims of
the property owners have never been fully settled. There is no assurance that such expropriations will not reoccur. In such an event, it is possible that the Fund could lose the entire value of its investments in the
affected markets.
17
Also, there may be less publicly
available information about issuers in emerging markets than would be available about issuers in more developed capital markets, and such issuers may not be subject to accounting, auditing and financial reporting
standards and requirements comparable to those to which US companies are subject. In certain countries with emerging capital markets, reporting standards vary widely. As a result, traditional investment measurements
used in the United States, such as price/earnings ratios, may not be applicable. Emerging market securities may be substantially less liquid and more volatile than those of mature markets, and companies may be held by
a limited number of persons. This may adversely affect the timing and pricing of the Fund’s acquisition or disposal of securities.
Practices in relation to settlement
of securities transactions in emerging markets involve higher risks than those in developed markets, in part because the Fund will need to use brokers and counterparties that are less well capitalized, and custody and
registration of assets in some countries may be unreliable. The possibility of fraud, negligence, undue influence being exerted by the issuer or refusal to recognize ownership exists in some emerging markets, and,
along with other factors, could result in ownership registration being completely lost. The Fund would absorb any loss resulting from such registration problems and may have no successful claim for compensation.
RECENT EVENTS IN EUROPEAN
COUNTRIES. A number of countries in Europe have experienced severe economic and financial difficulties. Many non-governmental issuers, and even certain governments, have defaulted on, or been forced
to restructure, their debts; many other issuers have faced difficulties obtaining credit or refinancing existing obligations; financial institutions have in many cases required government or central bank support, have
needed to raise capital, and/or have been impaired in their ability to extend credit; and financial markets in Europe and elsewhere have experienced extreme volatility and declines in asset values and liquidity. These
difficulties may continue, worsen or spread within and without Europe. Responses to the financial problems by European governments, central banks and others, including austerity measures and reforms, may not work, may
result in social unrest and may limit future growth and economic recovery or have other unintended consequences. Further defaults or restructurings by governments and others of their debt could have additional adverse
effects on economies, financial markets and asset valuations around the world. In addition, one or more countries may abandon the euro, the common currency of the European Union, and/or withdraw from the European
Union. The impact of these actions, especially if they occur in a disorderly fashion, is not clear but could be significant and far-reaching. Whether or not the Fund invests in securities of issuers located in Europe
or with significant exposure to European issuers or countries, these events could negatively affect the value and liquidity of the Fund’s investments.
RISK OF INVESTMENTS IN RUSSIA. The Fund may invest a portion of its assets in securities issued by companies located in the Russian Federation. Settlement, clearing and registration of securities transactions in Russia
are subject to significant risks. Ownership of shares is defined according to entries in the company’s share register and normally evidenced by extracts from the register. These extracts are not negotiable
instruments and are not effective evidence of securities ownership. The registrars are not necessarily subject to effective state supervision nor are they licensed with any governmental entity. Also, there is no
central registration system for shareholders and it is possible for the Fund to lose its registration through fraud, negligence or mere oversight. While the Fund will endeavor to ensure that its interests continue to
be appropriately recorded, either by itself or through a custodian or other agent inspecting the share register and by obtaining extracts of share registers through regular confirmations, these extracts are not
legally enforceable and it is possible that a subsequent illegal amendment or other fraudulent act may deprive the Fund of its ownership rights or improperly dilute its interests. In addition, while applicable Russian
regulations impose liability on registrars for losses resulting from their errors, it may be difficult for the Fund to enforce any rights it may have against the registrar or issuer of the securities in the event of
loss of share registration. While the Fund intends to invest directly in Russian companies that use an independent registrar, there can be no assurance that such investments will not result in a loss to the
Fund.
As a result of recent political and
military actions undertaken by the Russian Federation, the US and the European Union have instituted various economic sanctions against Russian individuals and entities. The US and/or the European Union may impose
additional economic sanctions, or take other actions, against individuals and/or companies in specific sectors of the Russian economy, including, but not limited to, the financial services, energy, metals and mining,
engineering, and defense and defense-related materials sectors. These sanctions, and the threat of additional sanctions, could have adverse consequences for the Russian economy, including continued weakening of the
Russian currency, downgrades in Russia’s credit rating, and a significant decline in the value and liquidity of securities issued by Russian companies or the Russian government. Any of these events could
negatively impact the Fund’s investment in Russian securities. These sanctions have the possibility of impairing the Fund’s ability to invest in accordance with its investment strategy and/or to meet its
investment objective. For example, the Fund may be prohibited from investing in securities issued by companies subject to such sanctions. In addition, these sanctions may require a fund to freeze its existing
investments in Russian securities, thereby prohibiting the Fund from buying, selling, receiving or delivering those securities or other financial instruments. It is also possible that any counter measures or
retaliatory action by Russia could further impair the value and liquidity of securities issued by Russian companies and may have an impact on the economies of other emerging markets as well.
18
INVESTMENT IN OTHER INVESTMENT
COMPANIES. The Fund may invest in other investment companies, including ETFs. In accordance with the 1940 Act, the Fund may invest up to 10% of its total assets in securities of other investment
companies. In addition, under the 1940 Act, the Fund may not own more than 3% of the total outstanding voting stock of any investment company and not more than 5% of the value of the Fund’s total assets may be
invested in securities of any single investment company.
Notwithstanding the limits
discussed above, the Fund may invest in other investment companies without regard to the limits set forth above provided that the Fund complies with Rules 12d1-1, 12d1-2 and 12d1-3 promulgated by the SEC under the
1940 Act or otherwise permitted by the 1940 Act Laws, Interpretations and Exemptions.
As with other investments,
investments in other investment companies are subject to market and selection risk. In addition, if the Fund acquires shares in other investment companies, shareholders would bear both their proportionate share of
expenses in the Fund (including management and advisory fees) and, indirectly, their proportionate shares of the expenses of such investment companies (including management and advisory fees).
JUNK BONDS. Junk bonds are debt securities that are rated below investment grade by the major rating agencies or are unrated securities that the subadviser believes are of comparable quality. Although
junk bonds generally pay higher rates of interest than investment grade bonds, they are high risk investments that may cause income and principal losses for the Fund. The major risks in junk bond investments include
the following:
| ■ | Junk bonds are issued by less creditworthy issuers. These securities are vulnerable to adverse changes in the issuer's economic condition and to general economic conditions. Issuers of junk bonds may be unable to meet their interest or principal payment obligations because of an economic downturn, specific issuer developments or the unavailability of additional financing. |
| ■ | The issuers of junk bonds may have a larger amount of outstanding debt relative to their assets than issuers of investment grade bonds. If the issuer experiences financial stress, it may be unable to meet its debt obligations. |
| ■ | Junk bonds are frequently ranked junior to claims by other creditors. If the issuer cannot meet its obligations, the senior obligations are generally paid off before the junior obligations. |
| ■ | Junk bonds frequently have redemption features that permit an issuer to repurchase the security from the Fund before it matures. If an issuer redeems the junk bonds, the Fund may have to invest the proceeds in bonds with lower yields and may lose income. |
| ■ | Prices of junk bonds are subject to extreme price fluctuations. Negative economic developments may have a greater impact on the prices of junk bonds than on other higher rated fixed income securities. |
| ■ | Junk bonds may be less liquid than higher rated fixed income securities even under normal economic conditions. There are fewer dealers in the junk bond market, and there may be significant differences in the prices quoted for junk bonds by the dealers. Because they are less liquid, judgment may play a greater role in valuing certain of the Fund’s portfolio securities than in the case of securities trading in a more liquid market. |
| ■ | The Fund may incur expenses to the extent necessary to seek recovery upon default or to negotiate new terms with a defaulting issuer. |
LIQUIDITY PUTS OR CALLS. The Fund may purchase a permissible instrument or investment together with the right to resell or purchase the instruments at an agreed-upon price or yield within a specified period prior
to the maturity date of the instruments. Such a right to resell is commonly known as a put, and such a right to purchase is commonly known as a call. The aggregate price which the Fund pays for instruments with puts
or calls may be higher than the price which otherwise would be paid for the instruments. The purpose of this practice is to permit the Fund to be fully invested while preserving the necessary liquidity to meet
unusually large redemptions and to purchase at a later date securities other than those subject to the put. The Fund may choose to exercise puts during periods in which proceeds from sales of its shares and from
recent sales of portfolio securities are insufficient to meet redemption requests or when the funds available are otherwise allocated for investment. The Fund may choose to exercise calls during periods in which funds
are available for investment. In determining whether to exercise puts or calls prior to their expiration date and in selecting which puts or calls to exercise in such circumstances, the subadviser considers, among
other things, the amount of cash available to the Fund, the expiration dates of the available puts or calls, any future commitments for securities purchases, the yield, quality and maturity dates of the underlying
securities, alternative investment opportunities and the desirability of retaining the underlying securities in the Fund.
MONEY MARKET INSTRUMENTS. The Fund may invest in money market instruments. Money market instruments include cash equivalents and short-term obligations of US banks, certificates of deposit and short-term
obligations issued or guaranteed by the US Government or its agencies. Money market instruments also include bankers' acceptances, commercial paper, certificates of deposit and Eurodollar obligations issued or
guaranteed by bank holding companies in the US, their subsidiaries and foreign branches, by foreign banking institutions, and by the World Bank and other multinational instrumentalities, as well as commercial paper
and other short-term obligations of, and variable amount master demand notes, variable rate notes and funding agreements issued by, US and foreign corporations.
19
MORTGAGE-BACKED SECURITIES. Investing in mortgage-backed securities involves certain unique risks in addition to those generally associated with investing in fixed-income securities and in the real estate industry in
general. These unique risks include the failure of a party to meet its commitments under the related operative documents, adverse interest rate changes and the effects of prepayments on mortgage cash flows.
Mortgage-backed securities are “pass-through” securities, meaning that principal and interest payments made by the borrower on the underlying mortgages are passed through to the Fund. The value of
mortgage-backed securities, like that of traditional fixed-income securities, typically increases when interest rates fall and decreases when interest rates rise. However, mortgage-backed securities differ from
traditional fixed-income securities because of their potential for prepayment without penalty. The price paid by the Fund for its mortgage-backed securities, the yield the Fund expects to receive from such securities
and the average life of the securities are based on a number of factors, including the anticipated rate of prepayment of the underlying mortgages. In a period of declining interest rates, borrowers may prepay the
underlying mortgages more quickly than anticipated, thereby reducing the yield to maturity and the average life of the mortgage-backed securities. Moreover, when the Fund reinvests the proceeds of a prepayment in
these circumstances, the likely rate of interest received will be lower than the rate on the security that was prepaid.
Mortgage-backed securities,
including CMOs, can be collateralized by either fixed-rate mortgages or adjustable rate mortgages. Fixed-rate mortgage securities are collateralized by fixed-rate mortgages and tend to have high prepayment rates when
the level of prevailing interest rates declines significantly below the interest rates on the mortgages. Thus, under those circumstances, the securities are generally less sensitive to interest rate movements than
lower coupon fixed-rate mortgages. CMOs may be collateralized by whole mortgage loans or private mortgage pass-through securities, but are more typically collateralized by portfolios of mortgage pass-through
securities guaranteed by Ginnie Mae, Freddie Mac or Fannie Mae.
Generally, adjustable rate mortgage
securities (ARMs) have a specified maturity date and amortize principal over their life. In periods of declining interest rates, there is a reasonable likelihood that ARMs will experience increased rates of prepayment
of principal. However, the major difference between ARMs and fixed-rate mortgage securities (FRMs) is that the interest rate and the rate of amortization of principal of ARMs can and do change in accordance with
movements in a particular, pre-specified, published interest rate index. The amount of interest on an ARM is calculated by adding a specified amount, the “margin,” to the index, subject to limitations on
the maximum and minimum interest that is charged during the life of the mortgage or to maximum and minimum changes to that interest rate during a given period.
The underlying mortgages which
collateralize the ARMs in which the Fund invests will frequently have caps and floors which limit the maximum amount by which the loan rate to the residential borrower may change up or down (1) per reset or adjustment
interval and (2) over the life of the loan. Some residential mortgage loans restrict periodic adjustments by limiting changes in the borrower's monthly principal and interest payments rather than limiting interest
rate changes. These payment caps may result in negative amortization.
To the extent that the Fund
purchases mortgage-backed securities at a premium, mortgage foreclosures and principal prepayments may result in a loss to the extent of the premium paid. If the Fund buys such securities at a discount, both scheduled
payments of principal and unscheduled prepayments will increase current and total returns and will accelerate the recognition of income which, when distributed to shareholders, will be taxable as ordinary income. In a
period of rising interest rates, prepayments of the underlying mortgages may occur at a slower than expected rate, creating maturity extension risk. This particular risk may effectively change a security that was
considered short- or intermediate-term at the time of purchase into a long-term security. Since long-term securities generally fluctuate more widely in response to changes in interest rates than shorter-term
securities, maturity extension risk could increase the inherent volatility of the Fund. Under certain interest rate and prepayment scenarios, the Fund may fail to recoup fully its investment in mortgage-backed
securities notwithstanding any direct or indirect governmental or agency guarantee.
Most mortgage-backed securities are
issued by federal government agencies such as Ginnie Mae, or by government sponsored enterprises such as Freddie Mac and Fannie Mae. Principal and interest payments on mortgage-backed securities issued by the federal
government and some federal agencies, such as Ginnie Mae, are guaranteed by the federal government and backed by the full faith and credit of the United States. Mortgage-backed securities issued by other government
agencies or government sponsored enterprises are backed only by the credit of the government agency or enterprise and are not backed by the full faith and credit of the United States. Fannie Mae and Freddie Mac are
authorized to borrow from the US Treasury to meet their obligations. Private mortgage-backed securities are issued by private corporations rather than government agencies and are subject to credit risk and interest
rate risk.
Fannie Mae and Freddie Mac are
stockholder-owned companies chartered by Congress. Fannie Mae and Freddie Mac guarantee the securities they issue as to timely payment of principal and interest, but such guarantee is not backed by the full faith and
credit of the United States. In September 2008, Fannie Mae and Freddie Mac were placed into conservatorship by their regulator, the Federal
20
Housing Finance Agency. It is unclear what effect
this conservatorship, which remains ongoing as of the date of this SAI, will have on the securities issued or guaranteed by Fannie Mae or Freddie Mac. Although the US Government has provided financial support to
Fannie Mae and Freddie Mac, there can be no assurance that it will support these or other government-sponsored enterprises (GSEs) in the future.
MUNICIPAL SECURITIES. The Fund may, from time to time, invest in municipal bonds, which may be general obligation or revenue bonds. General obligation bonds are secured by the issuer's pledge of its faith,
credit and taxing power for the payment of principal and interest, whereas revenue bonds are payable only from the revenues derived from a particular facility or class of facilities or, in some cases, from the
proceeds of a special excise or other specific revenue source.
The Fund may invest in municipal
notes including tax, revenue and bond anticipation notes which are issued to obtain funds for various public purposes. The Fund may invest in municipal asset-backed securities, which are debt obligations, often issued
through a trust or other investment vehicles that are backed by municipal debt obligations and accompanied by a liquidity facility. The Fund may invest in municipal securities with the right to resell such securities
to the seller at an agreed-upon price or yield within a specified period prior to the maturity date. Such a right to resell is commonly referred to as a “put” or “tender option.”
Municipal securities include notes
and bonds issued by or on behalf of states, territories and possessions of the United States and their political subdivisions, agencies and instrumentalities and the District of Columbia, the interest on which is
generally eligible for exclusion from federal income tax and, in certain instances, applicable state or local income and personal property taxes. Interest from municipal securities received by the Fund will not be
eligible from exclusion from federal income tax when distributed to shareholders. Such securities are traded primarily in the OTC market.
The interest rates payable on
certain municipal bonds and municipal notes are not fixed and may fluctuate based upon changes in market rates. Municipal bonds and notes of this type are called “variable rate” obligations. The interest
rate payable on a variable rate obligation is adjusted either at pre-designated intervals or whenever there is a change in the market rate of interest on which the interest rate payable is based. Other features may
include the right whereby the Fund may demand prepayment of the principal amount of the obligation prior to its stated maturity (a demand feature) and the right of the issuer to prepay the principal amount prior to
maturity. The principal benefit of a variable rate obligation is that the interest rate adjustment minimizes changes in the market value of the obligation. As a result, the purchase of variable rate obligations should
enhance the ability of the Fund to maintain a stable NAV per share and to sell an obligation prior to maturity at a price approximating the full principal amount of the obligation.
Variable rate securities provide
for a specific periodic adjustment in the interest rate based on prevailing market rates and generally would allow the Fund to demand payment of the obligation on short notice at par plus accrued interest, which
amount may, at times, be more or less than the amount the Fund paid for them.
An inverse floater is a debt
instrument with a floating or variable interest rate that moves in the opposite direction of the interest rate on another security or the value of an index. Changes in the interest rate on the other security or index
inversely affect the residual interest rate paid on the inverse floater, with the result that the inverse floater's price will be considerably more volatile than that of a fixed rate bond. Generally, income from
inverse floating rate bonds will decrease when short-term interest rates increase, and will increase when short-term interest rates decrease. Such securities have the effect of providing investment leverage, since
they may increase or decrease in value in response to changes, as an illustration, in market interest rates at a rate that is a multiple (typically two) of the rate at which fixed-rate, long-term, tax-exempt
securities increase or decrease in response to such changes. As a result, the market values of such securities generally will be more volatile than the market values of fixed-rate tax-exempt securities.
REAL ESTATE RELATED SECURITIES. Although the Fund may not invest directly in real estate, the Fund may invest in securities of issuers that are principally engaged in the real estate industry. Therefore, an investment by
the Fund is subject to certain risks associated with the ownership of real estate and with the real estate industry in general. These risks include, among others: possible declines in the value of real estate; risks
related to general and local economic conditions; possible lack of availability of mortgage funds or other limitations on access to capital; overbuilding; risks associated with leverage; market illiquidity; extended
vacancies of properties; increase in competition, property taxes, capital expenditures and operating expenses; changes in zoning laws or other governmental regulation; costs resulting from the clean-up of, and
liability to third parties for damages resulting from, environmental problems; tenant bankruptcies or other credit problems; casualty or condemnation losses; uninsured damages from floods, earthquakes or other natural
disasters; limitations on and variations in rents, including decreases in market rates for rents; investment in developments that are not completed or that are subject to delays in completion; and unfavorable changes
in interest rates. To the extent that assets underlying the Fund’s investments are concentrated geographically, by property type or in certain other respects, the Fund may be subject to certain of the foregoing
risks to a greater extent.
21
Investments by the Fund in
securities of companies providing mortgage servicing will be subject to the risks associated with refinancings and their impact on servicing rights. In addition, if the Fund receives rental income or income from the
disposition of real property acquired as a result of a default on securities the Fund owns, the receipt of such income may adversely affect the Fund’s ability to retain its federal income tax status as a RIC
because of certain income source requirements applicable to regulated investment companies under the Code.
REAL ESTATE INVESTMENT TRUSTS. Investing in REITs involves certain unique risks in addition to those risks associated with investing in the real estate industry in general. Equity REITs may be affected by changes in the
value of the underlying property owned by the REITs, while mortgage REITs may be affected by the quality of any credit extended. REITs are dependent upon management skills, may not be diversified geographically or by
property type, and are subject to heavy cash flow dependency, default by borrowers and self-liquidation. REITs must also meet certain requirements under the Code to avoid entity level tax and be eligible to
pass-through certain tax attributes of their income to shareholders. REITs are consequently subject to the risk of failing to meet these requirements for favorable tax treatment and of failing to maintain their
exemptions from registration under the 1940 Act. REITs are also subject to the risks of changes in the Code affecting their tax status.
REITs (especially mortgage REITs)
are also subject to interest rate risks. When interest rates decline, the value of a REIT's investment in fixed rate obligations can be expected to rise. Conversely, when interest rates rise, the value of a REIT's
investment in fixed rate obligations can be expected to decline. In contrast, as interest rates on adjustable rate mortgage loans are reset periodically, yields on a REIT's investments in such loans will gradually
align themselves to reflect changes in market interest rates, causing the value of such investments to fluctuate less dramatically in response to interest rate fluctuations than would investments in fixed rate
obligations.
Investing in certain REITs involves
risks similar to those associated with investing in small capitalization companies. These REITs may have limited financial resources, may trade less frequently and in limited volume and may be subject to more abrupt
or erratic price movements than larger company securities. Historically, small capitalization stocks, such as REITs, have been more volatile in price than the larger capitalization stocks included in the S&P 500
Index. The management of a REIT may be subject to conflicts of interest with respect to the operation of the business of the REIT and may be involved in real estate activities competitive with the REIT. REITs may own
properties through joint ventures or in other circumstances in which the REIT may not have control over its investments. REITs may incur significant amounts of leverage. The Fund’s investments in REITs may
subject the Fund to duplicate management and/or advisory fees.
REPURCHASE AGREEMENTS. The Fund may invest in securities pursuant to repurchase agreements. The Fund will enter into repurchase agreements only with parties meeting creditworthiness standards as set forth in the
Fund’s repurchase agreement procedures.
Under such agreements, the other
party agrees, upon entering into the contract with the Fund, to repurchase the security at a mutually agreed-upon time and price in a specified currency, thereby determining the yield during the term of the agreement.
This results in a fixed rate of return insulated from market fluctuations during such period, although such return may be affected by currency fluctuations. In the case of repurchase agreements, the prices at which
the trades are conducted do not reflect accrued interest on the underlying obligation. Such agreements usually cover short periods, such as under one week. Repurchase agreements may be construed to be collateralized
loans by the purchaser to the seller secured by the securities transferred to the purchaser.
In the case of a repurchase
agreement, as a purchaser, the Fund will require all repurchase agreements to be fully collateralized at all times by cash or other liquid assets in an amount at least equal to the resale price. The seller is required
to provide additional collateral if the market value of the securities falls below the repurchase price at any time during the term of the repurchase agreement. In the event of default by the seller under a repurchase
agreement construed to be a collateralized loan, the underlying securities are not owned by the Fund but only constitute collateral for the seller's obligation to pay the repurchase price. Therefore, the Fund may
suffer time delays and incur costs or possible losses in connection with disposition of the collateral.
The Fund may participate in a joint
repurchase agreement account with other investment companies managed by the Manager pursuant to an order of the SEC. On a daily basis, any uninvested cash balances of the Fund may be aggregated with those of such
investment companies and invested in one or more repurchase agreements. The Fund participates in the income earned or accrued in the joint account based on the percentage of its investment.
REVERSE REPURCHASE AGREEMENTS AND
DOLLAR ROLLS. The Fund may enter into reverse repurchase agreements. A reverse repurchase agreement involves the sale of a portfolio-eligible security by the Fund, coupled with its agreement to
repurchase the instrument at a specified time and price. See “Repurchase Agreements.”
22
The Fund may enter into dollar
rolls. In a dollar roll, the Fund sells securities for delivery in the current month and simultaneously contracts to repurchase substantially similar (same type and coupon) securities on a specified future date from
the same party. During the roll period, the Fund forgoes principal and interest paid on the securities. The Fund is compensated by the difference between the current sale price and the forward price for the future
purchase (often referred to as the drop) as well as by the interest earned on the cash proceeds of the initial sale. The Fund will segregate cash or other liquid assets, marked to market daily, having a value equal to
the obligations of the Fund in respect of dollar rolls.
Dollar rolls involve the risk that
the market value of the securities retained by the Fund may decline below the price of the securities sold by the Fund but which the Fund is obligated to repurchase under the agreement. In the event the buyer of
securities under a dollar roll files for bankruptcy or becomes insolvent, the Fund’s use of the proceeds of the agreement may be restricted pending a determination by the other party, or its trustee or receiver,
whether to enforce the Fund’s obligation to repurchase the securities. Cash proceeds from dollar rolls may be invested in cash or other liquid assets.
SECURITIES LENDING. Unless otherwise noted, the Fund may lend its portfolio securities to brokers, dealers and other financial institutions subject to applicable regulatory requirements and guidance,
including the requirements that: (1) the aggregate market value of securities loaned will not at any time exceed 33 1/3% of the total assets of the Fund; (2) the borrower pledge and maintain with the Fund collateral
consisting of cash, an irrevocable letter of credit, or securities issued or guaranteed by the US government having at all times a value of not less than 100% of the value of the securities lent; and (3) the loan be
made subject to termination by the Fund at any time. Prudential Investment Management, Inc. (PIM), an affiliate of the Fund’s investment manager, serves as securities lending agent for the Fund, and in that role
administers the Fund’s securities lending program. As compensation for these services, PIM receives a portion of any amounts earned by the Fund through lending securities.
The Fund may invest the cash
collateral and/or it may receive a fee from the borrower. To the extent that cash collateral is invested, it will be invested in an affiliated money market fund and be subject to market depreciation or appreciation.
The Fund will be responsible for any loss that results from this investment of collateral.
On termination of the loan, the
borrower is required to return the securities to the Fund, and any gain or loss in the market price during the loan would inure to the Fund. If the borrower defaults on its obligation to return the securities lent
because of insolvency or other reasons, the Fund could experience delays and costs in recovering the securities lent or in gaining access to the collateral. In such situations, the Fund may sell the collateral and
purchase a replacement investment in the market. There is a risk that the value of the collateral could decrease below the value of the replacement investment by the time the replacement investment is purchased.
During the time portfolio
securities are on loan, the borrower will pay the Fund an amount equivalent to any dividend or interest paid on such securities. Voting or consent rights which accompany loaned securities pass to the borrower.
However, all loans may be terminated at any time to facilitate the exercise of voting or other consent rights with respect to matters considered to be material. The Fund bears the risk that there may be a delay in the
return of the securities which may impair the Fund’s ability to exercise such rights.
SECURITIES OF SMALLER OR EMERGING
GROWTH COMPANIES. Investment in smaller or emerging growth companies involves greater risk than is customarily associated with investments in more established companies. The securities of smaller or
emerging growth companies may be subject to more abrupt or erratic market movements than larger, more established companies or the market average in general. These companies may have limited product lines, markets or
financial resources, or they may be dependent on a limited management group.
While smaller or emerging growth
company issuers may offer greater opportunities for capital appreciation than large cap issuers, investments in smaller or emerging growth companies may involve greater risks and thus may be considered speculative.
The subadviser believes that properly selected companies of this type have the potential to increase their earnings or market valuation at a rate substantially in excess of the general growth of the economy. Full
development of these companies and trends frequently takes time.
Small cap and emerging growth
securities will often be traded only in the OTC market or on a regional securities exchange and may not be traded every day or in the volume typical of trading on a national securities exchange. As a result, the
disposition by the Fund of portfolio securities to meet redemptions or otherwise may require the Fund to make many small sales over a lengthy period of time, or to sell these securities at a discount from market
prices or during periods when, in the subadviser's judgment, such disposition is not desirable.
23
While the process of selection and
continuous supervision by the subadviser does not, of course, guarantee successful investment results, it does provide access to an asset class not available to the average individual due to the time and cost
involved. Careful initial selection is particularly important in this area as many new enterprises have promise but lack certain of the fundamental factors necessary to prosper. Investing in small cap and emerging
growth companies requires specialized research and analysis. In addition, many investors cannot invest sufficient assets in such companies to provide wide diversification.
Small companies are generally
little known to most individual investors although some may be dominant in their respective industries. The subadviser believes that relatively small companies will continue to have the opportunity to develop into
significant business enterprises. The Fund may invest in securities of small issuers in the relatively early stages of business development that have a new technology, a unique or proprietary product or service, or a
favorable market position. Such companies may not be counted upon to develop into major industrial companies, but Fund management believes that eventual recognition of their special value characteristics by the
investment community can provide above-average long-term growth to the portfolio.
Equity securities of specific small
cap issuers may present different opportunities for long-term capital appreciation during varying portions of economic or securities markets cycles, as well as during varying stages of their business development. The
market valuation of small cap issuers tends to fluctuate during economic or market cycles, presenting attractive investment opportunities at various points during these cycles. Smaller companies, due to the size and
kinds of markets that they serve, may be less susceptible than large companies to intervention from the federal government by means of price controls, regulations or litigation.
SHORT SALES AND SHORT SALES
AGAINST-THE-BOX. The Fund may make short sales of securities, either as a hedge against potential declines in value of a portfolio security or to realize appreciation when a security that the Fund does not
own declines in value. Because making short sales in securities not owned by the Fund exposes the Fund to the risks associated with those securities, such short sales involve speculative exposure risk. As a result, if
the Fund makes short sales in securities that increase in value, the Fund will likely underperform similar mutual funds that do not make short sales in securities they do not own. The Fund will incur a loss as a
result of a short sale if the price of the security increases between the date of the short sale and the date on which the Fund replaces the borrowed security. The Fund will realize a gain if the security declines in
price between those dates. There can be no assurance that the Fund will be able to close out a short sale position at any particular time or at a desired price. Although the Fund’s gain is limited to the price
at which the Fund sold the security short, its potential loss is limited only by the maximum attainable price of the security, less the price at which the security was sold and may, theoretically, be unlimited. There
is also a risk that a borrowed security will need to be returned to the broker/dealer on short notice. If the request for the return of a security occurs at a time when other short sellers of the security are
receiving similar requests, a “short squeeze” can occur, meaning that the Fund might be compelled, at the most disadvantageous time, to replace the borrowed security with a security purchased on the open
market, possibly at prices significantly in excess of the proceeds received earlier.
The Fund has a short position in
the securities sold short until it delivers to the broker/dealer the securities sold, at which time the Fund receives the proceeds of the sale. In addition, the Fund is required to pay to the broker/dealer the amount
of any dividends or interest paid on shares sold short. The Fund will normally close out a short position by purchasing on the open market and delivering to the broker/dealer an equal amount of the securities sold
short.
The Fund may also make short sales
against-the-box. A short sale against-the-box is a short sale in which the Fund owns an equal amount of the securities sold short, or securities convertible or exchangeable for, with or without payment of any further
consideration, such securities. However, if further consideration is required in connection with the conversion or exchange, cash or other liquid assets, in an amount equal to such consideration, must be segregated on
the Fund’s records or with its Custodian.
SOVEREIGN DEBT. Investment in sovereign debt can involve a high degree of risk. The governmental entity that controls the repayment of sovereign debt may not be able or willing to repay the principal
and/or interest when due in accordance with the terms of such debt. A governmental entity's willingness or ability to repay principal and interest due in a timely manner may be affected by, among other factors, its
cash flow situation, the extent of its foreign reserves, the availability of sufficient foreign exchange on the date a payment is due, the relative size of the debt service burden to the economy as a whole, the
governmental entity's policy towards the International Monetary Fund and the political constraints to which a governmental entity may be subject. Governmental entities may also be dependent on expected disbursements
from foreign governments, multilateral agencies and others abroad to reduce principal and interest arrearages on their debt. The commitment on the part of these governments, agencies and others to make such
disbursements may be conditioned on the implementation of economic reforms and/or economic performance and the timely service of such debtor's obligations. Failure to implement such reforms, achieve such levels of
economic performance or repay principal or interest when due may result in the cancellation of such third parties' commitments to lend funds to the governmental entity, which may further impair such debtor's ability
or willingness to timely service its debts. Consequently, governmental entities may default on
24
their sovereign debt. Holders of sovereign debt may
be requested to participate in the rescheduling of such debt and to extend further loans to governmental entities. In the event of a default by a governmental entity, there may be few or no effective legal remedies
for collecting on such debt.
STANDBY COMMITMENT AGREEMENTS. The Fund may enter into standby commitment agreements. These agreements commit the Fund, for a stated period of time, to purchase a stated amount of securities that may be issued and sold
to the Fund at the option of the issuer. The price of the security is fixed at the time of the commitment. At the time of entering into the agreement the Fund is paid a commitment fee, regardless of whether or not the
security is ultimately issued. The Fund will enter into such agreements for the purpose of investing in the security underlying the commitment at a price that is considered advantageous to the Fund. The Fund will
limit investment in such commitments so that the aggregate purchase price of securities subject to such commitments, together with the value of portfolio securities subject to legal restrictions on resale that affect
their marketability, will not exceed 15% of its net assets taken at the time of the commitment. Liquid assets are segregated by the Fund in an aggregate amount equal to the purchase price of the securities underlying
the commitment. There can be no assurance that the securities subject to a standby commitment will be issued, and the value of the security, if issued, on the delivery date may be more or less than its purchase price.
Since the issuance of the security underlying the commitment is at the option of the issuer, the Fund may bear the risk of a decline in the value of such security and may not benefit from any appreciation in the value
of the security during the commitment period. The purchase of a security subject to a standby commitment agreement and the related commitment fee will be recorded on the date on which the security can reasonably be
expected to be issued, and the value of the security thereafter will be reflected in the calculation of the Fund’s NAV. The cost basis of the security will be adjusted by the amount of the commitment fee. In the
event the security is not issued, the commitment fee will be recorded as income on the expiration date of the standby commitment.
STRIPPED SECURITIES. Stripped securities are created when the issuer separates the interest and principal components of an instrument and sells them as separate securities. In general, one security is entitled
to receive the interest payments on the underlying assets (the interest only or “IO” security) and the other to receive the principal payments (the principal only or “PO” security). Some
stripped securities may receive a combination of interest and principal payments. The yields to maturity on IOs and POs are sensitive to the expected or anticipated rate of principal payments (including prepayments)
on the related underlying assets, and principal payments may have a material effect on yield to maturity. If the underlying assets experience greater than anticipated prepayments of principal, the Fund may not fully
recoup its initial investment in IOs. Conversely, if the underlying assets experience less than anticipated prepayments of principal, the yield on POs could be adversely affected. Stripped securities may be highly
sensitive to changes in interest rates and rates of prepayment.
STRUCTURED NOTES / STRUCTURED
SECURITIES. The Fund may invest in structured securities, including participation notes, structured notes, low exercise price warrants and other related instruments purchased by the Fund that are
generally privately negotiated financial instruments where the interest or value of the structured security is linked to equity securities or equity indices or other instruments or indices (reference instruments).
Issuers of structured securities include corporations and banks. Structured securities are subject to the creditworthiness of the counterparty of the structured security, and their values may decline substantially if
the counterparty's creditworthiness deteriorates.
Structured securities differ from
debt securities in several aspects. The interest rate or the principal amount payable upon maturity or redemption may increase or decrease, depending upon changes in the value of the reference instrument. The terms of
a structured security may provide that, in certain circumstances, no principal is due at maturity and, therefore, may result in a loss of invested capital by the Fund. Receipt of the reference instrument is also, in
certain circumstances, exchanged upon maturity of the security.
A structured security may be
positively, negatively, or both positively and negatively indexed; that is, its value or interest rate may increase or decrease if the value of the reference instrument increases. Similarly, its value or interest rate
may increase or decrease if the value of the reference instrument decreases. Further, the change in the principal amount payable with respect to, or the interest rate of, a structured security may be calculated as a
multiple of the percentage change (positive or negative) in the value of the underlying reference instrument(s); therefore, the value of such structured security may be very volatile. Also, caps can be placed on the
amount of appreciation with regard to the reference instrument.
Structured securities may entail a
greater degree of market risk because the investor bears the risk of the reference instrument. Structured securities may also be more volatile, less liquid, and more difficult to accurately price than less complex
securities. The secondary market for structured securities could be illiquid, making them difficult to sell when the Fund determines to sell them. The possible lack of a liquid secondary market for structured
securities and the resulting inability of the Fund to sell a structured security could expose the Fund to losses and could make structured securities more difficult for the Fund to value accurately.
25
SUPRANATIONAL ENTITIES. The Fund may invest in debt securities of supranational entities. Examples include the World Bank, the European Steel and Coal Community, the Asian Development Bank and the Inter-American
Development Bank. The government members, or “stockholders,” usually make initial capital contributions to the supranational entity and in many cases are committed to make additional capital contributions
if the supranational entity is unable to repay its borrowings.
TEMPORARY DEFENSIVE STRATEGY AND
SHORT-TERM INVESTMENTS. The Fund may temporarily invest without limit in money market instruments, including commercial paper of US corporations, certificates of deposit, bankers' acceptances and other
obligations of domestic banks, and obligations issued or guaranteed by the US Government, its agencies or its instrumentalities, as part of a temporary defensive strategy.
The Fund may invest in money market
instruments to maintain appropriate liquidity to meet anticipated redemptions. Money market instruments typically have a maturity of one year or less as measured from the date of purchase. The Fund also may
temporarily hold cash or invest in money market instruments pending investment of proceeds from new sales of Fund shares or during periods of portfolio restructuring.
YANKEE OBLIGATIONS. The Fund may invest in US dollar-denominated debt securities of foreign corporations issued in the United States and US dollar-denominated debt securities issued or guaranteed as to
payment of principal and interest by governments, quasi-governmental entities, government agencies, and other governmental entities of foreign countries and supranational entities, which securities are issued in the
United States (Yankee obligations). Debt securities of quasi-governmental entities are issued by entities owned by either a national, state or equivalent government or are obligations of a political unit that is not
backed by the national government’s full faith and credit and general taxing powers. These include, among others, the Province of Ontario and the City of Tokyo.
UTILITY INDUSTRIES. Risks that are intrinsic to the utility industries include difficulty in obtaining an adequate return on invested capital, difficulty in financing large construction programs during an
inflationary period, restrictions on operations and increased cost and delays attributable to environmental considerations and regulation, difficulty in raising capital in adequate amounts on reasonable terms in
periods of high inflation and unsettled capital markets, technological innovations that may render existing plants, equipment or products obsolete, the potential impact of natural or man-made disasters, increased
costs and reduced availability of certain types of fuel, occasionally reduced availability and high costs of natural gas for resale, the effects of energy conservation, the effects of a national energy policy and
lengthy delays and greatly increased costs and other problems associated with the design, construction, licensing, regulation and operation of nuclear facilities for electric generation, including, among other
considerations, the problems associated with the use of radioactive materials and the disposal of radioactive wastes. There are substantial differences between the regulatory practices and policies of various
jurisdictions, and any given regulatory agency may make major shifts in policy from time to time. There is no assurance that regulatory authorities will, in the future, grant rate increases or that such increases will
be adequate to permit the payment of dividends on common stocks. Additionally, existing and possible future regulatory legislation may make it even more difficult for these utilities to obtain adequate relief. Certain
of the issuers of securities held in the Fund’s portfolio may own or operate nuclear generating facilities. Governmental authorities may from time to time review existing policies and impose additional
requirements governing the licensing, construction and operation of nuclear power plants. Prolonged changes in climatic conditions can also have a significant impact on both the revenues of an electric and gas utility
as well as the expenses of a utility, particularly a hydro-based electric utility.
Utility companies in the United
States and in foreign countries are generally subject to regulation. In the United States, most utility companies are regulated by state and/or federal authorities. Such regulation is intended to ensure appropriate
standards of service and adequate capacity to meet public demand. Generally, prices are also regulated in the United States and in foreign countries with the intention of protecting the public while ensuring that the
rate of return earned by utility companies is sufficient to allow them to attract capital in order to grow and continue to provide appropriate services. There can be no assurance that such pricing policies or rates of
return will continue in the future.
The nature of regulation of the
utility industries continues to evolve both in the United States and in foreign countries. In recent years, changes in regulation in the United States increasingly have allowed utility companies to provide services
and products outside their traditional geographic areas and lines of business, creating new areas of competition within the industries. In some instances, utility companies are operating on an unregulated basis.
Because of trends toward deregulation and the evolution of independent power producers as well as new entrants to the field of telecommunications, non-regulated providers of utility services have become a significant
part of their respective industries. The subadviser believes that the emergence of competition and deregulation will result in certain utility companies being able to earn more than their traditional regulated rates
of return, while others may be forced to defend their core business from increased competition and may be less profitable. Reduced profitability, as well as new uses of funds (such as
26
for expansion, operations or stock buybacks) could
result in cuts in dividend payout rates. The subadviser seeks to take advantage of favorable investment opportunities that may arise from these structural changes. Of course, there can be no assurance that favorable
developments will occur in the future.
Foreign utility companies are also
subject to regulation, although such regulations may or may not be comparable to those in the United States. Foreign utility companies may be more heavily regulated by their respective governments than utilities in
the United States and, as in the United States, generally are required to seek government approval for rate increases. In addition, many foreign utilities use fuels that may cause more pollution than those used in the
United States, which may require such utilities to invest in pollution control equipment to meet any proposed pollution restrictions. Foreign regulatory systems vary from country to country and may evolve in ways
different from regulation in the United States.
The Fund’s investment
policies are designed to enable it to capitalize on evolving investment opportunities throughout the world. For example, the rapid growth of certain foreign economies will necessitate expansion of capacity in the
utility industries in those countries. Although many foreign utility companies currently are government-owned, thereby limiting current investment opportunities for the Fund, the subadviser believes that, in order to
attract significant capital for growth, foreign governments are likely to seek global investors through the privatization of their utility industries. Privatization, which refers to the trend toward investor ownership
of assets rather than government ownership, is expected to occur in newer, faster-growing economies and in mature economies. Of course, there is no assurance that such favorable developments will occur or that
investment opportunities in foreign markets for the Fund will increase.
The revenues of domestic and
foreign utility companies generally reflect the economic growth and development in the geographic areas in which they do business.
Electric. The electric utility industry consists of companies that are engaged principally in the generation, transmission and sale of electric energy, although many also provide other
energy-related services. In the past, electric utility companies, in general, have been favorably affected by lower fuel and financing costs and the full or near completion of major construction programs. In addition,
many of these companies have generated cash flows in excess of current operating expenses and construction expenditures, permitting some degree of diversification into unregulated businesses. Some electric utilities
have also taken advantage of the right to sell power outside of their traditional geographic areas. Electric utility companies have historically been subject to the risks associated with increases in fuel and other
operating costs, high interest costs on borrowings needed for capital construction programs, costs associated with compliance with environmental and safety regulations and changes in the regulatory climate. As
interest rates declined, many utilities refinanced high cost debt and in doing so improved their fixed charges coverage. Regulators, however, lowered allowed rates of return as interest rates declined and thereby
caused the benefits of the rate declines to be shared wholly or in part with customers. In a period of rising interest rates, the allowed rates of return may not keep pace with the utilities’ increased costs.
The construction and operation of nuclear power facilities are subject to increased scrutiny by, and evolving regulations of, the Nuclear Regulatory Commission and state agencies having comparable jurisdiction.
Increased scrutiny might result in higher operating costs and higher capital expenditures, with the risk that the regulators may disallow inclusion of these costs in rate authorizations or the risk that a company may
not be permitted to operate or complete construction of a facility. In addition, operators of nuclear power plants may be subject to significant costs for disposal of nuclear fuel and for decommissioning such
plants.
The rating agencies look closely at
the business profile of utilities. Ratings for companies are expected to be impacted to a greater extent in the future by the division of their asset base. Electric utility companies that focus more on the generation
of electricity may be assigned less favorable ratings as this business is expected to be competitive and the least regulated. On the other hand, companies that focus on transmission and distribution which is expected
to be the least competitive and the more regulated part of the business may see higher ratings given the greater predictability of cash flow.
A number of states are considering
or have enacted deregulation proposals. The introduction of competition into the industry as a result of such deregulation has at times resulted in lower revenue, lower credit ratings, increased default risk, and
lower electric utility security prices. Such increased competition may also cause long-term contracts, which electric utilities previously entered into to buy power, to become “stranded assets,” which have
no economic value. Any loss associated with such contracts must be absorbed by ratepayers and investors. In addition, in anticipation of increasing competition, some electric utilities have acquired electric utilities
overseas to diversify, enhance earnings and gain experience in operating in a deregulated environment. In some instances, such acquisitions have involved significant borrowings, which have burdened the
acquirer’s balance sheet. There is no assurance that current deregulation proposals will be adopted. However, deregulation in any form could significantly impact the electric utilities industry.
27
Telecommunications. The telecommunications industry today includes both traditional telephone companies, with a history of broad market coverage and highly regulated businesses, and cable companies, which
began as small, lightly regulated businesses focused on limited markets. Today these two historically different businesses are converging in an industry that is trending toward larger, competitive, national and
international markets with an emphasis on deregulation. Companies that distribute telephone services and provide access to the telephone networks still comprise the greatest portion of this segment, but non-regulated
activities such as wireless telephone services, paging, data transmission and processing, equipment retailing, computer software and hardware and internet services are becoming increasingly significant components as
well. In particular, wireless and internet telephone services continue to gain market share at the expense of traditional telephone companies. The presence of unregulated companies in this industry and the entry of
traditional telephone companies into unregulated or less regulated businesses provide significant investment opportunities with companies which may increase their earnings at faster rates than had been allowed in
traditional regulated businesses. Still, increasing competition, technological innovations and other structural changes could adversely affect the profitability of such utilities and the growth rate of their
dividends. Given mergers and proposed legislation and enforcement changes, it is likely that both traditional telephone companies and cable companies will continue to provide an expanding range of utility services to
both residential, corporate and governmental customers.
Gas. Gas transmission companies and gas distribution companies are undergoing significant changes. In the United States, interstate transmission companies are regulated by the Federal Energy
Regulatory Commission, which is reducing its regulation of the industry. Many companies have diversified into oil and gas exploration and development, making returns more sensitive to energy prices. In the recent
decade, gas utility companies have been adversely affected by disruptions in the oil industry and have also been affected by increased concentration and competition. In the opinion of the subadviser, however,
environmental considerations could improve the gas industry outlook in the future. For example, natural gas is the cleanest of the hydrocarbon fuels, and this may result in incremental shifts in fuel consumption
toward natural gas and away from oil and coal, even for electricity generation. However, technological or regulatory changes within the industry may delay or prevent this result.
Water. Water supply utilities are companies that collect, purify, distribute and sell water. In the United States and around the world the industry is highly fragmented because most of the
supplies are owned by local authorities. Companies in this industry are generally mature and are experiencing little or no per capita volume growth. In the opinion of the subadviser, there may be opportunities for
certain companies to acquire other water utility companies and for foreign acquisition of domestic companies. The subadviser believes that favorable investment opportunities may result from consolidation of this
segment. As with other utilities, however, increased regulation, increased costs and potential disruptions in supply may adversely affect investments in water supply utilities. There can be no assurance that the
positive developments noted above, including those relating to privatization and changing regulation, will occur or that risk factors other than those noted above will not develop in the future.
WARRANTS AND RIGHTS. Warrants and rights are securities permitting, but not obligating, the warrant holder to subscribe for other securities. Buying a warrant does not make the Fund a shareholder of the
underlying stock. The warrant holder has no right to dividends or votes on the underlying stock. A warrant does not carry any right to assets of the issuer, and for this reason investment in warrants may be more
speculative than other equity-based investments.
WHEN-ISSUED SECURITIES, DELAYED
DELIVERY SECURITIES AND FORWARD COMMITMENTS. The Fund may purchase or sell securities that the Fund is entitled to receive on a when-issued basis. The Fund may also purchase or sell securities on a delayed delivery basis or through a
forward commitment. These transactions involve the purchase or sale of securities by the Fund at an established price with payment and delivery taking place in the future. The Fund enters into these transactions to
obtain what is considered an advantageous price to the Fund at the time of entering into the transaction. The Fund has not established any limit on the percentage of its assets that may be committed in connection with
these transactions. When the Fund purchases securities in these transactions, the Fund segregates liquid securities in an amount equal to the amount of its purchase commitments.
There can be no assurance that a
security purchased on a when-issued basis will be issued or that a security purchased or sold through a forward commitment will be delivered. The value of securities in these transactions on the delivery date may be
more or less than the Fund’s purchase price. The Fund may bear the risk of a decline in the value of the security in these transactions and may not benefit from an appreciation in the value of the security
during the commitment period.
US GOVERNMENT SECURITIES. The Fund may invest in adjustable rate and fixed rate US Government securities. US Government securities are instruments issued or guaranteed by the US Treasury or by an agency or
instrumentality of the US Government. US Government guarantees do not extend to the yield or value of the securities or the Fund’s shares. Not all US Government securities are backed by the full faith and credit
of the United States. Some are supported only by the credit of the issuing agency.
28
US Treasury securities include
bills, notes, bonds and other debt securities issued by the US Treasury. These instruments are direct obligations of the US Government and, as such, are backed by the full faith and credit of the United States. They
differ primarily in their interest rates, the lengths of their maturities and the dates of their issuances.
Securities issued by agencies of
the US Government or instrumentalities of the US Government, including those which are guaranteed by Federal agencies or instrumentalities, may or may not be backed by the full faith and credit of the United States.
Obligations of Ginnie Mae, the Farmers Home Administration and the Small Business Administration are backed by the full faith and credit of the United States. In the case of securities not backed by the full faith and
credit of the United States, the Fund must look principally to the agency issuing or guaranteeing the obligation for ultimate repayment and may not be able to assert a claim against the United States if the agency or
instrumentality does not meet its commitments.
The Fund may also invest in
component parts of US Government securities, namely either the corpus (principal) of such obligations or one or more of the interest payments scheduled to be paid on such obligations. These obligations may take the
form of (1) obligations from which the interest coupons have been stripped; (2) the interest coupons that are stripped; (3) book-entries at a Federal Reserve member bank representing ownership of obligation components;
or (4) receipts evidencing the component parts (corpus or coupons) of US Government obligations that have not actually been stripped. Such receipts evidence ownership of component parts of US Government obligations
(corpus or coupons) purchased by a third party (typically an investment banking firm) and held on behalf of the third party in physical or book-entry form by a major commercial bank or trust company pursuant to a
custody agreement with the third party. The Fund may also invest in custodial receipts held by a third party that are not US Government securities.
ZERO COUPON SECURITIES, PAY-IN-KIND
SECURITIES AND DEFERRED PAYMENT SECURITIES. The Fund may invest in zero coupon securities. Zero coupon securities are securities that are sold at a discount to par value and on which interest payments are not made during the life of
the security. The discount approximates the total amount of interest the security will accrue and compound over the period until maturity on the particular interest payment date at a rate of interest reflecting the
market rate of the security at the time of issuance. Upon maturity, the holder is entitled to receive the par value of the security. While interest payments are not made on such securities, holders of such securities
are deemed to have received income (“phantom income”) annually, notwithstanding that cash may not be received currently. To the extent a distribution is paid, there may be uncertainty about the source of
the distribution. The effect of owning instruments that do not make current interest payments is that a fixed yield is earned not only on the original investment but also, in effect, on all discount accretion during
the life of the obligations. This implicit reinvestment of earnings at the same rate eliminates the risk of being unable to invest distributions at a rate as high as the implicit yield on the zero coupon bond, but at
the same time eliminates the holder's ability to reinvest at higher rates in the future. For this reason, some of these securities may be subject to substantially greater price fluctuations during periods of changing
market interest rates than are comparable securities that pay interest currently, which fluctuation increases the longer the period to maturity. These investments benefit the issuer by mitigating its need for cash to
meet debt service, but also require a higher rate of return to attract investors who are willing to defer receipt of cash. Because these securities do not pay current cash income, their price can be volatile when
interest rates fluctuate and an investment in these securities generally has a greater potential for complete loss of principal and/or return than an investment in debt securities that make periodic interest payments.
Such investments are more vulnerable to the creditworthiness of the issuer and any other parties upon which performance relies. If the issuer defaults, the Fund may not obtain any return on its investment. These
securities may be subject to less liquidity in the event of adverse market conditions than comparably rated securities that pay cash interest at regular intervals. The Fund accrues income with respect to these
securities for federal income tax and accounting purposes prior to the receipt of cash payments.
Pay-in-kind securities are
securities that have interest payable by delivery of additional securities. Upon maturity, the holder is entitled to receive the aggregate par value of the securities. Deferred payment securities are securities that
remain a zero coupon security until a predetermined date, at which time the stated coupon rate becomes effective and interest becomes payable at regular intervals. Pay-in-kind and deferred payment securities may be
subject to greater fluctuation in value and lesser liquidity in the event of adverse market conditions than comparable rated securities paying cash interest at regular intervals.
In addition to the above described
risks, there are certain other risks related to investing in zero coupon, pay-in-kind and deferred payment securities. During a period of severe market conditions, the market for such securities may become even less
liquid. In addition, as these securities do not pay cash interest, the Fund’s investment exposure to these securities and their risks, including credit risk, will increase during the time these securities are
held in the Fund’s portfolio. Further, to maintain its qualification for pass-through treatment under the federal tax laws, the Fund is required to distribute income to its shareholders and, consequently, may
have to dispose of its portfolio securities under disadvantageous circumstances to generate the cash, or may have to leverage itself by borrowing the cash to satisfy these distributions, as they relate to the
distribution of phantom income and the value of the paid-in-kind interest. The required distributions will result in an increase in the Fund’s exposure to such securities.
29
MASTER LIMITED PARTNERSHIPS. A Master Limited Partnership (“MLP”) is an entity receiving partnership taxation treatment under the Internal Revenue Code of 1986, as amended (the “Code”), and
whose interests or “units” are traded on securities exchanges like shares of corporate stock. A typical MLP consists of a general partner and limited partners; however, some entities receiving partnership
taxation treatment under the Code are established as limited liability companies. The general partner manages the partnership; has an ownership stake in the partnership; and is typically eligible to receive an
incentive distribution. The limited partners provide capital to the partnership, have a limited (if any) role in the operation and management of the partnership, and receive cash distributions. Due to their
partnership structure, MLPs generally do not pay income taxes.
Holders of MLP units could
potentially become subject to liability for all of the obligations of an MLP, if a court determines that the rights of the unit-holders to take certain action under the limited partnership agreement would constitute
control of the business of that MLP, or if a court or governmental agency determines that the MLP is conducting business in a state without complying with the limited partnership statute of that state.
To be treated as a partnership for
US federal income tax purposes, an MLP must derive at least 90% of its gross income for each taxable year from qualifying sources, including activities such as the exploration, development, mining, production,
processing, refining, transportation, storage and certain marketing of mineral or natural resources. Many of the MLPs in which the Fund invests either directly or through an Underlying Prudential Fund operate oil, gas
or petroleum facilities, or other facilities within the energy sector.
INVESTMENT RESTRICTIONS
The Fund has adopted the
restrictions listed below as fundamental policies. Under the 1940 Act, a fundamental policy is one which cannot be changed without the approval of the holders of a majority of the Fund’s outstanding voting
securities. A “majority of the Fund’s outstanding voting securities,” when used in this SAI, means the lesser of (i) 67% of the voting shares represented at a meeting at which more than 50% of the
outstanding voting shares are present in person or represented by proxy or (ii) more than 50% of the outstanding voting shares.
The Fund may not:
1. Purchase the securities of any
issuer if, as a result, the Fund would fail to be a diversified company within the meaning of the 1940 Act, and the rules and regulations promulgated thereunder, as such statute, rules and regulations are amended from
time to time or are interpreted from time to time by the SEC staff (collectively, the 1940 Act Laws and Interpretations) or to the extent that the Fund may be permitted to do so by exemptive order or similar relief
(collectively, with the 1940 Act Laws and Interpretations, the 1940 Act Laws, Interpretations and Exemptions). The Fund is a “diversified company” as defined in the 1940 Act.
2. Issue senior securities or
borrow money or pledge its assets, except as permitted by the 1940 Act Laws, Interpretations and Exemptions.
3. Buy or sell real estate, except
that investments in securities of issuers that invest in real estate and investments in mortgage-backed securities, mortgage participations or other instruments supported by interests in real estate are not subject to
this limitation, and except that the Fund may exercise rights under agreements relating to such securities, including the right to enforce security interests and to hold real estate acquired by reason of such
enforcement until that real estate can be liquidated in an orderly manner.
4. Make loans, except through loans
of assets of the Fund or through repurchase agreements, provided that for purposes of this limitation, the acquisition of bonds, debentures, other debt securities or instruments, or participations or other interests
therein and investments in government obligations, commercial paper, certificates of deposit, bankers’ acceptances or similar instruments will not be considered the making of a loan.
5. Purchase any security if as a
result 25% or more of the Fund’s total assets would be invested in the securities of issuers having their principal business activities in the same industry, except for temporary defensive purposes, and except
that this limitation does not apply to securities issued or guaranteed by the U.S. government, its agencies or instrumentalities.
6. Act as underwriter except to the
extent that, in connection with the disposition of portfolio securities, it may be deemed to be an underwriter under certain federal securities laws. The Fund may purchase restricted securities without limit.
For purposes of investment
restriction number 1, the Fund may not purchase any security (other than obligations of the U.S. government, its agencies or instrumentalities) if as a result: (i) with respect to 75% of a Fund’s total assets,
more than 5% of such assets (determined at the time of investment) would then be invested in securities of a single issuer, or (ii ) 25% or more of the Fund’s total assets (determined at the time of investment)
would be invested in a single industry.
30
For purposes of investment
restriction number 2, under the 1940 Act, the Fund can borrow money from a bank provided that immediately after such borrowing there is asset coverage of at least 300% for all borrowings. If the asset coverage falls
below 300%, the Fund must, within three business days, reduce the amount of its borrowings to satisfy the 300% requirement.
For purposes of investment
restriction number 5, the Fund will not consider investment companies to be an industry for purposes of this policy, and the Fund's investment in an investment company that concentrates its investments in a particular
industry or group of industries will not be considered an investment by the Fund in that particular industry or group of industries. Under this interpretation, the Fund will be permitted to invest 25% or more of its
total assets in one or more Underlying Funds that themselves may invest 25% or more of their total assets in a particular industry or group of industries. As a result, the Fund will be permitted to expose 25% or more
of its assets to the risks of the industry or group of industries in which an Underlying Fund invests. Generally, a more concentrated investment strategy can be riskier and more volatile than a broad diversified
strategy.
Whenever any fundamental investment
policy or investment restriction states a maximum percentage of a Fund’s assets, it is intended that if the percentage limitation is met at the time the investment is made, a later change in percentage resulting
from changing total or NAV will not be considered a violation of such policy.
As a matter of non-fundamental
operating policy, a Fund will not purchase rights if as a result the Fund would then have more than 5% of its assets (determined at the time of investment) invested in rights.
INFORMATION ABOUT BOARD MEMBERS
AND OFFICERS
Information about Board Members and
Officers of the Fund is set forth below. Board Members who are not deemed to be “interested persons” of the Fund, as defined in the 1940 Act, are referred to as “Independent Board Members.”
Board Members who are deemed to be “interested persons” of the Fund are referred to as “Interested Board Members.” The Board Members are responsible for the overall supervision of the
operations of the Fund and perform the various duties imposed on the directors of investment companies by the 1940 Act. The Board in turn elects the Officers, who are responsible for administering the day-to-day
operations of the Fund.
| Independent Board Members(1) | ||
| Name, Address, Age Position(s) Portfolios Overseen |
Principal Occupation(s) During Past Five Years | Other Directorships Held |
| Ellen S. Alberding (56) Board Member Portfolios Overseen: 69 |
President and Board Member, The Joyce Foundation (charitable foundation) (since 2002); Vice Chair, City Colleges of Chicago (community college system) (since 2011); Trustee, Skills for America’s Future (national initiative to connect employers to community colleges) (since 2011); Trustee, National Park Foundation (charitable foundation for national park system) (since 2009); Trustee, Economic Club of Chicago (since 2009). | None. |
| Kevin J. Bannon (62) Board Member Portfolios Overseen: 70 |
Managing Director (since April 2008) and Chief Investment Officer (October 2008-November 2013) of Highmount Capital LLC (registered investment adviser); formerly Executive Vice President and Chief Investment Officer (April 1993-August 2007) of Bank of New York Company; President (May 2003-May 2007) of BNY Hamilton Family of Mutual Funds. | Director of Urstadt Biddle Properties (equity real estate investment trust) (since September 2008). |
| Linda W. Bynoe (62) Board Member Portfolios Overseen: 70 |
President and Chief Executive Officer (since March 1995) and formerly Chief Operating Officer (December 1989-February 1995) of Telemat Ltd. (management consulting); formerly Vice President (January 1985-June 1989) at Morgan Stanley & Co. (broker-dealer). | Director of Simon Property Group, Inc. (retail real estate) (May 2003-May 2012); Director of Anixter International, Inc. (communication products distributor) (since January 2006); Director of Northern Trust Corporation (financial services) (since April 2006); Trustee of Equity Residential (residential real estate) (since December 2009). |
| Keith F. Hartstein (58) Board Member Portfolios Overseen: 70 |
Retired; Member (since November 2014) of the Governing Council of the Independent Directors Council (organization of independent mutual fund directors); formerly President and Chief Executive Officer (2005-2012), Senior Vice President (2004-2005), Senior Vice President of Sales and Marketing (1997-2004), and various executive management positions (1990-1997), John Hancock Funds, LLC (asset management); Chairman, Investment Company Institute’s Sales Force Marketing Committee (2003-2008). | None. |
31
| Independent Board Members(1) | ||
| Name, Address, Age Position(s) Portfolios Overseen |
Principal Occupation(s) During Past Five Years | Other Directorships Held |
| Michael S. Hyland, CFA (69) Board Member Portfolios Overseen: 69 |
Retired (since February 2005); formerly Senior Managing Director (July 2001-February 2005) of Bear Stearns & Co, Inc.; Global Partner, INVESCO (1999-2001); Managing Director and President of Salomon Brothers Asset Management (1989-1999). | None. |
| Douglas H. McCorkindale (75) Board Member Portfolios Overseen: 69 |
Retired; formerly Chairman (February 2001-June 2006), Chief Executive Officer (June 2000-July 2005), President (September 1997-July 2005) and Vice Chairman (March 1984-May 2000) of Gannett Co. Inc. (publishing and media). | Director of Lockheed Martin Corp. (aerospace and defense) (since May 2001). |
| Stephen P. Munn (72) Board Member Portfolios Overseen: 70 |
Lead Director (since 2007) and formerly Chairman (1993-2007) of Carlisle Companies Incorporated (manufacturer of industrial products). | Lead Director (since 2007) of Carlisle Companies Incorporated (manufacturer of industrial products). |
| James E. Quinn (62) Board Member Portfolios Overseen: 69 |
Retired; formerly President (2003-2012) and Director (2003-2008), and Vice Chairman and Director (1998-2003), Tiffany & Company (jewelry retailing); Director, Mutual of America Capital Management Corporation (asset management) (since 1996); Director, Hofstra University (since 2008); Vice Chairman, Museum of the City of New York (since 1994). | Director of Deckers Outdoor Corporation (footwear manufacturer) (since 2011). |
| Richard A. Redeker (71) Board Member & Independent Chair Portfolios Overseen: 70 |
Retired Mutual Fund Senior Executive (44 years); Management Consultant; Director, Mutual Fund Directors Forum (since 2014); Independent Directors Council (organization of independent mutual fund directors)-Executive Committee, Chair of Policy Steering Committee, Governing Council. | None. |
| Robin B. Smith (75) Board Member Portfolios Overseen:70 |
Chairman of the Board (since January 2003) of Publishers Clearing House (direct marketing); Member of the Board of Directors of ADLPartner (marketing) (since December 2010); formerly Chairman and Chief Executive Officer (August 1996-January 2003) of Publishers Clearing House. | Formerly Director of BellSouth Corporation (telecommunications) (1992-2006). |
| Stephen G. Stoneburn (71) Board Member Portfolios Overseen: 70 |
Chairman, (since July 2011), President and Chief Executive Officer (since June 1996) of Quadrant Media Corp. (publishing company); formerly President (June 1995-June 1996) of Argus Integrated Media, Inc.; Senior Vice President and Managing Director (January 1993-1995) of Cowles Business Media; Senior Vice President of Fairchild Publications, Inc. (1975-1989). | None. |
| Interested Board Members(1) | ||
| Name, Address, Age Position(s) Portfolios Overseen |
Principal Occupation(s) During Past Five Years | Other Directorships Held |
| Stuart S. Parker (52) Board Member & President Portfolios Overseen: 64 |
President of Prudential Investments LLC (since January 2012); Executive Vice President of Prudential Investment Management Services LLC (since December 2012); Executive Vice President of Jennison Associates LLC and Head of Retail Distribution of Prudential Investments LLC (June 2005-December 2011). | None. |
| Scott E. Benjamin (41) Board Member & Vice President Portfolios Overseen: 70 |
Executive Vice President (since June 2009) of Prudential Investments LLC; Executive Vice President (June 2009-June 2012) and Vice President (since June 2012) of Prudential Investment Management Services LLC; Executive Vice President (since September 2009) of AST Investment Services, Inc.; Senior Vice President of Product Development and Marketing, Prudential Investments (since February 2006); Vice President of Product Development and Product Management, Prudential Investments (2003-2006). | None. |
32
| Interested Board Members(1) | ||
| Name, Address, Age Position(s) Portfolios Overseen |
Principal Occupation(s) During Past Five Years | Other Directorships Held |
| Grace C. Torres* (55) Board Member Portfolios Overseen: 65 |
Retired; formerly Treasurer and Principal Financial and Accounting Officer of the Prudential Investments Funds, Target Funds, Advanced Series Trust, Prudential Variable Contract Accounts and The Prudential Series Fund (1998-June 2014); Assistant Treasurer (March 1999-June 2014) and Senior Vice President (September 1999-June 2014) of Prudential Investments LLC; Assistant Treasurer (May 2003-June 2014) and Vice President (June 2005-June 2014) of AST Investment Services, Inc.; Senior Vice President and Assistant Treasurer (May 2003-June 2014) of Prudential Annuities Advisory Services, Inc. | None. |
* Note: Prior to her
retirement in 2014, Ms. Torres was employed by Prudential Investments LLC. Due to her prior employment, she is considered to be an “interested person” under the 1940 Act. Ms. Torres is a non-management
Interested Board Member.
(1) The year that each Board Member joined the Funds’ Board is as follows:
Ellen S.
Alberding, 2013; Kevin J. Bannon, 2008; Linda W. Bynoe, 2005; Keith F. Hartstein, 2013; Michael S. Hyland, 2008; Douglas H. McCorkindale, 1998; Stephen P. Munn, 2008; James E. Quinn, 2013; Richard A. Redeker, 2003;
Robin B. Smith, 2003; Stephen G. Stoneburn, 1999; Stuart S. Parker, Board Member and President since 2012; Scott E. Benjamin, Board Member since 2010 and Vice President since 2009’ Grace C. Torres, 2014.
| Fund Officers(a) | ||
| Name, Address and Age Position with Fund |
Principal Occupation(s) During Past Five Years | Length of Service as Fund Officer |
| Raymond A. O’Hara (59) Chief Legal Officer |
Vice President and Corporate Counsel (since July 2010) of Prudential Insurance Company of America (Prudential); Vice President (March 2011-Present) of Pruco Life Insurance Company and Pruco Life Insurance Company of New Jersey; Vice President and Corporate Counsel (March 2011-Present) of Prudential Annuities Life Assurance Corporation; Chief Legal Officer of Prudential Investments LLC (since June 2012); Chief Legal Officer of Prudential Mutual Fund Services LLC (since June 2012) and Corporate Counsel of AST Investment Services, Inc. (since June 2012); formerly Assistant Vice President and Corporate Counsel (September 2008-July 2010) of The Hartford Financial Services Group, Inc.; formerly Associate (September 1980-December 1987) and Partner (January 1988–August 2008) of Blazzard & Hasenauer, P.C. (formerly, Blazzard, Grodd & Hasenauer, P.C.). | Since 2012 |
| Chad A. Earnst (39) Chief Compliance Officer |
Chief Compliance Officer (September 2014-Present) of Prudential Investments LLC; Chief Compliance Officer (September 2014-Present) of the Prudential Investments Funds, Target Funds, Advanced Series Trust, The Prudential Series Fund, Prudential's Gibraltar Fund, Inc., Prudential Global Short Duration High Yield Income Fund, Inc., Prudential Short Duration High Yield Fund, Inc. and Prudential Jennison MLP Income Fund, Inc.; formerly Assistant Director (March 2010-August 2014) of the Asset Management Unit, Division of Enforcement, US Securities & Exchange Commission; Assistant Regional Director (January 2010-August 2014), Branch Chief (June 2006–December 2009) and Senior Counsel (April 2003-May 2006) of the Miami Regional Office, Division of Enforcement, US Securities & Exchange Commission. | Since 2014 |
| Deborah A. Docs (56) Secretary |
Vice President and Corporate Counsel (since January 2001) of Prudential; Vice President (since December 1996) and Assistant Secretary (since March 1999) of Prudential Investments LLC; formerly Vice President and Assistant Secretary (May 2003-June 2005) of AST Investment Services, Inc. | Since 2004 |
| Jonathan D. Shain (56) Assistant Secretary |
Vice President and Corporate Counsel (since August 1998) of Prudential; Vice President and Assistant Secretary (since May 2001) of Prudential Investments LLC; Vice President and Assistant Secretary (since February 2001) of Prudential Mutual Fund Services LLC; formerly Vice President and Assistant Secretary (May 2003-June 2005) of AST Investment Services, Inc. | Since 2005 |
| Claudia DiGiacomo (40) Assistant Secretary |
Vice President and Corporate Counsel (since January 2005) of Prudential; Vice President and Assistant Secretary of Prudential Investments LLC (since December 2005); Associate at Sidley Austin Brown & Wood LLP (1999-2004). | Since 2005 |
| Andrew R. French (52) Assistant Secretary |
Vice President and Corporate Counsel (since February 2010) of Prudential; formerly Director and Corporate Counsel (2006-2010) of Prudential; Vice President and Assistant Secretary (since January 2007) of Prudential Investments LLC; Vice President and Assistant Secretary (since January 2007) of Prudential Mutual Fund Services LLC. | Since 2006 |
| Amanda S. Ryan (36) Assistant Secretary |
Director and Corporate Counsel (since March 2012) of Prudential; Director and Assistant Secretary (since June 2012) of Prudential Investments LLC; Associate at Ropes & Gray LLP (2008-2012). | Since 2012 |
| Theresa C. Thompson (52) Deputy Chief Compliance Officer |
Vice President, Compliance, Prudential Investments LLC (since April 2004); and Director, Compliance, Prudential Investments LLC (2001-2004). | Since 2008 |
33
| Fund Officers(a) | ||
| Name, Address and Age Position with Fund |
Principal Occupation(s) During Past Five Years | Length of Service as Fund Officer |
| Richard W. Kinville (46) Anti-Money Laundering Compliance Officer |
Vice President, Corporate Compliance, Anti-Money Laundering Unit (since January 2005) of Prudential; committee member of the American Council of Life Insurers Anti-Money Laundering and Critical Infrastructure Committee (since January 2007); formerly Investigator and Supervisor in the Special Investigations Unit for the New York Central Mutual Fire Insurance Company (August 1994-January 1999); Investigator in AXA Financial's Internal Audit Department and Manager in AXA's Anti-Money Laundering Office (January 1999-January 2005); first chair of the American Council of Life Insurers Anti-Money Laundering and Critical Infrastructure Committee (June 2007-December 2009). | Since 2011 |
| M. Sadiq Peshimam (50) Treasurer and Principal Financial and Accounting Officer |
Assistant Treasurer of funds in the Prudential Mutual Fund Complex (2006-2014); Vice President (since 2005) of Prudential Investments LLC. | Since 2006 |
| Peter Parrella (56) Assistant Treasurer |
Vice President (since 2007) and Director (2004-2007) within Prudential Mutual Fund Administration; formerly Tax Manager at SSB Citi Fund Management LLC (1997-2004). | Since 2007 |
| Lana Lomuti (47) Assistant Treasurer |
Vice President (since 2007) and Director (2005-2007), within Prudential Mutual Fund Administration; formerly Assistant Treasurer (December 2007-February 2014) of The Greater China Fund, Inc. | Since 2014 |
| Linda McMullin (53) Assistant Treasurer |
Vice President (since 2011) and Director (2008-2011) within Prudential Mutual Fund Administration. | Since 2014 |
(a) Excludes Mr. Parker and Mr. Benjamin, interested Board Members who also serve as President and Vice President, respectively.
Explanatory Notes to Tables:
| ■ | Board Members are deemed to be “Interested,” as defined in the 1940 Act, by reason of their affiliation with Prudential Investments LLC and/or an affiliate of Prudential Investments LLC. |
| ■ | Unless otherwise noted, the address of all Board Members and Officers is c/o Prudential Investments LLC, Gateway Center Three, 100 Mulberry Street, Newark, New Jersey 07102-4077. |
| ■ | There is no set term of office for Board Members or Officers. The Board Members have adopted a retirement policy, which calls for the retirement of Board Members on December 31 of the year in which they reach the age of 75. |
| ■ | “Other Directorships Held” includes only directorships of companies required to register or file reports with the SEC under the 1934 Act (that is, “public companies”) or other investment companies registered under the 1940 Act. |
| ■ | “Portfolios Overseen” includes all investment companies managed by Prudential Investments LLC. The investment companies for which Prudential Investments LLC serves as manager include the Prudential Investments Mutual Funds, The Prudential Variable Contract Accounts, Target Mutual Funds, Prudential Short Duration High Yield Fund, Inc., Prudential Global Short Duration High Yield Fund, Inc., The Prudential Series Fund, Prudential's Gibraltar Fund, Inc. and the Advanced Series Trust. |
COMPENSATION OF BOARD MEMBERS AND
OFFICERS. Pursuant to a management agreement with the Fund, the Manager pays all compensation of Fund Officers and employees as well as the fees and expenses of all Interested Board
Members.
The Fund pay each Independent Board
Member annual compensation in addition to certain out-of-pocket expenses. Independent Board Members who serve on Board Committees may receive additional compensation. The amount of annual compensation paid to each
Independent Board Member may change as a result of the introduction of additional funds on whose Boards the Board Member may be asked to serve.
Independent Board Members may defer
receipt of their fees pursuant to a deferred fee agreement with the Fund. Under the terms of the agreement, the Fund accrue deferred Board Members' fees daily which, in turn, accrue interest at a rate equivalent to
the prevailing rate of 90-day US Treasury Bills at the beginning of each calendar quarter or at the daily rate of return of any mutual fund managed by PI chosen by the Board Member. Payment of the interest so accrued
is also deferred and becomes payable at the option of the Board Member. The obligation to make payments of deferred Board Members' fees, together with interest thereon, is a general obligation of the Fund. No Fund has
a retirement or pension plan for Board Members.
The following table sets forth the
aggregate compensation paid by the Fund for the most recently completed fiscal year to the Independent Board Members for service on the Board, and the Board of any other investment company in the Fund Complex for the
most recently completed calendar year. Board Members and officers who are “interested persons” of the Fund (as defined in the 1940 Act) do not receive compensation from PI-managed funds and therefore are
not shown in the following table.
| Compensation Received by Independent Board Members | ||||
| Name | Aggregate Fiscal Year Compensation from Fund+ |
Pension or Retirement Benefits Accrued as Part of Fund Expenses |
Estimated Annual Benefits Upon Retirement |
Total Compensation from Fund and Fund Complex for Most Recent Calendar Year |
| Ellen S. Alberding | $363 | None | None | $67,834 (32/67)* |
| Kevin J. Bannon | $363 | None | None | $210,000 (32/67)* |
| Linda W. Bynoe** | $363 | None | None | $210,000 (32/67)* |
34
| Compensation Received by Independent Board Members | ||||
| Name | Aggregate Fiscal Year Compensation from Fund+ |
Pension or Retirement Benefits Accrued as Part of Fund Expenses |
Estimated Annual Benefits Upon Retirement |
Total Compensation from Fund and Fund Complex for Most Recent Calendar Year |
| Keith F. Hartstein** | $363 | None | None | $68,834 (32/67)* |
| Michael S. Hyland | $363 | None | None | $216,000 (32/67)* |
| Douglas H. McCorkindale** | $363 | None | None | $208,000 (32/67)* |
| Stephen P. Munn | $360 | None | None | $214,000 (32/67)* |
| James E. Quinn | $363 | None | None | $68,834 (32/67)* |
| Richard A. Redeker | $383 | None | None | $250,000 (32/67)* |
| Robin B. Smith** | $363 | None | None | $208,000 (32/67)* |
| Stephen G. Stoneburn** | $363 | None | None | $212,000 (32/67)* |
| Grace C. Torres† | None | None | None | None |
+During 2014, the Fund
changed its fiscal year-end from July 31 to October 31. Compensation shown above is for the period from August 1, 2014 through October 31, 2014.
†Ms. Torres joined the Board in
December 2014. Ms. Torres serves as a non-management Interested Board Member. Non-management Interested Board Members receive compensation from the Fund for their service on the Board.
Explanatory Notes to Board Member Compensation
Table
* Compensation relates to portfolios that
were in existence for any period during 2013. Number of funds and portfolios represent those in existence as of December 31, 2013, and excludes funds that have merged or liquidated during the year. Additionally, the
number of funds and portfolios includes those which have been approved as of December 31, 2013; however, certain of those funds/portfolios may commence operations after that date. No compensation is paid out from such
funds/portfolios.
** Under the Fund Complex’s
deferred fee agreement, certain Board Members have elected to defer all or part of their total compensation. The total amount of deferred compensation accrued during the calendar year ended December 31, 2013,
including investment results during the year on cumulative deferred fees, amounted to $(26,698), $1,068, $584,562, $1,070,182 and $409,269 for Ms. Bynoe, Mr. Hartstein, Mr. McCorkindale, Ms. Smith, and Mr. Stoneburn,
respectively.
BOARD COMMITTEES. The Board has established three standing committees in connection with Fund governance—Audit, Nominating and Governance, and Investment. Information on the membership of each
standing committee and its functions is set forth below.
Audit Committee: The Board has determined that each member of the Audit Committee is not an “interested person” as defined in the 1940 Act. The responsibilities of the Audit Committee are to
assist the Board in overseeing the Fund's independent registered public accounting firm, accounting policies and procedures and other areas relating to the Fund's auditing processes. The Audit Committee is responsible
for pre-approving all audit services and any permitted non-audit services to be provided by the independent registered public accounting firm directly to the Fund. The Audit Committee is also responsible for
pre-approving permitted services to be provided by the independent registered public accounting firm to (1) the Manager and (2) any entity in a control relationship with the Manager that provides ongoing services to
the Fund, provided that the engagement of the independent registered public accounting firm relates directly to the operation and financial reporting of the Fund. The scope of the Audit Committee's responsibilities is
oversight. It is management's responsibility to maintain appropriate systems for accounting and internal control and the independent registered public accounting firm's responsibility to plan and carry out an audit in
accordance with the standards of the Public Company Accounting Oversight Board (United States). The number of Audit Committee meetings held during the Fund's most recently completed fiscal year is set forth in the
table below.
The membership of the Audit
Committee is set forth below:
Stephen P. Munn (Chair)
Douglas H. McCorkindale
Kevin J. Bannon
Robin B. Smith
Ellen S. Alberding
James E. Quinn
Richard A. Redeker (ex-officio)
Stephen P. Munn (Chair)
Douglas H. McCorkindale
Kevin J. Bannon
Robin B. Smith
Ellen S. Alberding
James E. Quinn
Richard A. Redeker (ex-officio)
Nominating and Governance
Committee: The Nominating and Governance Committee of the Board is responsible for nominating Board Members and making recommendations to the Board concerning Board composition, committee structure
and governance, director education, and governance practices. The Board has determined that each member of the Nominating and Governance Committee is not an “interested person” as defined in the 1940 Act.
The number of Nominating and Governance Committee meetings held during the Fund's most recently completed fiscal year is set forth in the table below. The Nominating and Governance Committee Charter is available on
the Fund's website.
35
The membership of the Nominating
and Governance Committee is set forth below:
Michael S. Hyland, CFA (Chair)
Stephen G. Stoneburn
Linda W. Bynoe
Keith F. Hartstein
Richard A. Redeker (ex-officio)
Michael S. Hyland, CFA (Chair)
Stephen G. Stoneburn
Linda W. Bynoe
Keith F. Hartstein
Richard A. Redeker (ex-officio)
Prudential and
Target Investment Committees: In September 2005, the Board of each fund in the Prudential retail mutual funds complex formed joint committees to review the performance of each Fund in the Fund Complex. The Prudential
Investment Committee reviews the performance of each Fund whose subadvisers are affiliates of the Manager, while the Target Investment Committee reviews the performance of funds whose subadvisers are not affiliates of
the Manager. Each committee meets at least four times per year and reports the results of its review to the full Board of each Fund at each regularly scheduled Board meeting. Every Independent Board Member sits on one
of the two committees. The non-management Interested Board Member sits on one of the committees.
The number of Prudential and Target
Investment Committee meetings, as applicable, held during the Fund's most recently completed fiscal year is set forth in the table below.
The membership of
the Prudential and Target Investment Committees is set forth below:
Prudential Investment Committee
Keith F. Hartstein (Chair)
Richard A. Redeker
Stephen G. Stoneburn
Linda W. Bynoe
Michael S. Hyland, CFA
James E. Quinn
Target Investment Committee
Ellen S. Alberding (Chair)
Kevin J. Bannon
Douglas H. McCorkindale
Robin B. Smith
Stephen P. Munn
Grace C. Torres
Prudential Investment Committee
Keith F. Hartstein (Chair)
Richard A. Redeker
Stephen G. Stoneburn
Linda W. Bynoe
Michael S. Hyland, CFA
James E. Quinn
Target Investment Committee
Ellen S. Alberding (Chair)
Kevin J. Bannon
Douglas H. McCorkindale
Robin B. Smith
Stephen P. Munn
Grace C. Torres
| Board Committee Meetings (for most recently completed fiscal year) | ||
| Audit Committee | Nominating & Governance Committee | Target/Prudential Investment Committee |
| 4 | 4 | 4 |
LEADERSHIP STRUCTURE AND
QUALIFICATIONS OF BOARD MEMBERS. The Board is responsible for oversight of the Fund. The Fund has engaged the Manager to manage the Fund on a day-to-day basis. The Board oversees the Manager and certain other principal
service providers in the operations of the Fund. The Board is currently composed of thirteen members, eleven of whom are Independent Board Members. The Board meets in-person at regularly scheduled meetings four times
throughout the year. In addition, the Board Members may meet in-person or by telephone at special meetings or on an informal basis at other times. As described above, the Board has established three standing
committees—Audit, Nominating and Governance, and Investment—and may establish ad hoc committees or working groups from time to time, to assist the Board in fulfilling its oversight responsibilities. The
Independent Board Members have also engaged independent legal counsel to assist them in fulfilling their responsibilities.
The Board is chaired by an
Independent Board Member. As Chair, this Independent Board Member leads the Board in its activities. Also, the Chair acts as a member or as an ex-officio member of each standing committee and any ad hoc committee of
the Board. The Board Members have determined that the Board's leadership and committee structure is appropriate because the Board believes it sets the proper tone to the relationships between the Fund, on the one
hand, and the Manager, the subadviser(s) and certain other principal service providers, on the other, and facilitates the exercise of the Board's independent judgment in evaluating and managing the relationships. In
addition, the structure efficiently allocates responsibility among committees.
The Board has concluded that, based
on each Board Member's experience, qualifications, attributes or skills on an individual basis and in combination with those of the other Board Members, each Board Member should serve as a Board Member. Among other
attributes common to all Board Members are their ability to review critically, evaluate, question and discuss information provided to
36
them, to interact effectively with the various
service providers to the Fund, and to exercise reasonable business judgment in the performance of their duties as Board Members. In addition, the Board has taken into account the actual service and commitment of the
Board Members during their tenure in concluding that each should continue to serve. A Board Member's ability to perform his or her duties effectively may have been attained through a Board Member's educational
background or professional training; business, consulting, public service or academic positions; experience from service as a Board Member of the Fund, other funds in the Fund Complex, public companies, or non-profit
entities or other organizations; or other experiences. Set forth below is a brief discussion of the specific experience, qualifications, attributes or skills of each Board Member that led the Board to conclude that he
or she should serve as a Board Member.
Ms. Smith and
Messrs. McCorkindale, Redeker, and Stoneburn have each served as a Board Member of mutual funds in the Fund Complex for more than 14 years, including as members and/or Chairs of various Board committees. In addition,
Ms. Smith and Mr. McCorkindale each has more than 35 years and Mr. Stoneburn has more than 30 years of experience as senior executive officers of operating companies and/or as directors of public companies. Mr.
Redeker has more than 44 years of experience as a senior executive in the mutual fund industry. Ms. Bynoe has been a Board Member of the Fund and other funds in the Fund Complex since 2005, having served on the boards
of other mutual fund complexes since 1993. She has worked in the financial services industry over 11 years, has approximately 20 years experience as a management consultant and serves as a Director of financial
services and other complex global corporations. Mr. Munn joined the Board of the Fund and other funds in the Fund Complex in 2008. He previously served as a Board Member of funds managed by PI or its affiliates from
1991 until 2003. In addition, he is the lead director and was the Chairman of an operating business for 14 years. Messrs. Bannon and Hyland joined the Board of the Fund and other funds in the Fund Complex in 2008.
Each has held senior executive positions in the financial services industry, including serving as senior executives of asset management firms, for over 17 years. Ms. Alberding and Messrs. Hartstein and Quinn joined
the Board of the Fund and other funds in the Fund Complex in 2013. Ms. Alberding has 30 years of experience in the non-profit sector, including over 20 years as the president of a charitable foundation, where she
oversees multiple investment managers. Ms. Alberding also served as a Trustee of the Aon Funds from 2000 to 2003. Mr. Hartstein has worked in the asset management industry for almost 30 years and served as a senior
executive in an asset management firm. Mr. Quinn has over 20 years of experience as a senior executive officer and a director of a public company. Mr. Parker, who has served as an Interested Board Member and President
of the Fund and the other funds in the Fund Complex since 2012, is President, Chief Operating Officer and Officer-in-Charge of PI and several of its affiliates that provide services to the Fund and has held senior
positions in PI since 2005. Mr. Benjamin, an Interested Board Member of the Fund and other funds in the Fund Complex since 2010, has served as a Vice President of the Fund and other funds in the Fund Complex since
2009 and has held senior positions in PI since 2003. Ms. Torres, a non-management Interested Board Member of the Fund and other funds in the Fund Complex, formerly served as Treasurer and Principal Financial and
Accounting Officer for the Fund and other funds in the Fund Complex for 16 years and held senior positions with the Manager from 1999 to 2014. Specific details about each Board Member's professional experience appear
in the professional biography tables, above.
Risk Oversight. Investing in general and the operation of a mutual fund involve a variety of risks, such as investment risk, compliance risk, and operational risk, among others. The Board oversees risk as
part of its oversight of the Fund. Risk oversight is addressed as part of various regular Board and committee activities. The Board, directly or through its committees, reviews reports from among others, the Manager,
subadvisers, the Fund's Chief Compliance Officer, the Fund's independent registered public accounting firm, counsel, and internal auditors of the Manager or its affiliates, as appropriate, regarding risks faced by the
Fund and the risk management programs of the Manager and certain service providers. The actual day-to-day risk management with respect to the Fund resides with the Manager and other service providers to the Fund.
Although the risk management policies of the Manager and the service providers are designed to be effective, those policies and their implementation vary among service providers and over time, and there is no
guarantee that they will be effective. Not all risks that may affect the Fund can be identified or processes and controls developed to eliminate or mitigate their occurrence or effects, and some risks are simply
beyond any control of the Fund or the Manager, its affiliates or other service providers.
Selection of Board Member
Nominees. The Nominating and Governance Committee is responsible for considering nominees for Board Members at such times as it considers electing new members to the Board. The Nominating and
Governance Committee may consider recommendations by business and personal contacts of current Board Members, and by executive search firms which the Committee may engage from time to time and will also consider
shareholder recommendations. The Nominating and Governance Committee has not established specific, minimum qualifications that it believes must be met by a nominee. In evaluating nominees, the Nominating and
Governance Committee considers, among other things, an individual's background, skills, and experience; whether the individual is an “interested person” as defined in the 1940 Act; and whether the
individual would be deemed an “audit committee financial expert” within the meaning of applicable SEC rules. The Nominating and Governance Committee also considers whether the individual's background,
skills, and experience will complement the background, skills, and experience of other nominees and will contribute to the diversity of the Board. There are no differences in the manner in which the Nominating and
Governance Committee evaluates nominees for the Board based on whether the nominee is recommended by a shareholder.
37
A shareholder who wishes to
recommend a board member for nomination should submit his or her recommendation in writing to the Chair of the Board (Richard Redeker) or the Chair of the Nominating and Governance Committee (Michael Hyland), in
either case in care of the specified Fund(s), at Gateway Center Three, 100 Mulberry Street, 4th Floor, Newark, New Jersey 07102-4077. At a minimum, the recommendation should include: the name, address and business,
educational and/or other pertinent background of the person being recommended; a statement concerning whether the person is an “interested person” as defined in the 1940 Act; any other information that the
Fund would be required to include in a proxy statement concerning the person if he or she was nominated; and the name and address of the person submitting the recommendation, together with the number of Fund shares
held by such person and the period for which the shares have been held. The recommendation also can include any additional information which the person submitting it believes would assist the Nominating and Governance
Committee in evaluating the recommendation.
Shareholders should note that a
person who owns securities issued by Prudential Financial, Inc. (the parent company of the Fund's Manager) would be deemed an “interested person” under the 1940 Act. In addition, certain other
relationships with Prudential Financial, Inc. or its subsidiaries, with registered broker-dealers, or with the Fund's outside legal counsel may cause a person to be deemed an “interested person.” Before
the Nominating and Governance Committee decides to nominate an individual to the Board, Committee members and other Board Members customarily interview the individual in person. In addition, the individual customarily
is asked to complete a detailed questionnaire which is designed to elicit information which must be disclosed under SEC and stock exchange rules and to determine whether the individual is subject to any statutory
disqualification from serving on the board of a registered investment company.
Share Ownership. Information relating to each Board Member's Fund share ownership and in all registered funds in the PI-advised funds that are overseen by the respective Board Member as of the most
recently completed calendar year is set forth in the chart below.
| Name | Dollar Range of Equity Securities in the Fund |
Aggregate Dollar Range of Equity Securities in All Registered Investment Companies Overseen by Board Member in Fund Complex |
| Board Member Share Ownership: Independent Board Members | ||
| Ellen Alberding | None | Over $100,000 |
| Kevin J. Bannon | None | Over $100,000 |
| Linda W. Bynoe | None | Over $100,000 |
| Keith Hartstein | None | Over $100,000 |
| Michael S. Hyland | None | Over $100,000 |
| Douglas H. McCorkindale | None | Over $100,000 |
| Stephen P. Munn | None | Over $100,000 |
| James E. Quinn | None | Over $100,000 |
| Richard A. Redeker | None | Over $100,000 |
| Robin B. Smith | None | Over $100,000 |
| Stephen G. Stoneburn | None | Over $100,000 |
| Board Member Share Ownership: Interested Board Members | ||
| Stuart S. Parker | None | Over $100,000 |
| Scott E. Benjamin | None | Over $100,000 |
| Grace C. Torres | None | None |
None of the Independent Board Members, or any
member of his/her immediate family, owned beneficially or of record any securities in an investment adviser or principal underwriter of the Fund or a person (other than a registered investment company) directly or
indirectly controlling, controlled by, or under common control with an investment adviser or principal underwriter of the Fund as of the most recently completed calendar year.
Shareholder Communications with Board
Members. Shareholders can communicate directly with Board Members by writing to the Chair of the Board, c/o the Fund, Gateway Center Three, 100 Mulberry Street, 4th Floor, Newark, New Jersey
07102-4077. Shareholders can communicate directly with an individual Board Member by writing to that Board Member, c/o the Fund, Gateway Center Three, 100 Mulberry Street, Newark, New Jersey 07102-4077. Such
communications to the Board or individual Board Members are not screened before being delivered to the addressee.
38
MANAGEMENT & ADVISORY
ARRANGEMENTS
MANAGER. The Manager’s address is Gateway Center Three, 100 Mulberry Street, Newark, NJ 07102-4077. The Manager serves as manager to all of the other investment companies that, together with
the Fund, comprise the Prudential Investments mutual funds. See the Prospectus for more information about PI. As of November 30, 2014, the Manager served as the investment manager to all of the Prudential US and
offshore open-end investment companies, and as administrator to closed-end investment companies, with aggregate assets of approximately $237.8 billion.
The Manager is a wholly-owned
subsidiary of PIFM Holdco LLC, which is a wholly-owned subsidiary of Prudential Asset Management Holding Company LLC, which is a wholly-owned subsidiary of Prudential Financial, Inc. (Prudential). PMFS, an affiliate
of PI, serves as the transfer agent and dividend distribution agent for the Prudential Investments mutual funds and, in addition, provides customer service, record keeping and management and administrative services to
qualified plans.
Pursuant to a management agreement
with the Fund (the Management Agreement), PI, subject to the supervision of the Fund's Board and in conformity with the stated policies of the Fund, manages both the investment operations of the Fund and the
composition of the Fund's portfolio, including the purchase, retention, disposition and loan of securities and other assets. In connection therewith, the Manager is obligated to keep certain books and records of the
Fund. The Manager is authorized to enter into subadvisory agreements for investment advisory services in connection with the management of the Fund. The Manager will continue to have responsibility for all investment
advisory services performed pursuant to any such subadvisory agreements. PI will review the performance of the investment subadviser(s) and make recommendations to the Board with respect to the retention of investment
subadvisers and the renewal of contracts. The Manager also administers the Fund's corporate affairs and, in connection therewith, furnishes the Fund with office facilities, together with those ordinary clerical and
bookkeeping services which are not being furnished by the Fund's custodian (the Custodian) and PMFS. The management services of PI to the Fund are not exclusive under the terms of the Management Agreement and PI is
free to, and does, render management services to others.
PI may from time to time waive all
or a portion of its management fee and subsidize all or a portion of the operating expenses of the Fund. Fee waivers and subsidies will increase the Fund's total return. These voluntary waivers may be terminated at
any time without notice. To the extent that PI agrees to waive its fee or subsidize the Fund's expenses, it may enter into a relationship agreement with the Subadviser to share the economic impact of the fee waiver or
expense subsidy.
In connection with its management
of the corporate affairs of the Fund, PI bears the following expenses:
| ■ | the salaries and expenses of all of its and the Fund's personnel except the fees and expenses of Independent Board Members; |
| ■ | all expenses incurred by the Manager or the Fund in connection with managing the ordinary course of a Fund's business, other than those assumed by the Fund as described below; and |
| ■ | the fees, costs and expenses payable to any investment subadviser pursuant to a subadvisory agreement between PI and such investment subadviser. |
Under the terms of
the Management Agreement, the Fund is responsible for the payment of the following expenses:
| ■ | the fees and expenses incurred by the Fund in connection with the management of the investment and reinvestment of the Fund's assets payable to the Manager; |
| ■ | the fees and expenses of Independent Board Members; |
| ■ | the fees and certain expenses of the Custodian and transfer and dividend disbursing agent, including the cost of providing records to the Manager in connection with its obligation of maintaining required records of the Fund and of pricing the Fund's shares; |
| ■ | the charges and expenses of the Fund's legal counsel and independent auditors and counsel to the Independent Board Members; |
| ■ | brokerage commissions and any issue or transfer taxes chargeable to the Fund in connection with its securities (and futures, if applicable) transactions; |
| ■ | all taxes and corporate fees payable by the Fund to governmental agencies; |
| ■ | the fees of any trade associations of which the Fund may be a member; |
| ■ | the cost of share certificates representing, and/or non-negotiable share deposit receipts evidencing, shares of the Fund; |
| ■ | the cost of fidelity, directors and officers and errors and omissions insurance; |
| ■ | the fees and expenses involved in registering and maintaining registration of the Fund and of its shares with the SEC and paying notice filing fees under state securities laws, including the preparation and printing of the Fund's registration statements and prospectuses for such purposes; allocable communications expenses with respect to investor services and all expenses of shareholders' and Board meetings and of preparing, printing and mailing reports and notices to shareholders; and |
| ■ | litigation and indemnification expenses and other extraordinary expenses not incurred in the ordinary course of the Fund's business and distribution and service (12b-1) fees. |
The Management Agreement provides
that PI will not be liable for any error of judgment by PI or for any loss suffered by the Fund in connection with the matters to which the Management Agreement relates, except a loss resulting from a breach of
fiduciary duty with respect to the receipt of compensation for services (in which case any award of damages shall be limited to the period and the amount
39
set forth in Section 36(b)(3) of the 1940 Act) or
loss resulting from willful misfeasance, bad faith or gross negligence or reckless disregard of duties. The Management Agreement provides that it will terminate automatically if assigned (as defined in the 1940 Act),
and that it may be terminated without penalty by either PI or the Fund by the Board or vote of a majority of the outstanding voting securities of the Fund (as defined in the 1940 Act) upon not more than 60 days', nor
less than 30 days', written notice. The Management Agreement will continue in effect for a period of more than two years from the date of execution only so long as such continuance is specifically approved at least
annually in accordance with the requirements of the 1940 Act.
Fees payable under the Management
Agreement are computed daily and paid monthly. The applicable fee rate under the Management Agreement is set forth below.
The management fee rate for the
Fund is 0.70% up to $1 billion and 0.65% above $1 billion of the Fund’s average daily net assets. Prior to September 23, 2014, the management fee rate for the Fund was 0.75% up to $500 million of average daily
net assets; 0.70% on next $500 million of average daily net assets; and 0.65% over $1 billion of average daily net assets.
| Management Fees Paid by the Fund | ||||
| Fund Name | 2014* | 2014** | 2013** | 2012** |
| Prudential Income Builder Fund | $- | $861,014 | $849,682 | $880,913 |
*During 2014, the Fund
changed its fiscal year-end from July 31 to October 31. The advisory fee amount waived exceeds the advisory fee for the fiscal period from August 1, 2014 through October 31, 2014.
**The figures shown are for the fiscal years
ended July 31, 2014, 2013 and 2012.
SUBADVISORY ARRANGEMENTS. The Manager has entered into subadvisory agreements (Subadvisory Agreements) with the Fund's investment subadvisers. The Subadvisory Agreements provide that the Subadvisers will furnish
investment advisory services in connection with the management of the Fund. In connection therewith, the Subadvisers are obligated to keep certain books and records of the Fund. Under the Subadvisory Agreements, the
Subadvisers, subject to the supervision of PI, are responsible for managing the assets of the Fund in accordance with the Fund's investment objectives, investment program and policies. The Subadvisers determine what
securities and other instruments are purchased and sold for the Fund and are responsible for obtaining and evaluating financial data relevant to the Fund. PI continues to have responsibility for all investment
advisory services pursuant to the Management Agreement and supervises each Subadviser's performance of such services.
As discussed in the Prospectus, PI
employs the Subadvisers under a “manager of managers” structure that allows PI to replace a Subadviser or amend a Subadvisory Agreement without seeking shareholder approval. The Subadvisory Agreements
provide that they will terminate in the event of their assignment (as defined in the 1940 Act) or upon the termination of the Management Agreement. The Subadvisory Agreements may be terminated by the Fund, PI, or the
Subadviser upon not more than 60 days’ nor less than 30 days’ written notice. The Subadvisory Agreements provide that they will continue in effect for a period of not more than two years from their
execution only so long as such continuance is specifically approved at least annually in accordance with the requirements of the 1940 Act.
The applicable fee rate and the
subadvisory fees paid by PI for the indicated fiscal years are set forth below. Subadvisory fees are based on the average daily net assets of the Fund, calculated and paid on a monthly basis, at the fee rate as set
forth in the Subadvisory Agreements. Subadvisory fees are deducted out of the management fees paid by the Fund.
| Subadvisory Fee Rates and Subadvisory Fees Paid* | ||||||
| Income Builder Fund (formerly known as Target Conservative Allocation Fund) | Subadviser | Fee Rate | 2014*** | 2014*** | 2013*** | 2012*** |
| Eagle Asset Management, Inc. | 0.50% on assets up to and including $50 million; 0.45% on assets over $50 million |
$1,338 | $9,724 | $8,300 | $6,537 | |
| EARNEST Partners, LLC | 0.40% | $607 | $4,468 | $3,055 | $1,248 | |
40
| Subadvisory Fee Rates and Subadvisory Fees Paid* | ||||||
| Income Builder Fund (formerly known as Target Conservative Allocation Fund) | Subadviser | Fee Rate | 2014*** | 2014*** | 2013*** | 2012*** |
| Eaton Vance Management (terminated July 2012) |
0.25% on first $250 million; 0.24% on next $250 million; 0.23% on next $500 million; 0.22% over $1 billion |
None | None | None | $17,969 | |
| Epoch Investment Partners, Inc. (started July 2012) |
0.275% to $1 billion; 0.20% over $1 billion |
$2,808 | $19,606 | $18,562 | $585 | |
| Pacific Investment Management Company LLC | 0.25% to $1 billion; 0.225% over $1 billion |
$21,365 | $144,954 | $145,792 | $157,347 | |
| Hotchkis and Wiley Capital Management, LLC | 0.30% | $3,022 | $21,338 | $20,360 | $16,814 | |
| Marsico Capital Management, LLC (terminated April 2013) | 0.40% to $1.5 billion; 0.35% over $1.5 billion |
None | None | $32,491 | $51,105 | |
| Massachusetts Financial Services Company | 0.375% on assets up to and including $250 million; 0.325% on next $250 milliion; 0.300% on next $250 million; 0.275% on next $250 million; 0.25% on next $500 million; 0.225% over $1.5 billion |
$9,276 | $65,170 | $36,151 | $27,783 | |
| Vaughan Nelson Investment Management, L.P. | 0.40% on first $250 million; 0.35% over $250 million |
$576 | $4,278 | $4,605 | $7,513 | |
| NFJ Investment Group LLC | 0.40% on first $50 million; 0.38% on next $50 million; 0.34% on next $50 million; 0.30% on next $200 million; 0.28% over $350 million |
$4,216 | $29,517 | $28,273 | $22,698 | |
| Quantitative Management Associates LLC (QMA)** | 0.175% | $20,878 | n/a | n/a | n/a | |
| Jennison Associates LLC (Jennison) | 0.425% to $500 million; 0.40% over $500 million to $1 billion; 0.375% over $1 billion |
$7,838 | n/a | n/a | n/a | |
| Prudential Fixed Income (PFI) (Broad Market High Yield strategy) | 0.25% | $6,079 | n/a | n/a | n/a | |
| PFI (Emerging Markets Debt strategy) | 0.45% to $200 million; 0.40% over $200 million |
$10,836 | n/a | n/a | n/a | |
| Prudential Real Estate Investors (PREI) | 0.40% | $4,004 | n/a | n/a | n/a | |
Notes to Subadvisory Fee
Table
* Effective September 23, 2014, QMA,
Jennison, PFI and PREI became the subadvisers to the Fund. The subadvisory agreements for all of the other subadvisers listed above were terminated by the Manager effective September 23, 2014.
**
QMA’s subadvisory fee is based upon a percentage of average daily net assets, while the other subadvisory fees in the table are based upon the portion of the assets allocated to the applicable
subadviser.***During 2014, the Fund changed its fiscal year-end from July 31 to October 31. The figures shown above are for the fiscal period from August 1, 2014 through October 31, 2014 and the fiscal years
ended July 31, 2014, 2013 and 2012.
ADDITIONAL INFORMATION ABOUT
PORTFOLIO MANAGERS—OTHER ACCOUNTS AND OWNERSHIP OF FUND SECURITIES. Set forth below is information about other accounts managed by each portfolio manager and ownership of Fund securities. The information shows, for each portfolio manager, the number of
accounts managed and the total assets in such accounts, within each of the indicated categories. For each category, the number of accounts and total assets in the accounts whose fees are based on performance is
indicated in italics typeface. The Ownership of Fund Securities column shows the dollar range of equity securities of the Fund beneficially owned by the portfolio manager.
Information shown below is as of
the most recently completed fiscal year, unless noted otherwise.
41
| Prudential Income Builder Fund (as of October 31, 2014)* | |||||
| Subadviser | Portfolio Managers | Registered Investment Companies |
Other Pooled Investment Vehicles |
Other Accounts | Ownership of Fund Securities |
| Quantitative Management Associates LLC | Ted Lockwood | 27/$68,885,254,981 | 1/$46,815,239 | 32/$1,909,614,545 1/$49,928,968 |
None |
| Edward L. Campbell, CFA | 26/$68,508,965,370 | 1/$46,815,239 | 29/$1,807,351,075 | None | |
| Rory Cummings | 26/$68,508,965,370 | 1/$46,815,239 | 29/$1,807,351,075 | None | |
| Jennison Associates LLC | Ubong “Bobby” Edemeka | 7/$9,587,478,000 | None | None | None |
| Shaun Hong, CFA | 7/$9,587,478,000 | None | None | None | |
| Prudential Investment Management, Inc. – Prudential Fixed Income | Paul Appleby, CFA | 19/$11,848,429,918 | 27/$8,451,284,998 17/$5,021,973,804 |
60/$11,453,420,179 1/$0 |
None |
| Robert Cignarella, CFA | 19/$11,848,443,851 | 18/$5,618,877,970 | 56/$10,159,636,166 1/$0 |
None | |
| Michael J. Collins, CFA | 28/$28,259,968,618 | 8/$5,082,536,326 | 16/$6,941,338,154 | None | |
| Terence Wheat, CFA | 19/$11,848,428,694 | 19/$5,644,549,387 | 61/$11,491,665,056 1/$0 |
None | |
| Robert Spano, CFA, CPA | 19/$11,848,428,694 | 18/$5,618,877,970 | 61/$11,491,665,056 1/$0 |
None | |
| Ryan Kelly, CFA | 19/$11,848,428,694 | 18/$5,618,877,970 | 60/$11,453,420,179 1/$0 |
None | |
| Brian Clapp, CFA | 19/$11,848,443,851 | 18/$5,618,877,970 | 56/$10,159,636,166 1/$0 |
None | |
| Daniel Thorogood, CFA | 17/$6,031,101,056 | 18/$5,618,877,970 | 58/$11,165,679,639 1/$0 |
None | |
| David Bessey | 12/$1,512,012,998 | 20/$2,105,417,276 1/($54,977,721) |
82/$22,140,175,462 1/$4,334,070 |
None | |
| Cathy L. Hepworth, CFA | 12/$1,512,012,998 | 20/$2,105,417,276 1/($56,891,817) |
82/$22,140,175,462 1/$4,334,070 |
None | |
| Prudential Investment Management, Inc. – Prudential Real Estate Investors | Marc R. Halle | 5/$4,506,485,765 | 1/$10,663,156 | 8/$633,981,240 | None |
| Rick J.Romano, CFA | 5/$4,506,485,765 | 1/$10,663,156 | 8/$633,981,240 | None | |
| Gek Lang Lee, CFA | 5/$4,506,485,765 | 1/$10,663,156 | 8/$633,981,240 | None | |
| Michael Gallagher | 5/$4,506,485,765 | 1/$10,663,156 | 8/$633,981,240 | None | |
*During 2014, the Fund
changed its fiscal year-end from July 31 to October 31. The figures shown above are as of October 31, 2014.
ADDITIONAL INFORMATION ABOUT THE
PORTFOLIO MANAGERS—COMPENSATION AND CONFLICTS OF INTEREST. Set forth below, for each portfolio manager, is an explanation of the structure of, and methods used to determine, portfolio manager compensation. Also set forth below, for each portfolio
manager, is an explanation of any material conflicts of interest that may arise between a portfolio manager's management of the Fund's investments and investments in other accounts.
Quantitative Management Associates
LLC (QMA)
COMPENSATION. QMA’s investment professionals are compensated through a combination of base salary, a performance-based annual cash incentive bonus and an annual long-term incentive grant. QMA
regularly utilizes third party surveys to compare its compensation program against leading asset management firms to monitor competitiveness.
An investment professional’s
incentive compensation, including both the annual cash bonus and long-term incentive grant, is largely driven by a person’s contribution to QMA’s goal of providing investment performance to clients
consistent with portfolio objectives, guidelines and risk parameters. In addition, a person’s qualitative contributions would also be considered in determining compensation. An investment professional’s
long-term incentive grant is currently divided into two components: (i) 80% of the value of the grant is subject to increase or decrease based on the annual performance of certain QMA strategies, and (ii) 20% of the
value of the grant consists of stock options and/or restricted stock of Prudential Financial, Inc. (QMA’s ultimate parent company). The long-term incentive grants are subject to vesting requirements. The
incentive compensation of each investment professional is not based solely or directly on the performance of the Fund (or any other individual account managed by QMA) or the value of the assets of the Fund (or any
other individual account managed by QMA).
42
The annual cash bonus pool is
determined quantitatively based on two primary factors: 1) investment performance of composites representing QMA’s various investment strategies on a 1-year and 3-year basis relative to appropriate market peer
groups and the indices against which our strategies are managed, and 2) business results as measured by QMA’s pre-tax income.
CONFLICTS OF INTEREST. Like other investment advisers, QMA is subject to various conflicts of interest in the ordinary course of its business. QMA strives to identify potential risks, including conflicts of
interest, that are inherent in its business, and conducts annual conflict of interest reviews. When actual or potential conflicts of interest are identified, QMA seeks to address such conflicts through one or more of
the following methods:
| ■ | Elimination of the conflict; |
| ■ | Disclosure of the conflict; or |
| ■ | Management of the conflict through the adoption of appropriate policies and procedures. |
QMA follows Prudential
Financial’s policies on business ethics, personal securities trading, and information barriers. QMA has adopted a code of ethics, allocation policies and conflicts of interest policies, among others, and has
adopted supervisory procedures to monitor compliance with its policies. QMA cannot guarantee, however, that its policies and procedures will detect and prevent, or assure disclosure of, each and every situation in
which a conflict may arise.
Side-by-Side Management of Accounts
and Related Conflicts of Interest
Side-by-side management of multiple
accounts can create incentives for QMA to favor one account over another. Examples are detailed below, followed by a discussion of how QMA addresses these conflicts.
| ■ | Asset-Based Fees vs. Performance-Based Fees; Other Fee Considerations. QMA manages accounts with asset-based fees alongside accounts with performance-based fees. Asset-based fees are calculated based on the value of a client’s portfolio at periodic measurement dates or over specified periods of time. Performance-based fees are generally based on a share of the capital appreciation of a portfolio, and may offer greater upside potential to an investment manager than asset-based fees, depending on how the fees are structured. This side-by-side management can create an incentive for QMA and its investment professionals to favor one account over another. Specifically, QMA has the incentive to favor accounts for which it receives performance fees, and possibly take greater investment risks in those accounts, in order to bolster performance and increase its fees. In addition, since fees are negotiable, one client may be paying a higher fee than another client with similar investment objectives or goals. In negotiating fees, QMA takes into account a number of factors including, but not limited to, the investment strategy, the size of a portfolio being managed, the relationship with the client, and the required level of service. Fees may also differ based on account type. For example, fees for commingled vehicles, including those that QMA subadvises, may differ from fees charged for single client accounts. |
| ■ | Long Only/Long-Short Accounts. QMA manages accounts that only allow it to hold securities long as well as accounts that permit short selling. QMA may, therefore, sell a security short in some client accounts while holding the same security long in other client accounts, creating the possibility that QMA is taking inconsistent positions with respect to a particular security in different client accounts. |
| ■ | Compensation/Benefit Plan Accounts/Other Investments by Investment Professionals. QMA manages certain funds and strategies whose performance is considered in determining long-term incentive plan benefits for certain investment professionals. Investment professionals involved in the management of those accounts in these strategies have an incentive to favor them over other accounts they manage in order to increase their compensation. Additionally, QMA’s investment professionals may have an interest in funds in those strategies if the funds are chosen as options in their 401(k) or deferred compensation plans offered by Prudential or if they otherwise invest in those funds directly. |
| ■ | Affiliated Accounts. QMA manages accounts on behalf of its affiliates as well as unaffiliated accounts.QMA could have an incentive to favor accounts of affiliates over others. |
| ■ | Non-Discretionary Accounts or Models. QMA provides non-discretionary model portfolios to some clients and manages other portfolios on a discretionary basis. The non-discretionary clients may be disadvantaged if QMA delivers the model investment portfolio to them after it initiates trading for the discretionary clients, or vice versa. |
| ■ | Large Accounts. Large accounts typically generate more revenue than do smaller accounts. As a result, a portfolio manager has an incentive when allocating scarce investment opportunities to favor accounts that pay a higher fee or generate more income for QMA. |
| ■ | Securities of the Same Kind or Class. QMA may buy or sell, or may direct or recommend that one client buy or sell, securities of the same kind or class that are purchased or sold for another client, at prices that may be different. QMA may also, at any time, execute trades of securities of the same kind or class in one direction for an account and in the opposite direction for another account, due to differences in investment strategy or client direction. Different strategies effecting trading in the same securities or types of securities may appear as inconsistencies in QMA’s management of multiple accounts side-by-side. |
How QMA Addresses These Conflicts
of Interest
43
The conflicts of interest described
above with respect to different types of side-by-side management could influence QMA’s allocation of investment opportunities as well as its timing, aggregation and allocation of trades. QMA has developed
policies and procedures designed to address these conflicts of interest.
In keeping with its fiduciary
obligations, QMA’s policies with respect to allocation and aggregation are to treat all of its accounts fairly and equitably. QMA’s investment strategies generally require that QMA invest its
clients’ assets in securities that are publicly traded. QMA generally does not participate in initial public offerings. These factors significantly reduce the risk that QMA could favor one client over another in
the allocation of investment opportunities.
QMA’s compliance procedures
with respect to these policies include independent monitoring by its compliance unit of the timing, allocation and aggregation of trades and the allocation of investment opportunities. These procedures are designed to
detect patterns and anomalies in QMA’s side-by-side management and trading so that QMA may take measures to correct or improve its processes. QMA’s trade management oversight committee, which consists of
senior members of its management team, reviews trading patterns on a periodic basis.
QMA rebalances portfolios
periodically with frequencies that vary with market conditions and investment objectives and may differ across portfolios in the same strategy based on variations in portfolio characteristics and constraints. QMA may
aggregate trades for all portfolios rebalanced on any given day, where appropriate and consistent with its duty of best execution. Orders are generally allocated at the time of the transaction, or as soon as possible
thereafter, on a pro rata basis equal to each account’s appetite for the issue when such appetite can be determined. As mentioned above, QMA’s compliance unit performs periodic monitoring to determine that
all portfolios are rebalanced consistently, over time, within all strategies.
With respect to QMA’s
management of long-short and long only accounts, the security weightings (positive or negative) in each account are always determined by a quantitative algorithm. An independent review is performed by the compliance
unit to assess whether any such positions would represent a departure from the quantitative algorithm used to derive the positions in each portfolio. QMA’s review is also intended to identify situations where
QMA would seem to have conflicting views of the same security in different portfolios although such views may actually be reasonable due to differing portfolio constraints.
QMA’s Relationships with
Affiliates and Related Conflicts of Interest
As an indirect wholly-owned
subsidiary of Prudential Financial, QMA is part of a diversified, global financial services organization. It is affiliated with many types of financial service providers, including broker-dealers, insurance companies,
commodity pool operators and other investment advisers. Some of its employees are officers of some of these affiliates.
Conflicts Related to QMA’s
Affiliations
| ■ | Conflicts Arising Out of Legal Restrictions. QMA may be restricted by law, regulation or contract as to how much, if any, of a particular security it may purchase or sell on behalf of a client, and as to the timing of such purchase or sale. These restrictions may apply as a result of QMA’s relationship with Prudential Financial and its other affiliates. For example, QMA’s holdings of a security on behalf of its clients may, under some SEC rules, be aggregated with the holdings of that security by other Prudential Financial affiliates. These holdings could, on an aggregate basis, exceed certain reporting thresholds for which QMA and Prudential monitor, and QMA and Prudential may restrict purchases to avoid crossing such thresholds. In addition, QMA could receive material, non-public information with respect to a particular issuer from an affiliate and, as a result, be unable to execute purchase or sale transactions in securities of that issuer for our clients. QMA is generally able to avoid receiving material, non-public information from its affiliates by maintaining information barriers to prevent the transfer of information between affiliates. |
| ■ | The Fund may be prohibited from engaging in transactions with its affiliates even when such transactions may be beneficial for the Fund. Certain affiliated transactions are permitted in accordance with procedures adopted by the Fund and reviewed by the independent board members of the Fund. |
Conflicts Related
to QMA’s Asset Allocation Services
| ■ | QMA performs asset allocation services as subadviser for affiliated mutual funds managed or co-managed by the Manager, including for some Portfolios offered by the Fund. QMA may, under these arrangements, allocate assets to an asset class within which funds or accounts that QMA directly manages will be selected. In these circumstances, QMA receives both an asset allocation fee and a management fee. As a result, QMA has an incentive to allocate assets to an asset class that it manages in order to increase its fees. To help mitigate this conflict, the compliance group monitors the asset allocation to determine that the investments were made within the established guidelines by asset class. QMA also believes that it makes such allocations in a manner consistent with its fiduciary obligations. |
| ■ | In certain arrangements QMA subadvises mutual funds for the Manager through a program where they have selected QMA as a manager, resulting in QMA’s collection of subadvisory fees from them. From time to time, the Manager may also select managers for some of QMA’s asset allocation products. The Manager and QMA may have a mutual incentive to continue these types of arrangements that benefit both companies. These and other types of conflicts of interest are considered during initial project launch. |
44
Conflicts Arising Out of Securities
Holdings and Other Financial Interests
| ■ | QMA, Prudential Financial, Inc., the general account of the Prudential Insurance Company of America (PICA) and accounts of other affiliates of QMA (collectively, affiliated accounts) may, at times, have financial interests in, or relationships with, companies whose securities QMA may hold, purchase or sell in our client accounts. This may occur, for example, because affiliated accounts hold public and private debt and equity securities of a large number of issuers and may invest in some of the same companies as QMA’s client accounts. At any time, these interests and relationships could be inconsistent or in potential or actual conflict with positions held or actions taken by us on behalf of QMA’s client accounts. For instance, QMA may invest client assets in the equity of companies whose debt is held by an affiliate. QMA may also invest in the securities of one or more clients for the accounts of other clients. While these conflicts cannot be eliminated, QMA has implemented policies and procedures, including adherence to PIM’s information barrier policy, that are designed to ensure that investments of clients are managed in their best interests. |
| ■ | Certain of QMA’s employees may offer and sell securities of, and units in, commingled funds that QMA manages or subadvises. Employees may offer and sell securities in connection with their roles as registered representatives of Prudential Investment Management Services LLC (a broker-dealer affiliate), or as officers, agents, or approved persons of other affiliates. There is an incentive for QMA’s employees to offer these securities to investors regardless of whether the investment is appropriate for such investor since increased assets in these vehicles will result in increased advisory fees to QMA. In addition, such sales could result in increased compensation to the employee. |
| ■ | A portion of the long-term incentive grant of some of QMA’s investment professionals will increase or decrease based on the annual performance of several of QMA’s advised accounts over a defined time period. Consequently, some of QMA’s portfolio managers from time to time have financial interests in the accounts they advise. To address potential conflicts related to these financial interests, QMA has procedures, including supervisory review procedures, designed to ensure that each of its accounts is managed in a manner that is consistent with QMA’s fiduciary obligations, as well as with the account’s investment objectives, investment strategies and restrictions. Specifically, QMA’s Chief Investment Officer will perform a comparison of trading costs between the advised accounts whose performance is considered in connection with the long-term incentive grant and other accounts, to ensure that such costs are consistent with each other or otherwise in line with expectations. The results of the analysis are discussed at a trade management meeting. Additionally, QMA’s compliance group will review the performance of these accounts to ensure that it is consistent with the performance of other accounts in the same strategy that are not considered in connection with the grant. |
Conflicts of Interest in the Voting
Process
Occasionally, a conflict of
interest may arise in connection with proxy voting. For example, the issuer of the securities being voted may also be a client of QMA. When QMA identifies an actual or potential conflict of interest between QMA and
its clients, QMA votes in accordance with the policy of its proxy voting facilitator rather than its own policy. In that manner, QMA seeks to assure the independence and objectivity of the vote.
Jennison Associates LLC
COMPENSATION. Jennison seeks to maintain a highly competitive compensation program designed to attract and retain outstanding investment professionals, which include portfolio managers and research
analysts, and to align the interests of its investment professionals with those of its clients and overall firm results. Overall firm profitability determines the total amount of incentive compensation pool that is
available for investment professionals. Investment professionals are compensated with a combination of base salary and cash bonus. In general, the cash bonus comprises the majority of the compensation for investment
professionals. Jennison sponsors a profit sharing retirement plan for all eligible employees. The contribution to the profit sharing retirement plan for portfolio managers is based on a percentage of the portfolio
manager’s total compensation, subject to a maximum determined by applicable law. In addition to eligibility to participate in retirement and welfare plans, senior investment professionals, including portfolio
managers and senior research analysts, are eligible to participate in a deferred compensation program where all or a portion of the cash bonus can be invested in a variety of predominantly Jennison-managed investment
strategies on a tax-deferred basis.
Investment professionals’
total compensation is determined through a subjective process that evaluates numerous qualitative and quantitative factors. There is no particular weighting or formula for considering the factors. Some portfolio
managers may manage or contribute ideas to more than one product strategy, and the performance of the other product strategies is also considered in determining the portfolio manager’s overall compensation. The
factors reviewed for the portfolio managers are listed below in order of importance.
The following primary quantitative
factor is reviewed for the portfolio managers:
| ■ | One, three, five year and longer term pre-tax investment performance of groupings of accounts managed by the portfolio manager in the same strategy (composite) relative to market conditions, pre-determined passive indices and industry peer group data for the product strategy (e.g., large cap growth, large cap value) for the portion of the Fund which the portfolio manager is responsible. |
| ■ | Performance for the composite of accounts that includes the portion of the Fund managed by Mr. Hong and Mr. Edemeka is measured against Standard & Poor’s 500 Composite Stock Price Index. |
45
The qualitative factors reviewed
for the portfolio managers may include:
| ■ | The quality of the portfolio manager’s investment ideas and consistency of the portfolio manager’s judgment; |
| ■ | Historical and long-term business potential of the product strategies; |
| ■ | Qualitative factors such as teamwork and responsiveness; and |
| ■ | Individual factors such as years of experience and responsibilities specific to the individual’s role such as being a team leader or supervisor are also factored into the determination of an investment professional’s total compensation. |
CONFLICTS OF INTEREST. Jennison manages accounts with asset-based fees alongside accounts with performance-based fees. This side-by-side management can create an incentive for Jennison and its investment
professionals to favor one account over another. Specifically, Jennison has the incentive to favor accounts for which it receives performance fees, and possibly take greater investment risks in those accounts, in
order to bolster performance and increase its fees.
Other types of side-by-side
management of multiple accounts can also create incentives for Jennison to favor one account over another. Examples are detailed below, followed by a discussion of how Jennison addresses these conflicts.
| ■ | Long only accounts/long-short accounts: Jennison manages accounts in strategies that only hold long securities positions as well as accounts in strategies that are permitted to sell securities short. Jennison may hold a long position in a security in some client accounts while selling the same security short in other client accounts. Jennison permits quantitatively hedged strategies to short securities that are held long in other strategies. Additionally, Jennison permits securities that are held long in quantitatively derived strategies to be shorted by other strategies. The strategies that sell a security short held long by another strategy could lower the price for the security held long. Similarly, if a strategy is purchasing a security that is held short in other strategies, the strategies purchasing the security could increase the price of the security held short. |
| ■ | Multiple strategies: Jennison may buy or sell, or may direct or recommend that one client buy or sell, securities of the same kind or class that are purchased or sold for another client at prices that may be different. Jennison may also, at any time, execute trades of securities of the same kind or class in one direction for an account and in the opposite direction for another account, due to differences in investment strategy or client direction. Different strategies effecting trading in the same securities or types of securities may appear as inconsistencies in Jennison’s management of multiple accounts side-by-side. |
| ■ | Affiliated accounts/unaffiliated accounts and seeded/nonseeded accounts and accounts receiving asset allocation assets from affiliated investment advisers: Jennison manages accounts for its affiliates and accounts in which it has an interest alongside unaffiliated accounts. Jennison could have an incentive to favor its affiliated accounts over unaffiliated accounts. Additionally, Jennison’s affiliates may provide initial funding or otherwise invest in vehicles managed by Jennison. When an affiliate provides “seed capital” or other capital for a fund, it may do so with the intention of redeeming all or part of its interest at a particular future point in time or when it deems that sufficient additional capital has been invested in that fund. Jennison typically requests seed capital to start a track record for a new strategy or product. Managing “seeded” accounts alongside “non-seeded” accounts can create an incentive to favor the “seeded” accounts to establish a track record for a new strategy or product. Additionally, Jennison’s affiliated investment advisers could allocate their asset allocation clients’ assets to Jennison. Jennison could favor accounts used by its affiliate for their asset allocation clients to receive more assets from the affiliate. |
| ■ | Non-discretionary accounts or models: Jennison provides non-discretionary model portfolios to some clients and manages other portfolios on a discretionary basis. Recommendations for some non-discretionary models that are derived from discretionary portfolios are communicated after the discretionary portfolio has traded. The non-discretionary clients may be disadvantaged if Jennison delivers the model investment portfolio to them after Jennison initiates trading for the discretionary clients, or vice versa. |
| ■ | Higher fee paying accounts or products or strategies: Jennison receives more revenues from (1) larger accounts or client relationships than smaller accounts or client relationships and from (2) managing discretionary accounts than advising nondiscretionary models and from (3) non-wrap fee accounts than from wrap fee accounts and from (4) charging higher fees for some strategies than others. The differences in revenue that Jennison receives could create an incentive for Jennison to favor the higher fee paying or higher revenue generating account or product or strategy over another. |
| ■ | Personal interests: The performance of one or more accounts managed by Jennison’s investment professionals is taken into consideration in determining their compensation. Jennison also manages accounts that are investment options in its employee benefit plans such as its defined contribution plans or deferred compensation arrangements and where its employees may have personally invested alongside other accounts where there is no personal interest. These factors could create an incentive for Jennison to favor the accounts where it has a personal interest over accounts where Jennison does not have a personal interest. |
How Jennison Addresses These
Conflicts of Interest
46
The conflicts of interest described
above could create incentives for Jennison to favor one or more accounts or types of accounts over others in the allocation of investment opportunities, time, aggregation and timing of investments. Generally,
portfolios in a particular strategy with similar objectives are managed similarly to the extent possible. Accordingly, portfolio holdings and industry and sector exposure tend to be similar across a group of accounts
in a strategy that have similar objectives, which tends to minimize the potential for conflicts of interest among accounts within a product strategy. While these accounts have many similarities, the investment
performance of each account will be different primarily due to differences in guidelines, individual portfolio manager’s decisions, timing of investments, fees, expenses and cash flows.
Additionally, Jennison has
developed policies and procedures that seek to address, mitigate and monitor these conflicts of interest. Jennison cannot guarantee, however, that its policies and procedures will detect and prevent, or assure
disclosure of, each and every situation in which a conflict may arise.
| ■ | Jennison has adopted trade aggregation and allocation procedures that seek to treat all clients (including affiliated accounts) fairly and equitably. These policies and procedures address the allocation of limited investment opportunities, such as initial public offerings (IPOs) and new issues, the allocation of transactions across multiple accounts, and the timing of transactions between its non-wrap accounts and its wrap fee accounts. |
| ■ | Jennison has policies that limit the ability to short securities in portfolios that primarily rely on its fundamental research and investment processes (fundamental portfolios) if the security is held long in other fundamental portfolios. |
| ■ | Jennison has adopted procedures to monitor allocations between accounts with performance fees and non-performance fee based accounts and to monitor overlapping long and short positions among long accounts and long-short accounts. |
| ■ | Jennison has adopted a code of ethics and policies relating to personal trading. |
| ■ | Jennison provides disclosure of these conflicts as described in its Form ADV. |
Prudential Investment Management,
Inc. (PIM).
COMPENSATION. The base salary of an investment professional in the Prudential Fixed Income unit of PIM is based on market data relative to similar positions as well as the past performance, years of
experience and scope of responsibility of the individual. Incentive compensation, including the annual cash bonus, the long-term equity grant and grants under Prudential Fixed Income’s long-term incentive plan,
is primarily based on such person’s contribution to Prudential Fixed Income’s goal of providing investment performance to clients consistent with portfolio objectives, guidelines and risk parameters and
market-based data such as compensation trends and levels of overall compensation for similar positions in the asset management industry. In addition, an investment professional’s qualitative contributions to the
organization are considered in determining incentive compensation. Incentive compensation is not solely based on the performance of, or value of assets in, any single account or group of client accounts.
An investment professional’s
annual cash bonus is paid from an annual incentive pool. The pool is developed as a percentage of Prudential Fixed Income’s operating income and is refined by business metrics, such as:
| ■ | business development initiatives, measured primarily by growth in operating income; |
| ■ | the number of investment professionals receiving a bonus; and |
| ■ | investment performance of portfolios relative to appropriate peer groups or market benchmarks. |
Long-term compensation consists of
Prudential Financial restricted stock and grants under the long-term incentive plan. Grants under the long-term incentive plan are participation interests in notional accounts with a beginning value of a specified
dollar amount. The value attributed to these notional accounts increases or decreases over a defined period of time based, in part, on the performance of investment composites representing a number of Prudential Fixed
Income’s most frequently marketed investment strategies. An investment composite is an aggregation of accounts with similar investment strategies. The long-term incentive plan is designed to more closely align
compensation with investment performance and the growth of Prudential Fixed Income’s business. Both the restricted stock and participation interests are subject to vesting requirements.
CONFLICTS OF INTEREST. Like other investment advisers, Prudential Fixed Income is subject to various conflicts of interest in the ordinary course of its business. Prudential Fixed Income strives to identify
potential risks, including conflicts of interest, that are inherent in its business, and conducts annual conflict of interest reviews. When actual or potential conflicts of interest are identified, Prudential Fixed
Income seeks to address such conflicts through one or more of the following methods:
| ■ | elimination of the conflict; |
| ■ | disclosure of the conflict; or |
| ■ | management of the conflict through the adoption of appropriate policies and procedures. |
47
Prudential Fixed Income follows the
policies of Prudential Financial, Inc. (Prudential Financial) on business ethics, personal securities trading by investment personnel, and information barriers. Prudential Fixed Income has adopted a code of ethics,
allocation policies and conflicts of interest policies, among others, and has adopted supervisory procedures to monitor compliance with its policies. Prudential Fixed Income cannot guarantee, however, that its
policies and procedures will detect and prevent, or assure disclosure of, each and every situation in which a conflict may arise.
Side-by-Side Management of Accounts
and Related Conflicts of Interest. Prudential Fixed Income’s side-by-side management of multiple accounts can create conflicts of interest. Examples are detailed below, followed by a discussion of how Prudential Fixed
Income addresses these conflicts.
| ■ | Performance Fees— Prudential Fixed Income manages accounts with asset-based fees alongside accounts with performance-based fees. This side-by-side management may be deemed to create an incentive for Prudential Fixed Income and its investment professionals to favor one account over another. Specifically, Prudential Fixed Income could be considered to have the incentive to favor accounts for which it receives performance fees, and possibly take greater investment risks in those accounts, in order to bolster performance and increase its fees. |
| ■ | Affiliated accounts— Prudential Fixed Income manages accounts on behalf of its affiliates as well as unaffiliated accounts. Prudential Fixed Income could be considered to have an incentive to favor accounts of affiliates over others. |
| ■ | Large accounts—large accounts typically generate more revenue than do smaller accounts and certain of Prudential Fixed Income’s strategies have higher fees than others. As a result, a portfolio manager could be considered to have an incentive when allocating scarce investment opportunities to favor accounts that pay a higher fee or generate more income for Prudential Fixed Income. |
| ■ | Long only and long/short accounts— Prudential Fixed Income manages accounts that only allow it to hold securities long as well as accounts that permit short selling. Prudential Fixed Income may, therefore, sell a security short in some client accounts while holding the same security long in other client accounts. These short sales could reduce the value of the securities held in the long only accounts. In addition, purchases for long only accounts could have a negative impact on the short positions. |
| ■ | Securities of the same kind or class— Prudential Fixed Income may buy or sell for one client account securities of the same kind or class that are purchased or sold for another client at prices that may be different. Prudential Fixed Income may also, at any time, execute trades of securities of the same kind or class in one direction for an account and in the opposite direction for another account due to differences in investment strategy or client direction. Different strategies trading in the same securities or types of securities may appear as inconsistencies in Prudential Fixed Income’s management of multiple accounts side-by-side. |
| ■ | Financial interests of investment professionals— Prudential Fixed Income investment professionals may invest in investment vehicles that it advises. Also, certain of these investment vehicles are options under the 401(k) and deferred compensation plans offered by Prudential Financial. In addition, the value of grants under Prudential Fixed Income’s long-term incentive plan is affected by the performance of certain client accounts. As a result, Prudential Fixed Income investment professionals may have financial interests in accounts managed by Prudential Fixed Income or that are related to the performance of certain client accounts. |
| ■ | Non-discretionary accounts or models— Prudential Fixed Income provides non-discretionary investment advice and non-discretionary model portfolios to some clients and manages others on a discretionary basis. Trades in non-discretionary accounts could occur before, in concert with, or after Prudential Fixed Income executes similar trades in its discretionary accounts. The non-discretionary clients may be disadvantaged if Prudential Fixed Income delivers the model investment portfolio or investment advice to them after it initiates trading for the discretionary clients, or vice versa. |
How Prudential Fixed Income
Addresses These Conflicts of Interest. Prudential Fixed Income has developed policies and procedures designed to address the conflicts of interest with respect to its different types of side-by-side management described
above.
| ■ | The head of Prudential Fixed Income and its chief investment officer periodically review and compare performance and performance attribution for each client account within its various strategies. |
| ■ | In keeping with Prudential Fixed Income’s fiduciary obligations, its policy with respect to trade aggregation and allocation is to treat all of its accounts fairly and equitably over time. Prudential Fixed Income’s trade management oversight committee, which generally meets quarterly, is responsible for providing oversight with respect to trade aggregation and allocation. Prudential Fixed Income has compliance procedures with respect to its aggregation and allocation policy that include independent monitoring by its compliance group of the timing, allocation and aggregation of trades and the allocation of investment opportunities. In addition, its compliance group reviews a sampling of new issue allocations and related documentation each month to confirm compliance with the allocation procedures. Prudential Fixed Income’s compliance group reports the results of the monitoring processes to its trade management oversight committee. Prudential Fixed Income’s trade management oversight committee reviews forensic reports of new issue allocation throughout the year so that new issue allocation in each of its strategies is reviewed at least once during each year. This forensic analysis includes such data as: (i) the number of new issues allocated in the strategy; (ii) the size of new issue allocations to each portfolio in the strategy; and (iii) the profitability of new issue transactions. The results of these analyses are reviewed and discussed at Prudential Fixed Income’s trade management oversight committee meetings. Prudential Fixed Income’s trade management oversight committee also reviews forensic reports on the allocation of trading opportunities in the secondary market. The procedures above are designed to detect patterns and anomalies in Prudential Fixed Income’s side-by-side management and trading so that it may assess and improve its processes. |
48
| ■ | Prudential Fixed Income has policies and procedures that specifically address its side-by-side management of long/short and long only portfolios. These policies address potential conflicts that could arise from differing positions between long/short and long only portfolios. In addition, lending opportunities with respect to securities for which the market is demanding a slight premium rate over normal market rates are allocated to long only accounts prior to allocating the opportunities to long/short accounts. |
Conflicts Related to Prudential
Fixed Income’s Affiliations. As an indirect wholly-owned subsidiary of Prudential Financial, Prudential Fixed Income is part of a diversified, global financial services organization. Prudential Fixed Income is
affiliated with many types of US and non-US financial service providers, including insurance companies, broker-dealers, commodity trading advisors, commodity pool operators and other investment advisers. Some of its
employees are officers of some of these affiliates.
| ■ | Conflicts Arising Out of Legal Restrictions. Prudential Fixed Income may be restricted by law, regulation or contract as to how much, if any, of a particular security it may purchase or sell on behalf of a client, and as to the timing of such purchase or sale. These restrictions may apply as a result of its relationship with Prudential Financial and its other affiliates. For example, Prudential Fixed Income’s holdings of a security on behalf of its clients may, under some SEC rules, be aggregated with the holdings of that security by other Prudential Financial affiliates. These holdings could, on an aggregate basis, exceed certain reporting thresholds that are monitored, and Prudential Fixed Income may restrict purchases to avoid exceeding these thresholds. In addition, Prudential Fixed Income could receive material, non-public information with respect to a particular issuer and, as a result, be unable to execute transactions in securities of that issuer for its clients. For example, Prudential Fixed Income’s bank loan team often invests in private bank loans in connection with which the borrower provides material, non-public information, resulting in restrictions on trading securities issued by those borrowers. Prudential Fixed Income has procedures in place to carefully consider whether to intentionally accept material, non-public information with respect to certain issuers. Prudential Fixed Income is generally able to avoid receiving material, non-public information from its affiliates and other units within PIM by maintaining information barriers. In some instances, it may create an isolated information barrier around a small number of its employees so that material, non-public information received by such employees is not attributed to the rest of Prudential Fixed Income. |
| ■ | Conflicts Related to Outside Business Activity. From time to time, certain of Prudential Fixed Income’s employees or officers may engage in outside business activity, including outside directorships. Any outside business activity is subject to prior approval pursuant to Prudential Fixed Income’s personal conflicts of interest and outside business activities policy. Actual and potential conflicts of interest are analyzed during such approval process. Prudential Fixed Income could be restricted in trading the securities of certain issuers in client portfolios in the unlikely event that an employee or officer, as a result of outside business activity, obtains material, nonpublic information regarding an issuer. The head of Prudential Fixed Income serves on the board of directors of the operator of an electronic trading platform. Prudential Fixed Income has adopted procedures to address the conflict relating to trading on this platform. The procedures include independent monitoring by Prudential Fixed Income’s chief investment officer and chief compliance officer and reporting on Prudential Fixed Income’s use of this platform to the President of PIM. |
| ■ | Conflicts Related to Investment of Client Assets in Affiliated Funds. Prudential Fixed Income may invest client assets in funds that it manages or subadvises for an affiliate. Prudential Fixed Income may also invest cash collateral from securities lending transactions in these funds. These investments benefit both Prudential Fixed Income and its affiliate. |
| ■ | PICA General Account. Because of the substantial size of the general account of The Prudential Insurance Company of America (PICA), trading by PICA’s general account, including Prudential Fixed Income’s trades on behalf of the account, may affect market prices. Although Prudential Fixed Income doesn’t expect that PICA’s general account will execute transactions that will move a market frequently, and generally only in response to unusual market or issuer events, the execution of these transactions could have an adverse effect on transactions for or positions held by other clients. |
Conflicts Related to Securities
Holdings and Other Financial Interests.
| ■ | Securities Holdings. PIM, Prudential Financial, PICA’s general account and accounts of other affiliates of Prudential Fixed Income (collectively, affiliated accounts) hold public and private debt and equity securities of a large number of issuers and may invest in some of the same companies as other client accounts but at different levels in the capital structure. These investments can result in conflicts between the interests of the affiliated accounts and the interests of Prudential Fixed Income’s clients. For example: (i) Affiliated accounts can hold the senior debt of an issuer whose subordinated debt is held by Prudential Fixed Income’s clients or hold secured debt of an issuer whose public unsecured debt is held in client accounts. In the event of restructuring or insolvency, the affiliated accounts as holders of senior debt may exercise remedies and take other actions that are not in the interest of, or are adverse to, other clients that are the holders of junior debt. (ii) To the extent permitted by applicable law, Prudential Fixed Income may also invest client assets in offerings of securities the proceeds of which are used to repay debt obligations held in affiliated accounts or other client accounts. Prudential Fixed Income’s interest in having the debt repaid creates a conflict of interest. Prudential Fixed Income has adopted a refinancing policy to address this conflict. Prudential Fixed Income may be unable to invest client assets in the securities of certain issuers as a result of the investments described above. |
| ■ | Conflicts Related to the Offer and Sale of Securities. Certain of Prudential Fixed Income’s employees may offer and sell securities of, and interests in, commingled funds that it manages or sub-advises. There is an incentive for Prudential Fixed Income’s employees to offer these securities to investors regardless of whether the investment is appropriate for such investor since increased assets in these vehicles will result in increased advisory fees to it. In addition, such sales could result in increased compensation to the employee. |
| ■ | Conflicts Related to Long-Term Compensation. The performance of many client accounts is not reflected in the calculation of changes in the value of participation interests under Prudential Fixed Income’s long-term incentive plan. This may be because the composite representing the strategy in which the account is managed is not one of the composites included in the calculation or |
49
| because the account is excluded from a specified composite due to guideline restrictions or other factors. As a result of the long-term incentive plan, Prudential Fixed Income’s portfolio managers from time to time have financial interests related to the investment performance of some, but not all, of the accounts they manage. To address potential conflicts related to these financial interests, Prudential Fixed Income has procedures, including trade allocation and supervisory review procedures, designed to ensure that each of its client accounts is managed in a manner that is consistent with Prudential Fixed Income’s fiduciary obligations, as well as with the account’s investment objectives, investment strategies and restrictions. Specifically, Prudential Fixed Income’s chief investment officer reviews performance among similarly managed accounts to confirm that performance is consistent with expectations. The results of this review process are discussed at meetings of Prudential Fixed Income’s trade management oversight committee. | |
| ■ | Other Financial Interests. Prudential Fixed Income and its affiliates may also have financial interests or relationships with issuers whose securities it invests in for client accounts. These interests can include debt or equity financing, strategic corporate relationships or investments, and the offering of investment advice in various forms. For example, Prudential Fixed Income may invest client assets in the securities of issuers that are also its advisory clients. |
In general, conflicts related to
the securities holdings and financial interests described above are addressed by the fact that Prudential Fixed Income makes investment decisions for each client independently considering the best economic interests
of such client.
Conflicts Related to Valuation and
Fees. When client accounts hold illiquid or difficult to value investments, Prudential Fixed Income faces a conflict of interest when making recommendations regarding the value of such investments
since its management fees are generally based on the value of assets under management. Prudential Fixed Income believes that its valuation policies and procedures mitigate this conflict effectively and enable it to
value client assets fairly and in a manner that is consistent with the client’s best interests.
Conflicts Related to Securities
Lending Fees. When Prudential Fixed Income manages a client account and also serves as securities lending agent for the account, it could be considered to have the incentive to invest in securities that
would yield higher securities lending rates. This conflict is mitigated by the fact that Prudential Fixed Income’s advisory fees are generally based on the value of assets in a client’s account. In
addition, Prudential Fixed Income’s securities lending function has a separate reporting line to its chief operating officer (rather than its chief investment officer).
PREI®. Portfolio managers are compensated based on the overall performance of PREI, including the Global Real Estate Securities Group. Additionally, officers of the Global Real Estate Securities
Group receive compensation from carried interest that is generated by our real estate private equity funds. The carried interest compensation is tied to a multi-year vesting plan.
COMPENSATION. Specifically, there are three elements of compensation: base salary, bonus and deferred compensation.
Base salary/bonus-reviews are
completed for these components annually. Bonuses are generally based on investment performance, on the overall financial results of PIM, PREI, the Global Real Estate Securities Group, as well as the individual's own
performance and contribution. For officers, bonuses can range from 70% to 200% of base salary. PREI's incentive compensation program is designed to align the interests of each investment professional with those of our
clients. Total compensation is designed to be competitive with the market, but an individual's actual compensation will vary. The size of the overall bonus pool available in a given year primarily depends on the
financial performance of PREI and the investment performance of our clients' accounts for the applicable year measured against each account's benchmark. An individual's share of the pool is based on his or her
contribution toward meeting these goals. The individual's contribution is determined based on a set of goals for that individual, the performance of the accounts in which the individual is involved and the judgment of
senior management. Thus, the performance of our clients' accounts, PREI and the individual are all important factors in the size of the annual bonus awarded to an individual.
Individuals at the Managing
Director, Principals, and Vice President levels also receive deferred compensation awards. Those professionals who are eligible to participate in this program receive an annual award based on the same factors as the
annual bonus. The award, however, is not immediately paid to the individual and does not vest until three years later. During that period, the value of the award increases or decreases based on the performance of the
accounts on which the participant works directly and the performance of all discretionary equity real estate accounts that PREI manages.
CONFLICTS OF INTEREST. PREI is a division of PIM, which is an indirect, wholly-owned subsidiary of Prudential Financial and is part of a full scale global financial services organization, affiliated with
insurance companies, investment advisers and broker-dealers. PREI's portfolio managers are often responsible for managing multiple accounts, including accounts of affiliates, institutional accounts, mutual funds,
insurance company separate accounts and various pooled investment vehicles, such as commingled trust funds and unregistered funds. These affiliations and portfolio management responsibilities may cause potential and
actual conflicts of interest. PREI aims to conduct itself in a manner it considers to be the most fair and consistent with its fiduciary obligations to all of its clients, including the Fund.
50
Management of multiple accounts and
funds side-by-side may raise potential conflicts of interest relating to the allocation of investment opportunities, the aggregation and allocation of trades and cross trading. PREI has developed policies and
procedures designed to address these potential conflicts of interest.
There may be restrictions imposed
by law, regulation or contract regarding how much, if any, of a particular security PREI may purchase or sell on behalf of a Fund, and as to the timing of such purchase or sale. Such restrictions may come into play as
a result of PREI's relationship with Prudential Financial and its other affiliates. The Fund may be prohibited from engaging in transactions with its affiliates even when such transactions may be beneficial for the
Fund. Certain affiliated transactions are permitted in accordance with applicable law and procedures adopted thereunder by the Trust and reviewed by the Independent Board Members of the Trust.
PREI may come into possession of
material, non-public information with respect to a particular issuer and as a result be unable to execute purchase or sale transactions in securities of such issuer for a Fund. PREI, on behalf of client portfolios,
engages in real estate and other transactions with REITs and real estate operating companies and may thereby obtain material, non-public information about issuers, resulting in restrictions in trading in securities of
such issuers. PREI generally is able to avoid certain other potential conflicts due to the possession of material, non-public information by maintaining information barriers to prevent the transfer of this information
between units of PIM as well as between affiliates and PIM. Additionally, in an effort to avoid potential conflicts of interest, PREI has procedures in place to carefully consider whether or not to accept material,
non-public information with respect to certain issuers, where appropriate.
Certain affiliates of PREI develop
and may publish credit research that is independent from the research developed within PREI. PREI may hold different opinions on the investment merits of a given security, issuer or industry such that PREI may be
purchasing or holding a security for the Fund and an affiliated entity may be selling or recommending a sale of the same security or other securities of the issuer. Conversely, PREI may be selling a security for the
Fund and an affiliated entity may be purchasing or recommending a buy of the same security or other securities of the same issuer. In addition, PREI's affiliated broker-dealers or investment advisers may be executing
transactions in the market in the same securities as the Fund at the same time. PREI may cause securities transactions to be executed for the Fund concurrently with authorizations to purchase or sell the same
securities for other accounts managed by PREI, including proprietary accounts or accounts of affiliates. In these instances, the executions of purchases or sales, where possible, are allocated equitably among the
various accounts (including the Fund).
PREI may buy or sell, or may direct
or recommend that one client buy or sell, securities of the same kind or class that are purchased or sold for the Fund, at prices which may be different. In addition, PREI may, at any time, execute trades of
securities of the same kind or class in one direction for an account and trade in the opposite direction or not trade for any other account, including the Fund, due to differences in investment strategy or client
direction.
The fees charged to advisory
clients by PREI may differ depending upon a number of factors including, but not limited to, the unit providing the advisory services, the particular strategy, the size of a portfolio being managed, the relationship
with the client, the origination and service requirements and the asset class involved. Fees may also differ based on account type (e.g., commingled accounts, trust accounts, insurance company separate accounts, and
corporate, bank or trust-owned life insurance products). Fees are negotiable so one client with similar investment objectives or goals may be paying a higher fee than another client. Fees paid by certain clients may
also be higher due to performance based fees which increase based on the performance of a portfolio above an established benchmark.
Large clients generate more revenue
for PREI than do smaller accounts. A portfolio manager may be faced with a conflict of interest when allocating scarce investment opportunities given the benefit to PREI of favoring accounts that pay a higher fee or
generate more income for PIM. To address this conflict of interest, PREI has adopted allocation policies as well as supervisory procedures that are intended to fairly allocate investment opportunities among competing
client accounts. PREI manages certain funds that are subject to incentive compensation on a side-by-side basis with other accounts including the Fund.
PREI has implemented policies and
procedures to address potential conflicts of interest arising out of such side-by-side management.
Conflicts of interest may also
arise regarding proxy voting. A committee of senior business representatives together with relevant regulatory personnel oversees the proxy voting process and monitors potential conflicts of interest relating to proxy
voting.
PREI and certain of its affiliates
engage in various activities related to investment in real estate. For example, PREI or any of its affiliates may enter into financing arrangements with issuers of real estate securities, including the making of loans
secured by the assets or by the credit of the issuer of the real estate securities and may, in certain circumstances, exercise of creditor or other remedies, against the issuer of such real estate securities in
connection with such financing arrangements. In addition, PREI or any of its affiliates may buy or sell, or may direct or recommend that another person buy or sell, securities of the same kind or class, or from the
same issuer as are purchased or sold for this or any other account under the direction of PREI or any of its affiliates. PREI or its affiliates, as a part
51
of its direct investment in real estate on behalf
of clients, may obtain material non-public information regarding an issuer of securities that the fund may hold or wish to hold. As a consequence of these activities, PREI's ability to purchase or sell, or to chose
the timing of purchase or sale of, real estate securities of a given issuer may be restricted by contract or by applicable laws, including ERISA or federal securities laws.
Prudential Financial and the
general account of The Prudential Insurance Company of America (“PICA”) may at times have various levels of financial or other interests in companies whose securities may be purchased or sold in PIM's
client accounts, including the Fund. These financial interests may at any time be in potential or actual conflict or may be inconsistent with positions held or actions taken by PIM on behalf of the Fund. These
interests can include loan servicing, debt or equity financing, services related to advising on merger and acquisition issues, strategic corporate relationships or investments and the offering of investment advice in
various forms. Thus PIM may invest Fund assets in the securities of companies with which PIM or an affiliate of PIM has a financial relationship, including investment in the securities of companies that are advisory
clients of PIM.
PREI follows Prudential Financial's
policies on business ethics, personal securities trading by investment personnel, and information barriers and has adopted a code of ethics, allocation policies, supervisory procedures and conflicts of interest
policies, among other policies and procedures, which are designed to ensure that clients are not harmed by these potential and actual conflicts of interests; however, there is no guarantee that such policies and
procedures will detect and will ensure avoidance or disclosure of each and every situation in which a conflict may arise.
OTHER SERVICE PROVIDERS
CUSTODIAN. The Bank of New York Mellon (BNY), One Wall Street, New York, New York 10286, serves as Custodian for the Fund's portfolio securities and cash, and in that capacity, maintains certain
financial accounting books and records pursuant to an agreement with the Fund. Subcustodians provide custodial services for any foreign assets held outside the United States.
SECURITIES LENDING AGENT. Prudential Investment Management, Inc. (PIM) serves as securities lending agent for the Fund, and in that role administers the Fund's securities lending program. PIM is an affiliate of PI.
For its services, PIM receives a portion of the amount earned by lending securities. The compensation received by PIM for services as securities lending agent for the three most recently completed fiscal years is set
forth below.
| Compensation Received by PIM for Securities Lending: Income Builder Fund (formerly known as Target Conservative Allocation Fund)* | ||||
| 2014 | 2014 | 2013 | 2012 | |
| None | None | None | None |
*During 2014, the Fund
changed its fiscal year-end from July 31 to October 31. The figures shown above are for the fiscal period from August 1, 2014 through October 31, 2014, and the fiscal years ended July 31, 2014, 2013 and 2012.
TRANSFER AGENT. PMFS, Gateway Center Three, 100 Mulberry Street, Newark, New Jersey 07102, serves as the transfer and dividend disbursing agent of the Fund. PMFS is an affiliate of the Manager. PMFS
provides customary transfer agency services to the Fund, including the handling of shareholder communications, the processing of shareholder transactions, the maintenance of shareholder account records, the payment of
dividends and distributions, and related functions. For these services, PMFS receives compensation from the Fund and is reimbursed for its transfer agent expenses which include an annual fee and certain out-of-pocket
expenses including, but not limited to, postage, stationery, printing, allocable communication expenses and other costs.
The Fund's Board has appointed BNY
Mellon Asset Servicing (US) Inc. (BNYAS), 301 Bellevue Parkway, Wilmington, Delaware 19809, as sub-transfer agent to the Fund. PMFS has contracted with BNYAS to provide certain administrative functions to PMFS. PMFS
will compensate BNYAS for such services.
INDEPENDENT
REGISTERED PUBLIC ACCOUNTING FIRM. KPMG LLP, 345 Park Avenue, New York, New York 10154, served as independent registered public accounting firm for the Fund, and in that capacity will audit the annual
financial statements for the Fund for the next fiscal year.
DISTRIBUTION OF FUND SHARES
DISTRIBUTOR. Prudential Investment Management Services LLC (PIMS or the Distributor), Gateway Center Three, 14th Floor, 100 Mulberry Street, Newark, New Jersey 07102-4077, acts as the distributor of all of the shares of the Fund. The Distributor is a subsidiary of
Prudential.
52
The Distributor incurs the expenses
of distributing each of the Fund's share classes pursuant to separate Distribution and Service Plans for each share class (collectively, the Plans) adopted by the Fund pursuant to Rule 12b-1 under the 1940 Act and a
distribution agreement (the Distribution Agreement). PIMS also incurs the expenses of distributing any share class offered by the Fund which is not subject to a Distribution and Service (12b-1) Plan, and none of the
expenses incurred by PIMS in distributing such share classes are reimbursed or paid for by the Fund.
The expenses incurred under the
Plans include commissions and account servicing fees paid to, or on account of, brokers or financial institutions which have entered into agreements with the Distributor, as applicable, advertising expenses, the cost
of printing and mailing prospectuses to potential investors and indirect and overhead costs of the Distributor associated with the sale of Fund shares, including sales promotion expenses.
Under the Plans,
the Fund is obligated to pay distribution and/or service fees to the Distributor, as applicable, as compensation for its distribution and service activities, not as reimbursement for specific expenses incurred. If the
Distributor’s expenses exceed its distribution and service fees, the Fund will not be obligated to pay any additional expenses. If the Distributor’s expenses are less than such distribution and service
fees, then it will retain its full fees and realize a profit.
The distribution and/or service
fees may also be used by the Distributor to compensate on a continuing basis brokers in consideration for the distribution, marketing, administrative and other services and activities provided by brokers with respect
to the promotion of the sale of Fund shares and the maintenance of related shareholder accounts.
Distribution expenses attributable
to the sale of each share class are allocated to each such class based upon the ratio of sales of each such class to the combined sales of all classes of the Fund, other than expenses allocable to a particular class.
The distribution fee and sales charge of one class will not be used to subsidize the sale of another class.
Each Plan continues in effect from
year to year, provided that each such continuance is approved at least annually by a vote of the Board, including a majority vote of the Board Members who are not interested persons of the Fund and who have no direct
or indirect financial interest in any of the Plans or in any agreement related to the Plans (the Rule 12b-1 Board Members), cast in person at a meeting called for the purpose of voting on such continuance. A Plan may
be terminated at any time, without penalty, by the vote of a majority of the Rule 12b-1 Board Members or by the vote of the holders of a majority of the outstanding shares of the applicable class of the Fund on not
more than 30 days' written notice to any other party to the Plan. The Plans may not be amended to increase materially the amounts to be spent for the services described therein without approval by the shareholders of
the applicable class, and all material amendments are required to be approved by the Board in the manner described above. Each Plan will automatically terminate in the event of its assignment. The Fund will not be
contractually obligated to pay expenses incurred under any Plan if it is terminated or not continued.
Pursuant to each Plan, the Board
will review at least quarterly a written report of the distribution expenses incurred on behalf of each class of shares of the Fund by the Distributor. The report will include an itemization of the distribution
expenses and the purposes of such expenditures. In addition, as long as the Plans remain in effect, the selection and nomination of Rule 12b-1 Board Members shall be committed to the Rule 12b-1 Board Members.
Pursuant to the
Distribution Agreement, the Fund has agreed to indemnify the Distributor to the extent permitted by applicable law against certain liabilities under federal securities laws. In addition to distribution and service
fees paid by the Fund under the Plans, the Manager (or one of its affiliates) may make payments out of its own resources to dealers and other persons which distribute shares of the Fund. Such payments may be
calculated by reference to the NAV of shares sold by such persons or otherwise.
CLASS A SALES CHARGE AND DISTRIBUTION
EXPENSE INFORMATION. Under the Class A Plan, the Fund may pay the Distributor for its distribution-related activities with respect to Class A shares at an annual rate of .30% of the average daily net assets of
the Class A shares. The Class A Plan provides that (1) .25% of the average daily net assets of the Class A shares may be used to pay for personal service and/or the maintenance of shareholder accounts (service fee)
and (2) total distribution fees (including the service fee of .25%) may not exceed .30% of the average daily net assets of the Class A shares. The Prospectus discusses any contractual or voluntary fee waivers that may
be in effect. In addition, if you purchase $1 million or more of Class A shares, you are subject to a 1% CDSC (defined below) for shares redeemed within 12 months of purchase (the CDSC is waived for purchase by
certain retirement and/or benefit plans). (Note: For Prudential Short-Term Corporate Bond Fund only, if you purchase $1 million or more of Class A shares, you are subject to a .50% CDSC for shares redeemed within
18 months of purchase.)
53
For the most
recently completed fiscal year, the Distributor received payments under the Class A Plan. These amounts were expended primarily for payments of account servicing fees to financial advisers and other persons who sell
Class A shares. For the most recently completed fiscal year, the Distributor also received initial sales charges and proceeds of contingent deferred sales charges paid by shareholders upon certain redemptions of Class
A shares. The amounts received and spent by the Distributor are detailed in the tables below.
CLASS B AND CLASS C SALES CHARGE AND
DISTRIBUTION EXPENSE INFORMATION. Under the Class B and Class C Plans, the Fund may pay the Distributor for its distribution-related activities with respect to Class B and Class C shares at an annual rate of 1% of the
average daily net assets of each of the Class B and Class C shares. The Class B and Class C Plans provide that (1) .25% of the average daily net assets of the shares may be paid as a service fee and (2) .75% (not
including the service fee) of the average daily net assets of the shares (asset based sales charge) may be paid for distribution-related expenses with respect to the Class B shares and Class C shares. The service fee
(.25% of average daily net assets) is used to pay for personal service and/or the maintenance of shareholder accounts. The Prospectus discusses any voluntary or contractual fee waivers that may be in effect. The
Distributor also receives contingent deferred sales charges from certain redeeming shareholders.
For the most recently completed
fiscal year, the Distributor received payments under the Class B and C Plans. These amounts were expended primarily for payments of account servicing fees to financial advisers and other persons who sell Class B and
Class C shares. For the most recently completed fiscal year, the Distributor also received the proceeds of contingent deferred sales charges paid by shareholders upon certain redemptions of Class B and Class C shares.
The amounts received and spent by the Distributor are detailed in the tables below.
CLASS R SALES CHARGE
AND DISTRIBUTION EXPENSE INFORMATION. Under the Class R Plan, the Fund may pay the Distributor for its distribution-related expenses with respect to Class R shares at an annual rate of up to .75% of the average daily net
assets of the Class R shares. The Class R Plan provides that (1) up to .25% of the average daily net assets of the Class R shares may be used as a service fee and (2) total distribution fees (including the service fee
of .25%) may not exceed .75% of the average daily net assets of the Class R shares. There is no CDSC for the redemption of Class R shares. The Prospectus discusses any contractual or voluntary fee waivers that may be
in effect. For the most recently completed fiscal year, the Distributor received payments under the Class R Plan. These amounts were expended primarily for payments of account servicing fees to financial advisors and
other persons who sell Class R shares. The amounts received and spent by the Distributor are detailed in the tables below.
| Payments Received by the Distributor* | |
| Income Builder Fund (formerly known as Target Conservative Allocation Fund) | |
| Class A Distribution and service (12b-1) fees | $53,492 |
| Class A Initial Sales Charges | $16,363 |
| Class A Contingent Deferred Sales Charges (CDSC’s) | $6 |
| Class B Distribution and service (12b-1) fees | $12,614 |
| Class B Contingent Deferred Sales Charges (CDSC’s) | $2,714 |
| Class C Distribution and service (12b-1) fees | $44,142 |
| Class C Contingent Deferred Sales Charges (CDSC’s) | $532 |
| Class R Distribution and service (12b-1) fees | $438 |
*During 2014, the Fund
changed its fiscal year-end from July 31 to October 31. The amounts shown are for the period from August 1, 2014 through October 31, 2014.
| Amounts Spent by Distributor+ | |||||
| Fund | Share Class | Printing & Mailing Prospectuses to Other than Current Shareholders |
Compensation to Broker/Dealers for Commissions to Representatives and Other Expenses* |
Overhead Costs ** | Total Amount Spent by Distributor |
| Income Builder Fund (formerly known as Target Conservative Allocation Fund) | |||||
| Class A | None | $52,506 | $15,267 | $67,773 | |
| Class B | $12 | $3,151 | $843 | $4,006 | |
| Class C | $43 | $42,173 | $2,946 | $45,162 | |
| Class R | None | $420 | $59 | $479 | |
+During 2014, the Fund changed its fiscal
year-end from July 31 to October 31. The amounts shown are for the period from August 1, 2014 through October 31, 2014.
* Includes amounts paid to
affiliated broker/dealers.
54
** Includes sales promotion expenses.
FEE WAIVERS AND SUBSIDIES. PI may from time to time waive all or a portion of its management fee and subsidize all or a portion of the operating expenses of the Fund. In addition, the Distributor may from time to
time waive a portion of the distribution and service (12b-1) fees as described in the Prospectus. Fee waivers and subsidies will increase the Fund's total return.
PAYMENTS TO FINANCIAL SERVICES
FIRMS. As described in the Fund's Prospectus, the Manager or certain of its affiliates (but not the Distributor) have entered into revenue sharing or other similar arrangements with financial
services firms, including affiliates of the Manager. These revenue sharing arrangements are intended to promote the sale of Fund shares or to compensate the financial services firms for marketing or marketing support
activities in connection with the sale of Fund shares.
The list below includes the names
of the firms (or their affiliated broker/dealers) that received from the Manager, and/or certain of its affiliates, revenue sharing payments of more than $10,000 in calendar year 2013 for marketing and product support
of the Fund and other Prudential Investments funds as described above.
| ■ | Prudential Retirement |
| ■ | Wells Fargo Advisors, LLC |
| ■ | Ameriprise Financial Services Inc. |
| ■ | Merrill Lynch Pierce Fenner & Smith Inc. |
| ■ | MSSB |
| ■ | UBS Financial Services Inc. |
| ■ | Fidelity |
| ■ | Raymond James |
| ■ | Principal Life Insurance Company |
| ■ | LPL Financial |
| ■ | GWFS Equities, Inc. (Great West) |
| ■ | Nationwide Financial Services Inc. |
| ■ | ADP Broker-Dealer, Inc. |
| ■ | Hartford Life |
| ■ | MSCS Financial Services LLC |
| ■ | ING |
| ■ | Commonwealth Financial Network |
| ■ | American United Life Insurance Company |
| ■ | Charles Schwab & Co., Inc. |
| ■ | Ascensus |
| ■ | JP Morgan Chase Bank, N.A. |
| ■ | MidAtlantic Capital Corp. |
| ■ | NYLIFE Distributors LLC |
| ■ | T. Rowe Price Retirement Plan Services |
| ■ | Lincoln Retirement Services Company LLC |
| ■ | John Hancock USA |
| ■ | Benefit Trust Company |
| ■ | Diversified Investment Advisors |
| ■ | Mercer HR Services, LLC |
| ■ | The Ohio National Life Insurance Company |
| ■ | Security Benefit Life Insurance Company |
| ■ | RBC Capital Markets Corporation |
| ■ | Janney Montgomery & Scott, Inc. |
| ■ | TD Ameritrade Trust Company |
| ■ | Cambridge |
| ■ | Hewitt Associates LLC |
| ■ | Newport Retirement Plan Services, Inc. |
| ■ | Vanguard Group, Inc. |
| ■ | Standard Insurance Company |
| ■ | Securities America, Inc. |
| ■ | Genworth |
| ■ | Massachusetts Mutual Life Insurance Company |
| ■ | Reliance Trust Company |
| ■ | VALIC Retirement Services Company |
55
| ■ | Wilmington Trust Company |
| ■ | CPI Qualified Plan Consultants, Inc. |
| ■ | First Allied Securities |
| ■ | 1st Global Capital Corp. |
| ■ | ExpertPlan, Inc. |
| ■ | Daily Access Corporation |
| ■ | Oppenheimer & Co. |
| ■ | Northern Trust |
| ■ | Sammons Retirement Solutions, Inc. |
| ■ | Triad Advisors Inc. |
| ■ | AXA Equitable Life Insurance Company |
| ■ | United Planners Financial Services of America |
| ■ | Investacorp |
| ■ | Morgan Keegan & Co. |
| ■ | BPAS |
| ■ | National Security Life |
COMPUTATION OF OFFERING PRICE
PER SHARE
Using the NAV at
October 31, 2014, the offering prices of Fund shares were as follows:
| Income Builder Fund | |
| Class A | |
| NAV and redemption price per Class A share | $11.90 |
| Maximum initial sales charge (5.50% of public offering price) | $.69 |
| Maximum offering price to public | $12.59 |
| Class B | |
| NAV, offering price and redemption price per Class B share | $11.74 |
| Class C | |
| NAV, offering price and redemption price per Class C share | $11.74 |
| Class R | |
| NAV, offering price and redemption price per Class R share | $11.89 |
| Class Z | |
| NAV, offering price and redemption price per Class Z share | $11.96 |
PORTFOLIO TRANSACTIONS &
BROKERAGE
The Fund has
adopted a policy pursuant to which the Fund and its Manager, subadvisers and principal underwriter are prohibited from directly or indirectly compensating a broker-dealer for promoting or selling Fund shares by
directing brokerage transactions to that broker. The Fund has adopted procedures for the purpose of deterring and detecting any violations of the policy. The policy permits the Fund, the Manager and the subadvisers to
use selling brokers to execute transactions in portfolio securities so long as the selection of such selling brokers is the result of a decision that executing such transactions is in the best interest of the Fund and
is not influenced by considerations about the sale of Fund shares. For purposes of this section, the term “Manager” includes the subadvisers.
The Manager is responsible for
decisions to buy and sell securities, futures contracts and options on such securities and futures for the Fund, the selection of brokers, dealers and futures commission merchants to effect the transactions and the
negotiation of brokerage commissions, if any. On a national securities exchange, broker-dealers may receive negotiated brokerage commissions on Fund portfolio transactions, including options, futures, and options on
futures transactions and the purchase and sale of underlying securities upon the exercise of options. On a foreign securities exchange, commissions may be fixed. Orders may be directed to any broker or futures
commission merchant including, to the extent and in the manner permitted by applicable laws, one of the Manager's affiliates (an affiliated broker). Brokerage commissions on US securities, options and futures
exchanges or boards of trade are subject to negotiation between the Manager and the broker or futures commission merchant.
In the OTC market, securities are
generally traded on a “net” basis with dealers acting as principal for their own accounts without a stated commission, although the price of the security usually includes a profit to the dealer. In
underwritten offerings, securities are purchased at a fixed price which includes an amount of compensation to the underwriter, generally referred to as the underwriter's
56
concession or discount. On occasion, certain money
market instruments and US Government agency securities may be purchased directly from the issuer, in which case no commissions or discounts are paid. The Fund will not deal with an affiliated broker in any transaction
in which an affiliated broker acts as principal except in accordance with the rules of the SEC.
In placing orders for portfolio
securities of the Fund, the Manager's overriding objective is to obtain the best possible combination of favorable price and efficient execution. The Manager seeks to effect such transaction at a price and commission
that provides the most favorable total cost of proceeds reasonably attainable in the circumstances. The factors that the Manager may consider in selecting a particular broker, dealer or futures commission merchant
(firms) are the Manager's knowledge of negotiated commission rates currently available and other current transaction costs; the nature of the portfolio transaction; the size of the transaction; the desired timing of
the trade; the activity existing and expected in the market for the particular transaction; confidentiality; the execution, clearance and settlement capabilities of the firms; the availability of research and
research-related services provided through such firms; the Manager's knowledge of the financial stability of the firms; the Manager's knowledge of actual or apparent operational problems of firms; and the amount of
capital, if any, that would be contributed by firms executing the transaction. Given these factors, the Fund may pay transaction costs in excess of that which another firm might have charged for effecting the same
transaction.
When the Manager
selects a firm that executes orders or is a party to portfolio transactions, relevant factors taken into consideration are whether that firm has furnished research and research-related products and/or services, such
as research reports, research compilations, statistical and economic data, computer databases, quotation equipment and services, research-oriented computer software and services, reports concerning the performance of
accounts, valuations of securities, investment-related periodicals, investment seminars and other economic services and consultations. Such services are used in connection with some or all of the Manager's investment
activities; some of such services, obtained in connection with the execution of transactions for one investment account, may be used in managing other accounts, and not all of these services may be used in connection
with the Fund. The Manager maintains an internal allocation procedure to identify those firms who have provided it with research and research-related products and/or services, and the amount that was provided, and to
endeavor to direct sufficient commissions to them to ensure the continued receipt of those services that the Manager believes provide a benefit to the Fund and its other clients. The Manager makes a good faith
determination that the research and/or service is reasonable in light of the type of service provided and the price and execution of the related portfolio transactions.
When the Manager deems the purchase
or sale of equities to be in the best interests of the Fund or its other clients, including Prudential, the Manager may, but is under no obligation to, aggregate the transactions in order to obtain the most favorable
price or lower brokerage commissions and efficient execution. In such event, allocation of the transactions, as well as the expenses incurred in the transaction, will be made by the Manager in the manner it considers
to be most equitable and consistent with its fiduciary obligations to clients. The allocation of orders among firms and the commission rates paid are reviewed periodically by the Fund's Board. Portfolio securities may
not be purchased from any underwriting or selling syndicate of which any affiliate, during the existence of the syndicate, is a principal underwriter (as defined in the 1940 Act), except in accordance with rules of
the SEC. This limitation, in the opinion of the Fund, will not significantly affect the Fund's ability to pursue its present investment objectives. However, in the future in other circumstances, the Fund may be at a
disadvantage because of this limitation in comparison to other funds with similar objectives but not subject to such limitations.
Subject to the above
considerations, an affiliate may act as a broker or futures commission merchant for the Fund. In order for an affiliate of the Manager to effect any portfolio transactions for the Fund, the commissions, fees or other
remuneration received by the affiliated broker must be reasonable and fair compared to the commissions, fees or other remuneration paid to other firms in connection with comparable transactions involving similar
securities or futures being purchased or sold on an exchange or board of trade during a comparable period of time. This standard would allow the affiliated broker to receive no more than the remuneration which would
be expected to be received by an unaffiliated firm in a commensurate arm's-length transaction. Furthermore, the Board, including a majority of the Independent Board Members, has adopted procedures which are reasonably
designed to provide that any commissions, fees or other remuneration paid to the affiliated broker (or any affiliate) are consistent with the foregoing standard. In accordance with Section 11(a) of the 1934 Act, an
affiliate may not retain compensation for effecting transactions on a national securities exchange for the Fund unless the Fund has expressly authorized the retention of such compensation. The affiliate must furnish
to the Fund at least annually a statement setting forth the total amount of all compensation retained by the affiliate from transactions effected for the Fund during the applicable period. Brokerage transactions with
an affiliated broker are also subject to such fiduciary standards as may be imposed upon the affiliate by applicable law. Transactions in options by the Fund will be subject to limitations established by each of the
exchanges governing the maximum number of options which may be written or held by a single investor or group of investors acting in concert, regardless of whether the options are written or held on the same or
different exchanges or are written or held in one or more accounts or through one or more brokers. Thus, the number of options which the Fund may write or hold may be affected by options written or held by the Manager
and other investment advisory clients of the Manager. An exchange may order the liquidation of positions found to be in excess of these limits, and it may impose certain other sanctions.
57
Set forth below is
information concerning the payment of commissions by the Fund, including the amount of such commissions paid to an affiliate, if any, for the indicated fiscal years or periods:
| Prudential Income Builder Fund (formerly known as Target Conservative Allocation Fund)* | ||||
| 2014 | 2014 | 2013 | 2012 | |
| Total brokerage commissions paid by the Fund | $34,692 | $18,921 | $34,320 | $40,235 |
| Total brokerage commissions paid to affiliated brokers | None | None | None | None |
| Percentage of total brokerage commissions paid to affiliated brokers | 0.00% | 0.00% | 0.00% | 0.00% |
| Percentage of the aggregate dollar amount of portfolio transactions involving the payment of commissions to affiliated brokers | 0.00% | 0.00% | 0.00% | 0.00% |
* During 2014, the Fund
changed its fiscal year-end from July 31 to October 31. The figures shown above are for the fiscal period from August 1, 2014 through October 31, 2014, and the fiscal years ended July 31, 2014, 2013 and 2012.
The Fund is required to disclose
its holdings of securities of its regular brokers and dealers (as defined under Rule 10b-1 under the 1940 Act) and their parents as of the most recently completed fiscal year. As of the most recently completed fiscal
year, the Fund held the following securities of its regular brokers and dealers.
| Broker-Dealer Securities Holdings ($) (as of most recently completed fiscal year)* | |||
| Fund Name | Broker/Dealer Name | Equity (E)/Debt (D) | Amount |
| Income Builder Fund (formerly known as Target Conservative Allocation Fund) | Wells Fargo Securities LLC | E | $432,577 |
| Banc of America Securities LLC | E | $315,675 | |
| JPMorgan Chase & Co. | E | $290,667 | |
| CIT Capital Securities LLC | E | $261,563 | |
| Wells Fargo Securities LLC | D | $195,040 | |
* During 2014, the Fund
changed its fiscal year-end from July 31 to October 31. The figures shown above are as of October 31, 2014.
ADDITIONAL INFORMATION
FUND HISTORY. Prudential Investment Portfolios 16 (the “Trust”) was organized as a Delaware statutory trust on July 29, 1998 under the name Prudential Diversified Funds. On September 4,
2001, the Trust amended its Certificate of Trust, changing its name to Strategic Partners Asset Allocation Funds. On September 29, 2006, the Trust further amended its Certificate of Trust, changing its name to Target
Asset Allocation Funds. Effective May 8, 2013, the Trust amended its Certificate of Trust, changing its name to Prudential Investment Portfolios 16. Also on May 8, 2013, Target Moderate Allocation Fund changed its
name to Prudential Defensive Equity Fund. Effective June 21, 2013, Target Growth Allocation Fund was reorganized into Prudential Jennison Equity Income Fund, a series of Prudential Investment Portfolios, Inc. 10. The
Trust presently consists of Prudential Defensive Equity Fund and Prudential Income Builder Fund. On September 23, 2014, the Target Conservative Allocation Fund changed its name to the Prudential Income Builder
Fund.
DESCRIPTION OF SHARES AND
ORGANIZATION. The Trust is authorized to issue an unlimited number of shares of beneficial interest, $.001 par value per share, divided into two series (the Funds). Each Fund is divided into five
classes, designated Class A, Class B, Class C, Class R and Class Z shares. Each class of shares represents an interest in the same assets of the Fund and is identical in all respects except that (1) each class is
subject to different sales charges and distribution and/or service fees (except for Class Z shares, which are not subject to any sales charges or distribution and/or service fees), which may affect performance, (2)
each class has exclusive voting rights on any matter submitted to shareholders that relates solely to its arrangement and has separate voting rights on any matter submitted to shareholders in which the interests of
one class differ from the interests of any other class, (3) each class has a different exchange privilege, (4) Class B shares have a conversion feature and (5) Class R and Class Z shares are offered exclusively for
sale to a limited group of investors. In accordance with the Trust’s Agreement and Declaration of Trust, the Board Members may authorize the creation of additional series and classes within such series, with
such preferences, privileges, limitations and voting and dividend rights as the Board Members may determine. The voting rights of the shareholders of a series or class can be modified only by the vote of shareholders
of that series or class.
Shares of each Fund, when issued,
are fully paid, nonassessable, fully transferable and redeemable at the option of the holder. Shares are also redeemable at the option of the Trust under certain circumstances. Each share of each class is equal as to
earnings, assets and voting privileges, except as noted above, and each class of shares (with the exception of Class Z shares, which are not subject to any distribution or service fees) bears the expenses related to
the distribution of its shares. Except for the conversion feature applicable to the Class B shares, there are no conversion, preemptive or other subscription rights. In the event of liquidation, each share of a Fund
is
58
entitled to its portion of all of the Fund’s
assets after all debt and expenses of the Fund have been paid. Since Class B, and Class C shares generally bear higher distribution expenses than Class A and Class R shares, the liquidation proceeds to shareholders of
those classes are likely to be lower than to Class A and Class R shareholders and to Class Z shareholders, whose shares are not subject to any distribution and/or service fees.
The Trust does not intend to hold
annual meetings of shareholders unless otherwise required by law. The Trust will not be required to hold meetings of shareholders unless, for example, the election of Board Members is required to be acted on by
shareholders under the 1940 Act. Shareholders have certain rights, including the right to call a meeting upon the vote of 10% of the Fund’s outstanding shares for the purpose of voting on the removal of one or
more Board Members or to transact any other business. The Trust will render assistance to those shareholders who call such a meeting.
Under the Agreement and Declaration
of Trust, the Board may authorize the creation of additional series of shares (the proceeds of which would be invested in separate, independently managed portfolios with distinct investment objectives and policies and
share purchase, redemption and NAV procedures) with such preferences, privileges, limitations and voting and dividend rights as the Board Members may determine. All consideration received by the Trust for shares of
any additional series, and all assets in which such consideration is invested, would belong to that series (subject only to the rights of creditors of that series) and would be subject to the liabilities related
thereto.
The Board has the power to alter
the number and the terms of office of the Board Members, provided that at all times at least a majority of the Board Members have been elected by the shareholders of the Trust. The voting rights of shareholders are
not cumulative, so that holders of more than 50 percent of the shares voting can, if they choose, elect all Board Members being selected, while the holders of the remaining shares would be unable to elect any Board
Members.
| Prinicipal Fund Shareholders (as of December 11, 2014) | |||
| Shareholder Name | Address | Share Class | No. of Shares/ % of Fund |
| National Financial Services LLC For Exclusive Benefit Of Our Customers Attn Mutual Funds Dept |
499 Washington Blvd, 4th Fl Jersey City, NJ 07310 |
A | 1,562,715 / 18.79% |
| Special Custody Account For The Exclusive Benefit Of Customers |
2801 Market Street Saint Louis, MO 63103 |
A | 805,829 / 9.69% |
| National Financial Services LLC For Exclusive Benefit Of Our Customers Attn Mutual Funds Dept |
499 Washington Blvd, 4th Fl Jersey City, NJ 07310 |
B | 125,167 / 26.68% |
| Special Custody Account For The Exclusive Benefit Of Customers |
2801 Market Street Saint Louis, MO 63103 |
B | 28,960 / 6.17% |
| Special Custody Account For The Exclusive Benefit Of Customers |
2801 Market Street Saint Louis, MO 63103 |
C | 824,186 / 45.19% |
| National Financial Services LLC For Exclusive Benefit Of Our Customers Attn Mutual Funds Dept |
499 Washington Blvd, 4th Fl Jersey City, NJ 07310 |
C | 197,125 / 10.81% |
| Morgan Stanley & Co | Harborside Financial Center Plaza II, 3rd Floor Jersey City, NJ 07311 |
C | 138,892 / 7.62% |
| Pershing LLC | 1 Pershing Plaza Jersey City, NJ 07399 |
C | 133,995 / 7.35% |
| Ascensus Trust Company FBO Bent Marine, Inc 401(K) & P/S Plan |
PO Box 10758 Fargo, ND 58106 |
R | 15,917 / 46.92% |
| Raymond James Omnibus For Mutual Funds House Account Attn: Courtney Waller |
880 Carillon Parkway St Petersburg, FL 33716 |
R | 15,669 / 46.18% |
| National Financial Services LLC For Exclusive Benefit Of Our Customers Attn Mutual Funds Dept |
499 Washington Blvd, 4th Fl Jersey City, NJ 07310 |
Z | 308,496 / 45.93% |
| Merrill Lynch, Pierce, Fenner & Smith For The Sole Benefit Of Its Customers |
4800 Deer Lake Drive East Jacksonville, Fl 32246 |
Z | 78,982 / 11.76% |
| Special Custody Account For The Exclusive Benefit Of Customers |
2801 Market Street Saint Louis, MO 63103 |
Z | 74,404 / 11.08% |
59
| Prinicipal Fund Shareholders (as of December 11, 2014) | |||
| Shareholder Name | Address | Share Class | No. of Shares/ % of Fund |
| LPL Financial (FBO) Customer Accounts Attn: Mutual Fund Operations |
PO Box 509046 San Diego, CA 92150 |
Z | 69,879 / 10.40% |
FINANCIAL STATEMENTS
The financial
statements for the Fund for the fiscal year ended October 31, 2014 incorporated in this SAI by reference to the 2014 annual report to shareholders (File No. 811-09805), were audited by KPMG LLP, an independent
registered public accounting firm. You may obtain a copy of the annual report at no charge by request to the Fund by calling (800) 225-1852 or by writing to Prudential Mutual Fund Services LLC, P.O. Box 9658,
Providence, RI 02940.
60
PART II
PURCHASE, REDEMPTION AND
PRICING OF FUND SHARES
SHARE CLASSES. The Fund may offer shares of one or more classes to investors. Not every share class described in this SAI may be offered, and investors should consult their Prospectus for specific
information concerning the share classes that are available to them.
Shares of the Fund may be purchased
at a price equal to the next determined NAV per share plus a sales charge (if applicable) which, at the election of the investor, may be imposed either (1) at the time of purchase (Class A shares) or (2) on a deferred
basis (Class B and Class C shares or Class A shares, in certain circumstances). Class R, Class Y and Class Z shares, if offered, are offered only to a limited group of investors at NAV without any sales charges.
Additional or different classes of
shares may also be offered, including Class I, Class Q, and Class R. If offered, specific information with respect to these share classes is set forth in the Prospectus and SAI.
For more information, see
“How to Buy, Sell and Exchange Fund Shares—How to Buy Shares” in the Prospectus.
PURCHASE BY WIRE. For an initial purchase of shares of the Fund by wire, you must complete an application and telephone PMFS at (800) 225-1852 (toll-free) to receive an account number. PMFS will request
the following information: your name, address, tax identification number, Fund name, class election (if applicable), dividend distribution election, amount being wired and wiring bank. PMFS will also furnish you with
instructions for wiring the funds from your bank to the Fund's Custodian.
If you arrange for receipt by the
Custodian of federal funds prior to the calculation of NAV (once each business day at the close of regular trading on the NYSE, usually 4:00 p.m. Eastern time), on a business day, you may purchase shares of the Fund
as of that day. In the event that regular trading on the NYSE closes before 4:00 p.m. Eastern time, you will receive the following day's NAV if your order to purchase is received after the close of regular trading on
the NYSE.
In making a
subsequent purchase order by wire, you should wire the Custodian directly and should be sure that the wire specifies the Fund name, the share class to be purchased, your name, individual account number, Direct Deposit
Account (DDA) Number and the Fund's Bank Account registration. You do not need to call PMFS to make subsequent purchase orders utilizing federal funds. The minimum amount for subsequent purchase by wire is $100.
ISSUANCE OF FUND SHARES FOR
SECURITIES. Transactions involving the issuance of Fund shares for securities (rather than cash) will be limited to (1) reorganizations, (2) statutory mergers, or (3) other acquisitions of portfolio
securities that: (a) meet the investment objectives and policies of the Fund, (b) are liquid and not subject to restrictions on resale, (c) have a value that is readily ascertainable via listing on or trading in a
recognized United States or international exchange or market, and (d) are approved by the Fund's Manager.
MULTIPLE ACCOUNTS. An institution may open a single master account by filing an application with PMFS, signed by personnel authorized to act for the institution. Individual subaccounts may be opened at the
time the master account is opened by listing them, or they may be added at a later date by written advice. Procedures will be available to identify subaccounts by name and number within the master account name. The
foregoing procedures would also apply to related institutional accounts (i.e., accounts of shareholders with a common institutional or corporate parent). The investment minimums as set forth in the relevant Prospectus
under “How to Buy and Sell Fund Shares—How to Buy Shares” are applicable to the aggregate amounts invested by a group, and not to the amount credited to each subaccount.
REOPENING AN ACCOUNT. Subject to the minimum investment restrictions, an investor may reopen an account, without filing a new application, at any time during the calendar year the account is closed, provided
that the information on that application is still applicable.
RESTRICTIONS ON SALE
OF FUND SHARES. The right of redemption may be suspended or the date of payment may be postponed for a period of up to seven days. Suspensions or postponements may not exceed seven days except at times
(1) when the NYSE is closed for other than customary weekends and holidays, (2) when trading on the NYSE is restricted, (3) when an emergency exists as a result of which disposal of Fund securities is not reasonably
practicable or it is not reasonably practicable for the Fund fairly to determine the value of its net assets, or (4) during any other period when the SEC, by order, so permits; provided that applicable rules and
regulations of the SEC shall govern as to whether the conditions prescribed in (2), (3) or (4) exist.
61
REDEMPTION IN
KIND. The Fund may pay the redemption price in whole or in part by a distribution in kind of securities from the investment portfolio of the Fund, in lieu of cash, in conformity with applicable
rules of the SEC and procedures adopted by the Board. Securities will be readily marketable and will be valued in the same manner as in a regular redemption. If your shares are redeemed in kind, you would incur
transaction costs in converting the assets into cash. The Fund, however, has elected to be governed by Rule 18f-1 under the 1940 Act, under which the Fund is obligated to redeem shares solely in cash up to the lesser
of $250,000 or 1% of the NAV of the Fund during any 90-day period for any one shareholder. Redemption in kind is generally not available for the Prudential Jennison MLP Fund.
RIGHTS OF ACCUMULATION. Reduced sales charges are also available through Rights of Accumulation, under which an investor or an eligible group of related investors, as described under “Reducing or Waiving
Class A's Initial Sales Charge” in the Prospectus, may aggregate the value of their existing holdings of Class A, Class B, and Class C shares of the Fund and shares of other Prudential Investments mutual funds
(excluding money market funds other than those acquired pursuant to the exchange privilege) to determine the reduced sales charge. However, the value of shares held directly with PMFS and through your broker will not
be aggregated to determine the reduced sales charge. The value of existing holdings for purposes of determining the reduced sales charge is calculated using the maximum offering price (NAV plus maximum sales charge).
The Distributor, your broker or PMFS must be notified at the time of purchase that the investor is entitled to a reduced sales charge. Reduced sales charges will be granted subject to confirmation of the investor's
holdings. This does not apply to Prudential MoneyMart Assets, Inc.
SALE OF SHARES. You can redeem your shares at any time for cash at the NAV next determined after the redemption request is received in proper form (in accordance with procedures established by PMFS in
connection with investors' accounts) by PMFS or your broker or other financial intermediary. See “Net Asset Value” below. In certain cases, however, redemption proceeds will be reduced by the amount of any
applicable contingent deferred sales charge (CDSC), as described in “Contingent Deferred Sales Charge” below. If you are redeeming your shares through a broker, your broker must receive your sell order
before the NAV is computed for that day (at the close of regular trading on the NYSE, usually, 4:00 p.m. Eastern time) in order to receive that day's NAV. In the event that regular trading on the NYSE closes before
4:00 p.m. Eastern time, you will receive the following day's NAV if your order to sell is received after the close of regular trading on the NYSE. Your broker will be responsible for furnishing all necessary
documentation to the Distributor and may charge you for its services in connection with redeeming shares of the Fund.
All correspondence and documents
concerning redemptions should be sent to the Fund in care of PMFS, P.O. Box 9658, Providence, Rhode Island 02940 or to your broker or other financial intermediary.
If you hold shares in
non-certificate form, a written request for redemption signed by you exactly as the account is registered is required. If you hold certificates, the certificates must be received by PMFS, the Distributor or your
broker in order for the redemption request to be processed. If redemption is requested by a corporation, partnership, trust or fiduciary, written evidence of authority acceptable to PMFS must be submitted before such
request will be accepted. All correspondence and documents concerning redemptions should be sent to the Fund in care of PMFS, P.O. Box 9658, Providence, RI 02940, to the Distributor or to your broker.
Payment for redemption of recently
purchased shares will be delayed until the Fund or PMFS has been advised that the purchase check has been honored, which may take up to 7 calendar days from the time of receipt of the purchase check by PMFS. Such
delay may be avoided by purchasing shares by wire or by certified or cashier's check.
SIGNATURE GUARANTEE. If the proceeds of the redemption (1) exceed $100,000, (2) are to be paid to a person other than the record owner, (3) are to be sent to an address other than the address on PMFS’
records, (4) are to be paid to a corporation, partnership, trust or fiduciary, or (5) are to be paid due to the death of the shareholder or on behalf of the shareholder, and your shares are held directly with PMFS,
the signature(s) on the redemption request or stock power must be medallion signature guaranteed. The medallion signature guarantee must be obtained from an authorized officer of a bank, broker, dealer, securities
exchange or association, clearing agency, savings association, or credit union that is participating in one of the recognized medallion programs (STAMP, SEMP, or NYSE MSP). The medallion signature guarantee must be
appropriate for the dollar amount of the transaction. PMFS reserves the right to reject transactions where the value of the transaction exceeds the value of the surety coverage indicated on the medallion imprint. PMFS
also reserves the right to request additional information from, and make reasonable inquires of, any institution that provides a medallion signature guarantee. In the case of redemptions from a PruArray Plan, if the
proceeds of the redemption are invested in another investment option of the plan in the name of the record holder and at the same address as reflected in PMFS' records, a medallion signature guarantee is not
required.
Payment for shares presented for
redemption will be made by check within seven days after receipt by PMFS or your broker of the written request and certificates, if issued, except as indicated below. If you hold shares through a broker, payment for
shares presented for redemption will be credited to your account at your broker, unless you indicate otherwise. Such payment may be postponed or the right of redemption suspended at times (1) when the NYSE is closed
for other than customary weekends and holidays, (2) when
62
trading on the
NYSE is restricted, (3) when an emergency exists as a result of which disposal by the Fund of securities owned by it is not reasonably practicable or it is not reasonably practicable for the Fund fairly to determine
the value of its net assets, or (4) during any other period when the SEC, by order, so permits; provided that applicable rules and regulations of the SEC shall govern as to whether the conditions prescribed in (2),
(3) or (4) exist.
EXPEDITED REDEMPTION PRIVILEGE. By electing the Expedited Redemption Privilege, you may arrange to have redemption proceeds sent to your bank account. The Expedited Redemption Privilege may be used to redeem shares in an
amount of $100 or more, except if an account for which an expedited redemption is requested has an NAV of less than $100, the entire account will be redeemed. Redemption proceeds in the amount of $500 or more will be
remitted by wire to your bank account at a domestic commercial bank which is a member of the Federal Reserve system. The money would generally be received by your bank within one business day of the redemption.
Redemption proceeds of less than $500 will be sent by ACH to your bank which must be a member of the Automated Clearing House (ACH) system. The money would generally be received by your bank within three business days
of the redemption. Any applicable CDSC will be deducted from the redemption proceeds. Expedited redemption requests may be made by telephone or letter, must be received by the Transfer Agent prior to 4:00 p.m. Eastern
time to receive a redemption amount based on that day's NAV and are subject to the terms and conditions as set forth in the Prospectus regarding redemption of shares. In the event that regular trading on the NYSE
closes before 4:00 p.m. Eastern time, you will receive the following day's NAV if your order to sell is received after the close of regular trading on the NYSE. For more information, see “How to Buy, Sell and
Exchange Fund Shares-Telephone Redemptions or Exchanges” in the Prospectus. The Expedited Redemption Privilege may be modified or terminated at any time without notice. To receive further information,
shareholders should contact PMFS.
INVOLUNTARY REDEMPTION. If the value of your account with PMFS is less than $500 for any reason, we may sell the rest of your shares (without charging any CDSC) and close your account. The involuntary sale
provisions do not apply to: (i) an individual retirement account (IRA) or other qualified or tax-deferred retirement plan or account, (ii) Automatic Investment Plan (AIP) accounts, employee savings plan accounts or
payroll deduction plan accounts, (iii) accounts with the same registration associated with multiple share classes within the Fund, or (iv) clients with assets more than $50,000 across the Prudential Investments family
of mutual funds. “Client” for this purpose has the same definition as for purposes of Rights of Accumulation, i.e., an investor and an eligible group of related investors.
We have the right
to reject any purchase order (including an exchange into a Fund) or suspend or modify a Fund's sales of its shares under certain circumstances. These circumstances include, but are not limited to, failure by you to
provide additional information requested, such as information required to verify the source of funds used to purchase shares, your identity or the identity of any underlying beneficial owners of your shares.
Furthermore, we are required by law to close your account if you do not provide the required identifying information; this would result in the redemption of shares at the then-current day's NAV and the proceeds would
be remitted to you via check. We will attempt to verify your identity within a reasonable time frame (e.g., 60 days) which may change from time to time.
ACCOUNT MAINTENANCE FEE. In order to offset the disproportionate effect (in basis points) of expenses associated with servicing lower balance accounts, if the value of your account with PMFS is less than $10,000,
a $15 annual account maintenance fee (“account maintenance fee”) will be deducted from your account. The account maintenance fee will be assessed during the 4th calendar quarter of each year. Any
applicable CDSC on the shares redeemed to pay the account maintenance fee will be waived. The account maintenance fee will not be charged on: (i) accounts during the first six months from inception of the account,
(ii) accounts for which you have elected to receive your account statements, transaction confirmations, prospectuses, and fund shareholder reports electronically rather than by mail, (iii) omnibus accounts or other
accounts for which the dealer is responsible for recordkeeping, (iv) institutional accounts, (v) group retirement plans (including SIMPLE IRA plans, profit-sharing plans, money purchase pension plans, Keogh plans,
defined compensation plans, defined benefit plans and 401(k) plans), (vi) AIP accounts or employee savings plan accounts, (vii) accounts with the same registration associated with multiple share classes within the
Fund, provided that the aggregate value of share classes with the same registration within the Fund is $10,000 or more, or (viii) clients with assets of $50,000 or more across the Prudential Investments family of
mutual funds. “Client” for this purpose has the same definition as for purposes of Rights of Accumulation, i.e., an investor and an eligible group of related investors or other financial
intermediary.
90 DAY REPURCHASE PRIVILEGE. If you redeem your shares and have not previously exercised the repurchase privilege, you may reinvest back into your account any portion or all of the proceeds of such redemption in
shares of the Fund at the NAV next determined after the order is received, which must be within 90 days after the date of the redemption. Any CDSC paid in connection with such redemption in Class A, Class B or Class C
shares will be credited (in shares) to your account. (If less than a full repurchase is made, the credit will be on a pro rata basis.) You must notify PMFS, either directly or through the Distributor or your broker,
at the time the repurchase privilege is exercised to adjust your account for the CDSC you previously paid. Thereafter, any redemptions will be subject to the CDSC applicable at the time of the redemption. See
“Contingent Deferred Sales Charge” below. Exercise of the
63
repurchase privilege will generally not affect
federal tax treatment of any gain realized upon redemption. However, if the redemption was made within a 30 day period of the repurchase and if the redemption resulted in a loss, some or all of the loss, depending on
the amount reinvested, may not be allowed for federal income tax purposes.
CONTINGENT DEFERRED SALES CHARGE
(CDSC)
Class A. Investors who purchase $1 million or more of Class A shares and sell these shares within 12 months of purchase are subject to a 1% CDSC. (Note: For Prudential Short-Term Corporate Bond Fund, Inc. only, investors who purchase $1 million or more of Class A shares and then sell these shares within 18 months of
purchase are subject to a 0.50% CDSC).
Class B. Redemptions of Class B shares will be subject to a CDSC declining from 5% to zero over a six-year period (or a four-year period in the case of Prudential Short-Term Corporate Bond Fund, Inc.).
Class C. Class C shares redeemed within 12 months of purchase will be subject to a 1% CDSC. The CDSC will be deducted from the redemption proceeds and reduce the amount paid to you.
Waiver of CDSC. The Class A, Class B, or Class C CDSC is waived if the shares are sold:
| ■ | After a shareholder is deceased or permanently disabled (or, in the case of a trust account, after the death or disability of the grantor). This waiver applies to individual shareholders as well as shares held in joint tenancy, provided the shares were purchased before the death or permanent disability, |
| ■ | To provide for certain distributions—made without IRS penalty—from a qualified or tax-deferred retirement plan, benefit plan, IRA or Section 403(b) custodial account, |
| ■ | To withdraw excess contributions from a qualified or tax-deferred retirement plan, IRA or Section 403(b) custodial account, |
| ■ | For redemptions by certain retirement or benefit plans (Class A shares only), |
| ■ | On certain redemptions effected through a Systematic Withdrawal Plan (Class B shares only), and |
| ■ | For redemptions by certain group retirement plans for which Prudential or brokers not affiliated with Prudential provide administrative or record keeping services. The CDSC will also be waived for certain redemptions by benefit plans sponsored by Prudential and its affiliates. For more information, call Prudential Retirement at (800) 353-2847. (Class C shares only) |
If you purchase Class Z shares (see
“Qualifying for Class Z Shares” in the Prospectus) within 5 days of redemption of your Class A shares that you had purchased directly through the Fund's transfer agent, we will credit your account with the
appropriate number of shares to reflect any CDSC you paid on the reinvested portion of your redemption proceeds.
Calculation of CDSC. The CDSC will be imposed on any redemption that reduces the current value of your Class A, Class B or Class C shares to an amount which is lower than the amount of all payments by you for
shares during the preceding 12 months in the case of Class A shares (in certain cases), 6 years in the case of Class B shares (or four years in the case of Prudential Short-Term Corporate Bond Fund, Inc. Class B shares), and 12 months in the case of Class C shares. A CDSC will be applied on the lesser of the original purchase price or the current value of the shares being redeemed. Increases in the value
of your shares or shares acquired through reinvestment of dividends or distributions are not subject to a CDSC. The amount of any CDSC will be paid to and retained by the Distributor. If you purchased or hold your
shares through a broker, third party administrator or other authorized entity that maintains subaccount recordkeeping, any applicable CDSC that you will pay will be calculated and reported to PMFS by such broker,
administrator or other authorized entity.
The amount of the CDSC, if any,
will vary depending on the number of years from the time of payment for the purchase of shares until the time of redemption of such shares. The CDSC will be calculated from the date of the initial purchase, excluding
the time shares were held in Class B or Class C shares of a money market fund. See “Shareholder Services—Exchange Privileges” below.
In determining whether a CDSC is
applicable to a redemption, the calculation will be made in a manner that results in the lowest possible rate. It will be assumed that the redemption is made first of amounts representing shares acquired pursuant to
the reinvestment of dividends and distributions; then of amounts representing the increase in NAV above the total amount of payments for the purchase of Class A shares made during the preceding 12 months (in certain
cases), 6 years for Class B shares (four years in the case of Prudential Short-Term Corporate Bond Fund, Inc.) and 12 months for Class C shares; then of amounts representing the cost of shares held beyond the applicable
CDSC period; and finally, of amounts representing the cost of shares held for the longest period of time within the applicable CDSC period.
For example, assume you purchased
100 Class B shares at $10 per share for a cost of $1,000. Subsequently, you acquired 5 additional Class B shares through dividend reinvestment. During the second year after the purchase you decided to redeem $500 of
your investment. Assuming at the time of the redemption the NAV had appreciated to $12 per share, the value of your Class B shares would
64
be $1,260 (105 shares at $12 per share). The CDSC
would not be applied to the value of the reinvested dividend shares and the amount which represent appreciation ($260). Therefore, $240 of the $500 redemption proceeds ($500 minus $260) would be charged at a rate of
4% (the applicable rate in the second year after purchase) for a total CDSC of $9.60.
For federal income tax purposes,
the amount of the CDSC will reduce the gain or increase the loss, as the case may be, on the amount recognized on the redemption of shares.
As noted above, the CDSC will be
waived in the case of a redemption following the death or permanent disability of a shareholder or, in the case of a trust account, following the death or permanent disability of the grantor. The waiver is available
for total or partial redemptions of shares owned by a person, either individually or in joint tenancy at the time of death or initial determination of permanent disability, provided that the shares were purchased
prior to death or permanent disability.
The CDSC will be waived in the case
of a total or partial redemption in connection with certain distributions under the Code from a tax-deferred retirement plan, an IRA or Section 403(b) custodial account. For distributions from an IRA or 403(b)
custodial account, the shareholder must submit a copy of the distribution form from the custodial firm indicating (i) the date of birth of the shareholder and (ii) that the shareholder is over age 70 1⁄2. The distribution form must be signed by the shareholder.
SYSTEMATIC WITHDRAWAL PLAN. The CDSC will be waived (or reduced) on certain redemptions of Class B shares effected through a Systematic Withdrawal Plan. On an annual basis, up to 12% of the total dollar amount
subject to the CDSC may be redeemed without charge. PMFS will calculate the total amount available for this waiver annually on the anniversary date of your purchase. The CDSC will be waived (or reduced) on redemptions
until this threshold of 12% is reached. The Systematic Withdrawal Plan is not available to participants in certain retirement plans. Please contact PMFS at (800) 225-1852 for more details.
In addition, the CDSC will be
waived on redemptions of shares held by Board Members of the Funds.
You must notify PMFS either
directly or through your broker, at the time of redemption that you are entitled to a waiver of the CDSC and provide PMFS or your broker with such supporting documentation as it may deem appropriate. The waiver will
be granted subject to confirmation of your entitlement.
PMFS reserves the right to request
such additional documents as it may deem appropriate.
AUTOMATIC CONVERSION OF CLASS B
SHARES. Class B shares will automatically convert to Class A shares on a quarterly basis approximately seven years after purchase.
Note: Class B shares of Prudential Short-Term Corporate Bond Fund, Inc. will automatically convert to Class A shares on a quarterly basis approximately five years after purchase.
The number of Class B shares
eligible to convert to Class A shares will be the total number of shares that have completed their aging schedule (including any time spent at 0% liability), plus all shares acquired through the reinvestment of
dividends for Class B shares.
Since annual distribution-related
fees are lower for Class A shares than Class B shares, the per share NAV of the Class A shares may be higher than that of the Class B shares at the time of conversion. Thus, although the aggregate dollar value will be
the same, you may receive fewer Class A shares than Class B shares converted.
For purposes of calculating the
applicable holding period for conversions, for Class B shares previously exchanged for shares of a money market fund, the time period during which such shares were held in a money market fund will be excluded for the
Class B shares. For example, Class B shares held in a money market fund for one year would not convert to Class A shares until approximately eight years. Class B shares acquired through exchange will convert to Class
A shares after expiration of the conversion period applicable to the original purchaser of such shares.
The conversion feature may be
subject to the continuing availability of opinions of counsel or rulings of the IRS (1) that the dividends and other distributions paid on Class A, Class B, Class C, Class I, Class Q, Class R, Class Y and Class Z
shares will not constitute “preferential dividends” under the Code and (2) that the conversion of shares does not constitute a taxable event for federal income tax purposes. The conversion of Class B
shares into Class A shares may be suspended if such opinions or rulings are no longer available. If conversions are suspended, Class B shares of the Fund will continue to be subject, possibly indefinitely, to their
higher annual distribution and service fee. Shareholders should consult their tax advisers regarding the tax consequences of the conversion or exchange of shares.
65
Class A, Class Z and Class R shares
may be converted to Class Q shares under certain limited circumstances. Please contact PMFS at (800) 225-1852 for more details.
NET ASSET VALUE
The price an
investor pays for a Fund share is based on the share value. The share value—known as the net asset value per share or NAV—is determined by subtracting Fund liabilities from the value of Fund assets and
dividing the remainder by the number of outstanding shares. NAV is calculated separately for each class. The Fund will compute its NAV once each business day at the close of regular trading on the NYSE, usually 4:00
p.m. Eastern time. For purposes of computing NAV, the Fund will value futures contracts generally 15 minutes after the close of regular trading on the NYSE. The Fund may not compute its NAV on days on which no orders
to purchase, sell or exchange shares of the Fund have been received or on days on which changes in the value of the Fund's portfolio securities do not materially affect NAV. Please see the NYSE website (www.nyse.com)
for a specific list of the holidays on which the NYSE is closed.
In accordance with procedures
adopted by the Board, the value of investments listed on a securities exchange and NASDAQ System securities (other than options on stock and stock indices) are valued at the last sale price on the day of valuation or,
if there was no sale on such day, the mean between the last bid and asked prices on such day, or at the bid price on such day in the absence of an asked price, as provided by a pricing service or principal market
marker. Securities included on the NASDAQ Market are valued at the NASDAQ Official Closing Price (NOCP) on the day of valuation, or if there was no NOCP, at the last sale price. NASDAQ Market Securities for which
there was no NOCP or last sale price are valued at the mean between the last bid and asked prices on the day of valuation, or the last bid price in the absence of an asked price. Corporate bonds (other than
convertible debt securities) and US Government securities that are actively traded in the OTC market, including listed securities for which the primary market is believed by the Manager in consultation with the
subadviser to be over-the-counter, are valued on the basis of valuations provided by an independent pricing agent which uses information with respect to transactions in bonds, quotations from bond dealers, agency
ratings, market transactions in comparable securities and various relationships between securities in determining value. Convertible debt securities that are actively traded in the over-the-counter market, including
listed securities for which the primary market is believed by the Manager in consultation with the subadviser to be OTC, are valued on the day of valuation at an evaluated bid price provided by an independent pricing
agent, or, in the absence of valuation provided by an independent pricing agent, at the bid price provided by a principal market maker or primary market dealer.
OTC options on stock and stock
indices traded on an exchange are valued at the mean between the most recently quoted bid and asked prices on the respective exchange and futures contracts and options thereon are valued at their last sale prices as
of the close of trading on the applicable commodities exchange or if there was no sale on the applicable commodities exchange on such day, at the mean between the most recently quoted bid and asked prices on such
exchange or at the last bid price in the absence of an asked price. Quotations of foreign securities in a foreign currency are converted to US dollar equivalents at the current rate obtained from a recognized bank,
dealer or independent service, and forward currency exchange contracts are valued at the current cost of covering or offsetting such contacts. Should an extraordinary event, which is likely to affect the value of the
security, occur after the close of an exchange on which a portfolio security is traded, such security will be valued at fair value considering factors determined in good faith by the subadviser or Manager under
procedures established by and under the general supervision of the Fund's Board.
Under the 1940 Act, the Board is
responsible for determining in good faith the fair value of securities of the Fund. Portfolio securities for which reliable market quotations are not readily available or for which the pricing agent or principal
market maker does not provide a valuation or methodology or provides a valuation or methodology that, in the judgment of the Manager or subadviser (or Valuation Committee or Board) does not represent fair value (Fair
Value Securities), are valued by the Valuation Committee or Board in consultation with the subadviser or Manager, as applicable, including, as applicable, their portfolio managers, traders, research and credit
analysts, and legal and compliance personnel, on the basis of the following factors: the nature of any restrictions on disposition of the securities; assessment of the general liquidity/illiquidity of the securities;
the issuer's financial condition and the markets in which it does business; the cost of the investment; the size of the holding and the capitalization of issuer; the prices of any recent transactions or bids/offers
for such securities or any comparable securities; any available analyst, media or other reports or information deemed reliable by the Manager or subadviser regarding the issuer or the markets or industry in which it
operates; other analytical data; consistency with valuation of similar securities held by other Prudential Investments mutual funds; and such other factors as may be determined by the subadviser, Manager, Board or
Valuation Committee to materially affect the value of the security. Fair Value Securities may include, but are not limited to, the following: certain private placements and restricted securities that do not have an
active trading market; securities whose trading has been suspended or for which market quotes are no longer available; debt securities that have recently gone into default and for which there is no current market;
securities whose prices are stale; securities affected by significant events; and securities that the subadviser or Manager believes were priced incorrectly.
66
A “significant event”
(which includes, but is not limited to, an extraordinary political or market event) is an event that the subadviser or Manager believes with a reasonably high degree of certainty has caused the closing market prices
of portfolio securities to no longer reflect their value at the time of the NAV calculation. On a day that the Manager determines that one or more portfolio securities constitute Fair Value Securities, the
Manager’s Fair Valuation Committee may determine the fair value of these securities if the fair valuation of each security results in a change of less than $0.01 to the Fund's NAV and/or the fair valuation of
the securities in the aggregate results in a change of less than one half of one percent of the Fund's daily net assets and the Fair Valuation Committee presents these valuations to the Board for its ratification. In
the event that the fair valuation of a security results in a NAV change of $0.01 or more per share and/or in the aggregate results in a change of one half of one percent or more of the daily NAV, the Board shall
promptly be notified, in detail, of the fair valuation, and the fair valuation will be reported on and presented for ratification at the next regularly scheduled Board meeting. Also, the Board receives, on an interim
basis, minutes of the meetings of the Valuation Committee that occur between regularly scheduled Board meetings.
In addition, the Fund use a service
provided by a pricing vendor to fair value Foreign Fair Value Securities, which are securities that are primarily traded in non-US markets and subject to a valuation adjustment upon the reaching of a valuation
“trigger” determined by the Board. The fair value prices of Foreign Fair Value Securities reflect an adjustment to closing market prices that is intended to reflect the causal link between movements in the
US market and the non-US market on which the securities trade.
The use of fair value pricing
procedures involves subjective judgments and it is possible that the fair value determined for a security may be materially different from the value that could be realized upon the sale of that security. Accordingly,
there can be no assurance that the Fund could obtain the fair value assigned to a security if the security were sold at approximately the same time at which the NAV per share is determined.
Securities for which reliable
market quotations are not available or for which the pricing agent or principal market maker does not provide a valuation or provides a valuation that, in the judgment of the Manager, does not present fair value,
shall be valued in accordance with the following procedures: At the time of purchase, the duration of the security is to be determined. A Treasury issue (or similar security or index for which market quotes are
readily available) (the “Proxy”) of similar duration will then be selected to serve as a Proxy for the price movements of the security. The price of the security will fluctuate exactly as does the Proxy
while maintaining the initial price spread constant. The duration of the security will be reviewed once a month by one or more of the portfolio managers, and at any other time that a portfolio manager believes that
there may have been a material change in the duration of the security. Should the duration change, another security or index of similar duration will be chosen to serve as Proxy, at which point the price spread will
be determined. In addition, the validity of the pricing methodology will be monitored by (1) comparing the actual sales proceeds of the security to its price reported by the Fund at the time of the sale and (2)
periodically obtaining actual market quotes for the security.
Generally, we will value the Fund's
futures contracts at the close of trading for those contracts (normally 15 minutes after the close of regular trading on the NYSE). If, in the judgment of the subadviser or Manager, the closing price of a contract is
materially different from the contract price at the NYSE close, a fair value price for the contract will be determined.
If dividends are declared daily,
the NAV of each class of shares will generally be the same. It is expected, however, that the dividends, if any, will differ by approximately the amount of the distribution and/or service fee expense accrual
differential among the classes.
SHAREHOLDER SERVICES
Upon the initial purchase of Fund
shares, a Shareholder Investment Account is established for each investor under which a record of the shares is maintained by PMFS. Share certificates are no longer issued for shares of the Fund. The Fund furnish to
shareholders the following privileges and plans:
AUTOMATIC REINVESTMENT OF DIVIDENDS
AND/OR DISTRIBUTIONS. For the convenience of investors, all dividends and distributions are automatically reinvested in full and fractional shares of the Fund at NAV per share. An investor may direct PMFS in
writing not less than five full business days prior to the record date to have subsequent dividends and/or distributions sent in cash rather than reinvested. In the case of recently purchased shares for which
registration instructions have not been received by the record date, cash payment will be made directly to the broker. Any shareholder who receives dividends or distributions in cash may subsequently reinvest any such
dividend or distribution at NAV by returning the check or the proceeds to PMFS within 30 days after the payment date. Such reinvestment will be made at the NAV per share next determined after receipt of the check or
the proceeds by PMFS. Shares purchased with reinvested dividends and/or distributions will not be subject to any CDSC upon redemption.
EXCHANGE PRIVILEGES. The Fund furnish to shareholders the privilege of exchanging their shares of the Fund for shares of certain other Prudential Investments mutual funds, including one or more specified money
market funds, subject in each case to the minimum investment requirements of such funds. Shares of such other Prudential Investments mutual funds may also be exchanged
67
for shares of the Fund. All exchanges are made on
the basis of the relative NAV next determined after receipt of an order in proper form. An exchange will be treated as a redemption and purchase for federal income tax purposes. Shares may be exchanged for shares of
another fund only if shares of such fund may legally be sold under applicable state laws. For retirement and group plans having a limited menu of Prudential Investments mutual funds, the exchange privilege is
available for those funds eligible for investment in the particular program.
It is contemplated that the
exchange privilege may be applicable to new Prudential Investments mutual funds, the shares of which may be distributed by the Distributor.
In order to
exchange shares by telephone, you must authorize telephone exchanges on your initial application form or by written notice to PMFS and hold shares in non-certificated form. Thereafter, you may call the Fund at (800)
225-1852 to execute a telephone exchange of shares, on weekdays, except holidays, between the hours of 8:00 a.m. and 6:00 p.m. Eastern time. For your protection and to prevent fraudulent exchanges, your telephone call
will be recorded and you will be asked to authenticate your account. A written confirmation of the exchange transaction will be sent to you. Neither the Fund nor its agents will be liable for any loss, liability or
cost which results from acting upon instructions reasonably believed to be genuine under the foregoing procedures. All exchanges will be made on the basis of the relative NAV of the two funds next determined after the
request is received in good order.
If you hold shares through a
brokerage firm, you must exchange your shares by contacting your financial adviser.
If you hold share certificates, the
certificates must be returned in order for the shares to be exchanged. See “Purchase, Redemption and Pricing of Fund Shares—Sale of Shares” above.
You may also exchange shares by
mail by writing to PMFS, P.O. Box 9658, Providence, RI 02940.
In periods of severe market or
economic conditions the telephone exchange of shares may be difficult to implement and you should make exchanges by mail by writing to PMFS at the address noted above.
Class A shares: Shareholders of the Fund may exchange their Class A shares for Class A shares of certain other Prudential Investments mutual funds and shares of the money market funds specified below. No
fee or sales load will be imposed upon the exchange. Shareholders of money market funds who acquired such shares upon exchange of Class A shares may use the exchange privilege only to acquire Class A shares of the
Prudential Investments mutual funds participating in the exchange privilege.
The following money market fund
participates in the Class A exchange privilege: Prudential MoneyMart Assets, Inc. (Class A shares).
Participants in
certain programs sponsored by broker-dealers, investment advisers and financial planners who have agreements with Prudential, or whose programs are available through financial intermediaries that have agreements with
Prudential relating to mutual fund “wrap” or asset allocation programs or mutual fund “supermarket” programs, for which the Fund is an available option, may have their Class A shares, if any,
exchanged for Class Z shares of the Fund, if available as an investment option, when they elect to have those assets become a part of the program. Upon leaving the program (whether voluntarily or not), such Class Z
shares (and, to the extent provided for in the program, Class Z shares acquired through participation in the program) may be exchanged for Class A shares of the Fund at NAV if Class Z shares are not available to the
shareholder as an investment option outside the program. Contact your program sponsor or financial intermediary with any questions.
Class B and Class C shares: Shareholders of the Fund may exchange their Class B and Class C shares of the Fund for Class B and Class C shares, respectively, of other Prudential Investments mutual funds. No CDSC will
be payable upon such exchange, but a CDSC may be payable upon the redemption of the Class B and Class C shares acquired as a result of an exchange. The applicable sales charge will be that imposed by the fund in which
shares were initially purchased and the purchase date will be deemed to be the date of the initial purchase, rather than the date of the exchange, excluding any time Class B or Class C shares were held in a money
market fund.
Class B and Class C shares may also
be exchanged for shares of Prudential MoneyMart Assets, Inc. without imposition of any CDSC at the time of exchange. Upon subsequent redemption from such money market fund or after re-exchange into a Fund, such shares
will be subject to the CDSC calculated without regard to the time such shares were held in the money market fund. For purposes of calculating the seven year holding period applicable to the Class B conversion feature,
the time period during which Class B shares were held in a money market fund will be excluded.
68
At any time after acquiring shares
of other funds participating in the Class B or Class C exchange privilege, a shareholder may again exchange those shares (and any reinvested dividends and distributions) for Class B or Class C shares of a Fund without
subjecting such shares to any CDSC. Shares of any fund participating in the Class B or Class C exchange privilege that were acquired through reinvestment of dividends or distributions may be exchanged for Class B or
Class C shares of other funds without being subject to any CDSC.
Class Q shares: Class Q shares may be exchanged for Class Q shares of other Prudential Investments mutual funds.
Class R shares: Class R shares may be exchanged for Class R shares of other Prudential Investments mutual funds.
Class Z shares: Class Z shares may be exchanged for Class Z shares of other Prudential Investments mutual funds.
Shareholders who qualify to
purchase Class Z shares may have their Class B and Class C shares which are not subject to a CDSC and their Class A shares exchanged for Class Z shares upon notification. Eligibility for this exchange privilege will
be calculated on the business day prior to the date of the exchange. Amounts representing Class B or Class C shares which are not subject to a CDSC include the following: (1) amounts representing Class B or Class C
shares acquired pursuant to the automatic reinvestment of dividends and distributions, (2) amounts representing the increase in the NAV above the total amount of payments for the purchase of Class B or Class C shares
and (3) amounts representing Class B or Class C shares held beyond the applicable CDSC period. Class B and Class C shareholders must notify PMFS either directly or through Wells Fargo Advisors, Pruco Securities, LLC
or another broker that they are eligible for this special exchange privilege.
Participants in
any fee-based program for which the Fund is an available option may arrange with the Transfer Agent or their recordkeeper to have their Class A shares, if any, exchanged for Class Z shares when they elect to have
those assets become a part of the fee-based program. Upon leaving the program (whether voluntarily or not), the participant may arrange with the Transfer Agent or their recordkeeper to have such Class Z shares
acquired through participation in the program exchanged for Class A shares at NAV. Similarly, participants in Wells Fargo Advisors' 401(k) Plan for which the Fund's Class Z shares are an available option and who wish
to transfer their Class Z shares out of the Wells Fargo Advisors 401(k) Plan following separation from service (i.e., voluntary or involuntary termination of employment or retirement) may arrange with the Transfer
Agent or their recordkeeper to have their Class Z shares exchanged for Class A shares at NAV.
Additional details about the
exchange privilege and prospectuses for each of the Prudential Investments mutual funds are available from PMFS, the Distributor or your broker. The special exchange privilege may be modified, terminated or suspended
on sixty days' notice, and the Fund, or the Distributor, has the right to reject any exchange application relating to the Fund's shares.
AUTOMATIC INVESTMENT PLAN
(AIP). Under AIP, an investor may arrange to have a fixed amount automatically invested in shares of the Fund by authorizing his or her bank account or brokerage account to be debited to invest
specified dollar amounts in shares of the Fund. The investor's bank must be a member of the Automated Clearing House System.
Further information about this
program and an application form can be obtained from PMFS, the Distributor or your broker.
SYSTEMATIC WITHDRAWAL PLAN. A Systematic Withdrawal Plan is available to shareholders through the PMFS or your broker. The Systematic Withdrawal Plan provides for monthly, quarterly, semi-annual or annual redemptions
in any amount, except as provided below, up to the value of the shares in the shareholder's account. Systematic withdrawals of Class A (in certain instances), Class B and Class C shares may be subject to a CDSC. The
Systematic Withdrawal Plan is not available to participants in certain retirement plans. Please contact PMFS at (800) 225-1852 for more details.
PMFS, the Distributor or your
broker acts as an agent for the shareholder in redeeming sufficient full and fractional shares to provide the amount of the systematic withdrawal payment. The Systematic Withdrawal Plan may be terminated at any
time.
Systematic withdrawals should not
be considered as dividends, yield or income. If systematic withdrawals continuously exceed reinvested dividends and distributions, the shareholder's original investment will be correspondingly reduced and ultimately
exhausted.
Furthermore, each withdrawal
constitutes a redemption of shares, and any gain or loss realized must be recognized for federal income tax purposes. In addition, withdrawals made concurrently with purchases of additional shares are inadvisable
because of the sales charges applicable to (i) the purchase of Class A shares and (ii) the redemption of Class A (in certain instances), Class B and Class C shares. Each shareholder should consult his or her own tax
adviser with regard to the tax consequences of the Systematic Withdrawal Plan, particularly if used in connection with a retirement plan.
69
MUTUAL FUND PROGRAMS. From time to time, the Fund may be included in a mutual fund program with other Prudential Investments mutual funds. Under such a program, a group of portfolios will be selected and
thereafter marketed collectively. Typically, these programs are marketed with an investment theme, such as pursuit of greater diversification, protection from interest rate movements or access to different management
styles. In the event such a program is instituted, there may be a minimum investment requirement for the program as a whole. The Fund may waive or reduce the minimum initial investment requirements in connection with
such a program.
The mutual funds in the program may
be purchased individually or as a part of a program. Since the allocation of portfolios included in the program may not be appropriate for all investors, investors should consult their financial adviser concerning the
appropriate blends of portfolios for them. If investors elect to purchase the individual mutual funds that constitute the program in an investment ratio different from that offered by the program, the standard minimum
investment requirements for the individual mutual funds will apply.
TAX-DEFERRED RETIREMENT
PROGRAMS. Various tax-deferred retirement plans, including a 401(k) plan, self-directed individual retirement accounts and “tax-deferred accounts” under Section 403(b)(7) of the Code are
available through the Distributor. These plans are for use by both self-employed individuals and corporate employers. These plans permit either self-direction of accounts by participants or a pooled account
arrangement. Information regarding the establishment of these plans, their administration, custodial fees and other details is available from the Distributor or PMFS.
Investors who are considering the
adoption of such a plan should consult with their own legal counsel and/or tax adviser with respect to the establishment and maintenance of any such plan.
TAXES, DIVIDENDS AND
DISTRIBUTIONS
The following is a summary of
certain tax considerations generally affecting each Fund and its shareholders. This section is based on the Code, published rulings and court decisions, all as currently in effect. These laws are subject to change,
possibly on a retroactive basis. Please consult your own tax adviser concerning the consequences of investing in a Fund in your particular circumstances under the Code and the laws of any other taxing jurisdiction.
QUALIFICATION AS A REGULATED
INVESTMENT COMPANY. Each Fund has elected to be taxed as a regulated investment company under Subchapter M of the Code and intends to meet all other requirements that are necessary for it to be relieved of
federal taxes on income and gains it distributes to shareholders. As a regulated investment company, a Fund is not subject to federal income tax on the portion of its net investment income (i.e., investment company
taxable income, as that term is defined in the Code, without regard to the deduction for dividends paid) and net capital gain (i.e., the excess of net long-term capital gain over net short-term capital loss) that it
distributes to shareholders, provided that it distributes at least 90% of its net tax-exempt income and investment company taxable income for the year (the “Distribution Requirement”), and satisfies
certain other requirements of the Code that are described below.
Net capital gains of a Fund that
are available for distribution to shareholders will be computed by taking into account any applicable capital loss carryforward. If a Fund has a capital loss carryforward, the amount and duration of any such capital
loss carryforward will be set forth at the end of this section.
In addition to satisfying the
Distribution Requirement, each Fund must derive at least 90% of its gross income from dividends, interest, certain payments with respect to loans of stock and securities, gains from the sale or disposition of stock,
securities or foreign currencies and other income (including but not limited to gains from options, futures or forward contracts) derived with respect to its business of investing in such stock, securities or
currencies and net income derived from an interest in a “qualified publicly traded partnership” (as such term is defined in the Code).
Each Fund must also satisfy an
asset diversification test on a quarterly basis. Failure to do so may result in a Fund being subject to penalty taxes, being required to sell certain of its positions, and may cause the Fund to fail to qualify as a
regulated investment company. Under this asset diversification test, at the close of each quarter of a Fund’s taxable year, (1) 50% or more of the value of the Fund’s assets must be represented by cash,
United States government securities, securities of other regulated investment companies, and other securities, with such other securities limited, in respect of any one issuer, to an amount not greater than 5% of the
value of the Fund’s assets and 10% of the outstanding voting securities of such issuer and (2) not more than 25% of the value of the Fund’s assets may be invested in securities of (x) any one issuer (other
than United States government securities or securities of other regulated investment companies), or two or more issuers (other than securities of other regulated investment companies) of which the Fund owns 20% or
more of the voting stock and which are engaged in the same, similar or related trades or businesses or (y) one or more “qualified publicly traded partnerships” (as such term is defined in the Code) and
commonly referred to as “master limited partnerships.”
70
A Fund may be able to cure a
failure to derive 90% of its income from the sources specified above or a failure to diversify its holdings in the manner described above by paying a tax, by disposing of certain assets, or by paying a tax and
disposing of assets. If, in any taxable year, a Fund fails one of these tests and does not timely cure the failure, the Fund will be taxed in the same manner as an ordinary corporation and distributions to its
shareholders will not be deductible by the Fund in computing its taxable income.
Although in general the passive
loss rules of the Code do not apply to regulated investment companies, such rules do apply to a regulated investment company with respect to items attributable to an interest in a qualified publicly traded
partnership. A Fund’s investments in partnerships, including in qualified publicly traded partnerships, may result in the Fund being subject to state, local or foreign income, franchise or withholding tax
liabilities.
If for any year a Fund does not
qualify as a regulated investment company, or fails to meet the Distribution Requirement, all of its taxable income (including its net capital gain) will be subject to tax at regular corporate rates without any
deduction for distributions to shareholders. In addition, in the event of a failure to qualify, a Fund’s distributions, to the extent derived from the Fund’s current or accumulated earnings and profits,
including any distributions of net long-term capital gains, will be taxable to shareholders as dividend income. However, such dividends will be eligible (i) to be treated as qualified dividend income in the case of
shareholders taxed as individuals and (ii) for the dividends received deduction in the case of corporate shareholders. Moreover, if a Fund fails to qualify as a regulated investment company in any year, it must pay
out its earnings and profits accumulated in that year in order to qualify again as a regulated investment company. If a Fund fails to qualify as a regulated investment company for a period greater than two taxable
years, the Fund may be subject to taxation on any net built-in-gains (i.e., the excess of the aggregate gain, including items of income, over aggregate loss that would have been realized if the Fund had been
liquidated) recognized for a period of ten years, or, under certain circumstances, may have to recognize and pay tax on such net built-in-gain, in order to qualify as a regulated investment company in a subsequent
year.
EXCISE TAX ON REGULATED INVESTMENT
COMPANIES. A 4% non-deductible excise tax is imposed on a regulated investment company to the extent that it distributes income in such a way that it is taxable to shareholders in a calendar year
other than the calendar year in which a Fund earned the income. Specifically, the excise tax will be imposed if a Fund fails to distribute in each calendar year an amount equal to 98% of ordinary taxable income,
including qualified dividend income, for the calendar year and 98.2% of capital gain net income for the one-year period ending on October 31 of such calendar year (or, at the election of a regulated investment company
having a taxable year ending November 30 or December 31, for its taxable year). The balance of such income must be distributed during the next calendar year. For the foregoing purposes, a regulated investment company
is treated as having distributed otherwise retained amounts if it is subject to income tax on those amounts for any taxable year ending in such calendar year.
Each Fund intends to make
sufficient distributions or deemed distributions of its qualified dividend income, ordinary income and capital gain net income prior to the end of each calendar year to avoid liability for this excise tax. However,
investors should note that a Fund may in certain circumstances be required to borrow money or liquidate portfolio investments to make sufficient distributions to avoid excise tax liability.
FUND INVESTMENTS. Each Fund may make investments or engage in transactions that affect the character, amount and timing of gains or losses realized by a Fund. A Fund may make investments that produce income
that is not matched by a corresponding cash receipt by the Fund. Any such income would be treated as income earned by the Fund and therefore would be subject to the Distribution Requirement. Such investments may
require a Fund to borrow money or dispose of other securities in order to comply with those requirements. Each Fund may also make investments that prevent or defer the recognition of losses or the deduction of
expenses. These investments may likewise require a Fund to borrow money or dispose of other securities in order to comply with the Distribution Requirement. Additionally, a Fund may make investments that result in the
recognition of ordinary income rather than capital gain, or that prevent the Fund from accruing a long-term holding period. These investments may prevent the Fund from making capital gain distributions as described
below. Each Fund intends to monitor its transactions, will make the appropriate tax elections and will make the appropriate entries in its books and records when it makes any such investments in order to mitigate the
effect of these rules. The foregoing concepts are explained in greater detail in the following paragraphs.
Gains or losses on sales of stock
or securities by a Fund generally will be treated as long-term capital gains or losses if the stock or securities have been held by it for more than one year, except in certain cases where the Fund acquires a put or
writes a call or otherwise holds an offsetting position, with respect to the stock or securities. Other gains or losses on the sale of stock or securities will be short-term capital gains or losses.
In certain situations, a Fund may,
for a taxable year, defer all or a portion of its net capital loss realized after October and its late-year ordinary loss (defined as the excess of post-October foreign currency and passive foreign investment company
(“PFIC”) losses and other post-December ordinary losses over post-October foreign currency and PFIC gains and other post-December ordinary income)
71
until the next taxable year in computing its
investment company taxable income and net capital gain, which will defer the recognition of such realized losses. Such deferrals and other rules regarding gains and losses realized after October (or December) may
affect the tax character of shareholder distributions.
If an option written by a Fund on
securities lapses or is terminated through a closing transaction, such as a repurchase by the Fund of the option from its holder, the Fund will generally realize short-term capital gain or loss. If securities are sold
by the Fund pursuant to the exercise of a call option written by it, the Fund will include the premium received in the sale proceeds of the securities delivered in determining the amount of gain or loss on the sale.
Gain or loss on the sale, lapse or other termination of options acquired by a Fund on stock or securities and on narrowly-based stock indexes will be capital gain or loss and will be long-term or short-term depending
on the holding period of the option.
Certain Fund transactions may be
subject to wash sale, short sale, constructive sale, conversion transaction, constructive ownership transaction and straddle provisions of the Code that may, among other things, require a Fund to defer recognition of
losses or convert long-term capital gain into ordinary income or short-term capital gain taxable as ordinary income.
As a result of entering into swap
contracts, a Fund may make or receive periodic net payments. A Fund may also make or receive a payment when a swap is terminated prior to maturity through an assignment of the swap or other closing transaction.
Periodic net payments will generally constitute taxable ordinary income or deductions, while termination of a swap will generally result in capital gain or loss (which will be a long-term capital gain or loss if the
Fund has been a party to the swap for more than one year). With respect to certain types of swaps, a Fund may be required to currently recognize income or loss with respect to future payments on such swaps or may
elect under certain circumstances to mark such swaps to market annually for tax purposes as ordinary income or loss. Periodic net payments that would otherwise constitute ordinary deductions but are allocable under
the Code to exempt-interest dividends will not be allowed as a deduction but instead will reduce net tax-exempt income.
In general, gain or loss on a short
sale is recognized when a Fund closes the sale by delivering the borrowed property to the lender, not when the borrowed property is sold. Gain or loss from a short sale is generally capital gain or loss to the extent
that the property used to close the short sale constitutes a capital asset in a Fund’s hands. Except with respect to certain situations where the property used by a Fund to close a short sale has a long-term
holding period on the date of the short sale, special rules would generally treat the gains on short sales as short-term capital gains. These rules may also terminate the running of the holding period of
“substantially identical property” held by a Fund. Moreover, a loss on a short sale will be treated as a long-term capital loss if, on the date of the short sale, “substantially identical
property” has been held by a Fund for more than one year. In general, a Fund will not be permitted to deduct payments made to reimburse the lender of securities for dividends paid on borrowed stock if the short
sale is closed on or before the 45th day after the short sale is entered into.
Debt securities acquired by a Fund
may be subject to original issue discount and market discount rules which, respectively, may cause the Fund to accrue income in advance of the receipt of cash with respect to interest or cause gains to be treated as
ordinary income subject to the Distribution Requirement referred to above. Market discount generally is the excess, if any, of the principal amount of the security (or, in the case of a security issued at an original
issue discount, the adjusted issue price of the security) over the price paid by the Fund for the security. Original issue discount that accrues in a taxable year is treated as income earned by a Fund and therefore is
subject to the Distribution Requirement. Because the original issue discount income earned by a Fund in a taxable year may not be represented by cash income, the Fund may have to borrow money or dispose of other
securities and use the proceeds to make distributions to satisfy the Distribution Requirement.
Certain futures contracts and
certain listed options (referred to as Section 1256 contracts) held by the Funds will be required to be “marked to market” for federal income tax purposes at the end of a Fund’s taxable year, that
is, treated as having been sold at the fair market value on the last business day of the Fund’s taxable year. Except with respect to certain foreign currency forward contracts, sixty percent of any gain or loss
recognized on these deemed sales and on actual dispositions will be treated as long-term capital gain or loss, and forty percent will be treated as short-term capital gain or loss. Any net mark-to-market gains may be
subject to the Distribution Requirement referred to above, even though a Fund may receive no corresponding cash amounts, possibly requiring the disposition of portfolio securities or borrowing to obtain the necessary
cash.
Gains or losses attributable to
fluctuations in exchange rates that occur between the time a Fund accrues interest or other receivables or accrues expenses or other liabilities denominated in a foreign currency and the time the Fund actually
collects such receivables or pays such liabilities are treated as ordinary income or loss. Similarly, gains or losses on foreign currency forward contracts or dispositions of debt securities denominated in a foreign
currency that are attributable to fluctuations in the value of the foreign currency between the date of acquisition of the security or contract and the date of disposition thereof generally also are treated as
ordinary income or loss. These gains or losses, referred to under the Code as “Section 988” gains or losses, increase or decrease the amount of a Fund’s investment company taxable income available to
be distributed to its shareholders as ordinary income, rather than
72
increasing or decreasing the amount of the
Fund’s net capital gain. If Section 988 losses exceed other investment company taxable income during a taxable year, a Fund would not be able to make any ordinary dividend distributions from current earnings and
profits, and distributions made before the losses were realized could be recharacterized as a return of capital to shareholders, rather than as an ordinary dividend, thereby reducing each shareholder’s basis in
his or her Fund shares.
If the Fund holds (directly or
indirectly) one or more “tax credit bonds” (defined below) on one or more specified dates during the Fund’s taxable year, and the Fund satisfies the minimum distribution requirement, the Fund may
elect for US federal income tax purposes to pass through to shareholders tax credits otherwise allowable to the Fund for that year with respect to such bonds. A tax credit bond is defined in the Code as a
“qualified tax credit bond” (which includes a qualified forestry conservation bond, a new clean renewable energy bond, a qualified energy conservation bond, a qualified zone academy bond, or a qualified
school construction bond, each of which must meet certain requirements specified in the Code), a “build America bond” or certain other specified bonds. If the Fund were to make an election, a shareholder
of the Fund would be required to include in gross income an amount equal to such shareholder’s proportionate share of the interest income attributable to such credits and would be entitled to claim as a tax
credit an amount equal to the shareholder’s proportionate share of such credits. Certain limitations may apply on the extent to which the credit may be claimed.
A Fund may make investments in
equity securities of foreign issuers. If a Fund purchases shares in PFICs, the Fund may be subject to federal income tax on a portion of any “excess distribution” from such foreign corporation, including
any gain from the disposition of such shares, even if such income is distributed by the Fund to its shareholders. In addition, certain interest charges may be imposed on the Fund as a result of such distributions. If
a Fund were to invest in an eligible PFIC and elected to treat the PFIC as a qualified electing fund (a “QEF”), in lieu of the foregoing requirements, the Fund would be required to include each year in its
income and distribute to shareholders in accordance with the Distribution Requirement, a pro rata portion of the QEF’s ordinary earnings and net capital gain, whether or not distributed by the QEF to the Fund. A
Fund may not be able to make this election with respect to many PFICs because of certain requirements that the PFICs would have to satisfy.
Alternatively, a Fund generally
will be permitted to “mark to market” any shares it holds in a PFIC. If a Fund made such an election, with such election being made separately for each PFIC owned by the Fund, the Fund would be required to
include in income each year and distribute to shareholders in accordance with the Distribution Requirement, an amount equal to the excess, if any, of the fair market value of the PFIC stock as of the close of the
taxable year over the adjusted basis of such stock at that time. A Fund would be allowed a deduction for the excess, if any, of the adjusted basis of the PFIC stock over its fair market value as of the close of the
taxable year, but only to the extent of any net mark-to-market gains with respect to the stock included by the Fund for prior taxable years. A Fund will make appropriate basis adjustments in the PFIC stock to take
into account the mark-to-market amounts.
Notwithstanding any election made
by a Fund, dividends attributable to distributions from a foreign corporation will not be eligible for the special tax rates applicable to qualified dividend income if the foreign corporation is a PFIC either in the
taxable year of the distribution or the preceding taxable year, but instead will be taxable at rates applicable to ordinary income.
A Fund may invest in REITs. Such
Fund’s investments in REIT equity securities may require a Fund to accrue and distribute income not yet received. In order to generate sufficient cash to make the requisite distributions, a Fund may be required
to sell securities in its portfolio that it otherwise would have continued to hold (including when it is not advantageous to do so). A Fund’s investments in REIT equity securities may at other times result in
the Fund’s receipt of cash in excess of the REIT’s earnings; if the Fund distributes such amounts, such distribution could constitute a return of capital to Fund shareholders for federal income tax
purposes. Dividends received by the Fund from a REIT will generally not constitute qualified dividend income. REITs will generally be able to pass through the tax treatment of tax-qualified dividends they receive.
Some of the REITs in which the
Funds may invest will be permitted to hold residual interests in real estate mortgage investment conduits (“REMICs”). Under Treasury regulations not yet issued, but that may apply retroactively, a portion
of a Fund’s income from a REIT that is attributable to the REIT’s residual interest in a REMIC (referred to in the Code as an “excess inclusion”) will be subject to federal income tax in all
events. These regulations are expected to provide that excess inclusion income of a regulated investment company, such as a Fund, will be allocated to shareholders of the regulated investment company in proportion to
the dividends received by shareholders, with the same consequences as if shareholders held the related REMIC residual interest directly.
In general, excess inclusion income
allocated to shareholders (i) cannot be offset by net operating losses (subject to a limited exception for certain thrift institutions), (ii) will constitute unrelated business taxable income to entities (including a
qualified pension plan, an individual retirement account, a 401(k) plan, a Keogh plan or other tax-exempt entity) subject to tax on unrelated business income, thereby potentially requiring such an entity that is
allocated excess inclusion income, and that otherwise might not be required to file a tax return, to file a tax return and pay tax on such income, and (iii) in the case of a non-US shareholder, will not qualify for
any reduction in US federal withholding tax.
73
Under current law, if a charitable
remainder trust (defined in Section 664 of the Code) realizes any unrelated business taxable income for a taxable year, it will be subject to an excise tax equal to 100% of such unrelated business taxable income. In
addition, if at any time during any taxable year a “disqualified organization” (as defined in the Code) is a record holder of a share in a regulated investment company, then the regulated investment
company will be subject to a tax equal to that portion of its excess inclusion income for the taxable year that is allocable to the disqualified organization, multiplied by the highest federal income tax rate imposed
on corporations. The Funds do not intend to invest directly in residual interests in REMICs or to invest in REITs in which a substantial portion of the assets will consist of residual interests in REMICs.
FUND DISTRIBUTIONS. Each Fund anticipates distributing substantially all of its net investment income for each taxable year. Dividends of net investment income paid to a non-corporate US shareholder that are
reported as qualified dividend income will generally be taxable to such shareholder at capital gain income tax rates. The amount of dividend income that may be reported by a Fund as qualified dividend income will
generally be limited to the aggregate of the eligible dividends received by the Fund. In addition, a Fund must meet certain holding period requirements with respect to the shares on which the Fund received the
eligible dividends, and the non-corporate US shareholder must meet certain holding period requirements with respect to the Fund shares. Dividends of net investment income that are not reported as qualified dividend
income or exempt-interest dividends and dividends of net short-term capital gains will be taxable to shareholders at ordinary income rates. Dividends paid by a Fund with respect to a taxable year will qualify for the
70% dividends received deduction generally available to corporations to the extent of the amount of dividends received by the Fund from certain domestic corporations for the taxable year. Shareholders will be advised
annually as to the US federal income tax consequences of distributions made (or deemed made) during the year, including the portion of dividends paid that qualify for the reduced tax rate.
Ordinarily, shareholders are
required to take taxable distributions by a Fund into account in the year in which the distributions are made. However, for federal income tax purposes, dividends that are declared by a Fund in October, November or
December as of a record date in such month and actually paid in January of the following year will be treated as if they were paid on December 31 of the year declared. Therefore, such dividends will generally be
taxable to a shareholder in the year declared rather than the year paid.
Dividends paid by a Fund that are
properly reported as exempt-interest dividends will not be subject to regular federal income tax. Dividends paid by a Fund will be exempt from federal income tax (though not necessarily exempt from state and local
taxation) to the extent of the Fund’s tax-exempt interest income as long as 50% or more of the value of the Fund’s assets at the end of each quarter is invested in (1) state, municipal and other bonds that
are excluded from gross income for federal income tax purposes or (2) interests in other regulated investment companies, and, in each case, as long as the Fund properly reports such dividends as exempt-interest
dividends. Exempt-interest dividends from interest earned on municipal securities of a state, or its political subdivisions, are generally exempt from income tax in that state. However, income from municipal
securities from other states generally will not qualify for tax-free treatment.
Interest on indebtedness incurred
by a shareholder to purchase or carry shares of a Fund will not be deductible for US federal income tax purposes to the extent it relates to exempt-interest dividends received by a shareholder. If a shareholder
receives exempt-interest dividends with respect to any share of a Fund (other than a Fund that declares income dividends daily and pays such dividends at least as frequently as monthly) and if the share is held by the
shareholder for six months or less, then any loss on the sale or exchange of the share may, to the extent of the exempt-interest dividends, be disallowed. In addition, the Code may require a shareholder that receives
exempt-interest dividends to treat as taxable income a portion of certain otherwise non-taxable social security and railroad retirement benefit payments. Furthermore, a portion of any exempt-interest dividend paid by
a Fund that represents income derived from certain revenue or private activity bonds held by the Fund may not retain its tax-exempt status in the hands of a shareholder who is a “substantial user” of a
facility financed by such bonds, or a “related person” thereof. In addition, the receipt of dividends and distributions from a Fund may affect a foreign corporate shareholder’s federal “branch
profits” tax liability and the federal “excess net passive income” tax liability of a shareholder of an S corporation. Shareholders should consult their own tax advisers as to whether they are (i)
“substantial users” with respect to a facility or “related” to such users within the meaning of the Code or (ii) subject to the federal “branch profits” tax, or the federal
“excess net passive income” tax.
A Fund may either retain or
distribute to shareholders its net capital gain (i.e., excess net long-term capital gain over net short-term capital loss) for each taxable year. Each Fund currently intends to distribute any such amounts. If net
capital gain is distributed and reported as a “capital gain dividend,” it will be taxable to shareholders as long-term capital gain, regardless of the length of time the shareholder has held its shares or
whether such gain was recognized by the Fund prior to the date on which the shareholder acquired its shares. Conversely, if a Fund elects to retain its net capital gain, the Fund will be taxed thereon (except to the
extent of any available capital loss carryovers) at the 35% corporate tax rate. In such a case, it is expected that the Fund also will elect to have shareholders of record on the last day of its taxable year treated
as if each received a distribution of its pro rata share of such gain,
74
with the result that each shareholder will be
required to report its pro rata share of such gain on its tax return as long-term capital gain, will receive a refundable tax credit for its pro rata share of tax paid by the Fund on the gain, and will increase the
tax basis for its shares by an amount equal to the deemed distribution less the tax credit.
Distributions by a Fund that exceed
the Fund’s current and accumulated earnings and profits will be treated as a return of capital to the extent of (and in reduction of) the shareholder’s tax basis in its shares; any distribution in excess
of such tax basis will be treated as gain from the sale of its shares, as discussed below. Distributions in excess of a Fund’s minimum distribution requirements but not in excess of the Fund’s earnings and
profits will be taxable to shareholders and will not constitute nontaxable returns of capital. A Fund’s capital loss carryforwards, if any, carried from taxable years beginning before 2011 do not reduce current
earnings and profits, even if such carryforwards offset current year realized gains. In the event that the Fund were to experience an ownership change as defined under the Code, the Fund’s loss carryforwards, if
any, may be subject to limitation.
Distributions by a Fund will be
treated in the manner described above regardless of whether such distributions are paid in cash or reinvested in additional shares of the Fund (or of another fund). Shareholders receiving a distribution in the form of
additional shares will be treated as receiving a distribution in an amount equal to the amount of cash that could have been received. In addition, prospective investors in a Fund should be aware that distributions
from the Fund will, all other things being equal, have the effect of reducing the NAV of the Fund’s shares by the amount of the distribution. If the NAV is reduced below a shareholder’s cost, the
distribution will nonetheless be taxable as described above, even if the distribution effectively represents a return of invested capital. Investors should consider the tax implications of buying shares just prior to
a distribution, when the price of shares may reflect the amount of the forthcoming distribution.
SALE OR REDEMPTION OF SHARES. A shareholder will generally recognize gain or loss on the sale or redemption of shares in an amount equal to the difference between the proceeds of the sale or redemption and the
shareholder’s adjusted tax basis in the shares. All or a portion of any loss so recognized may be disallowed if the shareholder acquires other shares of the Fund or substantially identical stock or securities
within a period of 61 days beginning 30 days before such disposition, such as pursuant to reinvestment of a dividend in shares of the Fund. Additionally, if a shareholder disposes of shares of a Fund within 90 days
following their acquisition, and the shareholder subsequently re-acquires Fund shares (1) before January 31 of the calendar year following the calendar year in which the original stock was disposed of, (2) pursuant to
a reinvestment right received upon the purchase of the original shares and (3) at a reduced load charge (i.e., sales or additional charge), then any load charge incurred upon the acquisition of the original shares
will not be taken into account as part of the shareholder’s basis for computing gain or loss upon the sale of such shares, to the extent the original load charge does not exceed any reduction of the load charge
with respect to the acquisition of the subsequent shares. To the extent the original load charge is not taken into account on the disposition of the original shares, such charge shall be treated as incurred in
connection with the acquisition of the subsequent shares. In general, any gain or loss arising from (or treated as arising from) the sale or redemption of shares of a Fund will be considered capital gain or loss and
will be long term capital gain or loss if the shares were held for more than one year. However, any capital loss arising from the sale or redemption of shares held for six months or less will be treated as a long-term
capital loss to the extent of the amount of long-term capital gain dividends received on (or undistributed long-term capital gains credited with respect to) such shares.
Capital gain of a non-corporate US
shareholder is generally taxed at a federal income tax rate of up to 15% for individuals with incomes below approximately $400,000 ($450,000 if married filing jointly), adjusted annually for inflation, and 20% for any
income above such levels that is generally net long-term capital gain or qualified dividend income, where the property is held by the shareholder for more than one year. Capital gain of a corporate shareholder is
taxed at the same rate as ordinary income.
Cost Basis Reporting. Mutual funds must report cost basis information to you and the IRS when you sell or exchange shares acquired on or after January 1, 2012 in your non-retirement accounts. The cost basis
regulations do not affect retirement accounts, money market funds, and shares acquired before January 1, 2012. The regulations also require mutual funds to report whether a gain or loss is short-term (shares held one
year or less) or long-term (shares held more than one year) for all shares acquired on or after January 1, 2012 that are subsequently sold or exchanged. To calculate the gain or loss on shares sold, you need to know
the cost basis of the shares. Cost basis is the original value of an asset for tax purposes (usually the gross purchase price), adjusted for stock splits, reinvested dividends, and return of capital distributions.
This value is used to determine the capital gain (or loss), which is the difference between the cost basis of the shares and the gross proceeds when the shares are sold. The Fund’s Transfer Agent supports
several different cost basis methods from which you may select a cost basis method you believe best suited to your needs. If you decide to elect the Transfer Agent’s default method, which is average cost, no
action is required on your part. For shares acquired on or after January 1, 2012, if you change your cost basis method, the new method will apply to all shares in the account if you request the change prior to the
first redemption. If, however, you request the change after the first redemption, the new method will apply to shares acquired on or after the date of the change. Keep in mind that the Fund’s Transfer Agent is
not required to report cost basis
75
information to you or the IRS on shares acquired
before January 1, 2012. However, the Transfer Agent will provide this information to you, as a service, if its cost basis records are complete for such shares. This information will be separately identified on the
Form 1099-B (Proceeds from Broker and Barter Exchange Transactions) sent to you by the Transfer Agent and not transmitted to the IRS.
BACKUP WITHHOLDING. A Fund will be required in certain cases to withhold and remit to the US Treasury 28% of all dividends and capital gain dividends, and the proceeds of redemption of shares, paid to any
shareholder (1) who has provided the Fund with either an incorrect tax identification number or no number at all, (2) who is subject to backup withholding by the IRS for failure to report the receipt of interest or
dividend income properly or (3) who has failed to certify to the Fund that it is not subject to backup withholding or that it is a corporation or other exempt recipient. In addition, dividends and capital gain
dividends made to corporate United States holders may be subject to information reporting and backup withholding. Backup withholding is not an additional tax and any amounts withheld may be refunded or credited
against a shareholder’s federal income tax liability, provided the appropriate information is furnished to the IRS.
If a shareholder recognizes a loss
with respect to a Fund’s shares of $2 million or more for an individual shareholder or $10 million or more for a corporate shareholder, the shareholder must file with the IRS a disclosure statement on Form 8886.
Direct shareholders of portfolio securities are in many cases exempted from this reporting requirement, but under current guidance, shareholders of a regulated investment company are not exempted. The fact that a loss
is reportable under these regulations does not affect the legal determination of whether the taxpayer’s treatment of the loss is proper. Shareholders should consult their tax advisers to determine the
applicability of these regulations in light of their individual circumstances.
MEDICARE CONTRIBUTION TAX. A US person that is an individual or estate, or a trust that does not fall into a special class of trusts that is exempt from such tax, is subject to a 3.8% tax on the lesser of (1) the US
person’s “net investment income” for the relevant taxable year and (2) the excess of the US person’s modified adjusted gross income for the taxable year over $200,000 (or $250,000 if married
filing jointly). A Fund shareholder’s net investment income will generally include, among other things, dividend income from the Fund and net gains from the disposition of Fund shares, unless such dividend
income or net gains are derived in the ordinary course of the conduct of a trade or business (other than a trade or business that consists of certain passive or trading activities). If you are a US person that is an
individual, estate or trust, you are urged to consult your tax advisers regarding the applicability of the Medicare contribution tax to your income and gains in respect of your investment in the Fund shares.
FOREIGN SHAREHOLDERS. Dividends paid to a shareholder who, as to the United States, is a nonresident alien individual, foreign trust or estate, foreign corporation, or foreign partnership (“foreign
shareholder”) will be subject to US withholding tax at the rate of 30% (or lower applicable treaty rate) on the gross amount of the dividend. Such a foreign shareholder would generally be exempt from US federal
income tax, including withholding tax, on gains realized on the sale of shares of a Fund, net capital gain dividends, exempt-interest dividends, and amounts retained by the Fund that are reported as undistributed
capital gains.
The foregoing applies when the
foreign shareholder’s income from a Fund is not effectively connected with a US trade or business. If the income from a Fund is effectively connected with a US trade or business carried on by a foreign
shareholder, then ordinary income dividends, qualified dividend income, net capital gain dividends, undistributed capital gains credited to such shareholder and any gains realized upon the sale of shares of the Fund
will be subject to US federal income tax at the graduated rates applicable to US citizens or domestic corporations.
For taxable years beginning before
January 1, 2014, distributions that a Fund reports as “short-term capital gain dividends” or “long-term capital gain dividends” will not be treated as such to a recipient foreign shareholder if
the distribution is attributable to a REIT’s distribution to a Fund of a gain from the sale or exchange of US real property or an interest in a US real property holding corporation and a Fund’s direct or
indirect interests in US real property exceed certain levels. Instead, if the foreign shareholder has not owned more than 5% of the outstanding shares of a Fund at any time during the one year period ending on the
date of distribution, such distributions will be subject to 30% withholding by a Fund and will be treated as ordinary dividends to the foreign shareholder; if the foreign shareholder owned more than 5% of the
outstanding shares of a Fund at any time during the one-year period ending on the date of the distribution, such distribution will be treated as real property gain subject to 35% withholding tax and could subject the
foreign shareholder to US filing requirements. Additionally, if a Fund’s direct or indirect interests in US real property were to exceed certain levels, a foreign shareholder realizing gains upon redemption from
a Fund before January 1, 2014 could be subject to the 35% withholding tax and US filing requirements unless more than 50% of a Fund’s shares were owned by US persons at such time or unless the foreign person had
not held more than 5% of a Fund’s outstanding shares throughout either such person’s holding period for the redeemed shares or, if shorter, the previous five years.
Legislation has been proposed to
extend the above expiration dates but no assurance can be provided that such legislation will be enacted.
76
The rules laid out in the previous
paragraph, other than the withholding rules, will apply notwithstanding a Fund’s participation in a wash sale transaction or its payment of a substitute dividend.
Provided that 50% or more of the
value of the Fund’s stock is held by US shareholders, distributions of US real property interests (including securities in a US real property holding corporation, unless such corporation is regularly traded on
an established securities market and the Fund has held 5% or less of the outstanding shares of the corporation during the five-year period ending on the date of distribution) occurring on or before December 31, 2013,
in redemption of a foreign shareholder’s shares of the Fund will cause the Fund to recognize gain. If the Fund is required to recognize gain, the amount of gain recognized will be equal to the fair market value
of such interests over the Fund’s adjusted bases to the extent of the greatest foreign ownership percentage of the Fund during the five-year period ending on the date of redemption.
In the case of foreign
non-corporate shareholders, a Fund may be required to backup withhold US federal income tax on distributions that are otherwise exempt from withholding tax unless such shareholders furnish the Fund with proper
notification of their foreign status.
The tax consequences to a foreign
shareholder entitled to claim the benefits of an applicable tax treaty may be different from those described herein. Foreign shareholders are urged to consult their own tax advisers with respect to the particular tax
consequences to them of an investment in a Fund, the procedure for claiming the benefit of a lower treaty rate and the applicability of foreign taxes.
FOREIGN TAXES. A Fund may be subject to foreign withholding taxes or other foreign taxes with respect to income (possibly including, in some cases, capital gain) received from sources within foreign
countries. So long as more than 50% by value of the total assets of the Fund at the close of the taxable year consists of (1) stock or securities of foreign issuers or (2) interests in other regulated investment
companies, the Fund may elect to treat any foreign income taxes paid by it as paid directly by its shareholders.
If the Fund makes the election,
each shareholder will be required to (i) include in gross income, even though not actually received, its pro rata share of the Fund’s foreign income taxes, and (ii) either deduct (in calculating US taxable
income) or credit (in calculating US federal income tax) its pro rata share of the Fund’s income taxes. A foreign tax credit may not exceed the US federal income tax otherwise payable with respect to the foreign
source income. For this purpose, each shareholder must treat as foreign source gross income (i) its proportionate share of foreign taxes paid by the Fund and (ii) the portion of any actual dividend paid by the Fund
which represents income derived from foreign sources; the gain from the sale of securities will generally be treated as US source income and certain foreign currency gains and losses likewise will be treated as
derived from US sources. This foreign tax credit limitation is, with certain exceptions, applied separately to separate categories of income; dividends from the Fund will be treated as “passive” or
“general” income for this purpose. The effect of this limitation may be to prevent shareholders from claiming as a credit the full amount of their pro rata share of the Fund’s foreign income taxes.
In addition, shareholders will not be eligible to claim a foreign tax credit with respect to foreign income taxes paid by the Fund unless certain holding period requirements are met at both the Fund and the
shareholder levels.
A Fund will make such an election
only if it deems it to be in the best interest of its shareholders. A shareholder not subject to US tax may prefer that this election not be made. The Fund will notify shareholders in writing each year if it makes the
election and of the amount of foreign income taxes, if any, to be passed through to the shareholders and the amount of foreign taxes, if any, for which shareholders of the Fund will not be eligible to claim a foreign
tax credit because the holding period requirements (described above) have not been satisfied.
A 30% withholding
tax is imposed on US-source dividends, interest and other income items paid after June 30, 2014, and will be imposed on proceeds from the sale of property producing US-source dividends and interest paid after December
31, 2016, to (i) foreign financial institutions including non-US investment funds unless they agree to collect and disclose to the IRS information regarding their direct and indirect US account holders and (ii)
certain other foreign entities, unless they certify certain information regarding their direct and indirect US owners. To avoid withholding, foreign financial institutions will need to (i) enter into agreements with
the IRS that state that they will provide the IRS information, including the names, addresses and taxpayer identification numbers of direct and indirect US account holders, comply with due diligence procedures with
respect to the identification of US accounts, report to the IRS certain information with respect to US accounts maintained, agree to withhold tax on certain payments made to non-compliant foreign financial
institutions or to account holders, or (ii) in the event that an intergovernmental agreement and implementing legislation are adopted, provide local revenue authorities with similar account holder information. Other
foreign entities will need to either provide the name, address, and taxpayer identification number of each substantial US owner or certifications of no substantial US ownership unless certain exceptions apply.
Shares of a Fund held by a non-US
shareholder at death will be considered situated within the United States and subject to the US estate tax.
77
STATE AND LOCAL TAX MATTERS. Depending on the residence of the shareholders for tax purposes, distributions may also be subject to state and local taxes. Rules of state and local taxation regarding qualified dividend
income, ordinary income dividends and capital gains distributions from regulated investment companies and other items may differ from federal income tax rules. Shareholders are urged to consult their tax advisers as
to the consequences of these and other state and local tax rules affecting investment in a Fund.
CAPITAL LOSS
CARRYFORWARDS.The Fund did not utilize any of its capital loss carryforward to offset net taxable gains realized in the fiscal year ended October 31, 2014.
DISCLOSURE OF PORTFOLIO
HOLDINGS
The Fund's portfolio holdings as of
the end of the second and fourth fiscal quarters are made public, as required by law, in the Fund's annual and semi-annual reports. These reports are filed with the SEC on Form N-CSR and mailed to shareholders within
60 days after the end of the second and fourth fiscal quarters. The Fund's annual and semi-annual reports are posted on the Fund's website at www.prudentialfunds.com. The Fund's portfolio holdings as of the end of the
first and third fiscal quarters are made public and filed with the SEC on Form N-Q within 60 days after the end of the Fund's first and third fiscal quarters, and may be accessed at www.sec.gov.
The Fund generally post on the
website a detailed list of the Fund's portfolio holdings as of the end of each calendar month no sooner than approximately three business days prior to the end of the following month. The detailed list of portfolio
holdings will generally remain available on the website for approximately one month, at which time the list will be replaced. (Note: The Prudential Core Short-Term Bond Fund does not post portfolio holdings as of the end of each calendar month.)
In addition, the
Fund may also release its top ten holdings, sector and country breakdowns, and largest industries on a quarterly or monthly basis, with the information as of a date 15 days prior to the release. Such information will
be posted on the website and will generally be available for viewing until replaced at the end of the subsequent quarter. If the Fund recently commenced operations or recently completed a repositioning of investment
policies, then the Fund may publicly release one or more of the items described above in this section subject to a 15-day delay for the period from the commencement of operations or the repositioning until the timing
discussed earlier in this section becomes effective. However, if a money market fund is required to release any such information on a more frequent basis pursuant to Rule 2a-7, then the money market fund will release
such information in a manner consistent with Rule 2a-7.
Portfolio holdings information
which appears on the Fund's website may also be made available in printed form. When authorized by the Fund's Chief Compliance Officer and another officer of the Fund, portfolio holdings information may be
disseminated more frequently or at different periods than as described above.
The Fund has
entered into ongoing arrangements to make available information about the Fund's portfolio holdings. Parties receiving this information may include intermediaries that distribute Fund shares, third-party providers of
auditing, custody, proxy voting and other services for the Fund, rating and ranking organizations, and certain affiliated persons of the Fund, as described below. The procedures utilized to determine eligibility are
set forth below:
Procedures for Release of Portfolio
Holdings Information:
1. A request for release of fund holdings shall be provided by such third party setting forth a legitimate business purpose for such release which shall specify the Fund, the terms of such release, and frequency (e.g., level of detail, staleness). The request shall address whether there are any conflicts of interest between Fund shareholders and the investment adviser, subadviser, principal underwriter or any affiliated person thereof and how such conflicts shall be dealt with to demonstrate that the disclosure is in the best interest of the shareholders of the Fund.
1. A request for release of fund holdings shall be provided by such third party setting forth a legitimate business purpose for such release which shall specify the Fund, the terms of such release, and frequency (e.g., level of detail, staleness). The request shall address whether there are any conflicts of interest between Fund shareholders and the investment adviser, subadviser, principal underwriter or any affiliated person thereof and how such conflicts shall be dealt with to demonstrate that the disclosure is in the best interest of the shareholders of the Fund.
2. The request shall be forwarded
to the Chief Compliance Officer of the Fund, or his delegate, for review and approval.
3. A confidentiality agreement in
the form approved by an officer of the Fund must be executed with the recipient of the fund holdings information.
4. An officer of the Fund shall
approve the release and agreement. Copies of the release and agreement shall be sent to PI's law department.
5. Written notification of the
approval shall be sent by such officer to PI's Fund Administration Department to arrange the release of fund holdings information.
6. PI's Fund Administration
Department shall arrange for the release of fund holdings information by the Fund's custodian bank(s).
78
As of the date of this SAI, the
Fund will provide:
1. Traditional External
Recipients/Vendors
| ■ | Full holdings on a daily basis to Institutional Shareholder Services (ISS), Broadridge and Glass, Lewis & Co. (proxy voting administrator/agents) at the end of each day; |
| ■ | Full holdings on a daily basis to ISS (securities class action claims administrator) at the end of each day; |
| ■ | Full holdings on a daily basis to a Fund's Subadviser(s), Custodian Bank, sub-custodian (if any) and accounting agents (which includes the Custodian Bank and any other accounting agent that may be appointed) at the end of each day. When a Fund has more than one Subadviser, each Subadviser receives holdings information only with respect to the “sleeve” or segment of the Fund for which the Subadviser has responsibility; |
| ■ | Full holdings to a Fund's independent registered public accounting firm as soon as practicable following the Fund's fiscal year-end or on an as-needed basis; and |
| ■ | Full holdings to financial printers as soon as practicable following the end of a Fund's quarterly, semi-annual and annual period-ends. |
2. Analytical Service Providers
| ■ | Fund trades on a quarterly basis to Abel/Noser Corp. (an agency-only broker and transaction cost analysis company) as soon as practicable following a Fund's fiscal quarter-end; |
| ■ | Full holdings on a daily basis to FT Interactive Data (a fair value information service) at the end of each day; |
| ■ | Full holdings on a daily basis to FactSet Research Systems Inc. and Lipper, Inc. (investment research providers) at the end of each day; |
| ■ | Full holdings on a daily basis to Performance Explorer Limited (investment research provider for funds engaged in securities lending) at the end of each day, for certain funds; |
| ■ | Full holdings on a daily basis to Vestek (for preparation of fact sheets) at the end of each day (Target Portfolio Trust, and selected Prudential Investments Funds only); |
| ■ | Full holdings to Frank Russell Company (investment research provider) at the end of each month (Prudential Jennison Small Company Fund, Prudential Variable Contract Accounts -2 and -10 only); |
| ■ | Full holdings on a monthly basis to Fidelity Advisors (wrap program provider) approximately five days after the end of each month (Prudential Jennison Growth Fund and certain other selected Prudential Investments Funds only); |
| ■ | Full holdings on a daily basis to Brown Brothers Harriman & Co. (operations support) (Prudential Financial Services Fund only); |
| ■ | Full holdings on a daily basis to Markit WSO Corporation (certain operational functions)(Prudential Financial Services Fund only); |
| ■ | Full holdings on a daily basis to Investment Technology Group, Inc. (analytical service provider) (Prudential Financial Services Fund only); |
| ■ | Full holdings on a daily basis to State Street Bank and Trust Company (operations service provider) (Prudential Financial Services Fund only); and |
| ■ | Full holdings on a quarterly basis to Prudential Retirement Services / Watson Wyatt Investment Retirement Services (401(k) plan recordkeeping) approximately 30 days after the close of the Fund's fiscal quarter-end (Prudential Jennison Growth Fund only). |
In each case, the information
disclosed must be for a legitimate business purpose and is subject to a confidentiality agreement intended to prohibit the recipient from trading on or further disseminating such information (except for legitimate
business purposes). Such arrangements will be monitored on an ongoing basis and will be reviewed by the Chief Compliance Officer and PI's Law Department on an annual basis.
In addition, certain authorized
employees of PI receive portfolio holdings information on a quarterly, monthly or daily basis or upon request, in order to perform their business functions. All PI employees are subject to the requirements of the
personal securities trading policy of Prudential Financial, Inc., which prohibits employees from trading on or further disseminating confidential information, including portfolio holdings information.
Also, affiliated shareholders may,
subject to execution of a non-disclosure agreement, receive current portfolio holdings for the sole purpose of enabling the Fund to effect the payment of the redemption price to such shareholder in whole or in part by
a distribution in kind of securities from the investment portfolio of the Fund, in lieu of cash, in conformity with the rules of the SEC and procedures adopted by the Board. For more information regarding the payment
of the redemption price by a distribution in kind of securities from the investment portfolio of the Fund, see “Purchase, Redemption and Pricing of Fund Shares—Redemption in Kind.”
The Board has approved PI's Policy
for the Dissemination of Portfolio Holdings. The Board shall, on a quarterly basis, receive a report from PI detailing the recipients of the portfolio holdings information and the reason for such disclosure. The Board
has delegated oversight over the Fund's disclosure of portfolio holdings to the Chief Compliance Officer.
79
There can be no assurance that the
policies and procedures on portfolio holdings information will protect the Fund from the potential misuse of such information by individuals or entities that come into possession of the information.
PROXY VOTING
The Board has
delegated to the Manager the responsibility for voting any proxies and maintaining proxy recordkeeping with respect to the Fund. The Manager is authorized by the Fund to delegate, in whole or in part, its proxy voting
authority to the investment subadviser(s) or third party vendors consistent with the policies set forth below. The proxy voting process shall remain subject to the supervision of the Board, including any committee
thereof established for that purpose.
The Manager and the Board view the
proxy voting process as a component of the investment process and, as such, seek to ensure that all proxy proposals are voted with the primary goal of seeking the optimal benefit for the Fund. Consistent with this
goal, the Board views the proxy voting process as a means to encourage strong corporate governance practices and ethical conduct by corporate management. The Manager and the Board maintain a policy of seeking to
protect the best interests of the Fund should a proxy issue potentially implicate a conflict of interest between the Fund and the Manager or its affiliates.
The Manager
delegates to the Fund's Subadviser(s) the responsibility for voting proxies. The Subadviser is expected to identify and seek to obtain the optimal benefit for the Fund, and to adopt written policies that meet certain
minimum standards, including that the policies be reasonably designed to protect the best interests of the Fund and delineate procedures to be followed when a proxy vote presents a conflict between the interests of
the Fund and the interests of the Subadviser or its affiliates. The Manager and the Board expect that the Subadviser will notify the Manager and Board at least annually of any such conflicts identified and confirm how
the issue was resolved. In addition, the Manager expects that the Subadviser will deliver to the Manager, or its appointed vendor, information required for filing the Form N-PX with the SEC. Information regarding how
the Fund voted proxies relating to its portfolio securities during the most recent twelve-month period ending June 30 is available without charge on the Fund's website and on the SEC's website at www.sec.gov.
A summary of the proxy voting
policies of the Subadviser(s) is set forth in its respective Appendix to this SAI.
CODES OF ETHICS
The Board has
adopted a Code of Ethics. In addition, the Manager, investment subadviser(s) and Distributor have each adopted a Code of Ethics. The Codes of Ethics apply to access persons (generally, persons who have access to
information about the Fund's investment program) and permit personnel subject to the Codes of Ethics to invest in securities, including securities that may be purchased or held by the Fund. However, the protective
provisions of the Codes of Ethics prohibit certain investments and limit such personnel from making investments during periods when the Fund is making such investments. The Codes of Ethics are on public file with, and
are available from, the SEC.
APPENDIX I: PROXY VOTING
POLICIES OF THE SUBADVISERS
QUANTITATIVE MANAGEMENT ASSOCIATES LLC
(QMA)
Description of QMA Proxy Voting
Policies. It is the policy of Quantitative Management Associates LLC (“QMA”) to vote proxies on client securities in the best long-term economic interest of its clients, in accordance
with QMA’s established proxy voting policy and procedures. In the case of pooled accounts, QMA’s policy is to vote proxies on securities in such account in the best long-term economic interest of the
pooled account. In the event of any actual or apparent material conflict between its clients' interest and QMA’s own, QMA’s policy is to act solely in its clients' interest. To this end, the proxy voting
policy and procedures adopted by QMA include procedures to address potential material conflicts of interest arising in connection with the voting of proxies.
QMA's proxy voting policy contains
detailed voting guidelines on a wide variety of issues commonly voted upon by shareholders. These guidelines reflect QMA's judgment of how to further the best long-range economic interest of its clients (i.e. the
mutual interest of clients in seeing the appreciation in value of a common investment over time) through the shareholder voting process. Where issues are not addressed by its policy, or when circumstances suggest a
vote not in accordance with its established guidelines, voting decisions are made on a case-by-case basis taking into consideration the potential economic impact of the proposal. With respect to international
holdings, QMA takes into account additional restrictions in some countries that might impair its ability to trade those securities or have other potentially adverse economic consequences, and generally vote foreign
securities on a best efforts basis if QMA determines that voting is in the best economic interest of its clients. The Fund determines whether fund securities out on loan are to be recalled for voting purposes and QMA
is not involved in any such decision. QMA’s proxy voting committee includes representatives of QMA’s investment, operations, compliance, risk and legal teams. QMA’s proxy voting committee is
responsible for interpreting the proxy voting policy as well as monitoring conflicts of interest, and periodically assesses the policy's effectiveness.
80
QMA utilizes the services of a
third party proxy voting facilitator, and upon receipt of proxies will direct the voting facilitator to vote in a manner consistent with QMA's established proxy voting guidelines described above (assuming timely
receipt of proxy materials from issuers and custodians). In accordance with its obligations under the Advisers Act, QMA provides full disclosure of its proxy voting policy, guidelines and procedures to its clients
upon their request, and will also provide to any client, upon request, the proxy voting records for that client's securities.
JENNISON ASSOCIATES LLC
Conflicts of interest may also arise in voting proxies. Jennison has adopted a proxy voting policy to address these conflicts.
Conflicts of interest may also arise in voting proxies. Jennison has adopted a proxy voting policy to address these conflicts.
Jennison actively manages publicly
traded equity securities and fixed income securities. It is the policy of Jennison that where proxy voting authority has been delegated to and accepted by Jennison, all proxies shall be voted by investment
professionals in the best interest of the client without regard to the interests of Jennison or other related parties, based on recommendations as determined by pre-established guidelines either adopted by Jennison or
provided by the client. Secondary consideration is permitted to be given to the public and social value of each issue. For purposes of this policy, the “best interests of clients” shall mean, unless
otherwise specified by the client, the clients' best economic interests over the long term—that is, the common interest that all clients share in seeing the value of a common investment increase over time. Any
vote that represents a potential material conflict is reviewed by Jennison Compliance and referred to the Proxy Voting Committee to determine how to vote the proxy if Compliance determines that a material conflict
exists.
In voting proxies for international
holdings, which we vote on a best efforts basis, we will generally apply the same principles as those for US holdings. However, in some countries, voting proxies result in additional restrictions that have an economic
impact or cost to the security, such as “share blocking”, where Jennison would be restricted from selling the shares of the security for a period of time if Jennison exercised its ability to vote the
proxy. As such, we consider whether the vote, either itself or together with the votes of other shareholders, is expected to have an effect on the value of the investment that will outweigh the cost of voting. Our
policy is to not vote these types of proxies when the costs outweigh the benefit of voting, as in share blocking.
In an effort to discharge its
responsibility, Jennison has examined third-party services that assist in the researching and voting of proxies and development of voting guidelines. After such review, Jennison has selected an independent third party
proxy voting vendor to assist it in researching and voting proxies. Jennison will utilize the research and analytical services, operational implementation and recordkeeping and reporting services provided by the proxy
voting vendor. The proxy voting vendor will research each proxy and provide a recommendation to Jennison as to how best to vote on each issue based on its research of the individual facts and circumstances of the
proxy issue and its application of its research findings. It is important to note while Jennison may review the research and analysis provided by the vendor, the vendor's recommendation does not dictate the actual
voting instructions nor Jennison's Guidelines. The proxy voting vendor will cast votes in accordance with Jennison's Guidelines, unless instructed otherwise by a Jennison Investment Professional, as set forth below,
or if Jennison has accepted direction from a Client, in accordance with the Client's Guidelines.
In voting proxies for
quantitatively derived holdings and Jennison Managed Accounts (i.e., “wrap”) where the securities are not held elsewhere in the firm, Jennison has established a custom proxy voting policy with respect to
the voting of these proxies. Proxies received in these circumstances will be voted utilizing the Jennison's guidelines. Additionally, in those circumstances where no specific Jennison guideline exists, Jennison will
vote using the recommendations of the proxy voting vendor.
For securities on loan pursuant to
a client's securities lending arrangement, Jennison will work with either custodian banks or the proxy voting vendor to monitor upcoming meetings and call stock loans, if possible, in anticipation of an important vote
to be taken among holders of the securities or of the giving or withholding of their consent on a material matter affecting the investment. In determining whether to call stock loans, the relevant investment
professional shall consider whether the benefit to the client in voting the matter outweighs the benefit to the client in keeping the stock on loan. It is important to note that in order to recall securities on loan
in time to vote, the process must be initiated PRIOR to the record date of the proxy. This is extremely difficult to accomplish as Jennison is rarely made aware of the record date in advance.
It is further the policy of
Jennison that complete and accurate disclosure concerning its proxy voting policies and procedures and proxy voting records, as required by the Advisers Act, is to be made available to clients.
These procedures are intended to
provide Jennison with the reasonable assurance that all clients' accounts are being treated fairly so that no one client's account is systematically advantaged.
PRUDENTIAL INVESTMENT MANAGEMENT,
INC.
81
The policy of each of PIM’s
asset management units is to vote proxies in the best interests of their respective clients based on the clients’ priorities. Client interests are placed ahead of any potential interest of PIM or its asset
management units.
Because the various asset
management units manage distinct classes of assets with differing management styles, some units will consider each proxy on its individual merits while other units may adopt a pre‐determined set of voting
guidelines. The specific voting approach of each unit is noted below.
Relevant members of management and
regulatory personnel oversee the proxy voting process and monitor potential conflicts of interest. In addition, should the need arise, senior members of management, as advised by Compliance and Law, are authorized to
address any proxy matter involving an actual or apparent conflict of interest that cannot be resolved at the level of an individual asset management business unit.
VOTING APPROACH OF PIM ASSET
MANAGEMENT UNITS
Prudential Fixed Income. Prudential Fixed Income is a business unit of PIM. Prudential Fixed Income’s policy is to vote proxies in the best economic interest of its clients. In the case of pooled accounts,
the policy is to vote proxies in the best economic interest of the pooled account. The proxy voting policy contains detailed voting guidelines on a wide variety of issues commonly voted upon by shareholders. These
guidelines reflect Prudential Fixed Income’s judgment of how to further the best economic interest of its clients through the shareholder or debt-holder voting process.
Prudential Fixed Income invests
primarily in debt securities, thus there are few traditional proxies voted by it. Prudential Fixed Income generally votes with management on routine matters such as the appointment of accountants or the election of
directors. From time to time, ballot issues arise that are not addressed by the policy or circumstances may suggest a vote not in accordance with the established guidelines. In these cases, voting decisions are made
on a case-by-case basis by the applicable portfolio manager taking into consideration the potential economic impact of the proposal. If a security is held in multiple accounts and two or more portfolio managers are
not in agreement with respect to a particular vote, Prudential Fixed Income’s proxy voting committee will determine the vote. Not all ballots are received by Prudential Fixed Income in advance of voting
deadlines, but when ballots are received in a timely fashion, Prudential Fixed Income strives to meet its voting obligations. It cannot, however, guarantee that every proxy will be voted prior to its deadline.
With respect to non-US holdings,
Prudential Fixed Income takes into account additional restrictions in some countries that might impair its ability to trade those securities or have other potentially adverse economic consequences. Prudential Fixed
Income generally votes non-US securities on a best efforts basis if it determines that voting is in the best economic interest of its clients.
Occasionally, a conflict of
interest may arise in connection with proxy voting. For example, the issuer of the securities being voted may also be a client of Prudential Fixed Income. When Prudential Fixed Income identifies an actual or potential
conflict of interest between the firm and its clients with respect to proxy voting, the matter is presented to senior management who will resolve such issue in consultation with the compliance and legal
departments.
Any client may obtain a copy of
Prudential Fixed Income’s proxy voting policy, guidelines and procedures, as well as the proxy voting records for that client’s securities, by contacting the client service representative responsible for
the client’s account.
Prudential Real Estate
Investors. Prudential Real Estate Investors (PREI®) is a business unit of PIM. PREI's proxy voting policy contains detailed voting guidelines on a wide variety of issues commonly voted upon by shareholders.
These guidelines reflect PREI's judgment of how to further the best long-range economic interest of our clients (i.e. the mutual interest of clients in seeing the appreciation in value of a common investment over
time) through the shareholder voting process. PREI's policy is generally to vote proxies on social or political issues on a case by case basis. Additionally, where issues are not addressed by our policy, or when
circumstances suggest a vote not in accordance with our established guidelines, voting decisions are made on a case-by-case basis taking into consideration the potential economic impact of the proposal. With respect
to international holdings, we take into account additional restrictions in some countries that might impair our ability to trade those securities or have other potentially adverse economic consequences, and generally
vote foreign securities on a best efforts basis in accordance with the recommendations of the issuer's management if we determine that voting is in the best economic interest of our clients.
PREI utilizes the services of a
third party proxy voting facilitator, and upon receipt of proxies will direct the voting facilitator to vote in a manner consistent with PREI's established proxy voting guidelines described above (assuming timely
receipt of proxy materials from issuers and custodians). In accordance with its obligations under the Advisers Act, PREI provides full disclosure of its proxy voting policy, guidelines and procedures to its clients
upon their request, and will also provide to any client, upon request, the proxy voting records for that client's securities.
82
APPENDIX II: DESCRIPTIONS OF
SECURITY RATINGS
MOODY'S INVESTORS SERVICE, INC.
(MOODY'S)
Debt Ratings
Aaa: Bonds which are rated Aaa are judged to be of the best quality. They carry the smallest degree of investment risk and are generally referred to as “gilt edged.” Interest
payments are protected by a large or by an exceptionally stable margin and principal is secure. While the various protective elements are likely to change, such changes as can be visualized are most unlikely to impair
the fundamentally strong position of such issues.
Aa: Bonds which are rated Aa are judged to be of high quality by all standards. Together with the Aaa group they comprise what are generally known as high-grade bonds. They are rated lower
than the best bonds because margins of protection may not be as large as in Aaa securities or fluctuation of protective elements may be of greater amplitude or there may be other elements present which make the
long-term risks appear somewhat larger than the Aaa securities.
A: Bonds which are rated A possess many favorable investment attributes and are to be considered as upper-medium-grade obligations. Factors giving security to principal and interest are
considered adequate, but elements may be present which suggest a susceptibility to impairment some time in the future.
Baa: Bonds which are rated Baa are considered as medium-grade obligations, i.e., they are neither highly protected nor poorly secured. Interest payments and principal security appear adequate
for the present but certain protective elements may be lacking or may be characteristically unreliable over any great length of time. Such bonds lack outstanding investment characteristics and in fact have speculative
characteristics as well.
Ba: Bonds which are rated Ba are judged to have speculative elements; their future cannot be considered as well assured. Often the protection of interest and principal payments may be very
moderate and thereby not well safeguarded during both good and bad times over the future. Uncertainty of position characterizes bonds in this class.
B: Bonds which are rated B generally lack characteristics of the desirable investment. Assurance of interest and principal payments or of maintenance of other terms of the contract over any
long period of time may be small.
Caa: Bonds which are rated Caa are of poor standing. Such issues may be in default or there may be present elements of danger with respect to principal or interest.
Ca: Bonds which are rated Ca represent obligations which are speculative in a high degree. Such issues are often in default or have other marked shortcomings.
C: Bonds which are rated C are the lowest-rated class of bonds, and issues so rated can be regarded as having extremely poor prospects of ever attaining any real investment
standing.
Moody's applies numerical modifiers
1, 2, and 3 in each generic rating category from Aa to Caa. The modifier 1 indicates that the issuer is in the higher end of its letter rating category; the modifier 2 indicates a mid-range ranking; the modifier 3
indicates that the issuer is in the lower end of the letter ranking category.
Short-Term Ratings
Moody's short-term debt ratings are
opinions of the ability of issuers to honor senior financial obligations and contracts. Such obligations generally have an original maturity not exceeding one year, unless explicitly noted.
PRIME-1: Issuers rated Prime-1 (or supporting institutions) have a superior ability for repayment of senior short-term debt obligations. Prime-1 repayment ability will often be evidenced by many of
the following characteristics:
| ■ | Leading market positions in well-established industries. |
| ■ | High rates of return on funds employed. |
| ■ | Conservative capitalization structure with moderate reliance on debt and ample asset protection. |
| ■ | Broad margins in earnings coverage of fixed financial charges and high internal cash generation. |
| ■ | Well-established access to a range of financial markets and assured sources of alternate liquidity. |
PRIME-2: Issuers rated Prime-2 (or supporting institutions) have a strong ability for repayment of senior short-term debt obligations. This normally will be evidenced by many of the characteristics
cited above but to a lesser degree. Earnings trends and coverage ratios, while sound, may be more subject to variation. Capitalization characteristics, while still appropriate, may be more affected by external
conditions. Ample alternate liquidity is maintained.
83
MIG 1: This designation denotes best quality. There is strong protection by established cash flows, superior liquidity support or demonstrated broad-based access to the market for
refinancing.
MIG 2: This designation denotes high quality. Margins of protection are ample although not so large as in the preceding group.
STANDARD & POOR'S RATINGS
SERVICES (S&P)
Long-Term Issue Credit Ratings
AAA: An obligation rated AAA has the highest rating assigned by S&P. The obligor's capacity to meet its financial commitment on the obligation is extremely strong.
AA: An obligation rated AA differs from the highest rated obligations only in small degree. The obligor's capacity to meet its financial commitment on the obligation is very strong.
A: An obligation rated A is somewhat more susceptible to the adverse effects of changes in circumstances and economic conditions than obligations in higher-rated categories. However, the
obligor's capacity to meet its financial commitment on the obligation is still strong.
BBB: An obligation rated BBB exhibits adequate protection parameters. However, adverse economic conditions or changing circumstances are more likely to lead to a weakened capacity of the
obligor to meet its financial commitment on the obligation.
BB: An obligation rated BB is less vulnerable to nonpayment than other speculative issues. However, it faces major ongoing uncertainties or exposure to adverse business, financial, or economic
conditions which could lead to the obligor's inadequate capacity to meet its financial commitment on the obligation.
B: An obligation rated B is more vulnerable to nonpayment than obligations rated BB, but the obligor currently has the capacity to meet its financial commitment on the obligation. Adverse
business, financial, or economic conditions will likely impair the obligor's capacity or willingness to meet its financial commitment on the obligation.
CCC: An obligation rated CCC is currently vulnerable to nonpayment, and is dependent upon favorable business, financial, and economic conditions for the obligor to meet its financial commitment
on the obligation. In the event of adverse business, financial, or economic conditions, the obligor is not likely to have the capacity to meet its financial commitment on the obligation.
CC: An obligation rated CC is currently highly vulnerable to nonpayment.
C: The C rating may be used to cover a situation where a bankruptcy petition has been filed or similar action has been taken, but payments on this obligation are being continued.
Plus (+) or Minus (–): The ratings from AA to CCC may be modified by the addition of a plus or minus sign to show relative standing within the major rating categories.
Commercial Paper Ratings
A-1: This designation indicates that the degree of safety regarding timely payment is strong. Those issues determined to possess extremely strong safety characteristics are denoted with a plus
sign (+) designation.
A-2: Capacity for timely payment on issues with this designation is satisfactory. However, the relative degree of safety is not as high as for issues designated A-1.
Notes Ratings
An S&P notes rating reflects the
liquidity factors and market risks unique to notes. Notes due in three years or less will likely receive a notes rating. Notes maturing beyond three years will most likely receive a long-term debt rating. The
following criteria will be used in making that assessment.
| ■ | Amortization schedule-the longer the final maturity relative to other maturities the more likely it will be treated as a note. |
| ■ | Source of payment-the more dependent the issue is on the market for its refinancing, the more likely it will be treated as a note. |
Note rating symbols are as
follows:
SP-1: Strong capacity to pay principal and interest. An issue determined to possess a very strong capacity to pay debt service is given a plus (+) designation.
84
SP-2: Satisfactory capacity to pay principal and interest, with some vulnerability to adverse financial and economic changes over the term of the notes.
FITCH RATINGS LTD.
International Long-Term Credit
Ratings
AAA: Highest Credit Quality. AAA ratings denote the lowest expectation of credit risk. They are assigned only in case of exceptionally strong capacity for timely payment of financial
commitments. This capacity is highly unlikely to be adversely affected by foreseeable events.
AA: Very High Credit Quality. AA ratings denote a very low expectation of credit risk. They indicate very strong capacity for timely payment of financial commitments. This capacity is not
significantly vulnerable to foreseeable events.
A: High Credit Quality. A ratings denote a low expectation of credit risk. The capacity for timely payment of financial commitments is considered strong. This capacity may, nevertheless, be
more vulnerable to changes in circumstances or in economic conditions than is the case for higher ratings.
BBB: Good Credit Quality. BBB ratings indicate that there is currently a low expectation of credit risk. The capacity for timely payment of financial commitments is considered adequate, but
adverse changes in circumstances and in economic conditions are more likely to impair this capacity. This is the lowest investment-grade category.
BB: Speculative. BB ratings indicate that there is a possibility of credit risk developing, particularly as the result of adverse economic change over time; however, business or financial
alternatives may be available to allow financial commitments to be met. Securities rated in this category are not investment grade.
B: Highly Speculative. B ratings indicate that significant credit risk is present, but a limited margin of safety remains. Financial commitments are currently being met; however, capacity for
continued payment is contingent upon a sustained, favorable business and economic environment.
CCC, CC, C: High Default Risk. Default is a real possibility. Capacity for meeting financial commitments is solely reliant upon sustained, favorable business or economic developments. A CC rating
indicates that default of some kind appears probable. C ratings signal imminent default.
International Short-Term Credit
Ratings
F1: Highest Credit Quality. Indicates the strongest capacity for timely payment of financial commitments; may have an added “+” to denote any exceptionally strong credit
feature.
F2: Good Credit Quality. A satisfactory capacity for timely payment of financial commitments, but the margin of safety is not as great as in the case of the higher ratings.
F3: Fair Credit Quality. The capacity for timely payment of financial commitments is adequate; however, near-term adverse changes could result in a reduction to non-investment grade.
B: Speculative. Minimal capacity for timely payment of financial commitments, plus vulnerability to near-term adverse changes in financial and economic conditions.
C: High Default Risk. Default is a real possibility. Capacity for meeting financial commitments is solely reliant upon a sustained, favorable business and economic investment.
Plus (+) or Minus (–): Plus or minus signs may be appended to a rating to denote relative status within major rating categories. Such suffixes are not added to the AAA long-term rating category, to categories
below CCC, or to short-term ratings other than F1.
85
This page intentionally left blank
This page intentionally left blank
This page intentionally left blank
PART C
OTHER INFORMATION
Item 28. Exhibits.
(a)(1) Certificate of Trust.
Incorporated by reference to Registrant’s initial Registration Statement on Form N-1A, filed with the Securities and Exchange Commission (SEC) on August 4, 1998 (File No. 333-60561).
(2) Amendment to Certificate
of Trust dated August 26, 1999. Incorporated by reference to Registrant’s Post-Effective Amendment No. 8 filed on Form N-1A with the SEC on October 1, 2001 (File No. 333-60561).
(3) Amendment to Certificate
of Trust dated September 4, 2001. Incorporated by reference to Registrant’s Post-Effective Amendment No. 8 filed on Form N-1A with the SEC on October 1, 2001 (File No. 333-60561).
(4) Agreement and Declaration
of Trust. Incorporated by reference to Registrant’s initial Registration Statement on Form N-1A, filed with the SEC on August 4, 1998 (File No. 333-60561).
(5) Amendment No. 1 to
Agreement and Declaration of Trust. Incorporated by reference to Registrant’s Pre-Effective Amendment No. 1 filed on Form N-1A with the SEC on September 17, 1998 (File No. 333-60561).
(6) Certificate of Correction
of Certificate of Amendment to Certificate of Trust dated May 14, 2002. Incorporated by reference to Post-Effective No. 9 to the Registration Statement on Form N-1A filed with the SEC on September 27,
2002 (File No. 333-60561).
(7) Amendment to Certificate of
Trust dated September 29, 2006. Incorporated by reference to Registrant’s Post-Effective Amendment No. 14 to the Registration Statement on Form N-1A filed with the SEC on October 2, 2006 (File
No. 333-60561).
(8) Amendment to Certificate of
Trust dated May 8, 2013. Incorporated by reference to corresponding Exhibit to Registrant’s Post-Effective Amendment No. 26 to the Registration Statement on Form N-1A filed with the SEC on
July 16, 2013 (File No. 333-60561).
(b) By-Laws as amended
November 16, 2004. Incorporated by reference to Registrant’s Post-Effective Amendment No. 13 filed with the SEC on Form N-1A on September 30, 2005 (File No. 333-60561).
(c) In response to this item,
Registrant incorporates by reference the following provisions from its Agreement and Declaration of Trust and By-Laws, filed herewith as Exhibit a(1) and Exhibit (b), defining rights of the Trust’s
shareholders: Articles III and V of Agreement and Declaration of Trust; Article III of By-Laws.
(d)(1) Amended and Restated
Management Agreement between Registrant and Prudential Investments LLC dated May 25, 2004. Incorporated by reference to corresponding exhibit to Registrant’s Post-Effective Amendment No. 13 filed with
the SEC on Form N-1A on September 30, 2005 (File No. 333-60561).
(2) Amended and Restated
Management Agreement between Registrant and Prudential Investments LLC with respect to Prudential Income Builder Fund, dated September 1, 2014. Incorporated by reference to Registrant’s Post-Effective Amendment
No. 32 filed on Form N-1A filed with the SEC on September 22, 2014.
(3) Subadvisory Agreement between
PI and Quantitative Management Associates LLC with respect to the Prudential Defensive Equity Fund dated May 8, 2013. Incorporated by reference to Registrant’s Post-Effective Amendment No. 26 to the
Registration Statement on Form N-1A filed on July 16, 2013 (File No. 333-60561).
(4) Subadvisory Agreement between
PI and Quantitative Management Associates LLC with respect to the Prudential Income Builder Fund, dated September 1, 2014. Incorporated by reference to Registrant’s Post-Effective Amendment No. 32 filed on
Form N-1A filed with the SEC on September 22, 2014.
1
(5) Subadvisory Agreement between
PI and Jennison Associates LLC with respect to the Prudential Income Builder Fund, dated September 1, 2014. Incorporated by reference to Registrant’s Post-Effective Amendment No. 32 filed on Form N-1A filed
with the SEC on September 22, 2014.
(6) Subadvisory Agreement between
PI and Prudential Fixed Income, a business unit of Prudential Investment Management, Inc. with respect to the Prudential Income Builder Fund, dated September 1, 2014. Incorporated by reference to Registrant’s
Post-Effective Amendment No. 32 filed on Form N-1A filed with the SEC on September 22, 2014.
(7) Subadvisory Agreement between
PI and Prudential Real Estate Investors, a business unit of Prudential Investment Management, Inc. with respect to the Prudential Income Builder Fund, dated September 1, 2014. Incorporated by reference to
Registrant’s Post-Effective Amendment No. 32 filed on Form N-1A filed with the SEC on September 22, 2014.
(e)(1) Amended and Restated
Distribution Agreement between the Registrant and Prudential Investment Management Services LLC dated September 16, 2010. Incorporated by reference to Prudential Jennison Small Company Fund, Inc. Post-Effective
Amendment No. 50 to the Registration Statement on Form N-1A (File No. 2-68723) filed via EDGAR on September 16, 2010.
(i) Amended Exhibit A dated
March 11, 2011 for Distribution Agreement dated September 16, 2010, incorporated by reference to Prudential World Fund, Inc. Post-Effective Amendment No. 56 to the Registration Statement on Form N-1A
(File No. 2-89725) filed via EDGAR on January 11, 2011.
(2) Form of Selected Dealer
Agreement. Incorporated by reference to Registrant’s Post-Effective Amendment No. 4 filed on Form N-1A on October 7, 1999 (File No. 333-60561).
(f) Not applicable.
(g) Custodian Services
Agreement between Registrant and PFPC Trust Company (PFPC) dated July 1, 2005. Incorporated by reference to exhibit (g)(2) to Registrant’s Post-Effective Amendment No. 13 filed on Form N-1A on
September 30, 2005.
(h)(1) Amended and Restated
Transfer Agency and Service Agreement between the Registrant and Prudential Mutual Fund Services, Inc. (PMFS), dated May 29, 2007. Incorporated by reference to the Dryden Municipal Bond Fund Post-Effective
Amendment No. 29 to the Registration Statement on Form N-1A filed with the SEC via EDGAR on June 29, 2007 (File No. 33-10649).
(2) Amendment dated
September 2, 2008 to Amended and Restated Transfer Agency and Service Agreement dated May 29, 2007. Incorporated by reference to the Target Portfolio Trust Post-Effective Amendment No. 27 to the
Registration Statement on Form N-1A filed with the SEC on January 30, 2009 (File No. 33-50476).
(3) Amendment dated
December 21, 2010 to Amended and Restated Transfer Agency and Service Agreement dated May 29, 2007, incorporated by reference to the Prudential Investments Portfolio 9 Post-Effective Amendment No. 29 to
the Registration Statement on Form N-1A filed with the SEC on December 21, 2010 (File No. 333-66895).
(4) Expense waiver for Prudential
Income Builder Fund. Incorporated by reference to Registrant’s Post-Effective Amendment No. 32 filed on Form N-1A filed with the SEC on September 22, 2014.
(i) Opinion of counsel.
Incorporated by reference to Post-Effective No. 9 to the Registration Statement on Form N-1A filed with the SEC on September 27, 2002.
(j)(1) Consent of independent
registered public accounting firm for Prudential Defensive Equity Fund. Filed herewith.
2
(2) Consent of independent
registered public accounting firm for Prudential Income Builder Fund. Filed herewith.
(l) Purchase Agreement.
Incorporated by reference to Registrant’s Post-Effective Amendment No. 4 filed on Form N-1A on October 7, 1999 (File No. 333-60561).
(m)(1) Distribution and
Service Plan for Class A shares. Incorporated by reference to Registrant’s initial Registration Statement on Form N-1A, filed with the SEC on August 4, 1998 (File No. 333-60561).
(2) Distribution and Service
Plan for Class B shares. Incorporated by reference to Registrant’s initial Registration Statement on Form N-1A, filed with the SEC on August 4, 1998 (File No. 333-60561).
(3) Distribution and Service
Plan for Class C shares. Incorporated by reference to Registrant’s initial Registration Statement on Form N-1A, filed with the SEC on August 4, 1998 (File No. 333-60561).
(4) Distribution and Service
Plan for Class R shares. Incorporated by reference to Registrant’s Post-Effective Amendment No. 12 filed on Form N-1A filed with the SEC on October 1, 2004.
(5) Distribution and Service
Plan for Class X shares. Incorporated by reference to Registrant’s Post-Effective Amendment No. 12 filed on Form N-1A filed with the SEC on October 1, 2004.
(6) Rule 12b-1 fee waiver for
Class A shares and Class R shares of Prudential Income Builder Fund. Incorporated by reference to
Registrant’s Post-Effective Amendment No. 32 filed on Form N-1A filed with the SEC on September 22, 2014.
(7) Rule 12b-1 fee waiver for
Class A shares and Class R of Prudential Defensive Equity Fund. Filed herewith.
(n) Amended and Restated Rule
18f-3 Plan dated September 15, 2010. Incorporated by reference to the Prudential Jennison Small Company Fund, Inc. Post-Effective Amendment No. 50 to the Registration Statement on Form N-1A filed via EDGAR
on September 16, 2010 (File No.2-68723).
(p)(1) Code of Ethics of the
Registrant. Incorporated by reference to Exhibit (r)(1) to Pre-Effective Amendment No. 1 to the Registration Statement on Form N-2 for Prudential Global Short Duration High Yield Fund, Inc., filed via EDGAR on
October 5, 2012 (File No. 333-182826).
(2) Code of Ethics and Personal
Securities Trading Policy of Prudential, including the Manager and Distributor, dated January 10, 2011, incorporated by reference to Post-Effective Amendment No. 21 to the Registration Statement on Form N-1A
of Prudential Investment Portfolios 12, filed via EDGAR on June 1, 2011 (File No. 333-42705).
(3) Code of Ethics of Quantitative
Management Associates LLC (QMA). Incorporated by reference to Post-Effective Amendment No. 113 to the Registration Statement of Advanced Series Trust, which Amendment was filed via EDGAR on February 6, 2013
(File No. 033-24962).
(4) Code of Ethics of Jennison
dated October 5, 2005. Incorporated by reference to Post-Effective Amendment No. 29 to the Jennison Natural Resources Fund, Inc. Registration Statement on Form N-1A filed via EDGAR on July 31, 2006 (File No.
33-15166).
Item 29. Persons Controlled by or
under Common Control with the Registrant.
None.
Item 30. Indemnification.
As permitted by Sections
17(h) and (i) of the Investment Company Act of 1940, as amended (the 1940 Act), and pursuant to Article VII of the Agreement and Declaration of Trust (Exhibit (a)(4)) to the Registration Statement) and
Article XI of the Trust's By-Laws (Exhibit (b) to the Registration Statement), officers, trustees, employees and agents of Registrant will not be liable to Registrant, any stockholder, officer, director,
employee, agent or other person for
3
any action or failure to act, except for bad
faith, willful misfeasance, gross negligence or reckless disregard of duties, and those individuals may be indemnified against liabilities in connection with Registrant, subject to the same exceptions. Section 3817 of
the Delaware Statutory Trust Act permits indemnification of trustees who acted in good faith and reasonably believed that the conduct was in the best interest of Registrant. As permitted by Section 17(i) of the
1940 Act, pursuant to Section 10 of the Distribution Agreement (Exhibit (e)(1) to the Registration Statement), the Distributor of Registrant may be indemnified against liabilities which it may incur, except
liabilities arising from bad faith, gross negligence, willful misfeasance or reckless disregard of duties.
Insofar as indemnification for
liabilities arising under the Securities Act of 1933, as amended (the Securities Act), may be permitted to trustees, officers and controlling persons of Registrant pursuant to the foregoing provisions or otherwise,
Registrant has been advised that, in the opinion of the SEC, such indemnification is against public policy as expressed in the 1940 Act and is, therefore, unenforceable. In the event that a claim for indemnification
against such liabilities (other than the payment by Registrant of expenses incurred or paid by a trustee, officer or controlling person of Registrant in connection with the successful defense of any action, suit or
proceeding) is asserted against Registrant by such trustee, officer or controlling person in connection with the shares being registered, Registrant will, unless in the opinion of its counsel the matter has been
settled by controlling precedent, submit to a court of appropriate jurisdiction the question whether such indemnification by it is against public policy as expressed in the 1940 Act and will be governed by the final
adjudication of such issue.
Registrant has purchased an
insurance policy insuring its officers and trustees against liabilities, and certain costs of defending claims against such officers and trustees, to the extent such officers and trustees are not found to have
committed conduct constituting willful misfeasance, bad faith, gross negligence or reckless disregard in the performance of their duties. The insurance policy also insures Registrant against the cost of
indemnification payments to officers and trustees under certain circumstances.
Section 8 of the Management
Agreement (Exhibit (d)(1) to the Registration Statement) and Section 4 of the Subadvisory Agreements (Exhibits (d)(2) through (d)(14) to the Registration Statement) limit the liability of PI and each
Adviser, respectively, to liabilities arising from willful misfeasance, bad faith or gross negligence in the performance of their respective duties or from reckless disregard by them of their respective obligations
and duties under the agreements.
Registrant hereby undertakes that
it will apply the indemnification provisions of its By-Laws and the Distribution Agreement in a manner consistent with Release No. 11330 of the SEC under the 1940 Act as long as the interpretation of Section
17(h) and 17(i) of such Act remain in effect and are consistently applied.
Item 31. Business and other
Connections of the Investment Adviser.
Prudential Investments LLC (PI)
See the Prospectus constituting
Part A of this Post-Effective Amendment to the Registration Statement and “Management and Advisory Arrangements” in the Statement of Additional Information (SAI) constituting Part B of this Post-Effective
Amendment to the Registration Statement.
The business and other connections
of the officers of PI are listed in Schedules A and D of Form ADV of PI as currently on file with the Commission, the text of which is hereby incorporated by reference (File No. 801-31104).
Jennison Associates LLC
(Jennison)
See the Prospectus constituting a
portion of Part A of this Registration Statement and “Management and Advisory Arrangements” in the SAI.
Information as to Jennison’s
directors and executive officers is included in its Form ADV filed with the Commission (801-5608), as most recently amended, the relevant text of which is incorporated herein by reference.
Prudential Investment Management,
Inc. (PIM)
4
See the Prospectus constituting
Part A of the Registration Statement and “Management and Advisory Arrangements” in the SAI constituting Part B of this Registration Statement.
The business and other connections
of the directors and executive officers of Prudential Investment Management, Inc. are included in Schedule A and D of Form ADV filed with the Securities and Exchange Commission (File No. 801-22808), as most recently
amended, the text of which is hereby incorporated reference.
Prudential Real Estate Investors
(PREI)
See the Prospectus constituting
Part A of the Registration Statement and “Management and Advisory Arrangements” in the SAI constituting Part B of this Registration Statement.
The business and other connections
of the directors and executive officers of Prudential Real Estate Investors (which is a unit of Prudential Investment Management, Inc.) are included in Schedule A and D of Form ADV filed with the Securities and
Exchange Commission (File No. 801-22808), as most recently amended, the text of which is hereby incorporated reference.
Quantitative Management Associates
LLC (QMA)
See the Prospectus constituting
Part A of this Registration Statement and “Management and Advisory Arrangements” in the SAI.
Information as to QMA’s
directors and executive officers is included in its Form ADV as currently on file with the Commission (File No. 801-62692), the relevant text of which is incorporated herein by reference.
Item 32. Principal Underwriters.
(a) Prudential Investment
Management Services LLC (PIMS)
PIMS is distributor for The
Prudential Investment Portfolios, Inc., Prudential Investment Portfolios 2, Prudential Investment Portfolios 3, Prudential Investment Portfolios Inc. 14, Prudential Investment Portfolios 4, Prudential Investment
Portfolios 5, Prudential MoneyMart Assets, Inc., Prudential Investment Portfolios 6, Prudential National Muni Fund, Inc., Prudential Jennison Blend Fund, Inc., Prudential Jennison Mid-Cap Growth Fund, Inc., Prudential
Investment Portfolios 7, Prudential Investment Portfolios 8, Prudential Jennison Small Company Fund, Inc., Prudential Investment Portfolios 9, Prudential World Fund, Inc., Prudential Investment Portfolios, Inc. 10,
Prudential Jennison Natural Resources Fund, Inc., Prudential Global Total Return Fund, Inc., Prudential Investment Portfolios 12, Prudential Investment Portfolios, Inc. 15, Prudential Investment Portfolios 16,
Prudential Investment Portfolios, Inc. 17, Prudential Investment Portfolios 18, Prudential Sector Funds, Inc. Prudential Short-Term Corporate Bond Fund, Inc., The Target Portfolio Trust, and The Prudential Series
Fund.
PIMS is also distributor of the
following other investment companies: Separate Accounts: Prudential’s Gibraltar Fund, Inc., The Prudential Variable Contract Account-2, The Prudential Variable Contract Account-10, The Prudential Variable
Contract Account-11, The Prudential Variable Contract Account-24, The Prudential Variable Contract GI-2, The Prudential Discovery Select Group Variable Contract Account, The Pruco Life Flexible Premium Variable
Annuity Account, The Pruco Life of New Jersey Flexible Premium Variable Annuity Account, The Prudential Individual Variable Contract Account, The Prudential Qualified Individual Variable Contract Account and PRIAC
Variable Contract Account A.
(b) The following table sets forth
information regarding certain officers of PIMS. As a limited liability company, PIMS has no directors.
| Name and Principal Business Address | Positions and Offices with Underwriter | |
| David Hunt (2) | President and Chief Executive Officer | |
| Christine C. Marcks (4) | Executive Vice President | |
| Gary F. Neubeck (2) | Executive Vice President |
5
| Name and Principal Business Address | Positions and Offices with Underwriter | |
| Stuart S. Parker (1) | Executive Vice President | |
| Scott E. Benjamin (1) | Vice President | |
| Joanne M. Accurso-Soto (1) | Senior Vice President | |
| Michael J. King (3) | Senior Vice President, Chief Legal Officer and Secretary | |
| Peter J. Boland (1) | Senior Vice President and Chief Operating Officer | |
| John N. Christolini (4) | Senior Vice President | |
| Mark R. Hastings (1) | Senior Vice President and Chief Compliance Officer | |
| Michael J. McQuade (1) | Senior Vice President, Comptroller and Chief Financial Officer | |
| John L. Bronson (3) | Vice President and Deputy Chief Legal Officer | |
| Richard W. Kinville (3) | Vice President and Anti-Money Laundering Officer |
Principal Business
Addresses:
| (1) | Gateway Center Three, Newark, NJ 07102-4061 |
| (2) | Gateway Center Two, Newark, NJ 07102-4061 |
| (3) | 751 Broad Street, Newark NJ, 07102-3714 |
| (4) | 280 Trumbull Street, Hartford, CT 06103-3509 |
(c) Registrant has no principal
underwriter who is not an affiliated person of the Registrant.
Item 33. Location of Accounts and
Records.
All accounts, books and other
documents required to be maintained by Section 31(a) of the 1940 Act and the Rules thereunder are maintained at the offices of Bank of New York Mellon, 1 Wall Street, New York, New York 10011, Eagle
Asset Management, Inc., 880 Carrillon Pkwy., St. Petersburg, Florida 33716, EARNEST Partners, LLC, 1180 Peachtree Street NE, Suite 2300, Atlanta, Georgia 30309, Epoch Investment Partners, Inc., 640 Fifth Avenue, New
York, New York 10019, Hotchkis and Wiley Capital Management, LLC, 725 South Figueroa Street-39th Floor, Los Angeles, California 90017, Massachusetts Financial Services Company, 500 Boylston Street, Boston,
Massachusetts 02116, NFJ Investment Group LLC, 2100 Ross Avenue, Dallas, Texas 75201, Pacific Investment Management Company LLC, 840 Newport Center Drive, Newport Beach, California 92660, Quantitative Management
Associates, 100 Mulberry Street, 2 Gateway Center, Newark, New Jersey 07102, Vaughan Nelson Investment Management, L.P., 600 Travis Street, Suite 7300, Houston, Texas 77002, the Registrant, Gateway Center Three, 100
Mulberry Street, Newark, New Jersey 07102, and Prudential Mutual Fund Services LLC (PMFS), 100 Mulberry Street, Gateway Center Three, Newark, New Jersey 07102.
Documents required by
Rules 31a-1(b) (4), (5), (6), (7), (9), (10) and (11) and 31a-1 (d) and (f) will be kept at Gateway Center Three, 100 Mulberry Street, Newark, New Jersey 07102, and the remaining
accounts, books and other documents required by such other pertinent provisions of Section 31(a) and the Rules promulgated thereunder will be kept by BNY and PMFS.
Item 34. Management Services.
Other than as set forth under the
captions “How the Fund is Managed-Manager” and “How the Fund is Managed-Distributor” in the Prospectus and the caption “Management and Advisory Arrangements” in the SAI,
constituting Parts A and B, respectively, of this Post-Effective Amendment to the Registration Statement, Registrant is not a party to any management-related service contract.
6
Item 35. Undertakings.
Not applicable.
7
SIGNATURES
Pursuant to the requirements of
the Securities Act and the Investment Company Act, the Fund certifies that it meets all of the requirements for effectiveness of this Post-Effective Amendment to the Registration Statement under Rule 485(b) under
the Securities Act and has duly caused this Post-Effective Amendment to the Registration Statement to be signed on its behalf by the undersigned, duly authorized, in the City of Newark, and State of New Jersey, on the
24th day of December, 2014.
| Prudential Investment Portfolios 16 |
| * |
| Stuart S. Parker, President |
Pursuant to the requirements of
the Securities Act of 1933, this Post-Effective Amendment to the Registration Statement has been signed below by the following persons in the capacities and on the date indicated.
| Signature | Title | Date | ||
| * Ellen S. Alberding |
Trustee | |||
| * Kevin J. Bannon |
Trustee | |||
| * Scott E. Benjamin |
Trustee | |||
| * Linda W. Bynoe |
Trustee | |||
| * Keith F. Hartstein |
Trustee | |||
| * Michael S. Hyland |
Trustee | |||
| * Douglas H. McCorkindale |
Trustee | |||
| * Stephen P. Munn |
Trustee | |||
| * Stuart S. Parker |
Trustee and President, Principal Executive Officer | |||
| * James E. Quinn |
Trustee | |||
| * Richard A. Redeker |
Trustee | |||
| * Robin B. Smith |
Trustee | |||
| * Stephen Stoneburn |
Trustee |
8
| Signature | Title | Date | ||
| * Grace C. Torres |
Trustee | |||
| * M. Sadiq Peshimam |
Treasurer, Principal Financial and Accounting Officer | |||
| *By: /s/ Jonathan D. Shain Jonathan D. Shain |
Attorney-in-Fact | December 24, 2014 |
9
POWER OF ATTORNEY
The undersigned Directors,
Trustees and Officers of the Prudential Investments Mutual Funds, the Target Funds and The Prudential Variable Contract Accounts 2, 10 and 11 (collectively, the “Funds”), hereby constitute, appoint and
authorize each of, Andrew French, Claudia DiGiacomo, Deborah A. Docs, Raymond A. O’Hara, Amanda S. Ryan, and Jonathan D. Shain, as true and lawful agents and attorneys-in-fact, to sign, execute and deliver on
his or her behalf in the appropriate capacities indicated, any Registration Statements of the Funds on the appropriate forms, any and all amendments thereto (including pre- and post-effective amendments), and any and
all supplements or other instruments in connection therewith, including Form N-PX, Forms 3, 4 and 5, as appropriate, to file the same, with all exhibits thereto, with the US Securities and Exchange Commission (the
“SEC”) and the securities regulators of appropriate states and territories, and generally to do all such things in his or her name and behalf in connection therewith as said attorney-in-fact deems
necessary or appropriate to comply with the provisions of the Securities Act of 1933, section 16(a) of the Securities Exchange Act of 1934 and the Investment Company Act of 1940, all related requirements of the SEC
and all requirements of appropriate states and territories. The undersigned do hereby give to said agents and attorneys-in-fact full power and authority to act in these premises, including, but not limited
to, the power to appoint a substitute or substitutes to act hereunder with the same power and authority as said agents and attorneys-in-fact would have if personally acting. The undersigned do hereby
approve, ratify and confirm all that said agents and attorneys-in-fact, or any substitute or substitutes, may do by virtue hereof.
| /s/ Ellen S. Alberding Ellen S. Alberding |
/s/ Stephen P. Munn Stephen P. Munn | |
| /s/ Kevin J. Bannon Kevin J. Bannon |
/s/ Stuart S. Parker Stuart S. Parker | |
| /s/ Scott E. Benjamin Scott E. Benjamin |
/s/ James E. Quinn James E. Quinn | |
| /s/ Linda W. Bynoe Linda W. Bynoe |
/s/ Richard A. Redeker Richard A. Redeker | |
| /s/ Keith F. Hartstein Keith F. Hartstein |
/s/ Robin B. Smith Robin B. Smith | |
| /s/ Michael S. Hyland Michael S. Hyland |
/s/ Stephen Stoneburn Stephen Stoneburn | |
| /s/ Douglas H. McCorkindale Douglas H. McCorkindale |
||
| Dated: September 18, 2013 | ||
| /s/ M. Sadiq Peshimam M. Sadiq Peshimam Treasurer and Principal and Accounting Officer |
||
| Dated: May 12, 2014 | ||
| /s/ Grace C. Torres Grace C. Torres |
||
| Dated: December 10, 2014 |
10
11
Prudential Investment Portfolios
16
Exhibit Index
| Item 28 Exhibit No. |
Description | |
| j(1) | Consent of independent registered public accounting firm for Prudential Defensive Equity Fund | |
| j(2) | Consent of independent registered public accounting firm for Prudential Income Builder Fund | |
| m(7) | 12b-1 fee waiver for Class A and R shares of Prudential Defensive Equity Fund |
12