As
filed with the Securities and Exchange Commission on September 28, 2012
Securities Act Registration No. 333-60561
Investment Company Act Registration No. 811-08915
Investment Company Act Registration No. 811-08915
UNITED STATES
SECURITIES AND EXCHANGE COMMISSION
WASHINGTON, D.C. 20549
SECURITIES AND EXCHANGE COMMISSION
WASHINGTON, D.C. 20549
FORM
N-1A
REGISTRATION STATEMENT UNDER THE SECURITIES ACT OF 1933
PRE-EFFECTIVE AMENDMENT NO.
POST-EFFECTIVE AMENDMENT NO. 24 (X)
PRE-EFFECTIVE AMENDMENT NO.
POST-EFFECTIVE AMENDMENT NO. 24 (X)
and/or
REGISTRATION STATEMENT UNDER THE INVESTMENT COMPANY ACT OF 1940
POST-EFFECTIVE AMENDMENT NO. 24 (X)
Check appropriate box or boxes
POST-EFFECTIVE AMENDMENT NO. 24 (X)
Check appropriate box or boxes
Target Asset Allocation Funds
Exact name of registrant as specified in charter
Exact name of registrant as specified in charter
Gateway Center Three, 4th floor
100 Mulberry Street
Newark, New Jersey 07102
Address of Principal Executive Offices including Zip Code
100 Mulberry Street
Newark, New Jersey 07102
Address of Principal Executive Offices including Zip Code
(973) 367-7521
Registrant’s Telephone Number, Including Area Code
Registrant’s Telephone Number, Including Area Code
Deborah A. Docs
Gateway Center Three, 4th floor
100 Mulberry Street, 4th Floor
Newark, NJ 07102
Name and Address of Agent for Service
Gateway Center Three, 4th floor
100 Mulberry Street, 4th Floor
Newark, NJ 07102
Name and Address of Agent for Service
It is proposed that
this filing will become effective:
(X) immediately upon filing pursuant to paragraph (b)
__ on (____) pursuant to paragraph (b)
__ 60 days after filing pursuant to paragraph (a)(1)
__ on (____) pursuant to paragraph (a)(1)
__ 75 days after filing pursuant to paragraph (a)(2)
__ on (date) pursuant to paragraph (a)(2) of Rule 485
__ on (____) pursuant to paragraph (b)
__ 60 days after filing pursuant to paragraph (a)(1)
__ on (____) pursuant to paragraph (a)(1)
__ 75 days after filing pursuant to paragraph (a)(2)
__ on (date) pursuant to paragraph (a)(2) of Rule 485
If appropriate,
check the following box:
__ this post-effective amendment designates a new effective date for a previously filed post-effective amendment.
__ this post-effective amendment designates a new effective date for a previously filed post-effective amendment.

PRUDENTIAL INVESTMENTS » MUTUAL FUNDS
Target Asset Allocation Funds
PROSPECTUS • September 28, 2012


Table of Contents
SUMMARY: CONSERVATIVE ALLOCATION FUND
INVESTMENT OBJECTIVE
The investment
objective of the Fund is to seek to provide current income and reasonable level of capital appreciation.
FUND FEES AND
EXPENSES
The tables below
describe the sales charges, fees and expenses that you may pay if you buy and hold shares of the Fund.
You may qualify for
sales charge discounts if you and an eligible group of investors purchase, or agree to purchase in the future, $25,000 or more in shares of the Fund or other funds in the Prudential Investments family of funds. More
information about these discounts is available from your financial professional and is explained in Reducing or Waiving Class A's Initial Sales Charge on page 53 of the Fund's Prospectus and in the Fund's Statement of Additional Information (SAI), in Rights of Accumulation on page 68.
| Shareholder Fees (fees paid directly from your investment) | ||||||
| Class A | Class B | Class C | Class R | Class X | Class Z | |
| Maximum sales charge (load) imposed on purchases (as a percentage of offering price) | 5.50% | None | None | None | None | None |
| Maximum deferred sales charge (load) | 1% | 5% | 1% | None | 6% | None |
| Maximum sales charge (load) imposed on reinvested dividends and other distributions | None | None | None | None | None | None |
| Redemption fee | None | None | None | None | None | None |
| Exchange fee | None | None | None | None | None | None |
| Maximum account fee (accounts under $10,000) | $15 | $15 | $15 | None | $15 | None |
| Annual Fund Operating Expenses (expenses that you pay each year as a percentage of the value of your investment) | ||||||
| Class A | Class B | Class C | Class R | Class X | Class Z | |
| Management fees | .75% | .75% | .75% | .75% | .75% | .75% |
| + Distribution and service (12b-1) fees | .30 | 1.00 | 1.00 | .75 | 1.00 | None |
| + Other expenses | .54 | .54 | .54 | .54 | .54 | .54 |
| = Total annual Fund operating expenses | 1.59 | 2.29 | 2.29 | 2.04 | 2.29 | 1.29 |
| – Fee waiver or expense reimbursement | (.05) | None | None | (.25) | None | None |
| = Net annual Fund operating expenses | 1.54 | 2.29 | 2.29 | 1.79 | 2.29 | 1.29 |
Example. The following hypothetical example is intended to help you compare the cost of investing in the Fund with the cost of investing in other mutual funds. It assumes that you invest $10,000 in
the Fund for the time periods indicated and then, except as indicated, redeem all your shares at the end of those periods. It assumes a 5% return on your investment each year, that the Fund's operating expenses remain
the same and that all dividends and distributions are reinvested. Your actual costs may be higher or lower.
| If Shares Are Redeemed | If Shares Are Not Redeemed | |||||||
| Share Class | 1 Year | 3 Years | 5 Years | 10 Years | 1 Year | 3 Years | 5 Years | 10 Years |
| Class A | $698 | $1,020 | $1,364 | $2,331 | $698 | $1,020 | $1,364 | $2,331 |
| Class B | $732 | $1,015 | $1,325 | $2,368 | $232 | $715 | $1,225 | $2,368 |
| Class C | $332 | $715 | $1,225 | $2,626 | $232 | $715 | $1,225 | $2,626 |
| Class R | $182 | $616 | $1,075 | $2,349 | $182 | $616 | $1,075 | $2,349 |
| Class X | $832 | $1,116 | $1,525 | $2,626 | $232 | $716 | $1,225 | $2,626 |
| Class Z | $131 | $409 | $708 | $1,556 | $131 | $409 | $708 | $1,556 |
° The distributor of the Fund has contractually agreed through November 30, 2013 to reduce its distribution and service (12b-1) fees for Class A shares to an annual rate of .25% of the average
daily net assets of Class A shares and its distribution and service (12b-1) fees for Class R shares to an annual rate of .50% of the average daily net assets of Class R shares. These waivers may not be terminated prior
to November 30, 2013. The decision on whether to renew, modify or terminate the waivers is subject to review by the distributor and the Fund’s Board of Trustees.
| Visit our website at www.prudentialfunds.com | 3 |
Portfolio Turnover. The Fund pays transaction costs, such as commissions, when it buys and sells securities (or “turns over” its portfolio). A higher portfolio turnover rate may indicate higher
transaction costs and may result in higher taxes when Fund shares are held in a taxable account. These costs, which are not reflected in annual fund operating expenses or in the example, affect the Fund's performance.
During the Fund's most recent fiscal year, the Fund's portfolio turnover rate was 248% of the average value of its portfolio.
INVESTMENTS, RISKS
AND PERFORMANCE
Principal Investment
Strategies. The Fund is one of three funds which, together, comprise the Target Asset Allocation Funds. The Funds are designed for investors who want investment professionals to make their asset
allocation decisions in light of their personal investment goals and risk tolerance. Each Fund pursues its investment objective by investing in a mix of equity and fixed-income securities appropriate for a particular
type of investor. Each Fund may serve as the cornerstone of a larger investment portfolio.
The risk/return
balance of each Fund depends upon the proportion of assets it allocates to different types of investments. Higher risk does not always result in higher returns. The Manager (Prudential Investments LLC) has developed an
asset allocation strategy for each Fund designed to provide a mix of investment types and styles that is appropriate for investors with conservative, moderate and aggressive investment orientations.
Each Fund has a
distinct investment objective and is situated differently along the risk/return spectrum, as illustrated in the following table:
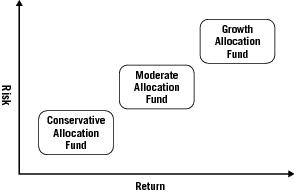
The Target
Conservative Allocation Fund may be appropriate for investors, such as those in early retirement, who need to draw income from investments while obtaining a measure of long-term capital growth as a hedge against
inflation. The Fund’s focus on bonds for greater stability of principal also makes it suitable for conservative investors seeking income and modest growth, especially those concerned about market volatility.
The Manager has
contracted with several subadvisers to manage the assets of the Fund. Each subadviser manages a portion of the Fund’s assets, focusing on a particular type and style of investing. The Manager monitors the
performance of the Fund’s subadvisers and allocates the Fund’s assets among its subadvisers.
The Manager believes
that its asset allocation strategy and multi-subadviser approach will enhance the performance of the Fund and minimize its volatility. First, the Manager has identified a select group of experienced subadvisers.
Although each subadviser will focus the management of its Fund segment on a particular type and style of investing, the Manager believes that the combined efforts of several subadvisers will result in a prudently
diversified Fund. Secondly, the Manager believes that, at any given time, certain investment types and styles will generate higher returns than others. Accordingly, the Manager believes that diversifying the Fund among
a variety of investment types and styles will reduce volatility relative to the price movements of a single asset class.
Please see How the
Funds Invest in this Prospectus for specific information on each subadviser, the Fund segments managed by each subadviser and the allocations among subadvisers as a percentage of long-term investments. The allocations
among subadvisers are reviewed by the Manager periodically, and the allocations among subadvisers may be altered or adjusted by the Manager without prior notice to shareholders. Such adjustments will be reflected in an
annual update to this Prospectus.
| 4 | Target Asset Allocation Funds |
In response to market
developments, the Manager may rebalance the allocation of the Fund’s assets or may add or eliminate Fund segments in accordance with the Fund’s investment objective and the investment policies of the Fund.
Principal Risks of
Investing in the Fund. All investments have risks to some degree. Please remember that an investment in the Fund is not guaranteed to achieve its investment objective; is not a deposit with a bank; is not
insured, endorsed or guaranteed by the Federal Deposit Insurance Corporation or any other government agency; and is subject to investment risks, including possible loss of your original investment.
Recent
Market Events. The equity and debt capital markets in the United States and internationally have experienced unprecedented volatility. The financial crisis has caused a significant decline in the value
and liquidity of many securities. This environment could make identifying investment risks and opportunities especially difficult for the investment subadvisers. These market conditions may continue or get worse. In
response to the crisis, the U.S. and other governments and the Federal Reserve and certain foreign central banks have taken steps to support financial markets. The withdrawal of this support could negatively affect the
value and liquidity of certain securities. In addition, legislation recently enacted in the United States calls for changes in many aspects of financial regulation. The impact of the legislation on the markets, and the
practical implications for market participants, may not be known for some time.
Risk of Increase in
Expenses. Your actual cost of investing in the Fund may be higher than the expenses shown in the expense table for a variety of reasons. For example, expense ratios may be higher than those shown if
average net assets decrease. Net assets are more likely to decrease and Fund expense ratios are more likely to increase when markets are volatile.
Market Risk for Common
Stocks. Since the Fund invests in common stocks, there is the risk that the price of a particular stock owned by the Fund could go down. Generally, the stock price of large companies is more
stable than the stock price of smaller companies, but this is not always the case. In addition to an individual stock losing value, the value of a market sector or of the equity market as a whole could go down. In
addition, different parts of a market can react differently to adverse issuer, market, regulatory, political and economic developments.
Small- and Medium-Size
Company Risk. The Fund invests in stocks of small-size (“small-cap”) companies. In addition, each of the subadvisers that invests in stocks may from time to time invest in stocks of
medium-size (“mid-cap”) companies. Mid-cap companies are similar to those found in the Russell MidCap Index, a market capitalization weighted index of common stocks designed to track the performance of
mid-cap companies. Small- and mid-cap companies usually offer a smaller range of products and services than larger companies. They may also have limited financial resources and may lack management depth. As a result,
the prices of stocks issued by small- and mid-cap companies tend to fluctuate more than the stocks of larger, more established companies.
Style Risk. Since some of the Fund segments focus on either a growth or value style, there is the risk that a particular style may be out of favor for a period of time.
Political Developments. Political developments may adversely affect the value of the Fund’s foreign securities.
Foreign Market Risk. Investing in foreign securities involves more risk than investing in securities of U.S. issuers. Foreign markets—especially emerging markets—tend to be more volatile than U.S.
markets and are generally not subject to regulatory requirements comparable to those in the U.S.
Currency Risk. Changes in currency exchange rates may affect the value of foreign securities held by the Fund and the amount of income available for distribution. If a foreign currency grows weaker
relative to the U.S. dollar, the value of securities denominated in that foreign currency generally decreases in terms of U.S. dollars. If the Fund does not correctly anticipate changes in exchange rates, certain
hedging activities may also cause the Fund to lose money and reduce the amount of income available for distribution.
Derivatives Risk. The Fund may use derivatives including swaps, options and futures as a principal investment strategy to improve its returns or to protect its assets. When used for hedging purposes,
derivatives may not fully offset or match the Fund’s underlying positions and this could result in losses to the Fund that would not otherwise have occurred.
Leverage Risk. The Fund may borrow from banks or through reverse repurchase agreements and dollar rolls to take advantage of investment opportunities. This is known as using “leverage.” If the
Fund borrows money to purchase securities and those securities decline in value, then the value of the Fund’s shares will decline faster than if the Fund were not leveraged.
| Visit our website at www.prudentialfunds.com | 5 |
Management Risk. Actively managed mutual funds are subject to management risk. The subadvisers will apply investment techniques and risk analyses in making investment decisions for the Fund, but there can
be no guarantee that these techniques will produce the desired results. Additionally, the securities selected by the subadvisers may underperform the markets in general, the Fund’s benchmark and other mutual
funds with similar investment objectives.
Liquidity Risk. The risk that the Fund may invest to a greater degree in securities that trade in lower volumes and may make investments that may be less liquid than other investments. Also, the risk that
the Fund may make investments that may become less liquid in response to market developments or adverse investor perceptions. When there is no willing buyer and investments cannot be readily sold at the desired time or
price, the Fund may have to accept a lower price or may not be able to sell the security at all. An inability to sell a portfolio position can adversely affect the Fund’s value or prevent the Fund from being able
to take advantage of other investment opportunities.
Interest Rate Risk. Debt obligations with longer maturities typically offer higher yields, but are subject to greater price shifts as a result of interest rate changes than debt obligations with shorter
maturities. The prices of debt obligations generally move in the opposite direction to that of market interest rates.
Market Risk for Debt Obligations. Debt obligations are subject to market risk, which is the possibility that the market value of an investment may move up or down and that its movement may occur quickly or unpredictably.
Market risk may affect an industry, a sector or the entire market.
Credit Risk. The debt obligations in which the Fund invests are generally subject to the risk that the issuer may be unable to make principal and interest payments when they are due. The Fund may
invest in below-investment-grade securities—also known as “junk bonds”—which have a higher risk of default and tend to be less liquid than higher-rated securities. The Fund may also invest in
debt obligations of foreign issuers. Investing in foreign securities presents additional risks.
Prepayment Risk. The Fund may invest in mortgage-related securities and asset-backed securities, which are subject to prepayment risk. If these securities are prepaid, the Fund may have to replace them
with lower-yielding securities. Stripped mortgage-backed securities are generally more sensitive to changes in prepayment and interest rates than other mortgage-related securities.
Portfolio Turnover Risk. The length of time the Fund has held a particular security is not generally a consideration in investment decisions. Under certain market conditions, the Fund’s turnover rate may be
higher than that of other mutual funds. Portfolio turnover generally involves some expense to the Fund, including brokerage commissions or dealer mark-ups and other transaction costs on the sale of securities and
reinvestment in other securities. These transactions may result in realization of taxable capital gains. The trading costs and tax effects associated with portfolio turnover may adversely affect the Fund’s
investment performance.
For more information
on the risks of investing in this Fund, please see How the Fund Invests—Investment Risks in the Prospectus and Investment Risks and Considerations in the SAI.
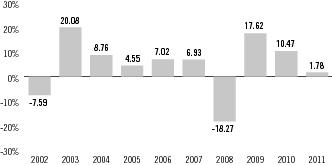
The Fund's Past
Performance. The following bar chart shows the Fund's performance for the indicated share class for each full calendar year of operations or for the last 10 calendar years, whichever is shorter. The
bar chart and Average Annual Total Returns table demonstrate the risk of investing in the Fund by showing how returns can change from year to year and by showing how the Fund's average annual total returns for the
share class compare with a broad-based securities market index and a group of similar mutual funds.
Past performance
(before and after taxes) does not mean that the Fund will achieve similar results in the future. Updated Fund performance information is available online at www.prudentialfunds.com.
| 6 | Target Asset Allocation Funds |
| Annual Total Returns % (Class A Shares)1 |
|
1 These annual total returns do not include sales charges. If the sales charges were included, the annual total returns would be lower than those shown. Without the
distribution and service (12b-1) fee waiver, the annual returns would have been lower, too. The total return for Class A shares from 1/1/12—6/30/12 was 6.12%.
| Best Quarter: | Worst Quarter: | ||
| 9.80% | 3rd Quarter 2009 | -7.94% | 4th Quarter 2008 |
| Average Annual Total Returns % (as of 12-31-11) | ||||
| Return Before Taxes | One Year | Five Years | Ten Years | Since Inception |
| Class B shares | -3.92 | 1.99 | 3.78 | — |
| Class C shares | -0.02 | 2.14 | 3.77 | — |
| Class R shares | 1.54 | 2.67 | N/A | 4.04 (10/4/04) |
| Class X shares | -4.92 | 1.70 | N/A | 3.44 (10/4/04) |
| Class Z shares | 2.01 | 3.19 | 4.83 | — |
| Class A Shares % | ||||
| Return Before Taxes | -3.82 | 1.78 | 3.96 | — |
| Return After Taxes on Distributions | -4.22 | 0.73 | 2.77 | — |
| Return After Taxes on Distribution and Sale of Fund Shares | -2.33 | 1.01 | 2.83 | — |
° After-tax returns are calculated using the historical highest individual federal marginal income tax rates and do not reflect the impact of state and local taxes. Actual after-tax returns
depend on an investor’s tax situation and may differ from those shown. After-tax returns shown are not relevant to investors who hold their Fund shares through tax deferred arrangements, such as 401(k) plans or
individual retirement accounts. After-tax returns are shown only for Class A shares. After-tax returns for other classes will vary due to differing sales charges and expenses.
| Index % (reflects no deduction for fees, expenses or taxes) | ||||
| Customized Blend Index | 5.43 | 4.33 | 5.24 | — |
| S&P 500 Index | 2.09 | -0.25 | 2.92 | — |
| Lipper Mixed-Asset Target Allocation Conservative Funds Average | 2.06 | 2.88 | 4.05 | — |
MANAGEMENT OF THE
FUND
| Investment Manager | Subadviser | Portfolio Managers | Title | Service Date |
| Prudential Investments LLC | Eagle Asset Management, Inc. | Bert L. Boksen, CFA | Senior Vice President & Managing Director | July 2008 |
| Eric Mintz, CFA | Co-Portfolio Manager | July 2008 | ||
| EARNEST Partners, LLC | Paul E. Viera, Jr. | Chief Executive Officer & Partner | December 2001 | |
| Epoch Investment Partners, Inc. | David N. Pearl | Executive Vice President, Co-Chief Investment Officer & Portfolio Manager | July 2012 | |
| Janet K. Navon | Managing Director, Portfolio Manager & Director of Research | July 2012 |
| Visit our website at www.prudentialfunds.com | 7 |
| Investment Manager | Subadviser | Portfolio Managers | Title | Service Date |
| Michael A. Welhoelter, CFA | Managing Director, Chief Risk Officer & Portfolio Manager | July 2012 | ||
| Hotchkis and Wiley Capital Management, LLC | Sheldon Lieberman | Principal & Portfolio Manager | April 2005 | |
| George Davis | Principal & CEO | April 2005 | ||
| Scott McBride | Portfolio Manager | February 2009 | ||
| Patricia McKenna | Principal & Portfolio Manager | April 2005 | ||
| Judd Peters | Portfolio Manager | February 2009 | ||
| Marsico Capital Management, LLC | Thomas F. Marsico | Portfolio Manager, CIO, & CEO | June 2005 | |
| Coralie Witter, CFA | Senior Analyst & Portfolio Manager | February 2011 | ||
| Massachusetts Financial Services Company | Eric B. Fischman | Investment Officer | January 2011 | |
| NFJ Investment Group LLC | Ben Fischer, CFA | Managing Director, Portfolio Manager | December 2005 | |
| Tom Oliver, CPA, CFA | Managing Director, Portfolio Manager | September 2008 | ||
| Paul Magnuson | Managing Director, Portfolio Manager | December 2005 | ||
| R. Burns McKinney, CFA | Managing Director, Portfolio Manager | September 2010 | ||
| Jeff Reed, CFA | Vice President, Portfolio Manager | February 2011 | ||
| Pacific Investment Management Company LLC | Chris Dialynas | Managing Director | May 2000 | |
| Vaughan Nelson Investment Management, L.P. | Chris D. Wallis, CFA | Senior Portfolio Manager | July 2005 | |
| Scott Weber | Portfolio Manager | July 2005 |
BUYING AND SELLING
FUND SHARES
| Minimum Initial Investment | Minimum Subsequent Investment | |
| Fund shares (most cases) | $2,500 | $100 |
| Retirement accounts and custodial accounts for minors | $1,000 | $100 |
| Automatic Investment Plan (AIP) | $50 | $50 |
You
can purchase or redeem shares through the Fund's transfer agent or through servicing agents, including brokers, dealers and other financial intermediaries appointed by the distributor to receive purchase and redemption
orders. Current shareholders may also purchase or redeem shares through the Fund's website or by calling (800) 225-1852.
TAX INFORMATION
Dividends, Capital Gains
and Taxes. The Fund's dividends and distributions are taxable and will be taxed as ordinary income or capital gains, unless you are investing through a tax-deferred arrangement, such as a 401(k) plan
or an individual retirement account. Such tax-deferred arrangements may be taxed later upon withdrawal of monies from those arrangements.
FINANCIAL
INTERMEDIARY COMPENSATION
Potential Conflicts of
Interest. If you purchase Fund shares through a financial services firm, the Fund, the Manager, or their related companies may pay the financial services firm for the sale of Fund shares and/or for
services to shareholders. These payments may create a conflict of interest by influencing the financial services firm or the firm's representatives to recommend the Fund over another investment. Ask your financial
services firm or representative for more information or visit your financial services firm's website.
| 8 | Target Asset Allocation Funds |
SUMMARY: MODERATE ALLOCATION FUND
INVESTMENT OBJECTIVE
The investment
objective of Fund is to seek to provide capital appreciation and a reasonable level of current income.
FUND FEES AND
EXPENSES
The tables below
describe the sales charges, fees and expenses that you may pay if you buy and hold shares of the Fund.
You may qualify for
sales charge discounts if you and an eligible group of investors purchase, or agree to purchase in the future, $25,000 or more in shares of the Fund or other funds in the Prudential Investments family of funds. More
information about these discounts is available from your financial professional and is explained in Reducing or Waiving Class A's Initial Sales Charge on page 53 of the Fund's Prospectus and in the Fund's Statement of Additional Information (SAI), in Rights of Accumulation on page 68.
| Shareholder Fees (fees paid directly from your investment) | ||||||
| Class A | Class B | Class C | Class R | Class X | Class Z | |
| Maximum sales charge (load) imposed on purchases (as a percentage of offering price) | 5.50% | None | None | None | None | None |
| Maximum deferred sales charge (load) | 1% | 5% | 1% | None | 6% | None |
| Maximum sales charge (load) imposed on reinvested dividends and other distributions | None | None | None | None | None | None |
| Redemption fee | None | None | None | None | None | None |
| Exchange fee | None | None | None | None | None | None |
| Maximum account fee (accounts under $10,000) | $15 | $15 | $15 | None | $15 | None |
| Annual Fund Operating Expenses (expenses that you pay each year as a percentage of the value of your investment) | ||||||
| Class A | Class B | Class C | Class R | Class X | Class Z | |
| Management fees | .75% | .75% | .75% | .75% | .75% | .75% |
| + Distribution and service (12b-1) fees | .30 | 1.00 | 1.00 | .75 | 1.00 | None |
| + Other expenses | .41 | .41 | .41 | .41 | .41 | .41 |
| = Total annual Fund operating expenses | 1.46 | 2.16 | 2.16 | 1.91 | 2.16 | 1.16 |
| – Fee waiver or expense reimbursement | (.05) | None | None | (.25) | None | None |
| = Net annual Fund operating expenses | 1.41 | 2.16 | 2.16 | 1.66 | 2.16 | 1.16 |
Example. The following hypothetical example is intended to help you compare the cost of investing in the Fund with the cost of investing in other mutual funds. It assumes that you invest $10,000 in
the Fund for the time periods indicated and then, except as indicated, redeem all your shares at the end of those periods. It assumes a 5% return on your investment each year, that the Fund's operating expenses remain
the same and that all dividends and distributions are reinvested. Your actual costs may be higher or lower.
| If Shares Are Redeemed | If Shares Are Not Redeemed | |||||||
| Share Class | 1 Year | 3 Years | 5 Years | 10 Years | 1 Year | 3 Years | 5 Years | 10 Years |
| Class A | $686 | $982 | $1,299 | $2,196 | $686 | $982 | $1,299 | $2,196 |
| Class B | $719 | $976 | $1,259 | $2,232 | $219 | $676 | $1,159 | $2.232 |
| Class C | $319 | $676 | $1,159 | $2,493 | $219 | $676 | $1,159 | $2,493 |
| Class R | $169 | $576 | $1,008 | $2,212 | $169 | $576 | $1,008 | $2,212 |
| Class X | $819 | $1,076 | $1,459 | $2,493 | $219 | $676 | $1,159 | $2,493 |
| Class Z | $118 | $368 | $638 | $1,409 | $118 | $368 | $638 | $1,409 |
° The distributor of the Fund has contractually agreed through November 30, 2013 to reduce its distribution and service (12b-1) fees for Class A shares to an annual rate of .25% of the average
daily net assets of Class A shares and its distribution and service (12b-1) fees for Class R shares to an annual rate of .50% of the average daily net assets of Class R shares. These waivers may not be terminated prior
to November 30, 2013. The decision on whether to renew, modify or terminate the waivers is subject to review by the distributor and the Fund’s Board of Trustees.
| Visit our website at www.prudentialfunds.com | 9 |
Portfolio Turnover. The Fund pays transaction costs, such as commissions, when it buys and sells securities (or “turns over” its portfolio). A higher portfolio turnover rate may indicate higher
transaction costs and may result in higher taxes when Fund shares are held in a taxable account. These costs, which are not reflected in annual fund operating expenses or in the example, affect the Fund's performance.
During the Fund's most recent fiscal year, the Fund's portfolio turnover rate was 174% of the average value of its portfolio.
INVESTMENTS, RISKS
AND PERFORMANCE
Principal Investment
Strategies. The Fund is one of three funds which, together, comprise the Target Asset Allocation Funds. The Funds are designed for investors who want investment professionals to make their asset
allocation decisions in light of their personal investment goals and risk tolerance. Each Fund pursues its investment objective by investing in a mix of equity and fixed-income securities appropriate for a particular
type of investor. Each Fund may serve as the cornerstone of a larger investment portfolio.
The risk/return
balance of each Fund depends upon the proportion of assets it allocates to different types of investments. Higher risk does not always result in higher returns. The Manager (Prudential Investments LLC) has developed an
asset allocation strategy for each Fund designed to provide a mix of investment types and styles that is appropriate for investors with conservative, moderate and aggressive investment orientations.
Each Fund has a
distinct investment objective and is situated differently along the risk/return spectrum, as illustrated in the following table:
The Target Moderate
Allocation Fund may be appropriate for investors looking for a balance of long-term capital growth and current income (e.g., investors in their 50s who are saving on a regular basis for retirement and who plan to
retire in their early to mid 60s). The Fund offers a diversified approach to equities for long-term growth, but will normally maintain a substantial component of fixed-income securities to provide current income and a
measure of stability.
The Manager has
contracted with several subadvisers to manage the assets of the Fund. Each subadviser manages a portion of the Fund’s assets, focusing on a particular type and style of investing. The Manager monitors the
performance of the Fund’s subadvisers and allocates the Fund’s assets among its subadvisers.
The Manager believes
that its asset allocation strategy and multi-subadviser approach will enhance the performance of the Fund and minimize its volatility. First, the Manager has identified a select group of experienced subadvisers.
Although each subadviser will focus the management of its Fund segment on a particular type and style of investing, the Manager believes that the combined efforts of several subadvisers will result in a prudently
diversified Fund. Secondly, the Manager believes that, at any given time, certain investment types and styles will generate higher returns than others. Accordingly, the Manager believes that diversifying the Fund among
a variety of investment types and styles will reduce volatility relative to the price movements of a single asset class.
Please see How the
Funds Invest in this Prospectus for specific information on each subadviser, the Fund segments managed by each subadviser and the allocations among subadvisers as a percentage of long-term investments. The allocations
among subadvisers are reviewed by the Manager periodically, and the allocations among subadvisers may be altered or adjusted by the Manager without prior notice to shareholders. Such adjustments will be reflected in an
annual update to this Prospectus.
| 10 | Target Asset Allocation Funds |
In response to market
developments, the Manager may rebalance the allocation of the Fund’s assets or may add or eliminate Fund segments in accordance with the Fund’s investment objective and the investment policies of the Fund.
Principal Risks of
Investing in the Fund. All investments have risks to some degree. Please remember that an investment in the Fund is not guaranteed to achieve its investment objective; is not a deposit with a bank; is not
insured, endorsed or guaranteed by the Federal Deposit Insurance Corporation or any other government agency; and is subject to investment risks, including possible loss of your original investment.
Recent
Market Events. The equity and debt capital markets in the United States and internationally have experienced unprecedented volatility. The financial crisis has caused a significant decline in the value
and liquidity of many securities. This environment could make identifying investment risks and opportunities especially difficult for the investment subadvisers. These market conditions may continue or get worse. In
response to the crisis, the U.S. and other governments and the Federal Reserve and certain foreign central banks have taken steps to support financial markets. The withdrawal of this support could negatively affect the
value and liquidity of certain securities. In addition, legislation recently enacted in the United States calls for changes in many aspects of financial regulation. The impact of the legislation on the markets, and the
practical implications for market participants, may not be known for some time.
Risk of Increase in
Expenses. Your actual cost of investing in the Fund may be higher than the expenses shown in the expense table for a variety of reasons. For example, expense ratios may be higher than those shown if
average net assets decrease. Net assets are more likely to decrease and Fund expense ratios are more likely to increase when markets are volatile.
Market Risk for Common
Stocks. Since the Fund invests in common stocks, there is the risk that the price of a particular stock owned by the Fund could go down. Generally, the stock price of large companies is more
stable than the stock price of smaller companies, but this is not always the case. In addition to an individual stock losing value, the value of a market sector or of the equity market as a whole could go down. In
addition, different parts of a market can react differently to adverse issuer, market, regulatory, political and economic developments.
Small- and Medium-Size
Company Risk. The Fund invests in stocks of small-size (“small-cap”) companies. In addition, each of the subadvisers that invests in stocks may from time to time invest in stocks of
medium-size (“mid-cap”) companies. Mid-cap companies are similar to those found in the Russell MidCap Index, a market capitalization weighted index of common stocks designed to track the performance of
mid-cap companies. Small- and mid-cap companies usually offer a smaller range of products and services than larger companies. They may also have limited financial resources and may lack management depth. As a result,
the prices of stocks issued by small- and mid-cap companies tend to fluctuate more than the stocks of larger, more established companies.
Style Risk. Since some of the Fund segments focus on either a growth or value style, there is the risk that a particular style may be out of favor for a period of time.
Political Developments. Political developments may adversely affect the value of the Fund’s foreign securities.
Foreign Market Risk. Investing in foreign securities involves more risk than investing in securities of U.S. issuers. Foreign markets—especially emerging markets—tend to be more volatile than U.S.
markets and are generally not subject to regulatory requirements comparable to those in the U.S.
Currency Risk. Changes in currency exchange rates may affect the value of foreign securities held by the Fund and the amount of income available for distribution. If a foreign currency grows weaker
relative to the U.S. dollar, the value of securities denominated in that foreign currency generally decreases in terms of U.S. dollars. If the Fund does not correctly anticipate changes in exchange rates, certain
hedging activities may also cause the Fund to lose money and reduce the amount of income available for distribution.
Derivatives Risk. The Fund may use derivatives including swaps, options and futures as a principal investment strategy to improve its returns or to protect its assets. When used for hedging purposes,
derivatives may not fully offset or match the Fund’s underlying positions and this could result in losses to the Fund that would not otherwise have occurred.
Leverage Risk. The Fund may borrow from banks or through reverse repurchase agreements and dollar rolls to take advantage of investment opportunities. This is known as using “leverage.” If
the Fund borrows money to purchase securities and those securities decline in value, then the value of the Fund’s shares will decline faster than if the Fund were not leveraged.
| Visit our website at www.prudentialfunds.com | 11 |
Management Risk. Actively managed mutual funds are subject to management risk. The subadvisers will apply investment techniques and risk analyses in making investment decisions for the Fund, but there can
be no guarantee that these techniques will produce the desired results. Additionally, the securities selected by the subadvisers may underperform the markets in general, the Fund’s benchmark and other mutual
funds with similar investment objectives.
Liquidity Risk. The risk that the Fund may invest to a greater degree in securities that trade in lower volumes and may make investments that may be less liquid than other investments. Also, the risk
that a Fund may make investments that may become less liquid in response to market developments or adverse investor perceptions. When there is no willing buyer and investments cannot be readily sold at the desired time
or price, the Fund may have to accept a lower price or may not be able to sell the security at all. An inability to sell a portfolio position can adversely affect the Fund’s value or prevent the Fund from being
able to take advantage of other investment opportunities.
Interest Rate Risk. Debt obligations with longer maturities typically offer higher yields, but are subject to greater price shifts as a result of interest rate changes than debt obligations with shorter
maturities. The prices of debt obligations generally move in the opposite direction to that of market interest rates.
Market Risk for Debt
Obligations. Debt obligations are also subject to market risk, which is the possibility that the market value of an investment may move up or down and that its movement may occur quickly or
unpredictably. Market risk may affect an industry, a sector or the entire market.
Credit Risk. The debt obligations in which the Fund invests are generally subject to the risk that the issuer may be unable to make principal and interest payments when they are due. The Fund may
invest in below-investment-grade securities—also known as “junk bonds”—which have a higher risk of default and tend to be less liquid than higher-rated securities. The Fund may also invest in
debt obligations of foreign issuers. Investing in foreign securities presents additional risks.
Prepayment Risk. The Fund may invest in mortgage-related securities and asset-backed securities, which are subject to prepayment risk. If these securities are prepaid, the Fund may have to replace them
with lower-yielding securities. Stripped mortgage-backed securities are generally more sensitive to changes in prepayment and interest rates than other mortgage-related securities.
Portfolio Turnover Risk. The length of time the Fund has held a particular security is not generally a consideration in investment decisions. Under certain market conditions, the Fund’s turnover rate may be
higher than that of other mutual funds. Portfolio turnover generally involves some expense to the Fund, including brokerage commissions or dealer mark-ups and other transaction costs on the sale of securities and
reinvestment in other securities. These transactions may result in realization of taxable capital gains. The trading costs and tax effects associated with portfolio turnover may adversely affect the Fund’s
investment performance.
For more information
on the risks of investing in this Fund, please see How the Fund Invests—Investment Risks in the Prospectus and Investment Risks and Considerations in the SAI.
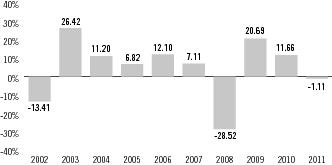
The Fund's Past
Performance. The following bar chart shows the Fund's performance for the indicated share class for each full calendar year of operations or for the last 10 calendar years, whichever is shorter. The
bar chart and Average Annual Total Returns table demonstrate the risk of investing in the Fund by showing how returns can change from year to year and by showing how the Fund's average annual total returns for the
share class compare with a broad-based securities market index and a group of similar mutual funds.
Past performance
(before and after taxes) does not mean that the Fund will achieve similar results in the future. Updated Fund performance information is available online at www.prudentialfunds.com.
| 12 | Target Asset Allocation Funds |
| Annual Total Returns % (Class A Shares)1 |
|
1 These annual total returns do not include sales charges. If the sales charges were included, the annual total returns would be lower than those shown. Without the
distribution and service (12b-1) fee waiver, the annual returns would have been lower, too. The total return for Class A shares from 1/1/12—6/30/12 was 5.80%.
| Best Quarter: | Worst Quarter: | ||
| 12.96% | 2nd Quarter 2003 | -13.86% | 4th Quarter 2008 |
| Average Annual Total Returns % (as of 12-31-11) | ||||
| Return Before Taxes | One Year | Five Year | Ten Years | Since Inception |
| Class B shares | -6.86 | -0.53 | 3.27 | — |
| Class C shares | -2.86 | -0.36 | 3.27 | — |
| Class R shares | -1.37 | 0.15 | N/A | 3.53 (10/4/04) |
| Class X shares | -6.99 | -0.54 | N/A | 3.15 (10/4/04) |
| Class Z shares | -0.95 | 0.64 | 4.29 | — |
| Class A Shares % | ||||
| Return Before Taxes | -6.55 | -0.73 | 3.46 | — |
| Return After Taxes on Distributions | -6.70 | -1.42 | 2.74 | — |
| Return After Taxes on Distributions and Sale of Fund Shares | -4.07 | -0.80 | 2.81 | — |
° After-tax returns are calculated using the historical highest individual federal marginal income tax rates and do not reflect the impact of state and local taxes. Actual after-tax returns
depend on an investor’s tax situation and may differ from those shown. After-tax returns shown are not relevant to investors who hold their Fund shares through tax deferred arrangements, such as 401(k) plans or
individual retirement accounts. After-tax returns are shown only for Class A shares. After-tax returns for other classes will vary due to differing sales charges and expenses.
| Index % (reflects no deduction for fees, expenses or taxes) | ||||
| Customized Blend Index | 1.89 | 2.09 | 4.84 | — |
| S&P 500 Index | 2.09 | -0.25 | 2.92 | — |
| Lipper Mixed-Asset Target Allocation Growth Funds Average | -1.30 | 0.63 | 3.80 | — |
MANAGEMENT OF THE
FUND
| Investment Manager | Subadviser | Portfolio Managers | Title | Service Date |
| Prudential Investments LLC | Eagle Asset Management, Inc. | Bert L. Boksen, CFA | Senior Vice President & Managing Director | July 2008 |
| Eric Mintz, CFA | Co-Portfolio Manager | July 2008 | ||
| EARNEST Partners, LLC | Paul E. Viera, Jr. | Chief Executive Officer & Partner | December 2001 | |
| Epoch Investment Partners, Inc. | David N. Pearl | Executive Vice President, Co-Chief Investment Officer & Portfolio Manager | July 2012 | |
| Janet K. Navon | Managing Director, Portfolio Manager & Director of Research | July 2012 |
| Visit our website at www.prudentialfunds.com | 13 |
| Investment Manager | Subadviser | Portfolio Managers | Title | Service Date |
| Michael A. Welhoelter, CFA | Managing Director, Chief Risk Officer & Portfolio Manager | July 2012 | ||
| Hotchkis and Wiley Capital Management, LLC | Sheldon Lieberman | Principal & Portfolio Manager | April 2005 | |
| George Davis | Principal & CEO | April 2005 | ||
| Scott McBride | Portfolio Manager | February 2009 | ||
| Patricia McKenna | Principal & Portfolio Manager | April 2005 | ||
| Judd Peters | Portfolio Manager | February 2009 | ||
| LSV Asset Management | Josef Lakonishok | CEO, CIO, Partner & Portfolio Manager | April 2005 | |
| Menno Vermuelen, CFA | Partner, Portfolio Manager & Senior Quantitative Analyst | April 2005 | ||
| Puneet Mansharamani, CFA | Partner, Portfolio Manager & Senior Quantitative Analyst | January 2006 | ||
| Marsico Capital Management, LLC | Thomas F. Marsico | Portfolio Manager, CIO, & CEO | June 2005 | |
| Coralie Witter, CFA | Senior Analyst & Portfolio Manager | February 2011 | ||
| Massachusetts Financial Services Company | Eric B. Fischman | Investment Officer | January 2011 | |
| NFJ Investment Group LLC | Ben Fischer, CFA | Managing Director, Portfolio Manager | December 2005 | |
| Tom Oliver, CPA, CFA | Managing Director, Portfolio Manager | September 2008 | ||
| Paul Magnuson | Managing Director, Portfolio Manager | December 2005 | ||
| R. Burns McKinney, CFA | Managing Director, Portfolio Manager | September 2010 | ||
| Jeff Reed, CFA | Vice President, Portfolio Manager | February 2011 | ||
| Pacific Investment Management Company LLC | Chris Dialynas | Managing Director | May 2000 | |
| Thornburg Investment Management, Inc. | William V. Fries, CFA | Managing Director | April 2005 | |
| Wendy Trevisani | Managing Director | April 2005 | ||
| Lei Wang, CFA | Managing Director | February 2006 | ||
| Vaughan Nelson Investment Management, L.P. | Chris D. Wallis, CFA | Senior Portfolio Manager | July 2005 | |
| Scott Weber | Portfolio Manager | July 2005 |
BUYING AND SELLING
FUND SHARES
| Minimum Initial Investment | Minimum Subsequent Investment | |
| Fund shares (most cases) | $2,500 | $100 |
| Retirement accounts and custodial accounts for minors | $1,000 | $100 |
| Automatic Investment Plan (AIP) | $50 | $50 |
You
can purchase or redeem shares through the Fund's transfer agent or through servicing agents, including brokers, dealers and other financial intermediaries appointed by the distributor to receive purchase and redemption
orders. Current shareholders may also purchase or redeem shares through the Fund's website or by calling (800) 225-1852.
| 14 | Target Asset Allocation Funds |
TAX INFORMATION
Dividends, Capital Gains
and Taxes. The Fund's dividends and distributions are taxable and will be taxed as ordinary income or capital gains, unless you are investing through a tax-deferred arrangement, such as a 401(k) plan
or an individual retirement account. Such tax-deferred arrangements may be taxed later upon withdrawal of monies from those arrangements.
FINANCIAL
INTERMEDIARY COMPENSATION
Potential Conflicts of
Interest. If you purchase Fund shares through a financial services firm, the Fund, the Manager, or their related companies may pay the financial services firm for the sale of Fund shares and/or for
services to shareholders. These payments may create a conflict of interest by influencing the financial services firm or the firm's representatives to recommend the Fund over another investment. Ask your financial
services firm or representative for more information or visit your financial services firm's website.
| Visit our website at www.prudentialfunds.com | 15 |
SUMMARY: GROWTH ALLOCATION FUND
INVESTMENT OBJECTIVE
The investment
objective of the Fund is to seek to provide long-term capital appreciation.
FUND FEES AND
EXPENSES
The tables below
describe the sales charges, fees and expenses that you may pay if you buy and hold shares of the Fund.
You may qualify for
sales charge discounts if you and an eligible group of investors purchase, or agree to purchase in the future, $25,000 or more in shares of the Fund or other funds in the Prudential Investments family of funds. More
information about these discounts is available from your financial professional and is explained in Reducing or Waiving Class A's Initial Sales Charge on page 53 of the Fund's Prospectus and in the Fund's Statement of Additional Information (SAI), in Rights of Accumulation on page 68.
| Shareholder Fees (fees paid directly from your investment) | ||||||
| Class A | Class B | Class C | Class R | Class X | Class Z | |
| Maximum sales charge (load) imposed on purchases (as a percentage of offering price) | 5.50% | None | None | None | None | None |
| Maximum deferred sales charge (load) | 1% | 5% | 1% | None | 6% | None |
| Maximum sales charge (load) imposed on reinvested dividends and other distributions | None | None | None | None | None | None |
| Redemption fee | None | None | None | None | None | None |
| Exchange fee | None | None | None | None | None | None |
| Maximum account fee (accounts under $10,000) | $15 | $15 | $15 | None | $15 | None |
| Annual Fund Operating Expenses (expenses that you pay each year as a percentage of the value of your investment) | ||||||
| Class A | Class B | Class C | Class R | Class X | Class Z | |
| Management fees | .75% | .75% | .75% | .75% | .75% | .75% |
| + Distribution and service (12b-1) fees | .30 | 1.00 | 1.00 | .75 | 1.00 | None |
| + Other expenses | .55 | .55 | .55 | .55 | .55 | .55 |
| = Total annual Fund operating expenses | 1.60 | 2.30 | 2.30 | 2.05 | 2.30 | 1.30 |
| – Fee waiver or expense reimbursement | (.05) | None | None | (.25) | None | None |
| = Net annual Fund operating expenses | 1.55 | 2.30 | 2.30 | 1.80 | 2.30 | 1.30 |
Example. The following hypothetical example is intended to help you compare the cost of investing in the Fund with the cost of investing in other mutual funds. It assumes that you invest $10,000 in
the Fund for the time periods indicated and then, except as indicated, redeem all your shares at the end of those periods. It assumes a 5% return on your investment each year, that the Fund's operating expenses remain
the same and that all dividends and distributions are reinvested. Your actual costs may be higher or lower.
| If Shares Are Redeemed | If Shares Are Not Redeemed | |||||||
| Share Class | 1 Year | 3 Years | 5 Years | 10 Years | 1 Year | 3 Years | 5 Years | 10 Years |
| Class A | $699 | $1,023 | $1,368 | $2,342 | $699 | $1,023 | $1,368 | $2,342 |
| Class B | $733 | $1,018 | $1,330 | $2,378 | $233 | $718 | $1,230 | $2,378 |
| Class C | $333 | $718 | $1,230 | $2,636 | $233 | $718 | $1,230 | $2,636 |
| Class R | $183 | $619 | $1,080 | $2,359 | $183 | $619 | $1,080 | $2,359 |
| Class X | $833 | $1,118 | $1,530 | $2,636 | $233 | $718 | $1,230 | $2,636 |
| Class Z | $132 | $412 | $713 | $1,568 | $132 | $412 | $713 | $1,568 |
° The distributor of the Fund has contractually agreed through November 30, 2013 to reduce its distribution and service (12b-1) fees for Class A shares to an annual rate of .25% of the average
daily net assets of Class A shares and its distribution and service (12b-1) fees for Class R shares to an annual rate of .50% of the average daily net assets of Class R shares. These waivers may not be terminated prior
to November 30, 2013. The decision on whether to renew, modify or terminate the waivers is subject to review by the distributor and the Fund’s Board of Trustees.
| 16 | Target Asset Allocation Funds |
Portfolio Turnover. The Fund pays transaction costs, such as commissions, when it buys and sells securities (or “turns over” its portfolio). A higher portfolio turnover rate may indicate higher
transaction costs and may result in higher taxes when Fund shares are held in a taxable account. These costs, which are not reflected in annual fund operating expenses or in the example, affect the Fund's performance.
During the Fund's most recent fiscal year, the Fund's portfolio turnover rate was 68% of the average value of its portfolio.
INVESTMENTS, RISKS
AND PERFORMANCE
Principal Investment
Strategies. The Fund is one of three funds which, together, comprise the Target Asset Allocation Funds. The Funds are designed for investors who want investment professionals to make their asset
allocation decisions in light of their personal investment goals and risk tolerance. Each Fund pursues its investment objective by investing in a mix of equity and fixed-income securities appropriate for a particular
type of investor. Each Fund may serve as the cornerstone of a larger investment portfolio.
The risk/return
balance of each Fund depends upon the proportion of assets it allocates to different types of investments. Higher risk does not always result in higher returns. The Manager (Prudential Investments LLC) has developed an
asset allocation strategy for each Fund designed to provide a mix of investment types and styles that is appropriate for investors with conservative, moderate and aggressive investment orientations.
Each Fund has a
distinct investment objective and is situated differently along the risk/return spectrum, as illustrated in the following table:
The Target Growth
Allocation Fund may be appropriate for investors seeking long-term capital growth. In addition, investors who already have a diversified portfolio may find this allocation suitable as an additional growth component
(e.g., investors in their 20s, 30s or 40s who are saving for retirement and who plan to retire in their early to mid 60s).
Principal Risks of
Investing in the Fund. All investments have risks to some degree. Please remember that an investment in the Fund is not guaranteed to achieve its investment objective; is not a deposit with a bank; is not
insured, endorsed or guaranteed by the Federal Deposit Insurance Corporation or any other government agency; and is subject to investment risks, including possible loss of your original investment.
Recent
Market Events. The equity and debt capital markets in the United States and internationally have experienced unprecedented volatility. The financial crisis has caused a significant decline in the value
and liquidity of many securities. This environment could make identifying investment risks and opportunities especially difficult for the investment subadvisers. These market conditions may continue or get worse. In
response to the crisis, the U.S. and other governments and the Federal Reserve and certain foreign central banks have taken steps to support financial markets. The withdrawal of this support could negatively affect the
value and liquidity of certain securities. In addition, legislation recently enacted in the United States calls for changes in many aspects of financial regulation. The impact of the legislation on the markets, and the
practical implications for market participants, may not be known for some time.
Risk of Increase in
Expenses. Your actual cost of investing in the Fund may be higher than the expenses shown in the expense table for a variety of reasons. For example, expense ratios may be higher than those shown if
average net assets decrease. Net assets are more likely to decrease and Fund expense ratios are more likely to increase when markets are volatile.
| Visit our website at www.prudentialfunds.com | 17 |
Market Risk for Common
Stocks. Since the Fund invests in common stocks, there is the risk that the price of a particular stock owned by the Fund could go down. Generally, the stock price of large companies is more
stable than the stock price of smaller companies, but this is not always the case. In addition to an individual stock losing value, the value of a market sector or of the equity market as a whole could go down. In
addition, different parts of a market can react differently to adverse issuer, market, regulatory, political and economic developments.
Small- and Medium-Size
Company Risk. The Fund invests in stocks of small-size (“small-cap”) companies. In addition, each of the subadvisers that invests in stocks may from time to time invest in stocks of
medium-size (“mid-cap”) companies. Mid-cap companies are similar to those found in the Russell MidCap Index, a market capitalization weighted index of common stocks designed to track the performance of
mid-cap companies. Small- and mid-cap companies usually offer a smaller range of products and services than larger companies. They may also have limited financial resources and may lack management depth. As a result,
the prices of stocks issued by small- and mid-cap companies tend to fluctuate more than the stocks of larger, more established companies.
Style Risk. Since some of the Fund segments focus on either a growth or value style, there is the risk that a particular style may be out of favor for a period of time.
Political Developments. Political developments may adversely affect the value of the Fund’s foreign securities.
Foreign Market Risk. Investing in foreign securities involves more risk than investing in securities of U.S. issuers. Foreign markets—especially emerging markets—tend to be more volatile than U.S.
markets and are generally not subject to regulatory requirements comparable to those in the U.S.
Currency Risk. Changes in currency exchange rates may affect the value of foreign securities held by the Fund and the amount of income available for distribution. If a foreign currency grows weaker
relative to the U.S. dollar, the value of securities denominated in that foreign currency generally decreases in terms of U.S. dollars. If the Fund does not correctly anticipate changes in exchange rates, certain
hedging activities may also cause the Fund to lose money and reduce the amount of income available for distribution.
Derivatives Risk. The Fund may use derivatives including swaps, options and futures as a principal investment strategy to improve its returns or to protect its assets. When used for hedging purposes,
derivatives may not fully offset or match the Fund’s underlying positions and this could result in losses to the Fund that would not otherwise have occurred.
Leverage Risk. The Fund may borrow from banks or through reverse repurchase agreements and dollar rolls to take advantage of investment opportunities. This is known as using “leverage.” If
the Fund borrows money to purchase securities and those securities decline in value, then the value of the Fund’s shares will decline faster than if the Fund were not leveraged.
Management Risk. Actively managed mutual funds are subject to management risk. The subadvisers will apply investment techniques and risk analyses in making investment decisions for the Fund, but there can
be no guarantee that these techniques will produce the desired results. Additionally, the securities selected by the subadvisers may underperform the markets in general, the Fund’s benchmark and other mutual
funds with similar investment objectives.
Liquidity Risk. The risk that the Fund may invest to a greater degree in securities that trade in lower volumes and may make investments that may be less liquid than other investments. Also, the risk that
the Fund may make investments that may become less liquid in response to market developments or adverse investor perceptions. When there is no willing buyer and investments cannot be readily sold at the desired time or
price, the Fund may have to accept a lower price or may not be able to sell the security at all. An inability to sell a portfolio position can adversely affect the Fund’s value or prevent the Fund from being able
to take advantage of other investment opportunities.
For more information
on the risks of investing in this Fund, please see How the Fund Invests—Investment Risks in the Prospectus and Investment Risks and Considerations in the SAI.
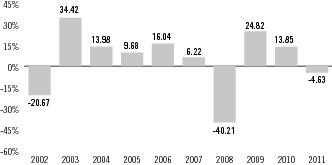
The Fund's Past
Performance. The following bar chart shows the Fund's performance for the indicated share class for each full calendar year of operations or for the last 10 calendar years, whichever is shorter. The
bar chart and Average Annual Total Returns table demonstrate the risk of investing in the Fund by showing how returns can change from year to year and by showing how the Fund's average annual total returns for the
share class compare with a broad-based securities market index and a group of similar mutual funds.
| 18 | Target Asset Allocation Funds |
Past performance
(before and after taxes) does not mean that the Fund will achieve similar results in the future. Updated Fund performance information is available online at www.prudentialfunds.com.
| Annual Total Returns % (Class A Shares)1 |
|
1 These annual total returns do not include sales charges. If the sales charges were included, the annual total returns would be lower than those shown. Without the
distribution and service (12b-1) fee waiver, the annual returns would have been lower, too. The total return for Class A shares from 1/1/12—6/30/12 was 6.87%.
| Best Quarter: | Worst Quarter: | ||
| 17.94% | 2nd Quarter 2003 | -22.16% | 4th Quarter 2008 |
| Average Annual Total Returns % (as of 12-31-11) | ||||
| Return Before Taxes | One Year | Five Year | Ten Years | Since Inception |
| Class B shares | -10.07 | -3.85 | 2.13 | — |
| Class C shares | -6.28 | -3.66 | 2.14 | — |
| Class R shares | -4.85 | -3.19 | N/A | 2.35 (10/4/2004) |
| Class X shares | -10.30 | -3.76 | N/A | 2.04 (10/4/2004) |
| Class Z shares | -4.36 | -2.71 | 3.17 | — |
| Class A Shares % | ||||
| Return Before Taxes | -9.88 | -4.05 | 2.32 | — |
| Return After Taxes on Distributions | -9.92 | -4.42 | 1.91 | — |
| Return After Taxes on Distribution and Sale of Fund Shares | -6.37 | -3.40 | 2.01 | — |
° After-tax returns are calculated using the historical highest individual federal marginal income tax rates and do not reflect the impact of state and local taxes. Actual after-tax returns
depend on an investor’s tax situation and may differ from those shown. After-tax returns shown are not relevant to investors who hold their Fund shares through tax deferred arrangements, such as 401(k) plans or
individual retirement accounts. After-tax returns are shown only for Class A shares. After-tax returns for other classes will vary due to differing sales charges and expenses.
| Index % (reflects no deduction for fees, expenses or taxes) | ||||
| Customized Blend Index | -1.71 | -0.91 | 3.80 | — |
| S&P 500 Index | 2.09 | -0.25 | 2.92 | — |
| Lipper Large-Cap Core Funds Average | -0.67 | -0.87 | 2.41 | — |
MANAGEMENT OF THE
FUND
| Investment Manager | Subadviser | Portfolio Managers | Title | Service Date |
| Prudential Investments LLC | Eagle Asset Management, Inc. | Bert L. Boksen, CFA | Senior Vice President & Managing Director | July 2008 |
| Eric Mintz, CFA | Co-Portfolio Manager | July 2008 | ||
| EARNEST Partners, LLC | Paul E. Viera, Jr. | Chief Executive Officer & Partner | December 2001 | |
| Epoch Investment Partners, Inc. | David N. Pearl | Executive Vice President, Co-Chief Investment Officer & Portfolio Manager | July 2012 |
| Visit our website at www.prudentialfunds.com | 19 |
| Investment Manager | Subadviser | Portfolio Managers | Title | Service Date |
| Janet K. Navon | Managing Director, Portfolio Manager & Director of Research | July 2012 | ||
| Michael A. Welhoelter, CFA | Managing Director, Chief Risk Officer & Portfolio Manager | July 2012 | ||
| Hotchkis and Wiley Capital Management, LLC | Sheldon Lieberman | Principal & Portfolio Manager | April 2005 | |
| George Davis | Principal & CEO | April 2005 | ||
| Scott McBride | Portfolio Manager | February 2009 | ||
| Patricia McKenna | Principal & Portfolio Manager | April 2005 | ||
| Judd Peters | Portfolio Manager | February 2009 | ||
| LSV Asset Management | Josef Lakonishok | CEO, CIO, Partner & Portfolio Manager | April 2005 | |
| Menno Vermuelen, CFA | Partner, Portfolio Manager & Senior Quantitative Analyst | April 2005 | ||
| Puneet Mansharamani, CFA | Partner, Portfolio Manager & Senior Quantitative Analyst | January 2006 | ||
| Marsico Capital Management, LLC | Thomas F. Marsico | Portfolio Manager, CIO, & CEO | June 2005 | |
| Coralie Witter, CFA | Senior Analyst & Portfolio Manager | February 2011 | ||
| Massachusetts Financial Services Company | Eric B. Fischman | Investment Officer | January 2011 | |
| NFJ Investment Group LLC | Ben Fischer, CFA | Managing Director, Portfolio Manager | December 2005 | |
| Tom Oliver, CPA, CFA | Managing Director, Portfolio Manager | September 2008 | ||
| Paul Magnuson | Managing Director, Portfolio Manager | December 2005 | ||
| R. Burns McKinney, CFA | Managing Director, Portfolio Manager | September 2010 | ||
| Jeff Reed, CFA | Vice President, Portfolio Manager | February 2011 | ||
| Thornburg Investment Management, Inc. | William V. Fries, CFA | Managing Director | April 2005 | |
| Wendy Trevisani | Managing Director | April 2005 | ||
| Lei Wang, CFA | Managing Director | February 2006 | ||
| Vaughan Nelson Investment Management, L.P. | Chris D. Wallis, CFA | Senior Portfolio Manager | July 2005 | |
| Scott Weber | Portfolio Manager | July 2005 |
BUYING AND SELLING
FUND SHARES
| Minimum Initial Investment | Minimum Subsequent Investment | |
| Fund shares (most cases) | $2,500 | $100 |
| Retirement accounts and custodial accounts for minors | $1,000 | $100 |
| Automatic Investment Plan (AIP) | $50 | $50 |
You
can purchase or redeem shares through the Fund's transfer agent or through servicing agents, including brokers, dealers and other financial intermediaries appointed by the distributor to receive purchase and redemption
orders. Current shareholders may also purchase or redeem shares through the Fund's website or by calling (800) 225-1852.
| 20 | Target Asset Allocation Funds |
TAX INFORMATION
Dividends, Capital Gains
and Taxes. The Fund's dividends and distributions are taxable and will be taxed as ordinary income or capital gains, unless you are investing through a tax-deferred arrangement, such as a 401(k) plan
or an individual retirement account. Such tax-deferred arrangements may be taxed later upon withdrawal of monies from those arrangements.
FINANCIAL
INTERMEDIARY COMPENSATION
Potential Conflicts of
Interest. If you purchase Fund shares through a financial services firm, the Fund, the Manager, or their related companies may pay the financial services firm for the sale of Fund shares and/or for
services to shareholders. These payments may create a conflict of interest by influencing the financial services firm or the firm's representatives to recommend the Fund over another investment. Ask your financial
services firm or representative for more information or visit your financial services firm's website.
| Visit our website at www.prudentialfunds.com | 21 |
HOW THE FUNDS INVEST
CONSERVATIVE
ALLOCATION FUND
The
Fund’s investment objective is to seek to provide current income and a reasonable level of capital appreciation. This means that we seek investments that will pay income and investments that will increase in value. The Fund seeks to achieve its objective by investing in a
diversified portfolio of fixed-income and equity securities. The table identifies the Fund’s subadvisers, the Fund segments they managed as of the date of this Prospectus, and the allocations among subadvisers as
of July 31, 2012 as a percentage of long-term investments. The allocations among subadvisers are reviewed by the Manager periodically, and the allocations among subadvisers may be altered or adjusted by the Manager
without prior notice to shareholders. Such adjustments will be reflected in an annual update to this prospectus.
| Conservative Allocation Fund | |||
| Subadviser | Allocation | Asset Class | Primary Investment Type/Style |
| Marsico Capital Management, LLC (Marsico) Massachusetts Financial Services Company (MFS) | 19% | Equities | Growth-oriented, focusing on large-cap stocks |
| Hotchkis and Wiley Capital Management, LLC (Hotchkis and Wiley) Epoch Investment Partners, Inc. (Epoch) NFJ Investment Group LLC (NFJ) | 17% | Equities | Value-oriented, focusing on large-cap stocks |
| Eagle Asset Management, Inc. (Eagle) | 1% | Equities | Growth-oriented, focusing on small-cap stocks |
| EARNEST Partners, LLC (EARNEST) Vaughan Nelson Investment Management LP (Vaughan Nelson) | 2% | Equities | Value-oriented, focusing on small-cap stocks |
| Pacific Investment Management Company LLC (PIMCO) | 61% | Fixed-Income | High-quality debt instruments |
In response to market
developments, the Manager may rebalance the allocation of the Fund’s assets or may add or eliminate Fund segments in accordance with the Fund’s investment objective and the policies described below.
Fixed-Income Segment
The fixed-income
segment of the Fund focuses primarily on investment-grade domestic and foreign debt obligations—debt obligations rated at least BBB by S&P, Baa by Moody’s, or the equivalent by another major rating service,
and unrated debt obligations that are believed to be comparable in quality. In choosing debt obligations, economic conditions and interest rate fundamentals are considered and, for foreign debt securities, country and
currency selection. Individual debt securities are also evaluated within each fixed-income sector based upon their relative investment merit. Factors such as yield, duration and potential for price or currency
appreciation are also considered for the fixed-income segment, as well as credit quality, maturity and risk.
Debt
Securities. The Fund will normally invest approximately 60% of its total assets (which may range up to 65% of its total assets) in debt obligations of varying credit quality, including securities issued or guaranteed by the U.S. Government and its agencies, and debt obligations issued by U.S. companies, foreign companies and foreign governments and their agencies.
Credit-Linked
Securities & Event-Linked Bonds. The Fund may invest up to 15% of its total assets in credit-linked securities, which give the Fund the right to receive periodic interest payments from the issuer of the credit-linked security at an agreed-upon interest rate and a return of principal at the maturity
date. In addition, the Fund may invest up to 5% of its total assets in event-linked bonds, the return of principal and payment of interest on which depends on the non-occurrence of a specific “trigger” event, such as a hurricane, earthquake or other physical or
weather-related phenomenon.
Junk Bonds. The Fund may invest up to 35% of its total assets in high-yield debt obligations—also known as “junk bonds”—including up to 25% of its total assets in securities rated below B by S&P, Moody’s or another major rating service, and unrated debt obligations that we believe are
comparable in quality. The Fund may continue to hold an obligation even if it is later downgraded or no longer rated. The Fund may invest in the securities of issuers that are in default. The Fund will buy securities
rated below B opportunistically, when the securities’ values appear attractive relative to underlying credit quality.
| 22 | Target Asset Allocation Funds |
Foreign Debt. The Fund may invest up to 30% of its total assets in non-U.S. dollar denominated foreign debt obligations, including up to 15% of its total assets in securities and instruments that are
economically tied to emerging countries, including (but not limited to) Brady Bonds. Foreign currency exposure (from non-U.S. dollar-denominated securities or currencies) normally will be limited to 20% of the
Fund’s total assets.
Mortgage-Related Securities. The Fund may invest in mortgage-related securities issued or guaranteed by U.S. governmental entities or private issuers. These securities are usually pass-through instruments that pay
investors a share of all interest and principal payments from an underlying pool of fixed or adjustable-rate mortgages. Mortgage-related securities issued by the U.S. Government or its agencies include obligations of the Federal National Mortgage Association (FNMA or “Fannie Mae”) and the Government National Mortgage Association (GNMA or
“Ginnie Mae”) and debt securities issued by the Federal Home Loan Mortgage Corporation (“Freddie Mac”). The U.S. Government or the issuing agency directly or indirectly guarantees the payment of interest and principal on these securities, but not their value. Private mortgage-related securities that
are not guaranteed by U.S. governmental entities generally have one or more types of credit enhancement to ensure timely receipt of payments and to protect against default.
Mortgage pass-through
securities include collateralized mortgage obligations, multiclass pass-through securities and stripped mortgage-backed securities. A collateralized mortgage obligation (CMO) is a security backed by an underlying
portfolio of mortgages or mortgage-backed securities that may be issued or guaranteed by a bank or by U.S. governmental entities. A multiclass pass-through security is an equity interest in a trust composed of
underlying mortgage assets. Payments of principal and interest on the mortgage assets and any reinvestment income thereon provide the funds to pay debt service on the CMO or to make scheduled distributions on the
multiclass pass-through security. A stripped mortgage-backed security (MBS strip) may be issued by U.S. governmental entities or by private institutions. MBS strips take the pieces of a debt security (principal and
interest) and break them apart. The resulting securities may be sold separately and may perform differently.
The values of
mortgage-backed securities vary with changes in market interest rates, generally, and in yields among various kinds of mortgage-related securities. Such values are particularly sensitive to changes in prepayments of
the underlying mortgages. For example, during periods of falling interest rates, prepayments tend to increase as homeowners and others refinance their higher-rate mortgages; these prepayments reduce the anticipated
duration of the mortgage-related securities. Conversely, during periods of rising interest rates, prepayments can be expected to decline, which has the effect of extending the anticipated duration at the same time that
the value of the securities declines. MBS strips tend to be even more highly sensitive to changes in prepayment and interest rates than mortgage-related securities and CMOs generally.
Asset-Backed
Securities. The Fund may invest up to 25% of its total assets in asset-backed debt securities, including, but not limited to, collateralized debt obligations (CDOs) and collateralized loan obligations
(CLOs). An asset-backed security is another type of pass-through instrument that pays interest based upon the cash flow of an underlying pool of assets, such as automobile loans and credit card receivables. Unlike
mortgage-related securities, asset-backed securities are usually not collateralized. However, credit-related asset-backed securities may be collateralized by a portfolio of corporate bonds, including junk bonds.
Equity Segments
The Fund will normally
invest approximately 40% of its total assets (which may range up to 45% of its total assets) in common stocks of U.S. and foreign companies of all market capitalization ranges. The Fund will normally invest up to 15% of its total assets in common stocks of small capitalization
(“small-cap”) companies. Small-cap companies are similar to those found in the Russell 2000 Index, a market capitalization weighted index comprised of the 2000 smallest companies in the Russell 3000 Index,
which in turn is comprised of the largest 3,000 U.S. companies representing approximately 98% of the investable U.S. equity market. Subject to certain restrictions, the Fund may invest up to 5% of its total assets in
any one exchange-traded fund (ETF) or other mutual fund and may invest up to 10% of its total assets in ETFs or other mutual funds collectively.
The Fund may invest
up to 20% of its total assets in non-U.S. dollar denominated stocks of foreign companies, including companies in emerging markets. The Fund considers “foreign” securities to be only those debt securities or
stocks of foreign companies that are denominated in foreign currencies (including the euro—a multinational currency unit). Therefore, the limitations described above on the amount of the Fund’s total assets
that may be invested in foreign debt securities and stocks of foreign companies do not apply to U.S. dollar denominated foreign debt securities or stocks.
| Visit our website at www.prudentialfunds.com | 23 |
The Fund may also
invest in American Depositary Receipts (ADRs), American Depositary Shares (ADSs), Global Depositary Receipts (GDRs) and European Depositary Receipts (EDRs). ADRs, ADSs, GDRs and EDRs are certificates—usually
issued by a bank or trust company—that represent an equity investment in a foreign company. ADRs and ADSs are issued by U.S. banks and trust companies and are valued in U.S. dollars. EDRs and GDRs are issued by
foreign banks and trust companies and may be valued in foreign currencies.
The
Fund may invest in Real Estate Investment Trusts (REITs), zero coupon bonds, deferred interest bonds, payment-in-kind securities, capital appreciation bonds, equity/mortgage swaps, structured securities, bank
obligations, and interest rate caps, collars and floors.
Derivative Strategies
We may use various
derivatives strategies to try to improve the Fund’s returns. We may also use hedging strategies to try to protect the Fund’s assets. We cannot guarantee that these strategies will work, that the instruments
necessary to implement these strategies will be available or that the Fund will not lose money. The derivatives in which the Fund may invest include, but are not limited to, futures, options and options on futures,
indexed and inverse floating rate securities and swaps (including credit default swaps). In addition, the Fund may enter into foreign currency forward contracts and foreign currency exchange contracts and purchase
commercial paper that is indexed to foreign currency exchange rates.
Derivatives involve
costs and can be volatile. With derivatives, a subadviser tries to predict whether the underlying investment—a security, market index, currency, interest rate or some other benchmark—will go up or down at
some future date. We may use derivatives to try to reduce risk or to increase return consistent with the Fund’s overall investment objective. A subadviser will consider other factors (such as cost) in deciding
whether to employ any particular strategy or use any particular instrument. Any derivatives we use may not match or offset the Fund’s underlying positions and this could result in losses to the Fund that would
not otherwise have occurred. When the Fund uses derivative strategies, the Fund designates certain assets as segregated, as required by the Securities and Exchange Commission (SEC or Commission). For more information
about these strategies, see the SAI.
Currency Hedges. The Fund may also use “currency hedges” to help protect its net asset value (NAV) from declining if a particular foreign currency were to decrease in value against the U.S.
dollar.
Options. The Fund may purchase and sell put and call options on securities, swap agreements, securities indexes, futures contracts and currencies traded on U.S. or foreign securities exchanges or
on the over-the-counter market. An option is the right to buy or sell securities in exchange for a premium. The options may be on debt securities, aggregates of debt securities, financial indexes and U.S. Government securities. The Fund will sell only covered options.
Futures Contracts and
Related Options and Foreign Currency Forward Contracts. The Fund may purchase and sell financial futures contracts and related options with respect to, among other things, debt securities, aggregates of debt securities, interest rates,
currencies, financial indexes or U.S. Government securities. A futures contract is an exchange-traded agreement to buy or sell a set quantity of an underlying asset at a future date or to make or receive a cash payment
based on the value of a securities index or some other asset on a stipulated future date. The terms of futures contracts are generally standardized. In the case of a financial futures contract based upon a broad index,
there is no delivery of the securities comprising the index, margin is uniform, a clearing corporation or an exchange is the counterparty and the Fund makes daily margin payments based on price movements in the index.
The Fund may also invest in futures contracts on interest rate swaps to hedge the Fund’s assets; that is, to attempt to protect the Fund’s assets from a decline in value. The Fund also may enter into
foreign currency forward contracts to attempt to protect the value of its assets against future changes in the level of foreign exchange rates. A foreign currency forward contract is an obligation to buy or sell a
given currency on a future date at a set price or to make or receive a cash payment based on the value of a given currency at a future date. Delivery of the underlying currency is expected, the terms are individually
negotiated, the counterparty is not a clearing corporation or an exchange and payment on the contract is made upon delivery, rather than daily. For more information about these strategies, see the SAI. The Fund’s
dealings in foreign currency forward contracts and options can be used for, but may not be limited to, hedging involving either specific transactions or portfolio positions.
Cash Management
To the extent that any
segment of the Fund has uninvested assets, Prudential Investment Management, Inc. (PIM) will manage these assets until the subadviser responsible for such assets requires them for investment in accordance with the
subadviser’s investment type or style. PIM will invest such assets primarily in high-quality, short-term money market instruments.
| 24 | Target Asset Allocation Funds |
Portfolio Turnover
As a result of the
strategies described above, the Fund has historically had an annual portfolio turnover rate of over 100%. Portfolio turnover is generally the percentage found by dividing the lesser of portfolio purchases or sales by
the monthly average value of the portfolio. High portfolio turnover (100% or more) results in higher brokerage commissions and other transaction costs and can affect the Fund’s performance. It also can result in
a greater amount of distributions to shareholders as ordinary income rather than long-term capital gains.
MODERATE
ALLOCATION FUND
The
Fund’s investment objective is to seek to provide capital appreciation and a reasonable level of current income. This means that we seek investments that will increase in value and investments that will pay
income. The Fund seeks to achieve its objective by investing in a diversified portfolio of equity and fixed-income securities. The table below identifies the Fund’s subadvisers, the Fund segments they managed as
of the date of this Prospectus, and the allocations among subadvisers as of July 31, 2012 as a percentage of long-term investments. The allocations among subadvisers will be reviewed by the Manager periodically, and
the allocations among subadvisers may be altered or adjusted by the Manager without prior notice to shareholders. Such adjustments will be reflected in an annual update to this prospectus.
| Moderate Allocation Fund | |||
| Subadviser | Allocation | Asset Class | Primary Investment Type/Style |
| Marsico MFS | 26% | Equities | Growth-oriented, focusing on large-cap stocks |
| Hotchkis and Wiley Epoch NFJ | 23% | Equities | Value-oriented, focusing on large-cap stocks |
| Eagle | 2% | Equities | Growth-oriented, focusing on small-cap stocks |
| EARNEST Vaughan Nelson | 2% | Equities | Value-oriented, focusing on small-cap stocks |
| LSV Asset Management (LSV) Thornburg Investment Management, Inc. (Thornburg) | 12% | International Equities | Stocks of foreign companies |
| PIMCO | 35% | Fixed-Income | High-quality debt instruments |
In response to market
developments, the Manager may rebalance the allocation of the Fund’s assets or may add or eliminate Fund segments in accordance with the Fund’s investment objective and the policies described below.
Fixed-Income Segment
The fixed-income
segment of the Fund focuses primarily on investment-grade domestic and foreign debt obligations—debt obligations rated at least BBB by S&P, Baa by Moody’s, or the equivalent by another major rating service,
and unrated debt obligations that PIMCO believes are comparable in quality. In choosing debt obligations, economic conditions and interest rate fundamentals are considered and, for foreign debt securities, country and
currency selection. Individual debt securities are also examined within each fixed-income sector based upon their relative investment merit. Factors such as yield, duration and potential for price or currency
appreciation are also considered, as well as credit quality, maturity and risk.
Debt
Securities. The Fund will normally invest approximately 35% of its total assets (which may range up to 40% of its total assets) in debt securities of varying credit quality, including securities issued
or guaranteed by the U.S. Government and its agencies, and debt obligations issued by U.S. companies, foreign companies and foreign governments and their agencies. The Fund may invest in mortgage-related securities
issued or guaranteed by U.S. Government entities and in privately issued mortgage-related securities (not issued or guaranteed by the U.S. Government). These investments may include collateralized mortgage obligations and stripped mortgage-backed securities. In addition, the Fund may also invest up to 25% of its total assets
in asset-backed securities.
Credit-Linked
Securities & Event-Linked Bonds. The Fund may invest up to 15% of its total assets in credit-linked securities, which give the Fund the right to receive periodic interest payments from the issuer of the credit-linked
security at an agreed-upon interest rate and a return of principal at the maturity date. In addition, the Fund may also invest up to 5% of its total assets in event-linked bonds, the return of principal and payment of
interest on which depends on the non-occurrence of a specific “trigger” event, such as a hurricane, earthquake or other physical or weather-related phenomenon.
| Visit our website at www.prudentialfunds.com | 25 |
Junk Bonds. The Fund may invest up to 35% of its total assets in high-yield debt obligations—also known as “junk bonds”—including up to 25% of its total assets in securities
rated below B by S&P, Moody’s or another major rating service, and unrated debt obligations that we believe are comparable in quality. The Fund may continue to hold an obligation even if it is later downgraded or
no longer rated. The Fund may invest in the securities of issuers that are in default.
Foreign Debt. The Fund may invest up to 30% of its total assets in non-U.S. dollar denominated foreign debt obligations, including up to 15% of its total assets in securities and instruments that are
economically tied to emerging countries. Foreign currency exposure (from non-U.S. dollar-denominated securities or currencies) normally will be limited to 20% of the Fund’s total assets.
The
Fund may invest in Real Estate Investment Trusts (REITs), zero coupon bonds, deferred interest bonds, payment-in-kind securities, capital appreciation bonds, equity/mortgage swaps, structured securities, bank
obligations, and interest rate caps, collars and floors.
Equity Segments
The Fund will normally
invest approximately 65% of its total assets (which may range up to 70% of its total assets) in common stocks of U.S. and foreign companies of all market capitalization ranges. The Fund will normally invest up to 25%
of its total assets in common stocks of small-cap companies. Small-cap companies are similar to those found in the Russell 2000 Index, a market capitalization weighted index comprised of the 2000 smallest companies in
the Russell 3000 Index, which in turn is comprised of the largest 3,000 U.S. companies representing approximately 98% of the investable U.S. equity market. Subject to certain restrictions, the Fund may invest up to 5%
of its total assets in any one ETF or other mutual fund and may invest up to 10% of its total assets in ETFs or other mutual funds collectively.
The Fund may invest
up to 30% of its total assets in non-U.S. dollar denominated stocks of foreign companies, including companies in emerging markets. The Fund considers “foreign” securities to be only those debt securities or
stocks of foreign companies that are denominated in foreign currencies (including the euro—a multinational currency unit). Therefore, the limitations described above on the amount of the Fund’s total assets
that may be invested in foreign debt securities and stocks of foreign companies do not apply to U.S. dollar denominated foreign debt securities or stocks.
The
Fund may also invest in American Depositary Receipts (ADRs), American Depositary Shares (ADSs), Global Depositary Receipts (GDRs) and European Depositary Receipts (EDRs). ADRs, ADSs, GDRs, and EDRs are
certificates—usually issued by a bank or trust company—that represent an equity investment in a foreign company. ADRs and ADSs are issued by U.S. banks and trust companies and are valued in U.S. dollars.
EDRs and GDRs are issued by foreign banks and trust companies and may be valued in foreign currencies.
Derivative Strategies
We may use various
derivatives strategies to try to improve the Fund’s returns. We may also use hedging strategies to try to protect the Fund’s assets. We cannot guarantee that these strategies will work, that the instruments
necessary to implement these strategies will be available or that the Fund will not lose money. The derivatives in which the Fund may invest include, but are not limited to, futures, options and options on futures,
indexed and inverse floating rate securities and swaps (including credit default swaps). In addition, the Fund may enter into foreign currency forward contracts and foreign currency exchange contracts and purchase
commercial paper that is indexed to foreign currency exchange rates.
Derivatives involve
costs and can be volatile. With derivatives, a subadviser tries to predict whether the underlying investment—a security, market index, currency, interest rate or some other benchmark—will go up or down at
some future date. We may use derivatives to try to reduce risk or to increase return consistent with the Fund’s overall investment objective. A subadviser will consider other factors (such as cost) in deciding
whether to employ any particular strategy or use any particular instrument. Any derivatives we use may not match or offset the Fund’s underlying positions and this could result in losses to the Fund that would
not otherwise have occurred. When the Fund uses derivative strategies, the Fund designates certain assets as segregated, as required by the Securities and Exchange Commission (SEC or Commission). For more information
about these strategies, see the SAI.
Currency Hedges. The Fund may also use “currency hedges” to help protect its net asset value (NAV) from declining if a particular foreign currency were to decrease in value against the U.S.
dollar.
| 26 | Target Asset Allocation Funds |
Options. The Fund may purchase and sell put and call options on securities, swap agreements, securities indexes, futures contracts and currencies traded on U.S. or foreign securities exchanges or
on the over-the-counter market. An option is the right to buy or sell securities in exchange for a premium. The options may be on debt securities, aggregates of debt securities, financial indexes and U.S. Government securities. The Fund will sell only covered options.
Futures Contracts and
Related Options and Foreign Currency Forward Contracts. The Fund may purchase and sell financial futures contracts and related options with respect to, among other things, debt securities, aggregates of debt securities, interest rates,
currencies, financial indexes or U.S. Government securities. A futures contract is an exchange-traded agreement to buy or sell a set quantity of an underlying asset at a future date or to make or receive a cash payment
based on the value of a securities index or some other asset on a stipulated future date. The terms of futures contracts are generally standardized. In the case of a financial futures contract based upon a broad index,
there is no delivery of the securities comprising the index, margin is uniform, a clearing corporation or an exchange is the counterparty and the Fund makes daily margin payments based on price movements in the index.
The Fund may also invest in futures contracts on interest rate swaps to hedge the Fund’s assets; that is, to attempt to protect the Fund’s assets from a decline in value. The Fund also may enter into
foreign currency forward contracts to attempt to protect the value of its assets against future changes in the level of foreign exchange rates. A foreign currency forward contract is an obligation to buy or sell a
given currency on a future date at a set price or to make or receive a cash payment based on the value of a given currency at a future date. Delivery of the underlying currency is expected, the terms are individually
negotiated, the counterparty is not a clearing corporation or an exchange and payment on the contract is made upon delivery, rather than daily. For more information about these strategies, see the SAI. The Fund’s
dealings in foreign currency forward contracts and options can be used for, but may not be limited to, hedging involving either specific transactions or portfolio positions.
Cash Management
To the extent that any
segment of the Fund has uninvested assets, Prudential Investment Management, Inc. (PIM) will manage these assets until the subadviser responsible for such assets requires them for investment in accordance with the
subadviser’s investment type or style. PIM will invest such assets primarily in high-quality, short-term money market instruments.
Portfolio Turnover
As a result of the
strategies described above, the Fund has historically had an annual portfolio turnover rate of over 100%. Portfolio turnover is generally the percentage found by dividing the lesser of portfolio purchases or sales by
the monthly average value of the portfolio. High portfolio turnover (100% or more) results in higher brokerage commissions and other transaction costs and can affect the Fund’s performance. It also can result in
a greater amount of distributions to shareholders as ordinary income rather than long-term capital gains.
GROWTH ALLOCATION
FUND
The
Fund’s investment objective is to seek to provide long-term capital appreciation. This means that we seek investments that will increase in value. The Fund seeks to achieve its objective by investing primarily in a diversified
portfolio of equity securities. The table below identifies the Fund’s subadvisers, the Fund segments they managed as of the date of this Prospectus, and the allocations among subadvisers as of July 31, 2012 as a
percentage of long-term investments. The allocations among subadvisers will be reviewed by the Manager periodically, and the allocations among subadvisers may be altered or adjusted by the Manager without prior notice
to shareholders. Such adjustments will be reflected in an annual update to this prospectus.
| Growth Allocation Fund | |||
| Subadviser | Allocation | Asset Class | Primary Investment Type/Style |
| Marsico MFS | 38% | Equities | Growth-oriented, focusing on large-cap stocks |
| Hotchkis and Wiley Epoch NFJ | 38% | Equities | Value-oriented, focusing on large-cap stocks |
| Eagle | 3% | Equities | Growth-oriented, focusing on small-cap stocks |
| EARNEST Vaughan Nelson | 3% | Equities | Value-oriented, focusing on small-cap stocks |
| LSV Thornburg | 18% | International Equities | Stocks of foreign companies |
| Visit our website at www.prudentialfunds.com | 27 |
In response to market
developments, the Manager may rebalance the allocation of the Fund’s assets or may add or eliminate Fund segments in accordance with the Fund’s investment objective and the policies described below.
The Fund will
normally invest substantially all of its assets in common stocks of U.S. and foreign companies of all market capitalization ranges. The Fund will normally invest up to 35% of its total assets in common stocks of
small-cap companies. Small-cap companies are similar to those found in the Russell 2000 Index, a market capitalization weighted index comprised of the 2000 smallest companies in the Russell 3000 Index, which in turn is
comprised of the largest 3,000 U.S. companies representing approximately 98% of the investable U.S. equity market. Subject to certain restrictions, the Fund may invest up to 5% of its total assets in any one ETF or
other mutual fund and may invest up to 10% of its total assets in EFTs or other mutual funds collectively.
The Fund may invest
up to 40% of its total assets in non-U.S. dollar denominated stocks of foreign companies, including companies in emerging markets. The Fund considers “foreign” securities to be only those stocks of foreign
companies that are denominated in foreign currencies (including the euro—a multinational currency unit). Therefore, the limitation described above on the amount of the Fund’s total assets that may be
invested in the stocks of foreign companies does not apply to U.S. dollar denominated foreign stocks.
The
Fund may also invest in American Depositary Receipts (ADRs), American Depositary Shares (ADSs), Global Depositary Receipts (GDRs) and European Depositary Receipts (EDRs). ADRs, ADSs, GDRs, and EDRs are
certificates—usually issued by a bank or trust company—that represent an equity investment in a foreign company. ADRs and ADSs are issued by U.S. banks and trust companies and are valued in U.S. dollars.
EDRs and GDRs are issued by foreign banks and trust companies and may be valued in foreign currencies.
The Fund may invest
up to 35% of its total assets in money market instruments when deemed appropriate by the Manager to preserve the Fund’s assets. To the extent the Fund invests in money market instruments, the Fund limits the
potential for capital appreciation and achieving its investment objective of long-term capital appreciation.
The
Fund may invest in Real Estate Investment Trusts (REITs), zero coupon bonds, deferred interest bonds, payment-in-kind securities, capital appreciation bonds, equity/mortgage swaps, structured securities, bank
obligations, and interest rate caps, collars and floors.
Derivative Strategies
We may use various
derivatives strategies to try to improve the Fund’s returns. We may also use hedging strategies to try to protect the Fund’s assets. We cannot guarantee that these strategies will work, that the instruments
necessary to implement these strategies will be available or that the Fund will not lose money. The derivatives in which the Fund may invest include, but are not limited to, futures, options and options on futures,
indexed and inverse floating rate securities and swaps (including credit default swaps). In addition, the Fund may enter into foreign currency forward contracts and foreign currency exchange contracts and purchase
commercial paper that is indexed to foreign currency exchange rates.
Derivatives involve
costs and can be volatile. With derivatives, a subadviser tries to predict whether the underlying investment—a security, market index, currency, interest rate or some other benchmark—will go up or down at
some future date. We may use derivatives to try to reduce risk or to increase return consistent with the Fund’s overall investment objective. A subadviser will consider other factors (such as cost) in deciding
whether to employ any particular strategy or use any particular instrument. Any derivatives we use may not match or offset the Fund’s underlying positions and this could result in losses to the Fund that would
not otherwise have occurred. When the Fund uses derivative strategies, the Fund designates certain assets as segregated, as required by the Securities and Exchange Commission (SEC or Commission). For more information
about these strategies, see the SAI.
Currency Hedges. The Fund may also use “currency hedges” to help protect its net asset value (NAV) from declining if a particular foreign currency were to decrease in value against the U.S.
dollar.
Options. The Fund may purchase and sell put and call options on securities, swap agreements, securities indexes, futures contracts and currencies traded on U.S. or foreign securities exchanges or
on the over-the-counter market. An option is the right to buy or sell securities in exchange for a premium. The options may be on debt securities, aggregates of debt securities, financial indexes and U.S. Government securities. The Fund will sell only covered options.
| 28 | Target Asset Allocation Funds |
Futures Contracts and
Related Options and Foreign Currency Forward Contracts. The Fund may purchase and sell financial futures contracts and related options with respect to, among other things, debt securities, aggregates of debt securities, interest rates,
currencies, financial indexes or U.S. Government securities. A futures contract is an exchange-traded agreement to buy or sell a set quantity of an underlying asset at a future date or to make or receive a cash payment
based on the value of a securities index or some other asset on a stipulated future date. The terms of futures contracts are generally standardized. In the case of a financial futures contract based upon a broad index,
there is no delivery of the securities comprising the index, margin is uniform, a clearing corporation or an exchange is the counterparty and the Fund makes daily margin payments based on price movements in the index.
The Fund also may enter into foreign currency forward contracts to attempt to protect the value of its assets against future changes in the level of foreign exchange rates. A foreign currency forward contract is an
obligation to buy or sell a given currency on a future date at a set price or to make or receive a cash payment based on the value of a given currency at a future date. Delivery of the underlying currency is expected,
the terms are individually negotiated, the counterparty is not a clearing corporation or an exchange and payment on the contract is made upon delivery, rather than daily. For more information about these strategies,
see the SAI. The Fund’s dealings in foreign currency forward contracts and options can be used for, but may not be limited to, hedging involving either specific transactions or portfolio positions.
Cash Management
To the extent that any
segment of the Fund has uninvested assets, Prudential Investment Management, Inc. (PIM) will manage these assets until the subadviser responsible for such assets requires them for investment in accordance with the
subadviser’s investment type or style. PIM will invest such assets primarily in high-quality, short-term money market instruments.
OTHER INVESTMENTS
AND STRATEGIES
In addition to their
principal strategies described above, unless otherwise specified below, we may also use the following investment strategies to increase the Funds’ returns or protect their assets if market conditions warrant.
Money Market Instruments
Each
Fund may invest in high-quality money market instruments. Money market instruments include the commercial paper of U.S. and foreign corporations, obligations of U.S. and foreign banks, certificates of deposit and
obligations issued or guaranteed by the U.S. Government or its agencies or a foreign government. Each Fund will generally purchase money market instruments in one of the two highest short-term quality ratings of a
major rating service. Each Fund may also invest in money market instruments that are not rated, but which we believe are of comparable quality to the instruments described above. The Growth Allocation Fund uses money
market instruments for cash management purposes only.
U.S. Government
Securities
Each
Fund may invest in debt obligations issued by the U.S. Treasury. Treasury securities have varying interest rates and maturities, but they are all backed by the full faith and credit of the U.S. Government.
Each Fund may also
invest in other debt obligations issued or guaranteed by the U.S. Government and government-related entities. Some of these debt securities are backed by the full faith and credit of the U.S. Government, like GNMA
obligations. Debt securities issued by other government entities, like obligations of FNMA and the Student Loan Marketing Association, are not backed by the full faith and credit of the U.S. Government. However, these
issuers have the right to borrow from the U.S. Treasury to meet their obligations. In contrast, the debt securities of other issuers, like the Farm Credit System, depend entirely upon their own resources to repay their
debt.
The U.S. Government
sometimes “strips” its debt obligations into their component parts: the U.S. Government’s obligation to make interest payments and its obligation to repay the amount borrowed. These stripped
securities are sold to investors separately. Stripped securities do not make periodic interest payments. They are usually sold at a discount and then redeemed for their face value on their maturity dates. These
securities increase in value when interest rates fall and lose value when interest rates rise. However, the value of stripped securities generally fluctuates more in response to interest rate movements than the value
of traditional debt obligations. A Fund may try to earn money by buying stripped securities at a discount and either selling them after they increase in value or holding them until they mature.
Temporary Defensive
Investments
In
response to adverse market, economic or political conditions, each Fund may temporarily invest up to 100% of its total assets in money market instruments or U.S. Government securities. Investing heavily in these
securities limits our ability to achieve each Fund’s investment objective, but can help to preserve a Fund’s assets when securities markets are unstable.
| Visit our website at www.prudentialfunds.com | 29 |
Reverse Repurchase
Agreements and Dollar Rolls
Each Fund may enter
into reverse repurchase agreements. When a Fund enters into a reverse repurchase agreement, the Fund borrows money on a temporary basis by selling a security with an obligation to repurchase it at an agreed-upon price
and time.
The Conservative
Allocation and Moderate Allocation Funds may each enter into dollar rolls. When a Fund enters into a dollar roll, the Fund sells securities to be delivered in the current month and repurchases substantially similar
(same type and coupon) securities to be delivered on a specified future date by the same party. The Fund is paid the difference between the current sales price and the forward price for the future purchase, as well as
the interest earned on the cash proceeds of the initial sale.
Repurchase Agreements
Each Fund may also use
repurchase agreements, where a party agrees to sell a security to the Fund and then repurchase it at an agreed-upon price at a stated time. This creates a fixed return for a Fund and is, in effect, a loan by the Fund.
The Growth Allocation Fund uses repurchase agreements for cash management purposes, only.
Convertible and
Preferred Securities
Each
Fund may also invest in convertible and preferred securities, including convertible bonds, convertible preferred stock, and non-convertible preferred stock, warrants and rights. These are securities—like bonds,
corporate notes and preferred stock—that can convert into the company’s common stock or some other equity security. Moderate Allocation Fund and Conservative Allocation Fund may invest up to 20% of each
Fund’s total assets in convertible bonds, convertible preferred stock and non-convertible preferred stock.
Collateralized-Debt
Obligations (CDOs)
The
Conservative Allocation and Moderate Allocation Funds may invest in each of collateralized bond obligations (CBOs), collateralized loan obligations (CLOs), and other collateralized debt obligations (CDOs). A CBO is a
trust which is often backed by a diversified pool of high risk, below investment grade fixed income securities. The collateral can be from many different types of fixed income securities such as high yield debt,
residential privately issued mortgage-related securities, commercial privately issued mortgage-related securities, trust preferred securities and emerging market debt. A CLO is a trust typically collateralized by a
pool of loans, which may include, among others, domestic and foreign senior secured loans, senior unsecured loans, and subordinate corporate loans, including loans that may be rated below investment grade or equivalent
unrated loans. Other CDOs are trusts backed by other types of assets representing obligations of various parties. CBOs, CLOs and other CDOs may charge management fees and administrative expenses. Investments in CBOs,
CLOs and CDOs will be limited to 5% of total assets of each Fund.
Short Sales
The Funds may make
short sales of a security. This means that a Fund may sell a security that it does not own when it thinks the value of the security will decline. The Fund generally borrows the security to deliver to the buyer in a
short sale. The Fund must then buy the security at its market price when the borrowed security must be returned to the lender. Short sales involve costs and risks. The Fund must pay the lender interest on the security
it borrows, and the Fund will lose money to the extent that the price of the security increases between the time of the short sale and the date when the Fund replaces the borrowed security. Although the Fund’s
gain is limited to the price at which it sold the securities short, its potential loss is limited only by the maximum attainable price of the securities, less the price at which the security was sold and may,
theoretically, be unlimited. Each Fund may also make short sales “against the box.” In a short sale against the box, at the time of sale, the Fund owns or has the right to acquire the identical security at
no additional cost. When selling short against the box, the Fund gives up the opportunity for capital appreciation in the security.
Municipal Bonds
States and
municipalities issue bonds in order to borrow money to finance a project. You can think of bonds as loans that investors make to the state, local government or other issuer. The government gets the cash needed to
complete the project and investors earn income on their investment.
The Conservative
Allocation Fund and Moderate Allocation Fund may hold municipal bonds rated B or better by Moody’s or S&P or bonds with a comparable rating by another major rating service or unrated bonds of comparable quality.
Municipal bonds rated Ba or BB or lower by Moody’s or S&P, respectively, are considered lower-rated or high-yield securities or junk bonds. Bonds rated Baa and higher by Moody’s or BBB and higher by S&P are
considered investment grade, with a range of adequate to very strong capacity for meeting their financial obligations, although municipal bonds rated Baa by Moody’s or BBB by S&P have certain speculative
characteristics and are riskier than higher-rated municipal bonds.
| 30 | Target Asset Allocation Funds |
Lower-rated bonds
tend to offer higher yields, but also have greater risks than higher-rated bonds. Under certain economic conditions, however, lower or medium-rated bonds might not yield significantly more than higher-rated bonds, or
comparable unrated bonds. If that happens, the Conservative Allocation Fund and Moderate Allocation Fund may invest in higher-rated bonds that offer similar yields but have less risk. Furthermore, if issuers redeem
their high-yield bonds at a higher than expected rate, which might happen during periods of declining interest rates, the Conservative Allocation Fund and Moderate Allocation Fund could be forced to buy higher-rated,
lower-yielding securities, which would decrease the Fund’s return.
In addition to
investing in rated municipal securities, the Conservative Allocation Fund and Moderate Allocation Fund may invest in unrated municipal securities that are determined to be of comparable quality to the rated securities
that are permissible investments. If the rating of a debt obligation is downgraded after it is purchased by a Fund (or if the debt obligation is no longer rated), the Fund will not have to sell that obligation, but
will consider selling the municipal bonds in question in deciding whether the Fund should continue to hold the obligation.
Investments in Affiliated Funds
Each Fund may also
invest its assets in affiliated money market funds or open-end short term bond funds. The affiliated funds are registered investment companies under the Investment Company Act of 1940, as amended (the 1940 Act). The
Fund can invest its free cash balances in the affiliated funds to obtain income on short-term cash balances while awaiting attractive investment opportunities, to provide liquidity in preparation for anticipated
redemptions or for defensive purposes. Such an investment could also allow the Fund to obtain the benefits of a more diversified portfolio than might otherwise be available through direct investments in those asset
classes, and will subject the Fund to the risks associated with the particular asset class. As a shareholder, the Fund will be subject to its proportional share of the expenses of the affiliated funds, but the
affiliated funds do not pay a management fee to the Manager. The investment results of the portions of the Fund’s assets invested in the affiliated funds will be based on the investment results of the affiliated
funds.
Additional Strategies
Each Fund may also use
additional strategies, such as purchasing debt securities on a when-issued or delayed-delivery basis. When a Fund makes this type of purchase, the price and interest rate are fixed at the time of purchase, but delivery
and payment for the debt obligations take place at a later time. The Fund does not earn interest income until the date the debt obligations are delivered.
The Conservative
Allocation and Moderate Allocation Funds may each enter into swap transactions, including interest rate, index, credit, long and short credit default, currency, and total return swaps agreements (or a combination of
these swap agreements or other similar swap agreements) or options on swap agreements. The swap may, among other things, preserve a return or spread on a particular investment or portion of a Fund, protect against any
increase in the price of securities the Fund anticipates purchasing at a later date, or transfer or allocate credit risk.
Each
Fund also follows certain policies when it borrows money (each Fund can borrow up to 33 1∕3% of the value of its total assets and pledge up to 33 1∕3% of its total assets to secure these borrowings), and holds illiquid securities (each Fund may hold up to 15% of its net assets in illiquid securities, including
securities with legal or contractual restrictions, those without a readily available market and repurchase agreements with maturities longer than seven days).
Each Fund is subject
to certain other investment restrictions that are fundamental policies, which means they cannot be changed without shareholder approval. For more information about these restrictions, see the SAI.
INVESTMENT RISKS
All
investments involve risk, and investing in the Funds is no exception. Since the Funds' holdings can vary significantly from broad-based securities market indexes, performance of the Funds can deviate from performance
of the indexes. The charts below outline the key risks and potential rewards of the Funds' principal strategies and certain other non-principal strategies that the Funds may use. Following the charts is a table which
sets forth the investment limits applicable to each of the types of investments discussed in the charts. Unless otherwise noted, a percentage stated as a limit on the Funds' ability to engage in a particular type of
investment is a percentage of investable assets. For more information, see the SAI.
| Visit our website at www.prudentialfunds.com | 31 |
Principal Investment
Strategies
| Common Stocks | |
| Risks | Potential Rewards |
| ■ Individual stocks could lose value. ■ Equity markets could go down, resulting in a decline in value of the Fund’s investments. ■ Companies that normally pay dividends may not do so if they don’t have profits or adequate cash flow. ■ Changes in economic or political conditions, both domestic and international, may result in a decline in value of the Fund’s investments. ■ Investment style risk—the risk that returns from the types of stocks in which the Fund invests will trail returns from the overall stock market. | ■ Historically, stocks have outperformed other investments over the long term. ■ Generally, economic growth leads to higher corporate profits, which in turn can lead to an increase in stock prices, known as capital appreciation. ■ May be a source of dividend income. |
| Small Capitalization Stocks | |
| Risks | Potential Rewards |
| ■ Individual stocks could lose value. ■ The equity markets could go down, resulting in a decline in value of the Fund's investments. ■ Stocks of small and medium-sized companies are more volatile and may decline more than those of larger capitalization companies. ■ Small-cap companies are more likely to reinvest earnings and not pay dividends. ■ Changes in interest rates may affect the securities of smaller companies more than the securities of larger companies. ■ Changes in economic or political conditions, both domestic and international, may result in a decline in value of the Fund's investments. | ■ Historically, stocks have outperformed other investments over the long term. ■ Generally, economic growth means higher corporate profits, which leads to an increase in stock prices, known as capital appreciation. ■ Highly successful small-cap companies can outperform larger ones. |
| 32 | Target Asset Allocation Funds |
| Fixed-Income Obligations | |
| Risks | Potential Rewards |
| ■ The Fund's holdings, share price, yield and total return may fluctuate in response to
bond market movements. ■ Credit risk—the risk that the default of an issuer will leave the Fund with unpaid interest or principal. The lower an instrument's quality, the higher its potential volatility. ■ Market risk—the risk that the market value of an investment may decline, sometimes rapidly or unpredictably. Market risk may affect an industry, a sector, or the market as a whole. ■ Interest rate risk—the risk that the value of most bonds will fall when interest rates rise: the longer a bond's maturity and the lower its credit quality, the more its value typically falls. Interest rate risk can lead to price volatility, particularly for junk bonds and stripped securities. ■ Spread Risk— Wider credit spreads and decreasing market values typically represent a deterioration of the fixed income instrument's credit soundness and a perceived greater likelihood or risk of default by the issuer. Fixed income instruments generally compensate for greater credit risk by paying interest at a higher rate. As the spread on a security widens (or increases), the price (or value) of the security generally falls. ■ Not all U.S. Government securities are insured or guaranteed by the full faith and credit of the U.S. Government—some are backed only by the issuing agency, which must rely on its own resources to repay the debt. ■ Inflation-indexed bonds, such as Treasury Inflation-Protected Securities (“TIPS”), may experience greater losses than other fixed income securities with similar durations. Investments in inflation-indexed bonds are more likely to cause fluctuations in the Fund’s income distributions. | ■ Bonds have generally outperformed money market instruments over the long term with less risk than stocks. ■ Most bonds will rise in value when interest rates fall. ■ May provide a source of regular interest income. ■ Generally more secure than stocks since companies must pay their debts before paying stockholders. ■ Investment-grade obligations have a lower risk of default. ■ Bonds with longer maturity dates typically have higher yields. ■ Intermediate-term securities may be less susceptible to loss of principal than longer-term securities. |
| Foreign Securities | |
| Risks | Potential Rewards |
| ■ Foreign markets, economies and political systems, particularly those in developing
countries, may not be as stable as those in the U.S. ■ Currency risk—the risk that adverse changes in the values of foreign currencies can cause losses (non-U.S. dollar denominated securities). ■ May be less liquid than U.S. stocks and bonds. ■ Differences in foreign laws, accounting standards, public information, custody and settlement practices may result in less reliable information on foreign investments and involve more risks. ■ Investments in emerging market securities are subject to greater volatility and price declines. | ■ Investors may participate in the growth of foreign markets through the Fund's investments in companies operating in those
markets. ■ The Fund may profit from a favorable change in the value of foreign currencies (non-U.S. dollar denominated securities). |
| Visit our website at www.prudentialfunds.com | 33 |
| U.S. Government and Agency Securities | |
| Risks | Potential Rewards |
| ■ Not all U.S. Government securities are insured or guaranteed by the U.S. Government.
Some are only insured or guaranteed by the issuing agency, which must rely on its own resources to repay the debt. ■ Limits potential for capital appreciation. ■ Credit risk—the risk that the borrower can't pay back the money borrowed or make interest payments (relatively low for U.S. Government securities). ■ Market risk—the risk that the market value of an investment may move up or down, sometimes rapidly or unpredictably, because interest rates rise or there is a lack of confidence in the borrower. Market risk may affect an industry, a sector or the market as a whole. ■ Interest rate risk—the risk that the value of most debt obligations will fall when interest rates rise. The longer a bond's maturity and the lower its credit quality, the more its value typically falls. Price volatility may follow. ■ Inflation-indexed bonds, such as Treasury Inflation-Protected Securities (“TIPS”), may experience greater losses than other fixed income securities with similar durations. ■ Investments in inflation-indexed bonds are more likely to cause fluctuations in the Fund’s income distributions. | ■ May preserve the Fund's assets. ■ May provide a source of regular interest income. ■ Generally more secure than lower quality debt securities and generally more secure than equity securities. ■ Principal and interest may be guaranteed by the U.S. Government. ■ If interest rates decline, long-term yields should be higher than money market yields. ■ Bonds have generally outperformed money market instruments over the long term. ■ Most bonds rise in value when interest rates fall. |
| Mortgage-Related Securities | |
| Risks | Potential Rewards |
| ■ Prepayment risk—the risk that the underlying mortgages may be prepaid, partially
or completely, generally during periods of falling interest rates, which could adversely affect yield to maturity and could require the Fund to reinvest in lower yielding securities. ■ Extension risk—the risk that rising interest rates may cause the underlying mortgages to be paid off more slowly by the borrower, causing the value of the securities to fall. ■ Credit risk—the risk that the underlying mortgages will not be paid by debtors or by credit insurers or guarantors of such instruments. Some private mortgage securities are unsecured or secured by lower-rated insurers or guarantors and thus may involve greater risk. ■ Market risk—the risk that bonds will lose value in the market, sometimes rapidly or unpredictably, because interest rates rise or there is a lack of confidence in the borrower or the bond's insurer. Market risk may affect an industry, a sector or the market as a whole. ■ Interest rate risk—the risk that the value of most bonds will fall when interest rates rise. The longer a bond's maturity and the lower its credit quality, the more its value typically falls. Price volatility may result. ■ Illiquidity risk—the risk that securities may be difficult to value precisely and to sell at the time or price desired. | ■ A source of regular interest income. ■ The U.S. Government guarantees interest and principal payments on certain securities. ■ May benefit from security interest in real estate collateral. ■ Pass-through instruments provide greater diversification than direct ownership of loans. |
| 34 | Target Asset Allocation Funds |
| Asset-Backed Securities | |
| Risks: | Potential Rewards: |
| ■ Credit risk—the risk that the underlying receivables will not be paid by debtors
or by credit insurers or guarantors of such instruments. Some asset-backed securities are unsecured or secured by lower-rated insurers or guarantors and thus may involve greater risk. ■ Prepayment risk—the risk that the underlying debt instruments may be prepaid, partially or completely, generally during periods of falling interest rates, which could adversely affect yield to maturity and could require the Fund to reinvest in lower yielding debt instruments. ■ Extension risk—the risk that rising interest rates may cause the underlying debt instruments to be paid off more slowly by the debtor, causing the value of the securities to fall. ■ Market risk—the risk that bonds will lose value in the market, sometimes rapidly or unpredictably, because interest rates rise or there is a lack of confidence in the borrower or the bond’s insurer. Market risk may affect an industry, a sector or the market as a whole. ■ Interest rate risk—the risk that the value of most bonds will fall when interest rates rise. The longer a bond's maturity and the lower its credit quality, the more its value typically falls. Price volatility may result. ■ Illiquidity risk—the risk that securities may be difficult to value precisely and to sell at the time or price desired. | ■ A potential source of regular interest income. ■ Prepayment risk is generally lower than with mortgage related securities. ■ Pass-through instruments may provide greater diversification than direct ownership of loans. ■ May offer higher yields due to their structure than other instruments. |
| Derivatives | |
| Risks | Potential Rewards |
| ■ The value of derivatives (such as forwards, futures, swaps and options) that are used to
hedge a portfolio security is generally determined independently from the value of that security and could result in a loss to the Fund when the price movement of the derivative does not correlate with a change in the
value of the portfolio security. ■ Derivatives may not have the intended effects and may result in losses or missed opportunities. ■ The counterparty to a derivatives contract could default. ■ Derivatives can increase share price volatility and those that involve leverage could magnify losses. ■ Certain types of derivatives involve costs to the Fund that can reduce returns. ■ Derivatives may be difficult to value precisely or sell at the time or price desired. ■ Recent legislation calls for new regulation of the derivatives markets. The extent and impact of the regulations are not yet fully known and may not be for some time. New regulation of derivatives may make them more costly, may limit their availability, or may otherwise adversely affect their value or performance. | ■ Derivatives could make money and protect against losses if the investment analysis proves correct. ■ Derivatives used for return enhancement purposes involve a type of leverage and could generate substantial gains at low cost. ■ One way to manage the Fund's risk/return balance is by locking in the value of an investment ahead of time. ■ Hedges that correlate well with an underlying position can reduce or eliminate the volatility of investment income or capital gains at low cost. |
| Visit our website at www.prudentialfunds.com | 35 |
Non-Principal
Investment Strategies
| Collateralized Debt Obligations | |
| Risks | Potential Rewards |
| ■ The CDO's underlying obligations may not be authorized investments for the Fund. ■ As a derivative, a CDO is subject to credit, liquidity and market risks, as well as price volatility. ■ Limited liquidity because of transfer restrictions and lack of an organized trading market. | ■ Greater diversification than direct investment in debt instruments. ■ May offer higher yield than other instruments due to their structure. |
| Credit-Linked Securities | |
| Risks | Potential Rewards |
| ■ The issuer of the credit-linked security may default or go bankrupt. ■ Subject to the credit risk of the corporate issuer underlying the credit default swaps. ■ Typically privately negotiated transactions, resulting in limited liquidity or no liquidity. ■ Market risk—the risk that underlying debt investments will lose value in the market, sometimes rapidly or unpredictably, because interest rates rise or there is a lack of confidence in the issuer of the security or the underlying security or the bond's insurer. ■ Prepayment risk—the risk that the underlying debt instruments may be prepaid, partially or completely, generally during periods of falling interest rates, which could adversely affect yield to maturity and could require the Fund to reinvest in lower yielding debt instruments. ■ Extension risk—the risk that rising interest rates may cause the underlying debt instruments to be paid off more slowly by the debtor, causing the value of the securities to fall. | ■ A potential source of regular interest income. ■ Pass-through instruments may provide greater diversification than direct investments. ■ May offer higher yield due to their structure than other instruments. |
| Money Market Instruments | |
| Risks | Potential Rewards |
| ■ May limit the Fund's potential for capital appreciation and achieving its
objective. ■ Credit risk (which is less of a concern for money market instruments)—the risk that the underlying receivables will not be paid by debtors or by credit insurers or guarantors of such instruments. ■ Market risk (which is less of a concern for money market instruments)—the risk that bonds will lose value in the market, sometimes rapidly or unpredictably, because interest rates rise or there is a lack of confidence in the borrower or the bond's insurer. | ■ May preserve the Fund's assets. |
| 36 | Target Asset Allocation Funds |
| Reverse Repurchase Agreements and Dollar Rolls | |
| Risks | Potential Rewards |
| ■ Risk that the counterparty may fail to return securities in a timely manner or at
all. ■ May magnify underlying investment losses. ■ Investment costs may exceed potential underlying investment gains. ■ Leverage risk—the risk that the market value of the securities purchased with proceeds of the sale declines below the price of the securities the Fund must repurchase. | ■ May magnify underlying investment gains. |
| Borrowing | |
| Risks | Potential Rewards |
| ■ Leverage for investment may magnify losses. ■ Interest costs and borrowing fees may exceed potential investment gains. ■ Transactions that leverage the Fund must be covered by segregated liquid assets, which may require the Fund to liquidate positions when it may not be advantageous to do so to meet its asset segregation or other obligations. | ■ Leverage may magnify investment gains (if any). |
| Stripped Securities | |
| Risks | Potential Rewards |
| ■ More volatile than securities where the principal and interest are not separated. | ■ Value may rise faster when interest rates fall. |
| Illiquid Securities | |
| Risks | Potential Rewards |
| ■ May be difficult to value precisely. ■ May be difficult to sell at the time or price desired. | ■ May offer a more attractive yield or potential for growth than more widely traded securities. |
| Variable/Floating Rate Bonds | |
| Risks | Potential Rewards |
| ■ The Fund's share price, yield and total return may fluctuate in response to bond market
movements. ■ Credit risk—the risk that the borrower can't pay back the money borrowed or make interest payments (lower risk for higher rated bonds). The greater a bond's credit risk, the higher its potential volatility. ■ Market risk—the risk that bonds will lose value in the market, sometimes rapidly or unpredictably, because interest rates rise or there is a lack of confidence in the borrower. ■ Interest rate risk—the risk that the value of most bonds will fall when interest rates rise. The longer a bond's maturity and the lower the credit quality, the more its value typically falls. Price volatility may result. | ■ May offer protection against interest rate increases. |
| Visit our website at www.prudentialfunds.com | 37 |
| Exchange-Traded Funds (ETFs) | |
| Risks | Potential Rewards |
| ■ The price movement of an ETF may not track the underlying index or basket of securities
and may result in a loss. ■ Duplicate management fees. | ■ Helps to manage cash flows. ■ Ability to get rapid exposure to an index. ■ Provides opportunity to buy or sell an entire portfolio of securities in a single transaction in a manner similar to buying or selling a share of stock. ■ The unsystemic risk (risk associated with certain issues rather than the financial markets generally) associated with investments in ETFs is generally low relative to investments in securities of individual issuers. |
| Short Sales, including Short Sales Against the Box | |
| Risks | Potential Rewards |
| ■ May magnify underlying investment losses. ■ Share price volatility can magnify losses because the underlying security must be replaced at a specific time. ■ Investment costs may exceed potential underlying investment gains. ■ Short sales pose the risk of potentially unlimited loss. ■ Short sales “against the box” give up the opportunity for capital appreciation in the security. ■ Short sales “against the box” are not subject to the 25% of net assets limitation. | ■ May magnify underlying investment gains. ■ Short sales “against the box” may lock in capital appreciation while delaying tax consequences. |
| Securities of Real Estate Investment Trusts (REITs) | |
| Risks | Potential Rewards |
| ■ Performance and values depend on the value of the underlying properties or the
underlying loans or interests, the strength of real estate markets, REIT management and property management which can be affected by many factors, including national and regional economic conditions. ■ Securities of individual REITs could lose value. ■ Equity markets could go down, resulting in a decline in value of the Fund's investments. ■ Companies that normally pay dividends may not do so if they don't have profits or adequate cash flow. ■ Changes in economic or political conditions, both domestic and international, may result in a decline in value of REIT investments. ■ REITs charge management fees which may result in layering the management fees paid by the Fund. ■ Real estate companies, including REITs, may be leveraged, which increases risk. | ■ Real estate holdings can generate good returns from rents, rising market values, etc. ■ Greater diversification than direct ownership of real estate. ■ Potential for dividend income. |
| 38 | Target Asset Allocation Funds |
| Municipal Obligations | |
| Risks | Potential Rewards |
| ■ Credit risk—the risk that the borrower or counterparty can't repay the money
borrowed or make interest payments (lower for insured and higher rated bonds). The lower a bond's quality, the higher its potential volatility. ■ Market risk—the risk that bonds will lose value in the market, sometimes rapidly or unpredictably, because interest rates rise or there is a lack of confidence in the borrower or counterparty or the bond's insurer. ■ Geographic concentration risk—the risk that bonds may lose value because of political, economic or other events in the geographic region where the Fund's investments are focused. ■ Illiquidity risk—the risk that bonds may be difficult to value precisely and sell at the time or price desired. ■ Non-appropriation risk—the risk that the state or municipality may not include the bond obligations in future budgets. ■ Prepayment risk — the risk that the underlying municipal bonds may be prepaid, partially or completely, generally during periods of falling interest rates, which could adversely affect yield to maturity and could require the Fund to reinvest in lower yielding instruments. ■ Extension risk — the risk that rising interest rates may cause the underlying municipal bonds to be paid off more slowly by the debtor, causing the value of the securities to fall. ■ Insured bond risk — insurance does not protect the Fund or its shareholders against losses caused by declines in a municipal bond’s value. Also, the Fund cannot be certain that any insurance company will make the payments it guarantees. ■ Tax risk—the risk that federal income tax rates may decrease, which could decrease demand for municipal bonds, or that a change in law may limit or eliminate exemption of interest on municipal bonds from such taxes. | ■ If interest rates decline, long term yields should be higher than money market yields. ■ Bonds have generally outperformed money market instruments over the long term. ■ Most bonds rise in value when interest rates fall. |
| Visit our website at www.prudentialfunds.com | 39 |
| Conservative Allocation Fund: Principal & Non-Principal Strategies |
| ■ Common Stocks (approximately 40%, may range up to 45%) ■ Small capitalization stocks (up to 15%) ■ Fixed-income securities (approximately 60%, may range up to 65%) ■ Foreign Equity Securities (up to 20%) ■ Securities Denominated in Foreign Currencies (up to 30% of total assets, no more than 15% in emerging markets) ■ U.S. Government and agency securities (percentage varies, up to 100% of total assets on a temporary basis) ■ Money market instruments (amount varies on a normal basis; up to 100% of total assets on a temporary basis) ■ Mortgage-related securities (percentage varies, up to 35%) ■ Asset-Backed Securities (amount varies, up to 25% of total assets) ■ Junk bonds (up to 35% of total assets) ■ Collateralized debt obligations (up to 5% of total assets) ■ Credit-Linked Securities (up to 15% of total assets) ■ Derivatives (percentage varies, but swaps up to 15% of net assets) ■ Reverse repurchase agreements & Dollar Rolls (up to 33 1∕3%, usually less than 10%) ■ When issued and delayed delivery securities: (percentage varies, usually less than 35% of total assets) ■ Borrowing (up to 33 1∕3%, usually less than 10%) ■ Stripped Securities (percentage varies) ■ Illiquid Securities (up to 15% of net assets) ■ Adjustable/floating rate securities (percentage varies) ■ ETFs (up to 5% in any one ETF or other mutual fund, and up to 10% in ETFs or other mutual funds collectively) ■ Corporate loans (up to 5% of total assets) ■ Municipals (up to 10% of net assets) |
| Moderate Allocation Fund: Principal & Non-Principal Strategies |
| ■ Common Stocks (approximately 65%, may range up to 70%) ■ Small capitalization stocks (up to 25%) ■ Fixed-income securities (approximately 35%, may range up to 40%) ■ Foreign Equity Securities (up to 30%) ■ Securities Denominated in Foreign Currencies (up to 30% of total assets, no more than 15% in emerging markets) ■ U.S. Government and agency securities (percentage varies; up to 100% of total assets on a temporary basis) ■ Money market instruments (amount varies on a normal basis; up to 100% of total assets on a temporary basis) ■ Mortgage-related securities (percentage varies, up to 35%) ■ Asset-Backed Securities (amount varies, but usually less than 25% of total assets) ■ Junk bonds (up to 35% of total assets) ■ Collateralized debt obligations (up to 5% of total assets) ■ Credit-Linked Securities (up to 15% of total assets) ■ Derivatives (percentage varies, but swaps up to 15% of net assets) ■ Reverse repurchase agreements & Dollar Rolls (up to 33 1∕3%, usually less than 10%) ■ When issued and delayed delivery securities (percentage varies, usually less than 35% of total assets) ■ Borrowing (up to 33 1∕3%, usually less than 10%) ■ Stripped Securities (percentage varies) ■ Illiquid Securities (up to 15% of net assets) ■ Adjustable/floating rate securities (percentage varies) ■ ETFs (up to 5% in any one ETF or other mutual fund, and up to 10% in ETFs or other mutual funds collectively) ■ Corporate loans (up to 5% of total assets) ■ Municipals (up to 10% of net assets) |
| 40 | Target Asset Allocation Funds |
| Growth Allocation Fund: Principal & Non-Principal Strategies |
| ■ Common Stocks (substantially all) ■ Small capitalization stocks (up to 35%) ■ Foreign Equity Securities (up to 40%) ■ U.S. Government and agency securities (percentage varies; up to 100% on a temporary basis) ■ Money market instruments (amount varies on a normal basis; up to 100% on a temporary basis) ■ Derivatives (percentage varies) ■ Reverse repurchase agreements (up to 33 1∕3%, usually less than 10%) ■ When issued and delayed delivery securities (percentage varies, usually less than 35%) ■ Borrowing (up to 33 1∕3%, usually less than 10%) ■ Illiquid Securities (up to 15% of net assets) ■ ETFs (up to 5% in any one ETF or other mutual funds, and up to 10% in ETFs or other mutual funds collectively) |
| Visit our website at www.prudentialfunds.com | 41 |
HOW THE FUNDS ARE MANAGED
BOARD OF TRUSTEES
The Funds are overseen
by a Board of Trustees (hereafter referred to as Trustees, or the Board). The Board oversees the actions of the Manager, investment subadvisers and Distributor and decides on general policies. The Board also oversees
the Funds’ officers, who conduct and supervise the daily business operations of the Funds.
MANAGER
Prudential Investments
LLC (PI)
Gateway Center Three, 100 Mulberry Street
Newark, NJ 07102-4077
Gateway Center Three, 100 Mulberry Street
Newark, NJ 07102-4077
Under a management agreement with the Funds, PI manages each Fund’s investment operations and administers its business affairs. PI relies on its Strategic Investment Research Group (SIRG) in managing
each Fund’s investment operations. PI is also responsible for all investment advisory services and supervising the subadvisers. For the fiscal year ended July 31, 2012 each Fund paid PI a management fee of 0.75%
of its average daily net assets.
PI and its
predecessors have served as manager or administrator to investment companies since 1987. As of July 31, 2012, PI, a wholly-owned subsidiary of Prudential, served as the investment manager to all of the Prudential U.S.
and offshore open-end investment companies, and as the administrator to closed-end investment companies, with aggregate assets of approximately $179 billion.
Subject to the
supervision of the Board, Pl is responsible for conducting the initial review of prospective investment subadvisers for the Funds. In evaluating a prospective investment subadviser, Pl considers many factors, including
the firm’s experience, investment philosophy and historical performance. Pl is also responsible for monitoring the performance of the Funds’ investment subadvisers.
Pl and the Funds
operate under an exemptive order (the Order) from the Securities and Exchange Commission (the Commission) that generally permits Pl to enter into or amend agreements with unaffiliated investment subadvisers without
obtaining shareholder approval each time. This authority is subject to certain conditions, including the requirement that the Board must approve any new or amended agreements with an investment subadviser. Shareholders
of the Funds still have the right to terminate these agreements at any time by a vote of the majority of outstanding shares of the Fund. The Funds will notify shareholders of any new investment subadvisers or material
amendments to subadvisory agreements pursuant to the Order.
A discussion of the
basis for the Board’s approvals of the management and subadvisory agreements is available in the annual report to shareholders, which is available at the end of September each year.
SUBADVISERS AND
PORTFOLIO MANAGERS
Introduction
The subadvisers are
responsible for the day-to-day management of each Fund segment that they manage, subject to the supervision of PI and the Board. The subadvisers are paid by PI, and not the Funds.
The subadvisers
manage segments within the Funds, focusing on a particular investment type and style. The Manager allocates daily cash inflows (i.e., purchases and reinvested dividends) and outflows ( i.e., redemptions and expense
items) among the segments of each Fund. By using several subadvisers for each Fund, and by periodically rebalancing each Fund in accordance with its asset allocation strategy, the Manager seeks long-term benefits from
a balance of different investment disciplines. The Manager believes that, at any given time, certain investment philosophies will be more successful than others and that a combination of different investment approaches
may benefit the Funds and help reduce their volatility. Reallocations may result in higher portfolio turnover and correspondingly higher transactional costs. In addition, a Fund may experience wash
transactions—where one subadviser buys a security at the same time another subadviser sells it. When this happens, the Fund’s position in that security remains unchanged, but the Fund has paid additional
transaction costs.
The following sets
forth certain information about each of the subadvisers and their portfolio managers (in alphabetical order).
Eagle
Asset Management, Inc. (Eagle)
| 42 | Target Asset Allocation Funds |
Eagle was founded in 1976 and is an autonomous wholly-owned subsidiary of Raymond James Financial, Inc. The firm provides an array of equity and fixed-income investing strategies to a variety of individual
and institutional clients. As of July 31, 2012, Eagle had approximately $19 billion in assets under management. Eagle’s address is 880 Carrillon Parkway, St. Petersburg, FL 33716.
Bert L. Boksen, CFA serves as the lead portfolio manager of the strategy. Mr. Boksen is Senior Vice President and Managing Director of Eagle. He has 31 years of investment experience. He earned a BA in
Business from City College of New York in 1970, and an MBA in Finance from St. John’s University in 1977. Mr. Boksen is a Chartered Financial Analyst. Since January 2002, Mr. Boksen has served as Manager and
President of EG Management I, LLC, general partner of Investment Partnership. Since April, 1995, Mr. Boksen has served as Senior Vice President of Eagle Asset Management, Inc. He has portfolio management
responsibilities for Small Cap Growth Equity accounts. Mr. Boksen was appointed Managing Director of Eagle in June 1999. Prior to joining Eagle, Mr. Boksen was Senior Vice President and Chief Investment Officer of
Raymond James Associates, Inc., where he was Chairman of the Raymond James Focus Committee. Mr. Boksen has been a registered representative of Raymond James Associates, Inc. since 1979.
Mr. Boksen is
assisted by Eric Mintz, CFA. Mr. Mintz is a Co-Portfolio Manager for Small Cap Growth Equity accounts. Mr. Mintz joined Eagle in 2005 as a Senior Research Analyst and brings 13 years of investment
experience as an analyst and research associate. He holds a BA in Economics from Washington and Lee University and earned his MBA from the University of Southern California. Mr. Mintz received his Chartered Financial
Analyst designation in 2000.
Eagle has been a
subadviser to the Funds since July 2008.
EARNEST Partners, LLC (EARNEST)
EARNEST is employee owned and a subsidiary of Westchester Limited, LLC. Paul E. Viera, Jr. (whose background is described below) holds a controlling interest and the position of CEO. Founded in
1998, EARNEST Partners had approximately $20.3 billion in assets under management as of July 31, 2012. The address of EARNEST Partners is 1180 Peachtree Street NE, Suite 2300, Atlanta, GA 30309.
Paul E. Viera, Jr., Chief Executive Officer and Partner of EARNEST Partners, manages the EARNEST Partners segment of the Funds. A founding member of EARNEST Partners, he previously served as a Global Partner
of, and portfolio manager with, INVESCO Capital Management from 1991 to 1998.
EARNEST has been a
subadviser to the Funds since December 2001.
Epoch
Investment Partners, Inc. (Epoch)
Epoch is a
wholly-owned subsidiary of Epoch Holding Corporation, a public company, which was incorporated in April 2004 as a Delaware corporation and is an independent advisory firm. As of July 31, 2012, Epoch managed
approximately $23.7 billion in assets under management. Epoch is located at 640 Fifth Avenue, New York, New York 10019.
David N. Pearl, Janet
K. Navon and Michael A. Welhoelter, CFA are the portfolio managers responsible for the segment of the Funds advised by Epoch.
David N. Pearl is Executive Vice President and Co-Chief Investment Officer of Epoch Investment Partners. He is a Portfolio Manager for Epoch's U.S. investment strategies. Prior to co-founding Epoch in
2004 with Bill Priest, Tim Taussig and Phil Clark, David was a Managing Director and Portfolio Manager at Steinberg Priest & Sloane Capital Management, LLC where he was responsible for both institutional and private
client assets. Previously, he held senior portfolio management positions at ING Furman Selz Asset Management and Citibank Global Asset Management where he managed mutual funds and institutional accounts. Prior to
Citibank, David was an Officer and Senior Analyst of BEA Associates, predecessor to Credit Suisse Asset Management -Americas. David holds a BS in Mechanical Engineering from the University of Pennsylvania and an MBA
from The Stanford University Graduate School of Business.
Janet K. Navon is a Managing Director, Director of Research, and is Portfolio Manager for Epoch's U.S. Small Cap, U.S. SMID Cap, U.S. Choice and Global Small Cap strategies. Additionally, she leads the
weekly U.S. research meetings. Prior to joining Epoch in 2007, Janet spent nine years as a Senior Analyst and Co-Portfolio Manager at Steinberg Asset Management. Prior to Steinberg, she was a founding principal of
Atlantic Asset Management where she was responsible for product development, sector strategies, and corporate security analysis. Janet's experience also includes investment management positions at Columbus Circle
| Visit our website at www.prudentialfunds.com | 43 |
Investors and J.P. Morgan Investment Management where she coordinated quantitative portfolio strategies and new product development. Janet holds a BS from Georgetown University School of Foreign Service
and an MBA from Columbia University, Graduate School of Business.
Michael A. Welhoelter,
CFA is Epoch's Chief Risk Officer and heads Epoch's Quantitative and Risk Management team. He is also a co-portfolio manager on all of Epoch's strategies. He is responsible for integrating
risk management into the investment process. Prior to joining Epoch in 2005, he was a Director and Portfolio Manager in the Quantitative Strategies Group at Columbia Management Group, Inc. In this role, he managed over
$5 billion in mutual funds and separately managed portfolios. Prior to joining Columbia Management Group, he was at Credit Suisse Asset Management-Americas, where he was a Portfolio Manager in the Structured Equity
group, overseeing long/short market neutral and large cap core products. Previously, he was a Portfolio Manager and Quantitative Research Analyst at Chancellor/LGT Asset Management. Mike holds a BA degree in Computer
and Information Science from Colgate University. He is a member of the New York Society of Security Analysts, the Society of Quantitative Analysts and holds the Chartered Financial Analyst designation.
Epoch has served as a
subadviser to the Funds since July 2012.
Hotchkis and Wiley
Capital Management, LLC (Hotchkis and Wiley)
Hotchkis and Wiley is a registered investment adviser, the primary members of which are HWCap Holdings, a limited liability company whose members are current and former employees of Hotchkis and Wiley and
Stephens-H&W, LLC, a limited liability company whose primary member is SF Holdings Corp., which is a diversified holding company. As of July 31, 2012, Hotchkis and Wiley had approximately $17 billion in assets under
management. The address of Hotchkis and Wiley is 725 South Figueroa Street, 39th Floor, Los Angeles, CA 90017-5439.
Hotchkis and Wiley
manages institutional separate accounts and is the adviser and sub-adviser to other mutual funds. The investment process employed is the same for similar accounts, including the Funds, and is team-based utilizing
primarily in-house, fundamental research. The investment research staff is organized by industry and sector and supports all of the accounts managed in each of Hotchkis and Wiley’s strategies. Portfolio
coordinators for each strategy ensure that the best thinking of the investment team is reflected in the “target portfolios.” Investment ideas for each Fund are generated by Hotchkis and Wiley’s
investment team. This list does not include all members of the investment team.
Sheldon Lieberman,
George Davis, Scott McBride, Patricia McKenna, and Judd Peters participate in the investment research review and decision-making process for the segments of the Funds advised by Hotchkis and Wiley. Mr. McBride, Mr. Peters and Mr. Davis coordinate the
day to day management of the Funds. Mr. Lieberman, Principal and Portfolio Manager, joined Hotchkis and Wiley’s investment team in 1994. Mr. Davis, Principal, Portfolio Manager and Chief Executive Officer, joined
Hotchkis and Wiley’s investment team in 1988. Mr. Peters, Portfolio Manager, joined Hotchkis and Wiley’s investment team in 1999. Mr. McBride, Portfolio Manager, joined Hotchkis and Wiley’s investment
team in 2001. Ms. McKenna, Principal and Portfolio Manager, joined Hotchkis and Wiley’s investment team in 1995.
Hotchkis and Wiley
has been a subadvisor to the Funds since April 2005.
LSV Asset Management
(LSV)
LSV
was formed in 1994, and is a quantitative value equity manager providing active asset management for institutional clients through the application of proprietary models. As of July 31, 2012, LSV had approximately $59
billion in assets under management. LSV’s address is 155 North Wacker Drive, Suite 4600, Chicago, IL 60606.
Josef Lakonishok, Menno
Vermuelen, CFA and Puneet Mansharamani, CFA serve as co-portfolio managers for the portion of the international equity segments of the Funds advised by LSV.
Mr. Lakonishok has
served as CEO, CIO, Partner and Portfolio Manager for LSV since its founding in 1994. He has more than 32 years of investment and research experience.
Mr. Vermuelen has
served as a Portfolio Manager and Senior Quantitative Analyst of LSV since 1995 and a Partner since 1998. He has more than 19 years of investment experience. Prior to joining LSV, Mr. Vermuelen served as a portfolio
manager for ABP Investments.
| 44 | Target Asset Allocation Funds |
Mr. Mansharamani,
CFA, has served as a Partner, Portfolio Manager of LSV since January 2006 and a Senior Quantitative Analyst of LSV since 2000. He has more than 12 years of investment experience. Prior to joining LSV, Mr. Mansharamani
was an Analyst at Institutional Trust National City Corporation.
LSV has been a
subadviser to the Funds since April 2005.
Massachusetts Financial
Services Company (MFS)
MFS
is America’s oldest mutual fund organization. MFS and its predecessor organizations have managed money since 1924. MFS is a subsidiary of Sun Life of Canada (U.S.) Financial Services Holdings, Inc., which in turn
is an indirect majority-owned subsidiary of Sun Life Financial Inc. (a diversified financial services company). MFS is located at 500 Boylston Street, Boston, Massachusetts 02116. As of July 31, 2012, the MFS
organization had approximately $283 billion in assets under management.
The Portfolio Manager
responsible for the management of the segment of the Funds subadvised by MFS is Eric B. Fischman. Mr. Fischman is an Investment Officer of MFS. He has been employed in the investment area of MFS since 2000.
MFS has served as a
subadviser to the Funds since December 2008.
Marsico Capital
Management, LLC (Marsico)
Marsico is located at 1200 17th Street, Suite 1600, Denver, CO 80202, and is an independent, registered investment adviser. Marsico was organized in September 1997 as a Delaware limited liability company
and provides investment management services to mutual funds and private accounts. As of July 31, 2012, Marsico had approximately $31.2 billion under management.
Thomas F. Marsico and
Coralie Witter, CFA are the Marsico portfolio managers responsible for making the day-to-day investment decisions for the segments of the Funds advised by Marsico.
Thomas F. Marsico,
Chief Investment Officer of Marsico, co-manages the Marsico-managed portions of the Funds. Mr. Marsico has over 30 years of experience in the investment management field as a securities analyst and a portfolio manager.
Coralie Witter, CFA,
co-manages the Marsico-managed portion of the Funds. Ms. Witter is a senior analyst who joined Marsico in June 2004. She was awarded the designation of Chartered Financial Analyst in 1998. She has over 15 years of
experience in the financial services industry, most of which has involved equity research. Ms. Witter spent six years with Goldman, Sachs & Co., where she was a Vice President in Equity Research and the lead analyst
covering the restaurant industry, and covered various internet companies for several years. Ms. Witter graduated from the University of Colorado with a Bachelor's degree in International Affairs.
Marsico has been a
subadviser to the Funds since June 2005.
NFJ
Investment Group LLC (NFJ)
NFJ was formed in 1989 and is a wholly owned subsidiary of Allianz Global Investors of America L.P. As of June 30, 2012, the firm had over $34.8 billion of worldwide assets under management and advice. NFJ, a disciplined, value-oriented equity manager, is located at 2100 Ross Avenue, Dallas, Texas 75201. The portfolio managers responsible for the portions of the Funds advised by NFJ are Thomas Oliver, CPA, CFA, Ben Fischer, CFA, Paul Magnuson, R. Burns McKinney, CFA and Jeff Reed, CFA.
NFJ was formed in 1989 and is a wholly owned subsidiary of Allianz Global Investors of America L.P. As of June 30, 2012, the firm had over $34.8 billion of worldwide assets under management and advice. NFJ, a disciplined, value-oriented equity manager, is located at 2100 Ross Avenue, Dallas, Texas 75201. The portfolio managers responsible for the portions of the Funds advised by NFJ are Thomas Oliver, CPA, CFA, Ben Fischer, CFA, Paul Magnuson, R. Burns McKinney, CFA and Jeff Reed, CFA.
BEN J. FISCHER, CFA -
MANAGING DIRECTOR, PORTFOLIO MANAGER
Mr. Fischer is a founding partner of NFJ Investment Group. He has over 45 years of experience in portfolio management, investment analysis and research. Prior to founding NFJ in 1989, he was chief investment officer (institutional and fixed income), senior vice president and senior portfolio manager at NationsBank which he joined in 1971. Prior to joining NationsBank, Mr. Fischer was a securities analyst at Chase Manhattan Bank and Clark, Dodge. He received his BA degree in Economics and a JD degree from Oklahoma University, and an MBA from New York University.
Mr. Fischer is a founding partner of NFJ Investment Group. He has over 45 years of experience in portfolio management, investment analysis and research. Prior to founding NFJ in 1989, he was chief investment officer (institutional and fixed income), senior vice president and senior portfolio manager at NationsBank which he joined in 1971. Prior to joining NationsBank, Mr. Fischer was a securities analyst at Chase Manhattan Bank and Clark, Dodge. He received his BA degree in Economics and a JD degree from Oklahoma University, and an MBA from New York University.
PAUL A. MAGNUSON -
MANAGING DIRECTOR, PORTFOLIO MANAGER
Mr. Magnuson joined NFJ in 1992. He is a senior research analyst and a portfolio manager with over 26 years of experience in equity analysis and portfolio management. He currently manages the Small Cap Value strategy and oversees NFJ investment processes. Prior to joining NFJ Investment Group, Mr. Magnuson was an assistant vice president at NationsBank which he joined in 1985. Within the trust investment quantitative services group, he managed structured investment strategies and performed qualitative equity risk analysis on domestic and international portfolios. Mr. Magnuson received his BBA degree in Finance from the University of Nebraska in 1984.
Mr. Magnuson joined NFJ in 1992. He is a senior research analyst and a portfolio manager with over 26 years of experience in equity analysis and portfolio management. He currently manages the Small Cap Value strategy and oversees NFJ investment processes. Prior to joining NFJ Investment Group, Mr. Magnuson was an assistant vice president at NationsBank which he joined in 1985. Within the trust investment quantitative services group, he managed structured investment strategies and performed qualitative equity risk analysis on domestic and international portfolios. Mr. Magnuson received his BBA degree in Finance from the University of Nebraska in 1984.
| Visit our website at www.prudentialfunds.com | 45 |
THOMAS W. OLIVER,
CPA, CFA - MANAGING DIRECTOR, PORTFOLIO MANAGER
Mr. Oliver has over 16 years of experience in accounting, reporting, financial analysis, and portfolio management. Prior to joining NFJ Investment Group in 2005, Mr. Oliver was a manager of corporate reporting at Perot Systems Corporation which he joined in 1999. He began his career as an auditor with Deloitte & Touche in 1995. Mr. Oliver received his BBA and MBA degrees from the University of Texas in 1995 and 2005, respectively.
Mr. Oliver has over 16 years of experience in accounting, reporting, financial analysis, and portfolio management. Prior to joining NFJ Investment Group in 2005, Mr. Oliver was a manager of corporate reporting at Perot Systems Corporation which he joined in 1999. He began his career as an auditor with Deloitte & Touche in 1995. Mr. Oliver received his BBA and MBA degrees from the University of Texas in 1995 and 2005, respectively.
R. BURNS MCKINNEY,
CFA - MANAGING DIRECTOR, PORTFOLIO MANAGER
Mr. McKinney has over 14 years of experience in equity research, financial analysis and investment banking. Prior to joining NFJ Investment Group in 2006, Mr. McKinney was an equity analyst covering the energy sector for Evergreen Investments in Boston. He began his career as an investment banking analyst at Alex. Brown & Sons in 1996. Prior to attending business school, he served as a Vice President in equity research at Merrill Lynch in New York, and also worked as an equity analyst at Morgan Stanley. Mr. McKinney received his BA in Economics from Dartmouth College in 1996 and his MBA from the Wharton School of Business in 2003.
Mr. McKinney has over 14 years of experience in equity research, financial analysis and investment banking. Prior to joining NFJ Investment Group in 2006, Mr. McKinney was an equity analyst covering the energy sector for Evergreen Investments in Boston. He began his career as an investment banking analyst at Alex. Brown & Sons in 1996. Prior to attending business school, he served as a Vice President in equity research at Merrill Lynch in New York, and also worked as an equity analyst at Morgan Stanley. Mr. McKinney received his BA in Economics from Dartmouth College in 1996 and his MBA from the Wharton School of Business in 2003.
JEFF N. REED, CFA
– VICE PRESIDENT, PORTFOLIO MANAGER
Mr. Reed has over 7 years of experience in investment and financial analysis. He began his career as a credit analyst at Frost Bank in 2003. Mr. Reed then attended the University of Texas, where he received his MBA. Upon completion of business school in 2007, Mr. Reed joined NFJ Investment Group. He received his BBA degree in Finance from Texas Christian University in 2003.
Mr. Reed has over 7 years of experience in investment and financial analysis. He began his career as a credit analyst at Frost Bank in 2003. Mr. Reed then attended the University of Texas, where he received his MBA. Upon completion of business school in 2007, Mr. Reed joined NFJ Investment Group. He received his BBA degree in Finance from Texas Christian University in 2003.
NFJ has been a
subadviser to the Funds since December 2005.
Pacific Investment
Management Company LLC (PIMCO)
PIMCO is a limited liability company that is a majority owned subsidiary of Allianz Asset Management of America L.P., formerly known as Allianz Global Investors of America L.P. (“AGI”).
PIMCO is an
investment counseling firm founded in 1971. As of June 30, 2012, PIMCO had approximately $1.468 trillion in assets under management. Effective March 31, 2012, PIMCO began reporting the assets managed on behalf of its
parent's affiliated companies as part of its assets under management. PIMCO is located at 840 Newport Center Drive, Newport Beach, California 92660. Chris Dialynas is responsible for the day-to-day management of the portions of the Funds advised by PIMCO.
Mr. Dialynas is a
managing director in the Newport Beach office, a portfolio manager, and a member of PIMCO’s Investment Committee. He has written extensively and lectured on the topic of fixed-income investing. Mr. Dialynas
served on the editorial board of The Journal of Portfolio Management and was a member of the Fixed Income Curriculum Committee of the Association for Investment Management and Research. He has 34 years of investment
experience and holds an MBA from the University of Chicago Graduate School of Business. He received his undergraduate degree from Pomona College. He joined PIMCO in 1980.
PIMCO has been a
subadviser to the Funds since November 1998.
Thornburg Investment
Management, Inc. (Thornburg)
Thornburg is an independent, employee-owned investment management firm located in Santa Fe, New Mexico. The firm was founded in 1982 and began providing investment management services to clients in 1984.
Thornburg uses a fundamental, bottom-up approach to investing which centers on the intrinsic value of each investment. As of July 31, 2012, Thornburg had approximately $79 billion in assets under management.
Thornburg’s address is 2300 North Ridgetop Road Santa Fe, NM 87506.
William V. Fries, CFA,
Wendy Trevisani, and Lei Wang, CFA, all Managing Directors of Thornburg, are the portfolio managers for the portion of the international equity segments of the Funds advised by Thornburg.
Mr. Fries serves as
the lead portfolio manager. Before joining Thornburg in May 1995, Mr. Fries managed equity mutual funds for 16 years with another mutual fund management company. Before joining Thornburg in March 1999, Ms. Trevisani
served as an institutional sales representative for Salomon Smith Barney in both New York City and London. Ms.Trevisani holds an MBA degree with a concentration in Finance from Columbia University, and a BA in
International Relations from Bucknell University. Lei Wang joined Thornburg Investment Management in 2004 as an Associate Portfolio Manager. Prior to joining Thornburg, Mr. Wang served as a research analyst at Enso
Capital Management LLC in New York City. He has also worked as a Financial Associate at Deutsche Bank in both London and New York City. Previously, Mr. Wang was an Analyst with The People’s Bank of China
(China’s central bank) in Shanghai, China. He completed his BA and MA at East China Normal University and received his MBA in Finance from New York University. He has earned the right to use the CFA designation
and is a member of the CFA Institute and Security Analyst Society of New York.
| 46 | Target Asset Allocation Funds |
Thornburg has been a
subadviser to the Funds since April 2005.
Vaughan Nelson
Investment Management, L.P. (Vaughan Nelson)
Vaughan Nelson is a Houston-based investment counseling firm, founded in 1970. Vaughan Nelson is a wholly owned subsidiary of Natixis Global Asset Management and operates independently with its own
proprietary research process and investment team. As of July 31, 2012, Vaughan Nelson had over $8.0 billion in assets under management. The address of Vaughan Nelson is 600 Travis Street, Suite 6300, Houston, Texas
77002.
Vaughan
Nelson’s small cap value team consists of two members: Chris Wallis, the lead portfolio manager and Scott Weber. Chris D. Wallis, CFA, Senior Portfolio Manager, has 19 years investment management, financial analysis and accounting experience. Prior to joining Vaughan Nelson in 1999, Mr. Wallis
was an Associate at Simmons Company International. He graduated with a BBA from Baylor University and an MBA from Harvard Business School. Scott J. Weber, CFA, Portfolio Manager, has 14 years of investment management and financial analysis experience. Prior to joining Vaughan Nelson in 2003, Mr. Weber was a Vice
President—Investment Banking with RBC Capital Markets. He graduated with a BS from the University of the South and MBA from Tulane University—A.B. Freeman School of Business.
Vaughan Nelson has
been a subadviser to the Funds since July 2005.
Additional
information about portfolio manager compensation, other accounts managed, and portfolio manager ownership of Fund securities may be found in the SAI.
DISTRIBUTORS
Prudential Investment Management Services LLC (PIMS) distributes each class of the Funds’ shares under a Distribution Agreement with the Funds, and Prudential Annuities Distributors, Inc. (PAD)
(together with PIMS, the Distributors) is a co-distributor of each Fund's Class X shares under a Distribution Agreement with the Funds. Each Fund has Distribution and Service Plans (the Plans) under Rule 12b-1 of the
Investment Company Act of 1940, as amended (the 1940 Act), applicable to each Fund's shares. Under the Plans and the Distribution Agreements, the Distributors, as applicable, pay the expenses of distributing the shares
of all share classes of the Funds. The Distributors, as applicable, also provide certain shareholder support services. The Funds pay distribution and other fees to the Distributors, as applicable, as compensation for
their services for each class of shares. These fees—known as 12b-1 fees—are shown in the “Fund Fees and Expenses” tables.
Because these fees
are paid from each Fund's assets on an ongoing basis, over time these fees will increase the cost of your investment and may cost you more than paying other types of sales charges.
DISCLOSURE OF
PORTFOLIO HOLDINGS
A
description of the Funds' policies and procedures with respect to the disclosure of the Funds' portfolio securities is described in the Funds' SAI and on the Funds' website.
| Visit our website at www.prudentialfunds.com | 47 |
FUND DISTRIBUTIONS AND TAX ISSUES
DISTRIBUTIONS
Investors who buy
shares of the Fund should be aware of some important tax issues. For example, the Fund distributes dividends of net investment income and realized net capital gains, if any, to shareholders. These distributions are
subject to federal income taxes, unless you hold your shares in a 401(k) plan, an Individual Retirement Account (IRA) or some other qualified or tax-deferred plan or account. Dividends and distributions from the Fund
also may be subject to state and local income tax in the state where you live.
Also, if you sell
shares of the Fund for a profit, you may have to pay capital gains taxes on the amount of your profit, unless you hold your shares in a qualified or tax-deferred plan or account.
The following briefly
discusses some of the important income tax issues you should be aware of, but is not meant to be tax advice. For tax advice, please speak with your tax adviser.
The
Fund distributes dividends to shareholders out of any net investment income. For example, if the Fund owns ACME Corp. stock and the stock pays a dividend, the Fund will pay out a portion of this
dividend to its shareholders, assuming the Fund's income is more than its costs and expenses. The dividends you receive from the Fund will be subject to taxation whether or not they are reinvested in the Fund.
The Fund also
distributes any realized net capital gains to shareholders. Capital gains are generated when the Fund sells its assets for a profit. For example, if the Fund bought 100 shares of ACME Corp. stock for a total of
$1,000 and more than one year later sold the shares for a total of $1,500, the Fund has net long-term capital gains of $500, which it will pass on to shareholders (assuming the Fund's remaining total gains are greater
than any losses it may have). Capital gains are taxed differently depending on how long the Fund holds the security. If the Fund holds a security for more than one year before selling it, any gain is treated as long-term capital gain which, if recognized in taxable years beginning before January 1, 2013, is generally taxed at rates of up to 15%, provided that the Fund distributes the net
capital gain to non-corporate U.S. shareholders, and up to 20% thereafter. If the Fund holds the security for one year or less, any gain is treated as short-term capital gain, which is taxed at rates applicable to ordinary income. Different rates apply to corporate shareholders.
Dividends from net
investment income paid to a non-corporate U.S. shareholder in a taxable year beginning before January 1, 2013 that are reported as qualified dividend income will generally be taxable to such shareholder at a maximum
rate of 15%. Dividends of net investment income that are not reported as qualified dividend income will be taxable to shareholders at ordinary income rates. Also, a portion of the dividends paid to corporate
shareholders of the Fund will be eligible for the 70% dividends received deduction to the extent the Fund's income is derived from certain dividends received from U.S. corporations.
For taxable years
beginning after December 31, 2012, a U.S. shareholder that is an individual, estate or certain type of trust will be subject to a 3.8% Medicare contribution tax on the lesser of (1) the U.S. shareholder's “net
investment income,” including Fund distributions and net gains from the disposition of Fund shares, and (2) the excess of the U.S. shareholder's modified adjusted gross income for the taxable year over a certain
threshold.
For
your convenience, the Fund's distributions of dividends and net capital gains are automatically reinvested in the Fund without any sales charge. If you ask us to pay the distributions in cash, we will send you a check if your account is with Prudential Mutual Fund
Services LLC (PMFS or the Transfer Agent). Otherwise, if your account is with a broker, you will receive a credit to your account. Either way, the distributions may be subject to income taxes unless your shares are
held in a qualified or tax-deferred plan or account. If your dividend distribution check(s) remains uncashed for more than six months, your check(s) may be invested in additional shares of the Fund at the next net
asset value (“NAV”) calculated on the day of the investment. For more information about automatic reinvestment and other shareholder services, see “Additional Shareholder Services” in the next
section.
The chart below sets
forth the expected frequency of dividend and capital gains distributions to shareholders. Various factors may impact the frequency of dividend distributions to shareholders, including but not limited to adverse market
conditions or portfolio holding-specific events.
| Fund | Dividends Declared and Paid* |
| Conservative Allocation Fund | dividends of net investment income—annually; net capital gains—annually |
| 48 | Target Asset Allocation Funds |
| Fund | Dividends Declared and Paid* |
| Moderate Allocation Fund | dividends of net investment income—annually; net capital gains—annually |
| Growth Allocation Fund | dividends of net investment income—annually; net capital gains—annually |
*Under certain
circumstances, the Funds may make more than one distribution of short-term and/or long-term capital gains during a fiscal year.
TAX ISSUES
Form 1099
For
every year the Fund declares a dividend, you will receive a Form 1099, which reports the amount of ordinary income distributions and long-term capital gains we distributed to you during the prior year unless you own
shares of the Fund as part of a qualified or tax-deferred plan or account. If you do own shares of the Fund as part of a qualified or tax-deferred plan or account, your taxes are deferred, so you will not receive a
Form 1099 annually, but instead you will receive a Form 1099 when you take any distribution from your qualified or tax-deferred plan or account.
Fund distributions
are generally taxable to you in the calendar year in which they are received, except when we declare certain dividends and distributions in the fourth quarter, with a record date in such quarter, and actually pay them
in January of the following year. In such cases, the dividends and distributions are treated as if they were paid on December 31st of the prior year.
Cost
Basis Reporting
Effective January 1,
2012, mutual funds must report cost basis information to you and the IRS when you sell or exchange shares acquired on or after January 1, 2012 in your non-retirement accounts. The new cost basis regulations do not
affect retirement accounts, money market funds, and shares acquired before January 1, 2012. The new cost basis regulations also require mutual funds to report whether a gain or loss is short-term (shares held one year
or less) or long-term (shares held more than one year) for all shares acquired on or after January 1, 2012 that are subsequently sold or exchanged. The Transfer Agent is not required to report cost basis information on
shares acquired before January 1, 2012. However, in most cases the Transfer Agent will provide this information to you as a service.
Withholding Taxes
If
federal tax law requires you to provide the Fund with your taxpayer identification number and certifications as to your tax status and you fail to do this, or if you are otherwise subject to backup withholding, we will
withhold and pay to the U.S. Treasury a portion, currently 28% (scheduled to rise to 31% in 2013), of your distributions and sale proceeds.
Taxation of Foreign
Shareholders
For a discussion
regarding the taxation of foreign shareholders, please see the SAI.
If You Purchase on or
Before a Record Date
If you buy shares of
the Fund on or before the record date for a distribution (the date that determines who receives the distribution), we will pay that distribution to you. As explained above, the distribution may be subject to taxes. You
may think you've done well since you bought shares one day and soon thereafter received a distribution. That is not so, because when dividends are paid out, the value of each share of the Fund decreases by the amount
of the dividend to reflect the payout, although this may not be apparent because the value of each share of the Fund also will be affected by market changes, if any. However, the timing of your purchase does mean that
part of your investment may have come back to you as taxable income.
Qualified and
Tax-Deferred Retirement Plans
Retirement plans and
accounts allow you to defer paying taxes on investment income and capital gains. Contributions to these plans may also be tax-deductible, although distributions from these plans generally are taxable. In the case of
Roth IRA accounts, contributions are not tax-deductible, but distributions from the plan may be tax-free. Please contact your financial adviser for information on a variety of Prudential Investments mutual funds that
are suitable for retirement plans offered by Prudential.
IF YOU SELL OR
EXCHANGE YOUR SHARES
If you sell any shares
of the Fund for a profit, you have realized a capital gain, which is subject to tax unless the shares are held in a qualified or tax-deferred plan or account. For individuals and other non-corporate shareholders, the
maximum capital gains tax rate is generally 15%, if the gain is recognized in a taxable year beginning before January 1, 2013, and 20% thereafter, for shares held for more than one year.
| Visit our website at www.prudentialfunds.com | 49 |
If you sell shares of
the Fund at a loss, you may have a capital loss, which you may use to offset capital gains you have, plus, in the case of non-corporate taxpayers, ordinary income of up to $3,000. If you sell shares and realize a loss,
you will not be permitted to use the loss to the extent you replace the shares (including pursuant to the reinvestment of a dividend) within a 61-day period (beginning 30 days before and ending 30 days after the sale
of the shares). Under certain circumstances, if you acquire shares of the Fund and sell or exchange your shares within 90 days, you may not be allowed to include certain charges incurred in acquiring the shares for
purposes of calculating gain or loss realized upon the sale or exchange of the shares.
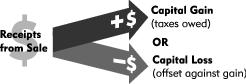
If you exchange your
Fund shares for shares of another class of the Fund, this is generally not a taxable event and should not result in realization of a capital gain or loss by you. If you exchange your shares of the Fund for shares of
another Prudential Investments mutual fund, this is considered a sale for tax purposes. In other words, it's a taxable event. Therefore, if the shares you exchanged have increased in value since you purchased them, you
have capital gains, which are subject to the taxes described above. Unless you hold your shares in a qualified or tax-deferred plan or account, you or your financial adviser should keep track of the dates on which you
buy and sell—or exchange—Fund shares, as well as the amount of any gain or loss on each transaction. For tax advice, please see your tax adviser.
Automatic Conversion of Class B and Class X Shares
The conversion of
Class B or Class X shares of the Fund—which happens automatically approximately every seven or ten years, respectively, after purchase—is not a taxable event for federal income tax purposes. For more
information about the automatic conversion of Class B and Class X shares, see “Class B and Class X Shares Automatically Convert to Class A Shares” in the “How to Buy, Sell and Exchange Fund
Shares” section.
| 50 | Target Asset Allocation Funds |
HOW TO BUY, SELL AND EXCHANGE FUND SHARES
HOW TO BUY SHARES
In order to buy Fund
shares, simply follow the steps described below.
Opening an Account
If
you don't have an account with us or a financial services firm that is permitted to buy or sell shares of the Fund for you, contact PMFS at (800) 225-1852 or write to:
Prudential Mutual Fund
Services LLC
P.O. Box 9658
Providence, RI 02940
P.O. Box 9658
Providence, RI 02940
You
may purchase shares by check or wire. We do not accept cash, money orders, foreign checks, credit card checks, payable through checks or travelers checks. To purchase by wire, call the number above to obtain an
application. After PMFS receives your completed application, you will receive an account number. For additional information, see the back cover page of this Prospectus. We have the right to reject any purchase order
(including an exchange into a Fund) or suspend or modify a Fund's sale of its shares, including due to failure by you to provide additional information requested, such as information needed to verify the source of
funds used to purchase shares, your identity or the identity of any underlying beneficial owners of your shares.
With certain limited
exceptions, Fund shares are only available to be sold in the United States, U.S. Virgin Islands, Puerto Rico and Guam.
Choosing a Share Class
The Funds offer the
following share classes. Certain classes of shares may have additional specific eligibility or qualification requirements, which are explained below.
| Share Class | Eligibility |
| Class A | Individual investors |
| Class B | Individual investors |
| Class C | Individual investors |
| Class R | Certain group retirement plans |
| Class X | Closed to new investors. Available only by exchange from same share class of another Prudential Investments fund |
| Class Z | Institutional investors and certain other investors |
Multiple share
classes let you choose a cost structure that meets your needs:
| ■ | Class A shares purchased in amounts of less than $1 million require you to pay a sales charge at the time of purchase, but the operating expenses of Class A shares are lower than the operating expenses of Class B and Class C shares. Investors who purchase $1 million or more of Class A shares and sell these shares within 12 months of purchase are also subject to a contingent deferred sales charge (CDSC) of 1%. The CDSC is waived for certain retirement and/or benefit plans. |
| ■ | Class B shares do not require you to pay a sales charge at the time of purchase, but do require you to pay a sales charge if you sell your shares within six years (that is why it is called a CDSC). The operating expenses of Class B shares are higher than the operating expenses of Class A shares. |
| ■ | Class C shares do not require you to pay a sales charge at the time of purchase, but do require you to pay a sales charge if you sell your shares within 12 months of purchase. The operating expenses of Class C shares are higher than the operating expenses of Class A shares. |
When choosing a share
class, you should consider the following factors:
| ■ | The amount of your investment and any previous or planned future investments, which may qualify you for reduced sales charges for Class A shares under Rights of Accumulation or a Letter of Intent. |
| ■ | The length of time you expect to hold the shares and the impact of varying distribution fees. Over time, these fees will increase the cost of your investment and may cost you more than paying other types of sales charges. For this reason, Class C shares are generally appropriate only for investors who plan to hold their shares for no more than 3 years. |
| ■ | The different sales charges that apply to each share class—Class A's front-end sales charge (in certain cases, CDSC) vs. Class B's CDSC vs. Class C's lower CDSC. |
| ■ | The fact that Class B shares automatically convert to Class A shares approximately seven years after purchase. |
| Visit our website at www.prudentialfunds.com | 51 |
| ■ | Class B shares purchased in single amounts greater than $100,000 are generally less advantageous than purchasing Class A shares. Purchase orders for Class B shares exceeding this amount generally will not be accepted. |
| ■ | Class C shares purchased in single amounts greater than $1 million are generally less advantageous than purchasing Class A shares. Purchase orders for Class C shares above this amount generally will not be accepted. |
| ■ | Because Class Z and Class R shares have lower operating expenses than Class A, Class B or Class C shares, as applicable, you should consider whether you are eligible to purchase Class Z or Class R shares. |
See “How to
Sell Your Shares” for a description of the impact of CDSCs.
Some investors
purchase or sell shares of the Fund through financial intermediaries and omnibus accounts maintained by brokers that aggregate the orders of multiple investors and forward the aggregate orders to the Fund. If your
shares are held through a broker-dealer, financial adviser, financial planner or other financial intermediary, you should discuss with your financial intermediary which share classes of the Fund are available to you
and which share class may best meet your needs. The Fund has advised the financial intermediaries and broker-dealers who maintain such accounts of the share class features and guidelines, per the Prospectus, and it is
their responsibility to monitor and enforce these guidelines with respect to shareholders purchasing shares through financial intermediaries or omnibus accounts.
Share Class Comparison. Use the following chart to help you compare the different share classes. The discussion following this chart will tell you whether you are entitled to a reduction or waiver of any sales
charges.
| Class A | Class B | Class C | Class R | Class X | Class Z | |
| Minimum purchase amount | $2,500 | $2,500 | $2,500 | None | $2,500 | None |
| Minimum amount for subsequent purchases | $100 | $100 | $100 | None | $100 | None |
| Maximum initial sales charge | 5.5% of the public offering price | None | None | None | None | None |
| Contingent Deferred Sales Charge (CDSC) (as a percentage of the lower of original purchase price or sale proceeds) | 1% on sales of $1 million or more made within 12 months of purchase | 5% (Year 1) 4% (Year 2) 3% (Year 3) 2% (Year 4) 1% (Years 5/6) 0% (Year 7) | 1% on sales made within 12 months of purchase | None | 6% (Year 1) 5% (Year 2) 4% (Year 3/4) 3% (Year 5) 2% (Year 6/7) 1% (Year 8) 0% (Year 9) | None |
| Annual distribution and service (12b-1) fees (shown as a percentage of average daily net assets) | .30% (.25% currently) | 1% | 1% | .75% (.50% currently) | 1% | None |
Notes to Share Class
Comparison Table:
° The minimum initial and subsequent investment requirements do not apply to employee savings plan accounts, payroll deduction plan accounts, or when exchanging all shares of an account to an
existing account with the same registration. The minimum initial investment for retirement accounts and custodial accounts for minors is $1,000. The minimum initial and subsequent investment for AIP accounts is $50 (if
your shares are held through a broker or other financial intermediary, the broker or intermediary is responsible for determining the minimum initial and subsequent investment for AIP accounts)
° If the
value of your Class A, Class B, Class C or Class X account with PMFS is less than $10,000, the Fund will deduct a $15 annual account maintenance fee from your account. The $15 annual account maintenance fee will be
assessed during the 4th calendar quarter of each year. Any applicable CDSC on the shares redeemed to pay the $15 account maintenance fee will be waived. The $15 account maintenance fee will not be charged on: (i)
accounts during the first six months from inception of the account, (ii) accounts which are authorized for electronic delivery of account statements, transaction confirmations, prospectuses and fund shareholder
reports; (iii) omnibus accounts or accounts for which a broker or other financial intermediary is responsible for recordkeeping, (iv) institutional accounts, (v) group retirement plans, (vi) AIP accounts or employee
savings plan accounts, (vii) accounts with the same registration associated with multiple share classes within the Fund, provided that the aggregate value of share classes with the same registration within the Fund is
$10,000 or more, or (viii) clients with assets of more than $50,000 across the Prudential Investments family of mutual funds. For more information, see “Purchase, Redemption and Pricing of Fund
Shares—Account Maintenance Fee” in the SAI.
° Class X shares are closed to new initial purchases. Class X shares are only available through exchanges from Class X shares of certain other Prudential Investments funds.
° For more information about the CDSC and how it is calculated, see “How to Sell Your Shares—Contingent Deferred Sales Charge (CDSC).”
° Investors who purchase $1 million or more of Class A shares and redeem those shares within 12 months of purchase are subject to a CDSC of 1%, but are not subject to an initial sales charge. The
CDSC is waived for certain retirement or benefit plans.
° Distribution and service (12b-1) fees are paid from each Fund’s assets on a continuous basis. The service fee for each of Class A, Class B, Class C, Class R and Class X shares is .25%
and the remainder of each class distribution and service (12b-1) fee consists of a distribution fee. For the period ending November 30, 2013, the Distributor has contractually agreed to reduce its distribution and
service (12b-1) fees for Class A shares to .25% of the average daily net assets of Class A shares and for Class R shares to .50% of the average daily net assets of the Class R shares.
° With respect to Class X shares, the service fee is up to .25% of the Fund’s Class X shares. The distribution fee for Class X shares, is up to 1% (including the .25% service fee).
| 52 | Target Asset Allocation Funds |
Reducing or Waiving
Class A's Initial Sales Charge
The following
describes the different ways investors can reduce or avoid paying Class A's initial sales charge.
Increase the Amount
of Your Investment. You can reduce Class A's initial sales charge by increasing the amount of your investment. This table shows how the sales charge decreases as the amount of your investment increases:
| Amount of Purchase | Sales Charge as a % of Offering Price | Sales Charge as a % of Amount Invested | Dealer Reallowance |
| Less than $25,000 | 5.50% | 5.82% | 5.00% |
| $25,000 to $49,999 | 5.00% | 5.26% | 4.50% |
| $50,000 to $99,999 | 4.50% | 4.71% | 4.00% |
| $100,000 to $249,999 | 3.75% | 3.90% | 3.25% |
| $250,000 to $499,999 | 2.75% | 2.83% | 2.50% |
| $500,000 to $999,999 | 2.00% | 2.04% | 1.75% |
| $1 million to $4,999,999* | None | None | 1.00%** |
* If you invest $1 million or more, you can buy only Class A shares, unless you qualify to buy other share classes. If you purchase $1 million or more of Class A shares and sell these shares within 12
months of purchase, you will be subject to a 1% CDSC, although you will not be subject to an initial sales charge. The CDSC is waived for purchases by certain retirement and/or benefit plans.
** For investments of $5 million to $9,999,999, the dealer reallowance is .50%. For investments of $10 million and over, the dealer reallowance is .25%.
To satisfy the
purchase amounts above, you can:
| ■ | Use your Rights of Accumulation, which allow you or an eligible group of related investors to combine (1) the current value of Prudential Investments mutual fund shares you or the group already own, (2) the value of money market shares (other than Direct Purchase money market shares) you or an eligible group of related investors have received for shares of other Prudential Investments mutual funds in an exchange transaction, and (3) the value of the shares you or an eligible group of related investors are purchasing; or |
| ■ | Sign a Letter of Intent, stating in writing that you or an eligible group of related investors will purchase a certain amount of shares in the Fund and other Prudential Investments mutual funds within 13 months. |
An “eligible
group of related investors” includes any combination of the following:
| ■ | All accounts held in your name (alone or with other account holders) and taxpayer identification number (TIN); |
| ■ | Accounts held in your spouse's name (alone or with other account holders) and TIN (see definition of spouse below); |
| ■ | Accounts for your children or your spouse's children, including children for whom you and/or your spouse are legal guardian(s) (e.g., UGMAs and UTMAs); |
| ■ | Accounts in the name and TINs of your parents; |
| ■ | Trusts with you, your spouse, your children, your spouse's children and/or your parents as the beneficiaries; |
| ■ | With limited exclusions, accounts with the same address (exclusions include, but are not limited to, addresses for brokerage firms and other intermediaries and Post Office boxes); and |
| ■ | Accounts held in the name of a company controlled by you (a person, entity or group that holds 25% or more of the outstanding voting securities of a company will be deemed to control the company, and a partnership will be deemed to be controlled by each of its general partners), including employee benefit plans of the company where the accounts are held in the plan's TIN. |
A
“spouse” is defined as follows:
| ■ | The person to whom you are legally married. We also consider your spouse to include the following: |
| ■ | An individual of the same gender with whom you have been joined in a civil union, or legal contract similar to marriage; |
| ■ | A domestic partner, who is an individual (including one of the same gender) with whom you have shared a primary residence for at least six months, in a relationship as a couple where you, your domestic partner or both provide for the personal or financial welfare of the other without a fee, to whom you are not related by blood; or |
| ■ | An individual with whom you have a common law marriage, which is a marriage in a state where such marriages are recognized between a man and a woman arising from the fact that the two live together and hold themselves out as being married. |
The value of shares
held by you or an eligible group of related investors will be determined as follows:
| ■ | for Class A shares and any other share class for which a sales charge is paid, the value of existing shares is determined by the maximum offering price (NAV plus maximum sales charge); and |
| ■ | for all other share classes, the value of existing shares is determined by the NAV. |
| Visit our website at www.prudentialfunds.com | 53 |
Note: Class Z shares or Class R shares cannot be aggregated with any other share class for purposes of reducing or waiving Class A's initial sales charge.
If your shares are
held directly by the Transfer Agent, and you believe you qualify for a reduction or waiver of Class A's initial sales charge, you must notify the Transfer Agent at the time of the qualifying share purchase in order to
receive the applicable reduction or waiver. If your shares are held through a broker or other financial intermediary, and you believe you qualify for a reduction or waiver of Class A's initial sales charge, you must
notify your broker or intermediary at the time of the qualifying purchase in order to receive the applicable reduction or waiver. Shares held through a broker or other financial intermediary will not be systematically
aggregated with shares held directly by the Transfer Agent for purposes of receiving a reduction or waiver of Class A's initial sales charge. The reduced or waived sales charge will be granted subject to confirmation
of account holdings.
If your shares are
held directly by the Transfer Agent, you must identify the eligible group of related investors. Although the Transfer Agent does not require any specific form of documentation in order to establish your eligibility to
receive a waiver or reduction of Class A's initial sales charge, you may be required to provide appropriate documentation if the Transfer Agent is unable to establish your eligibility.
If your shares are
held through a broker or other intermediary, the broker or intermediary is responsible for determining the specific documentation, if any, that you may need in order to establish your eligibility to receive a waiver or
reduction of Class A's initial sales charge. Your broker or intermediary is also responsible for notifying the Transfer Agent if your share purchase qualifies for a reduction or waiver of Class A's initial sales charge.
Purchases of $1
Million or More. If you purchase $1 million or more of Class A shares, you will not be subject to an initial sales charge, although a CDSC may apply, as previously noted.
Mutual Fund Programs. The initial sales charge will be waived for participants in any fee-based program or trust program sponsored by Prudential or an affiliate that includes the Fund as an available option. The
initial sales charge will also be waived for investors in certain programs sponsored by broker-dealers, investment advisers and financial planners who have agreements with Prudential, or whose programs are available
through financial intermediaries that have agreements with Prudential, relating to:
| ■ | Mutual fund “wrap” or asset allocation programs, where the sponsor places fund trades, links its clients' accounts to a master account in the sponsor's name and charges its clients a management, consulting or other fee for its services, or |
| ■ | Mutual fund “supermarket” programs, where the sponsor links its clients' accounts to a master account in the sponsor's name and the sponsor charges a fee for its services. |
Broker-dealers,
investment advisers or financial planners sponsoring these mutual fund programs may offer their clients more than one class of shares in the Fund in connection with different pricing options for their programs.
Investors should consider carefully any separate transaction and other fees charged by these programs in connection with investing in each available share class before selecting a share class.
Group Retirement Plans. The Class A initial sales charge will be waived for group retirement plans (including defined contribution plans, defined benefit plans and deferred compensation plans) available through a
retirement plan recordkeeper or third party administrator. If Prudential Retirement Services is the recordkeeper for your group retirement plan, you may call Prudential at (800) 353-2847 with any questions. Otherwise, investors in group retirement plans should contact their financial intermediary with any questions regarding availability of Class A shares at net
asset value.
Other Types of
Investors. Certain other types of investors may purchase Class A shares without paying the initial sales charge, including:
| ■ | certain directors, officers, employees (including their spouses, children and parents) of Prudential and its affiliates, the Prudential Investments mutual funds, and the investment subadvisers of the Prudential Investments mutual funds; |
| ■ | persons who have retired directly from active service with Prudential or one of its subsidiaries; |
| ■ | certain real estate brokers, agents and employees of real estate brokerage companies affiliated with the Prudential Real Estate Affiliates; |
| ■ | registered representatives and employees of broker-dealers that have entered into dealer agreements with the Distributor; |
| ■ | investors in IRAs, provided that: (a) the purchase is made either from a directed rollover to such IRA or with the proceeds of a tax-free rollover of assets from a Benefit Plan for which Prudential Retirement (the institutional Benefit Plan recordkeeping entity of Prudential) provides administrative or recordkeeping services, in each case provided that such purchase is made |
| 54 | Target Asset Allocation Funds |
| within 60 days of receipt of the Benefit Plan distribution, and (b) the IRA is established through Prudential Retirement as part of its “Rollover IRA” program (regardless of whether or not the purchase consists of proceeds of a tax-free rollover of assets from a Benefit Plan described above) and | |
| ■ | Clients of financial intermediaries, who (i) have entered into an agreement with the principal underwriter to offer Class A shares through a no-load network or platform, (ii) charge clients an ongoing fee for advisory, investment, consulting or similar services, or (iii) offer self-directed brokerage accounts that may or may not charge transaction fees to customers. |
To qualify for a
waiver of the Class A sales charge at the time of purchase, you must notify the Transfer Agent, or the Distributor must be notified by the broker facilitating the purchase, that the transaction qualifies for a waiver
of the Class A sales charge. The waiver will be granted subject to confirmation of your account holdings.
Additional
Information About Reducing or Waiving Class A's Sales Charge. The Fund also makes available free of charge, on the Fund's website, in a clear and prominent format, information relating to the Fund's Class A initial sales charge, and the different ways
that investors can reduce or avoid paying the initial sales charge. The Fund's website includes hyperlinks that facilitate access to this information.
You may need to
provide your broker-dealer or other financial intermediary through which you hold Fund shares with the information necessary to take full advantage of reduced or waived Class A sales charges.
The Distributor may
reallow the Class A sales charge to dealers.
Qualifying for Class Z
Shares
Institutional Investors. Various institutional investors may purchase Class Z shares, including corporations, banks, governmental entities, municipalities, hospitals, insurance companies and IRS Section 501
entities, such as foundations and endowments. The minimum initial investment for such investors is $10 million. Institutional investors are responsible for indicating their eligibility to purchase Class Z shares at the
time of purchase. Certain financial intermediaries may require that investments by their institutional investor clients in Class Z shares be placed directly with the Fund's Transfer Agent. Please contact the Transfer
Agent at (800) 225-1852 for further details.
Mutual Fund Programs. Class Z shares can be purchased by participants in any fee-based program or trust program sponsored by Prudential or an affiliate that includes the Fund as an available option. Class Z
shares also can be purchased by investors in certain programs sponsored by broker-dealers, investment advisers and financial planners who have agreements with Prudential, or whose programs are available through
financial intermediaries that have agreements with Prudential, relating to:
| ■ | Mutual fund “wrap” or asset allocation programs where the sponsor places fund trades, links its clients' accounts to a master account in the sponsor's name and charges its clients a management, consulting or other fee for its services; or |
| ■ | Mutual fund “supermarket” programs where the sponsor links its clients' accounts to a master account in the sponsor's name and the sponsor charges a fee for its services. |
Broker-dealers,
investment advisers or financial planners sponsoring these mutual fund programs may offer their clients more than one class of shares in the Fund in connection with different pricing options for their programs.
Investors should consider carefully any separate transaction and other fees charged by these programs in connection with investing in a share class offered by the program before selecting a share class.
Group Retirement Plans. Group retirement plans (including defined contribution plans, defined benefit plans and deferred compensation plans) available through a retirement plan recordkeeper or third party
administrator may purchase Class Z shares. If Prudential Retirement Services is the recordkeeper for your group retirement plan, you may call Prudential at (800) 353-2847 with any questions. Otherwise, investors in group retirement plans should contact their financial intermediary with any questions regarding availability of Class Z shares.
Other Types of
Investors. Class Z shares also can be purchased by any of the following:
| ■ | Certain participants in the MEDLEY Program (group variable annuity contracts) sponsored by Prudential for whom Class Z shares of the Prudential mutual funds are an available option; |
| ■ | Current and former Directors/Trustees of mutual funds managed by PI or any other affiliate of Prudential; |
| ■ | Prudential, with an investment of $10 million or more (except that seed money investments by Prudential in other Prudential funds may be made in any amount); |
| ■ | Prudential funds, including Prudential fund-of-funds; and |
| ■ | Qualified state tuition programs (529 plans). |
| Visit our website at www.prudentialfunds.com | 55 |
Qualifying for Class R
Shares
Group Retirement Plans. Class R shares are offered for sale to (i) certain group retirement plans (including defined contribution plans, defined benefit plans and deferred compensation plans) available through a
retirement plan recordkeeper or third party administer, and (ii) IRAs that are held on the books of a Fund through omnibus level accounts, including The SmartSolution IRA offered by Prudential Retirement. If Prudential
Retirement Services is the recordkeeper for your group retirement plan, you may call Prudential at (800) 353-2847 with any questions. Investors in SmartSolution IRA accounts through Prudential’s Personal
Retirement Services unit can call 888-244-6237 with any questions regarding how to purchase shares. Otherwise, investors in group retirement plans should contact their financial intermediary with any questions
regarding availability of Class R shares.
Class B and Class X
Shares Automatically Convert to Class A Shares
If you buy Class B
shares and hold them for approximately seven years, or if you buy Class X shares and hold them for approximately ten years, we will automatically convert them into Class A shares without charge. The number of Class B
and Class X shares eligible to convert to Class A shares will be the total number of shares that have completed their Class B and Class X aging schedule (including any time spent at 0% liability), plus all shares
acquired through the reinvestment of dividends for Class B shares and a proportionate number of shares acquired through reinvestment of dividends for Class X shares. Since the distribution and service (12b-1) fees for
Class A shares are lower than for Class B or Class X shares, converting to Class A shares lowers your Fund expenses.
Class B and Class X
shares acquired through the reinvestment of dividends or distributions will be converted to Class A shares according to the procedures utilized by the broker-dealer through which the Class B and Class X shares were
purchased, to the extent the shares are carried on the books of the broker-dealer and the broker-dealer provides subaccounting services to the Fund. Otherwise, the procedures utilized by Prudential Mutual Fund Services
LLC, or its affiliates, will be used. The use of different procedures may result in a timing differential in the conversion of Class B and Class X shares acquired through the reinvestment of dividends and distributions.
When we do the
conversion, you will get fewer Class A shares than the number of converted Class B or Class X shares if the price of the Class A shares is higher than the price of the Class B or Class X shares. The total dollar value
will be the same, so you will not have lost any money by getting fewer Class A shares. Conversions are quarterly for Class B shares and monthly for Class X shares.
If you hold Class B
share certificates, the certificates must be received by the Transfer Agent in order for your Class B shares to convert from Class B to Class A shares. Certificate deposited shares will convert during the next
quarterly conversion.
For more information,
see the SAI.
How Financial Services
Firms are Compensated for Selling Fund Shares
The Prudential
Investments and Target Mutual Funds are distributed by Prudential Investment Management Services LLC (the Distributor), a broker-dealer that is licensed to sell securities. The Distributor generally does not sell
shares of the Funds directly to the public, but instead markets and sells the Funds through other broker-dealers, 401(k) providers, retirement plan administrators, and other financial intermediaries. For ease of
reference, we refer to all financial intermediaries collectively as “financial services firms.” Each Fund is managed by the Manager.
Only persons licensed
with the Financial Industry Regulatory Authority, Inc. (FINRA), as a registered representative (often referred to as a broker or financial adviser) and associated with a specific financial services firm may sell shares
of a mutual fund to you, or to a retirement plan in which you participate.
Rule 12b-1 Fees &
Sales Charges. The Distributor has agreements in place with financial services firms defining how much each firm will be paid for the sale of a particular mutual fund from front-end sales charges, if any,
paid by Fund shareholders and from fees paid to the Distributor by the Fund pursuant to Rule 12b-1 under the 1940 Act (Rule 12b-1). These financial services firms then pay their registered representatives who sold you
the Fund some or all of what they received from the Distributor. The registered representatives may receive a payment when the sale is made and can, in some cases, continue to receive ongoing payments while you are
invested in the Fund. The Distributor may change at any time, without prior notice, the amount of Rule 12b-1 fees that it pays (when the sale is made and/or any ongoing payments) to financial services firms and
registered representatives so that the Distributor may retain all or a portion of such fees.
| 56 | Target Asset Allocation Funds |
“Revenue
Sharing” Payments. In addition to the compensation received by financial services firms as described above, the Manager or certain of its affiliates (but not the Distributor) may make additional payments
(which are often referred to as “revenue sharing” payments) to the financial services firms from the Manager's or certain affiliates' own resources, including from the profits derived from management or
other fees received from the Fund, without additional direct or indirect cost to the Fund or its shareholders. Revenue sharing payments are in addition to the front-end sales charges paid by Fund shareholders or fees
paid pursuant to plans adopted in accordance with Rule 12b-1. The Manager or certain of its affiliates may revise the terms of any existing revenue sharing arrangement, and may enter into additional revenue sharing
arrangements with other financial services firms in the future.
Revenue sharing
arrangements are intended to foster the sale of Fund shares and/or to compensate financial services firms for assisting in marketing or promotional activities in connection with the sale of Fund shares. In exchange for
revenue sharing payments, the Fund generally expects to receive the opportunity for the Fund to be sold through the financial services firms' sales force or access to third-party platforms or other marketing programs,
including but not limited to mutual fund “supermarket” platforms or other sales programs. To the extent that financial services firms receiving revenue sharing payments sell more shares of the Fund, the
Manager and Distributor benefit from the increase in Fund assets as a result of the management and distribution fees they receive from the Fund, respectively. Increased sales of Fund shares also may benefit
shareholders, since an increase in Fund assets may allow the Fund to expand its investment opportunities, and increased Fund assets may result in reduced Fund operating expenses.
Revenue sharing
payments, as well as the other types of payments described above, may provide an incentive for financial services firms and their registered representatives to recommend or sell shares of the Fund to you and in doing
so may create conflicts of interest between the firms' financial interests and their duties to customers.
If your Fund shares
are purchased through a retirement plan, the Manager or certain of its affiliates (but not the Distributor) may also make revenue sharing payments to the plan's record keeper or an affiliate, which generally is not a
registered broker-dealer. Rule 12b-1 fees and sales charges may only be paid to a registered broker-dealer.
It is likely that
financial services firms that execute portfolio transactions for the Fund will include those firms with which the Manager and/or certain of its affiliates have entered into revenue sharing arrangements. Neither the
Manager nor any subadviser may consider sales of Fund shares as a factor in the selection of broker-dealers to execute portfolio transactions for the Fund. The Manager and certain of its affiliates will not use Fund
brokerage as any part of revenue sharing payments to financial services firms.
Revenue sharing
payments are usually calculated based on a percentage of Fund sales and/or Fund assets attributable to a particular financial services firm. Payments may also be based on other criteria or factors, for example, a fee
per each transaction. Specific payment formulas are negotiated based on a number of factors, including, but not limited to, reputation in the industry, ability to attract and retain assets, target markets, customer
relationships and scope and quality of services provided. The Manager and/or certain of its affiliates make such payments to financial services firms in amounts that generally range from .02% up to .20% of Fund assets
serviced and maintained by the financial services firms or from .10% to .25% of sales of Fund shares attributable to the firm. In addition, the Manager and/or certain of its affiliates may pay flat fees on a one-time
or irregular basis for the initial set-up of the Fund on a financial services firm's systems, participation or attendance at a financial services firm's meeting, or for other reasons. These amounts are subject to
change. In addition, the costs associated with visiting the financial services firms to make presentations, and/or train and educate the personnel of the financial services firms, may be paid by the Manager and/or
certain of its affiliates, subject to applicable FINRA regulations.
Please contact the
registered representative (or his or her firm) who sold shares of the Fund to you for details about any payments the financial services firm may receive from the Manager and/or certain of its affiliates. You should
review your financial services firm's disclosure and/or talk to your financial services firm to obtain more information on how this compensation may have influenced your financial services firm's recommendation of the
Fund. Additional information regarding these revenue sharing payments is included in the SAI which is available to you at no additional charge.
Other Payments Received
by Financial Services Firms
Administrative,
Sub-Accounting and Networking Fees. In addition to, rather than in lieu of, the fees that the Fund may pay to financial services firms as described above, and the fees the Fund pays to the Transfer Agent, the Transfer Agent
or its affiliates may enter into additional agreements on behalf of the Fund with financial services firms pursuant to which the Fund will pay financial services firms for certain administrative, sub-accounting and
networking services. These services include maintenance of shareholder accounts by the firms, such as record-keeping and other activities that otherwise would be performed by the Transfer
| Visit our website at www.prudentialfunds.com | 57 |
Agent. Sub-accounting services encompass activities that reduce the burden of record-keeping to the Fund. Administrative fees are paid to a firm that undertakes, for example, shareholder communications on
behalf of the Fund. Networking services are services undertaken to support the electronic transmission of shareholder purchase and redemption orders through the National Securities Clearing Corporation (NSCC).
These payments, as
discussed above, are paid out of Fund assets and generally based on either (1) a percentage of the average daily net assets of Fund shareholders serviced by a financial services firm or (2) a fixed dollar amount for
each account serviced by a financial services firm. From time to time, the Manager or certain of its affiliates (but not the Distributor) also may pay a portion of the fees for the services to the financial services
firms at their own expense and out of their own resources.
In addition, the Fund
reimburses the Distributor for NSCC fees that are invoiced to the Distributor as the party to the Agreement with NSCC for the administrative services provided by NSCC to the Fund and its shareholders. These
administrative services provided by NSCC to the Fund and its shareholders include transaction processing and settlement through Fund/SERV, electronic networking services to support the transmission of shareholder
purchase and redemption orders to and from financial intermediaries, and related recordkeeping provided by NSCC to the Fund and its shareholders. These payments are generally based on a transaction fee rate for certain
administrative services plus a fee for other administrative services.
Anti-Money Laundering
In accordance with
federal law, the Fund has adopted policies designed to deter money laundering. Under the policies, the Fund will not knowingly engage in financial transactions that involve proceeds from unlawful activity or support
terrorist activities, and shall file government reports, including those concerning suspicious activities, as required by applicable law. The Fund will seek to confirm the identity of potential shareholders to include
both individuals and entities through documentary and non-documentary methods. Non-documentary methods may include verification of name, address, date of birth and tax identification number with selected credit
bureaus. The Fund has also appointed an Anti-Money Laundering Compliance Officer to oversee the Fund's anti-money laundering policies.
Understanding the Price
You'll Pay
The price you pay for
each share of the Fund is based on the share value. The share value of a mutual fund—known as the net asset value or NAV—is determined by a simple calculation: it's the total value of the Fund (assets minus liabilities) divided by the total number of shares outstanding. For example, if the
value of the investments held by Fund XYZ (minus its liabilities) is $1,000 and there are 100 shares of Fund XYZ owned by shareholders, the value of one share of the Fund—or the NAV—is $10 ($1,000 divided
by 100).
Mutual Fund Shares
The NAV of mutual fund shares changes every day because the value of a fund's portfolio changes constantly. For example, if Fund XYZ holds ACME Corp. bonds in its portfolio and the price of ACME bonds goes
up, while the value of the Fund's other holdings remains the same and expenses don't change, the NAV of Fund XYZ will increase.
The
Fund's NAV will be determined every day on which the Fund is open as of the close of regular trading on the New York Stock Exchange (NYSE) (generally, 4:00 p.m. Eastern time). The Fund's portfolio securities are valued
based upon market quotations or, if market quotations are not readily available, at fair value as determined in good faith under procedures established by the Board. These procedures include pricing methodologies for
determining the fair value of certain types of securities and other assets held by the Fund that do not have quoted market prices, and authorize the use of other pricing sources, such as bid prices supplied by a
principal market maker and evaluated prices supplied by pricing vendors that employ analytic methodologies that take into account the prices of similar securities and other market factors.
If the Fund
determines that a market quotation for a security is not reliable based on, among other things, events or market conditions that occur with respect to one or more securities held by the Fund or the market as a whole,
after the quotation is derived or after the closing of the primary market on which the security is traded, but before the time that the Fund's NAV is determined, the Fund may use “fair value pricing,” which
is implemented by a valuation committee (Valuation Committee) consisting of representatives of the Manager and subadviser or by the Board. In addition, the Fund may use fair value pricing determined by the Valuation
Committee or Board if the pricing source does not provide an evaluated price for a security or provides an evaluated price that, in the judgment of the Manager (or subadviser), does not represent fair value. Securities
that are primarily traded outside the United States may also be subject to a fair value pricing adjustment using a service provided by a
| 58 | Target Asset Allocation Funds |
pricing vendor, if it is determined that market quotations from those non-U.S. markets are not reliable, based on market movements after the close of the relevant non-U.S. markets. Non-U.S. securities
markets are open for trading on weekends and other days when the Fund does not price shares. Therefore, the value of the Fund’s shares may change on days when you will not be able to purchase or redeem the
Fund’s shares.
With respect to any
portion of the Fund's assets that are invested in one or more open-end investment companies, the Fund's NAV will be calculated based upon the NAV of the investment company in which the Fund invests.
Different valuation
methods may result in differing values for the same security. The fair value of a portfolio security that the Fund uses to determine its NAV may differ from the security's quoted or published price. If the Fund needs
to implement fair value pricing after the NAV publishing deadline but before shares of the Fund are processed, the NAV you receive or pay may differ from the published NAV price.
Fair value pricing
procedures are designed to result in prices for the Fund's securities and its NAV that are reasonable in light of the circumstances which make or have made market quotations unavailable or unreliable, and may have the
effect of reducing arbitrage opportunities available to short-term traders. There is no assurance, however, that fair value pricing will more accurately reflect the market value of a security than the market price of
such security on that day or that it will prevent dilution of the Fund's NAV by short-term traders.
What
Price Will You Pay for Shares of the Fund? For Class A shares, you'll pay the public offering price, which is the NAV next determined after we receive your order to purchase, plus an initial sales charge (unless you're entitled to a
waiver). For all other share classes, you will pay the NAV next determined after we receive your order to purchase (remember, there are no up-front sales charges for these share classes). Your broker may charge you a
separate or additional fee for purchases of shares. Unless regular trading on the NYSE closes before 4:00 p.m. Eastern time, or later than 4:00 p.m. Eastern time, your order to purchase must be received by the Transfer
Agent by 4:00 p.m. Eastern time in order to receive that day's NAV. In the event that regular trading on the NYSE closes before 4:00 p.m. Eastern time, you will receive the following day's NAV if your order to purchase
is received by the Transfer Agent after the close of regular trading on the NYSE.
Additional Shareholder
Services
As a Fund shareholder,
you can take advantage of the following services and privileges:
Automatic Reinvestment. As we explained in the “Fund Distributions and Tax Issues” section, the Fund pays out—or distributes—its net investment income and net capital gains to all
shareholders. For your convenience, we will automatically reinvest your distributions in the Fund at NAV, without any sales charge. If you want your distributions paid in cash, you can indicate this preference on your
application, or by notifying your broker or the Transfer Agent in writing (at the address below) at least five business days before the date we determine who receives dividends. For accounts held at the Transfer Agent
(PMFS), distributions of $10.00 or less on non-retirement accounts will not be paid out in cash, but will be automatically reinvested into your account.
Prudential Mutual Fund
Services LLC
P.O. Box 9658
Providence, RI 02940
P.O. Box 9658
Providence, RI 02940
Automatic Investment
Plan (AIP). You can make regular purchases of the Fund by having a fixed amount of money automatically withdrawn from your bank or brokerage account at specified intervals. The minimum for subsequent
investments through newly-established AIP accounts must be at least $50 monthly.
Retirement Plan
Services. Prudential offers a wide variety of retirement plans for individuals and institutions, including large and small businesses. For information on IRAs, including Roth IRAs or SEP-IRAs for a
one-person business, please contact your financial adviser. If you are interested in opening a 401(k) or other company-sponsored retirement plan (SIMPLE IRAs, SEP plans, Keoghs, 403(b)(7) plans, pension and
profit-sharing plans), your financial adviser will help you determine which retirement plan best meets your needs. Complete instructions about how to establish and maintain your plan and how to open accounts for you
and your employees will be included in the retirement plan kit you receive in the mail.
Systematic Withdrawal
Plan. A Systematic Withdrawal Plan is available that will provide you with monthly, quarterly, semi-annual or annual redemption checks. The Systematic Withdrawal Plan is not available to
participants in certain retirement plans. Please contact PMFS at (800) 225-1852 for more details.
| Visit our website at www.prudentialfunds.com | 59 |
Reports to
Shareholders. Every year we will send you an annual report (along with an updated prospectus) and a semi-annual report, which contain important financial information about the Fund. To reduce Fund
expenses, we may send one annual shareholder report, one semi-annual shareholder report and one annual prospectus per household, unless you instruct us or your broker otherwise. If each Fund shareholder in your
household would like to receive a copy of the Fund's prospectus, shareholder report and proxy statement, please call us toll free at (800) 225-1852. We will begin sending additional copies of these documents within 30
days of receipt of your request.
HOW TO SELL YOUR
SHARES
You can sell your Fund
shares for cash (in the form of a check) at any time, subject to certain restrictions. For more information about these restrictions, see “Restrictions on Sales” below.
When
you sell shares of a Fund—also known as redeeming your shares—the price you will receive will be the NAV next determined after the Transfer Agent, the Distributor or your broker receives your order to sell
(less any applicable CDSC). If your broker holds your shares, your broker must receive your order to sell no later than the time regular trading on the NYSE closes—which is usually 4:00 p.m. Eastern time—to
process the sale on that day. In the event that regular trading on the NYSE closes before 4:00 p.m. Eastern time, you will receive the following day's NAV if your order to sell is received after the close of regular
trading on the NYSE. Otherwise, contact:
Prudential Mutual Fund
Services LLC
P.O. Box 9658
Providence, RI 02940
P.O. Box 9658
Providence, RI 02940
Generally, we will
pay you for the shares that you sell within seven days after the Transfer Agent, the Distributor or your broker receives your sell order. If you hold shares through a broker, payment will be credited to your account.
If you are selling shares you recently purchased with a check, we may delay sending you the proceeds until your check clears, which can take up to seven days from the purchase date. Your broker may charge you a
separate or additional fee for sales of shares.
As a result of
restrictions on withdrawals and transfers imposed by Section 403(b) of the Internal Revenue Code of 1986, as amended, we may consider a redemption request to not be in good order until we obtain information from your
employer that is reasonably necessary to ensure that the payment is in compliance with such restrictions, if applicable. In such an event, the redemption request will not be in good order and we will not process it
until we obtain information from your employer.
Restrictions on Sales
There are certain times when you may not be able to sell shares of the Fund or when we may delay paying you the proceeds from a sale. As permitted by the Securities and Exchange Commission, the former may
happen only during unusual market conditions or emergencies when the Fund can't determine the value of its assets or sell its holdings. For more information, see the SAI.
If you hold your
shares directly with the Transfer Agent, you will need to have the signature on your sell order medallion signature guaranteed if:
| ■ | You are selling more than $100,000 of shares; |
| ■ | You want the redemption proceeds made payable to someone that is not in our records; |
| ■ | You want the redemption proceeds sent to some place that is not in our records; |
| ■ | You are a business or a trust; or |
| ■ | You are redeeming due to the death of the shareholder or on behalf of the shareholder. |
The medallion
signature guarantee may be obtained from an authorized officer from a bank, broker, dealer, securities exchange or association, clearing agency, savings association, or credit union that is participating in one of the
recognized medallion guarantee programs (STAMP, SEMP, or NYSE MSP). The medallion signature guarantee must be appropriate for the dollar amount of the transaction. The Transfer Agent reserves the right to reject
transactions where the value of the transaction exceeds the value of the surety coverage indicated on the medallion imprint. For more information, see the SAI.
Contingent Deferred
Sales Charge (CDSC)
If you sell shares
during certain periods of time (the CDSC periods) after purchase, you may have to pay a CDSC. The CDSC period and the CDSC rate for each share class are set forth in the table below:
| Year 1 | Year 2 | Year 3 | Year 4 | Year 5 | Year 6 | Year 7 | Year 8 | |
| Class A | 1% | N/A | N/A | N/A | N/A | N/A | N/A | N/A |
| 60 | Target Asset Allocation Funds |
| Year 1 | Year 2 | Year 3 | Year 4 | Year 5 | Year 6 | Year 7 | Year 8 | |
| Class B | 5% | 4% | 3% | 2% | 1% | 1% | N/A | N/A |
| Class C | 1% | N/A | N/A | N/A | N/A | N/A | N/A | N/A |
| Class X | 6% | 5% | 4% | 4% | 3% | 2% | 2% | 1% |
Notes to CDSC Table:
° No CDSC is payable for any share class for the ninth year after purchase and any following year.
° Although you are not subject to an initial sales charge, you will be subject to a 1% CDSC if you purchase $1 million or more of Class A shares and redeem those shares within 12 months of purchase.
If you sell Class B
shares within six years of purchase, Class C shares within 12 months of purchase, or Class X shares within eight years of purchase, you will have to pay a CDSC. In addition, if you purchase $1 million or more of Class
A shares, although you are not subject to an initial sales charge, you are subject to a 1% CDSC for shares redeemed within 12 months of purchase. (The CDSC is waived for purchases by certain retirement and/or benefit
plans.) To keep the CDSC as low as possible, we will sell amounts representing shares in the following order:
| ■ | Amounts representing shares you purchased with reinvested dividends and distributions, |
| ■ | Amounts representing the increase in NAV above the total amount of payments for shares made during the past 12 months for Class A shares (in certain cases), six years for Class B shares, 12 months for Class C shares, and eight years for Class X shares, |
| ■ | Any bonus shares received by investors when purchasing Class X shares, and |
| ■ | Amounts representing the cost of shares held beyond the CDSC period (12 months for Class A shares (in certain cases), six years for Class B shares, 12 months for Class C shares, and eight years for Class X shares). |
Since shares that
fall into any of the categories listed above are not subject to the CDSC, selling them first helps you to avoid—or at least minimize—the CDSC.
Having sold the
exempt shares first, if there are any remaining shares that are subject to the CDSC, we will apply the CDSC to amounts representing the cost of shares held for the longest period of time within the applicable CDSC
period.
The
CDSC is calculated based on the lesser of the original purchase price or the redemption proceeds, except for Class X purchases made after January 1, 2002, on which the CDSC will be calculated based on the original cost
of the purchase. The rate decreases on the anniversary date of your purchase. The holding period for purposes of determining the applicable CDSC will be calculated from the anniversary date of the purchase, excluding
any time Class B or Class C shares were held in a money market fund.
| Visit our website at www.prudentialfunds.com | 61 |
Waiver
of the CDSC—Class B and Class X Shares
The CDSC will be
waived if the Class B and Class X shares are sold:
| ■ | After a shareholder is deceased or disabled (or, in the case of a trust account, the death or disability of the grantor). This waiver applies to individual shareholders, as well as shares held in joint tenancy, provided the shares were purchased before the death or disability, |
| ■ | To provide for certain distributions—made without IRS penalty—from a tax-deferred retirement plan, IRA or Section 403(b) custodial account, and |
| ■ | On certain sales effected through a Systematic Withdrawal Plan. |
For more information
on the above and other waivers, see the SAI.
Waiver of the
CDSC—Class C Shares
Benefit Plans. The CDSC will be waived for redemptions by certain group retirement plans for which Prudential or brokers not affiliated with Prudential provide administrative or recordkeeping services.
The CDSC also will be waived for certain redemptions by benefit plans sponsored by Prudential and its affiliates. For more information, call Prudential at (800) 353-2847.
Redemption In Kind
If the sales of Fund
shares you make during any 90-day period reach the lesser of $250,000 or 1% of the value of the Fund's net assets, we can then give you securities from the Fund's portfolio instead of cash. If you want to sell the
securities for cash, you would have to pay the costs charged by a broker. You would also be responsible for any tax consequences resulting from your ownership of the securities.
Involuntary Redemption
of Small Accounts
If the value of your
account with PMFS is less than $500 for any reason, we may sell your shares (without charging any CDSC) and close your account. We would do this to minimize the Fund's expenses paid by other shareholders. The
involuntary sale provisions do not apply to Automatic Investment Plan (AIP) accounts, employee savings plan accounts, payroll deduction plan accounts, retirement accounts (such as a 401(k) plan, an IRA or other
qualified or tax-deferred plan or account), omnibus accounts, and accounts for which a broker or other financial intermediary is responsible for recordkeeping. Prior thereto, if you make a sale that reduces your
account value to less than the threshold, we may sell the rest of your shares (without charging any CDSC) and close your account; this involuntary sale does not apply to shareholders who own their shares as part of a
retirement account. For more information, see “Purchase, Redemption and Pricing of Fund Shares—Involuntary Redemption” in the SAI.
Account Maintenance Fee
If the value of your
account with PMFS is less than $10,000, with certain exclusions, a $15 annual account maintenance fee will be deducted from your account during the 4th calendar quarter of each year. Any applicable CDSC on the shares
redeemed to pay the account maintenance fee will be waived. For more information, see “Purchase, Redemption and Pricing of Fund Shares—Account Maintenance Fee” in the SAI.
90-Day Repurchase
Privilege
After you redeem your shares (except for Class X shares), you have a 90-day period during which you may reinvest back into your account any of the redemption proceeds in shares of the same Fund without
paying an initial sales charge. After you redeem your Class X shares, you have a 90-day period during which you may reinvest back into your account any of the redemption proceeds in Class A shares of the same Fund
without paying an initial sales charge. For Class B shares, if you paid a CDSC when you redeemed your Class B shares, we will credit your account with the appropriate number of shares to reflect the amount of the CDSC
you paid on that reinvested portion of your redemption proceeds. In order to take advantage of this one-time privilege, you must notify the Transfer Agent or your broker at the time of the repurchase. For more
information, see the SAI.
Retirement Plans
To sell shares and
receive a distribution from your retirement account, call your broker or the Transfer Agent for a distribution request form. There are special distribution and income tax withholding requirements for distributions from
retirement plans and you must submit a withholding form with your request to avoid delay. If your retirement plan account is held for you by your employer or plan trustee, you must arrange for the distribution request
to be signed and sent by the plan administrator or trustee. For additional information, see the SAI.
| 62 | Target Asset Allocation Funds |
HOW TO EXCHANGE
YOUR SHARES
You
can exchange your shares of the Fund for shares of the same class in certain other Prudential Investments mutual funds—including Prudential MoneyMart Assets (a money market fund)—if you satisfy the minimum
investment requirements. For example, you can exchange Class A shares of the Fund for Class A shares of other funds in the Prudential Investments mutual fund family, but you can’t exchange Class A shares for a
different share class of another fund. After an exchange, at redemption, any CDSC will be calculated from the date of the initial purchase, excluding any time that Class B or Class C shares were held in Prudential
MoneyMart Assets. We may change the terms of any exchange privilege after giving you 60 days' notice.
There is no sales
charge for exchanges. However, if you exchange—and then sell—shares within the applicable CDSC period, you must still pay the applicable CDSC. If you have exchanged Class B or Class C shares into Prudential
MoneyMart Assets, the time you hold the Class B or Class C shares in the money market fund will not be counted in calculating the required holding period for CDSC liability.
For investors in
certain programs sponsored by broker-dealers, investment advisers and financial planners who have agreements with Prudential, or whose programs are available through financial intermediaries that have agreements with
Prudential relating to mutual fund “wrap” or asset allocation programs or mutual fund “supermarket” programs, an exchange may be made from Class A to Class Z shares of the Fund in certain
limited circumstances. Contact your program sponsor or financial intermediary with any questions.
If you hold shares
through a broker, you must exchange shares through your broker. Otherwise contact:
Prudential Mutual Fund
Services LLC
P.O. Box 9658
Providence, RI 02940
P.O. Box 9658
Providence, RI 02940
If
you participate in any fee-based program where the Fund is an available investment option, you may arrange with the Transfer Agent or your recordkeeper to exchange your Class A shares, if any, for Class Z shares when
you elect to participate in the fee-based program. When you no longer participate in the program, you may arrange with the Transfer Agent or your recordkeeper to exchange all of your Class Z shares, including shares
purchased while you were in the program, for Class A shares.
Likewise, if you are
entitled to purchase Class Z shares as a participant in Wells Fargo Advisors’ 401(k) Plan and you seek to transfer your Class Z shares out of the 401(k) Plan after your voluntary or involuntary termination of
employment or retirement, you may arrange with the Transfer Agent or your recordkeeper to exchange your Class Z shares held in the 401(k) Plan for Class A shares.
Remember, as we
explained in the section entitled “Fund Distributions and Tax Issues—If You Sell or Exchange Your Shares,” exchanging shares is considered a sale for tax purposes. Therefore, if the shares you
exchange are worth more than the amount that you paid for them, you may have to pay capital gains tax. For additional information about exchanging shares, see the SAI.
Frequent Purchases and
Redemptions of Fund Shares
The Fund seeks to
prevent patterns of frequent purchases and redemptions of Fund shares by its shareholders. Frequent purchases and sales of shares of the Fund may adversely affect Fund performance and the interests of long-term
investors. When a shareholder engages in frequent or short-term trading, the Fund may have to sell portfolio securities to have the cash necessary to redeem the shareholder's shares. This can happen when it is not
advantageous to sell any securities, so the Fund's performance may be hurt. When large dollar amounts are involved, frequent trading can also make it difficult to use long-term investment strategies because the Fund
cannot predict how much cash it will have to invest. In addition, if the Fund is forced to liquidate investments due to short-term trading activity, it may incur increased brokerage and tax costs. Similarly, the Fund
may bear increased administrative costs as a result of the asset level and investment volatility that accompanies patterns of short-term trading. Moreover, frequent or short-term trading by certain shareholders may
cause dilution in the value of Fund shares held by other shareholders. Funds that invest in foreign securities may be particularly susceptible to frequent trading because time zone differences among international stock
markets can allow a shareholder engaging in frequent trading to exploit fund share prices that may be based on closing prices of foreign securities established some time before the Fund calculates its own share price.
Funds that invest in certain fixed-income securities, such as high-yield bonds or certain asset-backed securities, may also constitute an effective vehicle for a shareholder's frequent trading strategy.
| Visit our website at www.prudentialfunds.com | 63 |
The Fund does not
knowingly accommodate or permit frequent trading, and the Board has adopted policies and procedures designed to discourage or prevent frequent trading activities by Fund shareholders. In an effort to prevent such
practices, the Fund's Transfer Agent monitors trading activity on a daily basis. The Fund has implemented a trading policy that limits the number of times a shareholder may purchase Fund shares or exchange into the
Fund and then sell those shares within a specified period of time (a “round-trip transaction”) as established by the Fund's Chief Compliance Officer (CCO). The CCO is authorized to set and modify the
parameters of the trading policy at any time as required to prevent the adverse impact of frequent trading on Fund shareholders.
The
CCO has defined frequent trading as one or more round–trip transactions in shares of the Fund within a 30-day period. If this occurs, the shareholder’s account will be subject to a 60-day warning period. If
a second round-trip occurs before the conclusion of the 60-day warning period, a trading suspension will be placed on the account by the Fund’s Transfer Agent that will remain in effect for 90 days. The trading
suspension will relate to purchases and exchange purchases (but not redemptions) in the Fund in which the frequent trading occurred. Exceptions to the trading policy will not normally be granted.
Transactions in the
Prudential Investments money market funds are excluded from this policy. In addition, transactions by the Prudential Asset Allocation Funds and the Prudential Real Assets Fund, which are structured as
“funds-of-funds,” and invest primarily in other mutual funds within the Prudential Investments fund family, are not subject to the limitations of the trading policy and are not considered frequent or
short-term trading.
The
Fund reserves the right to reject or cancel, without prior notice, all additional purchases or exchanges into the Fund by a shareholder. Moreover, the Fund may direct a broker-dealer or other intermediary to block a
shareholder account from future trading in the Fund. The Transfer Agent will monitor trading activity over $25,000 per account on a daily basis for a rolling 90-day period. If a purchase into the Fund is rejected or
canceled, the shareholder will receive a return of the purchase amount.
If the Fund is
offered to qualified plans on an omnibus basis or if Fund shares may be purchased through other omnibus arrangements, such as through a financial intermediary such as a broker-dealer, a bank, an insurance company
separate account, an investment adviser, or an administrator or trustee of a retirement plan (“Intermediaries”) that holds your shares in an account under its name, Intermediaries maintain the individual
beneficial owner records and submit to the Fund only aggregate orders combining the transactions of many beneficial owners. The Fund itself generally cannot monitor trading by particular beneficial owners. The Fund has
notified Intermediaries in writing that it expects the Intermediaries to impose restrictions on transfers by beneficial owners. Intermediaries may impose different or stricter restrictions on transfers by beneficial
owners. Consistent with the restrictions described above, investments in the Fund through retirement programs administered by Prudential Retirement will be similarly identified for frequent purchases and redemptions
and appropriately restricted.
The Transfer Agent
also reviews the aggregate net flows in excess of $1 million. In those cases, the trade detail is reviewed to determine if any of the activity relates to potential offenders. In cases of omnibus orders, the
Intermediary may be contacted by the Transfer Agent to obtain additional information. The Transfer Agent has the authority to cancel all or a portion of the trade if the information reveals that the activity relates to
potential offenders. Where appropriate, the Transfer Agent may request that the Intermediary block a financial adviser or client from accessing the Fund. If necessary, the Fund may be removed from a particular
Intermediary's platform.
Shareholders seeking
to engage in frequent trading activities may use a variety of strategies to avoid detection and, despite the efforts of the Fund to prevent such trading, there is no guarantee that the Fund, the Transfer Agent or
Intermediaries will be able to identify these shareholders or curtail their trading practices. The Fund does not have any arrangements intended to permit trading of its shares in contravention of the policies described
above.
Telephone Redemptions
or Exchanges
You
may redeem your shares of the Fund if the proceeds of the redemption do not exceed $100,000 or exchange your shares in any amount by calling the Fund at (800) 225-1852 and communicating your instructions in good order
to a customer service representative before 4:00 p.m. Eastern time. You will receive a redemption or exchange amount based on that day's NAV. Certain restrictions apply; please see the section entitled “How to
Sell Your Shares—Restrictions on Sales” above for additional information. In the event that regular trading on the NYSE closes before 4:00 p.m. Eastern time, you will receive the following day's NAV if your
order to sell or exchange is received after the close of regular trading on the NYSE.
| 64 | Target Asset Allocation Funds |
The Transfer Agent
will record your telephone instructions and request specific account information before redeeming or exchanging shares. The Fund will not be liable for losses due to unauthorized or fraudulent telephone instructions if
it follows instructions that it reasonably believes are made by the shareholder. If the Fund does not follow reasonable procedures, it may be liable.
In the event of
drastic economic or market changes, you may have difficulty in redeeming or exchanging your shares by telephone. If this occurs, you should consider redeeming or exchanging your shares by mail or through your broker.
The telephone
redemption and exchange procedures may be modified or terminated at any time. If this occurs, you will receive a written notice from the Fund.
Expedited Redemption
Privilege
If
you have selected the Expedited Redemption Privilege, you may have your redemption proceeds sent directly to your bank account. Expedited redemption requests may be made by telephone or letter, must be received by the
Fund prior to 4:00 p.m. Eastern time to receive a redemption amount based on that day's NAV and are subject to the terms and conditions regarding the redemption of shares. In the event that regular trading on the NYSE
closes before 4:00 p.m. Eastern time, you will receive the following day's NAV if your order to sell is received after the close of regular trading on the NYSE. For more information, see the SAI. The Expedited
Redemption Privilege may be modified or terminated at any time without notice.
| Visit our website at www.prudentialfunds.com | 65 |
FINANCIAL HIGHLIGHTS
Introduction
The
financial highlights will help you evaluate the Fund's financial performance for the fiscal years ended July 31, 2012, 2011, 2010, 2009 and 2008. In addition, for Class M shares only, the financial highlights include
the financial performance for the fiscal year ended July 31, 2007. Certain information reflects financial results for a single fund share. The total return in each chart represents the rate that a shareholder would
have earned (or lost) on an investment in the Fund, assuming investment at the start of the period and reinvestment of all dividends and other distributions. The information is for the periods indicated.
A copy of the Fund's
annual report, along with the Fund's audited financial statements and report of independent registered public accounting firm, is available upon request, at no charge, as described on the back cover of this Prospectus.
The financial
highlights were derived from the financial statements audited by KPMG LLP, independent registered public accounting firm, whose report on those financial statements was unqualified.
| 66 | Target Asset Allocation Funds |
TARGET
CONSERVATIVE ALLOCATION FUND
| Class A Shares | |||||
| Year Ended July 31, | |||||
| 2012(c) | 2011(c) | 2010(c) | 2009(c) | 2008(c) | |
| Per Share Operating Performance: | |||||
| Net Asset Value, Beginning Of Year | $10.30 | $9.53 | $8.48 | $9.84 | $10.66 |
| Income (loss) from investment operations: | |||||
| Net investment income | .17 | .16 | .18 | .23 | .27 |
| Net realized and unrealized gain (loss) on investments | .38 | .79 | .90 | (.92) | (.32) |
| Total from investment operations | .55 | .95 | 1.08 | (.69) | (.05) |
| Less Dividends and Distributions: | |||||
| Dividends from net investment income | (.16) | (.18) | (.03) | (.37) | (.27) |
| Tax return of capital | – | – | – | (.05) | – |
| Distributions from net realized gains on investments | – | – | – | (.25) | (.50) |
| Total dividends and distributions | (.16) | (.18) | (.03) | (.67) | (.77) |
| Net asset value, end of year | $10.69 | $10.30 | $9.53 | $8.48 | $9.84 |
| Total Return(a) | 5.53% | 10.04% | 12.72% | (6.36)% | (.75)% |
| Ratios/Supplemental Data: | |||||
| Net assets, end of year (000) | $86,352 | $86,746 | $75,228 | $63,491 | $68,408 |
| Average net assets (000) | $84,243 | $83,395 | $70,865 | $59,479 | $65,817 |
| Ratios to average net assets(d): | |||||
| Expenses, including distribution and service (12b-1) fees(b) | 1.54% | 1.52% | 1.52% | 1.64%(e) | 1.43% |
| Expenses, excluding distribution and service (12b-1) fees | 1.29% | 1.27% | 1.27% | 1.39%(e) | 1.18% |
| Net investment income | 1.64% | 1.59% | 2.00% | 2.76% | 2.59% |
| Portfolio turnover rate | 248% | 188% | 200% | 356% | 353% |
(a) Total return does
not consider the effects of sales loads. Total return is calculated assuming a purchase of a share on the first day and a sale on the last day of each year reported and includes reinvestment of dividends and
distributions. Total returns may reflect adjustments to conform to generally accepted accounting principles.
(b)
The distributor of the Fund has contractually agreed to limit its distribution and service (12b-1) fees to .25% of the average daily assets of the Class A shares.
(c) Calculated based upon the average shares outstanding during the year.
(d) Does not include expenses of the underlying portfolios in which the Fund invests.
(e) Includes interest expense of .06%.
| Visit our website at www.prudentialfunds.com | 67 |
| Class B Shares | |||||
| Year Ended July 31, | |||||
| 2012(b) | 2011(b) | 2010(b) | 2009(b) | 2008(b) | |
| Per Share Operating Performance: | |||||
| Net Asset Value, Beginning Of Year | $10.15 | $9.41 | $8.43 | $9.82 | $10.64 |
| Income (loss) from investment operations: | |||||
| Net investment income | .09 | .08 | .11 | .17 | .19 |
| Net realized and unrealized gain (loss) on investments | .39 | .78 | .89 | (.92) | (.32) |
| Total from investment operations | .48 | .86 | 1.00 | (.75) | (.13) |
| Less Dividends and Distributions: | |||||
| Dividends from net investment income | (.09) | (.12) | (.02) | (.34) | (.19) |
| Tax return of capital | – | – | – | (.05) | – |
| Distributions from net realized gains on investments | – | – | – | (.25) | (.50) |
| Total dividends and distributions | (.09) | (.12) | (.02) | (.64) | (.69) |
| Net asset value, end of year | $10.54 | $10.15 | $9.41 | $8.43 | $9.82 |
| Total Return(a) | 4.86% | 9.20% | 11.82% | (7.05)% | (1.49)% |
| Ratios/Supplemental Data: | |||||
| Net assets, end of year (000) | $7,856 | $13,995 | $23,212 | $32,609 | $56,853 |
| Average net assets (000) | $10,840 | $18,900 | $28,746 | $39,077 | $70,345 |
| Ratios to average net assets(c): | |||||
| Expenses, including distribution and service (12b-1) fees | 2.29% | 2.27% | 2.27% | 2.39%(d) | 2.18% |
| Expenses, excluding distribution and service (12b-1) fees | 1.29% | 1.27% | 1.27% | 1.39%(d) | 1.18% |
| Net investment income | .93% | .82% | 1.26% | 2.08% | 1.82% |
| Portfolio turnover rate | 248% | 188% | 200% | 356% | 353% |
(a) Total return does
not consider the effects of sales loads. Total return is calculated assuming a purchase of a share on the first day and a sale on the last day of each year reported and includes reinvestment of dividends and
distributions. Total returns may reflect adjustments to conform to generally accepted accounting principles.
(b) Calculated based upon the average shares outstanding during the year.
(c) Does not include expenses of the underlying portfolios in which the Fund invests.
(d) Includes interest expense of .06%.
| 68 | Target Asset Allocation Funds |
| Class C Shares | |||||
| Year Ended July 31, | |||||
| 2012(b) | 2011(b) | 2010(b) | 2009(b) | 2008(b) | |
| Per Share Operating Performance: | |||||
| Net Asset Value, Beginning Of Year | $10.15 | $9.41 | $8.43 | $9.82 | $10.64 |
| Income (loss) from investment operations: | |||||
| Net investment income | .09 | .08 | .11 | .17 | .19 |
| Net realized and unrealized gain (loss) on investments | .39 | .78 | .89 | (.92) | (.32) |
| Total from investment operations | .48 | .86 | 1.00 | (.75) | (.13) |
| Less Dividends and Distributions: | |||||
| Dividends from net investment income | (.09) | (.12) | (.02) | (.34) | (.19) |
| Tax return of capital | – | – | – | (.05) | – |
| Distributions from net realized gains on investments | – | – | – | (.25) | (.50) |
| Total dividends and distributions | (.09) | (.12) | (.02) | (.64) | (.69) |
| Net asset value, end of year | $10.54 | $10.15 | $9.41 | $8.43 | $9.82 |
| Total Return(a) | 4.86% | 9.20% | 11.82% | (7.05)% | (1.49)% |
| Ratios/Supplemental Data: | |||||
| Net assets, end of year (000) | $17,307 | $19,133 | $20,499 | $21,777 | $29,417 |
| Average net assets (000) | $17,651 | $20,208 | $21,746 | $23,090 | $32,068 |
| Ratios to average net assets(c): | |||||
| Expenses, including distribution and service (12b-1) fees | 2.29% | 2.27% | 2.27% | 2.39%(d) | 2.18% |
| Expenses, excluding distribution and service (12b-1) fees | 1.29% | 1.27% | 1.27% | 1.39%(d) | 1.18% |
| Net investment income | .89% | .83% | 1.26% | 2.04% | 1.83% |
| Portfolio turnover rate | 248% | 188% | 200% | 356% | 353% |
(a) Total return does
not consider the effects of sales loads. Total return is calculated assuming a purchase of a share on the first day and a sale on the last day of each year reported and includes reinvestment of dividends and
distributions. Total returns may reflect adjustments to conform to generally accepted accounting principles.
(b) Calculated based upon the average shares outstanding during the year.
(c) Does not include expenses of the underlying portfolios in which the Fund invests.
(d) Includes interest expense of .06%.
| Visit our website at www.prudentialfunds.com | 69 |
| Class M Shares | ||||||
| Period Ended April 13, 2012(b)(e) | Year Ended July 31, | |||||
| 2011(b) | 2010(b) | 2009(b) | 2008(b) | 2007 | ||
| Per Share Operating Performance: | ||||||
| Net Asset Value, Beginning Of Period | $10.15 | $9.41 | $8.43 | $9.82 | $10.64 | $10.31 |
| Income (loss) from investment operations: | ||||||
| Net investment income | .07 | .08 | .12 | .17 | .19 | .17 |
| Net realized and unrealized gain (loss) on investments | .31 | .78 | .88 | (.92) | (.32) | .56 |
| Total from investment operations | .38 | .86 | 1.00 | (.75) | (.13) | .73 |
| Less Dividends and Distributions: | ||||||
| Dividends from net investment income | (.09) | (.12) | (.02) | (.34) | (.19) | (.19) |
| Tax return of capital | – | – | – | (.05) | – | – |
| Distributions from net realized gains on investments | – | – | – | (.25) | (.50) | (.21) |
| Total dividends and distributions | (.09) | (.12) | (.02) | (.64) | (.69) | (.40) |
| Net asset value, end of period | $10.44 | $10.15 | $9.41 | $8.43 | $9.82 | $10.64 |
| Total Return(a) | 3.86% | 9.20% | 11.82% | (7.06)% | (1.49)% | 7.12% |
| Ratios/Supplemental Data: | ||||||
| Net assets, end of period (000) | $2 | $50 | $168 | $479 | $1,047 | $2,936 |
| Average net assets (000) | $22 | $94 | $339 | $654 | $2,357 | $3,219 |
| Ratios to average net assets(c): | ||||||
| Expenses, including distribution and service (12b-1) fees | 2.29%(f) | 2.27% | 2.27% | 2.39%(d) | 2.18% | 2.10% |
| Expenses, excluding distribution and service (12b-1) fees | 1.29%(f) | 1.27% | 1.27% | 1.39%(d) | 1.18% | 1.10% |
| Net investment income | .75%(f) | .80% | 1.28% | 2.09% | 1.81% | 1.60% |
| Portfolio turnover rate | 248%(g)(h) | 188% | 200% | 356% | 353% | 395% |
(a) Total return does not consider the effects of sales loads. Total return is calculated assuming a purchase of a share on the first day and a sale on the last day of each period reported and
includes reinvestment of dividends and distributions. Total returns may reflect adjustments to conform to generally accepted accounting principles. Total returns for periods less than one full year are not annualized.
(b) Calculated based upon the average shares outstanding during the period.
(c) Does not include expenses of the underlying portfolios in which the Fund invests.
(d) Includes interest expense of .06%.
(e)
As of April 13, 2012, the last conversion of Class M shares was completed. There are no shares outstanding and Class M shares are no longer being offered for sale.
(f) Annualized.
(g) Not annualized.
(h) Calculated as of July 31, 2012.
| 70 | Target Asset Allocation Funds |
| Class R Shares | |||||
| Year Ended July 31, | |||||
| 2012(c) | 2011(c) | 2010(c) | 2009(c) | 2008(c) | |
| Per Share Operating Performance: | |||||
| Net Asset Value, Beginning Of Year | $10.28 | $9.51 | $8.48 | $9.85 | $10.67 |
| Income (loss) from investment operations: | |||||
| Net investment income | .14 | .13 | .16 | .24 | .24 |
| Net realized and unrealized gain (loss) on investments | .39 | .80 | .89 | (.95) | (.31) |
| Total from investment operations | .53 | .93 | 1.05 | (.71) | (.07) |
| Less Dividends and Distributions: | |||||
| Dividends from net investment income | (.14) | (.16) | (.02) | (.36) | (.25) |
| Tax return of capital | – | – | – | (.05) | – |
| Distributions from net realized gains on investments | – | – | – | (.25) | (.50) |
| Total dividends and distributions | (.14) | (.16) | (.02) | (.66) | (.75) |
| Net asset value, end of year | $10.67 | $10.28 | $9.51 | $8.48 | $9.85 |
| Total Return(a) | 5.29% | 9.84% | 12.44% | (6.59)% | (.99)% |
| Ratios/Supplemental Data: | |||||
| Net assets, end of year (000) | $231 | $232 | $687 | $721 | $4,015 |
| Average net assets (000) | $219 | $669 | $686 | $1,255 | $4,787 |
| Ratios to average net assets(d): | |||||
| Expenses, including distribution and service (12b-1) fees(b) | 1.79% | 1.77% | 1.77% | 1.89%(e) | 1.68% |
| Expenses, excluding distribution and service (12b-1) fees | 1.29% | 1.27% | 1.27% | 1.39%(e) | 1.18% |
| Net investment income | 1.39% | 1.29% | 1.76% | 2.70% | 2.33% |
| Portfolio turnover rate | 248% | 188% | 200% | 356% | 353% |
(a) Total return is
calculated assuming a purchase of a share on the first day and a sale on the last day of each year reported and includes reinvestment of dividends and distributions. Total returns may reflect adjustments to conform to
generally accepted accounting principles.
(b)
The distributor of the Fund has contractually agreed to limit its distribution and service (12b-1) fees to .50% of the average daily assets of the Class R shares.
(c) Calculated based upon the average shares outstanding during the year.
(d) Does not include expenses of the underlying portfolios in which the Fund invests.
(e) Includes interest expense of .06%.
| Visit our website at www.prudentialfunds.com | 71 |
| Class X Shares | |||||
| Year Ended July 31, | |||||
| 2012(b) | 2011(b) | 2010(b) | 2009(b) | 2008(b) | |
| Per Share Operating Performance: | |||||
| Net Asset Value, Beginning Of Year | $10.16 | $9.41 | $8.43 | $9.82 | $10.63 |
| Income (loss) from investment operations: | |||||
| Net investment income | .09 | .08 | .12 | .18 | .21 |
| Net realized and unrealized gain (loss) on investments | .38 | .79 | .88 | (.93) | (.31) |
| Total from investment operations | .47 | .87 | 1.00 | (.75) | (.10) |
| Less Dividends and Distributions: | |||||
| Dividends from net investment income | (.09) | (.12) | (.02) | (.34) | (.21) |
| Tax return of capital | – | – | – | (.05) | – |
| Distributions from net realized gains on investments | – | – | – | (.25) | (.50) |
| Total dividends and distributions | (.09) | (.12) | (.02) | (.64) | (.71) |
| Net asset value, end of year | $10.54 | $10.16 | $9.41 | $8.43 | $9.82 |
| Total Return(a) | 4.75% | 9.31% | 11.82% | (7.05)% | (1.22)% |
| Ratios/Supplemental Data: | |||||
| Net assets, end of year (000) | $93 | $123 | $769 | $977 | $2,120 |
| Average net assets (000) | $108 | $391 | $863 | $1,342 | $2,441 |
| Ratios to average net assets(c): | |||||
| Expenses, including distribution and service (12b-1) fees | 2.29% | 2.27% | 2.27% | 2.37%(d) | 1.99% |
| Expenses, excluding distribution and service (12b-1) fees | 1.29% | 1.27% | 1.27% | 1.39%(d) | 1.18% |
| Net investment income | .90% | .78% | 1.26% | 2.13% | 2.02% |
| Portfolio turnover rate | 248% | 188% | 200% | 356% | 353% |
(a) Total return does
not consider the effects of sales loads. Total return is calculated assuming a purchase of a share on the first day and a sale on the last day of each year reported and includes reinvestment of dividends and
distributions. Total returns may reflect adjustments to conform to generally accepted accounting principles.
(b) Calculated based upon the average shares outstanding during the year.
(c) Does not include expenses of the underlying portfolios in which the Fund invests.
(d) Includes interest expense of .06%.
| 72 | Target Asset Allocation Funds |
| Class Z Shares | |||||
| Year Ended July 31, | |||||
| 2012(b) | 2011(b) | 2010(b) | 2009(b) | 2008(b) | |
| Per Share Operating Performance: | |||||
| Net Asset Value, Beginning Of Year | $10.35 | $9.57 | $8.50 | $9.85 | $10.67 |
| Income (loss) from investment operations: | |||||
| Net investment income | .20 | .19 | .21 | .26 | .30 |
| Net realized and unrealized gain (loss) on investments | .39 | .79 | .89 | (.93) | (.32) |
| Total from investment operations | .59 | .98 | 1.10 | (.67) | (.02) |
| Less Dividends and Distributions: | |||||
| Dividends from net investment income | (.19) | (.20) | (.03) | (.38) | (.30) |
| Tax return of capital | – | – | – | (.05) | – |
| Distributions from net realized gains on investments | – | – | – | (.25) | (.50) |
| Total dividends and distributions | (.19) | (.20) | (.03) | (.68) | (.80) |
| Net asset value, end of year | $10.75 | $10.35 | $9.57 | $8.50 | $9.85 |
| Total Return(a) | 5.85% | 10.31% | 12.97% | (6.14)% | (.50)% |
| Ratios/Supplemental Data: | |||||
| Net assets, end of year (000) | $3,717 | $3,921 | $2,877 | $3,156 | $5,610 |
| Average net assets (000) | $4,379 | $3,567 | $3,031 | $3,809 | $5,771 |
| Ratios to average net assets(c): | |||||
| Expenses, including distribution and service (12b-1) fees | 1.29% | 1.27% | 1.27% | 1.39%(d) | 1.18% |
| Expenses, excluding distribution and service (12b-1) fees | 1.29% | 1.27% | 1.27% | 1.39%(d) | 1.18% |
| Net investment income | 1.90% | 1.84% | 2.26% | 3.10% | 2.85% |
| Portfolio turnover rate | 248% | 188% | 200% | 356% | 353% |
(a) Total return is
calculated assuming a purchase of a share on the first day and a sale on the last day of each year reported and includes reinvestment of dividends and distributions. Total returns may reflect adjustments to conform to
generally accepted accounting principles.
(b) Calculated based upon the average shares outstanding during the year.
(c) Does not include expenses of the underlying portfolios in which the Fund invests.
(d) Includes interest expense of .06%.
| Visit our website at www.prudentialfunds.com | 73 |
TARGET MODERATE
ALLOCATION FUND
| Class A Shares | |||||
| Year Ended July 31, | |||||
| 2012(b) | 2011(b) | 2010(b) | 2009(b) | 2008(b) | |
| Per Share Operating Performance: | |||||
| Net Asset Value, Beginning Of Year | $11.12 | $9.88 | $8.97 | $10.72 | $12.75 |
| Income (loss) from investment operations: | |||||
| Net investment income | .13 | .13 | .14 | .19 | .25 |
| Net realized and unrealized gain (loss) on investment transactions | .09 | 1.20 | .90 | (1.59) | (1.05) |
| Total from investment operations | .22 | 1.33 | 1.04 | (1.40) | (.80) |
| Less Dividends and Distributions: | |||||
| Dividends from net investment income | (.11) | (.09) | (.13) | (.25) | (.24) |
| Distributions from net realized gains | – | – | – | (.10) | (.99) |
| Total dividends and distributions | (.11) | (.09) | (.13) | (.35) | (1.23) |
| Net asset value, end of year | $11.23 | $11.12 | $9.88 | $8.97 | $10.72 |
| Total Return(a) | 2.05% | 13.51% | 11.67% | (12.78)% | (7.02)% |
| Ratios/Supplemental Data: | |||||
| Net assets, end of year (000) | $170,788 | $196,985 | $164,925 | $142,715 | $162,212 |
| Average net assets (000) | $188,087 | $186,704 | $159,007 | $131,169 | $169,156 |
| Ratios to average net assets(d): | |||||
| Expenses, including distribution and service (12b-1) fees(c) | 1.41% | 1.37% | 1.41% | 1.48%(e) | 1.39% |
| Expenses, excluding distribution and service (12b-1) fees | 1.16% | 1.12% | 1.16% | 1.23%(e) | 1.14% |
| Net investment income | 1.19% | 1.16% | 1.39% | 2.18% | 2.05% |
| Portfolio turnover rate | 174% | 151% | 140% | 249% | 213% |
(a) Total return does
not consider the effects of sales loads. Total return is calculated assuming a purchase of a share on the first day and a sale on the last day of each period reported and includes reinvestment of dividends and
distributions. Total returns may reflect adjustments to conform to generally accepted accounting principles.
(b) Calculated based upon average shares outstanding during the period.
(c) The distributor of the Fund has contractually agreed to limit its distribution and service (12b-1) fees to .25% of the average daily net assets of the Class A shares.
(d) Does not include expenses of the underlying portfolios in which the Fund invests.
(e)
Includes interest expense of .03%.
| 74 | Target Asset Allocation Funds |
| Class B Shares | |||||
| Year Ended July 31, | |||||
| 2012(b) | 2011(b) | 2010(b) | 2009(b) | 2008(b) | |
| Per Share Operating Performance: | |||||
| Net Asset Value, Beginning Of Year | $11.06 | $9.84 | $8.97 | $10.66 | $12.70 |
| Income (loss) from investment operations: | |||||
| Net investment income | .05 | .04 | .06 | .13 | .16 |
| Net realized and unrealized gain (loss) on investment transactions | .09 | 1.20 | .91 | (1.58) | (1.04) |
| Total from investment operations | .14 | 1.24 | .97 | (1.45) | (.88) |
| Less Dividends and Distributions: | |||||
| Dividends from net investment income | (.03) | (.02) | (.10) | (.14) | (.17) |
| Distributions from net realized gains | – | – | – | (.10) | (.99) |
| Total dividends and distributions | (.03) | (.02) | (.10) | (.24) | (1.16) |
| Net asset value, end of year | $11.17 | $11.06 | $9.84 | $8.97 | $10.66 |
| Total Return(a) | 1.26% | 12.57% | 10.82% | (13.43)% | (7.72)% |
| Ratios/Supplemental Data: | |||||
| Net assets, end of year (000) | $24,968 | $36,955 | $52,726 | $67,013 | $110,784 |
| Average net assets (000) | $29,979 | $46,927 | $62,087 | $76,425 | $139,512 |
| Ratios to average net assets(c): | |||||
| Expenses, including distribution and service (12b-1) fees | 2.16% | 2.12% | 2.16% | 2.23%(d) | 2.14% |
| Expenses, excluding distribution and service (12b-1) fees | 1.16% | 1.12% | 1.16% | 1.23%(d) | 1.14% |
| Net investment income | .45% | .41% | .65% | 1.46% | 1.30% |
| Portfolio turnover rate | 174% | 151% | 140% | 249% | 213% |
(a) Total return does
not consider the effects of sales loads. Total return is calculated assuming a purchase of a share on the first day and a sale on the last day of each period reported and includes reinvestment of dividends and
distributions. Total returns may reflect adjustments to conform to generally accepted accounting principles.
(b) Calculated based upon average shares outstanding during the period.
(c) Does not include expenses of the underlying portfolios in which the Fund invests.
(d)
Includes interest expense of .03%.
| Visit our website at www.prudentialfunds.com | 75 |
| Class C Shares | |||||
| Year Ended July 31, | |||||
| 2012(b) | 2011(b) | 2010(b) | 2009(b) | 2008(b) | |
| Per Share Operating Performance: | |||||
| Net Asset Value, Beginning Of Year | $11.06 | $9.84 | $8.97 | $10.66 | $12.70 |
| Income (loss) from investment operations: | |||||
| Net investment income | .05 | .04 | .06 | .12 | .16 |
| Net realized and unrealized gain (loss) on investment transactions | .09 | 1.20 | .91 | (1.57) | (1.04) |
| Total from investment operations | .14 | 1.24 | .97 | (1.45) | (.88) |
| Less Dividends and Distributions: | |||||
| Dividends from net investment income | (.03) | (.02) | (.10) | (.14) | (.17) |
| Distributions from net realized gains | – | – | – | (.10) | (.99) |
| Total dividends and distributions | (.03) | (.02) | (.10) | (.24) | (1.16) |
| Net asset value, end of year | $11.17 | $11.06 | $9.84 | $8.97 | $10.66 |
| Total Return(a) | 1.26% | 12.57% | 10.82% | (13.43)% | (7.72)% |
| Ratios/Supplemental Data: | |||||
| Net assets, end of year (000) | $50,632 | $58,827 | $63,077 | $68,208 | $100,797 |
| Average net assets (000) | $52,831 | $62,754 | $68,051 | $72,815 | $119,437 |
| Ratios to average net assets(c): | |||||
| Expenses, including distribution and service (12b-1) fees | 2.16% | 2.12% | 2.16% | 2.23%(d) | 2.14% |
| Expenses, excluding distribution and service (12b-1) fees | 1.16% | 1.12% | 1.16% | 1.23%(d) | 1.14% |
| Net investment income | .44% | .41% | .64% | 1.45% | 1.30% |
| Portfolio turnover rate | 174% | 151% | 140% | 249% | 213% |
(a) Total return does
not consider the effects of sales loads. Total return is calculated assuming a purchase of a share on the first day and a sale on the last day of each period reported and includes reinvestment of dividends and
distributions. Total returns may reflect adjustments to conform to generally accepted accounting principles.
(b) Calculated based upon average shares outstanding during the period.
(c) Does not include expenses of the underlying portfolios in which the Fund invests.
(d)
Includes interest expense of .03%.
| 76 | Target Asset Allocation Funds |
| Class M Shares | ||||||
| Period Ended April 13, 2012(b)(e) | Year Ended July 31, | |||||
| 2011(b) | 2010(b) | 2009(b) | 2008(b) | 2007(b) | ||
| Per Share Operating Performance: | ||||||
| Net Asset Value, Beginning Of Year | $11.04 | $9.81 | $8.95 | $10.64 | $12.66 | $11.85 |
| Income (loss) from investment operations: | ||||||
| Net investment income | .04 | .04 | .06 | .13 | .16 | .12 |
| Net realized and unrealized gain (loss) on investment transactions | .16 | 1.21 | .90 | (1.58) | (1.02) | 1.30 |
| Total from investment operations | .20 | 1.25 | .96 | (1.45) | (.86) | 1.42 |
| Less Dividends and Distributions: | ||||||
| Dividends from net investment income | (.03) | (.02) | (.10) | (.14) | (.17) | (.13) |
| Distributions from net realized gains | – | – | – | (.10) | (.99) | (.48) |
| Total dividends and distributions | (.03) | (.02) | (.10) | (.24) | (1.16) | (.61) |
| Net asset value, end of year | $11.21 | $11.04 | $9.81 | $8.95 | $10.64 | $12.66 |
| Total Return(a) | 1.81% | 12.71% | 10.74% | (13.46)% | (7.58)% | 12.21% |
| Ratios/Supplemental Data: | ||||||
| Net assets, end of year (000) | $13 | $230 | $1,100 | $2,083 | $4,709 | $8,277 |
| Average net assets (000) | $102 | $702 | $1,717 | $2,764 | $6,746 | $8,529 |
| Ratios to average net assets(c): | ||||||
| Expenses, including distribution and service (12b-1) fees | 2.16%(f) | 2.12% | 2.16% | 2.23%(d) | 2.14% | 1.93% |
| Expenses, excluding distribution and service (12b-1) fees | 1.16%(f) | 1.12% | 1.16% | 1.23%(d) | 1.14% | .93% |
| Net investment income | .33%(f) | .38% | .64% | 1.47% | 1.29% | .96% |
| Portfolio turnover rate | 174%(g)(h) | 151% | 140% | 249% | 213% | 195% |
(a) Total return does not consider the effects of sales loads. Total return is calculated assuming a purchase of a share on the first day and a sale on the last day of each period reported and
includes reinvestment of dividends and distributions. Total returns may reflect adjustments to conform to generally accepted accounting principles. Total returns for periods less than one full year are not annualized.
(b) Calculated based upon average shares outstanding during the period.
(c) Does not include expenses of the underlying portfolios in which the Fund invests.
(d)
Includes interest expense of .03%.
(e) As of April 13, 2012, the last conversion of Class M shares was completed. There are no Class M shares outstanding and Class M shares are no longer being offered for sale.
(f) Annualized.
(g) Not annualized.
(h) Calculated as of July 31, 2012.
| Visit our website at www.prudentialfunds.com | 77 |
| Class R Shares | |||||
| Year Ended July 31, | |||||
| 2012(b) | 2011(b) | 2010(b) | 2009(b) | 2008(b) | |
| Per Share Operating Performance: | |||||
| Net Asset Value, Beginning Of Year | $11.10 | $9.87 | $8.97 | $10.73 | $12.76 |
| Income (loss) from investment operations: | |||||
| Net investment income | .10 | .09 | .11 | .17 | .22 |
| Net realized and unrealized gain (loss) on investment transactions | .09 | 1.21 | .91 | (1.60) | (1.05) |
| Total from investment operations | .19 | 1.30 | 1.02 | (1.43) | (.83) |
| Less Dividends and Distributions: | |||||
| Dividends from net investment income | (.08) | (.07) | (.12) | (.23) | (.21) |
| Distributions from net realized gains | – | – | – | (.10) | (.99) |
| Total dividends and distributions | (.08) | (.07) | (.12) | (.33) | (1.20) |
| Net asset value, end of year | $11.21 | $11.10 | $9.87 | $8.97 | $10.73 |
| Total Return(a) | 1.78% | 13.16% | 11.43% | (13.03)% | (7.25)% |
| Ratios/Supplemental Data: | |||||
| Net assets, end of year (000) | $311 | $341 | $578 | $761 | $1,950 |
| Average net assets (000) | $306 | $497 | $632 | $1,024 | $3,358 |
| Ratios to average net assets(d): | |||||
| Expenses, including distribution and service (12b-1) fees(c) | 1.66% | 1.62% | 1.66% | 1.73%(e) | 1.64% |
| Expenses, excluding distribution and service (12b-1) fees | 1.16% | 1.12% | 1.16% | 1.23%(e) | 1.14% |
| Net investment income | .94% | .89% | 1.15% | 1.97% | 1.78% |
| Portfolio turnover rate | 174% | 151% | 140% | 249% | 213% |
(a) Total return is
calculated assuming a purchase of a share on the first day and a sale on the last day of each period reported and includes reinvestment of dividends and distributions. Total returns may reflect adjustments to conform
to generally accepted accounting principles.
(b) Calculated based upon average shares outstanding during the period.
(c) The distributor of the Fund has contractually agreed to limit its distribution and service (12b-1) fees to .50% of the average daily net assets of the Class R shares.
(d) Does not include expenses of the underlying portfolios in which the Fund invests.
(e)
Includes interest expense of .03%.
| 78 | Target Asset Allocation Funds |
| Class X Shares | |||||
| Year Ended July 31, | |||||
| 2012(b) | 2011(b) | 2010(b) | 2009(b) | 2008(b) | |
| Per Share Operating Performance: | |||||
| Net Asset Value, Beginning Of Year | $11.12 | $9.88 | $8.97 | $10.66 | $12.69 |
| Income (loss) from investment operations: | |||||
| Net investment income | .13 | .12 | .10 | .13 | .16 |
| Net realized and unrealized gain (loss) on investment transactions | .08 | 1.21 | .91 | (1.58) | (1.03) |
| Total from investment operations | .21 | 1.33 | 1.01 | (1.45) | (.87) |
| Less Dividends and Distributions: | |||||
| Dividends from net investment income | (.11) | (.09) | (.10) | (.14) | (.17) |
| Distributions from net realized gains | – | – | – | (.10) | (.99) |
| Total dividends and distributions | (.11) | (.09) | (.10) | (.24) | (1.16) |
| Capital Contribution | –(e) | –(e) | –(e) | – | – |
| Net asset value, end of year | $11.22 | $11.12 | $9.88 | $8.97 | $10.66 |
| Total Return(a) | 1.96% | 13.51% | 11.28% | (13.43)% | (7.64)% |
| Ratios/Supplemental Data: | |||||
| Net assets, end of year (000) | $367 | $777 | $1,430 | $2,235 | $4,299 |
| Average net assets (000) | $505 | $1,112 | $1,847 | $2,858 | $5,199 |
| Ratios to average net assets(c): | |||||
| Expenses, including distribution and service (12b-1) fees | 1.41% | 1.37% | 1.77% | 2.21%(d) | 2.08% |
| Expenses, excluding distribution and service (12b-1) fees | 1.16% | 1.12% | 1.16% | 1.23%(d) | 1.14% |
| Net investment income | 1.20% | 1.15% | 1.04% | 1.48% | 1.35% |
| Portfolio turnover rate | 174% | 151% | 140% | 249% | 213% |
(a) Total return does
not consider the effects of sales loads. Total return is calculated assuming a purchase of a share on the first day and a sale on the last day of each period reported and includes reinvestment of dividends and
distributions. Total returns may reflect adjustments to conform to generally accepted accounting principles.
(b) Calculated based upon average shares outstanding during the period.
(c) Does not include expenses of the underlying portfolios in which the Fund invests.
(d)
Includes interest expense of .03%.
(e) Less than $.005.
| Visit our website at www.prudentialfunds.com | 79 |
| Class Z Shares | |||||
| Year Ended July 31, | |||||
| 2012(b) | 2011(b) | 2010(b) | 2009(b) | 2008(b) | |
| Per Share Operating Performance: | |||||
| Net Asset Value, Beginning Of Year | $11.14 | $9.90 | $8.98 | $10.74 | $12.77 |
| Income (loss) from investment operations: | |||||
| Net investment income | .16 | .15 | .16 | .21 | .28 |
| Net realized and unrealized gain (loss) on investment transactions | .08 | 1.21 | .90 | (1.60) | (1.05) |
| Total from investment operations | .24 | 1.36 | 1.06 | (1.39) | (.77) |
| Less Dividends and Distributions: | |||||
| Dividends from net investment income | (.14) | (.12) | (.14) | (.27) | (.27) |
| Distributions from net realized gains | – | – | – | (.10) | (.99) |
| Total dividends and distributions | (.14) | (.12) | (.14) | (.37) | (1.26) |
| Net asset value, end of year | $11.24 | $11.14 | $9.90 | $8.98 | $10.74 |
| Total Return(a) | 2.22% | 13.75% | 11.90% | (12.55)% | (6.78)% |
| Ratios/Supplemental Data: | |||||
| Net assets, end of year (000) | $3,464 | $3,539 | $3,848 | $4,786 | $13,558 |
| Average net assets (000) | $3,240 | $3,846 | $4,425 | $8,208 | $14,407 |
| Ratios to average net assets(c): | |||||
| Expenses, including distribution and service (12b-1) fees | 1.16% | 1.12% | 1.16% | 1.23%(d) | 1.14% |
| Expenses, excluding distribution and service (12b-1) fees | 1.16% | 1.12% | 1.16% | 1.23%(d) | 1.14% |
| Net investment income | 1.44% | 1.42% | 1.64% | 2.47% | 2.30% |
| Portfolio turnover rate | 174% | 151% | 140% | 249% | 213% |
(a) Total return is
calculated assuming a purchase of a share on the first day and a sale on the last day of each period reported and includes reinvestment of dividends and distributions. Total returns may reflect adjustments to conform
to generally accepted accounting principles.
(b) Calculated based upon average shares outstanding during the period.
(c) Does not include expenses of the underlying portfolios in which the Fund invests.
(d)
Includes interest expense of .03%.
| 80 | Target Asset Allocation Funds |
TARGET GROWTH
ALLOCATION FUND
| Class A Shares | |||||
| Year Ended July 31, | |||||
| 2012(b) | 2011(b) | 2010(b) | 2009(b) | 2008(b) | |
| Per Share Operating Performance: | |||||
| Net Asset Value, Beginning Of Year | $11.49 | $9.73 | $8.77 | $11.52 | $14.62 |
| Income (loss) from investment operations: | |||||
| Net investment income | .07 | .05 | .04 | .09 | .13 |
| Net realized and unrealized gain (loss) on investments | (.09) | 1.71 | .98 | (2.73) | (1.90) |
| Total from investment operations | (.02) | 1.76 | 1.02 | (2.64) | (1.77) |
| Less Dividends and Distributions: | |||||
| Dividends from net investment income | (.03) | – | (.06) | (.11) | (.07) |
| Distributions from net realized gains | – | – | – | –(e) | (1.26) |
| Total dividends and distributions | (.03) | – | (.06) | (.11) | (1.33) |
| Net asset value, end of year | $11.44 | $11.49 | $9.73 | $8.77 | $11.52 |
| Total Return(a) | (.14)% | 18.09% | 11.69% | (22.71)% | (13.25)% |
| Ratios/Supplemental Data: | |||||
| Net assets, end of year (000) | $105,678 | $114,839 | $99,938 | $95,405 | $124,579 |
| Average net assets (000) | $105,524 | $112,821 | $102,324 | $89,232 | $135,539 |
| Ratios to average net assets(d): | |||||
| Expenses, including distribution and service (12b-1) fees(c) | 1.55% | 1.51% | 1.57% | 1.58% | 1.36% |
| Expenses, excluding distribution and service (12b-1) fees | 1.30% | 1.26% | 1.32% | 1.33% | 1.11% |
| Net investment income | .61% | .48% | .38% | 1.03% | 1.01% |
| Portfolio turnover rate | 68% | 73% | 97% | 135% | 83% |
(a) Total return does
not consider the effects of sales loads. Total return is calculated assuming a purchase of a share on the first day and a sale on the last day of each year reported and includes reinvestment of dividends and
distributions. Total returns may reflect adjustments to conform to generally accepted accounting principles.
(b)
Calculations are based on average shares outstanding during the period.
(c) The distributor of the Fund contractually agreed to limit its distribution and service (12b-1) fees to .25% of the average daily assets of the Class A shares.
(d) Does not include expenses of the underlying portfolios in which the Fund invests.
(e) Less than $.005 per share.
| Visit our website at www.prudentialfunds.com | 81 |
| Class B Shares | |||||
| Year Ended July 31, | |||||
| 2012(b) | 2011(b) | 2010(b) | 2009(b) | 2008(b) | |
| Per Share Operating Performance: | |||||
| Net Asset Value, Beginning Of Year | $10.55 | $9.00 | $8.13 | $10.68 | $13.67 |
| Income (loss) from investment operations: | |||||
| Net investment income (loss) | (.01) | (.03) | (.03) | .02 | .03 |
| Net realized and unrealized gain (loss) on investments | (.09) | 1.58 | .91 | (2.52) | (1.76) |
| Total from investment operations | (.10) | 1.55 | .88 | (2.50) | (1.73) |
| Less Dividends and Distributions: | |||||
| Dividends from net investment income | – | – | (.01) | (.05) | – |
| Distributions from net realized gains | – | – | – | –(d) | (1.26) |
| Total dividends and distributions | – | – | (.01) | (.05) | (1.26) |
| Net asset value, end of year | $10.45 | $10.55 | $9.00 | $8.13 | $10.68 |
| Total Return(a) | (.95)% | 17.22% | 10.80% | (23.29)% | (13.86)% |
| Ratios/Supplemental Data: | |||||
| Net assets, end of year (000) | $18,005 | $24,634 | $29,184 | $33,691 | $58,763 |
| Average net assets (000) | $20,467 | $28,562 | $33,068 | $37,140 | $78,596 |
| Ratios to average net assets(c): | |||||
| Expenses, including distribution and service (12b-1) fees | 2.30% | 2.26% | 2.32% | 2.33% | 2.11% |
| Expenses, excluding distribution and service (12b-1) fees | 1.30% | 1.26% | 1.32% | 1.33% | 1.11% |
| Net investment income (loss) | (.13)% | (.27)% | (.36)% | .31% | .26% |
| Portfolio turnover rate | 68% | 73% | 97% | 135% | 83% |
(a) Total return does
not consider the effects of sales loads. Total return is calculated assuming a purchase of a share on the first day and a sale on the last day of each year reported and includes reinvestment of dividends and
distributions. Total returns may reflect adjustments to conform to generally accepted accounting principles.
(b)
Calculations are based on average shares outstanding during the period.
(c) Does not include expenses of the underlying portfolios in which the Fund invests.
(d) Less than $.005 per share.
| 82 | Target Asset Allocation Funds |
| Class C Shares | |||||
| Year Ended July 31, | |||||
| 2012(b) | 2011(b) | 2010(b) | 2009(b) | 2008(b) | |
| Per Share Operating Performance: | |||||
| Net Asset Value, Beginning Of Year | $10.55 | $9.00 | $8.13 | $10.68 | $13.67 |
| Income (loss) from investment operations: | |||||
| Net investment income (loss) | (.01) | (.03) | (.03) | .02 | .03 |
| Net realized and unrealized gain (loss) on investments | (.08) | 1.58 | .91 | (2.52) | (1.76) |
| Total from investment operations | (.09) | 1.55 | .88 | (2.50) | (1.73) |
| Less Dividends and Distributions: | |||||
| Dividends from net investment income | – | – | (.01) | (.05) | – |
| Distributions from net realized gains | – | – | – | –(d) | (1.26) |
| Total dividends and distributions | – | – | (.01) | (.05) | (1.26) |
| Net asset value, end of year | $10.46 | $10.55 | $9.00 | $8.13 | $10.68 |
| Total Return(a) | (.85)% | 17.22% | 10.80% | (23.29)% | (13.86)% |
| Ratios/Supplemental Data: | |||||
| Net assets, end of year (000) | $35,215 | $42,214 | $43,511 | $48,649 | $76,714 |
| Average net assets (000) | $37,161 | $44,983 | $48,040 | $51,040 | $96,952 |
| Ratios to average net assets(c): | |||||
| Expenses, including distribution and service (12b-1) fees | 2.30% | 2.26% | 2.32% | 2.33% | 2.11% |
| Expenses, excluding distribution and service (12b-1) fees | 1.30% | 1.26% | 1.32% | 1.33% | 1.11% |
| Net investment income (loss) | (.14)% | (.27)% | (.37)% | .30% | .26% |
| Portfolio turnover rate | 68% | 73% | 97% | 135% | 83% |
(a) Total return does
not consider the effects of sales loads. Total return is calculated assuming a purchase of a share on the first day and a sale on the last day of each year reported and includes reinvestment of dividends and
distributions. Total returns may reflect adjustments to conform to generally accepted accounting principles.
(b)
Calculations are based on average shares outstanding during the period.
(c) Does not include expenses of the underlying portfolios in which the Fund invests.
(d) Less than $.005 per share.
| Visit our website at www.prudentialfunds.com | 83 |
| Class M Shares | ||||||
| Period Ended April 13, 2012(b)(e) | Year Ended July 31, | |||||
| 2011(b) | 2010(b) | 2009(b) | 2008(b) | 2007(b) | ||
| Per Share Operating Performance: | ||||||
| Net Asset Value, Beginning Of Period | $10.58 | $9.02 | $8.15 | $10.70 | $13.70 | $12.54 |
| Income (loss) from investment operations: | ||||||
| Net investment income (loss) | (.02) | (.03) | (.03) | .03 | .03 | (.01) |
| Net realized and unrealized gain (loss) on investments | .19 | 1.59 | .91 | (2.53) | (1.77) | 2.01 |
| Total from investment operations | .17 | 1.56 | .88 | (2.50) | (1.74) | 2.00 |
| Less Dividends and Distributions: | ||||||
| Dividends from net investment income | – | – | (.01) | (.05) | – | – |
| Distributions from net realized gains | – | – | – | –(d) | (1.26) | (.84) |
| Total dividends and distributions | – | – | (.01) | (.05) | (1.26) | (.84) |
| Net asset value, end of period | $10.75 | $10.58 | $9.02 | $8.15 | $10.70 | $13.70 |
| Total Return(a) | 1.61% | 17.29% | 10.77% | (23.24)% | (13.91)% | 16.28% |
| Ratios/Supplemental Data: | ||||||
| Net assets, end of period (000) | $15 | $308 | $1,004 | $2,154 | $4,712 | $10,851 |
| Average net assets (000) | $135 | $671 | $1,680 | $2,773 | $8,028 | $10,882 |
| Ratios to average net assets(c): | ||||||
| Expenses, including distribution and service (12b-1) fees | 2.32%(f) | 2.26% | 2.32% | 2.33% | 2.11% | 2.10% |
| Expenses, excluding distribution and service (12b-1) fees | 1.32%(f) | 1.26% | 1.32% | 1.33% | 1.11% | 1.10% |
| Net investment income (loss) | (.19)%(f) | (.32)% | (.36)% | .33% | .25% | (.10)% |
| Portfolio turnover rate | 68%(g)(h) | 73% | 97% | 135% | 83% | 71% |
(a) Total return does not consider the effects of sales loads. Total return is calculated assuming a purchase of a share on the first day and a sale on the last day of each year reported and includes
reinvestment of dividends and distributions. Total returns may reflect adjustments to conform to generally accepted accounting principles. Total returns for periods less than one full year are not annualized.
(b) Calculations are based on average shares outstanding during the period.
(c) Does not include expenses of the underlying portfolios in which the Fund invests.
(d) Less than $.005 per share.
(e)
As of April 13, 2012, the last conversion of Class M shares was completed. There are no shares outstanding and Class M shares are no longer offered for sale.
(f) Annualized.
(g) Not annualized.
(h) Calculated as of July 31, 2012.
| 84 | Target Asset Allocation Funds |
| Class R Shares | |||||
| Year Ended July 31, | |||||
| 2012(b) | 2011(b) | 2010(b) | 2009(b) | 2008(b) | |
| Per Share Operating Performance: | |||||
| Net Asset Value, Beginning Of Year | $11.38 | $9.66 | $8.71 | $11.44 | $14.52 |
| Income (loss) from investment operations: | |||||
| Net investment income (loss) | .06 | .01 | .01 | .07 | .10 |
| Net realized and unrealized gain (loss) on investments | (.09) | 1.71 | .98 | (2.71) | (1.88) |
| Total from investment operations | (.03) | 1.72 | .99 | (2.64) | (1.78) |
| Less Dividends and Distributions: | |||||
| Dividends from net investment income | –(d) | – | (.04) | (.09) | (.04) |
| Distributions from net realized gains | – | – | – | –(d) | (1.26) |
| Total dividends and distributions | –(d) | – | (.04) | (.09) | (1.30) |
| Net asset value, end of year | $11.35 | $11.38 | $9.66 | $8.71 | $11.44 |
| Total Return(a) | (.24)% | 17.81% | 11.40% | (22.90)% | (13.42)% |
| Ratios/Supplemental Data: | |||||
| Net assets, end of year (000) | $2 | $2 | $80 | $225 | $323 |
| Average net assets (000) | $2 | $74 | $122 | $203 | $339 |
| Ratios to average net assets(c): | |||||
| Expenses, including distribution and service (12b-1) fees(e) | 1.65% | 1.76% | 1.82% | 1.83% | 1.61% |
| Expenses, excluding distribution and service (12b-1) fees | 1.15% | 1.26% | 1.32% | 1.33% | 1.11% |
| Net investment income (loss) | .55% | .14% | .14% | .82% | .77% |
| Portfolio turnover rate | 68% | 73% | 97% | 135% | 83% |
(a) Total return does
not consider the effects of sales loads. Total return is calculated assuming a purchase of a share on the first day and a sale on the last day of each year reported and includes reinvestment of dividends and
distributions. Total returns may reflect adjustments to conform to generally accepted accounting principles.
(b)
Calculations are based on average shares outstanding during the period.
(c) Does not include expenses of the underlying portfolios in which the Fund invests.
(d) Less than $.005 per share.
(e)
The distributor of the Fund contractually agreed to limit its distribution and service (12b-1) fees to .50% of the average daily assets of the Class R shares.
| Visit our website at www.prudentialfunds.com | 85 |
| Class X Shares | |||||
| Year Ended July 31, | |||||
| 2012(b) | 2011(b) | 2010(b) | 2009(b) | 2008(b) | |
| Per Share Operating Performance: | |||||
| Net Asset Value, Beginning Of Year | $10.71 | $9.07 | $8.17 | $10.68 | $13.68 |
| Income (loss) from investment operations: | |||||
| Net investment income (loss) | .06 | .04 | .03 | .04 | .03 |
| Net realized and unrealized gain (loss) on investments | (.08) | 1.60 | .93 | (2.50) | (1.77) |
| Total from investment operations | (.02) | 1.64 | .96 | (2.46) | (1.74) |
| Less Dividends and Distributions: | |||||
| Dividends from net investment income | (.03) | – | (.06) | (.05) | – |
| Distributions from net realized gains | – | – | – | –(d) | (1.26) |
| Total dividends and distributions | (.03) | – | (.06) | (.05) | (1.26) |
| Capital Contributions | – | –(d) | –(d) | –(d) | – |
| Net asset value, end of year | $10.66 | $10.71 | $9.07 | $8.17 | $10.68 |
| Total Return(a) | (.15)% | 18.08% | 11.71% | (22.91)% | (13.93)% |
| Ratios/Supplemental Data: | |||||
| Net assets, end of year (000) | $189 | $534 | $1,293 | $1,705 | $3,759 |
| Average net assets (000) | $326 | $846 | $1,593 | $2,123 | $4,440 |
| Ratios to average net assets(c): | |||||
| Expenses, including distribution and service (12b-1) fees | 1.55% | 1.51% | 1.57% | 2.09% | 2.11% |
| Expenses, excluding distribution and service (12b-1) fees | 1.30% | 1.26% | 1.32% | 1.33% | 1.11% |
| Net investment income (loss) | .59% | .44% | .39% | .56% | .26% |
| Portfolio turnover rate | 68% | 73% | 97% | 135% | 83% |
(a) Total return does
not consider the effects of sales loads. Total return is calculated assuming a purchase of a share on the first day and a sale on the last day of each year reported and includes reinvestment of dividends and
distributions. Total returns may reflect adjustments to conform to generally accepted accounting principles.
(b)
Calculations are based on average shares outstanding during the period.
(c) Does not include expenses of the underlying portfolios in which the Fund invests.
(d) Less than $.005 per share.
| 86 | Target Asset Allocation Funds |
| Class Z Shares | |||||
| Year Ended July 31, | |||||
| 2012(b) | 2011(b) | 2010(b) | 2009(b) | 2008(b) | |
| Per Share Operating Performance: | |||||
| Net Asset Value, Beginning Of Year | $11.81 | $9.98 | $8.99 | $11.81 | $14.95 |
| Income (loss) from investment operations: | |||||
| Net investment income | .10 | .08 | .06 | .12 | .17 |
| Net realized and unrealized gain (loss) on investments | (.09) | 1.75 | 1.02 | (2.81) | (1.94) |
| Total from investment operations | .01 | 1.83 | 1.08 | (2.69) | (1.77) |
| Less Dividends and Distributions: | |||||
| Dividends from net investment income | (.06) | – | (.09) | (.13) | (.11) |
| Distributions from net realized gains | – | – | – | –(d) | (1.26) |
| Total dividends and distributions | (.06) | – | (.09) | (.13) | (1.37) |
| Net asset value, end of year | $11.76 | $11.81 | $9.98 | $8.99 | $11.81 |
| Total Return(a) | .12% | 18.34% | 11.98% | (22.54)% | (13.00)% |
| Ratios/Supplemental Data: | |||||
| Net assets, end of year (000) | $1,997 | $1,851 | $1,558 | $1,741 | $5,234 |
| Average net assets (000) | $1,639 | $1,707 | $1,600 | $2,938 | $7,414 |
| Ratios to average net assets(c): | |||||
| Expenses, including distribution and service (12b-1) fees | 1.30% | 1.26% | 1.32% | 1.33% | 1.11% |
| Expenses, excluding distribution and service (12b-1) fees | 1.30% | 1.26% | 1.32% | 1.33% | 1.11% |
| Net investment income | .87% | .73% | .62% | 1.32% | 1.25% |
| Portfolio turnover rate | 68% | 73% | 97% | 135% | 83% |
(a) Total return does
not consider the effects of sales loads. Total return is calculated assuming a purchase of a share on the first day and a sale on the last day of each year reported and includes reinvestment of dividends and
distributions. Total returns may reflect adjustments to conform to generally accepted accounting principles.
(b)
Calculations are based on average shares outstanding during the period.
(c) Does not include expenses of the underlying portfolios in which the Fund invests.
(d) Less than $.005 per share.
| Visit our website at www.prudentialfunds.com | 87 |
GLOSSARY
FUND INDEXES
Customized Blend
Index—Conservative Allocation Fund. The Customized Benchmark for Conservative Allocation Fund is a model portfolio consisting of the Russell 3000 Index (40%) and the Barclays Aggregate Bond Index (60%). Each component of the
Customized Blend Index is an unmanaged index generally considered to represent the performance of the Fund’s asset classes. The Customized Blend Index is intended to provide a theoretical comparison to the
Fund’s performance, based on the amounts allocated to each asset class. The Customized Blend Index does not reflect deductions for any sales charges or operating expenses of a mutual fund. These returns would be
lower if they included the effect of these expenses. Source: Lipper Inc.
Customized Blend
Index—Moderate Allocation Fund. The Customized Benchmark for Moderate Allocation Fund is a model portfolio consisting of the Russell 3000 Index (52%), the MSCI EAFE (13%), and the Barclays Aggregate Bond Index (35%).
Each component of the Customized Blend Index is an unmanaged index generally considered to represent the performance of the Fund’s asset classes. The Customized Blend Index is intended to provide a theoretical
comparison to the Fund’s performance based on the amounts allocated to each asset class. The Customized Blend Index does not reflect deductions for any sales charges or operating expenses of a mutual fund. These
returns would be lower if they included the effect of these expenses. Source: Lipper Inc.
Customized Blend
Index—Growth Allocation Fund. The Customized Benchmark for Growth Allocation Fund is a model portfolio consisting of the Russell 3000 Index (80%) and the MSCI EAFE Index (20%). Each component of the Customized Blend
Index is an unmanaged index generally considered to represent the performance of the Fund’s asset classes. The Customized Blend Index is intended to provide a theoretical comparison to the Fund’s
performance based on the amounts allocated to each asset class. The Customized Blend Index does not reflect deductions for any sales charges or operating expenses of a mutual fund. These returns would be lower if they
included the effect of these expenses. Source: Lipper Inc.
Standard & Poor's 500
Index. The Standard & Poor's 500 Composite Stock Price Index is an unmanaged index of 500 stocks of large U.S. public companies. It gives a broad look at how stock prices in the United States
have performed. These returns do not include the effect of any sales charges, operating expenses of a mutual fund or taxes. These returns would be lower if they included the effect of these expenses. Source: Standard &
Poor's Corporation.
Lipper Average. The Lipper Average is based on the average return of all mutual funds in the respective category for each of the Target Asset Allocation Funds. The Lipper Average for the Target
Conservative Allocation Fund is based on the Lipper Mixed-Asset Target Allocation Conservative Funds category. The Lipper Average for the Target Moderate Allocation Fund is based on the Lipper Mixed-Asset Target
Allocation Growth Funds category. The Lipper Average for the Target Growth Allocation Fund is based on the Lipper Large-Cap Core Funds category. Returns do not include the effect of any sales charges or taxes. Returns
would be lower if sales charges or taxes were reflected. Source: Lipper Inc.
88
This page
intentionally left blank
This page
intentionally left blank
This page
intentionally left blank
| FOR MORE INFORMATION Please read this Prospectus before you invest in the Fund and keep it for future reference. For information or shareholder questions contact: | |
| ■ MAIL Prudential Mutual Fund Services LLC PO Box 9658 Providence, RI 02940 ■ TELEPHONE (800) 225-1852 (973) 367-3529 (from outside the U.S.) ■ WEBSITE www.prudentialfunds.com | ■ OUTSIDE BROKERS SHOULD CONTACT Prudential Investment Management Services LLC PO Box 9658 Providence, RI 02940 ■ TELEPHONE (800) 778-8769 |
| ■ E-DELIVERY To receive your mutual fund documents on-line, go to www.prudentialfunds.com/edelivery and enroll. Instead of receiving printed documents by mail, you will receive notification via email when new materials are available. You can cancel your enrollment or change your email address at any time by visiting the website address above. |
| You can also obtain copies of Fund documents from the Securities and Exchange Commission as follows: | |
| ■ MAIL Securities and Exchange Commission Public Reference Section 100 F Street, N.E. Washington, DC 20549-1520 ■ ELECTRONIC REQUEST publicinfo@sec.gov (The SEC charges a fee to copy documents) | ■ IN PERSON Public Reference Room located at 100 F Street, N.E. in Washington, DC For hours of operation, call (202) 551-8090 ■ VIA THE INTERNET on the EDGAR Database at www.sec.gov |
| The Annual and Semi-Annual Reports and the SAI contain additional information about the Fund. Shareholders may obtain free copies of the SAI, Annual Report and Semi-Annual Report as well as other information about the Fund and may make other shareholder inquiries through the telephone number, address and website listed above. | |
| ■ STATEMENT OF ADDITIONAL INFORMATION (SAI) (incorporated by reference into this Prospectus) ■ SEMI-ANNUAL REPORT | ■ ANNUAL REPORT (contains a discussion of the market conditions and investment strategies that significantly affected the Fund's performance during the last fiscal year) |
| Conservative Allocation Fund | ||||||
| Share Class | A | B | C | R | X | Z |
| NASDAQ | PCGAX | PBCFX | PCCFX | PCLRX | N/A | PDCZX |
| CUSIP | 87612A104 | 87612A203 | 87612A302 | 87612A401 | 87612A708 | 87612A500 |
| Moderate Allocation Fund | ||||||
| Share Class | A | B | C | R | X | Z |
| NASDAQ | PAMGX | DMGBX | PIMGX | SPMRX | N/A | PDMZX |
| CUSIP | 87612A807 | 87612A880 | 87612A872 | 87612A864 | 87612A831 | 87612A856 |
| Growth Allocation Fund | ||||||
| Share Class | A | B | C | R | X | Z |
| NASDAQ | PHGAX | PIHGX | PHGCX | PGARX | N/A | PDHZX |
| CUSIP | 87612A823 | 87612A815 | 87612A799 | 87612A781 | 87612A757 | 87612A773 |
MFSP504STAT The Funds' Investment Company Act File No. 811-08915

PRUDENTIAL INVESTMENTS » MUTUAL FUNDS
Target Asset Allocation Funds
STATEMENT OF ADDITIONAL INFORMATION • SEPTEMBER 28, 2012

Table of Contents
PART I
INTRODUCTION
This
SAI sets forth information about the Target Asset Allocation Funds. It provides information about certain of the securities, instruments, policies and strategies that are used by each Fund in seeking to achieve its
objective. This SAI also provides additional information about the Funds’ Board of Trustees, the advisory services provided to and the management fees paid by each Fund, performance data for each Fund,
information about other fees paid by and services provided to each Fund, and other information. As used in the following section, unless otherwise noted, the term “Fund” includes each of the Funds that
comprise the Target Asset Allocation Funds.
This SAI should be
read in conjunction with the Prospectus of the Funds.
Target Asset
Allocation Funds consist of the following Funds:
| ■ | Target Conservative Allocation Fund (Conservative Allocation Fund) |
| ■ | Target Moderate Allocation Fund (Moderate Allocation Fund) |
| ■ | Target Growth Allocation Fund (Growth Allocation Fund) |
Before reading the
SAI, you should consult the Glossary below, which defines certain of the terms used in the SAI:
GLOSSARY
| Term | Definition |
| ADR | American Depositary Receipt |
| ADS | American Depositary Share |
| Board | Fund’s Board of Directors or Trustees |
| Board Member | A trustee or director of the Fund’s Board |
| CFTC | U.S. Commodity Futures Trading Commission |
| Code | Internal Revenue Code of 1986, as amended |
| CDO | Collateralized Debt Obligation |
| CMO | Collateralized Mortgage Obligation |
| ETF | Exchange-Traded Fund |
| EDR | European Depositary Receipt |
| Fannie Mae | Federal National Mortgage Association |
| FDIC | Federal Deposit Insurance Corporation |
| Fitch | Fitch, Inc. |
| Freddie Mac | Federal Home Loan Mortgage Corporation |
| GDR | Global Depositary Receipt |
| Ginnie Mae | Government National Mortgage Association |
| IPO | Initial Public Offering |
| IRS | Internal Revenue Service |
| 1933 Act | Securities Act of 1933, as amended |
| 1934 Act | Securities Exchange Act of 1934, as amended |
| 1940 Act | Investment Company Act of 1940, as amended |
| LIBOR | London Interbank Offered Rate |
| Manager or PI | Prudential Investments LLC |
| Moody’s | Moody’s Investor Services, Inc. |
| NASDAQ | National Association of Securities Dealers Automated Quotations System |
| NAV | Net Asset Value |
| NYSE | New York Stock Exchange |
| OTC | Over the Counter |
| PMFS | Prudential Mutual Fund Services LLC |
3
| Term | Definition |
| REIT | Real Estate Investment Trust |
| RIC | Regulated Investment Company, as the term is used in the Internal Revenue Code of 1986, as amended |
| S&P | Standard & Poor’s Corporation |
| SEC | U.S. Securities & Exchange Commission |
| World Bank | International Bank for Reconstruction and Development |
FUND CLASSIFICATION, INVESTMENT Objectives & POLICIES
Target Asset
Allocation Funds is an open-end management investment company. Each Fund is classified as a diversified fund.
The principal
investment policies and strategies of each Fund are described in the Prospectus. In addition, each Fund may from time to time use the securities, instruments, policies and strategies that are further identified and
explained in the following section. A Fund also may invest from time to time in certain types of investments and strategies that are not identified or explained in the following section. A Fund may not be successful in
achieving its objective and you could lose money.
With respect to
futures contracts that are not legally required to “cash settle,” the Conservative Allocation and Moderate Allocation Funds will cover the open position by setting aside or earmarking liquid assets in an
amount equal to the market value of the futures contract. With respect to futures that are required to “cash settle,” however, a Fund is permitted to set aside or earmark liquid assets in an amount equal to
the Fund’s daily marked to market (net) obligation (the Fund’s daily net liability, if any), rather than the total market value of the futures contract. By setting aside assets equal to only its net
obligation under cash-settled futures, a Fund will have the ability to employ leverage to a greater extent than if the Fund were required to segregate assets equal to the full market value of the futures contract.
Set forth below are
specific limitations or restrictions which are applicable to a Fund’s investments as further described in the following section:
| ■ | Conservative Allocation Fund and Moderate Allocation Fund may each invest up to 5% of total assets in event-linked bonds. |
| ■ | Conservative Allocation Fund and Moderate Allocation Fund may each invest up to 5% of total assets in CDOs. |
| ■ | Conservative Allocation Fund and Moderate Allocation Fund may each invest up to 5% of total assets in corporate loans. |
| ■ | Each Fund may invest up to 5% of total assets in any one ETF, and up to 10% in ETFs or other mutual funds collectively. |
| ■ | With respect to each Fund, the amount of Fund assets which may be utilized for short sales purposes is subject to the following restrictions: no more than 25% of each Fund’s total assets will be, when added together, (1) deposited as collateral for the obligation to replace securities borrowed to effect short sales, and (2) segregated in connection with short sales. |
| ■ | Each Fund may invest up to 10% of its net assets in municipal securities. |
INVESTMENT RISKS
AND CONSIDERATIONS
Set
forth below are descriptions of some of the types of investments and investment strategies that the Fund may use and the risks and considerations associated with those investments and investment strategies. Please also
see the Prospectus and the “Fund Classification, Investment Objective & Policies” section of this SAI.
ASSET-BACKED SECURITIES. Asset-backed securities directly or indirectly represent a participation interest in, or are secured by and payable from, a stream of payments generated by particular assets such as motor
vehicle or credit card receivables. Payments of principal and interest may be guaranteed up to certain amounts and for a certain time period by a letter of credit issued by a financial institution unaffiliated with the
entities issuing the securities. Asset-backed securities may be classified as pass-through certificates or collateralized obligations.
Pass-through
certificates are asset-backed securities which represent an undivided fractional ownership interest in an underlying pool of assets. Pass-through certificates usually provide for payments of principal and interest
received to be passed through to their holders, usually after deduction for certain costs and expenses incurred in administering the pool. Because pass-through certificates represent an ownership interest in the
underlying assets, the holders thereof bear directly the risk of any defaults by the obligors on the underlying assets not covered by any credit support.
Asset-backed securities issued in the form of debt instruments include collateralized bond obligations (“CBOs”), collateralized loan obligations (“CLOs”), other CDOs and other
similarly structured securities. A CBO is a trust which is often backed by a diversified pool of high risk, below investment grade fixed income securities. The collateral can be from many different types of fixed
income securities such as high yield debt, residential privately issued mortgage-related securities, commercial privately issued mortgage-related securities, trust preferred securities and emerging market debt. A CLO
is a trust typically collateralized by a pool of
Target
Asset Allocation Funds 4
loans, which may include, among others, domestic and foreign senior secured loans, senior unsecured loans, and subordinate corporate loans, including loans that may be rated below investment grade or
equivalent unrated loans. Other CDOs are trusts backed by other types of assets representing obligations of various parties. CBOs, CLOs and other CDOs may charge management fees and administrative expenses.
For CBOs, CLOs and
other CDOs, the cash flows from the trust are split into two or more portions, called tranches, varying in risk and yield. The riskiest portion is the “equity” tranche which bears the bulk of defaults from
the bonds or loans in the trust and serves to protect the other, more senior tranches from default in all but the most severe circumstances. Since they are partially protected from defaults, senior tranches from a CBO
trust, CLO trust or trust of another CDO typically have higher ratings and lower yields than their underlying securities, and can be rated investment grade. Despite the protection from the equity tranche, CBO, CLO or
other CDO tranches can experience substantial losses due to actual defaults, increased sensitivity to defaults due to collateral default and disappearance of protecting tranches, market anticipation of defaults, as
well as aversion to CBO, CLO or other CDO securities as a class.
The risks of an
investment in a CBO, CLO or other CDO depend largely on the type of the collateral securities and the class of the instrument in which the Fund invests. Normally, CBOs, CLOs and other CDOs are privately offered and
sold, and thus, are not registered under the securities laws. As a result, investments in CBOs, CLOs and other CDOs may be characterized by the Fund as illiquid securities; however, an active dealer market may exist
for CBOs, CLOs and other CDOs, allowing them to qualify for Rule 144A transactions. In addition to the normal risks associated with fixed income securities discussed elsewhere in this SAI and the Fund’s
Prospectus (e.g., interest rate risk and default risk), CBOs, CLOs and other CDOs carry additional risks including, but not limited to: (i) the possibility that distributions from collateral securities will not be
adequate to make interest or other payments; (ii) the possibility that the quality of the collateral may decline in value or default; (iii) the risk that Fund may invest in CBOs, CLOs or other CDOs that are subordinate
to other classes; and (iv) the risk that the complex structure of the security may not be fully understood at the time of investment and may produce disputes with the issuer or unexpected investment results.
ASSET-BASED SECURITIES. The Fund may invest in debt, preferred or convertible securities, the principal amount, redemption terms or conversion terms of which are related to the market price of some natural
resource asset such as gold bullion. These securities are referred to as “asset-based securities.” The Fund will purchase asset-based securities only if they are rated, or are issued by issuers that have
outstanding debt obligations rated investment grade (i.e., AAA, AA, A or BBB by S&P or Fitch or Aaa, Aa, A or Baa by Moody’s or commercial paper rated A-1 by S&P or Prime-1 by Moody’s) or of issuers that
the subadviser has determined to be of similar creditworthiness. Obligations ranked in the fourth highest rating category, while considered “investment grade,” may have certain speculative characteristics.
If the asset-based security is backed by a bank letter of credit or other similar facility, the subadviser may take such backing into account in determining the creditworthiness of the issuer. While the market prices
for an asset-based security and the related natural resource asset generally are expected to move in the same direction, there may not be perfect correlation in the two price movements. Asset-based securities may not
be secured by a security interest in or claim on the underlying natural resource asset.
The asset-based
securities in which the Fund may invest may bear interest or pay preferred dividends at below market (or even relatively nominal) rates. As an example, assume gold is selling at a market price of $300 per ounce and an
issuer sells a $1,000 face amount gold-related note with a seven-year maturity, payable at maturity at the greater of either $1,000 in cash or the then market price of three ounces of gold. If at maturity, the market
price of gold is $400 per ounce, the amount payable on the note would be $1,200. Certain asset-based securities may be payable at maturity in cash at the stated principal amount or, at the option of the holder,
directly in a stated amount of the asset to which it is related. In such instance, because the Fund does not presently intend to invest directly in natural resource assets, the Fund may sell the asset-based security in
the secondary market, to the extent one exists, prior to maturity if the value of the stated amount of the asset exceeds the stated principal amount and thereby realize the appreciation in the underlying asset.
PRECIOUS METAL-RELATED
SECURITIES. The Fund may invest in the equity securities of companies that explore for, extract, process or deal in precious metals, e.g., gold, silver and platinum, and in asset-based securities
indexed to the value of such metals. Such securities may be purchased when they are believed to be attractively priced in relation to the value of a company's precious metal-related assets or when the values of
precious metals are expected to benefit from inflationary pressure or other economic, political or financial uncertainty or instability. Based on historical experience, during periods of economic or financial
instability the securities of companies involved in precious metals may be subject to extreme price fluctuations, reflecting the high volatility of precious metal prices during such periods. In addition, the
instability of precious metal prices may result in volatile earnings of precious metal-related companies, which may, in turn, adversely affect the financial condition of such companies.
5
The major producers
of gold include the Republic of South Africa, Russia, Canada, the United States, Brazil and Australia. Sales of gold by Russia are largely unpredictable and often relate to political and economic considerations rather
than to market forces. Economic, financial, social and political factors within South Africa may significantly affect South African gold production.
BORROWING AND LEVERAGE. Unless noted otherwise, the Fund may borrow up to 33 1∕3% of the value of its total assets (calculated at the time of the borrowing). The Fund may pledge up to 33 1∕3% of its total assets to secure these borrowings. If the Fund’s asset coverage for borrowings falls below 300%, the Fund will take prompt action to reduce borrowings. If the Fund
borrows to invest in securities, any investment gains made on the securities in excess of interest paid on the borrowing will cause the net asset value of the shares to rise faster than would otherwise be the case. On
the other hand, if the investment performance of the additional securities purchased fails to cover their cost (including any interest paid on the money borrowed) to the Fund, the net asset value of the Fund’s
shares will decrease faster than would otherwise be the case. This is the speculative factor known as “leverage.”
The Fund may borrow
from time to time, at the discretion of the subadviser, to take advantage of investment opportunities, when yields on available investments exceed interest rates and other expenses of related borrowing, or when, in the
subadviser's opinion, unusual market conditions otherwise make it advantageous for the Fund to increase its investment capacity. The Fund will only borrow when there is an expectation that it will benefit the Fund
after taking into account considerations such as interest income and possible losses upon liquidation. Borrowing by the Fund creates an opportunity for increased net income but, at the same time, creates risks,
including the fact that leverage may exaggerate changes in the NAV of Fund shares and in the yield on the Fund. Unless otherwise stated, the Fund may borrow through forward rolls, dollar rolls or reverse repurchase
agreements.
CONVERTIBLE SECURITIES. Convertible securities entitle the holder to receive interest payments paid on corporate debt securities or the dividend preference on a preferred stock until such time as the convertible
security matures or is redeemed or until the holder elects to exercise the conversion privilege.
The
characteristics of convertible securities make them appropriate investments for an investment company seeking long-term capital appreciation and/or total return. These characteristics include the potential for capital
appreciation as the value of the underlying common stock increases, the relatively high yield received from dividend or interest payments as compared to common stock dividends and decreased risks of decline in value
relative to the underlying common stock due to their fixed-income nature. As a result of the conversion feature, however, the interest rate or dividend preference on a convertible security is generally less than would
be the case if the securities were issued in nonconvertible form.
In analyzing
convertible securities, the subadviser will consider both the yield on the convertible security relative to its credit quality and the potential capital appreciation that is offered by the underlying common stock,
among other things.
Convertible securities are issued and traded in a number of securities markets. Even in cases where a substantial portion of the convertible securities held by the Fund are denominated in U.S. dollars, the
underlying equity securities may be quoted in the currency of the country where the issuer is domiciled. With respect to convertible securities denominated in a currency different from that of the underlying equity
securities, the conversion price may be based on a fixed exchange rate established at the time the security is issued. As a result, fluctuations in the exchange rate between the currency in which the debt security is
denominated and the currency in which the share price is quoted will affect the value of the convertible security. As described below, the Fund is authorized to enter into foreign currency hedging transactions in which
the Fund may seek to reduce the effect of such fluctuations.
Apart from currency
considerations, the value of convertible securities is influenced by both the yield of nonconvertible securities of comparable issuers and by the value of the underlying common stock. The value of a convertible
security viewed without regard to its conversion feature (i.e., strictly on the basis of its yield) is sometimes referred to as its “investment value.” To the extent interest rates change, the investment
value of the convertible security typically will fluctuate. However, at the same time, the value of the convertible security will be influenced by its “conversion value,” which is the market value of the
underlying common stock that would be obtained if the convertible security were converted. Conversion value fluctuates directly with the price of the underlying common stock. If, because of a low price of the common
stock, the conversion value is substantially below the investment value of the convertible security, the price of the convertible security is governed principally by its investment value.
To the extent the
conversion value of a convertible security increases to a point that approximates or exceeds its investment value, the price of the convertible security will be influenced principally by its conversion value. A
convertible security will sell at a premium over the conversion value to the extent investors place value on the right to acquire the underlying common stock while holding a fixed-income security. The yield and
conversion premium of convertible securities issued in Japan and the Euromarket are frequently determined at levels that cause the conversion value to affect their market value more than the securities' investment value.
Target
Asset Allocation Funds 6
Holders of convertible securities generally have a claim on the assets of the issuer prior to the common stockholders but may be subordinated to other debt securities of the same issuer. A convertible
security may be subject to redemption at the option of the issuer at a price established in the charter provision, indenture or other governing instrument pursuant to which the convertible security was issued. If a
convertible security held by the Fund is called for redemption, the Fund will be required to redeem the security, convert it into the underlying common stock or sell it to a third party. Certain convertible debt
securities may provide a put option to the holder, which entitles the holder to cause the security to be redeemed by the issuer at a premium over the stated principal amount of the debt security under certain
circumstances.
Synthetic convertible
securities may be either (i) a debt security or preferred stock that may be convertible only under certain contingent circumstances or that may pay the holder a cash amount based on the value of shares of underlying
common stock partly or wholly in lieu of a conversion right (a “Cash-Settled Convertible”), (ii) a combination of separate securities chosen by the subadviser in order to create the economic characteristics
of a convertible security, i.e., a fixed income security paired with a security with equity conversion features, such as an option or warrant (a “Manufactured Convertible”) or (iii) a synthetic security
manufactured by another party.
Synthetic convertible
securities may include either Cash-Settled Convertibles or Manufactured Convertibles. Cash-Settled Convertibles are instruments that are created by the issuer and have the economic characteristics of traditional
convertible securities but may not actually permit conversion into the underlying equity securities in all circumstances. As an example, a private company may issue a Cash-Settled Convertible that is convertible into
common stock only if the company successfully completes a public offering of its common stock prior to maturity and otherwise pays a cash amount to reflect any equity appreciation. Manufactured Convertibles are created
by the subadviser by combining separate securities that possess one of the two principal characteristics of a convertible security, i.e., fixed income (“fixed income component”) or a right to acquire equity
securities (“convertibility component”). The fixed income component is achieved by investing in nonconvertible fixed income securities, such as nonconvertible bonds, preferred stocks and money market
instruments. The convertibility component is achieved by investing in call options, warrants, or other securities with equity conversion features (“equity features”) granting the holder the right to
purchase a specified quantity of the underlying stocks within a specified period of time at a specified price or, in the case of a stock index option, the right to receive a cash payment based on the value of the
underlying stock index.
A Manufactured
Convertible differs from traditional convertible securities in several respects. Unlike a traditional convertible security, which is a single security having a unitary market value, a Manufactured Convertible is
comprised of two or more separate securities, each with its own market value. Therefore, the total “market value” of such a Manufactured Convertible is the sum of the values of its fixed-income component
and its convertibility component.
More
flexibility is possible in the creation of a Manufactured Convertible than in the purchase of a traditional convertible security. Because many corporations have not issued convertible securities, the subadviser may
combine a fixed income instrument and an equity feature with respect to the stock of the issuer of the fixed income instrument to create a synthetic convertible security otherwise unavailable in the market. The
subadviser may also combine a fixed income instrument of an issuer with an equity feature with respect to the stock of a different issuer when the subadviser believes such a Manufactured Convertible would better
promote the Fund’s objective(s) than alternate investments. For example, the subadviser may combine an equity feature with respect to an issuer's stock with a fixed income security of a different issuer in the
same industry to diversify the Fund’s credit exposure, or with a U.S. Treasury instrument to create a Manufactured Convertible with a higher credit profile than a traditional convertible security issued by that
issuer. A Manufactured Convertible also is a more flexible investment in that its two components may be purchased separately and, upon purchasing the separate securities, “combined” to create a Manufactured
Convertible. For example, the Fund may purchase a warrant for eventual inclusion in a Manufactured Convertible while postponing the purchase of a suitable bond to pair with the warrant pending development of more
favorable market conditions.
The value of a
Manufactured Convertible may respond differently to certain market fluctuations than would a traditional convertible security with similar characteristics. For example, in the event the Fund created a Manufactured
Convertible by combining a short-term U.S. Treasury instrument and a call option on a stock, the Manufactured Convertible would likely outperform a traditional convertible of similar maturity that is convertible into
that stock during periods when Treasury instruments outperform corporate fixed income securities and underperform during periods when corporate fixed-income securities outperform Treasury instruments.
CERTIFICATES OF DEPOSIT. The FDIC, an independent agency of the U.S. Government, provides deposit insurance on all types of deposits, including certificates of deposit, received at an FDIC-insured bank or savings
association (“insured depository institutions”) up to applicable limits. The standard deposit insurance amount is $250,000 per depositor (including principal and accrued interest) for each insurable
capacity of such depositor, per insured depository institution, which is backed by the full faith and credit of the
7
U.S.
Government. All of a depositor’s deposits in the same insurable capacity at the same insured depository institution are aggregated for purposes of the $250,000 insurance limit, including deposits held directly in
the depositor’s name and for the depositor’s benefit by intermediaries. Any amounts in excess of the $250,000 deposit insurance limit may be uninsured.
CORPORATE LOANS. Commercial banks and other financial institutions make loans to companies that need capital to grow or restructure (“corporate loans”). Borrowers generally pay interest on
corporate loans at rates that change in response to changes in market interest rates such as the LIBOR or the prime rate of U.S. banks. As a result, the value of corporate loan investments is generally responsive to
shifts in market interest rates. Because the trading market for corporate loans is less developed than the secondary market for bonds and notes, the Fund may experience difficulties from time to time in selling its
corporate loans. Borrowers frequently provide collateral to secure repayment of these obligations. Leading financial institutions often act as agent for a broader group of lenders, generally referred to as a
“syndicate.” The syndicate's agent arranges the corporate loans, holds collateral and accepts payments of principal and interest. If the agent develops financial problems, the Fund may not recover its
investment, or there might be a delay in the Fund’s recovery. By investing in a corporate loan, the Fund becomes a member of the syndicate.
As in the case of
junk bonds, the corporate loans in which the Fund may invest can be expected to provide higher yields than higher-rated fixed income securities but may be subject to greater risk of loss of principal and interest.
There are, however, some significant differences between corporate loans and junk bonds. Corporate loans are frequently secured by pledges of liens and security interests in the assets of the borrower, and the holders
of corporate loans are frequently the beneficiaries of debt service subordination provisions imposed on the borrower's bondholders. These arrangements are designed to give corporate loan investors preferential
treatment over junk bond investors in the event of a deterioration in the credit quality of the issuer. Even when these arrangements exist, however, there can be no assurance that the principal and interest owed on the
corporate loans will be repaid in full. Corporate loans generally bear interest at rates set at a margin above a generally recognized base lending rate that may fluctuate on a day-to-day basis, in the case of the prime
rate of a U.S. bank, or that may be adjusted on set dates, typically 30 days but generally not more than one year, in the case of LIBOR. Consequently, the value of corporate loans held by the Fund may be expected to
fluctuate significantly less than the value of fixed rate junk bond instruments as a result of changes in the interest rate environment. On the other hand, the secondary dealer market for corporate loans is not as well
developed as the secondary dealer market for junk bonds, and therefore presents increased market risk relating to liquidity and pricing concerns.
The Fund may acquire
interests in corporate loans by means of a novation, assignment or participation. In a novation, the Fund would succeed to all the rights and obligations of the assigning institution and become a contracting party
under the credit agreement with respect to the debt obligation. As an alternative, the Fund may purchase an assignment, in which case the Fund may be required to rely on the assigning institution to demand payment and
enforce its rights against the borrower but would otherwise typically be entitled to all of such assigning institution's rights under the credit agreement. Participation interests in a portion of a debt obligation
typically result in a contractual relationship only with the institution selling the participation interest and not with the borrower. In purchasing a loan participation, the Fund generally will have no right to
enforce compliance by the borrower with the terms of the loan agreement, nor any rights of set-off against the borrower, and the Fund may not directly benefit from the collateral supporting the debt obligation in which
it has purchased the participation. As a result, the Fund will assume the credit risk of both the borrower and the institution selling the participation to the Fund.
CUSTODIAL RECEIPTS. Obligations issued or guaranteed as to principal and interest by the U.S. Government, foreign governments or semi-governmental entities may be acquired by the Fund in the form of custodial
receipts that evidence ownership of future interest payments, principal payments or both on certain notes or bonds. Typically, custodial receipts have their unmatured interest coupons separated (“stripped”)
by their holder. Having separated the interest coupons from the underlying principal of the government securities, the holder will resell the stripped securities in custodial receipt programs with a number of different
names, including “Treasury Income Growth Receipts” (“TIGRs”) and “Certificate of Accrual on Treasury Securities” (“CATS”). The stripped coupons are sold separately from
the underlying principal, which is usually sold at a deep discount because the buyer receives only the right to receive a future fixed payment on the security and does not receive any rights to periodic interest (cash)
payments. CATS and TIGRs are not considered U.S. Government securities by the staff of the SEC. Such notes and bonds are held in custody by a bank or a brokerage firm on behalf of the owners.
DEBT SECURITIES. Debt securities, such as bonds, involve credit risk. This is the risk that the issuer will not make timely payments of principal and interest. The degree of credit risk depends on the
issuer's financial condition and on the terms of the bonds. Changes in an issuer's credit rating or the market's perception of an issuer's creditworthiness may also affect the value of the Fund’s investment in
that issuer. Credit risk is reduced to the extent the Fund invests its assets in U.S. Government securities. All debt securities, however, are subject to interest rate risk. This is the risk that the value of the
security may fall when interest rates rise. In general, the market price of debt securities with longer maturities will go up or down more in response to changes in interest rates than the market price of shorter-term
securities.
Target
Asset Allocation Funds 8
DEPOSITARY RECEIPTS. The Fund may invest in the securities of foreign issuers in the form of Depositary Receipts or other securities convertible into securities of foreign issuers. Depositary Receipts may not
necessarily be denominated in the same currency as the underlying securities into which they may be converted. ADRs and ADSs are receipts or shares typically issued by an American bank or trust company that evidence
ownership of underlying securities issued by a foreign corporation. EDRs are receipts issued in Europe that evidence a similar ownership arrangement. GDRs are receipts issued throughout the world that evidence a
similar arrangement. Generally, ADRs and ADSs, in registered form, are designed for use in the U.S. securities markets, and EDRs, in bearer form, are designed for use in European securities markets. GDRs are tradable
both in the United States and in Europe and are designed for use throughout the world.
The Fund may invest
in unsponsored Depositary Receipts. The issuers of unsponsored Depositary Receipts are not obligated to disclose material information in the United States, and, therefore, there may be less information available
regarding such issuers and there may not be a correlation between such information and the market value of the Depositary Receipts. Depositary Receipts are generally subject to the same risks as the foreign securities
that they evidence or into which they may be converted or exchanged.
DERIVATIVES. The Fund may use instruments referred to as derivatives. Derivatives are financial instruments the value of which is derived from another security, a commodity (such as gold or oil), a
currency or an index (a measure of value or rates, such as the S&P 500 Index or the prime lending rate). Derivatives allow the Fund to increase or decrease the level of risk to which the Fund is exposed more quickly
and efficiently than transactions in other types of instruments. The Fund may use derivatives for hedging purposes. The Fund may also use derivatives to seek to enhance returns. The use of a derivative is speculative
if the Fund is primarily seeking to achieve gains, rather than offset the risk of other positions. When the Fund invests in a derivative for speculative purposes, the Fund will be fully exposed to the risks of loss of
that derivative, which may sometimes be greater than the derivative's cost. The Fund may not use any derivative to gain exposure to an asset or class of assets that the Fund would be prohibited by its investment
restrictions from purchasing directly.
A discussion of the
risk factors relating to derivatives is set out in the sub-section entitled “Risk Factors Involving Derivatives.”
EXCHANGE-TRADED FUNDS. The Fund may invest in ETFs. ETFs, which may be unit investment trusts or mutual funds, typically hold portfolios of securities designed to track the performance of various broad
securities indexes or sectors of such indexes. ETFs provide another means, in addition to futures and options on indexes, of including stock index exposure in the Fund’s investment strategies. The Fund will
indirectly bear its proportionate share of any management fees and other expenses paid by such ETF.
HEDGING. Hedging is a strategy in which a derivative or security is used to offset the risks associated with other Fund holdings. Losses on the other investment may be substantially reduced by
gains on a derivative that reacts in an opposite manner to market movements. While hedging can reduce losses, it can also reduce or eliminate gains or cause losses if the market moves in a different manner than
anticipated by the Fund or if the cost of the derivative outweighs the benefit of the hedge. Hedging also involves the risk that changes in the value of the derivative will not match those of the holdings being hedged
as expected by the Fund, in which case any losses on the holdings being hedged may not be reduced or may be increased. The inability to close options and futures positions also could have an adverse impact on the
Fund’s ability to hedge effectively its portfolio. There is also a risk of loss by the Fund of margin deposits or collateral in the event of bankruptcy of a broker with whom the Fund has an open position in an
option, a futures contract or a related option.
There can be no
assurance that the Fund’s hedging strategies will be effective or that hedging transactions will be available to the Fund. The Fund is not required to engage in hedging transactions and the Fund may choose not to
do so from time to time.
INDEXED AND INVERSE
SECURITIES. The Fund may invest in securities the potential return of which is based on an index or interest rate. As an illustration, the Fund may invest in a security whose value is based on changes
in a specific index or that pays interest based on the current value of an interest rate index, such as the prime rate. The Fund may also invest in a debt security that returns principal at maturity based on the level
of a securities index or a basket of securities, or based on the relative changes of two indices. In addition, the Fund may invest in securities the potential return of which is based inversely on the change in an
index or interest rate (that is, a security the value of which will move in the opposite direction of changes to an index or interest rate). For example, the Fund may invest in securities that pay a higher rate of
interest when a particular index decreases and pay a lower rate of interest (or do not fully return principal) when the value of the index increases. Investing in such securities may subject the Fund to reduced or
eliminated interest payments or loss of principal in the event of an adverse movement in the relevant interest rate, index or indices. Indexed and inverse securities may involve credit risk, and certain indexed and
inverse securities may involve leverage risk, liquidity risk and currency risk. The Fund may invest in indexed and inverse securities for hedging purposes or to seek to increase returns. When used for hedging purposes,
indexed and inverse securities involve correlation risk. (Furthermore, where such a security includes a contingent liability, in the event of such an adverse movement, the Fund may be required to pay substantial
additional margin to maintain the position.)
9
SWAP
AGREEMENTS. The Fund may enter into swap transactions, including, but not limited to, equity, interest rate, index, credit default, total return and, to the extent that it invests in foreign
currency-denominated securities, currency exchange rate swap agreements. In addition, the Fund may enter into options on swap agreements (swap options). These swap transactions are entered into in an attempt to obtain
a particular return when it is considered desirable to do so, possibly at a lower cost to the Fund than if the Fund had invested directly in an instrument that yielded that desired return. Swap transactions are a type
of derivative. Derivatives are further discussed in the sub-sections entitled “Derivatives” and “Risk Factors Involving Derivatives.”
Swap agreements are
two party contracts entered into primarily by institutional investors. In a standard “swap” transaction, two parties agree to exchange the returns (or differentials in rates of return) earned or realized on
or calculated with respect to particular predetermined investments or instruments, which may be adjusted for an interest factor. The gross returns to be exchanged or “swapped” between the parties are
generally calculated with respect to a “notional amount,” that is, the return on or increase in value of a particular dollar amount invested at a particular interest rate or in a “basket” of
securities representing a particular index or other investments or instruments. Most swap agreements entered into by the Fund would calculate the obligations of the parties to the agreement on a “net
basis.” Consequently the Fund’s current obligations (or rights) under a swap agreement will generally be equal only to the net amount to be paid or received under the agreement based on the relative values
of the positions held by each party to the agreement (the “net amount”). The Fund’s current obligations under a swap agreement will be accrued daily (offset against any amounts owed to the Fund) and
any accrued but unpaid net amounts owed to a swap counterparty will be covered by the segregation of liquid assets.
To the extent that
the Fund enters into swaps on other than a net basis, the amount maintained in a segregated account will be the full amount of the Fund’s obligations, if any, with respect to such swaps, accrued on a daily basis.
Inasmuch as segregated accounts are established for these hedging transactions, the subadviser and the Fund believe such obligations do not constitute senior securities and, accordingly, will not treat them as being
subject to the Fund’s borrowing restrictions. If there is a default by the other party to such a transaction, the Fund will have contractual remedies pursuant to the agreement related to the transaction. Since
swaps are individually negotiated, the Fund expects to achieve an acceptable degree of correlation between its rights to receive a return on its portfolio securities and its rights and obligations to receive and pay a
return pursuant to swaps. The Fund will enter into swaps only with counterparties meeting certain creditworthiness standards (generally, such counterparties would have to be eligible counterparties under the terms of
the Fund’s repurchase agreement guidelines approved by the Board).
Unless otherwise
noted, the Fund’s net obligations, in respect of all swap agreements, are limited to 15% of its net assets.
CREDIT DEFAULT SWAP
AGREEMENTS AND SIMILAR INSTRUMENTS. The Fund may enter into credit default swap agreements and similar agreements. The credit default swap agreement or similar instrument may have as reference obligations one or more
securities that are not currently held by the Fund. The protection “buyer” in a credit default contract may be obligated to pay the protection “seller” an up-front or a periodic stream of
payments over the term of the contract provided generally that no credit event on a reference obligation has occurred. If a credit event occurs, the seller generally must pay the buyer the “par value” (full
notional value) of the swap in exchange for an equal face amount of deliverable obligations of the reference entity described in the swap, or the seller may be required to deliver the related net cash amount, if the
swap is cash settled. The Fund may be either the buyer or seller in the transaction. If the Fund is a buyer and no credit event occurs, the Fund recovers nothing if the swap is held through its termination date.
However, if a credit event occurs, the buyer may elect to receive the full notional value of the swap in exchange for an equal face amount of deliverable obligations of the reference entity that may have little or no
value. As a seller, the Fund generally receives an up-front payment or a fixed rate of income throughout the term of the swap provided that there is no credit event. If a credit event occurs, generally the seller must
pay the buyer the full notional value of the swap in exchange for an equal face amount of deliverable obligations of the reference entity that may have little or no value.
Credit default swaps
and similar instruments involve greater risks than if the Fund had invested in the reference obligation directly, since, in addition to general market risks, they are subject to illiquidity risk, counterparty risk and
credit risk. The Fund will enter into credit default swap agreements and similar instruments only with counterparties that are rated investment grade quality by at least one credit rating agency at the time of entering
into such transaction or whose creditworthiness is believed by the subadviser to be equivalent to such rating. If a credit event were to occur, the value of any deliverable obligation received by the seller, coupled
with the up-front or periodic payments previously received, may be less than the full notional value it pays to the buyer, resulting in a loss of value to the Fund. When acting as a seller of a credit default swap or a
similar instrument, the Fund is exposed to many of the same risks of leverage since, if a credit event occurs, the seller may be required to pay the buyer the full notional value of the contract net of any amounts owed
by the buyer related to its delivery of deliverable obligations.
Target
Asset Allocation Funds 10
CREDIT-LINKED SECURITIES. Among the income producing securities in which the Fund may invest are credit-linked securities, which are issued by a limited purpose trust or other vehicle that, in turn, invests in a
derivative instrument or basket of derivative instruments, such as credit default swaps, interest rate swaps and other securities, in order to provide exposure to certain fixed income markets. For instance, the Fund
may invest in credit-linked securities as a cash management tool in order to gain exposure to a certain market and/or to remain fully invested when more traditional income producing securities are not available.
Like an investment in
a bond, investments in these credit-linked securities represent the right to receive periodic income payments (in the form of distributions) and payment of principal at the end of the term of the security. However,
these payments are conditioned on the issuer's receipt of payments from, and the issuer's potential obligations to, the counterparties to the derivative instruments and other securities in which the issuer invests. For
instance, the issuer may sell one or more credit default swaps, under which the issuer would receive a stream of payments over the term of the swap agreements provided that no event of default has occurred with respect
to the referenced debt obligation upon which the swap is based. If a default occurs, the stream of payments may stop and the issuer would be obligated to pay the counterparty the par (or other agreed upon value) of the
referenced debt obligation. This, in turn, would reduce the amount of income and principal that the Fund would receive. The Fund’s investments in these instruments are indirectly subject to the risks associated
with derivative instruments, including, among others, credit risk, default or similar event risk, counterparty risk, interest rate risk, leverage risk and management risk. It is also expected that the securities will
be exempt from registration under the 1933 Act. Accordingly, there may be no established trading market for the securities and they may constitute illiquid investments.
TOTAL RETURN SWAP
AGREEMENTS. The Fund may enter into total return swap agreements. Total return swap agreements are contracts in which one party agrees to make periodic payments based on the change in market value of
the underlying assets, which may include a specified security, basket of securities or securities indices during the specified period, in return for periodic payments based on a fixed or variable interest rate or the
total return from other underlying assets. Total return swap agreements may be used to obtain exposure to a security or market without owning or taking physical custody of such security or market. Total return swap
agreements may effectively add leverage to the Fund’s portfolio because, in addition to its total net assets, the Fund would be subject to investment exposure on the notional amount of the swap. Total return swap
agreements entail the risk that a party will default on its payment obligations to the Fund thereunder. Swap agreements also bear the risk that the Fund will not be able to meet its obligation to the counterparty.
Generally, the Fund will enter into total return swaps on a net basis (i.e., the two payment streams are netted out with the Fund receiving or paying, as the case may be, only the net amount of the two payments). The
net amount of the excess, if any, of the Fund’s obligations over its entitlements with respect to each total return swap will be accrued on a daily basis, and an amount of cash or liquid instruments having an
aggregate NAV at least equal to the accrued excess will be segregated by the Fund. If the total return swap transaction is entered into on other than a net basis, the full amount of the Fund’s obligations will be
accrued on a daily basis, and the full amount of the Fund’s obligations will be segregated by the Fund in an amount equal to or greater than the market value of the liabilities under the total return swap
agreement or the amount it would have cost the Fund initially to make an equivalent direct investment, plus or minus any amount the Fund is obligated to pay or is to receive under the total return swap agreement.
Unless otherwise
noted, the Fund’s net obligations in respect of all swap agreements are limited to 15% of its net assets.
OPTIONS ON SECURITIES
AND SECURITIES INDEXES.
TYPES OF OPTIONS. The Fund may engage in transactions in options on individual securities, baskets of securities or securities indices, or particular measurements of value or rate (an “index”),
such as an index of the price of treasury securities or an index representative of short term interest rates. Such investments may be made on exchanges and in OTC markets. In general, exchange-traded options have
standardized exercise prices and expiration dates and require the parties to post margin against their obligations, and the performance of the parties' obligations in connection with such options is guaranteed by the
exchange or a related clearing corporation. OTC options have more flexible terms negotiated between the buyer and the seller, but generally do not require the parties to post margin and are subject to greater credit
risk. OTC options also involve greater liquidity risk. See “Additional Risk Factors of OTC Transactions; Limitations on the Use of OTC Derivatives.”
CALL OPTIONS. The Fund may purchase call options on any of the types of securities or instruments in which it may invest. A call option gives the Fund the right to buy, and obligates the seller to sell,
the underlying security at the exercise price at any time during the option period. The Fund also may purchase and sell call options on indices. Index options are similar to options on securities except that, rather
than taking or making delivery of securities underlying the option at a specified price upon exercise, an index option gives the holder the right to receive cash upon exercise of the option if the level of the index
upon which the option is based is greater than the exercise price of the option.
The Fund may only
write (i.e., sell) covered call options on the securities or instruments in which it may invest and enter into closing purchase transactions with respect to certain of such options. A covered call option is an option
in which the Fund owns the underlying security or has an absolute and immediate right to acquire that security, without additional consideration (or for additional
11
consideration held in a segregated account by its custodian), upon conversion or exchange of other securities currently held in its portfolio or with respect to which the Fund has established cover by
segregating liquid instruments on its books. The principal reason for writing call options is the attempt to realize, through the receipt of premiums, a greater return than would be realized on the securities alone. By
writing covered call options, the Fund gives up the opportunity, while the option is in effect, to profit from any price increase in the underlying security above the option exercise price. In addition, the
Fund’s ability to sell the underlying security will be limited while the option is in effect unless the Fund enters into a closing purchase transaction. A closing purchase transaction cancels out the Fund’s
position as the writer of an option by means of an offsetting purchase of an identical option prior to the expiration of the option it has written. Covered call options also serve as a partial hedge to the extent of
the premium received against a decline in the price of the underlying security. Also, with respect to call options written by the Fund that are covered only by segregated portfolio securities, the Fund is exposed to
the risk of loss equal to the amount by which the price of the underlying securities rises above the exercise price.
PUT OPTIONS. The Fund may purchase put options to seek to hedge against a decline in the value of its securities or to enhance its return. By buying a put option, the Fund acquires a right to sell such
underlying securities or instruments at the exercise price, thus limiting the Fund’s risk of loss through a decline in the market value of the securities or instruments until the put option expires. The amount of
any appreciation in the value of the underlying securities or instruments will be partially offset by the amount of the premium paid for the put option and any related transaction costs. Prior to its expiration, a put
option may be sold in a closing sale transaction and profit or loss from the sale will depend on whether the amount received is more or less than the premium paid for the put option plus the related transaction costs.
A closing sale transaction cancels out the Fund’s position as the purchaser of an option by means of an offsetting sale of an identical option prior to the expiration of the option it has purchased. The Fund also
may purchase uncovered put options.
The Fund may write
(i.e., sell) put options on the types of securities or instruments that may be held by the Fund, provided that such put options are covered, meaning that such options are secured by segregated, liquid instruments. The
Fund will receive a premium for writing a put option, which increases the Fund’s return.
FUTURES. The Fund may engage in transactions in futures and options thereon. Futures are standardized, exchange-traded contracts which obligate a purchaser to take delivery, and a seller to make
delivery, of a specific amount of an asset at a specified future date at a specified price. No price is paid upon entering into a futures contract. Rather, upon purchasing or selling a futures contract the Fund is
required to deposit collateral (“margin”) equal to a percentage (generally less than 10%) of the contract value. Each day thereafter until the futures position is closed, the Fund will pay additional margin
representing any loss experienced as a result of the futures position the prior day or be entitled to a payment representing any profit experienced as a result of the futures position the prior day. Futures involve
substantial leverage risk.
The sale of a futures
contract limits the Fund’s risk of loss through a decline in the market value of portfolio holdings correlated with the futures contract prior to the futures contract's expiration date. In the event the market
value of the portfolio holdings correlated with the futures contract increases rather than decreases, however, the Fund will realize a loss on the futures position and a lower return on the portfolio holdings than
would have been realized without the purchase of the futures contract.
The purchase of a
futures contract may protect the Fund from having to pay more for securities as a consequence of increases in the market value for such securities during a period when the Fund was attempting to identify specific
securities in which to invest in a market the Fund believes to be attractive. In the event that such securities decline in value or the Fund determines not to complete an anticipatory hedge transaction relating to a
futures contract, however, the Fund may realize a loss relating to the futures position.
The Fund is also
authorized to purchase or sell call and put options on futures contracts including financial futures and stock indices in connection with its hedging activities. Generally, these strategies would be used under the same
market and market sector conditions (i.e., conditions relating to specific types of investments) in which the Fund entered into futures transactions. The Fund may purchase put options or write (i.e., sell) call options
on futures contracts and stock indices rather than selling the underlying futures contract in anticipation of a decrease in the market value of its securities. Similarly, the Fund can purchase call options, or write
put options on futures contracts and stock indices, as a substitute for the purchase of such futures to hedge against the increased cost resulting from an increase in the market value of securities which the Fund
intends to purchase.
The Fund may only
write “covered” put and call options on futures contracts. The Fund will be considered “covered” with respect to a call option written on a futures contract if the Fund owns the assets that are
deliverable under the futures contract or an option to purchase that futures contract having a strike price equal to or less than the strike price of the “covered” option and having an expiration date not
earlier than the expiration date of the “covered” option, or if it segregates for the term of the option cash or other liquid assets equal to the fluctuating value of the optioned future. The Fund will be
considered “covered” with respect to a put option written on a futures contract if the Fund owns an option to sell that futures contract having a strike price equal to or greater than the
Target
Asset Allocation Funds 12
strike price of the “covered” option, or if the Fund segregates for the term of the option cash or other liquid assets at all times equal in value to the exercise price of the put (less any
initial margin deposited by the Fund with its futures custody manager or as otherwise permitted by applicable law with respect to such option). There is no limitation on the amount of the Fund’s assets that can
be segregated.
The Fund has claimed
an exclusion from the definition of the term “commodity pool operator” (“CPO”) under the Commodity Exchange Act (CEA) pursuant to Rule 4.5 under the CEA promulgated by the CFTC. The Fund is not,
therefore, subject to registration or regulation as a CPO under the CEA and the Fund is operated so as not to be deemed to be a “commodity pool” under the regulations of the CFTC. In February 2012, the CFTC
adopted certain regulatory changes that potentially could subject the Manager of the Fund to registration with the CFTC as a CPO if the Fund is unable to comply with certain trading and marketing limitations. In order
for the Manager to avoid regulation as a CPO, with respect to investments in commodity futures, commodity options or swaps used for purposes other than bona fide hedging purposes, the Fund must meet one of the
following tests: (1) the aggregate initial margin and premiums required to establish the Fund’s positions in such investments may not exceed 5% of the liquidation value of the Fund’s portfolio (after
accounting for unrealized profits and unrealized losses on any such investments); or (2) the aggregate net notional value of such instruments, determined at the time the most recent position was established, may not
exceed 100% of the liquidation value of the Fund’s portfolio (after accounting for unrealized profits and unrealized losses on any such positions). In addition to meeting one of the foregoing trading limitations,
the Fund may not market itself as a commodity pool or otherwise as a vehicle for trading in the commodity futures, commodity options or swaps markets. Compliance with these additional registration and regulatory
requirements would increase Fund expenses. These rules go into effect on December 31, 2012. In the event that the Manager is required to register as a CPO, the Fund’s disclosure and operations would need to
comply with all applicable CFTC regulations. The Fund and the Manager are continuing to analyze the effect of these rule changes on the Fund.
FOREIGN EXCHANGE
TRANSACTIONS. The Fund may engage in spot and forward foreign exchange transactions and currency swaps, purchase and sell options on currencies and purchase and sell currency futures and related options
thereon (collectively, Currency Instruments) for purposes of hedging against the decline in the value of currencies in which its portfolio holdings are denominated against the U.S. dollar or to seek to enhance returns.
Such transactions could be effected with respect to hedges on non-U.S. dollar denominated securities owned by the Fund, sold by the Fund but not yet delivered, or committed or anticipated to be purchased by the Fund.
As an illustration,
the Fund may use such techniques to hedge the stated value in U.S. dollars of an investment in a yen-denominated security. In such circumstances, for example, the Fund may purchase a foreign currency put option
enabling the Fund to sell a specified amount of yen for dollars at a specified price by a future date. To the extent the hedge is successful, a loss in the value of the yen relative to the dollar will tend to be offset
by an increase in the value of the put option. To offset, in whole or in part, the cost of acquiring such a put option, the Fund may also sell a call option which, if exercised, requires the Fund to sell a specified
amount of yen for dollars at a specified price by a future date (a technique called a “straddle”). By selling such a call option in this illustration, the Fund gives up the opportunity to profit without
limit from increases in the relative value of the yen to the dollar. Straddles of the type that may be used by the Fund are considered to constitute hedging transactions and are consistent with the policies described
above. The Fund will not attempt to hedge all of its foreign portfolio positions.
FORWARD FOREIGN
EXCHANGE TRANSACTIONS. Forward foreign exchange transactions are OTC contracts to purchase or sell a specified amount of a specified currency or multinational currency unit at a price and future date set at the
time of the contract. Spot foreign exchange transactions are similar but require current, rather than future, settlement. The Fund will enter into foreign exchange transactions for purposes of hedging either a specific
transaction or a portfolio position, or to seek to enhance returns. The Fund may enter into a foreign exchange transaction for purposes of hedging a specific transaction by, for example, purchasing a currency needed to
settle a security transaction or selling a currency in which the Fund has received or anticipates receiving a dividend or distribution.
The Fund may enter
into a foreign exchange transaction for purposes of hedging a portfolio position by selling forward a currency in which a portfolio position of the Fund is denominated or by purchasing a currency in which the Fund
anticipates acquiring a portfolio position in the near future. The Fund may also hedge portfolio positions through currency swaps, which are transactions in which one currency is simultaneously bought for a second
currency on a spot basis and sold for the second currency on a forward basis. Forward foreign exchange transactions involve substantial currency risk, and also involve credit and liquidity risk.
CURRENCY FUTURES. The Fund may seek to enhance returns or hedge against the decline in the value of a currency against the U.S. dollar through use of currency futures or options thereon. Currency futures
are similar to forward foreign exchange transactions except that futures are standardized, exchange-traded contracts. See the sub-section entitled “Futures.” Currency futures involve substantial currency
risk, and also involve leverage risk.
13
CURRENCY OPTIONS. The Fund may seek to enhance returns or hedge against the decline in the value of a currency against the U.S. dollar through the use of currency options. Currency options are similar to
options on securities, but in consideration for an option premium the writer of a currency option is obligated to sell (in the case of a call option) or purchase (in the case of a put option) a specified amount of a
specified currency on or before the expiration date for a specified amount of another currency. The Fund may engage in transactions in options on currencies either on exchanges or OTC markets. See “Types of
Options” and “Additional Risk Factors of OTC Transactions; Limitations on the Use of OTC Derivatives” in this SAI. Currency options involve substantial currency risk, and may also involve credit,
leverage or liquidity risk.
LIMITATIONS ON CURRENCY
HEDGING. The Fund may use currency hedging instruments to seek to enhance returns. Accordingly, the Fund will not hedge a currency in excess of the aggregate market value of the securities that it
owns (including receivables for unsettled securities sales), or has committed to or anticipates purchasing, which are denominated in such currency. The Fund may, however, hedge a currency by entering into a transaction
in a Currency Instrument denominated in a currency other than the currency being hedged (a “cross-hedge”). The Fund will only enter into a cross-hedge if the subadviser believes that (i) there is a
demonstrable high correlation between the currency in which the cross-hedge is denominated and the currency being hedged, and (ii) executing a cross-hedge through the currency in which the cross-hedge is denominated
will be significantly more cost-effective or provide substantially greater liquidity than executing a similar hedging transaction by means of the currency being hedged.
RISK FACTORS IN HEDGING
FOREIGN CURRENCY. Hedging transactions involving Currency Instruments have substantial risks, including correlation risk. While the Fund’s use of Currency Instruments to effect hedging strategies is
intended to reduce the volatility of the NAV of the Fund’s shares, the NAV of the Fund’s shares will fluctuate. Moreover, although Currency Instruments will be used with the intention of hedging against
adverse currency movements, transactions in Currency Instruments involve the risk that anticipated currency movements will not be accurately predicted and that the Fund’s hedging strategies will be ineffective.
To the extent that the Fund hedges against anticipated currency movements that do not occur, the Fund may realize losses and decrease its total return as the result of its hedging transactions. Furthermore, the Fund
will only engage in hedging activities from time to time and may not be engaging in hedging activities when movements in currency exchange rates occur.
In connection with
its trading in forward foreign currency contracts, the Fund will contract with a foreign or domestic bank, or foreign or domestic securities dealer, to make or take future delivery of a specified amount of a particular
currency. There are no limitations on daily price moves in such forward contracts, and banks and dealers are not required to continue to make markets in such contracts. There have been periods during which certain
banks or dealers have refused to quote prices for such forward contracts or have quoted prices with an unusually wide spread between the price at which the bank or dealer is prepared to buy and that at which it is
prepared to sell. Governmental imposition of credit controls might limit any such forward contract trading. With respect to its trading of forward contracts, if any, the Fund will be subject to the risk of bank or
dealer failure and the inability of, or refusal by, a bank or dealer to perform with respect to such contracts. Any such default would deprive the Fund of any profit potential or force the Fund to cover its commitments
for resale, if any, at the then market price and could result in a loss to the Fund.
It may not be
possible for the Fund to hedge against currency exchange rate movements, even if correctly anticipated, in the event that (i) the currency exchange rate movement is so generally anticipated that the Fund is not able to
enter into a hedging transaction at an effective price, or (ii) the currency exchange rate movement relates to a market with respect to which Currency Instruments are not available and it is not possible to engage in
effective foreign currency hedging. The cost to the Fund of engaging in foreign currency transactions varies with such factors as the currencies involved, the length of the contract period and the market conditions
then prevailing. Since transactions in foreign currency exchange usually are conducted on a principal basis, no fees or commissions are involved.
RISK FACTORS INVOLVING
DERIVATIVES. Derivatives are volatile and involve significant risks, including:
Credit Risk—the risk that the counterparty on a derivative transaction will be unable to honor its financial obligation to the Fund.
Currency Risk—the risk that changes in the exchange rate between two currencies will adversely affect the value (in U.S. dollar terms) of an investment.
Leverage Risk—the risk associated with certain types of investments or trading strategies (such as borrowing money to increase the amount of investments) that relatively small market movements may
result in large changes in the value of an investment. Certain investments or trading strategies that involve leverage can result in losses that greatly exceed the amount originally invested.
Liquidity Risk—the risk that certain securities may be difficult or impossible to sell at the time that the seller would like or at the price that the seller believes the security is currently worth.
Target
Asset Allocation Funds 14
Regulatory Risk—the risk that new regulation of derivatives may make them more costly, may limit their availability, or may otherwise affect their value or performance.
The
use of derivatives for hedging purposes involves correlation risk. If the value of the derivative moves more or less than the value of the hedged instruments, the Fund will experience a gain or loss that will not be
completely offset by movements in the value of the hedged instruments.
The Fund intends to
enter into transactions involving derivatives only if there appears to be a liquid secondary market for such instruments or, in the case of illiquid instruments traded in OTC transactions, such instruments satisfy the
criteria set forth below under “Additional Risk Factors of OTC Transactions; Limitations on the Use of OTC Derivatives.” However, there can be no assurance that, at any specific time, either a liquid
secondary market will exist for a derivative or the Fund will otherwise be able to sell such instrument at an acceptable price. It may therefore not be possible to close a position in a derivative without incurring
substantial losses, if at all.
Certain transactions
in derivatives (such as futures transactions or sales of put options) involve substantial leverage risk and may expose the Fund to potential losses, which exceed the amount originally invested by the Fund. When the
Fund engages in such a transaction, the Fund will deposit in a segregated account at its custodian liquid securities or cash and cash equivalents with a value at least equal to the Fund’s exposure, on a
mark-to-market basis, to the transaction (as calculated pursuant to requirements of the SEC). Such segregation will ensure that the Fund has assets available to satisfy its obligations with respect to the transaction,
but will not limit the Fund’s exposure to loss.
ADDITIONAL RISK FACTORS
OF OTC TRANSACTIONS; LIMITATIONS ON THE USE OF OTC DERIVATIVES. Certain derivatives traded in OTC markets, including indexed securities, swaps and OTC options, involve substantial liquidity risk. The absence of liquidity may make it difficult or
impossible for the Fund to sell such instruments promptly at an acceptable price. The absence of liquidity may also make it more difficult for the Fund to ascertain a market value for such instruments. The Fund will,
therefore, acquire illiquid OTC instruments (i) if the agreement pursuant to which the instrument is purchased contains a formula price at which the instrument may be terminated or sold, or (ii) for which the
subadviser anticipates the Fund can receive on each business day at least two independent bids or offers, unless a quotation from only one dealer is available, in which case that dealer's quotation may be used.
Because derivatives
traded in OTC markets are not guaranteed by an exchange or clearing corporation and generally do not require payment of margin, to the extent that the Fund has unrealized gains in such instruments or has deposited
collateral with its counterparties, the Fund is at risk that its counterparties will become bankrupt or otherwise fail to honor their obligations. The Fund will attempt to minimize the risk that a counterparty will
become bankrupt or otherwise fail to honor its obligations by engaging in transactions in derivatives traded in OTC markets only with financial institutions that appear to have substantial capital or that have provided
the Fund with a third-party guaranty or other credit enhancement.
DISTRESSED SECURITIES. The Fund may invest in securities, including corporate loans purchased in the secondary market, which are the subject of bankruptcy proceedings or otherwise in default as to the repayment
of principal and/or interest at the time of acquisition by the Fund or are rated in the lower rating categories (generally, Ca or lower by Moody's and CC or lower by S&P or Fitch) or which, if unrated, are in the
judgment of the subadviser of equivalent quality (“Distressed Securities”). Investing in Distressed Securities is speculative and involves significant risks. Distressed Securities frequently do not produce
income while they are outstanding and may require the Fund to bear certain extraordinary expenses in order to protect and recover its investment. The Fund does not normally purchase securities rated lower than C but is
not required to dispose of them if they are downgraded.
The Fund will
generally make such investments only when the subadviser believes it is reasonably likely that the issuer of the Distressed Securities will make an exchange offer or will be the subject of a plan of reorganization
pursuant to which the Fund will receive new securities. However, there can be no assurance that such an exchange offer will be made or that such a plan of reorganization will be adopted. In addition, a significant
period of time may pass between the time at which the Fund makes its investment in Distressed Securities and the time that any such exchange offer or plan of reorganization is completed. During this period, it is
unlikely that the Fund will receive any interest payments on the Distressed Securities, the Fund will be subject to significant uncertainty as to whether or not the exchange offer or plan of reorganization will be
completed and the Fund may be required to bear certain extraordinary expenses to protect and recover its investment. Even if an exchange offer is made or plan of reorganization is adopted with respect to Distressed
Securities held by the Fund, there can be no assurance that the securities or other assets received by the Fund in connection with such exchange offer or plan of reorganization will not have a lower value or income
potential than may have been anticipated when the investment was made. Moreover, any securities received by the Fund upon completion of an exchange offer or plan of reorganization may be restricted as to resale. As a
result of the Fund’s participation in negotiations with respect to any exchange offer or plan of reorganization with respect to an issuer of Distressed Securities, the Fund may be restricted from disposing of
such securities.
15
FOREIGN INVESTMENTS. The Fund may invest in foreign equity and/or debt securities. Foreign debt securities include certain foreign bank obligations and U.S. dollar or foreign currency-denominated obligations
of foreign governments or their subdivisions, agencies and instrumentalities, international agencies and supranational entities.
Foreign Market Risk. Foreign securities offer the potential for more diversification than if the Fund invests only in the United States because securities traded on foreign markets have often (though not
always) performed differently from securities in the United States. However, such investments involve special risks not present in U.S. investments that can increase the chances that the Fund will lose money. In
particular, the Fund is subject to the risk that, because there are generally fewer investors on foreign exchanges and a smaller number of shares traded each day, it may be difficult for the Fund to buy and sell
securities on those exchanges. In addition, prices of foreign securities may fluctuate more than prices of securities traded in the United States.
Foreign Economy Risk. The economies of certain foreign markets often do not compare favorably with that of the United States with respect to such issues as growth of gross national product, reinvestment of
capital, resources, and balance of payments position. Certain such economies may rely heavily on particular industries or foreign capital and are more vulnerable to diplomatic developments, the imposition of economic
sanctions against a particular country or countries, changes in international trading patterns, trade barriers, and other protectionist or retaliatory measures. Investments in foreign markets may also be adversely
affected by governmental actions such as the imposition of capital controls, nationalization of companies or industries, expropriation of assets, or the imposition of punitive taxes. In addition, the governments of
certain countries may prohibit or impose substantial restrictions on foreign investing in their capital markets or in certain industries. Any of these actions could severely affect security prices, impair the
Fund’s ability to purchase or sell foreign securities or transfer the Fund’s assets or income back into the United States, or otherwise adversely affect the Fund’s operations. Other foreign market
risks include foreign exchange controls, difficulties in pricing securities, defaults on foreign government securities, difficulties in enforcing favorable legal judgments in foreign courts, and political and social
instability. Legal remedies available to investors in certain foreign countries may be less extensive than those available to investors in the United States or other foreign countries.
Currency Risk and
Exchange Risk. Securities in which the Fund invests may be denominated or quoted in currencies other than the U.S. dollar. Changes in foreign currency exchange rates will affect the value of the
Fund’s portfolio. Generally, when the U.S. dollar rises in value against a foreign currency, a security denominated in that currency loses value because the currency is worth fewer U.S. dollars. Conversely, when
the U.S. dollar decreases in value against a foreign currency, a security denominated in that currency gains value because the currency is worth more U.S. dollars. This risk, generally known as “currency
risk,” means that a stronger U.S. dollar will reduce returns for U.S. investors while a weak U.S. dollar will increase those returns.
Governmental
Supervision and Regulation/Accounting Standards. Many foreign governments supervise and regulate stock exchanges, brokers and the sale of securities less rigorously than the United States. Some countries may not have laws to protect
investors comparable to the U.S. securities laws. For example, some foreign countries may have no laws or rules against insider trading. Insider trading occurs when a person buys or sells a company's securities based
on nonpublic information about that company. Accounting standards in other countries are not necessarily the same as in the United States. If the accounting standards in another country do not require as much detail as
U.S. accounting standards, it may be harder for Fund management to completely and accurately determine a company's financial condition.
Certain Risks of Holding Fund Assets Outside the United States. The Fund generally holds its foreign securities and cash in foreign banks and securities depositories. Some foreign banks and securities depositories may be recently organized or new to
the foreign custody business. In addition, there may be limited or no regulatory oversight over their operations. Also, the laws of certain countries may put limits on the Fund’s ability to recover its assets if
a foreign bank or depository or issuer of a security or any of their agents goes bankrupt. In addition, it is often more expensive for the Fund to buy, sell and hold securities in certain foreign markets than in the
United States. The increased expense of investing in foreign markets reduces the amount the Fund can earn on its investments and typically results in a higher operating expense ratio for the Fund as compared to
investment companies that invest only in the United States.
Settlement Risk. Settlement and clearance procedures in certain foreign markets differ significantly from those in the United States. Foreign settlement procedures and trade regulations also may involve
certain risks (such as delays in payment for or delivery of securities) not typically generated by the settlement of U.S. investments. Communications between the United States and emerging market countries may be
unreliable, increasing the risk of delayed settlements or losses of security certificates. Settlements in certain foreign countries at times have not kept pace with the number of securities transactions; these problems
may make it difficult for the Fund to carry out transactions. If the Fund cannot settle or there is a delay in settling a purchase of securities, the Fund may miss attractive investment opportunities and certain assets
may be uninvested with no return earned thereon for some period. If the Fund cannot settle or there is a delay in settling a sale of securities, the Fund may lose money if the value of the security then declines or, if
there is a contract to sell the security to another party, the Fund could be liable to that party for any losses incurred.
Target
Asset Allocation Funds 16
Dividends or interest
on, or proceeds from the sale of, foreign securities may be subject to foreign withholding taxes, thereby reducing the amount available for distribution to shareholders.
INITIAL PUBLIC OFFERINGS. The Fund may invest in securities sold in IPOs. An IPO is the first sale of stock by a private company to the public. IPOs are often issued by smaller, younger companies seeking capital to
expand, but can also be done by large privately-owned companies looking to become publicly traded.
In an IPO, the issuer
obtains the assistance of an underwriting firm, which helps it determine what type of security to issue (common or preferred), best offering price and time to bring it to market. The volume of IPOs and the levels at
which the newly issued stocks trade in the secondary market are affected by the performance of the stock market overall. If IPOs are brought to the market, availability may be limited and the Fund may not be able to
buy any shares at the offering price, or if the Fund is able to buy shares, the Fund may not be able to buy as many shares at the offering price as the Fund would like.
Investing in IPOs
entails risks. Importantly, the prices of securities involved in IPOs are often subject to greater and more unpredictable price changes than more established stocks. It is difficult to predict what the stock will do on
its initial day of trading and in the near future since there is often little historical data with which to analyze the company. Also, most IPOs are of companies going through a transitory growth period, and they are
therefore subject to additional uncertainty regarding their future value.
INVESTMENT IN EMERGING MARKETS. The Fund may invest in the securities of issuers domiciled in various countries with emerging capital markets. Specifically, a country with an emerging capital market is any country that
the World Bank, the International Finance Corporation, the United Nations or its authorities has determined to have a low or middle income economy. Countries with emerging markets can be found in regions such as Asia,
Latin America, Eastern Europe and Africa.
Investments in the
securities of issuers domiciled in countries with emerging capital markets involve certain additional risks not involved in investments in securities of issuers in more developed capital markets, such as (i) low or
non-existent trading volume, resulting in a lack of liquidity and increased volatility in prices for such securities, as compared to securities of comparable issuers in more developed capital markets, (ii) uncertain
national policies and social, political and economic instability, increasing the potential for expropriation of assets, confiscatory taxation, high rates of inflation or unfavorable diplomatic developments, (iii)
possible fluctuations in exchange rates, differing legal systems and the existence or possible imposition of exchange controls, custodial restrictions or other foreign or U.S. governmental laws or restrictions
applicable to such investments, (iv) national policies that may limit the Fund’s investment opportunities such as restrictions on investment in issuers or industries deemed sensitive to national interests, and
(v) the lack or relatively early development of legal structures governing private and foreign investments and private property. In addition to withholding taxes on investment income, some countries with emerging
markets may impose differential capital gains taxes on foreign investors.
Such capital markets
are emerging in a dynamic political and economic environment brought about by events over recent years that have reshaped political boundaries and traditional ideologies. In such a dynamic environment, there can be no
assurance that these capital markets will continue to present viable investment opportunities for the Fund. In the past, governments of such nations have expropriated substantial amounts of private property, and most
claims of the property owners have never been fully settled. There is no assurance that such expropriations will not reoccur. In such an event, it is possible that the Fund could lose the entire value of its
investments in the affected markets.
Also, there may be
less publicly available information about issuers in emerging markets than would be available about issuers in more developed capital markets, and such issuers may not be subject to accounting, auditing and financial
reporting standards and requirements comparable to those to which U.S. companies are subject. In certain countries with emerging capital markets, reporting standards vary widely. As a result, traditional investment
measurements used in the United States, such as price/earnings ratios, may not be applicable. Emerging market securities may be substantially less liquid and more volatile than those of mature markets, and companies
may be held by a limited number of persons. This may adversely affect the timing and pricing of the Fund’s acquisition or disposal of securities.
Practices in relation
to settlement of securities transactions in emerging markets involve higher risks than those in developed markets, in part because the Fund will need to use brokers and counterparties that are less well capitalized,
and custody and registration of assets in some countries may be unreliable. The possibility of fraud, negligence, undue influence being exerted by the issuer or refusal to recognize ownership exists in some emerging
markets, and, along with other factors, could result in ownership registration being completely lost. The Fund would absorb any loss resulting from such registration problems and may have no successful claim for
compensation.
17
RESTRICTIONS ON CERTAIN INVESTMENTS. A number of publicly traded closed-end investment companies have been organized to facilitate indirect foreign investment in developing countries, and certain of such countries, such as
Thailand, South Korea, Chile and Brazil have specifically authorized such funds. There also are investment opportunities in certain of such countries in pooled vehicles that resemble open-end investment companies. In
accordance with the 1940 Act, the Fund may invest up to 10% of its total assets in securities of other investment companies, not more than 5% of which may be invested in any one such company. In addition, under the
1940 Act, the Fund may not own more than 3% of the total outstanding voting stock of any investment company. These restrictions on investments in securities of investment companies may limit opportunities for the Fund
to invest indirectly in certain developing countries. New shares of certain investment companies may at times be acquired only at market prices representing premiums to their net asset values. If the Fund acquires
shares of other investment companies, shareholders would bear both their proportionate share of expenses of the Fund (including management and advisory fees) and, indirectly, the expenses of such other investment
companies. See also “Investment in Other Investment Companies.”
RECENT EVENTS IN
EUROPEAN COUNTRIES. A number of countries in Europe have experienced severe economic and financial difficulties. Many non-governmental issuers, and even certain governments, have defaulted on, or been forced
to restructure, their debts; many other issuers have faced difficulties obtaining credit or refinancing existing obligations; financial institutions have in many cases required government or central bank support, have
needed to raise capital, and/or have been impaired in their ability to extend credit; and financial markets in Europe and elsewhere have experienced extreme volatility and declines in asset values and liquidity. These
difficulties may continue, worsen or spread within and without Europe. Responses to the financial problems by European governments, central banks and others, including austerity measures and reforms, may not work, may
result in social unrest and may limit future growth and economic recovery or have other unintended consequences. Further defaults or restructurings by governments and others of their debt could have additional adverse
effects on economies, financial markets and asset valuations around the world. In addition, one or more countries may abandon the euro, the common currency of the European Union, and/or withdraw from the European
Union. The impact of these actions, especially if they occur in a disorderly fashion, is not clear but could be significant and far-reaching. Whether or not the Fund invests in securities of issuers located in Europe
or with significant exposure to European issuers or countries, these events could negatively affect the value and liquidity of the Fund’s investments.
RISKS OF INVESTING IN
ASIA-PACIFIC COUNTRIES. In addition to the risks of foreign investing and the risks of investing in emerging markets, the developing market Asia-Pacific countries in which the Fund may invest are subject to
certain additional or specific risks. There is a high concentration of market capitalization and trading volume in a small number of issuers representing a limited number of industries, as well as a high concentration
of investors and financial intermediaries. Many of these markets also may be affected by developments with respect to more established markets in the region such as in Japan and Hong Kong. Brokers in developing market
Asia-Pacific countries typically are fewer in number and less well capitalized than brokers in the United States. These factors, combined with the U.S. regulatory requirements for open-end investment companies and the
restrictions on foreign investment discussed below, result in potentially fewer investment opportunities for the Fund and may have an adverse impact on the investment performance of the Fund.
Many of the
developing market Asia-Pacific countries may be subject to a greater degree of economic, political and social instability than is the case in the United States and Western European countries. Such instability may
result from, among other things: (i) authoritarian governments or military involvement in political and economic decision-making, including changes in government through extra-constitutional means; (ii) popular unrest
associated with demands for improved political, economic and social conditions; (iii) internal insurgencies; (iv) hostile relations with neighboring countries; and (v) ethnic, religious and racial disaffection. In
addition, the governments of many of such countries, such as Indonesia, have a heavy role in regulating and supervising the economy. Another risk common to most such countries is that the economy is heavily export
oriented and, accordingly, is dependent upon international trade. The existence of overburdened infrastructure and obsolete financial systems also present risks in certain countries, as do environmental problems.
Certain economies also depend to a significant degree upon exports of primary commodities and, therefore, are vulnerable to changes in commodity prices that, in turn, may be affected by a variety of factors.
The
legal systems in certain developing market Asia-Pacific countries also may have an adverse impact on the Fund. For example, while the potential liability of a shareholder in a U.S. corporation with respect to acts of
the corporation is generally limited to the amount of the shareholder’s investment, the notion of limited liability is less clear in certain emerging market Asia-Pacific countries. Similarly, the rights of
investors in developing market Asia-Pacific companies may be more limited than those of shareholders of U.S. corporations. It may be difficult or impossible to obtain and/or enforce a judgment in a developing market
Asia-Pacific country.
Governments of many
developing market Asia-Pacific countries have exercised and continue to exercise substantial influence over many aspects of the private sector. In certain cases, the government owns or controls many companies,
including the largest in the country. Accordingly, government actions in the future could have a significant effect on economic conditions in developing market
Target
Asset Allocation Funds 18
Asia-Pacific countries, which could affect private sector companies and the Fund itself, as well as the value of securities in the Fund’s portfolio. In addition, economic statistics of developing
market Asia-Pacific countries may be less reliable than economic statistics of more developed nations.
In addition to the
relative lack of publicly available information about developing market Asia-Pacific issuers and the possibility that such issuers may not be subject to the same accounting, auditing and financial reporting standards
as U.S. companies, inflation accounting rules in some developing market Asia-Pacific countries require companies that keep accounting records in the local currency, for both tax and accounting purposes, to restate
certain assets and liabilities on the company’s balance sheet in order to express items in terms of currency of constant purchasing power. Inflation accounting may indirectly generate losses or profits for
certain developing market Asia-Pacific companies. Satisfactory custodial services for investment securities may not be available in some developing Asia-Pacific countries, which may result in the Fund incurring
additional costs and delays in providing transportation and custody services for such securities outside such countries.
Certain developing
Asia-Pacific countries, such as the Philippines, India and Turkey, are especially large debtors to commercial banks and foreign governments. Fund management may determine that, notwithstanding otherwise favorable
investment criteria, it may not be practicable or appropriate to invest in a particular developing Asia-Pacific country. The Fund may invest in countries in which foreign investors, including management of the Fund,
have had no or limited prior experience.
Restrictions on Foreign
Investments in Asia-Pacific Countries. Some developing Asia-Pacific countries prohibit or impose substantial restrictions on investments in their capital markets, particularly their equity markets, by foreign entities such as
the Fund. As illustrations, certain countries may require governmental approval prior to investments by foreign persons or limit the amount of investment by foreign persons in a particular company or limit the
investment by foreign persons to only a specific class of securities of a company which may have less advantageous terms (including price) than securities of the company available for purchase by nationals. There can
be no assurance that the Fund will be able to obtain required governmental approvals in a timely manner. In addition, changes to restrictions on foreign ownership of securities subsequent to the Fund’s purchase
of such securities may have an adverse effect on the value of such shares. Certain countries may restrict investment opportunities in issuers or industries deemed important to national interests.
The manner in which
foreign investors may invest in companies in certain developing Asia-Pacific countries, as well as limitations on such investments, also may have an adverse impact on the operations of the Fund. For example, the Fund
may be required in certain of such countries to invest initially through a local broker or other entity and then have the shares purchased re-registered in the name of the Fund. Re-registration may in some instances
not be able to occur on a timely basis, resulting in a delay during which the Fund may be denied certain of its rights as an investor, including rights as to dividends or to be made aware of certain corporate actions.
There also may be instances where the Fund places a purchase order but subsequently learns, at the time of re-registration, that the permissible allocation of the investment to foreign investors has been filled,
depriving the Fund of the ability to make its desired investment at that time.
Substantial
limitations may exist in certain countries with respect to the Fund’s ability to repatriate investment income, capital or the proceeds of sales of securities by foreign investors. The Fund could be adversely
affected by delays in, or a refusal to grant, any required governmental approval for repatriation of capital, as well as by the application to the Fund of any restrictions on investments. For example, in September
1998, Malaysia imposed currency controls that limited funds’ ability to repatriate proceeds of Malaysian investments. It is possible that Malaysia, or certain other countries may impose similar restrictions or
other restrictions relating to their currencies or to securities of issuers in those countries. To the extent that such restrictions have the effect of making certain investments illiquid, securities may not be
available to meet redemptions. Depending on a variety of financial factors, the percentage of the Fund’s portfolio subject to currency controls may increase. In the event other countries impose similar controls,
the portion of the Fund’s assets that may be used to meet redemptions may be further decreased. Even where there is no outright restriction on repatriation of capital, the mechanics of repatriation may affect
certain aspects of the operations of the Fund. For example, funds may be withdrawn from the People’s Republic of China only in U.S. or Hong Kong dollars and only at an exchange rate established by the government
once each week. In certain countries, banks or other financial institutions may be among the leading companies or have actively traded securities. The 1940 Act restricts the Fund’s investments in any equity
securities of an issuer that, in its most recent fiscal year, derived more than 15% of its revenues from “securities related activities,” as defined by the rules thereunder. These provisions may restrict
the Fund’s investments in certain foreign banks and other financial institutions.
RISK OF INVESTMENTS IN
RUSSIA. The Fund may invest a portion of its assets in securities issued by companies located in Russia. Settlement, clearing and registration of securities transactions in Russia are subject to
significant risks. Ownership of shares is defined according to entries in the company’s share register and normally evidenced by extracts from the register. These extracts are not negotiable instruments and are
not effective evidence of securities ownership. The registrars are not necessarily subject to effective state supervision nor are they licensed with any governmental entity. Also, there is no central registration
system for shareholders and
19
it
is possible for the Fund to lose its registration through fraud, negligence or mere oversight. While the Fund will endeavor to ensure that its interests continue to be appropriately recorded, either by itself or
through a custodian or other agent inspecting the share register and by obtaining extracts of share registers through regular confirmations, these extracts are not legally enforceable and it is possible that a
subsequent illegal amendment or other fraudulent act may deprive the Fund of its ownership rights or improperly dilute its interests. In addition, while applicable Russian regulations impose liability on registrars for
losses resulting from their errors, it may be difficult for the Fund to enforce any rights it may have against the registrar or issuer of the securities in the event of loss of share registration. While the Fund
intends to invest directly in Russian companies that use an independent registrar, there can be no assurance that such investments will not result in a loss to the Fund.
INVESTMENT IN OTHER
INVESTMENT COMPANIES. The Fund may invest in other investment companies, including ETFs. In accordance with the 1940 Act, the Fund may invest up to 10% of its total assets in securities of other investment
companies. In addition, under the 1940 Act, the Fund may not own more than 3% of the total outstanding voting stock of any investment company and not more than 5% of the value of the Fund’s total assets may be
invested in securities of any single investment company. (These limits do not restrict a Feeder Fund from investing all of its assets in shares of its Master Portfolio.)
Notwithstanding the
limits discussed above, the Fund may invest in other investment companies without regard to the limits set forth above provided that the Fund complies with Rules 12d1-1, 12d1-2 and 12d1-3 promulgated by the SEC under
the 1940 Act.
As with other
investments, investments in other investment companies are subject to market and selection risk. In addition, if the Fund acquires shares in other investment companies, shareholders would bear both their proportionate
share of expenses in the Fund (including management and advisory fees) and, indirectly, the expenses of such investment companies (including management and advisory fees).
JUNK BONDS. Junk bonds are debt securities that are rated below investment grade by the major rating agencies or are unrated securities that the subadviser believes are of comparable quality. Although
junk bonds generally pay higher rates of interest than investment grade bonds, they are high risk investments that may cause income and principal losses for the Fund. The major risks in junk bond investments include
the following:
| ■ | Junk bonds are issued by less creditworthy issuers. These securities are vulnerable to adverse changes in the issuer's economic condition and to general economic conditions. Issuers of junk bonds may be unable to meet their interest or principal payment obligations because of an economic downturn, specific issuer developments or the unavailability of additional financing. |
| ■ | The issuers of junk bonds may have a larger amount of outstanding debt relative to their assets than issuers of investment grade bonds. If the issuer experiences financial stress, it may be unable to meet its debt obligations. |
| ■ | Junk bonds are frequently ranked junior to claims by other creditors. If the issuer cannot meet its obligations, the senior obligations are generally paid off before the junior obligations. |
| ■ | Junk bonds frequently have redemption features that permit an issuer to repurchase the security from the Fund before it matures. If an issuer redeems the junk bonds, the Fund may have to invest the proceeds in bonds with lower yields and may lose income. |
| ■ | Prices of junk bonds are subject to extreme price fluctuations. Negative economic developments may have a greater impact on the prices of junk bonds than on other higher rated fixed income securities. |
| ■ | Junk bonds may be less liquid than higher rated fixed income securities even under normal economic conditions. There are fewer dealers in the junk bond market, and there may be significant differences in the prices quoted for junk bonds by the dealers. Because they are less liquid, judgment may play a greater role in valuing certain of the Fund’s portfolio securities than in the case of securities trading in a more liquid market. |
| ■ | The Fund may incur expenses to the extent necessary to seek recovery upon default or to negotiate new terms with a defaulting issuer. |
LIQUIDITY PUTS OR CALLS. The Fund may purchase a permissible instrument or investment together with the right to resell or purchase the instruments at an agreed-upon price or yield within a specified period prior
to the maturity date of the instruments. Such a right to resell is commonly known as a put, and such a right to purchase is commonly known as a call. The aggregate price which the Fund pays for instruments with puts or
calls may be higher than the price which otherwise would be paid for the instruments. The purpose of this practice is to permit the Fund to be fully invested while preserving the necessary liquidity to meet unusually
large redemptions and to purchase at a later date securities other than those subject to the put. The Fund may choose to exercise puts during periods in which proceeds from sales of its shares and from recent sales of
portfolio securities are insufficient to meet redemption requests or when the funds available are otherwise allocated for investment. The Fund may choose to exercise calls during periods in which funds are available
for investment. In determining whether to exercise puts or calls prior to their expiration date and in selecting which puts or calls to exercise in such circumstances, the subadviser considers, among other things, the
amount of cash available to the Fund, the expiration dates of the available puts or calls, any future commitments for securities purchases, the yield, quality and maturity dates of the underlying securities,
alternative investment opportunities and the desirability of retaining the underlying securities in the Fund.
Target
Asset Allocation Funds 20
MONEY
MARKET INSTRUMENTS. The Fund may invest in money market instruments. Money market instruments include cash equivalents and short-term obligations of U.S. banks, certificates of deposit, short-term obligations
issued or guaranteed by the U.S. Government or its agencies. Money market instruments also include bankers' acceptances, commercial paper, certificates of deposit and Eurodollar obligations issued or guaranteed by bank
holding companies in the U.S., their subsidiaries and foreign branches, by foreign banking institutions, and by the World Bank and other multinational instrumentalities, as well as commercial paper and other short-term
obligations of, and variable amount master demand notes, variable rate notes and funding agreements issued by, U.S. and foreign corporations.
MORTGAGE-BACKED
SECURITIES. Investing in mortgage-backed securities involves certain unique risks in addition to those generally associated with investing in fixed-income securities and in the real estate industry in
general. These unique risks include the failure of a party to meet its commitments under the related operative documents, adverse interest rate changes and the effects of prepayments on mortgage cash flows.
Mortgage-backed securities are “pass-through” securities, meaning that principal and interest payments made by the borrower on the underlying mortgages are passed through to the Fund. The value of
mortgage-backed securities, like that of traditional fixed-income securities, typically increases when interest rates fall and decreases when interest rates rise. However, mortgage-backed securities differ from
traditional fixed-income securities because of their potential for prepayment without penalty. The price paid by the Fund for its mortgage-backed securities, the yield the Fund expects to receive from such securities
and the average life of the securities are based on a number of factors, including the anticipated rate of prepayment of the underlying mortgages. In a period of declining interest rates, borrowers may prepay the
underlying mortgages more quickly than anticipated, thereby reducing the yield to maturity and the average life of the mortgage-backed securities. Moreover, when the Fund reinvests the proceeds of a prepayment in these
circumstances, the likely rate of interest received will be lower than the rate on the security that was prepaid.
Mortgage-backed
securities, including CMOs, can be collateralized by either fixed-rate mortgages or adjustable rate mortgages. Fixed-rate mortgage securities are collateralized by fixed-rate mortgages and tend to have high prepayment
rates when the level of prevailing interest rates declines significantly below the interest rates on the mortgages. Thus, under those circumstances, the securities are generally less sensitive to interest rate
movements than lower coupon fixed-rate mortgages. CMOs may be collateralized by whole mortgage loans or private mortgage pass-through securities, but are more typically collateralized by portfolios of mortgage
pass-through securities guaranteed by Ginnie Mae, Freddie Mac or Fannie Mae.
Generally, adjustable
rate mortgage securities (ARMs) have a specified maturity date and amortize principal over their life. In periods of declining interest rates, there is a reasonable likelihood that ARMs will experience increased rates
of prepayment of principal. However, the major difference between ARMs and fixed-rate mortgage securities (FRMs) is that the interest rate and the rate of amortization of principal of ARMs can and do change in
accordance with movements in a particular, pre-specified, published interest rate index. The amount of interest on an ARM is calculated by adding a specified amount, the “margin,” to the index, subject to
limitations on the maximum and minimum interest that is charged during the life of the mortgage or to maximum and minimum changes to that interest rate during a given period.
The
underlying mortgages which collateralize the ARMs in which the Fund invests will frequently have caps and floors which limit the maximum amount by which the loan rate to the residential borrower may change up or down
(1) per reset or adjustment interval and (2) over the life of the loan. Some residential mortgage loans restrict periodic adjustments by limiting changes in the borrower's monthly principal and interest payments rather
than limiting interest rate changes. These payment caps may result in negative amortization.
To the extent that
the Fund purchases mortgage-backed securities at a premium, mortgage foreclosures and principal prepayments may result in a loss to the extent of the premium paid. If the Fund buys such securities at a discount, both
scheduled payments of principal and unscheduled prepayments will increase current and total returns and will accelerate the recognition of income which, when distributed to shareholders, will be taxable as ordinary
income. In a period of rising interest rates, prepayments of the underlying mortgages may occur at a slower than expected rate, creating maturity extension risk. This particular risk may effectively change a security
that was considered short- or intermediate-term at the time of purchase into a long-term security. Since long-term securities generally fluctuate more widely in response to changes in interest rates than shorter-term
securities, maturity extension risk could increase the inherent volatility of the Fund. Under certain interest rate and prepayment scenarios, the Fund may fail to recoup fully its investment in mortgage-backed
securities notwithstanding any direct or indirect governmental or agency guarantee.
Most mortgage-backed
securities are issued by federal government agencies such as Ginnie Mae, or by government sponsored enterprises such as Freddie Mac and Fannie Mae. Principal and interest payments on mortgage-backed securities issued
by the federal government and some Federal government agencies, such as Ginnie Mae, are guaranteed by the federal government and backed by the full faith and credit of the United States. Mortgage-backed securities
issued by other government agencies or government
21
sponsored enterprises are backed only by the credit of the government agency or enterprise and are not backed by the full faith and credit of the United States. Fannie Mae and Freddie Mac are authorized to
borrow from the U.S. Treasury to meet their obligations. Private mortgage-backed securities are issued by private corporations rather than government agencies and are subject to credit risk and interest rate risk.
Fannie Mae and
Freddie Mac are stockholder-owned companies chartered by Congress. Fannie Mae and Freddie Mac guarantee the securities they issue as to timely payment of principal and interest, but such guarantee is not backed by the
full faith and credit of the United States. In September 2008, Fannie Mae and Freddie Mac were placed into conservatorship by their regulator, the Federal Housing Finance Agency. It is unclear what effect this
conservatorship will have on the securities issued or guaranteed by Fannie Mae or Freddie Mac. Although the U.S. Government has provided financial support to Fannie Mae and Freddie Mac, there can be no assurance that
it will support these or other government-sponsored enterprises (GSEs) in the future.
MUNICIPAL SECURITIES. The Fund may, from time to time, invest in municipal bonds, which may be general obligation or revenue bonds. General obligation bonds are secured by the issuer's pledge of its faith,
credit and taxing power for the payment of principal and interest, whereas revenue bonds are payable only from the revenues derived from a particular facility or class of facilities or, in some cases, from the proceeds
of a special excise or other specific revenue source.
The Fund may invest
in municipal notes including tax, revenue and bond anticipation notes which are issued to obtain funds for various public purposes. The Fund may invest in municipal asset-backed securities, which are debt obligations,
often issued through a trust or other investment vehicles that are backed by municipal debt obligations and accompanied by a liquidity facility. The Fund may invest in municipal securities with the right to resell such
securities to the seller at an agreed-upon price or yield within a specified period prior to the maturity date. Such a right to resell is commonly referred to as a “put” or “tender option.”
Municipal securities
include notes and bonds issued by or on behalf of states, territories and possessions of the United States and their political subdivisions, agencies and instrumentalities and the District of Columbia, the interest on
which is generally eligible for exclusion from federal income tax and, in certain instances, applicable state or local income and personal property taxes. Such securities are traded primarily in the OTC market.
The
interest rates payable on certain municipal bonds and municipal notes are not fixed and may fluctuate based upon changes in market rates. Municipal bonds and notes of this type are called “variable rate”
obligations. The interest rate payable on a variable rate obligation is adjusted either at pre-designated intervals or whenever there is a change in the market rate of interest on which the interest rate payable is
based. Other features may include the right whereby the Fund may demand prepayment of the principal amount of the obligation prior to its stated maturity (a demand feature) and the right of the issuer to prepay the
principal amount prior to maturity. The principal benefit of a variable rate obligation is that the interest rate adjustment minimizes changes in the market value of the obligation. As a result, the purchase of
variable rate obligations should enhance the ability of the Fund to maintain a stable NAV per share and to sell an obligation prior to maturity at a price approximating the full principal amount of the obligation.
Variable rate
securities provide for a specific periodic adjustment in the interest rate based on prevailing market rates and generally would allow the Fund to demand payment of the obligation on short notice at par plus accrued
interest, which amount may, at times, be more or less than the amount the Fund paid for them.
An inverse floater is
a debt instrument with a floating or variable interest rate that moves in the opposite direction of the interest rate on another security or the value of an index. Changes in the interest rate on the other security or
index inversely affect the residual interest rate paid on the inverse floater, with the result that the inverse floater's price will be considerably more volatile than that of a fixed rate bond. Generally, income from
inverse floating rate bonds will decrease when short-term interest rates increase, and will increase when short-term interest rates decrease. Such securities have the effect of providing investment leverage, since they
may increase or decrease in value in response to changes, as an illustration, in market interest rates at a rate that is a multiple (typically two) of the rate at which fixed-rate, long-term, tax-exempt securities
increase or decrease in response to such changes. As a result, the market values of such securities generally will be more volatile than the market values of fixed-rate tax-exempt securities.
REAL
ESTATE RELATED SECURITIES. Although the Fund may not invest directly in real estate, the Fund may invest in securities of issuers that are principally engaged in the real estate industry. Therefore, an investment by
the Fund is subject to certain risks associated with the ownership of real estate and with the real estate industry in general. These risks include, among others: possible declines in the value of real estate; risks
related to general and local economic conditions; possible lack of availability of mortgage funds or other limitations on access to capital; overbuilding; risks associated with leverage; market illiquidity; extended
vacancies of properties; increase in competition, property taxes, capital expenditures and operating expenses; changes in zoning laws or other governmental regulation; costs resulting from the clean-up of, and
liability to third parties for damages resulting from, environmental problems; tenant bankruptcies or other credit problems; casualty or condemnation losses; uninsured damages from floods,
Target
Asset Allocation Funds 22
earthquakes or other natural disasters; limitations on and variations in rents, including decreases in market rates for rents; investment in developments that are not completed or that are subject to
delays in completion; and unfavorable changes in interest rates. To the extent that assets underlying the Fund’s investments are concentrated geographically, by property type or in certain other respects, the
Fund may be subject to certain of the foregoing risks to a greater extent.
Investments by the
Fund in securities of companies providing mortgage servicing will be subject to the risks associated with refinancings and their impact on servicing rights. In addition, if the Fund receives rental income or income
from the disposition of real property acquired as a result of a default on securities the Fund owns, the receipt of such income may adversely affect the Fund’s ability to retain its federal income tax status as a
RIC because of certain income source requirements applicable to regulated investment companies under the Code.
REAL ESTATE INVESTMENT
TRUSTS. Investing in REITs involves certain unique risks in addition to those risks associated with investing in the real estate industry in general. Equity REITs may be affected by changes in the
value of the underlying property owned by the REITs, while mortgage REITs may be affected by the quality of any credit extended. REITs are dependent upon management skills, may not be diversified geographically or by
property type, and are subject to heavy cash flow dependency, default by borrowers and self-liquidation. REITs must also meet certain requirements under the Code to avoid entity level tax and be eligible to
pass-through certain tax attributes of their income to shareholders. REITs are consequently subject to the risk of failing to meet these requirements for favorable tax treatment and of failing to maintain their
exemptions from registration under the 1940 Act. REITs are also subject to the risks of changes in the Code affecting their tax status.
REITs (especially
mortgage REITs) are also subject to interest rate risks. When interest rates decline, the value of a REIT's investment in fixed rate obligations can be expected to rise. Conversely, when interest rates rise, the value
of a REIT's investment in fixed rate obligations can be expected to decline. In contrast, as interest rates on adjustable rate mortgage loans are reset periodically, yields on a REIT's investments in such loans will
gradually align themselves to reflect changes in market interest rates, causing the value of such investments to fluctuate less dramatically in response to interest rate fluctuations than would investments in fixed
rate obligations.
Investing in certain REITs involves risks similar to those associated with investing in small capitalization companies. These REITs may have limited financial resources, may trade less frequently and in
limited volume and may be subject to more abrupt or erratic price movements than larger company securities. Historically, small capitalization stocks, such as REITs, have been more volatile in price than the larger
capitalization stocks included in the S&P 500 Index. The management of a REIT may be subject to conflicts of interest with respect to the operation of the business of the REIT and may be involved in real estate
activities competitive with the REIT. REITs may own properties through joint ventures or in other circumstances in which the REIT may not have control over its investments. REITs may incur significant amounts of
leverage. The Fund’s investments in REITs may subject the Fund to duplicate management and/or advisory fees.
REPURCHASE AGREEMENTS. The Fund may invest in securities pursuant to repurchase agreements. The Fund will enter into repurchase agreements only with parties meeting creditworthiness standards as set forth in the
Fund’s repurchase agreement procedures.
Under such
agreements, the other party agrees, upon entering into the contract with the Fund, to repurchase the security at a mutually agreed-upon time and price in a specified currency, thereby determining the yield during the
term of the agreement. This results in a fixed rate of return insulated from market fluctuations during such period, although such return may be affected by currency fluctuations. In the case of repurchase agreements,
the prices at which the trades are conducted do not reflect accrued interest on the underlying obligation. Such agreements usually cover short periods, such as under one week. Repurchase agreements may be construed to
be collateralized loans by the purchaser to the seller secured by the securities transferred to the purchaser.
In the case of a
repurchase agreement, as a purchaser, the Fund will require all repurchase agreements to be fully collateralized at all times by cash or other liquid assets in an amount at least equal to the resale price. The seller
is required to provide additional collateral if the market value of the securities falls below the repurchase price at any time during the term of the repurchase agreement. In the event of default by the seller under a
repurchase agreement construed to be a collateralized loan, the underlying securities are not owned by the Fund but only constitute collateral for the seller's obligation to pay the repurchase price. Therefore, the
Fund may suffer time delays and incur costs or possible losses in connection with disposition of the collateral.
The Fund may
participate in a joint repurchase agreement account with other investment companies managed by the Manager pursuant to an order of the SEC. On a daily basis, any uninvested cash balances of the Fund may be aggregated
with those of such investment companies and invested in one or more repurchase agreements. The Fund participates in the income earned or accrued in the joint account based on the percentage of its investment.
23
REVERSE REPURCHASE AGREEMENTS AND DOLLAR ROLLS. The Fund may enter into reverse repurchase agreements. A reverse repurchase agreement involves the sale of a portfolio-eligible security by the Fund, coupled with its agreement to
repurchase the instrument at a specified time and price. See “Repurchase Agreements.”
The Fund may enter
into dollar rolls. In a dollar roll, the Fund sells securities for delivery in the current month and simultaneously contracts to repurchase substantially similar (same type and coupon) securities on a specified future
date from the same party. During the roll period, the Fund forgoes principal and interest paid on the securities. The Fund is compensated by the difference between the current sale price and the forward price for the
future purchase (often referred to as the drop) as well as by the interest earned on the cash proceeds of the initial sale. The Fund will segregate cash or other liquid assets, marked to market daily, having a value
equal to the obligations of the Fund in respect of dollar rolls.
Dollar rolls involve
the risk that the market value of the securities retained by the Fund may decline below the price of the securities sold by the Fund but which the Fund is obligated to repurchase under the agreement. In the event the
buyer of securities under a dollar roll files for bankruptcy or becomes insolvent, the Fund’s use of the proceeds of the agreement may be restricted pending a determination by the other party, or its trustee or
receiver, whether to enforce the Fund’s obligation to repurchase the securities. Cash proceeds from dollar rolls may be invested in cash or other liquid assets.
SECURITIES LENDING. Consistent with applicable regulatory requirements, and unless otherwise noted, the Fund may lend its portfolio securities to brokers, dealers and financial institutions, provided that
outstanding loans of the Fund do not exceed in the aggregate 33 1∕3% of the value of the Fund’s total assets and provided that such loans are callable at any time by the Fund and are at all times secured by cash or equivalent collateral (including a
line of credit) that is equal to at least 100% of the market value, determined daily, of the loaned securities. Prudential Investment Management (“PIM”) serves as securities lending agent for the Fund, and
in that role administers the Fund’s securities lending program. PIM is an affiliate of PI. For its services, PIM receives a portion of the amount earned by lending securities. During the time portfolio securities
are on loan, the borrower will pay the Fund an amount equivalent to any dividend or interest paid on such securities and the Fund may invest the cash collateral and earn additional income, or it may receive an
agreed-upon amount of interest income from the borrower. The advantage of such loans is that the Fund continues to receive payments in lieu of the interest and dividends of the loaned securities, while at the same time
earning interest either directly from the borrower or on the collateral, which will be invested in short-term obligations.
A loan may be
terminated by the borrower on one business day's notice or by the Fund at any time. If the borrower fails to maintain the requisite amount of collateral, the loan automatically terminates, and the Fund could use the
collateral to replace the securities while holding the borrower liable for any excess of replacement cost over collateral. As with any extensions of credit, there are risks of delay in receiving additional collateral
or in recovery and in some cases loss of all rights in the collateral should the borrower of the securities fail financially. However, loans of portfolio securities will only be made to firms determined to be
creditworthy pursuant to procedures approved by the Board. On termination of the loan, the borrower is required to return the securities to the Fund, and any gain or loss in the market price during the loan would inure
to the Fund. Since voting or consent rights which accompany loaned securities pass to the borrower, the Fund will follow the policy of calling the loan, in whole or in part as may be appropriate, to permit the exercise
of such rights if the matters involved would have a material effect on the Fund’s investment in the securities which are the subject of the loan. The Fund will pay reasonable finders', administrative and
custodial fees in connection with a loan of its securities or may share the interest earned on collateral with the borrower.
SECURITIES OF SMALLER
OR EMERGING GROWTH COMPANIES. Investment in smaller or emerging growth companies involves greater risk than is customarily associated with investments in more established companies. The securities of smaller or
emerging growth companies may be subject to more abrupt or erratic market movements than larger, more established companies or the market average in general. These companies may have limited product lines, markets or
financial resources, or they may be dependent on a limited management group.
While smaller or
emerging growth company issuers may offer greater opportunities for capital appreciation than large cap issuers, investments in smaller or emerging growth companies may involve greater risks and thus may be considered
speculative. The subadviser believes that properly selected companies of this type have the potential to increase their earnings or market valuation at a rate substantially in excess of the general growth of the
economy. Full development of these companies and trends frequently takes time.
Small cap and emerging growth securities will often be traded only in the OTC market or on a regional securities exchange and may not be traded every day or in the volume typical of trading on a national
securities exchange. As a result, the disposition by the Fund of portfolio securities to meet redemptions or otherwise may require the Fund to make many small sales over a lengthy period of time, or to sell these
securities at a discount from market prices or during periods when, in the subadviser's judgment, such disposition is not desirable.
Target
Asset Allocation Funds 24
While the process of
selection and continuous supervision by the subadviser does not, of course, guarantee successful investment results, it does provide access to an asset class not available to the average individual due to the time and
cost involved. Careful initial selection is particularly important in this area as many new enterprises have promise but lack certain of the fundamental factors necessary to prosper. Investing in small cap and emerging
growth companies requires specialized research and analysis. In addition, many investors cannot invest sufficient assets in such companies to provide wide diversification.
Small companies are generally little known to most individual investors although some may be dominant in their respective industries. The subadviser believes that relatively small companies will continue
to have the opportunity to develop into significant business enterprises. The Fund may invest in securities of small issuers in the relatively early stages of business development that have a new technology, a unique
or proprietary product or service, or a favorable market position. Such companies may not be counted upon to develop into major industrial companies, but Fund management believes that eventual recognition of their
special value characteristics by the investment community can provide above-average long-term growth to the portfolio.
Equity securities of
specific small cap issuers may present different opportunities for long-term capital appreciation during varying portions of economic or securities markets cycles, as well as during varying stages of their business
development. The market valuation of small cap issuers tends to fluctuate during economic or market cycles, presenting attractive investment opportunities at various points during these cycles. Smaller companies, due
to the size and kinds of markets that they serve, may be less susceptible than large companies to intervention from the federal government by means of price controls, regulations or litigation.
SHORT
SALES AND SHORT SALES AGAINST-THE-BOX. The Fund may make short sales of securities, either as a hedge against potential declines in value of a portfolio security or to realize appreciation when a security that the Fund does not
own declines in value. When the Fund makes a short sale, the security sold short is borrowed by the Fund and is delivered by the Fund to the broker-dealer through which the Fund made the short sale. The Fund may have
to pay a fee to borrow particular securities and is often obligated to turn over any payments received on such borrowed securities to the lender of the securities. The Fund may not be able to limit any losses resulting
from share price volatility if the security indefinitely continues to increase in value at such specified time.
The Fund secures its
obligation to replace the borrowed security by depositing collateral with the broker-dealer, usually in cash, U.S. Government securities or other liquid securities similar to those borrowed. With respect to the
uncovered short positions, (1) the Fund is required to deposit similar collateral with its custodian or otherwise segregate collateral on its records, to the extent that the value of the collateral in the aggregate is
at all times equal to at least 100% of the current market value of the security sold short and will not be less than the market value of the security, or (2) the Fund must otherwise cover its short position. Depending
on arrangements made with the broker-dealer from which the Fund borrowed the security, regarding payment over of any payments received by the Fund on such security, the Fund may not receive any payments (including
interest) on its collateral deposited with such broker-dealer.
Because making short
sales in securities not owned by the Fund exposes the Fund to the risks associated with those securities, such short sales involve speculative exposure risk. As a result, if the Fund makes short sales in securities
that increase in value, the Fund will likely underperform similar mutual funds that do not make short sales in securities they do not own. The Fund will incur a loss as a result of a short sale if the price of the
security increases between the date of the short sale and the date on which the Fund replaces the borrowed security. The Fund will realize a gain if the security declines in price between those dates. There can be no
assurance that the Fund will be able to close out a short sale position at any particular time or at a desired price. Although the Fund’s gain is limited to the price at which the Fund sold the security short,
its potential loss is limited only by the maximum attainable price of the security, less the price at which the security was sold and may, theoretically, be unlimited.
The Fund may also
make short sales against-the-box. A short sale against-the-box is a short sale in which the Fund owns an equal amount of the securities sold short, or securities convertible or exchangeable for, with or without payment
of any further consideration, such securities. However, if further consideration is required in connection with the conversion or exchange, cash or other liquid assets, in an amount equal to such consideration, must be
segregated on the Fund’s records or with its Custodian.
SOVEREIGN DEBT. Investment in sovereign debt can involve a high degree of risk. The governmental entity that controls the repayment of sovereign debt may not be able or willing to repay the principal
and/or interest when due in accordance with the terms of such debt. A governmental entity's willingness or ability to repay principal and interest due in a timely manner may be affected by, among other factors, its
cash flow situation, the extent of its foreign reserves, the availability of sufficient foreign exchange on the date a payment is due, the relative size of the debt service burden to the economy as a whole, the
governmental entity's policy towards the International Monetary Fund and the political constraints to which a governmental entity may be subject. Governmental entities may also be dependent on expected disbursements
from foreign governments, multilateral agencies and others abroad to reduce principal and interest arrearages on their debt. The commitment on the part of these governments, agencies and others to make such
disbursements may be conditioned on the implementation of economic reforms and/or economic performance and the timely service
25
of such debtor's obligations. Failure to implement such reforms, achieve such levels of economic performance or repay principal or interest when due may result in the cancellation of such third parties'
commitments to lend funds to the governmental entity, which may further impair such debtor's ability or willingness to timely service its debts. Consequently, governmental entities may default on their sovereign debt.
Holders of sovereign debt may be requested to participate in the rescheduling of such debt and to extend further loans to governmental entities. In the event of a default by a governmental entity, there may be few or
no effective legal remedies for collecting on such debt.
STANDBY COMMITMENT AGREEMENTS. The Fund may enter into standby commitment agreements. These agreements commit the Fund, for a stated period of time, to purchase a stated amount of securities that may be issued and sold
to the Fund at the option of the issuer. The price of the security is fixed at the time of the commitment. At the time of entering into the agreement the Fund is paid a commitment fee, regardless of whether or not the
security is ultimately issued. The Fund will enter into such agreements for the purpose of investing in the security underlying the commitment at a price that is considered advantageous to the Fund. The Fund will limit
investment in such commitments so that the aggregate purchase price of securities subject to such commitments, together with the value of portfolio securities subject to legal restrictions on resale that affect their
marketability, will not exceed 15% of its net assets taken at the time of the commitment. Liquid assets are segregated by the Fund in an aggregate amount equal to the purchase price of the securities underlying the
commitment. There can be no assurance that the securities subject to a standby commitment will be issued, and the value of the security, if issued, on the delivery date may be more or less than its purchase price.
Since the issuance of the security underlying the commitment is at the option of the issuer, the Fund may bear the risk of a decline in the value of such security and may not benefit from any appreciation in the value
of the security during the commitment period. The purchase of a security subject to a standby commitment agreement and the related commitment fee will be recorded on the date on which the security can reasonably be
expected to be issued, and the value of the security thereafter will be reflected in the calculation of the Fund’s NAV. The cost basis of the security will be adjusted by the amount of the commitment fee. In the
event the security is not issued, the commitment fee will be recorded as income on the expiration date of the standby commitment.
STRIPPED SECURITIES. Stripped securities are created when the issuer separates the interest and principal components of an instrument and sells them as separate securities. In general, one security is entitled
to receive the interest payments on the underlying assets (the interest only or “IO” security) and the other to receive the principal payments (the principal only or “PO” security). Some
stripped securities may receive a combination of interest and principal payments. The yields to maturity on IOs and POs are sensitive to the expected or anticipated rate of principal payments (including prepayments) on
the related underlying assets, and principal payments may have a material effect on yield to maturity. If the underlying assets experience greater than anticipated prepayments of principal, the Fund may not fully
recoup its initial investment in IOs. Conversely, if the underlying assets experience less than anticipated prepayments of principal, the yield on POs could be adversely affected. Stripped securities may be highly
sensitive to changes in interest rates and rates of prepayment.
STRUCTURED NOTES. The Fund may invest in structured notes. The values of the structured notes in which the Fund will invest may be linked to equity securities or equity indices or other instruments or
indices (“reference instruments”). These notes differ from other types of debt securities in several respects. The interest rate or principal amount payable at maturity may vary based on changes in the
value of the equity security, instrument, or index. A structured note may be positively or negatively indexed; that is, its value or interest rate may increase or decrease if the value of the reference instrument
increases. Similarly, its value may increase or decrease if the value of the reference instrument decreases. Further, the change in the principal amount payable with respect to, or the interest rate of, a structured
note may be a multiple of the percentage change (positive or negative) in the value of the underlying reference instrument(s).
Investments in
structured notes involve certain risks, including the credit risk of the issuer and the normal risks of price changes in response to changes in interest rates. Further, in the case of certain structured notes, a
decline or increase in the value of the reference instrument may cause the interest rate to be reduced to zero, and any further declines or increases in the reference instrument may then reduce the principal amount
payable on maturity. The percentage by which the value of the structured note decreases may be far greater than the percentage by which the value of the reference instrument increases or decreases. Finally, these
securities may be less liquid than other types of securities, and may be more volatile than their underlying reference instruments.
SUPRANATIONAL ENTITIES. The Fund may invest in debt securities of supranational entities. Examples include the World Bank, the European Steel and Coal Community, the Asian Development Bank and the Inter-American
Development Bank. The government members, or “stockholders,” usually make initial capital contributions to the supranational entity and in many cases are committed to make additional capital contributions
if the supranational entity is unable to repay its borrowings.
YANKEE OBLIGATIONS. The Fund may invest in U.S. dollar-denominated debt securities of foreign corporations issued in the United States and U.S. dollar-denominated debt securities issued or guaranteed as to
payment of principal and interest by governments, quasi-governmental entities, government agencies, and other governmental entities of foreign countries and supranational entities,
Target
Asset Allocation Funds 26
which securities are issued in the United States (Yankee obligations). Debt securities of quasi-governmental entities are issued by entities owned by either a national, state or equivalent government or
are obligations of a political unit that is not backed by the national government’s full faith and credit and general taxing powers. These include, among others, the Province of Ontario and the City of Tokyo.
TEMPORARY DEFENSIVE STRATEGY AND SHORT-TERM INVESTMENTS. The Fund may temporarily invest without limit in money market instruments, including commercial paper of U.S. corporations, certificates of deposit, bankers' acceptances and other
obligations of domestic banks, and obligations issued or guaranteed by the U.S. Government, its agencies or its instrumentalities, as part of a temporary defensive strategy.
The Fund may invest
in money market instruments to maintain appropriate liquidity to meet anticipated redemptions. Money market instruments typically have a maturity of one year or less as measured from the date of purchase. The Fund also
may temporarily hold cash or invest in money market instruments pending investment of proceeds from new sales of Fund shares or during periods of portfolio restructuring.
UTILITY INDUSTRIES. Risks that are intrinsic to the utility industries include difficulty in obtaining an adequate return on invested capital, difficulty in financing large construction programs during an
inflationary period, restrictions on operations and increased cost and delays attributable to environmental considerations and regulation, difficulty in raising capital in adequate amounts on reasonable terms in
periods of high inflation and unsettled capital markets, technological innovations that may render existing plants, equipment or products obsolete, the potential impact of natural or man-made disasters, increased costs
and reduced availability of certain types of fuel, occasionally reduced availability and high costs of natural gas for resale, the effects of energy conservation, the effects of a national energy policy and lengthy
delays and greatly increased costs and other problems associated with the design, construction, licensing, regulation and operation of nuclear facilities for electric generation, including, among other considerations,
the problems associated with the use of radioactive materials and the disposal of radioactive wastes. There are substantial differences between the regulatory practices and policies of various jurisdictions, and any
given regulatory agency may make major shifts in policy from time to time. There is no assurance that regulatory authorities will, in the future, grant rate increases or that such increases will be adequate to permit
the payment of dividends on common stocks. Additionally, existing and possible future regulatory legislation may make it even more difficult for these utilities to obtain adequate relief. Certain of the issuers of
securities held in the Fund’s portfolio may own or operate nuclear generating facilities. Governmental authorities may from time to time review existing policies and impose additional requirements governing the
licensing, construction and operation of nuclear power plants. Prolonged changes in climatic conditions can also have a significant impact on both the revenues of an electric and gas utility as well as the expenses of
a utility, particularly a hydro-based electric utility.
Utility companies in
the United States and in foreign countries are generally subject to regulation. In the United States, most utility companies are regulated by state and/or federal authorities. Such regulation is intended to ensure
appropriate standards of service and adequate capacity to meet public demand. Generally, prices are also regulated in the United States and in foreign countries with the intention of protecting the public while
ensuring that the rate of return earned by utility companies is sufficient to allow them to attract capital in order to grow and continue to provide appropriate services. There can be no assurance that such pricing
policies or rates of return will continue in the future.
The
nature of regulation of the utility industries continues to evolve both in the United States and in foreign countries. In recent years, changes in regulation in the United States increasingly have allowed utility
companies to provide services and products outside their traditional geographic areas and lines of business, creating new areas of competition within the industries. In some instances, utility companies are operating
on an unregulated basis. Because of trends toward deregulation and the evolution of independent power producers as well as new entrants to the field of telecommunications, non-regulated providers of utility services
have become a significant part of their respective industries. The subadviser believes that the emergence of competition and deregulation will result in certain utility companies being able to earn more than their
traditional regulated rates of return, while others may be forced to defend their core business from increased competition and may be less profitable. Reduced profitability, as well as new uses of funds (such as for
expansion, operations or stock buybacks) could result in cuts in dividend payout rates. The subadviser seeks to take advantage of favorable investment opportunities that may arise from these structural changes. Of
course, there can be no assurance that favorable developments will occur in the future.
Foreign utility
companies are also subject to regulation, although such regulations may or may not be comparable to those in the United States. Foreign utility companies may be more heavily regulated by their respective governments
than utilities in the United States and, as in the United States, generally are required to seek government approval for rate increases. In addition, many foreign utilities use fuels that may cause more pollution than
those used in the United States, which may require such utilities to invest in pollution control equipment to meet any proposed pollution restrictions. Foreign regulatory systems vary from country to country and may
evolve in ways different from regulation in the United States.
27
The
Fund’s investment policies are designed to enable it to capitalize on evolving investment opportunities throughout the world. For example, the rapid growth of certain foreign economies will necessitate expansion
of capacity in the utility industries in those countries. Although many foreign utility companies currently are government-owned, thereby limiting current investment opportunities for the Fund, the subadviser believes
that, in order to attract significant capital for growth, foreign governments are likely to seek global investors through the privatization of their utility industries. Privatization, which refers to the trend toward
investor ownership of assets rather than government ownership, is expected to occur in newer, faster-growing economies and in mature economies. Of course, there is no assurance that such favorable developments will
occur or that investment opportunities in foreign markets for the Fund will increase.
The revenues of
domestic and foreign utility companies generally reflect the economic growth and development in the geographic areas in which they do business.
Electric. The electric utility industry consists of companies that are engaged principally in the generation, transmission and sale of electric energy, although many also provide other
energy-related services. In the past, electric utility companies, in general, have been favorably affected by lower fuel and financing costs and the full or near completion of major construction programs. In addition,
many of these companies have generated cash flows in excess of current operating expenses and construction expenditures, permitting some degree of diversification into unregulated businesses. Some electric utilities
have also taken advantage of the right to sell power outside of their traditional geographic areas. Electric utility companies have historically been subject to the risks associated with increases in fuel and other
operating costs, high interest costs on borrowings needed for capital construction programs, costs associated with compliance with environmental and safety regulations and changes in the regulatory climate. As interest
rates declined, many utilities refinanced high cost debt and in doing so improved their fixed charges coverage. Regulators, however, lowered allowed rates of return as interest rates declined and thereby caused the
benefits of the rate declines to be shared wholly or in part with customers. In a period of rising interest rates, the allowed rates of return may not keep pace with the utilities’ increased costs. The
construction and operation of nuclear power facilities are subject to increased scrutiny by, and evolving regulations of, the Nuclear Regulatory Commission and state agencies having comparable jurisdiction. Increased
scrutiny might result in higher operating costs and higher capital expenditures, with the risk that the regulators may disallow inclusion of these costs in rate authorizations or the risk that a company may not be
permitted to operate or complete construction of a facility. In addition, operators of nuclear power plants may be subject to significant costs for disposal of nuclear fuel and for decommissioning such plants.
The rating agencies
look closely at the business profile of utilities. Ratings for companies are expected to be impacted to a greater extent in the future by the division of their asset base. Electric utility companies that focus more on
the generation of electricity may be assigned less favorable ratings as this business is expected to be competitive and the least regulated. On the other hand, companies that focus on transmission and distribution
which is expected to be the least competitive and the more regulated part of the business may see higher ratings given the greater predictability of cash flow.
A number of states
are considering or have enacted deregulation proposals. The introduction of competition into the industry as a result of such deregulation has at times resulted in lower revenue, lower credit ratings, increased default
risk, and lower electric utility security prices. Such increased competition may also cause long-term contracts, which electric utilities previously entered into to buy power, to become “stranded assets,”
which have no economic value. Any loss associated with such contracts must be absorbed by ratepayers and investors. In addition, in anticipation of increasing competition, some electric utilities have acquired electric
utilities overseas to diversify, enhance earnings and gain experience in operating in a deregulated environment. In some instances, such acquisitions have involved significant borrowings, which have burdened the
acquirer’s balance sheet. There is no assurance that current deregulation proposals will be adopted. However, deregulation in any form could significantly impact the electric utilities industry.
Telecommunications. The telecommunications industry today includes both traditional telephone companies, with a history of broad market coverage and highly regulated businesses, and cable companies, which
began as small, lightly regulated businesses focused on limited markets. Today these two historically different businesses are converging in an industry that is trending toward larger, competitive, national and
international markets with an emphasis on deregulation. Companies that distribute telephone services and provide access to the telephone networks still comprise the greatest portion of this segment, but non-regulated
activities such as wireless telephone services, paging, data transmission and processing, equipment retailing, computer software and hardware and internet services are becoming increasingly significant components as
well. In particular, wireless and internet telephone services continue to gain market share at the expense of traditional telephone companies. The presence of unregulated companies in this industry and the entry of
traditional telephone companies into unregulated or less regulated businesses provide significant investment opportunities with companies which may increase their earnings at faster rates than had been allowed in
traditional regulated businesses. Still, increasing competition, technological innovations and other structural changes could adversely affect the profitability
Target
Asset Allocation Funds 28
of such utilities and the growth rate of their dividends. Given mergers and proposed legislation and enforcement changes, it is likely that both traditional telephone companies and cable companies will
continue to provide an expanding range of utility services to both residential, corporate and governmental customers.
Gas. Gas transmission companies and gas distribution companies are undergoing significant changes. In the United States, interstate transmission companies are regulated by the Federal Energy
Regulatory Commission, which is reducing its regulation of the industry. Many companies have diversified into oil and gas exploration and development, making returns more sensitive to energy prices. In the recent
decade, gas utility companies have been adversely affected by disruptions in the oil industry and have also been affected by increased concentration and competition. In the opinion of the subadviser, however,
environmental considerations could improve the gas industry outlook in the future. For example, natural gas is the cleanest of the hydrocarbon fuels, and this may result in incremental shifts in fuel consumption toward
natural gas and away from oil and coal, even for electricity generation. However, technological or regulatory changes within the industry may delay or prevent this result.
Water. Water supply utilities are companies that collect, purify, distribute and sell water. In the United States and around the world the industry is highly fragmented because most of the
supplies are owned by local authorities. Companies in this industry are generally mature and are experiencing little or no per capita volume growth. In the opinion of the subadviser, there may be opportunities for
certain companies to acquire other water utility companies and for foreign acquisition of domestic companies. The subadviser believes that favorable investment opportunities may result from consolidation of this
segment. As with other utilities, however, increased regulation, increased costs and potential disruptions in supply may adversely affect investments in water supply utilities. There can be no assurance that the
positive developments noted above, including those relating to privatization and changing regulation, will occur or that risk factors other than those noted above will not develop in the future.
WARRANTS AND RIGHTS. Warrants and rights are securities permitting, but not obligating, the warrant holder to subscribe for other securities. Buying a warrant does not make the Fund a shareholder of the
underlying stock. The warrant holder has no right to dividends or votes on the underlying stock. A warrant does not carry any right to assets of the issuer, and for this reason investment in warrants may be more
speculative than other equity-based investments.
WHEN-ISSUED SECURITIES,
DELAYED DELIVERY SECURITIES AND FORWARD COMMITMENTS. The Fund may purchase or sell securities that the Fund is entitled to receive on a when-issued basis. The Fund may also purchase or sell securities on a delayed delivery basis or through a
forward commitment. These transactions involve the purchase or sale of securities by the Fund at an established price with payment and delivery taking place in the future. The Fund enters into these transactions to
obtain what is considered an advantageous price to the Fund at the time of entering into the transaction. The Fund has not established any limit on the percentage of its assets that may be committed in connection with
these transactions. When the Fund purchases securities in these transactions, the Fund segregates liquid securities in an amount equal to the amount of its purchase commitments.
There can be no
assurance that a security purchased on a when-issued basis will be issued or that a security purchased or sold through a forward commitment will be delivered. The value of securities in these transactions on the
delivery date may be more or less than the Fund’s purchase price. The Fund may bear the risk of a decline in the value of the security in these transactions and may not benefit from an appreciation in the value
of the security during the commitment period.
U.S. GOVERNMENT
SECURITIES. The Fund may invest in adjustable rate and fixed rate U.S. Government securities. U.S. Government securities are instruments issued or guaranteed by the U.S. Treasury or by an agency or
instrumentality of the U.S. Government. U.S. Government guarantees do not extend to the yield or value of the securities or the Fund’s shares. Not all U.S. Government securities are backed by the full faith and
credit of the United States. Some are supported only by the credit of the issuing agency.
U.S. Treasury
securities include bills, notes, bonds and other debt securities issued by the U.S. Treasury. These instruments are direct obligations of the U.S. Government and, as such, are backed by the full faith and credit of the
United States. They differ primarily in their interest rates, the lengths of their maturities and the dates of their issuances.
Securities issued by agencies of the U.S. Government or instrumentalities of the U.S. Government, including those which are guaranteed by Federal agencies or instrumentalities, may or may not be backed by
the full faith and credit of the United States. Obligations of Ginnie Mae, the Farmers Home Administration, the Small Business Administration and securities guaranteed under FDIC's Temporary Liquidity Guarantee Program
are backed by the full faith and credit of the United States. In the case of securities not backed by the full faith and credit of the United States, the Fund must look principally to the agency issuing or guaranteeing
the obligation for ultimate repayment and may not be able to assert a claim against the United States if the agency or instrumentality does not meet its commitments.
29
The
Fund may invest in debt securities that are guaranteed under the FDIC's Temporary Liquidity Guarantee Program (TLGP). Under the TLGP, the FDIC guarantees, with the full faith and credit of the U.S. Government, the
payment of principal and interest on senior unsecured debt issued by entities eligible to participate in the TLGP, which generally include FDIC-insured depository institutions, U.S. bank holding companies or financial
holding companies and certain U.S. savings and loan holding companies. This guarantee presently extends through the earlier of the maturity date of the debt or June 30, 2012 (or December 31, 2012, depending on when the
debt was originally issued). This guarantee does not extend to shares of the Fund itself.
The Fund may also
invest in component parts of U.S. Government securities, namely either the corpus (principal) of such obligations or one or more of the interest payments scheduled to be paid on such obligations. These obligations may
take the form of (1) obligations from which the interest coupons have been stripped; (2) the interest coupons that are stripped; (3) book-entries at a Federal Reserve member bank representing ownership of obligation
components; or (4) receipts evidencing the component parts (corpus or coupons) of U.S. Government obligations that have not actually been stripped. Such receipts evidence ownership of component parts of U.S. Government
obligations (corpus or coupons) purchased by a third party (typically an investment banking firm) and held on behalf of the third party in physical or book-entry form by a major commercial bank or trust company
pursuant to a custody agreement with the third party. The Fund may also invest in custodial receipts held by a third party that are not U.S. Government securities.
ZERO COUPON SECURITIES,
PAY-IN-KIND SECURITIES AND DEFERRED PAYMENT SECURITIES. The Fund may invest in zero coupon securities. Zero coupon securities are securities that are sold at a discount to par value and on which interest payments are not made during the life of
the security. The discount approximates the total amount of interest the security will accrue and compound over the period until maturity on the particular interest payment date at a rate of interest reflecting the
market rate of the security at the time of issuance. Upon maturity, the holder is entitled to receive the par value of the security. While interest payments are not made on such securities, holders of such securities
are deemed to have received income (“phantom income”) annually, notwithstanding that cash may not be received currently. The effect of owning instruments that do not make current interest payments is that a
fixed yield is earned not only on the original investment but also, in effect, on all discount accretion during the life of the obligations. This implicit reinvestment of earnings at the same rate eliminates the risk
of being unable to invest distributions at a rate as high as the implicit yield on the zero coupon bond, but at the same time eliminates the holder's ability to reinvest at higher rates in the future. For this reason,
some of these securities may be subject to substantially greater price fluctuations during periods of changing market interest rates than are comparable securities that pay interest currently, which fluctuation
increases the longer the period to maturity. These investments benefit the issuer by mitigating its need for cash to meet debt service, but also require a higher rate of return to attract investors who are willing to
defer receipt of cash. The Fund accrues income with respect to these securities for federal income tax and accounting purposes prior to the receipt of cash payments. Pay-in-kind securities are securities that have
interest payable by delivery of additional securities. Upon maturity, the holder is entitled to receive the aggregate par value of the securities. Deferred payment securities are securities that remain a zero coupon
security until a predetermined date, at which time the stated coupon rate becomes effective and interest becomes payable at regular intervals. Zero coupon, pay-in-kind and deferred payment securities may be subject to
greater fluctuation in value and lesser liquidity in the event of adverse market conditions than comparable rated securities paying cash interest at regular intervals.
In addition to the
above described risks, there are certain other risks related to investing in zero coupon, pay-in-kind and deferred payment securities. During a period of severe market conditions, the market for such securities may
become even less liquid. In addition, as these securities do not pay cash interest, the Fund’s investment exposure to these securities and their risks, including credit risk, will increase during the time these
securities are held in the Fund’s portfolio. Further, to maintain its qualification for pass-through treatment under the federal tax laws, the Fund is required to distribute income to its shareholders and,
consequently, may have to dispose of its portfolio securities under disadvantageous circumstances to generate the cash, or may have to leverage itself by borrowing the cash to satisfy these distributions, as they
relate to the distribution of phantom income and the value of the paid-in-kind interest. The required distributions will result in an increase in the Fund’s exposure to such securities.
INVESTMENT
RESTRICTIONS
The
Funds have each adopted the restrictions listed below as fundamental policies. Under the 1940 Act, a fundamental policy is one which cannot be changed without the approval of the holders of a majority of each
Fund’s outstanding voting securities. A “majority of each Fund’s outstanding voting securities,” when used in this SAI, means the lesser of (i) 67% of the voting shares represented at a meeting
at which more than 50% of the outstanding voting shares are present in person or represented by proxy or (ii) more than 50% of the outstanding voting shares.
Each Fund may not:
Target
Asset Allocation Funds 30
1. Purchase the
securities of any issuer if, as a result, the Fund would fail to be a diversified company within the meaning of the 1940 Act, and the rules and regulations promulgated thereunder, as such statute, rules and regulations
are amended from time to time or are interpreted from time to time by the SEC staff (collectively, the 1940 Act Laws and Interpretations) or to the extent that the Fund may be permitted to do so by exemptive order or
similar relief (collectively, with the 1940 Act Laws and Interpretations, the 1940 Act Laws, Interpretations and Exemptions). Each Fund is a “diversified company” as defined in the 1940 Act.
2. Issue senior
securities or borrow money or pledge its assets, except as permitted by the 1940 Act Laws, Interpretations and Exemptions.
3. Buy or sell real
estate, except that investments in securities of issuers that invest in real estate and investments in mortgage-backed securities, mortgage participations or other instruments supported by interests in real estate are
not subject to this limitation, and except that the Fund may exercise rights under agreements relating to such securities, including the right to enforce security interests and to hold real estate acquired by reason of
such enforcement until that real estate can be liquidated in an orderly manner.
4. Make loans, except
through loans of assets of the Fund or through repurchase agreements, provided that for purposes of this limitation, the acquisition of bonds, debentures, other debt securities or instruments, or participations or
other interests therein and investments in government obligations, commercial paper, certificates of deposit, bankers’ acceptances or similar instruments will not be considered the making of a loan.
5. Purchase any
security if as a result 25% or more of the Fund’s total assets would be invested in the securities of issuers having their principal business activities in the same industry, except for temporary defensive
purposes, and except that this limitation does not apply to securities issued or guaranteed by the U.S. government, its agencies or instrumentalities.
6. Act as underwriter
except to the extent that, in connection with the disposition of portfolio securities, it may be deemed to be an underwriter under certain federal securities laws. Each Fund may purchase restricted securities without
limit.
For purposes of
investment restriction number 1, each Fund may not purchase any security (other than obligations of the U.S. government, its agencies or instrumentalities) if as a result: (i) with respect to 75% of a Fund’s
total assets, more than 5% of such assets (determined at the time of investment) would then be invested in securities of a single issuer, or (ii ) 25% or more of the Fund’s total assets (determined at the time of
investment) would be invested in a single industry.
For purposes of
investment restriction number 2, under the 1940 Act, each Fund can borrow money from a bank provided that immediately after such borrowing there is asset coverage of at least 300% for all borrowings. If the asset
coverage falls below 300%, the Fund must, within three business days, reduce the amount of its borrowings to satisfy the 300% requirement.
Whenever any
fundamental investment policy or investment restriction states a maximum percentage of a Fund’s assets, it is intended that if the percentage limitation is met at the time the investment is made, a later change
in percentage resulting from changing total or NAV will not be considered a violation of such policy. As a matter of non-fundamental operating policy, a Fund will not purchase rights if as a result the Fund would then
have more than 5% of its assets (determined at the time of investment) invested in rights.
As a non-fundamental
operating policy, a Fund may not invest in the securities of other investment companies, except that subject to certain restrictions, each Fund may purchase securities of other investment companies in the open market
involving customary brokerage commissions.
31
INFORMATION ABOUT
BOARD MEMBERS AND OFFICERS
Information about Board Members and Officers of the Funds is set forth below. Board Members who are not deemed to be “interested persons” of the Funds, as defined in the 1940 Act, are referred
to as “Independent Board Members.” Board Members who are deemed to be “interested persons” of the Funds are referred to as “Interested Board Members.” The Board Members are
responsible for the overall supervision of the operations of the Funds and perform the various duties imposed on the directors of investment companies by the 1940 Act. The Board in turn elects the Officers, who are
responsible for administering the day-to-day operations of the Funds.
| Independent Board Members(1) | ||
| Name, Address, Age Position(s) Portfolios Overseen | Principal Occupation(s) During Past Five Years | Other Directorships Held |
| Kevin J. Bannon (60) Board Member Portfolios Overseen: 61 | Managing Director (since April 2008) and Chief Investment Officer (since October 2008) of Highmount Capital LLC (registered investment adviser); formerly Executive Vice President and Chief Investment Officer (April 1993-August 2007) of Bank of New York Company; President (May 2003-May 2007) of BNY Hamilton Family of Mutual Funds. | Director of Urstadt Biddle Properties (since September 2008). |
| Linda W. Bynoe (60) Board Member Portfolios Overseen: 61 | President and Chief Executive Officer (since March 1995) and formerly Chief Operating Officer (December 1989-February 1995) of Telemat Ltd. (management consulting); formerly Vice President (January 1985-June 1989) at Morgan Stanley & Co (broker-dealer). | Director of Simon Property Group, Inc. (retail real estate) (May 2003-May 2012); Director of Anixter International, Inc. (communication products distributor) (since January 2006); Director of Northern Trust Corporation (financial services) (since April 2006); Trustee of Equity Residential (residential real estate) (since December 2009). |
| Michael S. Hyland, CFA (66) Board Member Portfolios Overseen: 61 | Independent Consultant (since February 2005); formerly Senior Managing Director (July 2001-February 2005) of Bear Stearns & Co, Inc.; Global Partner, INVESCO (1999-2001); Managing Director and President of Salomon Brothers Asset Management (1989-1999). | None. |
| Douglas H. McCorkindale (73) Board Member Portfolios Overseen: 61 | Formerly Chairman (February 2001-June 2006), Chief Executive Officer (June 2000-July 2005), President (September 1997-July 2005) and Vice Chairman (March 1984-May 2000) of Gannett Co. Inc. (publishing and media). | Director of Lockheed Martin Corp. (aerospace and defense) (since May 2001). |
| Stephen P. Munn (70) Board Member Portfolios Overseen: 61 | Lead Director (since 2007) and formerly Chairman (1993-2007) of Carlisle Companies Incorporated (manufacturer of industrial products). | Lead Director (since 2007) of Carlisle Companies Incorporated (manufacturer of industrial products). |
| Richard A. Redeker (69) Board Member & Independent Chair Portfolios Overseen: 61 | Retired Mutual Fund Senior Executive (44 years); Management Consultant; Independent Directors Council (organization of 2,800 Independent Mutual Fund Directors)-Executive Committee, Chair of Policy Steering Committee, Governing Council. | None. |
| Robin B. Smith (72) Board Member Portfolios Overseen: 61 | Chairman of the Board (since January 2003) of Publishers Clearing House (direct marketing); Member of the Board of Directors of ADLPartner (marketing) (since December 2010); formerly Chairman and Chief Executive Officer (August 1996-January 2003) of Publishers Clearing House. | Formerly Director of BellSouth Corporation (telecommunications) (1992-2006). |
| Stephen G. Stoneburn (69) Board Member Portfolios Overseen: 61 | Chairman, (since July 2011), President and Chief Executive Officer (since June 1996) of Quadrant Media Corp. (publishing company); formerly President (June 1995-June 1996) of Argus Integrated Media, Inc.; Senior Vice President and Managing Director (January 1993-1995) of Cowles Business Media; Senior Vice President of Fairchild Publications, Inc. (1975-1989). | None. |
| Interested Board Members(1) | ||
| Name, Address, Age Position(s) Portfolios Overseen | Principal Occupation(s) During Past Five Years | Other Directorships Held |
| Stuart S. Parker (49) Board Member & President Portfolios Overseen: 61 | President of Prudential Investments LLC (since January 2012); Executive Vice President of Jennison Associates LLC and Head of Retail Distribution of Prudential Investments LLC (June 2005 - December 2011). | None. |
Target
Asset Allocation Funds 32
| Interested Board Members(1) | ||
| Name, Address, Age Position(s) Portfolios Overseen | Principal Occupation(s) During Past Five Years | Other Directorships Held |
| Scott E. Benjamin (39) Board Member & Vice President Portfolios Overseen: 61 | Executive Vice President (since June 2009) of Prudential Investments LLC and Prudential Investment Management Services LLC; Executive Vice President (since September 2009) of AST Investment Services, Inc.; Senior Vice President of Product Development and Marketing, Prudential Investments (since February 2006); Vice President of Product Development and Product Management, Prudential Investments (2003-2006). | None. |
(1) The year that each Board Member joined the Funds’ Board is as follows:
Kevin J. Bannon, 2008; Linda W. Bynoe, 2005; Michael S. Hyland, 2008; Douglas H. McCorkindale, 1998; Stephen P. Munn, 2008; Richard A. Redeker, 2003; Robin B. Smith, 2003; Stephen G. Stoneburn, 1999;
Stuart S. Parker, Board Member and President since 2012; Scott E. Benjamin, Board Member since 2010 and Vice President since 2009.
Note: None of Mr. Bannon, Ms. Bynoe, Mr. Hyland, Mr. McCorkindale, Mr. Munn, Mr. Redeker or Ms. Smith, or any member of his/her immediate family, owned beneficially or of
record any securities in an investment adviser or principal underwriter of the Fund or a person (other than a registered investment company) directly or indirectly controlling, controlled by, or under common control
with an investment adviser or principal underwriter of the Fund as of December 31, 2011. As of that date, Mr. Stoneburn owned $2,022 of Prudential Financial, Inc. 4.50% Medium-Term Notes, Series D, Due November 15,
2020 of which the Manager, Tribeca Group at Morgan Stanley Smith Barney purchased in a discretionarily managed account. Mr. Stoneburn has since disposed of that bond.
| Fund Officers(a)(1) | |
| Name, Address and Age Position with Fund | Principal Occupation(s) During Past Five Years |
| Judy A. Rice (64) Vice President | President, Chief Executive Officer (May 2011-Present) and Executive Vice President (December 2008-May 2011) of Prudential Investment Management Services LLC; Formerly President, Chief Executive Officer, Chief Operating Officer and Officer-In-Charge (February 2003-December 2011) of Prudential Investments LLC; formerly President, Chief Executive Officer and Officer-In-Charge (April 2003-December 2011) of Prudential Mutual Fund Services LLC (PMFS); formerly Member of the Board of Directors of Jennison Associates LLC (November 2010-December 2011); formerly Vice President (February 1999-April 2006) of Prudential Investment Management Services LLC; formerly President, COO, CEO and Manager of PIFM Holdco, LLC (April 2006-December 2011); formerly President, Chief Executive Officer, Chief Operating Officer and Officer-In-Charge (May 2003-June 2005) and Director (May 2003-March 2006) and Executive Vice President (June 2005-March 2006) of AST Investment Services, Inc.; Member of Board of Governors of the Investment Company Institute. |
| Raymond A. O’Hara (56) Chief Legal Officer | Vice President and Corporate Counsel (since July 2010) of Prudential Insurance Company of America (Prudential); Vice President (March 2011-Present) of Pruco Life Insurance Company and Pruco Life Insurance Company of New Jersey; Vice President and Corporate Counsel (March 2011-Present) of Prudential Annuities Life Assurance Corporation; Chief Legal Officer of Prudential Investments LLC (since June 2012); Chief Legal Officer of PMFS (since June 2012) and Corporate Counsel of AST Investment Services, Inc. (since June 2012); formerly Vice President and Corporate Counsel (September 2008-July 2010) of The Hartford Financial Services Group, Inc.; formerly Associate (September 1980-December 1987) and Partner (January 1988–August 2008) of Blazzard & Hasenauer, P.C. (formerly, Blazzard, Grodd & Hasenauer, P.C.). |
| Deborah A. Docs (54) Secretary | Vice President and Corporate Counsel (since January 2001) of Prudential; Vice President (since December 1996) and Assistant Secretary (since March 1999) of Prudential Investments LLC; formerly Vice President and Assistant Secretary (May 2003-June 2005) of AST Investment Services, Inc. |
| Jonathan D. Shain (54) Assistant Secretary | Vice President and Corporate Counsel (since August 1998) of Prudential; Vice President and Assistant Secretary (since May 2001) of Prudential Investments LLC; Vice President and Assistant Secretary (since February 2001) of PMFS; formerly Vice President and Assistant Secretary (May 2003-June 2005) of AST Investment Services, Inc. |
| Claudia DiGiacomo (37) Assistant Secretary | Vice President and Corporate Counsel (since January 2005) of Prudential; Vice President and Assistant Secretary of Prudential Investments LLC (since December 2005); Associate at Sidley Austin Brown & Wood LLP (1999-2004). |
| Andrew R. French (49) Assistant Secretary | Vice President and Corporate Counsel (since February 2010) of Prudential; formerly Director and Corporate Counsel (2006-2010) of Prudential; Vice President and Assistant Secretary (since January 2007) of Prudential Investments LLC; Vice President and Assistant Secretary (since January 2007) of PMFS. |
| Amanda S. Ryan (34) Assistant Secretary | Director and Corporate Counsel (since March 2012) of Prudential; Director and Assistant Secretary (since June 2012) of Prudential Investments LLC; Associate at Ropes & Gray (2008-2012). |
| Timothy J. Knierim (53) Chief Compliance Officer | Chief Compliance Officer of Prudential Investment Management, Inc. (since July 2007); formerly Chief Risk Officer of Prudential Investment Management, Inc. and Prudential Investments LLC (2002-2007) and formerly Chief Ethics Officer of Prudential Investment Management, Inc. and Prudential Investments LLC (2006-2007). |
| Valerie M. Simpson (54) Deputy Chief Compliance Officer | Chief Compliance Officer (since April 2007) of Prudential Investments LLC and AST Investment Services, Inc.; formerly Vice President-Financial Reporting (June 1999-March 2006) for Prudential Life and Annuities Finance. |
| Theresa C. Thompson (50) Deputy Chief Compliance Officer | Vice President, Compliance, Prudential Investments LLC (since April 2004); and Director, Compliance, Prudential Investments LLC (2001-2004). |
33
| Fund Officers(a)(1) | |
| Name, Address and Age Position with Fund | Principal Occupation(s) During Past Five Years |
| Richard W. Kinville (44) Anti-Money Laundering Compliance Officer | Vice President, Corporate Compliance, Anti-Money Laundering Unit (since January 2005) of Prudential; committee member of the American Council of Life Insurers Anti-Money Laundering and Critical Infrastructure Committee (since January 2007); formerly Investigator and Supervisor in the Special Investigations Unit for the New York Central Mutual Fire Insurance Company (August 1994-January 1999); Investigator in AXA Financial's Internal Audit Department and Manager in AXA's Anti-Money Laundering Office (January 1999-January 2005); first chair of the American Council of Life Insurers Anti-Money Laundering and Critical Infrastructure Committee (June 2007-December 2009). |
| Grace C. Torres (53) Treasurer and Principal Financial and Accounting Officer | Assistant Treasurer (since March 1999) and Senior Vice President (since September 1999) of Prudential Investments LLC; Assistant Treasurer (since May 2003) and Vice President (since June 2005) of AST Investment Services, Inc.; Senior Vice President and Assistant Treasurer (since May 2003) of Prudential Annuities Advisory Services, Inc.; formerly Senior Vice President (May 2003-June 2005) of AST Investment Services, Inc. |
| M. Sadiq Peshimam (48) Assistant Treasurer | Vice President (since 2005) of Prudential Investments LLC. |
| Peter Parrella (54) Assistant Treasurer | Vice President (since 2007) and Director (2004-2007) within Prudential Mutual Fund Administration; formerly Tax Manager at SSB Citi Fund Management LLC (1997-2004). |
(a) Excludes Mr. Parker and Mr. Benjamin, interested Board Members who also serve as President and Vice President, respectively.
(1) The year that each individual became an Officer of the Funds is as follows:
Judy
A. Rice, 2012; Raymond A. O’Hara, 2012; Deborah A. Docs, 2004; Jonathan D. Shain, 2005; Claudia DiGiacomo, 2005; Andrew R. French, 2006; Amanda S. Ryan, 2012; Timothy J. Knierim, 2007; Valerie M. Simpson, 2007;
Theresa Thompson, 2008; Richard W. Kinville, 2011; Grace C. Torres, 1998; M. Sadiq Peshimam, 2006; Peter Parrella, 2007.
Explanatory Notes to
Tables:
| ■ | Board Members are deemed to be “Interested,” as defined in the 1940 Act, by reason of their affiliation with Prudential Investments LLC and/or an affiliate of Prudential Investments LLC. |
| ■ | Unless otherwise noted, the address of all Board Members and Officers is c/o Prudential Investments LLC, Gateway Center Three, 100 Mulberry Street, Newark, New Jersey 07102-4077. |
| ■ | There is no set term of office for Board Members or Officers. The Board Members have adopted a retirement policy, which calls for the retirement of Board Members on December 31 of the year in which they reach the age of 75. |
| ■ | “Other Directorships Held” includes only directorships of companies required to register or file reports with the SEC under the 1934 Act (that is, “public companies”) or other investment companies registered under the 1940 Act. |
| ■ | “Portfolios Overseen” includes all investment companies managed by Prudential Investments LLC. The investment companies for which PI serves as manager include the Prudential Investments Mutual Funds, The Prudential Variable Contract Accounts, Target Mutual Funds, Prudential Short Duration High Yield Fund, Inc., The Prudential Series Fund, Prudential's Gibraltar Fund, Inc. and the Advanced Series Trust. |
COMPENSATION OF BOARD
MEMBERS AND OFFICERS. Pursuant to a management agreement with the Funds, the Manager pays all compensation of Fund Officers and employees as well as the fees and expenses of all Interested Board Members.
The Funds pay each
Independent Board Member annual compensation in addition to certain out-of-pocket expenses. Independent Board Members who serve on Board Committees may receive additional compensation. The amount of annual compensation
paid to each Independent Board Member may change as a result of the introduction of additional funds on whose Boards the Board Member may be asked to serve.
Independent Board Members may defer receipt of their fees pursuant to a deferred fee agreement with the Funds. Under the terms of the agreement, the Funds accrue deferred Board Members' fees daily which,
in turn, accrue interest at a rate equivalent to the prevailing rate of 90-day U.S. Treasury Bills at the beginning of each calendar quarter or at the daily rate of return of any Prudential Investments mutual fund
chosen by the Board Member. Payment of the interest so accrued is also deferred and becomes payable at the option of the Board Member. The Funds' obligation to make payments of deferred Board Members' fees, together
with interest thereon, is a general obligation of the Funds. The Funds do not have a retirement or pension plan for Board Members.
The following table
sets forth the aggregate compensation paid by the Funds for the most recently completed fiscal year to the Independent Board Members for service on the Board, and the Board of any other investment company in the Fund
Complex for the most recently completed calendar year. Board Members and officers who are “interested persons” of the Funds (as defined in the 1940 Act) do not receive compensation from PI-managed funds and
therefore are not shown in the following table.
| Compensation Received by Independent Board Members | ||||
| Name | Aggregate Fiscal Year Compensation from Funds | Pension or Retirement Benefits Accrued as Part of Fund Expenses | Estimated Annual Benefits Upon Retirement | Total Compensation from Fund and Fund Complex for Most Recent Calendar Year |
| Kevin J. Bannon | $5,217 | None | None | $190,000 (31/60)* |
| Linda W. Bynoe** | $5,130 | None | None | $187,000 (31/60)* |
Target
Asset Allocation Funds 34
| Compensation Received by Independent Board Members | ||||
| Name | Aggregate Fiscal Year Compensation from Funds | Pension or Retirement Benefits Accrued as Part of Fund Expenses | Estimated Annual Benefits Upon Retirement | Total Compensation from Fund and Fund Complex for Most Recent Calendar Year |
| Michael S. Hyland | $5,227 | None | None | $193,000 (31/60)* |
| Douglas H. McCorkindale** | $5,150 | None | None | $188,000 (31/60)* |
| Stephen P. Munn | $5,247 | None | None | $194,000 (31/60)* |
| Richard A. Redeker | $5,617 | None | None | $212,000 (31/60)* |
| Robin B. Smith** | $5,150 | None | None | $188,000 (31/60)* |
| Stephen G. Stoneburn** | $5,197 | None | None | $189,000 (31/60)* |
Explanatory Notes to
Board Member Compensation Table
*
Compensation relates to portfolios that were in existence for any period during 2011. Number of funds and portfolios represent those in existence as of December 31, 2011, and excludes funds that have merged or
liquidated during the year.
** Under the
Fund complex’s deferred fee agreement, certain Board Members have elected to defer all or part of their total compensation. The total amount of deferred compensation accrued during the calendar year ended
December 31, 2011, including investment results during the year on cumulative deferred fees, amounted to $52,931, $(242,584), $(255,382) and $75,798 for Ms. Bynoe, Mr. McCorkindale, Ms. Smith, and Mr. Stoneburn,
respectively.
BOARD COMMITTEES. The Board has established three standing committees in connection with Fund governance—Audit, Nominating and Governance, and Investment. Information on the membership of each
standing committee and its functions is set forth below.
Audit
Committee: The Audit Committee consists of Messrs. Munn (Chair), McCorkindale and Bannon, Ms. Smith, and Mr. Redeker (ex-officio). The Board has determined that each member of the Audit Committee is
not an “interested person” as defined in the 1940 Act. The responsibilities of the Audit Committee are to assist the Board in overseeing the Funds' independent registered public accounting firm, accounting
policies and procedures and other areas relating to the Funds' auditing processes. The Audit Committee is responsible for pre-approving all audit services and any permitted non-audit services to be provided by the
independent registered public accounting firm directly to the Funds. The Audit Committee is also responsible for pre-approving permitted non-audit services to be provided by the independent registered public accounting
firm to (1) the Manager and (2) any entity in a control relationship with the Manager that provides ongoing services to the Funds, provided that the engagement of the independent registered public accounting firm
relates directly to the operation and financial reporting of the Funds. The scope of the Audit Committee's responsibilities is oversight. It is management's responsibility to maintain appropriate systems for accounting
and internal control and the independent registered public accounting firm's responsibility to plan and carry out an audit in accordance with the standards of the Public Company Accounting Oversight Board (United
States). The number of Audit Committee meetings held during the Funds' most recently completed fiscal year is set forth in the table below.
Nominating and
Governance Committee: The Nominating and Governance Committee of the Board is responsible for nominating Board Members and making recommendations to the Board concerning Board composition, committee structure
and governance, director education, and governance practices. The members of the Nominating and Governance Committee are Mr. Hyland (chair), Mr. Stoneburn, Ms. Bynoe, and Mr. Redeker (ex-officio). The Board has
determined that each member of the Nominating and Governance Committee is not an “interested person” as defined in the 1940 Act. The number of Nominating and Governance Committee meetings held during the
Funds' most recently completed fiscal year is set forth in the table below. The Nominating and Governance Committee Charter is available on the Funds' website.
Prudential and Target
Investment Committees: In September 2005, the Board of each Fund in the Prudential retail mutual funds complex formed joint committees to review the performance of each Fund in the fund complex. The Prudential
Investment Committee reviews the performance of each Fund whose subadvisers are affiliates of the Manager, while the Target Investment Committee reviews the performance of funds whose subadvisers are not affiliates of
the Manager. Each Committee meets at least four times per year and reports the results of its review to the full Board of each Fund at each regularly scheduled Board meeting. Every Independent Board Member sits on one
of the two Committees.
The
Prudential Investment Committee consists of Mr. Bannon (chair), Mr. McCorkindale, Mr. Munn, Ms. Smith and Mr. Parker. The Target Investment Committee consists of Mr. Stoneburn (chair), Mr. Hyland, Mr. Redeker, Ms.
Bynoe and Mr. Benjamin. The number of Prudential and Target Investment Committee meetings, as applicable, held during the Fund's most recently completed fiscal year is set forth in the table below.
35
| Board Committee Meetings (for most recently completed fiscal year) | ||
| Audit Committee | Nominating & Governance Committee | Target Investment Committee |
| 4 | 4 | 4 |
LEADERSHIP STRUCTURE
AND QUALIFICATIONS OF BOARD MEMBERS. The Board is responsible for oversight of the Funds. The Funds have engaged the Manager to manage the Funds on a day-to-day basis. The Board oversees the Manager and certain other principal
service providers in the operations of the Funds. The Board is currently composed of ten members, eight of whom are Independent Board Members. The Board meets in-person at regularly scheduled meetings four times
throughout the year. In addition, the Board Members may meet in-person or by telephone at special meetings or on an informal basis at other times. As described above, the Board has established three standing
committees—Audit, Nominating and Governance, and Investment—and may establish ad hoc committees or working groups from time to time, to assist the Board in fulfilling its oversight responsibilities. The
Independent Board Members have also engaged independent legal counsel to assist them in fulfilling their responsibilities.
The
Board is chaired by an Independent Board Member. As Chair, this Independent Board Member leads the Board in its activities. Also, the Chair acts as a member or as an ex-officio member of each standing committee and any
ad hoc committee of the Board. The Board Members have determined that the Board's leadership and committee structure is appropriate because the Board believes it sets the proper tone to the relationships between the
Funds, on the one hand, and the Manager, the subadviser(s) and certain other principal service providers, on the other, and facilitates the exercise of the Board's independent judgment in evaluating and managing the
relationships. In addition, the structure efficiently allocates responsibility among committees.
The Board has
concluded that, based on each Board Member's experience, qualifications, attributes or skills on an individual basis and in combination with those of the other Board Members, each Board Member should serve as a Board
Member. Among other attributes common to all Board Members are their ability to review critically, evaluate, question and discuss information provided to them, to interact effectively with the various service providers
to the Funds, and to exercise reasonable business judgment in the performance of their duties as Board Members. In addition, the Board has taken into account the actual service and commitment of the Board Members
during their tenure in concluding that each should continue to serve. A Board Member's ability to perform his or her duties effectively may have been attained through a Board Member's educational background or
professional training; business, consulting, public service or academic positions; experience from service as a Board Member of the Funds, other funds in the Fund Complex, public companies, or non-profit entities or
other organizations; or other experiences. Set forth below is a brief discussion of the specific experience, qualifications, attributes or skills of each Board Member that led the Board to conclude that he or she
should serve as a Board Member.
Ms. Smith and Messrs.
McCorkindale, Redeker, and Stoneburn have each served as a Board Member of mutual funds in the Fund Complex for more than 14 years, including as members and/or Chairs of various Board committees. In addition, Ms. Smith
and Mr. McCorkindale each has more than 35 years and Mr. Stoneburn has more than 30 years of experience as senior executive officers of operating companies and/or as directors of public companies. Mr. Redeker has 44
years of experience as a senior executive in the mutual fund industry. Ms. Bynoe has been a Board Member of the Funds and other funds in the Fund Complex since 2005, having served on the boards of other mutual fund
complexes since 1993. She has worked in the financial services industry over 11 years, has approximately 20 years experience as a management consultant and serves as a Director of financial services and other complex
global corporations. Mr. Munn joined the Board of the Funds and other funds in the Fund Complex in 2008. He previously served as a Board Member of funds managed by PI or its affiliates from 1991 until 2003. In
addition, he is the lead director and was the Chairman of an operating business for 14 years. Messrs. Bannon and Hyland joined the Board of the Funds and other funds in the Fund Complex in 2008. Each has held senior
executive positions in the financial services industry, including serving as senior executives of asset management firms, for over 17 years. Mr. Parker, who has served as an Interested Board Member and President of the
Funds and the other funds in the Fund Complex since 2012, is President, Chief Operating Officer and Officer-in-Charge of PI and several of its affiliates that provide services to the Funds and has held senior positions
in PI since 2005. Mr. Benjamin, an Interested Board Member of the Funds and other funds in the Fund Complex since 2010, has served as a Vice President of the Funds and other funds in the Fund Complex since 2009 and has
held senior positions in PI since 2003. Specific details about each Board Member's professional experience appear in the professional biography tables, above.
Risk Oversight. Investing in general and the operation of a mutual fund involve a variety of risks, such as investment risk, compliance risk, and operational risk, among others. The Board oversees risk as
part of its oversight of the Funds. Risk oversight is addressed as part of various regular Board and committee activities. The Board, directly or through its committees, reviews reports from among others, the Manager,
subadvisers, the Funds' Chief Compliance Officer, the Funds' independent registered public accounting firm, counsel, and internal auditors of the Manager or its affiliates, as appropriate, regarding risks faced by the
Funds and the risk management programs of the Manager and certain service providers. The actual day-to-day risk management with respect to the Funds resides with the Manager and other service providers to the Funds.
Although the risk management policies of the Manager and
Target
Asset Allocation Funds 36
the service providers are designed to be effective, those policies and their implementation vary among service providers and over time, and there is no guarantee that they will be effective. Not all risks
that may affect the Funds can be identified or processes and controls developed to eliminate or mitigate their occurrence or effects, and some risks are simply beyond any control of the Funds or the Manager, its
affiliates or other service providers.
Selection of Board
Member Nominees. The Nominating and Governance Committee is responsible for considering nominees for Board Members at such times as it considers electing new members to the Board. The Nominating and
Governance Committee may consider recommendations by business and personal contacts of current Board Members, and by executive search firms which the Committee may engage from time to time and will also consider
shareholder recommendations. The Nominating and Governance Committee has not established specific, minimum qualifications that it believes must be met by a nominee. In evaluating nominees, the Nominating and Governance
Committee considers, among other things, an individual's background, skills, and experience; whether the individual is an “interested person” as defined in the 1940 Act; and whether the individual would be
deemed an “audit committee financial expert” within the meaning of applicable SEC rules. The Nominating and Governance Committee also considers whether the individual's background, skills, and experience
will complement the background, skills, and experience of other nominees and will contribute to the diversity of the Board. There are no differences in the manner in which the Nominating and Governance Committee
evaluates nominees for the Board based on whether the nominee is recommended by a shareholder.
A shareholder who
wishes to recommend a board member for nomination should submit his or her recommendation in writing to the Chair of the Board (Richard Redeker) or the Chair of the Nominating and Governance Committee (Michael Hyland),
in either case in care of the specified Fund(s), at Gateway Center Three, 100 Mulberry Street, 4th Floor, Newark, New Jersey 07102-4077. At a minimum, the recommendation should include: the name, address and business,
educational and/or other pertinent background of the person being recommended; a statement concerning whether the person is an “interested person” as defined in the 1940 Act; any other information that the
Funds would be required to include in a proxy statement concerning the person if he or she was nominated; and the name and address of the person submitting the recommendation, together with the number of Fund shares
held by such person and the period for which the shares have been held. The recommendation also can include any additional information which the person submitting it believes would assist the Nominating and Governance
Committee in evaluating the recommendation.
Shareholders should
note that a person who owns securities issued by Prudential Financial, Inc. (the parent company of the Funds' Manager) would be deemed an “interested person” under the 1940 Act. In addition, certain other
relationships with Prudential Financial, Inc. or its subsidiaries, with registered broker-dealers, or with the Funds' outside legal counsel may cause a person to be deemed an “interested person.” Before the
Nominating and Governance Committee decides to nominate an individual to the Board, Committee members and other Board Members customarily interview the individual in person. In addition, the individual customarily is
asked to complete a detailed questionnaire which is designed to elicit information which must be disclosed under SEC and stock exchange rules and to determine whether the individual is subject to any statutory
disqualification from serving on the board of a registered investment company.
Share Ownership. Information relating to each Board Member's Fund share ownership and in all registered funds in the PI-advised funds that are overseen by the respective Board Member as of the most
recently completed calendar year is set forth in the chart below.
| Name | Dollar Range of Equity Securities in each Fund | Aggregate Dollar Range of Equity Securities in All Registered Investment Companies Overseen by Board Member in Fund Complex |
| Board Member Share Ownership: Independent Board Members | ||
| Kevin J. Bannon | None | Over $100,000 |
| Linda W. Bynoe | None | Over $100,000 |
| Michael S. Hyland | None | Over $100,000 |
| Douglas H. McCorkindale | Target Growth Allocation Fund ($10,001-$50,000) | Over $100,000 |
| Stephen P. Munn | None | Over $100,000 |
| Richard A. Redeker | None | Over $100,000 |
| Robin B. Smith | None | Over $100,000 |
| Stephen G. Stoneburn | None | Over $100,000 |
| Board Member Share Ownership: Interested Board Members | ||
| Stuart S. Parker | None | Over $100,000 |
37
| Name | Dollar Range of Equity Securities in each Fund | Aggregate Dollar Range of Equity Securities in All Registered Investment Companies Overseen by Board Member in Fund Complex |
| Board Member Share Ownership: Interested Board Members | ||
| Scott E. Benjamin | None | Over $100,000 |
None of the
Independent Board Members, or any member of his/her immediate family, owned beneficially or of record any securities in an investment adviser or principal underwriter of the Funds or a person (other than a registered
investment company) directly or indirectly controlling, controlled by, or under common control with an investment adviser or principal underwriter of the Funds as of the most recently completed calendar year.
Shareholder
Communications with Board Members. Shareholders can communicate directly with Board Members by writing to the Chair of the Board, c/o the Funds, Gateway Center Three, 100 Mulberry Street, 4th Floor, Newark, New Jersey
07102-4077. Shareholders can communicate directly with an individual Board Member by writing to that Board Member, c/o the Funds, Gateway Center Three, 100 Mulberry Street, Newark, New Jersey 07102-4077. Such
communications to the Board or individual Board Members are not screened before being delivered to the addressee.
MANAGEMENT &
ADVISORY ARRANGEMENTS
MANAGER. The Manager’s address is Gateway Center Three, 100 Mulberry Street, Newark, NJ 07102-4077. The Manager serves as manager to all of the other investment companies that, together with
the Funds, comprise the Prudential Investments mutual funds. See the Prospectus for more information about PI. As of July 31, 2012, the Manager served as the investment manager to all of the Prudential U.S. and
offshore open-end investment companies, and as administrator to closed-end investment companies, with aggregate assets of approximately $179 billion.
The Manager is a
wholly-owned subsidiary of PIFM Holdco LLC, which is a wholly-owned subsidiary of Prudential Asset Management Holding Company LLC, which is a wholly-owned subsidiary of Prudential Financial, Inc. (Prudential). PMFS, an
affiliate of PI, serves as the transfer agent and dividend distribution agent for the Prudential Investments mutual funds and, in addition, provides customer service, record keeping and management and administrative
services to qualified plans.
Pursuant to a management agreement with the Funds (the Management Agreement), PI, subject to the supervision of the Funds' Board and in conformity with the stated policies of the Funds, manages both the
investment operations of the Funds and the composition of the Funds' portfolios, including the purchase, retention, disposition and loan of securities and other assets. In connection therewith, the Manager is obligated
to keep certain books and records of the Funds. The Manager is authorized to enter into subadvisory agreements for investment advisory services in connection with the management of the Funds. The Manager will continue
to have responsibility for all investment advisory services performed pursuant to any such subadvisory agreements. PI will review the performance of the investment subadviser(s) and make recommendations to the Board
with respect to the retention of investment subadvisers and the renewal of contracts. The Manager also administers the Funds' corporate affairs and, in connection therewith, furnishes the Funds with office facilities,
together with those ordinary clerical and bookkeeping services which are not being furnished by the Funds' custodian (the Custodian) and PMFS. The management services of PI to the Funds are not exclusive under the
terms of the Management Agreement and PI is free to, and does, render management services to others.
PI may from time to
time waive all or a portion of its management fee and subsidize all or a portion of the operating expenses of the Funds. Fee waivers and subsidies will increase the Funds' total return. These voluntary waivers may be
terminated at any time without notice. To the extent that PI agrees to waive its fee or subsidize the Funds' expenses, it may enter into a relationship agreement with the Subadviser to share the economic impact of the
fee waiver or expense subsidy.
In connection with
its management of the corporate affairs of the Funds, PI bears the following expenses:
| ■ | the salaries and expenses of all of its and the Funds' personnel except the fees and expenses of Independent Board Members; |
| ■ | all expenses incurred by the Manager or the Funds in connection with managing the ordinary course of a Fund’s business, other than those assumed by the Funds as described below; and |
| ■ | the fees, costs and expenses payable to any investment subadviser pursuant to a subadvisory agreement between PI and such investment subadviser. |
Under the terms of
the Management Agreement, the Funds are responsible for the payment of the following expenses:
| ■ | the fees and expenses incurred by the Funds in connection with the management of the investment and reinvestment of the Funds' assets payable to the Manager; |
Target
Asset Allocation Funds 38
| ■ | the fees and expenses of Independent Board Members; |
| ■ | the fees and certain expenses of the Custodian and transfer and dividend disbursing agent, including the cost of providing records to the Manager in connection with its obligation of maintaining required records of the Funds and of pricing the Funds' shares; |
| ■ | the charges and expenses of the Funds' legal counsel and independent auditors and of legal counsel to the Independent Board Members; |
| ■ | brokerage commissions and any issue or transfer taxes chargeable to the Funds in connection with its securities (and futures, if applicable) transactions; |
| ■ | all taxes and corporate fees payable by the Funds to governmental agencies; |
| ■ | the fees of any trade associations of which the Funds may be a member; |
| ■ | the cost of share certificates representing, and/or non-negotiable share deposit receipts evidencing, shares of the Funds; |
| ■ | the cost of fidelity, directors and officers and errors and omissions insurance; |
| ■ | the fees and expenses involved in registering and maintaining registration of the Funds and of its shares with the SEC and paying notice filing fees under state securities laws, including the preparation and printing of the Funds' registration statements and prospectuses for such purposes; allocable communications expenses with respect to investor services and all expenses of shareholders' and Board meetings and of preparing, printing and mailing reports and notices to shareholders; and |
| ■ | litigation and indemnification expenses and other extraordinary expenses not incurred in the ordinary course of the Funds' business and distribution and service (12b-1) fees. |
The Management
Agreement provides that PI will not be liable for any error of judgment by PI or for any loss suffered by the Funds in connection with the matters to which the Management Agreement relates, except a loss resulting from
a breach of fiduciary duty with respect to the receipt of compensation for services (in which case any award of damages shall be limited to the period and the amount set forth in Section 36(b)(3) of the 1940 Act) or
loss resulting from willful misfeasance, bad faith or gross negligence or reckless disregard of duties. The Management Agreement provides that it will terminate automatically if assigned (as defined in the 1940 Act),
and that it may be terminated without penalty by either PI or the Funds by the Board or vote of a majority of the outstanding voting securities of the Funds (as defined in the 1940 Act) upon not more than 60 days', nor
less than 30 days', written notice. The Management Agreement will continue in effect for a period of more than two years from the date of execution only so long as such continuance is specifically approved at least
annually in accordance with the requirements of the 1940 Act.
Fees payable under
the Management Agreement are computed daily and paid monthly. The applicable fee rate and the management fees received by PI from the Funds for the indicated fiscal years are set forth below.
The management fee
rate for each Fund is:
0.75% up to $500
million; 0.70% on next $500 million; 0.65% over $1 billion
| Management Fees Paid by the Funds | |||
| Fund Name | 2012 | 2011 | 2010 |
| Conservative Allocation Fund | $880,913 | $954,172 | $947,071 |
| Moderate Allocation Fund | $2,062,669 | $2,269,065 | $2,233,243 |
| Growth Allocation Fund | $1,239,111 | $1,422,474 | $1,413,204 |
SUBADVISORY ARRANGEMENTS. The Manager has entered into subadvisory agreements (Subadvisory Agreements) with the Funds' investment subadvisers. The Subadvisory Agreements provide that the Subadvisers will furnish
investment advisory services in connection with the management of each Fund. In connection therewith, the Subadvisers are obligated to keep certain books and records of the Funds. Under the Subadvisory Agreements, the
Subadvisers, subject to the supervision of PI, are responsible for managing the assets of the Funds in accordance with the Funds' investment objectives, investment program and policies. The Subadvisers determine what
securities and other instruments are purchased and sold for the Funds and are responsible for obtaining and evaluating financial data relevant to the Funds. PI continues to have responsibility for all investment
advisory services pursuant to the Management Agreement and supervises each Subadviser's performance of such services.
As discussed in the
Prospectus, PI employs the Subadvisers under a “manager of managers” structure that allows PI to replace a Subadviser or amend a Subadvisory Agreement without seeking shareholder approval. The Subadvisory
Agreements provide that they will terminate in the event of their assignment (as defined in the 1940 Act) or upon the termination of the Management Agreement. The Subadvisory Agreements may be terminated by the Funds,
PI, or the Subadviser upon not more than 60 days nor less than 30 days written notice. The Subadvisory Agreements provide that they will continue in effect for a period of not more than two years from its execution
only so long as such continuance is specifically approved at least annually in accordance with the requirements of the 1940 Act.
39
The
applicable fee rate and the subadvisory fees paid by PI for the indicated fiscal years are set forth below. Subadvisory fees are based on the average daily net assets of the Funds, calculated and paid on a monthly
basis, at the fee rate as set forth in the Subadvisory Agreements. Subadvisory fees are deducted out of the management fees paid by the Funds.
| Subadvisers, Subadvisory Fee Rates and Subadvisory Fees Paid | |||||
| Fund Name | Subadviser | Fee Rate | 2012 | 2011 | 2010 |
| Conservative Allocation Fund | Eagle Asset Management, Inc. | 0.50% on assets up to and including $50 million; 0.45% on assets over $50 million | $6,537 | $9,504 | $9,599 |
| EARNEST Partners, LLC | 0.40% | $1,248 | $2,221 | $2,863 | |
| Eaton Vance Management (terminated July 2012) | 0.25% on first $250 million; 0.24% on next $250 million; 0.23% on next $500 million; 0.22% over $1 billion | $17,969 | $25,268 | $24,273 | |
| Epoch Investment Partners, Inc. (started July 2012) | 0.275% to $1 billion; 0.20% over $1 billion | $585 | None | None | |
| Pacific Investment Management Company LLC | 0.25% to $1 billion; 0.225% over $1 billion | $157,347 | $166,244 | $167,933 | |
| Hotchkis and Wiley Capital Management, LLC | 0.30% | $16,814 | $17,106 | $16,184 | |
| Marsico Capital Management, LLC | 0.40% to $1.5 billion; 0.35% over $1.5 billion | $51,105 | $50,924 | $50,203 | |
| Massachusetts Financial Services Company* | 0.375% on assets up to and including $250 million; 0.325% on next $250 milliion; 0.300% on next $250 million; 0.275% on next $250 million; 0.25% on next $500 million; 0.225% over $1.5 billion | $27,783 | $34,597 | $32,278 | |
| Vaughan Nelson Investment Management, L.P. | 0.40% on first $250 million; 0.35% over $250 million | $7,513 | $8,896 | $8,329 | |
| NFJ Investment Group LLC | 0.40% on first $50 million; 0.38% on next $50 million; 0.34% on next $50 million; 0.30% on next $200 million; 0.28% over $350 million | $22,698 | $19,562 | $21,278 | |
| Moderate Allocation Fund | Eagle Asset Management, Inc. | 0.50% to $50 million; 0.45% over $50 million | $25,902 | $31,750 | $29,938 |
| EARNEST Partners, LLC | 0.40% | $10,263 | $12,723 | $11,923 | |
| Eaton Vance Management (terminated July 2012) | 0.25% on first $250 million; 0.24% on next $250 million; 0.23% on next $500 million; 0.22% over $1 billion | $55,104 | $79,640 | $77,311 | |
| Epoch Investment Partners, Inc. (started July 2012) | 0.275% to $1 billion; 0.20% over $1 billion | $1,817 | None | None | |
| Pacific Investment Management Company LLC | 0.25% to $1 billion; 0.225% over $1 billion | $213,387 | $221,952 | $221,545 | |
| Hotchkis and Wiley Capital Management, LLC | 0.30% | $51,765 | $53,799 | $51,235 | |
| Marsico Capital Management, LLC | 0.40% to $1.5 billion; 0.35% over $1.5 billion | $156,907 | $157,529 | $155,828 | |
| Massachusetts Financial Services Company* | 0.375% on first $250 million; 0.325% on next $250 milliion; 0.300% on next $250 million; 0.275% on next $250 million; 0.25% on next $500 million; 0.225% over $1.5 billion | $85,159 | $106,771 | $99,978 | |
| Vaughan Nelson Investment Management, L.P. | 0.40% to $250 million; 0.35% over $250 million | $10,250 | $12,734 | $13,254 | |
Target
Asset Allocation Funds 40
| Subadvisers, Subadvisory Fee Rates and Subadvisory Fees Paid | |||||
| Fund Name | Subadviser | Fee Rate | 2012 | 2011 | 2010 |
| LSV Asset Management | 0.45% on first $150 million; 0.425% on next $150 million; 0.40% on next $150 million; 0.375% on next $300 million; 0.35% over $750 million | $69,961 | $79,944 | $79,484 | |
| Thornburg Investment Management, Inc. | 0.35% to $100 million; 0.30% over $100 million | $46,778 | $53,717 | $55,247 | |
| NFJ Investment Group LLC | 0.40% on first $50 million; 0.38% on next $50 million; 0.34% on next $50 million; 0.30% on next $200 million; 0.28% over $350 million | $69,867 | $61,786 | $67,482 | |
| Growth Allocation Fund | Eagle Asset Management, Inc. | 0.50% on assets up to and including $50 million; 0.45% on assets over $50 million | $25,545 | $29,981 | $28,666 |
| EARNEST Partners, LLC | 0.40% | $10,442 | $12,126 | $12,043 | |
| Eaton Vance Management (terminated July 2012) | 0.25% on assets up to and including $250 million; 0.24% on next $250 million; 0.23% on next $500 million; 0.22% over $1 billion | $52,547 | $79,840 | $73,661 | |
| Epoch Investment Partners, Inc. (started July 2012) | 0.275% to $1 billion; 0.20% over $1 billion | $1,729 | None | None | |
| Hotckis and Wiley Capital Management, LLC | 0.30% | $49,156 | $54,005 | $48,743 | |
| Marsico Capital Management, LLC | 0.40% to $1.5 billion: 0.35% over $1.5 billion | $140,929 | $146,437 | $147,893 | |
| Massachusetts Financial Services Company* | 0.375% on assets up to and including $250 million; 0.325% on next $250 milliion; 0.300% on next $250 million; 0.275% on next $250 million; 0.25% on next $500 million; 0.225% over $1.5 billion | $76,554 | $98,968 | $95,222 | |
| Vaughan Nelson Management Group, L.P. | 0.40% on first $250 million; 0.35% over $250 million | $10,427 | $12,129 | $12,202 | |
| LSV Asset Management | 0.45% on first $150 million; 0.425% on next $150 million; 0.40% on next $150 million; 0.375% on next $300 million; 0.35% on amounts exceeding $750 million | $60,269 | $63,974 | $73,177 | |
| Thornburg Investment Management, Inc. | 0.35% to $100 milliion; 0.30% over $100 million | $40,260 | $42,920 | $50,965 | |
| NFJ Investment Group LLC | 0.40% on first $50 million; 0.38% on next $50 million; 0.34% on next $50 million; 0.30% on next $200 million; 0.28% over $350 million | $66,396 | $61,649 | $64,531 | |
Notes to Subadvisory
Fee Table
For purposes of the fee calculation, assets managed by the same subadviser in the same “sleeve” or segment in each of the Funds will be aggregated. In addition, the asset aggregation
arrangements set forth below are applicable as noted:
Eagle
Asset Management, Inc. For purposes of the fee calculation, the assets managed by Eagle are aggregated with the funds managed or co-managed by PI for which Eagle serves as subadviser that are managed pursuant to
substantially the same investment strategy.
Eaton Vance Management: For purposes of the fee calculation, the combined average daily assets of the following will be aggregated: all portfolios sub-advised by Eaton Vance that are managed by Prudential
Investments LLC, or by Prudential Investments and AST Investment Services, Inc., that have substantially the same investment strategy (i.e., domestic large cap value).
Epoch Investment Partners, Inc.: For purposes of the fee calculation, the average daily net assets in all portfolios subadvised by Epoch that are managed by PI that have substantially the same investment strategy (i.e.,
domestic large cap value) will be combined (i.e., Conservative Allocation Fund, Moderate Allocation Fund and Growth Allocation Fund; and Target Portfolio Trust-Large Capitalization Value Portfolio).
Marsico Capital
Management, LLC: For purposes of the fee calculation, the assets managed by Marsico in the following funds will be aggregated: the AST Marsico Capital Growth Portfolio of the Advanced Series Trust and,
(ii) the portion of Target Conservative Allocation Fund of Target Asset Allocation Funds that is sub-advised by Marsico, (iii) the portion of Target Moderate Allocation Fund of Target Asset Allocation Funds that is
sub-advised by Marsico, (iv) the portion of Target Growth Allocation Fund of Target Asset Allocation Funds that is sub-advised by Marsico, (v) the portion of the Large Capitalization Growth Portfolio of The Target
Portfolio Trust that is sub-advised by Marsico, (vi) the portion of the Global Portfolio of The Prudential
41
Series Fund
that is sub-advised by Marsico, (vii) the portion of the AST Advanced Strategies Portfolio of the Advanced Series Trust that is sub-advised by Marsico and (viii) other future large cap growth accounts under which
Marsico provides substantially similar advisory or sub-advisory services and which Marsico, Prudential Investments LLC, and AST Investment Services, Inc., as applicable, mutually agree in writing.
Massachusetts
Financial Services Company: For purposes of the fee calculation, the combined average daily assets of the following will be aggregated: assets in all portfolios sub-advised by MFS that are managed by Prudential
Investments LLC, or by Prudential Investments and AST Investment Services, Inc., that have substantially the same investment strategy (i.e., domestic large capitalization growth).
NFJ Investment Group LLC: For purposes of the fee calculation, the assets managed by NFJ Investment Group in the large cap value sleeves of each of the Target Asset Allocation Funds will be aggregated with the
assets managed by NFJ Investment Group in The Target Portfolio Trust—Large Capitalization Value Portfolio and The Target Portfolio Trust—Small Capitalization Value Portfolio.
Thornburg
Investment Management, Inc.: For purposes of the fee calculation the assets managed by Thornburg in the Target Asset Allocation Funds will be aggregated with the assets managed by Thornburg in Prudential World Fund,
Inc.—Prudential International Value Fund, The Target Portfolio Trust—International Equity Portfolio, Advanced Series Trust—AST International Value Portfolio, and The Prudential Series Fund—SP
International Value Portfolio.
Vaughan Nelson
Investment Management, L.P.: For purposes of the fee calculation, the assets managed by Vaughan Nelson in the Target Conservative Allocation Fund of Target Asset Allocation Funds will be aggregated with the assets
managed by Vaughan Nelson in: (i) Small Capitalization Value Portfolio of The Target Portfolio Trust; (ii) the Target Moderate Allocation Fund of Target Asset Allocation Funds; (iii) the Target Growth Allocation Fund
of Target Asset Allocation Funds; and (iv) and any other portfolio subadvised by Vaughan Nelson on behalf of PI or one of its affiliates pursuant to substantially the same investment strategy. For purposes of
calculating the subadvisory fee payable to Vaughan Nelson, the assets managed by Vaughan Nelson in the Target Moderate Allocation Fund of Target Asset Allocation Funds will be aggregated with the assets managed by
Vaughan Nelson in: (i) the Small Capitalization Value Portfolio of The Target Portfolio Trust; (ii) the Target Conservative Allocation Fund of Target Asset Allocation Funds; (iii) the Target Growth Allocation Fund of
Target Asset Allocation Funds; and (iv) any other portfolio subadvised by Vaughan Nelson on behalf of PI or one of its affiliates pursuant to substantially the same investment strategy. For purposes of calculating the
subadvisory fee payable to Vaughan Nelson, the assets managed by Vaughan Nelson in the Target Growth Allocation Fund of Target Asset Allocation Funds will be aggregated with the assets managed by Vaughan Nelson in: (i)
the Small Capitalization Value Portfolio of The Target Portfolio Trust; (ii) the Target Conservative Allocation Fund of Target Asset Allocation Funds; (iii) the Target Moderate Allocation Fund of Target Asset
Allocation Funds; and (iv) and any other portfolio subadvised by Vaughan Nelson on behalf of PI or one of its affiliates pursuant to substantially the same investment strategy.
LSV Asset
Management. For purposes of the fee calculation, the assets managed by LSV in the Target Moderate Allocation Fund of Target Asset Allocation Funds will be aggregated with the assets managed by LSV in:
(i) the AST International Value Portfolio of Advanced Series Trust; (ii) the AST Advanced Strategies Portfolio of Advanced Series Trust; (iii) the SP International Value Portfolio of The Prudential Series Fund; (iv)
the Global Portfolio of The Prudential Series Fund; (v) the International Equity Portfolio of The Target Portfolio Trust; (vi) the Target Growth Allocation Fund of Target Asset Allocation Funds; (vii) the Prudential
International Value Fund of Prudential World Fund, Inc.; and (viii) any other portfolio subadvised by LSV on behalf of PI or one of its affiliates pursuant to substantially the same investment strategy.
For purposes
of the fee calculation, the assets managed by LSV in the Target Growth Allocation Fund of Target Asset Allocation Funds will be aggregated with the assets managed by LSV in: (i) the AST International Value Portfolio of
Advanced Series Trust; (ii) the AST Advanced Strategies Portfolio of Advanced Series Trust; (iii) the SP International Value Portfolio of The Prudential Series Fund; (iv) the Global Portfolio of The Prudential Series
Fund; (v) the International Equity Portfolio of The Target Portfolio Trust; (vi) the Target Moderate Allocation Fund of Target Asset Allocation Funds; (vii) the Prudential International Value Fund of the Prudential
World Fund, Inc.; and (viii) any other portfolio subadvised by LSV on behalf of PI or one of its affiliates pursuant to substantially the same investment strategy.
Pacific
Investment Management Company LLC (PIMCO). For purposes of the fee calculation, if on any day the aggregate assets of all funds/portfolios subadvised by PIMCO on behalf of PI and/or AST Investment Services, Inc. pursuant to a
“total return” strategy or mandate (as mutually agreed upon by PIMCO and PI/AST Investment Services, Inc.) total at least $3 billion, the contractual annual subadvisory fee, calculated daily, shall be:
0.250% on aggregate assets up to $1 billion; and 0.225% on aggregate assets over $1 billion. If, however, such aggregate assets on any day total less than $3 billion, then the subadvisory fee calculation for that day
shall be at the rate of 0.25% of the assets ofeach such fund/portfolio.
*Arrangements in Effect Prior to October 1, 2011:
Massachusetts Financial Services Company (MFS). Prior to October 1, 2011, the subadvisory fee rate applicable to MFS was as follows:
.375% on first $250 million;
..325% on next $250 milliion;
..300% on next $250 million;
..275% over $750 million
..325% on next $250 milliion;
..300% on next $250 million;
..275% over $750 million
ADDITIONAL INFORMATION ABOUT PORTFOLIO MANAGER—OTHER ACCOUNTS AND OWNERSHIP OF FUND SECURITIES. Set forth below is information about other accounts managed by each portfolio manager and ownership of Fund securities. The information shows, for each portfolio manager, the number of
accounts managed and the total assets in such accounts, within each of the indicated categories. For each category, the number of accounts and total assets in the accounts whose fees are based on performance is
indicated in italics typeface. The “Ownership of Fund Securities” column shows the dollar range of equity securities of the Fund beneficially owned by the portfolio manager.
Information shown
below is as of the most recently completed fiscal year, unless noted otherwise.
| Conservative Allocation Fund | |||||
| Subadvisers | Portfolio Managers | Registered Investment Companies/Total Assets | Other Pooled Investment Vehicles/ Total Assets | Other Accounts/ Total Assets | Ownership of Fund Securities |
| Eagle Asset Management, Inc. | Bert L. Boksen | 14/$4,809,371,113 | 2/$104,271,459 | 5,147/$2,972,943,634 | None |
| Eric Mintz | 14/$4,809,371,113 | None | 5,147/$2,972,943,634 | None | |
| EARNEST Partners, LLC | Paul E. Viera, Jr. | 17/$2,756.8 million | 23/$1,159.3 million | 205/$10,685.9 million 7/$585.8 million | None |
| Epoch Investment Partners, Inc. | David N. Pearl | 11/$2,818 million | 21/$2,354 million 1/$108 million | 110/$7,743 million 16/$1,822 million | None |
| Janet K Navon | 7/$888 million | 7/$620 million | 9/$349 million | None | |
Target
Asset Allocation Funds 42
| Conservative Allocation Fund | |||||
| Subadvisers | Portfolio Managers | Registered Investment Companies/Total Assets | Other Pooled Investment Vehicles/ Total Assets | Other Accounts/ Total Assets | Ownership of Fund Securities |
| Michael A. Welhoelter, CFA | 18/$6,788 million | 37/$4,237 million 1/$108 million | 168/$12,666 million 19/$2,740 million | None | |
| Pacific Investment Management Company LLC | Chris Dialynas | 16/$22,927.13 million | 18/$15,310.03 million | 97/$37,443.69 million 8/$5,081.9 million | None |
| Hotchkis and Wiley Capital Management, LLC | Sheldon Lieberman | 13/$8.5 billion 1/$2.2 billion | 3/$378 million | 58/$7.2 billion 3/$254 million | None |
| George Davis | 13/$8.5 billion 1/$2.2 billion | 3/$378 million | 58/$7.2 billion 3/$254 million | None | |
| Scott McBride | 13/$8.5 billion 1/$2.2 billion | 3/$378 million | 58/$7.2 billion 3/$254 million | None | |
| Patricia McKenna | 13/$8.5 billion 1/$2.2 billion | 3/$378 million | 58/$7.2 billion 3/$254 million | None | |
| Judd Peters | 13/$8.5 billion 1/$2.2 billion | 3/$378 million | 58/$7.2 billion 3/$254 million | None | |
| Marsico Capital Management, LLC | Thomas F. Marsico | 28/$14,951 million | 11/$1,732 million | 91/$7,967 million* | None |
| Coralie Witter, CFA | 22/$14,751 million | 10/$1,672 million | 81/$7,903 million* | None | |
| Massachusetts Financial Services Company | Eric B. Fischman | 10/$8.2 billion | 1/$14.1 million | 4/$286.8 million | None |
| Vaughan Nelson Investment Management, L.P. | Chris D. Wallis, CFA | 9/$1,245,572,016 | 6/$161,336,752 | 248/$3,924,088,687 | None |
| Scott Weber | 9/$1,245,572,016 | 6/$161,336,752 | 248/$3,924,088,687 | None | |
| NFJ Investment Group LLC | Paul Magnuson | 21/$24,323,888,313 | 5/$161,242,208 | 48/$9,873,773,431 | None |
| Thomas Oliver, CFA and CPA | 18/$15,909,626,299 | 2/$86,516,736 | 46/$9,631,602,498 | None | |
| Ben Fischer, CFA | 24/$24,441,969,112 | 5/$161,242,208 | 53/$10,374,079,510 | None | |
| R. Burns McKinney CFA | 16/$15,835,319,511 | 2/$86,516,736 | 43/$9,335,804,055 | None | |
| Jeff Reed, CFA | 12/$12,632,870,010 | 1/$3,561,476 | 34/$6,541,841,088 | None | |
| Moderate Allocation Fund | |||||
| Subadvisers | Portfolio Managers | Registered Investment Companies/Total Assets | Other Pooled Investment Vehicles/Total Assets | Other Accounts/Total Assets | Ownership of Fund Securities |
| Eagle Asset Management, Inc. | Bert L. Boksen | 14/$4,809,371,113 | 2/$104,271,459 | 5,147/$2,972,943,634 | None |
| Eric Mintz | 14/$4,809,371,113 | None | 5,147/$2,972,943,634 | None | |
| EARNEST Partners, LLC | Paul E. Viera, Jr. | 17/$2,756.8 million | 23/$1,159.3 million | 205/$10,685.9 million 7/$585.8 million | None |
| Epoch Investment Partners, Inc. | David N. Pearl | 11/$2,807 million | 21/$2,354 million 1/$108 million | 110/$7,743 million 16/$1,822 million | None |
| Janet K. Navon | 7/$877 million | 7/$620 million | 9/$349 million | None | |
| Michael A. Welhoelter, CFA | 18/$6,777 million | 37/$4,237 million 1/$108 million | 168/$12,666 million 19/$2,740 million | None | |
| Pacific Investment Management Company LLC | Chris Dialynas | 16/$22,927.13 million | 18/$15,310.03 million | 97/$37,443.69 million 8/$5,081.9 million | None |
| Hotchkis and Wiley Capital Management, LLC | Sheldon Lieberman | 13/$8.5 billion 1/$2.2 billion | 3/$378 million | 58/$7.2 billion 3/$254 million | None |
| George Davis | 13/$8.5 billion 1/$2.2 billion | 3/$378 million | 58/$7.2 billion 3/$254 million | None | |
| Scott McBride | 13/$8.5 billion 1/$2.2 billion | 3/$378 million | 58/$7.2 billion 3/$254 million | None | |
| Patricia McKenna | 13/$8.5 billion 1/$2.2 billion | 3/$378 million | 58/$7.2 billion 3/$254 million | None | |
43
| Moderate Allocation Fund | |||||
| Subadvisers | Portfolio Managers | Registered Investment Companies/Total Assets | Other Pooled Investment Vehicles/Total Assets | Other Accounts/Total Assets | Ownership of Fund Securities |
| Judd Peters | 13/$8.5 billion 1/$2.2 billion | 3/$378 million | 58/$7.2 billion 3/$254 million | None | |
| Marsico Capital Management, LLC | Thomas F. Marsico | 28/$14,923 million | 11/$1,732 million | 91/$7,967 million* | None |
| Coralie Witter, CFA | 22/$14,687 million | 10/$1,672 million | 81/$7,903 million* | None | |
| Massachusetts Financial Services Company | Eric B. Fischman | 10/$8.2 billion | 1/$14.1 million | 4/$286.8 million | None |
| Vaughan Nelson Investment Management, L.P. | Chris D. Wallis, CFA | 9/$1,245,264,946 | 6/$161,336,752 | 248/$3,924,088,687 | None |
| Scott Weber | 9/$1,245,264,946 | 6/$161,336,752 | 248/$3,924,088,687 | None | |
| NFJ Investment Group LLC | Paul Magnuson | 21/$24,307,085,396 | 5/$161,242,208 | 48/$9,873,773,431 | None |
| Thomas Oliver, CFA and CPA | 18/$15,892,823,382 | 2/$86,516,736 | 46/$9,631,602,498 | None | |
| Ben Fischer, CFA | 24/$24,425,166,195 | 5/$161,242,208 | 53/$10,374,079,510 | None | |
| R. Burns McKinney CFA | 16/$15,818,516,594 | 2/$86,516,736 | 43/$9,335,804,055 | None | |
| Jeff Reed, CFA | 12/$12,616,067,093 | 1/$3,561,476 | 34/$6,541,841,088 | None | |
| LSV Asset Management | Josef Lakonishok | 28/$7,806,721,066 | 47/$9,510,916,627 6/$352,675,745 | 415/$42,087,634,674 30/$6,519,789,947 | None |
| Menno Vermuelen, CFA | 28/$7,806,721,066 | 47/$9,510,916,627 6/$352,675,745 | 415/$42,087,634,674 30/$6,519,789,947 | None | |
| Puneet Mansharamani, CFA | 28/$7,806,721,066 | 47/$9,510,916,627 6/$352,675,745 | 415/$42,087,634,674 30/$6,519,789,947 | None | |
| Thornburg Investment Management, Inc. | William V. Fries, CFA | 17/$30.8 billion | 8/$3.4 billion | 43/$8.7 billion 1/$84 million | None |
| Wendy Trevisani | 17/$30.8 billion | 13/$3.4 billion | 10,244/$13.7 billion 1/$84 million | None | |
| Lei Wang, CFA | 17/$30.8 billion | 8/$3.4 billion | 43/$8.7 billion 1/$84 million | None | |
| Growth Allocation Fund | |||||
| Subadvisers | Portfolio Managers | Registered Investment Companies/Total Assets | Other Pooled Investment Vehicles/Total Assets | Other Accounts/Total Assets | Ownership of Fund Securities |
| Eagle Asset Management, Inc. | Bert L. Boksen | 14/$4,809,371,113 | 2/$104,271,459 | 5,147/$2,972,943,634 | None |
| Eric Mintz | 14/$4,809,371,113 | None | 5,147/$2,972,943,634 | None | |
| EARNEST Partners, LLC | Paul E. Viera, Jr. | 17/$2,756.8 million | 23/$1,159.3 million | 205/$10,685.9 million 7/$585.8 million | None |
| Epoch Investment Partners, Inc. | David N. Pearl | 11/$2,806 million | 21/$2,354 million 1/$108 million | 110/$7,743 million 16/$1,822 million | None |
| Janet K. Navon | 7/$876 million | 7/$620 million | 9/$349 million | None | |
| Michael A. Welhoelter, CFA | 18/$6,776 million | 37/$4,237 million 1/$108 million | 168/$12,666 million 19/$2,740 million | None | |
| Hotchkis and Wiley Capital Management, LLC | Sheldon Lieberman | 13/$8.5 billion 1/$2.2 billion | 3/$378 million | 58/$7.2 billion 3/$254 million | None |
| George Davis | 13/$8.5 billion 1/$2.2 billion | 3/$378 million | 58/$7.2 billion 3/$254 million | None | |
| Scott McBride | 13/$8.5 billion 1/$2.2 billion | 3/$378 million | 58/$7.2 billion 3/$254 million | None | |
| Patricia McKenna | 13/$8.5 billion 1/$2.2 billion | 3/$378 million | 58/$7.2 billion 3/$254 million | None | |
| Judd Peters | 13/$8.5 billion 1/$2.2 billion | 3/$378 million | 58/$7.2 billion 3/$254 million | None | |
Target
Asset Allocation Funds 44
| Growth Allocation Fund | |||||
| Subadvisers | Portfolio Managers | Registered Investment Companies/Total Assets | Other Pooled Investment Vehicles/Total Assets | Other Accounts/Total Assets | Ownership of Fund Securities |
| Marsico Capital Management, LLC | Thomas F. Marsico | 28/$14,928 million | 11/$1,732 million | 91/$7,967 million* | None |
| Coralie Witter, CFA | 22/$14,692 million | 10/$1,672 million | 81/$7,903 million* | None | |
| Massachusetts Financial Services Company | Eric B. Fischman | 10/$8.2 billion | 1/$14.1 million | 4/$286.8 million | None |
| Vaughan Nelson Investment Management, L.P. | Chris D. Wallis, CFA | 9/$1,245,017,012 | 6/$161,336,752 | 248/$3,924,088,687 | None |
| Scott Weber | 9/$1,245,017,012 | 6/$161,336,752 | 248/$3,924,088,687 | None | |
| NFJ Investment Group LLC | Paul Magnuson | 21/$24,308,075,256 | 5/$161,242,208 | 48/$9,873,773,431 | None |
| Thomas Oliver, CFA and CPA | 18/$15,893,813,241 | 2/$86,516,736 | 46/$9,631,602,498 | None | |
| Ben Fischer, CFA | 24/$24,426,156,055 | 5/$161,242,208 | 53/$10,374,079,510 | None | |
| R. Burns McKinney CFA | 16/$15,819,506,454 | 2/$86,516,736 | 43/$9,335,804,055 | None | |
| Jeff Reed, CFA | 12/$12,617,056,953 | 1/$3,561,476 | 34/$6,541,841,088 | None | |
| LSV Asset Management | Josef Lakonishok | 28/$7,807,989,412 | 47/$9,510,916,627 6/$352,675,745 | 415/$42,087,634,674 30/$6,519,789,947 | None |
| Menno Vermuelen, CFA | 28/$7,807,989,412 | 47/$9,510,916,627 6/$352,675,745 | 415/$42,087,634,674 30/$6,519,789,947 | None | |
| Puneet Mansharamani | 28/$7,807,989,412 | 47/$9,510,916,627 6/$352,675,745 | 415/$42,087,634,674 30/$6,519,789,947 | None | |
| Thornburg Investment Management, Inc. | William V. Fries, CFA | 17/$30.8 billion | 8/$3.4 billion | 43/$8.7 billion 1/$84 million | None |
| Wendy Trevisani | 17/$30.8 billion | 13/$3.4 billion | 10,244/$13.7 billion 1/$84 million | None | |
| Lei Wang, CFA | 17/$30.8 billion | 8/$3.4 billion | 43/$8.7 billion 1/$84 million | None | |
*For Marsico, 1 of
the ‘other accounts’ is a wrap fee platform which includes approximately 3,321 underlying clients for total assets (in millions) of approximately $962 and 4 of the ‘other accounts’ represent
model portfolios for total assets (in millions) of approximately $1,875.
ADDITIONAL INFORMATION
ABOUT THE PORTFOLIO MANAGERS—COMPENSATION AND CONFLICTS OF INTEREST. Set forth below, for each portfolio manager, is an explanation of the structure of, and methods used to determine, portfolio manager compensation. Also set forth below, for each portfolio
manager, is an explanation of any material conflicts of interest that may arise between a portfolio manager's management of the Fund's investments and investments in other accounts.
Eagle
Asset Management, Inc. (Eagle)
COMPENSATION. Mr. Boksen and Mr. Mintz are paid a base salary that is competitive with other portfolio managers in the industry, based on industry surveys; Mr. Boksen and Mr. Mintz, along with other
portfolio managers, participate in a revenue-sharing program that provides incentives to build a successful investment program over the long term; additional deferred compensation plans are provided to key investment
professionals; Mr. Boksen and Mr. Mintz along with all employees receive benefits from Eagle’s parent company including a 401(k) plan, profit sharing, and Employee Stock Purchase Plan. There is no difference
between the method used to determine Mr. Boksen’s and Mr. Mintz’s compensation with respect to the Funds and other funds managed by Mr. Boksen and Mr. Mintz. Mr. Boksen’s additional compensation
includes receipt of 50% of the net profits generated by the General Partner EB Management I. Mr. Boksen and Mr. Mintz also receive stock option awards as part of their annual bonus. These stock option awards vest over
a three-year period. Mr. Boksen’s and Mr. Mintz’s compensation is based upon all accounts managed and performance is evaluated annually. Performance is evaluated on the entire composite of accounts and is
pre-tax and account weighted. Mr. Boksen’s and Mr. Mintz’s benchmarks for evaluation purposes include LipperFund Index for Mutual Fund performance and the Russell 2000 index for separate accounts along with
peer group rankings such as Callan Associates and Mercer Investment Consulting.
CONFLICTS OF INTEREST. Eagle currently holds a 51% ownership interest in EB Management I, LLC which acts as the general partner to a limited partnership formed for investment purposes. Bert Boksen is a 49% owner
of EB Management and the Portfolio Manager for the Eagle Aggressive Growth Partners Fund I L.P. and Eagle Aggressive Growth Partners Fund II L.P. Eagle also provides administrative and investment research services for
the general partner. Certain officers and employees of Eagle have investment
45
interests in the limited partnership. On occasion, orders for the securities transactions of the limited partnership may be aggregated with orders for Eagle’s client accounts. In such instances,
Eagle will ensure that the allocation of securities among Eagle’s clients and the partnership is equitable; price averaging may be used for trades executed in a series of transactions on the same day. Eagle does
not invest assets of clients’ accounts in such limited partnership. Officers and employees of Raymond James Financial, Inc. and its subsidiaries may have investment interest in such investment partnership.
Eagle’s portfolio managers manage other accounts with investment strategies similar to the Funds. Certain conflicts of interest may arise in connection with the management of multiple portfolios. As noted above,
fees vary among these accounts and the portfolio manager may personally invest in some of these accounts. This could create potential conflicts of interest where a portfolio manager may favor certain accounts over
others, resulting in other accounts outperforming the Funds. Other potential conflicts include conflicts in the allocation of investment opportunities and aggregated trading. However, Eagle has developed and
implemented policies and procedures designed to ensure that all clients are treated equitably. In addition, compliance oversight and monitoring ensures adherence to policies designed to avoid conflicts. Also, as
indicated in Eagle’s Code of Ethics there are certain procedures in place to avoid conflicts of interest when the portfolio manager(s) and other investment personnel of Eagle buy or sell securities also owned by,
or bought or sold for clients.
EARNEST Partners, LLC (EARNEST Partners)
COMPENSATION. EARNEST Partners: All EARNEST Partners personnel are paid a salary and a discretionary bonus. A portion of the bonus may consist of profit sharing and/or deferred compensation. The Company
also matches a portion of employees’ 401(k) contributions, if any. The bonus is a function of client satisfaction with respect to investment results and service. Equity ownership is another component of
compensation for the portfolio managers. The firm is employee-owned.
CONFLICTS OF INTEREST. EARNEST Partners may be responsible for managing one or more of the Funds in addition to other client accounts which may include, but are not limited to, proprietary accounts, separate
accounts and other pooled investment vehicles. EARNEST Partners may manage other client accounts which may have higher fee arrangements than the Fund and/or may also have performance-based fees. Side-by-side management
of these other client accounts may create potential conflicts of interest which may relate to, among other things, the allocation of investment opportunities and the aggregation and allocation of transactions.
EARNEST Partners
seeks best execution with respect to all securities transactions and to aggregate and allocate the securities to client accounts in a fair and equitable manner. EARNEST Partners has implemented policies and procedures
that it believes are reasonably designed to mitigate and manage the potential conflicts of interest that may arise from side-by-side management. Specifically, EARNEST Partners manages client accounts to model
portfolios that are approved by its investment committee, and aggregates and then allocates securities transactions to client accounts in a manner that EARNEST Partners believes to be fair and equitable.
Epoch
Investment Partners, Inc.
COMPENSATION. Portfolio managers and other investment professionals at Epoch are compensated through a combination of base salary, overall work performance bonus and equity ownership, if appropriate due
to superior work performance and the performance of Epoch. The investment professional’s work performance is measured by Epoch, examining such things as effort, efficiency, ability to focus on the correct issues,
stock modeling ability and his or her ability to successfully interact with company management. Epoch avoids a compensation model that is driven by individual security performance and set against specific benchmarks,
as this can lead to short term thinking which is contrary to Epoch’s value investment philosophy. Ultimately, equity ownership is the primary tool used by Epoch for attracting and retaining the best people.
Shares are in the form of common stock subject to a vesting schedule.
CONFLICTS OF INTEREST. In Epoch’s view, conflicts of interest may arise in managing the Fund’s portfolio investments, on the one hand, and the portfolios of Epoch’s other clients and/or
accounts (together, the “Accounts”), on the other. Set forth below is a brief description of some of the material conflicts that may arise and Epoch’s policy or procedure for handling them. Although
Epoch has designed such procedures to prevent and address conflicts, there is no guarantee that such procedures will detect every situation in which a conflict arises.
The management of
multiple Accounts inherently means there may be competing interests for the portfolio management team’s time and attention. Epoch seeks to minimize this by utilizing one investment approach (i.e., focus on
free-cash flow), and by managing all Accounts on a strategy specific basis. Thus, all Accounts, whether they be fund accounts, institutional accounts or individual accounts are managed using the same investment
discipline, strategy and proprietary investment model as the Fund.
If the
portfolio management team identifies a limited investment opportunity that may be suitable for more than one Account, the Fund may not be able to take full advantage of that opportunity. However, Epoch has adopted
procedures for allocating portfolio transactions across Accounts so that each Account is treated fairly. First, all orders are allocated among portfolios of the same or similar mandates at the time of trade creation/
initial order preparation. Factors affecting allocations include availability of cash to existence of client imposed trading restrictions or prohibitions, and the tax status of the account. The only changes to the
allocations made at the time of the creation of the order, are if there is a partial fill for an order. Depending upon the size of the execution, Epoch
Target
Asset Allocation Funds 46
may
choose to allocate the executed shares through pro-rata breakdown, or on a random basis. As with all trade allocations each Account generally receives pro rata allocations of any new issue or IPO security that is
appropriate for its investment objective. Permissible reasons for excluding an account from an otherwise acceptable IPO or new issue investment include the account having FINRA restricted person status, lack of
available cash to make the purchase, or a client imposed trading prohibition on IPOs or on the business of the issuer.
With respect to
securities transactions for the Accounts, Epoch determines which broker to use to execute each order, consistent with its duty to seek best execution. Epoch will bunch or aggregate like orders where to do so will be
beneficial to the Accounts. However, with respect to certain Accounts, Epoch may be limited by the client with respect to the selection of brokers or may be instructed to direct trades through a particular broker. In
these cases, Epoch may place separate, non-simultaneous, transactions for the Fund and another Account, which may temporarily affect the market price of the security or the execution of the transaction to the detriment
one or the other.
Conflicts of
interest may arise when members of the portfolio management team transact personally in securities investments made or to be made for the Fund or other Accounts. To address this, Epoch has adopted a written Code of
Ethics designed to prevent and detect personal trading activities that may interfere or conflict with client interests (including Fund shareholders’ interests) or its current investment strategy. The Code of
Ethics generally requires that most transactions in securities by Epoch’s Access Persons and their family members (as defined in the Code), whether or not such securities are purchased or sold on behalf of the
Accounts, be cleared prior to execution by appropriate approving parties and compliance personnel. Securities transactions for Access Persons’ personal accounts also are subject to quarterly transaction reporting
and annual holdings reporting requirements.
Epoch manages
some Accounts under performance based fee arrangements. Epoch recognizes that this type of incentive compensation creates the risk for potential conflicts of interest. This structure may create an inherent pressure to
allocate investments having a greater potential for higher returns to accounts of those clients paying the higher performance fee. To prevent conflicts of interest associated with managing accounts with different
compensation structures, Epoch generally requires portfolio decisions to be made on a product specific basis. Epoch also requires pre-allocation of all client orders based on specific fee-neutral criteria set forth
above. Additionally, Epoch requires average pricing of all aggregated orders. Finally, Epoch has adopted a policy prohibiting Portfolio Managers (and all employees) from placing the investment interests of one client
or a group of clients with the same investment objectives above the investment interests of any other client or group of clients with the same or similar investment objectives.
Hotchkis and Wiley
Capital Management, LLC (HWCM)
COMPENSATION DISCLOSURE. Portfolio Managers of the Funds are supported by the full research team of HWCM. The investment team, including portfolio managers, is compensated in various forms, which may include a base
salary, an annual bonus, and equity ownership. Compensation is used to reward, attract and retain high quality investment professionals.
The investment team
is evaluated and accountable at three levels. The first level is individual contribution to the research and decision-making process, including the quality and quantity of work achieved. The second level is teamwork,
generally evaluated through contribution within sector teams. The third level pertains to overall portfolio and firm performance.
Fixed salaries and
discretionary bonuses for investment professionals are determined by the Chief Executive Officer of HWCM using tools which may include annual evaluations, compensation surveys, feedback from other employees and advice
from members of HWCM’s Executive and Compensation Committees. The amount of the bonus is determined by the total amount of HWCM’s bonus pool available for the year, which is generally a function of
revenues. No investment professional receives a bonus that is a pre-determined percentage of revenues or net income. Compensation is thus subjective rather than formulaic.
The majority of the
portfolio managers own equity in HWCM. HWCM believes that the employee ownership structure of HWCM will be a significant factor in ensuring a motivated and stable employee base going forward. HWCM believes that the
combination of competitive compensation levels and equity ownership provides HWCM with a demonstrable advantage in the retention and motivation of employees. Portfolio managers who own equity in HWCM receive their pro
rata share of HWCM’s profits. Investment professionals may also receive contributions under HWCM’s profit sharing / 401(k) plan.
Finally, HWCM maintains a bank of unallocated equity to be used for those individuals whose contributions to the firm grow over time. If any owner should retire or leave the firm, HWCM has the right to
repurchase their ownership thereby increasing the equity bank. This should provide for smooth succession through the gradual rotation of HWCM’s ownership from one generation to the next.
HWCM believes that
its compensation structure / levels are more attractive than the industry norm, which is illustrated by the firm’s lower-than-industry-norm investment personnel turnover.
47
DESCRIPTION OF
MATERIAL CONFLICTS OF INTEREST. The Funds are managed by HWCM’s investment team (“Investment Team”). The Investment Team also manages institutional accounts and other mutual funds in several different
investment strategies. The portfolios within an investment strategy are managed using a target portfolio; however, each portfolio may have different restrictions, cash flows, tax and other relevant considerations which
may preclude a portfolio from participating in certain transactions for that investment strategy. Consequently, the performance of portfolios may vary due to these different considerations. The Investment Team may
place transactions for one investment strategy that are directly or indirectly contrary to investment decisions made on behalf of another investment strategy. HWCM may be restricted from purchasing more than a limited
percentage of the outstanding shares of a company. If a company is a viable investment for more than one investment strategy, HWCM has adopted policies and procedures reasonably designed to ensure that all of its
clients are treated fairly and equitably.
Different types of
accounts and investment strategies may have different fee structures. Additionally, certain accounts pay HWCM performance-based fees, which may vary depending on how well the account performs compared to a benchmark.
Because such fee arrangements have the potential to create an incentive for HWCM to favor such accounts in making investment decisions and allocations, HWCM has adopted polices and procedures reasonably designed to
ensure that all of its clients are treated fairly and equitably, including in respect of allocation decisions, such as initial public offerings.
Since accounts are
managed to a target portfolio by the Investment Team, adequate time and resources are consistently applied to all accounts in the same investment strategy.
LSV
Asset Management (LSV)
PORTFOLIO MANAGER
COMPENSATION. LSV Portfolio Managers receive a base salary and bonus which is a function of overall firm profitability. In addition, each portfolio manager is a partner and receives a portion of the
firm’s net income.
POTENTIAL CONFLICTS. The same team of portfolio managers is responsible for the day-to-day management of all of LSV’s accounts. A potential conflict of interest could arise in relation to accounts with a
performance-based fee relative to other accounts in the same strategy without a performance-based fee and accounts in which employees may be invested. LSV has policies and procedures to monitor for this potential
conflict and designed to ensure that investment opportunities are fairly allocated to all clients.
Marsico Capital
Management, LLC (MCM)
PORTFOLIO MANAGER
COMPENSATION. The compensation package for portfolio managers of MCM is structured as a combination of base salary (reevaluated at least annually), and periodic cash bonuses. Base salaries may be
adjusted upward or downward depending on MCM's profitability. Bonuses are typically based on two other primary factors: (1) MCM's overall profitability for the period, and (2) individual achievement and contribution.
Exceptional individual efforts are typically rewarded through salary readjustments and through larger bonuses. No other special employee incentive arrangements are currently in place or being planned.
Portfolio manager compensation takes into account, among other factors, the overall performance of all accounts for which the portfolio manager provides investment advisory services. In receiving
compensation such as bonuses, portfolio managers do not receive special consideration based on the performance of particular accounts, and do not receive compensation from accounts charging performance-based fees. In
addition to salary and bonus, MCM's portfolio managers may participate in other benefits such as health insurance and retirement plans on the same basis as other MCM employees. MCM's portfolio managers also may be
offered the opportunity to acquire equity interests in the firm's indirect parent company.
As a general matter,
MCM does not tie portfolio manager compensation to specific levels of performance relative to fixed benchmarks (e.g., S&P 500 Index). Although performance is a relevant consideration, comparisons with fixed benchmarks
may not always be useful. Relevant benchmarks vary depending on specific investment styles and client guidelines or restrictions, and comparisons to benchmark performance may at times reveal more about market sentiment
than about a portfolio manager's performance or abilities. To encourage a long-term horizon for managing client assets and concurrently minimizing potential conflicts of interest and portfolios risks, MCM evaluates a
portfolio manager's performance over periods longer than the immediate compensation period, and may consider a variety of measures in determining compensation, such as the performance of unaffiliated mutual funds or
other portfolios having similar strategies as well as other measurements. Other factors that may be significant in determining portfolio manager compensation include, without limitation, the effectiveness of the
manager's leadership within MCM's investment management team, contributions to MCM's overall performance, discrete securities analysis, idea generation, the ability and willingness to support and train other analysts,
and other considerations.
MATERIAL CONFLICTS. A portfolio manager may manage accounts for other clients. These accounts may include registered investment companies, other types of pooled accounts (e.g., collective investment funds),
and separate accounts (i.e., accounts managed on behalf of individuals or public or private institutions). Portfolio managers of MCM make investment decisions for each account based on the investment objectives and
policies and other relevant investment considerations applicable to that account. The
Target
Asset Allocation Funds 48
management of multiple accounts may result in a portfolio manager devoting unequal time and attention to the management of each account. Although MCM does not track the time a portfolio manager spends on
a single portfolio, it does assess whether a portfolio manager has adequate time and resources to effectively manage all of the accounts for which he is responsible. MCM seeks to manage competing interests for the time
and attention of portfolio managers by having portfolio managers focus on a particular investment discipline or complementary investment disciplines. Accounts within a particular investment discipline may often be
managed by using generally similar investment strategies, subject to factors including particular account restrictions and objectives, account opening dates, cash flows, and other considerations. Even where multiple
accounts are managed by the same portfolio manager within the same investment discipline, however, MCM may take action with respect to one account that may differ from the timing or nature of action taken with respect
to another account because of different client-specific objectives or restrictions or for other reasons such as different cash flows. Accordingly, the performance of each account managed by a portfolio manager will vary.
Potential conflicts
of interest may also arise when allocating and/or aggregating trades. MCM often aggregates into a single trade order several individual contemporaneous client trade orders in a single security. Under MCM's trade
management policy and procedures, when trades are aggregated on behalf of more than one account, such transactions will be allocated to participating client accounts in a fair and equitable manner. With respect to
initial public offerings and other syndicated or limited offerings, it is MCM's policy to seek to ensure that over the long term, accounts with the same or similar investment objectives or strategies will receive an
equitable opportunity to participate meaningfully in such offerings and will not be unfairly disadvantaged. To deal with these situations, MCM has adopted policies and procedures for allocating transactions across
multiple accounts. MCM's policies also seek to ensure that portfolio managers do not systematically allocate other types of trades in a manner that would be more beneficial to one account than another. MCM's compliance
department monitors transactions made on behalf of multiple clients to seek to ensure adherence to its policies.
MCM has adopted and
implemented policies and procedures, including brokerage and trade allocation policies and procedures, that seek to minimize potential conflicts of interest that may arise because MCM advises multiple accounts. In
addition, MCM monitors a variety of areas, including compliance with account investment guidelines and/or restrictions and compliance with the policies and procedures of MCM, including MCM's Code of Ethics.
Massachusetts Financial Services Company (MFS)
COMPENSATION. Portfolio manager total cash compensation is reviewed annually. As of December 31, 2011, portfolio manager total cash compensation is a combination of base salary and performance bonus:
| ■ | Base Salary—Base salary represents a smaller percentage of portfolio manager total cash compensation than performance bonus. |
| ■ | Performance Bonus—Generally, the performance bonus represents more than a majority of portfolio manager total cash compensation. |
The performance bonus
is based on a combination of quantitative and qualitative factors, generally with more weight given to the former and less weight given to the latter.
The
quantitative portion is based on the pre-tax performance of assets managed by the portfolio manager over one-, three-, and five-year periods relative to peer group universes and/or indices (“benchmarks”).
As of December 31, 2011, the following benchmarks were used to measure the portfolio manager's performance for the Funds and/or comparable accounts:
| Portfolio Manager | Benchmark |
| Eric B. Fischman | Russell 1000 Growth Index |
Additional or
different benchmarks, including versions of indices, custom indices, and linked indices that include performance of different indices for different portions of the time period, may also be used. Primary weight is given
to portfolio performance over a three-year time period with lesser consideration given to portfolio performance over one-year and five-year periods (adjusted as appropriate if the portfolio manager has served for less
than five years).
The qualitative
portion is based on the results of an annual internal peer review process (conducted by other portfolio managers, analysts, and traders) and management’s assessment of overall portfolio manager contributions to
investor relations and the investment process (distinct from fund and other account performance). This performance bonus may be in the form of cash and/or a deferred cash award, at the discretion of management. A
deferred cash award is issued for a cash value and becomes payable over a three-year vesting period if the portfolio manager remains in the continuous employ of MFS or its affiliates. During the vesting period, the
value of the unfunded deferred cash award will fluctuate as though the portfolio manager had invested the cash value of the award in an MFS Fund(s) selected by the portfolio manager. A selected fund may be, but is not
required to be, a fund that is managed by the portfolio manager.
49
Portfolio managers also typically benefit from the opportunity to participate in the MFS Equity Plan. Equity interests and/or options to acquire equity interests in MFS or its parent company are awarded by
management, on a discretionary basis, taking into account tenure at MFS, contribution to the investment process, and other factors.
Finally, portfolio
managers also participate in benefit plans (including a defined contribution plan and health and other insurance plans) and programs available generally to other employees of MFS. The percentage such benefits represent
of any portfolio manager’s compensation depends upon the length of the individual’s tenure at MFS and salary level, as well as other factors.
POTENTIAL CONFLICTS
OF INTEREST. MFS seeks to identify potential conflicts of interest resulting from a portfolio manager’s management of both the Funds and other accounts, and has adopted policies and procedures
designed to address such potential conflicts.
The
management of multiple funds and accounts (including proprietary accounts) gives rise to potential conflicts of interest if the funds and accounts have different objectives and strategies, benchmarks, time horizons and
fees as a portfolio manager must allocate his or her time and investment ideas across multiple funds and accounts. In certain instances there are securities which are suitable for the Funds as well as for accounts of
MFS or its subsidiaries with similar investment objectives. The Fund’s trade allocation policies may give rise to conflicts of interest if the Fund’s orders do not get fully executed or are delayed in
getting executed due to being aggregated with those of other accounts of MFS or its subsidiaries. A portfolio manager may execute transactions for another fund or account that may adversely affect the value of the
Fund’s investments. Investments selected for funds or accounts other than the Portfolio may outperform investments selected for the Funds.
When two or more
clients are simultaneously engaged in the purchase or sale of the same security, the securities are allocated among clients in a manner believed by MFS to be fair and equitable to each. It is recognized that in some
cases this system could have a detrimental effect on the price or volume of the security as far as the Funds are concerned. In most cases, however, MFS believes that the Portfolio’s ability to participate in
volume transactions will produce better executions for the Funds.
MFS
and/or a portfolio manager may have a financial incentive to allocate favorable or limited opportunity investments or structure the timing of investments to favor accounts other than the Funds, for instance, those that
pay a higher advisory fee and/or include an investment by the portfolio manager.
NFJ Investment Group
LLC (NFJ)
COMPENSATION. Investment professional compensation is designed to align with our clients’ interests, attract, motivate and retain top talent, and encourage long-term stability. We aim to provide
rewards for exceptional investment performance and to build an enduring firm with a long-term culture of shared success. In support of these objectives, our compensation program includes base salary, an annual cash
bonus, and long-term incentive. For some investment teams, compensation is funded by team revenue adjusted by investment performance.
Base Salary.
Investment professionals are provided a competitive base salary which reflects the scope and responsibilities of the position and experience level of the individual. Salaries are periodically evaluated against industry
peers using market data provided by independent third-party compensation surveys. Salaries represent a larger percentage of total compensation for more junior positions; and for more senior positions is a smaller
percentage and subject to less frequent adjustments. Typically, salary comprises 30%-50% of total compensation for junior portfolio managers and 10%-30% of total compensation for senior portfolio managers.
Annual Cash Bonus.
Investment professionals are eligible for an annual, discretionary bonus. Bonuses are awarded based on achievement to set goals, investment performance, and individual contribution. Investment performance is measured
relative to the relevant fund/strategy benchmark and/or peer group ranking through measurement periods that are trailing one, three, and five years, but vary by investment team and fund. The differences in measurement
periods are not arbitrary, but are linked to the nature of the investment process, strategies, and investment turnover.
Long-Term Incentive.
Allianz Global Investors’ long-term incentive plan is designed to align compensation of key staff, managers, and executives with longer-term company performance. Awards are granted annually with award
appreciation determined by the earnings growth of Allianz Global Investors in the U.S. and globally. Each award has a three-year vesting schedule and is paid in cash upon vesting.
The portion of
individual incentive received as annual cash bonus versus long-term deferred incentive is standardized globally across Allianz Global Investors. Senior investment professionals receive a higher proportion of incentive
compensation in long-term awards. Typically, long-term incentive represents 10%-20% of junior portfolio manager total compensation while long-term incentive represents 25%-35% of senior portfolio manager total
compensation.
Target
Asset Allocation Funds 50
CONFLICTS OF INTEREST. Like other investment professionals with multiple clients, a portfolio manager for a Fund may face certain potential conflicts of interest in connection with managing both the Fund and
other accounts at the same time. The paragraphs below describe some of these potential conflicts, which NFJ believes are faced by investment professionals at most major financial firms. NFJ, the Adviser and the
Trustees have adopted compliance policies and procedures that attempt to address certain of these potential conflicts. The management of accounts with different advisory fee rates and/or fee structures, including
accounts that pay advisory fees based on account performance (“performance fee accounts”), may raise potential conflicts of interest by creating an incentive to favor higher-fee accounts. These potential
conflicts may include, among others:
| ■ | The most attractive investments could be allocated to higher-fee accounts or performance fee accounts. |
| ■ | The trading of higher-fee accounts could be favored as to timing and/or execution price. For example, higher fee accounts could be permitted to sell securities earlier than other accounts when a prompt sale is desirable or to buy securities at an earlier and more opportune time. |
| ■ | The investment management team could focus their time and efforts primarily on higher-fee accounts due to a personal stake in compensation. |
A potential conflict
of interest may arise when a Fund and other accounts purchase or sell the same securities. On occasions when a portfolio manager considers the purchase or sale of a security to be in the best interest of a Fund as well
as other accounts, NFJ’s trading desk may, to the extent by applicable laws and regulations, aggregate the securities to be sold or purchased in order to obtain the best execution and lower brokerage commissions,
if any. Aggregation of trades may create the potential for unfairness to a Fund or another account if one account is favored over another in allocating securities purchased or sold—for example, by allocating a
disproportionate amount of a security that is likely to increase in value to a favored account.
Another potential
conflict of interest may arise based on the different investment objectives and strategies of a Fund and other accounts. For example, another account may have a shorter-term investment horizon or different investment
objective, policies or restrictions than a Fund. Depending on another account’s objectives or other factors, a portfolio manager may give advice and make decisions that may differ from advice given, or the timing
or nature of decision made, with respect to a Fund. In addition, investment decisions are the product of many factors in addition to basic suitability for the particular account involved. Thus, a particular security
may be bought or sold for certain accounts even though it could have been bought or sold for other accounts at the same time. More rarely, a particular security may be bought for one or more accounts managed by a
portfolio manager when one or more other accounts are selling the security. There may be circumstances when purchased or sales of portfolio securities for one or more accounts may have an adverse effect on other
accounts.
A Fund’s
portfolio manager who is responsible for managing multiple funds and/or accounts may allocate unequal time and attention to the management of those funds and/or accounts. As a result, the portfolio manager may not be
able to formulate as complete a strategy or identify equally attractive investment opportunities for each of those accounts as might be the case if he or she were to devote substantially more attention to the
management of a single fund. The effects of this potential conflict may be more pronounced where funds and/or accounts overseen by a particular portfolio manager have different investment strategies.
A Fund’s
portfolio managers may be able to select or influence the selection of the brokers and dealers that are used to execute securities transactions for the Funds. In addition to executing trades, some brokers and dealers
provide portfolio managers with brokerage an research services (as those terms are defined in Section 28(e) of the Securities Exchange Act of 1934), which may result in the payment of higher brokerage fees than might
have otherwise been available. These services may be more beneficial to certain funs or accounts than to others. Although the payment of brokerage commissions is subject to the requirement that the portfolio manager
determine in good faith and the commissions are reasonable in relation to the value of the brokerage and research services provided to the Fund and NFJ’s other clients, a portfolio manager’s decision as to
the selection of brokers and dealers could yield disproportionate costs and benefits among the funds and/or accounts that he or she managers.
A Fund’s
portfolio managers may also face other potential conflicts of interest in managing a Fund, and the description above is not complete description of every conflict that could be deemed to exist in managing both the
Funds and other accounts. In addition, a Fund’s portfolio manger may also manage other accounts (including their personal assets or the assets of family members) in their personal capacity. The management of
these accounts may also involve certain of the potential conflicts described above. Front-running could also exist if a portfolio manager transacted in his own account prior to placing an order for a Fund or other
clients. NFJ’s investment personnel, including each Fund’s portfolio manager, are subject to restrictions on engaging in personal securities transactions, pursuant to a Code of Ethics adopted by NFJ, which
contain provisions and requirements designed to identify and address certain conflicts of interest between personal investments activities and the interest of the Funds.
As part of
NFJ’s Compliance Program, NFJ has established a Compliance Committee, a Best Execution Committee, a Proxy Voting Committee and a Pricing Committee to help develop policies and procedures that help NFJ avoid,
mitigate, monitor and oversee areas that could present potential conflicts of interest.
51
Pacific Investment
Management Company LLC (PIMCO)
COMPENSATION. PIMCO has adopted a Total Compensation Plan for its professional level employees, including its portfolio managers, that is designed to pay competitive compensation and reward performance,
integrity and teamwork consistent with the firm’s mission statement. The Total Compensation Plan includes an incentive component that rewards high performance standards, work ethic and consistent individual and
team contributions to the firm. The compensation of portfolio managers consists of a base salary, discretionary performance bonus, and may include an equity or long term incentive component.
Certain employees of PIMCO, including portfolio managers, may elect to defer compensation through PIMCO’s deferred compensation plan. PIMCO also offers its employees a non-contributory defined
contribution plan through which PIMCO makes a contribution based on the employee’s compensation. PIMCO’s contribution rate increases at a specified compensation level, which is a level that would include
portfolio managers.
The Total
Compensation Plan consists of three components:
| ■ | Base Salary - Base salary is determined based on core job responsibilities, positions/levels, and market factors. Base salary levels are reviewed annually, when there is a significant change in job responsibilities or a significant change in the market. Base salary is paid in regular installments throughout the year and payment dates are in line with local practice. |
| ■ | Performance Bonus - Performance bonuses are designed to reward individual performance. Each professional and his or her supervisor will agree upon performance objectives to serve as a basis for performance evaluation during the year. The objectives will outline individual goals according to pre-established measures of the group or department success. Achievement against these goals as measured by the employee and supervisor will be an important, but not exclusive, element of the Compensation Committee’s bonus decision process. Final award amounts are determined at the discretion of the Compensation Committee and will also consider firm performance. |
| ■ | Equity or Long Term Incentive Compensation - Equity allows key professionals to participate in the long-term growth of the firm. This program provides mid to senior level employees with the potential to acquire an equity stake in PIMCO over their careers and to better align employee incentives with the firm’s long-term results. These options vest over a number of years and may convert into PIMCO equity which shares in the profit distributions of the firm. M Units are non-voting common equity of PIMCO and provide a mechanism for individuals to build a significant equity stake in PIMCO over time. Employees who reach a total compensation threshold are delivered their annual compensation in a mix of cash and option awards. PIMCO incorporates a progressive allocation of option awards as a percentage of total compensation which is in line with market practices. |
In certain countries
with significant tax implications for employees to participate in the M Unit Option Plan, PIMCO continues to use the Long Term Incentive Plan (“LTIP”) in place of the M Unit Option Plan. The LTIP provides
cash awards that appreciate or depreciate based upon the performance of PIMCO’s performance over a three-year period. The aggregate amount available for distribution to participants is based upon PIMCO’s
profit growth.
Participation in the
M Unit Option Plan and LTIP is contingent upon continued employment at PIMCO.
In addition, the
following non-exclusive list of qualitative criteria may be considered when specifically determining the total compensation for portfolio managers:
| ■ | 3-year, 2-year and 1-year dollar-weighted and account-weighted, pre-tax investment performance as judged against the applicable benchmarks for each account managed by a portfolio manager (including the Funds) and relative to applicable industry peer groups; |
| ■ | Appropriate risk positioning that is consistent with PIMCO’s investment philosophy and the Investment Committee/CIO approach to the generation of alpha; |
| ■ | Amount and nature of assets managed by the portfolio manager; |
| ■ | Consistency of investment performance across portfolios of similar mandate and guidelines (reward low dispersion); |
| ■ | Generation and contribution of investment ideas in the context of PIMCO’s secular and cyclical forums, portfolio strategy meetings, Investment Committee meetings, and on a day-to-day basis; |
| ■ | Absence of defaults and price defaults for issues in the portfolios managed by the portfolio manager; |
| ■ | Contributions to asset retention, gathering and client satisfaction; |
| ■ | Contributions to mentoring, coaching and/or supervising; and |
| ■ | Personal growth and skills added. |
A portfolio
manager’s compensation is not based directly on the performance of any Fund or any other account managed by that portfolio manager.
Profit
Sharing Plan. Portfolio managers who are Managing Directors of PIMCO receive compensation from a non-qualified profit sharing plan consisting of a portion of PIMCO’s net profits.
Portfolio managers who are Managing Directors receive an amount determined by the Compensation Committee, based upon an individual’s overall contribution to the firm.
Target
Asset Allocation Funds 52
CONFLICTS OF INTEREST. From time to time, potential and actual conflicts of interest may arise between a portfolio manager’s management of the investments of a Fund, on the one hand, and the management of
other accounts, on the other. Potential and actual conflicts of interest may also arise as a result of PIMCO’s other business activities and PIMCO’s possession of material non-public information about an
issuer. Other accounts managed by a portfolio manager might have similar investment objectives or strategies as the Funds, track the same index a Fund tracks or otherwise hold, purchase, or sell securities that are
eligible to be held, purchased or sold by the Funds. The other accounts might also have different investment objectives or strategies than the Funds.
Knowledge and Timing
of Fund Trades. A potential conflict of interest may arise as a result of the portfolio manager’s day-to-day management of a Fund. Because of their positions with the Funds, the portfolio managers know the size,
timing and possible market impact of a Fund’s trades. It is theoretically possible that the portfolio managers could use this information to the advantage of other accounts they manage and to the possible
detriment of a Fund.
Investment
Opportunities. A potential conflict of interest may arise as a result of the portfolio manager’s management of a number of accounts with varying investment guidelines. Often, an investment opportunity may be
suitable for both a Fund and other accounts managed by the portfolio manager, but may not be available in sufficient quantities for both the Fund and the other accounts to participate fully. Similarly, there may be
limited opportunity to sell an investment held by a Fund and another account. PIMCO has adopted policies and procedures reasonably designed to allocate investment opportunities on a fair and equitable basis over time.
Under PIMCO’s
allocation procedures, investment opportunities are allocated among various investment strategies based on individual account investment guidelines and PIMCO’s investment outlook. PIMCO has also adopted
additional procedures to complement the general trade allocation policy that are designed to address potential conflicts of interest due to the side-by-side management of the Funds and certain pooled investment
vehicles, including investment opportunity allocation issues.
Conflicts potentially
limiting a Fund’s investment opportunities may also arise when the Fund and other PIMCO clients invest in different parts of an issuer’s capital structure, such as when the Fund owns senior debt obligations
of an issuer and other clients own junior tranches of the same issuer. In such circumstances, decisions over whether to trigger an event of default, over the terms of any workout, or how to exit an investment may
result in conflicts of interest. In order to minimize such conflicts, a portfolio manager may avoid certain investment opportunities that would potentially give rise to conflicts with other PIMCO clients or PIMCO may
enact internal procedures designed to minimize such conflicts, which could have the effect of limiting a Fund’s investment opportunities.
Additionally, if PIMCO acquires material non-public confidential information in connection with its business activities for other clients, a portfolio manager may be restricted from purchasing securities
or selling securities for a Fund. When making investment decisions where a conflict of interest may arise, PIMCO will endeavor to act in a fair and equitable manner as between a Fund and other clients; however, in
certain instances the resolution of the conflict may result in PIMCO acting on behalf of another client in a manner that may not be in the best interest, or may be opposed to the best interest, of a Fund.
Performance Fees. A
portfolio manager may advise certain accounts with respect to which the advisory fee is based entirely or partially on performance. Performance fee arrangements may create a conflict of interest for the portfolio
manager in that the portfolio manager may have an incentive to allocate the investment opportunities that he or she believes might be the most profitable to such other accounts instead of allocating them to a Fund.
PIMCO has adopted policies and procedures reasonably designed to allocate investment opportunities between the Funds and such other accounts on a fair and equitable basis over time.
REGULATORY AND LITIGATION MATTERS. PIMCO is not the subject of any lawsuit which can reasonably be expected to have a material adverse effect on PIMCO’s ability to provide investment management services.
Prudential Investments
LLC
COMPENSATION. Prudential provides compensation opportunities to eligible employees to motivate and reward the achievement of outstanding results by providing market-based programs that:
| ■ | Attract and reward highly qualified employees |
| ■ | Align with critical business goals and objectives |
| ■ | Link to the performance results relevant to the business segment and Prudential |
| ■ | Retain top performers |
| ■ | Pay for results and differentiate levels of performance |
| ■ | Foster behaviors and contributions that promote Prudential’s success |
The components of
compensation for a Vice President in Prudential Investments consists of base salary, annual incentive compensation and long term incentive compensation.
53
Base Pay Overview: The Prudential compensation structure is organized in grades, each with its own minimum and maximum base pay (i.e., salary). The grades reflect pay patterns in the market. Each job in the
plan—from CEO through an entry-level job—is included in one of the grades. The main determinant of placement in the base pay structure is market data. On an annual basis, Corporate Compensation collects and
analyzes market data to determine if any change to the placement of job in the structure is necessary to maintain market competitiveness. If necessary, structural compensation changes (e.g., increases to base pay
minimum and maximums) will be effective on the plan’s effective date for base pay increases.
Annual Incentive
Compensation Overview: The plan provides an opportunity for all participants to share in the annual results of Prudential, as well as the results of their division or profit center. Results are reviewed and
incentive payments are made as early as practicable after the close of the plan year. Incentive payments are awarded based on organizational performance—which determines the available dollar amounts—and
individual performance. Individual performance will be evaluated on the basis of contributions relative to others in the organization. Incentive payments are granted from a budgeted amount of money that is made
available by the Company. Initial budgets are developed by determining the competitive market rates for incentives as compared to our comparator companies.
Each
organization’s budget pool may be increased or decreased based on organizational performance. Organizational performance is determined by a review of performance relative to our comparator group, as well as key
measures indicated in our business plan, such as Return on Required Equity (RORE), earnings and revenue growth.
Long Term Incentive
Compensation Overview: In addition, executives at the Vice President level and above are eligible to participate in a long term incentive program to provide an ownership stake in Prudential Financial. Long-Term
incentives currently consist of restricted stock and stock options. The stock options vest 1∕3 per year over 3 years and the restricted stock vests 100% at the end of 3 years.
CONFLICTS OF INTEREST. PI follows Prudential Financial’s policies on business ethics, personal securities trading by investment personnel, and information barriers and has adopted a code of ethics,
allocation policies, supervisory procedures and conflicts of interest policies, among other policies and procedures, which are designed to ensure that clients are not harmed by these potential or actual conflicts of
interests; however, there is no guarantee that such policies and procedures will detect and ensure avoidance, disclosure or mitigation of each and every situation in which a conflict may arise.
Vaughan Nelson Investment Management, L.P. (Vaughan Nelson)
COMPENSATION. Compensation of portfolio management professionals includes a fixed base salary, variable bonus and a contribution to the firm’s retirement plan. The variable bonus component, as a
whole for all portfolio management professionals, is based upon a percentage of the firm’s operating profit, as defined. Each portfolio management professional’s participation in the variable bonus pool is
based primarily upon the performance of the strategy managed, as represented by a composite of all accounts qualifying for such composite relative to the Russell Universe peer group. In order to align compensation with
the investment objectives of our clients, the evaluation methodology utilizes the three year performance period as the primary weighting, the five year performance period as the secondary weighting and a qualitative
assessment of the quality of client service provided as a tertiary weighting. The contribution to the firm’s retirement plan is based on a percentage (at the discretion of the Vaughan Nelson Board) of total cash
compensation (subject to IRS limits) and such percentage is the same for all firm personnel. Key employees, at the discretion of the Compensation Committee, are eligible to participate within Natixis Global Asset
Management’s long-term incentive program. Compensation at Vaughan Nelson is determined by the Compensation Committee at the recommendation of the Chief Executive Officer.
There is no
distinction for purposes of compensation between the Funds and any other accounts managed.
CONFLICTS OF INTEREST. Actual or apparent conflicts of interest may arise when a portfolio manager has day-to-day responsibilities with respect to more than one investment account. Portfolio managers who manage
other investment accounts in addition to a portion of the Funds may be presented with the following potential conflicts: 1) a conflict between the investment strategy of the Funds and the other strategies and accounts
managed by the portfolio manager with regard to the allocation of limited investment opportunities that may be appropriate for more than one investment strategy; 2) a conflict in the allocation of investment
opportunities amongst accounts within the strategy employed by the Funds. Vaughan Nelson maintains policies and procedures in place that address these potential conflict of interest issues to aid in assuring that
investment opportunities are allocated fairly and equitably amongst all client accounts.
Target
Asset Allocation Funds 54
Thornburg Investment Management, Inc. (Thornburg)
COMPENSATION. The compensation of the portfolio manager includes an annual salary, annual bonus, and company-wide profit sharing. The portfolio manager also owns equity shares in the investment manager,
Thornburg Investment Management, Inc. (“Thornburg”) . Both the salary and bonus are reviewed approximately annually for comparability with salaries of other portfolio managers in the industry, using survey
data obtained from compensation consultants. The annual bonus is subjective. Criteria that are considered in formulating the bonus include, but are not limited to, the following: revenues available to pay compensation
of the portfolio manager; multiple year historical total return of accounts managed by the portfolio manager, relative to market performance and single year historical total return of accounts managed by the portfolio
manager.
CONFLICTS OF INTEREST. Most investment advisors and their portfolio managers manage investments for multiple clients, including mutual funds, private accounts, and retirement plans. In any case where a portfolio
manager manages the investments of two or more accounts, there is a possibility that conflicts of interest could arise between the portfolio manager’s management of the fund’s investments and the
manager’s management of other accounts. These conflicts could include:
| ■ | Allocating a favorable investment opportunity to one account but not another. |
| ■ | Directing one account to buy a security before purchases through other accounts increase the price of the security in the market place. |
| ■ | Giving substantially inconsistent investment directions at the same time to similar accounts, so as to benefit one account over another. |
| ■ | Obtaining services from brokers conducting trades for one account, which are used to benefit another account. |
Thornburg has
informed the Funds that it has considered the likelihood that any material conflicts of interest could arise between the portfolio manager’s management of a Fund’s investments and the portfolio
manager’s management of other accounts. Thornburg has also informed the Funds that it has not identified any such conflicts that may arise, and has concluded that it has implemented policies and procedures to
identify and resolve any such conflict if it did arise.
OTHER SERVICE
PROVIDERS
CUSTODIAN. The Bank of New York Mellon (BNY), One Wall Street, New York, New York 10286, serves as Custodian for the Funds' portfolio securities and cash, and in that capacity, maintains certain
financial accounting books and records pursuant to an agreement with the Funds. Subcustodians provide custodial services for any foreign assets held outside the United States.
SECURITIES LENDING AGENT. Prudential Investment Management, Inc. (PIM) serves as securities lending agent for the Funds, and in that role administers the Funds' securities lending program. PIM is an affiliate of PI. For its services, PIM receives a portion of
the amount earned by lending securities. The compensation received by PIM for services as securities lending agent for the three most recently completed fiscal years is set forth below.
| Compensation Received by PIM for Securities Lending: Conservative Allocation Fund | |||
| 2012 | 2011 | 2010 | |
| None | None | None |
| Compensation Received by PIM for Securities Lending: Moderate Allocation Fund | |||
| 2012 | 2011 | 2010 | |
| None | None | None |
| Compensation Received by PIM for Securities Lending: Growth Allocation Fund | |||
| 2012 | 2011 | 2010 | |
| None | None | None |
TRANSFER AGENT. PMFS, Gateway Center Three, 100 Mulberry Street, Newark, New Jersey 07102, serves as the transfer and dividend disbursing agent of the Funds. PMFS is an affiliate of the Manager. PMFS
provides customary transfer agency services to the Funds, including the handling of shareholder communications, the processing of shareholder transactions, the maintenance of shareholder account records, the payment of
dividends and distributions, and related functions. For these services, PMFS receives compensation from the Funds and is reimbursed for its transfer agent expenses which include an annual fee and certain out-of-pocket
expenses including, but not limited to, postage, stationery, printing, allocable communication expenses and other costs.
The Funds' Board has
appointed BNY Mellon Asset Servicing (U.S.) Inc. (BNYAS) as sub-transfer agent to the Funds. PMFS has contracted with BNY Mellon Asset Servicing, 301 Bellevue Parkway, Wilmington, Delaware 19809, to provide certain
administrative functions to PMFS. PMFS will compensate BNY Mellon Asset Servicing for such services.
55
For the most recently
completed fiscal year, the Funds incurred the following approximate amount of fees for services provided by PMFS:
| Fees Paid to PMFS | |
| Fund Name | Amount |
| Conservative Allocation Fund | $78,000 |
| Moderate Allocation Fund | $221,461 |
| Growth Allocation Fund | $157,663 |
INDEPENDENT REGISTERED
PUBLIC ACCOUNTING FIRM. KPMG LLP, 345 Park Avenue, New York, New York 10154, served as independent registered public accounting firm for each of the five most recent fiscal years for the Funds, and in that
capacity will audit the annual financial statements for the next fiscal year.
DISTRIBUTION OF
FUND SHARES
DISTRIBUTORS. Prudential Investment Management Services LLC (PIMS or the Distributor), Gateway Center Three, 100 Mulberry Street, Newark, New Jersey 07102-4077, acts as the distributor of all of the
shares of the Funds. Prudential Annuities Distributors, Inc. (PAD), together with PIMS (collectively, the Distributors), acts as co-distributor of the Funds' Class X shares. The Distributors are subsidiaries of
Prudential.
The Distributors, as
applicable, incur the expenses of distributing the Funds' share classes pursuant to separate Distribution and Service Plans for each share class (collectively, the Plans) adopted by the Funds pursuant to Rule 12b-1
under the 1940 Act and a distribution agreement (the Distribution Agreement). The Distributors also incur the expenses of distributing any share class offered by the Funds which is not subject to a Distribution and
Service (12b-1) Plan, and none of the expenses incurred by the Distributors in distributing such share classes are reimbursed or paid for by the Funds.
The expenses incurred
under the Plans include commissions and account servicing fees paid to, or on account of brokers or financial institutions which have entered into agreements with the Distributors, as applicable, advertising expenses,
the cost of printing and mailing prospectuses to potential investors and indirect and overhead costs of the Distributor associated with the sale of Fund shares, including sales promotion expenses.
Under the Plans, the Funds are obligated to pay distribution and/or service fees to the Distributors, as applicable, as compensation for its distribution and service activities, not as reimbursement for
specific expenses incurred. If the Distributors’ expenses exceed their distribution and service fees, the Funds will not be obligated to pay any additional expenses. If the Distributors’ expenses are less
than such distribution and service fees, the Distributors will retain their full fees and realize a profit.
The distribution
and/or service fees may also be used by the Distributors to compensate on a continuing basis brokers in consideration for the distribution, marketing, administrative and other services and activities provided by
brokers with respect to the promotion of the sale of Fund shares and the maintenance of related shareholder accounts.
Distribution expenses
attributable to the sale of each share class are allocated to each such class based upon the ratio of sales of each such class to the combined sales of all classes of the Funds, other than expenses allocable to a
particular class. The distribution fee and sales charge of one class will not be used to subsidize the sale of another class.
Each Plan continues
in effect from year to year, provided that each such continuance is approved at least annually by a vote of the Board, including a majority vote of the Board Members who are not interested persons of the Funds and who
have no direct or indirect financial interest in any of the Plans or in any agreement related to the Plans (the Rule 12b-1 Board Members), cast in person at a meeting called for the purpose of voting on such
continuance. A Plan may be terminated at any time, without penalty, by the vote of a majority of the Rule 12b-1 Board Members or by the vote of the holders of a majority of the outstanding shares of the applicable
class of the Funds on not more than 30 days' written notice to any other party to the Plan. The Plans may not be amended to increase materially the amounts to be spent for the services described therein without
approval by the shareholders of the applicable class, and all material amendments are required to be approved by the Board in the manner described above. Each Plan will automatically terminate in the event of its
assignment. The Funds will not be contractually obligated to pay expenses incurred under any Plan if it is terminated or not continued.
Pursuant to each
Plan, the Board will review at least quarterly a written report of the distribution expenses incurred on behalf of each class of shares of the Funds by the Distributors. The report will include an itemization of the
distribution expenses and the purposes of such expenditures. In addition, as long as the Plans remain in effect, the selection and nomination of Rule 12b-1 Board Members shall be committed to the Rule 12b-1 Board
Members.
Target
Asset Allocation Funds 56
Pursuant to the
Distribution Agreement, the Funds have agreed to indemnify the Distributors to the extent permitted by applicable law against certain liabilities under federal securities laws.
In addition to
distribution and service fees paid by the Funds under the Plans, the Manager (or one of its affiliates) may make payments out of its own resources to dealers and other persons which distribute shares of the Funds. Such
payments may be calculated by reference to the net asset value of shares sold by such persons or otherwise.
CLASS A SALES CHARGE
AND DISTRIBUTION EXPENSE INFORMATION. Under the Class A Plan, the Funds may pay the Distributor for its distribution-related activities with respect to Class A shares at an annual rate of .30% of the average daily net assets
of the Class A shares. The Class A Plan provides that (1) .25% of the average daily net assets of the Class A shares may be used to pay for personal service and/or the maintenance of shareholder accounts (service fee)
and (2) total distribution fees (including the service fee of .25%) may not exceed .30% of the average daily net assets of the Class A shares. The Prospectus discusses any contractual or voluntary fee waivers that may
be in effect. In addition, if you purchase $1 million or more of Class A shares, you are subject to a 1% CDSC (defined below) for shares redeemed within 12 months of purchase (the CDSC is waived for purchase by certain
retirement and/or benefit plans) (Note: For Prudential Short-Term Corporate Bond Fund only, if you purchase $1 million or more of Class A shares, you are subject to a .50% CDSC for shares redeemed within
18 months of purchase).
For the most recently
completed fiscal year, the Distributor received payments under the Class A Plan. These amounts were expended primarily for payments of account servicing fees to financial advisers and other persons who sell Class A
shares. For the most recently completed fiscal year, the Distributor also received initial sales charges and proceeds of contingent deferred sales charges paid by shareholders upon certain redemptions of Class A
Shares. The amounts received and spent by the Distributor are detailed in the tables below.
CLASS
X SALES CHARGE AND DISTRIBUTION EXPENSE INFORMATION. Under the Class X Plan, the Funds pay the Distributors for their distribution-related expenses with respect to these shares at an annual rate of up to 1% of the average daily net assets of
each of the Class X shares. The Class X Plan provides that (1) up to .25% of the average daily net assets of the Class X shares may be used to pay for personal service and/or the maintenance of shareholder accounts
(service fee) and (2) total distribution fees (including the service fee of .25%) may not exceed 1.00% of the average daily net assets of the Class X shares. The amounts received and spent by the Distributors are
detailed in the tables below.
CLASS R SALES CHARGE
AND DISTRIBUTION EXPENSE INFORMATION. Under the Class R Plan, the Funds may pay the Distributor for its distribution-related expenses with respect to Class R shares at an annual rate of up to .75% of the average daily net assets of Class R
shares. The Class R Plan provides that (1) up to .25% of the average daily net assets of the Class R shares may be used as a service fee and (2) total distribution fees (including the service fee of .25%) may not
exceed .75% of the average daily net assets of the Class R shares. The Prospectus discusses any contractual or voluntary fee waivers that may be in effect. The amounts received and spent by the Distributor are detailed
in the tables below.
| Payments Received by the Distributor | |||
| Conservative Allocation Fund | Moderate Allocation Fund | Growth Allocation Fund | |
| Class A Distribution and service (12b-1) fees | $210,607 | $470,218 | $263,809 |
| Class A Initial Sales Charges | $31,973 | $92,100 | $78,957 |
| Class A Contingent Deferred Sales Charges (CDSC’s) | $113 | $164 | $295 |
| Class B Distribution and service (12b-1) fees | $108,396 | $299,794 | $204,665 |
| Class B Contingent Deferred Sales Charges (CDSC’s) | $13,622 | $36,503 | $37,014 |
| Class C Distribution and service (12b-1) fees | $176,506 | $528,312 | $371,613 |
| Class C Contingent Deferred Sales Charges (CDSC’s) | $984 | $3,749 | $1,464 |
| Class R Distribution and service (12b-1) fees | $1,096 | $1,531 | $12 |
| Class X Distribution and service (12b-1) fees | $1,080 | $1,264 | $816 |
| Class X Contingent Deferred Sales Charges (CDSC’s) | None | None | None |
| Amounts Spent by Distributor | |||||
| Fund | Share Class | Printing & Mailing Prospectuses to Other than Current Shareholders | Compensation to Broker/Dealers for Commissions to Representatives and Other Expenses* | Overhead Costs ** | Total Amount Spent by Distributor |
| Conservative Allocation Fund | |||||
57
| Amounts Spent by Distributor | |||||
| Fund | Share Class | Printing & Mailing Prospectuses to Other than Current Shareholders | Compensation to Broker/Dealers for Commissions to Representatives and Other Expenses* | Overhead Costs ** | Total Amount Spent by Distributor |
| Class A | None | $206,384 | $73,775 | $280,159 | |
| Class B | $71 | $49,685 | $9,120 | $58,876 | |
| Class C | $113 | $174,168 | $14,574 | $188,855 | |
| Class R | None | $1,098 | $182 | $1,280 | |
| Class X | None | $196 | $73 | $269 | |
| Moderate Allocation Fund | |||||
| Class A | None | $404,948 | $220,622 | $625,570 | |
| Class B | $63 | $155,029 | $25,066 | $180,158 | |
| Class C | $112 | $522,484 | $43,661 | $566,257 | |
| Class R | None | $1,530 | $253 | $1,783 | |
| Class X | None | $1,117 | $147 | $1,264 | |
| Growth Allocation Fund | |||||
| Class A | None | $259,668 | $91,363 | $351,031 | |
| Class B | $63 | $112,595 | $17,120 | $129,778 | |
| Class C | $114 | $368,773 | $30,728 | $399,615 | |
| Class R | None | $12 | None | $12 | |
| Class X | None | $681 | $134 | $815 | |
* Includes amounts
paid to affiliated broker/dealers.
** Includes sales promotion expenses.
FEE
WAIVERS AND SUBSIDIES. PI may from time to time waive all or a portion of its management fee and subsidize all or a portion of the operating expenses of the Funds. In addition, the Distributor may from time to
time waive a portion of the distribution and service (12b-1) fees as described in the Prospectus. Fee waivers and subsidies will increase the Funds' total return.
PAYMENTS TO FINANCIAL
SERVICES FIRMS. As described in the Funds' Prospectus, the Manager or certain of its affiliates (but not the Distributor) have entered into revenue sharing or other similar arrangements with financial
services firms, including affiliates of the Manager. These revenue sharing arrangements are intended to promote the sale of Fund shares or to compensate the financial services firms for marketing or marketing support
activities in connection with the sale of Fund shares.
The
list below includes the names of the firms (or their affiliated broker/dealers) that received from the Manager, and/or certain of its affiliates, revenue sharing payments of more than $10,000 in calendar year 2011 for
marketing and product support of the Funds and other Prudential Investments funds as described above.
| ■ | 1st Global |
| ■ | ADP Retirement Services |
| ■ | AIG Advisors Group |
| ■ | American Enterprise Investment |
| ■ | American United Life Insurance |
| ■ | Ameriprise |
| ■ | Ascensus IO Business |
| ■ | AXA Equitable Life Insurance Company |
| ■ | Charles Schwab One Source |
| ■ | CitiStreet LLC |
| ■ | Commonwealth |
| ■ | CPI Qualified Plan Consultants |
| ■ | Daily Access |
| ■ | Diversified Investment Advisors—Target |
| ■ | Expert Plan |
| ■ | Fidelity IIOC |
| ■ | Fidelity NTF |
| ■ | Genworth Life & Annuity Insurance Company |
Target
Asset Allocation Funds 58
| ■ | GWFS |
| ■ | Hartford Life Insurance Company |
| ■ | Hartford Securities Distribution |
| ■ | Hewitt |
| ■ | Hewitt Associates LLC |
| ■ | ING Cetera (FNIC) |
| ■ | ING Cetera (Multi Financial) |
| ■ | ING Financial Partners |
| ■ | John Hancock Life Insurance Company |
| ■ | JP Morgan Chase Bank / TIAA-CREF |
| ■ | JP Morgan RPS |
| ■ | Lincoln Financial |
| ■ | LPL Marketing |
| ■ | Massachusetts Mutual Life Insurance Company |
| ■ | Matrix Settlement & Clearing |
| ■ | Mercer HR Services—JD |
| ■ | Merrill Lynch (Benchmark) |
| ■ | Merrill Lynch (New Sales) |
| ■ | Merrill Lynch RG |
| ■ | MidAtlantic (Sungard) |
| ■ | MSSB ADP |
| ■ | MSSB Revenue Share |
| ■ | MSSB SS |
| ■ | MSSB Trak NAV |
| ■ | Nationwide Trust Company |
| ■ | New York Life (Large) |
| ■ | Newport Group |
| ■ | Ohio National Life Insurance |
| ■ | Oppenheimer (Assets) |
| ■ | Oppenheimer (Sales) |
| ■ | Princeton (MFS) |
| ■ | Princeton Service Fees |
| ■ | Principal Financial—Level 3 |
| ■ | Raymond James |
| ■ | RBC Wealth Management |
| ■ | Reliance Trust |
| ■ | Securities America Inc. |
| ■ | Security Benefit Life Insurance Company |
| ■ | Standard Insurance Company |
| ■ | State Street Bank & Trust |
| ■ | T. Rowe Price |
| ■ | TD Ameritrade |
| ■ | UBS Marketing Support (Assets) |
| ■ | UBS Marketing Support (Sales) |
| ■ | UBS Wrap |
| ■ | United Planners |
| ■ | UVEST |
| ■ | Vanguard Fiduciary Trust Company |
| ■ | Wells Fargo Advisors |
| ■ | Wells Fargo Retirement Group |
| ■ | Wilmington Trust |
59
COMPUTATION OF
OFFERING PRICE PER SHARE
Using the net asset value at July 31, 2012, the offering prices of Fund shares were as follows:
| Offering Price Per Share | |||
| Conservative Allocation Fund | Moderate Allocation Fund | Growth Allocation Fund | |
| Class A | |||
| NAV and redemption price per Class A share | $10.69 | $11.23 | $11.44 |
| Maximum initial sales charge | .62 | .65 | .67 |
| Maximum offering price to public | $11.31 | $11.88 | $12.11 |
| Class B | |||
| NAV, offering price and redemption price per Class B share | $10.54 | $11.17 | $10.45 |
| Class C | |||
| NAV, offering price and redemption price per Class C share | $10.54 | $11.17 | $10.46 |
| Class R | |||
| NAV, offering price and redemption price per Class R share | $10.67 | $11.21 | $11.35 |
| Class X | |||
| NAV, offering price and redemption price per Class X share | $10.54 | $11.22 | $10.66 |
| Class Z | |||
| NAV, offering price and redemption price per Class Z share | $10.75 | $11.24 | $11.76 |
PORTFOLIO
TRANSACTIONS & BROKERAGE
The Funds have adopted
a policy pursuant to which the Funds and their Manager, Subadvisers and principal underwriter are prohibited from directly or indirectly compensating a broker-dealer for promoting or selling Fund shares by directing
brokerage transactions to that broker. Each Fund has adopted procedures for the purpose of deterring and detecting any violations of the policy. The policy permits the Funds, the Manager and the Subadvisers to use
selling brokers to execute transactions in portfolio securities so long as the selection of such selling brokers is the result of a decision that executing such transactions is in the best interest of the Funds and is
not influenced by considerations about the sale of Fund shares. For purposes of this section, the term “Manager” includes the Subadvisers.
The Manager is
responsible for decisions to buy and sell securities, futures contracts and options on such securities and futures for the Funds, the selection of brokers, dealers and futures commission merchants to effect the
transactions and the negotiation of brokerage commissions, if any. On a national securities exchange, broker-dealers may receive negotiated brokerage commissions on Fund portfolio transactions, including options,
futures, and options on futures transactions and the purchase and sale of underlying securities upon the exercise of options. On a foreign securities exchange, commissions may be fixed. Orders may be directed to any
broker or futures commission merchant including, to the extent and in the manner permitted by applicable laws, one of the Manager's affiliates (an affiliated broker). Brokerage commissions on U.S. securities, options
and futures exchanges or boards of trade are subject to negotiation between the Manager and the broker or futures commission merchant.
In the OTC market,
securities are generally traded on a “net” basis with dealers acting as principal for their own accounts without a stated commission, although the price of the security usually includes a profit to the
dealer. In underwritten offerings, securities are purchased at a fixed price which includes an amount of compensation to the underwriter, generally referred to as the underwriter's concession or discount. On occasion,
certain money market instruments and U.S. Government agency securities may be purchased directly from the issuer, in which case no commissions or discounts are paid. The Funds will not deal with an affiliated broker in
any transaction in which an affiliated broker acts as principal except in accordance with the rules of the SEC.
In placing orders for
portfolio securities of the Funds, the Manager's overriding objective is to obtain the best possible combination of favorable price and efficient execution. The Manager seeks to effect such transaction at a price and
commission that provides the most favorable total cost of proceeds reasonably attainable in the circumstances. The factors that the Manager may consider in selecting a
Target
Asset Allocation Funds 60
particular broker, dealer or futures commission merchant (firms) are the Manager's knowledge of negotiated commission rates currently available and other current transaction costs; the nature of the
portfolio transaction; the size of the transaction; the desired timing of the trade; the activity existing and expected in the market for the particular transaction; confidentiality; the execution, clearance and
settlement capabilities of the firms; the availability of research and research-related services provided through such firms; the Manager's knowledge of the financial stability of the firms; the Manager's knowledge of
actual or apparent operational problems of firms; and the amount of capital, if any, that would be contributed by firms executing the transaction. Given these factors, the Funds may pay transaction costs in excess of
that which another firm might have charged for effecting the same transaction.
When the Manager
selects a firm that executes orders or is a party to portfolio transactions, relevant factors taken into consideration are whether that firm has furnished research and research-related products and/or services, such as
research reports, research compilations, statistical and economic data, computer databases, quotation equipment and services, research-oriented computer software and services, reports concerning the performance of
accounts, valuations of securities, investment-related periodicals, investment seminars and other economic services and consultations. Such services are used in connection with some or all of the Manager's investment
activities; some of such services, obtained in connection with the execution of transactions for one investment account, may be used in managing other accounts, and not all of these services may be used in connection
with the Funds. The Manager maintains an internal allocation procedure to identify those firms who have provided it with research and research-related products and/or services, and the amount that was provided, and to
endeavor to direct sufficient commissions to them to ensure the continued receipt of those services that the Manager believes provide a benefit to the Funds and their other clients. The Manager makes a good faith
determination that the research and/or service is reasonable in light of the type of service provided and the price and execution of the related portfolio transactions.
When
the Manager deems the purchase or sale of equities to be in the best interests of the Funds or their other clients, including Prudential, the Manager may, but is under no obligation to, aggregate the transactions in
order to obtain the most favorable price or lower brokerage commissions and efficient execution. In such event, allocation of the transactions, as well as the expenses incurred in the transaction, will be made by the
Manager in the manner it considers to be most equitable and consistent with its fiduciary obligations to clients. The allocation of orders among firms and the commission rates paid are reviewed periodically by the
Funds' Board. Portfolio securities may not be purchased from any underwriting or selling syndicate of which any affiliate, during the existence of the syndicate, is a principal underwriter (as defined in the 1940 Act),
except in accordance with rules of the SEC. This limitation, in the opinion of the Funds, will not significantly affect the Funds' ability to pursue their present investment objectives. However, in the future in other
circumstances, the Funds may be at a disadvantage because of this limitation in comparison to other funds with similar objectives but not subject to such limitations.
Subject to the above
considerations, an affiliate may act as a broker or futures commission merchant for the Funds. In order for an affiliate of the Manager to effect any portfolio transactions for the Funds, the commissions, fees or other
remuneration received by the affiliated broker must be reasonable and fair compared to the commissions, fees or other remuneration paid to other firms in connection with comparable transactions involving similar
securities or futures being purchased or sold on an exchange or board of trade during a comparable period of time. This standard would allow the affiliated broker to receive no more than the remuneration which would be
expected to be received by an unaffiliated firm in a commensurate arm's-length transaction. Furthermore, the Board, including a majority of the Independent Board Members, has adopted procedures which are reasonably
designed to provide that any commissions, fees or other remuneration paid to the affiliated broker (or any affiliate) are consistent with the foregoing standard. In accordance with Section 11(a) of the 1934 Act, an
affiliate may not retain compensation for effecting transactions on a national securities exchange for the Funds unless the Funds have expressly authorized the retention of such compensation. The affiliate must furnish
to the Funds at least annually a statement setting forth the total amount of all compensation retained by the affiliate from transactions effected for the Funds during the applicable period. Brokerage transactions with
an affiliated broker are also subject to such fiduciary standards as may be imposed upon the affiliate by applicable law. Transactions in options by the Funds will be subject to limitations established by each of the
exchanges governing the maximum number of options which may be written or held by a single investor or group of investors acting in concert, regardless of whether the options are written or held on the same or
different exchanges or are written or held in one or more accounts or through one or more brokers. Thus, the number of options which the Funds may write or hold may be affected by options written or held by the Manager
and other investment advisory clients of the Manager. An exchange may order the liquidation of positions found to be in excess of these limits, and it may impose certain other sanctions.
Set forth below is
information concerning the payment of commissions by the Funds, including the amount of such commissions paid to any affiliate for the indicated fiscal years or periods:
61
| Conservative Allocation Fund | |||
| 2012 | 2011 | 2010 | |
| Total brokerage commissions paid by the Fund | $40,235 | $65,380 | $173,328 |
| Total brokerage commissions paid to affiliated brokers | None | None | None |
| Percentage of total brokerage commissions paid to affiliated brokers | 0.00% | 0.00% | 0.00% |
| Percentage of the aggregate dollar amount of portfolio transactions involving the payment of commissions to affiliated brokers | 0.00% | 0.00% | 0.00% |
| Moderate Allocation Fund | |||
| 2012 | 2011 | 2010 | |
| Total brokerage commissions paid by the Fund | $134,391 | $209,091 | $280,451 |
| Total brokerage commissions paid to affiliated brokers | None | None | None |
| Percentage of total brokerage commissions paid to affiliated brokers | 0.00% | 0.00% | 0.00% |
| Percentage of the aggregate dollar amount of portfolio transactions involving the payment of commissions to affiliated brokers | 0.00% | 0.00% | 0.00% |
| Growth Allocation Fund | |||
| 2012 | 2011 | 2010 | |
| Total brokerage commissions paid by the Fund | $123,679 | $192,299 | $263,029 |
| Total brokerage commissions paid to affiliated brokers | None | None | None |
| Percentage of total brokerage commissions paid to affiliated brokers | 0.00% | 0.00% | 0.00% |
| Percentage of the aggregate dollar amount of portfolio transactions involving the payment of commissions to affiliated brokers | 0.00% | 0.00% | 0.00% |
The Funds are
required to disclose their holdings of securities of their regular brokers and dealers (as defined under Rule 10b-1 under the 1940 Act) and their parents as of the most recently completed fiscal year. As of the most
recently completed fiscal year, the Funds held the following securities of their regular brokers and dealers.
| Broker-Dealer Securities Holdings ($) (as of most recently completed fiscal year) | |||
| Fund Name | Broker/Dealer Name | Equity (E)/Debt (D) | Amount (000’s) |
| Conservative Allocation Fund | |||
| Goldman Sachs & Co. | D | $1,782 | |
| Citigroup Global Markets, Inc. | D | $1,543 | |
| J.P. Morgan Chase & Co. | D | $1,470 | |
| Barclays Investments, Inc. | D | $1,032 | |
| Banc of America Securities LLC | D | $821 | |
| Morgan Stanley | D | $696 | |
| RBS Securities, Inc. | D | $626 | |
| UBS Securities LLC | D | $443 | |
| J.P. Morgan Chase & Co. | E | $475 | |
| Citigroup Global Markets, Inc. | E | $248 | |
| Banc of America Securities LLC | E | $152 | |
| Goldman Sachs & Co. | E | $71 | |
| Jefferies & Company, Inc. | E | $3 | |
| Moderate Allocation Fund | |||
| J.P. Morgan Chase & Co. | D | $3,359 | |
| Banc of America Securities LLC | D | $1,501 | |
| Barclays Investments, Inc. | D | $1,457 | |
| RBS Securities, Inc. | D | $1,149 | |
| Morgan Stanley | D | $696 | |
| UBS Securities LLC | D | $554 | |
| Goldman Sachs & Co. | D | $542 | |
| J.P. Morgan Chase & Co. | E | $1,397 | |
Target
Asset Allocation Funds 62
| Broker-Dealer Securities Holdings ($) (as of most recently completed fiscal year) | |||
| Fund Name | Broker/Dealer Name | Equity (E)/Debt (D) | Amount (000’s) |
| Citigroup Global Markets, Inc. | E | $692 | |
| Banc of America Securities LLC | E | $433 | |
| Goldman Sachs & Co. | E | $212 | |
| UBS Securities LLC | E | $98 | |
| Barclays Investments, Inc. | E | $84 | |
| Deutsche Bank Securities, Inc. | E | $70 | |
| Jefferies & Company, Inc. | E | $30 | |
| Growth Allocation Fund | |||
| J.P. Morgan Chase & Co. | E | $1,382 | |
| Citigroup Global Markets, Inc. | E | $725 | |
| Banc of America Securities LLC | E | $450 | |
| Goldman Sachs & Co. | E | $182 | |
| Barclays Investments, Inc. | E | $113 | |
| UBS Securities LLC | E | $104 | |
| Deutsche Bank Securities, Inc. | E | $70 | |
| Credit Suisse Securities (USA) LLC | E | $37 | |
| Jefferies & Company, Inc. | E | $32 | |
63
ADDITIONAL
INFORMATION
FUND HISTORY. Target Asset Allocation Funds (the “Trust”) was organized as a Delaware statutory trust on July 29, 1998 under the name “Prudential Diversified Funds.” On September
4, 2001, the Trust amended its Certificate of Trust, changing its name to “Strategic Partners Asset Allocation Funds.” On September 29, 2006, the Trust further amended its Certificate of Trust, changing its
name to “Target Asset Allocation Funds.”
DESCRIPTION OF SHARES AND ORGANIZATION. The Trust is authorized to issue an unlimited number of shares of beneficial interest, $.001 par value per share, divided into three series (the Funds). Each Fund is divided into six
classes, designated Class A, Class B, Class C, Class R, Class X and Class Z shares. Each class of shares represents an interest in the same assets of the Fund and is identical in all respects except that (1) each class
is subject to different sales charges and distribution and/or service fees (except for Class Z shares, which are not subject to any sales charges or distribution and/or service fees), which may affect performance, (2)
each class has exclusive voting rights on any matter submitted to shareholders that relates solely to its arrangement and has separate voting rights on any matter submitted to shareholders in which the interests of one
class differ from the interests of any other class, (3) each class has a different exchange privilege, (4) Class B and Class X shares have a conversion feature and (5) Class R and Class Z shares are offered exclusively
for sale to a limited group of investors. In accordance with the Trust’s Agreement and Declaration of Trust, the Board Members may authorize the creation of additional series and classes within such series, with
such preferences, privileges, limitations and voting and dividend rights as the Board Members may determine. The voting rights of the shareholders of a series or class can be modified only by the vote of shareholders
of that series or class.
Shares of each Fund,
when issued, are fully paid, nonassessable, fully transferable and redeemable at the option of the holder. Shares are also redeemable at the option of the Trust under certain circumstances. Each share of each class is
equal as to earnings, assets and voting privileges, except as noted above, and each class of shares (with the exception of Class Z shares, which are not subject to any distribution or service fees) bears the expenses
related to the distribution of its shares. Except for the conversion feature applicable to the Class B and Class X shares, there are no conversion, preemptive or other subscription rights. In the event of liquidation,
each share of a Fund is entitled to its portion of all of the Fund’s assets after all debt and expenses of the Fund have been paid. Since Class B, Class C and Class X shares generally bear higher distribution
expenses than Class A and Class R shares, the liquidation proceeds to shareholders of those classes are likely to be lower than to Class A and Class R shareholders and to Class Z shareholders, whose shares are not
subject to any distribution and/or service fees.
The Trust does not
intend to hold annual meetings of shareholders unless otherwise required by law. The Trust will not be required to hold meetings of shareholders unless, for example, the election of Board Members is required to be
acted on by shareholders under the 1940 Act. Shareholders have certain rights, including the right to call a meeting upon the vote of 10% of the Fund’s outstanding shares for the purpose of voting on the removal
of one or more Board Members or to transact any other business. The Trust will render assistance to those shareholders who call such a meeting.
Under the Agreement
and Declaration of Trust, the Board may authorize the creation of additional series of shares (the proceeds of which would be invested in separate, independently managed portfolios with distinct investment objectives
and policies and share purchase, redemption and NAV procedures) with such preferences, privileges, limitations and voting and dividend rights as the Board Members may determine. All consideration received by the Trust
for shares of any additional series, and all assets in which such consideration is invested, would belong to that series (subject only to the rights of creditors of that series) and would be subject to the liabilities
related thereto.
The Board has the
power to alter the number and the terms of office of the Board Members, provided that at all times at least a majority of the Board Members have been elected by the shareholders of the Trust. The voting rights of
shareholders are not cumulative, so that holders of more than 50 percent of the shares voting can, if they choose, elect all Board Members being selected, while the holders of the remaining shares would be unable to
elect any Board Members.
Target
Asset Allocation Funds 64
PRINCIPAL
SHAREHOLDERS AND CONTROL PERSONS
To the knowledge of
the Funds, the following persons/entities owned beneficially or of record 5% or more of any class of Fund shares as of the date indicated:
| Prinicipal Fund Shareholders (as of September 12, 2012) | ||||
| Fund Name | Shareholder Name | Address | Share Class | No. of Shares/ % of Fund |
| Target Conservative Allocation Fund | Special Custody Account For The Exclusive Benefit Of Customers | 2801 Market Street Saint Louis, MO 63103 | A | 2,201,149 / 28.03% |
| Special Custody Account For The Exclusive Benefit Of Customers | 2801 Market Street Saint Louis, MO 63103 | B | 229,185 / 31.16% | |
| Special Custody Account For The Exclusive Benefit Of Customers | 2801 Market Street Saint Louis, MO 63103 | C | 957,080 / 59.12% | |
| Morgan Stanley & Co | Harborside Financial Center Plaza II, 3rd Floor Jersey City, NJ 07311 | C | 163,349 / 10.09% | |
| Special Custody Account For The Exclusive Benefit Of Customers | 2801 Market Street Saint Louis, MO 63103 | Z | 105,939 / 33.28% | |
| Merrill Lynch, Pierce, Fenner & Smith Inc, For The Sole Benefit Of Its Customers | 4800 Deer Lake Dr E Jacksonville, FL 32246 | Z | 53,165 / 16.70% | |
| Pims/Prudential Retirement As Nominee For The TTEE/CUST Uchicago Argonne, LLC | 9700 S Cass Avenue Argonne, IL 60439 | Z | 38,621 / 12.13% | |
| Morgan Stanley & Co | Harborside Financial Center Plaza II,3rd Floor Jersey City, NJ 07311 | Z | 34,978 / 10.99% | |
| Clearview IRA C/F A James Baroody Jr | Pittsford, NY 14534 | Z | 17,887 / 5.62% | |
| Counsel Trust DBA Mid Atlantic Trust Company FBO Beehive Botanicals 401-K Plan | 1251 Waterfront Pl Pittsburgh, PA 15222 | Z | 16,938 / 5.32% | |
| Frontier Trust Company FBO Bent Marine, Inc 401K & P/S Plan | PO Box 10758 Fargo, ND 58106 | R | 12,128 / 55.38% | |
| Mid Atlantic Trust As Custodian FBO Virginia-Gilbert Family Dental PA 401K & PS Plan | 1251 Waterfront Place, Suite 525 Pittsburgh, PA 15222 | R | 8,983 / 41.02% | |
| BNYM I S Trust Co Cust Simple IRA Jerry W Hamil DBA The Water Guy Jerry W Hamil | Margaretville, NY 12455 | X | 2,398 / 27.88% | |
| UMB Bank, NA/CF Pleasant Valley SD-PA 403B FBO Charlene A Taylor | Effort, PA 18330 | X | 1,781 / 20.72% | |
| UMB Bank, NA C/F Pocono Mountain SD 403B FBO Patricia E Furey | East Stroudsburg, PA 18301 | X | 1,193 / 13.88% | |
| BNYM I S Trust Co Cust Simple IRA Global Imaging Inc NDFI Sim -IRA Kenneth N Kessler | Louisville, CO 80027 | X | 1,086 / 12.64% | |
| UMB Bank, NA C/F Northern Lehigh SD 403B FBO Suzanne E Tobing | Northampton, PA 18067 | X | 783 / 9.11% | |
| BNYM I S Trust Co Cust Simple IRA Salon Vizions By Vizza Inc John D Vizza | Johnstown, PA 15905 | X | 712 / 8.29% | |
| Target Moderate Allocation Fund | Special Custody Account For The Exclusive Benefit Of Customers | 2801 Market Street Saint Louis, MO 63103 | A | 4,376,132 / 29.88% |
| Special Custody Account For The Exclusive Benefit Of Customers | 2801 Market Street Saint Louis, MO 63103 | B | 801,918 / 36.08% | |
| Special Custody Account For The Exclusive Benefit Of Customers | 2801 Market Street Saint Louis, MO 63103 | C | 2,654,399 / 59.37% | |
| Merrill Lynch, Pierce, Fenner & Smith For The Sole Benefit Of Its Customers | 4800 Deer Lake Dr E Jacksonville, Fl 32246-6484 | C | 347,057 / 7.76% | |
| Morgan Stanley & Co | Harborside Financial Center Plaza II, 3rd Floor Jersey City, NJ 07311 | C | 256,864 / 5.75% | |
| Frontier Trust Company FBO Bent Marine, Inc 401(K) & P/S Plan | P.O. Box 10758 Fargo, ND 58106 | R | 27,653 / 99.17% | |
| Special Custody Account For The Exclusive Benefit Of Customers | 2801 Market Street Saint Louis, MO 63103 | Z | 186,377 / 62.68% | |
65
| Prinicipal Fund Shareholders (as of September 12, 2012) | ||||
| Fund Name | Shareholder Name | Address | Share Class | No. of Shares/ % of Fund |
| Merrill Lynch, Pierce, Fenner & Smith For The Sole Benefit Of Its Customers | 4800 Deer Lake Dr E Jacksonville, Fl 32246-6484 | Z | 28,105 / 9.45% | |
| Councel Trust DBA MID Atlantic Trust Company FBO Beehive Botanicals 401K Plan | 1251 Waterfront Pl Pittsburgh, PA 15222 | Z | 23,472 / 7.89% | |
| PIMS/Prudential Retirement As Nominee For The TTEE Uchicago Argonne, LLC | 9700 Cass Avenue Argonne, IL 60439 | Z | 18,313 / 6.16% | |
| Prudential Trust Company C/F The Rollover IRA Of David S Sitner | East Hampton, CT 06424 | X | 14,340 / 44.55% | |
| Prudential Trust Company C/F The Roth IRA Of Randi F Cornaglia | S Glastonbury, CT 06073 | X | 1,873 / 5.82% | |
| Target Growth Allocation Fund | Special Custody Account For The Exclusive Benefit Of Customers | 2801 Market Street Saint Louis, MO 63103 | A | 2,905,440 / 32.21% |
| Special Custody Account For The Exclusive Benefit Of Customers | 2801 Market Street Saint Louis, MO 63103 | B | 523,828 / 30.75% | |
| Special Custody Account For The Exclusive Benefit Of Customers | 2801 Market Street Saint Louis, MO 63103 | C | 1,819,934 / 54.85% | |
| Morgan Stanley & Co | Harborside Financial Center Plaza II, 3rd Floor Jersey City, NJ 07311 | C | 200,507 / 6.04% | |
| Prudential Investment Mgmt, Inc Prudential Investments Fund Management LLC | 100 Mulberrry Street, Fl 14 Newark, NJ 07102 | R | 215 / 100.00% | |
| BNYM I S Trust Co Cust Simple IRA Rusdal Construction Jill M Rusdal | PO Box 2356 GIG Harbor, WA 98335 | X | 1,654 / 11.40% | |
| BNYM I S Trust Co Cust Simple IRA Rusdal Construction George F Rusdal | PO Box 2356 GIG Harbor, WA 98335 | X | 1,654 / 11.40% | |
| UMA Bank, NA C/F Parkland School District 403B Ryan J Nunamaker | Macungie, PA 18062 | X | 1,086 / 7.48% | |
| UMB Bank, NA C/F Nazareth Area SD 403B FBO Rex W Lutz | Easton, PA 18040 | X | 1,082 / 7.46% | |
| Prudential Trust Company C/F The 403B Plan Of Sandra Y Yamamoto | Thornton, CO 80241 | X | 867 / 5.98% | |
| BNYM I S Trust Co Cust Simple IRA Once Upon A Bagel Stephen B Geffen | Northbrook, IL 60062 | X | 794 / 5.48% | |
| Special Custody Account For The Exclusive Benefit Of Customers | 2801 Market Street Saint Louis, MO 63103 | Z | 122,086 / 69.55% | |
| Counsel Trust DBA MID Atlantic Trust Company FBO Beehive Botanicals 401-K Plan | 1251 WaterFront Pl Pittsburgh, PA 15222 | Z | 14,579 / 8.31% | |
| PIMS/Prudential Retirement As Nominee For The TTEE Uchicago Argonne, LLC | 9700 S Cass Ave Argonne, IL 60439 | Z | 13,670 / 7.79% | |
As of the date of
this SAI, the Board Members and Officers of the Funds, as a group, owned less than 1% of the outstanding shares of the Funds.
FINANCIAL
STATEMENTS
The
financial statements for Target Asset Allocation Funds for the fiscal year ended July 31, 2012 incorporated in this SAI by reference to the 2011 annual report to shareholders (File No. 811-08915), have been derived
from our financial statements that were audited by KPMG LLP, an independent registered public accounting firm. You may obtain a copy of the annual report at no charge by request to the Funds by calling (800) 225-1852
or by writing to Prudential Mutual Fund Services LLC, P.O. Box 9658, Providence, RI 02940.
Target
Asset Allocation Funds 66
PART II
PURCHASE,
REDEMPTION AND PRICING OF FUND SHARES
SHARE CLASSES. The Funds may offer shares of one or more classes to investors. Not every share class described in this SAI may be offered, and investors should consult their Prospectus for specific
information concerning the share classes that are available to them.
Shares of the Funds
may be purchased at a price equal to the next determined NAV per share plus a sales charge (if applicable) which, at the election of the investor, may be imposed either (1) at the time of purchase (Class A shares) or
(2) on a deferred basis (Class B and Class C shares or Class A shares, in certain circumstances). Class R, Class Y and Class Z shares, if offered, are offered only to a limited group of investors at NAV without any
sales charges.
Additional or different classes of shares may also be offered, including Class F, Class I, Class Q, Class R and Class X shares. If offered, specific information with respect to these share classes is set
forth in the Prospectus and SAI.
For more information,
see “How to Buy, Sell and Exchange Fund Shares —How to Buy Shares” in the Prospectus.
PURCHASE BY WIRE. For an initial purchase of shares of the Funds by wire, you must complete an application and telephone PMFS at (800) 225-1852 (toll-free) to receive an account number. PMFS will request
the following information: your name, address, tax identification number, Fund name, class election (if applicable), dividend distribution election, amount being wired and wiring bank. PMFS will also furnish you with
instructions for wiring the funds from your bank to the Funds' Custodian.
If
you arrange for receipt by the Custodian of federal funds prior to the calculation of NAV (once each business day at the close of regular trading on the NYSE, usually 4:00 p.m. Eastern time), on a business day, you may
purchase shares of the Funds as of that day. In the event that regular trading on the NYSE closes before 4:00 p.m. Eastern time, you will receive the following day's NAV if your order to purchase is received after the
close of regular trading on the NYSE.
In making a
subsequent purchase order by wire, you should wire the Funds' Custodian directly and should be sure that the wire specifies the Fund name, the share class to be purchased, your name, individual account number, Direct
Deposit Account (DDA) Number and the Fund's Bank Account registration. You do not need to call PMFS to make subsequent purchase orders utilizing federal funds. The minimum amount for subsequent purchase by wire is $100.
ISSUANCE OF FUND SHARES
FOR SECURITIES. Transactions involving the issuance of Fund shares for securities (rather than cash) will be limited to (1) reorganizations, (2) statutory mergers, or (3) other acquisitions of portfolio
securities that: (a) meet the investment objectives and policies of the Funds, (b) are liquid and not subject to restrictions on resale, (c) have a value that is readily ascertainable via listing on or trading in a
recognized United States or international exchange or market, and (d) are approved by the Funds' Manager.
MULTIPLE ACCOUNTS. An institution may open a single master account by filing an application with PMFS, signed by personnel authorized to act for the institution. Individual subaccounts may be opened at the
time the master account is opened by listing them, or they may be added at a later date by written advice. Procedures will be available to identify subaccounts by name and number within the master account name. The
foregoing procedures would also apply to related institutional accounts (i.e., accounts of shareholders with a common institutional or corporate parent). The investment minimums as set forth in the relevant Prospectus
under “How to Buy and Sell Fund Shares—How to Buy Shares” are applicable to the aggregate amounts invested by a group, and not to the amount credited to each subaccount.
REOPENING AN ACCOUNT. Subject to the minimum investment restrictions, an investor may reopen an account, without filing a new application, at any time during the calendar year the account is closed, provided
that the information on that application is still applicable.
RESTRICTIONS ON SALE OF
FUND SHARES. The Funds may suspend the right of redemption or postpone the date of payment for a period of up to seven days. Suspensions or postponements may not exceed seven days except at times (1)
when the the NYSE is closed for other than customary weekends and holidays, (2) when trading on the NYSE is restricted, (3) when an emergency exists as a result of which disposal by the Funds of securities owned by it
the Funds not reasonably practicable or it is not reasonably practicable for the Funds fairly to determine the value of their net assets, or (4) during any other period when the SEC, by order, so permits; provided that
applicable rules and regulations of the SEC shall govern as to whether the conditions prescribed in (2), (3) or (4) exist.
67
REDEMPTION IN KIND. The Funds may pay the redemption price in whole or in part by a distribution in kind of securities from the investment portfolio of the Funds, in lieu of cash, in conformity with
applicable rules of the SEC and procedures adopted by the Board. Securities will be readily marketable and will be valued in the same manner as in a regular redemption. If your shares are redeemed in kind, you would
incur transaction costs in converting the assets into cash. The Funds, however, have elected to be governed by Rule 18f-1 under the 1940 Act, under which the Funds are obligated to redeem shares solely in cash up to
the lesser of $250,000 or 1% of the NAV of the Funds during any 90-day period for any one shareholder.
RIGHTS OF ACCUMULATION. Reduced sales charges are also available through Rights of Accumulation, under which an investor or an eligible group of related investors, as described under “Reducing or Waiving
Class A's Initial Sales Charge” in the Prospectus, may aggregate the value of their existing holdings of shares of the Fund and shares of other Prudential Investments mutual funds (excluding money market funds
other than those acquired pursuant to the exchange privilege) to determine the reduced sales charge. However, the value of shares held directly with PMFS and through your broker will not be aggregated to determine the
reduced sales charge. The value of existing holdings for purposes of determining the reduced sales charge is calculated using the maximum offering price (NAV plus maximum sales charge). The Distributor, your broker or
PMFS must be notified at the time of purchase that the investor is entitled to a reduced sales charge. Reduced sales charges will be granted subject to confirmation of the investor's holdings. This does not apply to
Prudential MoneyMart Assets, Inc.
SALE
OF SHARES. You can redeem your shares at any time for cash at the NAV next determined after the redemption request is received in proper form (in accordance with procedures established by PMFS in
connection with investors' accounts) by PMFS, the Distributor or your broker. See “Net Asset Value” below. In certain cases, however, redemption proceeds will be reduced by the amount of any applicable
contingent deferred sales charge (CDSC), as described in “Contingent Deferred Sales Charge” below. If you are redeeming your shares through a broker, your broker must receive your sell order before the
Funds compute their NAV for that day (at the close of regular trading on the NYSE, usually, 4:00 p.m. Eastern time) in order to receive that day's NAV. In the event that regular trading on the NYSE closes before 4:00
p.m. Eastern time, you will receive the following day's NAV if your order to sell is received after the close of regular trading on the NYSE. Your broker will be responsible for furnishing all necessary documentation
to the Distributor and may charge you for its services in connection with redeeming shares of the Funds.
All correspondence
and documents concerning redemptions should be sent to the Funds in care of PMFS, P.O. Box 9658, Providence, Rhode Island 02940, to the Distributor or to your broker.
If you hold shares in
non-certificate form, a written request for redemption signed by you exactly as the account is registered is required. If you hold certificates, the certificates must be received by PMFS, the Distributor or your broker
in order for the redemption request to be processed. If redemption is requested by a corporation, partnership, trust or fiduciary, written evidence of authority acceptable to PMFS must be submitted before such request
will be accepted. All correspondence and documents concerning redemptions should be sent to the Funds in care of PMFS, P.O. Box 9658, Providence, RI 02940, to the Distributor or to your broker.
Payment for
redemption of recently purchased shares will be delayed until the Funds or PMFS has been advised that the purchase check has been honored, which may take up to 7 calendar days from the time of receipt of the purchase
check by PMFS. Such delay may be avoided by purchasing shares by wire or by certified or cashier's check.
SIGNATURE GUARANTEE. If the proceeds of the redemption (1) exceed $100,000, (2) are to be paid to a person other than the record owner, (3) are to be sent to an address other than the address on PMFS’
records, (4) are to be paid to a corporation, partnership, trust or fiduciary, or (5) are to be paid due to the death of the shareholder or on behalf of the shareholder, and your shares are held directly with PMFS, the
signature(s) on the redemption request or stock power must be medallion signature guaranteed. The medallion signature guarantee must be obtained from an authorized officer of a bank, broker, dealer, securities exchange
or association, clearing agency, savings association, or credit union that is participating in one of the recognized medallion programs (STAMP, SEMP, or NYSE MSP). The medallion signature guarantee must be appropriate
for the dollar amount of the transaction. PMFS reserves the right to reject transactions where the value of the transaction exceeds the value of the surety coverage indicated on the medallion imprint. PMFS also
reserves the right to request additional information from, and make reasonable inquires of, any institution that provides a medallion signature guarantee. In the case of redemptions from a PruArray Plan, if the
proceeds of the redemption are invested in another investment option of the plan in the name of the record holder and at the same address as reflected in PMFS's records, a medallion signature guarantee is not required.
Payment for shares
presented for redemption will be made by check within seven days after receipt by PMFS, the Distributor or your broker of the written request and certificates, if issued, except as indicated below. If you hold shares
through a broker, payment for shares presented for redemption will be credited to your account at your broker, unless you indicate otherwise. Such payment may be postponed or the right of redemption suspended at times
(1) when the NYSE is closed for other than customary weekends and holidays, (2) when trading on the NYSE is restricted, (3) when an emergency exists as a result of which disposal by the Fund of
Target
Asset Allocation Funds 68
securities owned by it is not reasonably practicable or it is not reasonably practicable for the Funds fairly to determine the value of their net assets, or (4) during any other period when the SEC, by
order, so permits; provided that applicable rules and regulations of the SEC shall govern as to whether the conditions prescribed in (2), (3) or (4) exist.
EXPEDITED REDEMPTION PRIVILEGE. By electing the Expedited Redemption Privilege, you may arrange to have redemption proceeds sent to your bank account. The Expedited Redemption Privilege may be used to redeem shares in an
amount of $100 or more, except if an account for which an expedited redemption is requested has a net asset value of less than $100, the entire account will be redeemed. Redemption proceeds in the amount of $500 or
more will be remitted by wire to your bank account at a domestic commercial bank which is a member of the Federal Reserve system. The money would generally be received by your bank within one business day of the
redemption. Redemption proceeds of less than $500 will be sent by ACH to your bank which must be a member of the Automated Clearing House (ACH) system. The money would generally be received by your bank within three
business days of the redemption. Any applicable CDSC will be deducted from the redemption proceeds. Expedited redemption requests may be made by telephone or letter, must be received by the Funds prior to 4:00 p.m.
Eastern time to receive a redemption amount based on that day's NAV and are subject to the terms and conditions as set forth in the Prospectus regarding redemption of shares. In the event that regular trading on the
NYSE closes before 4:00 p.m. Eastern time, you will receive the following day's NAV if your order to sell is received after the close of regular trading on the NYSE. For more information, see “How to Buy, Sell
and Exchange Fund Shares-Telephone Redemptions or Exchanges” in the Prospectus. The Expedited Redemption Privilege may be modified or terminated at any time without notice. To receive further information,
shareholders should contact PMFS.
INVOLUNTARY REDEMPTION. If the value of your account with PMFS is less than $500 for any reason, we may sell the rest of your shares (without charging any CDSC) and close your account. The involuntary sale
provisions do not apply to: (i) an individual retirement account (IRA) or other qualified or tax-deferred retirement plan or account, (ii) Automatic Investment Plan (AIP) accounts, employee savings plan accounts or
payroll deduction plan accounts, (iii) accounts with the same registration associated with multiple share classes within the Fund, or (iv) clients with assets more than $50,000 across the Prudential Investments family
of mutual funds. “Client” for this purpose has the same definition as for purposes of Rights of Accumulation, i.e., an investor and an eligible group of related investors.
ACCOUNT MAINTENANCE FEE. In order to offset the disproportionate effect (in basis points) of expenses associated with servicing lower balance accounts, if the value of your account with PMFS is less than $10,000,
a $15 annual account maintenance fee (“account maintenance fee”) will be deducted from your account. The account maintenance fee will be assessed during the 4th calendar quarter of each year. Any applicable
CDSC on the shares redeemed to pay the account maintenance fee will be waived. The account maintenance fee will not be charged on: (i) accounts during the first six months from inception of the account, (ii) accounts
for which you have elected to receive your account statements, transaction confirmations, prospectuses, and fund shareholder reports electronically rather than by mail; (iii) omnibus accounts or other accounts for
which the dealer is responsible for recordkeeping, (iv) institutional accounts, (v) group retirement plans (including SIMPLE IRA plans, profit-sharing plans, money purchase pension plans, Keogh plans, defined
compensation plans, defined benefit plans and 401(k) plans), (vi) AIP accounts or employee savings plan accounts, (vii) accounts with the same registration associated with multiple share classes within the Fund,
provided that the aggregate value of share classes with the same registration within the Fund is $10,000 or more, or (viii) clients with assets of $50,000 or more across the Prudential Investments family of mutual
funds. “Client” for this purpose has the same definition as for purposes of Rights of Accumulation, i.e., an investor and an eligible group of related investors or other financial intermediary.
90 DAY REPURCHASE
PRIVILEGE. If you redeem your shares and have not previously exercised the repurchase privilege, you may reinvest back into your account any portion or all of the proceeds of such redemption in
shares of the Funds at the NAV next determined after the order is received, which must be within 90 days after the date of the redemption. Any CDSC paid in connection with such redemption in Class A, Class B or Class C
will be credited (in shares) to your account. (If less than a full repurchase is made, the credit will be on a pro rata basis.) You must notify PMFS, either directly or through the Distributor or your broker, at the
time the repurchase privilege is exercised to adjust your account for the CDSC you previously paid. Thereafter, any redemptions will be subject to the CDSC applicable at the time of the redemption. See
“Contingent Deferred Sales Charge” below. Exercise of the repurchase privilege will generally not affect federal tax treatment of any gain realized upon redemption. However, if the redemption was made
within a 30 day period of the repurchase and if the redemption resulted in a loss, some or all of the loss, depending on the amount reinvested, may not be allowed for federal income tax purposes.
CONTINGENT DEFERRED
SALES CHARGE (CDSC). Investors who purchase $1 million or more of Class A shares and sell these shares within 12 months of purchase are subject to a 1% CDSC. (Note: For Prudential Short-Term Corporate Bond Fund, Inc. only, investors who purchase $1 million or more of Class A shares and then sell these shares within 18 months of
purchase are subject to a 0.50% CDSC).
69
The Class A CDSC is
waived (i) for certain retirement and/or benefit plans, or (ii) if you purchase Class Z shares (see “Qualifying for Class Z Shares” in the Prospectus) within 5 days of redemption of your Class A shares that
you had purchased directly through the Fund's transfer agent. In the case of (ii), we will credit your account with the appropriate number of shares to reflect any CDSC you paid on the reinvested portion of your
redemption proceeds. Redemptions of Class B shares will be subject to a CDSC declining from 5% to zero over a six-year period (or a four-year period in the case of Prudential Short-Term Corporate Bond Fund, Inc.).
Class C shares redeemed within 12 months of purchase will be subject to a 1% CDSC. The CDSC will be deducted from the redemption proceeds and reduce the amount paid to you. The CDSC will be imposed on any redemption
that reduces the current value of your Class A, Class B or Class C shares to an amount which is lower than the amount of all payments by you for shares during the preceding 12 months in the case of Class A shares (in
certain cases), 6 years in the case of Class B shares (or four years in the case of Short-Term Corporate Bond Fund, Inc. Class B shares), and 12 months, in the case of Class C shares. A CDSC will be applied on the
lesser of the original purchase price or the current value of the shares being redeemed. Increases in the value of your shares or shares acquired through reinvestment of dividends or distributions are not subject to a
CDSC. The amount of any CDSC will be paid to and retained by the Distributor. If you purchased or hold your shares through a broker, third party administrator or other authorized entity that maintains subaccount
recordkeeping, any applicable CDSC that you will pay will be calculated and reported to PMFS by such broker, administrator or other authorized entity.
The amount of the
CDSC, if any, will vary depending on the number of years from the time of payment for the purchase of shares until the time of redemption of such shares. The CDSC will be calculated from the date of the initial
purchase, excluding the time shares were held in Class B, Class F or Class C shares of a money market fund. See “Shareholder Services—Exchange Privileges” below.
In determining
whether a CDSC is applicable to a redemption, the calculation will be made in a manner that results in the lowest possible rate. It will be assumed that the redemption is made first of amounts representing shares
acquired pursuant to the reinvestment of dividends and distributions; then of amounts representing the increase in NAV above the total amount of payments for the purchase of Class A shares made during the preceding 12
months (in certain cases), 6 years for Class B and Class F shares (four years in the case of Prudential Short-Term Corporate Bond Fund, Inc.) and 12 months for Class C shares; then of amounts representing the cost of
shares held beyond the applicable CDSC period; and finally, of amounts representing the cost of shares held for the longest period of time within the applicable CDSC period.
For example, assume
you purchased 100 Class B shares at $10 per share for a cost of $1,000. Subsequently, you acquired 5 additional Class B shares through dividend reinvestment. During the second year after the purchase you decided to
redeem $500 of your investment. Assuming at the time of the redemption the NAV had appreciated to $12 per share, the value of your Class B shares would be $1,260 (105 shares at $12 per share). The CDSC would not be
applied to the value of the reinvested dividend shares and the amount which represent appreciation ($260). Therefore, $240 of the $500 redemption proceeds ($500 minus $260) would be charged at a rate of 4% (the
applicable rate in the second year after purchase) for a total CDSC of $9.60.
For federal income
tax purposes, the amount of the CDSC will reduce the gain or increase the loss, as the case may be, on the amount recognized on the redemption of shares.
WAIVER OF
CDSC—CLASS B AND CLASS F SHARES. The CDSC will be waived in the case of a redemption following the death or disability of a shareholder or, in the case of a trust account, following the death or disability of the grantor.
The waiver is available for total or partial redemptions of shares owned by a person, either individually or in joint tenancy at the time of death or initial determination of disability, provided that the shares were
purchased prior to death or disability.
The CDSC will be
waived in the case of a total or partial redemption in connection with certain distributions under the Code from a tax-deferred retirement plan, an IRA or Section 403(b) custodial account. For more information, call
Prudential at (800) 353-2847.
For distributions
from an IRA or 403(b) Custodial Account, the shareholder must submit a copy of the distribution form from the custodial firm indicating (i) the date of birth of the shareholder and (ii) that the shareholder is over age
70 1∕2. The distribution form must be signed by the shareholder.
Finally, the CDSC
will be waived to the extent you exchange your shares for shares of other Prudential Investments mutual funds, The Guaranteed Investment Account, the Guaranteed Insulated Separate Account or units of The Stable Value
Fund. See “Shareholder Services—Exchange Privileges,” below, for more information regarding the Exchange Privilege.
SYSTEMATIC WITHDRAWAL
PLAN. The CDSC will be waived (or reduced) on certain redemptions effected through a Systematic Withdrawal Plan. On an annual basis, up to 12% of the total dollar amount subject to the CDSC may
be redeemed without charge. PMFS will calculate the total amount available for this waiver annually on the anniversary date of your purchase. The CDSC will be waived (or reduced) on redemptions until this threshold of
12% is reached. The Systematic Withdrawal Plan is not available to participants in certain retirement plans. Please contact PMFS at (800) 225-1852 for more details.
Target
Asset Allocation Funds 70
In addition, the CDSC
will be waived on redemptions of shares held by Board Members of the Funds.
You must notify PMFS
either directly or through your broker, at the time of redemption, that you are entitled to a waiver of the CDSC and provide PMFS or your broker with such supporting documentation as it may deem appropriate. The waiver
will be granted subject to confirmation of your entitlement.
PMFS reserves the
right to request such additional documents as it may deem appropriate.
WAIVER OF
CDSC—CLASS C SHARES. The CDSC will be waived for redemptions by certain group retirement plans for which Prudential or brokers not affiliated with Prudential provide administrative or record keeping services.
The CDSC will also be waived for certain redemptions by benefit plans sponsored by Prudential and its affiliates. For more information, call Prudential Retirement at (800) 353-2847.
AUTOMATIC CONVERSION OF CLASS B, CLASS F, AND CLASS X SHARES. Class B and Class F shares will automatically convert to Class A shares on a quarterly basis and Class X shares will automatically convert to Class A shares on a monthly basis
approximately seven years (five years in the case of Prudential Short-Term Corporate Bond Fund, Inc.), seven years, eight years and ten years, respectively, after purchase.
The number of Class
B, Class F, and Class X shares eligible to convert to Class A shares will be the total number of shares that have completed their Class B, Class F, and Class X aging schedule (including any time spent at 0% liability),
plus all shares acquired through the reinvestment of dividends for Class B and Class F shares and a proportionate number of shares acquired through reinvestment of dividends for Class X shares.
Since annual
distribution-related fees are lower for Class A shares than Class B, Class F, and Class X shares, the per share NAV of the Class A shares may be higher than that of the Class B, Class F, and Class X shares at the time
of conversion. Thus, although the aggregate dollar value will be the same, you may receive fewer Class A shares than Class B, Class F, and Class X shares converted.
For purposes of
calculating the applicable holding period for conversions, for Class B and Class F shares previously exchanged for shares of a money market fund, the time period during which such shares were held in a money market
fund will be excluded for the Class B and Class F shares. For example, Class B and Class F shares held in a money market fund for one year would not convert to Class A shares until approximately eight years. Class B
and Class F shares acquired through exchange will convert to Class A shares after expiration of the conversion period applicable to the original purchaser of such shares.
The
conversion feature may be subject to the continuing availability of opinions of counsel or rulings of the IRS (1) that the dividends and other distributions paid on Class A, Class B, Class C, Class F, Class I, Class R,
Class X, Class Y and Class Z shares will not constitute “preferential dividends” under the Code and (2) that the conversion of shares does not constitute a taxable event for federal income tax purposes. The
conversion of Class B, Class F, and Class X shares into Class A shares may be suspended if such opinions or rulings are no longer available. If conversions are suspended, Class B, Class F, and Class X shares of the
Funds will continue to be subject, possibly indefinitely, to their higher annual distribution and service fee. Shareholders should consult their tax advisers regarding the tax consequences of the conversion or exchange
of shares.
Class A, Class Z and
Class R shares may be converted to Class Q shares under certain limited circumstances. Please contact PMFS at (800) 225-1852 for more details.
NET ASSET VALUE
The
price an investor pays for a Fund share is based on the share value. The share value—known as the net asset value per share or NAV—is determined by subtracting Fund liabilities from the value of Fund assets
and dividing the remainder by the number of outstanding shares. NAV is calculated separately for each class. The Funds will compute their NAV once each business day at the close of regular trading on the NYSE, usually
4:00 p.m. Eastern time. For purposes of computing NAV, the Funds will value the Funds' futures contracts generally 15 minutes after the close of regular trading on the NYSE. The Funds may not compute their NAV on days
on which no orders to purchase, sell or exchange shares of the Funds have been received or on days on which changes in the value of the Funds' portfolio securities do not materially affect its NAV. The NYSE is closed
on the following holidays: New Year's Day, Martin Luther King, Jr. Day, Presidents' Day, Good Friday, Memorial Day, Independence Day, Labor Day, Thanksgiving Day and Christmas Day.
In accordance with
procedures adopted by the Board, the value of investments listed on a securities exchange and NASDAQ System securities (other than options on stock and stock indices) are valued at the last sale price on the day of
valuation or, if there was no sale on such day, the mean between the last bid and asked prices on such day, or at the bid price on such day in the absence of an asked price, as provided by a pricing service or
principal market marker. Securities included on the NASDAQ Market are valued at the
71
NASDAQ Official Closing Price (NOCP) on the day of valuation, or if there was no NOCP, at the last sale price. NASDAQ Market Securities for which there was no NOCP or last sale price are valued at the mean
between the last bid and asked prices on the day of valuation, or the last bid price in the absence of an asked price. Corporate bonds (other than convertible debt securities) and U.S. Government securities that are
actively traded in the OTC market, including listed securities for which the primary market is believed by the Manager in consultation with the subadviser to be over-the-counter, are valued on the basis of valuations
provided by an independent pricing agent which uses information with respect to transactions in bonds, quotations from bond dealers, agency ratings, market transactions in comparable securities and various
relationships between securities in determining value. Convertible debt securities that are actively traded in the over-the-counter market, including listed securities for which the primary market is believed by the
Manager in consultation with the subadviser to be OTC, are valued at the mean between the last reported bid and asked prices provided by principal market makers.
OTC options on stock
and stock indices traded on an exchange are valued at the mean between the most recently quoted bid and asked prices on the respective exchange and futures contracts and options thereon are valued at their last sale
prices as of the close of trading on the applicable commodities exchange or if there was no sale on the applicable commodities exchange on such day, at the mean between the most recently quoted bid and asked prices on
such exchange or at the last bid price in the absence of an asked price. Quotations of foreign securities in a foreign currency are converted to U.S. dollar equivalents at the current rate obtained from a recognized
bank, dealer or independent service, and forward currency exchange contracts are valued at the current cost of covering or offsetting such contacts. Should an extraordinary event, which is likely to affect the value of
the security, occur after the close of an exchange on which a portfolio security is traded, such security will be valued at fair value considering factors determined in good faith by the subadviser or Manager under
procedures established by and under the general supervision of the Funds' Board.
Under the 1940 Act, the Board is responsible for determining in good faith the fair value of securities of the Funds. Portfolio securities for which reliable market quotations are not readily available or
for which the pricing agent or principal market maker does not provide a valuation or methodology or provides a valuation or methodology that, in the judgment of the Manager or subadviser (or Valuation Committee or
Board) does not represent fair value (Fair Value Securities), are valued by the Valuation Committee or Board in consultation with the subadviser or Manager, as applicable, including, as applicable, their portfolio
managers, traders, research and credit analysts, and legal and compliance personnel, on the basis of the following factors: the nature of any restrictions on disposition of the securities; assessment of the general
liquidity / illiquidity of the securities; the issuer's financial condition and the markets in which it does business; the cost of the investment; the size of the holding and the capitalization of issuer; the prices of
any recent transactions or bids / offers for such securities or any comparable securities; any available analyst, media or other reports or information deemed reliable by the Manager or subadviser regarding the issuer
or the markets or industry in which it operates; other analytical data; consistency with valuation of similar securities held by other Prudential Investments mutual funds; and such other factors as may be determined by
the subadviser, Manager, Board or Valuation Committee to materially affect the value of the security. Fair Value Securities may include, but are not limited to, the following: certain private placements and restricted
securities that do not have an active trading market; securities whose trading has been suspended or for which market quotes are no longer available; debt securities that have recently gone into default and for which
there is no current market; securities whose prices are stale; securities affected by significant events; and securities that the subadviser or Manager believes were priced incorrectly.
A “significant
event” (which includes, but is not limited to, an extraordinary political or market event) is an event that the subadviser or Manager believes with a reasonably high degree of certainty has caused the closing
market prices of the Funds' portfolio securities to no longer reflect their value at the time of the Funds' NAV calculation. On a day that the Manager may determine that one or more of the Funds' portfolio securities
constitute Fair Value Securities, the Manager’s Fair Valuation Committee may determine the fair value of these securities if the fair valuation of each security results in a change of less than $0.01 to the
Funds' NAV and/or the fair valuation of the securities in the aggregate results in a change of one half of one percent or more of the Funds' daily net assets and the Fair Valuation Committee presents these valuations
to the Board for its ratification.
In addition, the
Funds use a service provided by a pricing vendor to fair value Foreign Fair Value Securities, which are securities that are primarily traded in non-U.S. markets and subject to a valuation adjustment upon the reaching
of a valuation “trigger” determined by the Board. The fair value prices of Foreign Fair Value Securities reflect an adjustment to closing market prices that is intended to reflect the causal link between
movements in the U.S. market and the non-U.S. market on which the securities trade.
The
Funds' use of fair value pricing procedures involves subjective judgments and it is possible that the fair value determined for a security may be materially different from the value that could be realized upon the sale
of that security. Accordingly, there can be no assurance that the Funds could obtain the fair value assigned to a security if the security were sold at approximately the same time at which the Funds determines their
NAV per share.
Target
Asset Allocation Funds 72
Short-term debt securities are valued at cost, with interest accrued of discount amortized to the date of maturity, if their original maturity was 60 days or less, unless this is determined by the Board
not to represent fair value. Short-term debt securities with remaining maturities of more than 60 days for which market quotations are readily available are valued at their current market quotations as supplied
by an independent pricing agent or more than one principal market maker (if available, otherwise a primary market maker).
Securities for which
reliable market quotations are not available or for which the pricing agent or principal market maker does not provide a valuation or provides a valuation that, in the judgment of the Manager, does not present fair
value, shall be valued in accordance with the following procedures: At the time of purchase, the duration of the security is to be determined. A Treasury issue (or similar security or index for which market quotes are
readily available) (the “Proxy”) of similar duration will then be selected to serve as a Proxy for the price movements of the security. The price of the security will fluctuate exactly as does the Proxy
while maintaining the initial price spread constant. The duration of the security will be reviewed once a month by one or more of the portfolio managers, and at any other time that a portfolio manager believes that
there may have been a material change in the duration of the security. Should the duration change, another security or index of similar duration will be chosen to serve as Proxy, at which point the price spread will be
determined. In addition, the validity of the pricing methodology will be monitored by (1) comparing the actual sales proceeds of the security to its price reported by the Fund at the time of the sale and (2)
periodically obtaining actual market quotes for the security.
Generally, we will
value the Funds' futures contracts at the close of trading for those contracts (normally 15 minutes after the close of regular trading on the NYSE). If, in the judgment of the subadviser or Manager, the closing price
of a contract is materially different from the contract price at the NYSE close, a fair value price for the contract will be determined.
If the Funds declare
dividends daily, the net asset value of each class of shares of the Funds will generally be the same. It is expected, however, that the dividends, if any, will differ by approximately the amount of the distribution
and/or service fee expense accrual differential among the classes.
SHAREHOLDER
SERVICES
Upon the initial
purchase of Fund shares, a Shareholder Investment Account is established for each investor under which a record of the shares is maintained by PMFS. Share certificates are no longer issued for shares of the Funds. The
Funds furnish to shareholders the following privileges and plans:
AUTOMATIC REINVESTMENT
OF DIVIDENDS AND/OR DISTRIBUTIONS. For the convenience of investors, all dividends and distributions are automatically reinvested in full and fractional shares of the Funds at NAV per share. An investor may direct PMFS in
writing not less than five full business days prior to the record date to have subsequent dividends and/or distributions sent in cash rather than reinvested. In the case of recently purchased shares for which
registration instructions have not been received by the record date, cash payment will be made directly to the broker. Any shareholder who receives dividends or distributions in cash may subsequently reinvest any such
dividend or distribution at NAV by returning the check or the proceeds to PMFS within 30 days after the payment date. Such reinvestment will be made at the NAV per share next determined after receipt of the check or
the proceeds by PMFS. Shares purchased with reinvested dividends and/or distributions will not be subject to any CDSC upon redemption.
EXCHANGE PRIVILEGES. The Funds furnish to shareholders the privilege of exchanging their shares of the Funds for shares of certain other Prudential Investments mutual funds, including one or more specified
money market funds, subject in each case to the minimum investment requirements of such funds. Shares of such other Prudential Investments mutual funds may also be exchanged for shares of the Funds. All exchanges are
made on the basis of the relative NAV next determined after receipt of an order in proper form. An exchange will be treated as a redemption and purchase for federal income tax purposes. Shares may be exchanged for
shares of another fund only if shares of such fund may legally be sold under applicable state laws. For retirement and group plans having a limited menu of Prudential Investments mutual funds, the exchange privilege is
available for those funds eligible for investment in the particular program.
It is contemplated
that the exchange privilege may be applicable to new Prudential Investments mutual funds, the shares of which may be distributed by the Distributor.
In
order to exchange shares by telephone, you must authorize telephone exchanges on your initial application form or by written notice to PMFS and hold shares in non-certificated form. Thereafter, you may call the Funds
at (800) 225-1852 to execute a telephone exchange of shares, on weekdays, except holidays, between the hours of 8:00 a.m. and 6:00 p.m. Eastern time. For your protection and to prevent fraudulent exchanges, your
telephone call will be recorded and you will be asked to authenticate your account. A
73
written confirmation of the exchange transaction will be sent to you. Neither the Funds nor their agents will be liable for any loss, liability or cost which results from acting upon instructions
reasonably believed to be genuine under the foregoing procedures. All exchanges will be made on the basis of the relative NAV of the two funds next determined after the request is received in good order.
If you hold shares
through a brokerage firm, you must exchange your shares by contacting your financial adviser.
If you hold share
certificates, the certificates must be returned in order for the shares to be exchanged. See “Purchase, Redemption and Pricing of Fund Shares—Sale of Shares” above.
You may also exchange
shares by mail by writing to PMFS, P.O. Box 9658, Providence, RI 02940.
In periods of severe
market or economic conditions the telephone exchange of shares may be difficult to implement and you should make exchanges by mail by writing to PMFS at the address noted above.
Class A shares: Shareholders of the Funds may exchange their Class A shares for Class A shares of certain other Prudential Investments mutual funds and shares of the money market funds specified below. No
fee or sales load will be imposed upon the exchange. Shareholders of money market funds who acquired such shares upon exchange of Class A shares may use the exchange privilege only to acquire Class A shares of the
Prudential Investments mutual funds participating in the exchange privilege.
The following money
market fund participates in the Class A exchange privilege: Prudential MoneyMart Assets, Inc. (Class A shares).
Participants in
certain programs sponsored by broker-dealers, investment advisers and financial planners who have agreements with Prudential, or whose programs are available through financial intermediaries that have agreements with
Prudential relating to mutual fund “wrap” or asset allocation programs or mutual fund “supermarket” programs, for which the Funds are an available option, may have their Class A shares, if any,
exchanged for Class Z shares of the Funds, if available as an investment option, when they elect to have those assets become a part of the program. Upon leaving the program (whether voluntarily or not), such Class Z
shares (and, to the extent provided for in the program, Class Z shares acquired through participation in the program) may be exchanged for Class A shares of the Funds at net asset value if Class Z shares are not
available to the shareholder as an investment option outside the program. Contact your program sponsor or financial intermediary with any questions.
Class B, Class C and
Class F shares: Shareholders of the Funds may exchange their Class B and Class C shares of the Funds for Class B and Class C shares, respectively, and Class F shareholders may exchange their Class F
shares for Class B shares of certain other Prudential Investments mutual funds. No CDSC will be payable upon such exchange, but a CDSC may be payable upon the redemption of the Class B and Class C shares acquired as a
result of an exchange. The applicable sales charge will be that imposed by the fund in which shares were initially purchased and the purchase date will be deemed to be the date of the initial purchase, rather than the
date of the exchange, excluding any time Class B, Class C or Class F shares were held in a money market fund.
Class B, Class C and
Class F shares may also be exchanged for shares of Prudential MoneyMart Assets, Inc. without imposition of any CDSC at the time of exchange. Upon subsequent redemption from such money market fund or after re-exchange
into a Fund, such shares will be subject to the CDSC calculated without regard to the time such shares were held in the money market fund. For purposes of calculating the seven year holding period applicable to the
Class B and Class F conversion feature, the time period during which Class B and Class F shares were held in a money market fund will be excluded.
At any time after
acquiring shares of other funds participating in the Class B or Class C or Class F exchange privilege, a shareholder may again exchange those shares (and any reinvested dividends and distributions) for Class B or Class
C or Class F shares of a Fund without subjecting such shares to any CDSC. Shares of any fund participating in the Class B or Class C or Class F exchange privilege that were acquired through reinvestment of dividends or
distributions may be exchanged for Class B or Class C or Class F shares of other funds without being subject to any CDSC.
Class
X shares: Shareholders of the Funds may exchange their Class X shares for Class X shares of certain other Prudential Investments mutual funds. No fee or sales load will be imposed upon the exchange.
Shares of any fund participating in the Class X exchange privilege that were acquired through reinvestment of dividends or distributions may be exchanged for Class X shares of other funds without being subject to any
CDSC.
Class Q shares: Class Q shares may be exchanged for Class Q shares of other Prudential Investments mutual funds.
Class R shares: Class R shares may be exchanged for Class R shares of other Prudential Investments mutual funds.
Class Z shares: Class Z shares may be exchanged for Class Z shares of other Prudential Investments mutual funds.
Target
Asset Allocation Funds 74
Shareholders who
qualify to purchase Class Z shares may have their Class B and Class C shares which are not subject to a CDSC and their Class A shares exchanged for Class Z shares upon notification. Eligibility for this exchange
privilege will be calculated on the business day prior to the date of the exchange. Amounts representing Class B or Class C shares which are not subject to a CDSC include the following: (1) amounts representing Class B
or Class C shares acquired pursuant to the automatic reinvestment of dividends and distributions, (2) amounts representing the increase in the net asset value above the total amount of payments for the purchase of
Class B or Class C shares and (3) amounts representing Class B or Class C shares held beyond the applicable CDSC period. Class B and Class C shareholders must notify PMFS either directly or through Wells Fargo
Advisors, Pruco Securities, LLC or another broker that they are eligible for this special exchange privilege.
Participants in any fee-based program for which the Funds are an available option may arrange with the Transfer Agent or their recordkeeper to have their Class A shares, if any, exchanged for Class Z
shares when they elect to have those assets become a part of the fee-based program. Upon leaving the program (whether voluntarily or not), the participant may arrange with the Transfer Agent or their recordkeeper to
have such Class Z shares acquired through participation in the program exchanged for Class A shares at net asset value. Similarly, participants in Wells Fargo Advisors' 401(k) Plan for which the Funds' Class Z shares
are an available option and who wish to transfer their Class Z shares out of the Wells Fargo Advisors 401(k) Plan following separation from service (i.e., voluntary or involuntary termination of employment or
retirement) may arrange with the Transfer Agent or their recordkeeper to have their Class Z shares exchanged for Class A shares at NAV.
Additional details
about the exchange privilege and prospectuses for each of the Prudential Investments mutual funds are available from PMFS, the Distributor or your broker. The special exchange privilege may be modified, terminated or
suspended on sixty days' notice, and the Funds, or the Distributor, have the right to reject any exchange application relating to the Funds' shares.
AUTOMATIC INVESTMENT
PLAN (AIP). Under AIP, an investor may arrange to have a fixed amount automatically invested in shares of the Funds by authorizing his or her bank account or brokerage account to be debited to invest
specified dollar amounts in shares of the Funds. The investor's bank must be a member of the Automated Clearing House System.
Further information
about this program and an application form can be obtained from PMFS, the Distributor or your broker.
SYSTEMATIC WITHDRAWAL PLAN. A Systematic Withdrawal Plan is available to shareholders through the Distributor, PMFS or your broker. The Systematic Withdrawal Plan provides for monthly, quarterly, semi-annual or
annual redemptions in any amount, except as provided below, up to the value of the shares in the shareholder's account. Systematic withdrawals of Class A (in certain instances), Class B, Class C, Class F, or Class X
shares may be subject to a CDSC. The Systematic Withdrawal Plan is not available to participants in certain retirement plans. Please contact PMFS at (800) 225-1852 for more details.
PMFS, the Distributor
or your broker acts as an agent for the shareholder in redeeming sufficient full and fractional shares to provide the amount of the systematic withdrawal payment. The Systematic Withdrawal Plan may be terminated at any
time.
Systematic
withdrawals should not be considered as dividends, yield or income. If systematic withdrawals continuously exceed reinvested dividends and distributions, the shareholder's original investment will be correspondingly
reduced and ultimately exhausted.
Furthermore, each
withdrawal constitutes a redemption of shares, and any gain or loss realized must be recognized for federal income tax purposes. In addition, withdrawals made concurrently with purchases of additional shares are
inadvisable because of the sales charges applicable to (i) the purchase of Class A shares and (ii) the redemption of Class A (in certain instances), Class B and Class C shares. Each shareholder should consult his or
her own tax adviser with regard to the tax consequences of the Systematic Withdrawal Plan, particularly if used in connection with a retirement plan.
MUTUAL FUND PROGRAMS. From time to time, the Funds may be included in a mutual fund program with other Prudential Investments mutual funds. Under such a program, a group of portfolios will be selected and
thereafter marketed collectively. Typically, these programs are marketed with an investment theme, such as pursuit of greater diversification, protection from interest rate movements or access to different management
styles. In the event such a program is instituted, there may be a minimum investment requirement for the program as a whole. The Funds may waive or reduce the minimum initial investment requirements in connection with
such a program.
The mutual funds in
the program may be purchased individually or as a part of a program. Since the allocation of portfolios included in the program may not be appropriate for all investors, investors should consult their financial adviser
concerning the appropriate blends of portfolios for them. If investors elect to purchase the individual mutual funds that constitute the program in an investment ratio different from that offered by the program, the
standard minimum investment requirements for the individual mutual funds will apply.
75
TAX-DEFERRED RETIREMENT
PROGRAMS. Various tax-deferred retirement plans, including a 401(k) plan, self-directed individual retirement accounts and “tax-deferred accounts” under Section 403(b)(7) of the Code are
available through the Distributor. These plans are for use by both self-employed individuals and corporate employers. These plans permit either self-direction of accounts by participants or a pooled account
arrangement. Information regarding the establishment of these plans, their administration, custodial fees and other details is available from the Distributor or PMFS.
Investors who are
considering the adoption of such a plan should consult with their own legal counsel and/or tax adviser with respect to the establishment and maintenance of any such plan.
TAXES, DIVIDENDS
AND DISTRIBUTIONS
The following is a
summary of certain tax considerations generally affecting each Fund and its shareholders. This section is based on the Code, published rulings and court decisions, all as currently in effect. These laws are subject to
change, possibly on a retroactive basis. Please consult your own tax adviser concerning the consequences of investing in a Fund in your particular circumstances under the Code and the laws of any other taxing
jurisdiction.
QUALIFICATION AS A
REGULATED INVESTMENT COMPANY. Each Fund has elected to be taxed as a regulated investment company under Subchapter M of the Code and intends to meet all other requirements that are necessary for it to be relieved of
federal taxes on income and gains it distributes to shareholders. As a regulated investment company, a Fund is not subject to federal income tax on the portion of its net investment income (i.e., investment company
taxable income, as that term is defined in the Code, without regard to the deduction for dividends paid) and net capital gain (i.e., the excess of net long-term capital gain over net short-term capital loss) that it
distributes to shareholders, provided that it distributes at least 90% of its net tax-exempt income and investment company taxable income for the year (the “Distribution Requirement”), and satisfies certain
other requirements of the Code that are described below.
Net capital gains of
a Fund that are available for distribution to shareholders will be computed by taking into account any applicable capital loss carryforward. If a Fund has a capital loss carryforward, the amount and duration of any
such capital loss carryforward will be set forth at the end of this section.
In addition to
satisfying the Distribution Requirement, each Fund must derive at least 90% of its gross income from dividends, interest, certain payments with respect to loans of stock and securities, gains from the sale or
disposition of stock, securities or foreign currencies and other income (including but not limited to gains from options, futures or forward contracts) derived with respect to its business of investing in such stock,
securities or currencies and net income derived from an interest in a “qualified publicly traded partnership” (as such term is defined in the Code).
Each Fund must also
satisfy an asset diversification test on a quarterly basis. Failure to do so may result in a Fund being subject to penalty taxes, being required to sell certain of its positions, and may cause the Fund to fail to
qualify as a regulated investment company. Under this asset diversification test, at the close of each quarter of a Fund’s taxable year, (1) 50% or more of the value of the Fund’s assets must be represented
by cash, United States government securities, securities of other regulated investment companies, and other securities, with such other securities limited, in respect of any one issuer, to an amount not greater than 5%
of the value of the Fund’s assets and 10% of the outstanding voting securities of such issuer and (2) not more than 25% of the value of the Fund’s assets may be invested in securities of (x) any one issuer
(other than United States government securities or securities of other regulated investment companies), or two or more issuers (other than securities of other regulated investment companies) of which the Fund owns 20%
or more of the voting stock and which are engaged in the same, similar or related trades or businesses or (y) one or more “qualified publicly traded partnerships” (as such term is defined in the Code).
A
Fund may be able to cure a failure to derive 90% of its income from the sources specified above or a failure to diversify its holdings in the manner described above by paying a tax, by disposing of certain assets, or
by paying a tax and disposing of assets. If, in any taxable year, a Fund fails one of these tests and does not timely cure the failure, the Fund will be taxed in the same manner as an ordinary corporation and
distributions to its shareholders will not be deductible by the Fund in computing its taxable income.
Although in general
the passive loss rules of the Code do not apply to regulated investment companies, such rules do apply to a regulated investment company with respect to items attributable to an interest in a qualified publicly traded
partnership. A Fund’s investments in partnerships, including in qualified publicly traded partnerships, may result in the Fund being subject to state, local or foreign income, franchise or withholding tax
liabilities.
If for any year a
Fund does not qualify as a regulated investment company, or fails to meet the Distribution Requirement, all of its taxable income (including its net capital gain) will be subject to tax at regular corporate rates
without any deduction for distributions to shareholders. In addition, in the event of a failure to qualify, a Fund’s distributions, to the extent derived from the Fund’s current or
Target
Asset Allocation Funds 76
accumulated earnings and profits, including any distributions of net long-term capital gains, will be taxable to shareholders as dividend income. However, such dividends will be eligible (i) for taxable
years beginning prior to January 1, 2013, to be treated as qualified dividend income in the case of shareholders taxed as individuals and (ii) for the dividends received deduction in the case of corporate shareholders.
Moreover, if a Fund fails to qualify as a regulated investment company in any year, it must pay out its earnings and profits accumulated in that year in order to qualify again as a regulated investment company. If a
Fund fails to qualify as a regulated investment company for a period greater than two taxable years, the Fund may be subject to taxation on any net built-in-gains (i.e., the excess of the aggregate gain, including
items of income, over aggregate loss that would have been realized if the Fund had been liquidated) recognized for a period of ten years, or, under certain circumstances, may have to recognize and pay tax on such net
built-in-gain, in order to qualify as a regulated investment company in a subsequent year.
EXCISE TAX ON REGULATED
INVESTMENT COMPANIES. A 4% non-deductible excise tax is imposed on a regulated investment company to the extent that it distributes income in such a way that it is taxable to shareholders in a calendar year
other than the calendar year in which a Fund earned the income. Specifically, the excise tax will be imposed if a Fund fails to distribute in each calendar year an amount equal to 98% of ordinary taxable income,
including qualified dividend income, for the calendar year and 98.2% of capital gain net income for the one-year period ending on October 31 of such calendar year (or, at the election of a regulated investment company
having a taxable year ending November 30 or December 31, for its taxable year). The balance of such income must be distributed during the next calendar year. For the foregoing purposes, a regulated investment company
is treated as having distributed otherwise retained amounts if it is subject to income tax on those amounts for any taxable year ending in such calendar year.
Each Fund intends to
make sufficient distributions or deemed distributions of its qualified dividend income, ordinary income and capital gain net income prior to the end of each calendar year to avoid liability for this excise tax.
However, investors should note that a Fund may in certain circumstances be required to borrow money or liquidate portfolio investments to make sufficient distributions to avoid excise tax liability.
FUND INVESTMENTS. Each Fund may make investments or engage in transactions that affect the character, amount and timing of gains or losses realized by a Fund. A Fund may make investments that produce income
that is not matched by a corresponding cash receipt by the Fund. Any such income would be treated as income earned by the Fund and therefore would be subject to the Distribution Requirement. Such investments may
require a Fund to borrow money or dispose of other securities in order to comply with those requirements. Each Fund may also make investments that prevent or defer the recognition of losses or the deduction of
expenses. These investments may likewise require a Fund to borrow money or dispose of other securities in order to comply with the Distribution Requirement. Additionally, a Fund may make investments that result in the
recognition of ordinary income rather than capital gain, or that prevent the Fund from accruing a long-term holding period. These investments may prevent the Fund from making capital gain distributions as described
below. Each Fund intends to monitor its transactions, will make the appropriate tax elections and will make the appropriate entries in its books and records when it makes any such investments in order to mitigate the
effect of these rules. The foregoing concepts are explained in greater detail in the following paragraphs.
Gains or losses on
sales of stock or securities by a Fund generally will be treated as long-term capital gains or losses if the stock or securities have been held by it for more than one year, except in certain cases where the Fund
acquires a put or writes a call or otherwise holds an offsetting position, with respect to the stock or securities. Other gains or losses on the sale of stock or securities will be short-term capital gains or losses.
In
certain situations, a Fund may, for a taxable year, defer all or a portion of its net capital loss realized after October and its late-year ordinary loss (defined as the excess of post-October foreign currency and PFIC
losses and other post-December ordinary losses over post-October foreign currency and PFIC gains and other post-December ordinary income) until the next taxable year in computing its investment company taxable income
and net capital gain, which will defer the recognition of such realized losses. Such deferrals and other rules regarding gains and losses realized after October (or December) may affect the tax character of shareholder
distributions.
If an option written
by a Fund on securities lapses or is terminated through a closing transaction, such as a repurchase by the Fund of the option from its holder, the Fund will generally realize short-term capital gain or loss. If
securities are sold by the Fund pursuant to the exercise of a call option written by it, the Fund will include the premium received in the sale proceeds of the securities delivered in determining the amount of gain or
loss on the sale. Gain or loss on the sale, lapse or other termination of options acquired by a Fund on stock or securities and on narrowly-based stock indexes will be capital gain or loss and will be long-term or
short-term depending on the holding period of the option.
Certain Fund
transactions may be subject to wash sale, short sale, constructive sale, conversion transaction, constructive ownership transaction and straddle provisions of the Code that may, among other things, require a Fund to
defer recognition of losses or convert long-term capital gain into ordinary income or short-term capital gain taxable as ordinary income.
77
As a
result of entering into swap contracts, a Fund may make or receive periodic net payments. A Fund may also make or receive a payment when a swap is terminated prior to maturity through an assignment of the swap or other
closing transaction. Periodic net payments will generally constitute taxable ordinary income or deductions, while termination of a swap will generally result in capital gain or loss (which will be a long-term capital
gain or loss if the Fund has been a party to the swap for more than one year). With respect to certain types of swaps, a Fund may be required to currently recognize income or loss with respect to future payments on
such swaps or may elect under certain circumstances to mark such swaps to market annually for tax purposes as ordinary income or loss. Periodic net payments that would otherwise constitute ordinary deductions but are
allocable under the Code to exempt interest dividends will not be allowed as a deduction but instead will reduce net tax-exempt income.
In general, gain or
loss on a short sale is recognized when a Fund closes the sale by delivering the borrowed property to the lender, not when the borrowed property is sold. Gain or loss from a short sale is generally capital gain or loss
to the extent that the property used to close the short sale constitutes a capital asset in a Fund’s hands. Except with respect to certain situations where the property used by a Fund to close a short sale has a
long-term holding period on the date of the short sale, special rules would generally treat the gains on short sales as short-term capital gains. These rules may also terminate the running of the holding period of
“substantially identical property” held by a Fund. Moreover, a loss on a short sale will be treated as a long-term capital loss if, on the date of the short sale, “substantially identical
property” has been held by a Fund for more than one year. In general, a Fund will not be permitted to deduct payments made to reimburse the lender of securities for dividends paid on borrowed stock if the short
sale is closed on or before the 45th day after the short sale is entered into.
Debt securities
acquired by a Fund may be subject to original issue discount and market discount rules which, respectively, may cause the Fund to accrue income in advance of the receipt of cash with respect to interest or cause gains
to be treated as ordinary income subject to the Distribution Requirement referred to above. Market discount generally is the excess, if any, of the principal amount of the security (or, in the case of a security issued
at an original issue discount, the adjusted issue price of the security) over the price paid by the Fund for the security. Original issue discount that accrues in a taxable year is treated as income earned by a Fund
and therefore is subject to the Distribution Requirement. Because the original issue discount income earned by a Fund in a taxable year may not be represented by cash income, the Fund may have to borrow money or
dispose of other securities and use the proceeds to make distributions to satisfy the Distribution Requirement.
Certain futures
contracts and certain listed options (referred to as Section 1256 contracts) held by the Funds will be required to be “marked to market” for federal income tax purposes at the end of a Fund’s taxable
year, that is, treated as having been sold at the fair market value on the last business day of the Fund’s taxable year. Except with respect to certain foreign currency forward contracts, sixty percent of any
gain or loss recognized on these deemed sales and on actual dispositions will be treated as long-term capital gain or loss, and forty percent will be treated as short-term capital gain or loss. Any net mark-to-market
gains may be subject to the Distribution Requirement referred to above, even though a Fund may receive no corresponding cash amounts, possibly requiring the disposition of portfolio securities or borrowing to obtain
the necessary cash.
Gains or losses
attributable to fluctuations in exchange rates that occur between the time a Fund accrues interest or other receivables or accrues expenses or other liabilities denominated in a foreign currency and the time the Fund
actually collects such receivables or pays such liabilities are treated as ordinary income or loss. Similarly, gains or losses on foreign currency forward contracts or dispositions of debt securities denominated in a
foreign currency that are attributable to fluctuations in the value of the foreign currency between the date of acquisition of the security or contract and the date of disposition thereof generally also are treated as
ordinary income or loss. These gains or losses, referred to under the Code as “Section 988” gains or losses, increase or decrease the amount of a Fund’s investment company taxable income available to
be distributed to its shareholders as ordinary income, rather than increasing or decreasing the amount of the Fund’s net capital gain. If Section 988 losses exceed other investment company taxable income during a
taxable year, a Fund would not be able to make any ordinary dividend distributions from current earnings and profits, and distributions made before the losses were realized could be recharacterized as a return of
capital to shareholders, rather than as an ordinary dividend, thereby reducing each shareholder’s basis in his or her Fund shares.
If the Fund holds
(directly or indirectly) one or more “tax credit bonds” (defined below) on one or more specified dates during the Fund’s taxable year, and the Fund satisfies the minimum distribution requirement, the
Fund may elect for U.S. federal income tax purposes to pass through to shareholders tax credits otherwise allowable to the Fund for that year with respect to such bonds. A tax credit bond is defined in the Code as a
“qualified tax credit bond” (which includes a qualified forestry conservation bond, a new clean renewable energy bond, a qualified energy conservation bond, a qualified zone academy bond, or a qualified
school construction bond, each of which must meet certain requirements specified in the Code), a “build America bond” or certain other specified bonds. If the Fund were to make an election, a shareholder of
the Fund would be required to include in gross income an amount equal to such shareholder’s proportionate share of the interest income attributable to such credits and would be entitled to claim as a tax credit
an amount equal to the shareholder’s proportionate share of such credits. Certain limitations may apply on the extent to which the credit may be claimed.
Target
Asset Allocation Funds 78
A Fund may make
investments in equity securities of foreign issuers. If a Fund purchases shares in certain foreign corporations (referred to as passive foreign investment companies (“PFICs”) under the Code), the Fund may
be subject to federal income tax on a portion of any “excess distribution” from such foreign corporation, including any gain from the disposition of such shares, even if such income is distributed by the
Fund to its shareholders. In addition, certain interest charges may be imposed on the Fund as a result of such distributions. If a Fund were to invest in an eligible PFIC and elected to treat the PFIC as a qualified
electing fund (a “QEF”), in lieu of the foregoing requirements, the Fund would be required to include each year in its income and distribute to shareholders in accordance with the Distribution Requirement,
a pro rata portion of the QEF’s ordinary earnings and net capital gain, whether or not distributed by the QEF to the Fund. A Fund may not be able to make this election with respect to many PFICs because of
certain requirements that the PFICs would have to satisfy.
Alternatively, a Fund
generally will be permitted to “mark to market” any shares it holds in a PFIC. If a Fund made such an election, with such election being made separately for each PFIC owned by the Fund, the Fund would be
required to include in income each year and distribute to shareholders in accordance with the Distribution Requirement, an amount equal to the excess, if any, of the fair market value of the PFIC stock as of the close
of the taxable year over the adjusted basis of such stock at that time. A Fund would be allowed a deduction for the excess, if any, of the adjusted basis of the PFIC stock over its fair market value as of the close of
the taxable year, but only to the extent of any net mark-to-market gains with respect to the stock included by the Fund for prior taxable years. A Fund will make appropriate basis adjustments in the PFIC stock to take
into account the mark-to-market amounts.
Notwithstanding any
election made by a Fund, dividends attributable to distributions from a foreign corporation will not be eligible for the special tax rates applicable to qualified dividend income if the foreign corporation is a PFIC
either in the taxable year of the distribution or the preceding taxable year, but instead will be taxable at rates applicable to ordinary income.
A Fund may invest in
REITs. Such Fund’s investments in REIT equity securities may require a Fund to accrue and distribute income not yet received. In order to generate sufficient cash to make the requisite distributions, a Fund may
be required to sell securities in its portfolio that it otherwise would have continued to hold (including when it is not advantageous to do so). A Fund’s investments in REIT equity securities may at other times
result in the Fund’s receipt of cash in excess of the REIT’s earnings; if the Fund distributes such amounts, such distribution could constitute a return of capital to Fund shareholders for federal income
tax purposes. Dividends received by the Fund from a REIT will generally not constitute qualified dividend income. REITs will generally be able to pass through the tax treatment of tax-qualified dividends they receive.
Some of the REITs in
which the Funds may invest will be permitted to hold residual interests in real estate mortgage investment conduits (“REMICs”). Under Treasury regulations not yet issued, but that may apply retroactively, a
portion of a Fund’s income from a REIT that is attributable to the REIT’s residual interest in a REMIC (referred to in the Code as an “excess inclusion”) will be subject to federal income tax in
all events. These regulations are expected to provide that excess inclusion income of a regulated investment company, such as a Fund, will be allocated to shareholders of the regulated investment company in proportion
to the dividends received by shareholders, with the same consequences as if shareholders held the related REMIC residual interest directly.
In general, excess
inclusion income allocated to shareholders (i) cannot be offset by net operating losses (subject to a limited exception for certain thrift institutions), (ii) will constitute unrelated business taxable income to
entities (including a qualified pension plan, an individual retirement account, a 401(k) plan, a Keogh plan or other tax-exempt entity) subject to tax on unrelated business income, thereby potentially requiring such an
entity that is allocated excess inclusion income, and that otherwise might not be required to file a tax return, to file a tax return and pay tax on such income, and (iii) in the case of a non-U.S. shareholder, will
not qualify for any reduction in U.S. federal withholding tax.
Under current law, if
a charitable remainder trust (defined in Section 664 of the Code) realizes any unrelated business taxable income for a taxable year, it will be subject to an excise tax equal to 100% of such unrelated business taxable
income. In addition, if at any time during any taxable year a “disqualified organization” (as defined in the Code) is a record holder of a share in a regulated investment company, then the regulated
investment company will be subject to a tax equal to that portion of its excess inclusion income for the taxable year that is allocable to the disqualified organization, multiplied by the highest federal income tax
rate imposed on corporations. The Funds do not intend to invest directly in residual interests in REMICs or to invest in REITs in which a substantial portion of the assets will consist of residual interests in REMICs.
FUND DISTRIBUTIONS. Each Fund anticipates distributing substantially all of its net investment income for each taxable year. Dividends of net investment income paid to a non-corporate U.S. shareholder in a
taxable year beginning before January 1, 2013 that are reported as qualified dividend income will generally be taxable to such shareholder at a maximum rate of 15%. The reduced tax rate for qualified dividends is
scheduled to expire on December 31, 2012, unless further extended by Congress. The amount of dividend income that may be reported by a Fund as qualified dividend income will generally be limited to the aggregate of the
eligible dividends received by the Fund. In addition, a Fund must meet certain holding period requirements with respect to the shares
79
on which the Fund received the eligible dividends, and the non-corporate U.S. shareholder must meet certain holding period requirements with respect to the Fund shares. Dividends of net investment income
that are not reported as qualified dividend income or exempt interest dividends and dividends of net short-term capital gains will be taxable to shareholders at ordinary income rates. Dividends paid by a Fund with
respect to a taxable year will qualify for the 70% dividends received deduction generally available to corporations to the extent of the amount of dividends received by the Fund from certain domestic corporations for
the taxable year. Shareholders will be advised annually as to the U.S. federal income tax consequences of distributions made (or deemed made) during the year, including the portion of dividends paid that qualify for
the reduced tax rate.
Ordinarily,
shareholders are required to take taxable distributions by a Fund into account in the year in which the distributions are made. However, for federal income tax purposes, dividends that are declared by a Fund in
October, November or December as of a record date in such month and actually paid in January of the following year will be treated as if they were paid on December 31 of the year declared. Therefore, such dividends
will generally be taxable to a shareholder in the year declared rather than the year paid.
Dividends paid by a
Fund that are properly reported as exempt-interest dividends will not be subject to regular federal income tax. Dividends paid by a Fund will be exempt from federal income tax (though not necessarily exempt from state
and local taxation) to the extent of the Fund’s tax-exempt interest income as long as 50% or more of the value of the Fund’s assets at the end of each quarter is invested in (1) state, municipal and other
bonds that are excluded from gross income for federal income tax purposes or (2) interests in other regulated investment companies, and, in each case, as long as the Fund properly reports such dividends as
exempt-interest dividends. Exempt-interest dividends from interest earned on municipal securities of a state, or its political subdivisions, are generally exempt from income tax in that state. However, income from
municipal securities from other states generally will not qualify for tax-free treatment.
Interest on
indebtedness incurred by a shareholder to purchase or carry shares of a Fund will not be deductible for U.S. federal income tax purposes to the extent it relates to exempt-interest dividends received by a shareholder.
If a shareholder receives exempt interest dividends with respect to any share of a Fund and if the share is held by the shareholder for six months or less, then any loss on the sale or exchange of the share may, to the
extent of the exempt-interest dividends, be disallowed. In addition, the Code may require a shareholder that receives exempt-interest dividends to treat as taxable income a portion of certain otherwise non-taxable
social security and railroad retirement benefit payments. Furthermore, a portion of any exempt-interest dividend paid by a Fund that represents income derived from certain revenue or private activity bonds held by the
Fund may not retain its tax-exempt status in the hands of a shareholder who is a “substantial user” of a facility financed by such bonds, or a “related person” thereof. In addition, the receipt
of dividends and distributions from a Fund may affect a foreign corporate shareholder’s federal “branch profits” tax liability and the federal “excess net passive income” tax liability of
a shareholder of an S corporation. Shareholders should consult their own tax advisers as to whether they are (i) “substantial users” with respect to a facility or “related” to such users within
the meaning of the Code or (ii) subject to the federal “branch profits” tax, or the federal “excess net passive income” tax.
A Fund may either
retain or distribute to shareholders its net capital gain (i.e., excess net long-term capital gain over net short-term capital loss) for each taxable year. Each Fund currently intends to distribute any such amounts. If
net capital gain is distributed and reported as a “capital gain dividend,” it will be taxable to shareholders as long-term capital gain, regardless of the length of time the shareholder has held its shares
or whether such gain was recognized by the Fund prior to the date on which the shareholder acquired its shares. Conversely, if a Fund elects to retain its net capital gain, the Fund will be taxed thereon (except to the
extent of any available capital loss carryovers) at the 35% corporate tax rate. In such a case, it is expected that the Fund also will elect to have shareholders of record on the last day of its taxable year treated as
if each received a distribution of its pro rata share of such gain, with the result that each shareholder will be required to report its pro rata share of such gain on its tax return as long-term capital gain, will
receive a refundable tax credit for its pro rata share of tax paid by the Fund on the gain, and will increase the tax basis for its shares by an amount equal to the deemed distribution less the tax credit.
Distributions by a
Fund that exceed the Fund’s current and accumulated earnings and profits will be treated as a return of capital to the extent of (and in reduction of) the shareholder’s tax basis in its shares; any
distribution in excess of such tax basis will be treated as gain from the sale of its shares, as discussed below.
Distributions by a
Fund will be treated in the manner described above regardless of whether such distributions are paid in cash or reinvested in additional shares of the Fund (or of another fund). Shareholders receiving a distribution in
the form of additional shares will be treated as receiving a distribution in an amount equal to the amount of cash that could have been received. In addition, prospective investors in a Fund should be aware that
distributions from the Fund will, all other things being equal, have the effect of reducing the net asset value of the Fund’s shares by the amount of the distribution. If the net asset value is reduced below a
shareholder’s cost, the distribution will nonetheless be taxable as described above, even if the distribution effectively represents a return of invested capital. Investors should consider the tax implications of
buying shares just prior to a distribution, when the price of shares may reflect the amount of the forthcoming distribution.
Target
Asset Allocation Funds 80
SALE OR REDEMPTION OF
SHARES. A shareholder will generally recognize gain or loss on the sale or redemption of shares in an amount equal to the difference between the proceeds of the sale or redemption and the
shareholder’s adjusted tax basis in the shares. All or a portion of any loss so recognized may be disallowed if the shareholder acquires other shares of the Fund or substantially identical stock or securities
within a period of 61 days beginning 30 days before such disposition, such as pursuant to reinvestment of a dividend in shares of the Fund. Additionally, if a shareholder disposes of shares of a Fund within 90 days
following their acquisition, and the shareholder subsequently re-acquires Fund shares (1) before January 31 of the calendar year following the calendar year in which the original stock was disposed of, (2) pursuant to
a reinvestment right received upon the purchase of the original shares and (3) at a reduced load charge (i.e., sales or additional charge), then any load charge incurred upon the acquisition of the original shares will
not be taken into account as part of the shareholder’s basis for computing gain or loss upon the sale of such shares, to the extent the original load charge does not exceed any reduction of the load charge with
respect to the acquisition of the subsequent shares. To the extent the original load charge is not taken into account on the disposition of the original shares, such charge shall be treated as incurred in connection
with the acquisition of the subsequent shares. In general, any gain or loss arising from (or treated as arising from) the sale or redemption of shares of a Fund will be considered capital gain or loss and will be long
term capital gain or loss if the shares were held for more than one year. However, any capital loss arising from the sale or redemption of shares held for six months or less will be treated as a long-term capital loss
to the extent of the amount of long-term capital gain dividends received on (or undistributed long-term capital gains credited with respect to) such shares.
Capital gain of a
non-corporate U.S. shareholder that is recognized in a taxable year beginning before January 1, 2013 is generally taxed at a maximum federal income tax rate of 15%, and thereafter at a maximum 20% rate, where the
property is held by the shareholder for more than one year. Capital gain of a corporate shareholder is taxed at the same rate as ordinary income.
Cost
Basis Reporting. Effective January 1, 2012, mutual funds must report cost basis information to you and the IRS when you sell or exchange shares acquired on or after January 1, 2012 in your non-retirement
accounts. The new cost basis regulations do not affect retirement accounts, money market funds, and shares acquired before January 1, 2012. The new regulations also require mutual funds to report whether a gain or loss
is short-term (shares held one year or less) or long-term (shares held more than one year) for all shares acquired on or after January 1, 2012 that are subsequently sold or exchanged. To calculate the gain or loss on
shares sold, you need to know the cost basis of the shares. Cost basis is the original value of an asset for tax purposes (usually the gross purchase price), adjusted for stock splits, reinvested dividends, and return
of capital distributions. This value is used to determine the capital gain (or loss), which is the difference between the cost basis of the shares and the gross proceeds when the shares are sold. The Fund’s
Transfer Agent supports several different cost basis methods from which you may select a cost basis method you believe best suited to your needs. If you decide to elect the Transfer Agent’s default method, which
is average cost, no action is required on your part. For shares acquired on or after January 1, 2012, if you change your cost basis method, the new method will apply to all shares in the account if you request the
change prior to the first redemption. If, however, you request the change after the first redemption, the new method will apply to shares acquired on or after the date of the change. Keep in mind that the Fund’s
Transfer Agent is not required to report cost basis information to you or the IRS on shares acquired before January 1, 2012. However, the Transfer Agent will provide this information to you, as a service, if its cost
basis records are complete for such shares. This information will be separately identified on the Form 1099-B (Proceeds from Broker and Barter Exchange Transactions) sent to you by the Transfer Agent and not
transmitted to the IRS.
BACKUP WITHHOLDING. A Fund will be required in certain cases to withhold and remit to the U.S. Treasury a portion of all dividends and capital gain dividends, and the proceeds of redemption of shares, paid to
any shareholder (1) who has provided the Fund with either an incorrect tax identification number or no number at all, (2) who is subject to backup withholding by the Internal Revenue Service (“IRS”) for
failure to report the receipt of interest or dividend income properly or (3) who has failed to certify to the Fund that it is not subject to backup withholding or that it is a corporation or other exempt recipient. In
addition, dividends and capital gain dividends made to corporate United States holders may be subject to information reporting and backup withholding. Backup withholding is not an additional tax and any amounts
withheld may be refunded or credited against a shareholder’s federal income tax liability, provided the appropriate information is furnished to the IRS.
If a shareholder
recognizes a loss with respect to a Fund’s shares of $2 million or more for an individual shareholder or $10 million or more for a corporate shareholder, the shareholder must file with the IRS a disclosure
statement on Form 8886. Direct shareholders of portfolio securities are in many cases exempted from this reporting requirement, but under current guidance, shareholders of a regulated investment company are not
exempted. The fact that a loss is reportable under these regulations does not affect the legal determination of whether the taxpayer’s treatment of the loss is proper. Shareholders should consult their tax
advisers to determine the applicability of these regulations in light of their individual circumstances.
MEDICARE CONTRIBUTION
TAX. For taxable years beginning after December 31, 2012, a U.S. person that is an individual or estate, or a trust that does not fall into a special class of trusts that is exempt from such
tax, will be subject to a 3.8% tax on the lesser of (1) the U.S. person’s “net investment income” for the relevant taxable year and (2) the excess of the U.S. person’s modified adjusted
81
gross income for the taxable year over a certain threshold (which in the case of individuals will be between $125,000 and $250,000, depending on the individual’s circumstances). A Fund
shareholder’s net investment income will generally include dividend income from the Fund and net gains from the disposition of Fund shares, unless such dividend income or net gains are derived in the ordinary
course of the conduct of a trade or business (other than a trade or business that consists of certain passive or trading activities). If you are a U.S. person that is an individual, estate or trust, you are urged to
consult your tax advisers regarding the applicability of the Medicare contribution tax to your income and gains in respect of your investment in the Fund shares.
FOREIGN SHAREHOLDERS. Dividends paid to a shareholder who, as to the United States, is a nonresident alien individual, foreign trust or estate, foreign corporation, or foreign partnership (“foreign
shareholder”) will be subject to U.S. withholding tax at the rate of 30% (or lower applicable treaty rate) on the gross amount of the dividend. Such a foreign shareholder would generally be exempt from U.S.
federal income tax, including withholding tax, on gains realized on the sale of shares of a Fund, net capital gain dividends, exempt interest dividends, and amounts retained by the Fund that are reported as
undistributed capital gains.
The foregoing applies
when the foreign shareholder’s income from a Fund is not effectively connected with a U.S. trade or business. If the income from a Fund is effectively connected with a U.S. trade or business carried on by a
foreign shareholder, then ordinary income dividends, qualified dividend income, net capital gain dividends, undistributed capital gains credited to such shareholder and any gains realized upon the sale of shares of the
Fund will be subject to U.S. federal income tax at the graduated rates applicable to U.S. citizens or domestic corporations.
Distributions that a Fund reports as “short-term capital gain dividends” or “long-term capital gain dividends” will not be treated as such to a recipient foreign shareholder if the
distribution is attributable to a REIT’s distribution to a Fund of a gain from the sale or exchange of U.S. real property or an interest in a U.S. real property holding corporation and a Fund’s direct or
indirect interests in U.S. real property exceed certain levels. Instead, if the foreign shareholder has not owned more than 5% of the outstanding shares of a Fund at any time during the one year period ending on the
date of distribution, such distributions will be subject to 30% withholding by a Fund and will be treated as ordinary dividends to the foreign shareholder; if the foreign shareholder owned more than 5% of the
outstanding shares of a Fund at any time during the one-year period ending on the date of the distribution, such distribution will be treated as real property gain subject to 35% withholding tax and could subject the
foreign shareholder to U.S. filing requirements. Additionally, if a Fund’s direct or indirect interests in U.S. real property were to exceed certain levels, a foreign shareholder realizing gains upon redemption
from a Fund could be subject to the 35% withholding tax and U.S. filing requirements unless more than 50% of a Fund’s shares were owned by U.S. persons at such time or unless the foreign person had not held more
than 5% of a Fund’s outstanding shares throughout either such person’s holding period for the redeemed shares or, if shorter, the previous five years.
The rules laid out in
the previous paragraph, other than the withholding rules, will apply notwithstanding a Fund’s participation in a wash sale transaction or its payment of a substitute dividend.
In the case of
foreign non-corporate shareholders, a Fund may be required to backup withhold U.S. federal income tax on distributions that are otherwise exempt from withholding tax unless such shareholders furnish the Fund with
proper notification of their foreign status.
The tax consequences
to a foreign shareholder entitled to claim the benefits of an applicable tax treaty may be different from those described herein. Foreign shareholders are urged to consult their own tax advisers with respect to the
particular tax consequences to them of an investment in a Fund, the procedure for claiming the benefit of a lower treaty rate and the applicability of foreign taxes.
FOREIGN TAXES. A Fund may be subject to foreign withholding taxes or other foreign taxes with respect to income (possibly including, in some cases, capital gain) received from sources within foreign
countries. So long as more than 50% by value of the total assets of the Fund at the close of the taxable year consists of (1) stock or securities of foreign issuers or (2) interests in other regulated investment
companies, the Fund may elect to treat any foreign income taxes paid by it as paid directly by its shareholders.
If the Fund makes the
election, each shareholder will be required to (i) include in gross income, even though not actually received, its pro rata share of the Fund’s foreign income taxes, and (ii) either deduct (in calculating U.S.
taxable income) or credit (in calculating U.S. federal income tax) its pro rata share of the Fund’s income taxes. A foreign tax credit may not exceed the U.S. federal income tax otherwise payable with respect to
the foreign source income. For this purpose, each shareholder must treat as foreign source gross income (i) its proportionate share of foreign taxes paid by the Fund and (ii) the portion of any actual dividend paid by
the Fund which represents income derived from foreign sources; the gain from the sale of securities will generally be treated as U.S. source income and certain foreign currency gains and losses likewise will be treated
as derived from U.S. sources. This foreign tax credit limitation is, with certain exceptions, applied separately to separate categories of income; dividends from the Fund will be treated as “passive” or
“general” income for this purpose. The effect of this limitation may be to prevent shareholders from claiming as a credit the full
Target
Asset Allocation Funds 82
amount of their pro rata share of the Fund’s foreign income taxes. In addition, shareholders will not be eligible to claim a foreign tax credit with respect to foreign income taxes paid by the Fund
unless certain holding period requirements are met at both the Fund and the shareholder levels.
A Fund will make such
an election only if it deems it to be in the best interest of its shareholders. A shareholder not subject to U.S. tax may prefer that this election not be made. The Fund will notify shareholders in writing each year if
it makes the election and of the amount of foreign income taxes, if any, to be passed through to the shareholders and the amount of foreign taxes, if any, for which shareholders of the Fund will not be eligible to
claim a foreign tax credit because the holding period requirements (described above) have not been satisfied.
WITHHOLDABLE PAYMENTS TO FOREIGN FINANCIAL ENTITIES AND OTHER FOREIGN ENTITIES. A 30% withholding tax will be imposed on certain payments that are made after December 31, 2013 to certain foreign financial institutions, investment funds and other non-U.S. persons that
fail to comply with information reporting requirements in respect of their direct and indirect United States shareholders and/or United States accountholders. Such payments would include U.S.-source dividends and,
beginning with payments made after December 31, 2014, the gross proceeds from the sale or other disposition of stock that can produce U.S.-source dividends.
STATE AND LOCAL TAX
MATTERS. Depending on the residence of the shareholders for tax purposes, distributions may also be subject to state and local taxes. Rules of state and local taxation regarding qualified dividend
income, ordinary income dividends and capital gains distributions from regulated investment companies and other items may differ from federal income tax rules. Shareholders are urged to consult their tax advisers as to
the consequences of these and other state and local tax rules affecting investment in a Fund.
CAPITAL LOSS CARRYFORWARDS.
Conservative
Allocation. Under the Regulated Investment Company Modernization Act of 2010 (the “Act”), the Fund is permitted to carryforward capital losses incurred in the fiscal year ended July 31,
2012 (“post-enactment losses”) for an unlimited period. Post-enactment losses are required to be utilized before the utilization of losses incurred prior to the effective date of the Act. As a result of
this ordering rule, capital loss carryforwards related to taxable years ending before July 31, 2012 (“pre-enactment losses”) may have an increased likelihood to expire unused. Additionally, post-enactment
capital losses that are carried forward will retain their character as either short-term or long-term capital losses rather than being considered all short-term as under previous law. The Fund utilized approximately
$4,868,000 of its pre-enactment losses to offset net taxable gains realized in the fiscal year ended July 31, 2012. No capital gains distributions are expected to be paid to shareholders until net gains have been
realized in excess of such losses. As of July 31, 2012, the pre-and post-enactment losses were approximately:
| Post-Enactment Losses: | $0 |
| Pre-Enactment Losses: | |
| Expiring 2018 | $3,368,000 |
Moderate Allocation. Under the Act, the Fund is permitted to carryforward capital losses incurred in the fiscal year ended July 31, 2012 (“post-enactment losses”) for an unlimited period.
Post-enactment losses are required to be utilized before the utilization of losses incurred prior to the effective date of the Act. As a result of this ordering rule, capital loss carryforwards related to taxable years
ending before July 31, 2012 (“pre-enactment losses”) may have an increased likelihood to expire unused. Additionally, post-enactment capital losses that are carried forward will retain their character as
either short-term or long-term capital losses rather than being considered all short-term as under previous law. The Fund utilized approximately $10,373,000 of its pre-enactment losses to offset net taxable gains
realized in the fiscal year ended July 31, 2012. No capital gains distributions are expected to be paid to shareholders until net gains have been realized in excess of such losses. As of July 31, 2012, the pre-and
post-enactment losses were approximately:
| Post-Enactment Losses: | $0 |
| Pre-Enactment Losses: | |
| Expiring 2018 | $25,836,000 |
Growth Allocation. Under the Act, the Fund is permitted to carryforward capital losses incurred in the fiscal year ended July 31, 2012 (”post-enactment losses”) for an unlimited period.
Post-enactment losses are required to be utilized before the utilization of losses incurred prior to the effective date of the Act. As a result of this ordering rule, capital loss carryforwards related to taxable years
ending
83
before July 31, 2012 (“pre-enactment losses”) may have an increased likelihood to expire unused. Additionally, post-enactment capital losses that are carried forward will retain their character
as either short-term or long-term capital losses rather than being considered all short-term as under previous law. The Fund utilized approximately $6,313,000 of its pre-enactment losses to offset net taxable gains
realized in the fiscal year ended July 31, 2012. No capital gains distributions are expected to be paid to shareholders until net gains have been realized in excess of such losses. As of July 31, 2012, the pre-and
post-enactment losses were approximately:
| Post-Enactment Losses: | $0 |
| Pre-Enactment Losses: | |
| Expiring 2018 | $36,798,000 |
The Fund elected to
treat post-October foreign currency losses of approximately $456,500 as having been incurred in the following fiscal year (July 31, 2013).
Under the Act, the
Target Asset Allocation Funds are permitted to carryforward capital losses incurred in taxable years beginning after December 22, 2010 (“post-enactment losses”) for an unlimited period. However, any
post-enactment losses are required to be utilized before the utilization of losses incurred prior to the effective date of the Act. As a result of this ordering rule, capital loss carryforwards related to the taxable
years beginning prior to the effective date of the Act may have an increased likelihood to expire unused. Additionally, post-enactment capital losses that are carried forward will retain their character as either
short-term or long-term capital losses rather than being considered all short-term as under previous law.
DISCLOSURE OF
PORTFOLIO HOLDINGS
The Funds' portfolio
holdings as of the end of the second and fourth fiscal quarters are made public, as required by law, in the Funds' annual and semi-annual reports. These reports are filed with the SEC on Form N-CSR and mailed to
shareholders within 60 days after the end of the second and fourth fiscal quarters. The Funds' annual and semi-annual reports are posted on the Funds' website at www.prudentialfunds.com. The Funds' portfolio holdings
as of the end of the first and third fiscal quarters are made public and filed with the SEC on Form N-Q within 60 days after the end of the Funds' first and third fiscal quarters, and may be accessed at www.sec.gov.
The Funds generally
post on the website a detailed list of the Funds' portfolio holdings as of the end of each calendar month no sooner than approximately three business days prior to the end of the following month. The detailed list of
portfolio holdings will generally remain available on the website for approximately one month, at which time the list will be replaced. (Note: The Target Portfolio Trust and the Target Asset Allocation Funds do not post portfolio holdings as of the end of each calendar month).
In addition, the
Funds may also release their top ten holdings, sector and country breakdowns, and largest industries on a quarterly or monthly basis, with the information as of a date 15 days prior to the release. Such information
will be posted on the website and will generally be available for viewing until replaced at the end of the subsequent quarter. However, if a money market fund is required to release any such information on a more
frequent basis pursuant to Rule 2a-7, then the money market fund will release such information in a manner consistent with Rule 2a-7.
Portfolio holdings
information which appears on the Funds' website may also be made available in printed form. When authorized by the Funds' Chief Compliance Officer and another officer of the Funds, portfolio holdings information may be
disseminated more frequently or at different periods than as described above.
The Funds have
entered into ongoing arrangements to make available information about the Funds' portfolio holdings. Parties receiving this information may include intermediaries that distribute Fund shares, third-party providers of
auditing, custody, proxy voting and other services for the Funds, rating and ranking organizations, and certain affiliated persons of the Funds, as described below. The procedures utilized to determine eligibility are
set forth below:
Procedures for Release of Portfolio Holdings Information:
1. A request for release of fund holdings shall be provided by such third party setting forth a legitimate business purpose for such release which shall specify the Fund, the terms of such release, and frequency (e.g., level of detail, staleness). The request shall address whether there are any conflicts of interest between Fund shareholders and the investment adviser, subadviser, principal underwriter or any affiliated person thereof and how such conflicts shall be dealt with to demonstrate that the disclosure is in the best interest of the shareholders of the Funds.
1. A request for release of fund holdings shall be provided by such third party setting forth a legitimate business purpose for such release which shall specify the Fund, the terms of such release, and frequency (e.g., level of detail, staleness). The request shall address whether there are any conflicts of interest between Fund shareholders and the investment adviser, subadviser, principal underwriter or any affiliated person thereof and how such conflicts shall be dealt with to demonstrate that the disclosure is in the best interest of the shareholders of the Funds.
2. The request shall
be forwarded to the Chief Compliance Officer of the Funds, or his delegate, for review and approval.
Target
Asset Allocation Funds 84
3. A confidentiality
agreement in the form approved by an officer of the Funds must be executed with the recipient of the fund holdings information.
4. An officer of the
Funds shall approve the release and agreement. Copies of the release and agreement shall be sent to PI's law department.
5. Written
notification of the approval shall be sent by such officer to PI's Fund Administration Department to arrange the release of fund holdings information.
6. PI's Fund
Administration Department shall arrange for the release of fund holdings information by the Funds' custodian bank(s).
As of the date of
this SAI, the Funds will provide:
1. Traditional
External Recipients/Vendors
| ■ | Full holdings on a daily basis to Institutional Shareholder Services (ISS), Broadridge and Glass, Lewis & Co. (proxy voting administrator/agents) at the end of each day; |
| ■ | Full holdings on a daily basis to ISS (securities class action claims administrator) at the end of each day; |
| ■ | Full holdings on a daily basis to a Fund's Subadviser(s), Custodian Bank, sub-custodian (if any) and accounting agents (which includes the Custodian Bank and any other accounting agent that may be appointed) at the end of each day. When a Fund has more than one Subadviser, each Subadviser receives holdings information only with respect to the “sleeve” or segment of the Fund for which the Subadviser has responsibility; |
| ■ | Full holdings to a Fund's independent registered public accounting firm as soon as practicable following the Fund's fiscal year-end or on an as-needed basis; and |
| ■ | Full holdings to financial printers as soon as practicable following the end of a Fund's quarterly, semi-annual and annual period-ends. |
2. Analytical Service
Providers
| ■ | Fund trades on a quarterly basis to Abel/Noser Corp. (an agency-only broker and transaction cost analysis company) as soon as practicable following a Fund's fiscal quarter-end; |
| ■ | Full holdings on a daily basis to FT Interactive Data (a fair value information service) at the end of each day; |
| ■ | Full holdings on a daily basis to FactSet Research Systems Inc. and Lipper, Inc. (investment research providers) at the end of each day; |
| ■ | Full holdings on a daily basis to Performance Explorer Limited (investment research provider for funds engaged in securities lending) at the end of each day, for certain funds; |
| ■ | Full holdings on a daily basis to Vestek (for preparation of fact sheets) at the end of each day (Target Portfolio Trust, and selected Prudential Investments Funds only); |
| ■ | Full holdings to Frank Russell Company (investment research provider) at the end of each month (Prudential Jennison Small Company Fund, Prudential Variable Contract Accounts -2 and -10 only); |
| ■ | Full holdings on a monthly basis to Fidelity Advisors (wrap program provider) approximately five days after the end of each month (Prudential Jennison Growth Fund and certain other selected Prudential Investments Funds only); |
| ■ | Full holdings on a daily basis to Brown Brothers Harriman & Co. (operations support) (Prudential Financial Services Fund only); |
| ■ | Full holdings on a daily basis to Markit WSO Corporation (certain operational functions)(Prudential Financial Services Fund only); |
| ■ | Full holdings on a daily basis to Investment Technology Group, Inc. (analytical service provider) (Prudential Financial Services Fund only); |
| ■ | Full holdings on a daily basis to State Street Bank and Trust Company (operations service provider) (Prudential Financial Services Fund only); and |
| ■ | Full holdings on a quarterly basis to Prudential Retirement Services / Watson Wyatt Investment Retirement Services (401(k) plan recordkeeping) approximately 30 days after the close of the Fund's fiscal quarter-end (Prudential Jennison Growth Fund only). |
In each case, the
information disclosed must be for a legitimate business purpose and is subject to a confidentiality agreement intended to prohibit the recipient from trading on or further disseminating such information (except for
legitimate business purposes). Such arrangements will be monitored on an ongoing basis and will be reviewed by the Chief Compliance Officer and PI's Law Department on an annual basis.
In addition, certain
authorized employees of PI receive portfolio holdings information on a quarterly, monthly or daily basis or upon request, in order to perform their business functions. All PI employees are subject to the requirements
of the personal securities trading policy of Prudential Financial, Inc., which prohibits employees from trading on or further disseminating confidential information, including portfolio holdings information.
85
Also, affiliated
shareholders may, subject to execution of a non-disclosure agreement, receive current portfolio holdings for the sole purpose of enabling the Funds to effect the payment of the redemption price to such shareholder in
whole or in part by a distribution in kind of securities from the investment portfolio of the Funds, in lieu of cash, in conformity with the rules of the SEC and procedures adopted by the Board. For more information
regarding the payment of the redemption price by a distribution in kind of securities from the investment portfolio of the Funds, see “Purchase, Redemption and Pricing of Fund Shares—Redemption in
Kind.”
The Board has
approved PI's Policy for the Dissemination of Portfolio Holdings. The Board shall, on a quarterly basis, receive a report from PI detailing the recipients of the portfolio holdings information and the reason for such
disclosure. The Board has delegated oversight over the Funds' disclosure of portfolio holdings to the Chief Compliance Officer.
There can be no
assurance that the policies and procedures on portfolio holdings information will protect the Funds from the potential misuse of such information by individuals or entities that come into possession of the information.
PROXY VOTING
The Board has
delegated to the Manager the responsibility for voting any proxies and maintaining proxy recordkeeping with respect to the Funds. The Manager is authorized by the Funds to delegate, in whole or in part, their proxy
voting authority to the investment subadviser(s) or third party vendors consistent with the policies set forth below. The proxy voting process shall remain subject to the supervision of the Board, including any
committee thereof established for that purpose.
The Manager and the
Board view the proxy voting process as a component of the investment process and, as such, seek to ensure that all proxy proposals are voted with the primary goal of seeking the optimal benefit for the Funds.
Consistent with this goal, the Board views the proxy voting process as a means to encourage strong corporate governance practices and ethical conduct by corporate management. The Manager and the Board maintain a policy
of seeking to protect the best interests of the Funds should a proxy issue potentially implicate a conflict of interest between the Funds and the Manager or its affiliates.
The Manager delegates
to the Funds' Subadviser(s) the responsibility for voting proxies. The Subadviser is expected to identify and seek to obtain the optimal benefit for the Funds, and to adopt written policies that meet certain minimum
standards, including that the policies be reasonably designed to protect the best interests of the Funds and delineate procedures to be followed when a proxy vote presents a conflict between the interests of the Funds
and the interests of the Subadviser or its affiliates. The Manager and the Board expect that the Subadviser will notify the Manager and Board at least annually of any such conflicts identified and confirm how the issue
was resolved. In addition, the Manager expects that the Subadviser will deliver to the Manager, or its appointed vendor, information required for filing the Form N-PX with the SEC. Information regarding how the Funds
voted proxies relating to their portfolio securities during the most recent twelve-month period ending June 30 is available without charge on the Funds' website and on the SEC's website at www.sec.gov.
A summary of the
proxy voting policies of the Subadviser(s) is set forth in its respective Appendix to this SAI.
CODES OF ETHICS
The
Board has adopted a Code of Ethics. In addition, the Manager, investment subadviser(s) and Distributors have each adopted a Code of Ethics. The Codes of Ethics apply to access persons (generally, persons who have
access to information about the Funds' investment program) and permit personnel subject to the Codes of Ethics to invest in securities, including securities that may be purchased or held by the Funds. However, the
protective provisions of the Codes of Ethics prohibit certain investments and limit such personnel from making investments during periods when the Funds are making such investments. The Codes of Ethics are on public
file with, and are available from, the SEC.
APPENDIX I: PROXY
VOTING POLICIES OF THE SUBADVISERS
EAGLE ASSET MANAGEMENT,
INC.
Eagle Proxy Voting
Policy. The exercise of proxy voting rights is an important element in the successful management of clients’ investments. Eagle Asset Management recognizes its fiduciary responsibility to
vote proxies solely in the best interests of clients with the overall goal of maximizing the growth of our clients’ assets. Toward that end, Eagle has developed a comprehensive and detailed set of proxy voting
guidelines, which our portfolio managers use to vote proxies in securities held in client accounts.
Eagle generally votes
proxies in furtherance of the long-term economic value of the underlying securities. We consider each proxy proposal on its own merits, and we make an independent determination of the advisability of supporting or
opposing management’s position. We believe that the recommendations of management should be given substantial weight, but we will not support management proposals, which we believe are detrimental to the
underlying value of our clients’ positions.
Target
Asset Allocation Funds 86
We usually oppose
proposals that dilute the economic interest of shareholders, and we also oppose those that reduce shareholders’ voting rights or otherwise limit their authority. With respect to takeover offers, Eagle calculates
a “going concern” value for every holding. If the offer approaches or exceeds our value estimate, we will generally vote for the merger, acquisition or leveraged buy-out.
In voting proxies of
securities held in client accounts, Eagle’s portfolio managers almost always recommend votes in accordance with the guidelines. By following predetermined voting guidelines, Eagle believes it will avoid any
potential conflicts of interests, which would otherwise affect proxy voting. On the rare occasion where a manager recommends a vote contrary to Eagle’s guidelines, Eagle’s Compliance Department will review
the proxy issue and the recommended vote to ensure that the vote is cast in compliance with Eagle’s overriding mandate to vote proxies in the best interests of clients and to avoid conflicts of interests.
A copy of
Eagle’s complete proxy voting policy and guidelines can be obtained by calling 800-237-3101. If you have any questions about these guidelines, or would like to know how your shares were voted, please contact our
Compliance Department at 800-237-3101.
EARNEST PARTNERS, LLC
Proxy Policies
As a general rule,
EARNEST Partners (the “Adviser”) will vote against actions which would reduce the rights or options of shareholders, reduce shareholder influence over the board of directors and management, reduce the
alignment of interests between management and shareholders, or reduce the value of shareholders’ investments. A partial list of issues that may require special attention are as follows: classified boards, change
of state of incorporation, poison pills, unequal voting rights plans, provisions requiring supermajority approval of a merger, executive severance agreements, and provisions limiting shareholder rights.
In addition, the
following will generally be adhered to unless the Adviser is instructed otherwise in writing by the Client:
The Adviser will
not actively engage in conduct that involves an attempt to change or influence the control of a portfolio company.
The Adviser will
not announce its voting intentions or the reasons for a particular vote.
The Advisor will
not participate in a proxy solicitation or otherwise seek proxy voting authority from any other portfolio company shareholder.
The Adviser will
not act in concert with any other portfolio company shareholders in connection with any proxy issue or other activity involving the control or management of a portfolio company.
All communications
with portfolio companies or fellow shareholders will be for the sole purpose of expressing and discussing the Adviser’s concerns for its Clients’ interests and not in an attempt to influence the control of
management.
Proxy Procedures
The Adviser has
designated a Proxy Director. The Proxy Director will consider each issue presented on each portfolio company proxy. The Proxy Director will also use available resources, including proxy evaluation services, to assist
in the analysis of proxy issues. Proxy issues presented to the Proxy Director will be voted in accordance with the judgment of the Proxy Director, taking into account the general policies outlined above and the
Adviser’s Proxy Voting Guidelines (currently ISS Taft-Hartley Advisory Services Proxy Voting Guidelines). Therefore, it is possible that actual votes may differ from these general policies and the Adviser’s
Proxy Voting Guidelines. In the case where the Adviser believes it has a material conflict of interest with a Client, the Proxy Director will utilize the services of outside third party professionals (currently ISS
Taft-Hartley Advisory Services) to assist in its analysis of voting issues and the actual voting of proxies to ensure that a decision to vote the proxies was based on the Client’s best interest and was not the
product of a conflict of interest. In general, ISS Taft-Hartley Advisory Services Proxy Voting Guidelines are based on a worker-owner view of long-term corporate value and conform to the AFL-CIO proxy voting policy. In
the event the services of an outside third party professional are not available in connection with a conflict of interest, the Adviser will seek the advice of the Client.
A detailed
description of the Adviser’s specific Proxy Voting Guidelines will be furnished upon written request. You may also obtain information about how the Adviser has voted with respect to portfolio company securities
by calling, writing, or emailing us at:
EARNEST Partners
1180 Peachtree Street NE, Suite 2300
Atlanta, GA 30309
invest@earnestpartners.com
404-815-8772
1180 Peachtree Street NE, Suite 2300
Atlanta, GA 30309
invest@earnestpartners.com
404-815-8772
The Adviser reserves
the right to change these policies and procedures at any time without notice.
EPOCH INVESTMENT
PARTNERS, INC.
Proxy Voting and Class
Action Monitoring Policy
87
Epoch votes proxies in a manner that it believes is most likely to enhance the economic value of the underlying securities held in client accounts. Epoch will not respond to proxy solicitor requests unless
Epoch determines that it is in the best interest of clients to do so.
Epoch does not
complete proofs-of-claim on behalf of clients for current or historical holdings; however, Epoch will assist clients with collecting information relevant to filing proofs-of-claim when such information is in the
possession of Epoch.
In light of
Epoch’s fiduciary duty to its clients, and given the complexity of the issues that may be raised in connection with proxy votes, the Firm has retained Institutional Shareholder Services, Inc. (“ISS”).
ISS is an independent adviser that specializes in providing a variety of fiduciary-level proxy-related services to institutional investment managers. The services provided to the Firm include in-depth research, voting
recommendations, vote execution and recordkeeping. Notwithstanding the foregoing, the Firm will use its best judgment to vote proxies in the manner it deems to be in the best interests of its clients. In the event that
judgment differs from that of ISS, the Firm will memorialize the reasons supporting that judgment and retain a copy of those records for the Firm’s files. Additionally, the CCO will periodically review the voting
of proxies to ensure that all such votes – particularly those diverging from the judgment of ISS – were voting consistent with the Firm’s fiduciary duties.
Procedures for Lent
Securities and Issuers in Share-blocking Countries
At times, neither
Epoch nor ISS will be allowed to vote proxies on behalf of Clients when those clients have adopted a securities lending program. The Firm recognizes that clients who have adopted securities lending programs have made a
general determination that the lending program provides a greater economic benefit than retaining the ability to vote proxies. Notwithstanding this fact, in the event that the Firm becomes aware of a proxy voting
matter that would enhance the economic value of the client’s position and that position is lent out, the Firm will make reasonable efforts to inform the client that neither the Firm nor ISS is able to vote the
proxy until the client recalls the lent security.
In certain markets
where share blocking occurs, shares must be “frozen” for trading purposes at the custodian or sub-custodian in order to vote. During the time that shares are blocked, any pending trades will not settle.
Depending on the market, this period can last from one day to three weeks. Any sales that must be executed will settle late and potentially be subject to interest charges or other punitive fees. For this reason, in
blocking markets, the Firm retains the right to vote or not, based on the determination of the Firm’s investment personnel. If the decision is made to vote, the Firm will process votes through ISS unless other
action is required as detailed in this policy.
Procedures for Specific
Conflicts of Interest
Conflict Scenario 1: In the event that Epoch intends to deviate from the proxy voting recommendation of ISS and if an EPHC Board Member is also a board member of the public company with the proxy being voted
upon, then Epoch shall bring the proxy voting issue to the attention of affected Clients for guidance on how to vote the proxy.
Conflict Scenario 2: In the event that Epoch intends to deviate from the proxy voting recommendation of ISS and where the public company is an entity that Epoch has a significant business relationship, then
Epoch shall bring the proxy voting issue to the attention of affected Clients for guidance on how to vote the proxy.
For the purpose of
this policy, a “significant business relationship” means (a) a broker-dealer that comprises 10 percent or more of the Firm’s total dollar amount of transaction flow for the prior 12 months; (b) a firm
that is the sponsor of a wrap program or managed account platform for which Epoch is currently a manager but only to the extent that Firm’s revenue from such program or platform exceeds 10% of the Firm’s
total revenue; (c) a Client that is a public company that has retained the Firm as an investment manager and the Client has at least $50 million in assets under management with the Firm; and (d) a Client that is a
401(k) plan or defined benefit plan for a public company that has retained the Firm as an investment manager and the Client has at least $50 million in assets under management with the Firm.
Procedures for Proxy
Solicitation
In the event that any
officer or employee of Epoch receives a request to reveal or disclose of Epoch’s voting intention on a specific proxy event, then the officer or employee must forward the solicitation onto the Chief Compliance
Officer.
Procedures for Voting
Disclosure
Upon request, Epoch
will provide clients with their specific proxy voting history.
Target
Asset Allocation Funds 88
Recordkeeping
Epoch must maintain
the documentation described in the following section for a period of not less than five (5) years, the first two (2) years at its principal place of business. The Firm will be responsible for the following procedures
and for ensuring that the required documentation is retained.
Client request to
review proxy votes:
The Client Service
group will record the identity of the client, the date of the request, and the disposition (e.g., provided a written or oral response to client’s request, referred to third party, not a proxy voting client, other
dispositions, etc.) in a suitable place.
Furnish the
information requested, free of charge, to the client within a reasonable time period (within 10 business days). Maintain a copy of the written record provided in response to client’s written (including e-mail) or
oral request.
Proxy voting records:
The proxy voting
record periodically provided by ISS.
Documents prepared or
created by Epoch that were material to making a decision on how to vote, or that memorialized the basis for the decision.
Documentation or
notes or any communications received from third parties, other industry analysts, third party service providers, company’s management discussions, etc. that were material in the basis for the decision.
Disclosure
The CCO will ensure
that Part 2A of Form ADV is updated as necessary to reflect: (i) all material changes to this policy; and (ii) regulatory requirements related to proxy voting disclosure.
HOTCHKIS AND WILEY
CAPITAL MANAGEMENT, LLC (HWCM)
Proxy Voting Summary. Generally, and except to the extent that a client otherwise instructs HWCM in writing, HWCM will vote (by proxy or otherwise) on all matters for which a shareholder vote is solicited by, or
with respect to, issuers of securities beneficially held in client accounts in such manner as HWCM deems appropriate in accordance with its written policies and procedures. These policies and procedures set forth
guidelines for voting typical proxy proposals. However, each proxy issue will be considered individually in order that HWCM may consider what would be in its clients’ best interest. Further, where a proxy
proposal raises a material conflict of interest between the interests of HWCM and its client, HWCM will vote according to its predetermined specific policy. HWCM’s Compliance Department will review the vote to
determine that the decision was based on the client’s best interest rather than the best interest of HWCM.
Although HWCM has
affiliates that provide investment advisory, broker-dealer, insurance or other financial services, it does not generally receive information about the business arrangements of such affiliates (except with regard to
limited matters such as underwritings by the broker-dealer) or the directors, officers and employees of such affiliates. Therefore, HWCM is unable to consider such information in its process of determining whether
there are material conflicts of interests.
HWCM
may determine not to vote proxies in respect of securities of any issuer if it determines that it would be in the clients’ overall best interest not to vote under the circumstances, such as when the cost of
voting exceeds the expected benefit, or if the security is no longer held in the client's portfolios by the proxy meeting date. For example, to the extent that HWCM receives proxies for securities that are transferred
into a client’s portfolio that were not recommended or selected by HWCM and have been sold or are expected to be sold promptly in an orderly manner (“legacy securities”), HWCM will generally refrain
from voting such proxies. In such circumstances, since legacy securities have been sold or are expected to be sold promptly, voting proxies on such securities would not further HWCM’s interest in maximizing the
value of client investments. HWCM may consider an institutional client’s special request to vote a legacy security proxy, and if agreed would vote such proxy in accordance with HWCM’s guidelines. If HWCM is
authorized to exercise proxy voting rights for a client account, HWCM will vote the proxies for securities beneficially held by the custodian for the portfolio as of the record date of the shareholder meetings
(settlement date). Securities not held by the custodian as of the record date (e.g., due to an unsettled purchase or securities lending) will not be voted by HWCM. Employees of HWCM may own the same securities held by
client accounts. The employees vote their securities independently from HWCM’s proxy voting policy.
HWCM utilizes a
third-party service provider to provide administrative assistance in connection with the voting of proxies, including certain record keeping and reporting functions.
89
LSV ASSET MANAGEMENT
LSV Asset Management
(“LSV”) has adopted proxy voting guidelines that provide direction in determining how various types of proxy issues are to be voted.
LSV’s purely
quantitative investment process does not provide output or analysis that would be functional in analyzing proxy issues. LSV therefore will retain an independent, expert third party, currently Glass Lewis & Co.
(“GLC”). GLC will implement LSV’s proxy voting process, provide assistance in developing guidelines for client accounts that are updated for current corporate governance issues, helping to ensure that
clients’ best interests are served by voting decisions, and provide analysis of proxy issues on a case-by-case basis. LSV is responsible for monitoring GLC to ensure that proxies are appropriately voted. LSV will
vote issues contrary to, or issues not covered by, the guidelines only when LSV believes it is in the best interest of the client. Where the client has provided proxy voting guidelines to LSV, those guidelines will be
followed, unless it is determined that a different vote would add more value to the client’s holding of the security in question. Direction from a client on a particular proxy vote will take precedence over the
guidelines. Clients are sent a copy of their respective guidelines on an annual basis. LSV’s use of GLC is not a delegation of LSV’s fiduciary obligation to vote proxies for clients.
Should a material
conflict arise between LSV’s interest and that of its clients (e.g., a client bringing a shareholder action has solicited LSV’s support; LSV manages a pension plan for a company whose management is
soliciting proxies; or an LSV employee has a relative involved in management at an investee company), LSV will vote the proxies in accordance with the recommendation of the independent third party proxy voting service.
A written record will be maintained describing the conflict of interest, and an explanation of how the vote taken was in the client’s best interest.
LSV may refrain from
voting a proxy if the cost of voting the proxy exceeds the expected benefit to the client, for example in the case of voting a foreign security when the proxy must be translated into English or the vote must be cast in
person.
Clients may receive a
copy of LSV’s voting record for their account by request. LSV will additionally provide any mutual fund for which LSV acts as adviser or sub-adviser, a copy of LSV’s voting record for the fund so that the
fund may fulfill its obligation to report proxy votes to fund shareholders.
Recordkeeping. In accordance with the recordkeeping rules, LSV will retain copies of its proxy voting policies and procedures; a copy of each proxy statement received regarding client securities
(maintained by the proxy voting service and/or available on EDGAR); a record of each vote cast on behalf of a client (maintained by the proxy voting service); a copy of any document created that was material to the
voting decision or that memorializes the basis for that decision (maintained by the proxy voting service); a copy of clients’ written requests for proxy voting information and a copy of LSV’s written
response to a client’s request for proxy voting information for the client’s account; and LSV will ensure that it may obtain access to the proxy voting service’s records promptly upon LSV’s
request.
MARSICO CAPITAL
MANAGEMENT, LLC. It is the policy of Marsico Capital Management, LLC (“MCM”) to seek to vote or otherwise process, such as by a decision to abstain from voting or to take no action on, proxies
over which it has voting authority in the best interests of MCM’s clients, as summarized here.
MCM’s security
analysts generally review proxy proposals as part of their monitoring of portfolio companies. Under MCM’s investment discipline, one of the qualities that MCM generally seeks in companies selected for client
portfolios is good management teams that generally seek to serve shareholder interests. Because MCM believes that the management teams of most companies it invests in generally seek to serve shareholder interests, MCM
believes that voting proxy proposals in clients’ best economic interests usually means voting with the recommendations of these management teams (including their boards of directors).
In certain
circumstances, MCM’s vote-by-vote analysis of proxy proposals could lead it to conclude that particular management or board recommendations may not appear as closely aligned with shareholder interests as MCM may
deem desirable, or could be disregarded in the best interests of shareholders. In those and other circumstances, MCM may, in its sole discretion, vote against a management or board recommendation (or abstain or take no
action) based on its analysis if such a vote appears consistent with the best interests of clients.
MCM may process
certain proxies without voting them, such as by making a decision to abstain from voting or take no action on such proxies (or on certain proposals within such proxies). Examples include, without limitation, proxies
issued by companies that MCM has decided to sell, proxies issued for securities that MCM did not select for a client portfolio (such as, without limitation, securities that were selected by a previous adviser,
unsupervised securities held in a client’s account, money market securities, or other securities selected by clients or their representatives other than MCM), or proxies issued by foreign companies that impose
burdensome or unreasonable voting, power of attorney, or holding requirements. MCM also may abstain from voting, or take no
Target
Asset Allocation Funds 90
action on, proxies in other circumstances, such as when voting may not be in the best interests of clients, as an alternative to voting with (or against) management, or when voting may be unduly
burdensome or expensive, or if MCM may have a material conflict of interest in voting certain proxies and alternative voting procedures are not desirable.
In circumstances when
there may be an apparent material conflict of interest between MCM’s interests and clients’ interests in how proxies are voted (such as when MCM knows that a proxy issuer is also an MCM client), MCM
generally will resolve any appearance concerns by causing those proxies to be “echo voted” or “mirror voted” in the same proportion as other votes, by voting the proxies as recommended by an
independent service provider, or by abstaining or taking no action. In other cases, MCM might use other procedures to resolve an apparent material conflict.
MCM may use an
independent service provider to assist in voting proxies, keep voting records, and disclose voting information to clients. MCM’s Proxy Voting policy and reports describing the voting of a client’s proxies
are available to the client on request.
MCM seeks to ensure
that, to the extent reasonably feasible, proxies for which MCM receives ballots in good order and receives timely notice will be voted or otherwise processed (such as through a decision to abstain or take no action) as
intended under MCM’s Proxy Voting policy and procedures. MCM may be unable to vote or otherwise process proxy ballotsthat are not received or processedin a timely manner due tofunctional limitations of the proxy
voting system, custodial limitations, or other factors beyond MCM’s control. Such ballots may include, without limitation,ballots for securities out on loan under securities lending programs initiated by the
client or its custodian, ballots not timely forwarded by a custodian,or ballots for which MCM does not timely receive essential information such as the proxy proposal itself or modifications to the required voting
date. Other ballots may be voted but not counted, or may be counted in an unexpected way, because of factors such as foreign voting requirements or other limitations.
MASSACHUSETTS FINANCIAL SERVICES COMPANY (MFS). Massachusetts Financial Services Company, MFS Institutional Advisors, Inc., MFS International (UK) Limited, MFS Heritage Trust Company, McLean Budden Limited and MFS’ other
subsidiaries that perform discretionary investment management activities (collectively, “MFS”) have adopted proxy voting policies and procedures, as set forth below (“MFS Proxy Voting Policies and
Procedures”), with respect to securities owned by the clients for which MFS serves as investment adviser and has the power to vote proxies, including the pooled investment vehicles sponsored by MFS (the
“MFS Funds”). References to “clients” in these policies and procedures include the MFS Funds and other clients of MFS, such as funds organized offshore, sub-advised funds and separate account
clients, to the extent these clients have delegated to MFS the responsibility to vote proxies on their behalf under the MFS Proxy Voting Policies and Procedures.
The MFS Proxy Voting
Policies and Procedures include:
| A. | Voting Guidelines; |
| B. | Administrative Procedures; |
| C | Records Retention; and |
| D. | Reports. |
| A. | VOTING GUIDELINES |
1.General Policy; Potential Conflicts of Interest
MFS’ policy is
that proxy voting decisions are made in what MFS believes to be the best long-term economic interests of MFS’ clients, and not in the interests of any other party or in MFS' corporate interests, including
interests such as the distribution of MFS Fund shares and institutional client relationships.
In developing these
proxy voting guidelines, MFS reviews corporate governance issues and proxy voting matters that are presented for shareholder vote by either management or shareholders of public companies. Based on the overall principle
that all votes cast by MFS on behalf of its clients must be in what MFS believes to be the best long-term economic interests of such clients, MFS has adopted proxy voting guidelines, set forth below, that govern how
MFS generally will vote on specific matters presented for shareholder vote.
As a general matter,
MFS votes consistently on similar proxy proposals across all shareholder meetings. However, some proxy proposals, such as certain excessive executive compensation, environmental, social and governance matters, are
analyzed on a case-by-case basis in light of all the relevant facts and circumstances of the proposal. Therefore, MFS may vote similar proposals
91
differently at different shareholder meetings based on the specific facts and circumstances of the issuer or the terms of the proposal. In addition, MFS also reserves the right to override the guidelines
with respect to a particular proxy proposal when such an override is, in MFS’ best judgment, consistent with the overall principle of voting proxies in the best long-term economic interests of MFS’ clients.
MFS also generally
votes consistently on the same matter when securities of an issuer are held by multiple client accounts, unless MFS has received explicit voting instructions to vote differently from a client for its own account. From
time to time, MFS may also receive comments on the MFS Proxy Voting Policies and Procedures from its clients. These comments are carefully considered by MFS when it reviews these guidelines and revises them as
appropriate.
These policies and
procedures are intended to address any potential material conflicts of interest on the part of MFS or its subsidiaries that are likely to arise in connection with the voting of proxies on behalf of MFS’ clients.
If such potential material conflicts of interest do arise, MFS will analyze, document and report on such potential material conflicts of interest (see Sections B.2 and D below), and shall ultimately vote the relevant
proxies in what MFS believes to be the best long-term economic interests of its clients. The MFS Proxy Voting Committee is responsible for monitoring and reporting with respect to such potential material conflicts of
interest.
MFS is also a
signatory to the United Nations Principles for Responsible Investment. In developing these guidelines, MFS considered environmental, social and corporate governance issues in light of MFS’ fiduciary obligation to
vote proxies in the best long-term economic interest of its clients.
| B. | ADMINISTRATIVE PROCEDURES |
1. MFS Proxy Voting Committee
The administration of
these MFS Proxy Voting Policies and Procedures is overseen by the MFS Proxy Voting Committee, which includes senior personnel from the MFS Legal and Global Investment Support Departments. The Proxy Voting Committee
does not include individuals whose primary duties relate to client relationship management, marketing, or sales. The MFS Proxy Voting Committee:
a.
Reviews these MFS Proxy Voting Policies and Procedures at least annually and recommends any amendments considered to be necessary or advisable;
b. Determines whether
any potential material conflict of interest exists with respect to instances in which MFS (i) seeks to override these MFS Proxy Voting Policies and Procedures; (ii) votes on ballot items not governed by these MFS Proxy
Voting Policies and Procedures; (iii) evaluates an excessive executive compensation issue in relation to the election of directors; or (iv) requests a vote recommendation from an MFS portfolio manager or investment
analyst (e.g. mergers and acquisitions); and
c. Considers special
proxy issues as they may arise from time to time.
2. Potential Conflicts of Interest
The
MFS Proxy Voting Committee is responsible for monitoring potential material conflicts of interest on the part of MFS or its subsidiaries that could arise in connection with the voting of proxies on behalf of MFS’
clients. Due to the client focus of our investment management business, we believe that the potential for actual material conflict of interest issues is small. Nonetheless, we have developed precautions to assure that
all proxy votes are cast in the best long-term economic interest of shareholders.1 Other MFS internal policies require all MFS employees to avoid actual and potential conflicts of interests between personal activities and MFS’ client
activities. If an employee identifies an actual or potential conflict of interest with respect to any voting decision, then that employee must recuse himself/herself from participating in the voting process.
Additionally, with respect to decisions concerning all Non-Standard Votes, as defined below, MFS will review the securities holdings reported by investment professionals that participate in such decisions to determine
whether such person has a direct economic interest in the decision, in which case such person shall not further participate in making the decision. Any significant attempt by an employee of MFS or its subsidiaries to
unduly influence MFS’ voting on a particular proxy matter should also be reported to the MFS Proxy Voting Committee.
In cases where
proxies are voted in accordance with these MFS Proxy Voting Policies and Procedures, no material conflict of interest will be deemed to exist. In cases where (i) MFS is considering overriding these MFS Proxy Voting
Policies and Procedures, (ii) matters presented for vote are not governed by these MFS Proxy Voting Policies and Procedures, (iii) MFS evaluates a potentially excessive executive compensation issue in relation to the
election of directors or advisory pay or severance package vote, or (iv) a vote recommendation is requested from an MFS portfolio manager or investment analyst (e.g. mergers and acquisitions) (collectively,
“Non-Standard Votes”); the MFS Proxy Voting Committee will follow these procedures:
Target
Asset Allocation Funds 92
a.
Compare the name of the issuer of such proxy against a list of significant current (i) distributors of MFS Fund shares, and (ii) MFS institutional clients (the “MFS Significant Client List”);
b. If the name of the
issuer does not appear on the MFS Significant Client List, then no material conflict of interest will be deemed to exist, and the proxy will be voted as otherwise determined by the MFS Proxy Voting Committee;
c. If the name of the
issuer appears on the MFS Significant Client List, then the MFS Proxy Voting Committee will be apprised of that fact and each member of the MFS Proxy Voting Committee will carefully evaluate the proposed vote in order
to ensure that the proxy ultimately is voted in what MFS believes to be the best long-term economic interests of MFS’ clients, and not in MFS' corporate interests; and
d. For all potential
material conflicts of interest identified under clause (c) above, the MFS Proxy Voting Committee will document: the name of the issuer, the issuer’s relationship to MFS, the analysis of the matters submitted for
proxy vote, the votes as to be cast and the reasons why the MFS Proxy Voting Committee determined that the votes were cast in the best long-term economic interests of MFS’ clients, and not in MFS' corporate
interests. A copy of the foregoing documentation will be provided to MFS’ Conflicts Officer.
The members of the
MFS Proxy Voting Committee are responsible for creating and maintaining the MFS Significant Client List, in consultation with MFS’ distribution and institutional business units. The MFS Significant Client List
will be reviewed and updated periodically, as appropriate.
If
an MFS client has the right to vote on a matter submitted to shareholders by Sun Life Financial, Inc. or any of its affiliates (collectively “Sun Life”), MFS will cast a vote on behalf of such MFS client
pursuant to the recommendations of Institutional Shareholder Services, Inc.'s (“ISS”) benchmark policy, or as required by law.
Except as described
in the MFS Fund's prospectus, from time to time, certain MFS Funds (the “top tier fund”) may own shares of other MFS Funds (the “underlying fund”). If an underlying fund submits a matter to a
shareholder vote, the top tier fund will generally vote its shares in the same proportion as the other shareholders of the underlying fund. If there are no other shareholders in the underlying fund, the top tier fund
will vote in what MFS believes to be in the top tier fund’s best long-term economic interest. If an MFS client has the right to vote on a matter submitted to shareholders by a pooled investment vehicle advised by
MFS, MFS will cast a vote on behalf of such MFS client in the same proportion as the other shareholders of the pooled investment vehicle.
3. Gathering Proxies
Most proxies received
by MFS and its clients originate at Broadridge Financial Solutions, Inc. (“Broadridge”). Broadridge and other service providers, on behalf of custodians, send proxy related material to the record holders of
the shares beneficially owned by MFS’ clients, usually to the client’s proxy voting administrator or, less commonly, to the client itself. This material will include proxy ballots reflecting the
shareholdings of Funds and of clients on the record dates for such shareholder meetings, as well as proxy materials with the issuer’s explanation of the items to be voted upon.
MFS,
on behalf of itself and certain of its clients (including the MFS Funds) has entered into an agreement with an independent proxy administration firm pursuant to which the proxy administration firm performs various
proxy vote related administrative services such as vote processing and recordkeeping functions. Except as noted below, the proxy administration firm for MFS and its clients, including the MFS Funds, is ISS. The proxy
administration firm for MFS Development Funds, LLC is Glass, Lewis & Co., Inc. (“Glass Lewis”; Glass Lewis and ISS are each hereinafter referred to as the “Proxy Administrator”).
The Proxy
Administrator receives proxy statements and proxy ballots directly or indirectly from various custodians, logs these materials into its database and matches upcoming meetings with MFS Fund and client portfolio
holdings, which are input into the Proxy Administrator’s system by an MFS holdings data-feed. Through the use of the Proxy Administrator system, ballots and proxy material summaries for all upcoming
shareholders’ meetings are available on-line to certain MFS employees and members of the MFS Proxy Voting Committee.
It is the
responsibility of the Proxy Administrator and MFS to monitor the receipt of ballots. When proxy ballots and materials for clients are received by the Proxy Administrator, they are input into the Proxy
Administrator’s on-line system. The Proxy Administrator then reconciles a list of all MFS accounts that hold shares of a company’s stock and the number of shares held on the record date by these accounts
with the Proxy Administrator’s list of any upcoming shareholder’s meeting of that company. If a proxy ballot has not been received, the Proxy Administrator contacts the custodian requesting the reason as to
why a ballot has not been received.
4. Analyzing Proxies
93
Proxies are voted in accordance with these MFS Proxy Voting Policies and Procedures. The Proxy Administrator, at the prior direction of MFS, automatically votes all proxy matters that do not require the
particular exercise of discretion or judgment with respect to these MFS Proxy Voting Policies and Procedures as determined by MFS. With respect to proxy matters that require the particular exercise of discretion or
judgment, the MFS Proxy Voting Committee considers and votes on those proxy matters. MFS also receives research and recommendations from the Proxy Administrator which it may take into account in deciding how to vote.
MFS uses the research of ISS to identify (i) circumstances in which a board may have approved excessive executive compensation, (ii) environmental and social proposals that warrant consideration or (iii) circumstances
in which a non-U.S. company is not in compliance with local governance or compensation best practices. In those situations where the only MFS fund that is eligible to vote at a shareholder meeting has Glass Lewis as
its Proxy Administrator, then we will rely on research from Glass Lewis to identify such issues. Representatives of the MFS Proxy Voting Committee review, as appropriate, votes cast to ensure conformity with these MFS
Proxy Voting Policies and Procedures.
As a general matter,
portfolio managers and investment analysts have little or no involvement in most votes taken by MFS. This is designed to promote consistency in the application of MFS’ voting guidelines, to promote consistency in
voting on the same or similar issues (for the same or for multiple issuers) across all client accounts, and to minimize the potential that proxy solicitors, issuers, or third parties might attempt to exert
inappropriate influence on the vote. In limited types of votes (e.g. mergers and acquisitions, capitalization matters, potentially excessive executive compensation issues, or shareholder proposals relating to
environmental and social issues), a representative of MFS Proxy Voting Committee may consult with or seek recommendations from MFS portfolio managers or investment analysts.2 However, the MFS Proxy Voting Committee would ultimately determine the manner in which all proxies are voted.
As noted above, MFS
reserves the right to override the guidelines when such an override is, in MFS’ best judgment, consistent with the overall principle of voting proxies in the best long-term economic interests of MFS’
clients. Any such override of the guidelines shall be analyzed, documented and reported in accordance with the procedures set forth in these policies.
5. Voting Proxies
In accordance with
its contract with MFS, the Proxy Administrator also generates a variety of reports for the MFS Proxy Voting Committee, and makes available on-line various other types of information so that the MFS Proxy Voting
Committee may review and monitor the votes cast by the Proxy Administrator on behalf of MFS’ clients.
6. Securities Lending
From time to time,
the MFS Funds or other pooled investment vehicles sponsored by MFS may participate in a securities lending program. In the event MFS or its agent receives timely notice of a shareholder
meeting for a U.S. security, MFS and its agent will attempt to recall any securities on loan before the meeting’s record date so that MFS will be entitled to vote these shares. However,
there may be instances in which MFS is unable to timely recall securities on loan for a U.S. security, in which cases MFS will not be able to vote these shares. MFS will report to the appropriate board of the
MFS Funds those instances in which MFS is not able to timely recall the loaned securities. MFS generally does not recall non-U.S. securities on loan because there may be insufficient advance notice of
proxy materials, record dates, or vote cut-off dates to allow MFS to timely recall the shares in certain markets. As a result, non-U.S. securities that are on loan will not generally be voted. If MFS receives timely
notice of what MFS determines to be an unusual, significant vote for a non-U.S. security whereas MFS shares are on loan, and determines that voting is in the best long-term economic interest of shareholders, then MFS
will attempt to timely recall the loaned shares.
7. Engagement
The
MFS Proxy Voting Policies and Procedures are available on www.mfs.com and may be accessed by both MFS’ clients and the companies in which MFS’ clients invest. From time to time, MFS may determine that it is
appropriate and beneficial for representatives from the MFS Proxy Voting Committee to engage in a dialogue or written communication with a company or other shareholders regarding certain matters on the company’s
proxy statement that are of concern to shareholders, including environmental, social and governance matters. A company or shareholder may also seek to engage with representatives of the MFS Proxy Voting Committee in
advance of the company’s formal proxy solicitation to review issues more generally or gauge support for certain contemplated proposals.
| C. | RECORDS RETENTION |
MFS will retain
copies of these MFS Proxy Voting Policies and Procedures in effect from time to time and will retain all proxy voting reports submitted to the Board of Trustees and Board of Managers of the MFS Funds for the period
required by applicable law. Proxy solicitation materials, including electronic versions of the proxy ballots completed by representatives of the MFS Proxy Voting Committee, together with their respective notes and
comments, are maintained in an electronic format by the Proxy Administrator and
Target
Asset Allocation Funds 94
are accessible on-line by the MFS Proxy Voting Committee. All proxy voting materials and supporting documentation, including records generated by the Proxy Administrator’s system as to proxies
processed, including the dates when proxy ballots were received and submitted, and the votes on each company’s proxy issues, are retained as required by applicable law.
| D. | REPORTS |
All MFS Advisory Clients
MFS may publicly
disclose the proxy voting records of certain clients or the votes it casts with respect to certain matters as required by law. At any time, a report can also be printed by MFS for each client who has requested that MFS
furnish a record of votes cast. The report specifies the proxy issues which have been voted for the client during the year and the position taken with respect to each issue and, upon request, may identify situations
where MFS did not vote in accordance with the MFS Proxy Voting Policies and Procedures.
Except as described
above, MFS generally will not divulge actual voting practices to any party other than the client or its representatives because we consider that information to be confidential and proprietary to the client. However, as
noted above, MFS may determine that it is appropriate and beneficial to engage in a dialogue with a company regarding certain matters. During such dialogue with the company, MFS may disclose the vote it intends to cast
in order to potentially effect positive change at a company in regards to environmental, social or governance issues.
1 For clarification purposes, note that MFS votes in what we believe to be the best, long-term economic interest of our clients entitled to vote at the shareholder
meeting, regardless of whether other MFS clients hold “short” positions in the same issuer.
2 From time to time, due to travel schedules and other commitments, an appropriate portfolio manager or research analyst may not be available to provide a vote
recommendation. If such a recommendation cannot be obtained within a reasonable time prior to the cut-off date of the shareholder meeting, the MFS Proxy Voting Committee may determine to abstain from voting.
NFJ INVESTMENT GROUP LLC.
General Policy. NFJ Investment Group LLC (“NFJ”) votes proxies as part of its authority to manage, acquire, and dispose of account assets, unless the client has explicitly reserved the
authority for itself. This policy is designed and implemented in a manner reasonable expected to ensure that voting rights are exercised in the best interest of NFJ’s clients and in compliance with Rule 206(4)-6
of the Investment Advisers Act of 1940, other applicable rules of the Securities and Exchange Commission and NFJ’s fiduciary obligations. When voting proxies, NFJ’s primary objective is to make voting
decisions solely in the best interests of its clients by voting proxies in a manner intended to enhance the economic value of the underlying portfolio securities held in its clients’ accounts.
This policy sets
forth the general standards for proxy voting whereby NFJ has authority to vote its client’s proxies with respect to portfolio securities held in the accounts of its clients for whom it provides discretionary
investment management services. These include:
| ■ | Exercising responsibility for voting decisions; |
| ■ | Resolving conflicts of interest; |
| ■ | Making appropriate disclosures to clients; |
| ■ | Creating and maintaining appropriate records; |
| ■ | Providing clients access to voting records; and |
| ■ | Outsourcing the proxy voting administrative process. |
Responsibility for
Voting Decisions. Exercise of shareholder voting rights is an investment decision. Accordingly, it is the responsibility of NFJ’s senior management to ensure that voting decisions are organized and
conducted in accordance with portfolio objectives and any applicable legal requirements. In order to ensure that this obligation is carried out, the senior management of NFJ has designated a committee to be responsible
for all aspects of the exercise of shareholder rights (the “Proxy Committee”). The Proxy Committee is comprised of NFJ professionals as provided for in the charter of the Proxy Committee. The Proxy
Committee shall have the responsibility for oversight of the proxy voting process for all NFJ clients, except for clients who have retained the right to vote their own proxies, either generally or on any specific
matter. To the extent a client instructs NFJ to direct voting on a particular issue, the Proxy Committee shall evaluate such request on a case-by-case basis.
The Proxy Committee. The Proxy Committee shall be governed by this policy and will perform the following duties:
| ■ | Establish NFJ’s proxy voting guidelines, with such advice, participation and research as the Proxy Committee deems appropriate from the investment professionals, proxy voting services or other knowledgeable interested parties. |
| ■ | To the extent the proxy guidelines do not cover potential proxy voting issues, discuss and determine the process for determining how to vote such issues. |
95
| ■ | Develop a process for the resolution of voting issues that require a case-by-case analysis or involve a conflict of interest (including the involvement of the appropriate investment professionals as necessary) and monitor such process. |
| ■ | Vote or engage a third party service provider to vote proxies in accordance with NFJ’s guidelines. |
| ■ | Document, in the form of a report, the resolution of any conflicts of interest between NFJ and its clients, and provide or make available, adequate documentation to support that conflicts were resolved in a fair, equitable and consistent manner that is in the interest of clients. |
| ■ | Approve and monitor the outsourcing of voting obligations to third-parties. |
| ■ | Oversee the maintenance of records regarding voting decisions in accordance with the standards set forth by this policy. |
| ■ | The Proxy Committee shall review, at least annually, all applicable processes and procedures, voting practices, the adequacy of records and the use of third party services. |
Obligation to Vote. When an investment management or client relationship is established, the obligation of NFJ to vote may be inherent in the relationship or, in some cases, implied as a matter of law. In some
situations, the client may prefer to vote (or direct the voting) for portfolio securities. To the extent a client wishes to retain voting authority, the client specifically must do so in writing.
Voting Proxies.
WRITTEN PROXY VOTING
GUIDELINES. NFJ shall establish general voting guidelines for recurring proposals (“Voting Guidelines”). The Voting Guidelines should address routine as well as significant matters commonly
encountered. The Voting Guidelines should permit voting decisions to be made flexibly while taking into account all relevant facts and circumstances. The Proxy Committee or its delegate (typically, an investment
professional on the Proxy Committee) shall review the Voting Guidelines periodically. In addition, the Proxy Committee or its delegate (typically, an investment professional on the applicable strategy team) may make
the determination regarding how to vote a proxy on a case-by-case basis.
ABSTENTION FROM
VOTING PROXIES. NFJ may abstain or refrain from voting a client proxy on behalf of its clients’ accounts under certain circumstances. These include:
| ■ | When the economic effect on shareholder’s interests or the value of the portfolio holding is indeterminable or insignificant; |
| ■ | When voting the proxy would unduly impair the investment management process; or |
| ■ | When the cost of voting the proxies outweighs the benefits or is otherwise impractical. |
LOGISTICAL
CONSIDERATIONS. NFJ may refrain from voting a proxy due to logistical or other considerations that may have a detrimental effect on NFJ’s ability to vote such a proxy. These issues may include, but
are not limited to: (1) proxy statements and ballots being written in a foreign language, (2) untimely notice of a shareholder meeting, (3) requirements to vote proxies in person, (4) restrictions on foreigner’s
ability to exercise votes, (5) restrictions on the sale of securities for a period of time in proximity to the shareholder meeting (e.g. share blocking) or (6) requirements to provide local agents with power of
attorney to facilitate the voting instructions. Such proxies are voted on a best-efforts basis.
SECURITIES ON LOAN. Registered investment companies that are advised or sub-advised by NFJ as well as certain other advisory clients may participate in securities lending programs. Under most securities lending
arrangements, securities on loan may not be voted by the lender unless the loan is recalled prior to the record date for the vote. NFJ believes that each client has the right to determine whether participating in a
securities lending program enhances returns, to contract with the securities lending agent of its choice and to structure a securities lending program through its lending agent that balances any tension between loaning
and voting securities in a manner that satisfies such client. NFJ will request that clients notify NFJ in writing if the client has decided to participate in a securities lending program. If a client has decided to
participate in a securities lending program, NFJ will defer to the client’s determination and not attempt to seek recalls solely for the purpose of voting routine proxies as this could impact the returns received
from securities lending and make the client a less desirable lender in a marketplace. If the client who participates in a securities lending program requests, NFJ will use reasonable efforts to request the client
recall the loaned securities for voting if NFJ has knowledge that the proxy involves a Material Event (as defined below) effecting the loaned securities.
Material Event for
purposes of determining whether a recall of a security is warranted, means a proxy that relates to a merger, acquisition, spin-off or other similar corporate action. The Proxy Committee will review the standard for
determination of a Material Event from time to time and will adjust the standard as it deems necessary. NFJ may utilize third-party service providers, in its sole discretion, to assist it in identifying and evaluating
whether an event constitutes a Material Event.
The ability to timely
recall shares for proxy voting purposes is not within the control of NFJ and requires the cooperation of the client and its other service providers. Under certain circumstances, the recall of shares in time to be voted
may not be possible due to applicable proxy voting record dates, the timing of receipt of information and administrative considerations. Accordingly, efforts to recall loaned securities are not always effective and
there can be no guarantee that any such securities can be retrieved in a timely manner for purposes of voting the securities.
Target
Asset Allocation Funds 96
RESOLVING CONFLICTS
OF INTEREST. NFJ may have conflicts that can affect how it votes its clients’ proxies. For example, NFJ may advise a pension plan whose management is sponsoring a proxy proposal. NFJ’s
clients that exercise voting rights themselves may also have conflicting views with NFJ on the appropriate manner of exercising shareholder voting rights in general or in specific circumstances. Regardless, votes shall
only be cast in the best economic interests of clients in a manner intended to enhance the economic value of the underlying portfolio securities. NFJ shall not vote shares held in one client’s account in a manner
designed to benefit or accommodate any other client. The Proxy Committee is responsible for addressing how NFJ resolves material conflicts of interest with its clients.
MAKING APPROPRIATE
DISCLOSURES TO CLIENTS. NFJ shall provide clients with a summary of this policy in the form of a general Proxy Voting Policy Statement. The delivery of this statement can be made in Part II of Form ADV or under
separate cover.
CREATING AND
MAINTAINING APPROPRIATE RECORDS.
Recordkeeping
Requirements. In keeping with applicable law, NFJ will keep the following records:
| ■ | Copies of NFJ’s Proxy Voting Policy and Procedures; |
| ■ | Copies or records of each proxy statement received with respect to clients’ securities for whom NFJ exercises voting authority; records of votes cast on behalf of clients; |
| ■ | Records of each vote cast as well as certain records pertaining to NFJ’s decision on the vote; |
| ■ | Records of written client requests for proxy voting information; and |
| ■ | Records of written responses from NFJ to either written or oral client request regarding proxy voting. |
Retention of Records. Records are kept for at least six years following the date that the vote was cast. NFJ may maintain the records electronically. Third-party service providers may be used to maintain proxy
statements and proxy votes.
PROVIDING CLIENTS
ACCESS TO VOTING RECORDS.
Access by Clients. Generally, clients of NFJ have the right, and shall be afforded the opportunity, to have access to records of voting actions taken with respect to securities held in their respective account
or strategy. Shareholders and unit-holders of commingled funds advised or sub-advised by NFJ shall have such access to voting records pursuant to the governing documents of the commingled fund.
Access by Third
Parties. Voting actions are confidential and may not be disclosed to any third party except as may berequired by law or explicitly authorized by the client.
Outsourcing the Proxy
Voting Process. To assist in the proxy voting process, NFJ may retain an independent third party service provider to assist in providing in-depth research, analysis and voting recommendations on corporate
governance issues and corporate actions as well as assist in the administrative process. The services provided to NFJ may offer a variety of fiduciary-level, proxy-related services to assist in its handling of proxy
voting responsibilities and corporate governance-related efforts.
PACIFIC INVESTMENT
MANAGEMENT COMPANY LLC. Pacific Investment Management Company LLC (“PIMCO”) has adopted written proxy voting policies and procedures (“Proxy Policy”) as required by Rule 206(4)-6 under the
Investment Advisers Act of 1940, as amended. PIMCO has implemented the Proxy Policy for each of its clients as required under applicable law, unless expressly directed by a client in writing to refrain from voting that
client’s proxies. Recognizing that proxy voting is a rare event in the realm of fixed income investing and is typically limited to solicitation of consent to changes in features of debt securities, the Proxy
Policy also applies to any voting rights and/or consent rights of PIMCO, on behalf of its clients, with respect to debt securities, including but not limited to, plans of reorganization, and waivers and consents under
applicable indentures.
The Proxy Policy is
designed and implemented in a manner reasonably expected to ensure that voting and consent rights are exercised in the best interests of PIMCO’s clients. Each proxy is voted on a case-by-case basis taking into
consideration any relevant contractual obligations as well as other relevant facts and circumstances at the time of the vote. In general, PIMCO reviews and considers corporate governance issues related to proxy matters
and generally supports proposals that foster good corporate governance practices. PIMCO may vote proxies as recommended by management on routine matters related to the operation of the issuer and on matters not
expected to have a significant economic impact on the issuer and/or its shareholders.
PIMCO will supervise
and periodically review its proxy voting activities and implementation of the Proxy Policy. PIMCO will review each proxy to determine whether there may be a material conflict between PIMCO and its client. If no
conflict exists, the proxy will be forwarded to the appropriate portfolio manager for consideration. If a conflict does exist, PIMCO will seek to resolve any such conflict in accordance with the Proxy Policy. PIMCO
seeks to resolve any material conflicts of interest by voting in good faith in the best interest of its clients. If a material conflict of interest should arise, PIMCO will seek to resolve such conflict in the
client’s best interest by pursuing any one of the following courses of action: (i) convening a committee to assess and resolve the conflict; (ii) voting
97
in accordance with the instructions of the client; (iii) voting in accordance with the recommendation of an independent third-party service provider; (iv) suggesting that the client engage another party
to determine how the proxy should be voted; (v) delegating the vote to a third-party service provider; or (vi) voting in accordance with the factors discussed in the Proxy Policy.
Clients may obtain a
copy of PIMCO’s written Proxy Policy and the factors that PIMCO may consider in determining how to vote a client’s proxy. Except as required by law, PIMCO will not disclose to third parties how it voted on
behalf of a client. However, upon request from an appropriately authorized individual, PIMCO will disclose to its clients or the entity delegating the voting authority to PIMCO for such clients, how PIMCO voted such
client’s proxy. In addition, a client may obtain copies of PIMCO’s Proxy Policy and information as to how its proxies have been voted by contacting PIMCO.
VAUGHAN NELSON
INVESTMENT MANAGEMENT, L.P. Vaughan Nelson undertakes to vote all client proxies in a manner reasonably expected to ensure the client’s best interest is upheld and in a manner that does not subrogate the
client’s best interest to that of the firm’s in instances where a material conflict exists.
Approach. Vaughan Nelson has created a Proxy Voting Guideline (“Guideline”) believed to be in the best interest of clients relating to common and recurring issues found within proxy
voting material. The Guideline is the work product of Vaughan Nelson’s Investment Committee and it considers the nature of it’s business, the types of securities being managed and other sources of
information including, but not limited to, research provided by an independent research firm (RiskMetrics Group, Inc., formerly Institutional Shareholder Services, Inc.), internal research, published information on
corporate governance and experience. The Guideline helps to ensure voting consistency on issues common amongst issuers and to serve as evidence that a vote was not the product of a conflict of interest but rather a
vote in accordance with a pre-determined policy. However, in many recurring and common proxy issues a “blanket voting approach” cannot be applied. In these instances the Guideline indicates that such issues
will be addressed on a case-by-case basis in consultation with a portfolio manager to determine how to vote the issue in the client’s best interest.
Vaughan Nelson, in
executing their duty to vote proxies, may encounter a material conflict of interest. Vaughan Nelson does not envision a large number of situations where a conflict of interest would exist, if any, given the nature of
Vaughan Nelson’s business, client base, relationships, the types of securities managed and the fact Vaughan Nelson is not affiliated with an investment banking or similar firm. Notwithstanding, if a conflict of
interest arises we will undertake to vote the proxy or proxy issue in the client’s continued best interest. This will be accomplished by either casting the vote in accordance with the Guideline, if the
application of such policy to the issue at hand involves little discretion on Vaughan Nelson’s part, or casting the vote as indicated by the independent third-party research firm, RiskMetrics Group, Inc.
(“RMG”).
Finally, there may be
circumstances or situations that may preclude or limit the manner in which a proxy is voted. These may include: 1) Mutual funds—whereby voting may be controlled by restrictions within the fund or the actions of
authorized persons, 2) International Securities—whereby the perceived benefit of voting an international proxy does not outweigh the anticipated costs of doing so, 3) New Accounts—instances where security
holdings assumed will be sold in the near term thereby limiting any benefit to be obtained by a vote of proxy material, 4) Unsupervised Securities—where the firm does not have a basis on which to offer advice, or
5) a Security is out on loan.
In summary, Vaughan
Nelson’s goal is to vote proxy material in a manner that is believed to assist in maximizing the value of a portfolio.
Vaughan
Nelson’s procedures in practice involve forwarding a listing of client holdings to RMG each day in order to assist with identifying upcoming proxy votes. Vaughan Nelson arranges for the custodians associated with
each client to forward all client proxy forms to RMG. Once a “proxy analysis” is received from RMG the individual issues are matched to the Vaughan Nelson Proxy Voting Guideline. Areas not covered by the
Guideline (such as votes on mergers/acquisitions) are routed to the portfolio manager for vote indications. Completed proxy analyses are voted electronically through an interface with RMG who then completes the actual
proxy vote on Vaughan Nelson’s behalf. All analyses with vote indications are retained. Reports concerning votes made on behalf of an account are accessible through RMG.
THORNBURG INVESTMENT
MANAGEMENT, INC.
Proxy Voting Policy
Policy Objectives
This Policy has been
adopted by Thornburg Investment Management, Inc. (“TIM”) and Thornburg Investment Trust (the “Trust”) to facilitate the voting of proxies relating to portfolio securities in what it perceives to
be the best interests of persons for whom TIM performs investment management services and is authorized and required to vote or consider voting proxies.
Target
Asset Allocation Funds 98
The
Trust has delegated to TIM the authority to vote proxies relating to its portfolio securities in accordance with this Policy.
This Policy is
intended by TIM to constitute “written policies and procedures” as described in Rule 206(4)-6 under the Investment Advisers Act of 1940, as amended (the “Advisers Act”). This Policy is intended
by the Trust to constitute proxy voting policies and procedures referred to in Item 13 of Form N-1A adopted under the Investment Company Act of 1940, as amended (the “Investment Company Act”).
Please see the
Glossary of Terms for definitions of terms used in this Policy.
Voting Objectives
This Policy defines
procedures for voting securities in each Account managed by TIM, for the benefit of and in the best interest of the Investment Client. The objective of voting a security in each case under this Policy is to seek to
enhance the value of the security, or to reduce potential for a decline in the security’s value. This Policy does not prescribe voting requirements or specific voting considerations. Instead, this Policy provides
procedures for assembling voting information and applying the informed expertise and judgment of TIM’s personnel on a timely basis in pursuit of the above stated voting objectives.
A further element of
this Policy is that while voting on all issues presented should be considered, voting on all issues is not required by this Policy unless specifically directed or required by an Investment Client. Some issues presented
for a vote of security holders may not be relevant to this Policy’s voting objectives, or it may not be reasonably possible to ascertain what effect, if any, a vote on a given issue may have on the value of an
investment. Accordingly, unless an Investment Client and TIM have agreed that TIM shall vote a specific security or all securities in an Account, TIM may abstain from voting or decline to vote in those cases where
there appears to be no relationship between the issue and the enhancement or preservation of an investment’s value, when TIM believes the costs of voting exceed the likely benefit to the Investment Client, or
when TIM believes other factors indicate that the objectives of the Policy are less likely to be realized by voting a security.
It is also important
to the pursuit of the Policy’s voting objectives that TIM be able to substitute its judgment in any specific situation for a presumption in this Policy where strict adherence to the presumption could reasonably
be expected by TIM, based upon the information then available (including but not limited to media and expert commentary and outside professional advice and recommendations sought by TIM on the issue), to be
inconsistent with the objectives of this Policy. Accordingly, TIM understands that it may substitute its judgment in a specific voting situation described in the preceding sentence, except where explicitly prohibited
by agreement with the Investment Client or this Policy.
TIM is not
responsible for voting proxies relating to proxy materials that are not forwarded on a timely basis, nor does TIM control the setting of record dates, shareholder meeting dates, or the timing of distribution of proxy
materials and ballots relating to shareholder votes. In addition, administrative matters beyond TIM’s control may at times prevent TIM from voting proxies in certain non-US markets (see “Voting Restrictions
in Certain Non-US Markets,” below).
ERISA Accounts
Portfolio managers
should recognize, in considering proxy votes for ERISA Accounts:
(a) Plan trustees are
ordinarily responsible for voting securities held by a plan, unless the plan documents direct TIM or another person to vote the proxies;
(b) If TIM is
delegated authority to vote proxies, voting may be subject to specific written guidelines issued by the plan’s trustees or other officials; and
(c) TIM may not
delegate authority to vote proxies, unless the plan documents or other written agreement expressly permit delegation.
Proxy Voting Coordinator
The President shall
appoint a Proxy Voting Coordinator. The Proxy Voting Coordinator shall discharge the following functions in effectuating this Policy:
(a) Collecting and
assembling proxy statements and other communications pertaining to proxy voting, together with proxies or other means of voting or giving voting instructions, and providing those materials to the appropriate portfolio
managers to permit timely voting of proxies;
99
(b)
Collecting recommendations, analysis, commentary and other information respecting subjects of proxy votes, from service providers engaged by TIM and other services specified by portfolio managers, and providing this
information to the President or the appropriate portfolio managers to permit evaluation of proxy voting issues;
(c) Providing to
appropriate portfolio managers any specific voting instructions from Investment Clients;
(d) Collecting proxy
votes or instructions from portfolio managers, and transmitting the votes or instructions to the appropriate custodians, brokers, nominees or other persons (which may include proxy voting services or agents engaged by
TIM);
(e) Accumulating
Voting Results as set forth in this Policy (which may be performed by proxy voting services or agents engaged by TIM) and transmitting or arranging for the transmission of that information in accordance with
“Communicating Votes,” below; and
(f) Recordkeeping in
accordance with “Recordkeeping”, below.
The Proxy Voting
Coordinator may, with the President’s approval, delegate any portion or all of any one or more of these functions to one or more other individuals employed by TIM. Any portion or all of any one or more of these
functions may be performed by service providers engaged by TIM.
Assembling Voting
Information
The Proxy Voting
Coordinator shall obtain proxy statements and other communications pertaining to proxy voting, together with proxies or other means of voting or giving voting instructions to custodians, brokers, nominees, tabulators
or others in a manner to permit voting on relevant issues in a timely manner. TIM may engage service providers and other third parties to assemble this information, digest or abstract the information where necessary or
desirable, and deliver it to the portfolio managers or others to evaluate proxy voting issues.
Portfolio Managers
The portfolio manager
responsible for management of a specific Account is responsible for timely voting (or determining not to vote in appropriate cases) proxies relating to securities in the Account in accordance with this Policy. The
President may exercise this authority in any instance. The portfolio manager or President may delegate voting responsibilities to one or more other portfolio managers or other individuals. Persons exercising voting
authority under this paragraph are authorized to consider voting recommendations and other information and analysis from service providers (including proxy voting services) engaged by TIM.
Accumulating Voting
Results
The Proxy Voting
Coordinator is responsible for accumulating the following information as to each matter relating to a portfolio security held by any Account, considered at any shareholder meeting, and with respect to which the Account
was entitled to vote:
(a) The name of the
issuer of the portfolio security;
(b) The exchange
ticker symbol of the portfolio security;
(c) The CUSIP number
for the portfolio security;
(d) The shareholder
meeting date;
(e) A brief
identification of the matter voted on;
(g) Whether a vote
was cast on the matter;
(h) How we cast the
vote (e.g., “for,” “against,” “abstain,” or “withhold regarding election of directors”); and
(i) Whether we cast
the vote for or against management.
TIM may use service
providers to record and cumulate the foregoing information. The Proxy Voting Coordinator may, with the President’s approval, delegate any portion or all of these functions to one or more other individuals
employed by TIM.
Resolution of Conflicts
of Interest
Target
Asset Allocation Funds 100
In
any case where a portfolio manager determines that a proxy vote involves an actual Conflict of Interest, and the proxy vote relates to the election of a director in an uncontested election or ratification of selection
of independent accountants, the portfolio manager shall vote the proxy in accordance with the recommendation of any proxy voting service engaged by TIM. If no such recommendation is available, or if the proxy vote
involves any other matters, the portfolio manager shall immediately refer the vote to the Investment Client (or in the case of any Investment Company as to which TIM is the adviser or subadviser and is authorized to
vote proxies, to the chairman of its audit committee) for direction on the voting of the proxy or consent to vote in accordance with the portfolio manager’s recommendation. In all cases where such a vote is
referred to the Investment Client, TIM shall disclose the Conflict of Interest to the Investment Client.
Communicating Votes
The Proxy Voting
Coordinator shall (i) communicate to TIM’s fund accounting department proxy voting information respecting votes on portfolio securities held by Investment Clients which are Investment Companies, sufficient to
permit fund accounting to prepare Form N-PX filings for the Investment Companies; and (ii) provide in writing to any Investment Client requesting information on voting of proxies with respect to portfolio securities,
the information described under the caption “Accumulating Voting Results,” for the period or periods specified by the Investment Client. If the information requested by the Investment Client pertains to a
period which is not readily available, or is not described above under the caption “Accumulating Voting Results,” the Proxy Voting Coordinator will confer with the Chief Compliance Officer. The Proxy Voting
Coordinator may, with the President’s approval, delegate any portion or all of this function to one or more individuals employed by TIM. TIM may engage one or more service providers to facilitate timely
communication of proxy votes.
Record of Voting
Delegation
The Proxy Voting
Coordinator shall maintain a list of all Accounts, with a specification as to each Account whether or not TIM is authorized to vote proxies respecting the Account’s portfolio securities.
Comment on Voting
It is the Policy of
TIM not to comment on specific proxy votes with respect to securities in an Account in response to inquiries from persons who are not specifically authorized representatives as to the Account. Attention is directed in
this regard to the Thornburg Investment Management Internal Confidentiality and Privacy Protection Policy and the Thornburg Investment Trust Policy and Procedures for Disclosure of Portfolio Securities Holdings, as in
effect from time to time. Customer service representatives and other persons who may receive such inquiries should advise persons presenting the inquiries that TIM does not comment on proxy voting, and that as to
Investment Companies for which TIM is required to disclose proxy votes, the information is available on the Investment Company’s website and filed with the SEC. The President may authorize comments in specific
cases, in his discretion.
Joining Insurgent or
Voting Committees
It is the policy of
TIM, for itself and the Accounts, not to join any insurgent or voting committee or similar group. The President may approve participation in any such committee or group in his discretion, and shall advise the
authorized representatives for the Account of any such action.
Social Issues
It is the presumption
of this Policy that proxies shall not be voted on Social Issues except that TIM may substitute its judgment in any specific situation involving a Social Issue as provided in the third paragraph under the caption
“Voting Objectives.”
Voting Restrictions in
Certain Non-US Markets
Proxy voting in
certain countries requires “share blocking.” During a “share blocking” period, shares that will be voted at a meeting may not be sold until the meeting has taken place and the shares are
returned to the Investment Client’s custodian bank. TIM may choose not to vote an Investment Client’s shares in a “share blocking” market if TIM believes that the benefit to the Investment
Client of being able to sell the shares during this “share blocking” period outweighs the benefit of exercising the vote. TIM will exercise its judgment subject to any specific voting instructions agreed to
between TIM and the Investment Client.
Certain non-US
markets require that TIM provide a power of attorney to give local agents authority to carry out TIM’s voting instructions. While TIM will make efforts to comply with relevant local market rules, TIM frequently
does not provide a power of attorney for the following reasons that include but are not limited to: (i) TIM may not have the required Investment Client information
101
that
the local market requires, (ii) TIM may deem the expense too great, or (iii) TIM may determine not to provide a power of attorney based upon advice of legal counsel. Failure to provide an effective power of attorney in
a particular non-US market may prevent TIM from being able to vote an Investment Client’s shares in that market.
Annual Review of Policy
Function
Pursuant to the
review requirements of Rule 206(4)-7 under the Advisers Act and Rule 38a-1 under the Investment Company Act, the Chief Compliance Officer, or a Designated Compliance Officer, shall conduct a periodic review, no less
often than annually, which shall comprise the following elements:
(a) Review a sample
of the record of voting delegation maintained by the Proxy Voting Coordinator against Voting Results to determine if TIM is exercising its authority to vote proxies on portfolio securities held in the selected Accounts;
(b) Request and
review voting data to determine if timely communication of proxy votes is reasonably accomplished during the period reviewed;
(c) Meet with the
Proxy Voting Coordinator to review the voting of proxies, communication of proxy votes, accumulation of Voting Results and the general functioning of this Policy;
(d) Evaluate the
performance of any proxy voting services or agents employed by TIM, including whether or not the service or agent maintains its independence with respect to companies the securities of which are the subject of voting
recommendations, information or analysis from the service or agent; and
(e) Prepare written
reports respecting the foregoing items to the President, the Trustees of the Trust, and any Investment Company Clients for which such a report is required.
Recordkeeping
The Proxy Voting
Coordinator shall maintain the following records:
(a) Copies of this
Policy as from time to time revised or supplemented;
(b) A copy of each
proxy statement that TIM receives regarding Investment Client securities. In maintaining a record of proxy statements referred to in this item, the Proxy Voting Coordinator may rely on obtaining copies from the
Securities and Exchange Commission’s EDGAR system or similar accessible database;
(c) Voting Results
for each Investment Client;
(d) A copy of any
document created by TIM that was material to making a decision how to vote proxies on behalf of an Investment Client or that memorializes the basis for that decision;
(e) A copy of each
written Investment Client request for information on how TIM voted proxies on behalf of the Investment Client, and a copy of any written response by TIM to any (written or oral) Investment Client request for
information on how TIM voted proxies on behalf of the requesting Investment Client; and
(f) Communications to
Investment Clients respecting Conflicts of Interest.
The Chief Compliance
Officer, or a Designated Compliance Officer, shall maintain the following records:
(a) All written
reports arising from annual reviews of policy function; and
(b) Chronological
record of proxy voting records reviewed by quarter.
All records shall be
maintained and preserved pursuant to the separately adopted Document Retention and Destruction Policy for the time period indicated in the current Books and Records Matrix. The President may authorize the Proxy Voting
Coordinator to engage one or more service providers to perform any portion of this recordkeeping function provided (1) the function is performed in compliance with then applicable governmental regulations, and (2) each
service provider provides a written undertaking to furnish the records to TIM promptly upon request.
Glossary of Terms
(Thornburg Proxy Voting Policy only)
Target
Asset Allocation Funds 102
“Account” means any discrete account or portfolio as to which TIM has discretionary investment authority. An Investment Client may have multiple Accounts. Each series of any Investment Company
as to which TIM is the adviser or subadviser is an Account.
“Chief
Compliance Officer” means the Chief Compliance Officer of TIM.
“Conflict of
Interest” means as to any Account, any conflict between a pecuniary interest of TIM or any affiliate, and the duties of TIM to the Investment Client who is the owner of the Account.
“ERISA”
means the Employee Retirement Income Security Act of 1975, as amended. Reference to an “ERISA Account” means an account for an employee benefit plan governed by ERISA.
“Investment
Client” means any person with whom TIM has a contract to perform discretionary investment management services, including a series of an Investment Company, and for whom TIM is authorized by the contract or
required by applicable law to vote or consider voting securities in the Investment Client’s Account.
“Investment
Company” means a company registered as such under the Investment Company Act.
“President” means the president of TIM, or in the event of his unavailability any individual who is a vice president and managing director of TIM.
“Proxy Voting
Coordinator” means the individual appointed from time to time by the President to perform the proxy voting coordination functions described in this Policy.
“Social
Issues” means any issue presented for a vote of holders of any security which is held in an Account, which may reasonably be interpreted as (i) unrelated in any substantial respect to the voting objectives of
this Policy, and (ii) intended to promote directly or indirectly the interests of persons who are not holders of the security.
“TIM”
means Thornburg Investment Management, Inc.
“Voting
Results” means the specific information described under the caption “Accumulating Voting Results.”
103
APPENDIX II:
DESCRIPTIONS OF SECURITY RATINGS
MOODY'S INVESTORS
SERVICE, INC. (MOODY'S)
Debt Ratings
Aaa: Bonds which are rated Aaa are judged to be of the best quality. They carry the smallest degree of investment risk and are generally referred to as “gilt edged.” Interest
payments are protected by a large or by an exceptionally stable margin and principal is secure. While the various protective elements are likely to change, such changes as can be visualized are most unlikely to impair
the fundamentally strong position of such issues.
Aa: Bonds which are rated Aa are judged to be of high quality by all standards. Together with the Aaa group they comprise what are generally known as high-grade bonds. They are rated lower
than the best bonds because margins of protection may not be as large as in Aaa securities or fluctuation of protective elements may be of greater amplitude or there may be other elements present which make the
long-term risks appear somewhat larger than the Aaa securities.
A: Bonds which are rated A possess many favorable investment attributes and are to be considered as upper-medium-grade obligations. Factors giving security to principal and interest are
considered adequate, but elements may be present which suggest a susceptibility to impairment some time in the future.
Baa: Bonds which are rated Baa are considered as medium-grade obligations, i.e., they are neither highly protected nor poorly secured. Interest payments and principal security appear adequate
for the present but certain protective elements may be lacking or may be characteristically unreliable over any great length of time. Such bonds lack outstanding investment characteristics and in fact have speculative
characteristics as well.
Ba: Bonds which are rated Ba are judged to have speculative elements; their future cannot be considered as well assured. Often the protection of interest and principal payments may be very
moderate and thereby not well safeguarded during both good and bad times over the future. Uncertainty of position characterizes bonds in this class.
B: Bonds which are rated B generally lack characteristics of the desirable investment. Assurance of interest and principal payments or of maintenance of other terms of the contract over any
long period of time may be small.
Caa: Bonds which are rated Caa are of poor standing. Such issues may be in default or there may be present elements of danger with respect to principal or interest.
Ca: Bonds which are rated Ca represent obligations which are speculative in a high degree. Such issues are often in default or have other marked shortcomings.
C: Bonds which are rated C are the lowest-rated class of bonds, and issues so rated can be regarded as having extremely poor prospects of ever attaining any real investment standing.
Moody's applies
numerical modifiers 1, 2, and 3 in each generic rating category from Aa to Caa. The modifier 1 indicates that the issuer is in the higher end of its letter rating category; the modifier 2 indicates a mid-range ranking;
the modifier 3 indicates that the issuer is in the lower end of the letter ranking category.
Short-Term Ratings
Moody's short-term
debt ratings are opinions of the ability of issuers to honor senior financial obligations and contracts. Such obligations generally have an original maturity not exceeding one year, unless explicitly noted.
PRIME-1: Issuers rated Prime-1 (or supporting institutions) have a superior ability for repayment of senior short-term debt obligations. Prime-1 repayment ability will often be evidenced by many of
the following characteristics:
| ■ | Leading market positions in well-established industries. |
| ■ | High rates of return on funds employed. |
| ■ | Conservative capitalization structure with moderate reliance on debt and ample asset protection. |
| ■ | Broad margins in earnings coverage of fixed financial charges and high internal cash generation. |
| ■ | Well-established access to a range of financial markets and assured sources of alternate liquidity. |
PRIME-2: Issuers rated Prime-2 (or supporting institutions) have a strong ability for repayment of senior short-term debt obligations. This normally will be evidenced by many of the characteristics
cited above but to a lesser degree. Earnings trends and coverage ratios, while sound, may be more subject to variation. Capitalization characteristics, while still appropriate, may be more affected by external
conditions. Ample alternate liquidity is maintained.
Target
Asset Allocation Funds 104
MIG 1: This designation denotes best quality. There is strong protection by established cash flows, superior liquidity support or demonstrated broad-based access to the market for refinancing.
MIG 2: This designation denotes high quality. Margins of protection are ample although not so large as in the preceding group.
STANDARD & POOR'S
RATINGS SERVICES (S&P)
Long-Term Issue Credit
Ratings
AAA: An obligation rated AAA has the highest rating assigned by S&P. The obligor's capacity to meet its financial commitment on the obligation is extremely strong.
AA: An obligation rated AA differs from the highest rated obligations only in small degree. The obligor's capacity to meet its financial commitment on the obligation is very strong.
A: An obligation rated A is somewhat more susceptible to the adverse effects of changes in circumstances and economic conditions than obligations in higher-rated categories. However, the
obligor's capacity to meet its financial commitment on the obligation is still strong.
BBB: An obligation rated BBB exhibits adequate protection parameters. However, adverse economic conditions or changing circumstances are more likely to lead to a weakened capacity of the
obligor to meet its financial commitment on the obligation.
BB: An obligation rated BB is less vulnerable to nonpayment than other speculative issues. However, it faces major ongoing uncertainties or exposure to adverse business, financial, or economic
conditions which could lead to the obligor's inadequate capacity to meet its financial commitment on the obligation.
B: An obligation rated B is more vulnerable to nonpayment than obligations rated BB, but the obligor currently has the capacity to meet its financial commitment on the obligation. Adverse
business, financial, or economic conditions will likely impair the obligor's capacity or willingness to meet its financial commitment on the obligation.
CCC: An obligation rated CCC is currently vulnerable to nonpayment, and is dependent upon favorable business, financial, and economic conditions for the obligor to meet its financial commitment
on the obligation. In the event of adverse business, financial, or economic conditions, the obligor is not likely to have the capacity to meet its financial commitment on the obligation.
CC: An obligation rated CC is currently highly vulnerable to nonpayment.
C: The C rating may be used to cover a situation where a bankruptcy petition has been filed or similar action has been taken, but payments on this obligation are being continued.
Plus (+) or Minus
(–): The ratings from AA to CCC may be modified by the addition of a plus or minus sign to show relative standing within the major rating categories.
Commercial Paper Ratings
A-1: This designation indicates that the degree of safety regarding timely payment is strong. Those issues determined to possess extremely strong safety characteristics are denoted with a plus
sign (+) designation.
A-2: Capacity for timely payment on issues with this designation is satisfactory. However, the relative degree of safety is not as high as for issues designated A-1.
Notes Ratings
An S&P notes rating
reflects the liquidity factors and market risks unique to notes. Notes due in three years or less will likely receive a notes rating. Notes maturing beyond three years will most likely receive a long-term debt rating.
The following criteria will be used in making that assessment.
| ■ | Amortization schedule-the longer the final maturity relative to other maturities the more likely it will be treated as a note. |
| ■ | Source of payment-the more dependent the issue is on the market for its refinancing, the more likely it will be treated as a note. |
Note rating symbols
are as follows:
SP-1: Strong capacity to pay principal and interest. An issue determined to possess a very strong capacity to pay debt service is given a plus (+) designation.
105
SP-2: Satisfactory capacity to pay principal and interest, with some vulnerability to adverse financial and economic changes over the term of the notes.
FITCH RATINGS LTD.
International Long-Term
Credit Ratings
AAA: Highest Credit Quality. AAA ratings denote the lowest expectation of credit risk. They are assigned only in case of exceptionally strong capacity for timely payment of financial
commitments. This capacity is highly unlikely to be adversely affected by foreseeable events.
AA: Very High Credit Quality. AA ratings denote a very low expectation of credit risk. They indicate very strong capacity for timely payment of financial commitments. This capacity is not
significantly vulnerable to foreseeable events.
A: High Credit Quality. A ratings denote a low expectation of credit risk. The capacity for timely payment of financial commitments is considered strong. This capacity may, nevertheless, be
more vulnerable to changes in circumstances or in economic conditions than is the case for higher ratings.
BBB: Good Credit Quality. BBB ratings indicate that there is currently a low expectation of credit risk. The capacity for timely payment of financial commitments is considered adequate, but
adverse changes in circumstances and in economic conditions are more likely to impair this capacity. This is the lowest investment-grade category.
BB: Speculative. BB ratings indicate that there is a possibility of credit risk developing, particularly as the result of adverse economic change over time; however, business or financial
alternatives may be available to allow financial commitments to be met. Securities rated in this category are not investment grade.
B: Highly Speculative. B ratings indicate that significant credit risk is present, but a limited margin of safety remains. Financial commitments are currently being met; however, capacity for
continued payment is contingent upon a sustained, favorable business and economic environment.
CCC, CC, C: High Default Risk. Default is a real possibility. Capacity for meeting financial commitments is solely reliant upon sustained, favorable business or economic developments. A CC rating
indicates that default of some kind appears probable. C ratings signal imminent default.
International
Short-Term Credit Ratings
F1: Highest Credit Quality. Indicates the strongest capacity for timely payment of financial commitments; may have an added “+” to denote any exceptionally strong credit feature.
F2: Good Credit Quality. A satisfactory capacity for timely payment of financial commitments, but the margin of safety is not as great as in the case of the higher ratings.
F3: Fair Credit Quality. The capacity for timely payment of financial commitments is adequate; however, near-term adverse changes could result in a reduction to non-investment grade.
B: Speculative. Minimal capacity for timely payment of financial commitments, plus vulnerability to near-term adverse changes in financial and economic conditions.
C: High Default Risk. Default is a real possibility. Capacity for meeting financial commitments is solely reliant upon a sustained, favorable business and economic investment.
Plus (+) or Minus
(–): Plus or minus signs may be appended to a rating to denote relative status within major rating categories. Such suffixes are not added to the AAA long-term rating category, to categories
below CCC, or to short-term ratings other than F1.
Target
Asset Allocation Funds 106
This page
intentionally left blank
This page
intentionally left blank
PART C
OTHER INFORMATION
Item 28. Exhibits.
(a)(1) Certificate of Trust. Incorporated by reference to Registrant's initial Registration Statement on Form N-1A, filed with the Securities and Exchange Commission (SEC) on August 4, 1998
(File No. 333-60561).
(2) Amendment
to Certificate of Trust dated August 26, 1999. Incorporated by reference to corresponding exhibit to Registrant's Post-Effective Amendment No. 8 filed on Form N-1A on October 1, 2001.
(3) Amendment
to Certificate of Trust dated September 4, 2001. Incorporated by reference to corresponding exhibit to Registrant's Post-Effective Amendment No. 8 filed on Form N-1A on October 1, 2001.
(4) Agreement
and Declaration of Trust. Incorporated by reference to Registrant's initial Registration Statement on Form N-1A, filed with the Securities and Exchange Commission (SEC) on August 4, 1998 (File No. 333-60561).
(5) Amendment
No. 1 to Agreement and Declaration of Trust. Incorporated by reference to Registrant's Pre-Effective Amendment No. 1 filed on Form N-1A on September 17, 1998 (File No. 333-60561).
(6) Certificate
of Correction of Certificate of Amendment to Certificate of Trust dated May 14, 2002. Incorporated by reference to Post-Effective No. 9 to the Registration Statement on Form N-1A filed on September 27, 2002.
(7) Amendment to
Certificate of Trust dated September 29, 2006. Incorporated by reference to corresponding Exhibit to Registrant’s Post-Effective No. 14 to the Registration Statement on Form N-1A filed on October 2, 2006 (File
No. 333-60561.
(b) By-Laws as
amended November 16, 2004. Incorporated by reference to corresponding exhibit to Registrant’s Post-Effective Amendment No. 13 filed on Form N-1A on September 30, 2005.
(c) In response
to this item, Registrant incorporates by reference the following provisions from its Agreement and Declaration of Trust and By-Laws, filed herewith as Exhibit a(1) and Exhibit (b), defining rights of the Trust's
shareholders: Articles III and V of Agreement and Declaration of Trust; Article III of By-Laws.
(d)(1) Amended
and Restated Management Agreement between Registrant and Prudential Investments LLC (PI) dated May 25, 2004. Incorporated by reference to corresponding exhibit to Registrant’s Post-Effective Amendment No. 13
filed on Form N-1A on September 30, 2005.
(2) Subadvisory
Agreement between Prudential Investments Fund Management LLC (PIFM) and Pacific Investment Management Company LLC (PIMCO) with respect to the Conservative Growth Fund dated May 5, 2000. Incorporated by
reference to Exhibit (p)(3) to Post-Effective Amendment No. 26 to the Registration Statement on Form N-1A of Jennison Natural Resources Fund, Inc. filed on July 28, 2004 (File No. 33-15166).
(3) Subadvisory
Agreement between PIFM and PIMCO with respect to the Moderate Growth Fund dated May 5, 2000. Incorporated by reference to Exhibit (p)(3) to Post-Effective Amendment No. 26 to the Registration Statement on
Form N-1A of Jennison Natural Resources Fund, Inc. filed on July 28, 2004 (File No. 33-15166).
(4) Subadvisory
Agreement between PI and Hotchkis and Wiley Capital Management LLC dated March 25, 2005. Incorporated by reference to corresponding exhibit to Registrant’s Post-Effective Amendment No. 13 filed on Form N-1A on
September 30, 2005.
(5) Subadvisory
Agreement between PI and Epoch Investment Partners, Inc. with respect to each Fund dated July 12, 2012. Filed herewith.
1
(6) Subadvisory
Agreement between PI and LSV Asset Management dated March 25, 2005. Incorporated by reference to corresponding exhibit to Registrant’s Post-Effective Amendment No. 13 filed on Form N-1A on September 30, 2005.
(7)(1) Subadvisory Agreement between PI and Thornburg Investment Management, Inc. dated March 25, 2005. Incorporated by reference to corresponding exhibit to Registrant’s Post-Effective
Amendment No. 13 filed on Form N-1A on September 30, 2005.
(2) Amended Fee
Schedule pertaining to Subadvisory Agreement between PI and Thornburg Investment Management, Inc. dated July 1, 2006. Incorporated by reference to corresponding Exhibit to Registrant’s Post-Effective Amendment
No. 14 to the Registration Statement on Form N-1A filed on October 2, 2006 (File No. 333-60561).
(8) Subadvisory
Agreement between PI and Eagle Asset Management, Inc. with respect to each Fund dated July 26, 2008. Incorporated by reference to corresponding exhibit to Registrant’s Post-Effective Amendment No. 16 to the
Registration Statement on Form N-1A filed on October 1, 2008 (File No. 333-60561)
(9)(1) Subadvisory Agreement between PI and Marsico Capital Management, LLC dated June 17, 2005. Incorporated by reference to corresponding exhibit to Registrant’s Post-Effective Amendment No.
13 filed on Form N-1A on September 30, 2005.
(2) Amended Fee
Schedule pertaining to Subadvisory Agreement between PI and Marsico Capital Management, LLC dated January 1, 2006. Incorporated by reference to corresponding Exhibit to Registrant’s Post-Effective No. 14 to the
Registration Statement on Form N-1A filed on October 2, 2006 (File No. 333-60561.
(10) Subadvisory Agreement between PI and Vaughan Nelson Investment Management, L.P. dated July 6, 2005. Incorporated by reference to corresponding exhibit to Registrant’s Post-Effective
Amendment No. 13 filed on Form N-1A on September 30, 2005.
(11) Subadvisory Agreement between PI and EARNEST Partners, LLC with respect to each Fund dated December 13, 2001. Incorporated by reference to Post-Effective No. 9 to the Registration Statement
on Form N-1A filed on September 27, 2002.
(12) Subadvisory
Agreement between PI and NFJ Investment Group, L.P. dated December 16, 2005. Incorporated by reference to corresponding Exhibit to Registrant’s Post-Effective Amendment No. 14 to the Registration Statement on
Form N-1A filed on October 2, 2006 (File No. 333-60561.
(13)(1) Subadvisory
Agreement between PI and Massachusetts Financial Services Company dated December 13, 2008. Incorporated by reference to corresponding Exhibit to Registrant’s Post-Effective Amendment No. 22 to the Registration
Statement on Form N-1A filed on September 28, 2011 (File No. 333-60561.
(2) Amendment to
Subadvisory Agreement between PI and Massachusetts Financial Services Company dated December 13, 2008. Incorporated by reference to corresponding Exhibit to Registrant’s Post-Effective Amendment No. 22 to the
Registration Statement on Form N-1A filed on September 28, 2011 (File No. 333-60561.
(3) Amendment to
Subadvisory Agreement between PI and Massachusetts Financial Services Company dated October 1, 2011. Incorporated by reference to corresponding Exhibit to Registrant’s Post-Effective Amendment No. 22 to the
Registration Statement on Form N-1A filed on September 28, 2011 (File No. 333-60561.
(e)(1) Amended and
Restated Distribution Agreement between the Registrant and Prudential Investment Management Services LLC dated September 16, 2010. Incorporated by reference to Prudential Jennison Small Company Fund, Inc.
Post-Effective Amendment No. 50 to the Registration Statement on Form N-1A (File No. 2-68723) filed via EDGAR on September 16, 2010.
2
(i) Amended Exhibit
A dated March 11, 2011 for Distribution Agreement dated September 16, 2010, incorporated by reference to Prudential World Fund, Inc. Post-Effective Amendment No. 56 to the Registration Statement on Form N-1A (File No.
2-89725) filed via EDGAR on January 11, 2011.
(2) Form of
Selected Dealer Agreement. Incorporated by reference to Registrant's Post-Effective Amendment No. 4 filed on Form N-1A on October 7, 1999 (File No. 333-60561).
(f) Not applicable.
(g) Custodian
Services Agreement between Registrant and PFPC Trust Company (PFPC) dated July 1, 2005. Incorporated by reference to exhibit (g)(2) to Registrant’s Post-Effective Amendment No. 13 filed on Form N-1A on September
30, 2005.
(h)(1) Amended and
Restated Transfer Agency and Service Agreement between the Registrant and Prudential Mutual Fund Services, Inc. (PMFS), dated May 29, 2007. Incorporated by reference to the Dryden Municipal Bond Fund Post-Effective
Amendment No. 29 to the Registration Statement on Form N-1A filed via EDGAR on June 29, 2007 (File No. 33-10649).
(2) Amendment dated
September 2, 2008 to Amended and Restated Transfer Agency and Service Agreement dated May 29, 2007. Incorporated by reference to the Target Portfolio Trust Post-Effective Amendment No. 27 to the Registration Statement
on Form N-1A as filed with the Commission on January 30, 2009 (File No. 33-50476).
(3) Amendment dated
December 21, 2010 to Amended and Restated Transfer Agency and Service Agreement dated May 29, 2007, incorporated by reference to the Prudential Investments Portfolio 9 Post-Effective Amendment No. 29 to the
Registration Statement on Form N-1A filed via EDGAR on December 21, 2010 (File No. 333-66895).
(i) Opinion of
counsel. Incorporated by reference to Post-Effective No. 9 to the Registration Statement on Form N-1A filed on September 27, 2002.
(j) Consent of
independent registered public accounting firm. Filed herewith.
(l) Purchase
Agreement. Incorporated by reference to Registrant's Post-Effective Amendment No. 4 filed on Form N-1A on October 7, 1999 (File No. 333-60561).
(m)(1) Distribution and Service Plan for Class A shares. Incorporated by reference to Registrant's initial Registration Statement on Form N-1A, filed with the Securities and Exchange
Commission (SEC) on August 4, 1998 (File No. 333-60561).
(2) Distribution and Service Plan for Class B shares. Incorporated by reference to Registrant's initial Registration Statement on Form N-1A, filed with the Securities and Exchange
Commission (SEC) on August 4, 1998 (File No. 333-60561).
(3) Distribution and Service Plan for Class C shares. Incorporated by reference to Registrant's initial Registration Statement on Form N-1A, filed with the Securities and Exchange
Commission (SEC) on August 4, 1998 (File No. 333-60561).
(4) Distribution and Service Plan for Class R shares. Incorporated by reference to corresponding exhibit to Registrant's Post-Effective Amendment No. 12 filed on Form N-1A on October 1, 2004.
(5) Distribution and Service Plan for Class X shares. Incorporated by reference to corresponding exhibit to Registrant's Post-Effective Amendment No. 12 filed on Form N-1A on October 1, 2004.
(6) Distribution fee
waiver for Class A and Class R shares. Filed herewith.
3
(n) Amended and
Restated Rule 18f-3 Plan dated September 15, 2010. Incorporated by reference to the Prudential Jennison Small Company Fund, Inc. Post-Effective Amendment No. 50 to the Registration Statement on Form N-1A filed via
EDGAR on September 16, 2010 (File No.2-68723.
(p)(1) Code of
Ethics of EARNEST Partners, LLC dated January 31, 2005. Incorporated by reference to corresponding exhibit to Registrant’s Post-Effective Amendment No. 13 filed on Form N-1A on September 30, 2005.
(2) Code of
Ethics of Hotchkis and Wiley Capital Management LLC dated February 1, 2005. Incorporated by reference to corresponding exhibit to Registrant’s Post-Effective Amendment No. 13 filed on Form N-1A on
September 30, 2005.
(3) (17) Code of
Ethics of Epoch Investment Partners, Inc. Incorporated by reference to Post-Effective Amendment no. 99 to the registration statement for Advanced Series Trust on Form N -1A filed via EDGAR on April 17, 2012 (File No. 811-5186).
(4) Code of
Ethics of LSV Asset Management dated January 7, 2005. Incorporated by reference to corresponding exhibit to Registrant’s Post-Effective Amendment No. 13 filed on Form N-1A on September 30, 2005.
(5) Code of
Ethics of Marsico Capital Management, LLC dated February 1, 2005. Incorporated by reference to corresponding exhibit to Registrant’s Post-Effective Amendment No. 13 filed on Form N-1A on September 30, 2005.
(6) Code of
Ethics of Pacific Investment Management Company LLC dated January 6, 2005. Incorporated by reference to corresponding exhibit to Registrant’s Post-Effective Amendment No. 13 filed on Form N-1A on September
30, 2005.
(7) Code of
Ethics of Eagle Asset Management. Incorporated by reference to Post-Effective Amendment No. 52 to the Registration Statement on Form N-1A of Advanced Series Trust (File Nos. 33-24962 and 811-5186), which Amendment
was filed via EDGAR on April 29, 2005.
(8) Code of
Ethics of Thornburg Investment Management, Inc. dated March 21, 2005. Incorporated by reference to corresponding exhibit to Registrant’s Post-Effective Amendment No. 13 filed on Form N-1A on September 30,
2005.
(9) Code of
Ethics of Vaughan Nelson Investment Management, L.P. dated December 31, 2004. Incorporated by reference to corresponding exhibit to Registrant’s Post-Effective Amendment No. 13 filed on Form N-1A on
September 30, 2005.
(10) Code of
Ethics of the Registrant dated January 2010. Incorporated by reference to Exhibit (p)(1) to Post-Effective Amendment No. 22 to the Registration Statement on Form N-1A for Prudential Investment Portfolios 5, filed via
EDGAR on September 27, 2010 (File No. 333-82621).
(11) Code of Ethics
of NFJ Investment Group, L.P. Incorporated by reference to corresponding Exhibit to Registrant’s Post-Effective No. 14 to the Registration Statement on Form N-1A filed on October 2, 2006 (File No. 333-60561.
(12) Code of Ethics
of Massachusetts Financial Services Company. Incorporated by reference to Post-Effective Amendment No. 38 to the Registration Statement of Advanced Series Trust (File Nos. 33-24962 and 811-5186), which Amendment was
filed via EDGAR on February 15, 2001.
(13) Code of Ethics
and Personal Securities Trading Policy of Prudential, including the Manager and Distributor, dated January 10, 2011, incorporated by reference to Post-Effective Amendment No. 21 to the Registration Statement on Form
N-1A of Prudential Investment Portfolios 12, filed via EDGAR on June 1, 2011 (File No. 333-42705).
4
Item 29. Persons
Controlled by or under Common Control with the Registrant.
None.
Item 30.
Indemnification.
As permitted by
Sections 17(h) and (i) of the Investment Company Act of 1940, as amended (the 1940 Act), and pursuant to Article VII of the Agreement and Declaration of Trust (Exhibit (a)(4)) to the Registration
Statement) and Article XI of the Trust's By-Laws (Exhibit (b) to the Registration Statement), officers, trustees, employees and agents of Registrant will not be liable to Registrant, any stockholder, officer,
director, employee, agent or other person for any action or failure to act, except for bad faith, willful misfeasance, gross negligence or reckless disregard of duties, and those individuals may be indemnified against
liabilities in connection with Registrant, subject to the same exceptions. Section 3817 of the Delaware Statutory Trust Act permits indemnification of trustees who acted in good faith and reasonably believed that the
conduct was in the best interest of Registrant. As permitted by Section 17(i) of the 1940 Act, pursuant to Section 10 of the Distribution Agreement (Exhibit (e)(1) to the Registration Statement), the
Distributor of Registrant may be indemnified against liabilities which it may incur, except liabilities arising from bad faith, gross negligence, willful misfeasance or reckless disregard of duties.
Insofar as
indemnification for liabilities arising under the Securities Act of 1933, as amended (the Securities Act), may be permitted to trustees, officers and controlling persons of Registrant pursuant to the foregoing
provisions or otherwise, Registrant has been advised that, in the opinion of the SEC, such indemnification is against public policy as expressed in the 1940 Act and is, therefore, unenforceable. In the event that a
claim for indemnification against such liabilities (other than the payment by Registrant of expenses incurred or paid by a trustee, officer or controlling person of Registrant in connection with the successful defense
of any action, suit or proceeding) is asserted against Registrant by such trustee, officer or controlling person in connection with the shares being registered, Registrant will, unless in the opinion of its counsel the
matter has been settled by controlling precedent, submit to a court of appropriate jurisdiction the question whether such indemnification by it is against public policy as expressed in the 1940 Act and will be governed
by the final adjudication of such issue.
Registrant has
purchased an insurance policy insuring its officers and trustees against liabilities, and certain costs of defending claims against such officers and trustees, to the extent such officers and trustees are not found to
have committed conduct constituting willful misfeasance, bad faith, gross negligence or reckless disregard in the performance of their duties. The insurance policy also insures Registrant against the cost of
indemnification payments to officers and trustees under certain circumstances.
Section 8 of the
Management Agreement (Exhibit (d)(1) to the Registration Statement) and Section 4 of the Subadvisory Agreements (Exhibits (d)(2) through (d)(14) to the Registration Statement) limit the liability of PI
and each Adviser, respectively, to liabilities arising from willful misfeasance, bad faith or gross negligence in the performance of their respective duties or from reckless disregard by them of their respective
obligations and duties under the agreements.
Registrant hereby
undertakes that it will apply the indemnification provisions of its By-Laws and the Distribution Agreement in a manner consistent with Release No. 11330 of the SEC under the 1940 Act as long as the interpretation of
Section 17(h) and 17(i) of such Act remain in effect and are consistently applied.
Item 31. Business and
other Connections of the Investment Adviser.
Prudential
Investments LLC (PI)
See the Prospectus
constituting Part A of this Post-Effective Amendment to the Registration Statement and “Management and Advisory Arrangements” in the Statement of Additional Information (SAI) constituting Part B of this
Post-Effective Amendment to the Registration Statement.
The business and
other connections of the officers of PI are listed in Schedules A and D of Form ADV of PI as currently on file with the Commission, the text of which is hereby incorporated by reference (File No. 801-31104).
5
Hotchkis and Wiley
See the Prospectus
constituting Part A of the Registration Statement and “Management and Advisory Arrangements” in the SAI constituting Part B of this Registration Statement.
The business and
other connections of the directors and executive officers of Hotchkis and Wiley are included in Schedule A and D of Form ADV filed with the Securities and Exchange Commission (File No. 801-60512), as most recently
amended, the text of which is hereby incorporated reference.
Eagle Asset
Management (Eagle)
See the Prospectus
constituting Part A of the Registration Statement and “Management and Advisory Arrangements” in the SAI constituting Part B of this Registration Statement.
The business and
other connections of the directors and executive officers of Eagle are included in Schedule A and D of Form ADV filed with the Securities and Exchange Commission (File No. 801-21343), as most recently amended, the text
of which is hereby incorporated reference.
Pacific Investment
Management Company LLC (PIMCO)
See the Prospectus
constituting Part A of the Registration Statement and “Management and Advisory Arrangements” in the SAI constituting Part B of this Registration Statement.
The business and
other connections of the directors and executive officers of PIMCO are included in Schedule A and D of Form ADV filed with the Securities and Exchange Commission (File No. 801-7260), as most recently amended, the text
of which is hereby incorporated reference.
EARNEST Partners
See the Prospectus
constituting Part A of the Registration Statement and “Management and Advisory Arrangements” in the SAI constituting Part B of this Registration Statement.
The business and
other connections of the directors and executive officers of EARNEST Partners are included in Schedule A and D of Form ADV filed with the Securities and Exchange Commission (File No. 801-56189), as most recently
amended, the text of which is hereby incorporated reference.
Epoch Investment
Partners, Inc.
See the Prospectus
constituting Part A of the Registration Statement and “Management and Advisory Arrangements” in the SAI constituting Part B of this Registration Statement.
The business and
other connections of the directors and executive officers of Epoch Investment Partners, Inc. are included in Schedule A and D of Form ADV filed with the Securities and Exchange Commission (File No. 801-63118), as most
recently amended, the text of which is hereby incorporated reference.
LSV Asset Management
(LSV)
See the Prospectus
constituting a portion of Part A of this Registration Statement and “Management and Advisory Arrangements” in the SAI.
Information as to
LSV’s directors and executive officers is included in its Form ADV filed with the Commission (801-47689), as most recently amended, the relevant text of which is incorporated herein by reference.
Thornburg Investment
Management, Inc. (Thornburg)
6
See the Prospectus
constituting a portion of Part A of this Registration Statement and “Management and Advisory Arrangements” in the SAI.
Information as to
Thornburg’s directors and executive officers is included in its Form ADV filed with the Commission (801-17853), as most recently amended, the relevant text of which is incorporated herein by reference.
Marsico Capital
Management LLC (Marsico)
See the Prospectus
constituting Part A of the Registration Statement and “Management and Advisory Arrangements” in the SAI constituting Part B of this Registration Statement.
The business and
other connections of the directors and executive officers of Marsico are included in Schedule A and D of Form ADV filed with the Securities and Exchange Commission (File No. 801-54914), as most recently amended, the
text of which is hereby incorporated reference.
NFJ Investment
Group, L.P. (NFJ)
See the Prospectus
constituting Part A of the Registration Statement and “Management and Advisory Arrangements” in the SAI constituting Part B of this Registration Statement.
The business and
other connections of the directors and executive officers of NFJ are included in Schedule A and D of Form ADV filed with the Securities and Exchange Commission (File No. 801-47940), as most recently amended, the text
of which is hereby incorporated reference.
Vaughan Nelson
Investment Management, L.P. (Vaughan Nelson)
See the Prospectus
constituting Part A of the Registration Statement and “Management and Advisory Arrangements” in the SAI constituting Part B of this Registration Statement.
The business and
other connections of the directors and executive officers of Vaughan Nelson are included in Schedule A and D of Form ADV filed with the Securities and Exchange Commission (File No. 801-51795), as most recently amended,
the text of which is hereby incorporated reference.
Massachusetts
Financial Services Company (MFS)
See the Prospectus
constituting Part A of the Registration Statement and “Management and Advisory Arrangements” in the SAI constituting Part B of this Registration Statement.
The business and
other connections of the directors and executive officers of MFS are included in Schedule A and D of Form ADV filed with the Securities and Exchange Commission (File No. 801-17352), as most recently amended, the text
of which is hereby incorporated reference.
Item 32. Principal
Underwriters.
(a) Prudential
Investment Management Services LLC (PIMS)
PIMS is distributor
for The Prudential Investment Portfolios, Inc., Prudential Investment Portfolios 2, Prudential Jennison 20/20 Focus Fund, Prudential Investment Portfolios 3, Prudential Investment Portfolios Inc. 14, Prudential
Investment Portfolios 4, Prudential Investment Portfolios 5, Prudential MoneyMart Assets, Inc., Prudential Investment Portfolios 6, Prudential National Muni Fund, Inc., Prudential Jennison Blend Fund, Inc., Prudential
Jennison Mid-Cap Growth Fund, Inc., Prudential Investment Portfolios 7, Prudential Investment Portfolios 8, Prudential Jennison Small Company Fund, Inc., Prudential Investment Portfolios 9, Prudential World Fund, Inc.,
Prudential Investment Portfolios, Inc. 10, Prudential Jennison Natural Resources Fund, Inc., Prudential Global Total
7
Return Fund, Inc., Prudential Total Return Bond Fund, Inc., Prudential Investment Portfolios 12, Prudential Investment Portfolios, Inc. 15, Prudential Sector Funds, Inc. Prudential Short-Term Corporate
Bond Fund, Inc., Target Asset Allocation Funds, The Target Portfolio Trust, and The Prudential Series Fund.
PIMS is also
distributor of the following other investment companies: Separate Accounts: Prudential’s Gibraltar Fund, Inc., The Prudential Variable Contract Account-2, The Prudential Variable Contract Account-10, The
Prudential Variable Contract Account-11, The Prudential Variable Contract Account-24, The Prudential Variable Contract GI-2, The Prudential Discovery Select Group Variable Contract Account, The Pruco Life Flexible
Premium Variable Annuity Account, The Pruco Life of New Jersey Flexible Premium Variable Annuity Account, The Prudential Individual Variable Contract Account, The Prudential Qualified Individual Variable Contract
Account and PRIAC Variable Contract Account A.
(b) The following
table sets forth information regarding certain officers of PIMS. As a limited liability company, PIMS has no directors.
| Name and Principal Business Address | Positions and Offices with Underwriter |
| Judy A. Rice (1) | President and Chief Executive Officer |
| Christine C. Marcks (4) | Executive Vice President |
| Gary F. Neubeck (2) | Executive Vice President |
| Scott E. Benjamin (1) | Vice President |
| Joanne M. Accurso-Soto (1) | Senior Vice President |
| Michael J. King (3) | Senior Vice President, Chief Legal Officer and Secretary |
| Peter J. Boland (1) | Senior Vice President and Chief Operating Officer |
| John N. Christolini (4) | Senior Vice President |
| Mark R. Hastings (1) | Senior Vice President and Chief Compliance Officer |
| Michael J. McQuade (1) | Senior Vice President, Comptroller and Chief Financial Officer |
| John L. Bronson (3) | Vice President and Deputy Chief Legal Officer |
| Richard W. Kinville (3) | Vice President and Anti-Money Laundering Officer |
Principal Business
Addresses:
| (1) | Gateway Center Three, Newark, NJ 07102-4061 |
| (2) | Gateway Center Two, Newark, NJ 07102-4061 |
| (3) | 751 Broad Street, Newark NJ, 07102-3714 |
| (4) | 280 Trumbull Street, Hartford, CT 06103-3509 |
(c) Registrant has
no principal underwriter who is not an affiliated person of the Registrant.
Item 33. Location of
Accounts and Records.
All accounts, books
and other documents required to be maintained by Section 31(a) of the 1940 Act and the Rules thereunder are maintained at the offices of Bank of New York Mellon, 1 Wall Street, NY NY 10011, Eagle Asset
Management, Inc., 880 Carrillon Pkwy., St. Petersburg, Florida 33716, EARNEST Partners, LLC, 1180 Peachtree Street NE, Suite 2300, Atlanta, Georgia 30309, Epoch Investment Partners, Inc., 640 Fifth Avenue, New York,
New York 10019, Hotchkis and Wiley Capital Management, LLC, 725 South Figueroa Street-39th Floor, Los Angeles, California 90017, LSV Asset Management, 155 North Wacker Drive, Chicago, Illinois 60606, Massachusetts
Financial Services Company, 500 Boylston Street, Boston, Massachusetts 02116, Marsico Capital Management, LLC, 1200 17th Street-Suite 1600, Denver, Colorado 80202, NFJ Investment Group LLC, 2100 Ross Avenue, Dallas,
Texas 75201, Pacific Investment Management Company LLC, 840 Newport Center Drive, Newport Beach, California 92660, Thornburg Investment Management, Inc., 2300 Ridgetop Road, Santa Fe, New Mexico 87506, Vaughan Nelson
Investment Management, L.P., 600 Travis Street, Suite 7300, Houston, Texas 77002, the Registrant, Gateway Center Three, 100 Mulberry Street, Newark, New Jersey 07102, and Prudential Mutual Fund Services LLC (PMFS), 100
Mulberry Street, Gateway Center Three, Newark, New Jersey 07102.
8
Documents required
by Rules 31a-1(b) (4), (5), (6), (7), (9), (10) and (11) and 31a-1 (d) and (f) will be kept at Gateway Center Three, 100 Mulberry Street, Newark, New Jersey 07102, and the remaining
accounts, books and other documents required by such other pertinent provisions of Section 31(a) and the Rules promulgated thereunder will be kept by BNY and PMFS.
Item 34. Management
Services.
Other than as set
forth under the captions “How the Fund is Managed-Manager” and “How the Fund is Managed-Distributor” in the Prospectus and the caption “Management and Advisory Arrangements” in the
SAI, constituting Parts A and B, respectively, of this Post-Effective Amendment to the Registration Statement, Registrant is not a party to any management-related service contract.
Item 35. Undertakings.
Not applicable.
9
SIGNATURES
Pursuant to the
requirements of the Securities Act and the Investment Company Act, the Fund certifies that it meets all of the requirements for effectiveness of this Post-Effective Amendment to the Registration Statement under
Rule 485(b) under the Securities Act and has duly caused this Post-Effective Amendment to the Registration Statement to be signed on its behalf by the undersigned, duly authorized, in the City of Newark, and State of
New Jersey, on the 28th day of September, 2012.
Target Asset Allocation Funds
*
Stuart S. Parker,
President
Pursuant to the
requirements of the Securities Act of 1933, this Post-Effective Amendment to the Registration Statement has been signed below by the following persons in the capacities and on the date indicated.
| Signature | Title | Date |
| * Kevin J. Bannon | Trustee | |
| * Scott E. Benjamin | Trustee | |
| * Linda W. Bynoe | Trustee | |
| * Michael S. Hyland | Trustee | |
| * Douglas H. McCorkindale | Trustee | |
| * Stephen P. Munn | Trustee | |
| * Stuart S. Parker | Trustee and President, Principal Executive Officer | |
| * Richard A. Redeker | Trustee | |
| * Robin B. Smith | Trustee | |
| * Stephen Stoneburn | Trustee | |
| * Grace C. Torres | Treasurer, Principal Financial and Accounting Officer | |
| *By: /s/ Jonathan D. Shain Jonathan D. Shain | Attorney-in-Fact | September 28, 2012 |
10
POWER OF ATTORNEY
The undersigned
Directors, Trustees and Officers of the Prudential Investments Mutual Funds, the Target Funds and The Prudential Variable Contract Accounts 2, 10 and 11 (collectively, the “Funds”), hereby constitute,
appoint and authorize each of, Andrew French, Claudia DiGiacomo, Deborah A. Docs, Katherine P. Feld, Raymond O’Hara, Amanda Ryan, and Jonathan D. Shain, as true and lawful agents and attorneys-in-fact, to sign,
execute and deliver on his or her behalf in the appropriate capacities indicated, any Registration Statements of the Funds on the appropriate forms, any and all amendments thereto (including pre- and post-effective
amendments), and any and all supplements or other instruments in connection therewith, including Form N-PX, Forms 3, 4 and 5, as appropriate, to file the same, with all exhibits thereto, with the U.S. Securities and
Exchange Commission (the “SEC”) and the securities regulators of appropriate states and territories, and generally to do all such things in his or her name and behalf in connection therewith as said
attorney-in-fact deems necessary or appropriate to comply with the provisions of the Securities Act of 1933, section 16(a) of the Securities Exchange Act of 1934 and the Investment Company Act of 1940, all related
requirements of the SEC and all requirements of appropriate states and territories. The undersigned do hereby give to said agents and attorneys-in-fact full power and authority to act in these premises,
including, but not limited to, the power to appoint a substitute or substitutes to act hereunder with the same power and authority as said agents and attorneys-in-fact would have if personally acting. The
undersigned do hereby approve, ratify and confirm all that said agents and attorneys-in-fact, or any substitute or substitutes, may do by virtue hereof.
| /s/ Kevin J. Bannon Kevin J. Bannon | /s/ Stuart S. Parker Stuart S. Parker | |
| /s/ Scott E. Benjamin Scott E. Benjamin | /s/ Richard A. Redeker Richard A. Redeker | |
| /s/ Linda W. Bynoe Linda W. Bynoe | /s/Robin B. Smith Robin B. Smith | |
| /s/ Michael S. Hyland Michael S. Hyland | /s/ Stephen Stoneburn Stephen Stoneburn | |
| /s/ Douglas H. McCorkindale Douglas H. McCorkindale | /s/ Grace C. Torres Grace C. Torres | |
| /s/ Stephen P. Munn Stephen P. Munn | ||
| Dated: June 6, 2012 |
11
Target Asset Allocation Funds
Exhibit Index
| Item 28 Exhibit No. | Description |
| (d)(5) | Subadvisory Agreement between PI and Epoch Investment Partners, Inc. with respect to each Fund dated July 12, 2012 |
| (j) | Consent of independent registered public accounting firm |
| (m)(6) | Distribution and fee waiver for Class A and R shares |
12