Table of Contents
UNITED STATES
SECURITIES AND EXCHANGE COMMISSION
Washington, D.C. 20549
FORM N-CSR
CERTIFIED SHAREHOLDER REPORT OF
REGISTERED MANAGEMENT INVESTMENT COMPANIES
Investment Company Act file number 811-08879
SUN CAPITAL ADVISERS TRUST
(Exact name of registrant as specified in charter)
One Sun Life Executive Park, Wellesley Hills, Massachusetts 02481
(Address of principal executive offices) (Zip code)
John T. Donnelly
Sun Capital Advisers Trust
One Sun Life Executive Park
Wellesley Hills, Massachusetts 02481
(Name and address of agent for service)
Registrant’s telephone number, including area code: (800) 432-1102 x 3330
Date of fiscal year end: December 31
Date of reporting period: December 31, 2010
Table of Contents
| Item 1. | Reports to Stockholders. |
The following is a copy of the report transmitted to stockholders pursuant to Rule 30e-1 under the Investment Company Act of 1940, as amended:
Table of Contents
SUN CAPITAL ADVISERS TRUST®
Annual Report December 31, 2010
SCSM AllianceBernstein International Value Fund
SCSM BlackRock International Index Fund
SCSM BlackRock Large Cap Index Fund
SCSM BlackRock Small Cap Index Fund
SCSM Goldman Sachs Mid Cap Value Fund
SCSM Columbia Small Cap Value Fund
SCSM Davis Venture Value Fund
SCSM Invesco Small Cap Growth Fund
SCSM Lord Abbett Growth & Income Fund
SCSM WMC Blue Chip Mid Cap Fund
SCSM WMC Large Cap Growth Fund
Sun Capital Global Real Estate Fund
SCSM Ibbotson Tactical Opportunities Fund
Sun Capital Investment Grade Bond Fund®
Sun Capital Money Market Fund®
SCSM BlackRock Inflation Protected Bond Fund
SCSM Goldman Sachs Short Duration Fund
SCSM PIMCO High Yield Fund
SCSM PIMCO Total Return Fund
SCSM Ibbotson Balanced Fund
SCSM Ibbotson Conservative Fund
SCSM Ibbotson Growth Fund

|
Sun Capital Advisers Trust is registered under the Investment Company Act of 1940 as an open-end management investment company. Its investment adviser is Sun Capital Advisers LLC®, a member of the Sun Life Financial group of companies. |
Table of Contents
| Important Information about this Report |
||||
| Management’s Discussion & Analysis |
||||
| 1 | ||||
| 6 | ||||
| 9 | ||||
| 13 | ||||
| 17 | ||||
| 21 | ||||
| 26 | ||||
| 30 | ||||
| 35 | ||||
| 40 | ||||
| 45 | ||||
| 49 | ||||
| 53 | ||||
| 56 | ||||
| 60 | ||||
| 64 | ||||
| 68 | ||||
| 72 | ||||
| 77 | ||||
| 82 | ||||
| 82 | ||||
| 82 | ||||
| 93 | ||||
| Portfolios of Investments |
||||
| 96 | ||||
| 103 | ||||
| 120 | ||||
| 130 | ||||
| 157 | ||||
| 163 | ||||
| 169 | ||||
| 174 | ||||
| 178 | ||||
| 181 | ||||
| 185 | ||||
| 188 | ||||
| 191 | ||||
| 192 | ||||
| 200 | ||||
| 203 | ||||
| 207 | ||||
| 215 | ||||
| 232 | ||||
| 255 | ||||
| 257 | ||||
| 258 | ||||
| Financial Statements |
||||
| 260 | ||||
| 265 | ||||
| 270 | ||||
| 278 | ||||
| 293 | ||||
| 328 | ||||
| 329 | ||||
| 329 | ||||
| 329 | ||||
| 329 | ||||
| 330 | ||||
| 337 |
Table of Contents
Important Information about this Report:
This report and the financial statements contained herein are submitted for the general information of the shareholders of the Funds. This report is not authorized for distribution to prospective investors in the Funds unless preceded or accompanied by an effective prospectus. Investors should consider the investment objectives, risks, charges and expenses of a Fund before investing. This and other information is contained in a Fund’s prospectus. Please read the prospectus carefully before you invest.
The views and opinions expressed in each Fund’s “Management’s Discussion and Analysis” are those of the portfolio manager(s) of the Fund. The views and opinions expressed, and the portfolio holdings described, are as of December 31, 2010, and are subject to change at any time without notice due to market or other conditions. These should not be construed as investment advice or as a recommendation to buy or sell any security. Any forecasts or other forward looking views may not come to pass. Past performance is no guarantee of future results. Performance may have changed materially since December 31, 2010.
An investment in a Fund is not a bank deposit and is not insured by the Federal Deposit Insurance Corporation. It is possible to lose money on an investment in any of the Funds.
Country codes included within each Fund’s Portfolio of Investments are unaudited.
Table of Contents
SC ALLIANCEBERNSTEIN INTERNATIONAL VALUE FUND
(subadvised by AllianceBernstein L.P.)
MANAGEMENT’S DISCUSSION & ANALYSIS:
How did the Fund perform during the year ended December 31, 2010?
For the year ended December 31, 2010, the Initial and Service Class shares of SC AllianceBernstein International Value Fund (the “Fund”) returned 4.62% and 4.52%, respectively, underperforming the benchmark, the MSCI- EAFE Index (the “Index”), which returned 7.75% for the same period.
What economic and market factors most influenced the global equity markets as a whole during the year ended December 31, 2010?
Equities rose during 2010, but markets were erratic. Concerns about sovereign debt troubles in Europe, Chinese growth and the fears of a second economic slowdown or a “double dip” recession in the U.S. interrupted the global market recovery in the second quarter. Markets did recover in the last four months of the year, led by stocks in the U.S. and emerging markets.
Tough market conditions have created an unprecedented value opportunity in stocks across all market sectors. During 2010, macroeconomic uncertainties prompted a flight to safe assets such as government debt. Strong corporate fundamentals were not rewarded as equity correlation was high, meaning stocks tended to trade in the same direction despite a wide divergence in underlying company performance. High risk aversion led investors to shun the value stocks that the Fund invests in.
How did the country allocations affect relative Fund performance during the year ended December 31, 2010?
The Fund’s country allocations are primarily a result of the bottom-up stock selection process. Overall security selection within countries had a negative impact on the Fund’s performance, detracting the most in Germany, Hong Kong and France. Country selection was a positive contributor to performance due to the Fund’s overweight positions in the United Kingdom (U.K.) and Canada, but a detractor due to underweight positions in Sweden and Hong Kong as compared to the Index. Finally, currency selection in the Fund contributed to performance due to the Fund’s overweight position in the U.S. dollar and the Canadian dollar, but detracted due to underweight positions in the Australian dollar and Japanese yen.
Which stocks contributed most to the Fund’s returns during the year ended December 31, 2010?
Holdings in several sectors benefited from signs of improving demand that is likely to continue as the global economic recovery progresses. German automaker Bayerische Motoren Werke (BMW) outperformed as demand recovered and as the company introduced new models, helping it gain market share and outperform its peers. Industrial commodity stocks, such as U.K. companies Xstrata PLC and Rio Tinto PLC, and Canadian company Lundin Mining Corp. benefited from a strong price surge in the commodity sector, driven by the U.S. Federal Reserve’s new quantitative easing initiative (U.S. Treasury Bond purchases) and resulting U.S. dollar weakness.
Which stocks detracted from the Fund’s performance results during the year ended December 31, 2010?
Several European holdings suffered from sovereign debt concerns, including UniCredit SpA, the Italian banking group. As the crisis evolved, the Fund trimmed its position in UniCredit SpA.
Japanese company Sharp Corp. weighed on the Fund’s returns in the year. Sharp Corp., which competes with Korean companies, was adversely affected by the appreciation of the Japanese yen versus the Korean won and weaker Liquid Crystal Display (LCD) pricing. Also detracting from performance was the Fund’s position in Portuguese retailer Espirit Holdings Ltd. and French utility Electricié de France.
1
Table of Contents
SC ALLIANCEBERNSTEIN INTERNATIONAL VALUE FUND (Continued)
Did the fund experience major changes to its top ten holdings during the year ended December 31, 2010?
There were five positions on the top ten holdings list as of December 31, 2009 that still remained among the Fund’s top ten holdings as of December 31, 2010. The five new additions to the top ten holdings list were AstraZeneca PLC, Nestle SA, Toyota Motor Corp., BHP Billiton PLC and E.ON AG. These securities, except for Toyota Motor Corp., which was a new purchase in 2010, were held by the Fund as of December 31, 2009 but were not in the top ten holdings. However, during 2010, their position size expanded due to market fluctuation and/or additions to the position size such that they were in the top ten holdings as of December 31, 2010. The five top ten holdings as of December 31, 2009 that were no longer on the Fund’s top ten holdings list as of December 31, 2010 remain as holdings by the Fund in reduced positions with the exception of Banco Santander SA which was sold from the Fund after being affected by investor anxiety over the European sovereign debt crisis.
How was the Fund positioned relative to its benchmark index at December 31, 2010?
The Fund is constructed using a bottom-up stock selection process. Relative sector weights are therefore a function of that approach rather than a result of top-down insights. Many of the companies that the Fund holds have massive amounts of cash on their balance sheets and strong cash flow, giving them ability to pay dividends to shareholders in the years ahead. The Fund’s sector weights illustrate where we have found value opportunities created from this environment.
The Fund remains tilted to benefit from the continued economic recovery through its holdings in the Consumer Discretionary, Materials and Energy sectors specifically. There are also attractive opportunities within the Telecommunications sector, where holdings such as U.K. company Vodafone Group PLC have significant cash on the balance sheet, pay sizable dividends, yet trade at very attractive valuations.
The Fund’s underweight positions to the Consumer Staples and Financials sectors are a result of more limited value opportunities and our assessment of risk. The Fund remains underweight in the Consumer Staples sector where valuations are more demanding. The continued risk around sovereign debt issues in Europe has led to underweight positions in the Financial sector, although the Fund continues to own many companies in Europe, Asia and Australia that offer attractive risk/reward profiles.
2
Table of Contents
SC ALLIANCEBERNSTEIN INTERNATIONAL VALUE FUND (Continued)
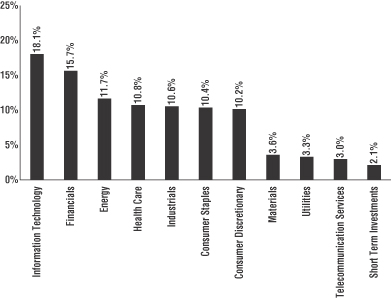
COUNTRY ALLOCATIONS AT DECEMBER 31, 2010*
Percentage of Net Assets
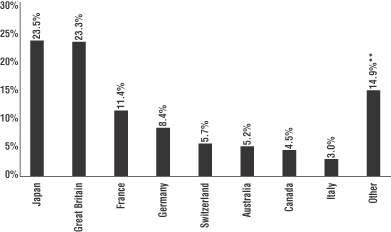
| * | The percentages shown for each country reflect the value of investments in that country as a percentage of net assets. Figures in the above graph may not total to 100% due to the exclusion of the Fund’s other assets and liabilities. |
| ** | Includes 21 countries with an allocation of less than 2% individually. |
TOP TEN EQUITY HOLDINGS AT DECEMBER 31, 2010
| % of Net Assets | Industry | |||||
| Royal Dutch Shell PLC, A Shares |
2.2 | % | Oil, Gas & Consumable Fuels | |||
| Rio Tinto PLC |
1.8 | Metals & Mining | ||||
| AstraZeneca PLC |
1.8 | Pharmaceuticals | ||||
| Vodafone Group PLC |
1.7 | Wireless Telecommunication Services | ||||
| BP PLC |
1.7 | Oil, Gas & Consumable Fuels | ||||
| Novartis AG |
1.5 | Pharmaceuticals | ||||
| Nestle SA |
1.5 | Food Products | ||||
| Toyota Motor Corp. |
1.5 | Automobiles | ||||
| BHP Billiton PLC |
1.2 | Metals & Mining | ||||
| E.ON AG |
1.2 | Electric Utilities | ||||
3
Table of Contents
SC ALLIANCEBERNSTEIN INTERNATIONAL VALUE FUND (Continued)
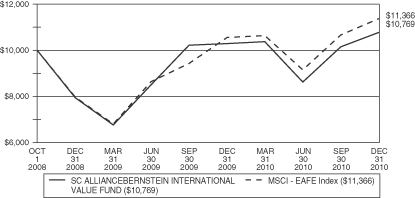
Comparison of Change in Value of a $10,000 Investment in the SC AllianceBernstein International Value Fund – Initial Class and the MSCI-EAFE Index
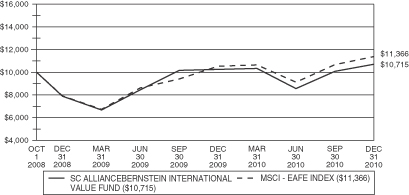
Comparison of Change in Value of a $10,000 Investment in the SC AllianceBernstein International Value Fund – Service Class and the MSCI-EAFE Index
4
Table of Contents
SC ALLIANCEBERNSTEIN INTERNATIONAL VALUE FUND (Continued)
Average Annual Total Returns for Periods Ended December 31, 2010**
| One Year | Life of Fund*** |
|||||||
| SC AllianceBernstein International Value Fund-Initial Class Shares |
4.62 | % | 3.34 | % | ||||
| SC AllianceBernstein International Value Fund-Service Class Shares |
4.52 | % | 3.12 | % | ||||
| MSCI-EAFE Index* |
7.75 | % | 5.85 | % | ||||
*The performance data of the index has been prepared from sources and data that the investment adviser believes to be reliable, but no representation is made as to their accuracy. The index is unmanaged and cannot be invested in directly. The MSCI-EAFE Index (Europe, Australasia, Far East) tracks performance of large cap international equity securities and is widely regarded as the standard for measuring large cap international stock market performance.
**Performance data is historical and includes changes in share price and reinvestment of income dividends and capital gains distributions. Past performance does not indicate future results. All Fund returns are net of fees and expenses, but do not include any insurance charges imposed in connection with your variable insurance contract. If this performance information included the effect of the insurance charges and the fees and expenses assumed by the investment adviser, performance numbers would be lower. The value of an investment in the SC AllianceBernstein International Value Fund and the return on the investment will fluctuate and redemption proceeds may be higher or lower than an investor’s original cost.
***For the period from October 1, 2008 (commencement of operations) to December 31, 2010.
5
Table of Contents
SC BLACKROCK INTERNATIONAL INDEX FUND
(subadvised by BlackRock Investment Management, LLC)
MANAGEMENT’S DISCUSSION & ANALYSIS:
How did the Fund perform during the period ended December 31, 2010?
For the period from November 15, 2010 (commencement of operations) to December 31, 2010, the Initial and Service Class shares of SC BlackRock International Index Fund (the “Fund”) returned 3.80% and 3.70%, respectively, outperforming the benchmark, the MSCI-EAFE Index (the “Index”), which returned 1.87% for the same period.
What economic and market factors most influenced the global equity markets as a whole during the quarter ended December 31, 2010?
International equity markets continued their climb over the fourth quarter, although the pace of the rally slowed relative to the previous quarter. The Index advanced 6.6% for the quarter, finishing the year with a 7.8% gain. Most countries in the Index posted gains for the quarter with the strongest returns seen in Japan, Norway, Austria and New Zealand, while Greece and Spain declined.
Emerging markets continued to outpace the developed world in terms of economic growth, and continued to post respectable gains despite the surfacing of concerns around the implementation of widespread tightening of monetary policy. While the MSCI Emerging Markets Index marginally outperformed the MSCI-EAFE Index for the quarter with its 7.4% return, it significantly outpaced the Index for the year, with a gain of 19.2%.
In Europe, concerns over the regional debt crisis resurfaced and dominated equity markets. Ireland’s acceptance of a bailout package elevated concerns over further contagion of the crisis to peripheral European nations, with particular focus on Spain and Portugal. Nevertheless, macroeconomic data from core European countries remained solid over the quarter, highlighted by strong industrial production. Germany was the main growth engine in the Eurozone, as German macro data consistently beat expectations.
Despite a weak start to the quarter, Japanese equities posted powerful gains, driven by exchange rate movements, generally improving macroeconomic data, and gross domestic product (“GDP”) growth that exceeded expectations. Elsewhere in Asia, geopolitical tensions in Korea and increasing concerns about overheating in China resulted in mixed performance across the region.
While all of the sectors in the Index advanced over the quarter, cyclical sectors outpaced defensive sectors as investors experienced a renewed confidence and gravitated toward higher risk assets. The Materials sector charged ahead of the Index, followed by the Information Technology, Industrials, and Energy sectors. The Financials sector had the weakest positive return.
How did the country allocations affect Fund performance during the period ended December 31, 2010?
The top contributors to the Fund’s performance were Japan, Australia, United Kingdom and Switzerland while the top detractors were Spain and Italy.
Which sectors contributed most to the Fund’s performance results during the period ended December 31, 2010?
The Fund’s investment in a money market fund during the short period at the Fund’s inception positively contributed to the relative Fund’s performance against the Index that declined during that period. The top contributors to the Fund’s performance were the Materials, Industrials and Consumer Discretionary sectors.
Which sectors detracted most from the Fund’s performance results during the period ended December 31, 2010?
The Telecommunication Services sector was the primary detractor from the Fund’s performance.
6
Table of Contents
SC BLACKROCK INTERNATIONAL INDEX FUND (Continued)
COUNTRY ALLOCATIONS AT DECEMBER 31, 2010*
Percentage of Net Assets
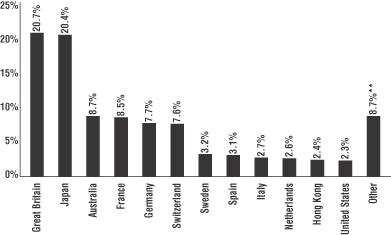
| * | The percentages shown for each country reflect the value of investments in that country as a percentage of net assets. Figures in the above graph may not total to 100% due to the exclusion of the Fund’s other assets and liabilities. |
| ** | Includes 19 countries with an allocation of less than 2% individually. |
TOP TEN EQUITY HOLDINGS AT DECEMBER 31, 2010
| % of Net Assets | Industry | |||||
| Nestle SA |
1.8 | % | Food Products | |||
| HSBC Holdings PLC |
1.6 | Commercial Banks | ||||
| BHP Billiton Ltd. |
1.3 | Metals & Mining | ||||
| BP PLC |
1.2 | Oil, Gas & Consumable Fuels | ||||
| Vodafone Group PLC |
1.2 | Wireless Telecommunication Services | ||||
| Novartis AG |
1.1 | Pharmaceuticals | ||||
| Royal Dutch Shell PLC, Class A |
1.0 | Oil, Gas & Consumable Fuels | ||||
| Total SA |
1.0 | Oil, Gas & Consumable Fuels | ||||
| Toyota Motor Corp. |
0.9 | Automobiles | ||||
| Roche Holding AG |
0.9 | Pharmaceuticals | ||||
7
Table of Contents
SC BLACKROCK INTERNATIONAL INDEX FUND (Continued)
As of the year ended 12/31/10, the Fund did not have six months of performance and therefore line graphs are not presented.
Total Returns for Period Ended December 31, 2010**
| Life of Fund***± |
||||
| SC BlackRock International Index Fund-Initial Class Shares |
3.80 | % | ||
| SC BlackRock International Index Fund-Service Class Shares |
3.70 | % | ||
| MSCI-EAFE Index* |
1.87 | % | ||
*The performance data of the index has been prepared from sources and data that the investment adviser believes to be reliable, but no representation is made as to their accuracy. The index is unmanaged and cannot be invested in directly. The MSCI-EAFE Index (Europe, Australasia, Far East) tracks performance of large cap international equity securities and is widely regarded as the standard for measuring large cap international stock market performance.
**Performance data is historical and includes changes in share price and reinvestment of income dividends and capital gains distributions. Past performance does not indicate future results. All Fund returns are net of fees and expenses, but do not include any insurance charges imposed in connection with your variable insurance contract. If this performance information included the effect of the insurance charges and the fees and expenses assumed by the investment adviser, performance numbers would be lower. The value of an investment in the SC BlackRock International Index Fund and the return on the investment will fluctuate and redemption proceeds may be higher or lower than an investor’s original cost.
***For the period from November 15, 2010 (commencement of operations) to December 31, 2010.
± Returns for period of less than one year are not annualized.
8
Table of Contents
SC BLACKROCK LARGE CAP INDEX FUND
(subadvised by BlackRock Investment Management, LLC)
MANAGEMENT’S DISCUSSION & ANALYSIS:
How did the Fund perform during the year and period ended December 31, 2010?
Effective November 15, 2010, BlackRock Investment Management, LLC replaced OppenheimerFunds, Inc. as subadviser to the SC Oppenheimer Large Cap Core Fund, and the name of the fund was changed to SC BlackRock Large Cap Index Fund (the “Fund”). In connection with this change, the Fund changed its investment goal and investment strategy from an active to a passive management approach, and will attempt to invest in a portfolio of assets whose performance is expected to match approximately the performance of the Standard & Poor’s (“S&P”) 500 Index (the “Index”).
For the year ended December 31, 2010, the Fund’s Initial and Service Class shares returned 16.76% and 16.45%, respectively, outperforming the benchmark Index, which returned 15.06% for the same period. For the period from November 15, 2010 to December 31, 2010, the Fund’s Initial and Service Class shares returned 5.16% and 5.15%, respectively, underperforming the Index which returned 5.28% for the same period.
What economic and market factors most influenced the equity markets as a whole during the quarter ended December 31, 2010?
Domestic equity markets continued their rally through the fourth quarter as the economic recovery gained traction and accelerated toward year end. During the quarter, the Federal Reserve Board (Fed) launched a second round of quantitative easing (“QE2”) measures consisting of U.S. Treasury Bond purchases, the Republicans won control of the House of Representatives in the November election, and the Bush-era tax cuts were extended and supplemented with some fiscal enhancements. As a result of these market-friendly actions, together with stronger economic data and continued positive surprises on the corporate earnings front, U.S. equity markets posted strong gains for the quarter despite a correction during the month of November due to concerns about the European sovereign debt crisis and heightened geopolitical tensions in Korea.
Although, the corporate sector was an important area of strength for the U.S. economy and consumer spending showed improvement, weakness in the housing and labor markets continued to burden the economy. The housing sector remained plagued with declining home prices and depressed levels of sales, starts, and overall construction activity.
Deflationary risk continued to threaten the momentum of economic growth in the United States, tempering gains in the equity markets as inflation remained muted. The seasonally adjusted Consumer Price Index was up only 0.1% in November, leaving the year-over-year rate at 1.1%. The high degree of excess capacity in labor and manufacturing leaves little potential for widespread inflation taking hold. As noted above, the Fed demonstrated its efforts to combat deflation and unemployment by maintaining an investor-favorable easy monetary policy for eight consecutive quarters. Although QE2 measures have thus far failed to make an impact on the unemployment situation, they have successfully boosted confidence and stimulated equity markets.
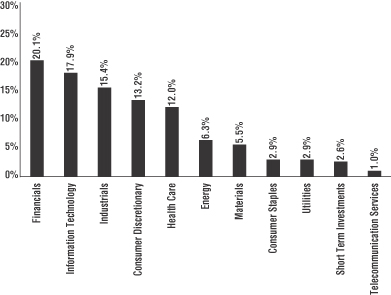
Which sectors contributed most to the Fund’s performance results during the period ended December 31, 2010?
The Financials sector was the strongest contributor during the period, followed by the Energy and Industrials sectors. The Utilities sector was the weakest positive contributor to the Fund’s performance during the period.
9
Table of Contents
SC BLACKROCK LARGE CAP INDEX FUND (Continued)
Which sectors detracted most from the Fund’s performance results during the period ended December 31, 2010?
There were no detractors during the period ended December 31, 2010.
SECTOR ALLOCATIONS AT DECEMBER 31, 2010*
Percentage of Net Assets
| * | The above graph categorizes investments using Global Industry Classification Standards (“GICS”). The percentages shown for each sector reflect the value of investments in that sector as a percentage of net assets. Figures in the above graph may not total to 100% due to the exclusion of the Fund’s other assets and liabilities. |
TOP TEN EQUITY HOLDINGS AT DECEMBER 31, 2010
| % of Net Assets | Industry | |||||
| Exxon Mobil Corp. |
3.1 | % | Oil, Gas & Consumable Fuels | |||
| Apple, Inc. |
2.5 | Computers & Peripherals | ||||
| Microsoft Corp. |
1.8 | Software | ||||
| General Electric Co. |
1.7 | Industrial Conglomerates | ||||
| Chevron Corp. |
1.6 | Oil, Gas & Consumable Fuels | ||||
| International Business Machines Corp. |
1.6 | IT Services | ||||
| The Procter & Gamble Co. |
1.5 | Household Products | ||||
| AT&T, Inc. |
1.5 | Diversified Telecommunication Services | ||||
| Johnson & Johnson |
1.4 | Pharmaceuticals | ||||
| JP Morgan Chase & Co. |
1.4 | Diversified Financial Services | ||||
10
Table of Contents
SC BLACKROCK LARGE CAP INDEX FUND (Continued)
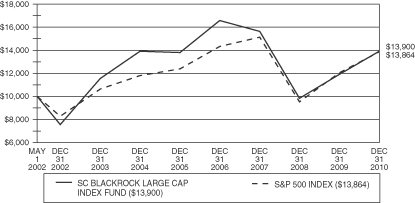
Comparison of Change in Value of a $10,000 Investment in the SC BlackRock Large Cap Index Fund – Initial Class and the S&P 500 Index
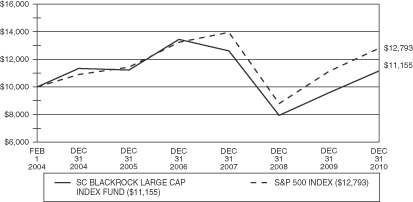
Comparison of Change in Value of a $10,000 Investment in the SC BlackRock Large Cap Index Fund – Service Class and the S&P 500 Index
11
Table of Contents
SC BLACKROCK LARGE CAP INDEX FUND (Continued)
Average Annual Total Returns for Periods Ended December 31, 2010**
| Initial Class Shares |
One Year | Three Years | Five Years | Life of Fund*** |
||||||||||||
| SC BlackRock Large Cap Index Fund |
16.76 | % | (3.81 | )% | 0.13 | % | 3.87 | % | ||||||||
| S&P 500 Index* |
15.06 | % | (2.86 | )% | 2.29 | % | 3.84 | % | ||||||||
| Service Class Shares |
||||||||||||||||
| SC BlackRock Large Cap Index Fund |
16.45 | % | (4.01 | )% | (0.10 | )% | 1.59 | % | ||||||||
| S&P 500 Index* |
15.06 | % | (2.86 | )% | 2.29 | % | 3.63 | % | ||||||||
*The performance data of the index has been prepared from sources and data that the investment adviser believes to be reliable, but no representation is made as to their accuracy. The index is unmanaged and cannot be invested in directly. The S&P 500 Index is a market-value weighted index of 500 blue chip stocks and is considered to be a benchmark of the overall stock market.
**Performance data is historical and includes changes in share price and reinvestment of income dividends and capital gains distributions. Past performance does not indicate future results. All Fund returns are net of fees and expenses, but do not include any insurance charges imposed in connection with your variable insurance contract. If this performance information included the effect of the insurance charges and the fees and expenses assumed by the investment adviser, performance numbers would be lower. The value of an investment in the SC BlackRock Large Cap Index Fund and the return on the investment will fluctuate and redemption proceeds may be higher or lower than an investor’s original cost.
***Initial Class Shares for the period from May 1, 2002 (commencement of operations) to December 31, 2010. Service Class Shares for the period from February 1, 2004 (commencement of operations) to December 31, 2010.
12
Table of Contents
SC BLACKROCK SMALL CAP INDEX FUND
(subadvised by BlackRock Investment Management, LLC)
MANAGEMENT’S DISCUSSION & ANALYSIS:
How did the Fund perform during the year and period ended December 31, 2010?
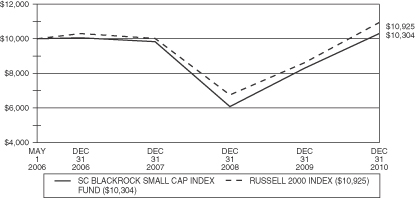
Effective November 15, 2010, BlackRock Investment Management, LLC replaced OppenheimerFunds, Inc. as subadviser to the SC Oppenheimer Main Street Small Cap Core Fund, and the name of the fund was changed to SC BlackRock Small Cap Index Fund (the “Fund”). In connection with this change, the Fund changed its investment goal and investment strategy from an active to a passive management approach, and will attempt to invest in a portfolio of assets whose performance is expected to match approximately the performance of the Russell 2000 Index (the “Index”).
For the year ended December 31, 2010, the Fund’s Initial and Service Class shares returned 24.46% and 24.07%, respectively, underperforming the benchmark Index, which returned 26.86% for the same period. For the period from November 15, 2010 to December 31, 2010, the Fund’s Initial and Service Class shares returned 9.06% and 9.01%, respectively, with the Initial Class outperforming and the Service Class underperforming the benchmark which returned 9.05% for the same period.
What economic and market factors most influenced the equity markets as a whole during the quarter ended December 31, 2010?
Domestic equity markets continued their rally through the fourth quarter as the economic recovery gained traction and accelerated toward year end. During the quarter, the Federal Reserve Board (Fed) launched a second round of quantitative easing (“QE2”) measures consisting of U.S. Treasury Bond purchases, the Republicans won control of the House of Representatives in the November election, and the Bush-era tax cuts were extended and supplemented with some fiscal enhancements. As a result of these market-friendly actions, together with stronger economic data and continued positive surprises on the corporate earnings front, U.S. equity markets posted strong gains for the quarter despite a correction during the month of November due to concerns about the European sovereign debt crisis and heightened geopolitical tensions in Korea.
Although, the corporate sector was an important area of strength for the U.S. economy and consumer spending showed improvement, weakness in the housing and labor markets continued to burden the economy. The housing sector remained plagued with declining home prices and depressed levels of sales, starts, and overall construction activity.
Deflationary risk continued to threaten the momentum of economic growth in the United States, tempering gains in the equity markets as inflation remained muted. The seasonally adjusted Consumer Price Index (“CPI”) was up only 0.1% in November, leaving the year-over-year rate at 1.1%. The high degree of excess capacity in labor and manufacturing leaves little potential for widespread inflation taking hold. As noted above, The Fed demonstrated its efforts to combat deflation and unemployment by maintaining an investor favorable easy monetary policy for eight consecutive quarters. Although QE2 measures have thus far failed to make an impact on the unemployment situation, they have successfully boosted confidence and stimulated equity markets.
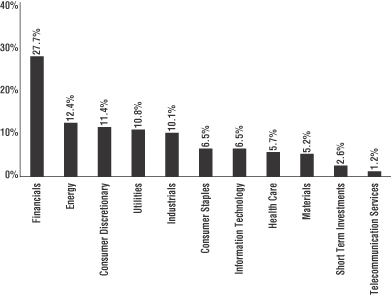
Which sectors contributed most to the Fund’s performance results during the period ended December 31, 2010?
The Information Technology sector was the strongest contributor to the Fund’s performance during the period, followed by the Industrials and Financials sectors. The Telecommunication Services sector was the weakest positive contributor for the Fund’s performance during the period.
13
Table of Contents
SC BLACKROCK SMALL CAP INDEX FUND (Continued)
Which sectors detracted most from the Fund’s performance results during the period ended December 31, 2010?
There were no detractors during the period ended December 31, 2010.
SECTOR ALLOCATIONS AT DECEMBER 31, 2010*
Percentage of Net Assets
| * | The above graph categorizes investments using GICS. The percentages shown for each sector reflect the value of investments in that sector as a percentage of net assets. Figures in the above graph may not total to 100% due to the exclusion of the Fund’s other assets and liabilities. |
TOP TEN EQUITY HOLDINGS AT DECEMBER 31, 2010
| % of Net Assets | Industry | |||||
| Riverbed Technology, Inc. |
0.4 | % | Communications Equipment | |||
| VeriFone Holdings, Inc. |
0.3 | IT Services | ||||
| TIBCO Software, Inc. |
0.3 | Software | ||||
| Brigham Exploration Co. |
0.3 | Oil, Gas & Consumable Fuels | ||||
| Deckers Outdoor Corp. |
0.3 | Textiles, Apparel & Luxury Goods | ||||
| Nordson Corp. |
0.2 | Machinery | ||||
| Rackspace Hosting, Inc. |
0.2 | Internet Software & Services | ||||
| Sotheby’s |
0.2 | Diversified Consumer Services | ||||
| Baldor Electric Co. |
0.2 | Electrical Equipment | ||||
| Hecla Mining Co. |
0.2 | Metals & Mining | ||||
14
Table of Contents
SC BLACKROCK SMALL CAP INDEX FUND (Continued)
Comparison of Change in Value of a $10,000 Investment in the SC BlackRock Small Cap Index Fund – Initial Class and the Russell 2000 Index

Comparison of Change in Value of a $10,000 Investment in the SC BlackRock Small Cap Index Fund – Service Class and the Russell 2000 Index
15
Table of Contents
SC BLACKROCK SMALL CAP INDEX FUND (Continued)
Average Annual Total Returns for Periods Ended December 31, 2010**
| Initial Class Shares |
One Year | Three Years | Five Years | Ten Years | Life of Fund*** |
|||||||||||||||
| SC BlackRock Small Cap Index Fund |
24.46 | % | 1.82 | % | 3.40 | % | 5.98 | % | 7.73 | % | ||||||||||
| Russell 2000 Index* |
26.86 | % | 2.22 | % | 4.47 | % | 6.33 | % | 4.95 | % | ||||||||||
| Service Class Shares |
||||||||||||||||||||
| SC BlackRock Small Cap Index Fund |
24.07 | % | 1.56 | % | — | — | 0.64 | % | ||||||||||||
| Russell 2000 Index* |
26.86 | % | 2.22 | % | — | — | 1.91 | % | ||||||||||||
*The performance data of the index has been prepared from sources and data that the investment adviser believes to be reliable, but no representation is made as to their accuracy. The index is unmanaged and cannot be invested in directly. The Russell 2000 Index is comprised of the 2,000 companies with the smallest market capitalizations from the Russell 3000 Index.
**Performance data is historical and includes changes in share price and reinvestment of income dividends and capital gains distributions. Past performance does not indicate future results. All Fund returns are net of fees and expenses, but do not include any insurance charges imposed in connection with your variable insurance contract. If this performance information included the effect of the insurance charges and the fees and expenses assumed by the investment adviser, performance numbers would be lower. The value of an investment in the SC BlackRock Small Cap Index Fund and the return on the investment will fluctuate and redemption proceeds may be higher or lower than an investor’s original cost.
***Initial Class Shares for the period from July 17, 2000 (commencement of operations) to December 31, 2010. Service Class Shares for the period from May 1, 2006 (commencement of operations) to December 31, 2010.
16
Table of Contents
SC GOLDMAN SACHS MID CAP VALUE FUND
(Subadvised by Goldman Sachs Asset Management, L.P.)
MANAGEMENT’S DISCUSSION & ANALYSIS:
How did the Fund perform during the year ended December 31, 2010?
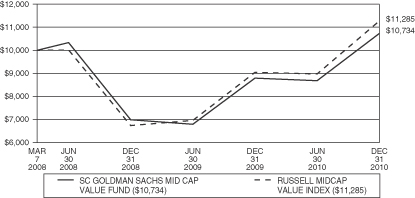
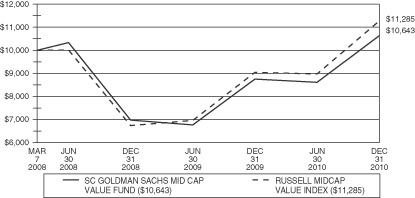
For the year ended December 31, 2010, the Initial and Service Class shares of SC Goldman Sachs Mid Cap Value Fund (the “Fund”) returned 22.13% and 21.62%, respectively, underperforming the benchmark, the Russell Mid Cap Value Index (the “Index”), which returned 24.75% for the same period.
What economic and market factors most influenced the equity markets as a whole during the year ended December 31, 2010?
Some of the most notable events during 2010 that influenced the equity markets included the following: The Flash Crash in May; the sovereign debt crisis in Europe; the Federal Reserve Board’s (Fed) quantitative easing program consisting of U.S. Treasury Bond purchases in the second half of the year; and the mid-term election.
The Flash Crash was characterized by extreme intraday swings in the prices of numerous stocks trading in the U.S., swings that appeared to be driven by the mechanics of trading rather than fundamentals. The Flash Crash heightened investors’ concerns about the structure of the equity markets and the role and impact of electronic trading. In the immediate aftermath of the Flash Crash, market volatility, as measured by the Chicago Board Options Exchange Volatility Index (VIX), increased sharply. In addition, the U.S. Securities and Exchange Commission (SEC) and stock exchanges imposed new regulations on trading.
The sovereign debt crisis in Europe began when Greece experienced difficulty rolling over a portion of its substantial debt. The European Union and International Monetary Fund (IMF) provided assistance for Greece and later on, Ireland. The European debt crisis caused a drop in sovereign bond prices (and an increase in yields), along with a drop in the euro. The crisis also led market participants to revise their forecasts of economic growth globally, as well as the likelihood of an additional economic slowdown or a “double-dip” recession in Europe and other developed markets (including the U.S.).
The Fed’s quantitative easing program, informally referred to as QE2, was largely motivated by serious doubts about the strength of the economic recovery in the U.S. The Fed’s stimulus was designed to boost economic growth and lower the chances the economic recovery would stall. QE2 helped trigger a rally in the equity markets and a steady decline in volatility as measured by VIX.
The mid-term election effected a major realignment in Washington as the Republicans took control of the House of Representatives and picked up several seats in the Senate. The Republican gains shifted the political discussion from government stimulus to spending reductions and more business friendly policies. An immediate consequence of the election was the extension of the “Bush tax cuts”, which heightened investors’ concerns about U.S. debt levels and the longer term impact of high debt levels on economic growth.
Were there any significant sector under/over weights that materially affected Fund performance relative to the benchmark during the year ended December 31, 2010?
Among sectors, stock selection was negative overall during the year. An overweight position in the Consumer Discretionary sector and an underweight position in Utilities sector, were the Fund’s least successful weightings relative to the Index. In contrast, an underweight position in the Energy sector, and an overweight position in the Industrials sector were the most successful allocations relative to the Index.
Which stocks contributed most to the Fund’s returns during the year ended December 31, 2010?
In terms of individual stocks, overweight positions in energy companies Valero Energy Corp. and Cimarex Energy Co. and machinery company The Timken Co. were the largest positive contributors to the Fund’s performance.
17
Table of Contents
SC GOLDMAN SACHS MID CAP VALUE FUND (Continued)
Which stocks detracted from the Fund’s performance results during the year ended December 31, 2010?
Overweight positions in tobacco company Lorillard, Inc., media company DISH Network Corp. and technology company Seagate Technology were among the least successful selections for the year.
Did the Fund experience major changes to its top ten holdings during the year ended December 31, 2010?
The composition of the Fund’s top ten holdings has changed since December 31, 2009. All of the securities on the top ten holdings list from December 31, 2009 are still held by the Fund with the exception of Seagate Technology. The five new positions within the top ten holdings list at December 31, 2010 are Valero Energy Corp., DISH Network Corp., Class A, Rayonier, Inc., Tesoro Corp. and Suntrust Banks, Inc. The Fund seeks to outperform the Index by overweighting stocks that are expected to outperform the Index, and underweighting those stocks that may lag the Index. The Fund attempts to take active positions such as holding securities with better momentum and valuation characteristics than the Index and, at the same time, the Fund seeks to avoid taking risks in sectors where the risk is not compensated for. Thus, over a given period, top ten holdings will be driven by the Fund’s stock selection signals and proprietary risk model.
How was the Fund positioned relative to its benchmark index at December 31, 2010?
As of December 31, 2010, the Fund was overweight in the Energy, Consumer Discretionary, Healthcare, Information Technology and Materials sectors relative to the Index. In contrast, the Fund was underweight in the Telecommunication Services, Financials, Utilities, Industrials and Consumer Staples sectors.
SECTOR ALLOCATIONS AT DECEMBER 31, 2010*
Percentage of Net Assets
| * | The above graph categorizes investments using GICS. The percentages shown for each sector reflect the value of investments in that sector as a percentage of net assets. Figures in the above graph may not total to 100% due to the exclusion of the Fund’s other assets and liabilities. |
18
Table of Contents
SC GOLDMAN SACHS MID CAP VALUE FUND (Continued)
TOP TEN EQUITY HOLDINGS AT DECEMBER 31, 2010
| % of Net Assets | Industry | |||||
| Valero Energy Corp. |
3.9 | % | Oil, Gas & Consumable Fuels | |||
| Lorillard, Inc. |
3.1 | Tobacco | ||||
| AvalonBay Communities, Inc. |
1.8 | Real Estate Investment Trusts | ||||
| Rayonier, Inc. |
1.8 | Real Estate Investment Trusts | ||||
| DISH Network Corp., Class A |
1.5 | Media | ||||
| Tesoro Corp. |
1.5 | Oil, Gas & Consumable Fuels | ||||
| Cimarex Energy Co. |
1.5 | Oil, Gas & Consumable Fuels | ||||
| Integrys Energy Group, Inc. |
1.4 | Multi-Utilities | ||||
| Unum Group |
1.4 | Insurance | ||||
| Suntrust Banks, Inc. |
1.4 | Commercial Banks | ||||
Comparison of Change in Value of a $10,000 Investment in the SC Goldman Sachs Mid Cap Value Fund – Initial Class and the Russell Midcap Value Index
Comparison of Change in Value of a $10,000 Investment in the SC Goldman Sachs Mid Cap Value Fund – Service Class and the Russell Midcap Value Index
19
Table of Contents
SC GOLDMAN SACHS MID CAP VALUE FUND (Continued)
Average Annual Total Returns for Periods Ended December 31, 2010**
| One Year | Life of Fund*** |
|||||||
| SC Goldman Sachs Mid Cap Value Fund-Initial Class Shares |
22.13 | % | 2.54 | % | ||||
| SC Goldman Sachs Mid Cap Value Fund-Service Class Shares |
21.62 | % | 2.23 | % | ||||
| Russell Midcap Value Index* |
24.75 | % | 4.38 | % | ||||
*The performance data of the index has been prepared from sources and data that the investment adviser believes to be reliable, but no representation is made as to their accuracy. The index is unmanaged and cannot be invested in directly. The Russell Midcap Value Index measures the performance of the mid-cap value segment of the U.S. equity universe. It includes those Russell Midcap Value Index companies with lower price-to-book ratios and lower forecasted growth values.
**Performance data is historical and includes changes in share price and reinvestment of income dividends and capital gains distributions. Past performance does not indicate future results. All Fund returns are net of fees and expenses, but do not include any insurance charges imposed in connection with your variable insurance contract. If this performance information included the effect of the insurance charges, performance numbers would be lower. The value of an investment in the SC Goldman Sachs Mid Cap Value Fund and the return on the investment will fluctuate and redemption proceeds may be higher or lower than an investor’s original cost.
***For the period from March 7, 2008 (commencement of operations) to December 31, 2010.
20
Table of Contents
SC COLUMBIA SMALL CAP VALUE FUND
(subadvised by Columbia Management Investment Advisers, LLC)
MANAGEMENT’S DISCUSSION & ANALYSIS:
How did the Fund perform during the year and eight month period ended December 31, 2010?
Effective May 1, 2010, Columbia Management Investment Advisers, LLC replaced Dreman Value Management LLC as subadviser to the SC Dreman Small Cap Value Fund and the name of the fund was changed to SC Columbia Small Cap Value Fund (the “Fund”).
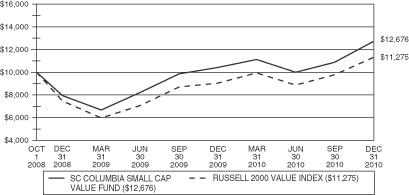
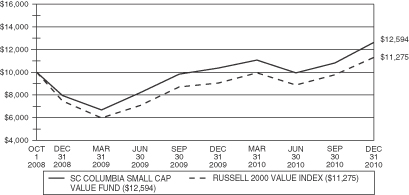
For the year ended December 31, 2010, the Fund’s Initial and Service Class shares returned 21.62% and 21.33%, respectively, underperforming the benchmark, the Russell 2000 Value Index (the “Index”), which returned 24.50% for the same period. For the period from May 1, 2010 to December 31, 2010, the Fund’s Initial and Service Class shares returned 9.46% and 9.29%, respectively, outperforming the Index which returned 5.77% for the same period.
What economic and market factors most influenced the equity markets as a whole during the period ended December 31, 2010?
May 2010 began a brief period of considerable uncertainty. Europe went through a crisis period and stocks retreated globally as contagion fears, or the fear that the sovereign debt crisis would lead to a slowdown of global economic growth, were foremost on investors’ minds. In the U.S., economic data signaled a retrenchment from the pace of growth observed towards the end of 2009 as markets began to worry that there might be a second economic slowdown, or a “double-dip” in economic growth. For most of the second and third quarters, markets either believed that global growth prospects were good and European risks were contained or they believed that growth prospects were deteriorating and risk was increasing. This “risk on-risk off” trading characterized much of 2010. The Federal Reserve (Fed) Chairman Ben Bernanke, in an August speech, announced that the Fed was considering round two of quantitative easing through purchases of U.S. Treasury Bonds. Markets responded positively to this announcement. Yields on U.S. Treasuries remained at historically low levels with continued buying by the Federal Reserve Bank and the 10 year yields fell from 3.8% at the beginning of the year to 3.3% by year end. Fiscal policy also received a boost for 2011, as tax cuts of previous years were extended for another two years. Meanwhile, companies continued to report strong earnings and economic data towards the end of the year which came in slightly better than expected.
The year ended on a stronger note with most economic data pointing to modest but sustainable growth, countering the expectations seen during the summer of growing probabilities of a double dip recession. Personal income measures have strengthened, as the labor market improved and government incentives are still active. This has resulted in better support for consumer spending which accounts for the majority of U.S. Gross Domestic Product (GDP), although consumers continue to delever both through defaults and write-offs. Retail sales have been surprisingly brisk, even on discretionary items and auto sales have increased. It is still expected that consumer deleveraging will be a continuing theme, presenting some resistance to growth. Leading indicators have stabilized and are still pointing to slow but stable growth in the period ahead. Labor market measures have indeed stabilized and are slowly improving, mainly because job cuts are behind us and hiring decisions have edged higher. However, the improvement is still not enough to move the unemployment rate significantly lower. Manufacturing and industrial production seem to have settled down a bit from the brisk pace seen earlier in the year but growth remains at very healthy levels.
Inflation measures have not stabilized as of yet with pervasive weakness still in the pipeline. However, this will keep the Fed in play and policy rates low. Quantitative easing has not had the desired effect on interest rates, with long term rates moving 50 basis points higher in December as the purchases of U.S. Treasury Bonds was re-started. This rise has the potential to short-circuit the recovery if allowed to continue and is counter to the Fed’s objectives.
21
Table of Contents
SC COLUMBIA SMALL CAP VALUE FUND (Continued)
Were there any significant sector under/over weights that materially affected Fund performance relative to the benchmark during the period ended December 31, 2010?
During the period from May 1, 2010 to December 31, 2010, the Fund’s strategic underweight positions in the Consumer Discretionary, Financial, and Utility sectors added to relative performance. Within the Consumer Discretionary sector, the avoidance of media stocks added significant positive returns as the media industry posted negative absolute returns overall. Utility stocks trailed in the 4th quarter as the market appreciated from previous lows, adding to relative performance. The Fund’s underweight position in Banks contributed to performance as continued credit pressure and revenue compression lead banks to underperform the Index. The Fund’s strategic overweight in the Industrial, Material and Technology sectors also contributed to relative performance as they all benefit from continued global growth trends. The Fund maintains its current exposure relative to the Index within these sectors. Sector selection contributed more than 35% of the alpha (excess return over the Index) generated during the period. There were no sectors that detracted from relative performance during the period.
Which stocks contributed most to the Fund’s returns during the period ended December 31, 2010?
During the period from May 1, 2010 to December 31, 2010, one of the main contributors to the Fund’s performance was Teletech Holdings, Inc. which is a well-managed, financially-strong provider of business process outsourcing services. The company is gaining share through addition of new capabilities and new customers. While the company remained solidly profitable, results were affected by the recession and the stock declined significantly. The Fund purchased the stock at a very attractive valuation as their business was bottoming. As the company`s outlook stabilized and improved, the stock has rebounded significantly yet remains reasonably valued.
Other strong contributors to the Fund’s performance include OM Group, Inc., a company that was a detractor during the period from May 1, 2010 to June 30, 2010 as the global economic slowdown took its toll on all mineral companies. The Fund accumulated additional shares during this period of weakness, and was rewarded with a significant positive return in the second half of 2010 as double dip fears subsided. Four other companies, Ladish Co., Inc., ADC Telecommunications, Inc., CNA Surety Corp. and Syniverse Holdings, Inc., all posted strong contributions to total returns as they were targeted for acquisition by different suitors. Given the strong movement by Ladish Co., Inc., ADC Telecommunications, Inc., and Syniverse Holdings, Inc., the Fund exited these positions by the end of the period, yet captured significant returns for the shareholders.
Which stocks detracted from the Fund’s performance results during the period ended December 31, 2010?
Bank Mutual Corp. and Home Federal Bancorp, Inc. both companies which are thrifts (financial institutions focused on taking in deposits and home mortgage originations) detracted from the Fund’s overall performance. Credit problems stemming from the U.S. economy have affected most every bank and thrift, these companies included. The low level of absolute interest rates also negatively affected their fundamental performance as excess liquidity could not be reinvested at satisfactory levels to sustain earnings. Overall both companies have been improving their mix of deposits and Home Federal Bancorp, Inc. has been able to acquire two failed banks from the Federal Deposit Insurance Corporation seizures. These actions actually improve the overall intrinsic value of the companies and we maintain our conviction in the future for these companies.
Did the Fund experience major changes to its top ten holdings during the period ended December 31, 2010?
All of the Fund’s top ten holdings changed as a result of the subadviser change that occurred on May 1, 2010.
22
Table of Contents
SC COLUMBIA SMALL CAP VALUE FUND (Continued)
How was the Fund positioned relative to its benchmark index at December 31, 2010?
At the end of the period, the Fund maintained an overweight position in Technology, Industrials and the Commodity sectors (both Energy and Materials). Headwinds due to low interest rates in the Financials and Utilities sectors as well as an over-levered consumer, both in Consumer Discretionary and Consumer Staples, have driven the Fund to maintain underweight positions in these sectors. The Fund continues to have a positive exposure to the Health Care sector, as we have conviction and continue to find selected health care stocks attractive, both on a valuation and a fundamental basis.
SECTOR ALLOCATIONS AT DECEMBER 31, 2010*
Percentage of Net Assets

| * | The above graph categorizes investments using GICS. The percentages shown for each sector reflect the value of investments in that sector as a percentage of net assets. Figures in the above graph may not total to 100% due to the exclusion of the Fund’s other assets and liabilities. |
23
Table of Contents
SC COLUMBIA SMALL CAP VALUE FUND (Continued)
TOP TEN EQUITY HOLDINGS AT DECEMBER 31, 2010
| % of Net Assets | Industry | |||||
| OM Group, Inc. |
1.1 | % | Chemicals | |||
| Global Indemnity PLC |
1.0 | Insurance | ||||
| Greif, Inc., Class B |
0.9 | Containers & Packaging | ||||
| Rental-A-Center, Inc. |
0.8 | Specialty Retail | ||||
| Healthspring, Inc. |
0.7 | Health Care Providers & Services | ||||
| Thompson Creek Metals Co., Inc. |
0.7 | Metals & Mining | ||||
| Fresh Del Monte Produce, Inc. |
0.7 | Food Products | ||||
| Knight Capital Group, Inc. |
0.7 | Capital Markets | ||||
| First Citizens BancShares, Inc. |
0.7 | Commercial Banks | ||||
| DiamondRock Hospitality Co. |
0.7 | Real Estate Investment Trusts | ||||
Comparison of Change in Value of a $10,000 Investment in the SC Columbia Small Cap Value Fund – Initial Class and the Russell 2000 Value Index
Comparison of Change in Value of a $10,000 Investment in the SC Columbia Small Cap Value Fund – Service Class and the Russell 2000 Value Index
24
Table of Contents
SC COLUMBIA SMALL CAP VALUE FUND (Continued)
Average Annual Total Returns for Periods Ended December 31, 2010**
| One Year | Life of Fund*** |
|||||||
| SC Columbia Small Cap Value Fund-Initial Class Shares |
21.62 | % | 11.10 | % | ||||
| SC Columbia Small Cap Value Fund-Service Class Shares |
21.33 | % | 10.78 | % | ||||
| Russell 2000 Value Index* |
24.50 | % | 5.48 | % | ||||
*The performance data of the index has been prepared from sources and data that the investment adviser believes to be reliable, but no representation is made as to their accuracy. The index is unmanaged and cannot be invested in directly. The Russell 2000 Value Index tracks the performance of the small value segment of the U.S. equity universe. It includes those Russell 2000 companies with lower price-to-book ratios and lower forecasted growth values.
**Performance data is historical and includes changes in share price and reinvestment of income dividends and capital gains distributions. Past performance does not indicate future results. All Fund returns are net of fees and expenses, but do not include any insurance charges imposed in connection with your variable insurance contract. If this performance information included the effect of the insurance charges and the fees and expenses assumed by the investment adviser, performance numbers would be lower. The value of an investment in the SC Columbia Small Cap Value Fund and the return on the investment will fluctuate and redemption proceeds may be higher or lower than an investor’s original cost.
***For the period from October 1, 2008 (commencement of operations) to December 31, 2010.
25
Table of Contents
(subadvised by Davis Selected Advisers, L.P.)
MANAGEMENT’S DISCUSSION & ANALYSIS:
How did the Fund perform during the year ended December 31, 2010?
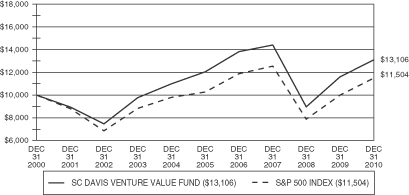
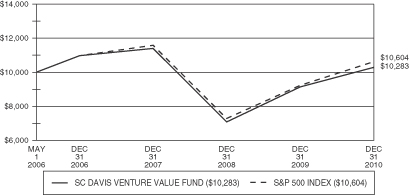
For the year ended December 31, 2010, the Initial and Service Class shares of SC Davis Venture Value Fund (the “Fund”) returned 12.92% and 12.68%, respectively, underperforming the benchmark, the S&P 500 Index (the “Index”), which returned 15.06% for the same period.
What economic and market factors most influenced the equity markets as a whole during the period ended December 31, 2010?
During 2010, the employment trend has been mildly positive but still below what is required to keep pace with the growing population and also absorb the current unemployed workers.
All sectors within the Index registered increases over the year. Consumer Discretionary, Industrials, and Materials were the sectors within the Index that increased the most. Health Care and Utilities were the sectors within the Index that increased the least.
Were there any significant sector under/over weights that materially affected Fund performance relative to the benchmark during the period ended December 31, 2010?
The Fund benefited when compared to the Index from its underweight position in the weakly performing Information Technology sector. Conversely, the Fund’s relative performance was hurt by its underweight positions in the Industrials and Consumer Discretionary sectors, the two best performing sectors of the Index for the year.
Which stocks contributed most to the Fund’s returns during the year ended December 31, 2010?
The Fund benefited the most from its allocation to a Consumer Staples company Costco Wholesale Corp., Financial companies Berkshire Hathaway, Inc. and Wells Fargo & Co., and Energy companies Occidental Petroleum Corp. and Canadian Natural Resources, Ltd.
Which stocks detracted from the Fund’s performance results during the year ended December 31, 2010?
The companies which detracted the most from the Fund’s performance were two information technology companies Hewlett-Packard Co. and Microsoft Corp., and three energy companies, EOG Resources, Inc., Transocean, Ltd. and China Coal Energy Co., Ltd.
Did the Fund experience major changes to its top ten holdings during the period ended December 31, 2010?
There were no material changes to the December 31, 2010 top ten holdings list relative to the December 31, 2009 top ten holdings list. This is consistent with the Fund’s low-turnover strategy. The Fund continues to own companies that dropped out of the top ten holdings but in reduced positions. The new additions to the Fund’s top ten holdings were among the Fund’s top twenty holdings at the end of 2009.
How was the Fund positioned relative to its benchmark index at December 31, 2010?
The Fund’s portfolio is positioned using a bottom-up stock selection process rather than a top down sector biased process. As a result, all weighting differentials relative to the Index reflect stock selection rather than sector bets.
26
Table of Contents
SC DAVIS VENTURE VALUE FUND (Continued)
The portfolio manager’s investment strategy is to perform extensive research to buy durable companies at a discount to their intrinsic values and to hold them for the long term.
As of December 31, 2010, the Fund continued to remain overweight as compared to the Index in the Financials, Consumer Staples and Energy sectors and underweight in the Industrials, Consumer Discretionary, Information Technology, and Utilities sectors.
SECTOR ALLOCATIONS AT DECEMBER 31, 2010*
Percentage of Net Assets

| * | The above graph categorizes investments using GICS. The percentages shown for each sector reflect the value of investments in that sector as a percentage of net assets. Figures in the above graph may not total to 100% due to the exclusion of the Fund’s other assets and liabilities. |
TOP TEN EQUITY HOLDINGS AT DECEMBER 31, 2010
| % of Net Assets | Industry | |||||
| Costco Wholesale Corp. |
5.0 | % | Food & Staples Retailing | |||
| Wells Fargo & Co. |
4.6 | Commercial Banks | ||||
| American Express Co. |
4.4 | Consumer Finance | ||||
| CVS Caremark Corp. |
3.8 | Food & Staples Retailing | ||||
| EOG Resources, Inc. |
3.4 | Oil, Gas & Consumable Fuels | ||||
| Occidental Petroleum Corp. |
3.3 | Oil, Gas & Consumable Fuels | ||||
| Merck & Co., Inc. |
3.1 | Pharmaceuticals | ||||
| Loews Corp. |
3.0 | Insurance | ||||
| Canadian Natural Resources, Ltd. |
2.9 | Oil, Gas & Consumable Fuels | ||||
| Devon Energy Corp. |
2.9 | Oil, Gas & Consumable Fuels | ||||
27
Table of Contents
SC DAVIS VENTURE VALUE FUND (Continued)
Comparison of Change in Value of a $10,000 Investment in the SC Davis Venture Value Fund – Initial Class and the S&P 500 Index
Comparison of Change in Value of a $10,000 Investment in the SC Davis Venture Value Fund – Service Class and the S&P 500 Index
28
Table of Contents
SC DAVIS VENTURE VALUE FUND (Continued)
Average Annual Total Returns for Periods Ended December 31, 2010**
| Initial Class Shares |
One Year | Three Years | Five Years | Ten Years | Life of Fund*** |
|||||||||||||||
| SC Davis Venture Value Fund |
12.92 | % | (3.14 | )% | 1.68 | % | 2.74 | % | 2.48 | % | ||||||||||
| S&P 500 Index* |
15.06 | % | (2.86 | )% | 2.29 | % | 1.41 | % | 0.11 | % | ||||||||||
| Service Class Shares |
||||||||||||||||||||
| SC Davis Venture Value Fund |
12.68 | % | (3.36 | )% | — | — | 0.60 | % | ||||||||||||
| S&P 500 Index* |
15.06 | % | (2.86 | )% | — | — | 1.27 | % | ||||||||||||
*The performance data of the index has been prepared from sources and data that the investment adviser believes to be reliable, but no representation is made as to their accuracy. The index is unmanaged and cannot be invested in directly. The S&P 500 Index is a market-value weighted index of 500 blue chip stocks and is considered to be a benchmark of the overall stock market.
**Performance data is historical and includes changes in share price and reinvestment of income dividends and capital gains distributions. Past performance does not indicate future results. All Fund returns are net of fees and expenses, but do not include any insurance charges imposed in connection with your variable insurance contract. If this performance information included the effect of the insurance charges and the fees and expenses assumed by the investment adviser, performance numbers would be lower. The value of an investment in the SC Davis Venture Value Fund and the return on the investment will fluctuate and redemption proceeds may be higher or lower than an investor’s original cost.
*** Initial Class Shares for the period from July 17, 2000 (commencement of operations) to December 31, 2010. Service Class Shares for the period from May 1, 2006 (commencement of operations) to December 31, 2010.
29
Table of Contents
SC INVESCO SMALL CAP GROWTH FUND
(subadvised by Invesco Advisers, Inc.)
MANAGEMENT’S DISCUSSION & ANALYSIS:
How did the Fund perform during the year ended December 31, 2010?
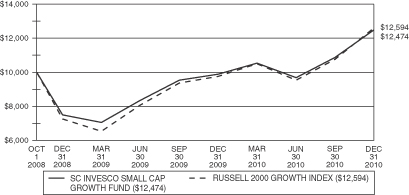
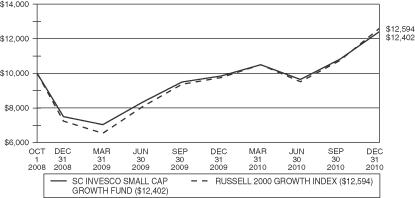
For the year ended December 31, 2010, the Initial and Service Class shares of SC Invesco Small Cap Growth Fund (the “Fund”) returned 26.08% and 25.86%, respectively, underperforming its benchmark, the Russell 2000 Growth Index (the “Index”), which returned 29.09% for the same period.
What economic and market factors most influenced the equity markets as a whole during the year ended December 31, 2010?
The U.S. economy exhibited signs of improvement during the year, potentially indicating that the economy has transitioned from a contraction phase into an expansionary phase. Nevertheless, the pace of economic recovery remained modest and the transition from government stimulus-induced growth to the private sector driven economic recovery was uncertain.
The U.S. Federal Reserve’s federal funds target rate remained low, ranging from 0.00% to 0.25%. Real Gross Domestic Product (GDP) registered positive growth during the reporting period with quarterly increases of 3.7%, 1.7% and 2.6% for the first, second and third quarters of 2010, respectively. Inflation, measured by the seasonally-adjusted Consumer Price Index, remained relatively unchanged. While labor markets improved as layoffs moderated, new hiring remained fairly weak. Unemployment, after climbing steadily throughout 2009, declined slightly during 2010 to a rate of 9.4% at the end of 2010.
Were there any significant sector under/over weights that materially affected Fund performance relative to the benchmark during the year ended December 31, 2010?
There were no significant sector under/over weights that materially affected Fund performance relative to the Index during the year ended December 31, 2010. Security selection was the primary driver of performance during the year. The most notable changes to the Fund’s positioning consisted of reductions in the Health Care and Financials sectors where a number of holdings were sold. Proceeds from the sale of these holdings were used to purchase positions in more economically sensitive sectors such as the Consumer Discretionary, Materials and Energy sectors. Additionally, within the Information Technology sector, the Fund added exposure to more economically sensitive holdings in the Semiconductor and Hardware industry groups, and sold several Software holdings late in the year.
Which stocks contributed most to the Fund’s returns during the year ended December 31, 2010?
The Fund’s top five contributors to absolute performance were F5 Networks, Inc., Informatica Corp., TRW Automotive Holdings Corp., Netflix, Inc., and TransDigm Group, Inc.
Two of the leading contributors to the Fund’s performance during the year were information technology holdings: Network Services provider F5 Networks, Inc. and Enterprise Data Integration Software maker Informatica Corp. Both companies continued to benefit from strong demand for their technology products during the year, which resulted in revenue and earnings growth. The Fund also benefited from strong performance from Consumer Discretionary holdings, including automotive component supplier TRW Automotive Holdings Corp. and movie and television subscription service provider Netflix, Inc. Both companies benefited from the improving consumer spending environment, which resulted in strong growth in revenues and earnings during the year. While the Fund continues to own TRW Automotive Holdings, it sold Netflix, Inc. due to concerns about high valuation levels. Lastly, TransDigm Group, Inc. was a key contributor to performance during the year. This company benefited from solid demand for the aircraft components it manufactures for commercial and military customers.
30
Table of Contents
SC INVESCO SMALL CAP GROWTH FUND (Continued)
Which stocks detracted from the Fund’s performance results during the year ended December 31, 2010?
The Fund’s top five detractors from absolute performance were Arena Resources, Inc., Rehabcare Group, Inc., EnergySolutions Inc., AMAG Pharmaceuticals, Inc. and DreamWorks Animation SKG, Inc.
The leading detractor to the Fund’s performance during the year was Exploration and Production firm Arena Resources, Inc. which had had weak performance given the company’s higher exposure to natural gas. The Fund sold the position in Arena Resources, Inc. due to deteriorating fundamentals. Another key detractor from the Fund’s performance was Environmental Services provider EnergySolutions, Inc., which had weak performance as investors reacted negatively to the resignation of the company’s CEO. The Fund subsequently sold its position in this company. Several holdings in the Health Care sector also detracted from the Fund’s performance, including rehabilitation services provider Rehabcare Group, Inc. and biopharmaceutical holding AMAG Pharmaceuticals, Inc. The Fund sold both positions due to deteriorating fundamentals. Lastly, entertainment firm DreamWorks Animation SKG, Inc. detracted from the Fund’s performance as the latest movie release, Megamind, underperformed relative to investor expectations. The Fund continues to own DreamWorks because we believe the company will continue to produce blockbuster movies and should also benefit from other new lines of business.
Did the Fund experience major changes to its top ten holdings during the year ended December 31, 2010?
There were four holdings on the top ten holdings list as of December 31, 2009 that remained among the Fund’s top ten holdings as of December 31, 2010: Informatica Corp., TransDigm Group, Inc., SBA Communications Corp. and Polycom, Inc.
Several holdings that were top ten holdings as of December 31, 2009 remain as holdings by the Fund at December 31, 2010, but fell out of the top ten holdings due to market fluctuation and/or a reduction in position size. The securities still held by the Fund but in reduced positions were Quality Systems, Inc., Knight Transportation, Inc., Costar Group, Inc. and Greif, Inc., Class A. Dril Quip, Inc., and Sybase Inc. were two holdings that were top ten holdings as of December 31, 2009 which were sold during 2010.
Several top ten holdings as of December 31, 2010 were held by the Fund as of December 31, 2009 but were not in the top ten holdings. However, during the course of 2010, their position size expanded due to market fluctuation and/or additions to the position size such that they are in the top ten holdings as of December 31, 2010. Ciena Corp. was the one position in the top ten holdings as of December 31, 2010 that was added during the year.
How was the Fund positioned relative to its benchmark index at December 31, 2010?
Sector weights are always a result of the Fund’s bottom up stock selection process. As of December 31, 2010, the Fund had higher exposure to more economically sensitive holdings. The largest overweight industry groups were Energy, Semiconductors/ Semiconductor Equipment, Banks, and Consumer Services. The Fund had lower exposure to more defensive holdings in the Health Care and Consumer Staples sector. Within Health Care, the Fund was underweight the Pharmaceuticals/ Biotechnology/ Life Sciences and the Health Care Equipment & Services industry groups. Within Consumer Staples, the Fund was underweight Food & Staples Retailing and the Food/ Beverage/ Tobacco industry groups. Other underweight positions included Consumer Durables & Apparel, Real Estate, and Commercial & Professional Services.
31
Table of Contents
SC INVESCO SMALL CAP GROWTH FUND (Continued)
SECTOR ALLOCATIONS AT DECEMBER 31, 2010*
Percentage of Net Assets

| * | The above graph categorizes investments using GICS. The percentages shown for each sector reflect the value of investments in that sector as a percentage of net assets. Figures in the above graph may not total to 100% due to the exclusion of the Fund’s other assets and liabilities. |
TOP TEN EQUITY HOLDINGS AT DECEMBER 31, 2010
| % of Net Assets | Industry | |||||
| TransDigm Group, Inc. |
1.7 | % | Aerospace & Defense | |||
| TRW Automotive Holdings Corp. |
1.5 | Auto Components | ||||
| Informatica Corp. |
1.5 | Software | ||||
| Polycom, Inc. |
1.4 | Communications Equipment | ||||
| Ciena Corp. |
1.2 | Communications Equipment | ||||
| SBA Communications Corp. |
1.1 | Wireless Telecommunication Services | ||||
| Regal-Beloit Corp. |
1.1 | Electrical Equipment | ||||
| Affiliated Managers Group, Inc. |
1.0 | Capital Markets | ||||
| Williams-Sonoma, Inc. |
1.0 | Specialty Retail | ||||
| P.F. Chang’s China Bistro, Inc. |
1.0 | Hotels, Restaurants & Leisure | ||||
32
Table of Contents
SC INVESCO SMALL CAP GROWTH FUND (Continued)
Comparison of Change in Value of a $10,000 Investment in the SC Invesco Small Cap Growth Fund – Initial Class and the Russell 2000 Growth Index
Comparison of Change in Value of a $10,000 Investment in the SC Invesco Small Cap Growth Fund – Service Class and the Russell 2000 Growth Index
33
Table of Contents
SC INVESCO SMALL CAP GROWTH FUND (Continued)
Average Annual Total Returns for Periods Ended December 31, 2010**
| One Year | Life of Fund*** |
|||||||
| SC Invesco Small Cap Growth Fund-Initial Class Shares |
26.08 | % | 10.32 | % | ||||
| SC Invesco Small Cap Growth Fund-Service Class Shares |
25.86 | % | 10.03 | % | ||||
| Russell 2000 Growth Index* |
29.09 | % | 10.80 | % | ||||
*The performance data of the index has been prepared from sources and data that the investment adviser believes to be reliable, but no representation is made as to their accuracy. The index is unmanaged and cannot be invested in directly. The Russell 2000 Growth Index measures the performance of those Russell 2000 companies with higher price-to-book ratios and higher forecasted growth values.
**Performance data is historical and includes changes in share price and reinvestment of income dividends and capital gains distributions. Past performance does not indicate future results. All Fund returns are net of fees and expenses, but do not include any insurance charges imposed in connection with your variable insurance contract. If this performance information included the effect of the insurance charges and the fees and expenses assumed by the investment adviser, performance numbers would be lower. The value of an investment in the SC Invesco Small Cap Growth Fund and the return on the investment will fluctuate and redemption proceeds may be higher or lower than an investor’s original cost.
***For the period from October 1, 2008 (commencement of operations) to December 31, 2010.
34
Table of Contents
SC LORD ABBETT GROWTH & INCOME FUND
(subadvised by Lord, Abbett & Co. LLC)
MANAGEMENT’S DISCUSSION & ANALYSIS:
How did the Fund perform during the year ended December 31, 2010?
For the year ended December 31, 2010, the Initial and Service Class shares of SC Lord Abbett Growth & Income Fund (the “Fund”) returned 17.19% and 16.94%, respectively, outperforming the benchmark, the Russell 1000 Value Index (the “Index”), which returned 15.51% for the same period.
What economic and market factors most influenced the equity markets as a whole during the year ended December 31, 2010?
Equity markets fluctuated throughout much of the year, before trending upwards in the final months as the economic recovery strengthened and the sovereign debt crisis in Europe was addressed. Government support also contributed to the positive performance.
Uncertainty about the economic recovery persisted for much of the year. The housing market showed further weakness, despite low mortgage rates and a government tax incentive program. This contributed to fears that the economy would experience an additional economic slowdown and slip back into recession. Unemployment also remained high throughout the year. Nevertheless, the U.S. economy continued to expand. Real Gross Domestic Product rose 3.7% in the first quarter, 1.7% in the second, and 2.6% in the third. The manufacturing sector continued to advance, as indicated by the index published by the Institute for Supply Management. The consumer segment of the economy strengthened, with retail sales improving even as consumers continued to save at a higher than normal rate. Government actions in the form of both monetary and fiscal policy contributed heavily to the market’s performance toward the end of the year. A decision by the Federal Reserve to initiate a second round of quantitative easing (U.S. Treasury Bond purchases) helped to boost markets, and an extension of tax cuts implemented in 2003, combined with a temporary reduction in payroll taxes supported returns in December. Exposure to rapidly growing emerging markets also assisted U.S. stocks.
Gains in the stock market occurred across all major sectors of the Index, but Consumer Discretionary, Industrials, Energy, Materials, and Telecommunications outperformed the broader market. Consumer Staples, Financials, Technology, Health Care, and Utilities lagged behind. Growth stocks outperformed value stocks during the year, and small caps outperformed large caps.
Were there any significant sector under/over weights that materially affected Fund performance relative to the benchmark during the year ended December 31, 2010?
The Fund’s overweight position within the Materials sector was a large contributor to relative performance for the year. Overweight positions within the Metals & Mining and Chemicals sectors contributed positively as a result of the strong returns within these areas. The overweight positions within the Energy and Consumer Discretionary sectors and the underweight position within the Utilities sector also contributed to the Fund’s relative performance for the period.
The largest decrease in active weight occurred within the Financials sector where the sector moved from an overweight to an underweight position. Within Capital Markets we trimmed select positions, closed one position and initiated another. Within Commercial Banks we terminated a position and trimmed several select others. Profits were taken in a few key positions within Diversified Financial Services.
An underweight position within the Health Care sector detracted from the Fund’s relative performance.
Which stocks contributed most to the Fund’s returns during the year ended December 31, 2010?
Favorable stock selection within the Materials sector contributed positively to the Fund’s relative performance. Cliffs Natural Resources, Inc. outperformed as it delivered strong earnings throughout the year. The producer of
35
Table of Contents
SC LORD ABBETT GROWTH & INCOME FUND (Continued)
iron ore pellets and supplier of metallurgical coal benefited from rising iron ore prices which have been driven by strong demand in Asia. The company also made an accretive acquisition of a producer/exporter of coal. Elsewhere within the sector, investors benefited from strong returns from Freeport-McMoRan Copper & Gold, Inc. resulting from a strong second quarter earnings report. The mining company’s results outpaced consensus expectations. While the results were aided by rising gold and copper prices, it was better-than-expected volume for gold and copper that drove the outperformance.
Stock selection within the Consumer Discretionary sector was also a significant contributor to the Fund’s relative performance. Ford Motor Co. was one of the strongest performers for the year as the auto maker continued to effectively execute its strategy, posting its fifth consecutive quarter of profitability in the North American segment, exceeding consensus earnings estimates and posting stronger-than-expected pre-tax profits in its Financial Services operations.
Which stocks detracted from the Fund’s performance results during the year ended December 31, 2010?
Within the Health Care sector, unfavorable stock selection detracted from the Fund’s relative performance for the year. Shares of biotechnology firm Gilead Sciences, Inc. tumbled following the release of its first quarter earnings. The company surpassed analysts’ expectations for earnings and revenue, but lowered full-year guidance based upon weaker expectations for its franchise HIV business, negatively affecting fund performance during its holding period in the Fund. Also within the Health Care sector the share price of medical device manufacturer Boston Scientific Corp. declined throughout the year. While the company reported fourth quarter 2009 results that were in line with analysts’ expectations, earnings guidance provided by management for 2010 was less than analysts’ expectations. In addition, the company had to suspend shipments of its implantable cardioverter-defibrillator after the company failed to notify regulators of changes in how the company manufactures the devices. The Fund sold both Gilead Sciences, Inc. and Boston Scientific Corp. during the year.
Stock selection within the Financials sector also detracted from the Fund’s relative performance for the year. Shares of brokerage firm The Charles Schwab Corp. underperformed during the year, as continued low short-term interest rates made it necessary for the firm to subsidize its sizable money market fund businesses. Some of this unfavorable stock selection was offset by solid performance from regional banks Zions Bancorporation., SunTrust Banks, Inc. and Keycorp, all of which outperformed the overall Financials sector in the Index and the Index as a whole.
Did the Fund experience major changes to its top ten holdings during the year ended December 31, 2010?
There were no material changes to the December 31, 2010 top ten holdings list relative to the December 31, 2009 top ten holdings list.
How was the Fund positioned relative to its benchmark index at December 31, 2010?
The Fund continues to be positioned for a cyclical recovery in the economy, but exposure to the most cyclical parts of the market is down considerably from a year ago. The Fund continues to seek out solid companies with attractive reward-to-risk ratios, while continually monitoring existing positions in the Fund.
The Materials sector remains the largest overweight in the Fund with a continued emphasis in the Metals & Mining, Paper & Forest Products and Chemicals sectors. During the year, we added to a position in a Paper & Packaging company as well as in two gold mining companies.
The Consumer Discretionary sector is the Fund’s second largest overweight relative to the Index, and is concentrated generally within Hotels, Restaurants & Leisure, Automobiles, Internet & Catalog Retail and the Multi-line Retail areas. In this sector we initiated positions in an automobile manufacturer and a media company; we also closed positions in a household durables firm and in a specialty retailer while trimming a position in another multi-line retailer.
36
Table of Contents
SC LORD ABBETT GROWTH & INCOME FUND (Continued)
The positively performing Energy sector is the third largest overweight position for the Fund, with both the Energy Equipment & Services and the Oil, Gas, & Consumable Fuels industries positioned as moderately overweight. We increased our exposure to the Oil, Gas & Consumable Fuels industry by initiating positions in two Exploration & Production companies, adding to two Integrated Oil firms and terminating a position in another Integrated Oil company.
The Utilities sector is the largest underweight sector in the Fund due to a shortage of opportunities here. The Consumer Staples sector remains a large underweight although we increased our exposure here modestly by initiating a position in a food products company.
SECTOR ALLOCATIONS AT DECEMBER 31, 2010*
Percentage of Net Assets
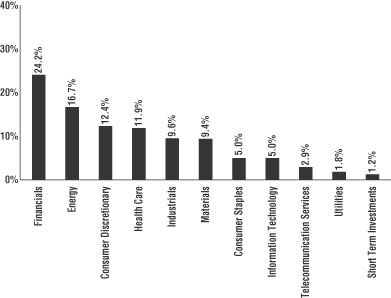
| * | The above graph categorizes investments using GICS. The percentages shown for each sector reflect the value of investments in that sector as a percentage of net assets. Figures in the above graph may not total to 100% due to the exclusion of the Fund’s other assets and liabilities. |
37
Table of Contents
SC LORD ABBETT GROWTH & INCOME FUND (Continued)
TOP TEN EQUITY HOLDINGS AT DECEMBER 31, 2010
| % of Net Assets | Industry | |||||
| Wells Fargo & Co. |
4.1 | % | Commercial Banks | |||
| Chevron Corp. |
3.6 | Oil, Gas & Consumable Fuels | ||||
| JP Morgan Chase & Co. |
3.3 | Diversified Financial Services | ||||
| Exxon Mobil Corp. |
2.9 | Oil, Gas & Consumable Fuels | ||||
| The Goldman Sachs Group, Inc. |
2.7 | Capital Markets | ||||
| Schlumberger, Ltd. |
2.4 | Energy Equipment & Services | ||||
| UnitedHealth Group, Inc. |
2.2 | Health Care Providers & Services | ||||
| Anadarko Petroleum Corp. |
2.2 | Oil, Gas & Consumable Fuels | ||||
| State Street Corp. |
2.1 | Capital Markets | ||||
| Citigroup, Inc. |
2.1 | Diversified Financial Services | ||||
Comparison of Change in Value of a $10,000 Investment in the SC Lord Abbett Growth & Income Fund – Initial Class and the Russell 1000 Value Index
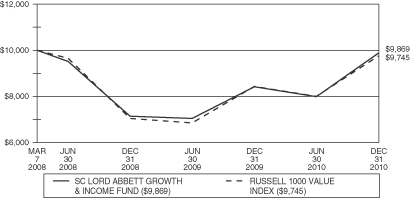
Comparison of Change in Value of a $10,000 Investment in the SC Lord Abbett Growth & Income Fund – Service Class and the Russell 1000 Value Index
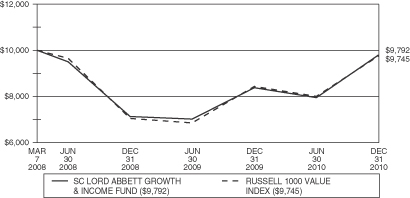
38
Table of Contents
SC LORD ABBETT GROWTH & INCOME FUND (Continued)
Average Annual Total Returns for Periods Ended December 31, 2010**
| One Year | Life of Fund*** |
|||||||
| SC Lord Abbett Growth & Income Fund-Initial Class Shares |
17.19 | % | (0.47 | )% | ||||
| SC Lord Abbett Growth & Income Fund-Service Class Shares |
16.94 | % | (0.74 | )% | ||||
| Russell 1000 Value Index* |
15.51 | % | (0.91 | )% | ||||
*The performance data of the index has been prepared from sources and data that the investment adviser believes to be reliable, but no representation is made as to their accuracy. The index is unmanaged and cannot be invested in directly. The Russell 1000 Index measures the performance of the 1,000 largest companies in the Russell 3000 Index, which measures the performance of the 3,000 largest U.S. companies based on total market capitalization. The Russell 1000 Value Index measures the performance of those Russell 1000 companies with lower price-to-book ratio and lower forecasted growth values.
**Performance data is historical and includes changes in share price and reinvestment of income dividends and capital gains distributions. Past performance does not indicate future results. All Fund returns are net of fees and expenses, but do not include any insurance charges imposed in connection with your variable insurance contract. If this performance information included the effect of the insurance charges and the fees and expenses assumed by the investment adviser, performance numbers would be lower. The value of an investment in the SC Lord Abbett Growth & Income Fund and the return on the investment will fluctuate and redemption proceeds may be higher or lower than an investor’s original cost.
***For the period from March 7, 2008 (commencement of operations) to December 31, 2010.
39
Table of Contents
(subadvised by Wellington Management Co., LLP)
MANAGEMENT’S DISCUSSION & ANALYSIS:
How did the Fund perform during the year ended December 31, 2010?
For the year ended December 31, 2010, the Initial and Service Class shares of SC WMC Blue Chip Mid Cap Fund (the “Fund”) returned 23.17% and 22.78%, respectively, underperforming the benchmark, the S&P Midcap 400 Index (the “Index”), which returned 26.64% for the same period.
What economic and market factors most influenced the equity markets as a whole during the year ended December 31, 2010?
Global equities had a tumultuous start to 2010. Through late April U.S. equities rose as investor confidence grew amid better-than-expected corporate earnings, accommodative monetary policy, and improving economic conditions. From late April through the end of August, risk aversion rose and equities fell on concerns that the global economy could slip back into recession. Investors worried about how expanding fiscal deficits across much of Europe, tightening credit conditions in China, and a disinflationary environment would affect the economic recovery and corporate earnings growth. In the third quarter, U.S. equities rebounded as investors shrugged off concerns about the pace of economic growth. Strong corporate earnings, a rebound in growth in China, and robust merger and acquisition activity boosted investors’ enthusiasm for stocks. U.S. equities continued their ascent in the fourth quarter driven by investors’ enthusiasm for additional government debt purchases by the U.S. Federal Reserve, the extension of tax cuts in the U.S., strong earnings growth, and generally improving economic data. Overall, improving optimism about the global economy and a surge of global liquidity were positive factors which outweighed investors’ concerns about the sovereign debt troubles in Europe.
Large cap stocks trailed mid and small cap stocks during the year, as measured by the S&P 500, S&P Midcap 400, and Russell 2000 indices, respectively. All ten sectors within the Index returned double digits during the year. Information Technology, Consumer Discretionary, and Industrials advanced the most, while the Telecommunication Services and Utilities sectors gained the least.
Were there any significant sector under/over weights that materially affected Fund performance relative to the benchmark during the year ended December 31, 2010?
Sector positioning, driven by bottom-up security selection, contributed positively to benchmark-relative returns during the year, primarily due to the Fund’s underweight positions in the Financials and Utilities sectors, and an overweight position in the Information Technology sector. An underweight to the Materials and an overweight to Telecommunication Services sectors detracted slightly.
Which stocks contributed most to the Fund’s returns during the year ended December 31, 2010?
Top contributors to the Fund’s relative performance included Huntington Bancshares, Inc., PACCAR, Inc., and NetApp, Inc. Shares of Ohio-based Diversified Banking and Financials Service company Huntington Bancshares, Inc. rose as investors grew more confident in the new management’s efforts to improve core operations, strengthen the balance sheet, and reduce risk. In April, the company also announced strong earnings along with a better-than-expected outlook for fiscal year 2010 earnings. Shares of PACCAR, Inc., a truck manufacturer, benefitted from signs of improving demand for commercial trucks. Shares of NetApp, Inc. a network data storage equipment and services company, rose after results topped expectations and management raised revenue guidance citing improving customer spending on computer upgrades and data-storage networks.
40
Table of Contents
SC WMC BLUE CHIP MID CAP FUND (Continued)
Which stocks detracted from the Fund’s performance results during the year ended December 31, 2010?
Top detractors from the Fund’s relative performance included Consumer Discretionary holdings DreamWorks Animation SKG, Inc., Class A, Staples, Inc. and Apollo Group, Inc. Computer-generated, animated feature film company DreamWorks Animation SKG, Inc. shares declined after the firm’s 3-D “Shrek” and “Megamind” films disappointed at the box office. Shares of Staples, Inc., an office supplier and retailer, disappointed as weak employment and small business environments pressured top line growth. Shares of for-profit educational services provider Apollo Group, Inc. fell due to regulatory concerns and fears that the firm’s shift away from Associate degree customers may weigh on earnings growth. Not owning F5 Networks, Inc. during the year hurt relative returns. Among the top detractors from absolute performance were also Consumer Discretionary holdings ITT Educational Services, Inc. and Strayer Education, Inc. and Health Care holdings Coventry Health Care, Inc. and Lincare Holdings Inc.
Did the Fund experience major changes to its top ten holdings during the year ended December 31, 2010?
It is expected that names in the Fund’s top ten holdings will move in and out of the top ten as a result of changes in the investment thesis and/or price performance. Additionally, in times of higher volatility it is not unusual to see a shift in the top ten. As a result, the composition of the Fund’s top ten holdings has changed since December 31, 2009. These are not considered material changes in our investment strategy, but rather a result of our of bottom-up investment approach.
Four of the top ten holdings from December 31, 2009 remained in the top ten holdings as of December 31, 2010 for the Fund. These holdings were Beckman Coulter, Inc., PACCAR, Inc., Watson Pharmaceuticals, Inc., and Southwest Airlines Co. The Fund still holds DreamWorks Animation SKG, Inc., Class A, Lam Research Corp., Unum Group, The Western Union Co., and Rockwell Collins, Inc. The Fund eliminated Massey Energy Co. from its holdings and initiated positions in M&T Bank Corp. and SEI Investments Co. during the year.
How was the Fund positioned relative to its benchmark index at December 31, 2010?
Sector exposure is predominantly a byproduct of stock selection. At the end of the period, the Fund’s largest overweight positions relative to the Index were to the Industrials, Health Care, and Information Technology sectors, while the largest underweight positions were to the Financials, Materials, and Consumer Staples sectors.
41
Table of Contents
SC WMC BLUE CHIP MID CAP FUND (Continued)
SECTOR ALLOCATIONS AT DECEMBER 31, 2010*
Percentage of Net Assets

| * | The above graph categorizes investments using GICS. The percentages shown for each sector reflect the value of investments in that sector as a percentage of net assets. Figures in the above graph may not total to 100% due to the exclusion of the Fund’s other assets and liabilities. |
TOP TEN EQUITY HOLDINGS AT DECEMBER 31, 2010
| % of Net Assets | Industry | |||||
| Watson Pharmaceuticals, Inc. |
1.8 | % | Pharmaceuticals | |||
| PACCAR, Inc. |
1.8 | Machinery | ||||
| Southwest Airlines Co. |
1.8 | Airlines | ||||
| M&T Bank Corp. |
1.6 | Commercial Banks | ||||
| Lennox International, Inc. |
1.6 | Building Products | ||||
| Beckman Coulter, Inc. |
1.6 | Health Care Equipment & Supplies | ||||
| SEI Investments Co. |
1.5 | Capital Markets | ||||
| Harley-Davidson, Inc. |
1.5 | Automobiles | ||||
| Discovery Communications, Inc., Class A |
1.5 | Media | ||||
| VeriSign, Inc. |
1.5 | Internet Software & Services | ||||
42
Table of Contents
SC WMC BLUE CHIP MID CAP FUND (Continued)
Comparison of Change in Value of a $10,000 Investment in the SC WMC Blue Chip Mid Cap Fund – Initial Class and the S&P Midcap 400 Index
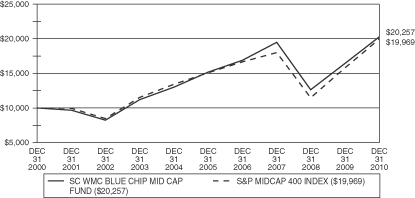
Comparison of Change in Value of a $10,000 Investment in the SC WMC Blue Chip Mid Cap Fund – Service Class and the S&P Midcap 400 Index
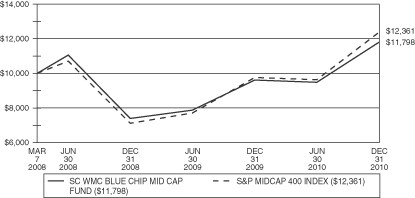
43
Table of Contents
SC WMC BLUE CHIP MID CAP FUND (Continued)
Average Annual Total Returns for Periods Ended December 31, 2010**
| Initial Class Shares |
One Year | Three Years | Five Years | Ten Years | Life of Fund*** |
|||||||||||||||
| SC WMC Blue Chip Mid Cap Fund |
23.17 | % | 1.29 | % | 5.94 | % | 7.31 | % | 10.86 | % | ||||||||||
| S&P Midcap 400 Index* |
26.64 | % | 3.52 | % | 5.74 | % | 7.16 | % | 9.00 | % | ||||||||||
| Service Class Shares |
||||||||||||||||||||
| SC WMC Blue Chip Mid Cap Fund |
22.78 | % | — | — | — | 6.04 | % | |||||||||||||
| S&P Midcap 400 Index* |
26.64 | % | — | — | — | 8.20 | % | |||||||||||||
*The performance data of the index has been prepared from sources and data that the investment adviser believes to be reliable, but no representation is made as to their accuracy. The index is unmanaged and cannot be invested in directly. The S&P Midcap 400 Index is a capitalization-weighted index that measures the mid-range sector of the U.S. stock market.
**Performance data is historical and includes changes in share price and reinvestment of income dividends and capital gains distributions. Past performance does not indicate future results. All Fund returns are net of fees and expenses, but do not include any insurance charges imposed in connection with your variable insurance contract. If this performance information included the effect of the insurance charges and the fees and expenses assumed by the investment adviser, performance numbers would be lower. The value of an investment in the SC WMC Blue Chip Mid Cap Fund and the return on the investment will fluctuate and redemption proceeds may be higher or lower than an investor’s original cost.
***Initial Class Shares for the period from September 1, 1999 (commencement of operations) to December 31, 2010. Service Class Shares for the period from March 7, 2008 (commencement of operations) to December 31, 2010.
44
Table of Contents
(subadvised by Wellington Management Co., LLP)
MANAGEMENT’S DISCUSSION & ANALYSIS:
How did the Fund perform during the year ended December 31, 2010?
For the year ended December 31, 2010, the Initial and Service Class shares of SC WMC Large Cap Growth Fund (the “Fund”) returned 19.50% and 19.19%, respectively, outperforming the benchmark, the Russell 1000 Growth Index (the “Index”), which returned 16.71% for the same period.
What economic and market factors most influenced the equity markets as a whole during the year ended December 31, 2010?
Equity markets experienced another year of volatile results. Despite the massive $850B Stimulus Bill during the first half of the year, the unemployment rate remained high at 9.7% for the first six months of the year. Record government deficits continued and a new healthcare entitlement bill was enacted, increasing taxes significantly for certain companies and individuals. The sustainable future growth of the global economy remained in question and the record government deficits continued to grow due to increased government spending despite increased taxes during the first half of the year. During the second half of the year, equity markets began to reflect the likelihood of a positive change in the direction of the U.S. economy in 2011 due to less onerous regulation and an improvement in the relationship between business and Congress. The market’s gains reflected the positive change from the election in early November. The election resulted in a significant change in the structure of Congress.
In this environment, nine of the ten sectors in the Index posted positive returns during the year. The Consumer Discretionary and Industrials sectors increased the most, while the Utilities sector was the only sector to post a decline for the year.
Were there any significant sector under/over weights that materially affected Fund performance relative to the benchmark during the year ended December 31, 2010?
Sector positioning, driven by bottom-up security selection, detracted slightly from benchmark-relative returns during the period, primarily due to an overweight position in the Information Technology and an underweight position in the Energy and Materials sectors. An underweight position in the Health Care sector and an overweight position in the relatively strong performing Industrials sector contributed positively to returns.
Which stocks contributed most to the Fund’s returns during the year ended December 31, 2010?
Top relative contributors included Las Vegas Sands Corp., Riverbed Technology, Inc. and Caterpillar, Inc. Shares of Las Vegas Sands Corp., a leading operator of casino properties in the U.S. and Asia rose as the company beat expectations on strong performance both in its new Singapore resort and in Macau. Shares of Riverbed Technology, Inc., a wide area network (WAN) applications and software company providing optimized telecommunication solutions from remote locations, benefited from low penetration in a rapidly growing market for high response low cost solutions. Shares of construction and mining equipment manufacturer Caterpillar, Inc. rose amid continued momentum in machinery sales driven by a robust recovery in construction activity. Consumer electronics company, Apple, Inc. and network data storage equipment and services company, NetApp, Inc. were among the top contributors to the Fund’s absolute performance.
Which stocks detracted from the Fund’s performance results during the year ended December 31, 2010?
Top detractors from the Fund’s relative performance included Cisco Systems, Inc., QLogic Corp., and ITT Educational Services, Inc. Shares of leading supplier of networking equipment, software, and services Cisco Systems, Inc. fell on weaker than expected revenue guidance as state and local government spending slowed
45
Table of Contents
SC WMC LARGE CAP GROWTH FUND (Continued)
sharply due to budget concerns. Shares of QLogic Corp., a networking solutions provider, fell after the company announced disappointing first quarter revenue numbers and issued second quarter guidance below market expectations. Post-secondary degree program provider ITT Educational Services, Inc. stock fell due to slowing enrollment growth, lower placement rates, and concerns about potential regulation/legislation of the for-profit education industry. Global technology giant Microsoft Corp. and Health Care Equipment & Supplier Medtronic, Inc. were among the top detractors from the Fund’s absolute performance. The Fund sold its position in Medtronic, Inc. during the year.
Security selection within the Financials and Consumer Staples sectors detracted from relative returns. Within Financials, the Fund’s holdings in The Goldman Sachs Group, Inc. and Lincoln National Corp. hurt results. In the Consumer Staples sector, stocks The Procter and Gamble Co. and General Mills, Inc. detracted from the Fund’s performance.
Did the Fund experience major changes to its top ten holdings during the year ended December 31, 2010?
There were no material changes to the December 31, 2010 top ten holdings list relative to the December 31, 2009 top ten holdings list.
How was the Fund positioned relative to its benchmark index at December 31, 2010?
As of December 31, 2010, the Fund’s largest overweight positions relative to the Index were to the Information Technology and Industrials sectors, while the largest underweight positions relative to the Index were to the Consumer Staples, Health Care, and Energy sectors.
SECTOR ALLOCATIONS AT DECEMBER 31, 2010*
Percentage of Net Assets

| * | The above graph categorizes investments using GICS. The percentages shown for each sector reflect the value of investments in that sector as a percentage of net assets. Figures in the above graph may not total to 100% due to the exclusion of the Fund’s other assets and liabilities. |
46
Table of Contents
SC WMC LARGE CAP GROWTH FUND (Continued)
TOP TEN EQUITY HOLDINGS AT DECEMBER 31, 2010
| % of Net Assets | Industry | |||||
| Apple, Inc. |
4.6 | % | Computers & Peripherals | |||
| International Business Machines Corp. |
4.6 | IT Services | ||||
| Cisco Systems, Inc. |
4.3 | Communications Equipment | ||||
| Oracle Corp. |
3.4 | Software | ||||
| EMC Corp. |
3.3 | Computers & Peripherals | ||||
| Caterpillar, Inc. |
3.2 | Machinery | ||||
| Microsoft Corp. |
3.2 | Software | ||||
| Altera Corp. |
3.2 | Semiconductors & Semiconductor Equipment | ||||
| NetApp, Inc. |
2.8 | Computers & Peripherals | ||||
| Google, Inc., Class A |
2.7 | Internet Software & Services | ||||
Comparison of Change in Value of a $10,000 Investment in the SC WMC Large Cap Growth Fund – Initial Class and the Russell 1000 Growth Index
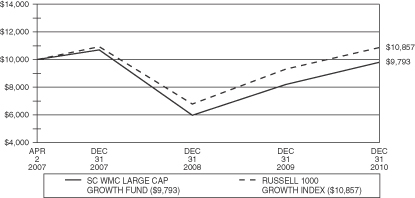
Comparison of Change in Value of a $10,000 Investment in the SC WMC Large Cap Growth Fund – Service Class and the Russell 1000 Growth Index
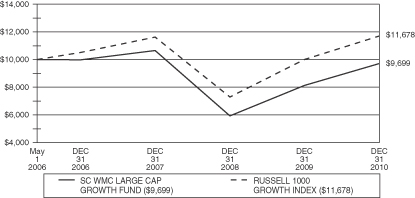
47
Table of Contents
SC WMC LARGE CAP GROWTH FUND (Continued)
Average Annual Total Returns for Periods Ended December 31, 2010**
| Initial Class Shares |
One Year | Three Years | Life of Fund*** |
|||||||||
| SC WMC Large Cap Growth Fund |
19.50 | % | (2.87 | )% | (0.56 | )% | ||||||
| Russell 1000 Growth Index* |
16.71 | % | (0.47 | )% | 2.22 | % | ||||||
| Service Class Shares |
||||||||||||
| SC WMC Large Cap Growth Fund |
19.19 | % | (3.09 | )% | (0.65 | )% | ||||||
| Russell 1000 Growth Index* |
16.71 | % | (0.47 | )% | 3.38 | % | ||||||
*The performance data of the index has been prepared from sources and data that the investment adviser believes to be reliable, but no representation is made as to their accuracy. The index is unmanaged and cannot be invested in directly. The Russell 1000 Growth Index measures the performance of those Russell 1000 Index securities with higher price-to-book ratios and higher forecasted growth values, representative of U.S. securities exhibiting growth characteristics. The Russell 1000 Growth Index includes the largest 1,000 securities in the Russell 3000 Index, based on market cap. The Russell 3000 Index consists of the 3,000 largest and most liquid stocks based and traded in the U.S.
**Performance data is historical and includes changes in share price and reinvestment of income dividends and capital gains distributions. Past performance does not indicate future results. All Fund returns are net of fees and expenses, but do not include any insurance charges imposed in connection with your variable insurance contract. If this performance information included the effect of the insurance charges and the fees and expenses assumed by the investment adviser, performance numbers would be lower. The value of an investment in the SC WMC Large Cap Growth Fund and the return on the investment will fluctuate and redemption proceeds may be higher or lower than an investor’s original cost.
***Initial Class Shares for the period from April 2, 2007 (commencement of operations) to December 31, 2010. Service Class Shares for the period from May 1, 2006 (commencement of operations) to December 31, 2010.
48
Table of Contents
SUN CAPITAL GLOBAL REAL ESTATE FUND
MANAGEMENT’S DISCUSSION & ANALYSIS:
How did the Fund perform during the year ended December 31, 2010?
For the year ended December 31, 2010, the Initial and Service Class shares of Sun Capital Global Real Estate Fund (the “Fund”) returned 15.28% and 14.94%, respectively, underperforming the benchmark, FTSE/EPRA NAREIT Developed Real Estate Index (the “Index”), which returned 20.40% for the same period.
What economic and market factors most influenced the global real estate equity markets as a whole during the year ended December 31, 2010?
After the announcement by the Federal Reserve Board (Fed) of the second round of quantitative easing consisting of U.S. Treasury Bond purchases in November, the 10 year U.S. Treasury bond yield rose from 2.39% in early October to end the year at 3.30%, which while substantially higher than the October low, it was still quite low by historic standards, and even less than the 3.84% yield at December 2009. The impact of the Fed’s monetary policy on real estate equities was felt globally as it is a key element of local borrowing rates and foreign exchange rates. The low borrowing rates have been very positive for real estate equities, but even more important have been the re-emergence of commercial real estate lending, and the narrowing of credit spreads. During 2010, the increase in lending and lower spreads helped to offset the slightly higher rates, which led to a recovery by many previously distressed owners of commercial real estate.
How did the Fund’s country allocations affect relative performance during the year ended December 31, 2010?
During the year, the Fund’s large positions in Digital Realty Trust, Inc. and DuPont Fabros Technology, Inc., both U.S. Office and Industrial Real Estate Investment Trusts (REITs), underperformed and contributed most to the negative performance within the U.S. investment allocation. Both companies, which focus on the ownership of datacenter facilities, came under pressure as investors grew concerned about the potential threat from datacenter developments, and worries over the technological obsolescence of the facilities. The negative contribution from Australia (an overweight position for the Fund), was primarily due to the Fund’s position in CFS Retail Property Trust, which was negatively influenced by potential slowing retail sales and the equity raising by a competitor.
The allocation to Brazil (an overweight position for the Fund) positively affected Fund performance. The underweight position in Canada contributed positively to the Fund’s performance during the fourth quarter of 2010, after a long period where the underweight position contributed negatively to the Fund’s performance due to a strong economy and stable real estate sector in Canada.
Which stocks contributed most to the Fund’s returns during the year ended December 31, 2010?
BR Malls Participacoes SA (Brazil Malls), Weyerhaeuser Co. (U.S. Timber), Parkway Properties, Inc. (U.S. Office), Tokyo Tatemono Co., Ltd. (Japan Diversified), Lexington Realty Trust (U.S. Office and Industrial) contributed most to the Fund’s performance during the year.
Which stocks detracted from the Fund’s performance results during the year ended December 31, 2010?
DuPont Fabros Technology, Inc. (U.S. Industrial), Digital Realty Trust, Inc. (U.S. Office), Capitaland Ltd. (Singapore Diversified), Beni Stabili SpA (Italian Diversified), and Corio NV (Netherlands Retail) detracted most from performance during the year.
Did the Fund experience major changes to its top ten issuers during the year ended December 31, 2010?
There were no material changes to the December 31, 2010 top ten holdings relative to the December 31, 2009 top ten holdings list.
49
Table of Contents
SUN CAPITAL GLOBAL REAL ESTATE FUND (Continued)
How was the Fund positioned relative to its benchmark index at December 31, 2010?
At December 31, 2010, the Fund was most overweight Brazil, the United Kingdom, Australia, France, Italy, the U.S., and the Netherlands. The Fund had the most underweight positions in Canada, Singapore, Sweden, China, Germany, Hong Kong, Belgium, Japan, Finland, and Switzerland. Overall, the Fund had a higher U.S. weight and a lower international weight (ex-U.S.) as compared to the Index. Compared to the benchmark, the Fund’s holdings have a lower enterprise value to earnings before interest, taxes, depreciation and amortization (EBITDA) multiple and lower financial leverage.
COUNTRY ALLOCATIONS AT DECEMBER 31, 2010*
Percentage of Net Assets
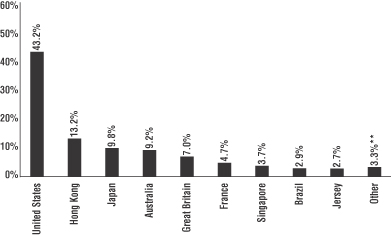
| * | The percentages shown for each country reflect the value of investments in that country as a percentage of net assets. Figures in the above graph may not total to 100% due to the exclusion of the Fund’s other assets and liabilities. |
| ** | Includes 3 countries with an allocation of less than 2% individually. |
50
Table of Contents
SUN CAPITAL GLOBAL REAL ESTATE FUND (Continued)
TOP TEN EQUITY HOLDINGS AT DECEMBER 31, 2010
| % of Net Assets | Industry | |||||
| Sun Hung Kai Properties Ltd. |
4.8 | % | Diversified Real Estate Activities | |||
| Simon Property Group, Inc. |
3.9 | Retail | ||||
| Westfield Group |
2.9 | Retail | ||||
| BR Malls Participacoes SA |
2.9 | Real Estate Operating Companies | ||||
| Segro PLC |
2.9 | Industrial | ||||
| Mitsui Fudosan Co., Ltd. |
2.7 | Diversified Real Estate Activities | ||||
| Atrium European Real Estate Ltd. |
2.7 | Real Estate Operating Companies | ||||
| Mitsubishi Estate Co. Ltd. |
2.7 | Diversified Real Estate Activities | ||||
| Stockland |
2.6 | Diversified | ||||
| Capitaland Ltd. |
2.5 | Diversified Real Estate Activities | ||||
Comparison of Change in Value of a $10,000 Investment in the Sun Capital Global Real Estate Fund – Initial Class and the FTSE/EPRA NAREIT Developed Real Estate Index
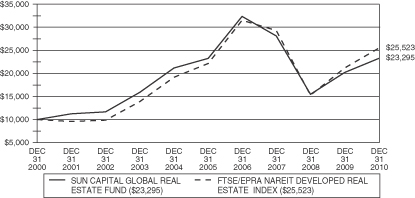
Comparison of Change in Value of a $10,000 Investment in the Sun Capital Global Real Estate Fund – Service Class and the FTSE/EPRA NAREIT Developed Real Estate Index
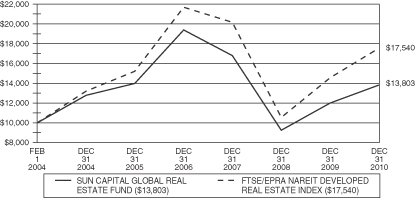
51
Table of Contents
SUN CAPITAL GLOBAL REAL ESTATE FUND (Continued)
Average Annual Total Returns for Periods Ended December 31, 2010**
| Initial Class Shares |
One Year | Three Years | Five Years | Ten Years | Life of Fund*** |
|||||||||||||||
| Sun Capital Global Real Estate Fund |
15.28 | % | (6.06 | )% | 0.01 | % | 8.82 | % | 9.27 | % | ||||||||||
| FTSE EPRA/NAREIT Developed Real Estate Index* |
20.40 | % | (4.53 | )% | 2.88 | % | 9.82 | % | 9.97 | % | ||||||||||
| Service Class Shares |
||||||||||||||||||||
| Sun Capital Global Real Estate Fund |
14.94 | % | (6.31 | )% | (0.24 | )% | — | 4.77 | % | |||||||||||
| FTSE EPRA/NAREIT Developed Real Estate Index* |
20.40 | % | (4.53 | )% | 2.88 | % | — | 8.46 | % | |||||||||||
*The performance data of the index has been prepared from sources and data that the investment adviser believes to be reliable, but no representation is made as to their accuracy. The index is unmanaged and cannot be invested in directly. The FTSE EPRA/NAREIT Developed Real Estate Index is a total-return index comprising eight index families covering the world’s largest investment markets in various currencies, and is designed to track the performance of listed real estate companies and REITs worldwide.
**Performance data is historical and includes changes in share price and reinvestment of income dividends and capital gains distributions. Past performance does not indicate future results. All Fund returns are net of fees and expenses, but do not include any insurance charges imposed in connection with your variable insurance contract. If this performance information included the effect of the insurance charges and the fees and expenses assumed by the investment adviser, performance numbers would be lower. The value of an investment in the Sun Capital Global Real Estate Fund and the return on the investment will fluctuate and redemption proceeds may be higher or lower than an investor’s original cost.
***Initial Class Shares for the period from December 7, 1998 (commencement of operations) to December 31, 2010. Service Class Shares for the period from February 1, 2004 (commencement of operations) to December 31, 2010.
52
Table of Contents
SC IBBOTSON TACTICAL OPPORTUNITIES FUND
(subadvised by Ibbotson Associates, Inc.)
MANAGEMENT’S DISCUSSION & ANALYSIS:
How did the Fund perform during the period ended December 31, 2010?
For the period from November 15, 2010 (commencement of operations) to December 31, 2010, the Initial Class shares of SC Ibbotson Tactical Opportunities (the “Fund”) returned 5.20%, underperforming the benchmark, the S&P 500 Index (the “Index”), which returned 5.28% for the same period.
What key factors influenced management’s tactical opportunities allocation strategy during the period ended December 31, 2010?
The Fund is not available for investment by contract holders but serves exclusively as an investment option designed to implement a tactical strategy for SC Ibbotson Balanced Fund, SC Ibbotson Conservative Fund and SC Ibbotson Growth Fund. The Tactical Opportunities strategy (“the Model”) employs a rules-based approach to tactically shift allocations among twelve defined asset classes. As such, a major influence on the Model is price momentum of the market. In general, the strategy over-weights the asset classes that display positive momentum and conversely, under-weights those with negative momentum. At the same time, the Model incorporates the mathematical concept of mean reversion, which argues that all prices eventually move back to their historical averages. The combination of these two factors is used to determine the monthly weighting scheme applied to the twelve defined asset classes within the Model.
Weighting decisions within the Model are relative to the Strategic Asset Allocation Model (“SAA Model”), which represents the neutral position of the Model without any over or under weights. During the period ended December 31, 2010, the Model over-weighted equity by approximately 3% relative to the SAA Model. Within equity, the Model over-weighted Emerging Markets, Real Estate and Small Cap Growth due to positive momentum signals within each asset class. Conversely, the Model under-weighted Large Cap Growth, Large Cap Value, and Mid Cap Value due to negative momentum signals during the period. During the period ended December 31, 2010, the Model under-weighted fixed income by approximately 3% relative to the SAA Model. Within fixed income, the Model over-weighted U.S. Aggregate Bonds, based on a positive momentum signal, and under-weighted U.S. Short-term Bonds and Treasury Inflation Protected Securities due to negative momentum signals within each asset class.
What tactical asset allocation decisions were most responsible for the Fund’s performance during the period ended December 31, 2010?
Performance contributors and detractors in the Model are relative to the SAA Model. Therefore, the under or over weighting of an asset class will either add or detract from the Model’s performance relative to the SAA. During the period ended December 31, 2010, the over-weight in equities relative to fixed income contributed to performance since equities outpaced bonds. Specifically, Mid Cap Growth, Small Cap Growth, and Small Cap Value contributed the most to the Fund’s performance. The greatest detractors from performance, due to the underweight positions based on the market, were Mid Cap Value, Large Cap Growth, and Large Cap Value.
An absolute return refers to the appreciation or depreciation of asset classes over the stated period and does not compare it to the SAA or any other measure. From an absolute return standpoint, Aggregate Bonds was the only asset class that detracted from performance during the period ended December 31, 2010.
Which Exchange Traded Fund (“ETF”) investments contributed most to the Fund’s returns during the period ended December 31, 2010?
The ETFs within the Fund consist of passively managed baskets of stocks and bonds that are designed to deliver the performance of a stated index. Therefore, from an absolute return standpoint, we expect the individual ETF manager’s performance to closely track the Model’s corresponding asset class returns less manager fees and any
53
Table of Contents
SC IBBOTSON TACTICAL OPPORTUNITIES FUND (Continued)
trade-related impact. Based on that, the greatest contributors to the Fund’s performance for the period ended December 31, 2010, were iShares Russell 2000 Index, iShares Russell MidCap Growth Index, and iShares S&P 500 Index. There are two driving factors that are reflected in ETFs with the highest contribution to the Fund’s return. The first factor is determined by the performance of the index that the ETF is tracking; and the second factor is the ETF’s weight within the Fund. Each of the above mentioned ETFs reflected a relatively higher index return and weight within the Fund for the period ended December 31, 2010.
Which ETF investments detracted from the Fund’s performance results during the period ended December 31, 2010?
The ETF that detracted the most from the Fund’s performance during the period ended December 31, 2010 was Vanguard Total Bond Market (BND) which tracks the Barclays Capital U.S. Aggregate Bond Index due to a relatively low index return and a large investment weight of BND within the Fund.
PORTFOLIO COMPOSITION AT DECEMBER 31, 2010*
Percentage of Net Assets
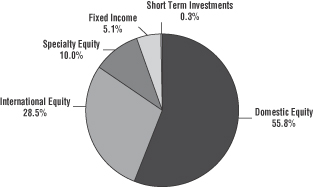
| * | The percentages shown for each investment category reflect the value of investments in that category as a percentage of net assets. Figures in the above graph may not total to 100% due to the exclusion of the Fund’s other assets and liabilities. |
TOP TEN INVESTMENT COMPANIES AT DECEMBER 31, 2010
| % of Net Assets | Category | |||||
| Vanguard Emerging Markets ETF |
12.1 | % | International Equity | |||
| iShares Russell 2000 Index Fund |
11.8 | Domestic Equity | ||||
| iShares Russell Midcap Growth Index Fund |
11.7 | Domestic Equity | ||||
| iShares S&P 500 Index Fund |
10.9 | Domestic Equity | ||||
| Vanguard Europe Pacific ETF |
10.0 | International Equity | ||||
| Vanguard REIT ETF |
10.0 | Specialty Equity | ||||
| SPDR S&P 500 ETF Trust |
9.9 | Domestic Equity | ||||
| iShares Russell 1000 Value Index Fund |
6.5 | Domestic Equity | ||||
| Vanguard Total Bond Market ETF |
5.2 | Fixed Income | ||||
| iShares MSCI EAFE Index Fund |
3.4 | International Equity | ||||
54
Table of Contents
SC IBBOTSON TACTICAL OPPORTUNITIES FUND (Continued)
As of the year ended 12/31/10, the Fund did not have six months of performance and therefore line graphs are not presented.
Total Returns for Period Ended December 31, 2010**
| Life of Fund***± |
||||
| SC Ibbotson Tactical Opportunities Fund–Initial Class Shares |
5.20 | % | ||
| S&P 500 Index* |
5.28 | % | ||
*The performance data of the index has been prepared from sources and data that the investment adviser believes to be reliable, but no representation is made as to their accuracy. The index is unmanaged and cannot be invested in directly. The S&P 500 Index is a market-value weighted index of 500 blue chip stocks and is considered to be a benchmark of the overall stock market.
**Performance data is historical and includes changes in share price and reinvestment of income dividends and capital gains distributions. Past performance does not indicate future results. All Fund returns are net of fees and expenses, but do not include any insurance charges imposed in connection with your variable insurance contract. If this performance information included the effect of the insurance charges and the fees and expenses assumed by the investment adviser, performance numbers would be lower. The value of an investment in the SC Ibbotson Tactical Opportunities Fund and the return on the investment will fluctuate and redemption proceeds may be higher or lower than an investor’s original cost.
***For the period from November 15, 2010 (commencement of operations) to December 31, 2010.
±Returns for period of less than one year are not annualized.
55
Table of Contents
SUN CAPITAL INVESTMENT GRADE BOND FUND
MANAGEMENT’S DISCUSSION & ANALYSIS:
How did the Fund perform during the year ended December 31, 2010?
For the year ended December 31, 2010, the Initial and Service Class shares of Sun Capital Investment Grade Bond Fund (the “Fund”) returned 7.67% and 7.49%, respectively, outperforming the benchmark, the Barclays Capital U.S. Aggregate Bond Index (the “Index”), which returned 6.54% for the same period.
What economic and market factors most influenced the fixed income markets as a whole during the year ended December 31, 2010?
Economic data domestically has continued to improve over the most recent quarter despite a stubbornly high unemployment rate and a residential housing market that remains in despair. Discussion of an additional economic slowdown or “double dip” has greatly declined. Globally, economic data remains strong, excluding certain peripheral European countries, with many emerging nations, including China, battling inflationary pressures.
The unemployment rate, which has been above 9% since May 2009, remains a drag on the economy and a concern for all. The Federal Reserve Board (Fed), at its latest Federal Open Market Committee meeting in mid December, where it held its target range for the federal funds rate at 0.00%-0.05%, remarked that high unemployment is constraining economic growth. With approximately 15 million people unemployed, and an “under” employed rate of more than 17%, the Fed expanded its asset purchase plan (U.S. Treasury Bond purchases) in December by $600 billion, after its “Round 1” effort of $1.7 trillion failed to heal the country’s economic woes. While the after effects of the plan are much debated (inflation, weak dollar, etc.), the Fed remains committed to the program which has persuaded investors to increase allocations toward higher risk assets, which in turn has driven prices up and thus consumer balance sheets and optimism.
What key strategies were most responsible for the Fund’s performance during the year ended December 31, 2010?
Positively affecting the Fund’s performance for the year was the Fund’s overweight allocation to the Credit sector which outperformed the Credit allocation within the Index. The Fund’s short duration position also positively affected performance during the year generating an additional 6 basis points of out-performance over the return of the Index. Additionally, the Fund’s yield curve positioning produced out-performance when contrasted to the Index. Negatively affecting performance for the year was the Fund’s U.S. Treasury security selection as well as the Fund’s Mortgage Backed Security (MBS) allocation, both of which lagged the Index.
What changes did you make to the Fund’s sector allocations during the year ended December 31, 2010 and how did these affect performance during the reporting period?
Allocation to the Credit and MBS sectors increased during the year. Supporting the increased investment in these sectors was the utilization of the Fund’s short term investments. The increase in the Credit sector allocation positively affected Fund performance as the Credit portion of the Fund outperformed the Credit portion of the Index. Although the increase in the Fund’s MBS sector allocation added to the Fund’s performance, this sector underperformed the MBS sector in the Index. The Fund’s U.S. Treasury sector allocation also enhanced the Fund’s returns but underperformed the U.S. Treasury sector in the Index. Other sector allocations remained relatively stable over the year.
Did the Fund experience major changes to its top ten issuers during the year ended December 31, 2010?
During the year ended December 31, 2010, six out of the top ten issuers were replaced. The newly added securities were all in the Corporate Credit sector and were purchased as a part of an overall portfolio optimization strategy. Of
56
Table of Contents
SUN CAPITAL INVESTMENT GRADE BOND FUND (Continued)
the six issuers from December 31, 2009 that are no longer among the Fund’s top ten issuers, two remain as holdings by the Fund as of December 31, 2010.
How was the Fund positioned relative to its benchmark index at December 31, 2010?
As of December 31, 2010, the Fund was overweight compared to the Index in Credit, MBS and Commercial Mortgage Backed Securities (CMBS), while underweight in U.S. Treasuries, U.S. Government Agencies and Asset Backed Securities. Premiums over U.S. Treasuries continue to offer attractive alternatives to money markets or risk-free assets and justify overweight positions in Credit, MBS and CMBS relative to the Index. The Fund’s exposure to the high yield corporate sector is a non-Index asset allocation. The high yield corporate sector remains an attractive sector with security selection continuing to be of paramount importance.
PORTFOLIO COMPOSITION AT DECEMBER 31, 2010*
Percentage of Net Assets
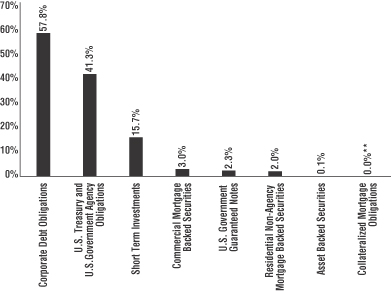
| * | The percentages shown for each investment category reflect the value of investments in that category as a percentage of net assets. Figures in the above graph may not total to 100% due to the exclusion of the Fund’s other assets and liabilities. |
| ** | Amount is less than 0.05%. |
57
Table of Contents
SUN CAPITAL INVESTMENT GRADE BOND FUND (Continued)
TOP TEN ISSUERS AT DECEMBER 31, 2010
| % of Net Assets | Category | |||||
| Federal National Mortgage Association |
22.0 | % | U.S. Government Agency | |||
| Federal Home Loan Mortgage Corp. |
11.4 | U.S. Government Agency | ||||
| U.S. Treasury |
7.2 | U.S. Treasury | ||||
| ING Bank NV |
2.6 | Corporate Debt – Banks | ||||
| PepsiCo, Inc. |
2.1 | Short Term – Commercial Paper | ||||
| Philip Morris International, Inc. |
1.9 | Short Term – Commercial Paper | ||||
| National Australia Bank Ltd. |
1.9 | Corporate Debt – Banks | ||||
| National Credit Union Association |
1.6 | U.S. Government Guaranteed Notes | ||||
| Morgan Stanley Capital I |
1.6 | Commercial Mortgage Backed Securities | ||||
| Ford Motor Credit Co. LLC |
1.4 | Corporate Debt – Automotive | ||||
Comparison of Change in Value of a $10,000 Investment in the Sun Capital Investment Grade Bond Fund – Initial Class and the Barclays Capital U.S. Aggregate Bond Index
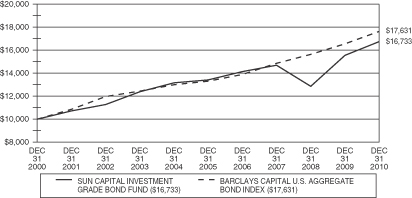
Comparison of Change in Value of a $10,000 Investment in the Sun Capital Investment Grade Bond Fund – Service Class and the Barclays Capital U.S. Aggregate Bond Index
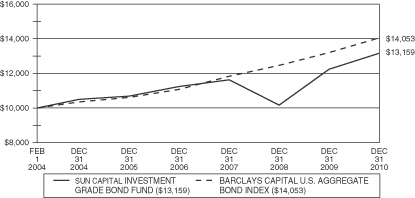
58
Table of Contents
SUN CAPITAL INVESTMENT GRADE BOND FUND (Continued)
Average Annual Total Returns for Periods Ended December 31, 2010**
| Initial Class Shares |
One Year | Three Years | Five Years | Ten Years | Life of Fund*** |
|||||||||||||||
| Sun Capital Investment Grade Bond Fund |
7.67 | % | 4.48 | % | 4.51 | % | 5.28 | % | 5.13 | % | ||||||||||
| Barclays Capital U.S. Aggregate Bond Index* |
6.54 | % | 5.90 | % | 5.80 | % | 5.84 | % | 5.70 | % | ||||||||||
| Service Class Shares |
||||||||||||||||||||
| Sun Capital Investment Grade Bond Fund |
7.49 | % | 4.22 | % | 4.26 | % | — | 4.05 | % | |||||||||||
| Barclays Capital U.S. Aggregate Bond Index* |
6.54 | % | 5.90 | % | 5.80 | % | — | 5.04 | % | |||||||||||
*The performance data of the index has been prepared from sources and data that the investment adviser believes to be reliable, but no representation is made as to their accuracy. The index is unmanaged and cannot be invested in directly. The Barclays Capital U.S. Aggregate Bond Index is composed of U.S. securities in the Treasury, Government-Related, Corporate, and Securitized sectors.
**Performance data is historical and includes changes in share price and reinvestment of income dividends and capital gains distributions. Past performance does not indicate future results. All Fund returns are net of fees and expenses, but do not include any insurance charges imposed in connection with your variable insurance contract. If this performance information included the effect of the insurance charges and the fees and expenses assumed by the investment adviser, performance numbers would be lower. The value of an investment in the Sun Capital Investment Grade Bond Fund and the return on the investment will fluctuate and redemption proceeds may be higher or lower than an investor’s original cost.
***Initial Class Shares for the period from December 7, 1998 (commencement of operations) to December 31, 2010. Service Class Shares for the period from February 1, 2004 (commencement of operations) to December 31, 2010.
59
Table of Contents
MANAGEMENT’S DISCUSSION & ANALYSIS:
How did the Fund perform during the year ended December 31, 2010?
For the year ended December 31, 2010, the Initial and Service Class shares of Sun Capital Money Market Fund (the “Fund”) returned 0.19% and 0.00%, respectively, with the Initial Class outperforming and the Service Class underperforming the benchmark, the BofA Merrill Lynch U.S. 3-month Treasury Bill Index (the “Index”), which returned 0.13% for the same period.
What economic and market factors most influenced the money markets as a whole during the year ended December 31, 2010?
Economic data was mixed during the year, but recent signs point to a gradual recovery. The unemployment rate remains elevated at 9.4%, and though eight of the last twelve months have showed modest employment gains, employment numbers on the whole have been weak. Business spending on equipment and software continued to rise over the second half of 2010, and household spending expanded at a moderate pace. Consumer confidence was mixed for the twelve month period, and housing data, which was positive early in the year spurred by the new home buyer tax credit, has been weak since the program’s expiration on April 30, 2010.
The zero interest rate policy of the Federal Reserve Board (Fed), which has been in place for two years, has left the Federal Funds Rate at historically low levels, at the 0.00% to 0.25% range. The Government’s only adjustment came during the first quarter, when the discount rate was raised nominally by 25 basis points (bps) to 0.75%, as part of the government’s effort to remove some of the excess liquidity put in place during 2008. This 0.75% rate remained in place through the end of the year. While the Federal Funds effective rate held near the upper end of its range of 0.25% for most of the year, U.S. Treasury Bills and commercial paper yields remain stubbornly low. Three month-treasury bills traded in a very tight range, beginning the year at 0.05%, reaching a high of 0.18% at mid-year, and then falling modestly to close the twelve month period at 0.13%. Sovereign concerns in Europe that had pushed certain short-term rates higher during the second quarter, including LIBOR to 0.54%, have eased by 24 bps to close the year at 0.30%.
At the November 3rd Federal Open Market Committee (FOMC) meeting, the Fed announced an anticipated second round of quantitative easing (U.S. Treasury Bond Purchases), following earlier statements that it was “prepared to provide additional accommodation if needed to support economic recovery”. The FOMC decided to continue its policy of reinvesting principal U.S. Treasury and Mortgage Backed Securities (MBS) payments, while also expanding its holdings of securities by purchasing $600 billion of longer-term U.S. Treasury Bonds over the next seven months.
Commercial paper issuance dropped as many companies continued to reduce their reliance on short term funding in favor of longer term issuance. At December 15th, commercial paper supply had declined 9.6% to $1.04 trillion on the year, representing a 52% decline since the peak in August 2007. Asset-backed securities and domestic financials posted the greatest declines, down 17.8% to $370 billion and 15.2% to $337 billion, respectively. Industrial commercial paper represented the only sector with increased issuance on a year-to-date basis, rising 43.2% to $136 billion.
Investors have developed a somewhat greater tolerance for risk, and there has been a shift away from money market funds in favor of global stock and fixed income funds. AMG Data Services reported that almost $415 billion was withdrawn from money market funds during 2010. This shift has thus far had little impact in driving yields higher.
60
Table of Contents
SUN CAPITAL MONEY MARKET FUND (Continued)
What key factors were most responsible for the Fund’s performance during the year ended December 31, 2010?
The Fed’s zero interest rate policy and the market’s persistent demand for quality remain the most influential factors on the overall performance of the Fund. Market conditions have continued to force the Fund’s gross portfolio yield below the Fund’s net operating expenses causing the adviser to further subsidize the Fund.
How did you manage the Fund’s weighted average maturity during the year ended December 31, 2010?
On December 31, 2010, the Fund had a weighted average maturity of 36 days, 9 days shorter than the average taxable money market fund maturity of 45 days as reported in the Money Fund Report, published by iMoneyNet Inc. The credit curve between 30 day and 90 day commercial paper has been consistently narrow, averaging 7 bps for the year; offering little compensation to invest in longer dated securities. The Fund’s average maturity ranged from 22 to 49 days during the year, and was typically slightly shorter than the market average.
How was the Fund invested during the year ended December 31, 2010?
The Fund was invested in a diversified portfolio of top tier, short term investments. Holdings in U.S. Treasury Bills increased from 0.0% to 11.8% during the year as a result of new liquidity requirements imposed by the U.S Securities and Exchange Commission (SEC). Holdings in agency discount notes and corporate debt securities decreased during the year due to less attractive yields, which the Fund was able to replace with higher yielding Commercial Paper.
PORTFOLIO COMPOSITION AT DECEMBER 31, 2010*
Percentage of Net Assets

| * | The percentages shown for each investment category reflect the value of investments in that category as a percentage of net assets. Figures in the above graph may not total to 100% due to the exclusion of the Fund’s other assets and liabilities. |
61
Table of Contents
SUN CAPITAL MONEY MARKET FUND (Continued)
TOP TEN ISSUERS AT DECEMBER 31, 2010
| % of Net Assets | Category | |||||
| U.S. Treasury |
11.8 | % | U.S. Treasury | |||
| Goldman Sachs Group, Inc. |
6.4 | TLGP | ||||
| Federal National Mortgage Association |
6.2 | U.S. Government Agency | ||||
| General Electric Capital Corp. |
3.8 | TLGP | ||||
| Province of Ontario |
3.8 | Foreign Government | ||||
| Caterpillar Financial Services Corp. |
3.8 | Commercial Paper | ||||
| PepsiCo, Inc. |
3.8 | Commercial Paper | ||||
| Philip Morris International, Inc. |
3.8 | Commercial Paper | ||||
| Province of Quebec |
3.8 | Foreign Government | ||||
| Nestle Capital Corp. |
3.8 | Commercial Paper | ||||
Comparison of Change in Value of a $10,000 Investment in the Sun Capital Money Market Fund – Initial Class and the BofA Merrill Lynch U.S. 3-Month Treasury Bill Index
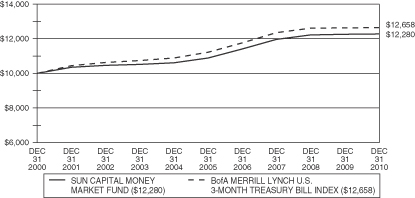
Comparison of Change in Value of a $10,000 Investment in the Sun Capital Money Market Fund – Service Class and the BofA Merrill Lynch U.S. 3-Month Treasury Bill Index
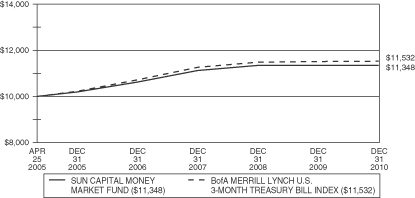
62
Table of Contents
SUN CAPITAL MONEY MARKET FUND (Continued)
Average Annual Total Returns for Periods Ended December 31, 2010**
| Initial Class Shares |
One Year | Three Years | Five Years | Ten Years | Life of Fund*** |
|||||||||||||||
| Sun Capital Money Market Fund |
0.19 | % | 0.89 | % | 2.41 | % | 2.08 | % | 2.61 | % | ||||||||||
| BofA Merrill Lynch U.S. 3-Month Treasury Bill Index* |
0.13 | % | 0.79 | % | 2.43 | % | 2.38 | % | 2.91 | % | ||||||||||
| Service Class Shares |
||||||||||||||||||||
| Sun Capital Money Market Fund |
0.00 | % | 0.67 | % | 2.17 | % | — | 2.25 | % | |||||||||||
| BofA Merrill Lynch U.S. 3-Month Treasury Bill Index* |
0.13 | % | 0.79 | % | 2.43 | % | — | 2.54 | % | |||||||||||
*The performance data of the index has been prepared from sources and data that the investment adviser believes to be reliable, but no representation is made as to their accuracy. The index is unmanaged and cannot be invested in directly. The BofA Merrill Lynch U.S. 3-Month Treasury Bill Index is a single security index which at the beginning of every month selects for inclusion the U.S. Treasury Bill maturing closest to, but not beyond three months from that date. That issue is then held for one month, sold and rolled into the newly selected U.S. Treasury Bill.
**Performance data is historical and includes changes in share price and reinvestment of income dividends and capital gains distributions. Past performance does not indicate future results. All Fund returns are net of fees and expenses, but do not include any insurance charges imposed in connection with your variable insurance contract. If this performance information included the effect of the insurance charges and the fees and expenses assumed by the investment adviser, performance numbers would be lower. Although the Fund seeks to maintain a stable net asset value of $1 per share there can be no assurance that it will do so. The value of an investment in the Sun Capital Money Market Fund and the return on the investment may fluctuate and redemption proceeds may be higher or lower than an investor’s original cost.
***Initial Class Shares for the period from December 7, 1998 (commencement of operations) to December 31, 2010. Service Class Shares for the period from April 25, 2005 (commencement of operations) to December 31, 2010.
63
Table of Contents
SC BLACKROCK INFLATION PROTECTED BOND FUND
(subadvised by BlackRock Financial Management, Inc.)
MANAGEMENT’S DISCUSSION & ANALYSIS:
How did the Fund perform during the year ended December 31, 2010?
For the year ended December 31, 2010, the Initial and Service Class shares of SC BlackRock Inflation Protected Bond Fund (the “Fund”) returned 5.24% and 4.91%, respectively, underperforming the benchmark, the Barclays Capital Global Real Index: U.S. TIPS (the “Index”), which returned 6.31% for the same period.
What economic and market factors most influenced the fixed income markets as a whole during the year ended December 31, 2010?
There were many factors that influenced the fixed income markets in 2010, including the Federal Reserve’s decision to leave the Federal Funds Rate target at 0.00%-0.25%, the conclusion of the first round of quantitative easing consisting of U.S. Treasury Bond Purchases, the introduction of an additional round of quantitative easing and economic data that was mixed at best and created periods of heightened volatility. The combination and timing of these various factors created sharp short-term movements in interest rates (lasting days or weeks) as well as longer term moves (lasting months), measured in hundreds of basis points.
What key strategies were most responsible for the Fund’s performance during the year ended December 31, 2010?
As the Fund’s investment mandate requires that 80% of its assets be invested in Inflation-Protected Securities, there are limited opportunities to add value through sector rotation. The Fund’s portfolio management team uses the limited ability it has to own nominal U.S. Treasuries during times when U.S. Treasury Inflation Protected Securities (“TIPS”) appear to be overvalued. Investment value is determined in many ways; however, a commonly used metric looks at the level between the yield on a nominal U.S. Treasury bond and a TIP bond with a similar maturity, known as the breakeven level. Breakeven levels reflect broad expectations of the level of inflation. When the portfolio management team was of the opinion that TIPS had priced in too high a level of inflation expectations, the Fund sold TIPS and bought nominal U.S. Treasuries and vice versa. In addition to monitoring inflation expectations via breakevens, the Fund also establishes overweight and underweight positions in bonds of varying maturities. Holding different positions along the yield curve is an effective means to manage duration (interest rate risk).
During the second and third quarters of 2010, the Fund benefited from holding an underweight position in U.S. TIPS in favor of nominal U.S. Treasuries. At this time, weaker-than-expected economic data along with concerns around the European sovereign debt crisis led to tempered growth expectations, driving investors into nominal U.S. Treasuries. During the fourth quarter, the Fund increased exposure to TIPS as the prospect of the Fed engaging in a second round of quantitative easing became increasingly likely. The anticipation of the pending announcement drove both real and nominal yields lower. Detracting from the Fund’s performance for the year was the decision to overweight longer dated bonds versus bonds with shorter maturities.
The Fund used interest rate derivatives such as futures, options, swaps and swaptions to primarily manage duration and convexity risk within the Fund during the year. These derivatives were used to express a view on the relative performance of bonds with shorter durations versus bonds with longer durations. Finally, derivatives enabled the Fund to be positioned based on the views on inflation expectations described above.
What changes did you make to the Fund’s sector allocations during the year ended December 31, 2010 and how did these affect performance during the reporting period?
As discussed above, single sector funds have limited flexibility to rotate between sectors. While some peer funds may use this limited flexibility to buy higher risk assets such as mortgage-backed securities or corporate bonds, that
64
Table of Contents
SC BLACKROCK INFLATION PROTECTED BOND FUND (Continued)
is not a central tenet of the portfolio management team’s management style. The Fund is mainly limited to TIPS and nominal Treasury and Treasury alternatives such as Treasury futures and options. In some instances, the Fund does make use of higher risk assets, but exposure is minimal.
Did the fund experience major changes to its top ten issuers during the year ended December 31, 2010?
There were no material changes to the December 31, 2010 top ten issuers list relative to the December 31, 2009 top ten issuers list.
How was the Fund positioned relative to its benchmark index at December 31, 2010?
At year end, the Fund’s duration was 7.46, which is in line with the Index. The Fund maintains a yield curve-flattening bias, by holding an underweight to the intermediate portion of the curve and an overweight to the long end expressed in terms of real and nominal yields. It is our view that prices on the long end of the breakeven curve are factoring in the appropriate amount of real yields given the current level of economic growth. In addition, the long end of the TIPS curve is, in our view, priced appropriately for the current levels of inflation expectations. We view the short end as overbought and therefore maintain an underweight position to the short end of the real yield and breakeven curves. The Fund maintains out-of-Index exposure to non-U.S. inflation-protected securities, which we believe are attractive on a relative value basis.
PORTFOLIO COMPOSITION AT DECEMBER 31, 2010*
Percentage of Net Assets
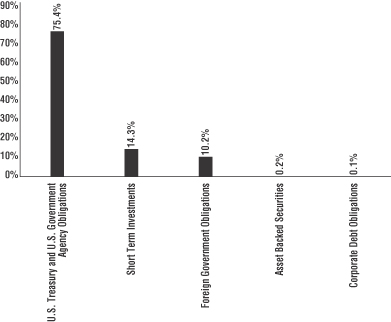
| * | The percentages shown for each investment category reflect the value of investments in that category as a percentage of net assets. Figures in the above graph may not total to 100% due to the exclusion of the Fund’s other assets and liabilities. |
65
Table of Contents
SC BLACKROCK INFLATION PROTECTED BOND FUND (Continued)
TOP TEN ISSUERS AT DECEMBER 31, 2010
| % of Net Assets | Category | |||||
| U.S. Treasury |
51.9 | % | U.S. Treasury | |||
| Government National Mortgage Association |
7.8 | U.S. Government Agency | ||||
| Federal Home Loan Mortgage Corp. |
7.8 | U.S. Government Agency | ||||
| Federal National Mortgage Association |
7.8 | U.S. Government Agency | ||||
| Government of Germany |
5.1 | Foreign Government | ||||
| Government of France |
5.0 | Foreign Government | ||||
| Bank of America Credit Card Trust |
0.2 | Asset Backed Securities | ||||
| Government of Greece |
0.1 | Foreign Government | ||||
| Verizon Wireless Capital LLC |
0.1 | Corporate Debt - Telecommunications | ||||
| Capital One Auto Finance Trust |
0.0 | * | Asset Backed Securities | |||
| * | Amount is less than 0.05%. |
Comparison of Change in Value of a $10,000 Investment in the SC BlackRock Inflation Protected Bond Fund – Initial Class and the Barclays Capital Global Real Index: U.S. TIPS
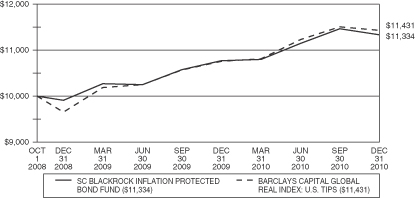
Comparison of Change in Value of a $10,000 Investment in the SC BlackRock Inflation Protected Bond Fund – Service Class and the Barclays Capital Global Real Index: U.S. TIPS
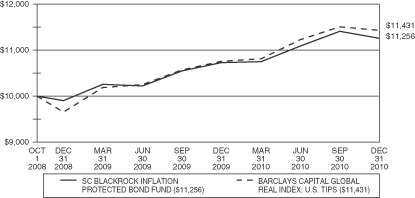
66
Table of Contents
SC BLACKROCK INFLATION PROTECTED BOND FUND (Continued)
Average Annual Total Returns for Periods Ended December 31, 2010**
| One Year | Life of Fund*** |
|||||||
| SC BlackRock Inflation Protected Bond Fund – Initial Class Shares |
5.24 | % | 5.72 | % | ||||
| SC BlackRock Inflation Protected Bond Fund – Service Class Shares |
4.91 | % | 5.39 | % | ||||
| Barclays Capital Global Real Index: U.S. TIPS* |
6.31 | % | 6.13 | % | ||||
*The performance data of the index has been prepared from sources and data that the investment adviser believes to be reliable, but no representation is made as to their accuracy. The index is unmanaged and cannot be invested in directly. Barclays Capital Global Real Index: U.S. TIPS is a market index comprised of all U.S. Treasury Inflation Protected Securities rated investment grade (Baa3 or better) that have at least one year to final maturity and at least $250 million par amount outstanding.
**Performance data is historical and includes changes in share price and reinvestment of income dividends and capital gains distributions. Past performance does not indicate future results. All Fund returns are net of fees and expenses, but do not include any insurance charges imposed in connection with your variable insurance contract. If this performance information included the effect of the insurance charges and the fees and expenses assumed by the investment adviser, performance numbers would be lower. The value of an investment in the SC BlackRock Inflation Protected Bond Fund and the return on the investment will fluctuate and redemption proceeds may be higher or lower than an investor’s original cost.
***For the period from October 1, 2008 (commencement of operations) to December 31, 2010.
67
Table of Contents
SC GOLDMAN SACHS SHORT DURATION FUND
(Subadvised by Goldman Sachs Asset Management, L.P.)
MANAGEMENT’S DISCUSSION & ANALYSIS:
How did the Fund perform during the year ended December 31, 2010?
For the year ended December 31, 2010, the Initial and Service Class shares of SC Goldman Sachs Short Duration Fund (the “Fund”) returned 2.41% and 2.16%, respectively, with the Initial Class shares outperforming and the Service Class shares underperforming the benchmark, the BofA Merrill Lynch 1-3 Year U.S. Treasury Index (the “Index”), which returned 2.35% for the same period.
What economic and market factors most influenced the fixed income markets as a whole during the year ended December 31, 2010?
In 2010, the global economy suffered a mid-year slowdown that raised concerns about a second economic slowdown or a “double-dip” recession, but ultimately, the year ended with improved momentum. In the U.S., even though job creation and the housing market remained persistently weak throughout the year, the recovery began to broaden beyond the corporate sector with a modest pickup in consumer demand. Industrial production and business investment picked up in the first half of the year then leveled out, and the manufacturing and services sectors have continued to expand. Further government stimulus, including extensions of tax cuts and jobless benefits, and more quantitative easing consisting of U.S. Treasury Bond Purchases by the Federal Reserve Board (Fed), boosted confidence in the recovery and prompted upward revisions to growth forecasts. Over the year, risk appetite has generally helped spread sectors to outperform U.S. Treasuries. Risk appetite benefited from better-than-expected corporate earnings, strengthening economic indicators and the search for yield in an environment of exceptionally low interest rates.
U.S. Treasury yields ended 2010 lower on the year, driven by concerns mid-year about the global recovery and persistent fears of contagion from peripheral European countries. In the fourth quarter, however, the U.S. Treasuries rally reversed on an improved economic outlook and increased capital flows from bonds to equities. Yields trended higher early in the year before softer data and doubts over the strength of the recovery emerged. Government bonds rallied strongly in May on a flight-to-quality sentiment amid heightened concerns regarding the fiscal strength of Greece and other peripheral European countries, and the prospect of a contagion effect to stronger European economies. Yields continued to move lower through the middle of the year, as anemic economic data and disappointing employment figures in the U.S. provided support to U.S. Treasuries. In the U.S., the 2-year Treasury yield fell to a historic low to approximately 0.5%. The downward trend reversed in October, following the emergence of stronger manufacturing and survey data, as well as the anticipated incentive from further stimulatory measures from the Fed and the extension of Bush-era tax cuts. Yields rose into the end of the year, particularly in November and December, leaving the benchmark 10-year Treasury yield at 3.30%.
What key strategies were most responsible for the Fund’s performance during the year ended December 31, 2010?
A combination of top-down and bottom-up strategies influenced the Fund’s performance in 2010. Tactical management of the Fund’s duration and term structure detracted from returns over the year. Specifically, the Fund’s long position in the short to intermediate portion of the yield curve (particularly in the 5-year portion) detracted in December as U.S. Treasury rates increased sharply. The Fund’s cross-sector positioning relative to the benchmark was a primary contributor to 2010 returns. An overweight exposure to investment grade corporate issues was the primary driver of results, as the sector outperformed on a combination of positive fundamental and technical factors. Fundamentally, company balance sheets continued to improve with high cash balances and declining leverage, while the technical picture was supportive as investors continued to move into risk assets as Treasury yields fell. Exposure to the agency mortgage-backed security (MBS) sector also added to returns as the mortgages were supported by an environment of strong investor demand and low prepayments. The
68
Table of Contents
SC GOLDMAN SACHS SHORT DURATION FUND (Continued)
Fund’s security selection strategies broadly added to performance, including the bias toward short-maturity corporates, the overall selection of spread-product securities, and the selection of agencies, Treasury Inflation Protected Securities, and other government securities.
What changes did you make to the Fund’s sector allocations during the year ended December 31, 2010 and how did these affect performance during the reporting period?
Primary changes in the Fund’s sector allocations over the year included shifting weights of agency debentures (based on valuations at the time), as well as increasing the Fund’s position in agency MBS and covered bonds (securities formed from the public sector or through the use of mortgage loans where the security is backed by a separate pool of loans) in the second half of the year. Covered bonds may offer attractive spread pick-up and high credit quality relative to government bonds and some asset-backed security sectors. This position resulted in relatively flat performance over the year. An increase in the Fund’s exposure to agency MBS over the year added to performance as the sector rallied. As previously noted, the asset class was supported by an environment of strong investor demand and low prepayments.
Did the Fund experience major changes to its top ten issuers during the year ended December 31, 2010?
There were no material changes to the Fund’s top ten issuers over the year.
How was the Fund positioned relative to its benchmark index at December 31, 2010?
At the end of the year, less than 50% of the Fund’s assets were in government securities, versus 100% for the Index, as the Fund continued to favor positions within non-Government sectors including the Investment Grade, Asset Backed and Mortgage Backed sectors, whose strong performance as noted above allowed the Fund’s Initial Class to outperform the benchmark. Though the sector allocations differ, the Index continues to maintain a relatively short duration (+1.96 years), with the Fund just a bit shorter (+1.85 years), though the Fund is moving toward a position of slightly longer duration than the Index.
PORTFOLIO COMPOSITION AT DECEMBER 31, 2010*
Percentage of Net Assets
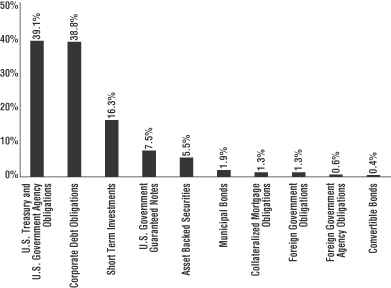
| * | The percentages shown for each investment category reflect the value of investments in that category as a percentage of net assets. Figures in the above graph may not total to 100% due to the exclusion of the Fund’s other assets and liabilities. |
69
Table of Contents
SC GOLDMAN SACHS SHORT DURATION FUND (Continued)
TOP TEN ISSUERS AT DECEMBER 31, 2010
| % of Net Assets | Category | |||||
| U.S. Treasury |
21.7 | % | U.S. Treasury | |||
| Federal National Mortgage Association |
17.6 | U.S. Government Agency | ||||
| General Electric Capital Corp. |
3.6 | Corporate Debt – Financial & TLGP | ||||
| Landwirtschaftliche Rentenbank |
2.4 | Special Purpose Banks | ||||
| Citigroup, Inc. |
2.1 | Corporate Debt – Financial & TLGP | ||||
| Bank of America Corp. |
1.5 | Corporate Debt – Banks | ||||
| The Bear Stearns Cos., LLC |
1.4 | Corporate Debt – Brokerage | ||||
| Province of Ontario |
1.3 | Foreign Government Obligations | ||||
| Brazos Higher Education Authority |
1.2 | Asset Backed Securities | ||||
| FIH Erhvervsbank A/S |
1.2 | Corporate Debt – Investment Company | ||||
Comparison of Change in Value of a $10,000 Investment in the SC Goldman Sachs Short Duration Fund – Initial Class and the BofA Merrill Lynch 1-3 Year U.S. Treasury Index
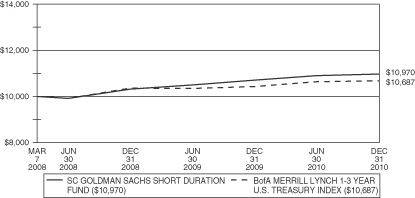
Comparison of Change in Value of a $10,000 Investment in the SC Goldman Sachs Short Duration Fund – Service Class and the BofA Merrill Lynch 1-3 Year U.S. Treasury Index
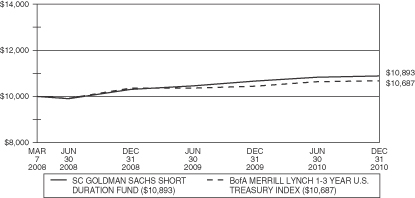
70
Table of Contents
SC GOLDMAN SACHS SHORT DURATION FUND (Continued)
Average Annual Total Returns for Periods Ended December 31, 2010**
| One Year | Life of Fund*** |
|||||||
| SC Goldman Sachs Short Duration Fund – Initial Class Shares |
2.41 | % | 3.33 | % | ||||
| SC Goldman Sachs Short Duration Fund – Service Class Shares |
2.16 | % | 3.08 | % | ||||
| BofA Merrill Lynch 1-3 Year U.S. Treasury Index* |
2.35 | % | 2.38 | % | ||||
*The performance data of the index has been prepared from sources and data that the investment adviser believes to be reliable, but no representation is made as to their accuracy. The index is unmanaged and cannot be invested in directly. The BofA Merrill Lynch 1-3 Year U.S. Treasury Index is a subset of the BofA Merrill Lynch U.S. Treasury Index including all securities with a remaining term to final maturity less than 3 years. The BofA Merrill Lynch U.S. Treasury Index tracks the performance of U.S. dollar denominated sovereign debt publicly issued by the U.S. government in its domestic market. Qualifying securities must have at least one year remaining term to final maturity, a fixed coupon schedule and a minimum amount outstanding of $1 billion.
**Performance data is historical and includes changes in share price and reinvestment of income dividends and capital gains distributions. Past performance does not indicate future results. All Fund returns are net of fees and expenses, but do not include any insurance charges imposed in connection with your variable insurance contract. If this performance information included the effect of the insurance charges and the fees and expenses assumed by the investment adviser, performance numbers would be lower. The value of an investment in the SC Goldman Sachs Short Duration Fund and the return on the investment will fluctuate and redemption proceeds may be higher or lower than an investor’s original cost.
***For the period from March 7, 2008 (commencement of operations) to December 31, 2010.
71
Table of Contents
(subadvised by Pacific Investment Management Company LLC)
MANAGEMENT’S DISCUSSION & ANALYSIS:
How did the Fund perform during the year ended December 31, 2010?
For the year ended December 31, 2010, the Initial and Service Class shares of SC PIMCO High Yield Fund (the “Fund”) returned 12.68% and 12.40%, respectively, underperforming the benchmark, the BofA Merrill Lynch BB-B U.S. High Yield Constrained Index (the “Index”), which returned 14.26% for the same period.
What economic and market factors most influenced the fixed income markets as a whole during the year ended December 31, 2010?
At the start of 2010, investors sought the relative safety of U.S. bonds amid concern about sovereign debt risk, especially in Greece and other peripheral Eurozone economies as growing budget shortfalls in Greece, Spain and Portugal raised fears that the region might derail the global economic recovery from the crisis that began in 2008. Policymakers wrestled with both the methods and proposed durations of stimulus programs designed to mitigate the global recession but which also threatened to undermine public finances and spur inflation. While the Federal Reserve Board (Fed) kept its main policy rate unchanged, it closed its $1.25 trillion Agency mortgage purchase program in March and also ended the subscription period for purchasing consumer asset-backed securities.
Policy initiatives that aimed to speed up the U.S. recovery and lower the persistently high unemployment rate were the major market drivers during the later part of the year. Utilizing monetary tools, the Fed continued its unconventional efforts to encourage faster growth, launching a second round of quantitative easing (U.S. Treasury Bond purchases) in November. These efforts coupled with the fiscal policy decisions in December by the Obama Administration and Congress where a major compromise was reached on tax policy that included a cut in payroll taxes, an extension of unemployment benefits and a tax credit for business capital expenditures gave a boost to riskier asset markets, despite their limited duration.
In the final months of 2010, most fixed income markets gave back some of their gains from earlier in the year as interest rates rose sharply and investors began to shift toward riskier assets. Signs of economic strength as well as market reaction to expanded fiscal and monetary stimulus drove the yield on the benchmark 10-year U.S. Treasury up 78 basis points during the fourth quarter to close the year at 3.30%. Additionally, the Treasury yield curve steepened during the year as the Fed kept short term yields anchored at low levels.
What key strategies were most responsible for the Fund’s performance during the year ended December 31, 2010?
The following strategies contributed to performance for the year:
| • | Security selection in the Consumer Cyclical sector, where automotive bonds outperformed the broader category, enhanced relative returns. |
| • | An overweight to the Financials sector helped performance, as banking and insurance names were among the top performers for the year. |
| • | An underweight to Consumer Non-cyclicals added to performance, as these defensive companies fell short of the broader Index returns. |
The following strategies detracted from performance for the year:
| • | An allocation to Investment Grade bonds detracted from the Fund’s performance, as investment grade fixed income underperformed the high yield market. |
| • | Security selection within the Financials sector detracted from the Fund’s performance as high grade banks underperformed high yield banks. |
72
Table of Contents
SC PIMCO HIGH YIELD FUND (Continued)
| • | Security selection in the Media sector detracted from performance, as broadcasting bonds outperformed cable issuers. |
What changes did you make to the Fund’s sector allocations during the year ended December 31, 2010 and how did these affect performance during the reporting period?
During 2010, one of the main themes for the Fund was its increased exposure to high yield corporate bonds while reducing its exposure to mortgages, investment grade corporate bonds, and emerging markets. This shift to a higher risk asset mix has helped the Fund’s performance as the high yield sector outperformed U.S. Treasuries, mortgages, emerging market bonds and investment grade bonds. This outperformance was due to improving corporate earnings as global growth began to show signs of improvement which led to increased appetite for risk.
Did the Fund experience major changes to its top ten issuers during the year ended December 31, 2010?
There were five issuers on the top ten issuers list as of December 31, 2009 that were still on the Fund’s top ten issuers list as of December 31, 2010. The U.S. Government was a new issuer and three of the remaining four new issuers were financial services companies CIT Group, Inc., Ally Financial, Inc. and International Lease Finance Corp. Within the Telecommunications sector, the Fund reduced its exposure to those issuers which had appreciated above their fare value. The new Telecommunications issuer Sprint Nextel Corp. moved into the top ten issuers list and is positioned to benefit from accelerating global growth expectations and increased demand from key markets.
These changes were implemented due to the conviction that certain financial institutions are likely to be supported by attractive structural characteristics which include a steep yield curve, stronger balance sheets, and an improved U.S. cyclical outlook. Additionally, the U.S. Government joined the list of top-ten issuers as this exposure is representative of the Fund’s shift to more risk-averse investments.
How was the Fund positioned relative to its benchmark index at December 31, 2010?
At the end of the year, the Fund was positioned with a slight underweight to duration coupled with a slight bias towards a flattening yield curve. The three largest sector overweights (ex-U.S. Treasuries) held by the Fund as of December 31, 2010, were Sovereign, non-agency mortgages, and life insurance issues. The three largest sector underweights by the Fund at the end of the year were to the Retail, Paper Products, and Home Construction corporate debt sectors.
73
Table of Contents
SC PIMCO HIGH YIELD FUND (Continued)
PORTFOLIO COMPOSITION AT DECEMBER 31, 2010*
Percentage of Net Assets
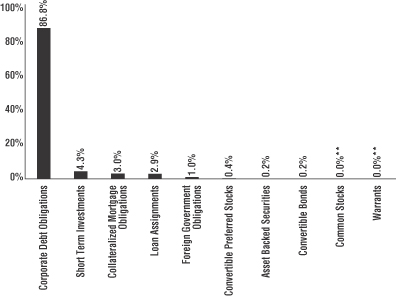
| * | The percentages shown for each investment category reflect the value of investments in that category as a percentage of net assets. Figures in the above graph may not total to 100% due to the exclusion of the Fund’s other assets and liabilities. |
| ** | Amount is less than 0.05%. |
TOP TEN ISSUERS AT DECEMBER 31, 2010
| % of Net Assets | Category | |||||
| U.S. Treasury |
3.8 | % | U.S. Treasury | |||
| Ford Motor Credit Co. LLC |
2.9 | Corporate Debt – Automotive | ||||
| HCA, Inc. |
2.7 | Corporate Debt – Health Care | ||||
| American International Group, Inc. |
2.2 | Corporate Debt – Insurance | ||||
| CIT Group, Inc. |
2.2 | Corporate Debt – Financials | ||||
| Ally Financial, Inc. |
2.1 | Corporate Debt – Banks | ||||
| Biomet, Inc. |
1.8 | Corporate Debt – Health Care – Facilities | ||||
| Sprint Nextel Corp. |
1.7 | Corporate Debt – Telecommunications | ||||
| Chesapeake Energy Corp. |
1.6 | Corporate Debt – Refining | ||||
| International Lease Finance Corp. |
1.5 | Corporate Debt – Financials | ||||
74
Table of Contents
SC PIMCO HIGH YIELD FUND (Continued)
Comparison of Change in Value of a $10,000 Investment in the SC PIMCO High Yield Fund – Initial Class and the BofA Merrill Lynch BB-B U.S. High Yield Constrained Index
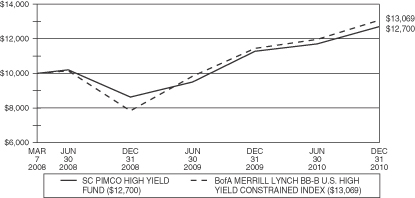
Comparison of Change in Value of a $10,000 Investment in the SC PIMCO High Yield Fund – Service Class and the BofA Merrill Lynch BB-B U.S. High Yield Constrained Index
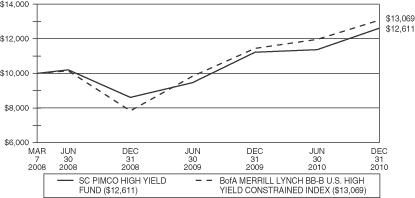
75
Table of Contents
SC PIMCO HIGH YIELD FUND (Continued)
Average Annual Total Returns for Periods Ended December 31, 2010**
| One Year | Life of Fund*** |
|||||||
| SC PIMCO High Yield Fund – Initial Class Shares |
12.68 | % | 8.84 | % | ||||
| SC PIMCO High Yield Fund – Service Class Shares |
12.40 | % | 8.57 | % | ||||
| BofA Merrill Lynch BB-B U.S. High Yield Constrained Index* |
14.26 | % | 9.96 | % | ||||
*The performance data of the index has been prepared from sources and data that the investment adviser believes to be reliable, but no representation is made as to their accuracy. The index is unmanaged and cannot be invested in directly. The BofA Merrill Lynch BB-B U.S. High Yield Constrained Index contains all securities in the BofA Merrill Lynch U.S. High Yield Index rated BB1 through B3, based on an average of Moody’s, S&P and Fitch, but caps issuer exposure at 2%. Index constituents are capitalization-weighted, based on their current amount outstanding, provided the total allocation to an individual issuer does not exceed 2%.
**Performance data is historical and includes changes in share price and reinvestment of income dividends and capital gains distributions. Past performance does not indicate future results. All Fund returns are net of fees and expenses, but do not include any insurance charges imposed in connection with your variable insurance contract. If this performance information included the effect of the insurance charges and the fees and expenses assumed by the investment adviser, performance numbers would be lower. The value of an investment in the SC PIMCO High Yield Fund and the return on the investment will fluctuate and redemption proceeds may be higher or lower than an investor’s original cost.
***For the period from March 7, 2008 (commencement of operations) to December 31, 2010.
76
Table of Contents
(subadvised by Pacific Investment Management Company LLC)
MANAGEMENT’S DISCUSSION & ANALYSIS:
How did the Fund perform during the year ended December 31, 2010?
For the year ended December 31, 2010, the Initial and Service Class shares of SC PIMCO Total Return Fund (the “Fund”) returned 7.53% and 7.27%, respectively, outperforming the benchmark, the Barclays Capital U.S. Aggregate Bond Index (the “Index”), which returned 6.54% for the same period
What economic and market factors most influenced the fixed income markets as a whole during the year ended December 31, 2010?
At the start of 2010, investors sought the relative safety of U.S. bonds amid concern about sovereign debt risk, especially in Greece and other peripheral Eurozone economies as growing budget shortfalls in Greece, Spain and Portugal raised fears that the region might derail the global economic recovery from the crisis that began in 2008. Policymakers wrestled with both the methods and proposed durations of stimulus programs designed to mitigate the global recession but which threatened to undermine public finances or encourage inflation. While the Federal Reserve Board (Fed) kept its main policy rate unchanged, it concluded its $1.25 trillion Agency mortgage purchase program in March and also ended the subscription period for purchasing consumer asset-backed securities.
Policy initiatives that aimed to speed up the U.S. recovery and lower the persistently high unemployment rate were the major market drivers during the later part of the year. Utilizing monetary tools, the Fed continued its unconventional efforts to encourage faster growth, launching a second round of quantitative easing (U.S. Treasury Bond purchases) in November. These efforts coupled with the fiscal policy decisions in December by the Obama Administration and Congress where a major compromise was reached on tax policy that included a cut in payroll taxes, an extension of unemployment benefits and a tax credit for business capital expenditures gave a boost to riskier asset markets, despite their limited duration.
In the final months of 2010, most fixed income markets gave back some of their gains from earlier in the year as interest rates rose sharply and investors began to shift toward riskier assets. Signs of economic strength as well as market reaction to expanded fiscal and monetary stimulus drove the yield on the benchmark 10-year U.S. Treasury up 78 basis points during the fourth quarter to close the year at 3.30%. Additionally, the Treasury yield curve steepened during the year as the Fed kept short-term yields anchored at low levels.
What key strategies were most responsible for the Fund’s performance during the year ended December 31, 2010?
The following strategies contributed to performance for the year:
| • | Tactical duration positioning within the U.S. was positive for the Fund’s performance as rates fell after a volatile year in yields. |
| • | An overweight to emerging markets, with an emphasis on local rates in Brazil, added to performance as rates declined in the country. |
The following strategies detracted from performance for the year:
| • | An underweight to Investment-Grade corporate securities detracted from performance as this sector outperformed similar-duration U.S. Treasuries as corporate credit fundamentals improved; however, a focus on the Financials sector more than offset this negative contribution. |
| • | A modest exposure to Build America Bonds (BAB’s) detracted from the Fund’s performance as taxable municipal bond issues supply spiked amid the rush by local governments to tap the Federal Government subsidy before it expired at the end of the year. |
77
Table of Contents
SC PIMCO TOTAL RETURN FUND (Continued)
What changes did you make to the Fund’s sector allocations during the year ended December 31, 2010 and how did these affect performance during the reporting period?
During the year ended December 31, 2010, the Fund increased its exposure to the longer-than-index U.S. duration via U.S. Treasuries. This increase in the Fund’s Treasury holdings was positive for performance as interest rates fell in the U.S. The Fund continued to increase its exposure to Agency mortgages, particularly in the last quarter of 2010 with the expectation for them to be an important source of high quality yield for the Fund. The Fund is targeting an overweight allocation to agency mortgages, to take advantage of relative value opportunities across mortgage coupons. This increased exposure to agency mortgages had a positive impact on returns as this sector outperformed like-duration U.S. Treasuries. Additionally, the Fund has increased its exposure to emerging markets and high yield issues. This increased exposure was positive for returns as these sectors outperformed like-duration U.S. Treasuries. Finally, as noted earlier, the Fund’s investments in Build America Bonds during the middle to late 2010 detracted from returns as taxable municipal supply spiked amid the rush by local governments to tap the Federal Government subsidy before it expired at the end of 2010.
Did the Fund experience major changes to its top ten issuers during the year ended December 31, 2010?
There were no material changes to the December 31, 2010 top ten issuers list relative to the December 31, 2009 top ten issuers list. The issuers which are no longer on the top ten issuer list when compared to the December 31, 2009 top ten issuer list were still held by the Fund as of December 31, 2010. The Fund made a number of tactical shifts during the year, with the end-of-year positioning targeting flat to slightly overweight duration. The duration-weighted exposure of U.S. Government-issued securities as a percentage of the Fund declined over the year. However, as discussed above, the increased allocation to U.S. Treasuries within the December 31, 2010 top ten issuers list was due to the Fund’s increased focus on longer-than-index duration.
How was the Fund positioned relative to its benchmark index at December 31, 2010?
The Fund ended the year with a moderate overweight to duration and a bias towards a steepening yield curve. The Fund was underweight mortgages and Investment Grade credit, however, within the Investment Grade credit allocation, the Fund was overweight in the Banks/Financials sector. The Fund’s emerging markets allocation was also overweight relative to the Index as of December 31, 2010.
The intent of the Fund’s allocation is to tactically reduce U.S. duration exposure, seeking to maintain a flat to slightly overweight duration overall. The Fund is positioned to focus on high quality income producing strategies.
78
Table of Contents
SC PIMCO TOTAL RETURN FUND (Continued)
PORTFOLIO COMPOSITION AT DECEMBER 31, 2010*
Percentage of Net Assets
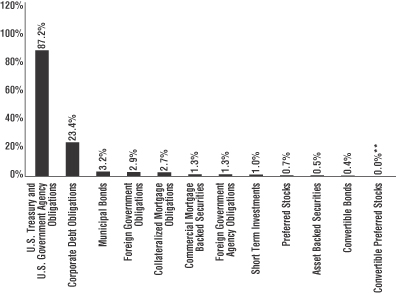
| * | The percentages shown for each investment category reflect the value of investments in that category as a percentage of net assets. Figures in the above graph may not total to 100% due to the exclusion of the Fund’s other assets and liabilities. |
| ** | Amount is less than 0.05%. |
TOP TEN ISSUERS AT DECEMBER 31, 2010
| % of Net Assets | Category | |||||
| U.S. Treasury |
42.5 | % | U.S. Treasury | |||
| Federal National Mortgage Association |
38.9 | U.S. Government Agency | ||||
| Federal Home Loan Mortgage Corp. |
3.6 | U.S. Government Agency | ||||
| Government National Mortgage Association |
2.6 | U.S. Government Agency | ||||
| Province of Ontario |
2.0 | Foreign Government | ||||
| Citigroup, Inc. |
2.0 | Corporate Debt – Financials & TLGP | ||||
| Royal Bank of Scotland Group PLC |
1.7 | Corporate Debt – Financials | ||||
| International Lease Finance Corp. |
1.3 | Corporate Debt – Financials | ||||
| The Goldman Sachs Group, Inc. |
1.3 | Corporate Debt – Financials | ||||
| Arkle Master Issuer PLC |
1.2 | Collaterized Mortgage Obligations | ||||
79
Table of Contents
SC PIMCO TOTAL RETURN FUND (Continued)
Comparison of Change in Value of a $10,000 Investment in the SC PIMCO Total Return Fund – Initial Class and the Barclays Capital U.S. Aggregate Bond Index
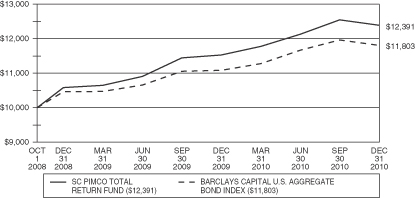
Comparison of Change in Value of a $10,000 Investment in the SC PIMCO Total Return Fund – Service Class and the Barclays Capital U.S. Aggregate Bond Index
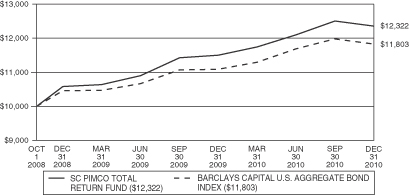
80
Table of Contents
SC PIMCO TOTAL RETURN FUND (Continued)
Average Annual Total Returns for Periods Ended December 31, 2010**
| One Year | Life of Fund*** |
|||||||
| SC PIMCO Total Return Fund-Initial Class Shares |
7.53 | % | 9.99 | % | ||||
| SC PIMCO Total Return Fund-Service Class Shares |
7.27 | % | 9.72 | % | ||||
| Barclays Capital U.S. Aggregate Bond Index* |
6.54 | % | 7.64 | % | ||||
*The performance data of the index has been prepared from sources and data that the investment adviser believes to be reliable, but no representation is made as to their accuracy. The index is unmanaged and cannot be invested in directly. The Barclays Capital U.S. Aggregate Bond Index is composed of U.S. securities in Treasury, Government-Related, Corporate, and Securitized sectors.
**Performance data is historical and includes changes in share price and reinvestment of income dividends and capital gains distributions. Past performance does not indicate future results. All Fund returns are net of fees and expenses, but do not include any insurance charges imposed in connection with your variable insurance contract. If this performance information included the effect of the insurance charges and the fees and expenses assumed by the investment adviser, performance numbers would be lower. The value of an investment in the SC PIMCO Total Return Fund and the return on the investment will fluctuate and redemption proceeds may be higher or lower than an investor’s original cost.
***For the period from October 1, 2008 (commencement of operations) to December 31, 2010.
81
Table of Contents
SC IBBOTSON BALANCED, CONSERVATIVE AND GROWTH FUND
(subadvised by Ibbotson Associates, Inc.)
MANAGEMENT’S DISCUSSION & ANALYSIS:
How did the Funds perform during the year ended December 31, 2010?
For the year ended December 31, 2010, the Initial and Service Class shares of SC Ibbotson Balanced Fund (the “Balanced Fund”) returned 12.18% and 11.82%, respectively, underperforming the benchmark, the Dow Jones Moderate U.S. Relative Risk Portfolio Index (the “Index”), which returned 15.23% for the same period.
For the year ended December 31, 2010, the Initial and Service Class shares of SC Ibbotson Conservative Fund (the “Conservative Fund”) returned 9.92% and 9.64%, respectively, underperforming the benchmark, the Dow Jones Moderately Conservative U.S. Relative Risk Portfolio Index (the “Index”), which returned 11.86% for the same period.
For the year ended December 31, 2010, the Initial and Service Class shares of SC Ibbotson Growth Fund (the “Growth Fund”) returned 13.80% and 13.61%, respectively, underperforming the benchmark, the Dow Jones Moderately Aggressive U.S. Relative Risk Portfolio Index (the “Index”), which returned 18.31% for the same period.
What key economic and market factors most influenced management’s tactical asset allocation strategy for the Ibbotson Balanced, Conservative, and Growth Funds (the “Funds”) during the year ended December 31, 2010?
Throughout most of the year, the Funds were positioned defensively due to macroeconomic and equity market valuation concerns. Dramatic swings in market sentiment occurred throughout the year. After trending upward in the first quarter, the equity market (represented by the S&P 500 Index) fell by over 11% following a series of bad economic data releases in the second quarter. The last four months of the year delivered over a 19% gain as fears of a second economic downturn or a “double-dip” recession abated.
At the end of December, the Ibbotson Investment Policy Committee (IPC) decided to remove the overweight of U.S. bonds versus U.S. equities, in effect since March of 2010. The likelihood of bonds outperforming stocks over the near term diminished as business conditions appear to have improved. Earnings growth of the S&P 500 was strong during 2010, exceeding the consensus forecast. Current price to earnings ratios (both trailing and forward-looking) stand at moderate to low levels, relative to the levels seen over the last 20 years. Finally, U.S. government debt yields are near historical lows and a rise in long-term yields would undermine the performance of debt relative to equities.
The Funds also removed their overweight positions of U.S. large-cap equities versus U.S. small-cap equities as the scenario of an additional economic slowdown became less likely. The overweight was implemented in November of 2009 and augmented in June of 2010.
What changes did you make to the Funds’ allocations during the reporting period and how did it affect performance during the year ended December 31, 2010?
As mentioned previously, at the end of December, the IPC decided to remove the overweight of U.S. bonds versus U.S. equities, leaving the equity-bond mix in a neutral position. The SC PIMCO Total Return and Sun Capital Investment Grade Bond Funds’ target allocations were mainly affected by these tactical reductions. The decreased emphasis on large cap equities compared to small cap equities resulted in the increase in holdings of the SC Columbia Small Cap Value and the SC BlackRock Small Cap Index Fund in the Growth Fund.
In November, the Funds also initiated positions in the SC Ibbotson Tactical Opportunities Fund, a rules-based tactical asset allocation fund of Exchange Traded Funds, accomplished by reducing exposure to the majority of
82
Table of Contents
SC IBBOTSON BALANCED, CONSERVATIVE AND GROWTH FUND (Continued)
the existing underlying equity funds in each of the Balanced Fund, Conservative Fund and Growth Fund. The Funds also replaced the MFS Research International Fund with the SC Blackrock International Index Fund.
Across all Funds, the dynamic asset allocation overweight of bonds was the main driver of the tactical asset allocation contributing positively in the first half of the year but, in the end, detracting from year-end performance relative to the strategic targets.
What key factors were responsible for the Funds’ performance during the year ended December 31, 2010?
The strong U.S. equity market rally, particularly in the fourth quarter of 2010, helped boost the Funds’ performance into double-digit or near double-digit returns for the year. Among asset classes, U.S. equities strongly outperformed non-U.S. developed equities in 2010, and small- and mid-cap equities outperformed large cap equities. The Balanced, Conservative and Growth Funds benefitted from their strategic exposures to global REITs, small- and mid-cap equities. Also, diversification into high yields bonds and Treasury Inflation Protected Securities helped enhance performance relative to a basic, blended benchmark of the S&P 500 and Barclays Capital U.S. Aggregate bond indices.
Across all Funds, the tactical asset allocation strategy to overweight bonds and underweight equities detracted from year-end performance due to the equity markets’ strong rally during the second half of the year. Finally, in both equity and fixed income asset classes, underlying fund-level performance detracted from overall performance relative to a weighted-average of indices representing the targeted asset class exposure across all Funds. The MFS Value, SC WMC Blue Chip Mid Cap, SC PIMCO High Yield, SC Columbia Small Cap Value, and SC Goldman Sachs Mid Cap Value Funds experienced the largest underperformance relative to the asset class benchmarks or their respective benchmarks while still contributing to overall Fund performance.
Which underlying funds were the most significant contributors/detractors to the Funds’ performance for the year ended December 31, 2010?
Balanced Fund
The SC WMC Large Cap Growth, SC Ibbotson Tactical Opportunities, SC Goldman Sachs Mid Cap Value, MFS Value and MFS International Growth Funds were the most significant contributors to performance. There were no detractors to performance since all funds achieved positive returns for the year.
Conservative Fund
The SC Goldman Sachs Mid Cap Value, SC PIMCO Total Return, SC WMC Large Cap Growth, Sun Capital Investment Grade Bond and SC BlackRock Inflation Protected Bond Funds were the most significant contributors to performance. There were no detractors to performance since all funds achieved positive returns for the year.
Growth Fund
The SC WMC Large Cap Growth, SC Ibbotson Tactical Opportunities, SC Davis Venture Value, MFS International Growth and MFS Value Funds were the most significant contributors to performance. There were no detractors to performance since all funds achieved positive returns for the year.
83
Table of Contents
PORTFOLIO COMPOSITION AT DECEMBER 31, 2010*
Percentage of Net Assets
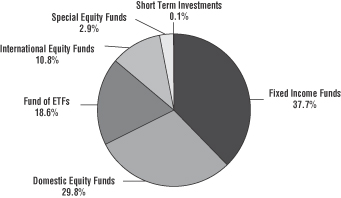
| * | The percentages shown for each investment category reflect the value of investments in that category as a percentage of net assets. Figures in the above graph may not total to 100% due to the exclusion of the Fund’s other assets and liabilities. |
TOP TEN INVESTMENT COMPANIES AT DECEMBER 31, 2010
| % of Net Assets | Category | |||||
| SC Ibbotson Tactical Opportunities Fund |
18.6 | % | Fund of ETFs | |||
| SC Goldman Sachs Short Duration Fund |
10.5 | Fixed Income | ||||
| SC PIMCO Total Return Fund |
9.3 | Fixed Income | ||||
| Sun Capital Investment Grade Bond Fund |
7.4 | Fixed Income | ||||
| SC BlackRock Inflation Protected Bond Fund |
6.7 | Fixed Income | ||||
| MFS Value Portfolio |
5.5 | Domestic Equity | ||||
| SC WMC Large Cap Growth Fund |
4.6 | Domestic Equity | ||||
| SC Goldman Sachs Mid Cap Value Fund |
4.5 | Domestic Equity | ||||
| SC Davis Venture Value Fund |
4.4 | Domestic Equity | ||||
| MFS International Growth Portfolio |
4.4 | International Equity | ||||
84
Table of Contents
SC IBBOTSON BALANCED FUND (Continued)
Comparison of Change in Value of a $10,000 Investment in the SC Ibbotson Balanced Fund – Initial Class and the Dow Jones Moderate U.S. Relative Risk Portfolio Index
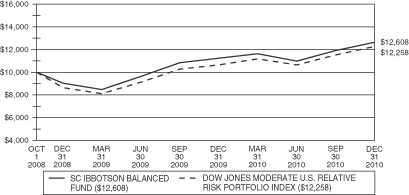
Comparison of Change in Value of a $10,000 Investment in the SC Ibbotson Balanced Fund – Service Class and the Dow Jones Moderate U.S. Relative Risk Portfolio Index

85
Table of Contents
SC IBBOTSON BALANCED FUND (Continued)
Average Annual Total Returns for Periods Ended December 31, 2010**
| One Year | Life of Fund*** |
|||||||
| SC Ibbotson Balanced Fund-Initial Class Shares |
12.18 | % | 10.84 | % | ||||
| SC Ibbotson Balanced Fund-Service Class Shares |
11.82 | % | 10.52 | % | ||||
| Dow Jones Moderate U.S. Relative Risk Portfolio Index* |
15.23 | % | 9.47 | % | ||||
*The performance data of the index has been prepared from sources and data that the investment adviser believes to be reliable, but no representation is made as to their accuracy. The index is unmanaged and cannot be invested in directly. The Dow Jones Relative Risk Indices measure the performance of conservative, moderate and aggressive portfolios based on incremental levels of potential risk. The indices are designed to systematically measure various levels of risk relative to the risk of a U.S. all-stock index. The Dow Jones Moderate U.S. Relative Risk Portfolio Index consists of 60% equities and 40% fixed income.
**Performance data is historical and includes changes in share price and reinvestment of income dividends and capital gains distributions. Past performance does not indicate future results. All Fund returns are net of fees and expenses, but do not include any insurance charges imposed in connection with your variable insurance contract. If this performance information included the effect of the insurance charges and the fees and expenses assumed by the investment adviser, performance numbers would be lower. The value of an investment in the SC Ibbotson Balanced Fund and the return on the investment will fluctuate and redemption proceeds may be higher or lower than an investor’s original cost.
***For the period from October 1, 2008 (commencement of operations) to December 31, 2010.
86
Table of Contents
PORTFOLIO COMPOSITION AT DECEMBER 31, 2010*
Percentage of Net Assets
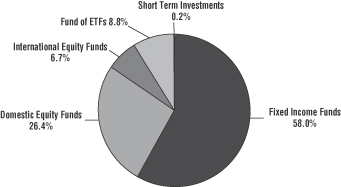
| * | The percentages shown for each investment category reflect the value of investments in that category as a percentage of net assets. Figures in the above graph may not total to 100% due to the exclusion of the Fund’s other assets and liabilities. |
TOP TEN INVESTMENT COMPANIES AT DECEMBER 31, 2010
| % of Net Assets | Category | |||||
| SC Goldman Sachs Short Duration Fund |
18.5 | % | Fixed Income | |||
| SC BlackRock Inflation Protected Bond Fund |
12.6 | Fixed Income | ||||
| SC PIMCO Total Return Fund |
11.0 | Fixed Income | ||||
| Sun Capital Investment Grade Bond Fund |
10.9 | Fixed Income | ||||
| SC Ibbotson Tactical Opportunities Fund |
8.8 | Fund of ETFs | ||||
| SC PIMCO High Yield Fund |
5.0 | Fixed Income | ||||
| MFS Value Portfolio |
4.8 | Domestic Equity | ||||
| SC Goldman Sachs Mid Cap Value Fund |
4.5 | Domestic Equity | ||||
| SC WMC Large Cap Growth Fund |
4.3 | Domestic Equity | ||||
| MFS International Growth Portfolio |
3.3 | International Equity | ||||
87
Table of Contents
SC IBBOTSON CONSERVATIVE FUND (Continued)
Comparison of Change in Value of a $10,000 Investment in the SC Ibbotson Conservative Fund – Initial Class and the Dow Jones Moderately Conservative U.S. Relative Risk Portfolio Index
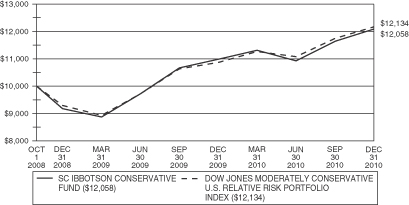
Comparison of Change in Value of a $10,000 Investment in the SC Ibbotson Conservative Fund – Service Class and the Dow Jones Moderately Conservative U.S. Relative Risk Portfolio Index
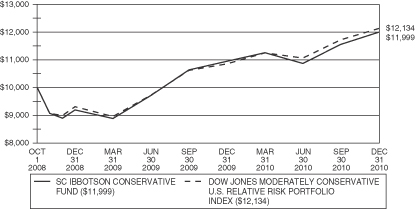
88
Table of Contents
SC IBBOTSON CONSERVATIVE FUND (Continued)
Average Annual Total Returns for Periods Ended December 31, 2010**
| One Year | Life of Fund*** |
|||||||
| SC Ibbotson Conservative Fund-Initial Class Shares |
9.92 | % | 8.67 | % | ||||
| SC Ibbotson Conservative Fund-Service Class Shares |
9.64 | % | 8.43 | % | ||||
| Dow Jones Moderately Conservative U.S. Relative Risk Portfolio Index* |
11.86 | % | 8.98 | % | ||||
*The performance data of the index has been prepared from sources and data that the investment adviser believes to be reliable, but no representation is made as to their accuracy. The index is unmanaged and cannot be invested in directly. The Dow Jones Relative Risk Indices measure the performance of conservative, moderate and aggressive portfolios based on incremental levels of potential risk. The indices are designed to systematically measure various levels of risk relative to the risk of a U.S. all-stock index. The Dow Jones Moderately Conservative U.S. Relative Risk Portfolio Index consists of 40% equities and 60% fixed income.
**Performance data is historical and includes changes in share price and reinvestment of income dividends and capital gains distributions. Past performance does not indicate future results. All Fund returns are net of fees and expenses, but do not include any insurance charges imposed in connection with your variable insurance contract. If this performance information included the effect of the insurance charges and the fees and expenses assumed by the investment adviser, performance numbers would be lower. The value of an investment in the SC Ibbotson Conservative Fund and the return on the investment will fluctuate and redemption proceeds may be higher or lower than an investor’s original cost.
***For the period from October 1, 2008 (commencement of operations) to December 31, 2010.
89
Table of Contents
PORTFOLIO COMPOSITION AT DECEMBER 31, 2010*
Percentage of Net Assets
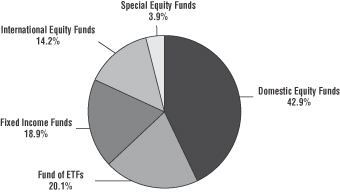
| * | The percentages shown for each investment category reflect the value of investments in that category as a percentage of net assets. Figures in the above graph may not total to 100% due to the exclusion of the Fund’s other assets and liabilities. |
TOP TEN INVESTMENT COMPANIES AT DECEMBER 31, 2010
| % of Net Assets | Category | |||||
| SC Ibbotson Tactical Opportunities Fund |
20.1 | % | Fund of ETFs | |||
| SC PIMCO Total Return Fund |
8.5 | Fixed Income | ||||
| SC Davis Venture Value Fund |
8.0 | Domestic Equity | ||||
| MFS Value Portfolio |
7.5 | Domestic Equity | ||||
| SC WMC Large Cap Growth Fund |
7.1 | Domestic Equity | ||||
| MFS International Growth Portfolio |
6.1 | International Equity | ||||
| SC Goldman Sachs Mid Cap Value Fund |
4.6 | Domestic Equity | ||||
| Sun Capital Investment Grade Bond Fund |
4.6 | Fixed Income | ||||
| SC Lord Abbett Growth & Income Fund |
4.1 | Domestic Equity | ||||
| SC BlackRock Large Cap Index Fund |
4.0 | Domestic Equity | ||||
90
Table of Contents
SC IBBOTSON GROWTH FUND (Continued)
Comparison of Change in Value of a $10,000 Investment in the SC Ibbotson Growth Fund – Initial Class and the Dow Jones Moderately Aggressive U.S. Relative Risk Portfolio Index
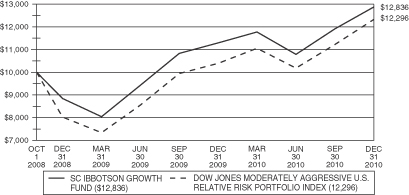
Comparison of Change in Value of a $10,000 Investment in the SC Ibbotson Growth Fund – Service Class and the Dow Jones Moderately Aggressive U.S. Relative Risk Portfolio Index
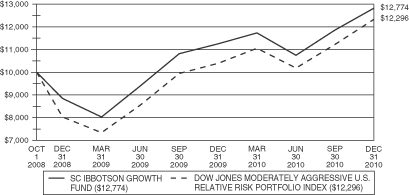
91
Table of Contents
SC IBBOTSON GROWTH FUND (Continued)
Average Annual Total Returns for Periods Ended December 31, 2010**
| One Year | Life of Fund*** |
|||||||
| SC Ibbotson Growth Fund-Initial Class Shares |
13.80 | % | 11.73 | % | ||||
| SC Ibbotson Growth Fund-Service Class Shares |
13.61 | % | 11.48 | % | ||||
| Dow Jones Moderately Aggressive U.S. Relative Risk Portfolio Index* |
18.31 | % | 9.62 | % | ||||
*The performance data of the index has been prepared from sources and data that the investment adviser believes to be reliable, but no representation is made as to their accuracy. The index is unmanaged and cannot be invested in directly. The Dow Jones Relative Risk Indices measure the performance of conservative, moderate and aggressive portfolios based on incremental levels of potential risk. The indices are designed to systematically measure various levels of risk relative to the risk of a U.S. all-stock index. The Dow Jones Moderately Aggressive U.S. Relative Risk Portfolio Index consists of 80% equities and 20% fixed income.
**Performance data is historical and includes changes in share price and reinvestment of income dividends and capital gains distributions. Past performance does not indicate future results. All Fund returns are net of fees and expenses, but do not include any insurance charges imposed in connection with your variable insurance contract. If this performance information included the effect of the insurance charges and the fees and expenses assumed by the investment adviser, performance numbers would be lower. The value of an investment in the SC Ibbotson Growth Fund and the return on the investment will fluctuate and redemption proceeds may be higher or lower than an investor’s original cost.
***For the period from October 1, 2008 (commencement of operations) to December 31, 2010.
92
Table of Contents
December 31, 2010 (Unaudited)
Information About Your Fund’s Expenses
All mutual funds incur ongoing operating expenses, including management fees and administrative services, among others. The following table is intended to increase your understanding of the ongoing costs of investing in each Fund. The following example is based on the investment of $1,000 at the beginning of the period and held for the entire period, July 1, 2010 to December 31, 2010. Expense information does not include any insurance charges imposed in connection with your variable insurance contract.
Actual Expenses: The table below provides information about actual account values and actual expenses. You may use the actual account values and actual expense information below, together with the amount you invested, to estimate the expenses you paid over the period. To do so, simply divide your account value by $1,000 (for example, an $8,600 account value divided by $1,000 = 8.6), then multiply the result by the number given for your Fund under the heading “Actual Expenses Paid During Period”. In addition, SC Ibbotson Tactical Opportunities Fund, SC Ibbotson Balanced Fund, SC Ibbotson Conservative Fund and SC Ibbotson Growth Fund, as shareholders in underlying funds, indirectly bear a pro rata share of the fees and expenses incurred by the underlying funds. These fees and expenses are not included in the annualized expense ratios used to calculate the “Net Expense Ratio During Period” for the Funds.
Hypothetical (5% annual return before expenses): The table below also provides information about hypothetical account values and hypothetical expenses for comparison purposes. The hypothetical account values and hypothetical expenses are based on each Fund’s actual expense ratio and an assumed rate of return of 5% per year before expenses, which is not the actual return of the Fund. The hypothetical account values and expenses may not be used to estimate the actual ending account balance or expenses you paid for the period. However, you may use this information to compare the ongoing costs of investing in the Funds with the hypothetical examples that appear in the shareholder reports of other mutual funds. In addition, SC Ibbotson Tactical Opportunities Fund, SC Ibbotson Balanced Fund, SC Ibbotson Conservative Fund and SC Ibbotson Growth Fund, as shareholders in underlying funds, indirectly bear a pro rata share of the fees and expenses incurred by the underlying funds. These fees and expenses are not included in the annualized expense ratios used to calculate the “Net Expense Ratio During Period” for the Funds.
Expense Information
| Beginning Account Value 7/1/10 |
Actual Ending Account Value 12/31/10 |
Hypothetical Ending Account Value 12/31/10 |
Actual Expenses Paid During Period* |
Hypothetical Expenses Paid During Period* |
Net Expense Ratio During Period |
|||||||||||||||||||
| SC AllianceBernstein International Value Fund |
||||||||||||||||||||||||
| Initial Class |
$ | 1,000.00 | $ | 1,248.30 | $ | 1,021.42 | $ | 4.25 | $ | 3.82 | 0.75 | % | ||||||||||||
| Service Class |
1,000.00 | 1,247.40 | 1,020.16 | 5.66 | 5.09 | 1.00 | ||||||||||||||||||
| SC BlackRock International Index Fund |
||||||||||||||||||||||||
| Initial Class |
1,000.00 | 1,038.00 | 1,005.67 | 0.79 | ** | 0.77 | ** | 0.60 | ||||||||||||||||
| Service Class |
1,000.00 | 1,037.00 | 1,005.34 | 1.11 | ** | 1.10 | ** | 0.85 | ||||||||||||||||
| SC BlackRock Large Cap Index Fund |
||||||||||||||||||||||||
| Initial Class |
1,000.00 | 1,225.50 | 1,021.07 | 4.60 | 4.18 | 0.82 | ||||||||||||||||||
| Service Class |
1,000.00 | 1,225.40 | 1,019.96 | 5.83 | 5.30 | 1.04 | ||||||||||||||||||
| SC BlackRock Small Cap Index Fund |
||||||||||||||||||||||||
| Initial Class |
1,000.00 | 1,262.50 | 1,020.67 | 5.13 | 4.58 | 0.90 | ||||||||||||||||||
| Service Class |
1,000.00 | 1,260.00 | 1,019.46 | 6.49 | 5.80 | 1.14 | ||||||||||||||||||
| * | For each class of the Fund, expenses are equal to the six-month annualized expense ratio for the class, multiplied by the average account value over the period, multiplied by 184/365 to reflect the most recent six-month period. |
| ** | The SC BlackRock International Index Fund and SC Ibbotson Tactical Opportunities Fund commenced operations on November 15, 2010. For each class of the SC BlackRock International Index Fund and Initial Class of SC Ibbotson Tactical Opportunities Fund, actual expenses are equal to the actual expenses incurred by each class from commencement of operations through December 31, 2010. Hypothetical expenses for each class are equal to the annualized expense ratio for the class, multiplied by the average account value over the period, multiplied by 47/365 to reflect the period from commencement. |
93
Table of Contents
EXPENSE INFORMATION
December 31, 2010 (Unaudited) (Continued)
| Beginning Account Value 7/1/10 |
Actual Ending Account Value 12/31/10 |
Hypothetical Ending Account Value 12/31/10 |
Actual Expenses Paid During Period* |
Hypothetical Expenses Paid During Period* |
Net Expense Ratio During Period |
|||||||||||||||||||
| SC Goldman Sachs Mid Cap Value Fund |
||||||||||||||||||||||||
| Initial Class |
$ | 1,000.00 | $ | 1,236.90 | $ | 1,019.86 | $ | 5.98 | $ | 5.40 | 1.06 | % | ||||||||||||
| Service Class |
1,000.00 | 1,234.90 | 1,018.60 | 7.38 | 6.67 | 1.31 | ||||||||||||||||||
| SC Columbia Small Cap Value Fund |
||||||||||||||||||||||||
| Initial Class |
1,000.00 | 1,266.50 | 1,019.41 | 6.57 | 5.85 | 1.15 | ||||||||||||||||||
| Service Class |
1,000.00 | 1,264.80 | 1,018.15 | 7.99 | 7.12 | 1.40 | ||||||||||||||||||
| SC Davis Venture Value Fund |
||||||||||||||||||||||||
| Initial Class |
1,000.00 | 1,216.40 | 1,020.87 | 4.80 | 4.38 | 0.86 | ||||||||||||||||||
| Service Class |
1,000.00 | 1,215.20 | 1,019.61 | 6.20 | 5.65 | 1.11 | ||||||||||||||||||
| SC Invesco Small Cap Growth Fund |
||||||||||||||||||||||||
| Initial Class |
1,000.00 | 1,287.60 | 1,019.41 | 6.63 | 5.85 | 1.15 | ||||||||||||||||||
| Service Class |
1,000.00 | 1,285.50 | 1,018.15 | 8.06 | 7.12 | 1.40 | ||||||||||||||||||
| SC Lord Abbett Growth & Income Fund |
||||||||||||||||||||||||
| Initial Class |
1,000.00 | 1,236.00 | 1,020.82 | 4.90 | 4.43 | 0.87 | ||||||||||||||||||
| Service Class |
1,000.00 | 1,233.40 | 1,019.56 | 6.30 | 5.70 | 1.12 | ||||||||||||||||||
| SC WMC Blue Chip Mid Cap Fund |
||||||||||||||||||||||||
| Initial Class |
1,000.00 | 1,245.10 | 1,020.26 | 5.55 | 4.99 | 0.98 | ||||||||||||||||||
| Service Class |
1,000.00 | 1,243.30 | 1,019.00 | 6.95 | 6.26 | 1.23 | ||||||||||||||||||
| SC WMC Large Cap Growth Fund |
||||||||||||||||||||||||
| Initial Class |
1,000.00 | 1,273.10 | 1,021.12 | 4.64 | 4.13 | 0.81 | ||||||||||||||||||
| Service Class |
1,000.00 | 1,272.00 | 1,019.86 | 6.07 | 5.40 | 1.06 | ||||||||||||||||||
| Sun Capital Global Real Estate Fund |
||||||||||||||||||||||||
| Initial Class |
1,000.00 | 1,243.60 | 1,019.66 | 6.22 | 5.60 | 1.10 | ||||||||||||||||||
| Service Class |
1,000.00 | 1,241.70 | 1,018.40 | 7.63 | 6.87 | 1.35 | ||||||||||||||||||
| SC Ibbotson Tactical Opportunities Fund |
||||||||||||||||||||||||
| Initial Class |
1,000.00 | 1,052.00 | 1,005.79 | 0.66 | ** | 0.65 | ** | 0.50 | ||||||||||||||||
| Sun Capital Investment Grade Bond Fund |
||||||||||||||||||||||||
| Initial Class |
1,000.00 | 1,033.20 | 1,021.58 | 3.69 | 3.67 | 0.72 | ||||||||||||||||||
| Service Class |
1,000.00 | 1,031.70 | 1,020.26 | 5.02 | 4.99 | 0.98 | ||||||||||||||||||
| Sun Capital Money Market Fund |
||||||||||||||||||||||||
| Initial Class |
1,000.00 | 1,000.70 | 1,024.95 | 0.25 | 0.26 | 0.05 | ||||||||||||||||||
| Service Class |
1,000.00 | 1,000.00 | 1,024.05 | 1.16 | 1.17 | 0.23 | ||||||||||||||||||
| SC BlackRock Inflation Protected Bond Fund |
||||||||||||||||||||||||
| Initial Class |
1,000.00 | 1,017.20 | 1,021.93 | 3.30 | 3.31 | 0.65 | ||||||||||||||||||
| Service Class |
1,000.00 | 1,015.10 | 1,020.67 | 4.57 | 4.58 | 0.90 | ||||||||||||||||||
| * | For each class of the Fund, expenses are equal to the six-month annualized expense ratio for the class, multiplied by the average account value over the period, multiplied by 184/365 to reflect the most recent six-month period. |
| ** | The SC BlackRock International Index Fund and SC Ibbotson Tactical Opportunities Fund commenced operations on November 15, 2010. For each class of the SC BlackRock International Index Fund and Initial Class of SC Ibbotson Tactical Opportunities Fund, actual expenses are equal to the actual expenses incurred by each class from commencement of operations through December 31, 2010. Hypothetical expenses for each class are equal to the annualized expense ratio for the class, multiplied by the average account value over the period, multiplied by 47/365 to reflect the period from commencement. |
94
Table of Contents
EXPENSE INFORMATION
December 31, 2010 (Unaudited) (Continued)
| Beginning Account Value 7/1/10 |
Actual Ending Account Value 12/31/10 |
Hypothetical Ending Account Value 12/31/10 |
Actual Expenses Paid During Period* |
Hypothetical Expenses Paid During Period* |
Net Expense Ratio During Period |
|||||||||||||||||||
| SC Goldman Sachs Short Duration Fund |
||||||||||||||||||||||||
| Initial Class |
$ | 1,000.00 | $ | 1,005.90 | $ | 1,021.93 | $ | 3.29 | $ | 3.31 | 0.65 | % | ||||||||||||
| Service Class |
1,000.00 | 1,005.60 | 1,020.67 | 4.55 | 4.58 | 0.90 | ||||||||||||||||||
| SC PIMCO High Yield Fund |
||||||||||||||||||||||||
| Initial Class |
1,000.00 | 1,085.00 | 1,021.42 | 3.94 | 3.82 | 0.75 | ||||||||||||||||||
| Service Class |
1,000.00 | 1,083.60 | 1,020.16 | 5.25 | 5.09 | 1.00 | ||||||||||||||||||
| SC PIMCO Total Return Fund |
||||||||||||||||||||||||
| Initial Class |
1,000.00 | 1,021.60 | 1,021.93 | 3.31 | 3.31 | 0.65 | ||||||||||||||||||
| Service Class |
1,000.00 | 1,020.30 | 1,020.67 | 4.58 | 4.58 | 0.90 | ||||||||||||||||||
| SC Ibbotson Balanced Fund |
||||||||||||||||||||||||
| Initial Class |
1,000.00 | 1,149.50 | 1,024.20 | 1.08 | 1.02 | 0.20 | ||||||||||||||||||
| Service Class |
1,000.00 | 1,146.90 | 1,022.94 | 2.44 | 2.29 | 0.45 | ||||||||||||||||||
| SC Ibbotson Conservative Fund |
||||||||||||||||||||||||
| Initial Class |
1,000.00 | 1,105.20 | 1,024.20 | 1.06 | 1.02 | 0.20 | ||||||||||||||||||
| Service Class |
1,000.00 | 1,104.50 | 1,022.94 | 2.39 | 2.29 | 0.45 | ||||||||||||||||||
| SC Ibbotson Growth Fund |
||||||||||||||||||||||||
| Initial Class |
1,000.00 | 1,189.80 | 1,024.20 | 1.10 | 1.02 | 0.20 | ||||||||||||||||||
| Service Class |
1,000.00 | 1,189.00 | 1,022.94 | 2.48 | 2.29 | 0.45 | ||||||||||||||||||
| * | For each class of the Fund, expenses are equal to the six-month annualized expense ratio for the class, multiplied by the average account value over the period, multiplied by 184/365 to reflect the most recent six-month period. |
95
Table of Contents
SC ALLIANCEBERNSTEIN INTERNATIONAL VALUE FUND
| PORTFOLIO OF INVESTMENTS December 31, 2010 |
Sun Capital Advisers Trust |
See Notes to Financial Statements.
96
Table of Contents
SC ALLIANCEBERNSTEIN INTERNATIONAL VALUE FUND
| PORTFOLIO OF INVESTMENTS (Continued) December 31, 2010 |
Sun Capital Advisers Trust |
See Notes to Financial Statements.
97
Table of Contents
SC ALLIANCEBERNSTEIN INTERNATIONAL VALUE FUND
| PORTFOLIO OF INVESTMENTS (Continued) December 31, 2010 |
Sun Capital Advisers Trust |
See Notes to Financial Statements.
98
Table of Contents
SC ALLIANCEBERNSTEIN INTERNATIONAL VALUE FUND
| PORTFOLIO OF INVESTMENTS (Continued) December 31, 2010 |
Sun Capital Advisers Trust |
See Notes to Financial Statements.
99
Table of Contents
SC ALLIANCEBERNSTEIN INTERNATIONAL VALUE FUND
| PORTFOLIO OF INVESTMENTS (Continued) December 31, 2010 |
Sun Capital Advisers Trust |
100
Table of Contents
| SC ALLIANCEBERNSTEIN INTERNATIONAL VALUE FUND PORTFOLIO OF INVESTMENTS (Continued) | ||
| December 31, 2010 | Sun Capital Advisers Trust | |
| * | Non-income producing security. |
| ** | Unless otherwise noted the issuer country code for all securities is United States. |
| + | Amount is less than 0.05%. |
| (1) | Eligible for resale under rule 144A of the Securities Act of 1933. These securities may be resold in transactions exempt from registration, normally to qualified institutional buyers. At the period end, the value of these securities amounted to $262,537, representing 0.4% of net assets. |
| (2) | At the period end, cash of $25,514 has been pledged to cover margin requirements for the following open futures contracts: |
| Type |
Description |
Expiration Date |
Contracts | Aggregate Face Value ($) |
Aggregate Notional Value ($) |
Unrealized Depreciation ($) |
||||||||||||||
| Long |
DJ Euro Stoxx 50 Index March Futures | 3/18/11 | 9 | 342,626 | 336,026 | (6,600 | ) | |||||||||||||
| (3) | Fair Value Measurements † |
The following table summarizes the inputs used to value the Fund’s assets and liabilities, as applicable, measured at fair value at the period end:
| Assets |
Quoted Prices in Active Markets for Identical Assets and Liabilities (Level 1) |
Significant Other Observable Inputs (Level 2) |
Significant Unobservable Inputs (Level 3) |
Total | ||||||||||||
| Common Stocks |
||||||||||||||||
| Aerospace & Defense |
$ | 207,092 | $ | 501,640 | $ | — | $ | 708,732 | ||||||||
| Airlines |
— | 345,832 | — | 345,832 | ||||||||||||
| Auto Components |
318,466 | 987,036 | — | 1,305,502 | ||||||||||||
| Automobiles |
— | 2,786,766 | — | 2,786,766 | ||||||||||||
| Beverages |
— | 395,236 | — | 395,236 | ||||||||||||
| Building Products |
— | 619,497 | — | 619,497 | ||||||||||||
| Capital Markets |
— | 1,466,967 | — | 1,466,967 | ||||||||||||
| Chemicals |
460,123 | 2,946,490 | — | 3,406,613 | ||||||||||||
| Commercial Banks |
463,408 | 9,261,963 | — | 9,725,371 | ||||||||||||
| Commercial Services & Supplies |
— | 467,256 | — | 467,256 | ||||||||||||
| Communications Equipment |
— | 294,774 | — | 294,774 | ||||||||||||
| Computers & Peripherals |
— | 1,055,549 | — | 1,055,549 | ||||||||||||
| Construction & Engineering |
— | 702,568 | — | 702,568 | ||||||||||||
| Construction Materials |
— | 295,419 | — | 295,419 | ||||||||||||
| Containers & Packaging |
— | 200,953 | — | 200,953 | ||||||||||||
| Distributors |
— | 244,073 | — | 244,073 | ||||||||||||
| Diversified Financial Services |
— | 816,684 | — | 816,684 | ||||||||||||
| Diversified Telecommunication Services |
— | 3,399,565 | — | 3,399,565 | ||||||||||||
| Electric Utilities |
— | 2,868,826 | — | 2,868,826 | ||||||||||||
| Electrical Equipment |
— | 926,816 | — | 926,816 | ||||||||||||
| Electronic Equipment, Instruments & Components |
76,837 | 218,660 | — | 295,497 | ||||||||||||
See Notes to Financial Statements.
101
Table of Contents
| SC ALLIANCEBERNSTEIN INTERNATIONAL VALUE FUND PORTFOLIO OF INVESTMENTS (Continued) | ||
| December 31, 2010 | Sun Capital Advisers Trust | |
| Assets (Continued) |
Quoted Prices in Active Markets for Identical Assets and Liabilities (Level 1) |
Significant Other Observable Inputs (Level 2) |
Significant Unobservable Inputs (Level 3) |
Total | ||||||||||||
| Energy Equipment & Services |
$ | — | $ | 310,429 | $ | — | $ | 310,429 | ||||||||
| Food & Staples Retailing |
— | 1,430,862 | — | 1,430,862 | ||||||||||||
| Food Products |
— | 1,410,654 | — | 1,410,654 | ||||||||||||
| Gas Utilities |
— | 270,477 | — | 270,477 | ||||||||||||
| Health Care Equipment & Supplies |
— | 247,862 | — | 247,862 | ||||||||||||
| Health Care Providers & Services |
— | 137,794 | — | 137,794 | ||||||||||||
| Hotels, Restaurants & Leisure |
— | 496,920 | — | 496,920 | ||||||||||||
| Household Durables |
— | 1,217,444 | — | 1,217,444 | ||||||||||||
| Independent Power Producers & Energy Traders |
— | 287,108 | — | 287,108 | ||||||||||||
| Industrial Conglomerates |
— | 1,191,205 | — | 1,191,205 | ||||||||||||
| Insurance |
— | 2,856,572 | — | 2,856,572 | ||||||||||||
| IT Services |
— | 807,709 | — | 807,709 | ||||||||||||
| Leisure Equipment & Products |
— | 113,846 | — | 113,846 | ||||||||||||
| Machinery |
— | 419,544 | — | 419,544 | ||||||||||||
| Media |
— | 1,183,020 | — | 1,183,020 | ||||||||||||
| Metals & Mining |
679,068 | 4,255,825 | — | 4,934,893 | ||||||||||||
| Multi-Line Retail |
— | 570,137 | — | 570,137 | ||||||||||||
| Multi-Utilities |
— | 650,033 | — | 650,033 | ||||||||||||
| Office Electronics |
— | 306,663 | — | 306,663 | ||||||||||||
| Oil, Gas & Consumable Fuels |
1,500,513 | 4,968,458 | — | 6,468,971 | ||||||||||||
| Paper & Forest Products |
— | 532,026 | — | 532,026 | ||||||||||||
| Pharmaceuticals |
— | 5,543,638 | — | 5,543,638 | ||||||||||||
| Real Estate Management & Development |
— | 1,319,254 | — | 1,319,254 | ||||||||||||
| Road & Rail |
— | 845,045 | — | 845,045 | ||||||||||||
| Semiconductors & Semiconductor Equipment |
— | 126,570 | — | 126,570 | ||||||||||||
| Specialty Retail |
— | 395,011 | — | 395,011 | ||||||||||||
| Textiles, Apparel & Luxury Goods |
— | 469,080 | — | 469,080 | ||||||||||||
| Tobacco |
— | 1,567,163 | — | 1,567,163 | ||||||||||||
| Trading Companies & Distributors |
— | 2,266,739 | — | 2,266,739 | ||||||||||||
| Wireless Telecommunication Services |
— | 1,571,699 | — | 1,571,699 | ||||||||||||
| Total Common Stocks |
3,705,507 | 68,571,357 | — | 72,276,864 | ||||||||||||
| Equity Linked Securities (a) |
— | 262,537 | — | 262,537 | ||||||||||||
| Preferred Stocks (a) |
— | 178,449 | — | 178,449 | ||||||||||||
| Short Term Investments |
||||||||||||||||
| Mutual Funds |
1,423,435 | — | — | 1,423,435 | ||||||||||||
| Total Investments |
$ | 5,128,942 | $ | 69,012,343 | $ | — | $ | 74,141,285 | ||||||||
| Liabilities |
||||||||||||||||
| Financial Derivative Instruments |
||||||||||||||||
| Futures Contracts |
$ | (6,600 | ) | $ | — | $ | — | $ | (6,600 | ) | ||||||
| Total Financial Derivative Instruments |
$ | (6,600 | ) | $ | — | $ | — | $ | (6,600 | ) | ||||||
| † | See Note 2b in the Notes to Financial Statements for additional information. |
| (a) | See Portfolio of Investments for additional detailed categorizations. |
See Notes to Financial Statements.
102
Table of Contents
SC BLACKROCK INTERNATIONAL INDEX FUND
| PORTFOLIO OF INVESTMENTS December 31, 2010 |
Sun Capital Advisers Trust |
See Notes to Financial Statements.
103
Table of Contents
SC BLACKROCK INTERNATIONAL INDEX FUND
| PORTFOLIO OF INVESTMENTS (Continued) December 31, 2010 |
Sun Capital Advisers Trust |
See Notes to Financial Statements.
104
Table of Contents
SC BLACKROCK INTERNATIONAL INDEX FUND
| PORTFOLIO OF INVESTMENTS (Continued) December 31, 2010 |
Sun Capital Advisers Trust |
See Notes to Financial Statements.
105
Table of Contents
SC BLACKROCK INTERNATIONAL INDEX FUND
| PORTFOLIO OF INVESTMENTS (Continued) December 31, 2010 |
Sun Capital Advisers Trust |
See Notes to Financial Statements.
106
Table of Contents
SC BLACKROCK INTERNATIONAL INDEX FUND
| PORTFOLIO OF INVESTMENTS (Continued) December 31, 2010 |
Sun Capital Advisers Trust |
See Notes to Financial Statements.
107
Table of Contents
SC BLACKROCK INTERNATIONAL INDEX FUND
| PORTFOLIO OF INVESTMENTS (Continued) December 31, 2010 |
Sun Capital Advisers Trust |
See Notes to Financial Statements.
108
Table of Contents
SC BLACKROCK INTERNATIONAL INDEX FUND
| PORTFOLIO OF INVESTMENTS (Continued) December 31, 2010 |
Sun Capital Advisers Trust |
See Notes to Financial Statements.
109
Table of Contents
SC BLACKROCK INTERNATIONAL INDEX FUND
| PORTFOLIO OF INVESTMENTS (Continued) December 31, 2010 |
Sun Capital Advisers Trust |
See Notes to Financial Statements.
110
Table of Contents
SC BLACKROCK INTERNATIONAL INDEX FUND
| PORTFOLIO OF INVESTMENTS (Continued) December 31, 2010 |
Sun Capital Advisers Trust |
See Notes to Financial Statements.
111
Table of Contents
SC BLACKROCK INTERNATIONAL INDEX FUND
| PORTFOLIO OF INVESTMENTS (Continued) December 31, 2010 |
Sun Capital Advisers Trust |
See Notes to Financial Statements.
112
Table of Contents
SC BLACKROCK INTERNATIONAL INDEX FUND
| PORTFOLIO OF INVESTMENTS (Continued) December 31, 2010 |
Sun Capital Advisers Trust |
See Notes to Financial Statements.
113
Table of Contents
SC BLACKROCK INTERNATIONAL INDEX FUND
| PORTFOLIO OF INVESTMENTS (Continued) December 31, 2010 |
Sun Capital Advisers Trust |
See Notes to Financial Statements.
114
Table of Contents
SC BLACKROCK INTERNATIONAL INDEX FUND
| PORTFOLIO OF INVESTMENTS (Continued) December 31, 2010 |
Sun Capital Advisers Trust |
See Notes to Financial Statements.
115
Table of Contents
SC BLACKROCK INTERNATIONAL INDEX FUND
| PORTFOLIO OF INVESTMENTS (Continued) December 31, 2010 |
Sun Capital Advisers Trust |
See Notes to Financial Statements.
116
Table of Contents
SC BLACKROCK INTERNATIONAL INDEX FUND
| PORTFOLIO OF INVESTMENTS (Continued) December 31, 2010 |
Sun Capital Advisers Trust |
See Notes to Financial Statements.
117
Table of Contents
SC BLACKROCK INTERNATIONAL INDEX FUND
| PORTFOLIO OF INVESTMENTS (Continued) December 31, 2010 |
Sun Capital Advisers Trust |
| * | Non-income producing security. |
| ** | Unless otherwise noted the issuer country code for all securities is United States. |
| + | Amount is less than 0.05%. |
| (1) | At the period end, cash of $145,000 has been pledged to cover margin requirements for the following open futures contracts: |
| Type |
Description |
Expiration Date |
Contracts | Aggregate Face Value ($) |
Aggregate Notional Value ($) |
Unrealized Appreciation/ (Depreciation) ($) |
||||||||||||||||
| Long |
DJ Euro Stoxx 50 Index March Futures | 3/18/11 | 5 | 190,381 | 186,681 | (3,700 | ) | |||||||||||||||
| Long |
FTSE 100 Index March Futures | 3/18/11 | 2 | 181,834 | 183,756 | 1,922 | ||||||||||||||||
| Long |
MSCI EAFE E-Mini Index March Futures | 3/18/11 | 16 | 1,312,939 | 1,328,800 | 15,861 | ||||||||||||||||
| Long |
Topix Index March Futures | 3/11/11 | 1 | 108,565 | 110,358 | 1,793 | ||||||||||||||||
| Net unrealized appreciation |
15,876 | |||||||||||||||||||||
See Notes to Financial Statements.
118
Table of Contents
SC BLACKROCK INTERNATIONAL INDEX FUND
| PORTFOLIO OF INVESTMENTS (Continued) December 31, 2010 |
Sun Capital Advisers Trust |
| (2) | Fair Value Measurements † |
The following table summarizes the inputs used to value the Fund’s assets and liabilities, as applicable, measured at fair value at the period end:
| Assets |
Quoted Prices in Active Markets for Identical Assets and Liabilities (Level 1) |
Significant Other Observable Inputs (Level 2) |
Significant Unobservable Inputs (Level 3) |
Total | ||||||||||||
| Common Stocks (a) |
$ | 9,320 | $ | 52,633,485 | $ | — | $ | 52,642,805 | ||||||||
| Preferred Stocks (b) |
— | 287,599 | — | 287,599 | ||||||||||||
| Short Term Investments |
||||||||||||||||
| Mutual Funds |
1,184,300 | — | — | 1,184,300 | ||||||||||||
| Total Investments |
1,193,620 | 52,921,084 | — | 54,114,704 | ||||||||||||
| Financial Derivative Instruments |
||||||||||||||||
| Futures Contracts |
19,576 | — | — | 19,576 | ||||||||||||
| Total Financial Derivative Instruments |
$ | 19,576 | $ | — | $ | — | $ | 19,576 | ||||||||
| Liabilities |
||||||||||||||||
| Financial Derivative Instruments |
||||||||||||||||
| Futures Contracts |
$ | (3,700 | ) | $ | — | $ | — | $ | (3,700 | ) | ||||||
| Total Financial Derivative Instruments |
$ | (3,700 | ) | $ | — | $ | — | $ | (3,700 | ) | ||||||
| † | See Note 2b in the Notes to Financial Statements for additional information. |
| (a) | See Portfolio of Investments for additional detailed categorizations of Level 2 Securities. The Level 1 security is within the Airlines industry in the Portfolio of Investments. |
| (b) | See Portfolio of Investments for additional detailed categorizations. |
See Notes to Financial Statements.
119
Table of Contents
SC BLACKROCK LARGE CAP INDEX FUND
| PORTFOLIO OF INVESTMENTS December 31, 2010 |
Sun Capital Advisers Trust |
See Notes to Financial Statements.
120
Table of Contents
SC BLACKROCK LARGE CAP INDEX FUND
| PORTFOLIO OF INVESTMENTS (Continued) December 31, 2010 |
Sun Capital Advisers Trust |
See Notes to Financial Statements.
121
Table of Contents
SC BLACKROCK LARGE CAP INDEX FUND
| PORTFOLIO OF INVESTMENTS (Continued) December 31, 2010 |
Sun Capital Advisers Trust |
See Notes to Financial Statements.
122
Table of Contents
SC BLACKROCK LARGE CAP INDEX FUND
| PORTFOLIO OF INVESTMENTS (Continued) December 31, 2010 |
Sun Capital Advisers Trust |
See Notes to Financial Statements.
123
Table of Contents
SC BLACKROCK LARGE CAP INDEX FUND
| PORTFOLIO OF INVESTMENTS (Continued) December 31, 2010 |
Sun Capital Advisers Trust |
See Notes to Financial Statements.
124
Table of Contents
SC BLACKROCK LARGE CAP INDEX FUND
| PORTFOLIO OF INVESTMENTS (Continued) December 31, 2010 |
Sun Capital Advisers Trust |
See Notes to Financial Statements.
125
Table of Contents
SC BLACKROCK LARGE CAP INDEX FUND
| PORTFOLIO OF INVESTMENTS (Continued) December 31, 2010 |
Sun Capital Advisers Trust |
See Notes to Financial Statements.
126
Table of Contents
SC BLACKROCK LARGE CAP INDEX FUND
| PORTFOLIO OF INVESTMENTS (Continued) December 31, 2010 |
Sun Capital Advisers Trust |
See Notes to Financial Statements.
127
Table of Contents
SC BLACKROCK LARGE CAP INDEX FUND
| PORTFOLIO OF INVESTMENTS (Continued) December 31, 2010 |
Sun Capital Advisers Trust |
| REIT | Real Estate Investment Trust | |
| AN | Netherlands Antilles | |
| BM | Bermuda | |
| CH | Switzerland | |
| IE | Ireland | |
| PA | Panama | |
| * | Non-income producing security. |
| ** | Unless otherwise noted the issuer country code for all securities is United States. |
| + | Amount is less than 0.05%. |
See Notes to Financial Statements.
128
Table of Contents
SC BLACKROCK LARGE CAP INDEX FUND
| PORTFOLIO OF INVESTMENTS (Continued) December 31, 2010 |
Sun Capital Advisers Trust |
| (1) | At the period end, cash of $368,000 has been pledged to cover margin requirements for the following open futures contracts: |
| Type |
Description |
Expiration Date |
Contracts | Aggregate Face Value ($) |
Aggregate Notional Value ($) |
Unrealized Appreciation ($) |
||||||||||||||||
| Long |
S&P 500 E-Mini Index March Futures | 3/18/11 | 44 | 2,701,834 | 2,756,600 | 54,766 | ||||||||||||||||
| (2) | Fair Value Measurements |
All investments and financial derivative instruments are categorized as Level 1 under the fair value hierarchy. See Note 2b in the Notes to Financial Statements for additional information.
See Notes to Financial Statements.
129
Table of Contents
SC BLACKROCK SMALL CAP INDEX FUND
| PORTFOLIO OF INVESTMENTS December 31, 2010 |
Sun Capital Advisers Trust |
See Notes to Financial Statements.
130
Table of Contents
SC BLACKROCK SMALL CAP INDEX FUND
| PORTFOLIO OF INVESTMENTS (Continued) December 31, 2010 |
Sun Capital Advisers Trust |
See Notes to Financial Statements.
131
Table of Contents
SC BLACKROCK SMALL CAP INDEX FUND
| PORTFOLIO OF INVESTMENTS (Continued) December 31, 2010 |
Sun Capital Advisers Trust |
See Notes to Financial Statements.
132
Table of Contents
SC BLACKROCK SMALL CAP INDEX FUND
| PORTFOLIO OF INVESTMENTS (Continued) December 31, 2010 |
Sun Capital Advisers Trust |
See Notes to Financial Statements.
133
Table of Contents
SC BLACKROCK SMALL CAP INDEX FUND
| PORTFOLIO OF INVESTMENTS (Continued) December 31, 2010 |
Sun Capital Advisers Trust |
See Notes to Financial Statements.
134
Table of Contents
SC BLACKROCK SMALL CAP INDEX FUND
| PORTFOLIO OF INVESTMENTS (Continued) December 31, 2010 |
Sun Capital Advisers Trust |
See Notes to Financial Statements.
135
Table of Contents
SC BLACKROCK SMALL CAP INDEX FUND
| PORTFOLIO OF INVESTMENTS (Continued) December 31, 2010 |
Sun Capital Advisers Trust |
See Notes to Financial Statements.
136
Table of Contents
SC BLACKROCK SMALL CAP INDEX FUND
| PORTFOLIO OF INVESTMENTS (Continued) December 31, 2010 |
Sun Capital Advisers Trust |
See Notes to Financial Statements.
137
Table of Contents
SC BLACKROCK SMALL CAP INDEX FUND
| PORTFOLIO OF INVESTMENTS (Continued) December 31, 2010 |
Sun Capital Advisers Trust |
See Notes to Financial Statements.
138
Table of Contents
SC BLACKROCK SMALL CAP INDEX FUND
| PORTFOLIO OF INVESTMENTS (Continued) December 31, 2010 |
Sun Capital Advisers Trust |
See Notes to Financial Statements.
139
Table of Contents
SC BLACKROCK SMALL CAP INDEX FUND
| PORTFOLIO OF INVESTMENTS (Continued) December 31, 2010 |
Sun Capital Advisers Trust |
See Notes to Financial Statements.
140
Table of Contents
SC BLACKROCK SMALL CAP INDEX FUND
| PORTFOLIO OF INVESTMENTS (Continued) December 31, 2010 |
Sun Capital Advisers Trust |
See Notes to Financial Statements.
141
Table of Contents
SC BLACKROCK SMALL CAP INDEX FUND
| PORTFOLIO OF INVESTMENTS (Continued) December 31, 2010 |
Sun Capital Advisers Trust |
See Notes to Financial Statements.
142
Table of Contents
SC BLACKROCK SMALL CAP INDEX FUND
| PORTFOLIO OF INVESTMENTS (Continued) December 31, 2010 |
Sun Capital Advisers Trust |
See Notes to Financial Statements.
143
Table of Contents
SC BLACKROCK SMALL CAP INDEX FUND
| PORTFOLIO OF INVESTMENTS (Continued) December 31, 2010 |
Sun Capital Advisers Trust |
See Notes to Financial Statements.
144
Table of Contents
SC BLACKROCK SMALL CAP INDEX FUND
| PORTFOLIO OF INVESTMENTS (Continued) December 31, 2010 |
Sun Capital Advisers Trust |
See Notes to Financial Statements.
145
Table of Contents
SC BLACKROCK SMALL CAP INDEX FUND
| PORTFOLIO OF INVESTMENTS (Continued) December 31, 2010 |
Sun Capital Advisers Trust |
See Notes to Financial Statements.
146
Table of Contents
SC BLACKROCK SMALL CAP INDEX FUND
| PORTFOLIO OF INVESTMENTS (Continued) December 31, 2010 |
Sun Capital Advisers Trust |
See Notes to Financial Statements.
147
Table of Contents
SC BLACKROCK SMALL CAP INDEX FUND
| PORTFOLIO OF INVESTMENTS (Continued) December 31, 2010 |
Sun Capital Advisers Trust |
See Notes to Financial Statements.
148
Table of Contents
SC BLACKROCK SMALL CAP INDEX FUND
| PORTFOLIO OF INVESTMENTS (Continued) December 31, 2010 |
Sun Capital Advisers Trust |
See Notes to Financial Statements.
149
Table of Contents
SC BLACKROCK SMALL CAP INDEX FUND
| PORTFOLIO OF INVESTMENTS (Continued) December 31, 2010 |
Sun Capital Advisers Trust |
See Notes to Financial Statements.
150
Table of Contents
SC BLACKROCK SMALL CAP INDEX FUND
| PORTFOLIO OF INVESTMENTS (Continued) December 31, 2010 |
Sun Capital Advisers Trust |
See Notes to Financial Statements.
151
Table of Contents
| SC BLACKROCK SMALL CAP INDEX FUND PORTFOLIO OF INVESTMENTS (Continued) | ||
| December 31, 2010 | Sun Capital Advisers Trust | |
See Notes to Financial Statements.
152
Table of Contents
SC BLACKROCK SMALL CAP INDEX FUND
| PORTFOLIO OF INVESTMENTS (Continued) December 31, 2010 |
Sun Capital Advisers Trust |
See Notes to Financial Statements.
153
Table of Contents
SC BLACKROCK SMALL CAP INDEX FUND
| PORTFOLIO OF INVESTMENTS (Continued) December 31, 2010 |
Sun Capital Advisers Trust |
See Notes to Financial Statements.
154
Table of Contents
SC BLACKROCK SMALL CAP INDEX FUND
| PORTFOLIO OF INVESTMENTS (Continued) December 31, 2010 |
Sun Capital Advisers Trust |
| REIT | Real Estate Investment Trust | |
| AN | Netherlands Antilles | |
| BM | Bermuda | |
| BS | Bahamas | |
| CA | Canada | |
| IE | Ireland | |
| KY | Cayman Islands | |
| LR | Liberia | |
| LU | Luxembourg | |
| MH | Marshall Islands | |
| NL | Netherlands | |
| PA | Panama | |
| PR | Puerto Rico | |
See Notes to Financial Statements.
155
Table of Contents
| SC BLACKROCK SMALL CAP INDEX FUND PORTFOLIO OF INVESTMENTS (Continued) | ||
| December 31, 2010 | Sun Capital Advisers Trust | |
| * | Non-income producing security. |
| ** | Unless otherwise noted the issuer country code for all securities is United States. |
| + | Amount is less than 0.05%. |
| (1) | Eligible for resale under rule 144A of the Securities Act of 1933. This security may be resold in transactions exempt from registration, normally to qualified institutional buyers. At the period end, the value of this security amounted to $0, representing less than 0.05% of net assets. |
| (2) | Zero-coupon bond. |
| (3) | At the period end, cash of $379,000 has been pledged to cover margin requirements for the following open futures contracts: |
| Type |
Description |
Expiration Date |
Contracts | Aggregate Face Value ($) |
Aggregate Notional Value ($) |
Unrealized Appreciation ($) |
||||||||||||||
| Long |
Russell 2000 Mini Index March Futures | 3/18/11 | 67 | 5,192,192 | 5,241,410 | 49,218 | ||||||||||||||
| (4) | Fair Value Measurements † |
The following table summarizes the inputs used to value the Fund’s assets and liabilities, as applicable, measured at fair value at the period end:
| Assets |
Quoted Prices in Active Markets for Identical Assets and Liabilities (Level 1) |
Significant Other Observable Inputs (Level 2) |
Significant Unobservable Inputs (Level 3) |
Total | ||||||||||||
| Common Stocks (a) |
$ | 175,580,938 | $ | — | $ | — | $ | 175,580,938 | ||||||||
| Corporate Debt Obligations (a) |
— | 3,894 | — | 3,894 | ||||||||||||
| Short Term Investments |
||||||||||||||||
| Mutual Funds |
4,714,399 | — | — | 4,714,399 | ||||||||||||
| Total Investments |
180,295,337 | 3,894 | — | 180,299,231 | ||||||||||||
| Financial Derivative Instruments |
||||||||||||||||
| Futures Contracts |
49,218 | — | — | 49,218 | ||||||||||||
| Total Financial Derivative Instruments |
$ | 49,218 | $ | — | $ | — | $ | 49,218 | ||||||||
| † | See Note 2b in the Notes to Financial Statements for additional information. |
| (a) | See Portfolio of Investments for additional detailed categorizations. |
See Notes to Financial Statements.
156
Table of Contents
SC GOLDMAN SACHS MID CAP VALUE FUND
| PORTFOLIO OF INVESTMENTS December 31, 2010 |
Sun Capital Advisers Trust |
See Notes to Financial Statements.
157
Table of Contents
SC GOLDMAN SACHS MID CAP VALUE FUND
| PORTFOLIO OF INVESTMENTS (Continued) December 31, 2010 |
Sun Capital Advisers Trust |
See Notes to Financial Statements.
158
Table of Contents
SC GOLDMAN SACHS MID CAP VALUE FUND
| PORTFOLIO OF INVESTMENTS (Continued) December 31, 2010 |
Sun Capital Advisers Trust |
See Notes to Financial Statements.
159
Table of Contents
SC GOLDMAN SACHS MID CAP VALUE FUND
| PORTFOLIO OF INVESTMENTS (Continued) December 31, 2010 |
Sun Capital Advisers Trust |
See Notes to Financial Statements.
160
Table of Contents
SC GOLDMAN SACHS MID CAP VALUE FUND
| PORTFOLIO OF INVESTMENTS (Continued) December 31, 2010 |
Sun Capital Advisers Trust |
See Notes to Financial Statements.
161
Table of Contents
SC GOLDMAN SACHS MID CAP VALUE FUND
| PORTFOLIO OF INVESTMENTS (Continued) December 31, 2010 |
Sun Capital Advisers Trust |
| BM | Bermuda | |
| CH | Switzerland | |
| GG | Guernsey | |
| IE | Ireland | |
| NL | Netherlands | |
| PA | Panama | |
| PR | Puerto Rico | |
| VG | British Virgin Islands |
| + | Amount is less than 0.05%. |
| * | Non-income producing security. |
| ** | Unless otherwise noted the issuer country code for all securities is United States. |
| (1) | At the period end, securities (or portions thereof) with an aggregate market value of $1,417,955 have been pledged to cover margin requirements for the following open futures contracts: |
| Type |
Description |
Expiration Date |
Contracts | Aggregate Face Value ($) |
Aggregate Notional Value ($) |
Unrealized Depreciation ($) |
||||||||||||||||
| Long |
S&P Midcap 400 E-Mini Index March Futures | 3/18/11 | 73 | 6,614,612 | 6,608,690 | (5,922 | ) | |||||||||||||||
| (2) | Fair Value Measurements |
All investments and financial derivative instruments are categorized as Level 1 under the fair value hierarchy. See Note 2b in the Notes to Financial Statements for additional information.
See Notes to Financial Statements.
162
Table of Contents
SC COLUMBIA SMALL CAP VALUE FUND
| PORTFOLIO OF INVESTMENTS December 31, 2010 |
Sun Capital Advisers Trust |
See Notes to Financial Statements.
163
Table of Contents
SC COLUMBIA SMALL CAP VALUE FUND
| PORTFOLIO OF INVESTMENTS (Continued) December 31, 2010 |
Sun Capital Advisers Trust |
See Notes to Financial Statements.
164
Table of Contents
SC COLUMBIA SMALL CAP VALUE FUND
| PORTFOLIO OF INVESTMENTS (Continued) December 31, 2010 |
Sun Capital Advisers Trust |
See Notes to Financial Statements.
165
Table of Contents
SC COLUMBIA SMALL CAP VALUE FUND
| PORTFOLIO OF INVESTMENTS (Continued) December 31, 2010 |
Sun Capital Advisers Trust |
See Notes to Financial Statements.
166
Table of Contents
SC COLUMBIA SMALL CAP VALUE FUND
| PORTFOLIO OF INVESTMENTS (Continued) December 31, 2010 |
Sun Capital Advisers Trust |
See Notes to Financial Statements.
167
Table of Contents
SC COLUMBIA SMALL CAP VALUE FUND
| PORTFOLIO OF INVESTMENTS (Continued) December 31, 2010 |
Sun Capital Advisers Trust |
| FHLMC | Federal Home Loan Mortgage Corporation | |
| BM | Bermuda | |
| CA | Canada | |
| CH | Switzerland | |
| DE | Germany | |
| IE | Ireland | |
| KY | Cayman Islands | |
| MH | Marshall Islands | |
| PR | Puerto Rico | |
| VG | British Virgin Islands | |
| * | Non-income producing security. |
| ** | Unless otherwise noted the issuer country code for all securities is United States. |
| (1) | Fair Value Measurements † |
The following table summarizes the inputs used to value the Fund’s assets and liabilities, as applicable, measured at fair value at the period end:
| Assets |
Quoted Prices in Active Markets for Identical Assets and Liabilities (Level 1) |
Significant Other Observable Inputs (Level 2) |
Significant Unobservable Inputs (Level 3) |
Total | ||||||||||||
| Common Stocks (a) |
$ | 60,818,809 | $ | 115,011 | $ | — | $ | 60,933,820 | ||||||||
| Short Term Investments |
— | 265,198 | — | 265,198 | ||||||||||||
| Total Investments |
$ | 60,818,809 | $ | 380,209 | $ | — | $ | 61,199,018 | ||||||||
| † | See Note 2b in the Notes to Financial Statements for additional information. |
| (a) | See Portfolio of Investments for additional detailed categorizations of Level 1 Securities. The Level 2 security is within the Construction & Engineering industry in the Portfolio of Investments. |
See Notes to Financial Statements.
168
Table of Contents
| PORTFOLIO OF INVESTMENTS December 31, 2010 |
Sun Capital Advisers Trust |
See Notes to Financial Statements.
169
Table of Contents
SC DAVIS VENTURE VALUE FUND
| PORTFOLIO OF INVESTMENTS (Continued) December 31, 2010 |
Sun Capital Advisers Trust |
See Notes to Financial Statements.
170
Table of Contents
SC DAVIS VENTURE VALUE FUND
| PORTFOLIO OF INVESTMENTS (Continued) December 31, 2010 |
Sun Capital Advisers Trust |
| ADR | American Depositary Receipt | |
| AN | Netherlands Antilles | |
| BR | Brazil | |
| CA | Canada | |
| CH | Switzerland | |
| CN | China | |
| GB | Great Britain | |
| HK | Hong Kong | |
| MX | Mexico | |
| NL | Netherlands | |
| * | Non-income producing security. |
| ** | Unless otherwise noted the issuer country code for all securities is United States. |
| (1) | Eligible for resale under rule 144A of the Securities Act of 1933. These securities may be resold in transactions exempt from registration, normally to qualified institutional buyers. At the period end, the value of these securities amounted to $953,784, representing 0.2% of net assets. |
| (2) | Interest rates represent annualized yield at date of purchase. |
See Notes to Financial Statements.
171
Table of Contents
| SC DAVIS VENTURE VALUE FUND PORTFOLIO OF INVESTMENTS (Continued) | ||
| December 31, 2010 | Sun Capital Advisers Trust | |
| (3) | Fair Value Measurements † |
The following table summarizes the inputs used to value the Fund’s assets and liabilities, as applicable, measured at fair value at the period end:
| Assets |
Quoted Prices in Active Markets for Identical Assets and Liabilities (Level 1) |
Significant Other Observable Inputs (Level 2) |
Significant Unobservable Inputs (Level 3) |
Total | ||||||||||||
| Common Stocks |
||||||||||||||||
| Aerospace & Defense |
$ | 3,050,872 | $ | — | $ | — | $ | 3,050,872 | ||||||||
| Automobiles |
6,749,764 | — | — | 6,749,764 | ||||||||||||
| Beverages |
11,213,961 | 5,726,662 | — | 16,940,623 | ||||||||||||
| Capital Markets |
19,363,678 | 11,363,551 | — | 30,727,229 | ||||||||||||
| Chemicals |
8,058,463 | — | — | 8,058,463 | ||||||||||||
| Commercial Banks |
19,391,156 | — | — | 19,391,156 | ||||||||||||
| Commercial Services & Supplies |
6,958,382 | — | — | 6,958,382 | ||||||||||||
| Computers & Peripherals |
3,666,068 | — | — | 3,666,068 | ||||||||||||
| Construction Materials |
1,639,319 | — | — | 1,639,319 | ||||||||||||
| Consumer Finance |
18,463,111 | — | — | 18,463,111 | ||||||||||||
| Containers & Packaging |
9,195,161 | — | — | 9,195,161 | ||||||||||||
| Diversified Financial Services |
2,144,347 | — | — | 2,144,347 | ||||||||||||
| Energy Equipment & Services |
4,345,535 | — | — | 4,345,535 | ||||||||||||
| Food & Staples Retailing |
37,131,484 | — | — | 37,131,484 | ||||||||||||
| Food Products |
5,727,579 | 895,909 | — | 6,623,488 | ||||||||||||
| Health Care Equipment & Supplies |
7,283,785 | — | — | 7,283,785 | ||||||||||||
| Health Care Providers & Services |
7,529,759 | — | — | 7,529,759 | ||||||||||||
| Household Durables |
— | 785,229 | — | 785,229 | ||||||||||||
| Household Products |
4,046,679 | — | — | 4,046,679 | ||||||||||||
| Industrial Conglomerates |
1,463,744 | — | — | 1,463,744 | ||||||||||||
| Insurance |
38,099,822 | — | — | 38,099,822 | ||||||||||||
| Internet & Catalog Retail |
1,597,217 | — | — | 1,597,217 | ||||||||||||
| Internet Software & Services |
4,543,870 | — | — | 4,543,870 | ||||||||||||
| IT Services |
1,197,164 | — | — | 1,197,164 | ||||||||||||
| Life Sciences Tools & Services |
4,173,990 | — | — | 4,173,990 | ||||||||||||
| Marine |
— | 6,025,658 | — | 6,025,658 | ||||||||||||
| Media |
2,686,877 | — | — | 2,686,877 | ||||||||||||
| Metals & Mining |
— | 6,655,206 | — | 6,655,206 | ||||||||||||
| Oil, Gas & Consumable Fuels |
53,325,339 | 6,743,660 | — | 60,068,999 | ||||||||||||
| Paper & Forest Products |
6,318,025 | 147,568 | — | 6,465,593 | ||||||||||||
| Personal Products |
— | 821,647 | — | 821,647 | ||||||||||||
| Pharmaceuticals |
32,024,067 | 4,205,241 | — | 36,229,308 | ||||||||||||
| Professional Services |
763,437 | — | — | 763,437 | ||||||||||||
| Real Estate Management & Development |
3,425,541 | 4,412,680 | — | 7,838,221 | ||||||||||||
| Semiconductors & Semiconductor Equipment |
7,317,537 | — | — | 7,317,537 | ||||||||||||
| Software |
5,978,956 | — | — | 5,978,956 | ||||||||||||
| Specialty Retail |
11,225,526 | — | — | 11,225,526 | ||||||||||||
| Tobacco |
4,771,834 | — | — | 4,771,834 | ||||||||||||
See Notes to Financial Statements.
172
Table of Contents
| SC DAVIS VENTURE VALUE FUND PORTFOLIO OF INVESTMENTS (Continued) | ||
| December 31, 2010 | Sun Capital Advisers Trust | |
| Assets (Continued) |
Quoted Prices in Active Markets for Identical Assets and Liabilities (Level 1) |
Significant Other Observable Inputs (Level 2) |
Significant Unobservable Inputs (Level 3) |
Total | ||||||||||||
| Transportation Infrastructure |
$ | — | $ | 6,705,123 | $ | — | $ | 6,705,123 | ||||||||
| Wireless Telecommunication Services |
1,499,441 | — | — | 1,499,441 | ||||||||||||
| Total Common Stocks |
356,371,490 | 54,488,134 | — | 410,859,624 | ||||||||||||
| Short Term Investments |
— | 13,148,854 | — | 13,148,854 | ||||||||||||
| Total Investments |
$ | 356,371,490 | $ | 67,636,988 | $ | — | $ | 424,008,478 | ||||||||
| † | See Note 2b in the Notes to Financial Statements for additional information. |
See Notes to Financial Statements.
173
Table of Contents
SC INVESCO SMALL CAP GROWTH FUND
| PORTFOLIO OF INVESTMENTS December 31, 2010 |
Sun Capital Advisers Trust |
See Notes to Financial Statements.
174
Table of Contents
SC INVESCO SMALL CAP GROWTH FUND
| PORTFOLIO OF INVESTMENTS (Continued) December 31, 2010 |
Sun Capital Advisers Trust |
See Notes to Financial Statements.
175
Table of Contents
SC INVESCO SMALL CAP GROWTH FUND
| PORTFOLIO OF INVESTMENTS (Continued) December 31, 2010 |
Sun Capital Advisers Trust |
See Notes to Financial Statements.
176
Table of Contents
SC INVESCO SMALL CAP GROWTH FUND
| PORTFOLIO OF INVESTMENTS (Continued) December 31, 2010 |
Sun Capital Advisers Trust |
| ADR | American Depositary Receipt | |
| FHLMC | Federal Home Loan Mortgage Corporation | |
| CA | Canada | |
| IL | Israel | |
| NL | Netherlands | |
| + | Amount is less than 0.05%. |
| * | Non-income producing security. |
| ** | Unless otherwise noted the issuer country code for all securities is United States. |
| (1) | Fair Value Measurements † |
The following table summarizes the inputs used to value the Fund’s assets and liabilities, as applicable, measured at fair value at the period end:
| Assets |
Quoted Prices in Active Markets for Identical Assets and Liabilities (Level 1) |
Significant Other Observable Inputs (Level 2) |
Significant Unobservable Inputs (Level 3) |
Total | ||||||||||||
| Common Stocks (a) |
$ | 31,022,073 | $ | — | $ | — | $ | 31,022,073 | ||||||||
| Short Term Investments |
— | 336,616 | — | 336,616 | ||||||||||||
| Total Investments |
$ | 31,022,073 | $ | 336,616 | $ | — | $ | 31,358,689 | ||||||||
| † | See Note 2b in the Notes to Financial Statements for additional information. |
| (a) | See Portfolio of Investments for additional detailed categorizations. |
See Notes to Financial Statements.
177
Table of Contents
SC LORD ABBETT GROWTH & INCOME FUND
| PORTFOLIO OF INVESTMENTS December 31, 2010 |
Sun Capital Advisers Trust |
See Notes to Financial Statements.
178
Table of Contents
SC LORD ABBETT GROWTH & INCOME FUND
| PORTFOLIO OF INVESTMENTS (Continued) December 31, 2010 |
Sun Capital Advisers Trust |
See Notes to Financial Statements.
179
Table of Contents
SC LORD ABBETT GROWTH & INCOME FUND
| PORTFOLIO OF INVESTMENTS (Continued) December 31, 2010 |
Sun Capital Advisers Trust |
| ADR | American Depositary Receipt | |
| AN | Netherlands Antilles | |
| BM | Bermuda | |
| CA | Canada | |
| IE | Ireland | |
| IL | Israel | |
| PA | Panama | |
| * | Non-income producing security. |
| ** | Unless otherwise noted the issuer country code for all securities is United States. |
| (1) | Fair Value Measurements |
All investments are categorized as Level 1 under the fair value hierarchy. See Note 2b in the Notes to Financial Statements for additional information.
See Notes to Financial Statements.
180
Table of Contents
| PORTFOLIO OF INVESTMENTS December 31, 2010 |
Sun Capital Advisers Trust |
See Notes to Financial Statements.
181
Table of Contents
SC WMC BLUE CHIP MID CAP FUND
| PORTFOLIO OF INVESTMENTS (Continued) December 31, 2010 |
Sun Capital Advisers Trust |
See Notes to Financial Statements.
182
Table of Contents
SC WMC BLUE CHIP MID CAP FUND
| PORTFOLIO OF INVESTMENTS (Continued) December 31, 2010 |
Sun Capital Advisers Trust |
See Notes to Financial Statements.
183
Table of Contents
SC WMC BLUE CHIP MID CAP FUND
| PORTFOLIO OF INVESTMENTS (Continued) December 31, 2010 |
Sun Capital Advisers Trust |
| ADR | American Depositary Receipt | |
| FHLMC | Federal Home Loan Mortgage Corporation | |
| BM | Bermuda | |
| CA | Canada | |
| CH | Switzerland | |
| GB | Great Britain | |
| IL | Israel | |
| NL | Netherlands | |
| * | Non-income producing security. |
| ** | Unless otherwise noted the issuer country code for all securities is United States. |
| (1) | Fair Value Measurements † |
The following table summarizes the inputs used to value the Fund’s assets and liabilities, as applicable, measured at fair value at the period end:
| Assets |
Quoted Prices in Active Markets for Identical Assets and Liabilities (Level 1) |
Significant Other Observable Inputs (Level 2) |
Significant Unobservable Inputs (Level 3) |
Total | ||||||||||||
| Common Stocks (a) |
$ | 166,763,235 | $ | — | $ | — | $ | 166,763,235 | ||||||||
| Short Term Investments |
— | 2,142,089 | — | 2,142,089 | ||||||||||||
| Total Investments |
$ | 166,763,235 | $ | 2,142,089 | $ | — | $ | 168,905,324 | ||||||||
| † | See Note 2b in the Notes to Financial Statements for additional information. |
| (a) | See Portfolio of Investments for additional detailed categorizations. |
See Notes to Financial Statements.
184
Table of Contents
| PORTFOLIO OF INVESTMENTS December 31, 2010 |
Sun Capital Advisers Trust |
See Notes to Financial Statements.
185
Table of Contents
SC WMC LARGE CAP GROWTH FUND
| PORTFOLIO OF INVESTMENTS (Continued) December 31, 2010 |
Sun Capital Advisers Trust |
See Notes to Financial Statements.
186
Table of Contents
SC WMC LARGE CAP GROWTH FUND
| PORTFOLIO OF INVESTMENTS (Continued) December 31, 2010 |
Sun Capital Advisers Trust |
| ADR | American Depositary Receipt | |
| ADS | American Depositary Shares | |
| FHLMC | Federal Home Loan Mortgage Corporation | |
| BE | Belgium | |
| BM | Bermuda | |
| BR | Brazil | |
| CA | Canada | |
| GB | Great Britain | |
| IE | Ireland | |
| IL | Israel | |
| KY | Cayman Islands | |
| PA | Panama | |
| * | Non-income producing security. |
| ** | Unless otherwise noted the issuer country code for all securities is United States. |
| (1) | Fair Value Measurements † |
The following table summarizes the inputs used to value the Fund’s assets and liabilities, as applicable, measured at fair value at the period end:
| Assets |
Quoted Prices in Active Markets for Identical Assets and Liabilities (Level 1) |
Significant Other Observable Inputs (Level 2) |
Significant Unobservable Inputs (Level 3) |
Total | ||||||||||||
| Common Stocks (a) |
$ | 191,330,621 | $ | — | $ | — | $ | 191,330,621 | ||||||||
| Short Term Investments |
— | 80,092 | — | 80,092 | ||||||||||||
| Total Investments |
$ | 191,330,621 | $ | 80,092 | $ | — | $ | 191,410,713 | ||||||||
| † | See Note 2b in the Notes to Financial Statements for additional information. |
| (a) | See Portfolio of Investments for additional detailed categorizations. |
See Notes to Financial Statements.
187
Table of Contents
SUN CAPITAL GLOBAL REAL ESTATE FUND
| PORTFOLIO OF INVESTMENTS December 31, 2010 |
Sun Capital Advisers Trust |
See Notes to Financial Statements.
188
Table of Contents
SUN CAPITAL GLOBAL REAL ESTATE FUND
| PORTFOLIO OF INVESTMENTS (Continued) December 31, 2010 |
Sun Capital Advisers Trust |
See Notes to Financial Statements.
189
Table of Contents
| SUN CAPITAL GLOBAL REAL ESTATE FUND PORTFOLIO OF INVESTMENTS (Continued) | ||
| December 31, 2010 | Sun Capital Advisers Trust | |
| (1) | Fair Value Measurements † |
The following table summarizes the inputs used to value the Fund’s assets and liabilities, as applicable, measured at fair value at the period end:
| Assets |
Quoted Prices in Active Markets for Identical Assets and Liabilities (Level 1) |
Significant Other Observable Inputs (Level 2) |
Significant Unobservable Inputs (Level 3) |
Total | ||||||||||||
| Common Stocks |
||||||||||||||||
| Real Estate Investment Trusts |
||||||||||||||||
| Diversified |
$ | 8,372,271 | $ | 11,960,737 | $ | — | $ | 20,333,008 | ||||||||
| Industrial |
4,154,811 | 10,082,668 | — | 14,237,479 | ||||||||||||
| Mortgage |
3,564,627 | — | — | 3,564,627 | ||||||||||||
| Office |
24,849,608 | 2,729,129 | — | 27,578,737 | ||||||||||||
| Residential |
14,431,818 | — | — | 14,431,818 | ||||||||||||
| Retail |
19,232,242 | 39,588,917 | — | 58,821,159 | ||||||||||||
| Specialized |
28,205,968 | 1,910,156 | — | 30,116,124 | ||||||||||||
| Total Real Estate Investment Trusts |
102,811,345 | 66,271,607 | — | 169,082,952 | ||||||||||||
| Real Estate Management & Development |
||||||||||||||||
| Diversified Real Estate Activities |
— | 52,841,081 | — | 52,841,081 | ||||||||||||
| Real Estate Operating Companies |
— | 24,376,826 | — | 24,376,826 | ||||||||||||
| Total Real Estate Management & Development |
— | 77,217,907 | — | 77,217,907 | ||||||||||||
| Total Common Stocks |
102,811,345 | 143,489,514 | — | 246,300,859 | ||||||||||||
| Short Term Investments |
||||||||||||||||
| Mutual Funds |
7,376,078 | — | — | 7,376,078 | ||||||||||||
| Total Investments |
$ | 110,187,423 | $ | 143,489,514 | $ | — | $ | 253,676,937 | ||||||||
| † | See Note 2b in the Notes to Financial Statements for additional information. |
See Notes to Financial Statements.
190
Table of Contents
SC IBBOTSON TACTICAL OPPORTUNITIES FUND
| PORTFOLIO OF INVESTMENTS December 31, 2010 |
Sun Capital Advisers Trust |
| ETF | Exchange Traded Fund | |
| REIT | Real Estate Investment Trust | |
| SPDR | Standard and Poor’s Depositary Receipts |
| (1) | Fair Value Measurements |
All investments are categorized as Level 1 under the fair value hierarchy. See Note 2b in the Notes to Financial Statements for additional information.
See Notes to Financial Statements.
191
Table of Contents
SUN CAPITAL INVESTMENT GRADE BOND FUND
| PORTFOLIO OF INVESTMENTS December 31, 2010 |
Sun Capital Advisers Trust |
See Notes to Financial Statements.
192
Table of Contents
SUN CAPITAL INVESTMENT GRADE BOND FUND
| PORTFOLIO OF INVESTMENTS (Continued) December 31, 2010 |
Sun Capital Advisers Trust |
See Notes to Financial Statements.
193
Table of Contents
SUN CAPITAL INVESTMENT GRADE BOND FUND
| PORTFOLIO OF INVESTMENTS (Continued) December 31, 2010 |
Sun Capital Advisers Trust |
See Notes to Financial Statements.
194
Table of Contents
SUN CAPITAL INVESTMENT GRADE BOND FUND
| PORTFOLIO OF INVESTMENTS (Continued) December 31, 2010 |
Sun Capital Advisers Trust |
See Notes to Financial Statements.
195
Table of Contents
SUN CAPITAL INVESTMENT GRADE BOND FUND
| PORTFOLIO OF INVESTMENTS (Continued) December 31, 2010 |
Sun Capital Advisers Trust |
See Notes to Financial Statements.
196
Table of Contents
SUN CAPITAL INVESTMENT GRADE BOND FUND
| PORTFOLIO OF INVESTMENTS (Continued) December 31, 2010 |
Sun Capital Advisers Trust |
See Notes to Financial Statements.
197
Table of Contents
SUN CAPITAL INVESTMENT GRADE BOND FUND
| PORTFOLIO OF INVESTMENTS (Continued) December 31, 2010 |
Sun Capital Advisers Trust |
| FDIC | Federal Deposit Insurance Corporation | |
| NCUA | National Credit Union Administration | |
| SNAT | Supranational | |
| TBA | To Be Announced. Securities are purchased on a forward commitment basis with an approximate principal amount and no definite maturity date. The actual principal and maturity date will be determined upon settlement when the specific mortgage pools are assigned. At the period end, total market value of the TBA securities amounts to $85,845,604 which represents approximately 23.0% of net assets. | |
| TLGP | Temporary Liquidity Guarantee Program. Under the Temporary Liquidity Guarantee Program, the Federal Deposit Insurance Corporation guarantees principal and interest in the event of payment default or bankruptcy until the earlier of maturity date of the debt or until June 30, 2012. | |
| AU | Australia | |
| BM | Bermuda | |
| CA | Canada | |
| CH | Switzerland | |
| DE | Germany | |
| GB | Great Britain | |
| LU | Luxembourg | |
| MX | Mexico | |
| NL | Netherlands | |
| VG | British Virgin Islands | |
See Notes to Financial Statements.
198
Table of Contents
| SUN CAPITAL INVESTMENT GRADE BOND FUND PORTFOLIO OF INVESTMENTS (Continued) | ||
| December 31, 2010 | Sun Capital Advisers Trust | |
| * | Unless otherwise noted the issuer country code for all securities is United States. |
| ** | Security is fair valued by management. |
| + | Amount is less than 0.05%. |
| (1) | Security is in default and is non-income producing. |
| (2) | Variable rate security. The interest rate shown reflects the rate in effect at the period end. |
| (3) | Eligible for resale under rule 144A or exempt from registration under Section 4(2) of the Securities Act of 1933. These securities may be resold in transactions exempt from registration. At the period end, the value of these securities amounted to $100,100,818, representing 26.8% of net assets. |
| (4) | Security (or a portion thereof) has been purchased on a delayed delivery or when-issued basis. |
| (5) | Interest rates represent annualized yield at date of purchase. |
| (6) | Fair Value Measurements † |
The following table summarizes the inputs used to value the Fund’s assets and liabilities, as applicable, measured at fair value at the period end:
| Assets |
Quoted Prices in Active Markets for Identical Assets and Liabilities (Level 1) |
Significant Other Observable Inputs (Level 2) |
Significant Unobservable Inputs (Level 3) |
Total | ||||||||||||
| Asset Backed Securities |
$ | — | $ | 376,375 | $ | — | * | $ | 376,375 | |||||||
| Collateralized Mortgage Obligations |
— | 123,173 | — | 123,173 | ||||||||||||
| Commercial Mortgage Backed Securities |
— | 11,369,422 | — | 11,369,422 | ||||||||||||
| Corporate Debt Obligations (a) |
— | 215,622,452 | — | 215,622,452 | ||||||||||||
| Residential Non-Agency Mortgage Backed Securities |
— | 7,441,594 | — | 7,441,594 | ||||||||||||
| U.S. Government Guaranteed Notes |
— | 8,443,920 | — | 8,443,920 | ||||||||||||
| U.S. Treasury and U.S. Government Agency Obligations |
27,027,737 | 127,154,412 | — | 154,182,149 | ||||||||||||
| Short Term Investments |
||||||||||||||||
| Commercial Paper |
— | 34,894,468 | — | 34,894,468 | ||||||||||||
| Foreign Government Obligations |
— | 3,999,282 | — | 3,999,282 | ||||||||||||
| Foreign Government Sponsored Commercial Paper |
— | 7,996,059 | — | 7,996,059 | ||||||||||||
| U.S. Government Agency Obligation |
— | 1,999,887 | — | 1,999,887 | ||||||||||||
| Mutual Funds |
9,578,518 | — | — | 9,578,518 | ||||||||||||
| Total Short Term Investments |
9,578,518 | 48,889,696 | — | 58,468,214 | ||||||||||||
| Total Investments |
$ | 36,606,255 | $ | 419,421,044 | $ | — | * | $ | 456,027,299 | |||||||
| † | See Note 2b in the Notes to Financial Statements for additional information. |
| * | The only investment held by the Fund whose fair value was determined using Level 3 inputs had a value of $0 and $0 at December 31, 2009, and December 31, 2010. |
| (a) | See Portfolio of Investments for additional detailed categorizations. |
See Notes to Financial Statements.
199
Table of Contents
| PORTFOLIO OF INVESTMENTS December 31, 2010 |
Sun Capital Advisers Trust |
See Notes to Financial Statements.
200
Table of Contents
SUN CAPITAL MONEY MARKET FUND
| PORTFOLIO OF INVESTMENTS (Continued) December 31, 2010 |
Sun Capital Advisers Trust |
| SNAT | Supranational | |
| TLGP | Temporary Liquidity Guarantee Program. Under the Temporary Liquidity Guarantee Program, the Federal Deposit Insurance Corporation guarantees principal and interest in the event of payment default or bankruptcy until the earlier of maturity date of the debt or until June 30, 2012. | |
| CA | Canada | |
| DE | Germany | |
| * | Unless otherwise noted the issuer country code for all securities is United States. | |
| (1) | Interest rates represent annualized yield at date of purchase. | |
| (2) | Security exempt from registration under Section 4(2) of the Securities Act of 1933. These securities may be resold in transactions exempt from registration. At the period end, the value of these securities amounted to $56,490,491, representing 30.3% of net assets. | |
| (3) | Variable rate security. The interest rate shown reflects the rate in effect at the period end. | |
See Notes to Financial Statements.
201
Table of Contents
SUN CAPITAL MONEY MARKET FUND
| PORTFOLIO OF INVESTMENTS (Continued) December 31, 2010 |
Sun Capital Advisers Trust |
| (4) | Fair Value Measurements † |
The following table summarizes the inputs used to value the Fund’s assets and liabilities, as applicable, measured at fair value at the period end:
| Assets |
Quoted Prices in Active Markets for Identical Assets and Liabilities (Level 1) |
Significant Other Observable Inputs (Level 2) |
Significant Unobservable Inputs (Level 3) |
Total | ||||||||||||
| Commercial Paper |
$ | — | $ | 86,444,591 | $ | — | $ | 86,444,591 | ||||||||
| Foreign Government Obligations |
— | 20,497,344 | — | 20,497,344 | ||||||||||||
| Foreign Government Sponsored Commercial Paper |
— | 8,995,766 | — | 8,995,766 | ||||||||||||
| U.S. Government Guaranteed Notes |
— | 19,000,000 | — | 19,000,000 | ||||||||||||
| U.S. Treasury and U.S. Government Agency Obligations |
— | 37,841,797 | — | 37,841,797 | ||||||||||||
| Mutual Funds |
14,137,776 | — | — | 14,137,776 | ||||||||||||
| Total Investments |
$ | 14,137,776 | $ | 172,779,498 | $ | — | $ | 186,917,274 | ||||||||
| † | See Note 2b in the Notes to Financial Statements for additional information. |
See Notes to Financial Statements.
202
Table of Contents
SC BLACKROCK INFLATION PROTECTED BOND FUND
| PORTFOLIO OF INVESTMENTS December 31, 2010 |
Sun Capital Advisers Trust |
See Notes to Financial Statements.
203
Table of Contents
SC BLACKROCK INFLATION PROTECTED BOND FUND
| PORTFOLIO OF INVESTMENTS (Continued) December 31, 2010 |
Sun Capital Advisers Trust |
| DE | Germany | |
| FR | France | |
| GR | Greece | |
| * | Unless otherwise noted the issuer country code for all securities is United States. | |
| (1) | Variable rate security. The interest rate shown reflects the rate in effect at the period end. | |
| (2) | Security (or a portion thereof) has been pledged as collateral for open swap contracts. At the period end, the value of securities pledged amounted to $294,400. | |
| (3) | At the period end, securities (or portions thereof) with an aggregate market value of $1,897,106 have been pledged to cover margin requirements for the following open futures contracts: | |
| Type |
Description |
Expiration Date |
Contracts | Aggregate Face Value ($) |
Aggregate Notional Value ($) |
Unrealized Appreciation/ (Depreciation) ($) |
||||||||||||||||
| Short |
German Euro-Bobl March Futures | 3/8/11 | 250 | 39,472,475 | 39,681,426 | (208,951 | ) | |||||||||||||||
| Long |
U.S. Treasury 10 Year Note March Futures | 3/22/11 | 216 | 26,128,000 | 26,014,500 | (113,500 | ) | |||||||||||||||
| Long |
U.S. Treasury 2 Year Note March Futures | 3/31/11 | 127 | 27,809,248 | 27,801,094 | (8,154 | ) | |||||||||||||||
| Long |
U.S. Treasury 30 Year Bond March Futures | 3/22/11 | 24 | 2,912,250 | 2,931,000 | 18,750 | ||||||||||||||||
| Short |
U.S. Treasury 5 Year Note March Futures | 3/31/11 | 1,292 | 151,969,683 | 152,092,625 | (122,942 | ) | |||||||||||||||
| Short |
Ultra Long U.S. Treasury Bond March Futures | 3/22/11 | 26 | 3,303,026 | 3,304,438 | (1,412 | ) | |||||||||||||||
| Net unrealized depreciation |
|
(436,209 | ) | |||||||||||||||||||
| (4) | At the period end, open forward foreign currency exchange contracts were as follows: |
| Counterparty |
Contracts to Deliver | In Exchange For | Settlement Date |
Unrealized Depreciation ($) |
||||||||||||||||||||
| Citibank NA | USD | 100,260 | EUR | 75,000 | 1/28/11 | (43 | ) | |||||||||||||||||
| Deutsche Bank AG | EUR | 28,374,000 | USD | 37,275,293 | 1/28/11 | (638,904 | ) | |||||||||||||||||
| Net unrealized depreciation |
(638,947 | ) | ||||||||||||||||||||||
| EUR | – | Euro | ||
| USD | – | United States Dollar |
See Notes to Financial Statements.
204
Table of Contents
SC BLACKROCK INFLATION PROTECTED BOND FUND
| PORTFOLIO OF INVESTMENTS (Continued) December 31, 2010 |
Sun Capital Advisers Trust |
| (5) | At the period end, open written option contracts were as follows: |
Interest Rate Swaptions
| Type |
Description |
Counterparty | Pay/Receive Floating Rate |
Floating Rate |
Exercise Rate |
Expiration Date |
Notional Amount (000) ($) |
Value ($) | ||||||||||||||||||
| Put | OTC - 10 Year Interest Rate Swap | Barclays Bank PLC | Pay | 3-Month USD-LIBOR |
4.13 | % | 12/16/11 | 6,200 | 183,187 | |||||||||||||||||
| Call | OTC - 10 Year Interest Rate Swap | Barclays Bank PLC | Receive | 3-Month USD-LIBOR |
4.13 | % | 12/16/11 | 6,200 | 324,299 | |||||||||||||||||
| Put | OTC - 10 Year Interest Rate Swap | Deutsche Bank AG | Pay | 3-Month USD-LIBOR |
3.99 | % | 12/19/11 | 5,500 | 188,492 | |||||||||||||||||
| Call | OTC - 10 Year Interest Rate Swap | Deutsche Bank AG | Receive | 3-Month USD-LIBOR |
3.99 | % | 12/19/11 | 5,500 | 248,095 | |||||||||||||||||
| Put | OTC - 10 Year Interest Rate Swap | Deutsche Bank AG | Pay | 3-Month USD-LIBOR |
4.13 | % | 12/16/11 | 4,000 | 118,185 | |||||||||||||||||
| Call | OTC - 10 Year Interest Rate Swap | Deutsche Bank AG | Receive | 3-Month USD-LIBOR |
4.13 | % | 12/16/11 | 4,000 | 209,225 | |||||||||||||||||
| Written swaptions (Premium received, $1,282,390) |
31,400 | 1,271,483 | ||||||||||||||||||||||||
| LIBOR | – | London Interbank Offered Rate | ||
| USD | – | United States Dollar |
| (6) | At the period end, open swap contracts were as follows: |
Interest Rate Swap Contracts
| Counterparty |
Pay/Receive Floating Rate |
Floating Rate Index | Fixed Rate |
Expiration Date |
Notional Amount (000) ($) |
Market Value ($) |
Unrealized Appreciation/ (Depreciation) ($) |
|||||||||||||||||||||
| Citibank NA |
Pay | 3-Month USD-LIBOR | 2.26 | % | 6/21/15 | 1,700 | 22,518 | 22,518 | ||||||||||||||||||||
| Citibank NA |
Pay | 3-Month USD-LIBOR | 3.28 | % | 12/16/20 | 5,100 | (42,315 | ) | (42,315 | ) | ||||||||||||||||||
| Citibank NA |
Receive | 3-Month USD-LIBOR | 3.58 | % | 5/12/20 | 900 | (22,051 | ) | (22,051 | ) | ||||||||||||||||||
| Deutsche Bank AG |
Pay | CPURNSA Index | 2.47 | % | 10/25/20 | 5,000 | (51,453 | ) | (51,453 | ) | ||||||||||||||||||
| Deutsche Bank AG |
Receive | 3-Month USD-LIBOR | 0.83 | % | 7/27/12 | 20,400 | (69,767 | ) | (69,767 | ) | ||||||||||||||||||
| Deutsche Bank AG |
Receive | 3-Month USD-LIBOR | 0.94 | % | 12/20/12 | 4,200 | (13,607 | ) | (13,607 | ) | ||||||||||||||||||
| Deutsche Bank AG |
Receive | CPURNSA Index | 1.84 | % | 10/25/15 | 9,400 | 94,614 | 94,614 | ||||||||||||||||||||
| Deutsche Bank AG |
Receive | 3-Month USD-LIBOR | 2.34 | % | 12/20/15 | 1,600 | (13,550 | ) | (13,550 | ) | ||||||||||||||||||
| Total |
48,300 | (95,611 | ) | (95,611 | ) | |||||||||||||||||||||||
Total Return Swap Contracts
| Pay/Receive |
Counterparty |
Reference Entity |
Number of |
Floating Rate |
Notional Amount (000) ($) |
Maturity |
Market Value ($) |
Unrealized Depreciation ($) |
||||||||||||||
| Receive | Barclays Bank PLC | Barclays Capital Inflation Linked Index |
562,743 | 1-Month USD-LIBOR |
136,302 | 1/24/11 | (489,587 | ) | (489,587 | ) | ||||||||||||
See Notes to Financial Statements.
205
Table of Contents
SC BLACKROCK INFLATION PROTECTED BOND FUND
| PORTFOLIO OF INVESTMENTS (Continued) December 31, 2010 |
Sun Capital Advisers Trust |
| CPURNSA | – | Consumer Price All Urban Non-Seasonally Adjusted Index | ||
| LIBOR | – | London Interbank Offered Rate | ||
| USD | – | United States Dollar |
| (7) | Fair Value Measurements † |
The following table summarizes the inputs used to value the Fund’s assets and liabilities, as applicable, measured at fair value at the period end:
| Assets |
Quoted Prices in Active Markets for Identical Assets and Liabilities (Level 1) |
Significant Other Observable Inputs (Level 2) |
Significant Unobservable Inputs (Level 3) |
Total | ||||||||||||
| Asset Backed Securities |
$ | — | $ | 805,622 | $ | — | $ | 805,622 | ||||||||
| Corporate Debt Obligations (a) |
— | 398,953 | — | 398,953 | ||||||||||||
| Foreign Government Obligations |
— | 38,512,614 | — | 38,512,614 | ||||||||||||
| U.S. Treasury and U.S. Government Agency Obligations |
196,762,956 | 88,858,848 | — | 285,621,804 | ||||||||||||
| Short Term Investments |
||||||||||||||||
| Mutual Funds |
54,217,991 | — | — | 54,217,991 | ||||||||||||
| Total Investments |
250,980,947 | 128,576,037 | — | 379,556,984 | ||||||||||||
| Financial Derivative Instruments |
||||||||||||||||
| Futures Contracts |
18,750 | — | — | 18,750 | ||||||||||||
| Swap Contracts (a) |
— | 117,132 | — | 117,132 | ||||||||||||
| Total Financial Derivative Instruments |
$ | 18,750 | $ | 117,132 | $ | — | $ | 135,882 | ||||||||
| Liabilities |
||||||||||||||||
| Financial Derivative Instruments |
||||||||||||||||
| Futures Contracts |
$ | (454,959 | ) | $ | — | $ | — | $ | (454,959 | ) | ||||||
| Forward Foreign Currency Exchange Contracts |
— | (638,947 | ) | — | (638,947 | ) | ||||||||||
| Written Swaption Contracts |
— | (1,271,483 | ) | — | (1,271,483 | ) | ||||||||||
| Swap Contracts (a) |
— | (702,330 | ) | — | (702,330 | ) | ||||||||||
| Total Financial Derivative Instruments |
$ | (454,959 | ) | $ | (2,612,760 | ) | $ | — | $ | (3,067,719 | ) | |||||
| † | See Note 2b in the Notes to Financial Statements for additional information. |
| (a) | See Portfolio of Investments for additional detailed categorizations. |
See Notes to Financial Statements.
206
Table of Contents
SC GOLDMAN SACHS SHORT DURATION FUND
| PORTFOLIO OF INVESTMENTS December 31, 2010 |
Sun Capital Advisers Trust |
See Notes to Financial Statements.
207
Table of Contents
SC GOLDMAN SACHS SHORT DURATION FUND
| PORTFOLIO OF INVESTMENTS (Continued) December 31, 2010 |
Sun Capital Advisers Trust |
See Notes to Financial Statements.
208
Table of Contents
SC GOLDMAN SACHS SHORT DURATION FUND
| PORTFOLIO OF INVESTMENTS (Continued) December 31, 2010 |
Sun Capital Advisers Trust |
See Notes to Financial Statements.
209
Table of Contents
SC GOLDMAN SACHS SHORT DURATION FUND
| PORTFOLIO OF INVESTMENTS (Continued) December 31, 2010 |
Sun Capital Advisers Trust |
See Notes to Financial Statements.
210
Table of Contents
SC GOLDMAN SACHS SHORT DURATION FUND
| PORTFOLIO OF INVESTMENTS (Continued) December 31, 2010 |
Sun Capital Advisers Trust |
See Notes to Financial Statements.
211
Table of Contents
SC GOLDMAN SACHS SHORT DURATION FUND
| PORTFOLIO OF INVESTMENTS (Continued) December 31, 2010 |
Sun Capital Advisers Trust |
See Notes to Financial Statements.
212
Table of Contents
SC GOLDMAN SACHS SHORT DURATION FUND
| PORTFOLIO OF INVESTMENTS (Continued) December 31, 2010 |
Sun Capital Advisers Trust |
| FDIC | Federal Deposit Insurance Corporation | |
| NCUA | National Credit Union Administration | |
| TBA | To Be Announced. Securities are purchased on a forward commitment basis with an approximate principal amount and no definite maturity date. The actual principal and maturity date will be determined upon settlement when the specific mortgage pools are assigned. At the period end, total market value of the TBA securities amounts to $149,936,862 which represents approximately 13.0% of net assets. | |
| TLGP | Temporary Liquidity Guarantee Program. Under the Temporary Liquidity Guarantee Program, the Federal Deposit Insurance Corporation guarantees principal and interest in the event of payment default or bankruptcy until the earlier of maturity date of the debt or until June 30, 2012. | |
| AU | Australia | |
| CA | Canada | |
| CH | Switzerland | |
| CL | Chile | |
| DE | Germany | |
| DK | Denmark | |
| ES | Spain | |
| FR | France | |
| GB | Great Britain | |
| IT | Italy | |
| KY | Cayman Islands | |
| LU | Luxembourg | |
| NL | Netherlands | |
| NO | Norway | |
| NZ | New Zealand | |
| SE | Sweden | |
| * | Amount is less than $500. |
| ** | Unless otherwise noted the issuer country code for all securities is United States. |
| (1) | Eligible for resale under rule 144A of the Securities Act of 1933. These securities may be resold in transactions exempt from registration, normally to qualified institutional buyers. At the period end, the value of these securities amounted to $162,010,583, representing 14.0% of net assets. |
| (2) | Variable rate security. The interest rate shown reflects the rate in effect at the period end. |
| (3) | Security (or a portion thereof) has been purchased on a delayed delivery or when-issued basis. |
See Notes to Financial Statements.
213
Table of Contents
SC GOLDMAN SACHS SHORT DURATION FUND
| PORTFOLIO OF INVESTMENTS (Continued) December 31, 2010 |
Sun Capital Advisers Trust |
| (4) | At the period end, securities (or portions thereof) with an aggregate market value of $2,029,220 have been pledged to cover margin requirements for the following open futures contracts: |
| Type |
Description |
Expiration Date |
Contracts | Aggregate Face Value ($) |
Aggregate Notional Value ($) |
Unrealized Appreciation/ (Depreciation) ($) |
||||||||||||||||
| Short |
90-Day Eurodollar December Futures | 12/19/11 | 103 | 25,156,205 | 25,562,025 | (405,820 | ) | |||||||||||||||
| Long |
90-Day Eurodollar March Futures | 3/19/12 | 310 | 76,756,697 | 76,763,750 | 7,053 | ||||||||||||||||
| Short |
U.S. Treasury 10 Year Note March Futures | 3/22/11 | 244 | 29,552,161 | 29,386,750 | 165,411 | ||||||||||||||||
| Long |
U.S. Treasury 2 Year Note March Futures | 3/31/11 | 1,268 | 278,007,397 | 277,573,125 | (434,272 | ) | |||||||||||||||
| Short |
U.S. Treasury 30 Year Bond March Futures | 3/22/11 | 343 | 42,614,356 | 41,888,875 | 725,481 | ||||||||||||||||
| Short |
U.S. Treasury 5 Year Note March Futures | 3/31/11 | 13 | 1,555,898 | 1,530,344 | 25,554 | ||||||||||||||||
| Long |
Ultra Long U.S. Treasury Bond March Futures | 3/22/11 | 12 | 1,551,158 | 1,525,125 | (26,033 | ) | |||||||||||||||
| Net unrealized appreciation |
57,374 | |||||||||||||||||||||
| (5) | Fair Value Measurements † |
The following table summarizes the inputs used to value the Fund’s assets and liabilities, as applicable, measured at fair value at the period end:
| Assets |
Quoted Prices in Active Markets for Identical Assets and Liabilities (Level 1) |
Significant Other Observable Inputs (Level 2) |
Significant Unobservable Inputs (Level 3) |
Total | ||||||||||||
| Asset Backed Securities |
$ | — | $ | 64,018,890 | $ | — | $ | 64,018,890 | ||||||||
| Collateralized Mortgage Obligations |
— | 14,985,699 | — | 14,985,699 | ||||||||||||
| Convertible Bonds (a) |
— | 4,383,250 | — | 4,383,250 | ||||||||||||
| Corporate Debt Obligations (a) |
— | 447,902,768 | — | 447,902,768 | ||||||||||||
| Foreign Government Agency Obligations |
— | 6,758,719 | — | 6,758,719 | ||||||||||||
| Foreign Government Obligations |
— | 14,574,846 | — | 14,574,846 | ||||||||||||
| Municipal Bonds |
— | 21,753,735 | — | 21,753,735 | ||||||||||||
| U.S. Government Guaranteed Notes |
— | 86,777,136 | — | 86,777,136 | ||||||||||||
| U.S. Treasury and U.S. Government Agency Obligations |
250,729,046 | 201,026,181 | — | 451,755,227 | ||||||||||||
| Short Term Investments |
||||||||||||||||
| Municipal Bonds |
— | 5,125,449 | — | 5,125,449 | ||||||||||||
| Mutual Funds |
182,539,480 | — | — | 182,539,480 | ||||||||||||
| Total Short Term Investments |
182,539,480 | 5,125,449 | — | 187,664,929 | ||||||||||||
| Total Investments |
433,268,526 | 867,306,673 | — | 1,300,575,199 | ||||||||||||
| Financial Derivative Instruments |
||||||||||||||||
| Futures Contracts |
923,499 | — | — | 923,499 | ||||||||||||
| Total Financial Derivative Instruments |
$ | 923,499 | $ | — | $ | — | $ | 923,499 | ||||||||
| Liabilities |
||||||||||||||||
| Financial Derivative Instruments |
||||||||||||||||
| Futures Contracts |
$ | (866,125 | ) | $ | — | $ | — | $ | (866,125 | ) | ||||||
| Total Financial Derivative Instruments |
$ | (866,125 | ) | $ | — | $ | — | $ | (866,125 | ) | ||||||
| † | See Note 2b in the Notes to Financial Statements for additional information. |
| (a) | See Portfolio of Investments for additional detailed categorizations. |
See Notes to Financial Statements.
214
Table of Contents
| PORTFOLIO OF INVESTMENTS December 31, 2010 |
Sun Capital Advisers Trust |
See Notes to Financial Statements.
215
Table of Contents
SC PIMCO HIGH YIELD FUND
| PORTFOLIO OF INVESTMENTS (Continued) December 31, 2010 |
Sun Capital Advisers Trust |
See Notes to Financial Statements.
216
Table of Contents
SC PIMCO HIGH YIELD FUND
| PORTFOLIO OF INVESTMENTS (Continued) December 31, 2010 |
Sun Capital Advisers Trust |
See Notes to Financial Statements.
217
Table of Contents
SC PIMCO HIGH YIELD FUND
| PORTFOLIO OF INVESTMENTS (Continued) December 31, 2010 |
Sun Capital Advisers Trust |
See Notes to Financial Statements.
218
Table of Contents
SC PIMCO HIGH YIELD FUND
| PORTFOLIO OF INVESTMENTS (Continued) December 31, 2010 |
Sun Capital Advisers Trust |
See Notes to Financial Statements.
219
Table of Contents
SC PIMCO HIGH YIELD FUND
| PORTFOLIO OF INVESTMENTS (Continued) December 31, 2010 |
Sun Capital Advisers Trust |
See Notes to Financial Statements.
220
Table of Contents
SC PIMCO HIGH YIELD FUND
| PORTFOLIO OF INVESTMENTS (Continued) December 31, 2010 |
Sun Capital Advisers Trust |
See Notes to Financial Statements.
221
Table of Contents
SC PIMCO HIGH YIELD FUND
| PORTFOLIO OF INVESTMENTS (Continued) December 31, 2010 |
Sun Capital Advisers Trust |
See Notes to Financial Statements.
222
Table of Contents
SC PIMCO HIGH YIELD FUND
| PORTFOLIO OF INVESTMENTS (Continued) December 31, 2010 |
Sun Capital Advisers Trust |
See Notes to Financial Statements.
223
Table of Contents
SC PIMCO HIGH YIELD FUND
| PORTFOLIO OF INVESTMENTS (Continued) December 31, 2010 |
Sun Capital Advisers Trust |
See Notes to Financial Statements.
224
Table of Contents
SC PIMCO HIGH YIELD FUND
| PORTFOLIO OF INVESTMENTS (Continued) December 31, 2010 |
Sun Capital Advisers Trust |
See Notes to Financial Statements.
225
Table of Contents
SC PIMCO HIGH YIELD FUND
| PORTFOLIO OF INVESTMENTS (Continued) December 31, 2010 |
Sun Capital Advisers Trust |
See Notes to Financial Statements.
226
Table of Contents
SC PIMCO HIGH YIELD FUND
| PORTFOLIO OF INVESTMENTS (Continued) December 31, 2010 |
Sun Capital Advisers Trust |
See Notes to Financial Statements.
227
Table of Contents
SC PIMCO HIGH YIELD FUND
| PORTFOLIO OF INVESTMENTS (Continued) December 31, 2010 |
Sun Capital Advisers Trust |
| AU | Australia | |
| BM | Bermuda | |
| BR | Brazil | |
| CA | Canada | |
| FR | France | |
| GB | Great Britain | |
| IE | Ireland | |
| IT | Italy | |
| KY | Cayman Islands | |
| LU | Luxembourg | |
| NL | Netherlands |
| * | Unless otherwise noted the issuer country code for all securities is United States. |
| ** | Non-income producing security. |
| + | Amount is less than 0.05%. |
| (1) | Variable rate security. The interest rate shown reflects the rate in effect at the period end. |
| (2) | Security is a “Step-up” bond where the coupon increases on a predetermined future date. |
| (3) | Eligible for resale under rule 144A of the Securities Act of 1933. These securities may be resold in transactions exempt from registration, normally to qualified institutional buyers. At the period end, the value of these securities amounted to $46,648,471, representing 27.0% of net assets. |
| (4) | Security is in default and is non-income producing. |
| (5) | Payment in-kind bond security which may pay interest in the form of additional bonds. |
| (6) | Security (or a portion thereof) has been purchased on a delayed delivery or when-issued basis. |
| (7) | Interest rates represent annualized yield at date of purchase. |
| (8) | At the period end, securities (or portions thereof) with an aggregate market value of $114,998 have been pledged to cover margin requirements for the following open futures contracts: |
| Type |
Description |
Expiration Date |
Contracts | Aggregate Face Value ($) |
Aggregate Notional Value ($) |
Unrealized Appreciation ($) |
||||||||||||||
| Long |
90-Day Eurodollar March Futures | 3/14/11 | 53 | 12,959,163 | 13,201,638 | 242,475 | ||||||||||||||
See Notes to Financial Statements.
228
Table of Contents
| SC PIMCO HIGH YIELD FUND PORTFOLIO OF INVESTMENTS (Continued) | ||
| December 31, 2010 | Sun Capital Advisers Trust | |
| (9) | At the period end, open forward foreign currency exchange contracts were as follows: |
| Counterparty |
Contracts to Deliver |
In Exchange For |
Settlement Date |
Unrealized Appreciation/ (Depreciation) ($) |
||||||||||||||||||||||||
| Barclays Bank PLC | EUR | 361,000 | USD | 502,385 | 1/25/11 | 20,002 | ||||||||||||||||||||||
| Citibank NA* | BRL | 3,252,193 | USD | 1,906,997 | 3/2/11 | (28,363 | ) | |||||||||||||||||||||
| Citibank NA* | EUR | 1,118,000 | USD | 1,512,620 | 1/6/11 | 18,644 | ||||||||||||||||||||||
| Citibank NA* | EUR | 3,034,000 | USD | 4,218,337 | 1/25/11 | 164,188 | ||||||||||||||||||||||
| Citibank NA* | USD | 4,760 | CNY | 32,000 | 1/10/11 | 95 | ||||||||||||||||||||||
| Deutsche Bank AG (London) | CNY | 170,584 | USD | 25,652 | 1/10/11 | (233 | ) | |||||||||||||||||||||
| Deutsche Bank AG (London) | EUR | 175,000 | USD | 240,453 | 1/25/11 | 6,611 | ||||||||||||||||||||||
| Deutsche Bank AG (London) | GBP | 1,040,000 | USD | 1,622,102 | 3/21/11 | 1,656 | ||||||||||||||||||||||
| Deutsche Bank AG (London) | USD | 10,745 | CNY | 72,174 | 1/10/11 | 207 | ||||||||||||||||||||||
| Deutsche Bank AG (London) | USD | 26,335 | CNY | 170,584 | 2/13/12 | (205 | ) | |||||||||||||||||||||
| JPMorgan Securities | USD | 30,680 | CNY | 197,060 | 11/15/11 | (609 | ) | |||||||||||||||||||||
| JPMorgan Securities | USD | 4,124 | CNY | 26,537 | 11/15/11 | (75 | ) | |||||||||||||||||||||
| Morgan Stanley Capital Services, Inc. | USD | 10,000 | CNY | 66,410 | 1/10/11 | 77 | ||||||||||||||||||||||
| UBS AG | BRL | 511,224 | USD | 300,720 | 2/2/11 | (5,280 | ) | |||||||||||||||||||||
| UBS AG | USD | 290,997 | BRL | 511,224 | 2/2/11 | 15,003 | ||||||||||||||||||||||
| UBS AG | USD | 297,051 | BRL | 511,224 | 4/4/11 | 5,431 | ||||||||||||||||||||||
| Net unrealized appreciation |
197,149 | |||||||||||||||||||||||||||
| * | At the period end, the broker pledged securities with a fair value of $279,990 to the Fund as collateral for these open forward currency exchange contracts. |
| BRL | – | Brazilian Real | ||
| CNY | – | Yuan Renminbi | ||
| EUR | – | Euro | ||
| GBP | – | Great British Pound | ||
| USD | – | United States Dollar |
See Notes to Financial Statements.
229
Table of Contents
| SC PIMCO HIGH YIELD FUND PORTFOLIO OF INVESTMENTS (Continued) | ||
| December 31, 2010 | Sun Capital Advisers Trust | |
| (10) | At the period end, open swap contracts were as follows: |
Credit Default Swap Contracts on Corporate Issues – Sell Protection (a)
| Counterparty |
Reference Entity |
(Pay)/ Receive Fixed Rate |
Expiration Date |
Implied Credit Spread (b) |
Notional Amount (c) (000) ($) |
Market Value ($) |
Upfront Premiums Paid/ (Received) ($) |
Unrealized Appreciation ($) |
||||||||||||||||||||||||
| Bank of America NA |
|
American International Group, Inc. |
|
5.00 | % | 9/20/11 | 0.67 | % | 200 | 6,313 | (46,000 | ) | 52,313 | |||||||||||||||||||
| Bank of America NA |
|
American International Group, Inc. |
|
5.00 | % | 9/20/11 | 0.67 | % | 200 | 6,314 | (48,000 | ) | 54,314 | |||||||||||||||||||
| Deutsche Bank AG |
|
Ally Financial, Inc. |
|
5.00 | % | 3/20/12 | 1.30 | % | 60 | 2,704 | (9,300 | ) | 12,004 | |||||||||||||||||||
| Deutsche Bank AG |
|
RRI Energy, Inc. |
|
5.00 | % | 9/20/14 | 5.47 | % | 300 | (4,446 | ) | (43,500 | ) | 39,054 | ||||||||||||||||||
| Deutsche Bank AG |
SLM Corp. | 5.00 | % | 6/20/12 | 1.23 | % | 100 | 5,531 | (13,000 | ) | 18,531 | |||||||||||||||||||||
| Goldman Sachs International |
|
El Paso Corp. |
|
5.00 | % | 9/20/14 | 1.93 | % | 500 | 54,368 | (47,500 | ) | 101,868 | |||||||||||||||||||
| Total |
1,360 | 70,784 | (207,300 | ) | 278,084 | |||||||||||||||||||||||||||
| (a) | If the Fund is a seller of protection and a credit event occurs, as defined under the terms of that particular swap agreement, the Fund will pay to the buyer of the protection an amount up to the notional amount of the swap and in certain instances, take delivery of the security. As a buyer of protection, the Fund will generally receive from the seller of protection an amount up to the notional amount of the swap if a credit event occurs. |
| (b) | Implied credit spreads, represented in absolute terms, utilized in determining the market value of credit default swap agreements on corporate issues as of period end serve as an indicator of the current status of the payment/performance risk and represent the likelihood or risk of default for the credit derivative. The implied credit spread of a particular referenced entity reflects the cost of buying/selling protection and may include upfront payments required to be made to enter into the agreement. Wider credit spreads represent a deterioration of the referenced entity’s credit soundness and a greater likelihood or risk of default or other credit event occurring as defined under the terms of that particular agreement. |
| (c) | The maximum potential amount the Fund could be required to pay as a seller of credit protection or receive as a buyer of credit protection if a credit event occurs as defined under the terms of that particular swap agreement. |
See Notes to Financial Statements.
230
Table of Contents
| SC PIMCO HIGH YIELD FUND PORTFOLIO OF INVESTMENTS (Continued) | ||
| December 31, 2010 | Sun Capital Advisers Trust | |
| (11) | Fair Value Measurements † |
The following table summarizes the inputs used to value the Fund’s assets and liabilities, as applicable, measured at fair value at the period end:
| Assets |
Quoted Prices in Active Markets for Identical Assets and Liabilities (Level 1) |
Significant Other Observable Inputs (Level 2) |
Significant Unobservable Inputs (Level 3) |
Total | ||||||||||||
| Asset Backed Securities |
$ | — | $ | 310,329 | $ | — | $ | 310,329 | ||||||||
| Collateralized Mortgage Obligations |
— | 5,179,794 | — | 5,179,794 | ||||||||||||
| Convertible Bonds (a) |
— | 330,969 | — | 330,969 | ||||||||||||
| Corporate Debt Obligations (a) |
— | 149,701,182 | — | 149,701,182 | ||||||||||||
| Foreign Government Obligations |
— | 1,775,115 | — | 1,775,115 | ||||||||||||
| Loan Assignments |
— | 5,062,411 | — | 5,062,411 | ||||||||||||
| Common Stocks (a) |
75,663 | — | — | 75,663 | ||||||||||||
| Convertible Preferred Stocks |
625,344 | — | — | 625,344 | ||||||||||||
| Warrants |
— | 628 | — | 628 | ||||||||||||
| Short Term Investments |
||||||||||||||||
| U.S. Treasury |
899,362 | 5,741,893 | — | 6,641,255 | ||||||||||||
| Mutual Funds |
810,632 | — | — | 810,632 | ||||||||||||
| Total Short Term Investments |
1,709,994 | 5,741,893 | — | 7,451,887 | ||||||||||||
| Total Investments |
2,411,001 | 168,102,321 | — | 170,513,322 | ||||||||||||
| Financial Derivative Instruments |
||||||||||||||||
| Futures Contracts |
242,475 | — | — | 242,475 | ||||||||||||
| Forward Foreign Currency Exchange Contracts |
— | 231,914 | — | 231,914 | ||||||||||||
| Swap Contracts |
— | 278,084 | — | 278,084 | ||||||||||||
| Total Financial Derivative Instruments |
$ | 242,475 | $ | 509,998 | $ | — | $ | 752,473 | ||||||||
| Liabilities |
||||||||||||||||
| Financial Derivative Instruments |
||||||||||||||||
| Forward Foreign Currency Exchange Contracts |
$ | — | $ | (34,765 | ) | $ | — | $ | (34,765 | ) | ||||||
| Total Financial Derivative Instruments |
$ | — | $ | (34,765 | ) | $ | — | $ | (34,765 | ) | ||||||
| † | See Note 2b in the Notes to Financial Statements for additional information. |
| (a) | See Portfolio of Investments for additional detailed categorizations. |
See Notes to Financial Statements.
231
Table of Contents
| PORTFOLIO OF INVESTMENTS December 31, 2010 |
Sun Capital Advisers Trust |
See Notes to Financial Statements.
232
Table of Contents
SC PIMCO TOTAL RETURN FUND
| PORTFOLIO OF INVESTMENTS (Continued) December 31, 2010 |
Sun Capital Advisers Trust |
See Notes to Financial Statements.
233
Table of Contents
SC PIMCO TOTAL RETURN FUND
| PORTFOLIO OF INVESTMENTS (Continued) December 31, 2010 |
Sun Capital Advisers Trust |
See Notes to Financial Statements.
234
Table of Contents
SC PIMCO TOTAL RETURN FUND
| PORTFOLIO OF INVESTMENTS (Continued) December 31, 2010 |
Sun Capital Advisers Trust |
See Notes to Financial Statements.
235
Table of Contents
SC PIMCO TOTAL RETURN FUND
| PORTFOLIO OF INVESTMENTS (Continued) December 31, 2010 |
Sun Capital Advisers Trust |
See Notes to Financial Statements.
236
Table of Contents
SC PIMCO TOTAL RETURN FUND
| PORTFOLIO OF INVESTMENTS (Continued) December 31, 2010 |
Sun Capital Advisers Trust |
See Notes to Financial Statements.
237
Table of Contents
SC PIMCO TOTAL RETURN FUND
| PORTFOLIO OF INVESTMENTS (Continued) December 31, 2010 |
Sun Capital Advisers Trust |
See Notes to Financial Statements.
238
Table of Contents
SC PIMCO TOTAL RETURN FUND
| PORTFOLIO OF INVESTMENTS (Continued) December 31, 2010 |
Sun Capital Advisers Trust |
See Notes to Financial Statements.
239
Table of Contents
SC PIMCO TOTAL RETURN FUND
| PORTFOLIO OF INVESTMENTS (Continued) December 31, 2010 |
Sun Capital Advisers Trust |
| TBA | To Be Announced. Securities are purchased on a forward commitment basis with an approximate principal amount and no definite maturity date. The actual principal and maturity date will be determined upon settlement when the specific mortgage pools are assigned. At the period end, total market value of the TBA securities amounts to $85,372,453 which represents approximately 11.3% of net assets. At the period end, the broker pledged securities with an aggregate market value of $259,999 and delivered cash of $630,000 to the Fund as collateral. | |
| AU | Australia | |
| BM | Bermuda | |
| BR | Brazil | |
| CA | Canada | |
| CH | Switzerland | |
| CL | Chile | |
| DE | Germany | |
| DK | Denmark | |
| ES | Spain | |
| FR | France | |
| GB | Great Britain | |
| HK | Hong Kong | |
| IE | Ireland | |
| IN | India | |
See Notes to Financial Statements.
240
Table of Contents
SC PIMCO TOTAL RETURN FUND
| PORTFOLIO OF INVESTMENTS (Continued) December 31, 2010 |
Sun Capital Advisers Trust |
| IT | Italy | |
| JP | Japan | |
| KR | Korea, Republic of | |
| KY | Cayman Islands | |
| MX | Mexico | |
| NL | Netherlands | |
| QA | Qatar | |
| SE | Sweden | |
| SG | Singapore | |
| VG | British Virgin Islands |
| + | Amount is less than 0.05%. |
| (1) | Variable rate security. The interest rate shown reflects the rate in effect at the period end. |
| (2) | Eligible for resale under rule 144A of the Securities Act of 1933. These securities may be resold in transactions exempt from registration, normally to qualified institutional buyers. At the period end, the value of these securities amounted to $96,575,803, representing 12.8% of net assets. |
| (3) | Security is a “Step-up” bond where the coupon increases on a predetermined future date. |
| (4) | Security (or a portion thereof) has been purchased on a delayed delivery or when-issued basis. |
| (5) | Interest rates represent annualized yield at date of purchase. |
| (6) | Security (or a portion thereof) has been pledged as collateral for open swap and swaption contracts. At the period end, the value of securities pledged amounted to $399,807. |
| (7) | At the period end, securities (or portions thereof) with an aggregate market value of $1,857,735 and cash of $9,000 have been pledged to cover margin requirements for the following open futures contracts: |
| Type |
Description |
Expiration Date |
Contracts | Aggregate Face Value ($) |
Aggregate Notional Value ($) |
Unrealized Appreciation/ (Depreciation) ($) |
||||||||||||
| Long | 90-Day Eurodollar December Futures | 12/19/11 | 124 | 30,785,675 | 30,773,700 | (11,975 | ) | |||||||||||
| Long | 90-Day Eurodollar December Futures | 12/17/12 | 100 | 24,717,300 | 24,553,750 | (163,550 | ) | |||||||||||
| Long | 90-Day Eurodollar June Futures | 6/13/11 | 260 | 64,610,825 | 64,714,000 | 103,175 | ||||||||||||
| Long | 90-Day Eurodollar June Futures | 6/18/12 | 165 | 40,863,250 | 40,746,750 | (116,500 | ) | |||||||||||
| Long | 90-Day Eurodollar June Futures | 6/17/13 | 9 | 2,212,650 | 2,197,125 | (15,525 | ) | |||||||||||
| Long | 90-Day Eurodollar March Futures | 3/14/11 | 597 | 148,629,963 | 148,705,238 | 75,275 | ||||||||||||
| Long | 90-Day Eurodollar March Futures | 3/19/12 | 197 | 48,849,975 | 48,782,125 | (67,850 | ) | |||||||||||
| Long | 90-Day Eurodollar March Futures | 3/18/13 | 69 | 17,019,725 | 16,893,787 | (125,938 | ) | |||||||||||
| Long | 90-Day Eurodollar September Futures | 9/19/11 | 148 | 36,749,075 | 36,794,650 | 45,575 | ||||||||||||
| Long | 90-Day Eurodollar September Futures | 9/17/12 | 153 | 37,914,313 | 37,678,163 | (236,150 | ) | |||||||||||
| Long | 90-Day Eurodollar September Futures | 9/16/13 | 32 | 7,859,925 | 7,790,400 | (69,525 | ) | |||||||||||
| Long | U.S. Treasury 2 Year Note March Futures | 3/31/11 | 99 | 21,674,453 | 21,671,718 | (2,735 | ) | |||||||||||
| Long | U.S. Treasury 5 Year Note March Futures | 3/31/11 | 39 | 4,653,109 | 4,591,031 | (62,078 | ) | |||||||||||
| Long | United Kingdom 90-Day LIBOR Sterling Interest Rate December Futures | 12/21/11 | 11 | 2,121,135 | 2,116,964 | (4,171 | ) | |||||||||||
| Long | United Kingdom 90-Day LIBOR Sterling Interest Rate June Futures | 6/20/12 | 12 | 2,307,311 | 2,297,489 | (9,822 | ) | |||||||||||
| Long | United Kingdom 90-Day LIBOR Sterling Interest Rate March Futures | 3/21/12 | 12 | 2,311,150 | 2,303,803 | (7,347 | ) | |||||||||||
| Long | United Kingdom 90-Day LIBOR Sterling Interest Rate September Futures | 9/19/12 | 11 | 2,111,644 | 2,100,029 | (11,615 | ) | |||||||||||
| Net unrealized depreciation |
|
(680,756 | ) | |||||||||||||||
See Notes to Financial Statements.
241
Table of Contents
SC PIMCO TOTAL RETURN FUND
| PORTFOLIO OF INVESTMENTS (Continued) December 31, 2010 |
Sun Capital Advisers Trust |
| (8) | At period end, the Fund had the following open forward sales contracts: |
| Description |
Interest Rate |
Maturity Date |
Settlement Date |
Principal Amount ($) |
Value ($) | |||||||||||||||
| Federal National Mortgage Association |
4.50 | % | TBA-30 Yr | 2/10/11 | 1,000,000 | 1,023,594 | ||||||||||||||
| (Proceeds receivable $1,019,258) |
1,023,594 | |||||||||||||||||||
| (9) | At the period end, open forward foreign currency exchange contracts were as follows: |
| Counterparty |
Contracts to Deliver |
In Exchange For |
Settlement Date |
Unrealized Appreciation/ (Depreciation) ($) |
||||||||||||||||||||||
| Bank of America Securities LLC | USD | 1,026,256 | AUD | 1,078,000 | 1/28/11 | 73,171 | ||||||||||||||||||||
| Bank of America Securities LLC | USD | 300,000 | INR | 13,935,000 | 5/9/11 | 4,585 | ||||||||||||||||||||
| Bank of America Securities LLC | USD | 100,000 | KRW | 113,830,000 | 5/9/11 | 741 | ||||||||||||||||||||
| Bank of America Securities LLC | USD | 100,000 | PHP | 4,400,000 | 4/15/11 | 535 | ||||||||||||||||||||
| Bank of America Securities LLC | USD | 70,381 | TWD | 2,141,000 | 4/6/11 | 3,257 | ||||||||||||||||||||
| Barclays Bank PLC | EUR | 58,000 | USD | 75,978 | 1/25/11 | (1,524 | ) | |||||||||||||||||||
| Barclays Bank PLC | EUR | 708,000 | USD | 927,452 | 1/25/11 | (18,606 | ) | |||||||||||||||||||
| Barclays Bank PLC | EUR | 100,000 | USD | 133,678 | 1/25/11 | 54 | ||||||||||||||||||||
| Barclays Bank PLC | EUR | 100,000 | USD | 132,080 | 1/25/11 | (1,544 | ) | |||||||||||||||||||
| Barclays Bank PLC | EUR | 200,000 | USD | 262,393 | 1/25/11 | (4,855 | ) | |||||||||||||||||||
| Barclays Bank PLC | EUR | 153,000 | USD | 200,775 | 1/25/11 | (3,669 | ) | |||||||||||||||||||
| Barclays Bank PLC | USD | 890,256 | AUD | 900,000 | 1/28/11 | 27,633 | ||||||||||||||||||||
| Barclays Bank PLC | USD | 306,000 | CNY | 2,027,556 | 4/7/11 | 1,691 | ||||||||||||||||||||
| Barclays Bank PLC | USD | 315,000 | CNY | 2,086,560 | 4/7/11 | 1,645 | ||||||||||||||||||||
| Barclays Bank PLC | USD | 241,000 | CNY | 1,595,420 | 4/7/11 | 1,113 | ||||||||||||||||||||
| Barclays Bank PLC | USD | 241,000 | CNY | 1,595,420 | 4/7/11 | 1,113 | ||||||||||||||||||||
| Barclays Bank PLC | USD | 100,000 | IDR | 934,000,000 | 7/27/11 | 524 | ||||||||||||||||||||
| Barclays Bank PLC | USD | 59,519 | IDR | 549,660,000 | 7/27/11 | (361 | ) | |||||||||||||||||||
| Barclays Bank PLC | USD | 385,218 | INR | 17,408,000 | 3/9/11 | (427 | ) | |||||||||||||||||||
| Barclays Bank PLC | USD | 498,168 | JPY | 41,486,000 | 1/14/11 | 12,858 | ||||||||||||||||||||
| Barclays Bank PLC | USD | 893,461 | JPY | 74,865,000 | 1/14/11 | 28,729 | ||||||||||||||||||||
| Barclays Bank PLC | USD | 201,619 | JPY | 16,702,000 | 1/14/11 | 4,117 | ||||||||||||||||||||
| Barclays Bank PLC | USD | 202,379 | JPY | 16,765,000 | 1/14/11 | 4,133 | ||||||||||||||||||||
| Barclays Bank PLC | USD | 36,856 | KRW | 41,400,000 | 5/9/11 | (216 | ) | |||||||||||||||||||
| Barclays Bank PLC | USD | 200,000 | KRW | 223,800,000 | 5/9/11 | (1,935 | ) | |||||||||||||||||||
| Barclays Bank PLC | USD | 775,127 | MXN | 9,951,850 | 2/22/11 | 27,934 | ||||||||||||||||||||
| Barclays Bank PLC | USD | 36,498 | MXN | 482,864 | 2/22/11 | 2,467 | ||||||||||||||||||||
| Barclays Bank PLC | USD | 100,000 | MXN | 1,303,090 | 2/22/11 | 5,152 | ||||||||||||||||||||
| Barclays Bank PLC | USD | 100,000 | MXN | 1,282,850 | 2/22/11 | 3,519 | ||||||||||||||||||||
| Barclays Bank PLC | USD | 400,000 | MXN | 5,002,600 | 2/22/11 | 3,683 | ||||||||||||||||||||
| Barclays Bank PLC | USD | 400,000 | MXN | 4,997,600 | 2/22/11 | 3,279 | ||||||||||||||||||||
| Barclays Bank PLC | USD | 51,502 | MYR | 160,000 | 2/7/11 | 265 | ||||||||||||||||||||
| Barclays Bank PLC | USD | 100,000 | PHP | 4,248,000 | 4/15/11 | (2,938 | ) | |||||||||||||||||||
| Barclays Bank PLC | USD | 100,000 | PHP | 4,485,000 | 6/15/11 | 2,399 | ||||||||||||||||||||
| Barclays Bank PLC | USD | 100,000 | PHP | 4,468,500 | 6/15/11 | 2,022 | ||||||||||||||||||||
| Barclays Bank PLC | USD | 400,000 | PHP | 17,780,000 | 6/15/11 | 5,944 | ||||||||||||||||||||
| Barclays Bank PLC | USD | 200,000 | PHP | 8,874,000 | 6/15/11 | 2,607 | ||||||||||||||||||||
| Barclays Bank PLC | USD | 100,000 | ZAR | 728,400 | 1/28/11 | 10,183 | ||||||||||||||||||||
See Notes to Financial Statements.
242
Table of Contents
SC PIMCO TOTAL RETURN FUND
| PORTFOLIO OF INVESTMENTS (Continued) December 31, 2010 |
Sun Capital Advisers Trust |
| Counterparty (Continued) |
Contracts to Deliver |
In Exchange For |
Settlement Date |
Unrealized Appreciation/ (Depreciation) ($) |
||||||||||||||||||||||
| Barclays Bank PLC | USD | 100,000 | ZAR | 760,150 | 9/13/11 | 11,456 | ||||||||||||||||||||
| Citibank NA | EUR | 100,000 | USD | 132,477 | 1/25/11 | (1,147 | ) | |||||||||||||||||||
| Citibank NA | EUR | 151,000 | USD | 196,757 | 1/25/11 | (5,015 | ) | |||||||||||||||||||
| Citibank NA | EUR | 10,883,000 | USD | 15,131,233 | 1/25/11 | 588,945 | ||||||||||||||||||||
| Citibank NA | EUR | 51,000 | USD | 70,648 | 1/25/11 | 2,500 | ||||||||||||||||||||
| Citibank NA | USD | 11,835,746 | BRL | 20,184,681 | 3/2/11 | 176,034 | ||||||||||||||||||||
| Citibank NA | USD | 7,550,926 | EUR | 5,581,000 | 1/6/11 | (93,068 | ) | |||||||||||||||||||
| Citibank NA | USD | 100,000 | IDR | 919,300,000 | 4/15/11 | 477 | ||||||||||||||||||||
| Citibank NA | USD | 40,000 | IDR | 382,000,000 | 7/27/11 | 1,113 | ||||||||||||||||||||
| Citibank NA | USD | 60,000 | IDR | 571,800,000 | 7/27/11 | 1,541 | ||||||||||||||||||||
| Citibank NA | USD | 60,611 | IDR | 563,500,000 | 7/27/11 | 37 | ||||||||||||||||||||
| Citibank NA | USD | 395,181 | IDR | 3,608,000,000 | 7/27/11 | (6,863 | ) | |||||||||||||||||||
| Citibank NA | USD | 100,000 | JPY | 8,121,670 | 1/6/11 | 34 | ||||||||||||||||||||
| Citibank NA | USD | 100,000 | JPY | 8,110,470 | 1/6/11 | (104 | ) | |||||||||||||||||||
| Citibank NA | USD | 100,000 | JPY | 8,111,770 | 1/6/11 | (88 | ) | |||||||||||||||||||
| Citibank NA | USD | 297,557 | JPY | 25,055,000 | 1/14/11 | 11,072 | ||||||||||||||||||||
| Citibank NA | USD | 100,000 | KRW | 115,410,000 | 1/19/11 | 1,710 | ||||||||||||||||||||
| Citibank NA | USD | 129,257 | KRW | 145,000,000 | 5/9/11 | (930 | ) | |||||||||||||||||||
| Citibank NA | USD | 142,895 | KRW | 161,400,000 | 5/9/11 | (54 | ) | |||||||||||||||||||
| Citibank NA | USD | 89,286 | KRW | 100,000,000 | 5/9/11 | (785 | ) | |||||||||||||||||||
| Citibank NA | USD | 100,000 | KRW | 111,260,000 | 5/9/11 | (1,534 | ) | |||||||||||||||||||
| Citibank NA | USD | 100,000 | KRW | 112,500,000 | 5/9/11 | (436 | ) | |||||||||||||||||||
| Citibank NA | USD | 100,000 | KRW | 114,020,000 | 5/9/11 | 909 | ||||||||||||||||||||
| Citibank NA | USD | 125,180 | MXN | 1,659,892 | 2/22/11 | 8,764 | ||||||||||||||||||||
| Citibank NA | USD | 100,000 | MXN | 1,304,400 | 2/22/11 | 5,258 | ||||||||||||||||||||
| Citibank NA | USD | 100,000 | MXN | 1,282,900 | 2/22/11 | 3,523 | ||||||||||||||||||||
| Citibank NA | USD | 100,000 | MXN | 1,269,650 | 2/22/11 | 2,454 | ||||||||||||||||||||
| Citibank NA | USD | 300,000 | MXN | 3,807,450 | 2/22/11 | 7,241 | ||||||||||||||||||||
| Citibank NA | USD | 100,000 | MXN | 1,257,100 | 2/22/11 | 1,441 | ||||||||||||||||||||
| Citibank NA | USD | 100,000 | MXN | 1,238,500 | 2/22/11 | (60 | ) | |||||||||||||||||||
| Citibank NA | USD | 300,000 | MXN | 3,695,400 | 2/22/11 | (1,801 | ) | |||||||||||||||||||
| Citibank NA | USD | 100,000 | MXN | 1,239,500 | 2/22/11 | 21 | ||||||||||||||||||||
| Citibank NA | USD | 100,000 | MXN | 1,230,500 | 2/22/11 | (705 | ) | |||||||||||||||||||
| Citibank NA | USD | 45,161 | MYR | 140,000 | 2/7/11 | 134 | ||||||||||||||||||||
| Citibank NA | USD | 100,000 | PHP | 4,410,000 | 2/7/11 | 777 | ||||||||||||||||||||
| Citibank NA | USD | 100,000 | PHP | 4,413,000 | 2/7/11 | 846 | ||||||||||||||||||||
| Citibank NA | USD | 50,000 | PHP | 2,137,500 | 4/15/11 | (1,161 | ) | |||||||||||||||||||
| Citibank NA | USD | 100,000 | PHP | 4,361,000 | 4/15/11 | (356 | ) | |||||||||||||||||||
| Citibank NA | USD | 93,928 | PHP | 4,130,000 | 6/15/11 | 366 | ||||||||||||||||||||
| Citibank NA | USD | 100,182 | PHP | 4,400,000 | 6/15/11 | 276 | ||||||||||||||||||||
| Citibank NA | USD | 100,000 | PHP | 4,270,000 | 6/15/11 | (2,509 | ) | |||||||||||||||||||
| Citibank NA | USD | 100,000 | PHP | 4,421,000 | 11/15/11 | 662 | ||||||||||||||||||||
| Citibank NA | USD | 100,000 | PHP | 4,339,500 | 11/15/11 | (1,193 | ) | |||||||||||||||||||
| Citibank NA | USD | 100,000 | PHP | 4,389,000 | 11/15/11 | (66 | ) | |||||||||||||||||||
| Citibank NA | USD | 50,000 | PHP | 2,175,000 | 11/15/11 | (477 | ) | |||||||||||||||||||
| Citibank NA | USD | 100,000 | PHP | 4,455,000 | 11/15/11 | 1,436 | ||||||||||||||||||||
| Citibank NA | USD | 100,000 | PHP | 4,310,000 | 11/15/11 | (1,865 | ) | |||||||||||||||||||
| Citibank NA | USD | 100,000 | SGD | 128,466 | 2/24/11 | 109 | ||||||||||||||||||||
| Citibank NA | USD | 100,000 | SGD | 132,160 | 3/9/11 | 2,988 | ||||||||||||||||||||
See Notes to Financial Statements.
243
Table of Contents
SC PIMCO TOTAL RETURN FUND
| PORTFOLIO OF INVESTMENTS (Continued) December 31, 2010 |
Sun Capital Advisers Trust |
| Counterparty (Continued) |
Contracts to Deliver |
In Exchange For |
Settlement Date |
Unrealized Appreciation/ (Depreciation) ($) |
||||||||||||||||||||||
| Credit Suisse AG (London) | EUR | 100,000 | USD | 132,951 | 1/6/11 | (679 | ) | |||||||||||||||||||
| Credit Suisse AG (London) | EUR | 300,000 | USD | 402,363 | 1/25/11 | 1,491 | ||||||||||||||||||||
| Credit Suisse AG (London) | EUR | 100,000 | USD | 132,626 | 1/25/11 | (998 | ) | |||||||||||||||||||
| Deutsche Bank AG (London) | CAD | 1,086,000 | USD | 1,078,258 | 2/17/11 | (13,071 | ) | |||||||||||||||||||
| Deutsche Bank AG (London) | EUR | 152,000 | USD | 198,963 | 1/25/11 | (4,145 | ) | |||||||||||||||||||
| Deutsche Bank AG (London) | TWD | 1,500,000 | USD | 50,033 | 1/14/11 | (1,428 | ) | |||||||||||||||||||
| Deutsche Bank AG (London) | TWD | 1,093,872 | USD | 36,615 | 1/14/11 | (913 | ) | |||||||||||||||||||
| Deutsche Bank AG (London) | USD | 2,010,224 | CNY | 13,496,646 | 4/7/11 | 37,956 | ||||||||||||||||||||
| Deutsche Bank AG (London) | USD | 393,639 | IDR | 3,651,000,000 | 10/31/11 | (5,655 | ) | |||||||||||||||||||
| Deutsche Bank AG (London) | USD | 200,012 | JPY | 16,755,000 | 1/14/11 | 6,377 | ||||||||||||||||||||
| Deutsche Bank AG (London) | USD | 100,000 | MXN | 1,273,450 | 2/22/11 | 2,761 | ||||||||||||||||||||
| Deutsche Bank AG (London) | USD | 201,472 | MYR | 625,268 | 2/7/11 | 826 | ||||||||||||||||||||
| Deutsche Bank AG (London) | USD | 94,437 | PHP | 4,142,000 | 6/15/11 | 131 | ||||||||||||||||||||
| Deutsche Bank AG (London) | USD | 100,000 | PHP | 4,321,000 | 6/15/11 | (1,345 | ) | |||||||||||||||||||
| Deutsche Bank AG (London) | USD | 50,000 | PHP | 2,202,500 | 11/15/11 | 149 | ||||||||||||||||||||
| Deutsche Bank AG (London) | USD | 260,612 | SGD | 340,000 | 6/9/11 | 4,343 | ||||||||||||||||||||
| Deutsche Bank AG (London) | USD | 141,785 | SGD | 184,476 | 6/9/11 | 1,974 | ||||||||||||||||||||
| Deutsche Bank AG (London) | USD | 20,979 | TWD | 649,000 | 1/14/11 | 1,286 | ||||||||||||||||||||
| Deutsche Bank AG (London) | USD | 10,066 | TWD | 316,872 | 1/14/11 | 805 | ||||||||||||||||||||
| Deutsche Bank AG (London) | USD | 48,900 | TWD | 1,500,000 | 4/6/11 | 2,692 | ||||||||||||||||||||
| Deutsche Bank AG (London) | USD | 50,420 | TWD | 1,500,000 | 4/6/11 | 1,172 | ||||||||||||||||||||
| Deutsche Bank AG (London) | USD | 36,899 | TWD | 1,093,872 | 4/6/11 | 724 | ||||||||||||||||||||
| Goldman Sachs International | JPY | 119,158,000 | USD | 1,415,666 | 1/14/11 | (52,128 | ) | |||||||||||||||||||
| Goldman Sachs International | USD | 29,378 | KRW | 33,337,650 | 5/9/11 | 127 | ||||||||||||||||||||
| Goldman Sachs International | USD | 100,000 | KRW | 111,900,000 | 5/9/11 | (967 | ) | |||||||||||||||||||
| Goldman Sachs International | USD | 100,000 | PHP | 4,392,000 | 11/15/11 | 2 | ||||||||||||||||||||
| Goldman Sachs International | USD | 100,000 | SGD | 128,530 | 3/9/11 | 159 | ||||||||||||||||||||
| Goldman Sachs International | USD | 100,000 | SGD | 129,350 | 6/9/11 | 800 | ||||||||||||||||||||
| Goldman Sachs International | USD | 50,000 | SGD | 64,790 | 6/9/11 | 490 | ||||||||||||||||||||
| Goldman Sachs International | USD | 100,000 | SGD | 130,900 | 6/9/11 | 2,008 | ||||||||||||||||||||
| Goldman Sachs International | USD | 100,000 | SGD | 128,690 | 6/9/11 | 285 | ||||||||||||||||||||
| Goldman Sachs International | USD | 100,000 | SGD | 129,180 | 6/9/11 | 667 | ||||||||||||||||||||
| Goldman Sachs International | USD | 100,000 | SGD | 130,000 | 6/9/11 | 1,306 | ||||||||||||||||||||
| HSBC Bank PLC | USD | 207,115 | CAD | 211,000 | 2/17/11 | 4,921 | ||||||||||||||||||||
| HSBC Bank PLC | USD | 242,000 | CNY | 1,602,040 | 4/7/11 | 1,117 | ||||||||||||||||||||
| HSBC Bank PLC | USD | 242,000 | CNY | 1,602,040 | 4/7/11 | 1,117 | ||||||||||||||||||||
| HSBC Bank PLC | USD | 110,000 | IDR | 1,046,100,000 | 7/27/11 | 2,589 | ||||||||||||||||||||
| HSBC Bank PLC | USD | 110,000 | IDR | 1,041,150,000 | 7/27/11 | 2,056 | ||||||||||||||||||||
| HSBC Bank PLC | USD | 100,000 | IDR | 930,000,000 | 7/27/11 | 93 | ||||||||||||||||||||
| HSBC Bank PLC | USD | 14,696 | IDR | 136,500,000 | 7/27/11 | (5 | ) | |||||||||||||||||||
| HSBC Bank PLC | USD | 62,519 | IDR | 579,800,000 | 7/27/11 | (117 | ) | |||||||||||||||||||
| HSBC Bank PLC | USD | 70,372 | KRW | 79,000,000 | 5/9/11 | (457 | ) | |||||||||||||||||||
| HSBC Bank PLC | USD | 100,000 | KRW | 114,750,000 | 5/9/11 | 1,555 | ||||||||||||||||||||
| HSBC Bank PLC | USD | 100,000 | MYR | 310,000 | 2/7/11 | 297 | ||||||||||||||||||||
| HSBC Bank PLC | USD | 379,552 | PHP | 16,613,000 | 6/15/11 | (252 | ) | |||||||||||||||||||
| HSBC Bank PLC | USD | 200,000 | SGD | 262,260 | 2/24/11 | 4,370 | ||||||||||||||||||||
| HSBC Bank PLC | USD | 100,000 | SGD | 130,180 | 2/24/11 | 1,445 | ||||||||||||||||||||
| HSBC Bank PLC | USD | 100,000 | SGD | 130,331 | 2/24/11 | 1,562 | ||||||||||||||||||||
| HSBC Bank PLC | USD | 100,000 | SGD | 132,170 | 3/9/11 | 2,996 | ||||||||||||||||||||
See Notes to Financial Statements.
244
Table of Contents
SC PIMCO TOTAL RETURN FUND
| PORTFOLIO OF INVESTMENTS (Continued) December 31, 2010 |
Sun Capital Advisers Trust |
| Counterparty (Continued) |
Contracts to Deliver |
In Exchange For |
Settlement Date |
Unrealized Appreciation/ (Depreciation) ($) |
||||||||||||||||||||||
| HSBC Bank PLC | USD | 100,000 | SGD | 131,906 | 3/9/11 | 2,790 | ||||||||||||||||||||
| HSBC Bank PLC | USD | 100,000 | SGD | 129,096 | 3/9/11 | 600 | ||||||||||||||||||||
| HSBC Bank PLC | USD | 200,000 | SGD | 263,013 | 3/9/11 | 4,958 | ||||||||||||||||||||
| HSBC Bank PLC | USD | 1,442,219 | ZAR | 10,107,790 | 1/28/11 | 86,762 | ||||||||||||||||||||
| JPMorgan Securities | EUR | 199,000 | USD | 263,318 | 1/25/11 | (2,593 | ) | |||||||||||||||||||
| JPMorgan Securities | KRW | 2,391,598,819 | USD | 2,071,186 | 1/19/11 | (36,504 | ) | |||||||||||||||||||
| JPMorgan Securities | USD | 100,000 | IDR | 923,000,000 | 4/15/11 | 881 | ||||||||||||||||||||
| JPMorgan Securities | USD | 50,000 | IDR | 472,000,000 | 7/27/11 | 800 | ||||||||||||||||||||
| JPMorgan Securities | USD | 205,142 | IDR | 1,883,000,000 | 7/27/11 | (2,481 | ) | |||||||||||||||||||
| JPMorgan Securities | USD | 100,000 | JPY | 8,168,870 | 1/6/11 | 615 | ||||||||||||||||||||
| JPMorgan Securities | USD | 66,667 | KRW | 77,333,720 | 1/19/11 | 1,486 | ||||||||||||||||||||
| JPMorgan Securities | USD | 66,667 | KRW | 76,753,717 | 1/19/11 | 975 | ||||||||||||||||||||
| JPMorgan Securities | USD | 66,667 | KRW | 76,400,382 | 1/19/11 | 664 | ||||||||||||||||||||
| JPMorgan Securities | USD | 2,064,927 | KRW | 2,391,598,819 | 5/9/11 | 51,662 | ||||||||||||||||||||
| JPMorgan Securities | USD | 159,872 | KRW | 181,300,000 | 5/9/11 | 580 | ||||||||||||||||||||
| JPMorgan Securities | USD | 100,000 | KRW | 113,600,000 | 5/9/11 | 537 | ||||||||||||||||||||
| JPMorgan Securities | USD | 100,000 | KRW | 113,370,000 | 5/9/11 | 334 | ||||||||||||||||||||
| JPMorgan Securities | USD | 200,000 | KRW | 223,280,000 | 5/9/11 | (2,395 | ) | |||||||||||||||||||
| JPMorgan Securities | USD | 200,000 | KRW | 222,620,000 | 5/9/11 | (2,979 | ) | |||||||||||||||||||
| JPMorgan Securities | USD | 100,000 | KRW | 115,970,000 | 5/9/11 | 2,635 | ||||||||||||||||||||
| JPMorgan Securities | USD | 200,000 | KRW | 224,540,000 | 5/9/11 | (1,280 | ) | |||||||||||||||||||
| JPMorgan Securities | USD | 100,000 | KRW | 113,650,000 | 5/9/11 | 581 | ||||||||||||||||||||
| JPMorgan Securities | USD | 100,000 | KRW | 114,260,000 | 5/9/11 | 1,121 | ||||||||||||||||||||
| JPMorgan Securities | USD | 100,000 | MXN | 1,269,450 | 2/22/11 | 2,438 | ||||||||||||||||||||
| JPMorgan Securities | USD | 100,000 | MXN | 1,236,450 | 2/22/11 | (225 | ) | |||||||||||||||||||
| JPMorgan Securities | USD | 100,000 | MYR | 310,250 | 2/7/11 | 378 | ||||||||||||||||||||
| JPMorgan Securities | USD | 200,000 | MYR | 617,200 | 2/7/11 | (312 | ) | |||||||||||||||||||
| JPMorgan Securities | USD | 100,000 | PHP | 4,406,000 | 2/7/11 | 686 | ||||||||||||||||||||
| JPMorgan Securities | USD | 50,000 | PHP | 2,134,000 | 4/15/11 | (1,241 | ) | |||||||||||||||||||
| JPMorgan Securities | USD | 100,000 | PHP | 4,375,000 | 4/15/11 | (37 | ) | |||||||||||||||||||
| JPMorgan Securities | USD | 100,000 | PHP | 4,354,000 | 6/15/11 | (592 | ) | |||||||||||||||||||
| JPMorgan Securities | USD | 100,000 | PHP | 4,480,000 | 6/15/11 | 2,285 | ||||||||||||||||||||
| JPMorgan Securities | USD | 100,000 | PHP | 4,492,000 | 6/15/11 | 2,559 | ||||||||||||||||||||
| JPMorgan Securities | USD | 97,013 | PHP | 4,254,000 | 6/15/11 | 113 | ||||||||||||||||||||
| JPMorgan Securities | USD | 100,000 | PHP | 4,320,000 | 6/15/11 | (1,368 | ) | |||||||||||||||||||
| JPMorgan Securities | USD | 100,000 | PHP | 4,310,000 | 11/15/11 | (1,865 | ) | |||||||||||||||||||
| JPMorgan Securities | USD | 100,000 | PHP | 4,410,000 | 11/15/11 | 412 | ||||||||||||||||||||
| JPMorgan Securities | USD | 100,000 | PHP | 4,437,000 | 11/15/11 | 1,027 | ||||||||||||||||||||
| JPMorgan Securities | USD | 66,667 | SGD | 87,294 | 1/14/11 | 1,355 | ||||||||||||||||||||
| JPMorgan Securities | USD | 66,667 | SGD | 87,914 | 1/14/11 | 1,838 | ||||||||||||||||||||
| JPMorgan Securities | USD | 100,000 | SGD | 131,720 | 1/14/11 | 2,640 | ||||||||||||||||||||
| JPMorgan Securities | USD | 66,667 | SGD | 87,354 | 1/14/11 | 1,401 | ||||||||||||||||||||
| JPMorgan Securities | USD | 100,000 | SGD | 129,640 | 3/9/11 | 1,024 | ||||||||||||||||||||
| JPMorgan Securities | USD | 100,000 | SGD | 128,710 | 3/9/11 | 300 | ||||||||||||||||||||
| JPMorgan Securities | USD | 50,000 | SGD | 64,295 | 6/9/11 | 104 | ||||||||||||||||||||
| JPMorgan Securities | USD | 100,000 | SGD | 128,820 | 6/9/11 | 387 | ||||||||||||||||||||
| JPMorgan Securities | USD | 100,000 | SGD | 131,000 | 6/9/11 | 2,086 | ||||||||||||||||||||
| JPMorgan Securities | USD | 100,000 | SGD | 129,970 | 6/9/11 | 1,283 | ||||||||||||||||||||
| JPMorgan Securities | USD | 26,314 | TWD | 831,000 | 1/14/11 | 2,196 | ||||||||||||||||||||
| JPMorgan Securities | USD | 72,601 | TWD | 2,196,908 | 4/6/11 | 2,961 | ||||||||||||||||||||
See Notes to Financial Statements.
245
Table of Contents
SC PIMCO TOTAL RETURN FUND
| PORTFOLIO OF INVESTMENTS (Continued) December 31, 2010 |
Sun Capital Advisers Trust |
| Counterparty (Continued) |
Contracts to Deliver |
In Exchange For |
Settlement Date |
Unrealized Appreciation/ (Depreciation) ($) |
||||||||||||||||||||||
| JPMorgan Securities | USD | 100,000 | ZAR | 728,400 | 1/28/11 | 10,183 | ||||||||||||||||||||
| JPMorgan Securities | USD | 300,000 | ZAR | 2,090,850 | 4/28/11 | 12,321 | ||||||||||||||||||||
| Morgan Stanley Capital Services, Inc. | EUR | 200,000 | USD | 264,446 | 1/25/11 | (2,802 | ) | |||||||||||||||||||
| Morgan Stanley Capital Services, Inc. | USD | 317,298 | CAD | 322,000 | 2/17/11 | 6,282 | ||||||||||||||||||||
| Morgan Stanley Capital Services, Inc. | USD | 245,000 | CNY | 1,623,125 | 4/7/11 | 1,317 | ||||||||||||||||||||
| Morgan Stanley Capital Services, Inc. | USD | 100,000 | IDR | 909,000,000 | 4/15/11 | (649 | ) | |||||||||||||||||||
| Morgan Stanley Capital Services, Inc. | USD | 199,304 | JPY | 16,780,000 | 1/14/11 | 7,393 | ||||||||||||||||||||
| Morgan Stanley Capital Services, Inc. | USD | 100,000 | KRW | 115,160,000 | 1/19/11 | 1,489 | ||||||||||||||||||||
| Morgan Stanley Capital Services, Inc. | USD | 200,000 | KRW | 230,220,000 | 1/19/11 | 2,890 | ||||||||||||||||||||
| Morgan Stanley Capital Services, Inc. | USD | 100,000 | KRW | 115,110,000 | 1/19/11 | 1,445 | ||||||||||||||||||||
| Morgan Stanley Capital Services, Inc. | USD | 100,000 | KRW | 115,208,000 | 1/19/11 | 1,532 | ||||||||||||||||||||
| Morgan Stanley Capital Services, Inc. | USD | 200,000 | KRW | 228,920,000 | 1/19/11 | 1,745 | ||||||||||||||||||||
| Morgan Stanley Capital Services, Inc. | USD | 200,000 | KRW | 227,820,000 | 1/19/11 | 775 | ||||||||||||||||||||
| Morgan Stanley Capital Services, Inc. | USD | 100,000 | KRW | 113,060,000 | 1/19/11 | (361 | ) | |||||||||||||||||||
| Morgan Stanley Capital Services, Inc. | USD | 100,000 | KRW | 112,960,000 | 1/19/11 | (450 | ) | |||||||||||||||||||
| Morgan Stanley Capital Services, Inc. | USD | 200,000 | KRW | 226,080,000 | 1/19/11 | (758 | ) | |||||||||||||||||||
| Morgan Stanley Capital Services, Inc. | USD | 300,000 | KRW | 339,075,000 | 1/19/11 | (1,177 | ) | |||||||||||||||||||
| Morgan Stanley Capital Services, Inc. | USD | 200,000 | KRW | 222,088,000 | 1/19/11 | (4,276 | ) | |||||||||||||||||||
| Morgan Stanley Capital Services, Inc. | USD | 400,000 | MXN | 4,996,000 | 2/22/11 | 3,150 | ||||||||||||||||||||
| Morgan Stanley Capital Services, Inc. | USD | 600,000 | MXN | 7,431,900 | 2/22/11 | (286 | ) | |||||||||||||||||||
| Morgan Stanley Capital Services, Inc. | USD | 100,000 | MXN | 1,303,220 | 2/22/11 | 5,163 | ||||||||||||||||||||
| Morgan Stanley Capital Services, Inc. | USD | 100,000 | MXN | 1,283,600 | 2/22/11 | 3,580 | ||||||||||||||||||||
| Morgan Stanley Capital Services, Inc. | USD | 100,000 | MXN | 1,284,100 | 2/22/11 | 3,620 | ||||||||||||||||||||
| Morgan Stanley Capital Services, Inc. | USD | 200,000 | MXN | 2,548,700 | 2/22/11 | 5,666 | ||||||||||||||||||||
| Morgan Stanley Capital Services, Inc. | USD | 100,000 | MXN | 1,268,940 | 2/22/11 | 2,397 | ||||||||||||||||||||
| Morgan Stanley Capital Services, Inc. | USD | 100,000 | MXN | 1,269,940 | 2/22/11 | 2,477 | ||||||||||||||||||||
| Morgan Stanley Capital Services, Inc. | USD | 100,000 | MXN | 1,266,350 | 2/22/11 | 2,188 | ||||||||||||||||||||
| Morgan Stanley Capital Services, Inc. | USD | 200,000 | MXN | 2,531,300 | 2/22/11 | 4,262 | ||||||||||||||||||||
| Morgan Stanley Capital Services, Inc. | USD | 100,000 | MXN | 1,269,200 | 2/22/11 | 2,418 | ||||||||||||||||||||
| Morgan Stanley Capital Services, Inc. | USD | 100,000 | MXN | 1,268,950 | 2/22/11 | 2,397 | ||||||||||||||||||||
| Morgan Stanley Capital Services, Inc. | USD | 100,000 | MXN | 1,258,000 | 2/22/11 | 1,514 | ||||||||||||||||||||
| Morgan Stanley Capital Services, Inc. | USD | 100,000 | MXN | 1,257,320 | 2/22/11 | 1,459 | ||||||||||||||||||||
| Morgan Stanley Capital Services, Inc. | USD | 100,000 | MXN | 1,238,900 | 2/22/11 | (27 | ) | |||||||||||||||||||
| Morgan Stanley Capital Services, Inc. | USD | 100,000 | MXN | 1,240,630 | 2/22/11 | 112 | ||||||||||||||||||||
| Morgan Stanley Capital Services, Inc. | USD | 200,000 | MXN | 2,472,200 | 2/22/11 | (507 | ) | |||||||||||||||||||
| Morgan Stanley Capital Services, Inc. | USD | 100,000 | MXN | 1,237,850 | 2/22/11 | (112 | ) | |||||||||||||||||||
| Morgan Stanley Capital Services, Inc. | USD | 100,000 | MXN | 1,230,600 | 2/22/11 | (697 | ) | |||||||||||||||||||
| Morgan Stanley Capital Services, Inc. | USD | 100,000 | MXN | 1,253,150 | 2/22/11 | 1,122 | ||||||||||||||||||||
| Morgan Stanley Capital Services, Inc. | USD | 100,000 | MXN | 1,237,350 | 2/22/11 | (153 | ) | |||||||||||||||||||
| Morgan Stanley Capital Services, Inc. | USD | 100,000 | MXN | 1,233,200 | 2/22/11 | (487 | ) | |||||||||||||||||||
| Morgan Stanley Capital Services, Inc. | USD | 100,000 | MXN | 1,243,000 | 2/22/11 | 303 | ||||||||||||||||||||
| Morgan Stanley Capital Services, Inc. | USD | 100,000 | MXN | 1,242,900 | 2/22/11 | 295 | ||||||||||||||||||||
| Morgan Stanley Capital Services, Inc. | USD | 100,000 | MXN | 1,247,150 | 2/22/11 | 638 | ||||||||||||||||||||
| Morgan Stanley Capital Services, Inc. | USD | 100,000 | SGD | 131,114 | 2/24/11 | 2,173 | ||||||||||||||||||||
| Morgan Stanley Capital Services, Inc. | USD | 25,362 | TWD | 797,000 | 1/14/11 | 1,981 | ||||||||||||||||||||
| Morgan Stanley Capital Services, Inc. | USD | 300,000 | ZAR | 2,092,950 | 4/28/11 | 12,634 | ||||||||||||||||||||
| Morgan Stanley Capital Services, Inc. | USD | 100,000 | ZAR | 759,900 | 9/13/11 | 11,419 | ||||||||||||||||||||
| Royal Bank of Canada | JPY | 70,928,000 | USD | 842,365 | 1/14/11 | (31,329 | ) | |||||||||||||||||||
| Royal Bank of Scotland PLC | EUR | 100,000 | USD | 132,984 | 1/6/11 | (646 | ) | |||||||||||||||||||
| Royal Bank of Scotland PLC | EUR | 300,000 | USD | 394,657 | 1/25/11 | (6,215 | ) | |||||||||||||||||||
See Notes to Financial Statements.
246
Table of Contents
SC PIMCO TOTAL RETURN FUND
| PORTFOLIO OF INVESTMENTS (Continued) December 31, 2010 |
Sun Capital Advisers Trust |
| Counterparty (Continued) |
Contracts to Deliver |
In Exchange For |
Settlement Date |
Unrealized Appreciation/ (Depreciation) ($) |
||||||||||||||||||||||||
| Royal Bank of Scotland PLC | GBP | 1,315,000 | USD | 2,055,680 | 3/21/11 | 6,751 | ||||||||||||||||||||||
| Royal Bank of Scotland PLC | JPY | 141,856,000 | USD | 1,687,737 | 1/14/11 | (59,652 | ) | |||||||||||||||||||||
| Royal Bank of Scotland PLC | SGD | 394,281 | USD | 299,560 | 1/14/11 | (7,674 | ) | |||||||||||||||||||||
| Royal Bank of Scotland PLC | USD | 793,086 | CAD | 803,000 | 2/17/11 | 13,854 | ||||||||||||||||||||||
| Royal Bank of Scotland PLC | USD | 40,000 | IDR | 378,000,000 | 7/27/11 | 683 | ||||||||||||||||||||||
| Royal Bank of Scotland PLC | USD | 830,387 | IDR | 7,707,650,000 | 10/31/11 | (11,311 | ) | |||||||||||||||||||||
| Royal Bank of Scotland PLC | USD | 222,222 | INR | 10,000,000 | 3/9/11 | (1,180 | ) | |||||||||||||||||||||
| Royal Bank of Scotland PLC | USD | 138,772 | KRW | 157,000,000 | 5/9/11 | 174 | ||||||||||||||||||||||
| Royal Bank of Scotland PLC | USD | 41,980 | MYR | 130,000 | 2/7/11 | 80 | ||||||||||||||||||||||
| Royal Bank of Scotland PLC | USD | 299,544 | SGD | 394,281 | 6/9/11 | 7,711 | ||||||||||||||||||||||
| UBS AG | USD | 200,000 | JPY | 16,341,780 | 1/6/11 | 1,281 | ||||||||||||||||||||||
| Net unrealized appreciation |
1,071,381 | |||||||||||||||||||||||||||
| AUD | – | Australian Dollar | ||
| BRL | – | Brazilian Real | ||
| CAD | – | Canadian Dollar | ||
| CNY | – | Yuan Renminbi | ||
| EUR | – | Euro | ||
| GBP | – | Great British Pound | ||
| IDR | – | Indonesian Rupiah | ||
| INR | – | Indian Rupee | ||
| JPY | – | Japanese Yen | ||
| KRW | – | South Korean Won | ||
| MXN | – | Mexican Peso | ||
| MYR | – | Malaysian Ringgit | ||
| PHP | – | Philippine Peso | ||
| SGD | – | Singapore Dollar | ||
| TWD | – | New Taiwan Dollar | ||
| USD | – | United States Dollar | ||
| ZAR | – | South African Rand |
| (10) | At the period end, open written option contracts were as follows: |
Options on Exchange-Traded Futures Contracts
| Type |
Description |
Expiration Date |
Strike Price ($) |
Number of Contracts |
Value ($) | |||||||||
| Call | 90-Day Eurodollar September Futures | 9/19/11 | 99.375 | 145 | 85,187 | |||||||||
| Put | 90-Day Eurodollar September Futures | 9/19/11 | 99.375 | 145 | 59,813 | |||||||||
| Call | U.S. Treasury 10 Year Note March Futures | 1/21/11 | 129.00 | 39 | 609 | |||||||||
| Put | U.S. Treasury 10 Year Note March Futures | 1/21/11 | 124.00 | 39 | 141,375 | |||||||||
| Written option contracts (Premium received, $188,270) |
368 | 286,984 | ||||||||||||
See Notes to Financial Statements.
247
Table of Contents
SC PIMCO TOTAL RETURN FUND
| PORTFOLIO OF INVESTMENTS (Continued) December 31, 2010 |
Sun Capital Advisers Trust |
Forward Volatility Agreements on Swaption Straddles
| Description |
Counterparty |
Expiration Date |
Exercise Price ($) |
Notional Amount (000) ($) |
Value ($) | |||||||||||
| Call & Put–OTC 1-Year vs. 1-Year Swaption Straddle |
Goldman Sachs Bank | 10/11/11 | TBD | 4,600 | 37,287 | |||||||||||
| Call & Put–OTC 1-Year vs. 2-Year Swaption Straddle |
Morgan Stanley Capital Services, Inc.**** |
10/11/11 | TBD | 14,000 | 235,498 | |||||||||||
| Call & Put–OTC 1-Year vs. 2-Year Swaption Straddle |
Morgan Stanley Capital Services, Inc.**** |
11/14/11 | TBD | 11,600 | 194,700 | |||||||||||
| Forward volatility agreements (Premium received, $306,061) |
|
30,200 | 467,485 | |||||||||||||
TBD: To be determined. Exercise price and premium of the underlying swaption straddles to be determined on each Forward Volatility Agreement’s expiration date, based upon implied volatility parameters.
Inflation Floor Options
| Description |
Counterparty |
Strike Index |
Exercise |
Expiration Date |
Notional Amount (000) ($) |
Value ($) | ||||||||||||
| Floor - OTC CPURNSA Index |
Citibank NA** | 216.687 | Maximum of [1-(Index Final/Index Initial)] or $0 |
4/7/20 | 2,100 | 20,927 | ||||||||||||
| Floor - OTC CPURNSA Index |
Citibank NA** | 217.965 | Maximum of [1-(Index Final/Index Initial)] or $0 |
9/29/20 | 1,300 | 13,234 | ||||||||||||
| Floor - OTC CPURNSA Index |
Deutsche Bank AG*** |
215.949 | Maximum of [1-(Index Final/Index Initial)] or $0 |
3/10/20 | 1,000 | 10,352 | ||||||||||||
| Written inflation floor options (Premium received, $42,970) |
4,400 | 44,513 | ||||||||||||||||
Interest Rate Swaptions
| Type |
Description |
Counterparty |
Pay/Receive |
Floating Rate |
Exercise Rate |
Expiration Date |
Notional Amount (000) ($) |
Value ($) | ||||||||||||||||
| Put | OTC-2 Year Interest Rate Swap | Bank of America NA* | Pay | 3-Month USD-LIBOR |
2.25 | % | 9/24/12 | 7,100 | 96,201 | |||||||||||||||
| Put | OTC-3 Year Interest Rate Swap | Bank of America NA* | Pay | 3-Month USD-LIBOR |
3.00 | % | 6/18/12 | 11,000 | 138,884 | |||||||||||||||
| Put | OTC-10 Year Interest Rate Swap | Bank of America NA* | Pay | 3-Month USD-LIBOR |
4.00 | % | 6/13/11 | 1,700 | 25,923 | |||||||||||||||
| Put | OTC-3 Year Interest Rate Swap | Barclays Bank PLC | Pay | 3-Month USD-LIBOR |
3.00 | % | 6/18/12 | 8,900 | 112,370 | |||||||||||||||
| Put | OTC-10 Year Interest Rate Swap | Barclays Bank PLC | Pay | 3-Month USD-LIBOR |
4.00 | % | 6/13/11 | 900 | 13,724 | |||||||||||||||
| Put | OTC-2 Year Interest Rate Swap | Citibank NA** | Pay | 3-Month USD-LIBOR |
2.25 | % | 9/24/12 | 800 | 10,839 | |||||||||||||||
| Put | OTC-3 Year Interest Rate Swap | Citibank NA** | Pay | 3-Month USD-LIBOR |
3.00 | % | 6/18/12 | 7,800 | 98,481 | |||||||||||||||
See Notes to Financial Statements.
248
Table of Contents
SC PIMCO TOTAL RETURN FUND
| PORTFOLIO OF INVESTMENTS (Continued) December 31, 2010 |
Sun Capital Advisers Trust |
| Type |
Description |
Counterparty |
Pay/Receive |
Floating Rate |
Exercise Rate |
Expiration Date |
Notional Amount (000) ($) |
Value ($) | ||||||||||||||||
| Put | OTC-5 Year Interest Rate Swap | Citibank NA** | Pay | 3-Month USD-LIBOR |
3.25 | % | 7/16/12 | 5,000 | 154,190 | |||||||||||||||
| Put | OTC-3 Year Interest Rate Swap | Deutsche Bank AG*** | Pay | 3-Month USD-LIBOR |
2.75 | % | 6/18/12 | 6,300 | 95,149 | |||||||||||||||
| Put | OTC-3 Year Interest Rate Swap | Deutsche Bank AG*** | Pay | 3-Month USD-LIBOR |
3.00 | % | 6/18/12 | 5,300 | 66,917 | |||||||||||||||
| Put | OTC-10 Year Interest Rate Swap | Deutsche Bank AG*** | Pay | 3-Month USD-LIBOR |
4.00 | % | 6/13/11 | 800 | 12,199 | |||||||||||||||
| Put | OTC-1 Year Interest Rate Swap | Goldman Sachs Bank | Pay | 3-Month USD-LIBOR |
0.65 | % | 11/14/11 | 9,400 | 44,999 | |||||||||||||||
| Put | OTC-1 Year Interest Rate Swap | Goldman Sachs Bank | Pay | 3-Month USD-LIBOR |
1.00 | % | 11/19/12 | 10,700 | 127,299 | |||||||||||||||
| Put | OTC-2 Year Interest Rate Swap | Goldman Sachs Bank | Pay | 3-Month USD-LIBOR |
2.25 | % | 9/24/12 | 6,700 | 90,781 | |||||||||||||||
| Put | OTC-10 Year Interest Rate Swap | Goldman Sachs Bank | Pay | 3-Month USD-LIBOR |
4.00 | % | 6/13/11 | 900 | 13,724 | |||||||||||||||
| Put | OTC-2 Year Interest Rate Swap | Morgan Stanley Capital Services Inc.**** | Pay | 3-Month USD-LIBOR |
2.25 | % | 9/24/12 | 3,500 | 47,423 | |||||||||||||||
| Put | OTC-10 Year Interest Rate Swap | Morgan Stanley Capital Services Inc.**** | Pay | 3-Month USD-LIBOR |
10.00 | % | 7/10/12 | 2,000 | 1,363 | |||||||||||||||
| Put | OTC-1 Year Interest Rate Swap | Royal Bank of Scotland PLC | Pay | 3-Month USD-LIBOR |
1.75 | % | 11/19/12 | 12,200 | 92,159 | |||||||||||||||
| Put | OTC-2 Year Interest Rate Swap | Royal Bank of Scotland PLC | Pay | 3-Month USD-LIBOR |
2.25 | % | 9/24/12 | 30,700 | 415,966 | |||||||||||||||
| Put | OTC-3 Year Interest Rate Swap | Royal Bank of Scotland PLC | Pay | 3-Month USD-LIBOR |
2.75 | % | 6/18/12 | 5,900 | 89,108 | |||||||||||||||
| Put | OTC-3 Year Interest Rate Swap | Royal Bank of Scotland PLC | Pay | 3-Month USD-LIBOR |
3.00 | % | 6/18/12 | 14,900 | 188,124 | |||||||||||||||
| Put | OTC-5 Year Interest Rate Swap | Royal Bank of Scotland PLC | Pay | 3-Month USD-LIBOR |
3.25 | % | 7/16/12 | 1,700 | 52,425 | |||||||||||||||
| Put | OTC-10 Year Interest Rate Swap | Royal Bank of Scotland PLC | Pay | 3-Month USD-LIBOR |
4.00 | % | 6/13/11 | 1,900 | 28,973 | |||||||||||||||
| Written swaptions (Premium received, $1,342,130) |
|
156,100 | 2,017,221 | |||||||||||||||||||||
| CPURNSA | – | Consumer Price All Urban Non-Seasonally Adjusted Index | ||
| LIBOR | – | London Interbank Offered Rate | ||
| OTC | – | Over the Counter | ||
| USD | – | United States Dollar |
See Notes to Financial Statements.
249
Table of Contents
SC PIMCO TOTAL RETURN FUND
| PORTFOLIO OF INVESTMENTS (Continued) December 31, 2010 |
Sun Capital Advisers Trust |
| (11) | At the period end, open swap contracts were as follows: |
Interest Rate Swap Contracts
| Counterparty |
Pay/Receive Floating Rate |
Floating Rate Index |
Fixed Rate |
Expiration Date |
Notional Amount (000) ($) |
Market Value ($) |
Upfront Premiums Paid/ (Received) ($) |
Unrealized Appreciation/ (Depreciation) ($) |
||||||||||||||||||||||||
| Bank of America NA* |
Pay | |
3-Month USD-LIBOR |
|
1.95% | 12/15/15 | 7,500 | (72,716 | ) | — | (72,716 | ) | ||||||||||||||||||||
| Goldman Sachs Bank |
Pay | |
3-Month USD-LIBOR |
|
1.25% | 12/19/13 | 4,800 | (44,586 | ) | 235 | (44,821 | ) | ||||||||||||||||||||
| Goldman Sachs Bank |
Pay | BRL-BZDIOVRA | 12.65% | 1/2/14 | 602 | 25,039 | 6,547 | 18,492 | ||||||||||||||||||||||||
| HSBC Bank USA, NA***** |
Pay | MXN-TIIE-Banxico | 7.33% | 1/28/15 | 486 | 18,834 | 2,681 | 16,153 | ||||||||||||||||||||||||
| Morgan Stanley Capital Services, Inc.**** |
Pay | BRL-BZDIOVRA | 12.59% | 1/2/13 | 120 | 2,410 | 272 | 2,138 | ||||||||||||||||||||||||
| Morgan Stanley Capital Services, Inc.**** |
Pay | BRL-BZDIOVRA | 12.51% | 1/2/14 | 602 | 21,612 | 4,601 | 17,011 | ||||||||||||||||||||||||
| Morgan Stanley Capital Services, Inc.**** |
Receive | |
3-Month USD-LIBOR |
|
4.25% | 6/15/41 | 7,000 | (39,135 | ) | 12,250 | (51,385 | ) | ||||||||||||||||||||
| Royal Bank of Scotland PLC |
Pay | |
3-Month CAD-CDOR |
|
5.70% | 12/18/24 | 3,218 | 63,715 | (2,193 | ) | 65,908 | |||||||||||||||||||||
| Total |
24,328 | (24,827 | ) | 24,393 | (49,220 | ) | ||||||||||||||||||||||||||
| BRL | – | Brazilian Real | ||
| BZDIOVRA | – | Brazilian Interbank Deposit Rate Over | ||
| CAD | – | Canadian Dollar | ||
| CDOR | – | Canadian Deposit Offered Rate | ||
| LIBOR | – | London Interbank Offered Rate | ||
| MXN | – | Mexican Peso | ||
| TIIE | – | Tasa de Interes Interbancaria de Equilibrio (Interbank Equilibrium Interest Rate) | ||
| USD | – | United States Dollar |
Credit Default Swap Contracts on Corporate Issue – Buy Protection (a)
| Counterparty |
Reference Entity |
(Pay)/Receive Fixed Rate |
Expiration Date |
Implied Credit Spread (b) |
Notional Amount (c) (000) ($) |
Market Value ($) |
Unrealized Depreciation ($) |
|||||||||||||||||||
| Barclays Bank PLC |
Tate & Lyle International Finance PLC |
(1.15 | )% | 6/20/16 | 1.08% | 500 | (1,843 | ) | (1,843 | ) | ||||||||||||||||
See Notes to Financial Statements.
250
Table of Contents
SC PIMCO TOTAL RETURN FUND
| PORTFOLIO OF INVESTMENTS (Continued) December 31, 2010 |
Sun Capital Advisers Trust |
Credit Default Swap Contracts on Corporate and Sovereign Issues – Sell Protection (a)
| Counterparty |
Reference Entity |
(Pay)/Receive Fixed Rate |
Expiration Date |
Implied Credit Spread (b) |
Notional Amount (c) (000) ($) |
Market Value ($) |
Upfront Premiums Paid / (Received) ($) |
Unrealized Appreciation/ (Depreciation) ($) |
||||||||||||||||||||||
| Bank of America NA* |
General Electric Capital Corp. |
1.00% | 12/20/15 | 1.33% | 500 | (7,551 | ) | (9,796 | ) | 2,245 | ||||||||||||||||||||
| Bank of America NA* |
General Electric Capital Corp. |
1.00% | 12/20/15 | 1.33% | 500 | (7,551 | ) | (10,025 | ) | 2,474 | ||||||||||||||||||||
| Bank of America NA* |
Japan Government Bond |
1.00% | 3/20/16 | 0.72% | 100 | 1,381 | 1,439 | (58 | ) | |||||||||||||||||||||
| Bank of America NA* |
Japan Government Bond |
1.00% | 3/20/16 | 0.72% | 200 | 2,763 | 2,676 | 87 | ||||||||||||||||||||||
| Bank of America NA* |
Metlife, Inc. | 1.00% | 12/20/15 | 1.61% | 600 | (16,822 | ) | (21,812 | ) | 4,990 | ||||||||||||||||||||
| Bank of America NA* |
Metlife, Inc. | 1.00% | 12/20/15 | 1.61% | 900 | (25,232 | ) | (50,283 | ) | 25,051 | ||||||||||||||||||||
| Bank of America NA* |
Prudential Financial, Inc. |
1.00% | 12/20/15 | 1.40% | 700 | (13,131 | ) | (20,428 | ) | 7,297 | ||||||||||||||||||||
| Barclays Bank PLC |
Brazilian Government International Bond |
1.00% | 6/20/15 | 1.02% | 500 | (380 | ) | (7,190 | ) | 6,810 | ||||||||||||||||||||
| Barclays Bank PLC |
United Mexican States, Series A |
1.00% | 3/20/15 | 1.02% | 400 | (313 | ) | (8,999 | ) | 8,686 | ||||||||||||||||||||
| Barclays Bank PLC |
United Mexican States, Series A |
1.00% | 9/20/15 | 1.09% | 3,300 | (12,792 | ) | (44,617 | ) | 31,825 | ||||||||||||||||||||
| Citibank NA** |
Brazilian Government International Bond |
1.00% | 9/20/15 | 1.05% | 1,000 | (2,335 | ) | (15,693 | ) | 13,358 | ||||||||||||||||||||
| Citibank NA** |
Metlife, Inc. | 1.00% | 12/20/15 | 1.61% | 800 | (22,429 | ) | (29,083 | ) | 6,654 | ||||||||||||||||||||
| Citibank NA** |
Turkey Government Bond |
1.00% | 12/20/15 | 1.36% | 6,100 | (102,320 | ) | (78,114 | ) | (24,206 | ) | |||||||||||||||||||
| Citibank NA** |
United Mexican States, Series A |
1.00% | 3/20/15 | 1.02% | 400 | (313 | ) | (9,184 | ) | 8,871 | ||||||||||||||||||||
| Deutsche Bank AG*** |
Brazilian Government International Bond |
1.00% | 12/20/15 | 1.08% | 6,200 | (23,982 | ) | (35,105 | ) | 11,123 | ||||||||||||||||||||
| Deutsche Bank AG*** |
Brazilian Government International Bond |
1.00% | 6/20/15 | 1.02% | 500 | (381 | ) | (4,780 | ) | 4,399 | ||||||||||||||||||||
| Deutsche Bank AG*** |
Japan Government Bond |
1.00% | 3/20/15 | 0.62% | 700 | 10,961 | 8,131 | 2,830 | ||||||||||||||||||||||
| Deutsche Bank AG*** |
United Mexican States, Series A |
1.00% | 3/20/15 | 1.02% | 200 | (157 | ) | (4,592 | ) | 4,435 | ||||||||||||||||||||
| Deutsche Bank AG*** |
United Mexican States, Series A |
1.00% | 9/20/15 | 1.09% | 3,000 | (11,629 | ) | (40,561 | ) | 28,932 | ||||||||||||||||||||
| Goldman Sachs International |
Brazilian Government International Bond |
1.00% | 6/20/15 | 1.02% | 500 | (381 | ) | (6,716 | ) | 6,335 | ||||||||||||||||||||
See Notes to Financial Statements.
251
Table of Contents
SC PIMCO TOTAL RETURN FUND
| PORTFOLIO OF INVESTMENTS (Continued) December 31, 2010 |
Sun Capital Advisers Trust |
| Counterparty |
Reference Entity |
(Pay)/Receive Fixed Rate |
Expiration Date |
Implied Credit Spread (b) |
Notional Amount (c) (000) ($) |
Market Value ($) |
Upfront Premiums Paid / (Received) ($) |
Unrealized Appreciation/ (Depreciation) ($) |
||||||||||||||||||||||||
| Goldman Sachs International |
|
France Government Bond |
|
0.25% | 12/20/15 | 1.05% | 300 | (11,242 | ) | (5,883 | ) | (5,359 | ) | |||||||||||||||||||
| Goldman Sachs International |
Metlife, Inc. | 1.00% | 9/20/15 | 1.56% | 1,000 | (24,829 | ) | (64,375 | ) | 39,546 | ||||||||||||||||||||||
| Goldman Sachs International |
|
United Kingdom Gilt |
|
1.00% | 12/20/15 | 0.71% | 500 | 6,801 | 11,507 | (4,706 | ) | |||||||||||||||||||||
| Goldman Sachs International |
|
United Kingdom Gilt |
|
1.00% | 12/20/15 | 0.71% | 1,000 | 13,602 | 23,194 | (9,592 | ) | |||||||||||||||||||||
| Goldman Sachs International |
|
United Kingdom Gilt |
|
1.00% | 6/20/15 | 0.66% | 2,200 | 32,339 | 20,327 | 12,012 | ||||||||||||||||||||||
| HSBC Bank USA, NA***** |
|
Brazilian Government International Bond |
|
1.00% | 9/20/15 | 1.05% | 1,200 | (2,802 | ) | (11,922 | ) | 9,120 | ||||||||||||||||||||
| Morgan Stanley Capital Services, Inc.**** |
|
Brazilian Government International Bond |
|
1.00% | 6/20/15 | 1.02% | 500 | (380 | ) | (4,839 | ) | 4,459 | ||||||||||||||||||||
| Morgan Stanley Capital Services, Inc.**** |
|
Brazilian Government International Bond |
|
1.00% | 9/20/15 | 1.05% | 4,900 | (11,442 | ) | (68,592 | ) | 57,150 | ||||||||||||||||||||
| Royal Bank of Scotland PLC |
|
France Government Bond |
|
0.25% | 12/20/15 | 1.05% | 700 | (26,231 | ) | (13,898 | ) | (12,333 | ) | |||||||||||||||||||
| Total |
39,400 | (256,778 | ) | (499,213 | ) | 242,435 | ||||||||||||||||||||||||||
Credit Default Swap Contracts on Credit Indices – Sell Protection (a)
| Counterparty |
Reference |
(Pay)/Receive Fixed Rate |
Expiration Date |
Notional Amount (c) (000) ($) |
Market Value (d) ($) |
Upfront Premiums Paid / (Received) ($) |
Unrealized Appreciation/ (Depreciation) ($) |
|||||||||||||||||||
| Bank of America NA* |
CDX.EM-14 Index | 5.00% | 12/20/15 | 5,000 | 680,263 | 685,000 | (4,737 | ) | ||||||||||||||||||
| Bank of America NA* |
CDX.HY-15 5-Year Index | 5.00% | 12/20/15 | 2,800 | 83,860 | 14,000 | 69,860 | |||||||||||||||||||
| Bank of America NA* |
CDX.IG-15 5-Year Index | 1.00% | 12/20/15 | 15,200 | 107,028 | (17,986 | ) | 125,014 | ||||||||||||||||||
| Barclays Bank PLC |
CDX.EM-13 Index | 5.00% | 6/20/15 | 6,000 | 758,334 | 769,300 | (10,966 | ) | ||||||||||||||||||
| Barclays Bank PLC |
CDX.EM-14 Index | 5.00% | 12/20/15 | 2,200 | 299,316 | 284,300 | 15,016 | |||||||||||||||||||
| Barclays Bank PLC |
CDX.HY-15 5-Year Index | 5.00% | 12/20/15 | 100 | 2,995 | (1,250 | ) | 4,245 | ||||||||||||||||||
| Citibank NA** |
CDX.EM-14 Index | 5.00% | 12/20/15 | 3,100 | 421,763 | 418,100 | 3,663 | |||||||||||||||||||
| Citibank NA** |
CDX.HY-15 5-Year Index | 5.00% | 12/20/15 | 1,100 | 32,945 | (15,875 | ) | 48,820 | ||||||||||||||||||
| Citibank NA** |
CDX.IG-15 5 Year Index | 1.00% | 12/20/15 | 2,500 | 17,603 | (4,879 | ) | 22,482 | ||||||||||||||||||
| Deutsche Bank AG*** |
CDX.EM-13 Index | 5.00% | 6/20/15 | 2,000 | 252,778 | 246,500 | 6,278 | |||||||||||||||||||
See Notes to Financial Statements.
252
Table of Contents
SC PIMCO TOTAL RETURN FUND
| PORTFOLIO OF INVESTMENTS (Continued) December 31, 2010 |
Sun Capital Advisers Trust |
| Counterparty |
Reference |
(Pay)/Receive Fixed Rate |
Expiration Date |
Notional Amount (c) (000) ($) |
Market Value (d) ($) |
Upfront Premiums Paid / (Received) ($) |
Unrealized Appreciation/ (Depreciation) ($) |
|||||||||||||||||||
| Deutsche Bank AG*** |
CDX.EM-14 Index | 5.00% | 12/20/15 | 1,300 | 176,868 | 161,400 | 15,468 | |||||||||||||||||||
| Deutsche Bank AG*** |
CDX.HY-15 5-Year Index | 5.00% | 12/20/15 | 2,500 | 74,875 | (18,750 | ) | 93,625 | ||||||||||||||||||
| Deutsche Bank AG*** |
CDX.IG-15 5-Year Index | 1.00% | 12/20/15 | 8,200 | 57,739 | (9,424 | ) | 67,163 | ||||||||||||||||||
| Goldman Sachs International |
CDX.IG-15 5-Year Index | 1.00% | 12/20/15 | 2,400 | 16,899 | (4,461 | ) | 21,360 | ||||||||||||||||||
| HSBC Bank USA, NA***** |
CDX.EM-13 Index | 5.00% | 6/20/15 | 3,100 | 391,806 | 363,590 | 28,216 | |||||||||||||||||||
| HSBC Bank USA, NA***** |
CDX.EM-14 Index | 5.00% | 12/20/15 | 400 | 54,421 | 52,200 | 2,221 | |||||||||||||||||||
| Morgan Stanley Capital Services, Inc.**** |
CDX.EM-13 Index | 5.00% | 6/20/15 | 1,900 | 240,139 | 214,250 | 25,889 | |||||||||||||||||||
| Morgan Stanley Capital Services, Inc.**** |
CDX.EM-14 Index | 5.00% | 12/20/15 | 900 | 122,447 | 117,000 | 5,447 | |||||||||||||||||||
| Morgan Stanley Capital Services, Inc.**** |
CDX.HY-15 5-Year Index | 5.00% | 12/20/15 | 15,375 | 460,480 | 76,563 | 383,917 | |||||||||||||||||||
| Morgan Stanley Capital Services, Inc.**** |
CDX.IG-15 5-Year Index | 1.00% | 12/20/15 | 1,000 | 7,041 | 1,475 | 5,566 | |||||||||||||||||||
| Royal Bank of Scotland PLC |
CDX.HY-15 5-Year Index | 5.00% | 12/20/15 | 600 | 17,970 | (4,125 | ) | 22,095 | ||||||||||||||||||
| Total |
77,675 | 4,277,570 | 3,326,928 | 950,642 | ||||||||||||||||||||||
| * ** *** **** ***** |
At the period end, cash of $590,000 has been received as collateral for these open swap and swaption contracts. At the period end, the broker pledged securities with a fair value of $759,635 to the Fund as collateral for these open swap and written option contracts. At the period end, cash of $285,000 has been received as collateral for these open swap and written option contracts. At the period end, cash of $700,000 has been received as collateral for these open swap and written option contracts. At the period end, cash of $500,000 has been received as collateral for these open swaps. |
| (a) | If the Fund is a seller of protection and a credit event occurs, as defined under the terms of that particular swap agreement, the Fund will pay to the buyer of the protection an amount up to the notional amount of the swap and in certain instances, take delivery of the security. As a buyer of protection, the Fund will generally receive from the seller of protection an amount up to the notional amount of the swap if a credit event occurs. |
| (b) | Implied credit spreads, represented in absolute terms, utilized in determining the market value of credit default swap agreements on corporate and sovereign issues as of period end serve as an indicator of the current status of the payment/performance risk and represent the likelihood or risk of default for the credit derivative. The implied credit spread of a particular referenced entity reflects the cost of buying/selling protection and may include upfront payments required to be made to enter into the agreement. Wider credit spreads represent a deterioration of the referenced entity’s credit soundness and a greater likelihood or risk of default or other credit event occurring as defined under the terms of that particular agreement. |
| (c) | The maximum potential amount the Fund could be required to pay as a seller of credit protection or receive as a buyer of credit protection if a credit event occurs as defined under the terms of that particular swap agreement. |
| (d) | The quoted market prices and resulting values for credit default swap contracts on credit indices serve as an indicator of the current status of the payment/performance risk and represent the likelihood of an expected liability (or profit) for the credit derivative had the notional amount of the swap agreement been closed/sold as of the period end. Increasing market values, in absolute terms when compared to the notional amount of the swap, represent a deterioration of the referenced entity’s credit soundness and a greater likelihood or risk of default or other credit event occurring as defined under the terms of the agreement. |
See Notes to Financial Statements.
253
Table of Contents
SC PIMCO TOTAL RETURN FUND
| PORTFOLIO OF INVESTMENTS (Continued) December 31, 2010 |
Sun Capital Advisers Trust |
| (12) | Fair Value Measurements † |
The following table summarizes the inputs used to value the Fund’s assets and liabilities, as applicable, measured at fair value at the period end:
| Assets |
Quoted Prices in Active Markets for Identical Assets and Liabilities (Level 1) |
Significant Other Observable Inputs (Level 2) |
Significant Unobservable Inputs (Level 3) |
Total | ||||||||||||
| Asset Backed Securities |
$ | — | $ | 3,737,404 | $ | — | $ | 3,737,404 | ||||||||
| Collateralized Mortgage Obligations |
— | 20,218,431 | — | 20,218,431 | ||||||||||||
| Commercial Mortgage Backed Securities |
— | 9,887,477 | — | 9,887,477 | ||||||||||||
| Convertible Bonds (a) |
— | 2,856,500 | — | 2,856,500 | ||||||||||||
| Corporate Debt Obligations (a) |
— | 177,313,393 | — | 177,313,393 | ||||||||||||
| Foreign Government Agency Obligations |
— | 9,399,447 | — | 9,399,447 | ||||||||||||
| Foreign Government Obligations |
— | 21,641,507 | — | 21,641,507 | ||||||||||||
| Municipal Bonds |
— | 24,436,646 | — | 24,436,646 | ||||||||||||
| U.S. Treasury and U.S. Government Agency Obligations |
319,882,072 | 340,017,802 | — | 659,899,874 | ||||||||||||
| Convertible Preferred Stocks (a) |
200,110 | — | — | 200,110 | ||||||||||||
| Preferred Stocks (a) |
— | 5,284,440 | — | 5,284,440 | ||||||||||||
| Short Term Investments |
||||||||||||||||
| U.S. Treasury |
340,754 | 1,539,980 | — | 1,880,734 | ||||||||||||
| Mutual Funds |
5,586,960 | — | — | 5,586,960 | ||||||||||||
| Total Short Term Investments |
5,927,714 | 1,539,980 | — | 7,467,694 | ||||||||||||
| Total Investments |
326,009,896 | 616,333,027 | — | 942,342,923 | ||||||||||||
| Financial Derivative Instruments |
||||||||||||||||
| Futures Contracts |
224,025 | — | — | 224,025 | ||||||||||||
| Forward Foreign Currency Exchange Contracts |
— | 1,494,454 | — | 1,494,454 | ||||||||||||
| Swap Contracts (a) |
— | 1,384,736 | — | 1,384,736 | ||||||||||||
| Total Financial Derivative Instruments |
$ | 224,025 | $ | 2,879,190 | $ | — | $ | 3,103,215 | ||||||||
| Liabilities |
||||||||||||||||
| Financial Derivative Instruments |
||||||||||||||||
| Futures Contracts |
$ | (904,781 | ) | $ | — | $ | — | $ | (904,781 | ) | ||||||
| Forward Foreign Currency Exchange Contracts |
— | (423,073 | ) | — | (423,073 | ) | ||||||||||
| Written Option Contracts (a) |
(286,984 | ) | (511,998 | ) | — | (798,982 | ) | |||||||||
| Written Swaption Contracts |
— | (2,017,221 | ) | — | (2,017,221 | ) | ||||||||||
| Swap Contracts (a) |
— | (242,722 | ) | — | (242,722 | ) | ||||||||||
| Total Financial Derivative Instruments |
(1,191,765 | ) | (3,195,014 | ) | — | (4,386,779 | ) | |||||||||
| Other Financial Instruments |
||||||||||||||||
| Forward Sales Contracts |
— | (4,336 | ) | — | (4,336 | ) | ||||||||||
| Total Other Financial Instruments |
$ | — | $ | (4,336 | ) | $ | — | $ | (4,336 | ) | ||||||
| † | See Note 2b in the Notes to Financial Statements for additional information. |
| (a) | See Portfolio of Investments for additional detailed categorizations. |
See Notes to Financial Statements.
254
Table of Contents
| PORTFOLIO OF INVESTMENTS December 31, 2010 |
Sun Capital Advisers Trust |
| FHLMC | Federal Home Loan Mortgage Corporation |
| (1) | Sun Capital Advisers LLC or its affiliate, Massachusetts Financial Services Company (“MFS”), serves as investment adviser to these underlying funds. These are affiliated securities. |
| (2) | Each investment is in the Initial Class shares. |
See Notes to Financial Statements.
255
Table of Contents
| SC IBBOTSON BALANCED FUND PORTFOLIO OF INVESTMENTS (Continued) | ||
| December 31, 2010 | Sun Capital Advisers Trust | |
| (3) | Fair Value Measurements † |
The following table summarizes the inputs used to value the Fund’s assets and liabilities, as applicable, measured at fair value at the period end:
| Assets |
Quoted Prices in Active Markets for Identical Assets and Liabilities (Level 1) |
Significant Other Observable Inputs (Level 2) |
Significant Unobservable Inputs (Level 3) |
Total | ||||||||||||
| Investment Companies |
$ | 1,443,061,806 | $ | — | $ | — | $ | 1,443,061,806 | ||||||||
| Short Term Investments |
— | 1,751,432 | — | 1,751,432 | ||||||||||||
| Total Investments |
$ | 1,443,061,806 | $ | 1,751,432 | $ | — | $ | 1,444,813,238 | ||||||||
| † | See Note 2b in the Notes to Financial Statements for additional information. |
See Notes to Financial Statements.
256
Table of Contents
| PORTFOLIO OF INVESTMENTS December 31, 2010 |
Sun Capital Advisers Trust |
| FHLMC | Federal Home Loan Mortgage Corporation |
| (1) | Sun Capital Advisers LLC or its affiliate, MFS, serves as investment adviser to these underlying funds. These are affiliated securities. |
| (2) | Each investment is in the Initial Class shares. |
| (3) | Fair Value Measurements † |
The following table summarizes the inputs used to value the Fund’s assets and liabilities, as applicable, measured at fair value at the period end:
| Assets |
Quoted Prices in Active Markets for Identical Assets and Liabilities (Level 1) |
Significant Other Observable Inputs (Level 2) |
Significant Unobservable Inputs (Level 3) |
Total | ||||||||||||
| Investment Companies |
$ | 761,154,596 | $ | — | $ | — | $ | 761,154,596 | ||||||||
| Short Term Investments |
— | 1,017,177 | — | 1,017,177 | ||||||||||||
| Total Investments |
$ | 761,154,596 | $ | 1,017,177 | $ | — | $ | 762,171,773 | ||||||||
| † | See Note 2b in the Notes to Financial Statements for additional information. |
See Notes to Financial Statements.
257
Table of Contents
| PORTFOLIO OF INVESTMENTS December 31, 2010 |
Sun Capital Advisers Trust |
| FHLMC | Federal Home Loan Mortgage Corporation |
| + | Amount is less than 0.05%. |
| (1) | Sun Capital Advisers LLC or its affiliate, MFS, serves as investment adviser to these underlying funds. These are affiliated securities. |
| (2) | Each investment is in the Initial Class shares. |
See Notes to Financial Statements.
258
Table of Contents
| SC IBBOTSON GROWTH FUND PORTFOLIO OF INVESTMENTS (Continued) | ||
| December 31, 2010 | Sun Capital Advisers Trust | |
| (3) | Fair Value Measurements † |
The following table summarizes the inputs used to value the Fund’s assets and liabilities, as applicable, measured at fair value at the period end:
| Assets |
Quoted Prices in Active Markets for Identical Assets and Liabilities (Level 1) |
Significant Other Observable Inputs (Level 2) |
Significant Unobservable Inputs (Level 3) |
Total | ||||||||||||
| Investment Companies |
$ | 590,608,920 | $ | — | $ | — | $ | 590,608,920 | ||||||||
| Short Term Investments |
— | 78,079 | — | 78,079 | ||||||||||||
| Total Investments |
$ | 590,608,920 | $ | 78,079 | $ | — | $ | 590,686,999 | ||||||||
| † | See Note 2b in the Notes to Financial Statements for additional information. |
See Notes to Financial Statements.
259
Table of Contents
| STATEMENTS OF ASSETS AND LIABILITIES | ||
| December 31, 2010 | Sun Capital Advisers Trust |
| SC AllianceBernstein International Value Fund |
SC BlackRock International Index Fund |
SC BlackRock Large Cap Index Fund |
SC BlackRock Small Cap Index Fund |
SC Goldman Sachs Mid Cap Value Fund |
||||||||||||||||
| ASSETS |
||||||||||||||||||||
| Investments, at value |
||||||||||||||||||||
| Securities |
$ | 74,141,285 | $ | 54,114,704 | $ | 106,096,582 | $ | 180,299,231 | $ | 272,165,370 | ||||||||||
| Total Investments |
74,141,285 | 54,114,704 | 106,096,582 | 180,299,231 | 272,165,370 | |||||||||||||||
| Cash |
— | — | — | — | 103,330 | |||||||||||||||
| Foreign currency, at value |
164,887 | 505,673 | — | — | — | |||||||||||||||
| Margin deposits with broker |
25,514 | 145,000 | 368,000 | 379,000 | — | |||||||||||||||
| Interest and dividends receivable |
101,001 | 25,763 | 120,127 | 196,216 | 266,559 | |||||||||||||||
| Receivable for Fund shares sold |
29,527 | 176,899 | 66,934 | 34,108 | 81,057 | |||||||||||||||
| Receivable for investments sold |
1,826 | — | — | — | — | |||||||||||||||
| Variation margin receivable |
209 | 7,307 | — | — | — | |||||||||||||||
| Receivable due from Adviser |
— | 66,126 | — | — | — | |||||||||||||||
| Other assets |
1,522 | 1,165 | 2,284 | 3,929 | 1,498 | |||||||||||||||
| Total Assets |
74,465,771 | 55,042,637 | 106,653,927 | 180,912,484 | 272,617,814 | |||||||||||||||
| LIABILITIES |
||||||||||||||||||||
| Payable for investments purchased - regular delivery |
149,312 | 30,484 | — | — | 103,330 | |||||||||||||||
| Payable for Fund shares redeemed |
95 | — | 405 | 47,518 | 24,775 | |||||||||||||||
| Investment advisory fee payable |
13,255 | — | 31,860 | 73,912 | 641,679 | |||||||||||||||
| Distribution fee (Service Class) payable |
325 | 28 | 1,776 | 14,863 | 2,924 | |||||||||||||||
| Variation margin payable |
— | — | 3,302 | 34,170 | 45,990 | |||||||||||||||
| Accrued expenses and other liabilities |
50,949 | 122,321 | 40,166 | 63,846 | 181 | |||||||||||||||
| Total Liabilities |
213,936 | 152,833 | 77,509 | 234,309 | 818,879 | |||||||||||||||
| NET ASSETS |
$ | 74,251,835 | $ | 54,889,804 | $ | 106,576,418 | $ | 180,678,175 | $ | 271,798,935 | ||||||||||
| COMPOSITION OF NET ASSETS |
||||||||||||||||||||
| Paid-in Capital |
$ | 61,101,099 | $ | 52,943,581 | $ | 81,765,997 | $ | 165,391,005 | $ | 187,019,383 | ||||||||||
| Accumulated undistributed net investment income (loss) |
1,643,157 | (26,586 | ) | 1,345,539 | 791,322 | 3,346,874 | ||||||||||||||
| Accumulated net realized gain (loss) on investments and foreign currency related transactions |
4,091,120 | (28,536 | ) | 17,284,946 | (3,544,153 | ) | 22,471,427 | |||||||||||||
| Net unrealized appreciation (depreciation) on investments and assets and liabilities in foreign currencies |
7,416,459 | 2,001,345 | 6,179,936 | 18,040,001 | 58,961,251 | |||||||||||||||
| $ | 74,251,835 | $ | 54,889,804 | $ | 106,576,418 | $ | 180,678,175 | $ | 271,798,935 | |||||||||||
| Initial Class |
||||||||||||||||||||
| Net Assets |
$ | 71,186,420 | $ | 54,634,591 | $ | 90,267,229 | $ | 45,720,356 | $ | 245,160,981 | ||||||||||
| Shares of beneficial interest |
7,037,858 | 5,265,551 | 9,630,076 | 3,485,955 | 25,951,851 | |||||||||||||||
| Net asset value per share |
$ | 10.11 | $ | 10.38 | $ | 9.37 | $ | 13.12 | $ | 9.45 | ||||||||||
| Service Class |
||||||||||||||||||||
| Net Assets |
$ | 3,065,415 | $ | 255,213 | $ | 16,309,189 | $ | 134,957,819 | $ | 26,637,954 | ||||||||||
| Shares of beneficial interest |
303,944 | 24,603 | 1,701,470 | 10,424,636 | 2,829,735 | |||||||||||||||
| Net asset value per share |
$ | 10.09 | $ | 10.37 | $ | 9.59 | $ | 12.95 | $ | 9.41 | ||||||||||
| Investments, at cost |
$ | 66,723,401 | $ | 52,136,312 | $ | 99,971,412 | $ | 162,308,448 | $ | 213,198,197 | ||||||||||
| Foreign currency, at cost |
$ | 162,503 | $ | 498,562 | $ | — | $ | — | $ | — | ||||||||||
See Notes to Financial Statements.
260
Table of Contents
| STATEMENTS OF ASSETS AND LIABILITIES (Continued) | ||
| December 31, 2010 | Sun Capital Advisers Trust |
| SC Columbia Small Cap Value Fund |
SC Davis Venture Value Fund |
SC Invesco Small Cap Growth Fund |
SC Lord Abbett Growth & Income Fund |
SC WMC Blue Chip Mid Cap Fund |
||||||||||||||||
| ASSETS |
||||||||||||||||||||
| Investments, at value |
||||||||||||||||||||
| Securities |
$ | 60,933,820 | $ | 424,008,478 | $ | 31,022,073 | $ | 559,022,698 | $ | 166,763,235 | ||||||||||
| Repurchase Agreements |
265,198 | — | 336,616 | — | 2,142,089 | |||||||||||||||
| Total Investments |
61,199,018 | 424,008,478 | 31,358,689 | 559,022,698 | 168,905,324 | |||||||||||||||
| Cash |
900 | 1,185 | — | — | — | |||||||||||||||
| Interest and dividends receivable |
60,694 | 404,744 | 8,043 | 287,404 | 66,214 | |||||||||||||||
| Receivable for Fund shares sold |
6,884 | 3,122 | 31,523 | 4,381 | 111,266 | |||||||||||||||
| Receivable for investments sold |
3,484 | 24,586 | 132,547 | 3,086,091 | 84,510 | |||||||||||||||
| Other assets |
1,233 | 9,411 | 689 | 3,143 | 3,228 | |||||||||||||||
| Total Assets |
61,272,213 | 424,451,526 | 31,531,491 | 562,403,717 | 169,170,542 | |||||||||||||||
| LIABILITIES |
||||||||||||||||||||
| Payable for investments purchased - regular delivery |
120,867 | 120,212 | 133,375 | 2,629,718 | 253,173 | |||||||||||||||
| Payable for Fund shares redeemed |
— | 207,025 | 71 | 194,228 | 23,639 | |||||||||||||||
| Investment advisory fee payable |
40,717 | 272,268 | 16,368 | 1,117,790 | 104,952 | |||||||||||||||
| Distribution fee (Service Class) payable |
1,372 | 29,074 | 1,194 | 1,503 | 4,469 | |||||||||||||||
| Accrued expenses and other liabilities |
34,819 | 58,553 | 32,320 | 381 | 41,481 | |||||||||||||||
| Total Liabilities |
197,775 | 687,132 | 183,328 | 3,943,620 | 427,714 | |||||||||||||||
| NET ASSETS |
$ | 61,074,438 | $ | 423,764,394 | $ | 31,348,163 | $ | 558,460,097 | $ | 168,742,828 | ||||||||||
| COMPOSITION OF NET ASSETS |
||||||||||||||||||||
| Paid-in Capital |
$ | 46,080,706 | $ | 323,037,345 | $ | 23,631,629 | $ | 343,818,730 | $ | 140,798,805 | ||||||||||
| Accumulated undistributed net investment income |
310,060 | 1,811,049 | — | 3,182,309 | 105,271 | |||||||||||||||
| Accumulated net realized gain (loss) on investments and foreign currency related transactions |
9,724,316 | 16,663,692 | 1,314,784 | 80,063,241 | (3,689,686 | ) | ||||||||||||||
| Net unrealized appreciation (depreciation) on investments and assets and liabilities in foreign currencies |
4,959,356 | 82,252,308 | 6,401,750 | 131,395,817 | 31,528,438 | |||||||||||||||
| $ | 61,074,438 | $ | 423,764,394 | $ | 31,348,163 | $ | 558,460,097 | $ | 168,742,828 | |||||||||||
| Initial Class |
||||||||||||||||||||
| Net Assets |
$ | 48,781,805 | $ | 157,651,983 | $ | 20,586,765 | $ | 544,716,458 | $ | 128,115,411 | ||||||||||
| Shares of beneficial interest |
4,364,205 | 13,055,113 | 1,862,063 | 64,561,760 | 8,585,138 | |||||||||||||||
| Net asset value per share |
$ | 11.18 | $ | 12.08 | $ | 11.06 | $ | 8.44 | $ | 14.92 | ||||||||||
| Service Class |
||||||||||||||||||||
| Net Assets |
$ | 12,292,633 | $ | 266,112,411 | $ | 10,761,398 | $ | 13,743,639 | $ | 40,627,417 | ||||||||||
| Shares of beneficial interest |
1,103,042 | 22,092,489 | 979,627 | 1,635,070 | 2,740,758 | |||||||||||||||
| Net asset value per share |
$ | 11.14 | $ | 12.05 | $ | 10.99 | $ | 8.41 | $ | 14.82 | ||||||||||
| Investments, at cost |
$ | 56,239,662 | $ | 341,761,254 | $ | 24,956,939 | $ | 427,626,881 | $ | 137,376,886 | ||||||||||
See Notes to Financial Statements.
261
Table of Contents
| STATEMENTS OF ASSETS AND LIABILITIES (Continued) | ||
| December 31, 2010 | Sun Capital Advisers Trust |
| SC WMC Large Cap Growth Fund |
Sun Capital Global Real Estate Fund |
SC Ibbotson Tactical Opportunities Fund |
Sun Capital Investment Grade Bond Fund |
Sun Capital Money Market Fund |
||||||||||||||||
| ASSETS |
||||||||||||||||||||
| Investments, at value |
||||||||||||||||||||
| Securities |
$ | 191,330,621 | $ | 253,676,937 | $ | 454,046,886 | $ | 456,027,299 | $ | 186,917,274 | ||||||||||
| Repurchase Agreements |
80,092 | — | — | — | — | |||||||||||||||
| Total Investments |
191,410,713 | 253,676,937 | 454,046,886 | 456,027,299 | 186,917,274 | |||||||||||||||
| Cash |
— | 8,995 | — | 56,837 | — | |||||||||||||||
| Foreign currency, at value |
— | 69,215 | — | — | — | |||||||||||||||
| Interest and dividends receivable |
105,788 | 988,446 | 253,933 | 2,686,068 | 5,723 | |||||||||||||||
| Receivable for Fund shares sold |
— | 58,991 | 1,317,943 | 456,946 | 546,360 | |||||||||||||||
| Receivable for investments sold |
286,174 | — | — | — | — | |||||||||||||||
| Receivable due from Adviser |
— | — | — | — | 32,121 | |||||||||||||||
| Other assets |
4,202 | 5,384 | 9,196 | 8,171 | 4,004 | |||||||||||||||
| Total Assets |
191,806,877 | 254,807,968 | 455,627,958 | 459,235,321 | 187,505,482 | |||||||||||||||
| LIABILITIES |
||||||||||||||||||||
| Payable for investments purchased - regular delivery |
287,754 | — | — | — | — | |||||||||||||||
| Payable for investments purchased - delayed delivery |
— | — | — | 85,816,862 | — | |||||||||||||||
| Payable for Fund shares redeemed |
250,552 | 56,712 | — | 34,044 | 969,449 | |||||||||||||||
| Investment advisory fee payable |
102,488 | 201,555 | 93,108 | 190,014 | — | |||||||||||||||
| Distribution fee (Service Class) payable |
2,080 | 15,308 | — | 13,561 | 13,047 | |||||||||||||||
| Accrued expenses and other liabilities |
43,850 | 53,487 | 111,979 | 66,482 | 36,961 | |||||||||||||||
| Total Liabilities |
686,724 | 327,062 | 205,087 | 86,120,963 | 1,019,457 | |||||||||||||||
| NET ASSETS |
$ | 191,120,153 | $ | 254,480,906 | $ | 455,422,871 | $ | 373,114,358 | $ | 186,486,025 | ||||||||||
| COMPOSITION OF NET ASSETS |
||||||||||||||||||||
| Paid-in Capital |
$ | 156,131,735 | $ | 288,689,051 | $ | 434,342,766 | $ | 360,746,804 | $ | 186,484,427 | ||||||||||
| Accumulated undistributed net investment income (loss) |
591,957 | (870,323 | ) | 3,891,690 | 9,304 | 422 | ||||||||||||||
| Accumulated net realized gain (loss) on investments, capital gains distributions from underlying funds and foreign currency related transactions |
(1,930,453 | ) | (84,458,827 | ) | 503,159 | 7,165,641 | 1,176 | |||||||||||||
| Net unrealized appreciation (depreciation) on investments and assets and liabilities in foreign currencies |
36,326,914 | 51,121,005 | 16,685,256 | 5,192,609 | — | |||||||||||||||
| $ | 191,120,153 | $ | 254,480,906 | $ | 455,422,871 | $ | 373,114,358 | $ | 186,486,025 | |||||||||||
| Initial Class |
||||||||||||||||||||
| Net Assets |
$ | 172,337,679 | $ | 111,981,279 | $ | 455,422,871 | $ | 245,189,777 | $ | 67,784,791 | ||||||||||
| Shares of beneficial interest |
17,740,170 | 9,791,855 | 43,298,257 | 26,101,133 | 67,761,305 | |||||||||||||||
| Net asset value per share |
$ | 9.71 | $ | 11.44 | $ | 10.52 | $ | 9.39 | $ | 1.00 | ||||||||||
| Service Class |
||||||||||||||||||||
| Net Assets |
$ | 18,782,474 | $ | 142,499,627 | $ | — | $ | 127,924,581 | $ | 118,701,234 | ||||||||||
| Shares of beneficial interest |
1,946,629 | 11,301,850 | — | 13,520,975 | 118,724,302 | |||||||||||||||
| Net asset value per share |
$ | 9.65 | $ | 12.61 | $ | — | $ | 9.46 | $ | 1.00 | ||||||||||
| Investments, at cost |
$ | 155,083,947 | $ | 202,559,479 | $ | 437,361,630 | $ | 450,834,690 | $ | 186,917,274 | ||||||||||
| Foreign currency, at cost |
$ | — | $ | 68,581 | $ | — | $ | — | $ | — | ||||||||||
See Notes to Financial Statements.
262
Table of Contents
| STATEMENTS OF ASSETS AND LIABILITIES (Continued) | ||
| December 31, 2010 | Sun Capital Advisers Trust |
| SC BlackRock Inflation Protected Bond Fund |
SC Goldman Sachs Short Duration Fund |
SC PIMCO High Yield Fund |
SC PIMCO Total Return Fund |
|||||||||||||
| ASSETS |
||||||||||||||||
| Investments, at value |
||||||||||||||||
| Securities |
$ | 379,556,984 | $ | 1,300,575,199 | $ | 170,513,322 | $ | 942,342,923 | ||||||||
| Total Investments |
379,556,984 | 1,300,575,199 | 170,513,322 | 942,342,923 | ||||||||||||
| Cash |
— | 201,211 | 284,534 | 88,411 | ||||||||||||
| Foreign currency, at value |
261 | — | 127,303 | 392,226 | ||||||||||||
| Margin deposits with broker |
— | — | — | 9,000 | ||||||||||||
| Interest and dividends receivable |
2,091,902 | 6,019,145 | 2,915,776 | 3,989,351 | ||||||||||||
| Receivable for Fund shares sold |
679,632 | 833,275 | 253,317 | 993,420 | ||||||||||||
| Receivable for investments sold |
— | 127,525,243 | — | 3,654,953 | ||||||||||||
| Variation margin receivable |
— | — | 1,325 | 252,353 | ||||||||||||
| Unrealized appreciation on forward foreign currency exchange contracts |
— | — | 231,914 | 1,494,454 | ||||||||||||
| Unrealized appreciation on swaps |
117,132 | — | 278,084 | 1,384,736 | ||||||||||||
| Swap premiums paid |
— | — | — | 3,497,538 | ||||||||||||
| Other assets |
21,821 | 6,489 | 3,227 | 122,531 | ||||||||||||
| Total Assets |
382,467,732 | 1,435,160,562 | 174,608,802 | 958,221,896 | ||||||||||||
| LIABILITIES |
||||||||||||||||
| Forward sales contract, at value (proceeds receivable $0; $0; $0 and $1,019,258, respectively) |
— | — | — | 1,023,594 | ||||||||||||
| Payable for investments purchased - regular delivery |
— | — | 1,031,927 | — | ||||||||||||
| Payable for investments purchased - delayed delivery |
— | 278,966,742 | 495,000 | 192,903,775 | ||||||||||||
| Cash collateral received from broker |
— | — | — | 2,705,000 | ||||||||||||
| Payable for Fund shares redeemed |
— | 221,313 | 48,772 | — | ||||||||||||
| Investment advisory fee payable |
496,160 | 1,636,072 | 235,307 | 998,748 | ||||||||||||
| Distribution fee (Service Class) payable |
17,209 | 16,134 | 3,468 | 51,260 | ||||||||||||
| Variation margin payable |
296,798 | 103,893 | — | — | ||||||||||||
| Options written (Premium $1,282,390; $0; $0 and $1,879,431, respectively) |
1,271,483 | — | — | 2,816,203 | ||||||||||||
| Unrealized depreciation on forward foreign currency exchange contracts |
638,947 | — | 34,765 | 423,073 | ||||||||||||
| Accrued expenses and other liabilities |
94,615 | 789 | 119 | 4,603 | ||||||||||||
| Swap premiums received |
— | — | 207,300 | 645,430 | ||||||||||||
| Unrealized depreciation on swaps |
702,330 | — | — | 242,722 | ||||||||||||
| Total Liabilities |
3,517,542 | 280,944,943 | 2,056,658 | 201,814,408 | ||||||||||||
| NET ASSETS |
$ | 378,950,190 | $ | 1,154,215,619 | $ | 172,552,144 | $ | 756,407,488 | ||||||||
| COMPOSITION OF NET ASSETS |
||||||||||||||||
| Paid-in Capital |
$ | 368,710,266 | $ | 1,137,017,126 | $ | 152,755,192 | $ | 725,637,308 | ||||||||
| Accumulated undistributed net investment income (loss) |
638,947 | — | 366,223 | (586,403 | ) | |||||||||||
| Accumulated net realized gain (loss) on investments and foreign currency related transactions |
12,805,081 | 6,478,393 | 4,120,351 | 23,112,585 | ||||||||||||
| Net unrealized appreciation (depreciation) on investments and assets and liabilities in foreign currencies |
(3,204,104 | ) | 10,720,100 | 15,310,378 | 8,243,998 | |||||||||||
| $ | 378,950,190 | $ | 1,154,215,619 | $ | 172,552,144 | $ | 756,407,488 | |||||||||
| Initial Class |
||||||||||||||||
| Net Assets |
$ | 217,591,260 | $ | 1,004,463,643 | $ | 140,327,300 | $ | 273,150,069 | ||||||||
| Shares of beneficial interest |
20,456,095 | 97,411,988 | 14,276,322 | 23,592,087 | ||||||||||||
| Net asset value per share |
$ | 10.64 | $ | 10.31 | $ | 9.83 | $ | 11.58 | ||||||||
| Service Class |
||||||||||||||||
| Net Assets |
$ | 161,358,930 | $ | 149,751,976 | $ | 32,224,844 | $ | 483,257,419 | ||||||||
| Shares of beneficial interest |
15,201,700 | 14,530,688 | 3,278,154 | 41,744,512 | ||||||||||||
| Net asset value per share |
$ | 10.61 | $ | 10.31 | $ | 9.83 | $ | 11.58 | ||||||||
| Investments, at cost |
$ | 381,117,445 | $ | 1,289,912,473 | $ | 155,926,203 | $ | 934,697,712 | ||||||||
| Foreign currency, at cost |
$ | 256 | $ | — | $ | 126,138 | $ | 386,129 | ||||||||
See Notes to Financial Statements.
263
Table of Contents
| STATEMENTS OF ASSETS AND LIABILITIES (Continued) | ||
| December 31, 2010 | Sun Capital Advisers Trust |
| SC Ibbotson Balanced Fund |
SC Ibbotson Conservative Fund |
SC Ibbotson Growth Fund |
||||||||||
| ASSETS |
||||||||||||
| Investments, at value |
||||||||||||
| Affiliated securities |
$ | 1,443,061,806 | $ | 761,154,596 | $ | 590,608,920 | ||||||
| Repurchase Agreements |
1,751,432 | 1,017,177 | 78,079 | |||||||||
| Total Investments |
1,444,813,238 | 762,171,773 | 590,686,999 | |||||||||
| Interest and dividends receivable |
1,203,326 | 901,253 | 265,894 | |||||||||
| Receivable for Fund shares sold |
3,201,317 | 799,171 | 86,562 | |||||||||
| Other assets |
30,518 | 16,277 | 12,796 | |||||||||
| Total Assets |
1,449,248,399 | 763,888,474 | 591,052,251 | |||||||||
| LIABILITIES |
||||||||||||
| Payable for investments purchased - regular delivery |
2,954,758 | 1,918,430 | 343,973 | |||||||||
| Investment advisory fee payable |
115,429 | 82,210 | 50,462 | |||||||||
| Distribution fee (Service Class) payable |
155,374 | 81,851 | 64,145 | |||||||||
| Accrued expenses and other liabilities |
95,499 | 63,726 | 54,464 | |||||||||
| Total Liabilities |
3,321,060 | 2,146,217 | 513,044 | |||||||||
| NET ASSETS |
$ | 1,445,927,339 | $ | 761,742,257 | $ | 590,539,207 | ||||||
| COMPOSITION OF NET ASSETS |
||||||||||||
| Paid-in Capital |
$ | 1,260,863,534 | $ | 674,363,027 | $ | 469,199,682 | ||||||
| Accumulated undistributed net investment income |
20,455,821 | 10,819,968 | 9,256,393 | |||||||||
| Accumulated net realized gain (loss) on investments and capital gain distributions from affiliated underlying funds |
57,705,151 | 19,404,600 | 48,985,701 | |||||||||
| Net unrealized appreciation (depreciation) on investments and assets and liabilities in foreign currencies |
106,902,833 | 57,154,662 | 63,097,431 | |||||||||
| $ | 1,445,927,339 | $ | 761,742,257 | $ | 590,539,207 | |||||||
| Initial Class |
||||||||||||
| Net Assets |
$ | 1,686,659 | $ | 5,052,643 | $ | 1,616,478 | ||||||
| Shares of beneficial interest |
136,395 | 428,576 | 129,592 | |||||||||
| Net asset value per share |
$ | 12.37 | $ | 11.79 | $ | 12.47 | ||||||
| Service Class |
||||||||||||
| Net Assets |
$ | 1,444,240,680 | $ | 756,689,614 | $ | 588,922,729 | ||||||
| Shares of beneficial interest |
116,921,927 | 64,200,943 | 47,227,759 | |||||||||
| Net asset value per share |
$ | 12.35 | $ | 11.79 | $ | 12.47 | ||||||
| Investments, at cost |
$ | 1,337,910,405 | $ | 705,017,111 | $ | 527,589,568 | ||||||
See Notes to Financial Statements.
264
Table of Contents
| STATEMENTS OF OPERATIONS | ||
| For the Year Ended December 31, 2010 | Sun Capital Advisers Trust |
| SC AllianceBernstein International Value Fund |
SC BlackRock International Index Fund* |
SC BlackRock Large Cap Index Fund |
SC BlackRock Small Cap Index Fund |
SC Goldman Sachs Mid Cap Value Fund |
||||||||||||||||
| INVESTMENT INCOME |
||||||||||||||||||||
| Interest |
$ | 2,780 | $ | 751 | $ | 388 | $ | 20,414 | $ | 14,427 | ||||||||||
| Dividends (net of foreign withholding taxes of $187,406; $5,747; $0; $8,873 and $0, respectively) |
1,975,762 | 50,748 | 2,338,816 | 2,723,036 | 5,955,368 | |||||||||||||||
| Total investment income |
1,978,542 | 51,499 | 2,339,204 | 2,743,450 | 5,969,795 | |||||||||||||||
| EXPENSES |
||||||||||||||||||||
| Investment advisory fee |
452,664 | 26,390 | 737,104 | 1,330,326 | — | |||||||||||||||
| Unified management fee |
— | — | — | — | 2,541,104 | |||||||||||||||
| Distribution fee (Service Class) |
5,661 | 78 | 34,082 | 330,287 | 56,798 | |||||||||||||||
| Custody |
149,508 | 69,177 | 46,435 | 199,878 | — | |||||||||||||||
| Accounting |
49,950 | 4,023 | 48,950 | 48,950 | — | |||||||||||||||
| Audit |
42,564 | 38,661 | 32,375 | 32,324 | — | |||||||||||||||
| Legal |
8,197 | 673 | 14,412 | 18,521 | 5,183 | |||||||||||||||
| Printing |
1,006 | 151 | 2,712 | 7,298 | — | |||||||||||||||
| Administration |
46,191 | 3,978 | 65,169 | 96,689 | — | |||||||||||||||
| Transfer agent |
7,186 | 801 | 9,892 | 9,242 | — | |||||||||||||||
| Trustees fees |
2,711 | 452 | 4,092 | 7,407 | 9,460 | |||||||||||||||
| Insurance |
1,581 | 57 | 2,187 | 4,980 | 1,829 | |||||||||||||||
| Registration fees |
814 | 5,925 | 338 | — | — | |||||||||||||||
| Miscellaneous fees |
1,699 | 310 | 2,781 | 5,541 | — | |||||||||||||||
| Total expenses |
769,732 | 150,676 | 1,000,529 | 2,091,443 | 2,614,374 | |||||||||||||||
| Less: Reduction of investment advisory fees or unified management fees |
(225,183 | ) | (26,390 | ) | (12,062 | ) | (67,163 | ) | — | |||||||||||
| Reimbursement of operating expenses |
— | (84,623 | ) | — | — | — | ||||||||||||||
| Net expenses |
544,549 | 39,663 | 988,467 | 2,024,280 | 2,614,374 | |||||||||||||||
| Net investment income |
1,433,993 | 11,836 | 1,350,737 | 719,170 | 3,355,421 | |||||||||||||||
| REALIZED AND UNREALIZED GAIN (LOSS) |
||||||||||||||||||||
| Net realized gain (loss) from: |
||||||||||||||||||||
| Investments |
4,553,162 | (25,426 | ) | 17,272,801 | 46,540,808 | 21,580,575 | ||||||||||||||
| Futures |
54,039 | 16,418 | 133,245 | 222,369 | 1,502,752 | |||||||||||||||
| Foreign currency related transactions |
154,410 | (58,027 | ) | — | 157 | — | ||||||||||||||
| Net realized gain (loss) |
4,761,611 | (67,035 | ) | 17,406,046 | 46,763,334 | 23,083,327 | ||||||||||||||
| Change in unrealized appreciation (depreciation) on: |
||||||||||||||||||||
| Investments |
(572,335 | ) | 1,978,392 | (277,524 | ) | (7,639,312 | ) | 23,662,060 | ||||||||||||
| Futures |
(48,444 | ) | 15,876 | 54,766 | 49,218 | (92,106 | ) | |||||||||||||
| Assets and liabilities in foreign currencies |
6,769 | 7,077 | — | (6 | ) | — | ||||||||||||||
| Change in unrealized appreciation (depreciation) |
(614,010 | ) | 2,001,345 | (222,758 | ) | (7,590,100 | ) | 23,569,954 | ||||||||||||
| Net realized and unrealized gain (loss) |
4,147,601 | 1,934,310 | 17,183,288 | 39,173,234 | 46,653,281 | |||||||||||||||
| Net increase (decrease) in net assets from operations |
$ | 5,581,594 | $ | 1,946,146 | $ | 18,534,025 | $ | 39,892,404 | $ | 50,008,702 | ||||||||||
| * | For the period November 15, 2010 (commencement of operations) to December 31, 2010. |
See Notes to Financial Statements.
265
Table of Contents
| STATEMENTS OF OPERATIONS (Continued) | ||
| For the Year Ended December 31, 2010 | Sun Capital Advisers Trust |
| SC Columbia Small Cap Value Fund |
SC Davis Venture Value Fund |
SC Invesco Small Cap Growth Fund |
SC Lord Abbett Growth & Income Fund |
SC WMC Blue Chip Mid Cap Fund |
||||||||||||||||
| INVESTMENT INCOME |
||||||||||||||||||||
| Interest |
$ | 208 | $ | 201,028 | $ | — | $ | 31,214 | $ | 3,355 | ||||||||||
| Dividends (net of foreign withholding taxes of $68; $99,773; $1,681; $30,726 and $0, respectively) |
878,543 | 6,674,684 | 150,078 | 7,708,731 | 1,506,722 | |||||||||||||||
| Total investment income |
878,751 | 6,875,712 | 150,078 | 7,739,945 | 1,510,077 | |||||||||||||||
| EXPENSES |
||||||||||||||||||||
| Investment advisory fee |
430,198 | 3,215,546 | 229,336 | — | 1,052,768 | |||||||||||||||
| Unified management fee |
— | — | — | 4,527,889 | — | |||||||||||||||
| Distribution fee (Service Class) |
22,782 | 610,570 | 20,641 | 29,883 | 99,279 | |||||||||||||||
| Custody |
78,631 | 112,007 | 45,995 | — | 55,340 | |||||||||||||||
| Accounting |
48,950 | 48,950 | 48,950 | — | 48,950 | |||||||||||||||
| Audit |
32,302 | 32,499 | 32,301 | — | 32,499 | |||||||||||||||
| Legal |
38,756 | 40,800 | 2,978 | 11,039 | 12,170 | |||||||||||||||
| Printing |
698 | 6,756 | 348 | — | 1,956 | |||||||||||||||
| Administration |
34,497 | 213,838 | 23,808 | — | 74,078 | |||||||||||||||
| Transfer agent |
6,706 | 11,114 | 6,973 | — | 10,954 | |||||||||||||||
| Trustees fees |
1,894 | 16,971 | 942 | 20,710 | 5,122 | |||||||||||||||
| Insurance |
1,632 | 10,218 | 835 | 4,644 | 3,261 | |||||||||||||||
| Registration fees |
682 | 421 | 580 | — | 2,317 | |||||||||||||||
| Miscellaneous fees |
1,548 | 8,213 | 1,108 | — | 2,801 | |||||||||||||||
| Total expenses |
699,276 | 4,327,903 | 414,795 | 4,594,165 | 1,401,495 | |||||||||||||||
| Less: Reduction of investment advisory fees or unified management fees |
(126,797 | ) | — | (116,536 | ) | (36,406 | ) | — | ||||||||||||
| Net expenses |
572,479 | 4,327,903 | 298,259 | 4,557,759 | 1,401,495 | |||||||||||||||
| Net investment income (loss) |
306,272 | 2,547,809 | (148,181 | ) | 3,182,186 | 108,582 | ||||||||||||||
| REALIZED AND UNREALIZED GAIN (LOSS) |
||||||||||||||||||||
| Net realized gain (loss) from: |
||||||||||||||||||||
| Investments |
10,133,367 | 31,586,384 | 1,661,528 | 81,512,832 | 15,478,126 | |||||||||||||||
| Foreign currency related transactions |
(6 | ) | (13,757 | ) | — | 372 | 21 | |||||||||||||
| Net realized gain (loss) |
10,133,361 | 31,572,627 | 1,661,528 | 81,513,204 | 15,478,147 | |||||||||||||||
| Change in unrealized appreciation (depreciation) on: |
||||||||||||||||||||
| Investments |
(518,490 | ) | 18,969,904 | 4,731,050 | 6,557,057 | 14,767,039 | ||||||||||||||
| Assets and liabilities in foreign currencies |
— | 3,793 | — | — | 8 | |||||||||||||||
| Change in unrealized appreciation (depreciation) |
(518,490 | ) | 18,973,697 | 4,731,050 | 6,557,057 | 14,767,047 | ||||||||||||||
| Net realized and unrealized gain (loss) |
9,614,871 | 50,546,324 | 6,392,578 | 88,070,261 | 30,245,194 | |||||||||||||||
| Net increase (decrease) in net assets from operations |
$ | 9,921,143 | $ | 53,094,133 | $ | 6,244,397 | $ | 91,252,447 | $ | 30,353,776 | ||||||||||
See Notes to Financial Statements.
266
Table of Contents
| STATEMENTS OF OPERATIONS (Continued) | ||
| For the Year Ended December 31, 2010 | Sun Capital Advisers Trust |
| SC WMC Large Cap Growth Fund |
Sun Capital Global Real Estate Fund |
SC Ibbotson Tactical Opportunities Fund* |
Sun Capital Investment Grade Bond Fund |
Sun Capital Money Market Fund |
||||||||||||||||
| INVESTMENT INCOME |
||||||||||||||||||||
| Interest |
$ | — | $ | 10,163 | $ | 1,256 | $ | 12,734,550 | $ | 430,425 | ||||||||||
| Dividends (net of foreign withholding taxes of $4,803; $209,367; $0; $0 and $0, respectively) |
2,210,590 | 9,720,491 | 4,111,278 | — | — | |||||||||||||||
| Total investment income |
2,210,590 | 9,730,654 | 4,112,534 | 12,734,550 | 430,425 | |||||||||||||||
| EXPENSES |
||||||||||||||||||||
| Investment advisory fee |
1,443,257 | 2,224,455 | 188,505 | 1,818,799 | 985,267 | |||||||||||||||
| Distribution fee (Service Class) |
44,595 | 336,586 | — | 231,080 | 293,130 | |||||||||||||||
| Custody |
88,360 | 120,957 | 10,508 | 83,123 | 49,862 | |||||||||||||||
| Accounting |
48,950 | 48,950 | 2,372 | 48,950 | 48,950 | |||||||||||||||
| Audit |
32,514 | 35,274 | 28,824 | 32,608 | 28,317 | |||||||||||||||
| Legal |
21,995 | 20,718 | 5,187 | 31,357 | 39,695 | |||||||||||||||
| Printing |
2,780 | 3,494 | 1,163 | 4,519 | 2,699 | |||||||||||||||
| Administration |
102,862 | 121,942 | 20,652 | 152,844 | 111,292 | |||||||||||||||
| Transfer agent |
12,227 | 12,075 | 724 | 11,969 | 9,257 | |||||||||||||||
| Trustees fees |
7,548 | 9,384 | 3,413 | 11,592 | 8,161 | |||||||||||||||
| Insurance |
4,418 | 6,425 | 448 | 5,607 | 6,449 | |||||||||||||||
| Registration fees |
— | 2,594 | 44,737 | 13,142 | — | |||||||||||||||
| Miscellaneous fees |
3,970 | 4,631 | 1,272 | 6,062 | 3,243 | |||||||||||||||
| Total expenses |
1,813,476 | 2,947,485 | 307,805 | 2,451,652 | 1,586,322 | |||||||||||||||
| Less: Reduction of investment advisory fees or unified management fees |
(210,162 | ) | (35,216 | ) | (52,556 | ) | — | (985,267 | ) | |||||||||||
| Reimbursement of operating expenses |
— | — | — | — | (323,877 | ) | ||||||||||||||
| Net expenses |
1,603,314 | 2,912,269 | 255,249 | 2,451,652 | 277,178 | |||||||||||||||
| Net investment income |
607,276 | 6,818,385 | 3,857,285 | 10,282,898 | 153,247 | |||||||||||||||
| REALIZED AND UNREALIZED GAIN (LOSS) |
||||||||||||||||||||
| Net realized gain (loss) from: |
||||||||||||||||||||
| Investments |
22,548,882 | 21,442,525 | 436,340 | 7,159,689 | 529 | |||||||||||||||
| Capital gain distributions from underlying funds |
— | — | 101,224 | — | — | |||||||||||||||
| Foreign currency related transactions |
— | (5,355 | ) | — | — | — | ||||||||||||||
| Net realized gain (loss) |
22,548,882 | 21,437,170 | 537,564 | 7,159,689 | 529 | |||||||||||||||
| Change in unrealized appreciation (depreciation) on: |
||||||||||||||||||||
| Investments |
13,271,046 | 6,094,763 | 16,685,256 | 3,226,405 | — | |||||||||||||||
| Assets and liabilities in foreign currencies |
148 | 3,453 | — | — | — | |||||||||||||||
| Change in unrealized appreciation (depreciation) |
13,271,194 | 6,098,216 | 16,685,256 | 3,226,405 | — | |||||||||||||||
| Net realized and unrealized gain (loss) |
35,820,076 | 27,535,386 | 17,222,820 | 10,386,094 | 529 | |||||||||||||||
| Net increase (decrease) in net assets from operations |
$ | 36,427,352 | $ | 34,353,771 | $ | 21,080,105 | $ | 20,668,992 | $ | 153,776 | ||||||||||
| * | For the period November 15, 2010 (commencement of operations) to December 31, 2010. |
See Notes to Financial Statements.
267
Table of Contents
| STATEMENTS OF OPERATIONS (Continued) | ||
| For the Year Ended December 31, 2010 | Sun Capital Advisers Trust |
| SC BlackRock Inflation Protected Bond Fund |
SC Goldman Sachs Short Duration Fund |
SC PIMCO High Yield Fund |
SC PIMCO Total Return Fund |
|||||||||||||
| INVESTMENT INCOME |
||||||||||||||||
| Interest |
$ | 5,652,487 | $ | 20,589,901 | $ | 11,588,575 | $ | 14,802,894 | ||||||||
| Dividends |
— | — | 46,875 | 337,380 | ||||||||||||
| Total investment income |
5,652,487 | 20,589,901 | 11,635,450 | 15,140,274 | ||||||||||||
| EXPENSES |
||||||||||||||||
| Unified management fee |
1,845,566 | 6,703,160 | 1,053,564 | 3,821,943 | ||||||||||||
| Distribution fee (Service Class) |
298,419 | 316,031 | 68,661 | 894,756 | ||||||||||||
| Legal |
6,384 | 22,592 | 3,117 | 13,217 | ||||||||||||
| Trustees fees |
10,850 | 42,622 | 5,614 | 22,327 | ||||||||||||
| Insurance |
1,784 | 8,952 | 1,181 | 3,625 | ||||||||||||
| Total expenses |
2,163,003 | 7,093,357 | 1,132,137 | 4,755,868 | ||||||||||||
| Less: Reduction of investment advisory fees or unified management fees |
(19,019 | ) | — | — | (39,169 | ) | ||||||||||
| Net expenses |
2,143,984 | 7,093,357 | 1,132,137 | 4,716,699 | ||||||||||||
| Net investment income |
3,508,503 | 13,496,544 | 10,503,313 | 10,423,575 | ||||||||||||
| REALIZED AND UNREALIZED GAIN (LOSS) |
||||||||||||||||
| Net realized gain (loss) from: |
||||||||||||||||
| Investments |
10,600,918 | 6,051,627 | 3,110,752 | 8,780,149 | ||||||||||||
| Futures and options on futures |
355,675 | 3,134,455 | 554,788 | 12,340,195 | ||||||||||||
| Written options |
495,905 | — | 236,692 | 2,364,890 | ||||||||||||
| Swaps |
3,122,485 | — | 838,976 | 5,264 | ||||||||||||
| Foreign currency related transactions |
(678,936 | ) | — | (78,200 | ) | 833,959 | ||||||||||
| Net realized gain (loss) |
13,896,047 | 9,186,082 | 4,663,008 | 24,324,457 | ||||||||||||
| Change in unrealized appreciation (depreciation) on: |
||||||||||||||||
| Investments |
(2,777,379 | ) | 1,883,491 | 2,426,749 | 1,278,165 | |||||||||||
| Futures and options on futures |
(688,429 | ) | (885,020 | ) | (146,001 | ) | (350,133 | ) | ||||||||
| Written options |
(35,863 | ) | — | (76,399 | ) | (907,282 | ) | |||||||||
| Swaps |
(602,820 | ) | — | (711,348 | ) | 1,169,209 | ||||||||||
| Assets and liabilities in foreign currencies |
(613,392 | ) | — | 54,808 | 836,771 | |||||||||||
| Change in unrealized appreciation (depreciation) |
(4,717,883 | ) | 998,471 | 1,547,809 | 2,026,730 | |||||||||||
| Net realized and unrealized gain (loss) |
9,178,164 | 10,184,553 | 6,210,817 | 26,351,187 | ||||||||||||
| Net increase (decrease) in net assets from operations |
$ | 12,686,667 | $ | 23,681,097 | $ | 16,714,130 | $ | 36,774,762 | ||||||||
See Notes to Financial Statements.
268
Table of Contents
| STATEMENTS OF OPERATIONS (Continued) | ||
| For the Year Ended December 31, 2010 | Sun Capital Advisers Trust |
| SC Ibbotson Balanced Fund |
SC Ibbotson Conservative Fund |
SC Ibbotson Growth Fund |
||||||||||
| INVESTMENT INCOME |
||||||||||||
| Dividends from affiliated underlying funds |
$ | 17,258,394 | $ | 9,267,418 | $ | 7,825,259 | ||||||
| Total investment income |
17,258,394 | 9,267,418 | 7,825,259 | |||||||||
| EXPENSES |
||||||||||||
| Investment advisory fee |
1,233,672 | 710,478 | 660,170 | |||||||||
| Distribution fee (Service Class) |
2,464,711 | 1,414,703 | 1,317,927 | |||||||||
| Custody |
125,529 | 87,097 | 81,064 | |||||||||
| Accounting |
32,150 | 32,150 | 32,150 | |||||||||
| Audit |
26,675 | 26,675 | 26,674 | |||||||||
| Legal |
80,227 | 49,443 | 43,649 | |||||||||
| Printing |
14,975 | 8,178 | 7,756 | |||||||||
| Administration |
463,902 | 275,181 | 259,025 | |||||||||
| Transfer agent |
6,485 | 6,149 | 7,348 | |||||||||
| Trustees fees |
36,745 | 21,507 | 20,923 | |||||||||
| Insurance |
16,019 | 10,256 | 11,873 | |||||||||
| Miscellaneous fees |
18,773 | 10,874 | 11,350 | |||||||||
| Total expenses |
4,519,863 | 2,652,691 | 2,479,909 | |||||||||
| Less: Reduction of investment advisory fees or unified management fees |
(81,277 | ) | (101,185 | ) | (105,710 | ) | ||||||
| Net expenses |
4,438,586 | 2,551,506 | 2,374,199 | |||||||||
| Net investment income |
12,819,808 | 6,715,912 | 5,451,060 | |||||||||
| REALIZED AND UNREALIZED GAIN (LOSS) |
||||||||||||
| Net realized gain (loss) from: |
||||||||||||
| Affiliated investments |
57,112,689 | 19,107,171 | 48,757,868 | |||||||||
| Capital gain distributions from affiliated underlying funds |
8,243,418 | 4,413,270 | 4,058,049 | |||||||||
| Net realized gain (loss) |
65,356,107 | 23,520,441 | 52,815,917 | |||||||||
| Change in unrealized appreciation (depreciation) on: |
||||||||||||
| Affiliated investments |
51,959,160 | 27,625,126 | 11,687,524 | |||||||||
| Change in unrealized appreciation (depreciation) |
51,959,160 | 27,625,126 | 11,687,524 | |||||||||
| Net realized and unrealized gain (loss) |
117,315,267 | 51,145,567 | 64,503,441 | |||||||||
| Net increase (decrease) in net assets from operations |
$ | 130,135,075 | $ | 57,861,479 | $ | 69,954,501 | ||||||
See Notes to Financial Statements.
269
Table of Contents
| STATEMENTS OF CHANGES IN NET ASSETS | ||
| Sun Capital Advisers Trust |
| SC AllianceBernstein International Value Fund |
SC BlackRock International Index Fund |
SC BlackRock Large Cap Index Fund |
||||||||||||||||||
| Year Ended December 31, | Year Ended December 31, | Year Ended December 31, | ||||||||||||||||||
| 2010 | 2009 | 2010* | 2010 | 2009 | ||||||||||||||||
| INCREASE (DECREASE) IN NET ASSETS FROM OPERATIONS |
||||||||||||||||||||
| Net investment income (loss) |
$ | 1,433,993 | $ | 835,605 | $ | 11,836 | $ | 1,350,737 | $ | 649,627 | ||||||||||
| Net realized gain (loss) |
4,761,611 | 2,662,754 | (67,035 | ) | 17,406,046 | 3,853,147 | ||||||||||||||
| Change in unrealized appreciation (depreciation) |
(614,010 | ) | 8,466,686 | 2,001,345 | (222,758 | ) | 7,857,708 | |||||||||||||
| Net increase (decrease) in net assets resulting from operations |
5,581,594 | 11,965,045 | 1,946,146 | 18,534,025 | 12,360,482 | |||||||||||||||
| DISTRIBUTIONS TO SHAREHOLDERS FROM |
||||||||||||||||||||
| Net investment income: |
||||||||||||||||||||
| Initial Class |
(5,066 | ) | (1,184,943 | ) | — | — | (619,650 | ) | ||||||||||||
| Service Class |
(170 | ) | (32,563 | ) | — | — | (73,322 | ) | ||||||||||||
| Net realized gain on investments: |
||||||||||||||||||||
| Initial Class |
(1,243,366 | ) | (1,251,599 | ) | — | (216,837 | ) | — | ||||||||||||
| Service Class |
(41,814 | ) | (37,812 | ) | — | (24,908 | ) | — | ||||||||||||
| Net decrease in net assets from distributions |
(1,290,416 | ) | (2,506,917 | ) | — | (241,745 | ) | (692,972 | ) | |||||||||||
| SHARE TRANSACTIONS |
||||||||||||||||||||
| Net proceeds from sales |
34,934,924 | 41,717,363 | 53,063,106 | 53,409,421 | 60,497,249 | |||||||||||||||
| Net proceeds from reinvestment of distributions |
1,290,416 | 2,506,917 | — | 241,745 | 692,972 | |||||||||||||||
| Cost of shares redeemed |
(23,677,066 | ) | (8,084,384 | ) | (119,468 | ) | (47,738,756 | ) | (3,826,640 | ) | ||||||||||
| Net increase (decrease) in net assets from share transactions |
12,548,274 | 36,139,896 | 52,943,638 | 5,912,410 | 57,363,581 | |||||||||||||||
| Total increase (decrease) in net assets |
16,839,452 | 45,598,024 | 54,889,784 | 24,204,690 | 69,031,091 | |||||||||||||||
| NET ASSETS |
||||||||||||||||||||
| Beginning of period |
57,412,383 | 11,814,359 | 20 | ** | 82,371,728 | 13,340,637 | ||||||||||||||
| End of period† |
$ | 74,251,835 | $ | 57,412,383 | $ | 54,889,804 | $ | 106,576,418 | $ | 82,371,728 | ||||||||||
| † Accumulated undistributed net investment income (loss) |
$ | 1,643,157 | $ | (326,462 | ) | $ | (26,586 | ) | $ | 1,345,539 | $ | 936 | ||||||||
| * | For the period November 15, 2010 (commencement of operations) to December 31, 2010. |
| ** | Amount represents initial seed investment. |
See Notes to Financial Statements.
270
Table of Contents
| STATEMENTS OF CHANGES IN NET ASSETS (Continued) | ||
| Sun Capital Advisers Trust |
| SC BlackRock Small Cap Index Fund |
SC Goldman Sachs Mid Cap Value Fund |
SC Columbia Small Cap Value Fund |
||||||||||||||||||||||
| Year Ended December 31, | Year Ended December 31, | Year Ended December 31, | ||||||||||||||||||||||
| 2010 | 2009 | 2010 | 2009 | 2010 | 2009 | |||||||||||||||||||
| INCREASE (DECREASE) IN NET ASSETS FROM OPERATIONS |
||||||||||||||||||||||||
| Net investment income (loss) |
$ | 719,170 | $ | 425,488 | $ | 3,355,421 | $ | 1,908,485 | $ | 306,272 | $ | 176,805 | ||||||||||||
| Net realized gain (loss) |
46,763,334 | (25,104,929 | ) | 23,083,327 | 23,146,315 | 10,133,361 | 5,271,664 | |||||||||||||||||
| Change in unrealized appreciation (depreciation) |
(7,590,100 | ) | 83,844,844 | 23,569,954 | 36,984,630 | (518,490 | ) | 5,615,479 | ||||||||||||||||
| Net increase (decrease) in net assets resulting from operations |
39,892,404 | 59,165,403 | 50,008,702 | 62,039,430 | 9,921,143 | 11,063,948 | ||||||||||||||||||
| DISTRIBUTIONS TO SHAREHOLDERS FROM |
||||||||||||||||||||||||
| Net investment income: |
||||||||||||||||||||||||
| Initial Class |
(155,615 | ) | (24,361 | ) | — | (1,781,536 | ) | — | (160,938 | ) | ||||||||||||||
| Service Class |
(155,938 | ) | (70,061 | ) | — | (127,774 | ) | — | (15,265 | ) | ||||||||||||||
| Net realized gain on investments: |
||||||||||||||||||||||||
| Initial Class |
— | — | (5,643,760 | ) | (15,418,462 | ) | (3,503,453 | ) | (898,849 | ) | ||||||||||||||
| Service Class |
— | — | (540,908 | ) | (1,515,089 | ) | (809,308 | ) | (181,700 | ) | ||||||||||||||
| Net decrease in net assets from distributions |
(311,553 | ) | (94,422 | ) | (6,184,668 | ) | (18,842,861 | ) | (4,312,761 | ) | (1,256,752 | ) | ||||||||||||
| SHARE TRANSACTIONS |
||||||||||||||||||||||||
| Net proceeds from sales |
13,269,153 | 26,384,791 | 74,814,561 | 82,966,501 | 22,139,445 | 43,962,372 | ||||||||||||||||||
| Subscriptions in-kind |
— | — | — | 86,276,287 | — | — | ||||||||||||||||||
| Net proceeds from reinvestment of distributions |
311,553 | 94,422 | 6,184,668 | 18,842,861 | 4,312,761 | 1,256,752 | ||||||||||||||||||
| Cost of shares redeemed |
(56,251,939 | ) | (55,314,564 | ) | (62,184,412 | ) | (33,069,713 | ) | (11,469,850 | ) | (20,282,746 | ) | ||||||||||||
| Net increase (decrease) in net assets from share transactions |
(42,671,233 | ) | (28,835,351 | ) | 18,814,817 | 155,015,936 | 14,982,356 | 24,936,378 | ||||||||||||||||
| Total increase (decrease) in net assets |
(3,090,382 | ) | 30,235,630 | 62,638,851 | 198,212,505 | 20,590,738 | 34,743,574 | |||||||||||||||||
| NET ASSETS |
||||||||||||||||||||||||
| Beginning of period |
183,768,557 | 153,532,927 | 209,160,084 | 10,947,579 | 40,483,700 | 5,740,126 | ||||||||||||||||||
| End of period† |
$ | 180,678,175 | $ | 183,768,557 | $ | 271,798,935 | $ | 209,160,084 | $ | 61,074,438 | $ | 40,483,700 | ||||||||||||
| † Accumulated undistributed net investment income |
$ | 791,322 | $ | 414,338 | $ | 3,346,874 | $ | — | $ | 310,060 | $ | — | ||||||||||||
See Notes to Financial Statements.
271
Table of Contents
| STATEMENTS OF CHANGES IN NET ASSETS (Continued) | ||
| Sun Capital Advisers Trust |
| SC Davis Venture Value Fund |
SC Invesco Small Cap Growth Fund |
SC Lord Abbett Growth & Income Fund |
||||||||||||||||||||||
| Year Ended December 31, | Year Ended December 31, | Year Ended December 31, | ||||||||||||||||||||||
| 2010 | 2009 | 2010 | 2009 | 2010 | 2009 | |||||||||||||||||||
| INCREASE (DECREASE) IN NET ASSETS FROM OPERATIONS |
||||||||||||||||||||||||
| Net investment income (loss) |
$ | 2,547,809 | $ | 1,101,748 | $ | (148,181 | ) | $ | (49,052 | ) | $ | 3,182,186 | $ | 2,760,473 | ||||||||||
| Net realized gain (loss) |
31,572,627 | (11,210,937 | ) | 1,661,528 | 2,524,434 | 81,513,204 | 69,452,194 | |||||||||||||||||
| Change in unrealized appreciation (depreciation) |
18,973,697 | 87,391,607 | 4,731,050 | 2,250,746 | 6,557,057 | 125,484,977 | ||||||||||||||||||
| Net increase (decrease) in net assets resulting from operations |
53,094,133 | 77,282,418 | 6,244,397 | 4,726,128 | 91,252,447 | 197,697,644 | ||||||||||||||||||
| DISTRIBUTIONS TO SHAREHOLDERS FROM |
||||||||||||||||||||||||
| Net investment income: |
||||||||||||||||||||||||
| Initial Class |
(1,027,110 | ) | (375,796 | ) | — | — | — | (2,736,418 | ) | |||||||||||||||
| Service Class |
(583,899 | ) | (290,015 | ) | — | — | — | (27,899 | ) | |||||||||||||||
| Net realized gain on investments: |
||||||||||||||||||||||||
| Initial Class |
— | — | (1,478,663 | ) | (408,415 | ) | (22,281,747 | ) | (46,790,450 | ) | ||||||||||||||
| Service Class |
— | — | (722,220 | ) | (201,982 | ) | (518,969 | ) | (883,699 | ) | ||||||||||||||
| Net decrease in net assets from distributions |
(1,611,009 | ) | (665,811 | ) | (2,200,883 | ) | (610,397 | ) | (22,800,716 | ) | (50,438,466 | ) | ||||||||||||
| SHARE TRANSACTIONS |
||||||||||||||||||||||||
| Net proceeds from sales |
101,561,755 | 213,128,717 | 9,254,259 | 23,398,241 | 87,295,175 | 87,024,697 | ||||||||||||||||||
| Subscriptions in-kind |
— | — | — | — | — | 342,061,308 | ||||||||||||||||||
| Net proceeds from reinvestment of distributions |
1,611,009 | 665,811 | 2,200,883 | 610,397 | 22,800,716 | 50,438,466 | ||||||||||||||||||
| Cost of shares redeemed |
(113,481,100 | ) | (21,730,381 | ) | (3,746,705 | ) | (12,602,418 | ) | (128,148,494 | ) | (123,572,200 | ) | ||||||||||||
| Net increase (decrease) in net assets from share transactions |
(10,308,336 | ) | 192,064,147 | 7,708,437 | 11,406,220 | (18,052,603 | ) | 355,952,271 | ||||||||||||||||
| Total increase (decrease) in net assets |
41,174,788 | 268,680,754 | 11,751,951 | 15,521,951 | 50,399,128 | 503,211,449 | ||||||||||||||||||
| NET ASSETS |
||||||||||||||||||||||||
| Beginning of period |
382,589,606 | 113,908,852 | 19,596,212 | 4,074,261 | 508,060,969 | 4,849,520 | ||||||||||||||||||
| End of period† |
$ | 423,764,394 | $ | 382,589,606 | $ | 31,348,163 | $ | 19,596,212 | $ | 558,460,097 | $ | 508,060,969 | ||||||||||||
| † Accumulated undistributed net investment income |
$ | 1,811,049 | $ | 905,316 | $ | — | $ | — | $ | 3,182,309 | $ | — | ||||||||||||
See Notes to Financial Statements.
272
Table of Contents
| STATEMENTS OF CHANGES IN NET ASSETS (Continued) | ||
| Sun Capital Advisers Trust |
| SC WMC Blue Chip Mid Cap Fund |
SC WMC Large Cap Growth Fund |
Sun Capital Global Real Estate Fund |
||||||||||||||||||||||
| Year Ended December 31, | Year Ended December 31, | Year Ended December 31, | ||||||||||||||||||||||
| 2010 | 2009 | 2010 | 2009 | 2010 | 2009 | |||||||||||||||||||
| INCREASE (DECREASE) IN NET ASSETS FROM OPERATIONS |
||||||||||||||||||||||||
| Net investment income (loss) |
$ | 108,582 | $ | 65,199 | $ | 607,276 | $ | 554,358 | $ | 6,818,385 | $ | 6,369,618 | ||||||||||||
| Net realized gain (loss) |
15,478,147 | (8,248,694 | ) | 22,548,882 | (3,983,702 | ) | 21,437,170 | (91,942,249 | ) | |||||||||||||||
| Change in unrealized appreciation (depreciation) |
14,767,047 | 33,984,929 | 13,271,194 | 37,481,869 | 6,098,216 | 155,578,275 | ||||||||||||||||||
| Net increase (decrease) in net assets resulting from operations |
30,353,776 | 25,801,434 | 36,427,352 | 34,052,525 | 34,353,771 | 70,005,644 | ||||||||||||||||||
| DISTRIBUTIONS TO SHAREHOLDERS FROM |
||||||||||||||||||||||||
| Net investment income: |
||||||||||||||||||||||||
| Initial Class |
(60,133 | ) | (16,377 | ) | (545,213 | ) | (197,983 | ) | (12,598,073 | ) | (2,511,768 | ) | ||||||||||||
| Service Class |
— | (9,615 | ) | (9,148 | ) | (33,289 | ) | (13,918,369 | ) | (3,915,725 | ) | |||||||||||||
| Net realized gain on investments: |
||||||||||||||||||||||||
| Initial Class |
— | — | — | — | — | (514,116 | ) | |||||||||||||||||
| Service Class |
— | — | — | — | — | (870,300 | ) | |||||||||||||||||
| Net decrease in net assets from distributions |
(60,133 | ) | (25,992 | ) | (554,361 | ) | (231,272 | ) | (26,516,442 | ) | (7,811,909 | ) | ||||||||||||
| SHARE TRANSACTIONS |
||||||||||||||||||||||||
| Net proceeds from sales |
65,448,862 | 29,411,187 | 54,836,305 | 93,346,643 | 40,263,351 | 56,809,092 | ||||||||||||||||||
| Net proceeds from reinvestment of distributions |
60,133 | 25,992 | 554,361 | 231,272 | 26,516,442 | 7,811,909 | ||||||||||||||||||
| Cost of shares redeemed |
(43,053,482 | ) | (16,198,087 | ) | (67,647,634 | ) | (10,011,918 | ) | (44,052,501 | ) | (75,577,163 | ) | ||||||||||||
| Net increase (decrease) in net assets from share transactions |
22,455,513 | 13,239,092 | (12,256,968 | ) | 83,565,997 | 22,727,292 | (10,956,162 | ) | ||||||||||||||||
| Total increase (decrease) in net assets |
52,749,156 | 39,014,534 | 23,616,023 | 117,387,250 | 30,564,621 | 51,237,573 | ||||||||||||||||||
| NET ASSETS |
||||||||||||||||||||||||
| Beginning of period |
115,993,672 | 76,979,138 | 167,504,130 | 50,116,880 | 223,916,285 | 172,678,712 | ||||||||||||||||||
| End of period† |
$ | 168,742,828 | $ | 115,993,672 | $ | 191,120,153 | $ | 167,504,130 | $ | 254,480,906 | $ | 223,916,285 | ||||||||||||
| † Accumulated undistributed net investment income (loss) |
$ | 105,271 | $ | 63,374 | $ | 591,957 | $ | 554,356 | $ | (870,323 | ) | $ | 10,936,439 | |||||||||||
See Notes to Financial Statements.
273
Table of Contents
| STATEMENTS OF CHANGES IN NET ASSETS (Continued) | ||
| Sun Capital Advisers Trust |
| SC Ibbotson Tactical Opportunities Fund |
Sun Capital Investment Grade Bond Fund |
Sun Capital Money Market Fund |
||||||||||||||||||
| Year Ended December 31 | Year Ended December 31, | Year Ended December 31, | ||||||||||||||||||
| 2010* | 2010 | 2009 | 2010 | 2009 | ||||||||||||||||
| INCREASE (DECREASE) IN NET ASSETS FROM OPERATIONS |
||||||||||||||||||||
| Net investment income (loss) |
$ | 3,857,285 | $ | 10,282,898 | $ | 5,291,938 | $ | 153,247 | $ | 340,128 | ||||||||||
| Net realized gain (loss) |
537,564 | 7,159,689 | 1,727,150 | 529 | 647 | |||||||||||||||
| Change in unrealized appreciation (depreciation) |
16,685,256 | 3,226,405 | 13,693,333 | — | — | |||||||||||||||
| Net increase (decrease) in net assets resulting from operations |
21,080,105 | 20,668,992 | 20,712,421 | 153,776 | 340,775 | |||||||||||||||
| DISTRIBUTIONS TO SHAREHOLDERS FROM |
||||||||||||||||||||
| Net investment income: |
||||||||||||||||||||
| Initial Class |
— | (7,412,008 | ) | (3,544,244 | ) | (153,247 | ) | (331,634 | ) | |||||||||||
| Service Class |
— | (3,029,790 | ) | (1,634,523 | ) | — | (8,299 | ) | ||||||||||||
| Net realized gain on investments: |
||||||||||||||||||||
| Initial Class |
— | (681,253 | ) | (63,545 | ) | — | — | |||||||||||||
| Service Class |
— | (313,903 | ) | (29,899 | ) | — | — | |||||||||||||
| Net decrease in net assets from distributions |
— | (11,436,954 | ) | (5,272,211 | ) | (153,247 | ) | (339,933 | ) | |||||||||||
| SHARE TRANSACTIONS |
||||||||||||||||||||
| Net proceeds from sales |
434,362,406 | 200,395,252 | 134,907,828 | 151,481,767 | 156,250,942 | |||||||||||||||
| Net proceeds from reinvestment of distributions |
— | 11,436,954 | 5,272,211 | 153,247 | 339,933 | |||||||||||||||
| Cost of shares redeemed |
(19,650 | ) | (48,989,541 | ) | (11,711,227 | ) | (169,444,454 | ) | (156,820,840 | ) | ||||||||||
| Net increase (decrease) in net assets from share transactions |
434,342,756 | 162,842,665 | 128,468,812 | (17,809,440 | ) | (229,965 | ) | |||||||||||||
| Total increase (decrease) in net assets |
455,422,861 | 172,074,703 | 143,909,022 | (17,808,911 | ) | (229,123 | ) | |||||||||||||
| NET ASSETS |
||||||||||||||||||||
| Beginning of period |
10 | ** | 201,039,655 | 57,130,633 | 204,294,936 | 204,524,059 | ||||||||||||||
| End of period† |
$ | 455,422,871 | $ | 373,114,358 | $ | 201,039,655 | $ | 186,486,025 | $ | 204,294,936 | ||||||||||
| † Accumulated undistributed net investment income |
$ | 3,891,690 | $ | 9,304 | $ | 183,560 | $ | 422 | $ | 422 | ||||||||||
| * | For the period November 15, 2010 (commencement of operations) to December 31, 2010. |
| ** | Amount represents initial seed investment. |
See Notes to Financial Statements.
274
Table of Contents
| STATEMENTS OF CHANGES IN NET ASSETS (Continued) | ||
| Sun Capital Advisers Trust |
| SC BlackRock Inflation Protected Bond Fund |
SC Goldman Sachs Short Duration Fund |
|||||||||||||||
| Year Ended December 31, | Year Ended December 31, | |||||||||||||||
| 2010 | 2009 | 2010 | 2009 | |||||||||||||
| INCREASE (DECREASE) IN NET ASSETS FROM OPERATIONS |
||||||||||||||||
| Net investment income (loss) |
$ | 3,508,503 | $ | 2,025,636 | $ | 13,496,544 | $ | 13,047,670 | ||||||||
| Net realized gain (loss) |
13,896,047 | 4,945,379 | 9,186,082 | 7,958,070 | ||||||||||||
| Change in unrealized appreciation (depreciation) |
(4,717,883 | ) | 1,384,872 | 998,471 | 7,355,401 | |||||||||||
| Net increase (decrease) in net assets resulting from operations |
12,686,667 | 8,355,887 | 23,681,097 | 28,361,141 | ||||||||||||
| DISTRIBUTIONS TO SHAREHOLDERS FROM |
||||||||||||||||
| Net investment income: |
||||||||||||||||
| Initial Class |
(2,042,941 | ) | (1,172,205 | ) | (13,719,331 | ) | (12,528,695 | ) | ||||||||
| Service Class |
(1,190,584 | ) | (603,807 | ) | (1,542,346 | ) | (1,486,390 | ) | ||||||||
| Net realized gain on investments: |
||||||||||||||||
| Initial Class |
(1,815,579 | ) | (1,626,544 | ) | (972,991 | ) | (6,192,212 | ) | ||||||||
| Service Class |
(1,330,938 | ) | (1,199,392 | ) | (138,662 | ) | (761,733 | ) | ||||||||
| Net decrease in net assets from distributions |
(6,380,042 | ) | (4,601,948 | ) | (16,373,330 | ) | (20,969,030 | ) | ||||||||
| SHARE TRANSACTIONS |
||||||||||||||||
| Net proceeds from sales |
193,206,634 | 170,986,380 | 300,846,678 | 1,025,662,269 | ||||||||||||
| Net proceeds from reinvestment of distributions |
6,380,042 | 4,601,948 | 16,373,330 | 20,969,030 | ||||||||||||
| Cost of shares redeemed |
(12,046,006 | ) | (6,826,654 | ) | (147,289,854 | ) | (195,070,121 | ) | ||||||||
| Net increase (decrease) in net assets from share transactions |
187,540,670 | 168,761,674 | 169,930,154 | 851,561,178 | ||||||||||||
| Total increase (decrease) in net assets |
193,847,295 | 172,515,613 | 177,237,921 | 858,953,289 | ||||||||||||
| NET ASSETS |
||||||||||||||||
| Beginning of period |
185,102,895 | 12,587,282 | 976,977,698 | 118,024,409 | ||||||||||||
| End of period† |
$ | 378,950,190 | $ | 185,102,895 | $ | 1,154,215,619 | $ | 976,977,698 | ||||||||
| † Accumulated undistributed net investment income |
$ | 638,947 | $ | 12,276 | $ | — | $ | — | ||||||||
See Notes to Financial Statements.
275
Table of Contents
| STATEMENTS OF CHANGES IN NET ASSETS (Continued) | ||
| Sun Capital Advisers Trust |
| SC PIMCO High Yield Fund |
SC PIMCO Total Return Fund |
|||||||||||||||
| Year Ended December 31, | Year Ended December 31, | |||||||||||||||
| 2010 | 2009 | 2010 | 2009 | |||||||||||||
| INCREASE (DECREASE) IN NET ASSETS FROM OPERATIONS |
||||||||||||||||
| Net investment income (loss) |
$ | 10,503,313 | $ | 7,091,347 | $ | 10,423,575 | $ | 4,241,609 | ||||||||
| Net realized gain (loss) |
4,663,008 | 3,614,164 | 24,324,457 | 6,640,956 | ||||||||||||
| Change in unrealized appreciation (depreciation) |
1,547,809 | 15,503,746 | 2,026,730 | 5,713,786 | ||||||||||||
| Net increase (decrease) in net assets resulting from operations |
16,714,130 | 26,209,257 | 36,774,762 | 16,596,351 | ||||||||||||
| DISTRIBUTIONS TO SHAREHOLDERS FROM |
||||||||||||||||
| Net investment income: |
||||||||||||||||
| Initial Class |
(8,491,359 | ) | (5,611,869 | ) | (5,163,456 | ) | (1,777,999 | ) | ||||||||
| Service Class |
(1,965,640 | ) | (1,584,958 | ) | (7,131,257 | ) | (2,556,449 | ) | ||||||||
| Net realized gain on investments: |
||||||||||||||||
| Initial Class |
(857,562 | ) | (2,250,992 | ) | (893,320 | ) | (1,718,228 | ) | ||||||||
| Service Class |
(202,216 | ) | (597,851 | ) | (1,377,736 | ) | (2,905,414 | ) | ||||||||
| Net decrease in net assets from distributions |
(11,516,777 | ) | (10,045,670 | ) | (14,565,769 | ) | (8,958,090 | ) | ||||||||
| SHARE TRANSACTIONS |
||||||||||||||||
| Net proceeds from sales |
63,731,516 | 113,481,631 | 379,028,421 | 357,694,132 | ||||||||||||
| Net proceeds from reinvestment of distributions |
11,516,777 | 10,045,670 | 14,565,769 | 8,958,090 | ||||||||||||
| Cost of shares redeemed |
(24,995,144 | ) | (38,023,439 | ) | (47,950,269 | ) | (17,955,774 | ) | ||||||||
| Net increase (decrease) in net assets from share transactions |
50,253,149 | 85,503,862 | 345,643,921 | 348,696,448 | ||||||||||||
| Total increase (decrease) in net assets |
55,450,502 | 101,667,449 | 367,852,914 | 356,334,709 | ||||||||||||
| NET ASSETS |
||||||||||||||||
| Beginning of period |
117,101,642 | 15,434,193 | 388,554,574 | 32,219,865 | ||||||||||||
| End of period† |
$ | 172,552,144 | $ | 117,101,642 | $ | 756,407,488 | $ | 388,554,574 | ||||||||
| † Accumulated undistributed net investment income (loss) |
$ | 366,223 | $ | (93,986 | ) | $ | (586,403 | ) | $ | 98,716 | ||||||
See Notes to Financial Statements.
276
Table of Contents
| STATEMENTS OF CHANGES IN NET ASSETS (Continued) | ||
| Sun Capital Advisers Trust |
| SC Ibbotson Balanced Fund |
SC Ibbotson Conservative Fund |
SC Ibbotson Growth Fund |
||||||||||||||||||||||
| Year Ended December 31, | Year Ended December 31, | Year Ended December 31, | ||||||||||||||||||||||
| 2010 | 2009 | 2010 | 2009 | 2010 | 2009 | |||||||||||||||||||
| INCREASE (DECREASE) IN NET ASSETS FROM OPERATIONS |
||||||||||||||||||||||||
| Net investment income (loss) |
$ | 12,819,808 | $ | 4,471,965 | $ | 6,715,912 | $ | 3,739,710 | $ | 5,451,060 | $ | 2,412,299 | ||||||||||||
| Net realized gain (loss) |
65,356,107 | 11,555,252 | 23,520,441 | 7,517,826 | 52,815,917 | 10,244,795 | ||||||||||||||||||
| Change in unrealized appreciation (depreciation) |
51,959,160 | 53,653,607 | 27,625,126 | 28,588,643 | 11,687,524 | 49,767,168 | ||||||||||||||||||
| Net increase (decrease) in net assets resulting from operations |
130,135,075 | 69,680,824 | 57,861,479 | 39,846,179 | 69,954,501 | 62,424,262 | ||||||||||||||||||
| DISTRIBUTIONS TO SHAREHOLDERS FROM |
||||||||||||||||||||||||
| Net investment income: |
||||||||||||||||||||||||
| Initial Class |
(16,154 | ) | (544 | ) | (34,581 | ) | (4,173 | ) | (17,891 | ) | (602 | ) | ||||||||||||
| Service Class |
(9,758,906 | ) | (70,479 | ) | (7,460,635 | ) | (82,385 | ) | (7,020,584 | ) | (56,414 | ) | ||||||||||||
| Net realized gain on investments: |
||||||||||||||||||||||||
| Initial Class |
(7,998 | ) | (4 | ) | (14,251 | ) | (72 | ) | (12,008 | ) | (18 | ) | ||||||||||||
| Service Class |
(6,259,087 | ) | (8,075 | ) | (3,749,369 | ) | (12,037 | ) | (5,614,337 | ) | (23,977 | ) | ||||||||||||
| Net decrease in net assets from distributions |
(16,042,145 | ) | (79,102 | ) | (11,258,836 | ) | (98,667 | ) | (12,664,820 | ) | (81,011 | ) | ||||||||||||
| SHARE TRANSACTIONS |
||||||||||||||||||||||||
| Net proceeds from sales |
754,316,052 | 458,469,983 | 351,389,899 | 294,855,518 | 106,923,986 | 355,499,350 | ||||||||||||||||||
| Net proceeds from reinvestment of distributions |
16,042,145 | 79,102 | 11,258,836 | 98,667 | 12,664,820 | 81,011 | ||||||||||||||||||
| Cost of shares redeemed |
(5,242,404 | ) | (234,989 | ) | (14,007,370 | ) | (2,224,176 | ) | (35,071,730 | ) | (2,474,598 | ) | ||||||||||||
| Net increase (decrease) in net assets from share transactions |
765,115,793 | 458,314,096 | 348,641,365 | 292,730,009 | 84,517,076 | 353,105,763 | ||||||||||||||||||
| Total increase (decrease) in net assets |
879,208,723 | 527,915,818 | 395,244,008 | 332,477,521 | 141,806,757 | 415,449,014 | ||||||||||||||||||
| NET ASSETS |
||||||||||||||||||||||||
| Beginning of period |
566,718,616 | 38,802,798 | 366,498,249 | 34,020,728 | 448,732,450 | 33,283,436 | ||||||||||||||||||
| End of period† |
$ | 1,445,927,339 | $ | 566,718,616 | $ | 761,742,257 | $ | 366,498,249 | $ | 590,539,207 | $ | 448,732,450 | ||||||||||||
| † Accumulated undistributed net investment income |
$ | 20,455,821 | $ | 9,775,011 | $ | 10,819,968 | $ | 7,495,179 | $ | 9,256,393 | $ | 7,038,432 | ||||||||||||
See Notes to Financial Statements.
277
Table of Contents
| FINANCIAL HIGHLIGHTS | ||
| Sun Capital Advisers Trust |
Selected data for a share outstanding throughout each period:
| SC AllianceBernstein International Value Fund Initial Class Shares |
SC AllianceBernstein International Value Fund Service Class Shares |
SC BlackRock International Index Fund Initial Class Shares |
SC BlackRock International Index Fund Service Class Shares |
|||||||||||||||||||||||||||||
| Years Ended December 31, | Years Ended December 31, | Year Ended December 31, | Year Ended December 31, | |||||||||||||||||||||||||||||
| 2010 | 2009 | 2008* | 2010 | 2009 | 2008* | 2010** | 2010** | |||||||||||||||||||||||||
| Net Asset Value, Beginning of Period |
$ | 9.82 | $ | 7.92 | $ | 10.00 | $ | 9.81 | $ | 7.92 | $ | 10.00 | $ | 10.00 | $ | 10.00 | ||||||||||||||||
| Income (Loss) from Investment Operations: |
||||||||||||||||||||||||||||||||
| Net investment income (loss) (d) |
0.19 | † | 0.22 | † | 0.01 | 0.16 | † | 0.21 | † | 0.02 | 0.00 | †(e) | (0.00 | )†(e) | ||||||||||||||||||
| Net realized and unrealized gain (loss) on investments |
0.25 | 2.13 | (2.07 | ) | 0.27 | 2.11 | (2.09 | ) | 0.38 | 0.37 | ||||||||||||||||||||||
| Total from Investment Operations |
0.44 | 2.35 | (2.06 | ) | 0.43 | 2.32 | (2.07 | ) | 0.38 | 0.37 | ||||||||||||||||||||||
| Less Distributions from: |
||||||||||||||||||||||||||||||||
| Net investment income |
(0.00 | )(e) | (0.22 | ) | (0.02 | ) | (0.00 | )(e) | (0.20 | ) | (0.01 | ) | — | — | ||||||||||||||||||
| Net realized gain on investments |
(0.15 | ) | (0.23 | ) | — | (0.15 | ) | (0.23 | ) | — | — | — | ||||||||||||||||||||
| Total distributions |
(0.15 | ) | (0.45 | ) | (0.02 | ) | (0.15 | ) | (0.43 | ) | (0.01 | ) | — | — | ||||||||||||||||||
| Net Asset Value, End of Period |
$ | 10.11 | $ | 9.82 | $ | 7.92 | $ | 10.09 | $ | 9.81 | $ | 7.92 | $ | 10.38 | $ | 10.37 | ||||||||||||||||
| Total Return (b) |
4.62 | % | 29.71 | % | (20.64 | )% | 4.52 | % | 29.26 | % | (20.69 | )% | 3.80 | % | 3.70 | % | ||||||||||||||||
| Ratios and Supplemental Data: |
||||||||||||||||||||||||||||||||
| Net Assets, End of Period (000’s) |
$ | 71,186 | $ | 55,746 | $ | 9,763 | $ | 3,065 | $ | 1,666 | $ | 2,051 | $ | 54,635 | $ | 255 | ||||||||||||||||
| Ratio to average net assets: |
||||||||||||||||||||||||||||||||
| Net expenses (a)(c)(d) |
0.75 | % | 0.75 | % | 0.75 | % | 1.00 | % | 1.00 | % | 1.00 | % | 0.60 | % | 0.85 | % | ||||||||||||||||
| Gross expenses (a)(d) |
1.06 | % | 1.38 | % | 6.64 | % | 1.31 | % | 1.69 | % | 4.64 | % | 2.27 | % | 5.60 | % | ||||||||||||||||
| Net investment income (loss) (a)(c)(d) |
2.01 | % | 2.47 | % | 1.18 | % | 1.65 | % | 2.35 | % | 1.07 | % | 0.18 | % | (0.07 | )% | ||||||||||||||||
| Portfolio turnover rate |
60 | % | 49 | % | 7 | % | 60 | % | 49 | % | 7 | % | 1 | % | 1 | % | ||||||||||||||||
| * | For the period October 1, 2008 (commencement of operations) to December 31, 2008. |
| ** | For the period November 15, 2010 (commencement of operations) to December 31, 2010. |
| † | Based on average shares outstanding during the period. |
| (a) | Annualized for periods of less than one year. |
| (b) | Total returns are historical and assume changes in share price, reinvestments of all dividends and distributions, and no sales charge. Had certain expenses not been reduced during the periods shown, total returns would have been lower. Total returns for periods of less than one year are not annualized. |
| (c) | Such percentages are after advisory fee or unified management fee waivers and expense reimbursements, as applicable. |
| (d) | Does not include any insurance charges imposed in connection with your variable insurance contract. |
| (e) | Amount is less than $0.005 per share. |
278
Table of Contents
| FINANCIAL HIGHLIGHTS (Continued) | ||
| Sun Capital Advisers Trust |
Selected data for a share outstanding throughout each period:
| SC BlackRock Large Cap Index Fund Initial Class Shares |
SC BlackRock Large Cap Index Fund Service Class Shares |
|||||||||||||||||||||||||||||||||||||||
| Years Ended December 31, | Years Ended December 31, | |||||||||||||||||||||||||||||||||||||||
| 2010 | 2009 | 2008 | 2007 | 2006 | 2010 | 2009 | 2008 | 2007 | 2006 | |||||||||||||||||||||||||||||||
| Net Asset Value, Beginning of Period |
$ | 8.04 | $ | 6.70 | $ | 10.77 | $ | 12.37 | $ | 10.47 | $ | 8.25 | $ | 6.87 | $ | 11.03 | $ | 12.65 | $ | 10.70 | ||||||||||||||||||||
| Income (Loss) from Investment Operations: |
||||||||||||||||||||||||||||||||||||||||
| Net investment income (loss) (c) |
0.10 | † | 0.11 | † | 0.04 | 0.12 | 0.17 | 0.09 | † | 0.10 | † | 0.10 | 0.08 | 0.12 | ||||||||||||||||||||||||||
| Net realized and unrealized gain (loss) on |
1.25 | 1.30 | (4.03 | ) | (0.84 | ) | 1.93 | 1.27 | 1.33 | (4.19 | ) | (0.84 | ) | 2.00 | ||||||||||||||||||||||||||
| Total from Investment Operations |
1.35 | 1.41 | (3.99 | ) | (0.72 | ) | 2.10 | 1.36 | 1.43 | (4.09 | ) | (0.76 | ) | 2.12 | ||||||||||||||||||||||||||
| Less Distributions from: |
||||||||||||||||||||||||||||||||||||||||
| Net investment income |
— | (0.07 | ) | (0.05 | ) | (0.10 | ) | (0.16 | ) | — | (0.05 | ) | (0.04 | ) | (0.08 | ) | (0.13 | ) | ||||||||||||||||||||||
| Net realized gain on investments |
(0.02 | ) | — | (0.03 | ) | (0.78 | ) | (0.04 | ) | (0.02 | ) | — | (0.03 | ) | (0.78 | ) | (0.04 | ) | ||||||||||||||||||||||
| Total distributions |
(0.02 | ) | (0.07 | ) | (0.08 | ) | (0.88 | ) | (0.20 | ) | (0.02 | ) | (0.05 | ) | (0.07 | ) | (0.86 | ) | (0.17 | ) | ||||||||||||||||||||
| Net Asset Value, End of Period |
$ | 9.37 | $ | 8.04 | $ | 6.70 | $ | 10.77 | $ | 12.37 | $ | 9.59 | $ | 8.25 | $ | 6.87 | $ | 11.03 | $ | 12.65 | ||||||||||||||||||||
| Total Return (a) |
16.76 | % | 21.09 | % | (37.06 | )% | (5.81 | )% | 20.07 | % | 16.45 | % | 20.85 | % | (37.15 | )% | (6.07 | )% | 19.78 | % | ||||||||||||||||||||
| Ratios and Supplemental Data: |
||||||||||||||||||||||||||||||||||||||||
| Net Assets, End of Period (000’s) |
$ | 90,267 | $ | 70,638 | $ | 8,366 | $ | 5,544 | $ | 6,183 | $ | 16,309 | $ | 11,734 | $ | 4,974 | $ | 7,808 | $ | 5,262 | ||||||||||||||||||||
| Ratios to average net assets: |
||||||||||||||||||||||||||||||||||||||||
| Net expenses (b)(c) |
0.85 | % | 0.90 | % | 0.90 | % | 0.90 | % | 0.90 | % | 1.09 | % | 1.15 | % | 1.15 | % | 1.15 | % | 1.15 | % | ||||||||||||||||||||
| Gross expenses (c) |
0.86 | % | 1.13 | % | 2.08 | % | 1.81 | % | 2.47 | % | 1.10 | % | 1.44 | % | 2.34 | % | 2.05 | % | 2.62 | % | ||||||||||||||||||||
| Net investment income (loss) (b)(c) |
1.23 | % | 1.55 | % | 1.39 | % | 0.89 | % | 1.47 | % | 1.02 | % | 1.37 | % | 1.05 | % | 0.63 | % | 1.44 | % | ||||||||||||||||||||
| Portfolio turnover rate |
235 | % | 109 | % | 189 | % | 63 | % | 135 | % | 235 | % | 109 | % | 189 | % | 63 | % | 135 | % | ||||||||||||||||||||
| † | Based on average shares outstanding during the period. |
| (a) | Total returns are historical and assume changes in share price, reinvestments of all dividends and distributions, and no sales charge. Had certain expenses not been reduced during the periods shown, total returns would have been lower. |
| (b) | Such percentages are after advisory fee or unified management fee waivers and expense reimbursements, as applicable. |
| (c) | Does not include any insurance charges imposed in connection with your variable insurance contract. |
279
Table of Contents
| FINANCIAL HIGHLIGHTS (Continued) | ||
| Sun Capital Advisers Trust |
Selected data for a share outstanding throughout each period:
| SC BlackRock Small Cap Index
Fund Initial Class Shares |
SC BlackRock Small Cap Index
Fund Service Class Shares |
|||||||||||||||||||||||||||||||||||||||
| Years Ended December 31, | Years Ended December 31, | |||||||||||||||||||||||||||||||||||||||
| 2010 | 2009 | 2008 | 2007 | 2006 | 2010 | 2009 | 2008 | 2007 | 2006* | |||||||||||||||||||||||||||||||
| Net Asset Value, Beginning of Period |
$ | 10.58 | $ | 7.74 | $ | 12.98 | $ | 15.02 | $ | 13.79 | $ | 10.45 | $ | 7.66 | $ | 12.85 | $ | 14.99 | $ | 15.56 | ||||||||||||||||||||
| Income (Loss) from Investment Operations: |
||||||||||||||||||||||||||||||||||||||||
| Net investment income (loss) (d) |
0.06 | † | 0.04 | † | 0.03 | 0.05 | 0.01 | 0.04 | † | 0.02 | † | (0.00 | )(e) | 0.01 | (0.01 | ) | ||||||||||||||||||||||||
| Net realized and unrealized gain (loss) on |
2.52 | 2.81 | (4.82 | ) | (0.23 | ) | 1.82 | 2.47 | 2.78 | (4.77 | ) | (0.29 | ) | 0.04 | ||||||||||||||||||||||||||
| Total from Investment Operations |
2.58 | 2.85 | (4.79 | ) | (0.18 | ) | 1.83 | 2.51 | 2.80 | (4.77 | ) | (0.28 | ) | 0.03 | ||||||||||||||||||||||||||
| Less Distributions from: |
||||||||||||||||||||||||||||||||||||||||
| Net investment income |
(0.04 | ) | (0.01 | ) | (0.03 | ) | — | — | (0.01 | ) | (0.01 | ) | (0.00 | )(e) | — | — | ||||||||||||||||||||||||
| Net realized gain on investments |
— | — | (0.42 | ) | (1.86 | ) | (0.60 | ) | — | — | (0.42 | ) | (1.86 | ) | (0.60 | ) | ||||||||||||||||||||||||
| Total distributions |
(0.04 | ) | (0.01 | ) | (0.45 | ) | (1.86 | ) | (0.60 | ) | (0.01 | ) | (0.01 | ) | (0.42 | ) | (1.86 | ) | (0.60 | ) | ||||||||||||||||||||
| Net Asset Value, End of Period |
$ | 13.12 | $ | 10.58 | $ | 7.74 | $ | 12.98 | $ | 15.02 | $ | 12.95 | $ | 10.45 | $ | 7.66 | $ | 12.85 | $ | 14.99 | ||||||||||||||||||||
| Total Return (b) |
24.46 | % | 36.77 | % | (37.99 | )% | (1.44 | )% | 13.60 | % | 24.07 | % | 36.50 | % | (38.14 | )% | (2.11 | )% | 0.48 | % | ||||||||||||||||||||
| Ratios and Supplemental Data: |
||||||||||||||||||||||||||||||||||||||||
| Net Assets, End of Period (000’s) |
$ | 45,720 | $ | 48,950 | $ | 38,435 | $ | 72,741 | $ | 87,215 | $ | 134,958 | $ | 134,819 | $ | 115,098 | $ | 105,377 | $ | 25 | ||||||||||||||||||||
| Ratios to average net assets: |
||||||||||||||||||||||||||||||||||||||||
| Net expenses (a)(c)(d) |
0.95 | % | 1.00 | % | 1.00 | % | 1.00 | % | 1.00 | % | 1.20 | % | 1.25 | % | 1.25 | % | 1.25 | % | 1.25 | % | ||||||||||||||||||||
| Gross expenses (a)(d) |
0.99 | % | 1.21 | % | 1.29 | % | 1.38 | % | 1.42 | % | 1.23 | % | 1.46 | % | 1.55 | % | 1.61 | % | 1.82 | % | ||||||||||||||||||||
| Net investment income (loss) (a)(c)(d) |
0.57 | % | 0.45 | % | 0.21 | % | 0.31 | % | 0.02 | % | 0.34 | % | 0.20 | % | 0.04 | % | (0.06 | )% | (0.09 | )% | ||||||||||||||||||||
| Portfolio turnover rate |
131 | % | 132 | % | 126 | % | 126 | % | 206 | % | 131 | % | 132 | % | 126 | % | 126 | % | 206 | % | ||||||||||||||||||||
| * | For the period from May 1, 2006 (commencement of operations – Service Class Shares) through December 31, 2006. |
| † | Based on average shares outstanding during the period. |
| (a) | Annualized for periods of less than one year. |
| (b) | Total returns are historical and assume changes in share price, reinvestments of all dividends and distributions, and no sales charge. Had certain expenses not been reduced during the periods shown, total returns would have been lower. Total returns for periods of less than one year are not annualized. |
| (c) | Such percentages are after advisory fee or unified management fee waivers and expenses reimbursements, as applicable. |
| (d) | Does not include any insurance charges imposed in connection with your variable insurance contract. |
| (e) | Amount is less than $0.005 per share. |
280
Table of Contents
| FINANCIAL HIGHLIGHTS (Continued) | ||
| Sun Capital Advisers Trust |
Selected data for a share outstanding throughout each period:
| SC Goldman Sachs Mid Cap Value Fund Initial Class Shares |
SC Goldman Sachs Mid Cap Value Fund Service Class Shares |
SC Columbia Small Cap Value Fund Initial Class Shares |
SC Columbia Small Cap Value Fund Service Class Shares |
|||||||||||||||||||||||||||||||||||||||||||||
| Years Ended December 31, | Years Ended December 31, | Years Ended December 31, | Years Ended December 31, | |||||||||||||||||||||||||||||||||||||||||||||
| 2010 | 2009 | 2008* | 2010 | 2009 | 2008* | 2010 | 2009 | 2008** | 2010 | 2009 | 2008** | |||||||||||||||||||||||||||||||||||||
| Net Asset Value, Beginning of Period |
$ | 7.93 | $ | 6.93 | $ | 10.00 | $ | 7.93 | $ | 6.93 | $ | 10.00 | $ | 10.08 | $ | 7.97 | $ | 10.00 | $ | 10.07 | $ | 7.97 | $ | 10.00 | ||||||||||||||||||||||||
| Income (Loss) from Investment Operations: |
||||||||||||||||||||||||||||||||||||||||||||||||
| Net investment income (loss) (d) |
0.12 | † | 0.11 | † | 0.05 | 0.10 | † | 0.09 | † | 0.07 | 0.07 | † | 0.06 | † | 0.01 | 0.05 | † | 0.04 | † | 0.01 | ||||||||||||||||||||||||||||
| Net realized and unrealized gain (loss) on |
1.61 | 1.68 | (3.06 | ) | 1.59 | 1.68 | (3.09 | ) | 1.93 | 2.38 | (2.03 | ) | 1.92 | 2.36 | (2.03 | ) | ||||||||||||||||||||||||||||||||
| Total from Investment Operations |
1.73 | 1.79 | (3.01 | ) | 1.69 | 1.77 | (3.02 | ) | 2.00 | 2.44 | (2.02 | ) | 1.97 | 2.40 | (2.02 | ) | ||||||||||||||||||||||||||||||||
| Less Distributions from: |
||||||||||||||||||||||||||||||||||||||||||||||||
| Net investment income |
— | (0.08 | ) | (0.06 | ) | — | (0.06 | ) | (0.05 | ) | — | (0.05 | ) | (0.01 | ) | — | (0.02 | ) | (0.01 | ) | ||||||||||||||||||||||||||||
| Net realized gain on investments |
(0.21 | ) | (0.71 | ) | — | (0.21 | ) | (0.71 | ) | — | (0.90 | ) | (0.28 | ) | — | (0.90 | ) | (0.28 | ) | — | ||||||||||||||||||||||||||||
| Total distributions |
(0.21 | ) | (0.79 | ) | (0.06 | ) | (0.21 | ) | (0.77 | ) | (0.05 | ) | (0.90 | ) | (0.33 | ) | (0.01 | ) | (0.90 | ) | (0.30 | ) | (0.01 | ) | ||||||||||||||||||||||||
| Net Asset Value, End of Period |
$ | 9.45 | $ | 7.93 | $ | 6.93 | $ | 9.41 | $ | 7.93 | $ | 6.93 | $ | 11.18 | $ | 10.08 | $ | 7.97 | $ | 11.14 | $ | 10.07 | $ | 7.97 | ||||||||||||||||||||||||
| Total Return (b) |
22.13 | % | 25.68 | % | (30.07 | )% | 21.62 | % | 25.38 | % | (30.21 | )% | 21.62 | % | 30.52 | % | (20.15 | )% | 21.33 | % | 30.07 | % | (20.20 | )% | ||||||||||||||||||||||||
| Ratios and Supplemental Data: |
||||||||||||||||||||||||||||||||||||||||||||||||
| Net Assets, End of Period (000’s) |
$ | 245,161 | $ | 190,461 | $ | 6,496 | $ | 26,638 | $ | 18,699 | $ | 4,452 | $ | 48,782 | $ | 33,674 | $ | 4,316 | $ | 12,293 | $ | 6,809 | $ | 1,424 | ||||||||||||||||||||||||
| Ratio to average net assets: |
||||||||||||||||||||||||||||||||||||||||||||||||
| Net expenses (a)(c)(d) |
1.06 | % | 1.06 | % | 1.07 | % | 1.31 | % | 1.31 | % | 1.32 | % | 1.15 | % | 1.15 | % | 1.15 | % | 1.40 | % | 1.40 | % | 1.40 | % | ||||||||||||||||||||||||
| Gross expenses (a)(d) |
1.06 | % | 1.06 | % | 1.08 | % | 1.31 | % | 1.31 | % | 1.32 | % | 1.41 | % | 1.54 | % | 8.84 | % | 1.67 | % | 1.87 | % | 6.68 | % | ||||||||||||||||||||||||
| Net investment income (loss) (a)(c)(d) |
1.41 | % | 1.45 | % | 2.10 | % | 1.18 | % | 1.15 | % | 1.65 | % | 0.68 | % | 0.65 | % | 1.18 | % | 0.47 | % | 0.44 | % | 0.72 | % | ||||||||||||||||||||||||
| Portfolio turnover rate |
65 | % | 159 | % | 90 | % | 65 | % | 159 | % | 90 | % | 139 | % | 110 | % | 28 | % | 139 | % | 110 | % | 28 | % | ||||||||||||||||||||||||
| * | For the period March 7, 2008 (commencement of operations) to December 31, 2008. |
| ** | For the period October 1, 2008 (commencement of operations) to December 31, 2008. |
| † | Based on average shares outstanding during the period. |
| (a) | Annualized for periods of less than one year. |
| (b) | Total returns are historical and assume changes in share price, reinvestments of all dividends and distributions, and no sales charge. Had certain expenses not been reduced during the periods shown, total returns would have been lower. Total returns for periods of less than one year are not annualized. |
| (c) | Such percentages are after advisory fee or unified management fee waivers and expense reimbursements, as applicable. |
| (d) | Does not include any insurance charges imposed in connection with your variable insurance contract. |
281
Table of Contents
| FINANCIAL HIGHLIGHTS (Continued) | ||
| Sun Capital Advisers Trust |
Selected data for a share outstanding throughout each period:
| SC Davis Venture Value Fund Initial Class Shares |
SC Davis Venture Value Fund Service Class Shares |
|||||||||||||||||||||||||||||||||||||||
| Years Ended December 31, | Years Ended December 31, | |||||||||||||||||||||||||||||||||||||||
| 2010 | 2009 | 2008 | 2007 | 2006 | 2010 | 2009 | 2008 | 2007 | 2006* | |||||||||||||||||||||||||||||||
| Net Asset Value, Beginning of Period |
$ | 10.75 | $ | 8.34 | $ | 13.65 | $ | 13.17 | $ | 11.56 | $ | 10.72 | $ | 8.32 | $ | 13.61 | $ | 13.15 | $ | 12.08 | ||||||||||||||||||||
| Income (Loss) from Investment Operations: |
||||||||||||||||||||||||||||||||||||||||
| Net investment income (loss) (d) |
0.08 | † | 0.06 | † | 0.10 | 0.17 | 0.09 | 0.05 | † | 0.04 | † | 0.06 | 0.12 | 0.04 | ||||||||||||||||||||||||||
| Net realized and unrealized gain (loss) on |
1.30 | 2.39 | (5.21 | ) | 0.39 | 1.61 | 1.31 | 2.37 | (5.17 | ) | 0.39 | 1.12 | ||||||||||||||||||||||||||||
| Total from Investment Operations |
1.38 | 2.45 | (5.11 | ) | 0.56 | 1.70 | 1.36 | 2.41 | (5.11 | ) | 0.51 | 1.16 | ||||||||||||||||||||||||||||
| Less Distributions from: |
||||||||||||||||||||||||||||||||||||||||
| Net investment income |
(0.05 | ) | (0.04 | ) | (0.09 | ) | (0.08 | ) | (0.09 | ) | (0.03 | ) | (0.01 | ) | (0.07 | ) | (0.05 | ) | (0.09 | ) | ||||||||||||||||||||
| Net realized gain on investments |
— | — | (0.11 | ) | — | — | — | — | (0.11 | ) | — | — | ||||||||||||||||||||||||||||
| Total distributions |
(0.05 | ) | (0.04 | ) | (0.20 | ) | (0.08 | ) | (0.09 | ) | (0.03 | ) | (0.01 | ) | (0.18 | ) | (0.05 | ) | (0.09 | ) | ||||||||||||||||||||
| Net Asset Value, End of Period |
$ | 12.08 | $ | 10.75 | $ | 8.34 | $ | 13.65 | $ | 13.17 | $ | 12.05 | $ | 10.72 | $ | 8.32 | $ | 13.61 | $ | 13.15 | ||||||||||||||||||||
| Total Return (b) |
12.92 | % | 29.39 | % | (37.81 | )% | 4.23 | % | 14.77 | % | 12.68 | % | 29.02 | % | (37.93 | )% | 3.91 | % | 9.66 | % | ||||||||||||||||||||
| Ratios and Supplemental Data: |
||||||||||||||||||||||||||||||||||||||||
| Net Assets, End of Period (000’s) |
$ | 157,652 | $ | 147,350 | $ | 31,868 | $ | 52,861 | $ | 61,438 | $ | 266,112 | $ | 235,240 | $ | 82,041 | $ | 27,764 | $ | 27 | ||||||||||||||||||||
| Ratios to average net assets: |
||||||||||||||||||||||||||||||||||||||||
| Net expenses (a)(c)(d) |
0.87 | % | 0.90 | % | 0.90 | % | 0.90 | % | 0.90 | % | 1.12 | % | 1.15 | % | 1.15 | % | 1.15 | % | 1.15 | % | ||||||||||||||||||||
| Gross expenses (a)(d) |
0.87 | % | 0.93 | % | 1.11 | % | 1.11 | % | 1.16 | % | 1.12 | % | 1.18 | % | 1.35 | % | 1.35 | % | 1.43 | % | ||||||||||||||||||||
| Net investment income (loss) (a)(c)(d) |
0.73 | % | 0.62 | % | 0.86 | % | 1.06 | % | 0.74 | % | 0.49 | % | 0.41 | % | 0.65 | % | 0.68 | % | 0.48 | % | ||||||||||||||||||||
| Portfolio turnover rate |
39 | % | 17 | % | 19 | % | 10 | % | 16 | % | 39 | % | 17 | % | 19 | % | 10 | % | 16 | % | ||||||||||||||||||||
| * | For the period from May 1, 2006 (commencement of operations – Service Class Shares) through December 31, 2006. |
| † | Based on average shares outstanding during the period. |
| (a) | Annualized for periods of less than one year. |
| (b) | Total returns are historical and assume changes in share price, reinvestments of all dividends and distributions, and no sales charge. Had certain expenses not been reduced during the periods shown, total returns would have been lower. Total returns for periods of less than one year are not annualized. |
| (c) | Such percentages are after advisory fee or unified management fee waivers and expense reimbursements, as applicable. |
| (d) | Does not include any insurance charges imposed in connection with your variable insurance contract. |
282
Table of Contents
| FINANCIAL HIGHLIGHTS (Continued) | ||
| Sun Capital Advisers Trust |
Selected data for a share outstanding throughout each period:
| SC Invesco Small Cap Growth Fund Initial Class Shares |
SC Invesco Small Cap Growth Fund Service Class Shares |
SC Lord Abbett Growth & Income Fund Initial Class Shares |
SC Lord
Abbett Growth & Income Fund Service Class Shares |
|||||||||||||||||||||||||||||||||||||||||||||
| Years Ended December 31, | Years Ended December 31, | Years Ended December 31, | Years Ended December 31, | |||||||||||||||||||||||||||||||||||||||||||||
| 2010 | 2009 | 2008* | 2010 | 2009 | 2008* | 2010 | 2009 | 2008** | 2010 | 2009 | 2008** | |||||||||||||||||||||||||||||||||||||
| Net Asset Value, Beginning of Period |
$ | 9.59 | $ | 7.51 | $ | 10.00 | $ | 9.55 | $ | 7.50 | $ | 10.00 | $ | 7.52 | $ | 7.08 | $ | 10.00 | $ | 7.51 | $ | 7.08 | $ | 10.00 | ||||||||||||||||||||||||
| Income (Loss) from Investment Operations: |
||||||||||||||||||||||||||||||||||||||||||||||||
| Net investment income (loss) (d) |
(0.05 | )† | (0.02 | )† | (0.00 | )(e) | (0.08 | )† | (0.04 | )† | (0.01 | ) | 0.05 | † | 0.05 | † | 0.06 | 0.03 | † | 0.04 | † | 0.06 | ||||||||||||||||||||||||||
| Net realized and unrealized gain (loss) on investments |
2.39 | 2.41 | (2.49 | ) | 2.39 | 2.40 | (2.49 | ) | 1.20 | 1.22 | (2.92 | ) | 1.20 | 1.19 | (2.93 | ) | ||||||||||||||||||||||||||||||||
| Total from Investment Operations |
2.34 | 2.39 | (2.49 | ) | 2.31 | 2.36 | (2.50 | ) | 1.25 | 1.27 | (2.86 | ) | 1.23 | 1.23 | (2.87 | ) | ||||||||||||||||||||||||||||||||
| Less Distributions from: |
||||||||||||||||||||||||||||||||||||||||||||||||
| Net investment income |
— | — | — | — | — | — | — | (0.05 | ) | (0.06 | ) | — | (0.02 | ) | (0.05 | ) | ||||||||||||||||||||||||||||||||
| Net realized gain on investments |
(0.87 | ) | (0.31 | ) | — | (0.87 | ) | (0.31 | ) | — | (0.33 | ) | (0.78 | ) | — | (0.33 | ) | (0.78 | ) | — | ||||||||||||||||||||||||||||
| Total distributions |
(0.87 | ) | (0.31 | ) | — | (0.87 | ) | (0.31 | ) | — | (0.33 | ) | (0.83 | ) | (0.06 | ) | (0.33 | ) | (0.80 | ) | (0.05 | ) | ||||||||||||||||||||||||||
| Net Asset Value, End of Period |
$ | 11.06 | $ | 9.59 | $ | 7.51 | $ | 10.99 | $ | 9.55 | $ | 7.50 | $ | 8.44 | $ | 7.52 | $ | 7.08 | $ | 8.41 | $ | 7.51 | $ | 7.08 | ||||||||||||||||||||||||
| Total Return (b) |
26.08 | % | 31.75 | % | (24.90 | )% | 25.86 | % | 31.39 | % | (25.00 | )% | 17.19 | % | 17.85 | % | (28.54 | )% | 16.94 | % | 17.41 | % | (28.68 | )% | ||||||||||||||||||||||||
| Ratios and Supplemental Data: |
||||||||||||||||||||||||||||||||||||||||||||||||
| Net Assets, End of Period (000’s) |
$ | 20,587 | $ | 13,109 | $ | 2,530 | $ | 10,761 | $ | 6,488 | $ | 1,544 | $ | 544,716 | $ | 498,639 | $ | 2,229 | $ | 13,744 | $ | 9,422 | $ | 2,620 | ||||||||||||||||||||||||
| Ratio to average net assets: |
||||||||||||||||||||||||||||||||||||||||||||||||
| Net expenses (a)(c)(d) |
1.15 | % | 1.15 | % | 1.15 | % | 1.40 | % | 1.40 | % | 1.40 | % | 0.87 | % | 0.87 | % | 0.87 | % | 1.12 | % | 1.12 | % | 1.12 | % | ||||||||||||||||||||||||
| Gross expenses (a)(d) |
1.63 | % | 2.17 | % | 11.09 | % | 1.88 | % | 2.48 | % | 9.42 | % | 0.88 | % | 0.88 | % | 0.90 | % | 1.13 | % | 1.13 | % | 1.14 | % | ||||||||||||||||||||||||
| Net investment income (loss) (a)(c)(d) |
(0.53 | )% | (0.25 | )% | (0.40 | )% | (0.78 | )% | (0.51 | )% | (0.72 | )% | 0.62 | % | 0.68 | % | 1.71 | % | 0.36 | % | 0.49 | % | 1.48 | % | ||||||||||||||||||||||||
| Portfolio turnover rate |
42 | % | 114 | % | 4 | % | 42 | % | 114 | % | 4 | % | 63 | % | 83 | % | 73 | % | 63 | % | 83 | % | 73 | % | ||||||||||||||||||||||||
| * | For the period October 1, 2008 (commencement of operations) to December 31, 2008. |
| ** | For the period March 7, 2008 (commencement of operations) to December 31, 2008. |
| † | Based on average shares outstanding during the period. |
| (a) | Annualized for periods of less than one year. |
| (b) | Total returns are historical and assume changes in share price, reinvestments of all dividends and distributions, and no sales charge. Had certain expenses not been reduced during the periods shown, total returns would have been lower. Total returns for periods of less than one year are not annualized. |
| (c) | Such percentages are after advisory fee or unified management fee waivers and expense reimbursements, as applicable. |
| (d) | Does not include any insurance charges imposed in connection with your variable insurance contract. |
| (e) | Amount is less than $0.005 per share. |
283
Table of Contents
| FINANCIAL HIGHLIGHTS (Continued) | ||
| Sun Capital Advisers Trust |
Selected data for a share outstanding throughout each period:
| SC WMC Blue Chip Mid Cap Fund Initial Class Shares |
SC WMC Blue Chip Mid Cap Fund Service Class Shares |
|||||||||||||||||||||||||||||||
| Years Ended December 31, | Years Ended December 31, | |||||||||||||||||||||||||||||||
| 2010 | 2009 | 2008 | 2007 | 2006 | 2010 | 2009 | 2008* | |||||||||||||||||||||||||
| Net Asset Value, Beginning of Period |
$ | 12.12 | $ | 9.32 | $ | 17.95 | $ | 19.04 | $ | 20.60 | $ | 12.07 | $ | 9.30 | $ | 15.70 | ||||||||||||||||
| Income (Loss) from Investment Operations: |
||||||||||||||||||||||||||||||||
| Net investment income (loss) (d) |
0.02 | † | 0.02 | † | 0.01 | (0.00 | )(e) | 0.18 | (0.01 | )† | (0.01 | )† | 0.02 | |||||||||||||||||||
| Net realized and unrealized gain (loss) on |
2.79 | 2.78 | (5.41 | ) | 2.87 | 1.87 | 2.76 | 2.78 | (3.19 | ) | ||||||||||||||||||||||
| Total from Investment Operations |
2.81 | 2.80 | (5.40 | ) | 2.87 | 2.05 | 2.75 | 2.77 | (3.17 | ) | ||||||||||||||||||||||
| Less Distributions from: |
||||||||||||||||||||||||||||||||
| Net investment income |
(0.01 | ) | (0.00 | )(e) | (0.03 | ) | (0.25 | ) | — | — | (0.00 | )(e) | (0.03 | ) | ||||||||||||||||||
| Net realized gain on investments |
— | — | (3.20 | ) | (3.71 | ) | (3.61 | ) | — | — | (3.20 | ) | ||||||||||||||||||||
| Total distributions |
(0.01 | ) | (0.00 | )(e) | (3.23 | ) | (3.96 | ) | (3.61 | ) | — | (0.00 | )(e) | (3.23 | ) | |||||||||||||||||
| Net Asset Value, End of Period |
$ | 14.92 | $ | 12.12 | $ | 9.32 | $ | 17.95 | $ | 19.04 | $ | 14.82 | $ | 12.07 | $ | 9.30 | ||||||||||||||||
| Total Return (b) |
23.17 | % | 30.07 | % | (35.14 | )% | 15.41 | % | 11.30 | % | 22.78 | % | 29.96 | % | (26.06 | )% | ||||||||||||||||
| Ratios and Supplemental Data: |
||||||||||||||||||||||||||||||||
| Net Assets, End of Period (000’s) |
$ | 128,115 | $ | 75,745 | $ | 45,842 | $ | 85,438 | $ | 94,632 | $ | 40,627 | $ | 40,249 | $ | 31,137 | ||||||||||||||||
| Ratio to average net assets: |
||||||||||||||||||||||||||||||||
| Net expenses (a)(c)(d) |
0.99 | % | 1.00 | % | 1.00 | % | 1.00 | % | 1.00 | % | 1.24 | % | 1.25 | % | 1.25 | % | ||||||||||||||||
| Gross expenses (a)(d) |
0.99 | % | 1.10 | % | 1.21 | % | 1.14 | % | 1.14 | % | 1.24 | % | 1.35 | % | 1.47 | % | ||||||||||||||||
| Net investment income (loss) (a)(c)(d) |
0.17 | % | 0.17 | % | 0.05 | % | (0.17 | )% | 0.92 | % | (0.11 | )% | (0.09 | )% | 0.02 | % | ||||||||||||||||
| Portfolio turnover rate |
69 | % | 82 | % | 104 | % | 75 | % | 83 | % | 69 | % | 82 | % | 104 | % | ||||||||||||||||
| * | For the period March 7, 2008 (commencement of operations – Service Class Shares) through December 31, 2008. |
| † | Based on average shares outstanding during the period. |
| (a) | Annualized for periods of less than one year. |
| (b) | Total returns are historical and assume changes in share price, reinvestments of all dividends and distributions, and no sales charge. Had certain expenses not been reduced during the periods shown, total returns would have been lower. Total returns for periods of less than one year are not annualized. |
| (c) | Such percentages are after advisory fee or unified management fee waivers and expense reimbursements, as applicable. |
| (d) | Does not include any insurance charges imposed in connection with your variable insurance contract. |
| (e) | Amount is less than $0.005 per share. |
284
Table of Contents
| FINANCIAL HIGHLIGHTS (Continued) | ||
| Sun Capital Advisers Trust |
Selected data for a share outstanding throughout the period:
| SC WMC Large Cap Growth Fund Initial Class Shares |
SC WMC Large Cap Growth Fund Service Class Shares |
|||||||||||||||||||||||||||||||||||
| Years Ended December 31, | Years Ended December 31, | |||||||||||||||||||||||||||||||||||
| 2010 | 2009 | 2008 | 2007* | 2010 | 2009 | 2008 | 2007 | 2006** | ||||||||||||||||||||||||||||
| Net Asset Value, Beginning of Period |
$ | 8.15 | $ | 5.95 | $ | 10.65 | $ | 9.99 | $ | 8.10 | $ | 5.92 | $ | 10.63 | $ | 9.98 | $ | 10.00 | ||||||||||||||||||
| Income (Loss) from Investment Operations: |
||||||||||||||||||||||||||||||||||||
| Net investment income (loss) (d) |
0.03 | † | 0.04 | † | 0.04 | (0.00 | )(e) | 0.01 | † | 0.03 | † | 0.02 | (0.02 | ) | (0.01 | ) | ||||||||||||||||||||
| Net realized and unrealized gain (loss) on |
1.55 | 2.17 | (4.74 | ) | 0.69 | 1.54 | 2.16 | (4.73 | ) | 0.70 | (0.01 | ) | ||||||||||||||||||||||||
| Total from Investment Operations |
1.58 | 2.21 | (4.70 | ) | 0.69 | 1.55 | 2.19 | (4.71 | ) | 0.68 | (0.02 | ) | ||||||||||||||||||||||||
| Less Distributions from: |
||||||||||||||||||||||||||||||||||||
| Net investment income |
(0.02 | ) | (0.01 | ) | — | — | (0.00 | )(e) | (0.01 | ) | — | — | — | |||||||||||||||||||||||
| Net realized gain on investments |
— | — | (0.00 | )(e) | (0.03 | ) | — | — | (0.00 | )(e) | (0.03 | ) | — | |||||||||||||||||||||||
| Total distributions |
(0.02 | ) | (0.01 | ) | (0.00 | )(e) | (0.03 | ) | (0.00 | )(e) | (0.01 | ) | (0.00 | )(e) | (0.03 | ) | — | |||||||||||||||||||
| Net Asset Value, End of Period |
$ | 9.71 | $ | 8.15 | $ | 5.95 | $ | 10.65 | $ | 9.65 | $ | 8.10 | $ | 5.92 | $ | 10.63 | $ | 9.98 | ||||||||||||||||||
| Total Return (b) |
19.50 | % | 37.23 | % | (44.12 | )% | 6.88 | % | 19.19 | % | 37.08 | % | (44.30 | )% | 6.78 | % | (0.20 | )% | ||||||||||||||||||
| Ratios and Supplemental Data: |
||||||||||||||||||||||||||||||||||||
| Net Assets, End of Period (000’s) |
$ | 172,338 | $ | 149,621 | $ | 34,599 | $ | 62,680 | $ | 18,782 | $ | 17,883 | $ | 15,518 | $ | 33,064 | $ | 3,810 | ||||||||||||||||||
| Ratios to average net assets: |
||||||||||||||||||||||||||||||||||||
| Net expenses (a)(c)(d) |
0.81 | % | 0.81 | % | 0.81 | % | 0.81 | % | 1.06 | % | 1.06 | % | 1.06 | % | 1.06 | % | 1.06 | % | ||||||||||||||||||
| Gross expenses (a)(d) |
0.92 | % | 1.05 | % | 1.17 | % | 1.06 | % | 1.17 | % | 1.33 | % | 1.43 | % | 1.46 | % | 5.26 | % | ||||||||||||||||||
| Net investment income (loss) (a)(c)(d) |
0.34 | % | 0.60 | % | 0.43 | % | 0.01 | % | 0.09 | % | 0.46 | % | 0.17 | % | (0.25 | )% | (0.10 | )% | ||||||||||||||||||
| Portfolio turnover rate |
77 | % | 72 | % | 265 | % | 307 | % | 77 | % | 72 | % | 265 | % | 307 | % | 110 | % | ||||||||||||||||||
| * | For the period April 2, 2007 (commencement of operations – Initial Class Shares) through December 31, 2007. |
| ** | For the period May 1, 2006 (commencement of operations – Service Class Shares) through December 31, 2006. |
| † | Based on average shares outstanding during the period. |
| (a) | Annualized for periods of less than one year. |
| (b) | Total returns are historical and assume changes in share price, reinvestments of all dividends and distributions, and no sales charge. Had certain expenses not been reduced during the periods shown, total returns would have been lower. Total returns for periods of less than one year are not annualized. |
| (c) | Such percentage are after advisory fee or unified management fee waivers and expense reimbursements, as applicable. |
| (d) | Does not include any insurance charges imposed in connection with your variable insurance contract. |
| (e) | Amount is less than $0.005 per share. |
285
Table of Contents
| FINANCIAL HIGHLIGHTS (Continued) | ||
| Sun Capital Advisers Trust |
Selected data for a share outstanding throughout each period:
| Sun Capital Global Real Estate Fund Initial Class Shares |
Sun Capital Global Real Estate Fund Service Class Shares |
|||||||||||||||||||||||||||||||||||||||
| Years Ended December 31, | Years Ended December 31, | |||||||||||||||||||||||||||||||||||||||
| 2010 | 2009 | 2008 | 2007 | 2006 | 2010 | 2009 | 2008 | 2007 | 2006 | |||||||||||||||||||||||||||||||
| Net Asset Value, Beginning of Period |
$ | 11.23 | $ | 8.99 | $ | 18.24 | $ | 24.60 | $ | 18.80 | $ | 12.25 | $ | 9.77 | $ | 19.66 | $ | 26.23 | $ | 19.97 | ||||||||||||||||||||
| Income (Loss) from Investment Operations: |
|
|||||||||||||||||||||||||||||||||||||||
| Net investment income (loss) (c) |
0.34 | † | 0.32 | † | 0.18 | 0.66 | 0.81 | 0.34 | † | 0.32 | † | 0.18 | 0.40 | 0.64 | ||||||||||||||||||||||||||
| Net realized and unrealized gain (loss) on |
1.28 | 2.35 | (7.53 | ) | (3.70 | ) | 6.37 | 1.40 | 2.56 | (8.22 | ) | (3.71 | ) | 6.94 | ||||||||||||||||||||||||||
| Total from Investment Operations |
1.62 | 2.67 | (7.35 | ) | (3.04 | ) | 7.18 | 1.74 | 2.88 | (8.04 | ) | (3.31 | ) | 7.58 | ||||||||||||||||||||||||||
| Less Distributions from: |
||||||||||||||||||||||||||||||||||||||||
| Net investment income |
(1.41 | ) | (0.36 | ) | (0.39 | ) | (0.36 | ) | (0.37 | ) | (1.38 | ) | (0.33 | ) | (0.34 | ) | (0.30 | ) | (0.31 | ) | ||||||||||||||||||||
| Net realized gain on investments |
— | (0.07 | ) | (1.51 | ) | (2.96 | ) | (1.01 | ) | — | (0.07 | ) | (1.51 | ) | (2.96 | ) | (1.01 | ) | ||||||||||||||||||||||
| Total distributions |
(1.41 | ) | (0.43 | ) | (1.90 | ) | (3.32 | ) | (1.38 | ) | (1.38 | ) | (0.40 | ) | (1.85 | ) | (3.26 | ) | (1.32 | ) | ||||||||||||||||||||
| Net Asset Value, End of Period |
$ | 11.44 | $ | 11.23 | $ | 8.99 | $ | 18.24 | $ | 24.60 | $ | 12.61 | $ | 12.25 | $ | 9.77 | $ | 19.66 | $ | 26.23 | ||||||||||||||||||||
| Total Return (a) |
15.28 | % | 30.09 | % | (44.73 | )% | (13.13 | )% | 38.96 | % | 14.94 | % | 29.83 | % | (44.89 | )% | (13.34 | )% | 38.64 | % | ||||||||||||||||||||
| Ratios and Supplemental Data: |
||||||||||||||||||||||||||||||||||||||||
| Net Assets, End of Period (000’s) |
$ | 111,981 | $ | 84,988 | $ | 45,841 | $ | 87,441 | $ | 121,197 | $ | 142,500 | $ | 138,929 | $ | 126,838 | $ | 173,065 | $ | 106,954 | ||||||||||||||||||||
| Ratios to average net assets: |
||||||||||||||||||||||||||||||||||||||||
| Net expenses (b)(c) |
1.10 | % | 1.10 | % | 1.10 | % | 1.10 | % | 1.10 | % | 1.35 | % | 1.35 | % | 1.35 | % | 1.35 | % | 1.35 | % | ||||||||||||||||||||
| Gross expenses (c) |
1.11 | % | 1.17 | % | 1.23 | % | 1.18 | % | 1.19 | % | 1.37 | % | 1.43 | % | 1.48 | % | 1.43 | % | 1.44 | % | ||||||||||||||||||||
| Net investment income (loss) (b)(c) |
3.07 | % | 3.52 | % | 1.28 | % | 2.65 | % | 3.08 | % | 2.80 | % | 3.33 | % | 1.15 | % | 2.82 | % | 2.95 | % | ||||||||||||||||||||
| Portfolio turnover rate |
40 | % | 110 | % | 76 | % | 25 | % | 44 | % | 40 | % | 110 | % | 76 | % | 25 | % | 44 | % | ||||||||||||||||||||
| † | Based on average shares outstanding during the period. |
| (a) | Total returns are historical and assume changes in share price, reinvestments of all dividends and distributions, and no sales charge. Had certain expenses not been reduced during the periods shown, total returns would have been lower. |
| (b) | Such percentages are after advisory fee or unified management fee waivers and expense reimbursements, as applicable. |
| (c) | Does not include any insurance charges imposed in connection with your variable insurance contract. |
286
Table of Contents
| FINANCIAL HIGHLIGHTS (Continued) | ||
| Sun Capital Advisers Trust |
Selected data for a share outstanding throughout each period:
| SC Ibbotson Tactical Opportunities Fund |
Sun Capital Investment Grade Bond Fund Initial Class Shares |
Sun Capital Investment Grade Bond Fund Service Class Shares |
||||||||||||||||||||||||||||||||||||||||||
| Year Ended December 31, | Years Ended December 31, | Years Ended December 31, | ||||||||||||||||||||||||||||||||||||||||||
| 2010* | 2010 | 2009 | 2008 | 2007 | 2006 | 2010 | 2009 | 2008 | 2007 | 2006 | ||||||||||||||||||||||||||||||||||
| Net Asset Value, Beginning of Period |
$ | 10.00 | $ | 9.06 | $ | 7.84 | $ | 9.48 | $ | 9.62 | $ | 9.72 | $ | 9.12 | $ | 7.90 | $ | 9.55 | $ | 9.69 | $ | 9.79 | ||||||||||||||||||||||
| Income (Loss) from Investment Operations: |
||||||||||||||||||||||||||||||||||||||||||||
| Net investment income (loss) (d) |
0.09 | † | 0.32 | † | 0.39 | † | 0.51 | 0.49 | 0.50 | 0.30 | † | 0.37 | † | 0.49 | 0.47 | 0.47 | ||||||||||||||||||||||||||||
| Net realized and unrealized gain (loss) on investments |
0.43 | 0.37 | 1.23 | (1.65 | ) | (0.14 | ) | 0.00 | (e) | 0.38 | 1.23 | (1.66 | ) | (0.14 | ) | 0.01 | ||||||||||||||||||||||||||||
| Total from Investment Operations |
0.52 | 0.69 | 1.62 | (1.14 | ) | 0.35 | 0.50 | 0.68 | 1.60 | (1.17 | ) | 0.33 | 0.48 | |||||||||||||||||||||||||||||||
| Less Distributions from: |
||||||||||||||||||||||||||||||||||||||||||||
| Net investment income |
— | (0.33 | ) | (0.39 | ) | (0.50 | ) | (0.49 | ) | (0.47 | ) | (0.31 | ) | (0.37 | ) | (0.48 | ) | (0.47 | ) | (0.45 | ) | |||||||||||||||||||||||
| Net realized gain on investments |
— | (0.03 | ) | (0.01 | ) | — | — | (0.11 | ) | (0.03 | ) | (0.01 | ) | — | — | (0.11 | ) | |||||||||||||||||||||||||||
| Capital |
— | — | — | — | — | (0.02 | ) | — | — | — | — | (0.02 | ) | |||||||||||||||||||||||||||||||
| Total distributions |
— | (0.36 | ) | (0.40 | ) | (0.50 | ) | (0.49 | ) | (0.60 | ) | (0.34 | ) | (0.38 | ) | (0.48 | ) | (0.47 | ) | (0.58 | ) | |||||||||||||||||||||||
| Net Asset Value, End of Period |
$ | 10.52 | $ | 9.39 | $ | 9.06 | $ | 7.84 | $ | 9.48 | $ | 9.62 | $ | 9.46 | $ | 9.12 | $ | 7.90 | $ | 9.55 | $ | 9.69 | ||||||||||||||||||||||
| Total Return (b) |
5.20 | % | 7.67 | % | 21.00 | % | (12.47 | )% | 3.75 | % | 5.39 | % | 7.49 | % | 20.58 | % | (12.67 | )% | 3.51 | % | 5.13 | % | ||||||||||||||||||||||
| Ratios and Supplemental Data: |
||||||||||||||||||||||||||||||||||||||||||||
| Net Assets, End of Period (000’s) |
$ | 455,423 | $ | 245,190 | $ | 136,827 | $ | 35,941 | $ | 40,696 | $ | 45,186 | $ | 127,925 | $ | 64,213 | $ | 21,189 | $ | 25,460 | $ | 9,393 | ||||||||||||||||||||||
| Ratios to average net assets: |
||||||||||||||||||||||||||||||||||||||||||||
| Net expenses (a)(c)(d) |
0.50 | %(f) | 0.73 | % | 0.75 | % | 0.75 | % | 0.75 | % | 0.75 | % | 0.98 | % | 1.00 | % | 1.00 | % | 1.00 | % | 1.00 | % | ||||||||||||||||||||||
| Gross expenses (a)(d) |
0.60 | %(f) | 0.73 | % | 0.84 | % | 1.06 | % | 1.00 | % | 1.06 | % | 0.98 | % | 1.10 | % | 1.31 | % | 1.24 | % | 1.31 | % | ||||||||||||||||||||||
| Net investment income (loss) (a)(c)(d) |
7.56 | %(f) | 3.47 | % | 4.49 | % | 5.70 | % | 5.10 | % | 5.14 | % | 3.22 | % | 4.25 | % | 5.45 | % | 4.89 | % | 5.06 | % | ||||||||||||||||||||||
| Portfolio turnover rate |
17 | %(g) | 90 | % | 99 | % | 30 | % | 46 | % | 55 | % | 90 | % | 99 | % | 30 | % | 46 | % | 55 | % | ||||||||||||||||||||||
| * | For the period November 15, 2010 (commencement of operations) to December 31, 2010. |
| † | Based on average shares outstanding during the period. |
| (a) | Annualized for periods of less than one year. |
| (b) | Total returns are historical and assume changes in share price, reinvestments of all dividends and distributions, and no sales charge. Had certain expenses not been reduced during the periods shown, total returns would have been lower. Total returns for periods of less than one year are not annualized. |
| (c) | Such percentages are after advisory fee or unified management fee waivers and expense reimbursements, as applicable. |
| (d) | Does not include any insurance charges imposed in connection with your variable insurance contract. |
| (e) | Amount is less than $0.005 per share. |
| (f) | Does not include expenses of the underlying funds in which the Fund invests. |
| (g) | Does not include the portfolio turnover activity of the underlying funds in which the Fund invests. |
287
Table of Contents
| FINANCIAL HIGHLIGHTS (Continued) | ||
| Sun Capital Advisers Trust |
Selected data for a share outstanding throughout each period:
| Sun Capital Money Market Fund Initial Class Shares |
Sun Capital Money Market Fund Service Class Shares |
|||||||||||||||||||||||||||||||||||||||
| Years Ended December 31, | Years Ended December 31, | |||||||||||||||||||||||||||||||||||||||
| 2010 | 2009 | 2008 | 2007 | 2006 | 2010 | 2009 | 2008 | 2007 | 2006 | |||||||||||||||||||||||||||||||
| Net Asset Value, Beginning of Period |
$ | 1.00 | $ | 1.00 | $ | 1.00 | $ | 1.00 | $ | 1.00 | $ | 1.00 | $ | 1.00 | $ | 1.00 | $ | 1.00 | $ | 1.00 | ||||||||||||||||||||
| Income (Loss) from Investment Operations: |
||||||||||||||||||||||||||||||||||||||||
| Net investment income (loss) (c) |
0.00 | (d)† | 0.00 | (d)† | 0.02 | 0.05 | 0.05 | 0.00 | (d)† | 0.00 | (d)† | 0.02 | 0.05 | 0.04 | ||||||||||||||||||||||||||
| Net realized and unrealized gain (loss) on |
0.00 | (d) | 0.00 | (d) | 0.00 | (d) | 0.00 | (d) | — | 0.00 | (d) | 0.00 | (d) | 0.00 | (d) | — | — | |||||||||||||||||||||||
| Total from Investment Operations |
0.00 | (d) | 0.00 | (d) | 0.02 | 0.05 | 0.05 | 0.00 | (d) | 0.00 | (d) | 0.02 | 0.05 | 0.04 | ||||||||||||||||||||||||||
| Less Distributions from: |
||||||||||||||||||||||||||||||||||||||||
| Net investment income |
0.00 | (d) | (0.00 | )(d) | (0.02 | ) | (0.05 | ) | (0.05 | ) | — | (0.00 | )(d) | (0.02 | ) | (0.05 | ) | (0.04 | ) | |||||||||||||||||||||
| Total distributions |
0.00 | (d) | (0.00 | )(d) | (0.02 | ) | (0.05 | ) | (0.05 | ) | — | (0.00 | )(d) | (0.02 | ) | (0.05 | ) | (0.04 | ) | |||||||||||||||||||||
| Net Asset Value, End of Period |
$ | 1.00 | $ | 1.00 | $ | 1.00 | $ | 1.00 | $ | 1.00 | $ | 1.00 | $ | 1.00 | $ | 1.00 | $ | 1.00 | $ | 1.00 | ||||||||||||||||||||
| Total Return (a) |
0.19 | % | 0.25 | % | 2.25 | % | 4.87 | % | 4.59 | % | 0.00 | % | 0.02 | % | 2.00 | % | 4.61 | % | 4.33 | % | ||||||||||||||||||||
| Ratios and Supplemental Data: |
||||||||||||||||||||||||||||||||||||||||
| Net Assets, End of Period (000’s) |
$ | 67,785 | $ | 88,013 | $ | 150,416 | $ | 129,112 | $ | 120,164 | $ | 118,701 | $ | 116,282 | $ | 54,108 | $ | 1,740 | $ | 1,274 | ||||||||||||||||||||
| Ratios to average net assets: |
||||||||||||||||||||||||||||||||||||||||
| Net expenses (b)(c) |
0.03 | % | 0.20 | % | 0.50 | % | 0.50 | % | 0.50 | % | 0.22 | % | 0.38 | % | 0.75 | % | 0.75 | % | 0.75 | % | ||||||||||||||||||||
| Gross expenses (c) |
0.66 | % | 0.72 | % | 0.81 | % | 0.76 | % | 0.77 | % | 0.91 | % | 0.94 | % | 1.10 | % | 1.00 | % | 1.02 | % | ||||||||||||||||||||
| Net investment income (loss) (b)(c) |
0.19 | % | 0.25 | % | 2.19 | % | 4.76 | % | 4.51 | % | 0.00 | % | 0.01 | % | 1.34 | % | 4.50 | % | 4.31 | % | ||||||||||||||||||||
| Portfolio turnover rate |
N/A | N/A | N/A | N/A | N/A | N/A | N/A | N/A | N/A | N/A | ||||||||||||||||||||||||||||||
| † | Based on average shares outstanding during the period. |
| (a) | Total returns are historical and assume changes in share price, reinvestments of all dividends and distributions, and no sales charge. Had certain expenses not been reduced during the periods shown, total returns would have been lower. |
| (b) | Such percentages are after advisory fee or unified management fee waivers and expense reimbursements, as applicable. |
| (c) | Does not include any insurance charges imposed in connection with your variable insurance contract. |
| (d) | Amount is less than $0.005 per share. |
288
Table of Contents
| FINANCIAL HIGHLIGHTS (Continued) | ||
| Sun Capital Advisers Trust |
Selected data for a share outstanding throughout each period:
| SC BlackRock Inflation Protected Bond Fund Initial Class Shares |
SC
BlackRock Inflation Protected Bond Fund Service Class Shares |
SC Goldman Sachs Short Duration Fund Initial Class Shares |
SC Goldman Sachs Short Duration Fund Service Class Shares |
|||||||||||||||||||||||||||||||||||||||||||||
| Years Ended December 31, | Years Ended December 31, | Years Ended December 31, | Years Ended December 31, | |||||||||||||||||||||||||||||||||||||||||||||
| 2010 | 2009 | 2008* | 2010 | 2009 | 2008* | 2010 | 2009 | 2008** | 2010 | 2009 | 2008** | |||||||||||||||||||||||||||||||||||||
| Net Asset Value, Beginning of Period |
$ | 10.34 | $ | 9.87 | $ | 10.00 | $ | 10.32 | $ | 9.87 | $ | 10.00 | $ | 10.23 | $ | 10.13 | $ | 10.00 | $ | 10.23 | $ | 10.13 | $ | 10.00 | ||||||||||||||||||||||||
| Income (Loss) from Investment Operations: |
||||||||||||||||||||||||||||||||||||||||||||||||
| Net investment income (loss) (e) |
0.14 | † | 0.24 | † | (0.05 | ) | 0.12 | † | 0.21 | † | (0.06 | ) | 0.14 | † | 0.19 | † | 0.16 | 0.11 | † | 0.17 | † | 0.14 | ||||||||||||||||||||||||||
| Net realized and unrealized gain (loss) on investments |
0.40 | 0.61 | (0.05 | )(c) | 0.38 | 0.60 | (0.04 | )(c) | 0.11 | 0.19 | 0.16 | 0.11 | 0.18 | 0.16 | ||||||||||||||||||||||||||||||||||
| Total from Investment Operations |
0.54 | 0.85 | (0.10 | ) | 0.50 | 0.81 | (0.10 | ) | 0.25 | 0.38 | 0.32 | 0.22 | 0.35 | 0.30 | ||||||||||||||||||||||||||||||||||
| Less Distributions from: |
||||||||||||||||||||||||||||||||||||||||||||||||
| Net investment income |
(0.14 | ) | (0.22 | ) | (0.03 | ) | (0.11 | ) | (0.20 | ) | (0.03 | ) | (0.16 | ) | (0.21 | ) | (0.16 | ) | (0.13 | ) | (0.18 | ) | (0.14 | ) | ||||||||||||||||||||||||
| Net realized gain on investments |
(0.10 | ) | (0.16 | ) | — | (0.10 | ) | (0.16 | ) | — | (0.01 | ) | (0.07 | ) | (0.03 | ) | (0.01 | ) | (0.07 | ) | (0.03 | ) | ||||||||||||||||||||||||||
| Total distributions |
(0.24 | ) | (0.38 | ) | (0.03 | ) | (0.21 | ) | (0.36 | ) | (0.03 | ) | (0.17 | ) | (0.28 | ) | (0.19 | ) | (0.14 | ) | (0.25 | ) | (0.17 | ) | ||||||||||||||||||||||||
| Net Asset Value, End of Period |
$ | 10.64 | $ | 10.34 | $ | 9.87 | $ | 10.61 | $ | 10.32 | $ | 9.87 | $ | 10.31 | $ | 10.23 | $ | 10.13 | $ | 10.31 | $ | 10.23 | $ | 10.13 | ||||||||||||||||||||||||
| Total Return (b) |
5.24 | % | 8.72 | % | (0.95 | )% | 4.91 | % | 8.34 | % | (0.96 | )% | 2.41 | % | 3.78 | % | 3.22 | % | 2.16 | % | 3.52 | % | 3.00 | % | ||||||||||||||||||||||||
| Ratios and Supplemental Data: |
||||||||||||||||||||||||||||||||||||||||||||||||
| Net Assets, End of Period (000’s) |
$ | 217,591 | $ | 106,264 | $ | 8,311 | $ | 161,359 | $ | 78,839 | $ | 4,276 | $ | 1,004,464 | $ | 869,648 | $ | 54,602 | $ | 149,752 | $ | 107,329 | $ | 63,422 | ||||||||||||||||||||||||
| Ratio to average net assets: |
||||||||||||||||||||||||||||||||||||||||||||||||
| Net expenses (a)(d)(e) |
0.65 | % | 0.65 | % | 0.65 | % | 0.90 | % | 0.90 | % | 0.90 | % | 0.65 | % | 0.65 | % | 0.65 | % | 0.90 | % | 0.90 | % | 0.90 | % | ||||||||||||||||||||||||
| Gross expenses (a)(e) |
0.66 | % | 0.66 | % | 0.68 | % | 0.91 | % | 0.91 | % | 0.93 | % | 0.65 | % | 0.65 | % | 0.68 | % | 0.90 | % | 0.90 | % | 0.92 | % | ||||||||||||||||||||||||
| Net investment income (loss) (a)(d)(e) |
1.34 | % | 2.33 | % | (4.63 | )% | 1.09 | % | 2.07 | % | (4.60 | )% | 1.32 | % | 1.82 | % | 2.34 | % | 1.05 | % | 1.66 | % | 1.95 | % | ||||||||||||||||||||||||
| Portfolio turnover rate |
388 | % | 278 | % | 85 | % | 388 | % | 278 | % | 85 | % | 122 | % | 231 | % | 333 | % | 122 | % | 231 | % | 333 | % | ||||||||||||||||||||||||
| * | For the period October 1, 2008 (commencement of operations) to December 31, 2008. |
| ** | For the period March 7, 2008 (commencement of operations) to December 31, 2008. |
| † | Based on average shares outstanding during the period. |
| (a) | Annualized for periods of less than one year. |
| (b) | Total returns are historical and assume changes in share price, reinvestments of all dividends and distributions, and no sales charge. Had certain expenses not been reduced during the periods shown, total returns would have been lower. Total returns for periods of less than one year are not annualized. |
| (c) | The amount shown for a share outstanding does not correspond with the net realized and unrealized gain (loss) on investments for the period due to timing of sales and repurchases of Fund shares in relation to fluctuating market values of the investments of the fund. |
| (d) | Such percentages are after advisory fee or unified management fee waivers and expense reimbursements, as applicable. |
| (e) | Does not include any insurance charges imposed in connection with your variable insurance contract. |
289
Table of Contents
| FINANCIAL HIGHLIGHTS (Continued) | ||
| Sun Capital Advisers Trust |
Selected data for a share outstanding throughout each period:
| SC PIMCO High Yield Fund Initial Class Shares |
SC PIMCO High Yield Fund Service Class Shares |
SC PIMCO Total Return Fund Initial Class Shares |
SC PIMCO Total Return Fund Service Class Shares |
|||||||||||||||||||||||||||||||||||||||||||||
| Years Ended December 31, | Years Ended December 31, | Years Ended December 31, | Years Ended December 31, | |||||||||||||||||||||||||||||||||||||||||||||
| 2010 | 2009 | 2008* | 2010 | 2009 | 2008* | 2010 | 2009 | 2008** | 2010 | 2009 | 2008** | |||||||||||||||||||||||||||||||||||||
| Net Asset Value, Beginning of Period |
$ | 9.46 | $ | 8.07 | $ | 10.00 | $ | 9.46 | $ | 8.07 | $ | 10.00 | $ | 11.04 | $ | 10.55 | $ | 10.00 | $ | 11.04 | $ | 10.55 | $ | 10.00 | ||||||||||||||||||||||||
| Income (Loss) from Investment Operations: |
||||||||||||||||||||||||||||||||||||||||||||||||
| Net investment income (loss) (d) |
0.72 | † | 0.75 | † | 0.53 | 0.70 | † | 0.72 | † | 0.51 | 0.22 | † | 0.27 | † | 0.03 | 0.19 | † | 0.24 | † | 0.02 | ||||||||||||||||||||||||||||
| Net realized and unrealized gain (loss) on investments |
0.44 | 1.62 | (1.85 | ) | 0.43 | 1.62 | (1.85 | ) | 0.61 | 0.65 | 0.55 | 0.61 | 0.65 | 0.55 | ||||||||||||||||||||||||||||||||||
| Total from Investment Operations |
1.16 | 2.37 | (1.32 | ) | 1.13 | 2.34 | (1.34 | ) | 0.83 | 0.92 | 0.58 | 0.80 | 0.89 | 0.57 | ||||||||||||||||||||||||||||||||||
| Less Distributions from: |
||||||||||||||||||||||||||||||||||||||||||||||||
| Net investment income |
(0.72 | ) | (0.74 | ) | (0.55 | ) | (0.69 | ) | (0.71 | ) | (0.53 | ) | (0.25 | ) | (0.29 | ) | (0.03 | ) | (0.22 | ) | (0.26 | ) | (0.02 | ) | ||||||||||||||||||||||||
| Net realized gain on investments |
(0.07 | ) | (0.24 | ) | (0.06 | ) | (0.07 | ) | (0.24 | ) | (0.06 | ) | (0.04 | ) | (0.14 | ) | (0.00 | )(e) | (0.04 | ) | (0.14 | ) | (0.00 | )(e) | ||||||||||||||||||||||||
| Total distributions |
(0.79 | ) | (0.98 | ) | (0.61 | ) | (0.76 | ) | (0.95 | ) | (0.59 | ) | (0.29 | ) | (0.43 | ) | (0.03 | ) | (0.26 | ) | (0.40 | ) | (0.02 | ) | ||||||||||||||||||||||||
| Net Asset Value, End of Period |
$ | 9.83 | $ | 9.46 | $ | 8.07 | $ | 9.83 | $ | 9.46 | $ | 8.07 | $ | 11.58 | $ | 11.04 | $ | 10.55 | $ | 11.58 | $ | 11.04 | $ | 10.55 | ||||||||||||||||||||||||
| Total Return (b) |
12.68 | % | 30.67 | % | (13.74 | )% | 12.40 | % | 30.34 | % | (13.92 | )% | 7.53 | % | 8.89 | % | 5.82 | % | 7.27 | % | 8.62 | % | 5.76 | % | ||||||||||||||||||||||||
| Ratios and Supplemental Data: |
||||||||||||||||||||||||||||||||||||||||||||||||
| Net Assets, End of Period (000’s) |
$ | 140,327 | $ | 92,422 | $ | 3,134 | $ | 32,225 | $ | 24,680 | $ | 12,300 | $ | 273,150 | $ | 144,812 | $ | 13,823 | $ | 483,257 | $ | 243,743 | $ | 18,397 | ||||||||||||||||||||||||
| Ratio to average net assets: |
||||||||||||||||||||||||||||||||||||||||||||||||
| Net expenses (a)(c)(d) |
0.75 | % | 0.75 | % | 0.75 | % | 1.00 | % | 1.00 | % | 1.00 | % | 0.65 | % | 0.65 | % | 0.65 | % | 0.90 | % | 0.90 | % | 0.90 | % | ||||||||||||||||||||||||
| Gross expenses (a)(d) |
0.75 | % | 0.75 | % | 0.77 | % | 1.00 | % | 1.00 | % | 1.03 | % | 0.66 | % | 0.66 | % | 0.68 | % | 0.91 | % | 0.91 | % | 0.93 | % | ||||||||||||||||||||||||
| Net investment income (loss) (a)(c)(d) |
7.42 | % | 8.45 | % | 6.74 | % | 7.19 | % | 8.19 | % | 7.18 | % | 1.93 | % | 2.44 | % | 1.19 | % | 1.67 | % | 2.15 | % | 0.97 | % | ||||||||||||||||||||||||
| Portfolio turnover rate |
28 | % | 190 | % | 75 | % | 28 | % | 190 | % | 75 | % | 493 | % | 496 | % | 181 | % | 493 | % | 496 | % | 181 | % | ||||||||||||||||||||||||
| * | For the period March 7, 2008 (commencement of operations) to December 31, 2008. |
| ** | For the period October 1, 2008 (commencement of operations) to December 31, 2008. |
| † | Based on average shares outstanding during the period. |
| (a) | Annualized for periods of less than one year. |
| (b) | Total returns are historical and assume changes in share price, reinvestments of all dividends and distributions, and no sales charge. Had certain expenses not been reduced during the periods shown, total returns would have been lower. Total returns for periods of less than one year are not annualized. |
| (c) | Such percentages are after advisory fee or unified management fee waivers and expense reimbursements, as applicable. |
| (d) | Does not include any insurance charges imposed in connection with your variable insurance contract. |
| (e) | Amount is less than $0.005 per share. |
290
Table of Contents
| FINANCIAL HIGHLIGHTS (Continued) | ||
| Sun Capital Advisers Trust |
Selected data for a share outstanding throughout each period:
| SC Ibbotson Balanced Fund Initial Class Shares |
SC Ibbotson Balanced Fund Service Class Shares |
SC Ibbotson Conservative Fund Initial Class Shares |
SC Ibbotson Conservative Fund Service Class Shares |
|||||||||||||||||||||||||||||||||||||||||||||
| Years Ended December 31, | Years Ended December 31, | Years Ended December 31, | Years Ended December 31, | |||||||||||||||||||||||||||||||||||||||||||||
| 2010 | 2009 | 2008* | 2010 | 2009 | 2008* | 2010 | 2009 | 2008* | 2010 | 2009 | 2008* | |||||||||||||||||||||||||||||||||||||
| Net Asset Value, Beginning of Period |
$ | 11.21 | $ | 9.07 | $ | 10.00 | $ | 11.20 | $ | 9.06 | $ | 10.00 | $ | 10.94 | $ | 9.19 | $ | 10.00 | $ | 10.94 | $ | 9.18 | $ | 10.00 | ||||||||||||||||||||||||
| Income (Loss) from Investment Operations: |
||||||||||||||||||||||||||||||||||||||||||||||||
| Net investment income (loss) (e) |
0.20 | † | 0.20 | † | 0.02 | 0.15 | † | 0.17 | † | 0.01 | 0.14 | † | 0.33 | † | 0.03 | 0.13 | † | 0.20 | † | 0.02 | ||||||||||||||||||||||||||||
| Net realized and unrealized gain (loss) on investments |
1.15 | 1.97 | (0.95 | )(c) | 1.16 | 1.97 | (0.95 | )(c) | 0.94 | 1.45 | (0.84 | )(c) | 0.92 | 1.56 | (0.84 | )(c) | ||||||||||||||||||||||||||||||||
| Total from Investment Operations |
1.35 | 2.17 | (0.93 | ) | 1.31 | 2.14 | (0.94 | ) | 1.08 | 1.78 | (0.81 | ) | 1.05 | 1.76 | (0.82 | ) | ||||||||||||||||||||||||||||||||
| Less Distributions from: |
||||||||||||||||||||||||||||||||||||||||||||||||
| Net investment income |
(0.13 | ) | (0.03 | ) | — | (0.10 | ) | (0.00 | )(h) | — | (0.16 | ) | (0.03 | ) | — | (0.13 | ) | (0.00 | )(h) | — | ||||||||||||||||||||||||||||
| Net realized gain on investments |
(0.06 | ) | (0.00 | )(h) | — | (0.06 | ) | (0.00 | )(h) | — | (0.07 | ) | (0.00 | )(h) | — | (0.07 | ) | (0.00 | )(h) | — | ||||||||||||||||||||||||||||
| Total distributions |
(0.19 | ) | (0.03 | ) | — | (0.16 | ) | (0.00 | )(h) | — | (0.23 | ) | (0.03 | ) | — | (0.20 | ) | (0.00 | )(h) | — | ||||||||||||||||||||||||||||
| Net Asset Value, End of Period |
$ | 12.37 | $ | 11.21 | $ | 9.07 | $ | 12.35 | $ | 11.20 | $ | 9.06 | $ | 11.79 | $ | 10.94 | $ | 9.19 | $ | 11.79 | $ | 10.94 | $ | 9.18 | ||||||||||||||||||||||||
| Total Return (b) |
12.18 | % | 23.91 | % | (9.30 | )% | 11.82 | % | 23.65 | % | (9.40 | )% | 9.92 | % | 19.37 | % | (8.10 | )% | 9.64 | % | 19.22 | % | (8.20 | )% | ||||||||||||||||||||||||
| Ratios and Supplemental Data: |
||||||||||||||||||||||||||||||||||||||||||||||||
| Net Assets, End of Period (000’s) |
$ | 1,687 | $ | 442 | $ | 56 | $ | 1,444,241 | $ | 566,276 | $ | 38,747 | $ | 5,053 | $ | 1,708 | $ | 46 | $ | 756,690 | $ | 364,790 | $ | 33,974 | ||||||||||||||||||||||||
| Ratio to average net assets: |
||||||||||||||||||||||||||||||||||||||||||||||||
| Net expenses (a)(d)(e)(f) |
0.20 | % | 0.20 | % | 0.20 | % | 0.45 | % | 0.45 | % | 0.45 | % | 0.20 | % | 0.20 | % | 0.20 | % | 0.45 | % | 0.45 | % | 0.45 | % | ||||||||||||||||||||||||
| Gross expenses (a)(e)(f) |
0.21 | % | 0.28 | % | 16.72 | % | 0.46 | % | 0.52 | % | 2.11 | % | 0.21 | % | 0.26 | % | 17.09 | % | 0.47 | % | 0.53 | % | 2.12 | % | ||||||||||||||||||||||||
| Net investment income (loss) (a)(d)(e)(f) |
1.75 | % | 1.95 | % | 0.88 | % | 1.30 | % | 1.69 | % | 1.82 | % | 1.27 | % | 3.15 | % | 1.15 | % | 1.18 | % | 2.01 | % | 2.22 | % | ||||||||||||||||||||||||
| Portfolio turnover rate (g) |
27 | % | 14 | % | 0 | % | 27 | % | 14 | % | 0 | % | 16 | % | 12 | % | 1 | % | 16 | % | 12 | % | 1 | % | ||||||||||||||||||||||||
| * | For the period October 1, 2008 (commencement of operations) to December 31, 2008. |
| † | Based on average shares outstanding during the period. |
| (a) | Annualized for periods of less than one year. |
| (b) | Total returns are historical and assume changes in share price, reinvestments of all dividends and distributions, and no sales charge. Had certain expenses not been reduced during the periods shown, total returns would have been lower. Total returns for periods of less than one year are not annualized. |
| (c) | The amount shown for a share outstanding does not correspond with the net realized and unrealized gain (loss) on investments for the period due to timing of sales and repurchases of Fund shares in relation to fluctuating market values of the investments of the fund. |
| (d) | Such percentages are after advisory fee or unified management fee waivers and expense reimbursements, as applicable. |
| (e) | Does not include any insurance charges imposed in connection with your variable insurance contract. |
| (f) | Does not include expenses of the underlying funds in which the Fund invests. |
| (g) | Does not include the portfolio turnover activity of the underlying funds in which the Fund invests. |
| (h) | Amount is less than $0.005. |
291
Table of Contents
| FINANCIAL HIGHLIGHTS (Continued) | ||
| Sun Capital Advisers Trust |
Selected data for a share outstanding throughout each period:
| SC Ibbotson Growth Fund Initial Class Shares |
SC Ibbotson Growth Fund Service Class Shares |
|||||||||||||||||||||||
| Years Ended December 31, | Years Ended December 31, | |||||||||||||||||||||||
| 2010 | 2009 | 2008* | 2010 | 2009 | 2008* | |||||||||||||||||||
| Net Asset Value, Beginning of Period |
$ | 11.25 | $ | 8.87 | $ | 10.00 | $ | 11.24 | $ | 8.87 | $ | 10.00 | ||||||||||||
| Income (Loss) from Investment Operations: |
||||||||||||||||||||||||
| Net investment income (loss) (e) |
0.18 | † | 0.06 | † | 0.02 | 0.12 | † | 0.12 | † | 0.01 | ||||||||||||||
| Net realized and unrealized gain (loss) on |
1.34 | 2.35 | (1.15 | )(c) | 1.38 | 2.25 | (1.14 | )(c) | ||||||||||||||||
| Total from Investment Operations |
1.52 | 2.41 | (1.13 | ) | 1.50 | 2.37 | (1.13 | ) | ||||||||||||||||
| Less Distributions from: |
||||||||||||||||||||||||
| Net investment income |
(0.18 | ) | (0.03 | ) | — | (0.15 | ) | (0.00 | )(h) | — | ||||||||||||||
| Net realized gain on investments |
(0.12 | ) | (0.00 | )(h) | — | (0.12 | ) | (0.00 | )(h) | — | ||||||||||||||
| Total distributions |
(0.30 | ) | (0.03 | ) | — | (0.27 | ) | (0.00 | )(h) | — | ||||||||||||||
| Net Asset Value, End of Period |
$ | 12.47 | $ | 11.25 | $ | 8.87 | $ | 12.47 | $ | 11.24 | $ | 8.87 | ||||||||||||
| Total Return (b) |
13.80 | % | 27.17 | % | (11.30 | )% | 13.61 | % | 26.75 | % | (11.30 | )% | ||||||||||||
| Ratios and Supplemental Data: |
||||||||||||||||||||||||
| Net Assets, End of Period (000’s) |
$ | 1,616 | $ | 292 | $ | 92 | $ | 588,923 | $ | 448,441 | $ | 33,191 | ||||||||||||
| Ratio to average net assets: |
||||||||||||||||||||||||
| Net expenses (a)(d)(e)(f) |
0.20 | % | 0.20 | % | 0.20 | % | 0.45 | % | 0.45 | % | 0.45 | % | ||||||||||||
| Gross expenses (a)(e)(f) |
0.22 | % | 0.30 | % | 14.32 | % | 0.47 | % | 0.53 | % | 2.08 | % | ||||||||||||
| Net investment income (loss) (a)(d)(e)(f) |
1.54 | % | 0.61 | % | 1.20 | % | 1.03 | % | 1.18 | % | 1.53 | % | ||||||||||||
| Portfolio turnover rate (g) |
38 | % | 16 | % | 7 | % | 38 | % | 16 | % | 7 | % | ||||||||||||
| * | For the period October 1, 2008 (commencement of operations) to December 31, 2008. |
| † | Based on average shares outstanding during the period. |
| (a) | Annualized for periods of less than one year. |
| (b) | Total returns are historical and assume changes in share price, reinvestments of all dividends and distributions, and no sales charge. Had certain expenses not been reduced during the periods shown, total returns would have been lower. Total returns for periods of less than one year are not annualized. |
| (c) | The amount shown for a share outstanding does not correspond with the net realized and unrealized gain (loss) on investments for the period due to timing of sales and repurchases of Fund shares in relation to fluctuating market values of the investments of the fund. |
| (d) | Such percentages are after advisory fee or unified management fee waivers and expense reimbursements, as applicable. |
| (e) | Does not include any insurance charges imposed in connection with your variable insurance contract. |
| (f) | Does not include expenses of the underlying funds in which the Fund invests. |
| (g) | Does not include the portfolio turnover activity of the underlying funds in which the Fund invests. |
| (h) | Amount is less than $0.005. |
292
Table of Contents
| NOTES TO FINANCIAL STATEMENTS | Sun Capital Advisers Trust |
1. ORGANIZATION
Sun Capital Advisers Trust (the “Trust”) is registered under the Investment Company Act of 1940, as amended (the “1940 Act”) as an open-end management investment company. The Trust was established as a Delaware statutory trust under the laws of Delaware by an Agreement and Declaration of Trust dated July 13, 1998. It currently consists of twenty two funds (each referred to as a “Fund” and, collectively, as “the Funds”). Three of the Funds, SC Ibbotson Balanced Fund, SC Ibbotson Conservative Fund and SC Ibbotson Growth Fund, are affiliated “Fund-of-Funds”, which invest in other Funds of the Trust and in other mutual funds managed by MFS, an affiliate of the investment adviser to each Fund of the Trust, Sun Capital Advisers LLC (“Sun Capital”). The three Fund-of-Funds and each of the other Funds other than SC Ibbotson Tactical Opportunities Fund are offered to variable annuity and variable life insurance separate accounts established by affiliated insurance companies to fund variable annuity contracts and variable life insurance policies. SC Ibbotson Tactical Opportunities Fund, a Fund-of-exchange traded funds, is not available for investment by contract holders but serves exclusively as an investment option designed to implement a tactical strategy for the three Fund-of-Funds.
Each of the Funds is an open-end mutual fund under the 1940 Act. Each is classified as a diversified mutual fund except for the Sun Capital Global Real Estate Fund and SC BlackRock Inflation Protected Bond Fund, which are classified as non-diversified mutual funds. Each Fund, except for SC Ibbotson Tactical Opportunities Fund, offers Initial Class Shares and Service Class Shares. SC Ibbotson Tactical Opportunities Fund offers only Initial Class Shares. The Funds are:
SC AllianceBernstein International Value Fund (“AllianceBernstein International Value Fund”)
SC BlackRock International Index Fund (“BlackRock International Index Fund”)*
SC BlackRock Large Cap Index Fund (“BlackRock Large Cap Index Fund”)**,
formerly known as SC Oppenheimer Large Cap Core Fund
SC BlackRock Small Cap Index Fund (“BlackRock Small Cap Index Fund”)**,
formerly known as SC Oppenheimer Main Street Small Cap Fund
SC Goldman Sachs Mid Cap Value Fund (“Goldman Sachs Mid Cap Value Fund”)
SC Columbia Small Cap Value Fund (“Columbia Small Cap Value Fund”)
formerly known as SC Dreman Small Cap Value Fund
SC Davis Venture Value Fund (“Davis Venture Value Fund”)
SC Invesco Small Cap Growth Fund (“Invesco Small Cap Growth Fund”)
formerly known as SC AIM Small Cap Growth Fund
SC Lord Abbett Growth & Income Fund (“Lord Abbett Growth & Income Fund”)
SC WMC Blue Chip Mid Cap Fund (“WMC Blue Chip Mid Cap Fund”)
SC WMC Large Cap Growth Fund (“WMC Large Cap Growth Fund”)
Sun Capital Global Real Estate Fund (“Global Real Estate Fund”)
SC Ibbotson Tactical Opportunities Fund (“Ibbotson Tactical Opportunities Fund”)*
Sun Capital Investment Grade Bond Fund (“Investment Grade Bond Fund”)
Sun Capital Money Market Fund (“Money Market Fund”)
SC BlackRock Inflation Protected Bond Fund (“BlackRock Inflation Protected Bond Fund”)
SC Goldman Sachs Short Duration Fund (“Goldman Sachs Short Duration Fund”)
SC PIMCO High Yield Fund (“PIMCO High Yield Fund”)
SC PIMCO Total Return Fund (“PIMCO Total Return Fund”)
SC Ibbotson Balanced Fund (“Ibbotson Balanced Fund”)
SC Ibbotson Conservative Fund (“Ibbotson Conservative Fund”),
formerly known as SC Ibbotson Moderate Fund
SC Ibbotson Growth Fund (“Ibbotson Growth Fund”)
| * | The BlackRock International Index Fund and Ibbotson Tactical Opportunities Fund commenced operations on November 15, 2010. |
293
Table of Contents
| NOTES TO FINANCIAL STATEMENTS (Continued) | Sun Capital Advisers Trust |
| ** | On November 15, 2010, BlackRock Investment Management, LLC replaced OppenheimerFunds, Inc. as subadviser to the SC Oppenheimer Large Cap Core Fund and SC Oppenheimer Main Street Small Cap Fund. The Funds were renamed SC BlackRock Large Cap Index Fund and SC BlackRock Small Cap Index Fund, respectively. In connection with these changes, each of the Funds changed its investment goal and investment strategy from an active to a passive management approach, and will attempt to invest in a portfolio of assets whose performance is expected to match approximately the performance of the Standard & Poor’s 500 Index and the Russell 2000 Index, respectively. |
Each Fund-of-Funds seeks to achieve its objective by investing in a portfolio of underlying affiliated funds (“underlying funds”) which, in turn, may invest in a variety of U.S. and foreign equity, fixed income, money market and derivative instruments. The Funds-of-Funds do not invest in the underlying funds for the purpose of exercising management or control; however, investments by the Funds-of-Funds, within their principal investment strategies, may represent a significant portion of the underlying funds’ net assets. Each Fund-of-Funds’ “Portfolio of Investments” lists the underlying funds held as an investment of the Fund-of-Funds as of period end, but does not include the holdings of the underlying funds. A complete list of the holdings of each underlying fund, as well as the financial statements of each underlying fund, each as of December 31, 2010, are available at the SEC’s website at www.sec.gov if not already provided in this report under the name of the underlying fund.
2. SIGNIFICANT ACCOUNTING POLICIES
The preparation of financial statements in conformity with accounting principles generally accepted in the United States of America (“U.S. GAAP”) requires management to make estimates and assumptions that affect the reported amounts of assets and liabilities and disclosure of contingent assets and liabilities at the date of the financial statements and the reported amounts of revenues and expenses during the reporting period. Actual results could differ from those estimates.
The following is a summary of significant accounting policies followed by the Trust in the preparation of its financial statements:
a) Determination of Net Asset Value
The net asset value per share (“NAV”) of each Fund is determined as of the close of regular trading on the New York Stock Exchange (normally 4:00 p.m. New York time) on each day the New York Stock Exchange is open for business (a valuation day). If the New York Stock Exchange closes early for any reason, each Fund will accelerate the determination of its NAV to that earlier time.
b) Valuation of Investments
Valuation techniques of the Funds’ major categories of assets and liabilities are as follows:
Investments in securities and option contracts listed on the National Association of Securities Dealers Automation Quotation System (“NASDAQ”) are valued at the NASDAQ Official Closing Price on the day of valuation. Securities and option contracts listed on any other U.S. or foreign exchanges are valued at the last sale price on the exchange or system in which they are principally traded on the valuation date, or if no sales occurred on that day, at the mean between the closing bid and asked prices. Over-the-counter (OTC) equity securities not quoted on the NASDAQ are valued at the last sale price on the valuation day, or, if no sale occurs, at the mean between the last bid and asked prices. If both bid and asked prices are not available on the valuation day, the last bid price is used to value securities and purchased option contracts and the last asked price is used to value written option contracts. Debt securities are valued by a dealer or by a pricing service based upon a computerized matrix system, which considers market transactions and dealer supplied valuations. The fair value of corporate bonds is estimated using various techniques, which may consider recently executed transactions in securities of the issuer or comparable issuers, market price quotations (where observable), bond spreads, fundamental data relating to the issuer, and adjusted credit default swap spreads. The fair value of asset backed and mortgage backed securities is estimated using models that consider the future cash flows of each tranche of the entity, establish a benchmark yield, and develop an estimated tranche specific spread to the benchmark yield based on
294
Table of Contents
| NOTES TO FINANCIAL STATEMENTS (Continued) | Sun Capital Advisers Trust |
the unique attributes of the tranche. U.S. Government and agency securities are normally valued using a model that incorporates market observable data, such as reported sales of similar securities, broker quotes, yields, bids, offers and reference data. Short-term securities maturing in 60 days or less are valued at amortized cost, which approximates market value. Investments in open end mutual funds and underlying funds are valued at their daily closing net asset value per share as reported by the investment company. Securities for which current market quotations are not readily available or are considered unreliable are stated at fair value as determined in good faith by an Internal Pricing Committee under the oversight of the Board of Trustees.
The close of foreign exchanges before the determination of each Fund’s NAV gives rise to the possibility that significant events, including broad market moves, may have occurred after these foreign exchanges close but before the Funds determine their NAVs. In consideration of this, the Board of Trustees has approved an independent pricing vendor to facilitate the fair value process of equity securities traded on particular foreign exchanges. The independent pricing service considers the correlation of the trading patterns of the foreign security to the intraday trading in the U.S. markets for investments such as American Depositary Receipts, futures, exchange-traded funds, and the movements of certain indexes of securities based on a statistical analysis of the historical relationship. The frequency with which this fair value process is used cannot be predicted and may be utilized to a significant extent. The value of securities used for NAV calculation under this fair value process may differ from published prices for the same securities.
Exchange traded futures and certain options on futures contracts are valued at the settlement price determined by the relevant exchange. Swap contracts and OTC options and swaptions are valued daily based upon quotations from an independent pricing vendor. Depending on the product and the terms of the transaction, the fair value of the OTC derivatives can be modeled taking into account the counterparties’ creditworthiness and using a series of techniques, including simulation models. Many pricing models do not entail material subjectivity because the methodologies used do not necessitate significant judgments and the pricing inputs are observed from actively quoted markets. The U.S. dollar value of forward foreign currency contracts is determined using forward currency exchange rates supplied by a quotation service.
In accordance with Rule 2a-7 of the 1940 Act, the Money Market Fund values its securities initially at cost, and thereafter, securities are assumed to have a constant amortization to maturity of any discount or premium. Amortized cost approximates fair value.
U.S. GAAP defines the fair value of a financial instrument as the price that a Fund would receive to sell an asset or pay to transfer a liability in an orderly transaction between market participants at the measurement date. In accordance with U.S. GAAP, the Funds have categorized their financial instruments, based on priority of the inputs to the valuation technique, into a three-level hierarchy. The fair value hierarchy gives the highest priority to quoted prices in active markets for identical assets or liabilities (Level 1) and the lowest priority to significant unobservable inputs (Level 3). The Funds utilize valuation techniques that maximize the use of observable inputs and minimize the use of unobservable inputs. If the inputs used to measure fair value for a security fall within different levels of the hierarchy, the category level is based on the lowest priority level input that is significant to the fair value measurement of the instrument. The inputs or methodology used for valuing securities are not necessarily an indication of the risk associated with investing in those securities. Changes in valuation techniques may result in transfers into or out of an investment’s assigned level within the hierarchy.
The three-tier hierarchy of fair value measurements is summarized in the three broad levels listed below:
Level 1 – quoted prices in active markets for identical assets or liabilities
The types of assets and liabilities utilizing Level 1 valuations generally include exchange traded domestic and certain foreign equities, listed derivatives (such as warrants, rights, futures, options), investments in publicly-traded mutual funds, including exchange-traded funds (“ETF”), with quoted market prices and certain over the counter actively traded U.S. Treasury securities.
295
Table of Contents
| NOTES TO FINANCIAL STATEMENTS (Continued) | Sun Capital Advisers Trust |
Level 2 – significant other observable inputs, including:
| a) | Quoted prices for identical or similar assets or liabilities in active and non-active markets, |
| b) | Inputs other than quoted market prices that are observable, and |
| c) | Inputs that are derived principally from or corroborated by observable market data through correlation or other means |
The types of assets and liabilities utilizing Level 2 valuations generally include debt securities such as U.S. Government Agency obligations, municipal bonds, mortgage-backed securities, asset-backed securities, collateralized mortgage obligations, corporate debt obligations, loan assignments and those securities valued at amortized cost; OTC derivatives such as swaps, options, swaptions, foreign forward currency exchange contracts and equity-linked securities; and certain foreign equity securities traded on particular foreign exchanges that close before the Funds determine their NAVs.
Level 3 – significant unobservable inputs (including the Funds’ own assumptions in determining the fair value of assets or liabilities)
Generally, the types of assets and liabilities utilizing Level 3 valuations are securities whose trading has been suspended or which has been de-listed from its primary trading exchange; securities in default or bankruptcy proceedings for which there is no current market quotation; securities and certain derivatives valued by broker quotes which may include brokers’ assumptions about the assumptions a market participant would use.
The tables summarizing the inputs used to value the Fund’s assets and liabilities measured at fair value as of December 31, 2010 and transfers among levels, if any, are incorporated within each Fund’s Portfolio of Investments. During the year ended December 31, 2010, there were no significant changes to valuation techniques described above and the related inputs. There were no significant transfers between Levels 1 and 2 during the year ended December 31, 2010.
c) Investment Transactions and Income
Investment security transactions are accounted for as of trade date. Dividend income from securities and dividend and capital gain distributions from affiliated underlying funds are recorded on the ex-dividend date (net of foreign withholding taxes, as applicable). Non-cash dividends included in income, if any, are recorded at fair market value of securities received. Interest income is recorded on the accrual basis (net of foreign withholding taxes, as applicable). Discounts and premiums on debt securities are amortized using the interest method.
Upon notification from issuers some dividend income received from a real estate investment trust (“REIT”) may be redesignated as a reduction of cost of investment and/or realized gain. Realized gains and losses from security transactions are determined on the basis of identified cost for both financial statement and federal income tax purposes. Investment income, realized and unrealized gains and losses are allocated pro rata on the basis of relative net assets to both classes of shares.
d) Expenses
Expenses directly attributable to a Fund are charged to that Fund. Expenses not directly attributable to a particular Fund are allocated among the affected Funds on the basis of relative net assets. Expenses directly attributable to a particular share class of a Fund are charged directly to such class. All other expenses are borne pro rata on the basis of relative net assets by all classes of shares.
e) Foreign Currency Translation and Foreign Investments
The accounting records of the Funds are maintained in U.S. dollars. Portfolio securities and other assets and liabilities denominated in a foreign currency are translated to U.S. dollars at the prevailing rates of exchange at period end. Purchases and sales of securities, income receipts and expense payments are translated into U.S.
296
Table of Contents
| NOTES TO FINANCIAL STATEMENTS (Continued) | Sun Capital Advisers Trust |
dollars at the prevailing exchange rate on the respective dates of transactions. The Funds do not isolate that portion of the results of operations resulting from changes in foreign exchange rates on investments from the fluctuations arising from changes in market prices of securities held. The effects of changes in foreign currency exchange rates on portfolio investments are included in the net realized and unrealized gains and losses on investments and assets and liabilities in foreign currencies. Net realized gains and losses on foreign currency transactions include disposition of foreign currencies, net gains or losses from assets or liabilities denominated in foreign currencies, and currency gains and losses between the accrual and receipt dates of portfolio investment income and between the trade and settlement dates of portfolio investment transactions.
f) New Accounting Pronouncement
In January 2010, the Financial Accounting Standards Board issued an Accounting Standards Update that will require reporting entities to make new disclosures about purchases, sales, issuances, and settlements in the roll forward of activity in Level 3 fair value measurements, which are effective for interim and annual reporting periods beginning after December 15, 2010. Management is currently evaluating the impact the new requirements will have on the Funds’ financial statement disclosures.
3. SECURITIES AND OTHER INVESTMENTS
a) Mortgage Dollar Roll Transactions
Certain funds may enter into mortgage dollar roll (“MDR”) transactions to take advantage of opportunities in the mortgage market. A dollar roll transaction involves a sale by the Fund of mortgage-backed securities that it holds with an agreement by the Fund to repurchase substantially similar securities at an agreed upon price on a specified future date. The Fund treats mortgage dollar rolls as two separate transactions: one involving the purchase of a security and a separate transaction involving a sale. The Fund is paid a fee for entering into a dollar roll transaction, that is accrued as income over the life of the dollar roll contract. During the period between the sale and repurchase, the Fund will not be entitled to receive interest and principal payments on the securities sold. A Fund will only enter into “covered” rolls. A “covered” roll is a specific type of dollar roll for which there is an offsetting cash position or liquid security position.
The proceeds of the sale will generally be invested in additional instruments for the Fund, and the income from these investments, together with any additional fee income received on the dollar roll transaction, will generally exceed the interest income that would have been earned on the securities sold. Dollar roll transactions involve the risk that the market value of the securities sold by the Fund may decline below the repurchase price of those similar securities which the Fund is obligated to purchase or that the return earned by the Fund with the proceeds of a dollar roll may not exceed transaction costs. As of December 31, 2010, only Investment Grade Bond Fund had open MDR transactions.
b) Real Estate Investment Trusts
Certain Funds may invest in REITs. REITs are pooled investment vehicles that invest primarily in income producing real estate or real estate related loans or interests. REITs are generally classified as equity REITs, mortgage REITs or a combination of equity and mortgage REITs. Equity REITs invest most of their assets directly in real property and derive income primarily from the collection of rents. Equity REITs can also realize capital gains by selling properties that have appreciated in value. Mortgage REITs invest most of their assets in real estate mortgages and derive income from interest payments. Each Fund will indirectly bear its proportionate share of any expenses (such as operating expenses and advisory fees) paid by REITs in which it invests in addition to the expenses paid by the Fund.
Certain risks may arise when investing in REITs. Although Global Real Estate Fund does not invest directly in real estate, it does invest primarily in real estate equity securities and does concentrate its investments in the real
297
Table of Contents
| NOTES TO FINANCIAL STATEMENTS (Continued) | Sun Capital Advisers Trust |
estate industry, and, therefore, an investment in the Fund may be subject to certain risks associated with the direct ownership of real estate and with the real estate industry in general. Each of the other Funds that may invest in REITs may, to a lesser degree, be subject to these risks. Risks associated with the real estate industry may include risks resulting from future economic, political and environmental conditions.
c) Repurchase Agreements
The Funds may invest in repurchase agreements. In a repurchase agreement, a Fund buys a security (“collateral”) for a relatively short period (usually not more than 7 days) subject to the obligation to sell the security back to the repurchase agreement counterparty at a fixed time and price plus accrued interest. Securities serving as collateral for each repurchase agreement must be delivered to the Trust’s custodian. The value of the collateral must at least equal 102% of the principal amount of the repurchase transaction, until the agreement matures. The value of the collateral is marked to market on a daily basis to ensure the adequacy of the collateral. In the event of default, the Funds have the right to liquidate the collateral and apply the proceeds in satisfaction of the obligation. There is the risk that the collateral may be insufficient to meet the obligation in the event of default. As of December 31, 2010, Columbia Small Cap Value Fund, Invesco Small Cap Growth Fund, WMC Blue Chip Mid Cap Fund, WMC Large Cap Growth Fund, Ibbotson Balanced Fund, Ibbotson Conservative Fund and Ibbotson Growth Fund had open repurchase agreements as listed on each Fund’s Portfolio of Investments.
d) When Issued Securities and Forward Commitments
The Funds may purchase or sell securities on a when issued or forward commitment basis. These transactions are arrangements in which the Funds purchase and sell securities with payment and delivery scheduled for a future time. Settlement dates may be a month or more after entering into these transactions and such transactions may involve a risk of loss if the value of the underlying security declines prior to the settlement date. The price of the underlying securities and the date when these securities will be delivered and paid for are fixed at the time the transaction is negotiated. If the counterparty to the purchase transaction fails to deliver the securities, the Fund is at risk to subsequently invest at less advantageous prices and yields. In connection with such purchases the Funds maintain cash or liquid assets in an amount equal to purchase commitments for such underlying securities until settlement date, and for sales commitments the Funds maintain equivalent deliverable securities as “cover” for the transactions. Unsettled sales commitments are valued at the current market value of the underlying security and marked to market daily on the Fund’s Statement of Assets and Liabilities. As of December 31, 2010, only PIMCO Total Return Fund had outstanding forward sales contracts as listed on the Fund’s Portfolio of Investments.
e) Treasury Inflation-Protected Securities
Certain Funds may invest in Treasury Inflation-Protected Securities (“TIPS”), specially structured bonds in which the principal amount is adjusted daily to reflect changes in inflation, as measured by the U.S. Consumer Pricing Index for Urban Consumers. The adjustments to principal due to inflation are reflected as increases or decreases to interest income. Such adjustments may have a significant impact on the Fund’s distributions. The repayment of the original bond principal upon maturity is guaranteed by the full faith and credit of the U.S. Government. At December 31, 2010, Investment Grade Bond Fund, BlackRock Inflation Protected Bond Fund, Goldman Sachs Short Duration Fund and PIMCO Total Return Fund held TIPS as listed on each Fund’s Portfolio of Investments.
f) Equity Linked Securities
Certain Funds may invest in equity-linked securities which are privately issued securities with investment results that are designed to correspond generally to the performance of a specified stock index or “basket” of stocks, or a single stock. These securities may be used by a Fund to gain exposure to countries that place restrictions on
298
Table of Contents
| NOTES TO FINANCIAL STATEMENTS (Continued) | Sun Capital Advisers Trust |
direct investments by foreigners. To the extent that the Funds invest in equity-linked securities having returns that correspond to the performance of a foreign securities index or one or more foreign stocks, investing in equity-linked securities will involve risks similar to the risks of investing in foreign securities. In addition, the Funds bear the risk that the issuer of an equity-linked security may default on its obligation under the terms of the arrangement with the counterparty. At December 31, 2010, only AllianceBernstein International Value Fund held equity-linked securities as listed on the Fund’s Portfolio of Investments.
g) Loan Participations and Assignments
Certain Funds may invest in senior loans in the form of participations (“Participations”) or assignments of all or a portion of loans from third parties (“Assignments”). Loan participations typically represent direct participation in a loan owed by a corporate borrower, and generally are offered by banks, other financial institutions or lending syndicates. The Fund may participate in such syndications, or can buy part of a loan, becoming a co-lender. When purchasing loan participations, the Fund assumes the credit risk associated with the corporate borrower and may assume the credit risk associated with a financial intermediary.
Assignments typically result in the Fund having a direct contractual relationship with the borrower, and the Fund may enforce compliance by the borrower with terms of the loan agreement. All senior loans involve interest rate risk, liquidity risk and credit risk, including the potential default or insolvency of the borrower. As of December 31, 2010, only PIMCO High Yield Fund had open senior loan assignments as listed on the Fund’s Portfolio of Investments.
h) Exchange Traded Funds
The Ibbotson Tactical Opportunities Fund (“the Tactical Fund”) invests substantially all of its assets in ETFs. ETFs are investment companies, the shares of which are listed and traded on U.S. stock exchanges or otherwise traded in the over-the-counter market and may be purchased and sold at market price throughout the trading day. The market price of an underlying ETF may be different from the net asset value of such underlying ETF (i.e., an underlying ETF may trade at a discount or premium to its net asset value). The Fund’s assets may be invested in a variety of equity and fixed income ETFs. Because the Fund’s investments are focused in these underlying ETFs, the Fund’s net asset value and investment performance are directly related to the performance and risk of the underlying ETFs and the equity and bond markets in which those ETFs invest. Underlying ETFs also may change their investment objectives or policies without the approval of the Fund, causing the Fund to withdraw its investment from the underlying ETF at a time and price that is unfavorable to the Fund.
As a result of the Fund’s investment in underlying ETFs, it will indirectly bear fees and expenses charged by the underlying ETFs, in addition to the Fund’s direct fees and expenses. Therefore, the cost of investing in the Tactical Fund may be higher than the cost of investing in mutual funds that invest directly in individual stocks and bonds.
4. PRINCIPAL INVESTMENT RISKS
In the normal course of pursuing their investment objectives, the Funds may trade financial instruments and enter into financial transactions where risk of potential loss exists due to changes in the market (market or equity risk), failure of the other party to a transaction to perform or a decline in credit quality of the issuer (counterparty and credit risk), fluctuations in the value of foreign currencies (foreign currency exchange risk) and unfavorable changes in interest rates (interest rate risk). The potential loss due to any of these risks could exceed the value of the financial assets recorded in the Fund’s financial statements. Financial assets which potentially expose the Funds to credit risk consist principally of cash due from counterparties and investments. In addition, investing in foreign markets may also involve special risks and considerations not typically associated with investing in the U.S. such as high rates of inflation, repatriation restrictions on income and capital, and adverse political and
299
Table of Contents
| NOTES TO FINANCIAL STATEMENTS (Continued) | Sun Capital Advisers Trust |
economic developments. Moreover, securities issued in these markets may be less liquid, be subject to government ownership controls, have delayed settlements, and their prices may be more volatile than those of comparable securities in the U.S.
Counterparty risk, the type of credit risk associated with a default by an institution or other entity with which the Funds have unsettled or open transactions, is managed through evaluation of each counterparty prior to entering into transactions with them. Transactions in listed securities are generally settled/paid for upon delivery using approved counterparties. The risk of loss would generally be considered low as the trades will fail if either party fails to meet its obligation.
The Funds may be subject to various Master Agreements, which govern the terms of certain transactions with select counterparties. These Master Agreements reduce the counterparty risk associated with relevant transactions by allowing a Fund to net contracts in the event of default. All amounts with the counterparty are terminated and settled on a net basis. The Fund’s overall exposure to counterparty risk can change substantially within a short period, as it is affected by each transaction subject to the relevant Master Agreement.
Master Securities Forward Transaction Agreements (“Master Forward Agreements”) govern the considerations and factors surrounding the settlement of certain purchases and sales made on a delayed-delivery basis by and between a Fund and select counterparties. The Master Forward Agreements maintain provisions for, among other things, initiation and confirmation, payment and transfer, events of default, termination, and maintenance of collateral.
Funds attempt to reduce exposure to counterparty credit risk by entering into International Swaps and Derivatives Association, Inc. Master Agreements (“ISDA Master Agreements”) with select counterparties for certain OTC derivative and foreign exchange contract transactions. The ISDA Master Agreements maintain provisions for general obligations, representations, agreements, collateral and events of default or termination. Events of termination include conditions that may entitle counterparties to elect to terminate early and cause settlement of all outstanding transactions under the applicable ISDA Master Agreement. Early termination could be detrimental to the Funds.
5. FINANCIAL DERIVATIVE INSTRUMENTS
The following disclosures contain information on the Funds’ objectives and strategies for using derivative instruments, the credit-risk-related contingent features in certain derivative instruments, and how derivative instruments affect the Funds’ financial position, results of operations, and cash flows. The derivative instruments outstanding as of December 31, 2010, as disclosed in the notes to each applicable Fund’s Portfolio of Investments, and the amount of realized and unrealized gains and losses on derivative instruments during the year ended December 31, 2010, as disclosed in each Fund’s Statement of Operations, serve as indicators of the volume of derivative activity for the Funds.
The following is a summary of the fair valuations of the Funds’ financial derivative instruments (not accounted for as hedging instruments under U.S. GAAP) categorized by risk exposure:
Fair Values of Derivative Instruments on the Statement of Assets and Liabilities as of December 31, 2010:
| Asset Derivatives |
||||||||||||||||||||||
| Fund |
Derivative Type |
Interest Rate | Foreign Exchange |
Credit | Equity | Total | ||||||||||||||||
| BlackRock International Index Fund |
Futures Contracts(a) | $ | — | $ | — | $ | — | $ | 19,576 | $ | 19,576 | |||||||||||
| Total Value | $ | — | $ | — | $ | — | $ | 19,576 | $ | 19,576 | ||||||||||||
| BlackRock Large Cap Index Fund |
Futures Contracts(a) | $ | — | $ | — | $ | — | $ | 54,766 | $ | 54,766 | |||||||||||
| Total Value | $ | — | $ | — | $ | — | $ | 54,766 | $ | 54,766 | ||||||||||||
300
Table of Contents
| NOTES TO FINANCIAL STATEMENTS (Continued) | Sun Capital Advisers Trust |
| Asset Derivatives |
||||||||||||||||||||||
| Fund |
Derivative Type |
Interest Rate | Foreign Exchange |
Credit | Equity | Total | ||||||||||||||||
| BlackRock Small Cap Index Fund |
Futures Contracts(a) | $ | — | $ | — | $ | — | $ | 49,218 | $ | 49,218 | |||||||||||
| Total Value | $ | — | $ | — | $ | — | $ | 49,218 | $ | 49,218 | ||||||||||||
| BlackRock Inflation Protected Bond |
Futures Contracts(a) | $ | 18,750 | $ | — | $ | — | $ | — | $ | 18,750 | |||||||||||
| Swap Contracts(b) | 117,132 | — | — | — | 117,132 | |||||||||||||||||
| Total Value | $ | 135,882 | $ | — | $ | — | $ | — | $ | 135,882 | ||||||||||||
| Goldman Sachs Short Duration Fund |
Futures Contracts(a) | $ | 923,499 | $ | — | $ | — | $ | — | $ | 923,499 | |||||||||||
| Total Value | $ | 923,499 | $ | — | $ | — | $ | — | $ | 923,499 | ||||||||||||
| PIMCO High Yield |
Forward Foreign Currency Exchange Contracts(c) | $ | — | $ | 231,914 | $ | — | $ | — | $ | 231,914 | |||||||||||
| Futures Contracts(a) | 242,475 | — | — | — | 242,475 | |||||||||||||||||
| Swap Contracts(b) | — | — | 278,084 | — | 278,084 | |||||||||||||||||
| Total Value | $ | 242,475 | $ | 231,914 | $ | 278,084 | $ | — | $ | 752,473 | ||||||||||||
| PIMCO Total Return |
Forward Foreign Currency Exchange Contracts(c) | $ | — | 1,494,454 | — | — | $ | 1,494,454 | ||||||||||||||
| Futures Contracts(a) | 224,025 | — | — | — | 224,025 | |||||||||||||||||
| Swap Contracts(b) | 119,702 | — | 1,265,034 | — | 1,384,736 | |||||||||||||||||
| Total Value | $ | 343,727 | $ | 1,494,454 | $ | 1,265,034 | $ | — | $ | 3,103,215 | ||||||||||||
| (a) | Statement of Assets and Liabilities location: Variation margin receivable or payable, as applicable. Amount includes cumulative appreciation (depreciation) on futures as presented in each Fund’s Portfolio of Investments. |
| (b) | Statement of Assets and Liabilities location: Unrealized appreciation on swaps. |
| (c) | Statement of Assets and Liabilities location: Unrealized appreciation on forward foreign currency exchange contracts. |
| Liability Derivatives |
||||||||||||||||||||||
| Fund |
Derivative Type |
Interest Rate | Foreign Exchange |
Credit | Equity | Total | ||||||||||||||||
| AllianceBernstein International Value |
Futures Contracts(a) | $ | — | $ | — | $ | — | $ | (6,600 | ) | $ | (6,600 | ) | |||||||||
| Total Value | $ | — | $ | — | $ | — | $ | (6,600 | ) | $ | (6,600 | ) | ||||||||||
| BlackRock International Index Fund |
Futures Contracts(a) | $ | — | $ | — | $ | — | $ | (3,700 | ) | $ | (3,700 | ) | |||||||||
| Total Value | $ | — | $ | — | $ | — | $ | (3,700 | ) | $ | (3,700 | ) | ||||||||||
| Goldman Sachs Mid Cap Value |
Futures Contracts(a) | $ | — | $ | — | $ | — | $ | (5,922 | ) | $ | (5,922 | ) | |||||||||
| Total Value | $ | — | $ | — | $ | — | $ | (5,922 | ) | $ | (5,922 | ) | ||||||||||
301
Table of Contents
| NOTES TO FINANCIAL STATEMENTS (Continued) | Sun Capital Advisers Trust |
| Liability Derivatives |
||||||||||||||||||||||
| Fund |
Derivative Type |
Interest Rate | Foreign Exchange |
Credit | Equity | Total | ||||||||||||||||
| BlackRock Inflation Protected Bond |
Forward Foreign Currency Exchange Contracts(b) | $ | — | $ | (638,947 | ) | $ | — | $ | — | $ | (638,947 | ) | |||||||||
| Futures Contracts(a) | (454,959 | ) | — | — | — | (454,959 | ) | |||||||||||||||
| Swap Contracts(c) | (702,330 | ) | — | — | — | (702,330 | ) | |||||||||||||||
| Written Option Contracts(d) | (1,271,483 | ) | — | — | — | (1,271,483 | ) | |||||||||||||||
| Total Value | $ | (2,428,772 | ) | $ | (638,947 | ) | $ | — | $ | — | $ | (3,067,719 | ) | |||||||||
| Goldman Sachs Short Duration |
Futures Contracts(a) | $ | (866,125 | ) | $ | — | $ | — | $ | — | $ | (866,125 | ) | |||||||||
| Total Value | $ | (866,125 | ) | $ | — | $ | — | $ | — | $ | (866,125 | ) | ||||||||||
| PIMCO High Yield |
Forward Foreign Currency Exchange Contracts(b) | $ | — | $ | (34,765 | ) | $ | — | $ | — | $ | (34,765 | ) | |||||||||
| Total Value | $ | — | $ | (34,765 | ) | $ | — | $ | — | $ | (34,765 | ) | ||||||||||
| PIMCO Total Return |
Forward Foreign Currency Exchange Contracts(b) | $ | — | $ | (423,073 | ) | $ | — | $ | — | $ | (423,073 | ) | |||||||||
| Futures Contracts(a) | (904,781 | ) | — | — | — | (904,781 | ) | |||||||||||||||
| Swap Contracts(c) | (168,922 | ) | — | (73,800 | ) | — | (242,722 | ) | ||||||||||||||
| Written Option Contracts(d) | (2,816,203 | ) | — | — | — | (2,816,203 | ) | |||||||||||||||
| Total Value | $ | (3,889,906 | ) | $ | (423,073 | ) | $ | (73,800 | ) | $ | — | $ | (4,386,779 | ) | ||||||||
| (a) | Statement of Assets and Liabilities location: Variation margin receivable or payable, as applicable. Amount includes cumulative appreciation (depreciation) on futures, as applicable, as presented in each Fund’s Portfolio of Investments. |
| (b) | Statement of Assets and Liabilities location: Unrealized depreciation on forward foreign currency exchange contracts. |
| (c) | Statement of Assets and Liabilities location: Unrealized depreciation on swaps. |
| (d) | Statement of Assets and Liabilities location: Options written. |
Effect of Derivative Instruments on the Statement of Operations for the Year Ended December 31, 2010:
| Realized Gain (Loss) |
||||||||||||||||||||||
| Fund |
Derivative Type |
Interest Rate | Foreign Exchange |
Credit | Equity | Total | ||||||||||||||||
| AllianceBernstein International Value |
Futures Contracts(a) | $ | — | $ | — | $ | — | $ | 54,039 | $ | 54,039 | |||||||||||
| Total Value | $ | — | $ | — | $ | — | $ | 54,039 | $ | 54,039 | ||||||||||||
| BlackRock |
Futures Contracts(a) | $ | — | $ | — | $ | — | $ | 16,418 | $ | 16,418 | |||||||||||
| Total Value | $ | — | $ | — | $ | — | $ | 16,418 | $ | 16,418 | ||||||||||||
| BlackRock Large Cap Index Fund |
Futures Contracts(a) | $ | — | $ | — | $ | — | $ | 133,245 | $ | 133,245 | |||||||||||
| Total Value | $ | — | $ | — | $ | — | $ | 133,245 | $ | 133,245 | ||||||||||||
302
Table of Contents
| NOTES TO FINANCIAL STATEMENTS (Continued) | Sun Capital Advisers Trust |
| Realized Gain (Loss) |
||||||||||||||||||||||
| Fund |
Derivative Type |
Interest Rate | Foreign Exchange |
Credit | Equity | Total | ||||||||||||||||
| BlackRock Small Cap Index Fund |
Futures Contracts(a) | $ | — | $ | — | $ | — | $ | 222,369 | $ | 222,369 | |||||||||||
| Total Value | $ | — | $ | — | $ | — | $ | 222,369 | $ | 222,369 | ||||||||||||
| Goldman Sachs Mid Cap Value |
Futures Contracts(a) | $ | — | $ | — | $ | — | $ | 1,502,752 | $ | 1,502,752 | |||||||||||
| Total Value | $ | — | $ | — | $ | — | $ | 1,502,752 | $ | 1,502,752 | ||||||||||||
| BlackRock Inflation Protected Bond |
Forward Foreign Currency Exchange Contracts(b) | $ | — | $ | (413,265 | ) | $ | — | $ | — | $ | (413,265 | ) | |||||||||
| Futures Contracts(a) | 355,675 | — | — | — | 355,675 | |||||||||||||||||
| Purchased Option Contracts(c) | 314,737 | — | — | — | 314,737 | |||||||||||||||||
| Swap Contracts(d) | 3,122,485 | — | — | — | 3,122,485 | |||||||||||||||||
| Written Option Contracts(e) | 495,905 | — | — | — | 495,905 | |||||||||||||||||
| Total Value | $ | 4,288,802 | $ | (413,265 | ) | $ | — | $ | — | $ | 3,875,537 | |||||||||||
| Goldman Sachs Short Duration |
Futures Contracts(a) | $ | 3,134,455 | $ | — | $ | — | $ | — | $ | 3,134,455 | |||||||||||
| Total Value | $ | 3,134,455 | $ | — | $ | — | $ | — | $ | 3,134,455 | ||||||||||||
| PIMCO High Yield |
Futures Contracts(a) | $ | 554,788 | $ | — | $ | — | $ | — | $ | 554,788 | |||||||||||
| Forward Foreign Currency Exchange Contracts(b) | — | (34,956 | ) | — | — | (34,956 | ) | |||||||||||||||
| Swap Contracts(d) | — | — | 838,976 | — | 838,976 | |||||||||||||||||
| Written Option Contracts(e) | 236,692 | — | — | — | 236,692 | |||||||||||||||||
| Total Value | $ | 791,480 | $ | (34,956 | ) | $ | 838,976 | $ | — | $ | 1,595,500 | |||||||||||
| PIMCO Total Return |
Futures and Options on Futures Contracts(a) | $ | 12,340,195 | $ | — | $ | — | $ | — | $ | 12,340,195 | |||||||||||
| Forward Foreign Currency Exchange Contracts(b) | — | 1,194,979 | — | — | 1,194,979 | |||||||||||||||||
| Swap Contracts(d) | (1,074,514 | ) | — | 1,079,778 | — | 5,264 | ||||||||||||||||
| Written Option Contracts(e) | 2,225,660 | 124,030 | 15,200 | — | 2,364,890 | |||||||||||||||||
| Total Value | $ | 13,491,341 | $ | 1,319,009 | $ | 1,094,978 | $ | — | $ | 15,905,328 | ||||||||||||
| (a) | Statement of Operations location: Net realized gain (loss) from: Futures and options on futures, as applicable. |
| (b) | Statement of Operations location: Net realized gain (loss) from: Foreign currency related transactions (Statement of Operations includes both forward foreign currency exchange contracts and foreign currency transactions). |
| (c) | Statement of Operations location: Net realized gain (loss) from: Investments. |
| (d) | Statement of Operations location: Net realized gain (loss) from: Swaps. |
| (e) | Statement of Operations location: Net realized gain (loss) from: Written options. |
303
Table of Contents
| NOTES TO FINANCIAL STATEMENTS (Continued) | Sun Capital Advisers Trust |
| Change in Unrealized Appreciation (Depreciation) |
||||||||||||||||||||||
| Fund |
Derivative Type |
Interest Rate | Foreign Exchange |
Credit | Equity | Total | ||||||||||||||||
| AllianceBernstein International Value |
Futures Contracts(a) | $ | — | $ | — | $ | — | $ | (48,444 | ) | $ | (48,444 | ) | |||||||||
| Total Value | $ | — | $ | — | $ | — | $ | (48,444 | ) | $ | (48,444 | ) | ||||||||||
| BlackRock International Index Fund |
Futures Contracts(a) | $ | — | $ | — | $ | — | $ | 15,876 | $ | 15,876 | |||||||||||
| Total Value | $ | — | $ | — | $ | — | $ | 15,876 | $ | 15,876 | ||||||||||||
| BlackRock Large Cap Index Fund |
Futures Contracts(a) | $ | — | $ | — | $ | — | $ | 54,766 | $ | 54,766 | |||||||||||
| Total Value | $ | — | $ | — | $ | — | $ | 54,766 | $ | 54,766 | ||||||||||||
| BlackRock Small Cap Index Fund |
Futures Contracts(a) | $ | — | $ | — | $ | — | $ | 49,218 | $ | 49,218 | |||||||||||
| Total Value | $ | — | $ | — | $ | — | $ | 49,218 | $ | 49,218 | ||||||||||||
| Goldman Sachs Mid Cap Value |
Futures Contracts(a) | $ | — | $ | — | $ | — | $ | (92,106 | ) | $ | (92,106 | ) | |||||||||
| Total Value | $ | — | $ | — | $ | — | $ | (92,106 | ) | $ | (92,106 | ) | ||||||||||
| BlackRock Inflation Protected Bond |
Forward Foreign Currency Exchange Contracts(b) | $ | — | $ | (619,969 | ) | $ | — | $ | — | $ | (619,969 | ) | |||||||||
| Futures Contracts(a) | (688,429 | ) | — | — | — | (688,429 | ) | |||||||||||||||
| Purchased Option Contracts(c) | (80,177 | ) | — | — | — | (80,177 | ) | |||||||||||||||
| Swap Contracts(d) | (602,820 | ) | — | — | — | (602,820 | ) | |||||||||||||||
| Written Option Contracts(e) | (35,863 | ) | — | — | — | (35,863 | ) | |||||||||||||||
| Total Value | $ | (1,407,289 | ) | $ | (619,969 | ) | $ | — | $ | — | $ | (2,027,258 | ) | |||||||||
| Goldman Sachs Short Duration |
Futures Contracts(a) | $ | (885,020 | ) | $ | — | $ | — | $ | — | $ | (885,020 | ) | |||||||||
| Total Value | $ | (885,020 | ) | $ | — | $ | — | $ | — | $ | (885,020 | ) | ||||||||||
| PIMCO High Yield |
Forward Foreign Currency Exchange Contracts(b) | $ | — | $ | 43,282 | $ | — | $ | — | $ | 43,282 | |||||||||||
| Futures Contracts(a) | (146,001 | ) | — | — | — | (146,001 | ) | |||||||||||||||
| Swap Contracts(d) | — | — | (711,348 | ) | — | (711,348 | ) | |||||||||||||||
| Written Option Contracts(e) | (76,399 | ) | — | — | — | (76,399 | ) | |||||||||||||||
| Total Value | $ | (222,400 | ) | $ | 43,282 | $ | (711,348 | ) | $ | — | $ | (890,466 | ) | |||||||||
304
Table of Contents
| NOTES TO FINANCIAL STATEMENTS (Continued) | Sun Capital Advisers Trust |
| Change in Unrealized Appreciation (Depreciation) |
||||||||||||||||||||||
| Fund |
Derivative Type |
Interest Rate | Foreign Exchange |
Credit | Equity | Total | ||||||||||||||||
| PIMCO Total Return |
Forward Foreign Currency Exchange Contracts(b) | $ | — | $ | 824,295 | $ | — | $ | — | $ | 824,295 | |||||||||||
| Futures and Options on Futures Contracts(a) | (350,133 | ) | — | — | — | (350,133 | ) | |||||||||||||||
| Swap Contracts(d) | (20,766 | ) | — | 1,189,975 | — | 1,169,209 | ||||||||||||||||
| Written Option Contracts(e) | (909,592 | ) | 2,310 | — | — | (907,282 | ) | |||||||||||||||
| Total Value | $ | (1,280,491 | ) | $ | 826,605 | $ | 1,189,975 | $ | — | $ | 736,089 | |||||||||||
| (a) | Statement of Operations location: Change in unrealized appreciation (depreciation) on: Futures and options on futures, as applicable. |
| (b) | Statement of Operations location: Change in unrealized appreciation (depreciation) on: Assets and liabilities in foreign currencies (Statement of Operations includes both forward foreign currency exchange contracts and foreign currency transactions). |
| (c) | Statement of Operations location: Change in unrealized appreciation (depreciation) on: Investments. |
| (d) | Statement of Operations location: Change in unrealized appreciation (depreciation) on: Swaps. |
| (e) | Statement of Operations location: Change in unrealized appreciation (depreciation) on: Written options. |
a) Swap Agreements
Certain Funds may invest in swap agreements. Swap agreements are privately negotiated contracts between a Fund and a counterparty to exchange or swap investment cash flows, assets, foreign currencies or market-linked returns at specified, future intervals. A Fund may enter into credit default, cross-currency, interest rate, total return and other forms of swap agreements to manage its exposure to credit, currency and interest rate risks. In connection with these agreements, securities or cash may be identified as collateral in accordance with the terms of the respective swap agreements to provide assets of value and recourse in the event of default or bankruptcy/insolvency. The amount of collateral posted or received by a Fund, as noted on each applicable Fund’s Portfolio of Investments, is generally subject to certain minimum requirements as determined between the Fund and each counterparty.
The value of the swap is adjusted daily based upon quotations from an independent pricing vendor and is recorded as unrealized appreciation or depreciation on the Fund’s Statement of Assets and Liabilities. Upfront swap premium payments paid or received by the Fund, if any, are recorded as such on the Fund’s Statement of Assets and Liabilities and represent payments paid or received upon entering into the swap contract to compensate for differences between stated terms of the swap contract and prevailing market conditions (credit spreads, currency exchange rates, interest rates and other relevant factors). These upfront payments are recorded as realized gain or loss on the Fund’s Statement of Operations upon termination or maturity of the swap contract. Under the terms of the swap contracts, the Fund receives or makes net periodic payments which are included as part of realized gains or losses on the Fund’s Statement of Operations. Liquidation payments received or made upon termination of the swap contract are recorded as realized gain or loss in the Fund’s Statement of Operations.
Entering into swap agreements involves, to varying degrees, elements of credit, market and documentation risk in excess of the amounts recognized on the Fund’s Statement of Operations. Swap agreements are also subject to risks related to the counterparty’s ability to perform, and may decline in value if the counterparty’s creditworthiness deteriorates. A Fund may also suffer losses if it is unable to terminate outstanding swap
305
Table of Contents
| NOTES TO FINANCIAL STATEMENTS (Continued) | Sun Capital Advisers Trust |
agreements or reduce its exposure through offsetting transactions. Swap agreements also bear the risk that the Fund will not be able to meet its obligations to the counterparty.
The Funds may enter into certain interest rate, total return and credit default swap contracts that may contain provisions whereby the counterparty may terminate the contract under certain conditions, including but not limited to a decline in a Fund’s net assets below a certain level, which may result in a payment by the Funds for those swaps in a net liability position.
(i) Credit Default Swap Agreements
Certain Funds may enter into credit default swap agreements. A Fund may buy or sell credit default swap contracts to seek to increase the Fund’s income, to provide comparable exposure to fixed income securities that might not be available in primary markets, to add leverage to the portfolio, or to hedge the risk of default on other securities held by the Fund. A credit default swap is a contract between a buyer and a seller of protection against a predefined credit event. As a seller in the credit default swap contract, the Fund would be required to pay the par (or other agreed-upon) value of certain third party debt obligations to the counterparty in the event of a credit event (generally including the occurrence of a bankruptcy, failure to make payments in respect of debt obligations, or debt restructurings) in respect of such third party, such as a U.S. or foreign corporate issuer. Such a payment would likely result in a loss to the Fund. In return, the Fund would receive from the counterparty a periodic stream of payments over the term of the contract provided that no credit event has occurred. If no credit event occurs, the Fund would keep the stream of payments and would have no payment obligations. The Fund may also buy credit default swap contracts in order to hedge against the risk of default of debt securities or to take a view as to the likelihood of default of debt securities. This would involve the risk that the contract may expire worthless if a credit event does not occur during the term of the transaction. It would also involve credit risk that the seller may fail to satisfy its payment obligations to the Fund in the event of a credit event.
Credit default swap agreements on corporate and sovereign issues involve one party making a stream of payments to another party in exchange for the right to receive a specified return in the event of a credit event. If a credit event occurs and cash settlement is not elected, a variety of other deliverable obligations may be delivered in lieu of the specific referenced obligation. The ability to deliver other obligations may result in a cheapest-to-deliver option (the buyer of protection’s right to choose the deliverable obligation with the lowest value following a credit event). A Fund may use credit default swaps on corporate and sovereign issues to provide a measure of protection against credit events in respect of the issuers (i.e., to reduce risk where a Fund owns or has exposure to the referenced obligation) or to take an active long or short position with respect to the likelihood of the occurrence of a credit event in respect of a particular issuer.
Credit default swap agreements on credit indices involve one party making a stream of payments to another party in exchange for the right to receive a specified return in the event of certain credit events in respect of or default of all or part of the referenced entities comprising the credit index. A credit index is a list or a basket of credit instruments or exposures designed to be representative of some part of the credit market as a whole. Index credit default swaps that reference asset-backed or mortgage-backed instruments may require payments in the event of a write-down, principal or interest shortfall in respect of the underlying instruments. Index credit default swaps that reference corporate entities or instruments generally include the same credit events that would be contained in a single-name credit default swap on the relevant corporate entity or instruments. An index credit default swap references all the entities in the index, and if there is a credit event, the credit event is settled based on that entity’s weight in the index. A Fund may use credit default swaps on credit indices to hedge a portfolio of credit default swaps or bonds which is less expensive than it would be to buy many individual credit default swaps to achieve a similar effect.
The maximum potential amount of future payments (undiscounted) that a Fund as a seller of protection could be required to make under a credit default swap agreement would be an amount equal to the notional amount of the
306
Table of Contents
| NOTES TO FINANCIAL STATEMENTS (Continued) | Sun Capital Advisers Trust |
agreement. Notional amounts of all credit default swap agreements outstanding as of December 31, 2010 for which a Fund is the seller of protection are disclosed in each Fund’s Portfolio of Investments. At December 31, 2010, PIMCO High Yield Fund and PIMCO Total Return Fund had open credit default swap contracts and were the sellers of protection. As disclosed in the notes to the PIMCO High Yield Fund’s Portfolio of Investments and PIMCO Total Return Fund’s Portfolio of Investments, the aggregate market values of credit default swap contracts in net liability positions where each Fund is a seller of protection as of December 31, 2010 were $(4,446) and $(324,625), respectively. If a defined credit event had occurred as of December 31, 2010, the swaps’ credit-risk-contingent features would have been triggered and PIMCO High Yield Fund and PIMCO Total Return Fund would have been required to pay $300,000 and $34,700,000, respectively, representing 0.2% and 4.6%, respectively, of each Fund’s net assets on December 31, 2010 to settle these swaps. These potential amounts would be partially offset by any recovery values of the respective referenced obligations, upfront payments received upon entering into the agreement, or net amounts received from the settlement of buy protection credit default swap agreements entered into by the Fund for the same referenced entity or entities.
(ii) Interest Rate Swap Agreements
Certain Funds may enter into interest rate swap agreements to manage the interest rate risk inherent in the Fund’s underlying investments such as fixed rate bonds. The value of these bonds may decrease if interest rates rise. In an interest rate swap, the Fund would agree to pay the other party to the interest rate swap (the “counterparty”) a fixed rate payment in exchange for the counterparty agreeing to pay to the Fund a variable rate payment, or the Fund would agree to receive from the counterparty a fixed rate payment in exchange for the counterparty agreeing to receive from the Fund a variable rate payment. The payment obligations would be based on the notional amount of the swap.
As of December 31, 2010, BlackRock Inflation Protected Bond Fund and PIMCO Total Return Fund had open interest rate swap agreements as listed on each Fund’s Portfolio of Investments.
(iii) Total Return Swap Agreements
Certain Funds may enter into total return swap agreements to obtain exposure to a security or market without owning or taking physical custody of such security or investing directly in such market. Total return swap agreements are contracts in which one party agrees to make periodic payments to another party based on the change in market value of the assets underlying the contract, which may include a specified security, basket of securities or securities indices during the specific period, in return for periodic payments based on a fixed or variable interest rate or the total return from other underlying assets. To the extent the total return of the security or index underlying the transaction exceeds or falls short of the offsetting interest rate obligation, a Fund will receive a payment from or make a payment to the counterparty.
As of December 31, 2010, only BlackRock Inflation Protected Bond Fund had outstanding total return swap agreements as listed on the Fund’s Portfolio of Investments.
b) Forward Foreign Currency Exchange and Spot Contracts
Certain Funds may engage in forward foreign currency exchange and spot contracts in an effort to enhance total return, to facilitate transactions in foreign securities and to reduce exposure to foreign currency exchange rates. Forward foreign currency exchange contracts are agreements to purchase or sell a specified currency on a specified future date at a price set at the time of the contract. The use of forward foreign currency exchange and spot contracts does not eliminate fluctuations in the underlying prices of the Fund’s securities, but it does establish a rate of exchange on a particular date. When a contract is used to hedge against movements in exchange rates, it will limit the risk of loss due to a decline in the value of the hedged currency during the
307
Table of Contents
| NOTES TO FINANCIAL STATEMENTS (Continued) | Sun Capital Advisers Trust |
relevant period, but will also limit any potential gain that might result should the value of the currency increase during that period. In addition, the Fund could be exposed to risks if the counterparties to the contracts are unable to meet the terms of their contracts. The Funds may segregate liquid assets to cover their obligations under these contracts.
The value of forward foreign currency exchange contracts is translated into U.S. dollars. The change in market values of forward foreign currency exchange contracts is recorded as unrealized appreciation (depreciation) on assets and liabilities in foreign currencies on the Fund’s Statement of Assets and Liabilities. When the contract is closed, the Fund records a realized gain or loss from foreign currency related transactions equal to the difference between the value of the contract at the time it was opened and the value at the time it was closed which is included in realized gain/(loss) on foreign currency related transactions on the Fund’s Statement of Operations.
As of December 31, 2010, BlackRock Inflation Protected Bond Fund, PIMCO High Yield Fund and PIMCO Total Return Fund had open forward foreign currency exchange contracts as listed on each Fund’s Portfolio of Investments.
c) Futures
Certain Funds may enter into futures contracts. A Fund may enter into futures contracts as a hedge against changes in interest rates or securities prices, for duration management, and return enhancement purposes. A futures contract is an agreement between a buyer or seller and an established futures exchange or its clearinghouse, regulated and approved by the Commodity Futures Trading Commission, in which the buyer or seller agrees to take or make a delivery of a specific amount of a financial instrument at a specified price on a specific date (the “settlement date”). Certain risks may arise upon entering into futures contracts, including the risk that an illiquid commodity market will limit the Fund’s ability to close out a futures contract prior to the settlement date and that a change in the value of a futures contract may not correlate exactly with the changes in the value of the securities. The Funds segregate liquid assets or engage in other appropriate measures to cover their obligations under these contracts, as noted on each applicable Fund’s Portfolio of Investments.
Upon entering into a futures contract, the Fund is required to deposit with a financial intermediary an amount (“initial margin”) equal to a certain percentage of the face value indicated in the futures contract. Subsequent payments (“variation margin”) made or received by the Fund are dependent upon the daily fluctuations in the value of the underlying security and are recorded as unrealized gains or losses in the Fund’s Statement of Operations. The value of futures contracts will be the sum of the initial margin plus or minus the difference between the value of the futures contract on the valuation date and the value on the date the futures contract is originated. Futures contracts involve, to a varying degree, risk of loss in excess of the variation margin disclosed on the Statement of Assets and Liabilities.
As of December 31, 2010, AllianceBerstein International Value Fund, BlackRock International Index Fund, BlackRock Large Cap Index Fund, BlackRock Small Cap Index Fund, Goldman Sachs Mid Cap Value Fund, BlackRock Inflation Protected Bond Fund, Goldman Sachs Short Duration Fund, PIMCO High Yield Fund and PIMCO Total Return Fund had open futures contracts as listed on each Fund’s Portfolio of Investments.
d) Options
Certain Funds may enter into call and put option contracts on 1) securities, futures, commodities, currencies or swaps (“swaptions”) it owns or in which it may invest, 2) forward volatility agreements and 3) inflation floors. The Fund may enter into option contracts in order to hedge against potential adverse price movements in the value of portfolio investments; as a temporary substitute for purchasing or selling selected investments; to lock in the purchase price of a security or currency which it expects to purchase in the near future; or to enhance total return. An option contract is a contract in which the writer of the option grants the buyer of the option the right to purchase from (a “call option”), or sell to (a “put option”) the writer a designated instrument at a specified price
308
Table of Contents
| NOTES TO FINANCIAL STATEMENTS (Continued) | Sun Capital Advisers Trust |
within a specified period of time. Writing put options tends to increase a Fund’s exposure to the underlying instrument. Writing call options tends to decrease a Fund’s exposure to the underlying instruments. Swaptions are similar to options on securities except that instead of selling or purchasing the right to buy or sell a security, the writer or purchaser of the swap option is granting or buying the right to enter into a previously agreed upon swap agreement at any time before or upon the expiration of the option. Certain options will require cash settlement by the Fund if the option is exercised. The purpose of an inflation cap is to protect the buyer from inflation erosion above a certain rate on a given notional exposure. A floor can be used to give downside protection to investments in inflation-linked products. A forward volatility agreement hedges against the amount of volatility of an underlying instrument’s value, rate, or movement of a related index.
Certain risks may arise upon entering into option contracts including the risk that an illiquid secondary market will limit the Fund’s ability to close out an option contract prior to the expiration date and that a change in the value of the option contract may not correlate exactly with changes in the value of the securities or currencies hedged. The Fund’s maximum exposure to purchased options is limited to the premium initially paid. If a Fund writes a put option, it accepts the risk of a decline in the value of the underlying security below the exercise price. OTC options have the risk of the potential inability of counterparties to meet the terms of their contracts. The Funds may segregate liquid assets to cover their obligations under option contracts.
The Fund pays a premium as cost for a purchased put or call option, which is disclosed in the Fund’s Portfolio of Investments and subsequently marked to market to reflect the current value of the option. When a Fund writes an inflation cap and a call or put option, an amount equal to the premium received is recorded as a liability on the Statement of Assets and Liabilities and subsequently marked to market to reflect the current value of the option written. Certain forward volatility agreements may be written with premiums on the underlying instruments to be determined on a future date, based upon implied volatility parameters at specified terms. Realized gain or loss is recognized on the Fund’s Statement of Operations when the option contract expires or is closed.
As of December 31, 2010, BlackRock Inflation Protected Bond Fund and PIMCO Total Return Fund had open written option, swaption, forward volatility, and inflation floor contracts as listed on each Fund’s Portfolio of Investments.
Transactions in all types of options written during the year ended December 31, 2010 were as follows:
| BlackRock Inflation Protected Bond Fund |
Number of Contracts |
Swaptions Notional Par |
Premium Amount |
|||||||||
| Beginning of period |
270 | $ | 6,600,000 | $ | 391,727 | |||||||
| Written |
270 | 41,600,000 | 1,474,151 | |||||||||
| Bought back |
(448 | ) | (5,100,000 | ) | (169,618 | ) | ||||||
| Expired |
(92 | ) | (11,700,000 | ) | (413,870 | ) | ||||||
| Exercised |
— | — | — | |||||||||
| End of period |
— | $ | 31,400,000 | $ | 1,282,390 | |||||||
| PIMCO High Yield Fund |
Number of Contracts |
Swaptions Notional Par |
Premium Amount |
|||||||||
| Beginning of period |
8 | $ | 26,100,000 | $ | 236,692 | |||||||
| Written |
— | — | — | |||||||||
| Bought back |
(8 | ) | (16,100,000 | ) | (149,307 | ) | ||||||
| Expired |
— | (10,000,000 | ) | (87,385 | ) | |||||||
| Exercised |
— | — | — | |||||||||
| End of period |
— | $ | — | $ | — | |||||||
309
Table of Contents
| NOTES TO FINANCIAL STATEMENTS (Continued) | Sun Capital Advisers Trust |
| PIMCO Total Return Fund |
Number of Contracts |
Swaptions Notional Par |
Premium Amount |
|||||||||
| Beginning of period |
2,200,314 | $ | 87,900,000 | $ | 997,851 | |||||||
| Written |
13,101,123 | 415,400,000 | 3,515,884 | |||||||||
| Bought back |
(2,200,496 | ) | (107,300,000 | ) | (1,119,178 | ) | ||||||
| Expired |
(13,100,551 | ) | (205,300,000 | ) | (1,515,126 | ) | ||||||
| Exercised |
(22 | ) | — | — | ||||||||
| End of period |
368 | $ | 190,700,000 | $ | 1,879,431 | |||||||
6. INVESTMENT ADVISORY AND OTHER RELATED PARTY AGREEMENTS
a) Investment Advisory Agreement
Sun Capital (the “Adviser”) is the investment adviser to each of the Funds under separate investment advisory or investment advisory and management agreements with the Trust. The Adviser is a direct wholly-owned subsidiary of Sun Life Assurance Company of Canada U.S. Operations Holdings, Inc. (“Sun Life U.S. Ops Holdco”), a holding company. Sun Life Financial Inc. (“Sun Life Financial”), a publicly traded holding company, is the ultimate parent of Sun Life U.S. Ops Holdco and the Adviser. The Adviser, at its own cost, has retained AllianceBernstein L.P., as subadviser for the AllianceBernstein International Value Fund; BlackRock Investment Management, LLC, as subadviser for the BlackRock International Index Fund, BlackRock Large Cap Index Fund and BlackRock Small Cap Index Fund; BlackRock Financial Management, Inc., as subadviser for the BlackRock Inflation Protected Bond Fund; Goldman Sachs Asset Management, L.P., as subadviser for the Goldman Sachs Mid Cap Value Fund and the Goldman Sachs Short Duration Fund; Columbia Management Investment Advisers, LLC, as subadviser for the Columbia Small Cap Value Fund; Davis Selected Advisers, L.P., as subadviser for the Davis Venture Value Fund; Invesco Advisers, Inc., as subadviser for Invesco Small Cap Growth Fund; Lord, Abbett & Co. LLC, as subadviser for the Lord Abbett Growth & Income Fund; Wellington Management Company, LLP, as subadviser for the WMC Blue Chip Mid Cap Fund and WMC Large Cap Growth Fund; Ibbotson Associates, Inc., as subadviser for the Ibbotson Tactical Opportunities Fund, Ibbotson Balanced Fund, Ibbotson Conservative Fund, and Ibbotson Growth Fund; and Pacific Investment Management Company LLC, as subadviser for PIMCO High Yield Fund and PIMCO Total Return Fund.
As compensation for all services rendered, facilities provided and expenses paid or assumed by the Adviser under the advisory agreements, the following sixteen Funds pay an investment advisory fee monthly to the Adviser at the following annual rates based on the average daily net assets of each Fund taken separately:
| Fund | Asset Level | Fee | ||||
| AllianceBernstein International Value |
All |
0.63% | ||||
| BlackRock International Index |
$0-$500 million over $500 million |
|
0.40% 0.375% |
| ||
| BlackRock Large Cap Index* |
$0-$500 million over $500 million |
|
0.35% 0.325% |
| ||
| BlackRock Small Cap Index** |
$0-$500 million over $500 million |
|
0.375% 0.35% |
| ||
| Columbia Small Cap Value |
$0-$250 million over $250 million |
|
0.90% 0.85% |
| ||
310
Table of Contents
| NOTES TO FINANCIAL STATEMENTS (Continued) | Sun Capital Advisers Trust |
| Fund | Asset Level | Fee | ||||
| Davis Venture Value |
$0-$500 million over $500 million |
|
0.75% 0.70% |
| ||
| Invesco Small Cap Growth |
$0-$250 million over $250 million |
|
0.95% 0.90% |
| ||
| WMC Blue Chip Mid Cap |
$0-$300 million over $300 million |
|
0.80% 0.75% |
| ||
| WMC Large Cap Growth |
$0-$750 million over $750 million |
|
0.75% 0.70% |
| ||
| Global Real Estate |
All |
0.95% | ||||
| Ibbotson Tactical Opportunities |
$0-$250 million $250 million-$500 million $500 million-$750 million $750 million-$1billion over $1 billion |
|
0.375% 0.36% 0.34% 0.32% 0.30% |
| ||
| Investment Grade Bond |
All |
0.60% | ||||
| Money Market |
All |
0.50% | ||||
| Ibbotson Balanced |
All |
0.125% | ||||
| Ibbotson Conservative |
All |
0.125% | ||||
| Ibbotson Growth |
All |
0.125% | ||||
| * | Prior to November 15, 2010, the advisory fee for BlackRock Large Cap Index Fund was 0.70%. |
| ** | Prior to November 15, 2010, the advisory fee for BlackRock Small Cap Index Fund was 0.80% (assets $0-$400 million), 0.75% (assets $400 million-$800 million), and 0.70% (assets over $800 million). |
Under the investment advisory and management agreements, the following six Funds pay a unified management fee to the Adviser on a quarterly basis for its advisory and management services. Out of a unified management fee, the Adviser pays for all of the ordinary expenses of managing and operating the Funds. Each fee is calculated based on the annual stated percentage of average daily net assets for each Fund taken separately, as follows:
| Fund | Asset Level | Fee | ||||
| Goldman Sachs Mid Cap Value |
All |
1.05% | ||||
| Lord Abbett Growth & Income |
All |
0.87% | ||||
| BlackRock Inflation Protected Bond |
All |
0.65% | ||||
| Goldman Sachs Short Duration |
All |
0.64% | ||||
| PIMCO High Yield |
All |
0.74% | ||||
| PIMCO Total Return |
All |
0.65% | ||||
311
Table of Contents
| NOTES TO FINANCIAL STATEMENTS (Continued) | Sun Capital Advisers Trust |
b) Limitations
The Adviser has contractually agreed (until at least April 30, 2012 except as indicated below) to reduce its advisory or unified management fee and to reimburse each Fund’s other operating expenses to reduce each Fund’s total annual operating expenses to:
| Contractual Expense Limitations | ||||||||
| Fund |
Initial Class | Service Class | ||||||
| AllianceBernstein International Value |
0.75 | % | 1.00 | % | ||||
| BlackRock International Index |
0.60 | % | 0.85 | % | ||||
| BlackRock Large Cap Index* |
0.50 | % | 0.75 | % | ||||
| BlackRock Small Cap Index** |
0.60 | % | 0.85 | % | ||||
| Goldman Sachs Mid Cap Value*** |
1.07 | % | 1.32 | % | ||||
| Columbia Small Cap Value |
1.15 | % | 1.40 | % | ||||
| Davis Venture Value |
0.90 | % | 1.15 | % | ||||
| Invesco Small Cap Growth |
1.15 | % | 1.40 | % | ||||
| Lord Abbett Growth & Income*** |
0.87 | % | 1.12 | % | ||||
| WMC Blue Chip Mid Cap |
1.00 | % | 1.25 | % | ||||
| WMC Large Cap Growth |
0.81 | % | 1.06 | % | ||||
| Global Real Estate |
1.10 | % | 1.35 | % | ||||
| Ibbotson Tactical Opportunities |
0.50 | % | N/A | |||||
| Investment Grade Bond |
0.75 | % | 1.00 | % | ||||
| Money Market |
0.50 | % | 0.75 | % | ||||
| BlackRock Inflation Protected Bond*** |
0.65 | % | 0.90 | % | ||||
| Goldman Sachs Short Duration*** |
0.65 | % | 0.90 | % | ||||
| PIMCO High Yield*** |
0.75 | % | 1.00 | % | ||||
| PIMCO Total Return*** |
0.65 | % | 0.90 | % | ||||
| Invesco Small Cap Growth |
1.15 | % | 1.40 | % | ||||
| Ibbotson Balanced |
0.20 | % | 0.45 | % | ||||
| Ibbotson Conservative |
0.20 | % | 0.45 | % | ||||
| Ibbotson Growth |
0.20 | % | 0.45 | % | ||||
| * | Prior to November 15, 2010, the expense limitations for BlackRock Large Cap Index Fund were 0.90% and 1.15% for Initial Class and Service Class, respectively. |
| ** | Prior to November 15, 2010, the expense limitations for BlackRock Small Cap Index Fund were 1.00% and 1.25% for Initial Class and Service Class, respectively. |
| *** | Contractual expense limitations expire on April 30, 2011. |
To the extent that a Fund’s total expense ratio falls below the expense limit stated above in future years, the Adviser reserves the right to be reimbursed for advisory or unified management fees waived and fund expenses paid on behalf of each fund during the prior two fiscal years. For each of the periods below, the Adviser waived all or part of its investment advisory fee and reimbursed certain operating expenses in the following amounts:
| Year Ended December 31, 2010 |
Two-year period ended December 31, 2010 |
|||||||||||||||
| Fund |
Advisory Fees Waived |
Expenses Reimbursed |
Advisory Fees Waived |
Expenses Reimbursed |
||||||||||||
| AllianceBernstein International Value |
$ | 225,183 | $ | — | $ | 438,713 | $ | 2,254 | ||||||||
| BlackRock International Index |
26,390 | * | 84,623 | * | 26,390 | * | 84,623 | * | ||||||||
| BlackRock Large Cap Index |
12,062 | — | 113,409 | — | ||||||||||||
| BlackRock Small Cap Index |
67,163 | — | 400,968 | — | ||||||||||||
312
Table of Contents
| NOTES TO FINANCIAL STATEMENTS (Continued) | Sun Capital Advisers Trust |
| Year Ended December 31, 2010 |
Two-year period ended December 31, 2010 |
|||||||||||||||
| Fund |
Advisory Fees Waived |
Expenses Reimbursed |
Advisory Fees Waived |
Expenses Reimbursed |
||||||||||||
| Goldman Sachs Mid Cap Value |
$ | — | $ | — | $ | — | $ | — | ||||||||
| Columbia Small Cap Value |
126,797 | — | 241,926 | — | ||||||||||||
| Davis Venture Value |
— | — | 69,717 | — | ||||||||||||
| Invesco Small Cap Growth |
116,536 | — | 261,332 | 13,392 | ||||||||||||
| Lord Abbett Growth & Income |
36,406 | — | 80,629 | — | ||||||||||||
| WMC Blue Chip Mid Cap |
— | — | 91,879 | — | ||||||||||||
| WMC Large Cap Growth |
210,162 | — | 441,658 | — | ||||||||||||
| Global Real Estate |
35,216 | — | 175,999 | — | ||||||||||||
| Ibbotson Tactical Opportunities |
52,556 | * | — | * | 52,556 | * | — | * | ||||||||
| Investment Grade Bond |
— | — | 114,948 | — | ||||||||||||
| Money Market |
985,267 | 323,877 | 2,091,212 | 404,567 | ||||||||||||
| BlackRock Inflation Protected Bond |
19,019 | — | 28,152 | — | ||||||||||||
| Goldman Sachs Short Duration |
— | — | 15,758 | — | ||||||||||||
| PIMCO High Yield |
— | — | 1,464 | — | ||||||||||||
| PIMCO Total Return |
39,169 | — | 58,110 | — | ||||||||||||
| Ibbotson Balanced |
81,277 | — | 257,266 | — | ||||||||||||
| Ibbotson Conservative |
101,185 | — | 258,110 | — | ||||||||||||
| Ibbotson Growth |
105,710 | — | 271,325 | — | ||||||||||||
| * | For the period November 15, 2010 (commencement of operations) to December 31, 2010. |
On November 15, 2010, the Board of Trustees approved the following changes to the expense limitation arrangements between Sun Capital and the Funds of the Trust effective May 1, 2011: i) the following items of expenses will no longer be covered by the expense limitation arrangements: independent trustee compensation and expenses in performance of their duties, independent trustee legal counsel fees and related expenses, independent trustee liability insurance premiums, fees and expenses associated with electronic delivery of Board materials, fees and expenses associated with obtaining third party data to assist the Board with quarterly performance and annual contract reviews and such other expenses as are determined to be extraordinary expenses by the independent trustees; ii) there will be no expense limitation applicable to the six Funds of the Trust that have unified management fees, and iii) the expense limitation for the WMC Large Cap Growth Fund will be changed from 0.81% to 0.90% for the Initial Class shares and from 1.06% to 1.15% for the Service Class shares.
c) Distribution and Service Plan
The Trust has adopted a plan of distribution and service pursuant to Rule 12b-1 under the 1940 Act with respect to its Service Class Shares (the “Plan”), pursuant to which distribution and service fees are paid to the Trust’s underwriter, Clarendon Insurance Agency, Inc. (“Clarendon”), which is a wholly-owned subsidiary of Sun Life Assurance Company of Canada (U.S.) (“Sun Life (U.S.)”). The fees of the Trust payable to Clarendon under the Plan are accrued daily at a rate with respect to each Fund which may not exceed 0.25% of the Fund’s average daily net assets attributable to Service Class Shares regardless of the level of expenses actually incurred by Clarendon and others. Clarendon uses the service and distribution fees to compensate Sun Life (U.S.) and Sun Life Insurance and Annuity Company of New York (“Sun Life (N.Y.)”) for services rendered in connection with maintenance and distribution of the variable contracts issued by Sun Life (U.S.) and Sun Life (N.Y.).
d) Trustees’ Compensation
Each independent trustee of the Trust is compensated by the Funds. The aggregate remuneration accrued and paid by the Funds to the independent trustees for the year ended December 31, 2010 was $270,447 and $290,605, respectively, including out of pocket expenses. The Trust pays no compensation directly to those of its Trustees
313
Table of Contents
| NOTES TO FINANCIAL STATEMENTS (Continued) | Sun Capital Advisers Trust |
or officers who are affiliated with the Adviser, or its affiliates, all of whom receive remuneration for their services to the Trust from the Adviser, or its affiliates. Certain officers and Trustees of the Trust are also officers and directors of the Adviser, and/or other companies affiliated with the Adviser.
7. INVESTMENT TRANSACTIONS
Cost of purchases and proceeds from sales and maturities of investments, excluding short-term securities, for the year ended December 31, 2010, were as follows:
| Fund |
Non- Government Purchases |
Government Purchases |
Non- Government Sales |
Government Sales |
||||||||||||
| AllianceBernstein International Value |
$ | 55,026,765 | $ | — | $ | 41,278,019 | $ | — | ||||||||
| BlackRock International Index |
51,700,511 | — | 723,073 | — | ||||||||||||
| BlackRock Large Cap Index |
259,021,998 | — | 253,410,059 | — | ||||||||||||
| BlackRock Small Cap Index |
229,722,089 | — | 275,586,413 | — | ||||||||||||
| Goldman Sachs Mid Cap Value |
169,354,733 | — | 152,482,648 | — | ||||||||||||
| Columbia Small Cap Value |
76,157,035 | — | 64,918,728 | — | ||||||||||||
| Davis Venture Value |
158,748,755 | — | 162,683,301 | — | ||||||||||||
| Invesco Small Cap Growth |
15,479,444 | — | 9,800,564 | — | ||||||||||||
| Lord Abbett Growth & Income |
317,234,943 | — | 351,218,949 | — | ||||||||||||
| WMC Blue Chip Mid Cap |
113,264,319 | — | 89,400,759 | — | ||||||||||||
| WMC Large Cap Growth |
144,526,396 | — | 155,695,261 | — | ||||||||||||
| Global Real Estate |
94,664,638 | — | 91,021,037 | — | ||||||||||||
| Ibbotson Tactical Opportunities |
499,348,571 | — | 63,677,044 | — | ||||||||||||
| Investment Grade Bond |
377,628,183 | 99,976,422 | 251,054,330 | 5,940,508 | ||||||||||||
| BlackRock Inflation Protected Bond |
113,137,618 | 1,044,007,098 | 100,538,855 | 884,340,898 | ||||||||||||
| Goldman Sachs Short Duration |
362,061,489 | 1,039,461,530 | 285,407,841 | 923,634,731 | ||||||||||||
| PIMCO High Yield |
82,523,551 | — | 37,036,650 | — | ||||||||||||
| PIMCO Total Return |
235,146,763 | 3,080,922,639 | 91,583,844 | 2,593,681,965 | ||||||||||||
| Ibbotson Balanced* |
1,038,120,335 | — | 269,124,245 | — | ||||||||||||
| Ibbotson Conservative* |
437,327,400 | — | 88,276,343 | — | ||||||||||||
| Ibbotson Growth* |
280,079,491 | — | 197,796,054 | — | ||||||||||||
| * | Affiliated investment transactions. |
Purchases and sales, including maturities, of short-term securities by the Money Market Fund for the year ended December 31, 2010 were $1,591,372,172 and $1,608,695,566, respectively.
8. AFFILIATED COMPANY SECURITIES
The term “affiliated securities” includes securities issued by any company that is under common control with the Fund. At December 31, 2010, the Adviser or its affiliate, MFS, served as investment adviser to the underlying funds of Ibbotson Balanced Fund, Ibbotson Conservative Fund and Ibbotson Growth Fund. Purchases and proceeds from sales of affiliated investments are disclosed in Note 7 – Investment Transactions. Dividend and capital gains distributions from affiliated underlying funds are presented in each Fund’s Statement of Operations. Underlying funds managed by MFS seek to achieve capital appreciation by investing primarily in U.S. and foreign equity securities, including those in emerging markets.
9. LINE OF CREDIT
The Trust has entered into a $20 million committed unsecured revolving line of credit (the “Agreement”) primarily for temporary or emergency purposes. The Money Market Fund is not a party to this Agreement.
314
Table of Contents
| NOTES TO FINANCIAL STATEMENTS (Continued) | Sun Capital Advisers Trust |
Interest is charged to each Fund based on its borrowings at a rate equal to a variable lending rate. In addition, a commitment fee on the daily unused portion of the $20 million committed line is allocated among the participating Funds at the end of each calendar quarter. During the year ended December 31, 2010, the following Funds had borrowings and incurred commitment fees under this Agreement as follows:
| Fund Name |
Maximum Loan | Average Daily Amount of Loan |
Weighted Average Interest Rate |
Commitment Fee |
||||||||||||
| AllianceBernstein International Value Fund |
$ | — | $ | — | — | % | $ | 342 | ||||||||
| BlackRock International Index Fund* |
— | — | — | 24 | ||||||||||||
| BlackRock Large Cap Index Fund |
243,000 | 830 | 1.49 | 536 | ||||||||||||
| BlackRock Small Cap Index Fund |
9,349,000 | 108,397 | 1.50 | 792 | ||||||||||||
| Goldman Sachs Mid Cap Value Fund |
— | — | — | 1,070 | ||||||||||||
| Columbia Small Cap Value Fund |
972,000 | 11,526 | 1.52 | 216 | ||||||||||||
| Davis Venture Value Fund |
3,626,000 | 45,529 | 1.49 | 1,953 | ||||||||||||
| Invesco Small Cap Growth Fund |
448,000 | 11,236 | 1.49 | 110 | ||||||||||||
| Lord Abbett Growth & Income Fund |
5,583,000 | 61,170 | 1.50 | 2,326 | ||||||||||||
| WMC Blue Chip Mid Cap Fund |
1,622,000 | 5,397 | 1.49 | 601 | ||||||||||||
| WMC Large Cap Growth Fund |
921,000 | 10,200 | 1.51 | 890 | ||||||||||||
| Global Real Estate Fund |
872,000 | 6,225 | 1.48 | 1,048 | ||||||||||||
| Ibbotson Tactical Opportunities Fund* |
— | — | — | 148 | ||||||||||||
| Investment Grade Bond Fund |
— | — | — | 1,418 | ||||||||||||
| BlackRock Inflation Protected Bond Fund |
422,000 | 3,468 | 1.48 | 1,191 | ||||||||||||
| Goldman Sachs Short Duration Fund |
556,000 | 1,523 | 1.43 | 4,764 | ||||||||||||
| PIMCO High Yield Fund |
38,000 | 104 | 1.43 | 622 | ||||||||||||
| PIMCO Total Return Fund |
12,702,000 | 36,230 | 1.52 | 2,468 | ||||||||||||
| Ibbotson Balanced Fund |
2,835,000 | 23,301 | 1.42 | 4,575 | ||||||||||||
| Ibbotson Conservative Fund |
5,284,000 | 38,345 | 1.51 | 2,635 | ||||||||||||
| Ibbotson Growth Fund |
6,228,000 | 142,019 | 1.51 | 2,390 | ||||||||||||
| * | For the period November 15, 2010 (commencement of operations) to December 31, 2010. |
As of December 31, 2010, there were no outstanding borrowings under this Agreement.
10. SHARE TRANSACTIONS
Each of the Funds is authorized to issue an unlimited number of shares without par value. Transactions in classes of each Fund were as follows:
| Initial Class Shares | Service Class Shares | |||||||||||||||
| Year Ended December 31, 2010 |
Year Ended December 31, 2009 |
Year Ended December 31, 2010 |
Year Ended December 31, 2009 |
|||||||||||||
| AllianceBernstein International Value Fund (shares) |
||||||||||||||||
| Shares sold |
3,567,009 | 4,771,893 | 174,698 | 184,843 | ||||||||||||
| Shares issued as reinvestment of distributions |
133,237 | 246,823 | 4,490 | 7,134 | ||||||||||||
| Shares redeemed |
(2,340,618 | ) | (573,626 | ) | (45,024 | ) | (281,329 | ) | ||||||||
| Net increase (decrease) in shares outstanding |
1,359,628 | 4,445,090 | 134,164 | (89,352 | ) | |||||||||||
| Beginning of period |
5,678,230 | 1,233,140 | 169,780 | 259,132 | ||||||||||||
| End of period |
7,037,858 | 5,678,230 | 303,944 | 169,780 | ||||||||||||
315
Table of Contents
| NOTES TO FINANCIAL STATEMENTS (Continued) | Sun Capital Advisers Trust |
| Initial Class Shares | Service Class Shares | |||||||||||||||
| Year Ended December 31, 2010 |
Year Ended December 31, 2009 |
Year Ended December 31, 2010 |
Year Ended December 31, 2009 |
|||||||||||||
| AllianceBernstein International Value Fund ($) |
||||||||||||||||
| Net proceeds from sales |
$ | 33,291,819 | $ | 40,083,978 | $ | 1,643,105 | $ | 1,633,385 | ||||||||
| Net proceeds on reinvestment of distributions |
1,248,432 | 2,436,542 | 41,984 | 70,375 | ||||||||||||
| Shares redeemed |
(23,253,856 | ) | (5,181,425 | ) | (423,210 | ) | (2,902,959 | ) | ||||||||
| Net increase (decrease) in net assets |
$ | 11,286,395 | $ | 37,339,095 | $ | 1,261,879 | $ | (1,199,199 | ) | |||||||
| BlackRock International Index Fund (shares)(a) |
||||||||||||||||
| Shares sold |
5,277,325 | 24,602 | ||||||||||||||
| Shares redeemed |
(11,775 | ) | — | |||||||||||||
| Net increase (decrease) in shares outstanding |
5,265,550 | 24,602 | ||||||||||||||
| Beginning of period |
1 | 1 | ||||||||||||||
| End of period |
5,265,551 | 24,603 | ||||||||||||||
| BlackRock International Index Fund ($)(a) |
||||||||||||||||
| Net proceeds from sales |
$ | 52,817,033 | $ | 246,073 | ||||||||||||
| Shares redeemed |
(119,468 | ) | — | |||||||||||||
| Net increase (decrease) in net assets |
$ | 52,697,565 | $ | 246,073 | ||||||||||||
| BlackRock Large Cap Index Fund (shares) |
||||||||||||||||
| Shares sold |
5,938,764 | 7,834,541 | 528,690 | 850,101 | ||||||||||||
| Shares issued as reinvestment of distributions |
26,219 | 76,567 | 2,941 | 8,853 | ||||||||||||
| Shares redeemed |
(5,116,303 | ) | (378,097 | ) | (253,110 | ) | (160,112 | ) | ||||||||
| Net increase (decrease) in shares outstanding |
848,680 | 7,533,011 | 278,521 | 698,842 | ||||||||||||
| Beginning of period |
8,781,396 | 1,248,385 | 1,422,949 | 724,107 | ||||||||||||
| End of period |
9,630,076 | 8,781,396 | 1,701,470 | 1,422,949 | ||||||||||||
| BlackRock Large Cap Index Fund ($) |
||||||||||||||||
| Net proceeds from sales |
$ | 48,839,087 | $ | 54,434,294 | $ | 4,570,334 | $ | 6,062,955 | ||||||||
| Net proceeds on reinvestment of distributions |
216,837 | 619,650 | 24,908 | 73,322 | ||||||||||||
| Shares redeemed |
(45,548,229 | ) | (2,749,134 | ) | (2,190,527 | ) | (1,077,506 | ) | ||||||||
| Net increase (decrease) in net assets |
$ | 3,507,695 | $ | 52,304,810 | $ | 2,404,715 | $ | 5,058,771 | ||||||||
| BlackRock Small Cap Index Fund (shares) |
||||||||||||||||
| Shares sold |
491,327 | 1,248,829 | 694,478 | 2,693,263 | ||||||||||||
| Shares issued as reinvestment of distributions |
14,108 | 2,426 | 14,319 | 7,063 | ||||||||||||
| Shares redeemed |
(1,644,466 | ) | (1,594,457 | ) | (3,188,604 | ) | (4,830,748 | ) | ||||||||
| Net increase (decrease) in shares outstanding |
(1,139,031 | ) | (343,202 | ) | (2,479,807 | ) | (2,130,422 | ) | ||||||||
| Beginning of period |
4,624,986 | 4,968,188 | 12,904,443 | 15,034,865 | ||||||||||||
| End of period |
3,485,955 | 4,624,986 | 10,424,636 | 12,904,443 | ||||||||||||
316
Table of Contents
| NOTES TO FINANCIAL STATEMENTS (Continued) | Sun Capital Advisers Trust |
| Initial Class Shares | Service Class Shares | |||||||||||||||
| Year Ended December 31, 2010 |
Year Ended December 31, 2009 |
Year Ended December 31, 2010 |
Year Ended December 31, 2009 |
|||||||||||||
| BlackRock Small Cap Index Fund ($) |
||||||||||||||||
| Net proceeds from sales |
$ | 5,730,919 | $ | 10,256,665 | $ | 7,538,234 | $ | 16,128,126 | ||||||||
| Net proceeds on reinvestment of distributions |
155,615 | 24,361 | 155,938 | 70,061 | ||||||||||||
| Shares redeemed |
(18,747,647 | ) | (13,291,807 | ) | (37,504,292 | ) | (42,022,757 | ) | ||||||||
| Net increase (decrease) in net assets |
$ | (12,861,113 | ) | $ | (3,010,781 | ) | $ | (29,810,120 | ) | $ | (25,824,570 | ) | ||||
| Goldman Sachs Mid Cap Value Fund (shares) |
||||||||||||||||
| Shares sold |
7,670,260 | 10,009,062 | 1,195,388 | 1,857,700 | ||||||||||||
| Subscriptions in-kind (b) |
— | 15,162,792 | — | — | ||||||||||||
| Shares issued as reinvestment of distributions |
677,522 | 2,136,646 | 65,091 | 204,336 | ||||||||||||
| Shares redeemed |
(6,401,931 | ) | (4,239,802 | ) | (789,814 | ) | (345,461 | ) | ||||||||
| Net increase (decrease) in shares outstanding |
1,945,851 | 23,068,698 | 470,665 | 1,716,575 | ||||||||||||
| Beginning of period |
24,006,000 | 937,302 | 2,359,070 | 642,495 | ||||||||||||
| End of period |
25,951,851 | 24,006,000 | 2,829,735 | 2,359,070 | ||||||||||||
| Goldman Sachs Mid Cap Value Fund ($) |
||||||||||||||||
| Net proceeds from sales |
$ | 64,672,510 | $ | 69,508,915 | $ | 10,142,051 | $ | 13,457,586 | ||||||||
| Subscriptions in-kind (b) |
— | 86,276,287 | — | — | ||||||||||||
| Net proceeds on reinvestment of distributions |
5,643,760 | 17,199,998 | 540,908 | 1,642,863 | ||||||||||||
| Shares redeemed |
(55,491,591 | ) | (30,422,726 | ) | (6,692,821 | ) | (2,646,987 | ) | ||||||||
| Net increase (decrease) in net assets |
$ | 14,824,679 | $ | 142,562,474 | $ | 3,990,138 | $ | 12,453,462 | ||||||||
| Columbia Small Cap Value Fund (shares) |
||||||||||||||||
| Shares sold |
1,544,629 | 4,559,288 | 569,073 | 660,894 | ||||||||||||
| Shares issued as reinvestment of distributions |
377,528 | 103,698 | 87,398 | 19,272 | ||||||||||||
| Shares redeemed |
(900,177 | ) | (1,862,200 | ) | (229,432 | ) | (182,795 | ) | ||||||||
| Net increase (decrease) in shares outstanding |
1,021,980 | 2,800,786 | 427,039 | 497,371 | ||||||||||||
| Beginning of period |
3,342,225 | 541,439 | 676,003 | 178,632 | ||||||||||||
| End of period |
4,364,205 | 3,342,225 | 1,103,042 | 676,003 | ||||||||||||
| Columbia Small Cap Value Fund ($) |
||||||||||||||||
| Net proceeds from sales |
$ | 16,293,217 | $ | 38,421,162 | $ | 5,846,228 | $ | 5,541,210 | ||||||||
| Net proceeds on reinvestment of distributions |
3,503,453 | 1,059,787 | 809,308 | 196,965 | ||||||||||||
| Shares redeemed |
(9,044,675 | ) | (18,513,699 | ) | (2,425,175 | ) | (1,769,047 | ) | ||||||||
| Net increase (decrease) in net assets |
$ | 10,751,995 | $ | 20,967,250 | $ | 4,230,361 | $ | 3,969,128 | ||||||||
| Davis Venture Value Fund (shares) |
||||||||||||||||
| Shares sold |
7,288,612 | 10,680,746 | 2,157,750 | 13,579,231 | ||||||||||||
| Shares issued as reinvestment of distributions |
96,261 | 37,207 | 54,826 | 28,743 | ||||||||||||
| Shares redeemed |
(8,039,035 | ) | (828,912 | ) | (2,060,829 | ) | (1,526,348 | ) | ||||||||
| Net increase (decrease) in shares outstanding |
(654,162 | ) | 9,889,041 | 151,747 | 12,081,626 | |||||||||||
| Beginning of period |
13,709,275 | 3,820,234 | 21,940,742 | 9,859,116 | ||||||||||||
| End of period |
13,055,113 | 13,709,275 | 22,092,489 | 21,940,742 | ||||||||||||
317
Table of Contents
| NOTES TO FINANCIAL STATEMENTS (Continued) | Sun Capital Advisers Trust |
| Initial Class Shares | Service Class Shares | |||||||||||||||
| Year Ended December 31, 2010 |
Year Ended December 31, 2009 |
Year Ended December 31, 2010 |
Year Ended December 31, 2009 |
|||||||||||||
| Davis Venture Value Fund ($) |
||||||||||||||||
| Net proceeds from sales |
$ | 78,342,507 | $ | 98,509,305 | $ | 23,219,248 | $ | 114,619,412 | ||||||||
| Net proceeds on reinvestment of distributions |
1,027,110 | 375,796 | 583,899 | 290,015 | ||||||||||||
| Shares redeemed |
(90,371,562 | ) | (7,382,976 | ) | (23,109,538 | ) | (14,347,405 | ) | ||||||||
| Net increase (decrease) in net assets |
$ | (11,001,945 | ) | $ | 91,502,125 | $ | 693,609 | $ | 100,562,022 | |||||||
| Invesco Small Cap Growth Fund (shares) |
||||||||||||||||
| Shares sold |
495,380 | 2,139,249 | 438,169 | 642,199 | ||||||||||||
| Shares issued as reinvestment of distributions |
157,640 | 42,061 | 77,408 | 20,866 | ||||||||||||
| Shares redeemed |
(158,170 | ) | (1,151,197 | ) | (214,999 | ) | (189,830 | ) | ||||||||
| Net increase (decrease) in shares outstanding |
494,850 | 1,030,113 | 300,578 | 473,235 | ||||||||||||
| Beginning of period |
1,367,213 | 337,100 | 679,049 | 205,814 | ||||||||||||
| End of period |
1,862,063 | 1,367,213 | 979,627 | 679,049 | ||||||||||||
| Invesco Small Cap Growth Fund ($) |
||||||||||||||||
| Net proceeds from sales |
$ | 4,927,667 | $ | 17,852,894 | $ | 4,326,592 | $ | 5,545,347 | ||||||||
| Net proceeds on reinvestment of distributions |
1,478,663 | 408,415 | 722,220 | 201,982 | ||||||||||||
| Shares redeemed |
(1,570,015 | ) | (10,858,399 | ) | (2,176,690 | ) | (1,744,019 | ) | ||||||||
| Net increase (decrease) in net assets |
$ | 4,836,315 | $ | 7,402,910 | $ | 2,872,122 | $ | 4,003,310 | ||||||||
| Lord Abbett Growth & Income Fund (shares) |
||||||||||||||||
| Shares sold |
11,085,638 | 14,884,765 | 760,127 | 928,732 | ||||||||||||
| Subscriptions in-kind (b) |
— | 61,521,818 | — | — | ||||||||||||
| Shares issued as reinvestment of distributions |
2,990,839 | 6,551,173 | 69,848 | 120,741 | ||||||||||||
| Shares redeemed |
(15,813,249 | ) | (16,973,942 | ) | (449,032 | ) | (165,243 | ) | ||||||||
| Net increase (decrease) in shares outstanding |
(1,736,772 | ) | 65,983,814 | 380,943 | 884,230 | |||||||||||
| Beginning of period |
66,298,532 | 314,718 | 1,254,127 | 369,897 | ||||||||||||
| End of period |
64,561,760 | 66,298,532 | 1,635,070 | 1,254,127 | ||||||||||||
| Lord Abbett Growth & Income Fund ($) |
||||||||||||||||
| Net proceeds from sales |
$ | 81,259,922 | $ | 80,394,556 | $ | 6,035,253 | $ | 6,630,141 | ||||||||
| Subscriptions in-kind (b) |
— | 342,061,308 | — | — | ||||||||||||
| Net proceeds on reinvestment of distributions |
22,281,747 | 49,526,868 | 518,969 | 911,598 | ||||||||||||
| Shares redeemed |
(124,677,960 | ) | (122,254,652 | ) | (3,470,534 | ) | (1,317,548 | ) | ||||||||
| Net increase (decrease) in net assets |
$ | (21,136,291 | ) | $ | 349,728,080 | $ | 3,083,688 | $ | 6,224,191 | |||||||
| WMC Blue Chip Mid Cap Fund (shares) |
||||||||||||||||
| Shares sold |
4,678,564 | 2,493,643 | 263,704 | 429,406 | ||||||||||||
| Shares issued as reinvestment of distributions |
4,691 | 1,443 | — | 850 | ||||||||||||
| Shares redeemed |
(2,346,045 | ) | (1,168,027 | ) | (858,621 | ) | (444,353 | ) | ||||||||
| Net increase (decrease) in shares outstanding |
2,337,210 | 1,327,059 | (594,917 | ) | (14,097 | ) | ||||||||||
| Beginning of period |
6,247,928 | 4,920,869 | 3,335,675 | 3,349,772 | ||||||||||||
| End of period |
8,585,138 | 6,247,928 | 2,740,758 | 3,335,675 | ||||||||||||
318
Table of Contents
| NOTES TO FINANCIAL STATEMENTS (Continued) | Sun Capital Advisers Trust |
| Initial Class Shares | Service Class Shares | |||||||||||||||
| Year Ended December 31, 2010 |
Year Ended December 31, 2009 |
Year Ended December 31, 2010 |
Year Ended December 31, 2009 |
|||||||||||||
| WMC Blue Chip Mid Cap Fund ($) |
||||||||||||||||
| Net proceeds from sales |
$ | 62,074,414 | $ | 25,342,933 | $ | 3,374,448 | $ | 4,068,254 | ||||||||
| Net proceeds on reinvestment of distributions |
60,133 | 16,377 | — | 9,615 | ||||||||||||
| Shares redeemed |
(31,559,949 | ) | (11,534,225 | ) | (11,493,533 | ) | (4,663,862 | ) | ||||||||
| Net increase (decrease) in net assets |
$ | 30,574,598 | $ | 13,825,085 | $ | (8,119,085 | ) | $ | (585,993 | ) | ||||||
| WMC Large Cap Growth Fund (shares) |
||||||||||||||||
| Shares sold |
6,364,356 | 13,334,566 | 415,338 | 247,637 | ||||||||||||
| Shares issued as reinvestment of distributions |
65,688 | 26,292 | 1,109 | 4,445 | ||||||||||||
| Shares redeemed |
(7,040,501 | ) | (829,734 | ) | (678,065 | ) | (664,821 | ) | ||||||||
| Net increase (decrease) in shares outstanding |
(610,457 | ) | 12,531,124 | (261,618 | ) | (412,739 | ) | |||||||||
| Beginning of period |
18,350,627 | 5,819,503 | 2,208,247 | 2,620,986 | ||||||||||||
| End of period |
17,740,170 | 18,350,627 | 1,946,629 | 2,208,247 | ||||||||||||
| WMC Large Cap Growth Fund ($) |
||||||||||||||||
| Net proceeds from sales |
$ | 51,480,956 | $ | 91,673,236 | $ | 3,355,349 | $ | 1,673,407 | ||||||||
| Net proceeds on reinvestment of distributions |
545,213 | 197,983 | 9,148 | 33,289 | ||||||||||||
| Shares redeemed |
(61,907,003 | ) | (5,576,567 | ) | (5,740,631 | ) | (4,435,351 | ) | ||||||||
| Net increase (decrease) in net assets |
$ | (9,880,834 | ) | $ | 86,294,652 | $ | (2,376,134 | ) | $ | (2,728,655 | ) | |||||
| Global Real Estate Fund (shares) |
||||||||||||||||
| Shares sold |
2,802,255 | 4,108,295 | 755,136 | 3,685,040 | ||||||||||||
| Shares issued as reinvestment of distributions |
1,175,193 | 287,905 | 1,176,532 | 417,264 | ||||||||||||
| Shares redeemed |
(1,750,396 | ) | (1,930,311 | ) | (1,968,579 | ) | (5,741,347 | ) | ||||||||
| Net increase (decrease) in shares outstanding |
2,227,052 | 2,465,889 | (36,911 | ) | (1,639,043 | ) | ||||||||||
| Beginning of period |
7,564,803 | 5,098,914 | 11,338,761 | 12,977,804 | ||||||||||||
| End of period |
9,791,855 | 7,564,803 | 11,301,850 | 11,338,761 | ||||||||||||
| Global Real Estate Fund ($) |
||||||||||||||||
| Net proceeds from sales |
$ | 31,073,659 | $ | 34,655,047 | $ | 9,189,692 | $ | 22,154,045 | ||||||||
| Net proceeds on reinvestment of distributions |
12,598,073 | 3,025,884 | 13,918,369 | 4,786,025 | ||||||||||||
| Shares redeemed |
(19,588,315 | ) | (17,463,407 | ) | (24,464,186 | ) | (58,113,756 | ) | ||||||||
| Net increase (decrease) in net assets |
$ | 24,083,417 | $ | 20,217,524 | $ | (1,356,125 | ) | $ | (31,173,686 | ) | ||||||
| Ibbotson Tactical Opportunities Fund (shares)(a) |
||||||||||||||||
| Shares sold |
43,300,126 | |||||||||||||||
| Shares redeemed |
(1,870 | ) | ||||||||||||||
| Net increase (decrease) in shares outstanding |
43,298,256 | |||||||||||||||
| Beginning of period |
1 | |||||||||||||||
| End of period |
43,298,257 | |||||||||||||||
319
Table of Contents
| NOTES TO FINANCIAL STATEMENTS (Continued) | Sun Capital Advisers Trust |
| Initial Class Shares | Service Class Shares | |||||||||||||||
| Year Ended December 31, 2010 |
Year Ended December 31, 2009 |
Year Ended December 31, 2010 |
Year Ended December 31, 2009 |
|||||||||||||
| Ibbotson Tactical Opportunities Fund ($)(a) |
||||||||||||||||
| Net proceeds from sales |
$ | 434,362,406 | ||||||||||||||
| Shares redeemed |
(19,650 | ) | ||||||||||||||
| Net increase (decrease) in net assets |
$ | 434,342,756 | ||||||||||||||
| Investment Grade Bond Fund (shares) |
||||||||||||||||
| Shares sold |
14,965,112 | 11,185,943 | 6,497,983 | 4,491,182 | ||||||||||||
| Shares issued as reinvestment of distributions |
862,977 | 416,021 | 353,970 | 191,092 | ||||||||||||
| Shares redeemed |
(4,833,373 | ) | (1,077,204 | ) | (370,097 | ) | (324,991 | ) | ||||||||
| Net increase (decrease) in shares outstanding |
10,994,716 | 10,524,760 | 6,481,856 | 4,357,283 | ||||||||||||
| Beginning of period |
15,106,417 | 4,581,657 | 7,039,119 | 2,681,836 | ||||||||||||
| End of period |
26,101,133 | 15,106,417 | 13,520,975 | 7,039,119 | ||||||||||||
| Investment Grade Bond Fund ($) |
||||||||||||||||
| Net proceeds from sales |
$ | 139,297,497 | $ | 95,812,537 | $ | 61,097,755 | $ | 39,095,291 | ||||||||
| Net proceeds on reinvestment of distributions |
8,093,261 | 3,607,789 | 3,343,693 | 1,664,422 | ||||||||||||
| Shares redeemed |
(45,521,961 | ) | (9,011,151 | ) | (3,467,580 | ) | (2,700,076 | ) | ||||||||
| Net increase (decrease) in net assets |
$ | 101,868,797 | $ | 90,409,175 | $ | 60,973,868 | $ | 38,059,637 | ||||||||
| Money Market Fund (shares) |
||||||||||||||||
| Shares sold |
59,695,332 | 50,417,264 | 91,786,435 | 105,833,678 | ||||||||||||
| Shares issued as reinvestment of distributions |
153,247 | 331,634 | — | 8,299 | ||||||||||||
| Shares redeemed |
(80,077,232 | ) | (113,149,690 | ) | (89,367,222 | ) | (43,671,150 | ) | ||||||||
| Net increase (decrease) in shares outstanding |
(20,228,653 | ) | (62,400,792 | ) | 2,419,213 | 62,170,827 | ||||||||||
| Beginning of period |
87,989,958 | 150,390,750 | 116,305,089 | 54,134,262 | ||||||||||||
| End of period |
67,761,305 | 87,989,958 | 118,724,302 | 116,305,089 | ||||||||||||
| Money Market Fund ($) |
||||||||||||||||
| Net proceeds from sales |
$ | 59,695,332 | $ | 50,417,264 | $ | 91,786,435 | $ | 105,833,678 | ||||||||
| Net proceeds on reinvestment of distributions |
153,247 | 331,634 | — | 8,299 | ||||||||||||
| Shares redeemed |
(80,077,232 | ) | (113,149,690 | ) | (89,367,222 | ) | (43,671,150 | ) | ||||||||
| Net increase (decrease) in net assets |
$ | (20,228,653 | ) | $ | (62,400,792 | ) | $ | 2,419,213 | $ | 62,170,827 | ||||||
| BlackRock Inflation Protected Bond Fund (shares) |
||||||||||||||||
| Shares sold |
10,086,435 | 9,577,023 | 8,182,656 | 7,285,641 | ||||||||||||
| Shares issued as reinvestment of distributions |
362,109 | 272,217 | 237,149 | 175,494 | ||||||||||||
| Shares redeemed |
(272,165 | ) | (411,460 | ) | (860,104 | ) | (252,520 | ) | ||||||||
| Net increase (decrease) in shares outstanding |
10,176,379 | 9,437,780 | 7,559,701 | 7,208,615 | ||||||||||||
| Beginning of period |
10,279,716 | 841,936 | 7,641,999 | 433,384 | ||||||||||||
| End of period |
20,456,095 | 10,279,716 | 15,201,700 | 7,641,999 | ||||||||||||
320
Table of Contents
| NOTES TO FINANCIAL STATEMENTS (Continued) | Sun Capital Advisers Trust |
| Initial Class Shares | Service Class Shares | |||||||||||||||
| Year Ended December 31, 2010 |
Year Ended December 31, 2009 |
Year Ended December 31, 2010 |
Year Ended December 31, 2009 |
|||||||||||||
| BlackRock Inflation Protected Bond Fund ($) |
||||||||||||||||
| Net proceeds from sales |
$ | 106,668,556 | $ | 96,862,111 | $ | 86,538,078 | $ | 74,124,269 | ||||||||
| Net proceeds on reinvestment of distributions |
3,858,520 | 2,798,749 | 2,521,522 | 1,803,199 | ||||||||||||
| Shares redeemed |
(2,890,510 | ) | (4,267,952 | ) | (9,155,496 | ) | (2,558,702 | ) | ||||||||
| Net increase (decrease) in net assets |
$ | 107,636,566 | $ | 95,392,908 | $ | 79,904,104 | $ | 73,368,766 | ||||||||
| Goldman Sachs Short Duration Fund (shares) |
||||||||||||||||
| Shares sold |
24,391,949 | 95,717,794 | 4,779,074 | 5,195,337 | ||||||||||||
| Shares issued as reinvestment of distributions |
1,423,197 | 1,824,407 | 162,967 | 219,420 | ||||||||||||
| Shares redeemed |
(13,380,910 | ) | (17,954,165 | ) | (905,179 | ) | (1,182,738 | ) | ||||||||
| Net increase (decrease) in shares outstanding |
12,434,236 | 79,588,036 | 4,036,862 | 4,232,019 | ||||||||||||
| Beginning of period |
84,977,752 | 5,389,716 | 10,493,826 | 6,261,807 | ||||||||||||
| End of period |
97,411,988 | 84,977,752 | 14,530,688 | 10,493,826 | ||||||||||||
| Goldman Sachs Short Duration Fund ($) |
||||||||||||||||
| Net proceeds from sales |
$ | 251,573,909 | $ | 972,599,536 | $ | 49,272,769 | $ | 53,062,733 | ||||||||
| Net proceeds on reinvestment of distributions |
14,692,322 | 18,720,907 | 1,681,008 | 2,248,123 | ||||||||||||
| Shares redeemed |
(137,964,965 | ) | (183,043,674 | ) | (9,324,889 | ) | (12,026,447 | ) | ||||||||
| Net increase (decrease) in net assets |
$ | 128,301,266 | $ | 808,276,769 | $ | 41,628,888 | $ | 43,284,409 | ||||||||
| PIMCO High Yield Fund (shares) |
||||||||||||||||
| Shares sold |
5,534,887 | 12,167,657 | 1,052,578 | 1,535,138 | ||||||||||||
| Shares issued as reinvestment of distributions |
965,971 | 863,319 | 224,053 | 242,170 | ||||||||||||
| Shares redeemed |
(1,992,484 | ) | (3,651,290 | ) | (606,972 | ) | (692,874 | ) | ||||||||
| Net increase (decrease) in shares outstanding |
4,508,374 | 9,379,686 | 669,659 | 1,084,434 | ||||||||||||
| Beginning of period |
9,767,948 | 388,262 | 2,608,495 | 1,524,061 | ||||||||||||
| End of period |
14,276,322 | 9,767,948 | 3,278,154 | 2,608,495 | ||||||||||||
| PIMCO High Yield Fund ($) |
||||||||||||||||
| Net proceeds from sales |
$ | 53,529,410 | $ | 100,264,761 | $ | 10,202,106 | $ | 13,216,870 | ||||||||
| Net proceeds on reinvestment of distributions |
9,348,921 | 7,862,861 | 2,167,856 | 2,182,809 | ||||||||||||
| Shares redeemed |
(19,168,429 | ) | (31,827,180 | ) | (5,826,715 | ) | (6,196,259 | ) | ||||||||
| Net increase (decrease) in net assets |
$ | 43,709,902 | $ | 76,300,442 | $ | 6,543,247 | $ | 9,203,420 | ||||||||
| PIMCO Total Return Fund (shares) |
||||||||||||||||
| Shares sold |
12,666,177 | 12,682,052 | 20,371,783 | 20,320,071 | ||||||||||||
| Shares issued as reinvestment of distributions |
521,269 | 318,228 | 732,251 | 496,571 | ||||||||||||
| Shares redeemed |
(2,711,374 | ) | (1,194,947 | ) | (1,439,317 | ) | (481,250 | ) | ||||||||
| Net increase (decrease) in shares outstanding |
10,476,072 | 11,805,333 | 19,664,717 | 20,335,392 | ||||||||||||
| Beginning of period |
13,116,015 | 1,310,682 | 22,079,795 | 1,744,403 | ||||||||||||
| End of period |
23,592,087 | 13,116,015 | 41,744,512 | 22,079,795 | ||||||||||||
321
Table of Contents
| NOTES TO FINANCIAL STATEMENTS (Continued) | Sun Capital Advisers Trust |
| Initial Class Shares | Service Class Shares | |||||||||||||||
| Year Ended December 31, 2010 |
Year Ended December 31, 2009 |
Year Ended December 31, 2010 |
Year Ended December 31, 2009 |
|||||||||||||
| PIMCO Total Return Fund ($) |
||||||||||||||||
| Net proceeds from sales |
$ | 145,027,137 | $ | 137,256,966 | $ | 234,001,284 | $ | 220,437,166 | ||||||||
| Net proceeds on reinvestment of distributions |
6,056,776 | 3,496,227 | 8,508,993 | 5,461,863 | ||||||||||||
| Shares redeemed |
(31,454,819 | ) | (12,737,635 | ) | (16,495,450 | ) | (5,218,139 | ) | ||||||||
| Net increase (decrease) in net assets |
$ | 119,629,094 | $ | 128,015,558 | $ | 226,014,827 | $ | 220,680,890 | ||||||||
| Ibbotson Balanced Fund (shares) |
||||||||||||||||
| Shares sold |
137,449 | 44,827 | 65,391,657 | 46,286,079 | ||||||||||||
| Shares issued as reinvestment of distributions |
2,104 | 51 | 1,396,512 | 7,328 | ||||||||||||
| Shares redeemed |
(42,608 | ) | (11,574 | ) | (421,503 | ) | (14,111 | ) | ||||||||
| Net increase (decrease) in shares outstanding |
96,945 | 33,304 | 66,366,666 | 46,279,296 | ||||||||||||
| Beginning of period |
39,450 | 6,146 | 50,555,261 | 4,275,965 | ||||||||||||
| End of period |
136,395 | 39,450 | 116,921,927 | 50,555,261 | ||||||||||||
| Ibbotson Balanced Fund ($) |
||||||||||||||||
| Net proceeds from sales |
$ | 1,590,393 | $ | 456,674 | $ | 752,725,659 | $ | 458,013,309 | ||||||||
| Net proceeds on reinvestment of distributions |
24,152 | 548 | 16,017,993 | 78,554 | ||||||||||||
| Shares redeemed |
(495,419 | ) | (107,698 | ) | (4,746,985 | ) | (127,291 | ) | ||||||||
| Net increase (decrease) in net assets |
$ | 1,119,126 | $ | 349,524 | $ | 763,996,667 | $ | 457,964,572 | ||||||||
| Ibbotson Conservative Fund (shares) |
||||||||||||||||
| Shares sold |
301,852 | 155,902 | 31,046,199 | 29,858,809 | ||||||||||||
| Shares issued as reinvestment of distributions |
4,356 | 403 | 999,109 | 8,950 | ||||||||||||
| Shares redeemed |
(33,787 | ) | (5,200 | ) | (1,194,488 | ) | (217,241 | ) | ||||||||
| Net increase (decrease) in shares outstanding |
272,421 | 151,105 | 30,850,820 | 29,650,518 | ||||||||||||
| Beginning of period |
156,155 | 5,050 | 33,350,123 | 3,699,605 | ||||||||||||
| End of period |
428,576 | 156,155 | 64,200,943 | 33,350,123 | ||||||||||||
| Ibbotson Conservative Fund ($) |
||||||||||||||||
| Net proceeds from sales |
$ | 3,469,227 | $ | 1,610,584 | $ | 347,920,672 | $ | 293,244,934 | ||||||||
| Net proceeds on reinvestment of distributions |
48,832 | 4,245 | 11,210,004 | 94,422 | ||||||||||||
| Shares redeemed |
(384,667 | ) | (55,236 | ) | (13,622,703 | ) | (2,168,940 | ) | ||||||||
| Net increase (decrease) in net assets |
$ | 3,133,392 | $ | 1,559,593 | $ | 345,507,973 | $ | 291,170,416 | ||||||||
| Ibbotson Growth Fund (shares) |
||||||||||||||||
| Shares sold |
129,754 | 27,376 | 9,249,698 | 36,360,653 | ||||||||||||
| Shares issued as reinvestment of distributions |
2,641 | 58 | 1,115,174 | 7,506 | ||||||||||||
| Shares redeemed |
(28,749 | ) | (11,861 | ) | (3,020,369 | ) | (226,939 | ) | ||||||||
| Net increase (decrease) in shares outstanding |
103,646 | 15,573 | 7,344,503 | 36,141,220 | ||||||||||||
| Beginning of period |
25,946 | 10,373 | 39,883,256 | 3,742,036 | ||||||||||||
| End of period |
129,592 | 25,946 | 47,227,759 | 39,883,256 | ||||||||||||
322
Table of Contents
| NOTES TO FINANCIAL STATEMENTS (Continued) | Sun Capital Advisers Trust |
| Initial Class Shares | Service Class Shares | |||||||||||||||
| Year Ended December 31, 2010 |
Year Ended December 31, 2009 |
Year Ended December 31, 2010 |
Year Ended December 31, 2009 |
|||||||||||||
| Ibbotson Growth Fund ($) |
||||||||||||||||
| Net proceeds from sales |
$ | 1,499,274 | $ | 273,347 | $ | 105,424,712 | $ | 355,226,003 | ||||||||
| Net proceeds on reinvestment of distributions |
29,899 | 620 | 12,634,921 | 80,391 | ||||||||||||
| Shares redeemed |
(334,194 | ) | (125,048 | ) | (34,737,536 | ) | (2,349,550 | ) | ||||||||
| Net increase (decrease) in net assets |
$ | 1,194,979 | $ | 148,919 | $ | 83,322,097 | $ | 352,956,844 | ||||||||
| (a) | The BlackRock International Index Fund and the Ibbotson Tactical Opportunities Fund commenced operations on November 15, 2010 and share activity presented is for the period November 15, 2010 to December 31, 2010. |
| (b) | During the year ended December 31, 2009, Goldman Sachs Mid Cap Value Fund and Lord Abbett Growth & Income Fund received securities with a value of $86,276,287 and $342,061,308, respectively, in exchange for 15,162,792 and 61,521,818 fund shares, respectively. Pursuant to a substitution order granted by the Securities and Exchange Commission, these assets were transferred from other third party funds that serve as investment options for certain Sun Life variable insurance products. |
11. FEDERAL INCOME TAX INFORMATION
Each Fund is treated as a separate entity for Federal tax purposes. Each Fund intends to elect or has elected to be treated and intends to qualify each year as a regulated investment company under Subchapter M of the Internal Revenue Code, as amended (“the Code”). By so qualifying, the Funds will not be subject to Federal income taxes to the extent that they distribute all of their taxable income, including realized capital gains, for the fiscal year. In addition, by distributing during each calendar year substantially all of their net investment income, capital gains and certain other amounts, if any, the Funds will not be subject to a Federal excise tax. As a result, no provision for income taxes is required.
There are no unrecognized tax benefits in the accompanying financial statements in connection with the tax positions taken by each Fund. Each of the Fund’s federal tax returns for the prior three fiscal years remains subject to examination by the Internal Revenue Service.
Capital accounts within the financial statements are adjusted for permanent book-tax differences. These adjustments have no impact on net assets or results of operations. Temporary book-tax differences will reverse in a subsequent period.
Book-tax differences are primarily due to treatment of derivatives, distributions received from REIT securities, currency gain (loss), Passive Foreign Investment Companies, capital loss carryforwards, and losses deferred due to wash sales.
As of December 31, 2010, the components of distributable earnings on a tax basis were as follows:
| Fund Name |
Undistributed Ordinary Income |
Undistributed Long-Term Capital Gains |
Net Unrealized Appreciation/ (Depreciation) |
|||||||||
| AllianceBernstein International Value |
$ | 3,470,180 | $ | 3,136,768 | $ | 6,543,788 | ||||||
| BlackRock International Index |
17,973 | 13,336 | 1,914,914 | |||||||||
| BlackRock Large Cap Index |
12,869,483 | 6,148,421 | 5,792,517 | |||||||||
| BlackRock Small Cap Index |
721,272 | — | 17,166,436 | |||||||||
| Goldman Sachs Mid Cap Value |
11,707,801 | 14,560,923 | 58,510,828 | |||||||||
| Columbia Small Cap Value |
10,446,775 | 445,962 | 4,100,995 | |||||||||
323
Table of Contents
| NOTES TO FINANCIAL STATEMENTS (Continued) | Sun Capital Advisers Trust |
| Fund Name |
Undistributed Ordinary Income |
Undistributed Long-Term Capital Gains |
Net Unrealized Appreciation/ (Depreciation) |
|||||||||
| Davis Venture Value |
$ | 3,350,920 | $ | 17,824,141 | $ | 79,551,988 | ||||||
| Invesco Small Cap Growth |
678,054 | 863,692 | 6,174,788 | |||||||||
| Lord Abbett Growth & Income |
21,095,654 | 63,730,740 | 129,814,973 | |||||||||
| WMC Blue Chip Mid Cap |
105,271 | — | 30,928,781 | |||||||||
| WMC Large Cap Growth |
591,957 | — | 34,955,715 | |||||||||
| Global Real Estate |
13,028,034 | — | 33,267,220 | |||||||||
| Ibbotson Tactical Opportunities |
4,589,381 | 66,819 | 16,423,905 | |||||||||
| Investment Grade Bond |
5,717,207 | 1,598,718 | 5,051,629 | |||||||||
| Money Market |
1,598 | — | — | |||||||||
| BlackRock Inflation Protected Bond |
10,494,179 | 2,865,839 | (3,120,094 | ) | ||||||||
| Goldman Sachs Short Duration |
2,690,103 | 4,395,034 | 10,113,356 | |||||||||
| PIMCO High Yield |
2,877,545 | 2,057,800 | 14,861,607 | |||||||||
| PIMCO Total Return |
16,764,173 | 8,333,062 | 6,006,532 | |||||||||
| Ibbotson Balanced |
24,163,483 | 54,014,002 | 106,886,320 | |||||||||
| Ibbotson Conservative |
11,965,670 | 18,266,477 | 57,147,083 | |||||||||
| Ibbotson Growth |
10,493,459 | 47,750,205 | 63,095,861 | |||||||||
At December 31, 2010, the following Funds had available for federal income tax purposes capital loss carryovers which can be used to offset certain future realized capital gains.
| Fund Name |
Expires December 31, 2017 |
|||
| BlackRock Small Cap Index |
$ | 2,600,538 | ||
| WMC Blue Chip Mid Cap |
3,090,029 | |||
| WMC Large Cap Growth |
559,254 | |||
| Global Real Estate |
80,503,399 | |||
Net capital loss carryforwards may be applied against any net realized taxable gains in succeeding years, subject to the carryforward period limitations, where applicable. Effective for taxable years beginning after December 22, 2010, the Regulated Investment Company Modernization Act of 2010 (the “Modernization Act”) changed the capital loss carryforward rules. Capital losses generated in tax years beginning after the date of enactment may now be carried forward indefinitely, and retain the character of the original loss. Under pre-enactment law, capital losses could be carried forward for up to eight tax years as short-term capital losses. The provisions affecting the utilization of capital loss carryforwards under the Modernization Act also require the utilization of post-enactment losses prior to the utilization of pre-enactment losses. Net capital loss carryforwards for the Funds shown in the above table are from pre-enactment years and are, therefore, subject to the eight-year carryforward period and possible expiration.
The following Funds utilized capital loss carryforwards during the year ended December 31, 2010, as follows:
| Fund Name |
Amount | |||
| BlackRock Small Cap Index |
$ | 44,050,638 | ||
| Davis Venture Value |
9,362,329 | |||
| WMC Blue Chip Mid Cap |
15,195,309 | |||
| WMC Large Cap Growth |
20,929,423 | |||
| Global Real Estate |
9,868,723 | |||
324
Table of Contents
| NOTES TO FINANCIAL STATEMENTS (Continued) | Sun Capital Advisers Trust |
Under current tax law, certain capital or currency losses realized after October 31 within a taxable year may be deferred and treated as occurring on the first day of the following tax year. For the tax period ended December 31, 2010, the following Funds elected to defer net losses arising between November 1, 2010 and December 31, 2010.
| Fund Name |
Capital Loss Deferral |
|||
| PIMCO Total Return |
$ | 333,587 | ||
The Investment Grade Bond Fund, Money Market Fund, BlackRock Inflation Protected Bond Fund, Goldman Sachs Short Duration Fund, PIMCO High Yield Fund and PIMCO Total Return Fund declare dividends from net investment income, if any, daily and pay dividends monthly. Each of the remaining Funds in the Trust declare and pay dividends from net investment income, if any, at least annually. Each Fund distributes its net realized capital gains, if any, at least annually. Income and capital gain distributions are determined in accordance with income tax regulations which may differ from U.S. GAAP.
The tax character of distributions paid during the year ended December 31, 2010, was as follows:
| Fund Name |
Ordinary Income |
Long-Term Capital Gains |
||||||
| AllianceBernstein International Value |
$ | 1,251,307 | $ | 39,109 | ||||
| BlackRock Large Cap Index |
241,745 | — | ||||||
| BlackRock Small Cap Index |
311,553 | — | ||||||
| Goldman Sachs Mid Cap Value |
5,547,330 | 637,338 | ||||||
| Columbia Small Cap Value |
3,987,622 | 325,139 | ||||||
| Davis Venture Value |
1,611,009 | — | ||||||
| Invesco Small Cap Growth |
1,862,909 | 337,974 | ||||||
| Lord Abbett Growth & Income |
22,800,716 | — | ||||||
| WMC Blue Chip Mid Cap |
60,133 | — | ||||||
| WMC Large Cap Growth |
554,361 | — | ||||||
| Global Real Estate |
26,516,442 | — | ||||||
| Investment Grade Bond |
11,436,954 | — | ||||||
| Money Market |
153,247 | — | ||||||
| BlackRock Inflation Protected Bond |
6,035,581 | 344,461 | ||||||
| Goldman Sachs Short Duration |
16,012,555 | 360,775 | ||||||
| PIMCO High Yield |
11,470,465 | 46,312 | ||||||
| PIMCO Total Return |
14,472,398 | 93,371 | ||||||
| Ibbotson Balanced |
15,191,811 | 850,334 | ||||||
| Ibbotson Conservative |
10,796,952 | 461,884 | ||||||
| Ibbotson Growth |
11,613,647 | 1,051,173 | ||||||
325
Table of Contents
| NOTES TO FINANCIAL STATEMENTS (Continued) | Sun Capital Advisers Trust |
The tax character of distributions paid during the year ended December 31, 2009, was as follows:
| Fund |
Ordinary Income |
Long-Term Capital Gain |
||||||
| AllianceBernstein International Value |
$ | 2,506,917 | $ | — | ||||
| BlackRock Large Cap Index |
692,972 | — | ||||||
| BlackRock Small Cap Index |
94,422 | — | ||||||
| Goldman Sachs Mid Cap Value |
18,842,861 | — | ||||||
| Columbia Small Cap Value |
1,256,752 | — | ||||||
| Davis Venture Value |
665,811 | — | ||||||
| Invesco Small Cap Growth |
545,255 | 65,142 | ||||||
| Lord Abbett Growth & Income |
50,438,466 | — | ||||||
| WMC Blue Chip Mid Cap |
25,992 | — | ||||||
| WMC Large Cap Growth |
231,272 | — | ||||||
| Global Real Estate |
6,427,509 | 1,384,400 | ||||||
| Investment Grade Bond |
5,245,640 | 26,571 | ||||||
| Money Market |
339,933 | — | ||||||
| BlackRock Inflation Protected Bond |
4,545,855 | 56,093 | ||||||
| Goldman Sachs Short Duration |
18,976,898 | 1,992,132 | ||||||
| PIMCO High Yield |
9,989,286 | 56,384 | ||||||
| PIMCO Total Return |
8,084,038 | 874,052 | ||||||
| Ibbotson Balanced |
71,023 | 8,079 | ||||||
| Ibbotson Conservative |
86,730 | 11,937 | ||||||
| Ibbotson Growth |
79,203 | 1,808 | ||||||
The identified cost of investments and their respective gross unrealized appreciation and depreciation for federal income tax purposes at December 31, 2010 were as follows:
| Fund Name |
Identified Cost |
Gross Unrealized | Net Appreciation/ (Depreciation) |
|||||||||||||
| Appreciation | (Depreciation) | |||||||||||||||
| AllianceBernstein International Value |
$ | 67,594,246 | $ | 8,055,551 | $ | (1,508,512 | ) | $ | 6,547,039 | |||||||
| BlackRock International Index |
52,204,961 | 2,595,786 | (686,043 | ) | 1,909,743 | |||||||||||
| BlackRock Large Cap Index |
100,304,064 | 6,551,309 | (758,791 | ) | 5,792,518 | |||||||||||
| BlackRock Small Cap Index |
163,132,795 | 19,250,573 | (2,084,137 | ) | 17,166,436 | |||||||||||
| Goldman Sachs Mid Cap Value |
213,654,542 | 60,007,661 | (1,496,833 | ) | 58,510,828 | |||||||||||
| Columbia Small Cap Value |
57,098,023 | 5,435,600 | (1,334,605 | ) | 4,100,995 | |||||||||||
| Davis Venture Value |
344,461,574 | 80,148,904 | (602,000 | ) | 79,546,904 | |||||||||||
| Invesco Small Cap Growth |
25,183,901 | 6,328,947 | (154,159 | ) | 6,174,788 | |||||||||||
| Lord Abbett Growth & Income |
429,207,725 | 131,079,875 | (1,264,902 | ) | 129,814,973 | |||||||||||
| WMC Blue Chip Mid Cap |
137,976,543 | 32,061,021 | (1,132,240 | ) | 30,928,781 | |||||||||||
| WMC Large Cap Growth |
156,455,146 | 36,318,565 | (1,362,998 | ) | 34,955,567 | |||||||||||
| Global Real Estate |
220,413,264 | 37,276,080 | (4,012,407 | ) | 33,263,673 | |||||||||||
| Ibbotson Tactical Opportunities |
437,622,981 | 16,770,628 | (346,723 | ) | 16,423,905 | |||||||||||
| Investment Grade Bond |
450,975,670 | 9,299,138 | (4,247,509 | ) | 5,051,629 | |||||||||||
| Money Market |
186,917,274 | — | — | — | ||||||||||||
| BlackRock Inflation Protected Bond |
381,899,640 | 3,462,641 | (5,805,297 | ) | (2,342,656 | ) | ||||||||||
| Goldman Sachs Short Duration |
1,290,461,843 | 12,437,758 | (2,324,402 | ) | 10,113,356 | |||||||||||
| PIMCO High Yield |
155,935,350 | 15,645,503 | (1,067,531 | ) | 14,577,972 | |||||||||||
| PIMCO Total Return |
936,863,877 | 14,241,058 | (8,762,012 | ) | 5,479,046 | |||||||||||
| Ibbotson Balanced |
1,337,926,918 | 106,886,320 | — | 106,886,320 | ||||||||||||
| Ibbotson Conservative |
705,024,690 | 57,147,083 | — | 57,147,083 | ||||||||||||
| Ibbotson Growth |
527,591,138 | 63,095,861 | — | 63,095,861 | ||||||||||||
326
Table of Contents
| NOTES TO FINANCIAL STATEMENTS (Continued) | Sun Capital Advisers Trust |
12. INDEMNIFICATION
Under the Trust’s organizational documents, its officers and Trustees may be indemnified against certain liabilities and expenses arising out of the performance of their duties to the Trust. Additionally, in the normal course of business, the Trust enters into agreements with service providers that may contain indemnification clauses. The Trust’s maximum exposure under these agreements is unknown as this would involve future claims that may be made against the Trust that have not yet occurred.
13. EVALUATION OF SUBSEQUENT EVENTS
Management has determined that there are no material events through the issuance date of the financial statements that would require additional disclosure in the Funds’ financial statements.
327
Table of Contents
REPORT OF INDEPENDENT REGISTERED PUBLIC ACCOUNTING FIRM
To the Trustees and the Shareholders of Sun Capital Advisers Trust:
We have audited the accompanying statements of assets and liabilities, including the portfolios of investments of SC AllianceBernstein International Value Fund, SC BlackRock International Index Fund, SC BlackRock Large Cap Index Fund (formerly known as SC Oppenheimer Large Cap Core Fund), SC BlackRock Small Cap Index Fund (formerly known as SC Oppenheimer Main Street Small Cap Fund), SC Goldman Sachs Mid Cap Value Fund, SC Columbia Small Cap Value Fund (formerly known as SC Dreman Small Cap Value Fund), SC Davis Venture Value Fund, SC Invesco Small Cap Growth Fund (formerly known as SC AIM Small Cap Growth Fund), SC Lord Abbett Growth & Income Fund, SC WMC Blue Chip Mid Cap Fund, SC WMC Large Cap Growth Fund, Sun Capital Global Real Estate Fund, SC Ibbotson Tactical Opportunities Fund, Sun Capital Investment Grade Bond Fund, Sun Capital Money Market Fund, SC BlackRock Inflation Protected Bond Fund, SC Goldman Sachs Short Duration Fund, SC PIMCO High Yield Fund, SC PIMCO Total Return Fund, SC Ibbotson Balanced Fund, SC Ibbotson Conservative Fund (formerly known as SC Ibbotson Moderate Fund), and SC Ibbotson Growth Fund (collectively the “Funds”) (each a Fund of Sun Capital Advisers Trust, the “Trust”) as of December 31, 2010, and the related statements of operations, statements of changes in net assets and the financial highlights for each of the periods presented. These financial statements and financial highlights are the responsibility of the Trust’s management. Our responsibility is to express an opinion on these financial statements and financial highlights based on our audits.
We conducted our audits in accordance with the standards of the Public Company Accounting Oversight Board (United States). Those standards require that we plan and perform the audit to obtain reasonable assurance about whether the financial statements and financial highlights are free of material misstatement. The Trust is not required to have, nor were we engaged to perform, an audit of its internal control over financial reporting. Our audits included consideration of internal control over financial reporting as a basis for designing audit procedures that are appropriate in the circumstances, but not for the purpose of expressing an opinion on the effectiveness of the Trust’s internal control over financial reporting. Accordingly, we express no such opinion. An audit also includes examining, on a test basis, evidence supporting the amounts and disclosures in the financial statements, assessing the accounting principles used and significant estimates made by management, as well as evaluating the overall financial statement presentation. Our procedures included confirmation of securities owned as of December 31, 2010, by correspondence with the custodians and brokers; where replies were not received from brokers, we performed other auditing procedures. We believe that our audits provide a reasonable basis for our opinion.
In our opinion, such financial statements and financial highlights referred to above present fairly, in all material respects, the financial position of each of the Funds constituting Sun Capital Advisers Trust as of December 31, 2010, the results of their operations, the changes in their net assets and the financial highlights for each of the periods presented, in conformity with accounting principles generally accepted in the United States of America.
DELOITTE & TOUCHE LLP
Boston, Massachusetts
February 28, 2011
328
Table of Contents
PROXY VOTING POLICIES AND PROCEDURES AND VOTING RECORDS
A description of the policies and procedures that the Funds use to determine how to vote proxies relating to portfolio securities and information regarding how the Funds voted proxies relating to portfolio securities during the most recent 12-month period ended June 30 are available (i) without charge, upon request, by calling (800) 432-1102 x 3330 and (ii) on the U.S. Securities and Exchange Commission’s website at www.sec.gov.
QUARTERLY FILING OF PORTFOLIO HOLDINGS
The Funds file their complete schedule of investments with the U.S. Securities and Exchange Commission (“SEC”) for the first and third quarters of each fiscal year on Form N-Q. The Funds’ Form N-Q are (i) available on the SEC’s website at www.sec.gov; and (ii) available for review and copying at the SEC’s Public Reference Room in Washington, D.C. Information about the operations of the Public Reference Room may be obtained by calling (800) SEC-0330.
For the year ended December 31, 2010, the following Funds paid distributions which were designated as long-term capital gains dividends:
| Fund |
Amount | |||
| AllianceBernstein International Value |
$ | 39,109 | ||
| Goldman Sachs Mid Cap Value |
637,338 | |||
| Columbia Small Cap Value |
325,139 | |||
| Invesco Small Cap Growth |
337,974 | |||
| BlackRock Inflation Protected Bond |
344,461 | |||
| Goldman Sachs Short Duration |
360,775 | |||
| PIMCO High Yield |
46,312 | |||
| PIMCO Total Return |
93,371 | |||
| Ibbotson Balanced |
850,334 | |||
| Ibbotson Conservative |
461,884 | |||
| Ibbotson Growth |
1,051,173 | |||
For federal tax purposes, the following information is furnished with respect to the distributions of the Trust for its fiscal year ended December 31, 2010:
Percentage of distributions which qualify for the corporate dividends received deduction:
| Fund |
Percentage | |||
| BlackRock Large Cap Index |
100.00 | % | ||
| BlackRock Small Cap Index |
100.00 | % | ||
| Goldman Sachs Mid Cap Value |
9.47 | % | ||
| Columbia Small Cap Value |
8.12 | % | ||
| Davis Venture Value |
100.00 | % | ||
| Invesco Small Cap Growth |
5.45 | % | ||
| Lord Abbett Growth & Income |
7.91 | % | ||
| WMC Blue Chip Mid Cap |
100.00 | % | ||
| WMC Large Cap Growth |
100.00 | % | ||
| Global Real Estate |
0.84 | % | ||
| PIMCO High Yield |
0.37 | % | ||
| PIMCO Total Return |
1.01 | % | ||
| Ibbotson Balanced |
6.45 | % | ||
| Ibbotson Conservative |
4.88 | % | ||
| Ibbotson Growth |
8.49 | % | ||
329
Table of Contents
OTHER INFORMATION (Unaudited) (Continued)
The following Funds designate as income received from foreign sources and taxes paid to foreign countries the following amounts:
| Fund |
Foreign Source Income |
Foreign Taxes Paid |
||||||
| AllianceBernstein International Value |
$ | 2,160,437 | $ | 136,394 | ||||
| BlackRock International Index |
56,820 | 5,747 | ||||||
| Global Real Estate |
5,206,638 | 161,573 | ||||||
ADVISORY CONTRACT APPROVALS AND RENEWALS
Funds Having New Subadvisory Agreements Approved in August 2010:
SC BlackRock Small Cap Index Fund
SC BlackRock Large Cap Index Fund
Factors Considered by the Board of Trustees (the “Board”) in Connection with Approval of each Subadvisory Agreement.
The Trust’s Board approved a new subadvisory agreement for each Fund listed above at an in-person meeting held in August 2010. In terms of the process that the Trustees followed prior to approving each subadvisory agreement (together, the “subadvisory agreements”), Variable Contract Owners1 should know that:
| * | At present, all but one of the Trust’s Trustees, including the Board’s chairman, are independent of Sun Capital, which serves as investment adviser to each Fund, BlackRock Investment Management, LLC (“BIM”), which serves as subadviser to each Fund listed above, and their respective affiliates (“Independent Trustees”). |
| * | The Board engaged in a thorough review of each Fund’s subadvisory agreement. In this connection, the Board reviewed a wide range of materials furnished by Sun Capital and BIM, and met with and was advised by its independent legal counsel prior to reaching these decisions. In addition, the Board considered information furnished by Sun Capital in connection with the Board’s 2009 and 2010 contract reviews. |
In determining to approve each Fund’s subadvisory agreements, the Board considered all factors that it believed relevant to the interests of the Fund and Variable Contract Owners, including but not limited to:
| • | Fees and expenses. The proposed subadvisory fee schedules for each Fund, including (i) comparative information provided by Lipper regarding investment advisory and subadvisory fee rates paid to other advisers by similar funds; and (ii) as applicable, fee rates to be paid to BIM by each Fund relative to those paid by similar funds and institutional accounts advised by BIM. The Board also received and considered information regarding the differences in the type and level of services required for the Funds and institutional accounts more generally. The Board noted that the investment subadvisory fees to be paid to BIM will be paid by Sun Capital out of its fee, not by the Fund. The Board also noted that the subadvisory fee rate to be paid to BIM would be significantly less than the fee rate paid to the Funds’ prior subadviser, since the Fund would now employ a passive strategy, and that Sun Capital had in turn agreed to reduce its fee rate payable by the Fund. Taking into account the foregoing, the Board concluded that the proposed subadvisory fee schedules for each Fund represent reasonable compensation in light of the nature, extent and quality of the investment services expected to be provided to each such Fund. |
| 1 | Shares of the Funds will principally be owned by Sun Life (U.S.) and Sun Life (N.Y.) for the benefit of the owners of variable annuities and variable life insurance policies (“Variable Contract Owners”) issued by Sun Life (U.S.) or Sun Life (N.Y.). |
330
Table of Contents
OTHER INFORMATION (Unaudited) (Continued)
| • | Economies of scale. The Trustees observed that each Fund’s proposed subadvisory fee schedules contain breakpoints. The Board concluded that, to the extent economies of scale exist in the management of a Fund at its current asset level, each Fund’s fee schedule represents an appropriate sharing of such economies of scale among the Fund, Sun Capital and BIM. |
| • | Profitability; Other benefits to Sun Capital. The Trustees noted that they had considered Sun Capital’s profitability from managing the Funds in connection with the Trust’s 2010 annual contract review. In analyzing Sun Capital’s costs and profits and its affiliates’ costs in connection with its annual contract review, the Trustees also review the fees paid to and services provided by Sun Capital and its affiliates to each Fund for non-advisory services, such as distribution (including fees paid pursuant to Rule 12b-1 plans). The Trustees also consider other potential benefits to Sun Capital and its affiliates from their relationships with the Funds, including the roles of the Funds in supporting the variable contracts issued by Sun Life (U.S.) and Sun Life (N.Y.), both of which are affiliates of Sun Capital. |
| • | Investment performance. The Board considered BIM’s scale and focus on tracking error, transaction costs, and trading. The Board also considered BIM’s experience managing other similar funds and/or accounts. |
| • | Nature, quality and extent of services. The Board considered, among other things, BIM’s personnel (including particularly those personnel with responsibilities for providing services to the Funds), resources, policies and investment processes. In addition to meeting with representatives of Sun Capital and BIM, the Board also considered, among other things, Sun Capital’s representation that it was satisfied with the resources, compliance program and level of commitment expected to be put forth by BIM and its recommendation that each subadvisory agreement be approved. The Board also considered that the types of services to be provided under the subadvisory agreements were comparable to those typically found in agreements of such type. The Board concluded that the quality and range of services expected to be provided by BIM should benefit each Fund and its Variable Contract Owners. |
| • | Brokerage practices. The Board considered BIM’s practices regarding the selection and compensation of brokers and dealers executing portfolio transactions for the Funds, including the brokers’ and dealers’ provision of brokerage and research services to BIM. |
| • | Compliance. The Board considered BIM’s commitment to and record of compliance, including its written compliance policies and procedures. In this regard, the Board considered Sun Capital’s continued commitment of attention and resources to compliance functions relevant to the Funds’ operations, including the oversight of subadvisers. |
After due consideration of these and other factors that it considered relevant, the Board determined to approve each Fund’s subadvisory agreement, and concluded that the approval of such agreements was in the best interest of each Fund and the Variable Contract Owners.
In reaching this conclusion, the Board did not give particular weight to any single factor noted above. The Board considered these and other factors over the course of multiple meetings, certain of which were held in executive session with only the Independent Trustees and their counsel present. It is possible that individual Trustees may have weighed these factors differently in reaching their individual decisions to approve the subadvisory agreements.
331
Table of Contents
OTHER INFORMATION (Unaudited) (Continued)
Funds Having Investment Advisory and Subadvisory Agreements Approved Initially in August 2010:
SC BlackRock International Index Fund
SC Ibbotson Tactical Opportunities Fund
Factors Considered by the Board of Trustees (the “Board”) in Connection with Initial Approval of each Investment Advisory Agreement.
The Trust’s Board approved the initial investment advisory agreement and subadvisory agreement for each Fund listed above at an in-person meeting held in August 2010. In terms of the process that the Trustees followed prior to approving each investment advisory and subadvisory agreement (together, the “investment advisory agreements”), Variable Contract Owners2 should know that:
| * | At present, all but one of the Trust’s Trustees, including the Board’s chairman, are independent of Sun Capital, which serves as investment adviser to each Fund, each subadviser, and their respective affiliates (“Independent Trustees”). |
| * | In connection with reviewing the Funds’ investment advisory agreements, the Independent Trustees met on multiple occasions to discuss and consider the proposed arrangements, and were advised by, and held private meetings with, their independent legal counsel. |
| * | The Board engaged in a thorough review of each Fund’s investment advisory agreements. In this connection, the Board reviewed a wide range of materials furnished by Sun Capital and each subadviser prior to reaching these decisions. |
In determining to approve each Fund’s investment advisory agreements, the Board considered all factors that it believed relevant to the interests of the Fund and Variable Contract Owners, including but not limited to:
| • | Fees and expenses. The proposed investment advisory and investment subadvisory fee schedules for each Fund, including (i) comparative information provided by Lipper regarding investment advisory fee rates paid to other advisers by similar funds; and (ii) as applicable, fee rates to be paid to Sun Capital and each subadviser by each Fund relative to those paid by similar funds and institutional accounts advised by such firms. The Board also received and considered information regarding the differences in the type and level of services required for the Funds and institutional accounts more generally. The Board noted that the investment subadvisory fees paid to each Fund’s subadviser will be paid by Sun Capital out of its fee, not by the Fund. Taking into account the foregoing, the Board concluded that the proposed fee schedules for each Fund represent reasonable compensation in light of the nature, extent and quality of the investment services expected to be provided to each such Fund. |
| • | Economies of scale. Given the uncertainty regarding each Fund’s size and related operating costs, the Board deferred its evaluation of economies of scale to a future date. |
| • | Profitability; Other benefits to Sun Capital. Because the Funds had not yet commenced operations, no information regarding Sun Capital’s costs and profits from providing investment advisory services to the Funds could be considered by the Board. The Board did review and consider the fees to be paid to and services to be provided by Sun Capital and its affiliates to each Fund for non-advisory services, such as distribution (including fees paid pursuant to Rule 12b-1 plans). The Board also considered other potential |
| 2 | Shares of the SC BlackRock International Index Fund will principally be owned by Sun Life (U.S.) and Sun Life (N.Y.) for the benefit of the owners of variable annuities and variable life insurance policies (“Variable Contract Owners”) issued by Sun Life (U.S.) or Sun Life (N.Y.). Shares of SC Ibbotson Tactical Opportunities Fund are owned exclusively by SC Ibbotson Balanced Fund, SC Ibbotson Conservative Fund and SC Ibbotson Growth Fund, which are also series of the Trust. |
332
Table of Contents
OTHER INFORMATION (Unaudited) (Continued)
| benefits to Sun Capital and its affiliates from their relationships with the Funds, including the role of the Funds in supporting the variable contracts issued by Sun Life (U.S.) and Sun Life (N.Y.), both of which are affiliates of Sun Capital. The Board also considered the entrepreneurial risk associated with launching new funds. |
| • | Investment performance. Because the Funds had not yet commenced operations, no information relating to the Funds’ past performance could be considered by the Board. The Board did consider Sun Capital’s experience with overseeing the management of other funds, and each subadviser’s experience with managing other similar funds and/or accounts. |
| • | Nature, quality and extent of services. The Board considered, among other things, Sun Capital’s and each subadviser’s personnel (including particularly those personnel with responsibilities for providing services to the Funds), resources, policies and investment processes. In addition to meeting with representatives of Sun Capital and each subadviser, the Board also considered, among other things, Sun Capital’s representation that it was satisfied with the resources, compliance program and level of commitment expected to be put forth by each subadviser and its recommendation that each subadvisory agreement be approved. The Board also considered that the types of services to be provided under the advisory agreements were comparable to those typically found in agreements of such type. The Board concluded that the quality and range of services expected to be provided by Sun Capital and each subadviser should benefit each Fund and its Variable Contract Owners. |
| • | Brokerage practices. The Board considered the practices of Sun Capital and each subadviser regarding the selection and compensation of brokers and dealers executing portfolio transactions for the Funds, including the brokers’ and dealers’ provision of brokerage and research services to Sun Capital and each subadviser. |
| • | Compliance. The Board considered Sun Capital’s and each subadviser’s commitment to and record of compliance, including its written compliance policies and procedures. In this regard, the Board considered Sun Capital’s continued commitment of attention and resources to compliance functions relevant to the Funds’ operations, including the oversight of subadvisers. The Board also considered the Sun Life organization’s commitment of resources to its U.S. business more generally. |
After due consideration of these and other factors that it considered relevant, the Board determined to approve each Fund’s investment advisory agreement and investment subadvisory agreement, and concluded that the approval of such agreements was in the best interest of each Fund and the Variable Contract Owners.
In reaching this conclusion, the Board did not give particular weight to any single factor noted above. The Board considered these and other factors over the course of multiple meetings, certain of which were held in executive session with only the Independent Trustees and their counsel present. It is possible that individual Trustees may have weighed these factors differently in reaching their individual decisions to approve the investment advisory agreements.
333
Table of Contents
OTHER INFORMATION (Unaudited) (Continued)
Funds Having Investment Advisory and/or Subadvisory Agreements Renewed in November 2010:
Sun Capital Global Real Estate Fund
Sun Capital Investment Grade Bond Fund
Sun Capital Money Market Fund
SC AllianceBernstein International Value Fund
SC BlackRock Inflation Protected Bond Fund
SC BlackRock Large Cap Index Fund
SC BlackRock Small Cap Index Fund
SC Columbia Small Cap Value Fund
SC Davis Venture Value Fund
SC Goldman Sachs Mid Cap Value Fund
SC Goldman Sachs Short Duration Fund
SC Ibbotson Balanced Fund
SC Ibbotson Growth Fund
SC Ibbotson Conservative Fund
SC Invesco Small Cap Growth Fund
SC Lord Abbett Growth & Income Fund
SC PIMCO High Yield Fund
SC PIMCO Total Return Fund
SC WMC Blue Chip Mid Cap Fund
SC WMC Large Cap Growth Fund
Factors Considered by the Board of Trustees (the “Board”) in Approving the Continuation of each Investment Advisory Agreement.
The Trust’s Board approved the continuation of each above-referenced Fund’s current investment advisory agreement (including, in the case of all Funds other than Sun Capital Global Real Estate Fund, Sun Capital Investment Grade Bond Fund, Sun Capital Money Market Fund, SC BlackRock Large Cap Index Fund, BlackRock Small Cap Index Fund3 and SC Columbia Small Cap Value Fund4, each Fund’s subadvisory agreement) for an additional twelve-month period at an in-person meeting held in November 2010.
In terms of the process that the Trustees followed prior to approving the continuation of each investment advisory and subadvisory agreement (together, the “investment advisory agreements”), Variable Contract Owners5 should know that:
| * | At present, all but one of the Trust’s Trustees, including the Board’s chairman, are independent of Sun Capital Advisers LLC (“Sun Capital”), which serves as investment adviser to each of the Funds, each subadviser, and their respective affiliates (“Independent Trustees”). |
| 3 | The Trust’s Board approved new subadvisory agreements for SC BlackRock Large Cap Index Fund and BlackRock Small Cap Index Fund as discussed above. |
| 4 | The subadvisory agreement for SC Columbia Small Cap Value Fund was approved separately at an in-person meeting held in February 2010. For information regarding the approval process for that subadvisory agreement, please see the Funds’ semi-annual report dated June 30, 2010. |
| 5 | Shares of the Funds will principally be owned by Sun Life (U.S.) and Sun Life (N.Y.) for the benefit of the owners of variable annuities and variable life insurance policies (“Variable Contract Owners”) issued by Sun Life (U.S.) or Sun Life (N.Y.). |
334
Table of Contents
OTHER INFORMATION (Unaudited) (Continued)
| * | In connection with the Board’s 2010 contract review, the Independent Trustees met on multiple occasions to discuss and consider contract review matters, and were advised by, and held private meetings with, their independent legal counsel. |
| * | The Board engaged in a thorough review of each Fund’s investment advisory agreement(s). In this connection, the Board reviewed a wide range of materials furnished by Sun Capital and, as applicable, each subadviser, prior to reaching these decisions. |
In determining to approve the continuation of each Fund’s investment advisory agreement(s), the Board considered all factors that it believed relevant to the interests of the Fund and Variable Contract Owners, including but not limited to:
| • | Fees and expenses. The investment advisory and, as applicable, investment subadvisory fee schedules for each Fund, including (i) comparative information provided by Lipper regarding investment advisory fee rates paid to other advisers by similar funds; and (ii) fee rates paid to Sun Capital and each subadviser by each Fund relative to those paid by similar funds and institutional accounts advised by such firms. The Board considered that Sun Capital currently does not manage any institutional accounts in a manner similar to a Fund. The Board also received and considered information regarding the differences in the type and level of services required for the Funds and institutional accounts more generally. In the case of each subadvised Fund, the Board noted that the investment subadvisory fees paid to each subadviser are paid by Sun Capital out of its fee, not by the Fund. The Board also considered that, with respect to each of the SC Lord Abbett Growth & Income Fund, SC Goldman Sachs Mid Cap Value Fund, SC Goldman Sachs Short Duration Fund, SC PIMCO High Yield Fund, SC PIMCO Total Return Fund and SC BlackRock Inflation Protected Bond Fund (collectively, the “Unified Fee Funds”), because Sun Capital provides a broader range of services and bears additional categories of expenses in return for the “unified” investment management fee it receives than would be the case under a typical investment advisory agreement, it was most appropriate to examine and compare each such Fund’s total operating expense ratio relative to the total operating expense ratios of other similar funds. With respect to the Sun Capital Global Real Estate Fund, in addition to comparative information provided by Lipper, the Board also considered comparative information regarding the advisory and administration fees and total expense ratios of a group of domestic and global real estate funds considered by Sun Capital to be the Fund’s primary competitors. With respect to the SC BlackRock Large Cap Index Fund and SC BlackRock Small Cap Index Fund, the Board also considered that the investment advisory agreements with Sun Capital had been amended in August 2010 to reduce the fee rate payable to Sun Capital in conjunction with changes to such Funds’ investment programs, and that Sun Capital had represented that there would be no reduction in the quality or quantity of services that Sun Capital provides to each fund as a result of, or otherwise in connection with, such fee reductions. Taking into account the foregoing, the Board concluded that the fee schedules in effect for each Fund represent reasonable compensation in light of the nature, extent and quality of the investment services being provided to such Fund. |
| • | Economies of scale. The extent to which economies of scale would be realized as each Fund grows. In this regard, the Board observed that the advisory fees charged to the SC BlackRock Small Cap Index Fund, SC BlackRock Large Cap Index Fund, SC Columbia Small Cap Value Fund, SC Davis Venture Value Fund, SC WMC Large Cap Growth Fund, SC WMC Blue Chip Mid Cap Fund and SC Invesco Small Cap Growth Fund contain breakpoints. In addition, the Board considered Sun Capital’s commitment to consider initial and/or additional breakpoints for each Fund to the extent the Fund’s assets under management increase to more substantial, scalable levels in the future. The Board concluded that, to the extent economies of scale exist in the management of a Fund at its current asset level, each Fund’s fee schedule represents an appropriate sharing of such economies of scale between the Fund and its investment adviser(s). |
| • | Profitability; Other benefits to Sun Capital. The costs of the services to be provided, and profits realized, by Sun Capital and its affiliates from their relationship with each Fund. In this regard, the Board observed that |
335
Table of Contents
OTHER INFORMATION (Unaudited) (Continued)
| Sun Capital reported that it was operating several Funds at a net loss (suggesting that Sun Capital had assumed considerable economic risk in contracting with the Funds), and had committed to total operating expense caps applicable to each Fund (other than the Unified Fee Funds) through at least April 30, 2012. In analyzing Sun Capital’s costs and profits and its affiliates’ costs, the Board also reviewed the fees paid to and services provided by Sun Capital and its affiliates to each Fund for non-advisory services, such as distribution (including fees paid pursuant to Rule 12b-1 plans). The Board also considered other potential benefits to Sun Capital and its affiliates from their relationships with the Funds, including the roles of the Funds in supporting the variable contracts issued by Sun Life (U.S.) and Sun Life (N.Y.), both of which are affiliates of Sun Capital. The Board concluded that each Fund’s investment advisory fee schedule represented reasonable compensation in light of, among other factors, the costs incurred by the adviser and its affiliates in providing services to each Fund. |
| • | Investment performance. The investment performance of each Fund, both absolute and relative to various benchmarks and industry peer groups, including comparative information provided by Lipper regarding each Fund’s performance relative to other similar Funds. With respect to the Global Real Estate Fund, the Board also considered the Fund’s performance since its transition to a global real estate fund relative to peer global real estate funds managed by the Fund’s primary competitors. With respect to the AllianceBernstein International Value Fund, the Board noted while the Fund has underperformed since inception, the Fund’s subadviser has a strong long-term record managing assets in this strategy. |
| • | Nature, quality and extent of services. The nature, scope and quality of the services that Sun Capital and each subadviser provide to the Funds. In this regard, the Board considered, among other things, Sun Capital’s and each subadviser’s personnel (including particularly those personnel with responsibilities for providing services to the Funds), resources, policies and investment processes. In addition to meeting with representatives of Sun Capital and each subadviser, the Board also considered, among other things, Sun Capital’s representation that it was satisfied with the resources, compliance program and level of commitment put forth by each subadviser and its recommendation that each subadvisory agreement be continued. The Board considered that the types of services to be provided under the investment advisory agreements were comparable to (or, in the case of the Unified Fee Funds, broader than) those typically found in agreements of such type. In this regard, the Board concluded that the quality and range of services provided by Sun Capital and, as applicable, each subadviser, have benefited and should continue to benefit each Fund and its Variable Contract Owners. |
| • | Brokerage practices. The practices of Sun Capital and each subadviser regarding the selection and compensation of brokers and dealers executing portfolio transactions for the Funds, including the brokers’ and dealers’ provision of brokerage and research services to Sun Capital and each subadviser. |
| • | Compliance. Sun Capital’s and each subadviser’s commitment to and record of compliance, including its written compliance policies and procedures. In this regard, the Board considered Sun Capital’s continued commitment of attention and resources to compliance functions relevant to the Funds’ operations, including the oversight of subadvisers. The Board also considered the Sun Life organization’s commitment of resources to its U.S. business more generally. |
After due consideration of these and other factors that it considered relevant, the Board determined to approve the continuation of each Fund’s investment advisory agreement and, as applicable, investment subadvisory agreement, and concluded that the continuation of such agreements was in the best interest of the Fund and the Variable Contract Owners.
In reaching this conclusion, the Board did not give particular weight to any single factor noted above. The Board considered these and other factors over the course of multiple meetings, certain of which were held in executive session with only the Independent Trustees and their counsel present. It is possible that individual Trustees may have weighed these factors differently in reaching their individual decisions to approve the continuation of the investment advisory agreements.
336
Table of Contents
| OTHER INFORMATION (Unaudited) (Continued) | Sun Capital Advisers Trust |
Each Fund’s business is managed by the Trustees. Several of the Funds’ Trustees and Officers are also Directors and Officers of Sun Life Assurance Company of Canada or the Adviser. The table below provides more information about the Funds’ Trustees and certain Officers.
| Name, address and age | Position with
the Trust |
Length of Time Served | Principal occupation past 5 years |
Number of Funds Within Fund Complex Overseen by Trustee |
Other
Directorships Held Outside of the Fund Complex by Trustee | |||||
| Michael P. Castellano c/o Sun Capital Advisers Trust One Sun Life Executive Park Wellesley Hills, MA 02481 Year of birth: 1941 |
Trustee |
Since |
Retired | 22 | None | |||||
| Dawn-Marie Driscoll c/o Sun Capital Advisers Trust One Sun Life Executive Park Wellesley Hills, MA 02481 Year of birth: 1946 |
Trustee |
Since June 2007 |
President, Driscoll Associates (consulting firm); Executive Fellow, Center for Business Ethics, Bentley University; Directorships: Advisory Board, Center for Business Ethics, Bentley University; Trustee, Southwest Florida Community Foundation (charitable organization), Director, ICI Mutual; Former Directorships: Investment Company Institute; Former Memberships: Executive Committee of the Independent Directors Council of the Investment Company Institute. | 22 |
Trustee, DWS Funds Board (123 mutual funds) since 1987. | |||||
| William N. Searcy, Jr. c/o Sun Capital Advisers Trust One Sun Life Executive Park Wellesley Hills, MA 02481 Year of birth: 1946 |
Chairman and Trustee |
Chairman since 2005 Trustee since October 1998 |
Private investor. Pension and Savings Trust Officer, Sprint Corp. (wireless and wireline communications services) 1989-2003. | 22 | Trustee, DWS Funds Board (123 mutual funds) since 1993. | |||||
| John T. Donnelly* One Sun Life Executive Park Wellesley Hills, MA 02481 Year of birth: 1958 |
President, Chief Executive Officer and Trustee |
Since May 2009 |
Senior Managing Director, Investment Operations, Sun Life Assurance Company of Canada. President and Manager, Sun Capital Advisers LLC, since 2009. Associated with Sun Life Financial since 1991. | 22 | Director, Crosspointe Shops I LLC since 2009; Director, Crosspointe Shops II LLC since 2009; Director, Sun Life Insurance and Annuity Company of New York since 2008; Director and Chairman, Sun Life Investments LLC since 2005; Director, Sun Life |
337
Table of Contents
| OTHER INFORMATION (Unaudited) (Continued) | Sun Capital Advisers Trust |
| Name, address and age | Position with
the Trust |
Length of Time Served | Principal occupation past 5 years |
Number of Funds Within Fund Complex Overseen by Trustee |
Other
Directorships Held Outside of the Fund Complex by Trustee | |||||
| Financial Global Funding, L.L.C. since 2004; Director, Sun Life Financial Global Funding, U.L.C. since 2004; Director, Sun Life Financial Global Funding II, L.L.C. since 2006; Director, Sun Life Financial Global Funding II, U.L.C. since 2006; Director, Sun Life Financial Global Funding III, L.L.C. since 2006; Director, Sun Life Financial Global Funding III U.L.C. since 2006. | ||||||||||
| Lena Metelitsa* One Sun Life Executive Park Wellesley Hills, MA 02481 Year of birth: 1967 |
Chief Financial Officer and Treasurer |
Since May 2010; Serves at the discretion of the Trustees. |
Managing Director and Chief Financial Officer, Sun Capital Advisers LLC since 2010. Senior Director, Sun Capital Advisers LLC, 2008-2010. Associated with Sun Life Financial since 2005. |
N/A | N/A | |||||
| Maura A. Murphy, Esq.* One Sun Life Executive Park Wellesley Hills, MA 02481 Year of birth: 1960 |
Secretary and Chief Legal Officer |
Since October 1998; Serves at the discretion of the Trustees. |
Managing Director and General Counsel since 2000, and Secretary since 1998, Sun Capital Advisers LLC. Assistant Vice President and Senior Counsel, Sun Life Financial. Associated with Sun Life Financial since 1998. | N/A | N/A | |||||
| Andrew S. Harris* One Sun Life Executive Park Wellesley Hills, MA 02481 Born: 1974 |
Chief Compliance Officer |
Since August 2010; Serves at the discretion of the Trustees. |
Chief Compliance Officer, Sun Capital Advisers LLC since 2010. Fund Compliance Officer, SEI Investments 2008-2010. Director of Corporate Compliance, Nationwide Funds Group 2004-2008. | N/A |
N/A |
| * | An interested person of the Funds for purposes of Section 2(a)(19) of the 1940 Act. |
The Statement of Additional Information (SAI) includes additional information about the Funds’ Trustees and is available, without charge, upon request by calling 1-800-432-1102 x3330.
338
Table of Contents
Sun Capital Advisers Trust
TRUSTEES AND OFFICERS
Michael P. Castellano, Trustee
Dawn-Marie Driscoll, Trustee
William N. Searcy, Jr., Chairman, Trustee
John T. Donnelly, President, Chief Executive Officer and Trustee
Lena Metelitsa, Chief Financial Officer and Treasurer
Maura A. Murphy, Secretary and Chief Legal Officer
Andrew S. Harris, Chief Compliance Officer
INVESTMENT ADVISER
Sun Capital Advisers LLC
One Sun Life Executive Park
Wellesley Hills, MA 02481
INDEPENDENT REGISTERED PUBLIC ACCOUNTING FIRM
Deloitte & Touche LLP
200 Berkeley Street
Boston, MA 02116
ADMINISTRATOR, CUSTODIAN, TRANSFER AGENT
State Street Bank & Trust Company
One Lincoln Street
Boston, MA 02111
LEGAL COUNSEL
Dechert LLP
200 Clarendon Street
Boston, MA 02116
This report must be preceded or accompanied by a prospectus for Sun Capital Advisers Trust which includes more information about charges and expenses. Please read the prospectus carefully before you invest or send money.
Table of Contents
| Item 2. | Code of Ethics. |
Registrant has adopted a code of ethics that applies to registrant’s principal executive officer and principal financial officer. This code of ethics is available without charge, upon request, by calling 1-800-432-1102 x3330. A copy of this code of ethics is filed as an exhibit to this Form N-CSR. No substantive amendments were approved or waivers granted to this code of ethics during the period covered by this report.
| Item 3. | Audit Committee Financial Expert. |
The registrant’s Board of Trustees has determined that the registrant has at least one financial expert, Michael P. Castellano, serving on its Audit Committee. Mr. Castellano is considered “independent” for purposes of Item 3(a)(2) of Form N-CSR.
| Item 4. | Principal Accountant Fees and Services. |
Aggregate fees billed for professional services rendered to the registrant for the last two fiscal years by the registrant’s principal accountant were as follows:
(a) Audit Fees: Includes amounts related to the audit of the registrant’s annual financial statements and services normally provided by the accountant in connection with statutory and regulatory filings.
| FY 2010 |
FY 2009 | |||
| $765,705 |
$ | 692,782 | ||
(b) Audit-related Fees: Includes amounts related to assurance and related services that are reasonably related to the performance of the audit of the registrant’s financial statements and are not reported under paragraph (a) of this Item.
| FY 2010 |
FY 2009 | |||
| None |
None | |||
(c) Tax Fees: Includes amounts related to tax compliance, tax planning and tax advice.
| FY 2010 |
FY 2009 | |||
| $69,620 |
$ | 81,160 | ||
(d) All Other Fees: Includes amounts related to products and services provided to the registrant by the registrant’s principal accountant, other than the services reported in paragraphs (a) through (c) of this Item.
| FY 2010 |
FY 2009 | |||
| None |
None | |||
(e)(1) The registrant’s Audit Committee has adopted a policy whereby audit and non-audit services performed by the registrant’s principal accountant for the registrant require pre-approval. In addition, non-audit services performed by the registrant’s principal accountant for the registrant’s investment adviser and any entity controlling, controlled by or under common control with the investment adviser that provides ongoing services to the registrant also require pre-approval if the services provided to those entities are related directly to the operations and financial reporting of the registrant.
The policy includes a list of specified services that are deemed to be pre-approved, subject to stated dollar limits, by the Audit Committee. The Audit Committee must provide specific advance approval for any service that is not included in the list of pre-approved services, or for any pre-approved service that exceeds the dollar limit set forth in the policy. In determining whether to approve services, the Audit Committee considers whether the services are consistent with maintaining the principal accountant’s independence.
(e)(2) No services included in this Item 4 (b) through (d) were approved pursuant to the “de minimis exception” set forth in paragraph (c)(7)(i)(C) of Rule 2-01 of Regulation S-X.
(f) Not applicable
(g) During the registrant’s fiscal years ended December 31, 2010 and December 31, 2009, the aggregate fees billed by the registrant’s principal accountant for non-audit services rendered to the registrant, the registrant’s investment adviser, or to any entity controlling, controlled by, or under common control with the adviser that provides ongoing services to the registrant were $69,620 and $81,160^, respectively, and represent tax fees included under item 4(c) above.
^ Reflects current period presentation.
(h) Not applicable
Table of Contents
| Item 5. | Audit Committee of Listed Registrants. |
Not applicable
| Item 6. | Schedule of Investments. |
Included in stockholder report filed under Item 1.
| Item 7. | Disclosure of Proxy Voting Policies and Procedures for Closed-End Management Investment Companies. |
Not applicable
| Item 8. | Portfolio Managers of Closed-End Management Investment Companies. |
Not Applicable
| Item 9. | Purchases of Equity Securities by Closed-End Management Investment Company and Affiliated Purchasers. |
Not Applicable
| Item 10. | Submission of Matters to a Vote of Security Holders. |
No material changes to the procedures by which shareholders may recommend nominees to the registrant’s Board of Trustees have been implemented since the registrant’s most recent disclosure to this Item.
| Item 11. | Controls and Procedures. |
| (a) | Based upon their evaluation of the registrant’s disclosure controls and procedures as conducted within 90 days of the filing date of this Form N-CSR, the registrant’s principal financial officer and principal executive officer have concluded that those disclosure controls and procedures provide reasonable assurance that the material information required to be disclosed by the registrant on this report is recorded, processed, summarized and reported within the time periods specified in the Securities and Exchange Commission’s rules and forms. |
| (b) | There have been no significant changes in the registrant’s internal control over financial reporting during the registrant’s second fiscal quarter of the period covered by this report that has materially affected, or is reasonably likely to materially affect, the registrant’s internal control over financial reporting. |
Table of Contents
| Item 12. | Exhibits. |
| (a) (1) | The code of ethics as required by Form N-CSR Item 2 is filed herewith. |
| (a) (2) | A separate certification for each principal executive officer and principal financial officer of the registrant as required by Rule 30a-2(a) under the Investment Company Act of 1940, as amended, are filed herewith. |
| (a) (3) | A combined certification by the principal executive and principal financial officers of the registrant as required by Rule 30a-2(b), under the Investment Company Act of 1940, as amended, is filed herewith. |
Table of Contents
SIGNATURES
Pursuant to the requirements of the Securities Exchange Act of 1934 and the Investment Company Act of 1940, the registrant has duly caused this report to be signed on its behalf by the undersigned, thereunto duly authorized.
| (Registrant) | SUN CAPITAL ADVISERS TRUST | |||||||
| By (Signature and Title)* | /s/ JOHN T. DONNELLY | |||||||
| John T. Donnelly, President | ||||||||
Date: February 28, 2011
Pursuant to the requirements of the Securities Exchange Act of 1934 and the Investment Company Act of 1940, this report has been signed below by the following persons on behalf of the registrant and in the capacities and on the dates indicated.
| By (Signature and Title)* | /s/ JOHN T. DONNELLY | |||||||
| John T. Donnelly, President | ||||||||
| (Chief Executive Officer) | ||||||||
Date: February 28, 2011
| By (Signature and Title)* | /s/ LENA METELITSA | |||||||
| Lena Metelitsa, Treasurer | ||||||||
| (Chief Financial Officer) | ||||||||
Date: February 28, 2011
| * | Print name and title of each signing officer under his or her signature. |