Exhibit 99.1
BAML Global Metals, Mining and Steel Conference Glenn Kellow President and CEO May 2019
Statement on Forward-Looking Information This presentation contains forward-looking statements within the meaning of the securities laws. Forward-looking statements can be identified by the fact that they do not relate strictly to historical or current facts. They often include words or variation of words such as “expects,” “anticipates,” “intends,” “plans,” “believes,” “seeks,” “estimates,” “projects,” “forecasts,” “targets,” “would,” “will,” “should,” “goal,” “could” or “may” or other similar expressions. Forward-looking statements provide management’s current expectations or predictions of future conditions, events or results. All statements that address operating performance, events or developments that we expect or anticipate will occur in the future are forward-looking statements. They may include estimates of revenues, income, earnings per share, cost savings, capital expenditures, dividends, share repurchases, liquidity, capital structure, market share, industry volume, or other financial items, descriptions of management’s plans or objectives for future operations, or descriptions of assumptions underlying any of the above. All forward-looking statements speak only as of the date they are made and reflect the company’s good faith beliefs, assumptions and expectations, but they are not guarantees of future performance or events. Furthermore, the company disclaims any obligation to publicly update or revise any forward-looking statement, except as required by law. By their nature, forward-looking statements are subject to risks and uncertainties that could cause actual results to differ materially from those suggested by the forward-looking statements. Factors that might cause such differences include, but are not limited to, a variety of economic, competitive and regulatory factors, many of which are beyond the company’s control, that are described in our Annual Report on Form 10-K for the fiscal year ended Dec. 31, 2018, as well as additional factors we may describe from time to time in other filings with the SEC. You may get such filings for free at our website at www.peabodyenergy.com. You should understand that it is not possible to predict or identify all such factors and, consequently, you should not consider any such list to be a complete set of all potential risks or uncertainties. 2
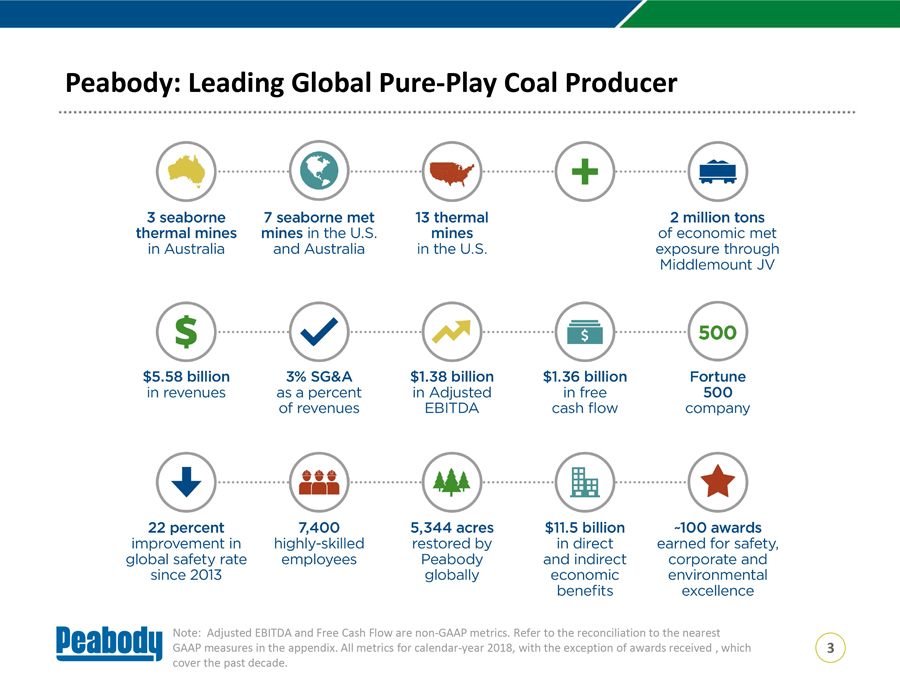
Peabody: Leading Global Pure-Play Coal Producer Note: Adjusted EBITDA and Free Cash Flow are non-GAAP metrics. Refer to the reconciliation to the nearest GAAP measures in the appendix. All metrics for calendar-year 2018, with the exception of awards received , which 3 cover the past decade.
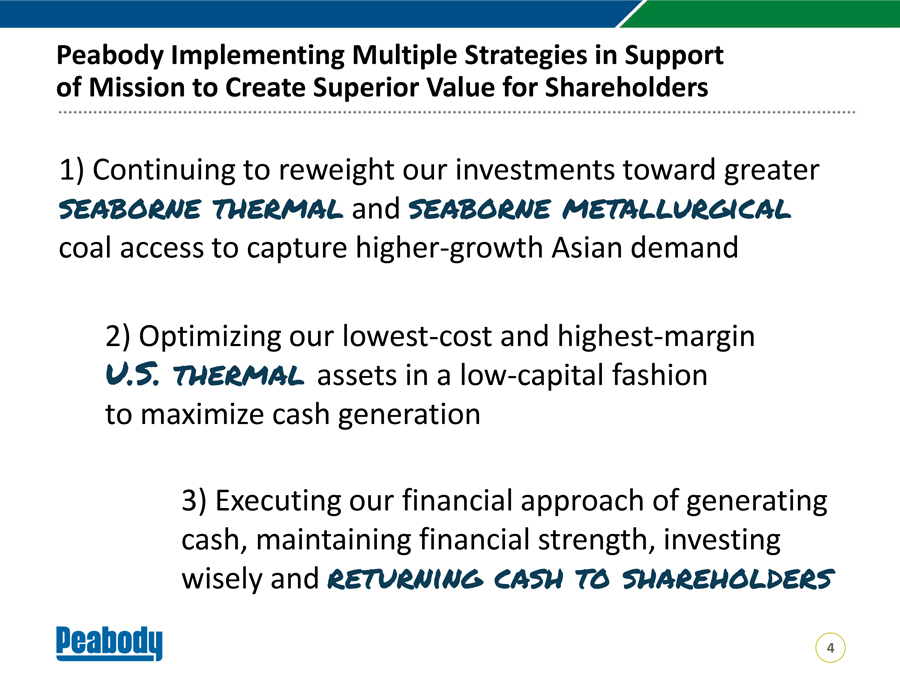
Peabody Implementing Multiple Strategies in Support of Mission to Create Superior Value for Shareholders 1) Continuing to reweight our investments toward greater seaborne thermal and seaborne metallurgical coal access to capture higher-growth Asian demand 2) Optimizing our lowest-cost and highest-margin U.S. thermal assets in a low-capital fashion to maximize cash generation 3) Executing our financial approach of generating cash, maintaining financial strength, investing wisely and returning cash to shareholders 4
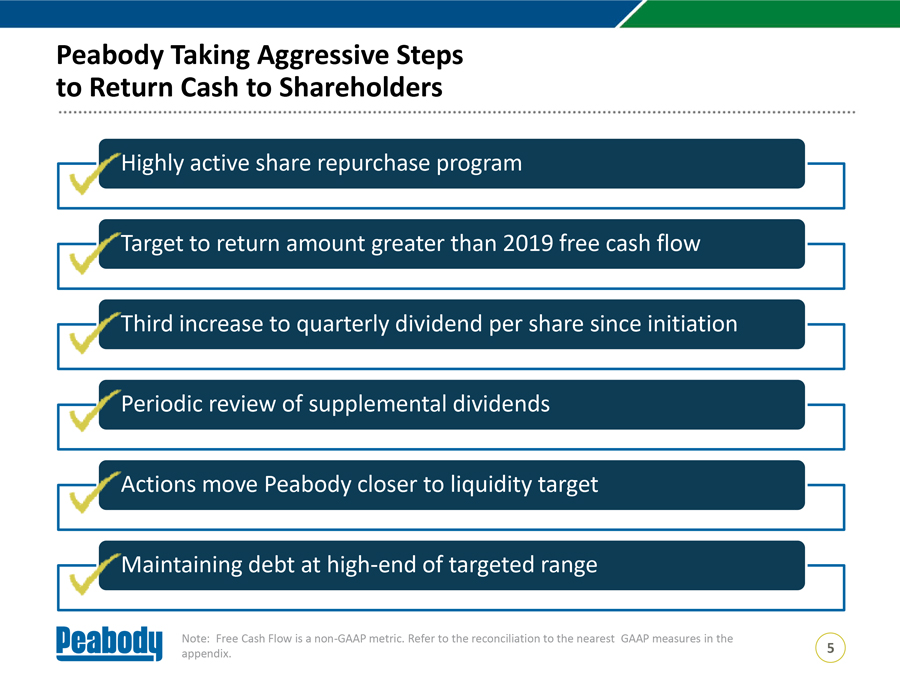
Peabody Taking Aggressive Steps to Return Cash to Shareholders Highly active share repurchase program Target to return amount greater than 2019 free cash flow Third increase to quarterly dividend per share since initiation Periodic review of supplemental dividends Actions move Peabody closer to liquidity target Maintaining debt at high-end of targeted range Note: Free Cash Flow is a non-GAAP metric. Refer to the reconciliation to the nearest GAAP measures in the appendix. 5
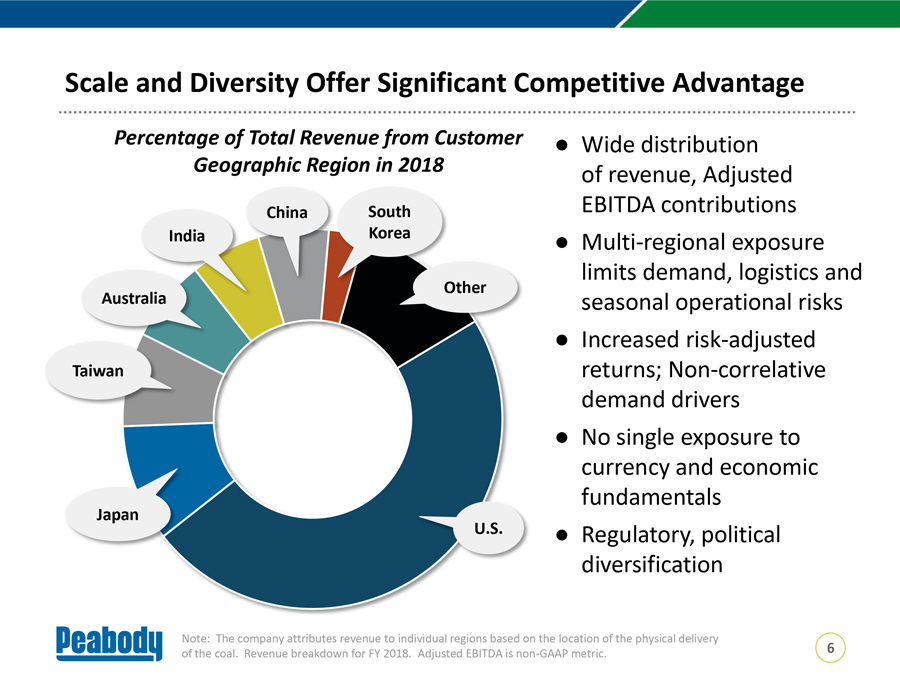
Scale and Diversity Offer Significant Competitive Advantage Percentage of Total Revenue from Customer • Wide distribution Geographic Region in 2018 of revenue, Adjusted China South EBITDA contributions India Korea • Multi-regional exposure limits demand, logistics and Other Austr seasonal operational risks • Increased risk-adjusted Taiwan returns; Non-correlative demand drivers • No single exposure to currency and economic fundamentals Japan U.S. • Regulatory, political diversification Note: The company attributes revenue to individual regions based on the location of the physical delivery of the coal. Revenue breakdown for FY 2018. Adjusted EBITDA is non-GAAP metric. 6
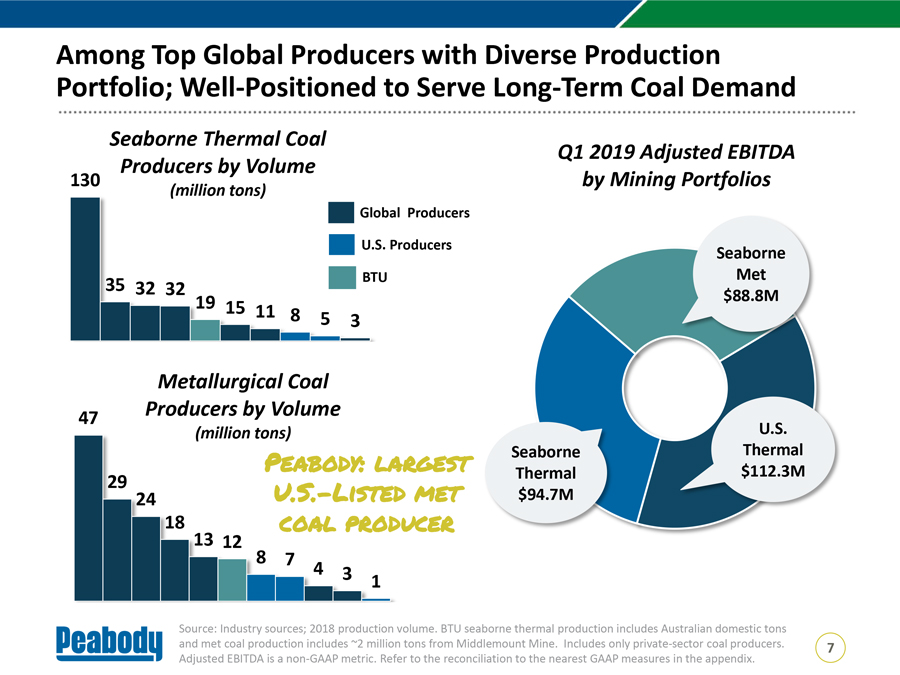
Among Top Global Producers with Diverse Production Portfolio; Well-Positioned to Serve Long-Term Coal Demand Seaborne Thermal Coal Q1 2019 Adjusted EBITDA Producers by Volume 130 by Mining Portfolios (million tons) Global Producers U.S. Producers Seaborne 35 BTU Met 32 32 $88.8M 19 15 11 8 5 3 Metallurgical Coal 47 Producers by Volume U.S. (million tons) Peabody: largest Seaborne Thermal 29 Thermal $112.3M 24 U.S.-Listed met $94.7M 18 coal producer 13 12 8 7 4 3 1 Source: Industry sources; 2018 production volume. BTU seaborne thermal production includes Australian domestic tons and met coal production includes ~2 million tons from Middlemount Mine. Includes only private-sector coal producers. 7 Adjusted EBITDA is a non-GAAP metric. Refer to the reconciliation to the nearest GAAP measures in the appendix.
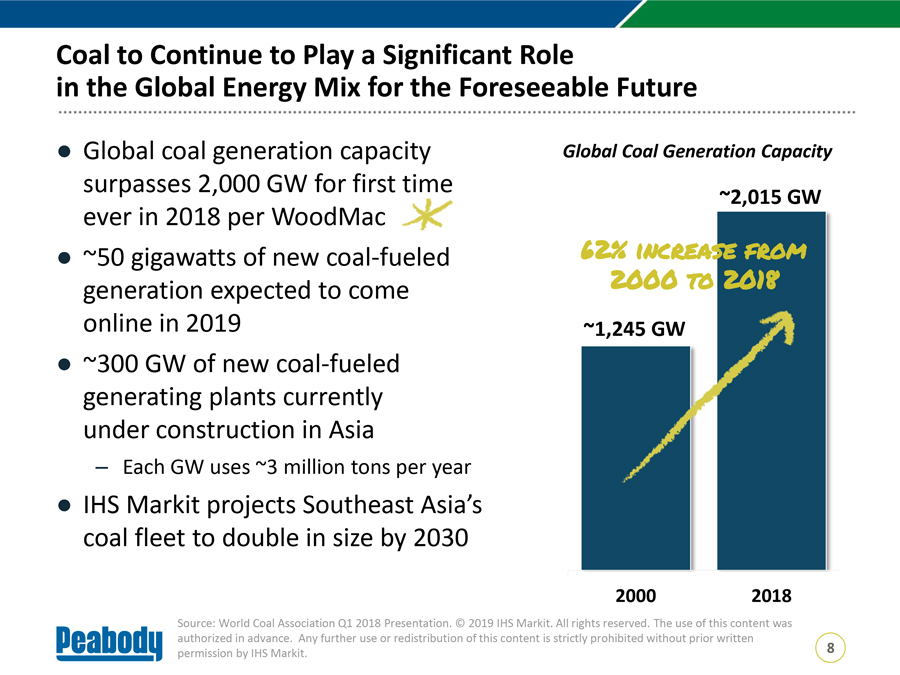
Coal to Continue to Play a Significant Role in the Global Energy Mix for the Foreseeable Future • Global coal generation capacity Global Coal Generation Capacity surpasses 2,000 GW for first time ~2,015 GW ever in 2018 per WoodMac • ~50 gigawatts of new coal-fueled 62% increase from generation expected to come 2000 to 2018 online in 2019 ~1,245 GW • ~300 GW of new coal-fueled generating plants currently under construction in Asia – Each GW uses ~3 million tons per year • IHS Markit projects Southeast Asia’s coal fleet to double in size by 2030 2000 2018 Source: World Coal Association Q1 2018 Presentation. © 2019 IHS Markit. All rights reserved. The use of this content was authorized in advance. Any further use or redistribution of this content is strictly prohibited without prior written permission by IHS Markit. 8
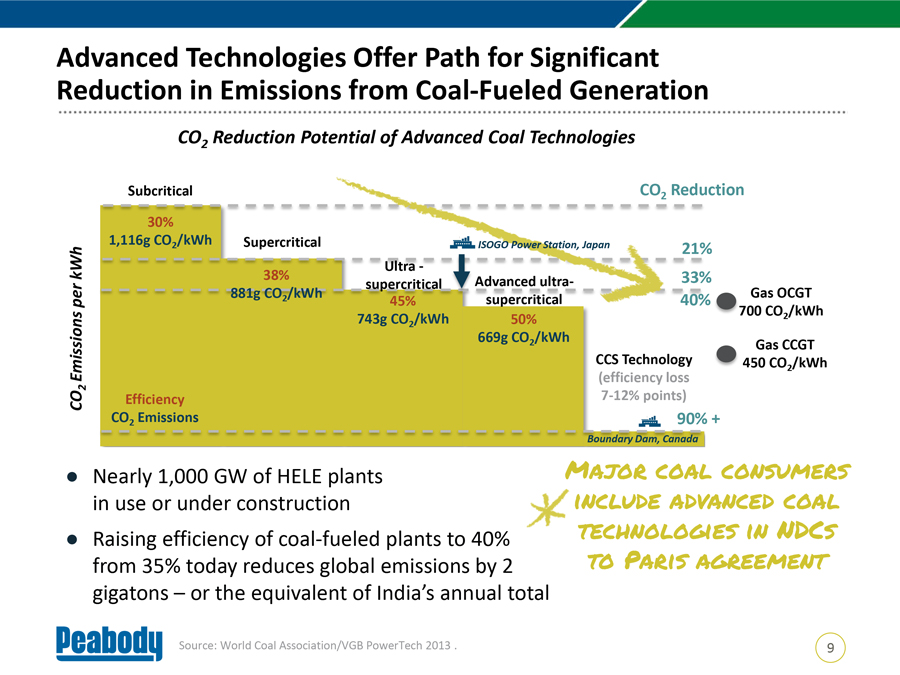
Advanced Technologies Offer Path for Significant Reduction in Emissions from Coal-Fueled Generation CO2 Reduction Potential of Advanced Coal Technologies Subcritical CO2 Reduction 30% 1,116g CO2/kWh Supercritical ISOGO Power Station, Japan 21% kWh 38% 33% 881g CO2/kWh 40% Gas OCGT per 45% 743g CO /kWh 50% 700 CO2/kWh 2 669g CO2/kWh Gas CCGT CCS Technology 450 CO /kWh Emissions 2 (efficiency loss 2 7-12% points) CO Efficiency CO2 Emissions 90% + Boundary Dam, Canada • Nearly 1,000 GW of HELE plants Major coal consumers in use or under construction nclude advanced coal • Raising efficiency of coal-fueled plants to 40% technologies in NDCs from 35% today reduces global emissions by 2 to Paris agreement gigatons – or the equivalent of India’s annual total Source: World Coal Association/VGB PowerTech 2013 . 9
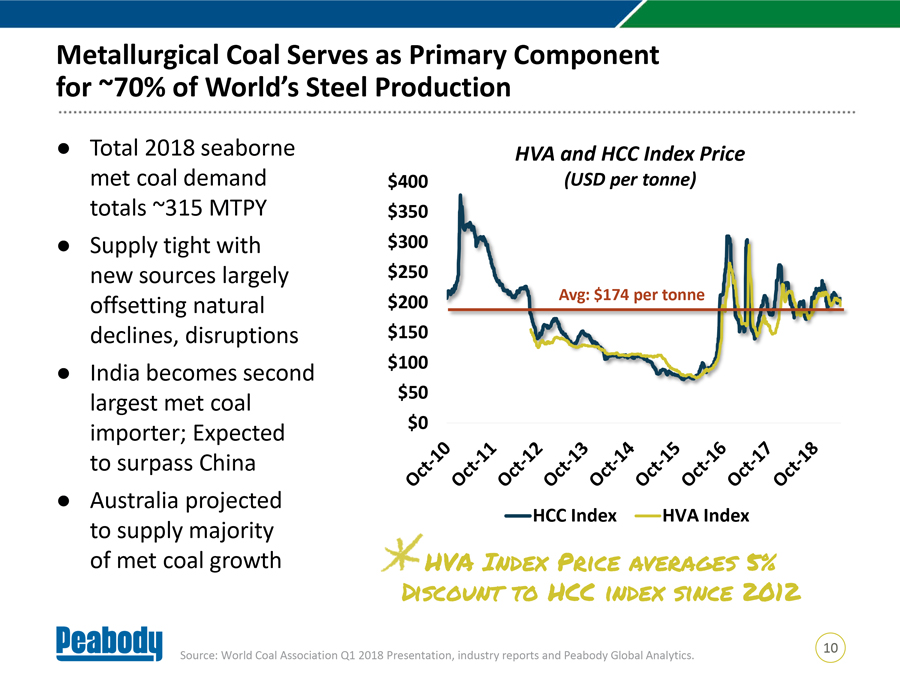
Metallurgical Coal Serves as Primary Component for ~70% of World’s Steel Production • Total 2018 seaborne HVA and HCC Index Price met coal demand $400 (USD per tonne) totals ~315 MTPY $350 • Supply tight with $300 new sources largely $250 offsetting natural $200 Avg: $174 per tonne declines, disruptions $150 • India becomes second $100 largest met coal $50 importer; Expected $0 to surpass China • Australia projected HCC Index HVA Index to supply majority of met coal growth HVA Index Price averages 5% Discount to HCC index since 2012 10 Source: World Coal Association Q1 2018 Presentation, industry reports and Peabody Global Analytics.
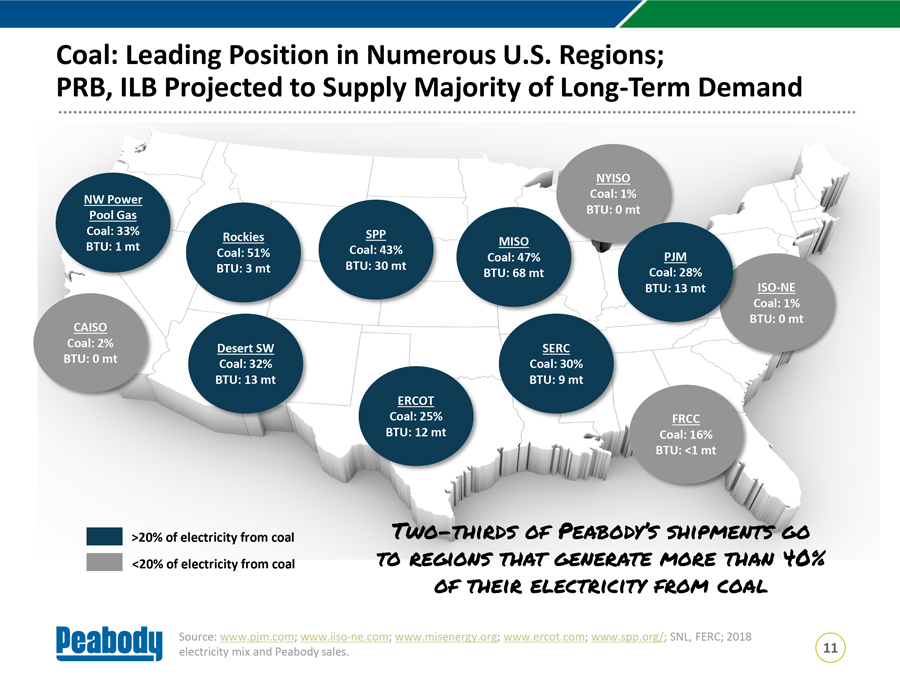
Coal: Leading Position in Numerous U.S. Regions; PRB, ILB Projected to Supply Majority of Long-Term Demand NYISO NW Power Coal: 1% Pool Gas BTU: 0 mt Coal: 33% Rockies SPP BTU: 1 mt MISO Coal: 51% Coal: 43% PJM Coal: 47% BTU: 3 mt BTU: 30 mt Coal: 28% BTU: 68 mt BTU: 13 mt ISO-NE Coal: 1% BTU: 0 mt CAISO Coal: 2% Desert SW SERC BTU: 0 mt Coal: 32% Coal: 30% BTU: 13 mt BTU: 9 mt ERCOT Coal: 25% FRCC BTU: 12 mt Coal: 16% BTU: <1 mt >20% of electricity from coal Two-thirds of Peabody’s shipments go <20% of electricity from coal to regions that generate more than 40% of their electricity from coal Source: www.pjm.com; www.iiso-ne.com; www.misenergy.org; www.ercot.com; www.spp.org/; SNL, FERC; 2018 electricity mix and Peabody sales. 11
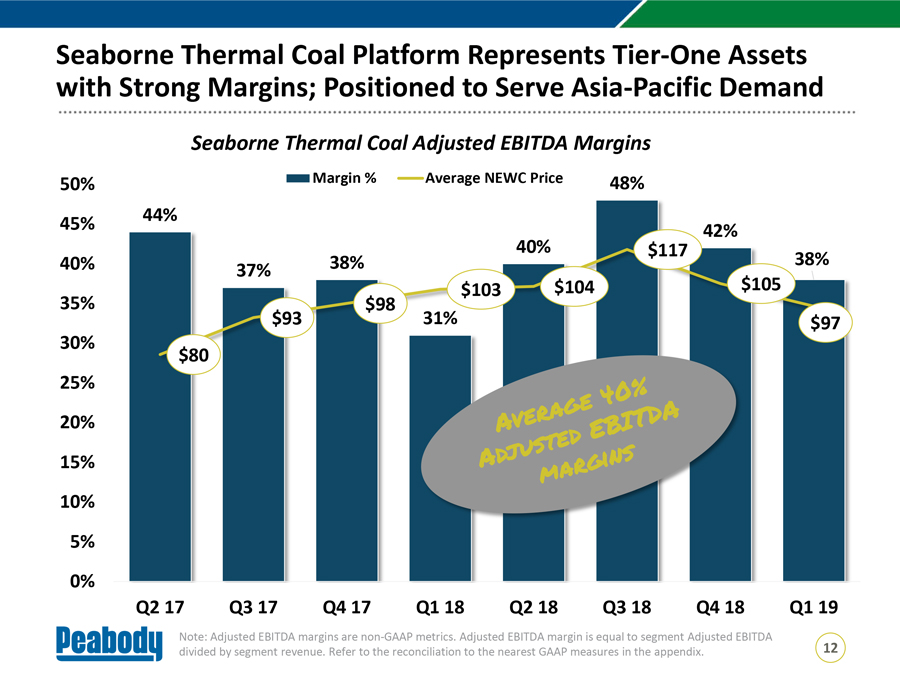
Seaborne Thermal Coal Platform Represents Tier-One Assets with Strong Margins; Positioned to Serve Asia-Pacific Demand Seaborne Thermal Coal Adjusted EBITDA Margins 50% Margin % Average NEWC Price 48% 45% 44% 42% 40% $117 40% 38% 38% 37% $103 $104 $105 35% $98 $93 31% $97 30% $80 25% 20% 15% 10% 5% 0% Q2 17 Q3 17 Q4 17 Q1 18 Q2 18 Q3 18 Q4 18 Q1 19 Note: Adjusted EBITDA margins are non-GAAP metrics. Adjusted EBITDA margin is equal to segment Adjusted EBITDA divided by segment revenue. Refer to the reconciliation to the nearest GAAP measures in the appendix. 12
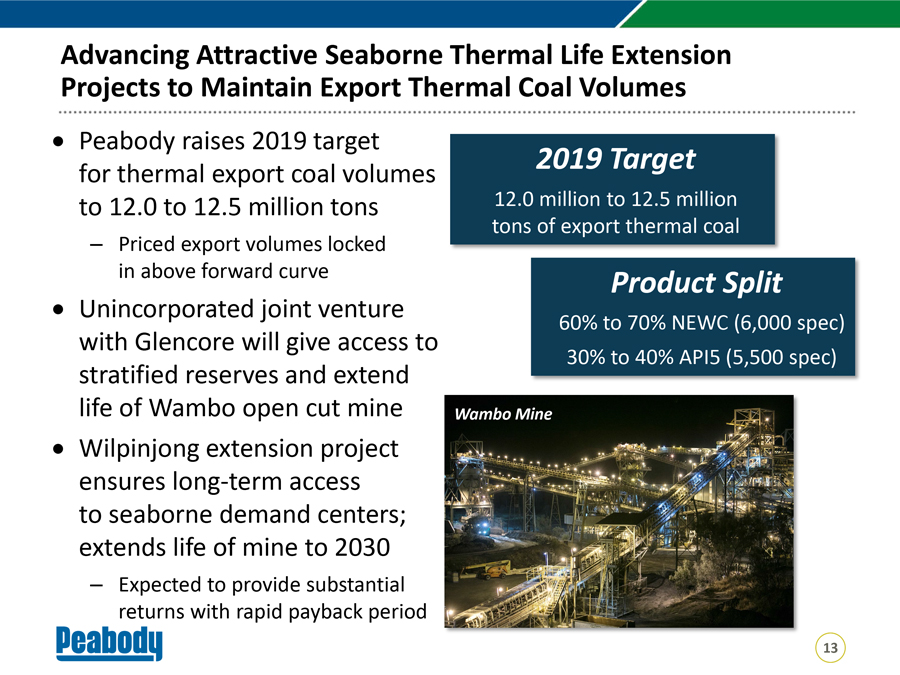
Advancing Attractive Seaborne Thermal Life Extension Projects to Maintain Export Thermal Coal Volumes • Peabody raises 2019 target 2019 Target for thermal export coal volumes 12.0 million to 12.5 million to 12.0 to 12.5 million tons tons of export thermal coal – Priced export volumes locked in above forward curve Product Split • Unincorporated joint venture 60% to 70% NEWC (6,000 spec) with Glencore will give access to 30% to 40% API5 (5,500 spec) stratified reserves and extend life of Wambo open cut mine Wambo Mine • Wilpinjong extension project ensures long-term access to seaborne demand centers; extends life of mine to 2030 – Expected to provide substantial returns with rapid payback period 13
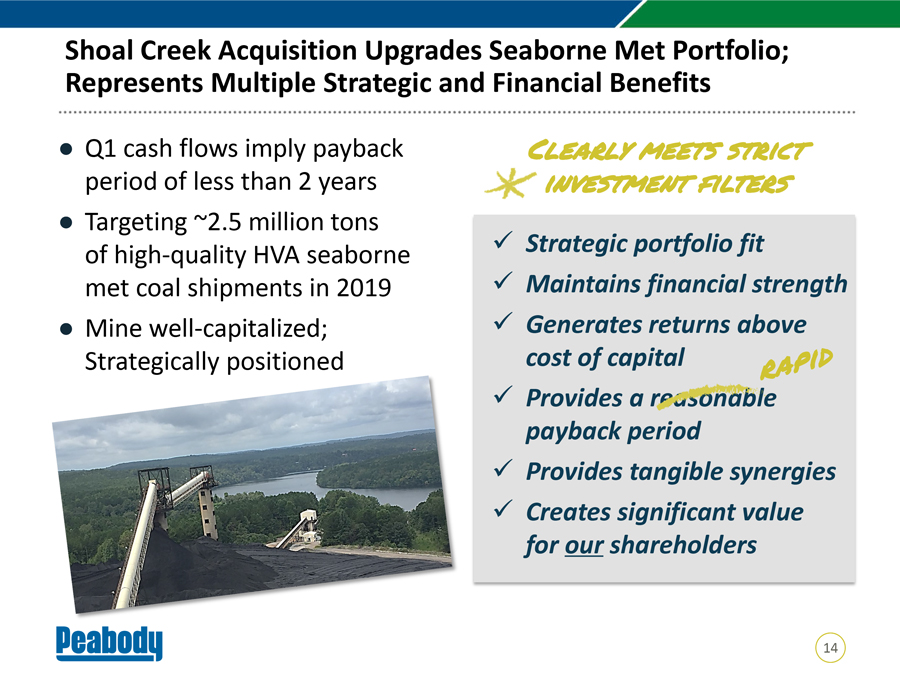
Shoal Creek Acquisition Upgrades Seaborne Met Portfolio; Represents Multiple Strategic and Financial Benefits • Q1 cash flows imply payback Clearly meets strict period of less than 2 years investment filters • Targeting ~2.5 million tons of high-quality HVA seaborne ? Strategic portfolio fit met coal shipments in 2019? Maintains financial strength • Mine well-capitalized; ? Generates returns above Strategically positioned cost of capital ? Provides a r e payback period? Provides tangible synergies? Creates significant value for our shareholders 14
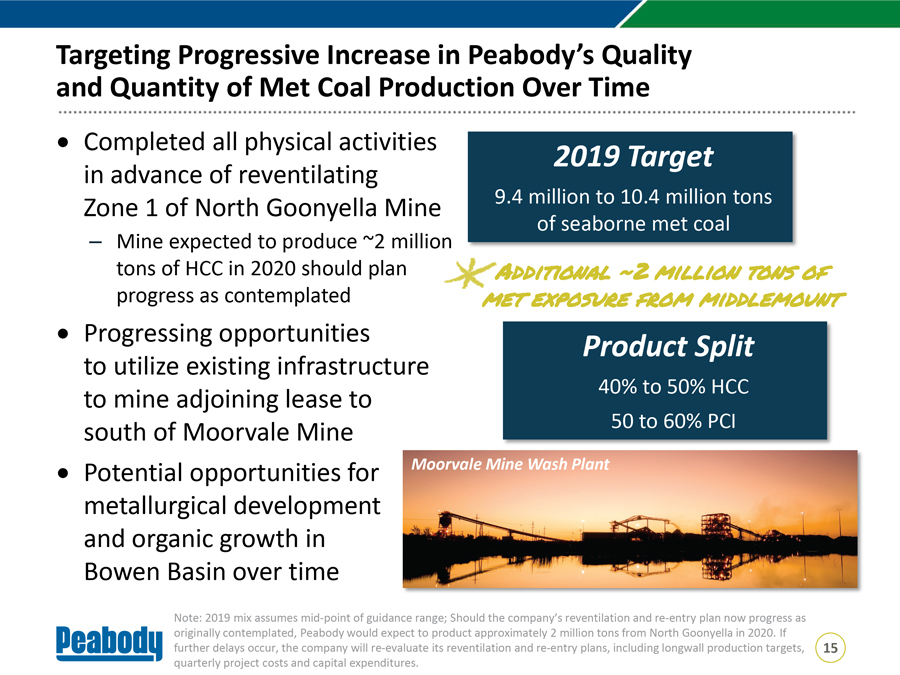
Targeting Progressive Increase in Peabody’s Quality and Quantity of Met Coal Production Over Time • Completed all physical activities 2019 Target in advance of reventilating Zone 1 of North Goonyella Mine 9.4 million to 10.4 million tons of seaborne met coal – Mine expected to produce ~2 million tons of HCC in 2020 should plan Additional ~2 million tons of progress as contemplated et exposure from middlemount • Progressing opportunities Product Split to utilize existing infrastructure to mine adjoining lease to 40% to 50% HCC south of Moorvale Mine 50 to 60% PCI • Potential opportunities for Moorvale Mine Wash Plant metallurgical development and organic growth in Bowen Basin over time Note: 2019 mix assumes mid-point of guidance range; Should the company’s reventilation and re-entry plan now progress as originally contemplated, Peabody would expect to product approximately 2 million tons from North Goonyella in 2020. If further delays occur, the company will re-evaluate its reventilation and re-entry plans, including longwall production targets, 15 quarterly project costs and capital expenditures.
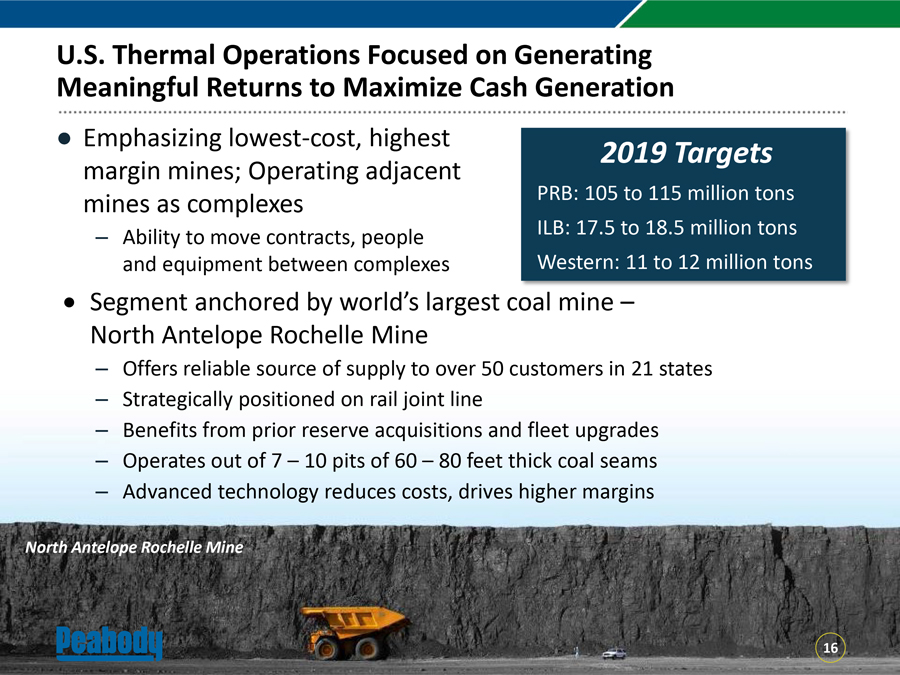
U.S. Thermal Operations Focused on Generating Meaningful Returns to Maximize Cash Generation • Emphasizing lowest-cost, highest 2019 Targets margin mines; Operating adjacent mines as complexes PRB: 105 to 115 million tons – Ability to move contracts, people ILB: 17.5 to 18.5 million tons and equipment between complexes Western: 11 to 12 million tons • Segment anchored by world’s largest coal mine –North Antelope Rochelle Mine – Offers reliable source of supply to over 50 customers in 21 states – Strategically positioned on rail joint line – Benefits from prior reserve acquisitions and fleet upgrades – Operates out of 7 – 10 pits of 60 – 80 feet thick coal seams – Advanced technology reduces costs, drives higher margins North Antelope Rochelle Mine 16
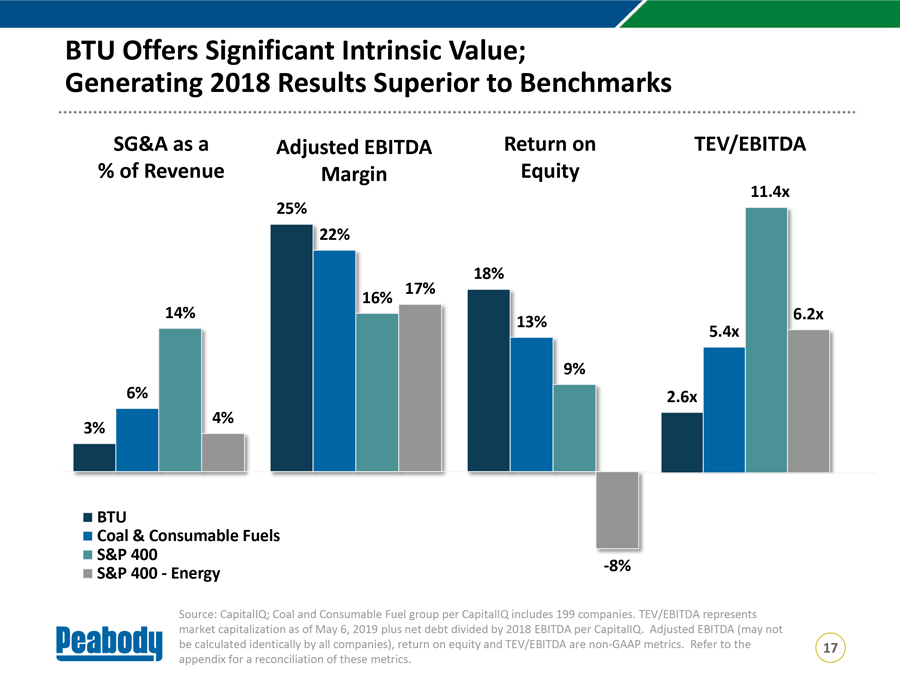
BTU Offers Significant Intrinsic Value; Generating 2018 Results Superior to Benchmarks SG&A as a Adjusted EBITDA Return on TEV/EBITDA % of Revenue Margin Equity Coal BTU & Consumable Fuels S&P 400 S&P 400—Energy -8% Source: CapitalIQ; Coal and Consumable Fuel group per CapitalIQ includes 199 companies. TEV/EBITDA represents market capitalization as of May 6, 2019 plus net debt divided by 2018 EBITDA per CapitalIQ. Adjusted EBITDA (may not be calculated identically by all companies), return on equity and TEV/EBITDA are non-GAAP metrics. Refer to the 17 appendix for a reconciliation of these metrics.
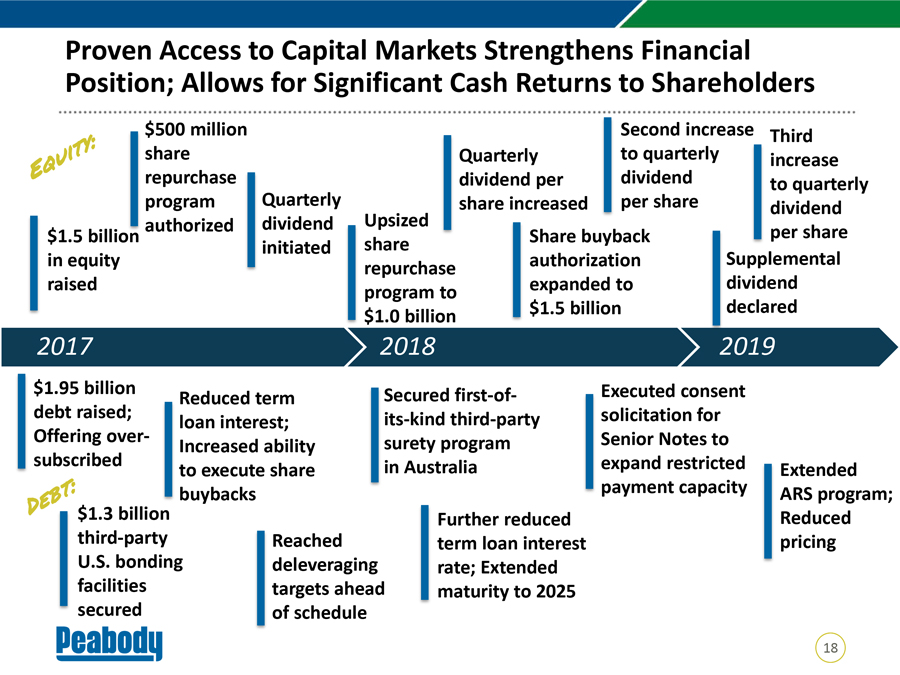
Proven Access to Capital Markets Strengthens Financial Position; Allows for Significant Cash Returns to Shareholders $500 million Second increase Third share Quarterly to quarterly increase repurchase dividend per dividend to quarterly program Quarterly Upsized share increased per share dividend authorized dividend per share $1.5 billio share Share buyback initiated in equity repurchase authorization Supplemental raised program to expanded to dividend $1.0 billion $1.5 billion declared 2017 2018 2019 $1.95 billion Reduced term Secured first-of- Executed consent debt raised; loan interest; its-kind third-party solicitation for Offering over- Increased ability surety program Senior Notes to subscribed to execute share in Australia expand restricted Extended buybacks payment capacity ARS program; $1.3 billion Further reduced Reduced third-party Reached term loan interest pricing U.S. bonding deleveraging rate; Extended facilities targets ahead maturity to 2025 secured of schedule 18
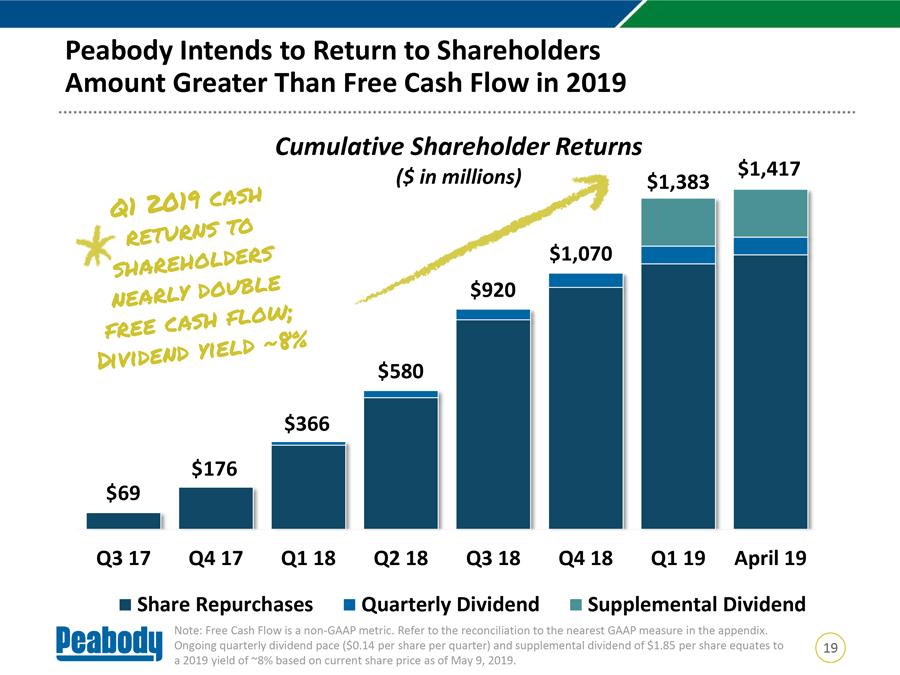
Peabody Intends to Return to Shareholders Amount Greater Than Free Cash Flow in 2019 Cumulative Shareholder Returns $1,417 $1,383 $580 $366 $176 $69 Q3 17 Q4 17 Q1 18 Q2 18 Q3 18 Q4 18 Q1 19 April 19 Share Repurchases Quarterly Dividend Supplemental Dividend Note: Free Cash Flow is a non-GAAP metric. Refer to the reconciliation to the nearest GAAP measure in the appendix. Ongoing quarterly dividend pace ($0.14 per share per quarter) and supplemental dividend of $1.85 per share equates to 19 a 2019 yield of ~8% based on current share price as of May 9, 2019.
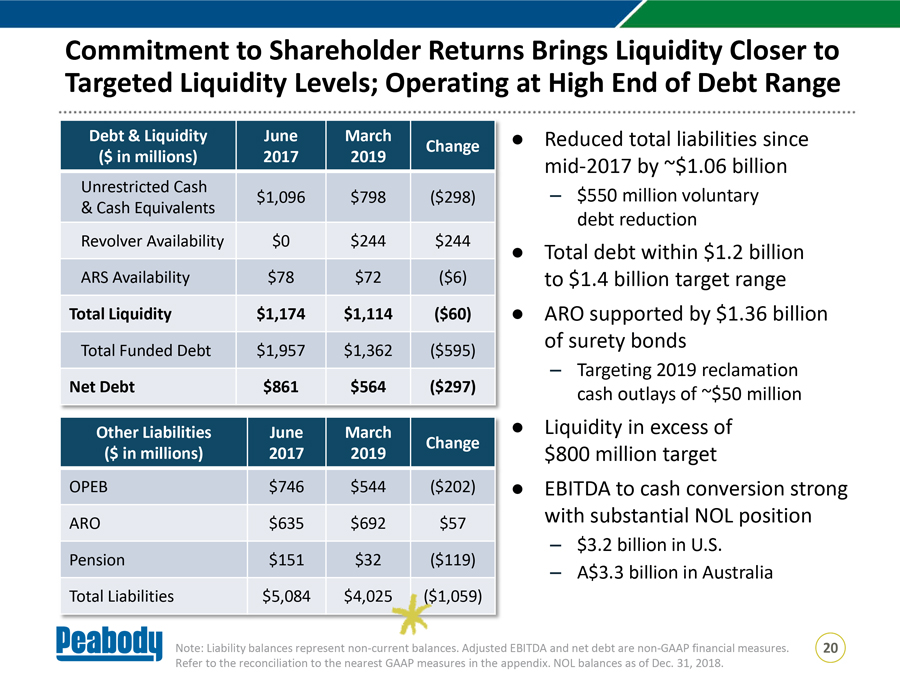
Commitment to Shareholder Returns Brings Liquidity Closer to Targeted Liquidity Levels; Operating at High End of Debt Range Debt & Liquidity June March • Reduced total liabilities since Change ($ in millions) 2017 2019 mid-2017 by ~$1.06 billion Unrestricted Cash – $550 million voluntary $1,096 $798 ($298) & Cash Equivalents debt reduction Revolver Availability $0 $244 $244 • Total debt within $1.2 billion ARS Availability $78 $72 ($6) to $1.4 billion target range Total Liquidity $1,174 $1,114 ($60) • ARO supported by $1.36 billion Total Funded Debt $1,957 $1,362 ($595) of surety bonds – Targeting 2019 reclamation Net Debt $861 $564 ($297) cash outlays of ~$50 million Other Liabilities June March • Liquidity in excess of Change ($ in millions) 2017 2019 $800 million target OPEB $746 $544 ($202) • EBITDA to cash conversion strong ARO $635 $692 $57 with substantial NOL position – $3.2 billion in U.S. Pension $151 $32 ($119) – A$3.3 billion in Australia Total Liabilities $5,084 $4,025 ($1,059) Note: Liability balances represent non-current balances. Adjusted EBITDA and net debt are non-GAAP financial measures. 20 Refer to the reconciliation to the nearest GAAP measures in the appendix. NOL balances as of Dec. 31, 2018.
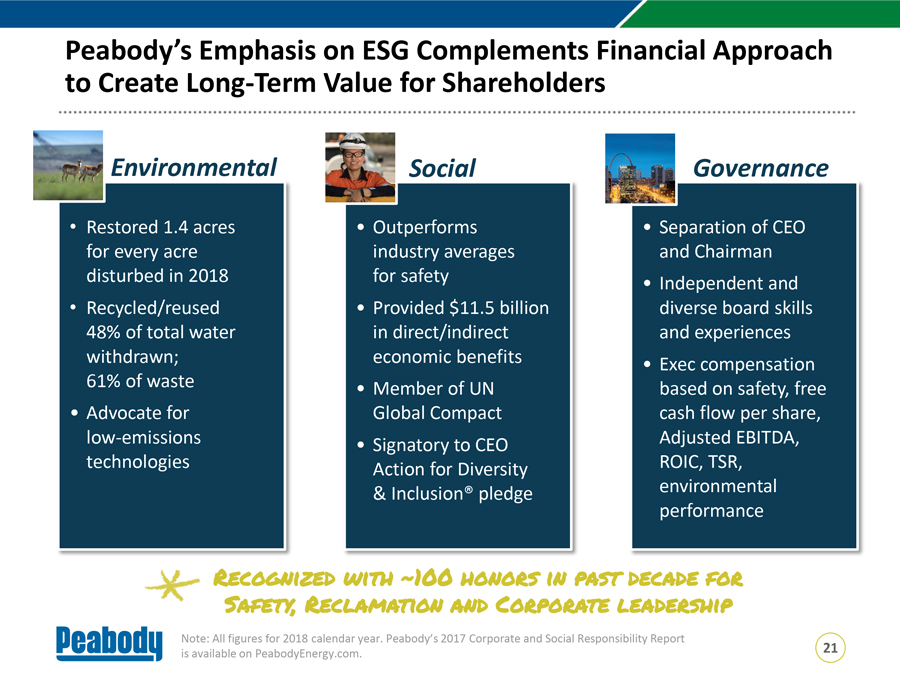
Peabody’s Emphasis on ESG Complements Financial Approach to Create Long-Term Value for Shareholders Environmental Social Governance • Restored 1.4 acres • Outperforms • Separation of CEO for every acre industry averages and Chairman disturbed in 2018 for safety • Independent and • Recycled/reused • Provided $11.5 billion diverse board skills 48% of total water in direct/indirect and experiences withdrawn; economic benefits • Exec compensation 61% of waste • Member of UN based on safety, free • Advocate for Global Compact cash flow per share, low-emissions • Signatory to CEO Adjusted EBITDA, technologies Action for Diversity ROIC, TSR, & Inclusion® pledge environmental performance Recognized with ~100 honors in past decade for Safety, Reclamation and Corporate leadership Note: All figures for 2018 calendar year. Peabody’s 2017 Corporate and Social Responsibility Report is available on PeabodyEnergy.com. 21
Appendix
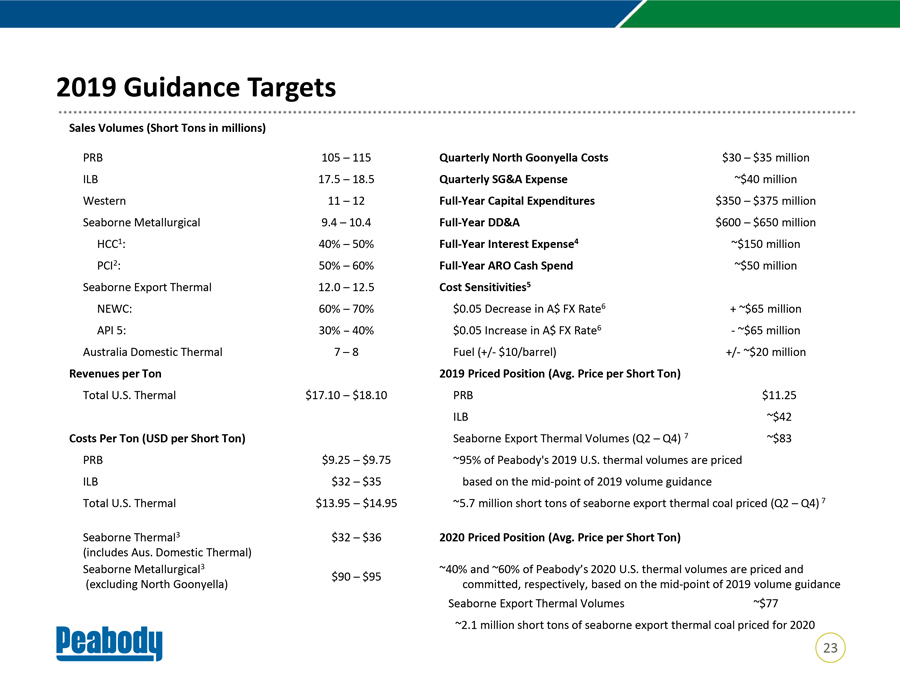
2019 Guidance Targets Sales Volumes (Short Tons in millions) PRB 105 – 115 Quarterly North Goonyella Costs $30 – $35 million ILB 17.5 – 18.5 Quarterly SG&A Expense ~$40 million Western 11 – 12 Full-Year Capital Expenditures $350 – $375 million Seaborne Metallurgical 9.4 – 10.4 Full-Year DD&A $600 – $650 million HCC1: 40% – 50% Full-Year Interest Expense4 ~$150 million PCI2: 50% – 60% Full-Year ARO Cash Spend ~$50 million Seaborne Export Thermal 12.0 – 12.5 Cost Sensitivities5 NEWC: 60% – 70% $0.05 Decrease in A$ FX Rate6 + ~$65 million API 5: 30% – 40% $0.05 Increase in A$ FX Rate6—~$65 million Australia Domestic Thermal 7 – 8 Fuel (+/- $10/barrel) +/- ~$20 million Revenues per Ton 2019 Priced Position (Avg. Price per Short Ton) Total U.S. Thermal $17.10 – $18.10 PRB $11.25 ILB ~$42 Costs Per Ton (USD per Short Ton) Seaborne Export Thermal Volumes (Q2 – Q4) 7 ~$83 PRB $9.25 – $9.75 ~95% of Peabody’s 2019 U.S. thermal volumes are priced ILB $32 – $35 based on the mid-point of 2019 volume guidance Total U.S. Thermal $13.95 – $14.95 ~5.7 million short tons of seaborne export thermal coal priced (Q2 – Q4) 7 Seaborne Thermal3 $32 – $36 2020 Priced Position (Avg. Price per Short Ton) (includes Aus. Domestic Thermal) Seaborne Metallurgical3 ~40% and ~60% of Peabody’s 2020 U.S. thermal volumes are priced and $90 – $95 (excluding North Goonyella) committed, respectively, based on the mid-point of 2019 volume guidance Seaborne Export Thermal Volumes ~$77 ~2.1 million short tons of seaborne export thermal coal priced for 2020 23
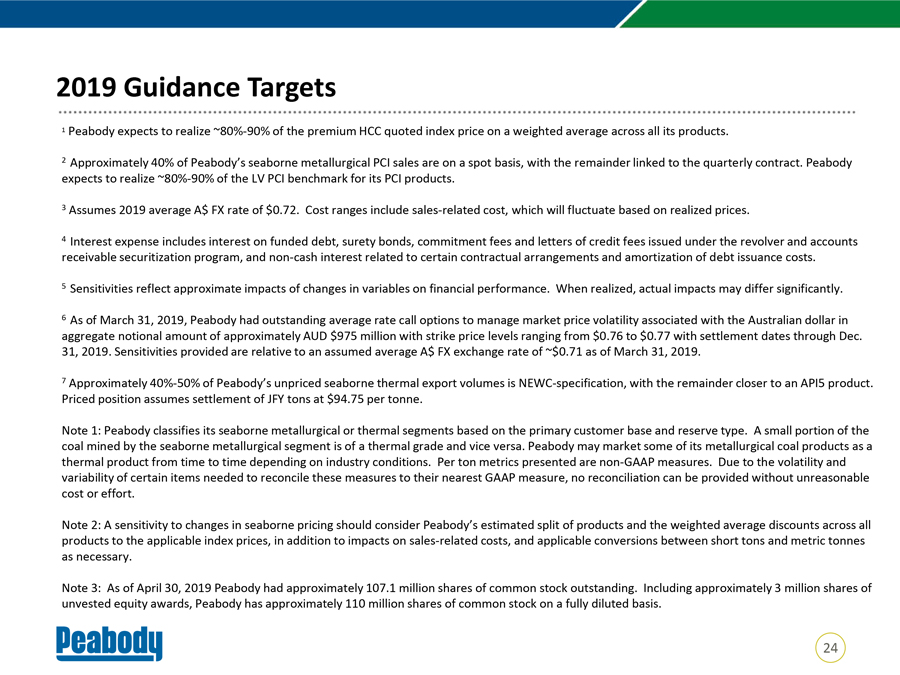
2019 Guidance Targets 1 Peabody expects to realize ~80%-90% of the premium HCC quoted index price on a weighted average across all its products. 2 Approximately 40% of Peabody’s seaborne metallurgical PCI sales are on a spot basis, with the remainder linked to the quarterly contract. Peabody expects to realize ~80%-90% of the LV PCI benchmark for its PCI products. 3 Assumes 2019 average A$ FX rate of $0.72. Cost ranges include sales-related cost, which will fluctuate based on realized prices. 4 Interest expense includes interest on funded debt, surety bonds, commitment fees and letters of credit fees issued under the revolver and accounts receivable securitization program, and non-cash interest related to certain contractual arrangements and amortization of debt issuance costs. 5 Sensitivities reflect approximate impacts of changes in variables on financial performance. When realized, actual impacts may differ significantly. 6 As of March 31, 2019, Peabody had outstanding average rate call options to manage market price volatility associated with the Australian dollar in aggregate notional amount of approximately AUD $975 million with strike price levels ranging from $0.76 to $0.77 with settlement dates through Dec. 31, 2019. Sensitivities provided are relative to an assumed average A$ FX exchange rate of ~$0.71 as of March 31, 2019. 7 Approximately 40%-50% of Peabody’s unpriced seaborne thermal export volumes is NEWC-specification, with the remainder closer to an API5 product. Priced position assumes settlement of JFY tons at $94.75 per tonne. Note 1: Peabody classifies its seaborne metallurgical or thermal segments based on the primary customer base and reserve type. A small portion of the coal mined by the seaborne metallurgical segment is of a thermal grade and vice versa. Peabody may market some of its metallurgical coal products as a thermal product from time to time depending on industry conditions. Per ton metrics presented are non-GAAP measures. Due to the volatility and variability of certain items needed to reconcile these measures to their nearest GAAP measure, no reconciliation can be provided without unreasonable cost or effort. Note 2: A sensitivity to changes in seaborne pricing should consider Peabody’s estimated split of products and the weighted average discounts across all products to the applicable index prices, in addition to impacts on sales-related costs, and applicable conversions between short tons and metric tonnes as necessary. Note 3: As of April 30, 2019 Peabody had approximately 107.1 million shares of common stock outstanding. Including approximately 3 million shares of unvested equity awards, Peabody has approximately 110 million shares of common stock on a fully diluted basis. 24
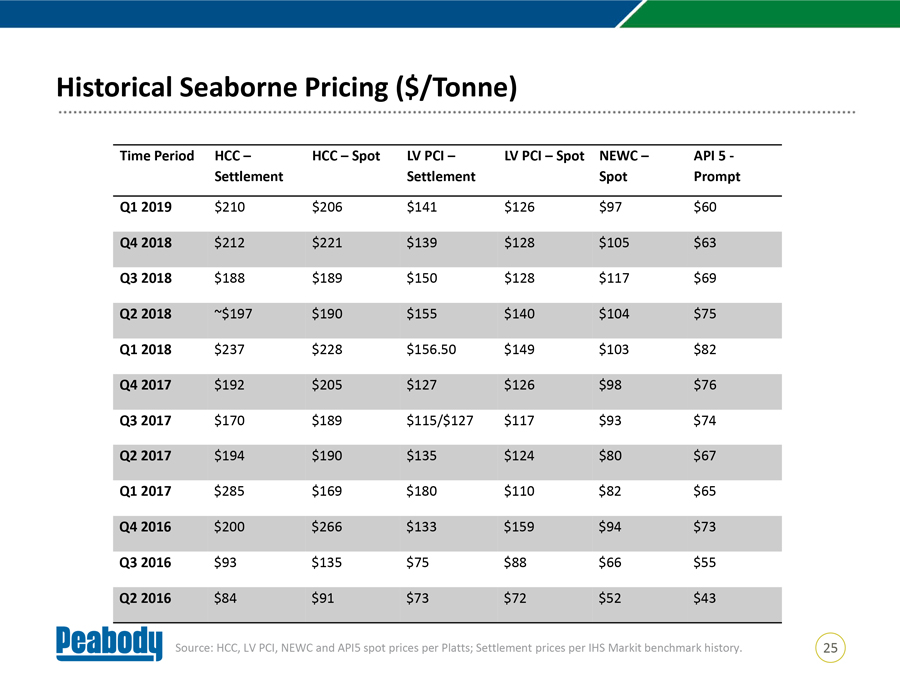
Historical Seaborne Pricing ($/Tonne) Time Period HCC – HCC – Spot LV PCI – LV PCI – Spot NEWC – API 5 -Settlement Settlement Spot Prompt Q1 2019 $210 $206 $141 $126 $97 $60 Q4 2018 $212 $221 $139 $128 $105 $63 Q3 2018 $188 $189 $150 $128 $117 $69 Q2 2018 ~$197 $190 $155 $140 $104 $75 Q1 2018 $237 $228 $156.50 $149 $103 $82 Q4 2017 $192 $205 $127 $126 $98 $76 Q3 2017 $170 $189 $115/$127 $117 $93 $74 Q2 2017 $194 $190 $135 $124 $80 $67 Q1 2017 $285 $169 $180 $110 $82 $65 Q4 2016 $200 $266 $133 $159 $94 $73 Q3 2016 $93 $135 $75 $88 $66 $55 Q2 2016 $84 $91 $73 $72 $52 $43 Source: HCC, LV PCI, NEWC and API5 spot prices per Platts; Settlement prices per IHS Markit benchmark history. 25

Peabody Executive Leadership Team Glenn Kellow President and CEO A. Verona Dorch EVP, CLO, Government Affairs and Corporate Secretary Charles Meintjes EVP – Corporate Services and COO Paul Richard SVP and Chief Human Resources Officer George J. Schuller Jr. President – Australia Amy Schwetz EVP and CFO (Standing, from left) Amy Schwetz, Glenn Kellow, A. Verona Dorch, Charles Meintjes Kemal Williamson (Seated from left) George J. Schuller Jr., Paul Richard, Kemal Williamson President – Americas 26
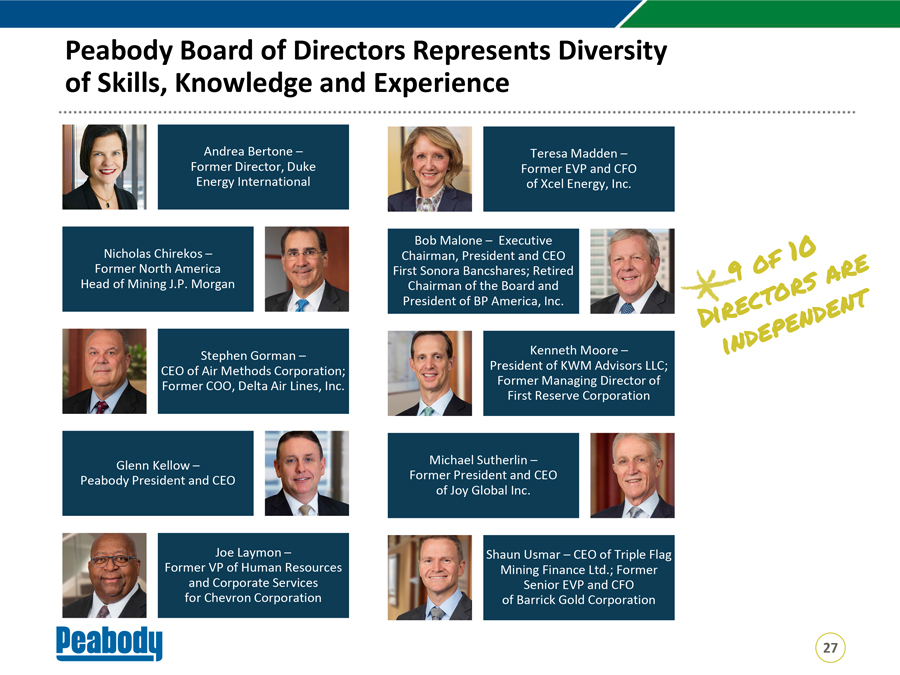
Peabody Board of Directors Represents Diversity of Skills, Knowledge and Experience Andrea Bertone – Teresa Madden –Former Director, Duke Former EVP and CFO Energy International of Xcel Energy, Inc. Bob Malone – Executive Nicholas Chirekos – Chairman, President and CEO Former North America First Sonora Bancshares; Retired Head of Mining J.P. Morgan Chairman of the Board and President of BP America, Inc. Stephen Gorman – Kenneth Moore –CEO of Air Methods Corporation; President of KWM Advisors LLC; Former COO, Delta Air Lines, Inc. Former Managing Director of First Reserve Corporation Glenn Kellow – Michael Sutherlin –Peabody President and CEO Former President and CEO of Joy Global Inc. Joe Laymon – Shaun Usmar – CEO of Triple Flag Former VP of Human Resources Mining Finance Ltd.; Former and Corporate Services Senior EVP and CFO for Chevron Corporation of Barrick Gold Corporation 27
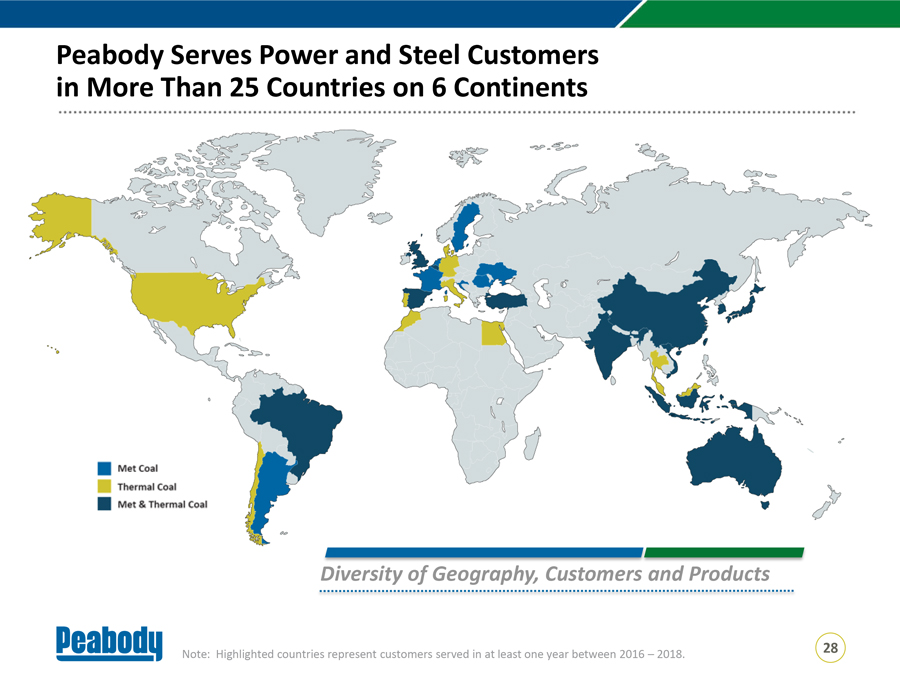
Peabody Serves Power and Steel Customers in More Than 25 Countries on 6 Continents Diversity of Geography, Customers and Products Note: Highlighted countries represent customers served in at least one year between 2016 – 2018. 28
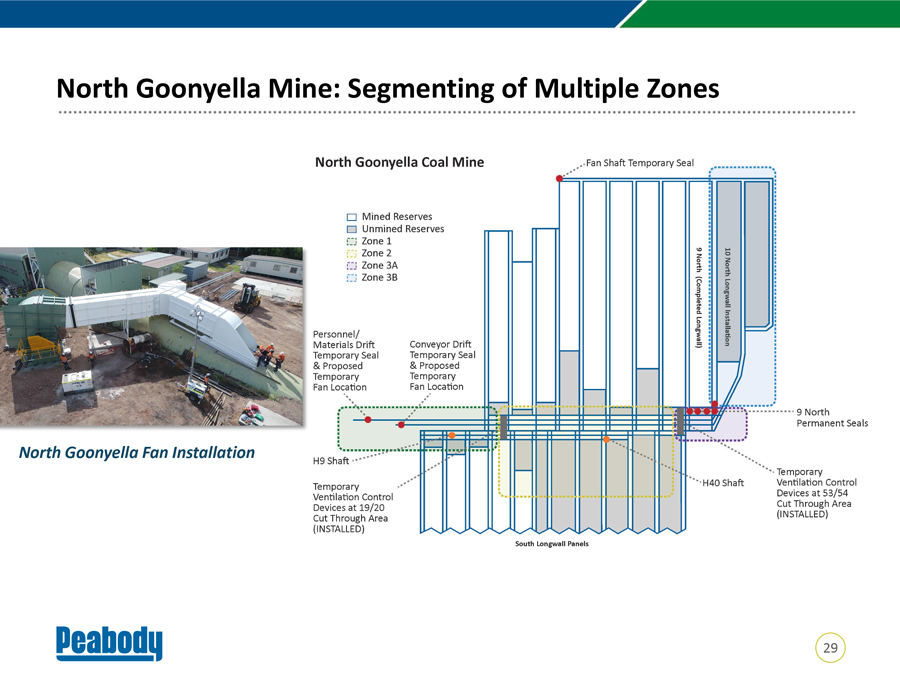
North Goonyella Mine: Segmenting of Multiple Zones North Goonyella Fan Installation 29
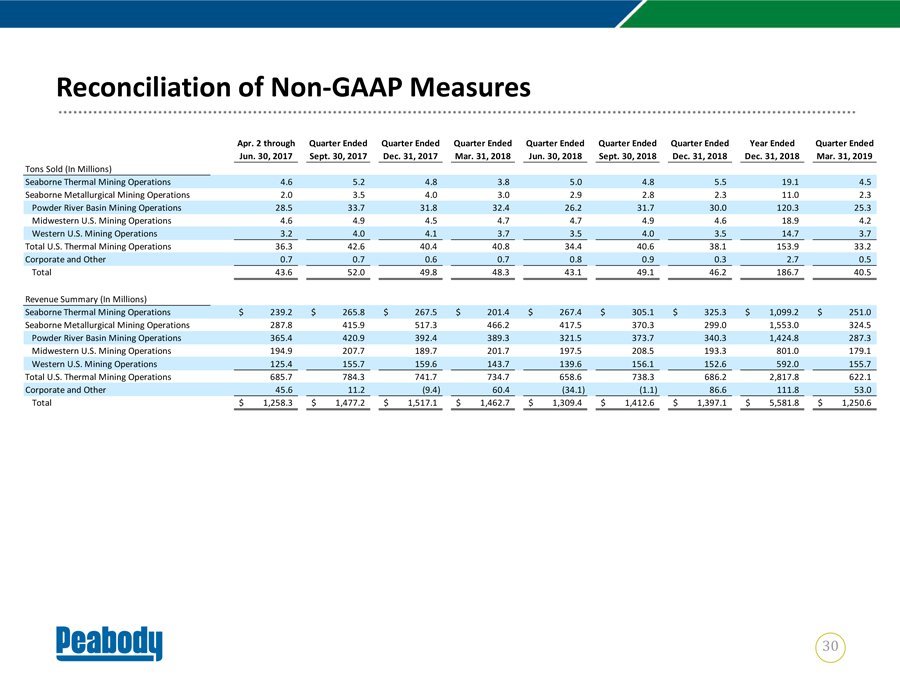
Reconciliation of Non-GAAP Measures Apr. 2 through Quarter Ended Quarter Ended Quarter Ended Quarter Ended Quarter Ended Quarter Ended Year Ended Quarter Ended Jun. 30, 2017 Sept. 30, 2017 Dec. 31, 2017 Mar. 31, 2018 Jun. 30, 2018 Sept. 30, 2018 Dec. 31, 2018 Dec. 31, 2018 Mar. 31, 2019 Tons Sold (In Millions) Seaborne Thermal Mining Operations 4.6 5.2 4.8 3.8 5.0 4.8 5.5 19.1 4.5 Seaborne Metallurgical Mining Operations 2.0 3.5 4.0 3.0 2.9 2.8 2.3 11.0 2.3 Powder River Basin Mining Operations 28.5 33.7 31.8 32.4 26.2 31.7 30.0 120.3 25.3 Midwestern U.S. Mining Operations 4.6 4.9 4.5 4.7 4.7 4.9 4.6 18.9 4.2 Western U.S. Mining Operations 3.2 4.0 4.1 3.7 3.5 4.0 3.5 14.7 3.7 Total U.S. Thermal Mining Operations 36.3 42.6 40.4 40.8 34.4 40.6 38.1 153.9 33.2 Corporate and Other 0.7 0.7 0.6 0.7 0.8 0.9 0.3 2.7 0.5 Total 43.6 52.0 49.8 48.3 43.1 49.1 46.2 186.7 40.5 Revenue Summary (In Millions) Seaborne Thermal Mining Operations $ 239.2 $ 265.8 $ 267.5 $ 201.4 $ 267.4 $ 305.1 $ 325.3 $ 1,099.2 $ 251.0 Seaborne Metallurgical Mining Operations 287.8 415.9 517.3 466.2 417.5 370.3 299.0 1,553.0 324.5 Powder River Basin Mining Operations 365.4 420.9 392.4 389.3 321.5 373.7 340.3 1,424.8 287.3 Midwestern U.S. Mining Operations 194.9 207.7 189.7 201.7 197.5 208.5 193.3 801.0 179.1 Western U.S. Mining Operations 125.4 155.7 159.6 143.7 139.6 156.1 152.6 592.0 155.7 Total U.S. Thermal Mining Operations 685.7 784.3 741.7 734.7 658.6 738.3 686.2 2,817.8 622.1 Corporate and Other 45.6 11.2 (9.4) 60.4 (34.1) (1.1) 86.6 111.8 53.0 Total $ 1,258.3 $ 1,477.2 $ 1,517.1 $ 1,462.7 $ 1,309.4 $ 1,412.6 $ 1,397.1 $ 5,581.8 $ 1,250.6 30
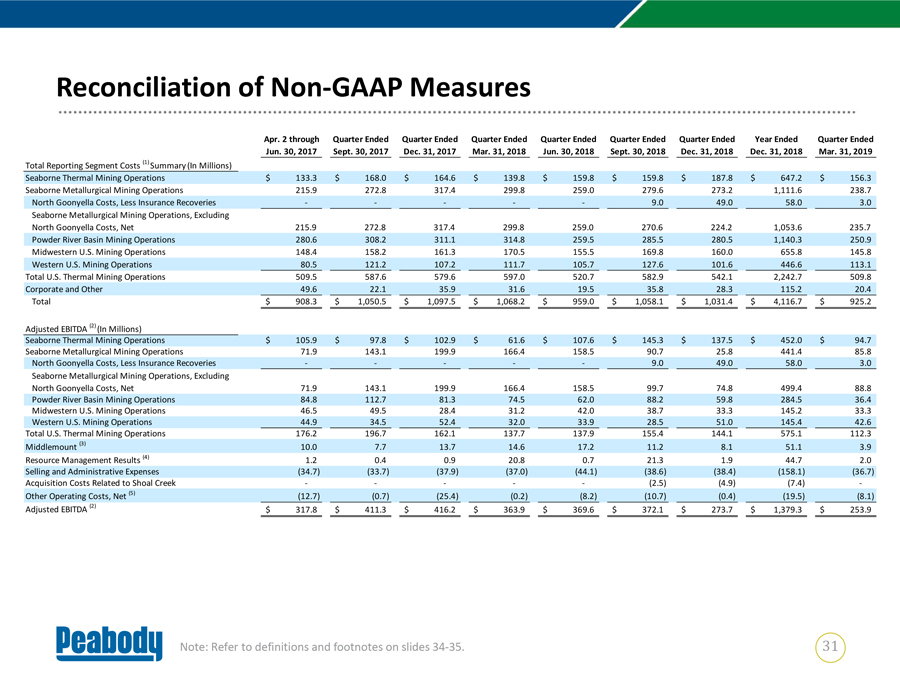
Reconciliation of Non-GAAP Measures Apr. 2 through Quarter Ended Quarter Ended Quarter Ended Quarter Ended Quarter Ended Quarter Ended Year Ended Quarter Ended Jun. 30, 2017 Sept. 30, 2017 Dec. 31, 2017 Mar. 31, 2018 Jun. 30, 2018 Sept. 30, 2018 Dec. 31, 2018 Dec. 31, 2018 Mar. 31, 2019 Total Reporting Segment Costs (1) Summary (In Millions) Seaborne Thermal Mining Operations $ 133.3 $ 168.0 $ 164.6 $ 139.8 $ 159.8 $ 159.8 $ 187.8 $ 647.2 $ 156.3 Seaborne Metallurgical Mining Operations 215.9 272.8 317.4 299.8 259.0 279.6 273.2 1,111.6 238.7 North Goonyella Costs, Less Insurance Recoveries — — — — — 9.0 49.0 58.0 3.0 Seaborne Metallurgical Mining Operations, Excluding North Goonyella Costs, Net 215.9 272.8 317.4 299.8 259.0 270.6 224.2 1,053.6 235.7 Powder River Basin Mining Operations 280.6 308.2 311.1 314.8 259.5 285.5 280.5 1,140.3 250.9 Midwestern U.S. Mining Operations 148.4 158.2 161.3 170.5 155.5 169.8 160.0 655.8 145.8 Western U.S. Mining Operations 80.5 121.2 107.2 111.7 105.7 127.6 101.6 446.6 113.1 Total U.S. Thermal Mining Operations 509.5 587.6 579.6 597.0 520.7 582.9 542.1 2,242.7 509.8 Corporate and Other 49.6 22.1 35.9 31.6 19.5 35.8 28.3 115.2 20.4 Total $ 908.3 $ 1,050.5 $ 1,097.5 $ 1,068.2 $ 959.0 $ 1,058.1 $ 1,031.4 $ 4,116.7 $ 925.2 Adjusted EBITDA (2) (In Millions) Seaborne Thermal Mining Operations $ 105.9 $ 97.8 $ 102.9 $ 61.6 $ 107.6 $ 145.3 $ 137.5 $ 452.0 $ 94.7 Seaborne Metallurgical Mining Operations 71.9 143.1 199.9 166.4 158.5 90.7 25.8 441.4 85.8 North Goonyella Costs, Less Insurance Recoveries — — — — — 9.0 49.0 58.0 3.0 Seaborne Metallurgical Mining Operations, Excluding North Goonyella Costs, Net 71.9 143.1 199.9 166.4 158.5 99.7 74.8 499.4 88.8 Powder River Basin Mining Operations 84.8 112.7 81.3 74.5 62.0 88.2 59.8 284.5 36.4 Midwestern U.S. Mining Operations 46.5 49.5 28.4 31.2 42.0 38.7 33.3 145.2 33.3 Western U.S. Mining Operations 44.9 34.5 52.4 32.0 33.9 28.5 51.0 145.4 42.6 Total U.S. Thermal Mining Operations 176.2 196.7 162.1 137.7 137.9 155.4 144.1 575.1 112.3 Middlemount (3) 10.0 7.7 13.7 14.6 17.2 11.2 8.1 51.1 3.9 Resource Management Results (4) 1.2 0.4 0.9 20.8 0.7 21.3 1.9 44.7 2.0 Selling and Administrative Expenses (34.7) (33.7) (37.9) (37.0) (44.1) (38.6) (38.4) (158.1) (36.7) Acquisition Costs Related to Shoal Creek — — — — — (2.5) (4.9) (7.4) -Other Operating Costs, Net (5) (12.7) (0.7) (25.4) (0.2) (8.2) (10.7) (0.4) (19.5) (8.1) Adjusted EBITDA (2) $ 317.8 $ 411.3 $ 416.2 $ 363.9 $ 369.6 $ 372.1 $ 273.7 $ 1,379.3 $ 253.9 Note: Refer to definitions and footnotes on slides 34-35. 31
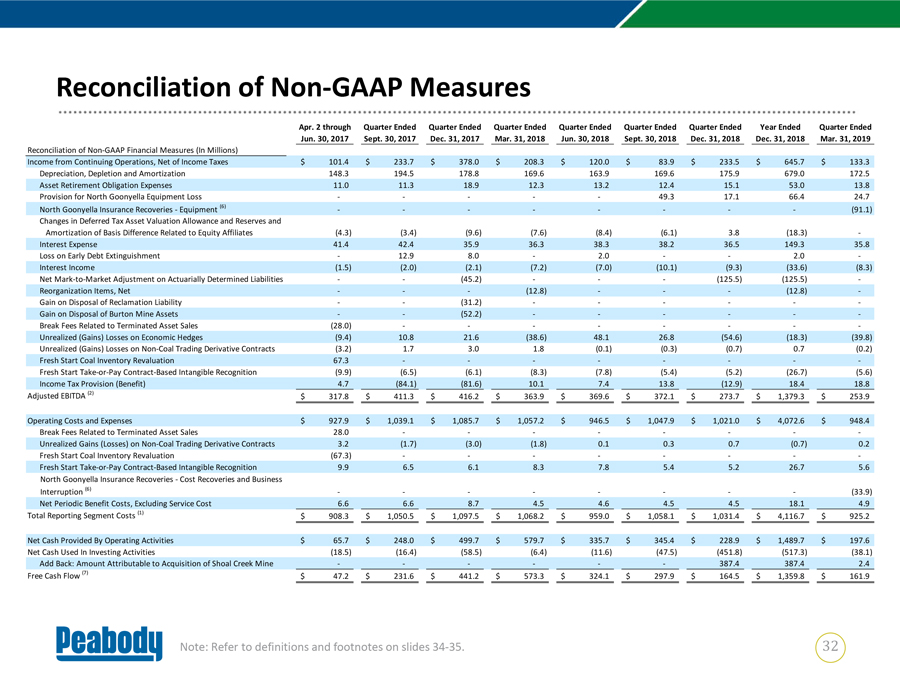
Reconciliation of Non-GAAP Measures Apr. 2 through Quarter Ended Quarter Ended Quarter Ended Quarter Ended Quarter Ended Quarter Ended Year Ended Quarter Ended Jun. 30, 2017 Sept. 30, 2017 Dec. 31, 2017 Mar. 31, 2018 Jun. 30, 2018 Sept. 30, 2018 Dec. 31, 2018 Dec. 31, 2018 Mar. 31, 2019 Reconciliation of Non-GAAP Financial Measures (In Millions) Income from Continuing Operations, Net of Income Taxes $ 101.4 $ 233.7 $ 378.0 $ 208.3 $ 120.0 $ 83.9 $ 233.5 $ 645.7 $ 133.3 Depreciation, Depletion and Amortization 148.3 194.5 178.8 169.6 163.9 169.6 175.9 679.0 172.5 Asset Retirement Obligation Expenses 11.0 11.3 18.9 12.3 13.2 12.4 15.1 53.0 13.8 Provision for North Goonyella Equipment Loss — — — — — 49.3 17.1 66.4 24.7 North Goonyella Insurance Recoveries—Equipment (6) — — — — — — — — (91.1) Changes in Deferred Tax Asset Valuation Allowance and Reserves and Amortization of Basis Difference Related to Equity Affiliates (4.3) (3.4) (9.6) (7.6) (8.4) (6.1) 3.8 (18.3) -Interest Expense 41.4 42.4 35.9 36.3 38.3 38.2 36.5 149.3 35.8 Loss on Early Debt Extinguishment — 12.9 8.0 — 2.0 — — 2.0 -Interest Income (1.5) (2.0) (2.1) (7.2) (7.0) (10.1) (9.3) (33.6) (8.3) Net Mark-to-Market Adjustment on Actuarially Determined Liabilities — — (45.2) — — — (125.5) (125.5) -Reorganization Items, Net — — — (12.8) — — — (12.8) -Gain on Disposal of Reclamation Liability — — (31.2) — — — — — -Gain on Disposal of Burton Mine Assets — — (52.2) — — — — — -Break Fees Related to Terminated Asset Sales (28.0) — — — — — — — -Unrealized (Gains) Losses on Economic Hedges (9.4) 10.8 21.6 (38.6) 48.1 26.8 (54.6) (18.3) (39.8) Unrealized (Gains) Losses on Non-Coal Trading Derivative Contracts (3.2) 1.7 3.0 1.8 (0.1) (0.3) (0.7) 0.7 (0.2) Fresh Start Coal Inventory Revaluation 67.3 — — — — — — — -Fresh Start Take-or-Pay Contract-Based Intangible Recognition (9.9) (6.5) (6.1) (8.3) (7.8) (5.4) (5.2) (26.7) (5.6) Income Tax Provision (Benefit) 4.7 (84.1) (81.6) 10.1 7.4 13.8 (12.9) 18.4 18.8 Adjusted EBITDA (2) $ 317.8 $ 411.3 $ 416.2 $ 363.9 $ 369.6 $ 372.1 $ 273.7 $ 1,379.3 $ 253.9 Operating Costs and Expenses $ 927.9 $ 1,039.1 $ 1,085.7 $ 1,057.2 $ 946.5 $ 1,047.9 $ 1,021.0 $ 4,072.6 $ 948.4 Break Fees Related to Terminated Asset Sales 28.0 — — — — — — — -Unrealized Gains (Losses) on Non-Coal Trading Derivative Contracts 3.2 (1.7) (3.0) (1.8) 0.1 0.3 0.7 (0.7) 0.2 Fresh Start Coal Inventory Revaluation (67.3) — — — — — — — -Fresh Start Take-or-Pay Contract-Based Intangible Recognition 9.9 6.5 6.1 8.3 7.8 5.4 5.2 26.7 5.6 North Goonyella Insurance Recoveries—Cost Recoveries and Business Interruption (6) — — — — — — — — (33.9) Net Periodic Benefit Costs, Excluding Service Cost 6.6 6.6 8.7 4.5 4.6 4.5 4.5 18.1 4.9 Total Reporting Segment Costs (1) $ 908.3 $ 1,050.5 $ 1,097.5 $ 1,068.2 $ 959.0 $ 1,058.1 $ 1,031.4 $ 4,116.7 $ 925.2 Net Cash Provided By Operating Activities $ 65.7 $ 248.0 $ 499.7 $ 579.7 $ 335.7 $ 345.4 $ 228.9 $ 1,489.7 $ 197.6 Net Cash Used In Investing Activities (18.5) (16.4) (58.5) (6.4) (11.6) (47.5) (451.8) (517.3) (38.1) Add Back: Amount Attributable to Acquisition of Shoal Creek Mine — — — — — — 387.4 387.4 2.4 Free Cash Flow (7) $ 47.2 $ 231.6 $ 441.2 $ 573.3 $ 324.1 $ 297.9 $ 164.5 $ 1,359.8 $ 161.9 Note: Refer to definitions and footnotes on slides 34-35. 32
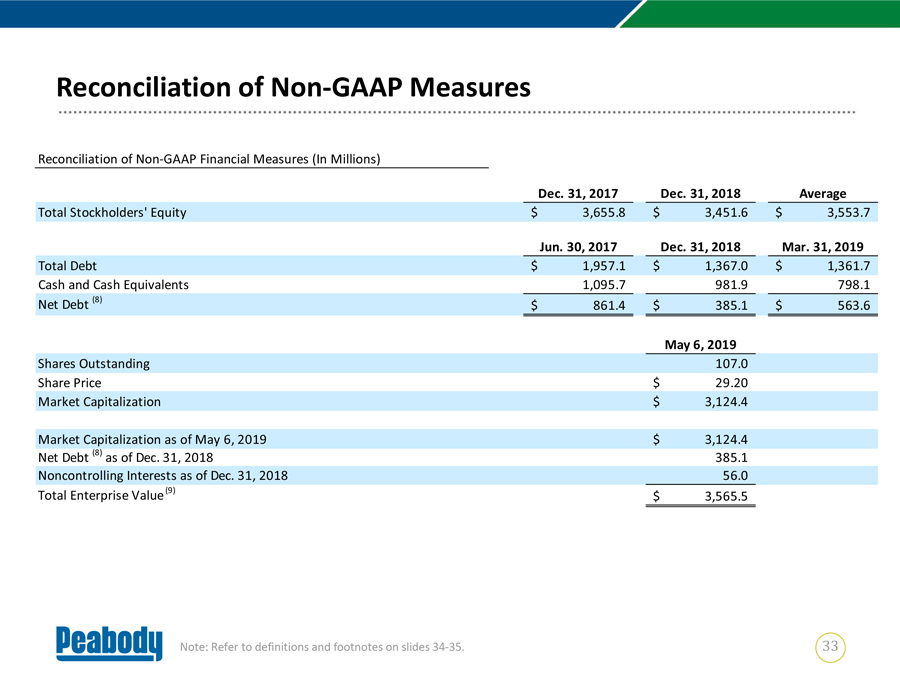
Reconciliation of Non-GAAP Measures Reconciliation of Non-GAAP Financial Measures (In Millions) Dec. 31, 2017 Dec. 31, 2018 Average Total Stockholders’ Equity $ 3,655.8 $ 3,451.6 $ 3,553.7 Jun. 30, 2017 Dec. 31, 2018 Mar. 31, 2019 Total Debt $ 1,957.1 $ 1,367.0 $ 1,361.7 Cash and Cash Equivalents 1,095.7 981.9 798.1 Net Debt (8) $ 861.4 $ 385.1 $ 563.6 May 6, 2019 Shares Outstanding 107.0 Share Price $ 29.20 Market Capitalization $ 3,124.4 Market Capitalization as of May 6, 2019 $ 3,124.4 Net Debt (8) as of Dec. 31, 2018 385.1 Noncontrolling Interests as of Dec. 31, 2018 56.0 Total Enterprise Value (9) $ 3,565.5 Note: Refer to definitions and footnotes on slides 34-35. 33
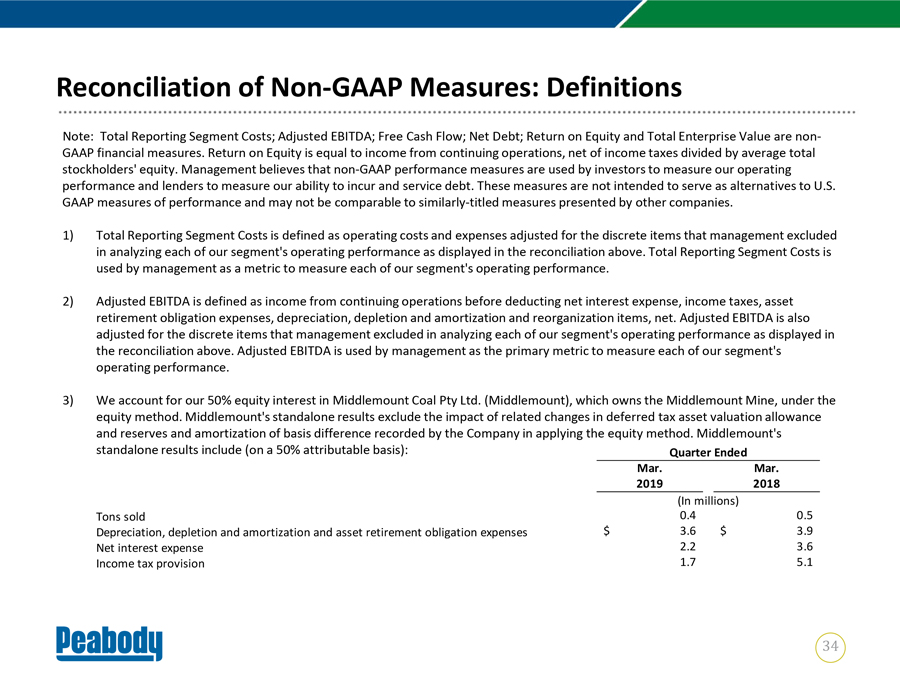
Reconciliation of Non-GAAP Measures: Definitions Note: Total Reporting Segment Costs; Adjusted EBITDA; Free Cash Flow; Net Debt; Return on Equity and Total Enterprise Value are non-GAAP financial measures. Return on Equity is equal to income from continuing operations, net of income taxes divided by average total stockholders’ equity. Management believes that non-GAAP performance measures are used by investors to measure our operating performance and lenders to measure our ability to incur and service debt. These measures are not intended to serve as alternatives to U.S. GAAP measures of performance and may not be comparable to similarly-titled measures presented by other companies. 1) Total Reporting Segment Costs is defined as operating costs and expenses adjusted for the discrete items that management excluded in analyzing each of our segment’s operating performance as displayed in the reconciliation above. Total Reporting Segment Costs is used by management as a metric to measure each of our segment’s operating performance. 2) Adjusted EBITDA is defined as income from continuing operations before deducting net interest expense, income taxes, asset retirement obligation expenses, depreciation, depletion and amortization and reorganization items, net. Adjusted EBITDA is also adjusted for the discrete items that management excluded in analyzing each of our segment’s operating performance as displayed in the reconciliation above. Adjusted EBITDA is used by management as the primary metric to measure each of our segment’s operating performance. 3) We account for our 50% equity interest in Middlemount Coal Pty Ltd. (Middlemount), which owns the Middlemount Mine, under the equity method. Middlemount’s standalone results exclude the impact of related changes in deferred tax asset valuation allowance and reserves and amortization of basis difference recorded by the Company in applying the equity method. Middlemount’s standalone results include (on a 50% attributable basis): Quarter Ended Mar. Mar. 2019 2018 (In millions) Tons sold 0.4 0.5 Depreciation, depletion and amortization and asset retirement obligation expenses $ 3.6 $ 3.9 Net interest expense 2.2 3.6 Income tax provision 1.7 5.1 34
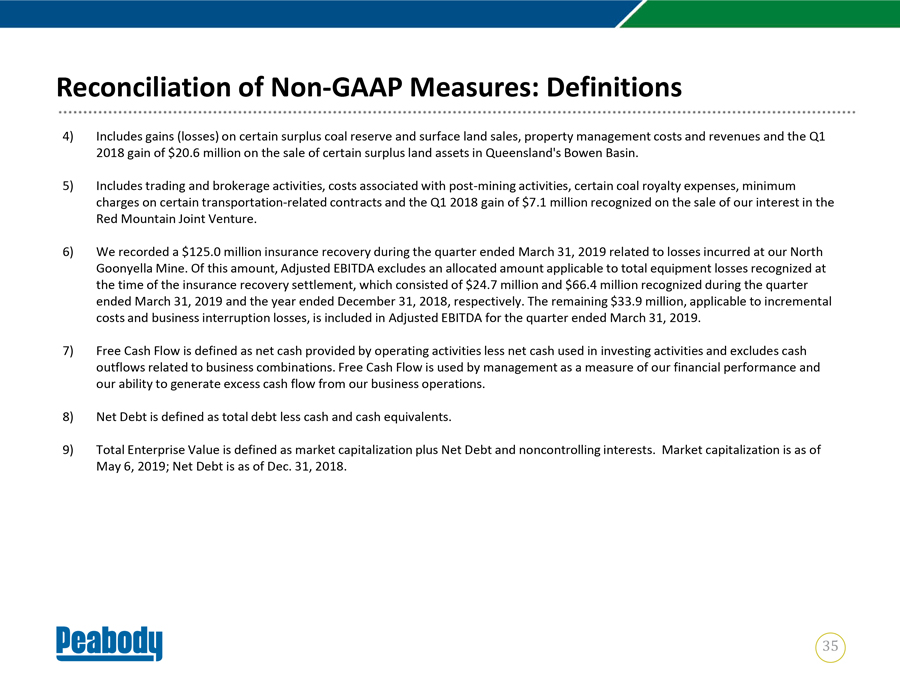
Reconciliation of Non-GAAP Measures: Definitions 4) Includes gains (losses) on certain surplus coal reserve and surface land sales, property management costs and revenues and the Q1 2018 gain of $20.6 million on the sale of certain surplus land assets in Queensland’s Bowen Basin. 5) Includes trading and brokerage activities, costs associated with post-mining activities, certain coal royalty expenses, minimum charges on certain transportation-related contracts and the Q1 2018 gain of $7.1 million recognized on the sale of our interest in the Red Mountain Joint Venture. 6) We recorded a $125.0 million insurance recovery during the quarter ended March 31, 2019 related to losses incurred at our North Goonyella Mine. Of this amount, Adjusted EBITDA excludes an allocated amount applicable to total equipment losses recognized at the time of the insurance recovery settlement, which consisted of $24.7 million and $66.4 million recognized during the quarter ended March 31, 2019 and the year ended December 31, 2018, respectively. The remaining $33.9 million, applicable to incremental costs and business interruption losses, is included in Adjusted EBITDA for the quarter ended March 31, 2019. 7) Free Cash Flow is defined as net cash provided by operating activities less net cash used in investing activities and excludes cash outflows related to business combinations. Free Cash Flow is used by management as a measure of our financial performance and our ability to generate excess cash flow from our business operations. 8) Net Debt is defined as total debt less cash and cash equivalents. 9) Total Enterprise Value is defined as market capitalization plus Net Debt and noncontrolling interests. Market capitalization is as of May 6, 2019; Net Debt is as of Dec. 31, 2018. 35