Exhibit 99.1

October 2017 Investor Presentation
Certain statements included in this presentation are forward-looking as defined in the Private Securities Litigation Reform Act of 1995. The Company uses words such as “anticipate,” “believe,” “expect,” “may,” “forecast,” “project,” “should,” “estimate,” “plan,” “outlook,” “target,” “likely,” “will,” “to be” or other similar words to identify forward-looking statements. These forward-looking statements are made as of the date of this presentation and are based on numerous assumptions that the Company believes are reasonable, but these assumptions are open to a wide range of uncertainties and business risks that may cause actual results to differ materially from expectations. These factors are difficult to accurately predict and may be beyond the Company’s control. Such factors include, but are not limited to those described in the Company’s Annual Report on Form 10-K for the year ended December 31, 2016 filed with the SEC on March 22, 2017, as amended on July 10, 2017 and August 14, 2017, and in Exhibit 99.2 to the Company’s Current Report on Form 8-K filed with the SEC on April 11, 2017, as well as other filings the Company may make from time to time with the SEC. Factors that could affect the Company’s results or an investment in its securities include but are not limited to: competition in the energy market and supply and demand for the Company’s products, including the impact of alternative energy sources, such as natural gas and renewables; global steel demand and its downstream impact on metallurgical coal prices, and lower demand for the Company’s products by electric power generators; customer procurement practices and contract duration; the impact of weather and natural disasters on demand, production and transportation; reductions and/or deferrals of purchases by major customers and the Company’s ability to renew sales contracts; credit and performance risks associated with customers, suppliers, contract miners, co-shippers, and trading, bank and other financial counterparties; geologic, equipment, permitting, site access, operational risks and new technologies related to mining; transportation availability, performance and costs; availability, timing of delivery and costs of key supplies, capital equipment or commodities such as diesel fuel, steel, explosives and tires; impact of take-or-pay arrangements for rail and port commitments for the delivery of coal; successful implementation of business strategies, including, without limitation, the actions the Company is implementing to improve its organization and respond to current conditions; negotiation of labor contracts, employee relations and workforce availability, including, without limitation, attracting and retaining key personnel; changes in post-retirement benefit and pension obligations and their related funding requirements; replacement and development of coal reserves; uncertainties in estimating the Company’s coal reserves; effects of changes in interest rates and currency exchange rates (primarily the Australian dollar); the Company’s ability to successfully consummate acquisitions or divestitures, and the resulting effects thereof; economic strength and political stability of countries in which the Company has operations or serves customers; legislation, regulations and court decisions or other government actions, including, but not limited to, new environmental and mine safety requirements, changes in income tax regulations, sales-related royalties, or other regulatory taxes and changes in derivative laws and regulations; the Company’s ability to obtain and renew permits necessary for the Company’s operations; the Company’s ability to appropriately secure the Company’s requirements for reclamation, federal and state workers’ compensation, federal coal leases and other obligations related to the Company’s operations, including the Company’s ability to utilize self-bonding and/or successfully access the commercial surety bond market; litigation or other dispute resolution, including, but not limited to, claims not yet asserted; terrorist attacks or security threats, including, but not limited to, cybersecurity breaches; impacts of pandemic illnesses; any lack of an established market for certain of the Company’s securities, including the Company’s preferred stock, and potential dilution of the Company’s common stock; price volatility in the Company’s securities; short-sales in the Company’s securities; any conflicts of interest between the Company’s significant shareholders and other holders of the Company’s capital stock; the Company’s ability to generate sufficient cash to service all of the Company’s indebtedness; the Company’s debt instruments and capital structure placing certain limits on the Company’s ability to pay dividends and repurchase capital stock; the Company’s ability to comply with financial and other restrictive covenants in various agreements, including the Company’s debt instruments; and other risks detailed in the Company’s reports filed with the SEC. The Company does not undertake to update its forward-looking statements except as required by law. Adjusted EBITDA is a non-GAAP measure defined as income (loss) from continuing operations before deducting net interest expense, income taxes, asset retirement obligation expenses, depreciation, depletion and amortization and reorganization items, net. Adjusted EBITDA is also adjusted for the discrete items that management excluded in analyzing each of the segment’s operating performance as displayed in the reconciliation. Adjusted EBITDA is used by management as one of the primary metrics to measure the Company’s operating performance. Management also believes non-GAAP performance measures are used by investors to measure the Company’s operating performance and lenders to measure the Company’s ability to incur and service debt. Adjusted EBITDA is not intended to serve as an alternative to U.S. GAAP measures of performance and may not be comparable to similarly-titled measures presented by other companies. 2 Statement on Forward-Looking Information
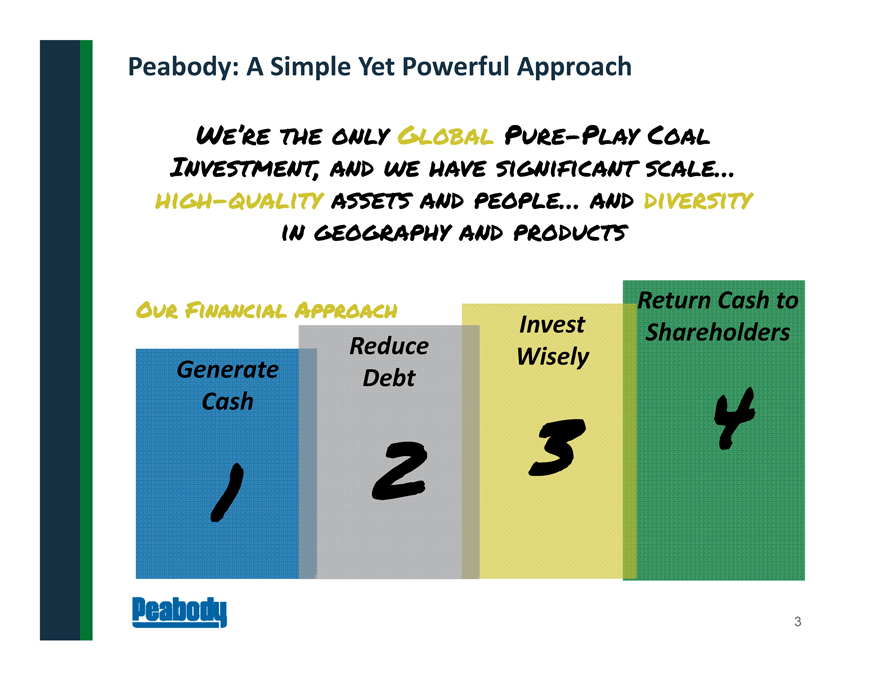
3 Peabody: A Simple Yet Powerful Approach We’re the only Global Pure-Play Coal Investment, and we have significant scale… high-quality assets and people… and diversity in geography and products Generate Cash Invest Wisely Return Cash to Reduce Shareholders Debt 1 2 3 4 Our Financial Approach

23 operations In U.S. and Australia ~7,000 Employee-Owners Globally $4.7 billion 2016 Revenues 25+ countries Served by Peabody Operations 5.6 billion Tons of Reserves 4 Who We Are; Where We Operate Note: Information as of the year ended Dec. 31, 2016, with the exception of headcount which is provided as of June 30, 2017. Proven and probable reserves reflect estimated amounts as of Dec. 31, 2016.
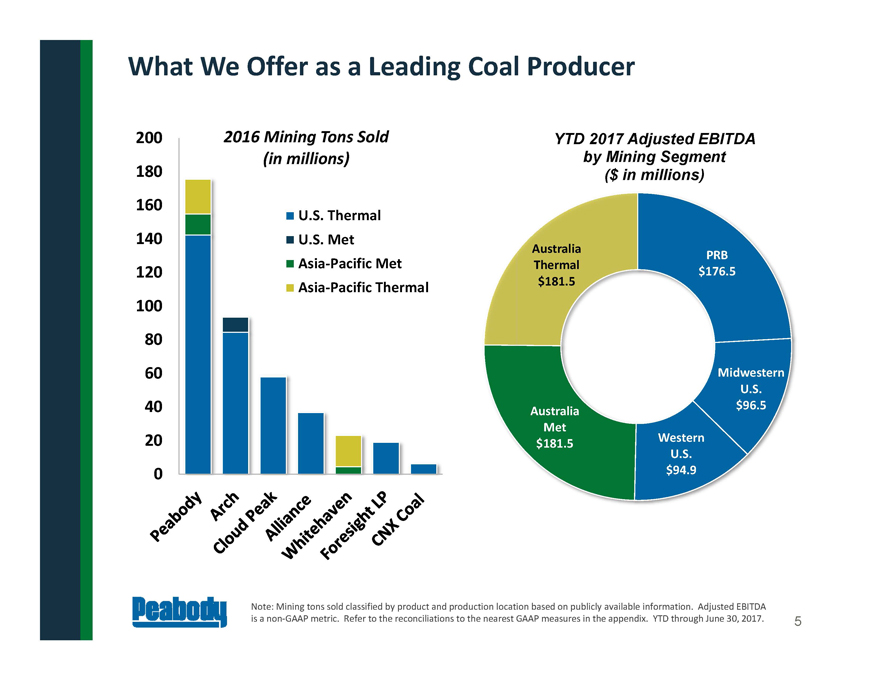
5 What We Offer as a Leading Coal Producer Note: Mining tons sold classified by product and production location based on publicly available information. Adjusted EBITDA is a non-GAAP metric. Refer to the reconciliations to the nearest GAAP measures in the appendix. YTD through June 30, 2017. PRB $176.5 Midwestern U.S. $96.5 Western U.S. $94.9 Australia Met $181.5 Australia Thermal $181.5 YTD 2017 Adjusted EBITDA by Mining Segment ($ in millions) 0 20 40 60 80 100 120 140 160 180 200 2016 Mining Tons Sold (in millions) U.S. Thermal U.S. Met Asia-Pacific Met Asia-Pacific Thermal
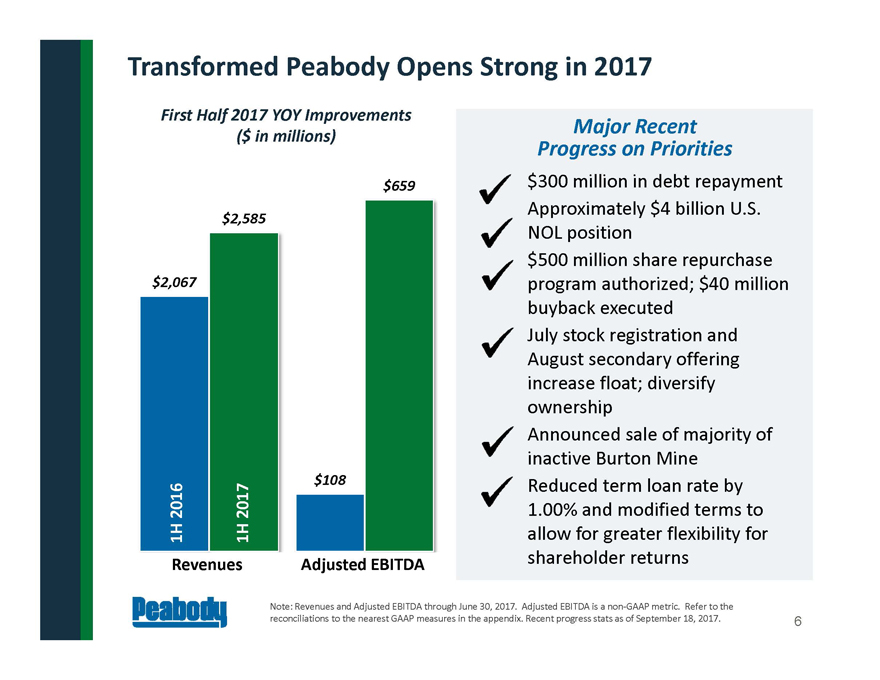
6 Transformed Peabody Opens Strong in 2017 Note: Revenues and Adjusted EBITDA through June 30, 2017. Adjusted EBITDA is a non-GAAP metric. Refer to the reconciliations to the nearest GAAP measures in the appendix. Recent progress stats as of September 18, 2017. $300 million in debt repayment Approximately $4 billion U.S. NOL position $500 million share repurchase program authorized; $40 million buyback executed July stock registration and August secondary offering increase float; diversify ownership Announced sale of majority of inactive Burton Mine Reduced term loan rate by 1.00% and modified terms to allow for greater flexibility for shareholder returns Major Recent Progress on Priorities $2,067 $2,585 1H 2016 1H 2017 First Half 2017 YOY Improvements ($ in millions) $108 $659 Revenues Adjusted EBITDA
7 Mining Operations Operations at Peabody’s North Antelope Rochelle Mine in Wyoming
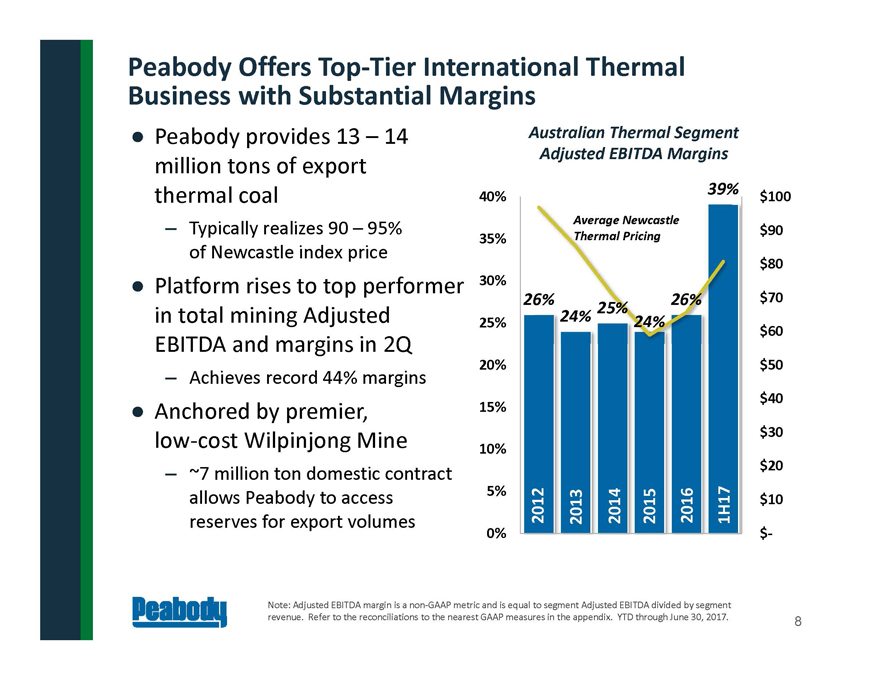
26% 24% 25% 24% 26% 39% $- $10 $20 $30 $40 $50 $60 $70 $80 $90 $100 0% 5% 10% 15% 20% 25% 30% 35% 40% Peabody Offers Top-Tier International Thermal Business with Substantial Margins • Peabody provides 13 – 14 million tons of export thermal coal – Typically realizes 90 – 95% of Newcastle index price • Platform rises to top performer in total mining Adjusted EBITDA and margins in 2Q – Achieves record 44% margins • Anchored by premier, low-cost Wilpinjong Mine – ~7 million ton domestic contract allows Peabody to access reserves for export volumes 8 Australian Thermal Segment Adjusted EBITDA Margins 2014 1H17 Note: Adjusted EBITDA margin is a non-GAAP metric and is equal to segment Adjusted EBITDA divided by segment revenue. Refer to the reconciliations to the nearest GAAP measures in the appendix. YTD through June 30, 2017. 2016 2012 2013 2015 Average Newcastle Thermal Pricing

-19% 29% -30% -20% -10% 0% 10% 20% 30% 40% Australian Seaborne Metallurgical Portfolio Represents Marked Improvement; Further Strengthening Platform • Substantial steps taken to improve platform, including: – Improved efficiencies, lower costs through owner-operator conversions – Aligned and leaner workforce – Enhanced mine planning – Transition of high-cost Burton Mine to care and maintenance • Driving further productivity at North Goonyella and Coppabella, mines with largest met reserves • Evaluating opportunities to lead to stable metallurgical coal volumes over time • On track to reach 2017 volume and cost targets 9 Improvement in Australian Metallurgical Adjusted EBITDA Margins 1H 2016 1H 2017 Note: Adjusted EBITDA margin is a non-GAAP metric. Refer to the reconciliations to the nearest GAAP measures in the appendix. Adjusted EBITDA margin is equal to segment Adjusted EBITDA divided by segment revenue. YTD through June 30, 2017.
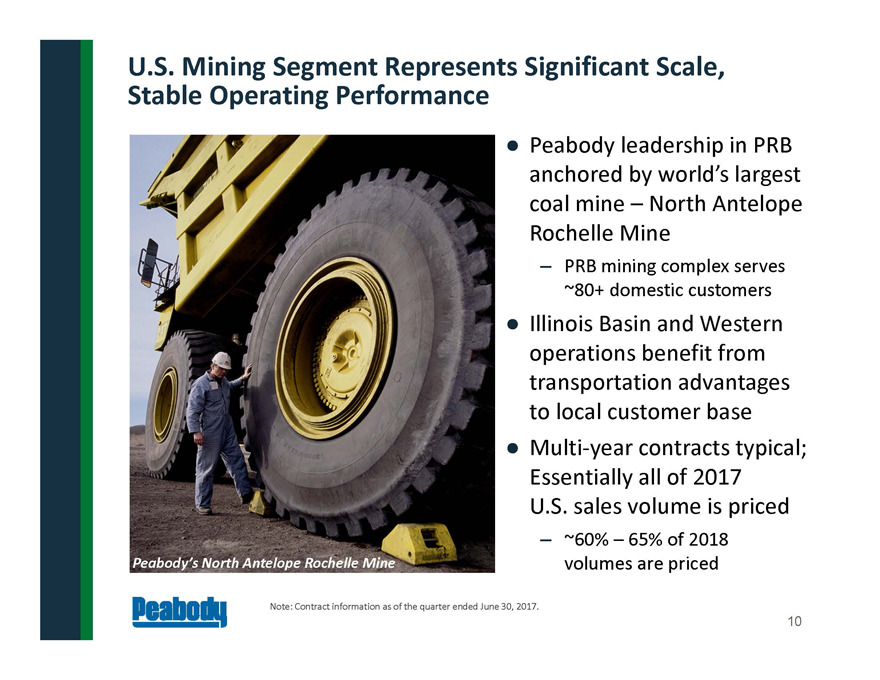
10 U.S. Mining Segment Represents Significant Scale, Stable Operating Performance Note: Contract information as of the quarter ended June 30, 2017. • Peabody leadership in PRB anchored by world’s largest coal mine – North Antelope Rochelle Mine – PRB mining complex serves ~80+ domestic customers • Illinois Basin and Western operations benefit from transportation advantages to local customer base • Multi-year contracts typical; Essentially all of 2017 U.S. sales volume is priced – ~60% – 65% of 2018 Peabody’s North Antelope Rochelle Mine volumes are priced
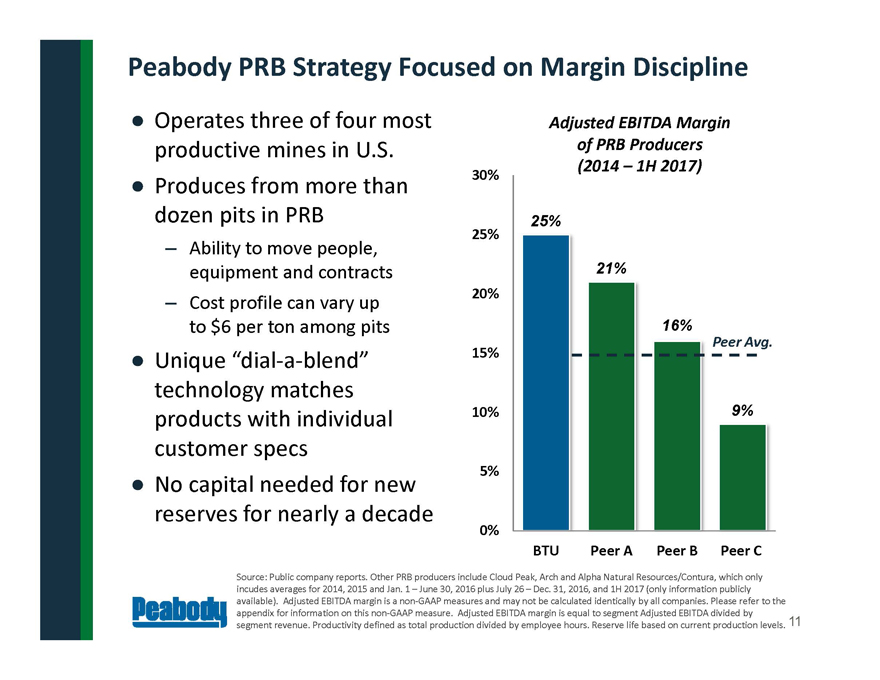
Peabody PRB Strategy Focused on Margin Discipline 25% 21% 16% 9% 0% 5% 10% 15% 20% 25% 30% BTU Peer A Peer B Peer C Adjusted EBITDA Margin of PRB Producers (2014 – 1H 2017) • Operates three of four most productive mines in U.S. • Produces from more than dozen pits in PRB – Ability to move people, equipment and contracts – Cost profile can vary up to $6 per ton among pits • Unique “dial-a-blend” technology matches products with individual customer specs • No capital needed for new reserves for nearly a decade Peer Avg. Source: Public company reports. Other PRB producers include Cloud Peak, Arch and Alpha Natural Resources/Contura, which only incudes averages for 2014, 2015 and Jan. 1 – June 30, 2016 plus July 26 – Dec. 31, 2016, and 1H 2017 (only information publicly available). Adjusted EBITDA margin is a non-GAAP measures and may not be calculated identically by all companies. Please refer to the appendix for information on this non-GAAP measure. Adjusted EBITDA margin is equal to segment Adjusted EBITDA divided by segment revenue. Productivity defined as total production divided by employee hours. Reserve life based on current production levels. 11

12 Peabody “DNA” Interwoven from PRB, Midwest and Australian Heritage PRB: Large Scale, Innovative Process Technologies Australia: Continuous Improvement, Global Mining The Peabody Way Midwest: Capital Discipline, Cost Control Trading and Shared Services: Support, Platform Optimization
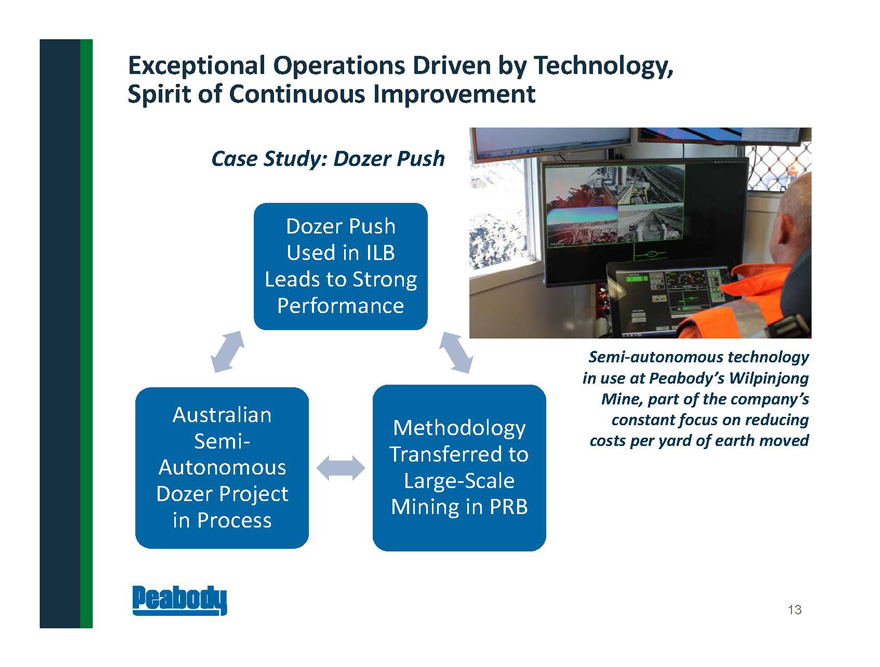
13 Exceptional Operations Driven by Technology, Spirit of Continuous Improvement Dozer Push Used in ILB Leads to Strong Performance Methodology Transferred to Large-Scale Mining in PRB Australian Semi- Autonomous Dozer Project in Process Case Study: Dozer Push Semi-autonomous technology in use at Peabody’s Wilpinjong Mine, part of the company’s constant focus on reducing costs per yard of earth moved
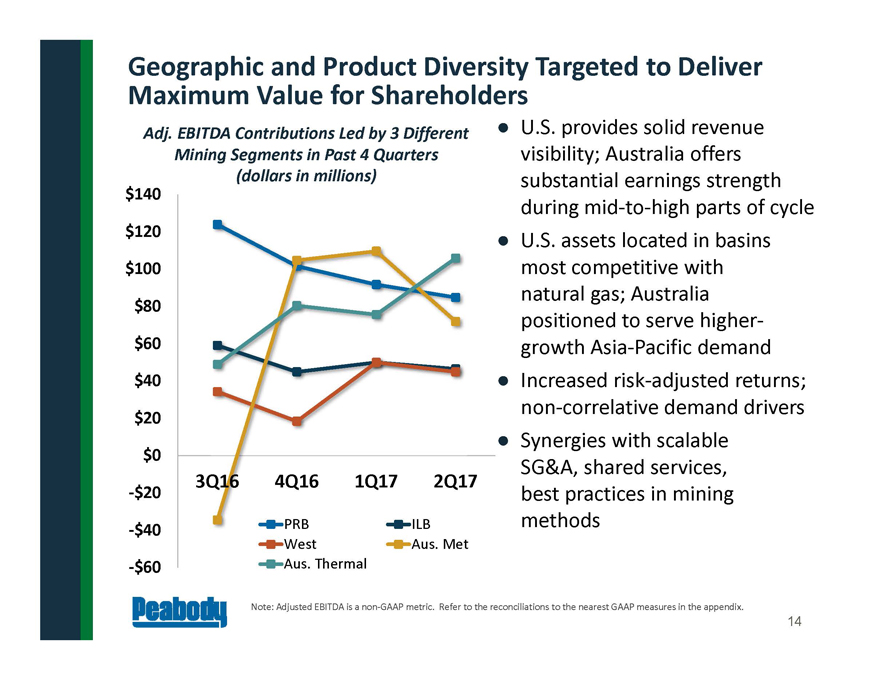
14 Geographic and Product Diversity Targeted to Deliver Maximum Value for Shareholders Note: Adjusted EBITDA is a non-GAAP metric. Refer to the reconciliations to the nearest GAAP measures in the appendix. • U.S. provides solid revenue visibility; Australia offers substantial earnings strength during mid-to-high parts of cycle • U.S. assets located in basins most competitive with natural gas; Australia positioned to serve highergrowth Asia-Pacific demand • Increased risk-adjusted returns; non-correlative demand drivers • Synergies with scalable SG&A, shared services, best practices in mining methods Adj. EBITDA Contributions Led by 3 Different Mining Segments in Past 4 Quarters (dollars in millions) -$60 -$40 -$20 $0 $20 $40 $60 $80 $100 $120 $140 3Q16 4Q16 1Q17 2Q17 PRB ILB West Aus. Met Aus. Thermal
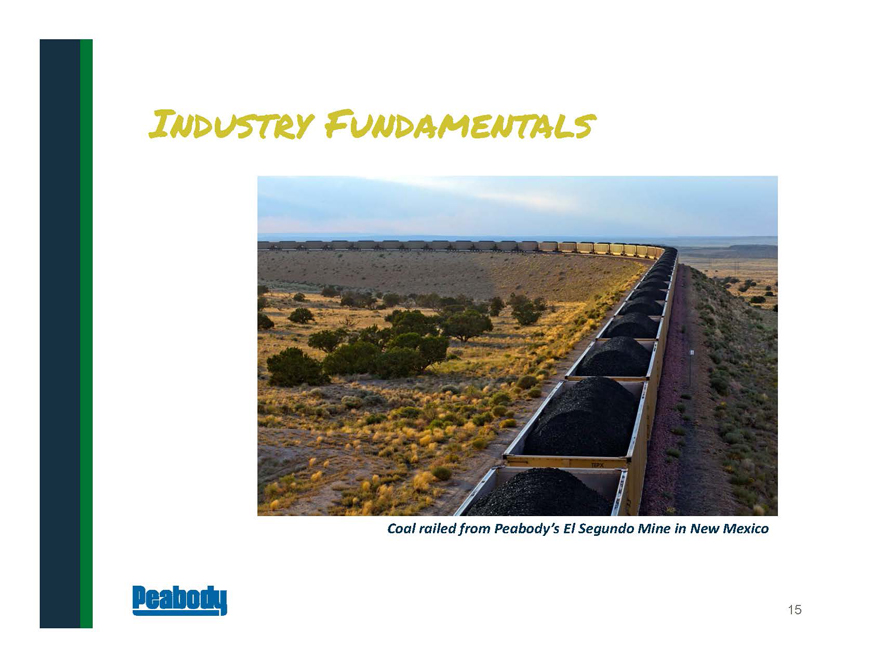
15 Industry Fundamentals Coal railed from Peabody’s El Segundo Mine in New Mexico
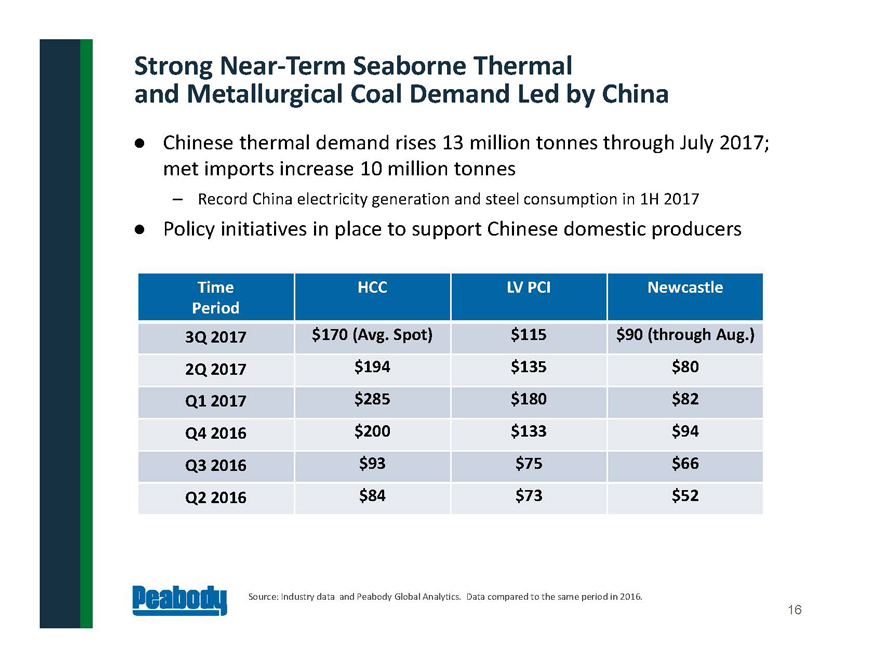
• Chinese thermal demand rises 13 million tonnes through July 2017; met imports increase 10 million tonnes – Record China electricity generation and steel consumption in 1H 2017 • Policy initiatives in place to support Chinese domestic producers Strong Near-Term Seaborne Thermal and Metallurgical Coal Demand Led by China 16 Source: Industry data and Peabody Global Analytics. Data compared to the same period in 2016. Time Period HCC LV PCI Newcastle 3Q 2017 $170 (Avg. Spot) $115 $90 (through Aug.) 2Q 2017 $194 $135 $80 Q1 2017 $285 $180 $82 Q4 2016 $200 $133 $94 Q3 2016 $93 $75 $66 Q2 2016 $84 $73 $52
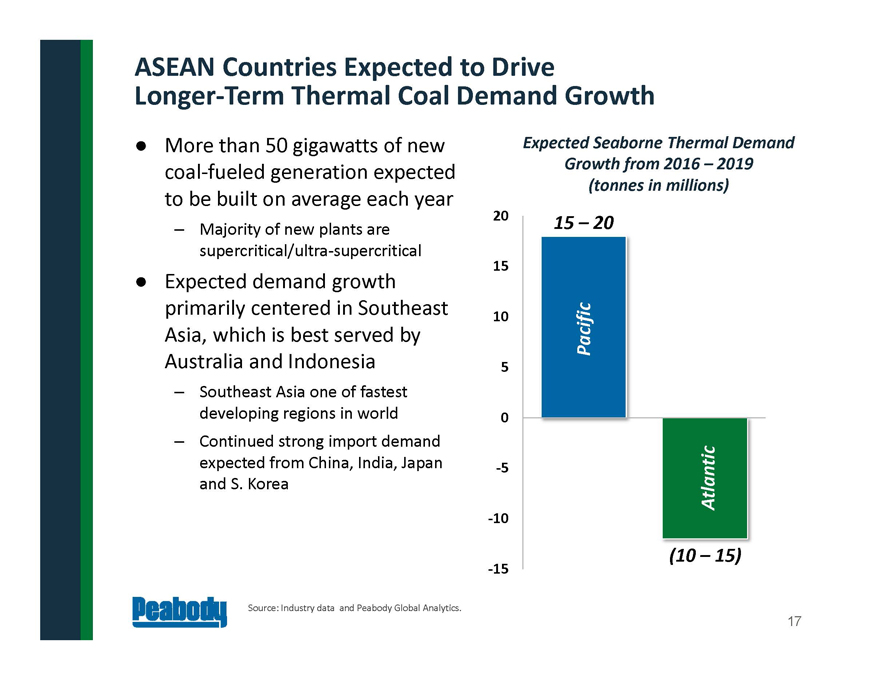
ASEAN Countries Expected to Drive Longer-Term Thermal Coal Demand Growth 17 Source: Industry data and Peabody Global Analytics. • More than 50 gigawatts of new coal-fueled generation expected to be built on average each year – Majority of new plants are supercritical/ultra-supercritical • Expected demand growth primarily centered in Southeast Asia, which is best served by Australia and Indonesia – Southeast Asia one of fastest developing regions in world – Continued strong import demand expected from China, India, Japan and S. Korea -15 -10 -5 0 5 10 15 20 Atlantic Pacific Expected Seaborne Thermal Demand Growth from 2016 – 2019 (tonnes in millions) 15 – 20 (10 – 15)
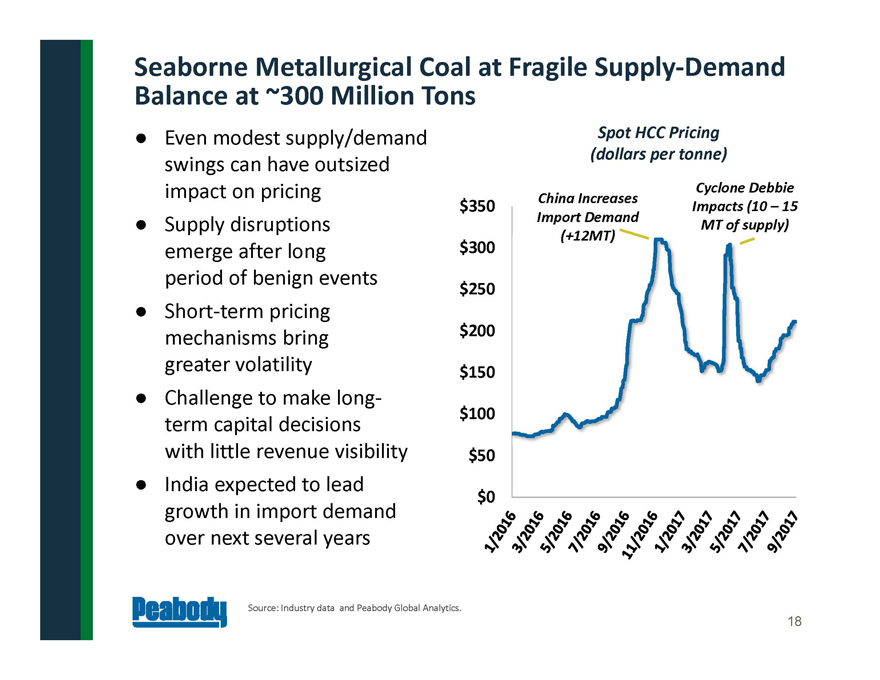
Seaborne Metallurgical Coal at Fragile Supply-Demand Balance at ~300 Million Tons 18 Source: Industry data and Peabody Global Analytics. • Even modest supply/demand swings can have outsized impact on pricing • Supply disruptions emerge after long period of benign events • Short-term pricing mechanisms bring greater volatility • Challenge to make longterm capital decisions with little revenue visibility • India expected to lead growth in import demand over next several years $0 $50 $100 $150 $200 $250 $300 $350 Spot HCC Pricing (dollars per tonne) China Increases Import Demand (+12MT) Cyclone Debbie Impacts (10 – 15 MT of supply)
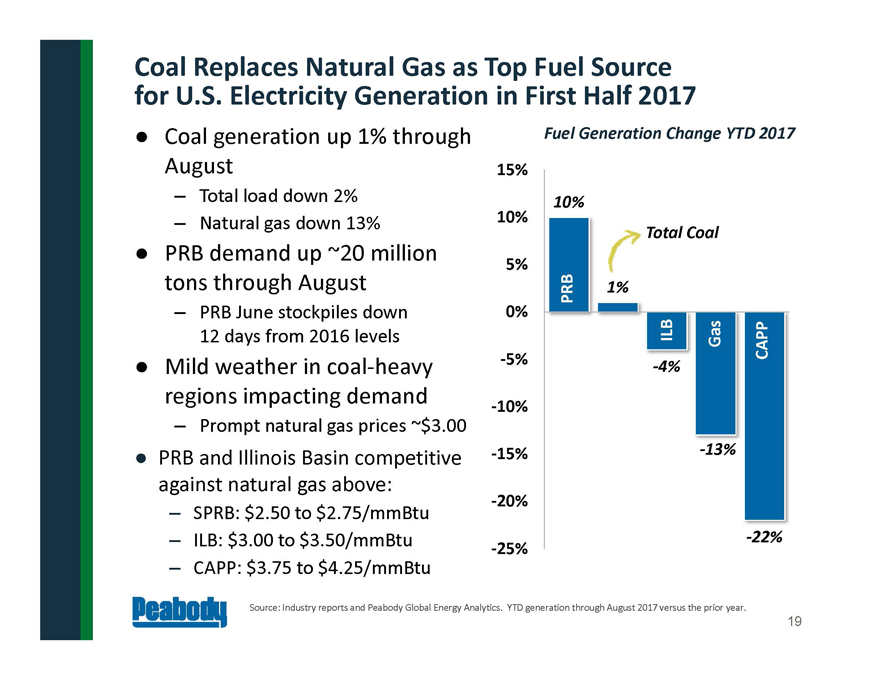
10% 1% -4% -13% -22% -25% -20% -15% -10% -5% 0% 5% 10% 15% • Coal generation up 1% through August – Total load down 2% – Natural gas down 13% • PRB demand up ~20 million tons through August – PRB June stockpiles down 12 days from 2016 levels • Mild weather in coal-heavy regions impacting demand – Prompt natural gas prices ~$3.00 • PRB and Illinois Basin competitive against natural gas above: – SPRB: $2.50 to $2.75/mmBtu – ILB: $3.00 to $3.50/mmBtu – CAPP: $3.75 to $4.25/mmBtu Coal Replaces Natural Gas as Top Fuel Source for U.S. Electricity Generation in First Half 2017 19 Fuel Generation Change YTD 2017 Source: Industry reports and Peabody Global Energy Analytics. YTD generation through August 2017 versus the prior year. PRB ILB CAPP Total Coal Gas
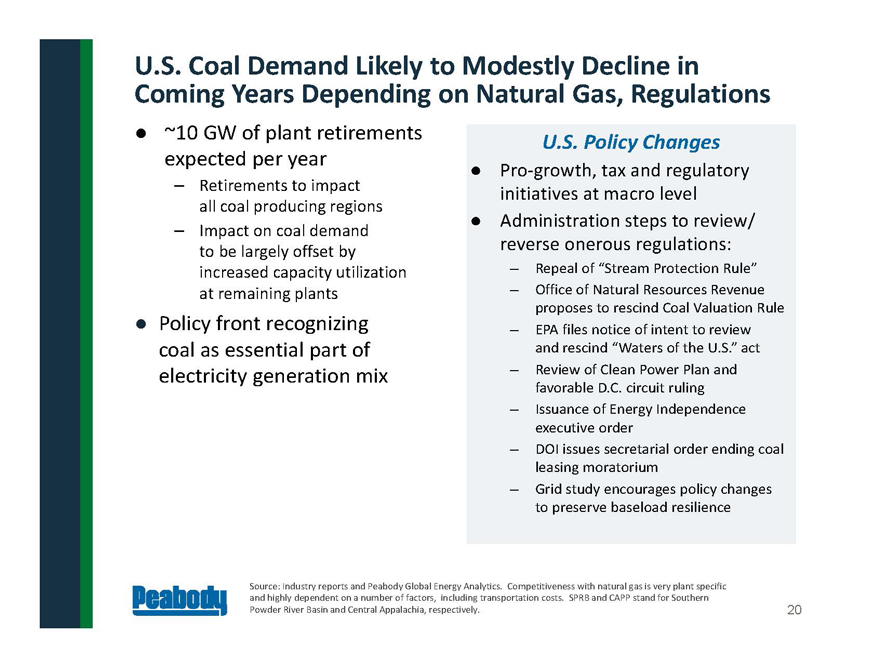
• ~10 GW of plant retirements expected per year – Retirements to impact all coal producing regions – Impact on coal demand to be largely offset by increased capacity utilization at remaining plants • Policy front recognizing coal as essential part of electricity generation mix U.S. Coal Demand Likely to Modestly Decline in Coming Years Depending on Natural Gas, Regulations 20 U.S. Policy Changes Source: Industry reports and Peabody Global Energy Analytics. Competitiveness with natural gas is very plant specific and highly dependent on a number of factors, including transportation costs. SPRB and CAPP stand for Southern Powder River Basin and Central Appalachia, respectively. • Pro-growth, tax and regulatory initiatives at macro level • Administration steps to review/ reverse onerous regulations: – Repeal of “Stream Protection Rule” – Office of Natural Resources Revenue proposes to rescind Coal Valuation Rule – EPA files notice of intent to review and rescind “Waters of the U.S.” act – Review of Clean Power Plan and favorable D.C. circuit ruling – Issuance of Energy Independence executive order – DOI issues secretarial order ending coal leasing moratorium – Grid study encourages policy changes to preserve baseload resilience

21 Financial Approach
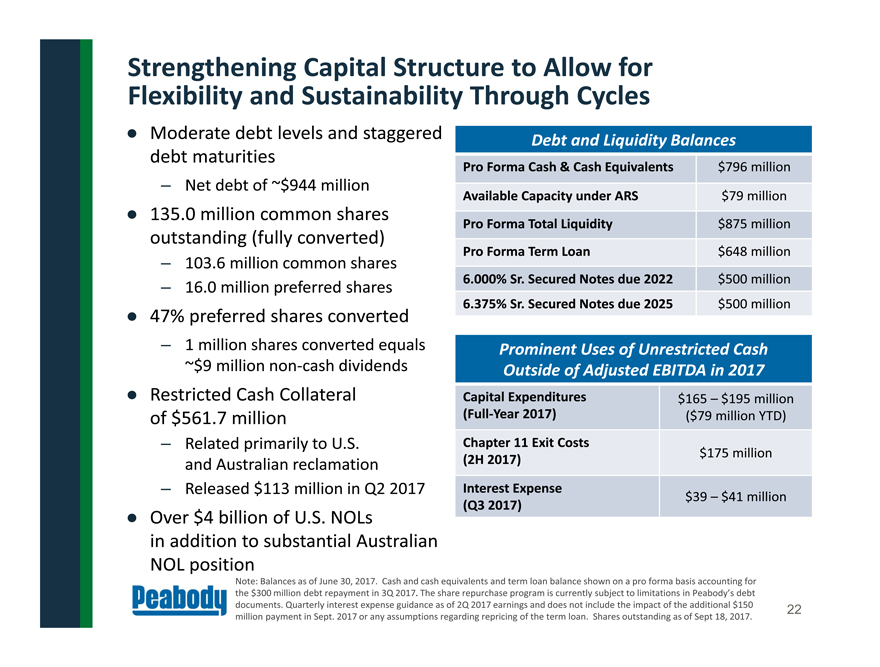
Strengthening Capital Structure to Allow for Flexibility and Sustainability Through Cycles 22 • Moderate debt levels and staggered debt maturities – Net debt of ~$944 million • 135.0 million common shares outstanding (fully converted) – 103.6 million common shares – 16.0 million preferred shares • 47% preferred shares converted – 1 million shares converted equals ~$9 million non-cash dividends • Restricted Cash Collateral of $561.7 million – Related primarily to U.S. and Australian reclamation – Released $113 million in Q2 2017 • Over $4 billion of U.S. NOLs in addition to substantial Australian NOL position Note: Balances as of June 30, 2017. Cash and cash equivalents and term loan balance shown on a pro forma basis accounting for the $300 million debt repayment in 3Q 2017. The share repurchase program is currently subject to limitations in Peabody’s debt documents. Quarterly interest expense guidance as of 2Q 2017 earnings and does not include the impact of the additional $150 million payment in Sept. 2017 or any assumptions regarding repricing of the term loan. Shares outstanding as of Sept 18, 2017. Debt and Liquidity Balances Pro Forma Cash & Cash Equivalents $796 million Available Capacity under ARS $79 million Pro Forma Total Liquidity $875 million Pro Forma Term Loan $648 million 6.000% Sr. Secured Notes due 2022 $500 million 6.375% Sr. Secured Notes due 2025 $500 million Prominent Uses of Unrestricted Cash Outside of Adjusted EBITDA in 2017 Capital Expenditures (Full-Year 2017) $165 – $195 million ($79 million YTD) Chapter 11 Exit Costs (2H 2017) $175 million Interest Expense (Q3 2017) $39 – $41 million

23 Financial Approach: Generate Cash, Reduce Debt, Invest Wisely, Return Cash to Shareholders Liquidity Debt Deleveraging Capital Returns • Targeting $800 million • Current liquidity primarily in cash and cash equivalents • Considering revolver over time to reduce required cash needs • Committed to sustainable capital structure across cycles • Major focus is deleveraging • Targeting $1.2 billion to $1.4 billion over time • $500 million share buyback program authorized; $40 million executed in August • Ongoing evaluation of sustainable dividend; Q1 2018 target • Modified credit agreement, increasing flexibility Note: The share repurchase program is subject to limitations in Peabody’s debt documents . Note $500 million debt reduction target includes $300 million voluntary repayment made in 3Q 2017. • Voluntarily repaying $300 million in 3Q 2017 • Targeting $500 million of total debt reduction over 18 months • Benefits include potential to release cash collateral
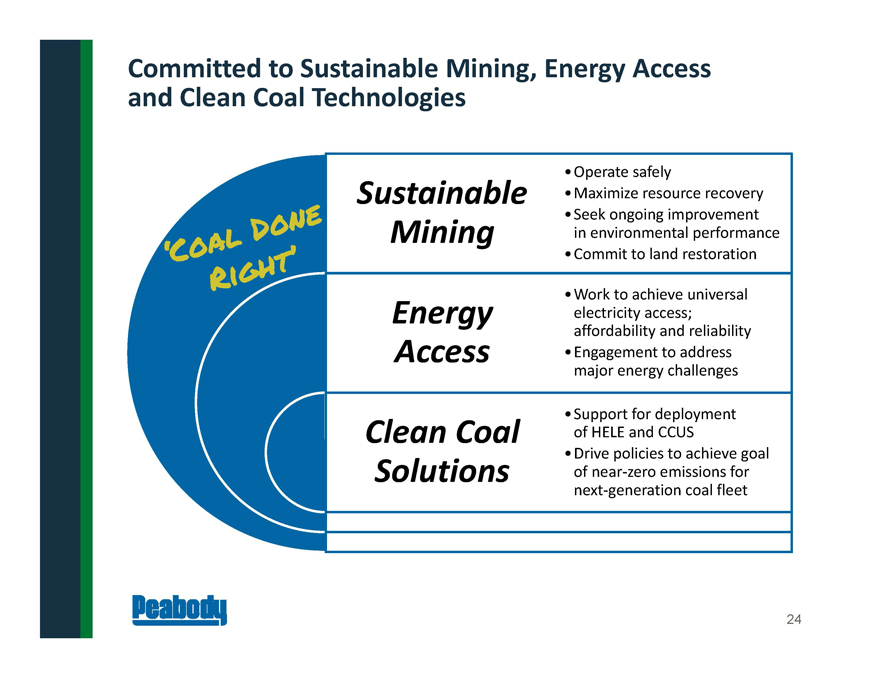
Committed to Sustainable Mining, Energy Access and Clean Coal Technologies 24 Sustainable Mining Energy Access Clean Coal Solutions •Operate safely •Maximize resource recovery •Seek ongoing improvement in environmental performance •Commit to land restoration •Work to achieve universal electricity access; affordability and reliability •Engagement to address major energy challenges •Support for deployment of HELE and CCUS •Drive policies to achieve goal of near-zero emissions for next-generation coal fleet
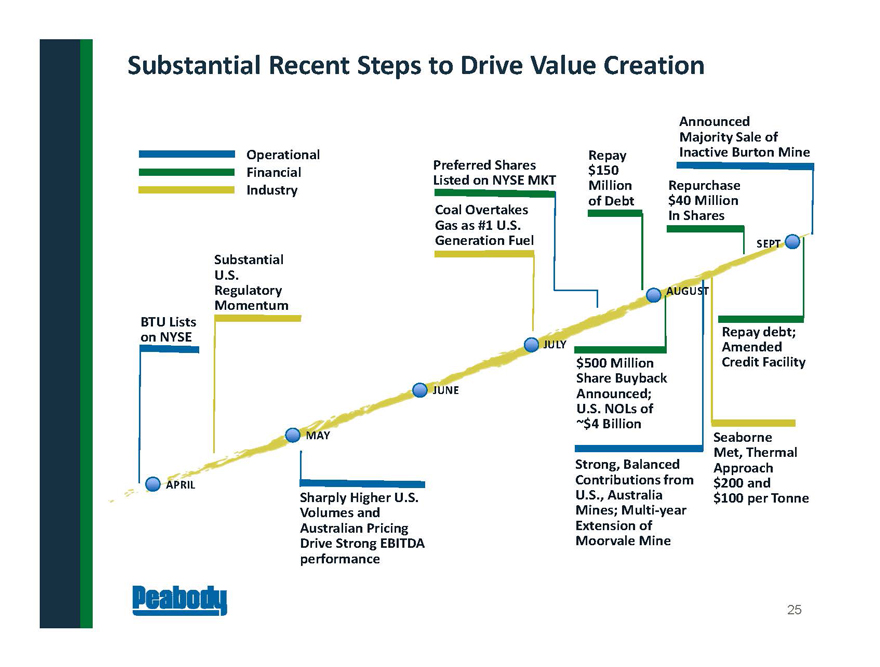
25 Substantial Recent Steps to Drive Value Creation BTU Lists on NYSE Operational Financial Industry $500 Million Share Buyback Announced; U.S. NOLs of ~$4 Billion APRIL AUGUST JULY JUNE MAY Repurchase $40 Million In Shares Repay debt; Amended Credit Facility Repay $150 Million of Debt Substantial U.S. Regulatory Momentum Strong, Balanced Contributions from U.S., Australia Mines; Multi-year Extension of Moorvale Mine Coal Overtakes Gas as #1 U.S. Generation Fuel Seaborne Met, Thermal Approach $200 and Sharply Higher U.S. $100 per Tonne Volumes and Australian Pricing Drive Strong EBITDA performance Preferred Shares Listed on NYSE MKT SEPT Announced Majority Sale of Inactive Burton Mine
26 APPENDIX
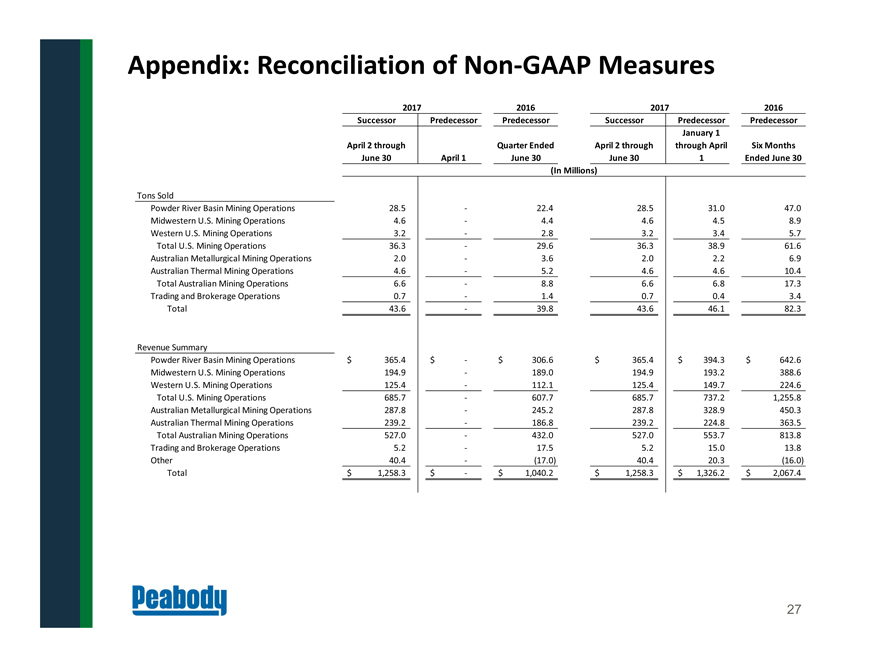
Appendix: Reconciliation of Non-GAAP Measures 27 2016 2016 Successor Predecessor Predecessor Successor Predecessor Predecessor April 2 through June 30 April 1 Quarter Ended June 30 April 2 through June 30 January 1 through April 1 Six Months Ended June 30 Powder River Basin Mining Operations 28.5 - 22.4 28.5 31.0 47.0 Midwestern U.S. Mining Operations 4.6 - 4.4 4.6 4.5 8.9 Western U.S. Mining Operations 3.2 - 2.8 3.2 3.4 5.7 Total U.S. Mining Operations 36.3 - 29.6 36.3 38.9 61.6 Australian Metallurgical Mining Operations 2.0 - 3.6 2.0 2.2 6.9 Australian Thermal Mining Operations 4.6 - 5.2 4.6 4.6 10.4 Total Australian Mining Operations 6.6 - 8.8 6.6 6.8 17.3 Trading and Brokerage Operations 0.7 - 1.4 0.7 0.4 3.4 Total 43.6 - 39.8 43.6 46.1 82.3 Powder River Basin Mining Operations $ 365.4 $ - $ 3 06.6 $ 365.4 $ 3 94.3 $ 6 42.6 Midwestern U.S. Mining Operations 1 94.9 - 189.0 194.9 193.2 388.6 Western U.S. Mining Operations 1 25.4 - 112.1 125.4 149.7 224.6 Total U.S. Mining Operations 6 85.7 - 607.7 685.7 737.2 1 ,255.8 Australian Metallurgical Mining Operations 2 87.8 - 245.2 287.8 328.9 450.3 Australian Thermal Mining Operations 2 39.2 - 186.8 239.2 224.8 363.5 Total Australian Mining Operations 5 27.0 - 432.0 527.0 553.7 813.8 Trading and Brokerage Operations 5.2 - 17.5 5.2 15.0 13.8 Other 40.4 - (17.0) 40.4 20.3 (16.0) Total $ 1,258.3 $ - $ 1,040.2 $ 1,258.3 $ 1,326.2 $ 2,067.4 2017 2017 (In Millions) Tons Sold Revenue Summary
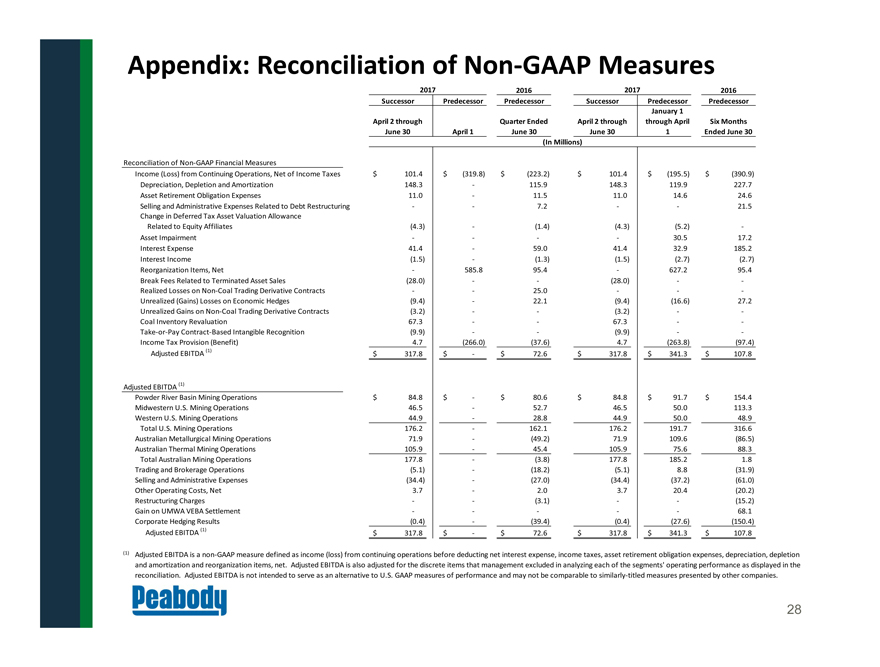
Appendix: Reconciliation of Non-GAAP Measures 28 2016 2016 Successor Predecessor Predecessor Successor Predecessor Predecessor April 2 through June 30 April 1 Quarter Ended June 30 April 2 through June 30 January 1 through April 1 Six Months Ended June 30 Income (Loss) from Continuing Operations, Net of Income Taxes $ 101.4 $ (319.8) $ (223.2) $ 101.4 $ (195.5) $ (390.9) Depreciation, Depletion and Amortization 1 48.3 - 115.9 1 48.3 119.9 227.7 Asset Retirement Obligation Expenses 11.0 - 11.5 11.0 14.6 24.6 Selling and Administrative Expenses Related to Debt Restructuring - - 7.2 - - 21.5 Change in Deferred Tax Asset Valuation Allowance Related to Equity Affiliates (4.3) - (1.4) (4.3) (5.2) - Asset Impairment - - - - 30.5 17.2 Interest Expense 41.4 - 59.0 41.4 32.9 185.2 Interest Income (1.5) - (1.3) (1.5) (2.7) (2.7) Reorganization Items, Net - 585.8 95.4 - 627.2 95.4 Break Fees Related to Terminated Asset Sales (28.0) - - ( 28.0) - - Realized Losses on Non-Coal Trading Derivative Contracts - - 25.0 - - - Unrealized (Gains) Losses on Economic Hedges (9.4) - 22.1 (9.4) (16.6) 27.2 Unrealized Gains on Non-Coal Trading Derivative Contracts (3.2) - - (3.2) - - Coal Inventory Revaluation 67.3 - - 67.3 - - Take-or-Pay Contract-Based Intangible Recognition (9.9) - - (9.9) - - Income Tax Provision (Benefit) 4.7 (266.0) (37.6) 4.7 ( 263.8) (97.4) Adjusted EBITDA (1) $ 317.8 $ - $ 72.6 $ 317.8 $ 3 41.3 $ 1 07.8 Powder River Basin Mining Operations $ 8 4.8 $ - $ 80.6 $ 8 4.8 $ 91.7 $ 1 54.4 Midwestern U.S. Mining Operations 46.5 - 52.7 46.5 50.0 113.3 Western U.S. Mining Operations 44.9 - 28.8 44.9 50.0 48.9 Total U.S. Mining Operations 1 76.2 - 162.1 1 76.2 191.7 316.6 Australian Metallurgical Mining Operations 71.9 - (49.2) 71.9 109.6 (86.5) Australian Thermal Mining Operations 1 05.9 - 45.4 1 05.9 75.6 88.3 Total Australian Mining Operations 1 77.8 - (3.8) 1 77.8 185.2 1.8 Trading and Brokerage Operations (5.1) - (18.2) (5.1) 8.8 (31.9) Selling and Administrative Expenses ( 34.4) - (27.0) (34.4) (37.2) (61.0) Other Operating Costs, Net 3.7 - 2.0 3.7 20.4 (20.2) Restructuring Charges - - (3.1) - - (15.2) Gain on UMWA VEBA Settlement - - - - - 68.1 Corporate Hedging Results (0.4) - (39.4) (0.4) (27.6) ( 150.4) Adjusted EBITDA (1) $ 317.8 $ - $ 72.6 $ 317.8 $ 3 41.3 $ 1 07.8 (1) 2017 2017 (In Millions) Adjusted EBITDA is a non-GAAP measure defined as income (loss) from continuing operations before deducting net interest expense, income taxes, asset retirement obligation expenses, depreciation, depletion and amortization and reorganization items, net. Adjusted EBITDA is also adjusted for the discrete items that management excluded in analyzing each of the segments’ operating performance as displayed in the reconciliation. Adjusted EBITDA is not intended to serve as an alternative to U.S. GAAP measures of performance and may not be comparable to similarly-titled measures presented by other companies. Adjusted EBITDA (1) Reconciliation of Non-GAAP Financial Measures
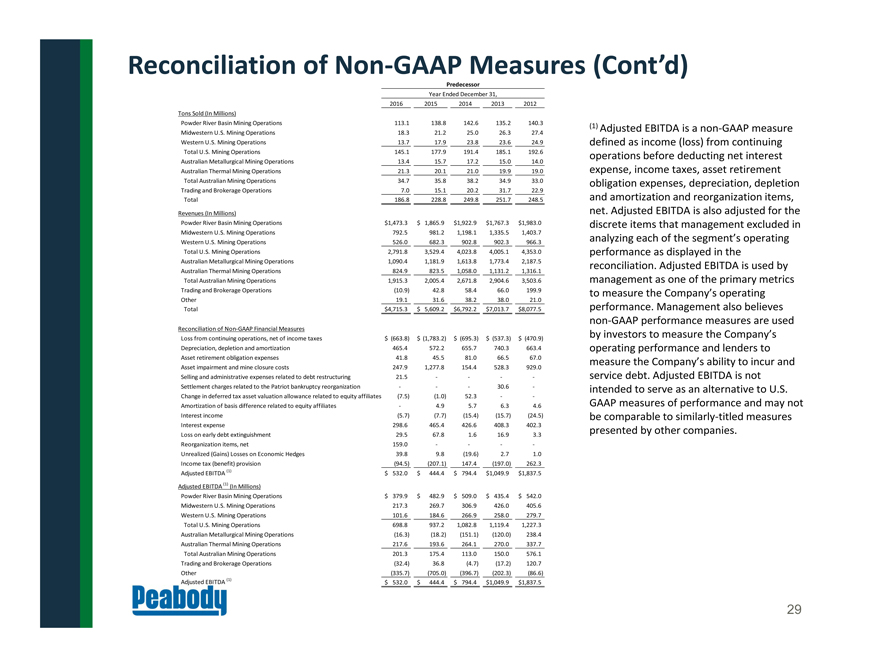
29 (1) Adjusted EBITDA is a non-GAAP measure defined as income (loss) from continuing operations before deducting net interest expense, income taxes, asset retirement obligation expenses, depreciation, depletion and amortization and reorganization items, net. Adjusted EBITDA is also adjusted for the discrete items that management excluded in analyzing each of the segment’s operating performance as displayed in the reconciliation. Adjusted EBITDA is used by management as one of the primary metrics to measure the Company’s operating performance. Management also believes non-GAAP performance measures are used by investors to measure the Company’s operating performance and lenders to measure the Company’s ability to incur and service debt. Adjusted EBITDA is not intended to serve as an alternative to U.S. GAAP measures of performance and may not be comparable to similarly-titled measures presented by other companies. Reconciliation of Non-GAAP Measures (Cont’d) 2016 2015 2014 2013 2012 Tons Sold (In Millions) Powder River Basin Mining Operations 113.1 138.8 142.6 135.2 140.3 Midwestern U.S. Mining Operations 18.3 21.2 25.0 26.3 27.4 Western U.S. Mining Operations 13.7 17.9 23.8 23.6 24.9 Total U.S. Mining Operations 145.1 177.9 191.4 185.1 192.6 Australian Metallurgical Mining Operations 13.4 15.7 17.2 15.0 14.0 Australian Thermal Mining Operations 21.3 20.1 21.0 19.9 19.0 Total Australian Mining Operations 34.7 35.8 38.2 34.9 33.0 Trading and Brokerage Operations 7.0 15.1 20.2 31.7 22.9 Total 186.8 228.8 249.8 251.7 248.5 Revenues (In Millions) Powder River Basin Mining Operations $1 ,473.3 $ 1 ,865.9 $ 1,922.9 $ 1,767.3 $ 1,983.0 Midwestern U.S. Mining Operations 792.5 981.2 1,198.1 1,335.5 1,403.7 Western U.S. Mining Operations 526.0 682.3 902.8 902.3 966.3 Total U.S. Mining Operations 2,791.8 3,529.4 4,023.8 4,005.1 4,353.0 Australian Metallurgical Mining Operations 1,090.4 1,181.9 1,613.8 1,773.4 2,187.5 Australian Thermal Mining Operations 824.9 823.5 1,058.0 1,131.2 1,316.1 Total Australian Mining Operations 1,915.3 2,005.4 2,671.8 2,904.6 3,503.6 Trading and Brokerage Operations (10.9) 42.8 58.4 66.0 199.9 Other 19.1 31.6 38.2 38.0 21.0 Total $4 ,715.3 $ 5 ,609.2 $ 6,792.2 $ 7,013.7 $ 8,077.5 Reconciliation of Non-GAAP Financial Measures Loss from continuing operations, net of income taxes $ ( 663.8) $ (1,783.2) $ ( 695.3) $ (537.3) $ (470.9) Depreciation, depletion and amortization 465.4 572.2 655.7 740.3 663.4 Asset retirement obligation expenses 41.8 45.5 81.0 66.5 67.0 Asset impairment and mine closure costs 247.9 1,277.8 154.4 528.3 929.0 Selling and administrative expenses related to debt restructuring 21.5 - - - - Settlement charges related to the Patriot bankruptcy reorganization - - - 30.6 - Change in deferred tax asset valuation allowance related to equity affiliates (7.5) (1.0) 52.3 - - Amortization of basis difference related to equity affiliates - 4.9 5 .7 6 .3 4.6 Interest income (5.7) (7.7) (15.4) (15.7) (24.5) Interest expense 298.6 465.4 426.6 408.3 402.3 Loss on early debt extinguishment 29.5 67.8 1 .6 16.9 3.3 Reorganization items, net 159.0 - - - - Unrealized (Gains) Losses on Economic Hedges 39.8 9.8 (19.6) 2 .7 1.0 Income tax (benefit) provision (94.5) (207.1) 147.4 (197.0) 262.3 Adjusted EBITDA (1) $ 532.0 $ 444.4 $ 794.4 $ 1,049.9 $ 1,837.5 Adjusted EBITDA (1) (In Millions) Powder River Basin Mining Operations $ 379.9 $ 482.9 $ 509.0 $ 435.4 $ 542.0 Midwestern U.S. Mining Operations 217.3 269.7 306.9 426.0 405.6 Western U.S. Mining Operations 101.6 184.6 266.9 258.0 279.7 Total U.S. Mining Operations 698.8 937.2 1,082.8 1,119.4 1,227.3 Australian Metallurgical Mining Operations (16.3) (18.2) (151.1) (120.0) 238.4 Australian Thermal Mining Operations 217.6 193.6 264.1 270.0 337.7 Total Australian Mining Operations 201.3 175.4 113.0 150.0 576.1 Trading and Brokerage Operations (32.4) 36.8 (4.7) (17.2) 120.7 Other (335.7) (705.0) (396.7) (202.3) (86.6) Adjusted EBITDA (1) $ 532.0 $ 444.4 $ 794.4 $ 1,049.9 $ 1,837.5 Predecessor Year Ended December 31,