ANNUAL REPORT PURSUANT TO SECTION 13 OR 15(d) OF THE SECURITIES EXCHANGE ACT OF 1934 For the fiscal year ended |
TRANSITION REPORT PURSUANT TO SECTION 13 OR 15(d) OF THE SECURITIES EXCHANGE ACT OF 1934 For the transition period from to |
(State or other jurisdiction of incorporation or organization) |
(I.R.S. Employer Identification No.) |
Title of each class |
Trading symbol(s) |
Name of each exchange on which registered | ||
, par value $0.01 per share |
|
☒ |
Accelerated filer |
☐ | |||
Non-accelerated filer |
☐ |
Smaller reporting company |
| |||
Emerging growth company |
|
Page | ||||||
ITEM 1. |
3 | |||||
ITEM 1A. |
11 | |||||
ITEM 1B. |
65 | |||||
ITEM 2. |
65 | |||||
ITEM 3. |
65 | |||||
ITEM 4. |
65 | |||||
ITEM 5. |
MARKET FOR REGISTRANT’S COMMON EQUITY, RELATED STOCKHOLDER MATTERS AND ISSUER PURCHASES OF EQUITY SECURITIES | 66 | ||||
ITEM 6. |
67 | |||||
ITEM 7. |
MANAGEMENT’S DISCUSSION AND ANALYSIS OF FINANCIAL CONDITION AND RESULTS OF OPERATIONS | 68 | ||||
ITEM 7A. |
98 | |||||
ITEM 8. |
102 | |||||
ITEM 9. |
CHANGES IN AND DISAGREEMENTS WITH ACCOUNTANTS ON ACCOUNTING AND FINANCIAL DISCLOSURE | 102 | ||||
ITEM 9A. |
102 | |||||
ITEM 9B. |
103 | |||||
ITEM 10. |
104 | |||||
ITEM 11. |
104 | |||||
ITEM 12. |
SECURITY OWNERSHIP OF CERTAIN BENEFICIAL OWNERS AND MANAGEMENT AND RELATED STOCKHOLDER MATTERS | 104 | ||||
ITEM 13. |
CERTAIN RELATIONSHIPS AND RELATED TRANSACTIONS, AND DIRECTOR INDEPENDENCE | 104 | ||||
ITEM 14. |
104 | |||||
ITEM 15. |
105 | |||||
ITEM 16. |
115 | |||||
116 | ||||||
F-1 |
• | Our lending and investment activities subject us to the general political, economic, capital markets, competitive and other conditions in the United States and foreign jurisdictions where we invest, including with respect to the effects of the COVID-19 pandemic and other events that markedly impact United States or foreign financial markets. |
• | Fluctuations in prevailing interest rates and credit spreads could reduce our ability to generate income on our loans and other investments, which could lead to a significant decrease in our results of operations, our cash flows and the market value of our investments, and ultimately limit our ability to pay distributions to our stockholders. |
• | Adverse changes in the real estate and real estate capital markets, in North America, Europe and Australia in particular, could negatively impact our performance by making it more difficult for borrowers of our mortgage loans to satisfy their debt payment obligations, which could result in losses on our loan investments and/or make it more difficult for us to generate consistent or attractive risk-adjusted returns. |
• | Our results of operations, financial condition and business could be materially adversely affected if we experience difficulty accessing financing or raising capital, including due to a significant dislocation in or shut-down of the capital markets, experience a reduction in the yield on our investments, experience an increase in the cost of our financing or experience defaults by borrowers in paying debt service on outstanding indebtedness. |
• | Events giving rise to increases in our current expected credit loss reserve, including the impact of the COVID-19 pandemic, have had an adverse effect on our business and results of operations and could in the future have a material adverse effect on our business, financial condition and results of operations. |
• | Adverse legislative or regulatory developments, including with respect to tax laws, securities laws, and the laws governing financial and lending institutions, could increase our cost of doing business and/or reduce our operating flexibility and the price of our class A common stock. |
• | Acts of God such as hurricanes, earthquakes and other natural disasters, pandemics or outbreaks of infectious disease, acts of war and/or terrorism and other events that can markedly impact financial markets may cause unanticipated and uninsured performance declines and/or losses to us or the owners and operators of the real estate securing our investments. |
• | Deterioration in the performance of properties securing our investments may cause deterioration in the performance of our investments, instances of default or foreclosure on such properties and, potentially, principal losses to us. |
• | Adverse developments in the availability of desirable investment opportunities whether they are due to competition, regulation or otherwise, could adversely affect our results of operations. |
• | Difficulty in redeploying the proceeds from repayments of our existing loans and investments may cause our financial performance and returns to investors to decline. |
• | Increased competition from entities engaged in mortgage lending and/or investing in our target assets may limit our ability to originate or acquire desirable loans and investments or dispose of assets we target, and could also affect the yields of these assets and have a material adverse effect on our business, financial condition and results of operations. |
• | Loans or investments involving international real estate-related assets are subject to special risks that we may not manage effectively, including currency exchange risk, the burdens of complying with international regulatory requirements, risks related to taxation and certain economic and political risks, which could have a material adverse effect on our results of operations and financial condition and our ability to make distributions to our stockholders. |
• | If we do not maintain our qualification as a REIT, we will be subject to tax as a regular corporation and could face a substantial tax liability. |
ITEM 1. |
BUSINESS |
Total Investment Exposure |
||||||||||||||||||
Balance Sheet Portfolio (1) |
Loan Exposure (1)(2) |
Other Investments (3) |
Total Investment Portfolio |
|||||||||||||||
Number of investments |
120 | 120 | 1 | 121 | ||||||||||||||
Principal balance |
$ | 16,652,824 | $ | 17,454,621 | $ | 735,542 | $ | 18,190,163 | ||||||||||
Net book value |
$ | 16,399,166 | $ | 16,399,166 | $ | 75,722 | $ | 16,474,888 | ||||||||||
Unfunded loan commitments (4) |
$ | 3,160,084 | $ | 3,962,960 | $ | — | $ | 3,962,960 | ||||||||||
Weighted-average cash coupon (5) |
L + 3.18 | % | L + 3.24 | % | L + 2.75 | % | L + 3.22 | % | ||||||||||
Weighted-average all-in yield(5) |
L + 3.53 | % | L + 3.58 | % | L + 3.10 | % | L + 3.56 | % | ||||||||||
Weighted-average maximum maturity (years) (6) |
3.1 | 3.1 | 4.4 | 3.2 | ||||||||||||||
Origination loan to value (LTV) (7) |
64.9 | % | 64.9 | % | 42.6 | % | 64.0 | % |
(1) | Excludes investment exposure to the $79.2 million subordinate position we own in the $735.5 million 2018 Single Asset Securitization. Refer to Notes 4 and 16 to our consolidated financial statements for further discussion of the 2018 Single Asset Securitization. |
(2) | In certain instances, we finance our loans through the non-recourse sale of a senior loan interest that is not included in our consolidated financial statements. Total loan exposure encompasses the entire loan we originated and financed, including $801.8 million of such non-consolidated senior interests that are not included in our balance sheet portfolio. |
(3) | Includes investment exposure to the $735.5 million 2018 Single Asset Securitization. We do not consolidate the 2018 Single Asset Securitization on our consolidated financial statements, and instead reflect our $79.2 million subordinate position as a component of other assets on our consolidated balance sheet. Refer to Notes 4 and 16 to our consolidated financial statements for further discussion of the 2018 Single Asset Securitization. |
(4) | Unfunded commitments will primarily be funded to finance our borrowers’ construction or development of real estate-related assets, capital improvements of existing assets, or lease-related expenditures. These commitments will generally be funded over the term of each loan, subject in certain cases to an expiration date. |
(5) | The weighted-average cash coupon and all-in yield are expressed as a spread over the relevant floating benchmark rates, which include USD LIBOR, GBP LIBOR, EURIBOR, BBSY, and CDOR, as applicable to each investment. As of December 31, 2020, 98% of our investments by total investment exposure earned a floating rate of interest, primarily indexed to USD LIBOR, and $14.2 billion of such investments earned interest based on floors that are above the applicable index. The other 2% of our investments earned a fixed rate of interest, which we reflect as a spread over the relevant floating benchmark rates, as of December 31, 2020, for purposes of the weighted-averages. In addition to cash coupon, all-in yield includes the amortization of deferred origination and extension fees, loan origination costs, and purchase discounts, as well as the accrual of exit fees. Excludes loans accounted for under the cost-recovery method. |
(6) | Maximum maturity assumes all extension options are exercised by the borrower, however our loans and other investments may be repaid prior to such date. As of December 31, 2020, 32% of our loans and other investments by total investment exposure were subject to yield maintenance or other prepayment restrictions and 68% were open to repayment by the borrower without penalty. |
(7) | Based on LTV as of the dates loans and other investments were originated or acquired by us. |
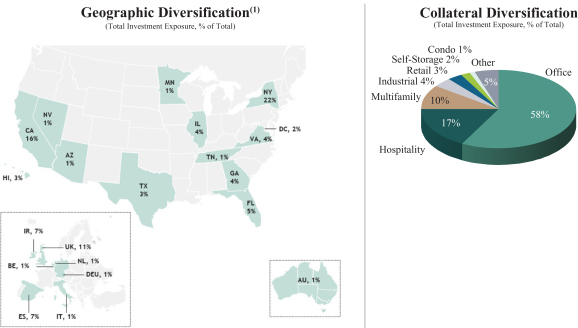
(1) | States comprising less than 1% of total loan portfolio are excluded. |
Portfolio Financing Outstanding Principal Balance |
||||
December 31, 2020 |
||||
Secured debt agreements |
$ | 7,896,863 | ||
Securitizations (1) |
3,596,980 | |||
Asset-specific financings (2) |
1,201,495 | |||
|
|
|||
Total portfolio financing |
$ | 12,695,338 | ||
|
|
(1) | Includes our consolidated securitized debt obligations of $2.9 billion and our non-consolidated securitized debt obligations of $656.3 million. The non-consolidated securitized debt obligation represents the senior non-consolidated investment exposure to the 2018 Single Asset Securitization. We own the related subordinate position, which is classified as a held-to-maturity |
(2) | Includes our consolidated asset-specific debt agreements of $399.7 million and our non-consolidated senior interests of $801.8 million. The non-consolidated senior interests provide structural leverage for our net investments which are reflected in the form of mezzanine loans or other subordinate interests on our balance sheet and in our results of operations. |
• | our Manager shall seek to invest our capital in a broad range of investments in, or relating to, public and/or private debt, non-controlling equity, loans and/or other interests (including “mezzanine” interests and/or options or derivatives related thereto) relating to real estate assets (including pools thereof), real estate companies, and/or real estate-related holdings; |
• | prior to the deployment of capital into investments, our Manager may cause our capital to be invested in any short-term investments in money market funds, bank accounts, overnight repurchase agreements with primary federal reserve bank dealers collateralized by direct U.S. government obligations and other instruments or investments reasonably determined by our Manager to be of high quality; |
• | not more than 25% of our equity, as defined in the Management Agreement with our Manager, will be invested in any individual investment without the approval of a majority of the investment risk management committee of our board of directors (it being understood, however, that for purposes of the foregoing concentration limit, in the case of any investment that is comprised (whether through a structured investment vehicle or other arrangement) of securities, instruments or assets of multiple portfolio issuers, such investment for purposes of the foregoing limitation shall be deemed to be multiple investments in such underlying securities, instruments and assets and not such particular vehicle, product or other arrangement in which they are aggregated); |
• | any investment in excess of $350.0 million shall require the approval of a majority of the investment risk management committee of our board of directors; |
• | no investment shall be made that would cause us to fail to qualify as a REIT under the Internal Revenue Code of 1986, as amended, or the Internal Revenue Code; and |
• | no investment shall be made that would cause us or any of our subsidiaries to be regulated as an investment company under the Investment Company Act. |
ITEM 1A. |
RISK FACTORS |
• | COVID-19 could continue to have a significant long-term impact on the broader economy and the commercial real estate market generally, which would continue to negatively impact the value of the assets collateralizing our loans. Our portfolio includes loans collateralized by hotel, retail, and other asset classes which are particularly negatively impacted by the pandemic. As of December 31, 2020, 17% of our total investment exposure was concentrated in hospitality assets. While we believe the principal amount of our loans are generally adequately protected by underlying property value, there can be no assurance that we will realize the entire principal amount of certain investments. In addition, interest rates and credit spreads have been significantly impacted since the outbreak of COVID-19. This has resulted in volatile changes to the interest we earn from our floating rate loans and also the interest obligations on our floating-rate debt, which could result in a decrease to our net interest income. |
• | Some of our borrowers have indicated that due to the impact of the COVID-19 pandemic, they will be unable to timely execute their business plans, have had to temporarily close their businesses, or have experienced other negative business consequences and have requested temporary interest deferral or forbearance, or other modifications of their loans. During the year ended December 31, 2020, we closed 49 loan modifications, representing an aggregate principal balance of $6.5 billion as of December 31, 2020. Additional loan modifications may continue in the near term and we may experience instances of default or foreclosure on assets underlying our loans, which will adversely affect the credit profile of our assets and our results of operations and financial condition. Loan modifications may include term extensions, interest rate changes, repurposing of reserves, temporary deferrals of interest, performance test or covenant waivers, and additional equity commitments from sponsors. |
• | The unprecedented impact of COVID-19 on commercial real estate created significant uncertainty regarding the application of the credit based margining provisions in our credit facilities. In order to |
address this uncertainty, we modified our seven largest credit facility agreements to temporarily suspend the credit margining provisions for certain collateral assets and to pre-approve certain collateral asset modifications in exchange for our deleveraging of the facilities. Although we again extended the agreements to suspend credit margining in the fourth quarter of 2020 without further de-leveraging, there can be no assurance that our credit facility lenders will continue to extend temporary suspensions of credit mark provisions or that collateral asset performance itself will not deteriorate. Consequently there can be no assurance that further deleveraging of our credit facilities will not adversely impact our liquidity and earnings. In addition, there can be no assurance that, even if credit concerns ease, we will be able to re-lever our portfolio at terms commensurate with those prior to the pandemic in order to recover potential earnings power. |
• | The ongoing COVID-19 pandemic has at times curtailed liquidity in the commercial real estate capital markets which in turn has reduced some sources of liquidity for our business primarily in terms of reduced portfolio loan repayments and more limited access to financing on favorable terms. However, many of our obligations, including unfunded loan commitments, were not similarly reduced. Although our liquidity position substantially increased during the second quarter of 2020, there can be no assurance that we will avoid the need to sell assets at inopportune times, engage in dilutive capital raising on unfavorable terms in order to generate the liquidity required to meet our obligations, or change our dividend practice, including by reducing the amount of, or temporarily suspending, our future dividends or paying our future dividends in kind for some period of time. Furthermore there can be no assurance that we will have access to financing and corporate capital on terms that enable accretive growth. |
• | COVID-19 has caused us to materially increase our current expected credit loss, or CECL, reserve. Our initial CECL reserve of $17.7 million recorded on January 1, 2020 was reflected as a direct charge to retained earnings on our consolidated statements of changes in equity; however subsequent changes to the CECL reserve were recognized through net income on our consolidated statements of operations. During the year ended December 31, 2020, we recorded a $167.7 million net increase in the CECL reserve, bringing our total CECL reserve to $185.4 million as of December 31, 2020. This CECL reserve reflects, among other things, the macroeconomic impact of the COVID-19 pandemic on commercial real estate markets generally, as well as certain loans assessed for impairment in our portfolio. Further, this reserve is not reflective of what we expect our CECL reserve would be absent the current and potential future impacts of the COVID-19 pandemic. If the adverse macroeconomic effects of the COVID-19 pandemic persist or worsen, we may further materially increase our CECL reserve, which may have a material adverse effect on our business, financial condition, results of operations and ability to make distributions. |
• | lack of liquidity in certain of our assets; |
• | the greater risk of loss to which we are exposed in connection with B-notes, mezzanine loans, and other investments that are subordinated or otherwise junior in an issuer’s capital structure and that involve privately negotiated structures; |
• | risks associated with loans to properties in transition or construction; |
• | risks associated with loans or investments involving assets in foreign jurisdictions, especially those experiencing difficulty; |
• | impairment of our investments and harm to our operations from a prolonged economic slowdown, a lengthy or severe recession or declining real estate values; |
• | foreign currency risks; |
• | the concentration of our loans and investments in terms of geography, asset types and sponsors; |
• | losses resulting from foreclosing on certain of the loans we originate or acquire; |
• | risks associated with our investments in CMBS, CLOs, and other similar structured finance investments, including those we structure, sponsor or arrange; |
• | downgrades in credit ratings assigned to our investments; |
• | investments in non-conforming and non-investment grade rated loans or securities; |
• | investments in interest rate- and foreign currency-related derivative instruments; |
• | the difficulty of estimating provisions for loan losses; |
• | our debt under our credit facilities and our corporate debt; |
• | risks associated with non-recourse securitizations which we use to finance our assets; |
• | losses arising from current and future guarantees of debt and contingent obligations of our subsidiaries or joint venture or co-investment partners; |
• | borrower and counterparty risks; |
• | risks associated with our hedging strategies; |
• | if the market value or income potential of our real estate-related investments declines, we may need to increase our real estate investments and income and/or liquidate our non-qualifying assets in order to maintain our REIT qualification or exclusion from regulation under the Investment Company Act of 1940, as amended; |
• | operational impacts on ourselves and our third-party advisors, service providers, vendors and counterparties, including operating partners, property managers, other independent third-party appraisal firms that provide appraisals of properties collateralizing our loans, our lenders and other providers of financing, brokers and other counterparties that we purchase and sell assets to and from, derivative counterparties, and legal and diligence professionals that we rely on for acquiring our investments; |
• | limitations on our ability to ensure business continuity in the event our, or our third-party advisors’ and service providers’, continuity of operations plan is not effective or improperly implemented or deployed during a disruption; |
• | the availability of key personnel of the Manager and our service providers as they face changed circumstances and potential illness during the pandemic; and |
• | other risks described herein. |
• | tenant mix and tenant bankruptcies; |
• | success of tenant businesses; |
• | property management decisions, including with respect to capital improvements, particularly in older building structures; |
• | property location and condition; |
• | competition from other properties offering the same or similar services; |
• | changes in laws that increase operating expenses or limit rents that may be charged; |
• | responses of businesses, governments and individuals to pandemics or outbreaks of contagious disease; |
• | any liabilities relating to environmental matters at the property; |
• | changes in global, national, regional, or local economic conditions and/or specific industry segments; |
• | global trade disruption, significant introductions of trade barriers and bilateral trade frictions; |
• | declines in global, national, regional or local real estate values; |
• | declines in global, national, regional or local rental or occupancy rates; |
• | changes in interest rates, foreign exchange rates, and in the state of the credit and securitization markets and the debt and equity capital markets, including diminished availability or lack of debt financing for commercial real estate; |
• | changes in real estate tax rates, tax credits and other operating expenses; |
• | changes in governmental rules, regulations and fiscal policies, including income tax regulations and environmental legislation; |
• | acts of God, terrorism, social unrest and civil disturbances, which may decrease the availability of or increase the cost of insurance or result in uninsured losses; and |
• | adverse changes in zoning laws. |
• | acquire investments subject to rights of senior classes, special servicers or collateral managers under intercreditor, servicing agreements or securitization documents; |
• | pledge our investments as collateral for financing arrangements; |
• | acquire only a minority and/or a non-controlling participation in an underlying investment; |
• | co-invest with others through partnerships, joint ventures or other entities, thereby acquiring non-controlling interests; or |
• | rely on independent third party management or servicing with respect to the management of an asset. |
• | currency exchange matters, including fluctuations in currency exchange rates and costs associated with conversion of investment principal and income from one currency into another, which may have an adverse impact on the valuation of our assets or income, including for purposes of our REIT requirements; |
• | less developed or efficient financial markets than in the United States, which may lead to potential price volatility and relative illiquidity; |
• | the burdens of complying with international regulatory requirements, including the requirements imposed by exchanges on which our international affiliates list debt securities issued in connection with the financing of our loans or investments involving international real-estate related assets, and prohibitions that differ between jurisdictions; |
• | changes in laws or clarifications to existing laws that could impact our tax treaty positions, which could adversely impact the returns on our investments; |
• | a less developed legal or regulatory environment, differences in the legal and regulatory environment or enhanced legal and regulatory compliance; |
• | political hostility to investments by foreign investors; |
• | higher rates of inflation; |
• | higher transaction costs; |
• | greater difficulty enforcing contractual obligations; |
• | fewer investor protections; |
• | certain economic and political risks, including potential exchange control regulations and restrictions on our non-U.S. investments and repatriation of profits from investments or of capital invested, the risks of political, economic or social instability, the possibility of expropriation or confiscatory taxation and adverse economic and political developments; and |
• | potentially adverse tax consequences. |
• | our cash flow from operations may be insufficient to make required payments of principal of and interest on our debt or we may fail to comply with covenants contained in our debt agreements, which is likely to result in (i) acceleration of such debt (and any other debt containing a cross-default or cross-acceleration provision), which we then may be unable to repay from internal funds or to refinance on favorable terms, or at all, (ii) our inability to borrow undrawn amounts under our financing arrangements, even if we are current in payments on borrowings under those arrangements, which would result in a decrease in our liquidity, and/or (iii) the loss of some or all of our collateral assets to foreclosure or sale; |
• | our debt may increase our vulnerability to adverse economic and industry conditions with no assurance that investment yields will increase in an amount sufficient to offset the higher financing costs; |
• | we may be required to dedicate a substantial portion of our cash flow from operations to payments on our debt, thereby reducing funds available for operations, future business opportunities, stockholder distributions or other purposes; and |
• | we may not be able to refinance any debt that matures prior to the maturity (or realization) of an underlying investment it was used to finance on favorable terms or at all. |
• | general economic or market conditions; |
• | the market’s view of the quality of our assets; |
• | the market’s perception of our growth potential; |
• | our current and potential future earnings and cash distributions; and |
• | the market price of the shares of our class A common stock. |
• | interest rate, currency and/or credit hedging can be expensive and may result in us generating less net income; |
• | available interest rate or currency hedges may not correspond directly with the interest rate or currency risk for which protection is sought; |
• | due to a credit loss, prepayment or asset sale, the duration of the hedge may not match the duration of the related asset or liability; |
• | the amount of income that a REIT may earn from hedging transactions (other than hedging transactions that satisfy certain requirements of the Internal Revenue Code or that are done through a TRS (as defined below)) to offset interest rate losses is limited by U.S. federal income tax provisions governing REITs; |
• | the credit quality of the hedging counterparty owing money on the hedge may be downgraded to such an extent that it impairs our ability to sell or assign our side of the hedging transaction; |
• | the hedging counterparty owing money in the hedging transaction may default on its obligation to pay; |
• | we may fail to recalculate, readjust and execute hedges in an efficient manner; and |
• | legal, tax and regulatory changes could occur and may adversely affect our ability to pursue our hedging strategies and/or increase the costs of implementing such strategies. |
• | Broad and Wide-Ranging Activities |
• | Blackstone’s Policies and Procedures non-public information with respect to companies that are clients of Blackstone or its affiliates, in which our Manager may be considering making an investment. As a consequence, that information, |
which could be of benefit to our Manager, might become restricted to those other businesses and otherwise be unavailable to our Manager, and could also restrict our Manager’s activities. Additionally, the terms of confidentiality or other agreements with or related to companies in which any investment vehicle of Blackstone has or has considered making an investment or which is otherwise a client of Blackstone and its affiliates may restrict or otherwise limit the ability of Blackstone or its affiliates, including our Manager, to engage in businesses or activities competitive with such companies. |
• | Allocation of Investment Opportunities . co-investment vehicles, other entities formed in connection with Blackstone or its affiliates side-by-side |
• | Investments in Different Levels or Classes of an Issuer’s Securities non-controlling interest in any such investment and a forbearance of rights, including certain non-economic rights, relating to the Blackstone Vehicles, such as where Blackstone may cause us to decline to exercise certain control- and/or foreclosure-related rights with respect to a portfolio entity (including following the vote of other third party lenders generally or otherwise recusing ourselves with respect to decisions), including with respect to both normal course ongoing matters (such as consent rights with respect to loan modifications in intercreditor agreements) and also defaults, foreclosures, workouts, restructurings and/or exit opportunities, subject to certain limitations. If we recuse ourselves from decision-making as described above, we will generally rely upon a third party lender to make the decisions, and the third party lender could have conflicts or otherwise make decisions that we would not have made. It is expected that our participation in connection with any such investments and transactions will be negotiated by third parties on market terms and prices. Our Management Agreement requires our Manager to keep our board of directors reasonably informed on a periodic basis in connection with the foregoing, including with respect to transactions that involve investments at different levels of an issuer’s or borrower’s capital structure, as to which our Manager has agreed to provide our board of directors with quarterly updates. We currently hold mortgage and mezzanine loans and other investments in which Blackstone affiliates have interests in the collateral securing or backing such investments. While Blackstone will seek to resolve any conflicts in a fair and equitable manner with respect to conflicts resolution among the Blackstone Vehicles generally, such transactions are not required to be presented to our board of directors for approval, and there can be no assurance that any conflicts will be resolved in our favor. |
• | Assignment and Sharing or Limitation of Rights |
other reasons which may be unrelated to us, share with or assign to such other Blackstone Vehicles certain of our rights, in whole or in part, or to limit our rights, including certain control- and/or foreclosure-related rights with respect to such shared investments and/or otherwise agree to implement certain procedures to mitigate conflicts of interest which typically involve maintaining a non-controlling interest in any such investment and a forbearance of our rights, including certain non-economic rights (including following the vote of other third party lenders generally or otherwise being recused with respect to certain decisions, including with respect to both normal course ongoing matters (such as consent rights with respect to loan modifications in intercreditor agreements) and also defaults, foreclosures, workouts, restructurings and/or exit opportunities), subject to certain limitations. While it is expected that our participation in connection with any such investments and transactions would be negotiated by third parties on market prices, such investments and transactions will give rise to potential or actual conflicts of interest. We cannot make assurances that any such conflict will be resolved in our favor. To the extent we hold an interest in a loan or security that is different (including with respect to their relative seniority) than those held by such other Blackstone Vehicles (and vice versa), our Manager and its affiliates may be presented and/or may have limited or no rights with respect to decisions when the interests of the funds/vehicles are in conflict. Such sharing or assignment of rights could make it more difficult for us to protect our interests and could give rise to a conflict (which may be exacerbated in the case of financial distress) and could result in another Blackstone Vehicle exercising such rights in a way adverse to us. |
• | Providing Debt Financings in connection with Assets Owned by Other Blackstone Vehicles |
• | Obtaining Financing from Other Blackstone Vehicles |
• | Pursuit of Differing Strategies |
vehicles which may affect the market price of the security or the execution of the transaction, or both, to the detriment or benefit of one or more other accounts, clients, entities, funds and/or investment vehicles. For example, an investment professional may determine that it would be in the interest of another account to sell a security that we hold long, potentially resulting in a decrease in the market value of the security held by us. |
• | Variation in Financial and Other Benefits |
• | Underwriting, Advisory and Other Relationships “lock-up” period following the offering under applicable regulations during which time our ability to sell any securities that we continue to hold is restricted. This may prejudice our ability to dispose of such securities at an opportune time. |
• | Service Providers co-investors or commercial counterparties. Such relationships may influence our Manager in deciding whether to select such service provider. In certain circumstances, service providers, or their affiliates, may charge different rates (including below-market rates or at no cost) or have different arrangements for services provided to Blackstone or its affiliates as compared to services provided to us, which in certain circumstances may result in more favorable rates or arrangements than those payable by us. In addition, in instances where multiple Blackstone businesses may be exploring a potential individual investment, certain of these service providers may choose to be engaged by other Blackstone affiliates rather than us. |
• | Material, Non-Public Informationnon-public information with respect to an issuer in which we have invested or may invest. Should this occur, our Manager may be restricted from buying or selling securities, derivatives or loans of the issuer on our behalf until such time as the information becomes public or is no longer deemed material. Disclosure of such information to the personnel responsible for management of our business may be on a need-to-know non-public information in the possession of Blackstone which might be relevant to an investment decision to be made by our Manager on our behalf, and our Manager may initiate a transaction or purchase or sell an investment which, if such information had been known to it, may not have been undertaken. Due to these restrictions, our Manager may not be able to initiate a transaction on our behalf that it otherwise might have initiated and may not be able to purchase or sell an investment that it otherwise might have purchased or sold, which could negatively affect our operations. |
• | Possible Future Activities |
• | Transactions with Blackstone Vehicles . |
• | Loan Refinancings . |
• | Other Affiliate Transactions |
• | Family Relationships |
companies that are owned by such family members or relatives or in respect of which such family members or relatives have other involvement. In most such circumstances, we will not be precluded from undertaking any of these investment activities or transactions. To the extent Blackstone determines appropriate, it may put in place conflict mitigation strategies with respect to a particular circumstance, such as internal information barriers or recusal, disclosure or other steps determined appropriate by the Manager. |
• | we would be taxed as a regular domestic corporation, which under current laws, among other things, means being unable to deduct distributions to stockholders in computing taxable income and being subject to federal income tax on our taxable income at regular corporate income tax rates; |
• | any resulting tax liability could be substantial and could have a material adverse effect on our book value; |
• | unless we were entitled to relief under applicable statutory provisions, we would be required to pay taxes, and therefore, our cash available for distribution to stockholders would be reduced for each of the years during which we did not qualify as a REIT and for which we had taxable income; and |
• | we generally would not be eligible to requalify as a REIT for the subsequent four full taxable years. |
• | our actual or projected operating results, financial condition, cash flows and liquidity, or changes in business strategy or prospects, including as a result of the COVID-19 pandemic; |
• | actual or perceived conflicts of interest with our Manager or other affiliates of Blackstone and individuals, including our executives; |
• | equity issuances by us, or share resales by our stockholders, or the perception that such issuances or resales may occur; |
• | loss of a major funding source; |
• | actual or anticipated accounting problems; |
• | publication of research reports about us or the real estate industry; |
• | changes in market valuations of similar companies; |
• | adverse market reaction to the level of leverage we employ; |
• | additions to or departures of our Manager’s or Blackstone’s key personnel; |
• | speculation in the press or investment community; |
• | our failure to meet, or the lowering of, our earnings estimates or those of any securities analysts; |
• | increases in market interest rates, which may lead investors to demand a higher distribution yield for our class A common stock, and would result in increased interest expenses on our debt; |
• | a compression of the yield on our investments and an increase in the cost of our liabilities; |
• | failure to maintain our REIT qualification or exclusion from Investment Company Act regulation; |
• | price and volume fluctuations in the overall stock market from time to time; |
• | general market and economic conditions, and trends including inflationary concerns, and the current state of the credit and capital markets; |
• | significant volatility in the market price and trading volume of securities of publicly traded REITs or other companies in our sector, including us, which is not necessarily related to the operating performance of these companies; |
• | changes in law, regulatory policies or tax guidelines, or interpretations thereof, particularly with respect to REITs; |
• | changes in the value of our portfolio; |
• | any shortfall in revenue or net income or any increase in losses from levels expected by investors or securities analysts; |
• | operating performance of companies comparable to us; |
• | short-selling pressure with respect to shares of our class A common stock or REITs generally; and |
• | uncertainty surrounding the strength of the U.S. economy particularly in light of budget deficit concerns and other U.S. and international political and economic affairs. |
• | our ability to make profitable investments; |
• | margin calls or other expenses that reduce our cash flow; |
• | defaults in our asset portfolio or decreases in the value of our portfolio; |
• | the impact of changes in interest rates on our net interest income; and |
• | the fact that anticipated operating expense levels may not prove accurate, as actual results may vary from estimates. |
ITEM 1B. |
UNRESOLVED STAFF COMMENTS |
ITEM 2. |
PROPERTIES |
ITEM 3. |
LEGAL PROCEEDINGS |
ITEM 4. |
MINE SAFETY DISCLOSURES |
ITEM 5. |
MARKET FOR REGISTRANT’S COMMON EQUITY, RELATED STOCKHOLDER MATTERS AND ISSUER PURCHASES OF EQUITY SECURITIES |
ITEM 6. |
SELECTED FINANCIAL DATA |
Years ended December 31, |
||||||||||||||||||||
(in thousands, except per share data) | 2020 |
2019 |
2018 |
2017 |
2016 |
|||||||||||||||
Operating Data: |
||||||||||||||||||||
Interest and related income |
$ | 779,648 | $ | 882,679 | $ | 756,109 | $ | 537,915 | $ | 497,974 | ||||||||||
Interest and related expense |
347,471 | 458,503 | 359,625 | 234,870 | 184,270 | |||||||||||||||
|
|
|
|
|
|
|
|
|
|
|||||||||||
Income from loans and other investments, net |
$ | 432,177 | $ | 424,176 | $ | 396,484 | $ | 303,045 | $ | 313,704 | ||||||||||
Net income |
$ | 140,414 | $ | 307,393 | $ | 285,813 | $ | 217,968 | $ | 246,440 | ||||||||||
Net income attributable to Blackstone Mortgage Trust, Inc. |
$ | 137,670 | $ | 305,567 | $ | 285,078 | $ | 217,631 | $ | 238,297 | ||||||||||
Per Share Data: |
||||||||||||||||||||
Net income from continuing operations per share of common stock |
||||||||||||||||||||
Basic and diluted |
$ | 0.97 | $ | 2.35 | $ | 2.50 | $ | 2.27 | $ | 2.53 | ||||||||||
Net income per share of common stock |
||||||||||||||||||||
Basic and diluted |
$ | 0.97 | $ | 2.35 | $ | 2.50 | $ | 2.27 | $ | 2.53 | ||||||||||
Dividends declared per share of common stock |
$ | 2.48 | $ | 2.48 | $ | 2.48 | $ | 2.48 | $ | 2.48 | ||||||||||
As of December 31, |
||||||||||||||||||||
2020 |
2019 |
2018 |
2017 |
2016 |
||||||||||||||||
Balance Sheet Data: |
||||||||||||||||||||
Total assets |
$ | 16,958,955 | $ | 16,551,871 | $ | 14,467,375 | $ | 10,258,825 | $ | 8,812,615 | ||||||||||
Secured debt agreements, net |
7,880,536 | 9,731,426 | 8,893,818 | 5,178,250 | 5,609,031 | |||||||||||||||
Asset-specific debt agreements, net |
391,269 | 323,504 | 80,938 | 95,605 | 107,323 | |||||||||||||||
Secured term loan, net |
1,041,704 | 736,142 | — | — | — | |||||||||||||||
Convertible notes, net |
616,389 | 613,071 | 609,911 | 563,911 | 166,762 | |||||||||||||||
Total liabilities |
13,054,724 | 12,767,190 | 11,092,768 | 7,341,419 | 6,319,012 | |||||||||||||||
Total equity |
3,904,231 | 3,784,681 | 3,374,607 | 2,917,406 | 2,493,603 |
ITEM 7. |
MANAGEMENT’S DISCUSSION AND ANALYSIS OF FINANCIAL CONDITION AND RESULTS OF OPERATIONS |
• | Net income of $137.7 million, or $0.97 per share, and Distributable Earnings of $352.0 million, or $2.48 per share, with dividends declared of $356.2 million, or $2.48 per share. Net income includes a $167.7 million increase to the current expected credit loss, or CECL, reserve that is excluded from Distributable Earnings, as further described below. |
• | Book value per share of $26.42 as of December 31, 2020, which is net of a $1.26 cumulative CECL reserve. |
• | Increased liquidity by $387.7 million during the year to $1.1 billion as of December 31, 2020. |
• | Loan originations of $1.6 billion. During the year we had loan fundings of $2.1 billion and loan repayments of $2.0 billion, resulting in net portfolio growth of $139.5 million. |
• | Portfolio of 121 investments as of December 31, 2020, with a weighted-average origination loan-to-value all-in yield of L+3.56%. |
• | Collected 99.7% of the contractual interest payments that were due under our loans during the year, with virtually no interest deferrals during the year. |
• | Issued an aggregate 10.0 million shares of our class A common stock through an underwritten public offering, generating aggregate net proceeds of $278.3 million and entered into a $325.0 million senior secured term loan facility. |
• | Refinanced $2.1 billion of our secured credit facilities with the proceeds from two non-recourse, non-mark-to-market debt-to-equity |
• | Closed $1.2 billion of new financings under our secured credit facilities and maintained stable facility pricing and advance rates with our 12 credit providers through the volatile lending environment in 2020. |
Three Months Ended December 31, 2020 |
Year Ended December 31, |
|||||||||||
2020 |
2019 |
|||||||||||
Net income (1) |
$ | 83,616 | $ | 137,670 | $ | 305,567 | ||||||
Weighted-average shares outstanding, basic and diluted |
146,675,431 | 141,795,977 | 130,085,398 | |||||||||
|
|
|
|
|
|
|||||||
Net income per share, basic and diluted |
$ | 0.57 | $ | 0.97 | $ | 2.35 | ||||||
|
|
|
|
|
|
|||||||
Dividends declared per share |
$ | 0.62 | $ | 2.48 | $ | 2.48 | ||||||
|
|
|
|
|
|
(1) | Represents net income attributable to Blackstone Mortgage Trust. |
Three Months Ended December 31, 2020 |
Year Ended December 31, |
|||||||||||
2020 |
2019 |
|||||||||||
Net income (1) |
$ | 83,616 | $ | 137,670 | $ | 305,567 | ||||||
(Decrease) increase in current expected credit loss reserve |
(5,813 | ) | 167,653 | — | ||||||||
Non-cash compensation expense |
8,554 | 34,532 | 30,656 | |||||||||
Realized hedging and foreign currency income, net (2) |
582 | 10,852 | 14,172 | |||||||||
Other items |
921 | 1,487 | 300 | |||||||||
Adjustments attributable to non-controlling interests, net |
74 | (204 | ) | — | ||||||||
|
|
|
|
|
|
|||||||
Distributable Earnings |
$ | 87,934 | $ | 351,990 | $ | 350,695 | ||||||
|
|
|
|
|
|
|||||||
Weighted-average shares outstanding, basic and diluted |
146,675,431 | 141,795,977 | 130,085,398 | |||||||||
|
|
|
|
|
|
|||||||
Distributable Earnings per share, basic and diluted |
$ | 0.60 | $ | 2.48 | $ | 2.70 | ||||||
|
|
|
|
|
|
(1) | Represents net income attributable to Blackstone Mortgage Trust. |
(2) | For the three months ended December 31, 2020, represents realized gains (losses) on the repatriation of unhedged foreign currency. For the years ended December 31, 2020 and 2019, primarily represents the forward points earned on our foreign currency forward contracts, which reflect the interest rate differentials between the applicable base rate for our foreign currency investments and USD LIBOR. These forward contracts effectively convert the rate exposure to USD LIBOR, resulting in additional interest income earned in U.S. dollar terms. These amounts were not included in GAAP net income, but rather as a component of Other Comprehensive Income in our consolidated financial statements. |
December 31, 2020 |
December 31, 2019 |
|||||||
Stockholders’ equity |
$ | 3,886,067 | $ | 3,762,583 | ||||
Shares |
||||||||
Class A common stock |
146,780,031 | 135,003,662 | ||||||
Deferred stock units |
306,691 | 260,066 | ||||||
|
|
|
|
|||||
Total outstanding |
147,086,722 | 135,263,728 | ||||||
|
|
|
|
|||||
Book value per share |
$ | 26.42 | $ | 27.82 | ||||
|
|
|
|
Three Months Ended December 31, 2020 |
Year Ended December 31, 2020 |
|||||||
Loan originations (1) |
$ | 228,900 | $ | 1,573,980 | ||||
Loan fundings (2) |
$ | 478,464 | $ | 2,138,114 | ||||
Loan repayments and sales (3) |
(561,740 | ) | (1,998,637 | ) | ||||
|
|
|
|
|||||
Total net (repayments) fundings |
$ | (83,276 | ) | $ | 139,477 | |||
|
|
|
|
(1) | Includes new loan originations and additional commitments made under existing loans. |
(2) | Loan fundings during the three months and year ended December 31, 2020 include $71.3 million and $241.8 million, respectively, of additional fundings under related non-consolidated senior interests. |
(3) | Loan repayments and sales during the three months and year ended December 31, 2020 include $647,000 and $135.7 million, respectively, of additional repayments or reduction of loan exposure under related non-consolidated senior interests. |
Total Investment Exposure |
||||||||||||||||||||
Balance Sheet Portfolio (1) |
Loan Exposure (1)(2) |
Other Investments (3) |
Total Investment Portfolio |
|||||||||||||||||
Number of investments |
120 | 120 | 1 | 121 | ||||||||||||||||
Principal balance |
$ | 16,652,824 | $ | 17,454,621 | $ | 735,542 | $ | 18,190,163 | ||||||||||||
Net book value |
$ | 16,399,166 | $ | 16,399,166 | $ | 75,722 | $ | 16,474,888 | ||||||||||||
Unfunded loan commitments (4) |
$ | 3,160,084 | $ | 3,962,960 | $ | — | $ | 3,962,960 | ||||||||||||
Weighted-average cash coupon (5) |
L + 3.18 | % | L + 3.24 | % | L + 2.75 | % | L + 3.22 | % | ||||||||||||
Weighted-average all-in yield(5) |
L + 3.53 | % | L + 3.58 | % | L + 3.10 | % | L + 3.56 | % | ||||||||||||
Weighted-average maximum maturity (years) (6) |
3.1 | 3.1 | 4.4 | 3.2 | ||||||||||||||||
Origination loan to value (LTV) (7) |
64.9 | % | 64.9 | % | 42.6 | % | 64.0 | % |
(1) | Excludes investment exposure to the $79.2 million subordinate position we own in the $735.5 million 2018 Single Asset Securitization. Refer to Notes 4 and 16 to our consolidated financial statements for further discussion of the 2018 Single Asset Securitization. |
(2) | In certain instances, we finance our loans through the non-recourse sale of a senior loan interest that is not included in our consolidated financial statements. Total loan exposure encompasses the entire loan we originated and financed, including $801.8 million of such non-consolidated senior interests that are not included in our balance sheet portfolio. |
(3) | Includes investment exposure to the $735.5 million 2018 Single Asset Securitization. We do not consolidate the 2018 Single Asset Securitization on our consolidated financial statements, and instead reflect our $79.2 million subordinate position as a component of other assets on our consolidated balance sheet. Refer to Notes 4 and 16 to our consolidated financial statements for further discussion of the 2018 Single Asset Securitization. |
(4) | Unfunded commitments will primarily be funded to finance our borrowers’ construction or development of real estate-related assets, capital improvements of existing assets, or lease-related expenditures. These commitments will generally be funded over the term of each loan, subject in certain cases to an expiration date. |
(5) | The weighted-average cash coupon and all-in yield are expressed as a spread over the relevant floating benchmark rates, which include USD LIBOR, GBP LIBOR, EURIBOR, BBSY, and CDOR, as applicable to each investment. As of December 31, 2020, 98% of our investments by total investment exposure earned a floating rate of interest, primarily indexed to USD LIBOR, and $14.2 billion of such investments earned interest based on floors that are above the applicable index. The other 2% of our investments earned a fixed rate of interest, which we reflect as a spread over the relevant floating benchmark rates, as of December 31, 2020, for purposes of the weighted-averages. In addition to cash coupon, all-in yield includes the amortization of deferred origination and extension fees, loan origination costs, and purchase discounts, as well as the accrual of exit fees. Excludes loans accounted for under the cost-recovery method. |
(6) | Maximum maturity assumes all extension options are exercised by the borrower, however our loans and other investments may be repaid prior to such date. As of December 31, 2020, 32% of our loans and other investments by total investment exposure were subject to yield maintenance or other prepayment restrictions and 68% were open to repayment by the borrower without penalty. |
(7) | Based on LTV as of the dates loans and other investments were originated or acquired by us. |
Investment Count |
Currency |
Total Investment Portfolio |
Floating Rate Index (1) |
Cash Coupon (2) |
All-in Yield(2) | |||||||||
95 | $ | $ 12,516,341 | USD LIBOR | L + 3.17% | L + 3.51% | |||||||||
8 | € | € 2,644,653 | EURIBOR | E + 2.91% | E + 3.23% | |||||||||
13 | £ | £ 1,536,989 | GBP LIBOR | L + 3.87% | L + 4.25% | |||||||||
2 | A$ | A$ 337,650 | BBSY | BBSY + 4.01% | BBSY + 4.31% | |||||||||
3 | C$ | C$ 104,679 | CDOR | CDOR + 3.97% | CDOR + 4.31% | |||||||||
|
|
|
|
|
| |||||||||
121 | $ 18,190,163 | INDEX + 3.22% | INDEX + 3.56% | |||||||||||
|
|
|
|
|
|
(1) | We use foreign currency forward contracts to protect the value or fix the amount of certain investments or cash flows in terms of the U.S. dollar. We earn forward points on our forward contracts that reflect the interest rate differentials between the applicable base rate for our foreign currency investments and USD LIBOR. These forward contracts effectively convert the foreign currency rate exposure for such investments to USD LIBOR. |
(2) | The cash coupon and all-in yield of our fixed rate loans are reflected as a spread over USD LIBOR for purposes of the weighted-averages. In addition to cash coupon, all-in yield includes the amortization of deferred origination and extension fees, loan origination costs, and purchase discounts, as well as the accrual of exit fees. Excludes loans accounted for under the cost-recovery method. |
December 31, 2020 |
||||||||||||
Risk Rating |
Number of Loans |
Net Book Value |
Total Loan Exposure (1)(2) |
|||||||||
1 |
8 | $ | 777,163 | $ | 778,283 | |||||||
2 |
17 | 2,513,848 | 2,528,835 | |||||||||
3 |
79 | 9,911,914 | 10,763,496 | |||||||||
4 |
14 | 3,032,593 | 3,045,309 | |||||||||
5 |
2 | 337,197 | 338,698 | |||||||||
|
|
|
|
|
|
|||||||
Loans receivable |
120 | $ | 16,572,715 | $ | 17,454,621 | |||||||
|
|
|
|
|
|
|||||||
CECL reserve |
(173,549 | ) | ||||||||||
|
|
|||||||||||
Loans receivable, net |
$ | 16,399,166 | ||||||||||
|
|
(1) | In certain instances, we finance our loans through the non-recourse sale of a senior loan interest that is not included in our consolidated financial statements. See Note 2 to our consolidated financial statements for further discussion. Total loan exposure encompasses the entire loan we originated and financed, including $801.8 million of such non-consolidated senior interests as of December 31, 2020. |
(2) | Excludes investment exposure to the $735.5 million 2018 Single Asset Securitization. Refer to Notes 4 and 16 to our consolidated financial statements for details of the subordinate position we own in the 2018 Single Asset Securitization. |
Portfolio Financing Outstanding Principal Balance |
||||||||
December 31, 2020 |
December 31, 2019 |
|||||||
Secured debt agreements |
$ | 7,896,863 | $ | 9,753,059 | ||||
Securitizations (1) |
3,596,980 | 2,030,704 | ||||||
Asset-specific financings (2) |
1,201,495 | 1,019,400 | ||||||
|
|
|
|
|||||
Total portfolio financing |
$ | 12,695,338 | $ | 12,803,163 | ||||
|
|
|
|
(1) | Includes our consolidated securitized debt obligations of $2.9 billion and our non-consolidated securitized debt obligations of $656.3 million. The non-consolidated securitized debt obligation represents the senior non-consolidated investment exposure to the 2018 Single Asset Securitization. We own the related subordinate position, which is classified as a held-to-maturity |
(2) | Includes our consolidated asset-specific debt agreements of $399.7 million and our non-consolidated senior interests of $801.8 million. The non-consolidated senior interests provide structural leverage for our net investments which are reflected in the form of mezzanine loans or other subordinate interests on our balance sheet and in our results of operations. |
Secured Debt Agreements Borrowings Outstanding |
||||||||
December 31, 2020 |
December 31, 2019 |
|||||||
Secured credit facilities |
$ | 7,896,863 | $ | 9,753,059 | ||||
Revolving credit agreement |
— | — | ||||||
|
|
|
|
|||||
Total secured debt agreements |
$ | 7,896,863 | $ | 9,753,059 | ||||
|
|
|
|
December 31, 2020 |
||||||||||||||||
Credit Facility Borrowings |
Collateral Assets (2) |
|||||||||||||||
Lender |
Potential (1) |
Outstanding |
Available (1) |
|||||||||||||
Deutsche Bank |
$ | 1,892,211 | $ | 1,847,211 | $ | 45,000 | $ | 2,869,889 | ||||||||
Barclays |
1,443,251 | 1,249,415 | 193,836 | 1,862,987 | ||||||||||||
Wells Fargo |
1,241,357 | 956,780 | 284,577 | 1,663,661 | ||||||||||||
Citibank |
927,531 | 779,139 | 148,392 | 1,212,521 | ||||||||||||
Goldman Sachs |
615,411 | 615,411 | — | 828,965 | ||||||||||||
Bank of America |
473,678 | 473,678 | — | 667,830 | ||||||||||||
JP Morgan |
449,449 | 422,096 | 27,353 | 605,144 | ||||||||||||
Morgan Stanley |
528,846 | 401,846 | 127,000 | 849,426 | ||||||||||||
MetLife |
276,605 | 276,605 | — | 349,612 | ||||||||||||
Santander |
269,501 | 269,501 | — | 337,329 | ||||||||||||
Société Générale |
237,822 | 237,822 | — | 308,700 | ||||||||||||
US Bank – Multi. JV (3) |
184,802 | 181,795 | 3,007 | 231,003 | ||||||||||||
Goldman Sachs – Multi. JV (3) |
167,964 | 167,964 | — | 231,840 | ||||||||||||
Bank of America – Multi. JV (3) |
17,600 | 17,600 | — | 22,000 | ||||||||||||
|
|
|
|
|
|
|
|
|||||||||
$ | 8,726,028 | $ | 7,896,863 | $ | 829,165 | $ | 12,040,907 | |||||||||
|
|
|
|
|
|
|
|
(1) | Potential borrowings represents the total amount we could draw under each facility based on collateral already approved and pledged. When undrawn, these amounts are immediately available to us at our sole discretion under the terms of each credit facility. |
(2) | Represents the principal balance of the collateral assets. |
(3) | These facilities finance the loan investments of our consolidated Multifamily Joint Venture. Refer to Note 2 to our consolidated financial statements for additional discussion of our Multifamily Joint Venture. |
Securitizations Outstanding |
||||||||
December 31, 2020 |
December 31, 2019 |
|||||||
Securitized debt obligations |
$ | 2,940,638 | 1,189,642 | |||||
Non-consolidated securitized debt obligation(1) |
656,342 | 841,062 | ||||||
|
|
|
|
|||||
Total securitizations |
$ | 3,596,980 | $ | 2,030,704 | ||||
|
|
|
|
(1) | These non-consolidated securitized debt obligations represent the senior non-consolidated investment exposure to the 2018 Single Asset Securitization. We own the related subordinate position, which is classified as a held-to-maturity |
December 31, 2020 |
||||||||||||||||||||
Securitized Debt Obligations |
Count |
Principal Balance |
Book Value |
Wtd. Avg. Yield/Cost (1) |
Term (2) |
|||||||||||||||
2020 FL3 Collateralized Loan Obligation |
||||||||||||||||||||
Collateral assets |
25 | $ | 1,000,000 | $ | 1,000,000 | L+3.09 | % | February 2024 | ||||||||||||
Financing provided |
1 | 808,750 | 800,993 | L+2.08 | % | November 2037 | ||||||||||||||
2020 FL2 Collateralized Loan Obligation |
||||||||||||||||||||
Collateral assets |
31 | 1,500,000 | 1,500,000 | L+3.17 | % | January 2024 | ||||||||||||||
Financing provided |
1 | 1,243,125 | 1,233,464 | L+1.44 | % | February 2038 | ||||||||||||||
2017 FL1 Collateralized Loan Obligation |
||||||||||||||||||||
Collateral assets |
15 | 666,334 | 666,334 | L+3.39 | % | January 2023 | ||||||||||||||
Financing provided |
1 | 483,834 | 483,113 | L+1.83 | % | June 2035 | ||||||||||||||
2017 Single Asset Securitization |
||||||||||||||||||||
Collateral assets (3) |
1 | 619,194 | 618,766 | L+3.57 | % | June 2023 | ||||||||||||||
Financing provided |
1 | 404,929 | 404,929 | L+1.63 | % | June 2033 | ||||||||||||||
Total |
||||||||||||||||||||
Collateral assets |
72 | $ | 3,785,528 | $ | 3,785,100 | L+3.25 | % | |||||||||||||
|
|
|
|
|
|
|
|
|||||||||||||
Financing provided (4) |
4 | $ | 2,940,638 | $ | 2,922,499 | L+1.70 | % | |||||||||||||
|
|
|
|
|
|
|
|
(1) | In addition to cash coupon, all-in yield includes the amortization of deferred origination and extension fees, loan origination costs, purchase discounts, and accrual of exit fees. All-in yield for the total portfolio assumes applicable floating benchmark rates for weighted-average calculation. |
(2) | Loan term represents weighted-average final maturity, assuming all extension options are exercised by the borrower. Repayments of securitized debt obligations are tied to timing of the related collateral loan asset repayments. The term of these obligations represents the rated final distribution date of the securitizations. |
(3) | The collateral assets for the 2017 Single Asset Securitization include the total loan amount, of which we securitized $500.0 million. |
(4) | During the year ended December 31, 2020, we recorded $43.1 million of interest expense related to our securitized debt obligations. |
December 31, 2020 |
||||||||||||||||||||
Non-Consolidated Securitized Debt Obligation |
Count |
Principal Balance |
Book Value |
Wtd. Avg. Yield/Cost (1) |
Wtd. Avg. Term (2) |
|||||||||||||||
Collateral assets |
1 | $ | 735,542 | n/a | L+3.10 | % | June 2025 | |||||||||||||
Financing provided |
1 | $ | 656,342 | n/a | L+2.27 | % | June 2035 |
(1) | In addition to cash coupon, all-in yield includes the amortization of deferred origination and extension fees, loan origination costs, and purchase discounts. |
(2) | Loan term represents weighted-average final maturity, assuming all extension options are exercised by the borrower. Repayments of non-consolidated securitized debt obligations are tied to timing of the related collateral loan asset repayments. The term of these obligations represents the rated final distribution date of the securitizations. |
Asset-Specific Financings Outstanding Principal Balance |
||||||||
December 31, 2020 |
December 31, 2019 |
|||||||
Asset-specific debt agreements |
$ | 399,699 | $ | 330,879 | ||||
Non-consolidated senior interests(1) |
801,796 | 688,521 | ||||||
|
|
|
|
|||||
Total asset-specific financings |
$ | 1,201,495 | $ | 1,019,400 | ||||
|
|
|
|
(1) | These non-consolidated senior interests provide structural leverage for our net investments which are reflected in the form of mezzanine loans or other subordinate interests on our balance sheet and in our results of operations. |
December 31, 2020 |
||||||||||||||||||||||||
Asset-Specific Debt Agreements |
Count |
Principal Balance |
Book Value |
Wtd. Avg. Yield/Cost (1) |
Guarantee (2) |
Wtd. Avg. Term (3) |
||||||||||||||||||
Collateral assets |
4 | $ | 512,794 | $ | 499,085 | L+4.65 | % | n/a | Oct. 2023 | |||||||||||||||
Financing provided |
4 | $ | 399,699 | $ | 391,269 | L+3.48 | % | $ | 33,244 | Oct. 2023 |
(1) | These floating rate loans and related liabilities are indexed to the various benchmark rates relevant in each arrangement in terms of currency and payment frequency. Therefore the net exposure to each benchmark rate is in direct proportion to our net assets indexed to that rate. In addition to cash coupon, yield/cost includes the amortization of deferred origination fees / financing costs. |
(2) | Other than amounts guaranteed on an asset-by-asset non-recourse to us. |
(3) | The weighted-average term is determined based on the maximum maturity of the corresponding loans, assuming all extension options are exercised by the borrower. Each of our asset-specific financings is term-matched to the corresponding collateral loans. |
December 31, 2020 |
||||||||||||||||||||||||
Non-Consolidated Senior Interests |
Count |
Principal Balance |
Book Value |
Wtd. Avg. Yield/Cost (1) |
Guarantee |
Wtd. Avg. Term |
||||||||||||||||||
Total loan |
5 | $ | 1,002,818 | n/a | 5.72 | % | n/a | Jun. 2024 | ||||||||||||||||
Senior participation |
5 | 801,796 | n/a | 4.40 | % | n/a | Jun. 2024 |
(1) | Our floating rate loans and related liabilities were indexed to the various benchmark rates relevant in each arrangement in terms of currency and payment frequency. Therefore the net exposure to each benchmark rate is in direct proportion to our net assets indexed to that rate. In addition to cash coupon, all-in yield/cost includes the amortization of deferred fees / financing costs. |
Corporate Financing Outstanding Principal Balance |
||||||||
December 31, 2020 |
December 31, 2019 |
|||||||
Secured term loans |
$ | 1,062,766 | $ | 746,878 | ||||
Convertible notes |
622,500 | 622,500 | ||||||
|
|
|
|
|||||
Total corporate financing |
$ | 1,685,266 | $ | 1,369,378 | ||||
|
|
|
|
Term Loans |
Face Value |
Interest Rate (1) |
All-in Cost (1)(2) |
Maturity | ||||||||||
2019 Term Loan |
$ | 739,391 | L+2.25 | % | L+2.52 | % | April 23, 2026 | |||||||
2020 Term Loan |
323,375 | L+4.75 | % | L+5.60 | % | April 23, 2026 |
(1) | The 2020 Term Loan borrowing is subject to a LIBOR floor of 1.00%. |
(2) | Includes issue discount and transaction expenses that are amortized through interest expense over the life of the Secured Term Loans. |
Convertible Notes Issuance |
Face Value |
Interest Rate |
All-in Cost (1) |
Maturity |
||||||||||||
May 2017 |
$ | 402,500 | 4.38 | % | 4.85 | % | May 5, 2022 | |||||||||
March 2018 |
$ | 220,000 | 4.75 | % | 5.33 | % | March 15, 2023 |
(1) | Includes issuance costs that are amortized through interest expense over the life of the Convertible Notes using the effective interest method. |
USD |
EUR |
GBP |
AUD |
CAD |
||||||||||||||||
Floating rate loans (1)(2)(3) |
$ | 12,516,341 | € | 2,799,894 | £ | 1,155,034 | A$ | 337,650 | C$ | 58,088 | ||||||||||
Floating rate debt (1)(4) |
(9,160,051 | ) | (2,044,904 | ) | (822,401 | ) | (244,891 | ) | (79,862 | ) | ||||||||||
|
|
|
|
|
|
|
|
|
|
|||||||||||
Net floating rate exposure (5) |
$ | 3,356,290 | € | 754,990 | £ | 332,633 | A$ | 92,759 | C$ | (21,774) | ||||||||||
|
|
|
|
|
|
|
|
|
|
(1) | Our floating rate investments and related liabilities are indexed to the various benchmark rates relevant in each case in terms of currency and payment frequency. Therefore the net exposure to each benchmark rate is in direct proportion to our net assets indexed to that rate. |
(2) | Includes investment exposure to the 2018 Single Asset Securitization. Refer to Notes 4 and 16 to our consolidated financial statements for details of the subordinate position we own in the 2018 Single Asset Securitization. |
(3) | Euro balance includes a loan denominated in British Pound Sterling, with an outstanding principal balance of £146.2 million as of December 31, 2020, that is hedged to Euro exposure through a foreign currency forward contract. Refer to Note 10 to our consolidated financial statements for additional discussion of our foreign currency derivatives. |
(4) | Includes borrowings under secured debt agreements, securitizations, asset-specific financings, and secured term loans. |
(5) | In addition, we have two interest rate caps of C$38.3 million ($30.1 million as of December 31, 2020) to limit our exposure to increases in interest rates. |
Year Ended December 31, |
2020 vs 2019 |
Year Ended December 31, |
2019 vs 2018 |
|||||||||||||||||||||
2020 |
2019 |
$ |
2019 |
2018 |
$ |
|||||||||||||||||||
Income from loans and other investments |
||||||||||||||||||||||||
Interest and related income |
$ | 779,648 | $ | 882,679 | $ | (103,031 | ) | $ | 882,679 | $ | 756,109 | $ | 126,570 | |||||||||||
Less: Interest and related expenses |
347,471 | 458,503 | (111,032 | ) | 458,503 | 359,625 | 98,878 | |||||||||||||||||
|
|
|
|
|
|
|
|
|
|
|
|
|||||||||||||
Income from loans and other investments, net |
432,177 | 424,176 | 8,001 | 424,176 | 396,484 | 27,692 | ||||||||||||||||||
Other expenses |
||||||||||||||||||||||||
Management and incentive fees |
77,916 | 78,435 | (519 | ) | 78,435 | 74,834 | 3,601 | |||||||||||||||||
General and administrative expenses |
45,871 | 38,854 | 7,017 | 38,854 | 35,529 | 3,325 | ||||||||||||||||||
|
|
|
|
|
|
|
|
|
|
|
|
|||||||||||||
Total other expenses |
123,787 | 117,289 | 6,498 | 117,289 | 110,363 | 6,926 | ||||||||||||||||||
Increase in current expected credit loss reserve |
(167,653 | ) | — | (167,653 | ) | — | — | — | ||||||||||||||||
|
|
|
|
|
|
|
|
|
|
|
|
|||||||||||||
Income before income taxes |
140,737 | 306,887 | (166,150 | ) | 306,887 | 286,121 | 20,766 | |||||||||||||||||
Income tax provision (benefit) |
323 | (506 | ) | 829 | (506 | ) | 308 | (814 | ) | |||||||||||||||
|
|
|
|
|
|
|
|
|
|
|
|
|||||||||||||
Net income |
140,414 | 307,393 | (166,979 | ) | 307,393 | 285,813 | 21,580 | |||||||||||||||||
|
|
|
|
|
|
|
|
|
|
|
|
|||||||||||||
Net income attributable to non-controlling interests |
(2,744 | ) | (1,826 | ) | (918 | ) | (1,826 | ) | (735 | ) | (1,091 | ) | ||||||||||||
|
|
|
|
|
|
|
|
|
|
|
|
|||||||||||||
Net income attributable to Blackstone Mortgage Trust, Inc. |
$ | 137,670 | $ | 305,567 | $ | (167,897 | ) | $ | 305,567 | $ | 285,078 | $ | 20,489 | |||||||||||
|
|
|
|
|
|
|
|
|
|
|
|
|||||||||||||
Net income per share – basic and diluted |
$ | 0.97 | $ | 2.35 | $ | (1.38 | ) | $ | 2.35 | $ | 2.50 | $ | (0.15 | ) | ||||||||||
Dividends declared per share |
$ | 2.48 | $ | 2.48 | $ | — | $ | 2.48 | $ | 2.48 | $ | — |
Three Months Ended December 31, |
2020 vs 2019 |
|||||||||||
2020 |
2019 |
$ |
||||||||||
Income from loans and other investments |
||||||||||||
Interest and related income |
$ | 188,851 | $ | 220,678 | $ | (31,827 | ) | |||||
Less: Interest and related expenses |
79,401 | 110,967 | (31,566 | ) | ||||||||
|
|
|
|
|
|
|||||||
Income from loans and other investments, net |
109,450 | 109,711 | (261 | ) | ||||||||
Other expenses |
||||||||||||
Management and incentive fees |
19,158 | 20,159 | (1,001 | ) | ||||||||
General and administrative expenses |
11,551 | 9,904 | 1,647 | |||||||||
|
|
|
|
|
|
|||||||
Total other expenses |
30,709 | 30,063 | 646 | |||||||||
Decrease in current expected credit loss reserve |
5,813 | — | 5,813 | |||||||||
|
|
|
|
|
|
|||||||
Income before income taxes |
84,554 | 79,648 | 4,906 | |||||||||
Income tax provision |
131 | 67 | 64 | |||||||||
|
|
|
|
|
|
|||||||
Net income |
84,423 | 79,581 | 4,842 | |||||||||
|
|
|
|
|
|
|||||||
Net income attributable to non-controlling interests |
(807 | ) | (650 | ) | (157 | ) | ||||||
|
|
|
|
|
|
|||||||
Net income attributable to Blackstone Mortgage Trust, Inc. |
$ | 83,616 | $ | 78,931 | $ | 4,685 | ||||||
|
|
|
|
|
|
|||||||
Net income per share – basic and diluted |
$ | 0.57 | $ | 0.59 | $ | (0.02 | ) | |||||
Dividends declared per share |
$ | 0.62 | $ | 0.62 | $ | — |
December 31, 2020 |
December 31, 2019 | |||
Debt-to-equity (1) |
2.5x | 3.0x | ||
Total leverage ratio (2) |
3.6x | 3.7x |
(1) | Represents (i) total outstanding secured debt agreements, asset-specific debt agreements, secured term loans, and convertible notes, less cash, to (ii) total equity, in each case at period end. |
(2) | Represents (i) total outstanding secured debt agreements, securitizations, asset-specific financings, secured term loans, and convertible notes, less cash, to (ii) total equity, in each case at period end. |
December 31, 2020 |
December 31, 2019 |
|||||||
Cash and cash equivalents |
$ | 289,970 | $ | 150,090 | ||||
Available borrowings under secured debt agreements |
829,165 | 598,840 | ||||||
Loan principal payments held by servicer, net (1) |
19,460 | 1,965 | ||||||
|
|
|
|
|||||
$ | 1,138,595 | $ | 750,895 | |||||
|
|
|
|
(1) | Represents loan principal payments held by our third-party servicer as of the balance sheet date which were remitted to us during the subsequent remittance cycle, net of the related secured debt balance. |
Payment Timing |
||||||||||||||||||||
Total Obligation |
Less Than 1 Year |
1 to 3 Years |
3 to 5 Years |
More Than 5 Years |
||||||||||||||||
Unfunded loan commitments (1) |
$ | 3,160,084 | $ | 53,324 | $ | 726,146 | $ | 2,357,863 | $ | 22,751 | ||||||||||
Principal repayments under secured debt agreements (2) |
7,896,863 | 262,895 | 3,230,648 | 4,193,543 | 209,777 | |||||||||||||||
Principal repayments under asset-specific debt agreements (2) |
399,699 | — | 311,068 | 88,631 | — | |||||||||||||||
Principal repayments of secured term loans (3) |
1,062,766 | 10,738 | 21,475 | 21,475 | 1,009,078 | |||||||||||||||
Principal repayments of convertible notes (4) |
622,500 | — | 622,500 | — | — | |||||||||||||||
Interest payments (2)(5) |
705,445 | 234,578 | 317,330 | 141,305 | 12,232 | |||||||||||||||
|
|
|
|
|
|
|
|
|
|
|||||||||||
Total (6) |
$ | 13,847,357 | $ | 561,535 | $ | 5,229,167 | $ | 6,802,817 | $ | 1,253,838 | ||||||||||
|
|
|
|
|
|
|
|
|
|
(1) | The allocation of our unfunded loan commitments is based on the earlier of the commitment expiration date or the final loan maturity date, however, we may be obligated to fund these commitments earlier than such date. |
(2) | The allocation of repayments under our secured debt agreements and asset-specific debt agreements for both principal and interest payments is based on the earlier of (i) the maturity date of each agreement, or (ii) the maximum maturity date of the collateral loans, assuming all extension options are exercised by the borrower. |
(3) | The Secured Term Loans are partially amortizing, with an amount equal to 1.0% per annum of the principal balance due in quarterly installments. Refer to Note 8 to our consolidated financial statements for further details on our secured term loans. |
(4) | Reflects the outstanding principal balance of convertible notes, excluding any potential conversion premium. Refer to Note 9 to our consolidated financial statements for further details on our convertible notes. |
(5) | Represents interest payments on our secured debt agreements, convertible notes, and Secured Term Loans. Future interest payment obligations are estimated assuming the interest rates in effect as of December 31, 2020 will remain constant into the future. This is only an estimate as actual amounts borrowed and interest rates will vary over time. |
(6) | Total does not include $2.9 billion of consolidated securitized debt obligations, $656.3 million of non-consolidated securitized debt obligations, and $801.8 million of non-consolidated senior interests, as the satisfaction of these liabilities will not require cash outlays from us. |
For the years ended December 31, |
||||||||||||
2020 |
2019 |
2018 |
||||||||||
Cash flows provided by operating activities |
$ | 336,607 | $ | 304,037 | $ | 290,002 | ||||||
Cash flows used in investing activities |
(88,251 | ) | (1,871,148 | ) | (4,251,659 | ) | ||||||
Cash flows (used in) provided by financing activities |
(110,769 | ) | 1,612,552 | 3,957,708 | ||||||||
|
|
|
|
|
|
|||||||
Net increase (decrease) in cash and cash equivalents |
$ | 137,587 | $ | 45,441 | $ | (3,949 | ) | |||||
|
|
|
|
|
|
• | U.S. Loans |
• | Non-U.S. Loans |
• | Unique Loans |
• | Impaired Loans non-recoverability may also be concluded if, in our determination, it is nearly certain that all amounts due will not be collected. |
Impact of ASU 2016-13 Adoption |
||||
Assets: |
||||
Loans |
||||
U.S. Loans |
$ | 8,955 | ||
Non-U.S. Loans |
3,631 | |||
Unique Loans |
1,356 | |||
|
|
|||
CECL reserve on loans |
$ | 13,942 | ||
|
|
|||
CECL reserve on held-to-maturity |
445 | |||
Liabilities: |
||||
CECL reserve on unfunded loan commitments |
3,263 | |||
|
|
|||
Total impact of ASU 2016-13 adoption on retained earnings |
$ | 17,650 | ||
|
|
1 - |
Very Low Risk |
2 - |
Low Risk |
3 - |
Medium Risk |
4 - |
High Risk/Potential for Loss: |
5 - |
Impaired/Loss Likely: |
Loan Type (1) |
Origination Date (2) |
Total Loan (3)(4) |
Principal Balance (4) |
Net Book Value |
Cash Coupon (5) |
All-in Yield (5) |
Maximum Maturity (6) |
Location |
Property Type |
Loan Per SQFT / Unit / Key |
Origination LTV (2) |
Risk Rating | ||||||||||||||||||||||||||||||||
1 |
Senior loan |
8/14/2019 | $ | 1,317.8 | $ | 1,317.8 | $ | 1,309.4 | L + 2.50 | % | L + 2.84 | % | 12/23/2024 | Dublin-IE |
Office | $479 / sqft | 74 | % | 3 | |||||||||||||||||||||||||
2 |
Senior loan |
3/22/2018 | 993.3 | 993.3 | 990.7 | L + 3.15 | % | L + 3.37 | % | 3/15/2023 | Diversified-Spain |
Mixed-Use |
n/a | 71 | % | 4 | ||||||||||||||||||||||||||||
3 |
Senior loan |
11/25/2019 | 724.2 | 653.3 | 653.9 | L + 2.30 | % | L + 2.79 | % | 12/9/2024 | New York |
Office | $936 / sqft | 65 | % | 3 | ||||||||||||||||||||||||||||
4 |
Senior loan |
5/11/2017 | 646.8 | 619.2 | 618.8 | L + 3.40 | % | L + 3.57 | % | 6/10/2023 | Washington DC |
Office | $304 / sqft | 62 | % | 3 | ||||||||||||||||||||||||||||
5 |
Senior loan |
8/22/2018 | 362.5 | 359.9 | 359.1 | L + 3.15 | % | L + 3.49 | % | 8/9/2023 | Maui |
Hospitality | $467,454 / key | 61 | % | 4 | ||||||||||||||||||||||||||||
6 |
Senior loan |
10/23/2018 | 352.4 | 347.8 | 347.7 | L + 3.40 | % | L + 3.67 | % | 1/23/2022 | New York |
Mixed-Use |
$589 / sqft | 65 | % | 3 | ||||||||||||||||||||||||||||
7 |
Senior loan |
4/11/2018 | 355.0 | 344.5 | 344.2 | L + 2.85 | % | L + 3.10 | % | 5/1/2023 | New York |
Office | $437 / sqft | 71 | % | 2 | ||||||||||||||||||||||||||||
8 |
Senior loan (4) |
8/6/2015 | 332.5 | 332.5 | 60.6 | 5.75 | % | 5.81 | % | 10/29/2022 | Diversified-EUR |
Other | n/a | 71 | % | 3 | ||||||||||||||||||||||||||||
9 |
Senior loan |
1/11/2019 | 328.2 | 328.2 | 325.1 | L + 4.35 | % | L + 4.70 | % | 1/11/2026 | Diversified-UK |
Other | $324 / sqft | 74 | % | 4 | ||||||||||||||||||||||||||||
10 |
Senior loan (4) |
8/7/2019 | 745.8 | 305.7 | 59.3 | L + 3.12 | % | L + 3.56 | % | 9/9/2025 | Los Angeles | Office | $207 / sqft | 59 | % | 3 | ||||||||||||||||||||||||||||
11 |
Senior loan |
11/30/2018 | 286.3 | 286.3 | 284.8 | n/m | (7) |
n/m | (7) |
8/9/2025 | New York |
Hospitality | $306,870 / key | 73 | % | 5 | ||||||||||||||||||||||||||||
12 |
Senior loan |
2/27/2020 | 300.0 | 281.7 | 279.6 | L + 2.70 | % | L + 3.03 | % | 3/9/2025 | New York |
Mixed-Use |
$884 / sqft | 59 | % | 3 | ||||||||||||||||||||||||||||
13 |
Senior loan |
7/31/2018 | 279.5 | 278.0 | 277.3 | L + 3.10 | % | L + 3.52 | % | 8/9/2022 | San Francisco |
Office | $701 / sqft | 50 | % | 2 | ||||||||||||||||||||||||||||
14 |
Senior loan |
9/30/2019 | 305.5 | 267.3 | 267.6 | L + 3.66 | % | L + 3.75 | % | 9/9/2024 | Chicago |
Office | $232 / sqft | 58 | % | 2 | ||||||||||||||||||||||||||||
15 |
Senior loan |
12/11/2018 | 310.0 | 259.0 | 257.8 | L + 2.55 | % | L + 2.96 | % | 12/9/2023 | Chicago |
Office | $218 / sqft | 78 | % | 3 | ||||||||||||||||||||||||||||
16 |
Senior loan |
9/23/2019 | 305.4 | 258.8 | 256.5 | L + 3.00 | % | L + 3.22 | % | 11/15/2024 | Diversified-Spain |
Hospitality | $138,195 / key | 62 | % | 4 | ||||||||||||||||||||||||||||
17 |
Senior loan |
10/23/2018 | 290.4 | 250.1 | 249.0 | L + 2.80 | % | L + 3.04 | % | 11/9/2024 | Atlanta |
Office | $233 / sqft | 64 | % | 2 | ||||||||||||||||||||||||||||
18 |
Senior loan |
11/30/2018 | 263.9 | 248.9 | 247.6 | L + 2.80 | % | L + 3.34 | % | 12/9/2024 | San Francisco |
Hospitality | $365,544 / key | 73 | % | 4 | ||||||||||||||||||||||||||||
19 |
Senior loan |
5/9/2018 | 242.9 | 232.9 | 233.1 | L + 2.60 | % | L + 3.13 | % | 5/9/2023 | New York |
Industrial | $66 / sqft | 70 | % | 1 | ||||||||||||||||||||||||||||
20 |
Senior loan |
7/20/2017 | 249.4 | 222.0 | 221.6 | L + 4.80 | % | L + 5.05 | % | 8/9/2022 | San Francisco |
Office | $369 / sqft | 58 | % | 2 | ||||||||||||||||||||||||||||
21 |
Senior loan |
6/23/2015 | 208.9 | 208.9 | 208.7 | L + 3.65 | % | L + 3.91 | % | 5/8/2022 | Washington DC |
Office | $234 / sqft | 72 | % | 2 | ||||||||||||||||||||||||||||
22 |
Senior loan |
6/27/2019 | 234.2 | 207.9 | 206.6 | L + 2.80 | % | L + 3.16 | % | 8/15/2026 | Berlin-DEU |
Office | $446 / sqft | 62 | % | 3 | ||||||||||||||||||||||||||||
23 |
Senior loan |
12/12/2019 | 260.5 | 207.0 | 206.3 | L + 2.40 | % | L + 2.69 | % | 12/9/2024 | New York |
Office | $98 / sqft | 42 | % | 1 | ||||||||||||||||||||||||||||
24 |
Senior loan |
11/5/2019 | 225.8 | 205.5 | 204.0 | L + 3.85 | % | L + 4.45 | % | 2/21/2025 | Diversified-IT |
Office | $406 / sqft | 66 | % | 3 | ||||||||||||||||||||||||||||
25 |
Senior loan |
9/25/2019 | 201.2 | 201.2 | 200.3 | L + 4.35 | % | L + 4.93 | % | 9/26/2023 | London-UK |
Office | $917 / sqft | 72 | % | 3 |
Loan Type (1) |
Origination Date (2) |
Total Loan (3)(4) |
Principal Balance (4) |
Net Book Value |
Cash Coupon (5) |
All-in Yield (5) |
Maximum Maturity (6) |
Location |
Property Type |
Loan Per SQFT / Unit / Key |
Origination LTV (2) |
Risk Rating | ||||||||||||||||||||||||||||||||
26 |
Senior loan |
11/23/2018 | 203.3 | 199.9 | 198.4 | L + 2.62 | % | L + 2.87 | % | 2/15/2024 | Diversified-UK |
Office | $1,212 / sqft | 50 | % | 3 | ||||||||||||||||||||||||||||
27 |
Senior loan |
8/31/2017 | 203.0 | 199.0 | 198.5 | L + 2.50 | % | L + 2.85 | % | 9/9/2023 | Orange County |
Office | $232 / sqft | 64 | % | 3 | ||||||||||||||||||||||||||||
28 |
Senior loan |
9/14/2018 | 193.6 | 193.6 | 193.2 | L + 3.50 | % | L + 3.85 | % | 9/14/2023 | Canberra-AU |
Mixed-Use |
$503 / sqft | 68 | % | 3 | ||||||||||||||||||||||||||||
29 |
Senior loan |
12/22/2016 | 204.5 | 191.5 | 191.5 | L + 2.90 | % | L + 2.98 | % | 12/9/2022 | New York |
Office | $269 / sqft | 64 | % | 3 | ||||||||||||||||||||||||||||
30 |
Senior loan |
6/4/2018 | 187.8 | 187.8 | 187.5 | L + 3.50 | % | L + 3.86 | % | 6/9/2024 | New York |
Hospitality | $309,308 / key | 52 | % | 4 | ||||||||||||||||||||||||||||
31 |
Senior loan |
4/9/2018 | 1,486.5 | 185.0 | 173.3 | L + 8.50 | % | L + 10.64 | % | 6/9/2025 | New York |
Office | $525 / sqft | 48 | % | 2 | ||||||||||||||||||||||||||||
32 |
Senior loan |
4/3/2018 | 178.6 | 177.3 | 177.2 | L + 2.75 | % | L + 3.06 | % | 4/9/2024 | Dallas |
Mixed-Use |
$502 / sqft | 64 | % | 3 | ||||||||||||||||||||||||||||
33 |
Senior loan |
9/26/2019 | 175.0 | 175.0 | 174.7 | L + 3.10 | % | L + 3.54 | % | 1/9/2023 | New York |
Office | $256 / sqft | 65 | % | 3 | ||||||||||||||||||||||||||||
34 |
Senior loan (4) |
11/22/2019 | 470.0 | 170.8 | 33.3 | L + 3.70 | % | L + 4.14 | % | 12/9/2025 | Los Angeles |
Office | $171 / sqft | 69 | % | 3 | ||||||||||||||||||||||||||||
35 |
Senior loan |
12/21/2017 | 197.5 | 167.4 | 167.4 | L + 2.65 | % | L + 2.87 | % | 1/9/2023 | Atlanta |
Office | $125 / sqft | 51 | % | 2 | ||||||||||||||||||||||||||||
36 |
Senior loan |
11/16/2018 | 211.9 | 166.2 | 165.1 | L + 4.10 | % | L + 4.71 | % | 12/9/2023 | Fort Lauderdale |
Mixed-Use |
$467 / sqft | 59 | % | 3 | ||||||||||||||||||||||||||||
37 |
Senior loan |
12/6/2019 | 157.2 | 157.2 | 156.1 | L + 2.80 | % | L + 3.51 | % | 12/5/2024 | London-UK |
Office | $1,041 / sqft | 75 | % | 3 | ||||||||||||||||||||||||||||
38 |
Senior loan |
9/4/2018 | 172.7 | 156.9 | 156.4 | L + 3.00 | % | L + 3.39 | % | 9/9/2023 | Las Vegas |
Hospitality | $189,902 / key | 70 | % | 4 | ||||||||||||||||||||||||||||
39 |
Senior loan |
8/23/2017 | 165.0 | 155.0 | 154.7 | L + 3.25 | % | L + 3.48 | % | 10/9/2022 | Los Angeles |
Office | $315 / sqft | 74 | % | 2 | ||||||||||||||||||||||||||||
40 |
Senior loan |
12/20/2019 | 153.6 | 153.6 | 152.4 | L + 3.10 | % | L + 3.32 | % | 12/18/2026 | London-UK |
Office | $764 / sqft | 75 | % | 3 | ||||||||||||||||||||||||||||
41 |
Senior loan |
9/5/2019 | 198.4 | 147.8 | 146.3 | L + 2.75 | % | L + 3.24 | % | 9/9/2024 | New York |
Office | $922 / sqft | 62 | % | 3 | ||||||||||||||||||||||||||||
42 |
Senior loan |
4/25/2019 | 210.0 | 141.4 | 140.6 | L + 3.50 | % | L + 3.76 | % | 9/1/2025 | Los Angeles |
Office | $635 / sqft | 73 | % | 3 | ||||||||||||||||||||||||||||
43 |
Senior loan |
6/1/2018 | 138.1 | 136.6 | 136.0 | L + 3.40 | % | L + 3.74 | % | 5/28/2023 | London-UK |
Office | $927 / sqft | 70 | % | 1 | ||||||||||||||||||||||||||||
44 |
Senior loan |
5/11/2017 | 135.9 | 135.9 | 135.7 | L + 3.40 | % | L + 3.64 | % | 6/10/2023 | Washington DC |
Office | $312 / sqft | 38 | % | 2 | ||||||||||||||||||||||||||||
45 |
Senior loan |
1/17/2020 | 203.0 | 133.5 | 132.4 | L + 2.75 | % | L + 3.07 | % | 2/9/2025 | New York |
Mixed-Use |
$110 / sqft | 43 | % | 3 | ||||||||||||||||||||||||||||
46 |
Senior loan |
11/14/2017 | 133.0 | 133.0 | 133.0 | L + 2.75 | % | L + 3.00 | % | 6/9/2023 | Los Angeles |
Hospitality | $532,000 / key | 56 | % | 3 | ||||||||||||||||||||||||||||
47 |
Senior loan |
6/28/2019 | 223.8 | 128.9 | 126.6 | L + 3.70 | % | L + 4.96 | % | 6/27/2024 | London-UK |
Office | $420 / sqft | 71 | % | 3 | ||||||||||||||||||||||||||||
48 |
Senior loan |
12/14/2018 | 135.6 | 127.5 | 127.4 | L + 2.90 | % | L + 3.25 | % | 1/9/2024 | Diversified-US |
Industrial | $51 / sqft | 57 | % | 3 | ||||||||||||||||||||||||||||
49 |
Senior loan |
4/30/2018 | 175.2 | 124.1 | 123.2 | L + 3.25 | % | L + 3.51 | % | 4/30/2023 | London-UK |
Office | $558 / sqft | 60 | % | 3 | ||||||||||||||||||||||||||||
50 |
Senior loan |
10/1/2019 | 354.1 | 124.0 | 120.5 | L + 3.75 | % | L + 4.25 | % | 10/9/2025 | Atlanta |
Mixed-Use |
$365 / sqft | 70 | % | 3 |
Loan Type (1) |
Origination Date (2) |
Total Loan (3)(4) |
Principal Balance (4) |
Net Book Value |
Cash Coupon (5) |
All-in Yield (5) |
Maximum Maturity (6) |
Location |
Property Type |
Loan Per SQFT / Unit / Key |
Origination LTV (2) |
Risk Rating | ||||||||||||||||||||||||||||||||
51 |
Senior loan |
11/27/2019 | 146.3 | 123.8 | 122.8 | L + 2.75 | % | L + 3.13 | % | 12/9/2024 | Minneapolis |
Office | $124 / sqft | 64 | % | 3 | ||||||||||||||||||||||||||||
52 |
Senior loan |
6/28/2019 | 125.0 | 117.2 | 116.8 | L + 2.75 | % | L + 2.91 | % | 2/1/2024 | Los Angeles |
Office | $591 / sqft | 48 | % | 3 | ||||||||||||||||||||||||||||
53 |
Senior loan |
3/10/2020 | 140.0 | 116.4 | 116.3 | L + 2.50 | % | L + 2.67 | % | 1/9/2025 | New York |
Mixed-Use |
$75 / sqft | 53 | % | 3 | ||||||||||||||||||||||||||||
54 |
Senior loan |
7/15/2019 | 144.6 | 114.2 | 113.4 | L + 2.90 | % | L + 3.25 | % | 8/9/2024 | Houston |
Office | $207 / sqft | 58 | % | 3 | ||||||||||||||||||||||||||||
55 |
Senior loan |
10/17/2016 | 113.7 | 113.7 | 113.7 | L + 3.95 | % | L + 3.96 | % | 10/21/2021 | Diversified-UK |
Self-Storage |
$156 / sqft | 73 | % | 3 | ||||||||||||||||||||||||||||
56 |
Senior loan |
11/30/2018 | 151.1 | 110.8 | 110.1 | L + 2.55 | % | L + 2.81 | % | 12/9/2024 | Washington DC |
Office | $316 / sqft | 60 | % | 3 | ||||||||||||||||||||||||||||
57 |
Senior loan |
12/21/2018 | 123.1 | 109.8 | 109.4 | L + 2.60 | % | L + 3.00 | % | 1/9/2024 | Chicago |
Office | $215 / key | 72 | % | 3 | ||||||||||||||||||||||||||||
58 |
Senior loan |
3/25/2020 | 130.2 | 106.3 | 105.3 | L + 2.40 | % | L + 2.78 | % | 3/31/2025 | Diversified-NL |
Multi | $129,761 / unit | 65 | % | 3 | ||||||||||||||||||||||||||||
59 |
Senior loan (4) |
9/22/2017 | 111.7 | 105.1 | 26.2 | L + 5.25 | % | L + 5.48 | % | 10/9/2022 | San Francisco |
Multi | $547,745 / unit | 46 | % | 3 | ||||||||||||||||||||||||||||
60 |
Senior loan |
10/16/2018 | 113.7 | 104.8 | 104.5 | L + 3.25 | % | L + 3.57 | % | 11/9/2023 | San Francisco |
Hospitality | $228,299 / key | 72 | % | 4 | ||||||||||||||||||||||||||||
61 |
Senior loan |
3/13/2018 | 123.0 | 103.6 | 103.2 | L + 3.00 | % | L + 3.27 | % | 4/9/2025 | Honolulu |
Hospitality | $160,580 / key | 50 | % | 3 | ||||||||||||||||||||||||||||
62 |
Senior loan |
12/10/2018 | 121.4 | 98.2 | 97.2 | L + 2.95 | % | L + 3.34 | % | 12/3/2024 | London-UK |
Office | $469 / sqft | 72 | % | 3 | ||||||||||||||||||||||||||||
63 |
Senior loan |
4/12/2018 | 103.1 | 96.5 | 96.4 | L + 2.75 | % | L + 3.06 | % | 5/9/2023 | San Francisco |
Office | $252 / sqft | 72 | % | 3 | ||||||||||||||||||||||||||||
64 |
Senior loan |
3/28/2019 | 98.4 | 96.1 | 96.0 | L + 3.25 | % | L + 3.40 | % | 1/9/2024 | New York |
Hospitality | $248,380 / key | 63 | % | 4 | ||||||||||||||||||||||||||||
65 |
Senior loan |
12/23/2019 | 109.7 | 95.7 | 95.0 | L + 2.70 | % | L + 3.03 | % | 1/9/2025 | Miami |
Multi | $331,037 / unit | 68 | % | 3 | ||||||||||||||||||||||||||||
66 |
Senior loan |
8/18/2017 | 94.9 | 94.9 | 94.8 | L + 4.10 | % | L + 4.41 | % | 8/18/2022 | Brussels-BE |
Office | $147 / sqft | 59 | % | 1 | ||||||||||||||||||||||||||||
67 |
Senior loan |
5/16/2014 | 92.0 | 92.0 | 91.9 | L + 3.85 | % | L + 4.04 | % | 7/9/2022 | Miami |
Office | $198 / sqft | 67 | % | 3 | ||||||||||||||||||||||||||||
68 |
Senior loan |
3/31/2017 | 96.9 | 90.0 | 90.3 | L + 4.30 | % | L + 4.69 | % | 4/9/2022 | New York |
Office | $441 / sqft | 64 | % | 3 | ||||||||||||||||||||||||||||
69 |
Senior loan (4) |
3/23/2020 | 348.6 | 88.8 | 16.7 | L + 3.75 | % | L + 4.41 | % | 1/9/2025 | Nashville |
Mixed-Use |
$298 / sqft | 78 | % | 3 | ||||||||||||||||||||||||||||
70 |
Senior loan |
2/18/2015 | 87.7 | 87.7 | 87.7 | L + 3.75 | % | L + 4.88 | % | 1/9/2021 | Diversified-CA |
Office | $181 / sqft | 71 | % | 3 | ||||||||||||||||||||||||||||
71 |
Senior loan |
11/22/2019 | 85.0 | 85.0 | 84.8 | L + 2.99 | % | L + 3.27 | % | 12/1/2024 | San Jose |
Multi | $317,164 / unit | 62 | % | 3 | ||||||||||||||||||||||||||||
72 |
Senior loan |
2/20/2019 | 138.8 | 80.2 | 79.0 | L + 3.25 | % | L + 3.89 | % | 2/19/2024 | London-UK |
Office | $394 / sqft | 61 | % | 3 | ||||||||||||||||||||||||||||
73 |
Senior loan |
6/29/2016 | 83.4 | 80.0 | 79.8 | L + 2.80 | % | L + 3.04 | % | 7/9/2021 | Miami |
Office | $308 / sqft | 64 | % | 2 | ||||||||||||||||||||||||||||
74 |
Senior loan |
6/18/2019 | 75.0 | 75.0 | 74.6 | L + 2.75 | % | L + 3.15 | % | 7/9/2024 | Napa Valley |
Hospitality | $785,340 / key | 74 | % | 4 | ||||||||||||||||||||||||||||
75 |
Senior loan |
6/27/2019 | 84.0 | 74.2 | 73.9 | L + 2.50 | % | L + 2.77 | % | 7/9/2024 | West Palm Beach | Office | $254 / sqft | 70 | % | 3 |
Loan Type (1) |
Origination Date (2) |
Total Loan (3)(4) |
Principal Balance (4) |
Net Book Value |
Cash Coupon (5) |
All-in Yield (5) |
Maximum Maturity (6) |
Location |
Property Type |
Loan Per SQFT / Unit / Key |
Origination LTV (2) |
Risk Rating | ||||||||||||||||||||||||||||||||
76 |
Senior loan |
7/26/2018 | 84.1 | 73.3 | 73.3 | L + 2.75 | % | L + 2.85 | % | 1/29/2024 | Columbus |
Multi | $69,038 / unit | 69 | % | 3 | ||||||||||||||||||||||||||||
77 |
Senior loan |
4/5/2018 | 85.3 | 71.2 | 71.1 | L + 3.10 | % | L + 3.51 | % | 4/9/2023 | Diversified-US |
Industrial | $26 / sqft | 54 | % | 3 | ||||||||||||||||||||||||||||
78 |
Senior loan |
3/21/2018 | 74.3 | 69.4 | 69.2 | L + 3.10 | % | L + 3.33 | % | 3/21/2024 | Jacksonville |
Office | $91 / sqft | 72 | % | 2 | ||||||||||||||||||||||||||||
79 |
Senior loan |
1/30/2020 | 104.4 | 66.7 | 66.0 | L + 2.85 | % | L + 3.22 | % | 2/9/2026 | Honolulu |
Hospitality | $214,341 / key | 63 | % | 4 | ||||||||||||||||||||||||||||
80 |
Senior loan |
10/5/2018 | 66.2 | 66.2 | 66.0 | L + 5.50 | % | L + 5.65 | % | 10/5/2021 | Sydney-AU |
Office | $703 / sqft | 78 | % | 3 | ||||||||||||||||||||||||||||
81 |
Senior loan |
8/22/2019 | 74.3 | 65.0 | 64.6 | L + 2.55 | % | L + 2.93 | % | 9/9/2024 | Los Angeles |
Office | $389 / sqft | 63 | % | 3 | ||||||||||||||||||||||||||||
82 |
Senior loan |
6/29/2017 | 63.4 | 63.4 | 63.3 | L + 3.40 | % | L + 3.65 | % | 7/9/2023 | New York |
Multi | $184,768 / unit | 69 | % | 4 | ||||||||||||||||||||||||||||
83 |
Senior loan |
10/31/2018 | 63.3 | 59.2 | 59.2 | L + 5.00 | % | L + 5.00 | % | 11/9/2023 | New York |
Multi | $307,319 / unit | 61 | % | 2 | ||||||||||||||||||||||||||||
84 |
Senior loan |
6/26/2019 | 72.8 | 57.1 | 56.6 | L + 3.35 | % | L + 3.66 | % | 6/20/2024 | London-UK |
Office | $645 / sqft | 61 | % | 3 | ||||||||||||||||||||||||||||
85 |
Senior loan |
10/6/2017 | 55.9 | 55.8 | 55.8 | L + 2.95 | % | L + 3.15 | % | 10/9/2022 | Nashville |
Multi | $99,598 / unit | 74 | % | 2 | ||||||||||||||||||||||||||||
86 |
Senior loan |
12/10/2020 | 61.2 | 54.3 | 53.8 | L + 3.25 | % | L + 3.54 | % | 1/9/2026 | Fort Lauderdale |
Office | $187 / sqft | 68 | % | 3 | ||||||||||||||||||||||||||||
87 |
Senior loan |
8/16/2019 | 54.3 | 54.3 | 54.2 | L + 2.75 | % | L + 2.95 | % | 9/1/2022 | Sarasota |
Multi | $238,158 / unit | 76 | % | 3 | ||||||||||||||||||||||||||||
88 |
Senior loan |
8/14/2019 | 70.3 | 53.8 | 53.4 | L + 2.45 | % | L + 2.87 | % | 9/9/2024 | Los Angeles |
Office | $617 / sqft | 57 | % | 3 | ||||||||||||||||||||||||||||
89 |
Senior loan |
11/23/2016 | 53.6 | 53.6 | 53.5 | L + 3.50 | % | L + 4.07 | % | 12/9/2022 | New York |
Multi | $223,254 / unit | 65 | % | 4 | ||||||||||||||||||||||||||||
90 |
Senior loan |
3/11/2014 | 52.4 | 52.4 | 52.4 | n/m | (7) |
n/m | (7) |
7/9/2021 | New York |
Multi | $588,633 / unit | 65 | % | 5 | ||||||||||||||||||||||||||||
91 |
Senior loan |
11/30/2016 | 60.5 | 52.0 | 51.9 | L + 3.10 | % | L + 3.22 | % | 12/9/2023 | Chicago |
Retail | $1,014 / sqft | 54 | % | 4 | ||||||||||||||||||||||||||||
92 |
Senior loan |
6/12/2019 | 55.0 | 48.3 | 48.3 | L + 3.25 | % | L + 3.37 | % | 7/1/2022 | Grand Rapids |
Multi | $92,529 / unit | 69 | % | 3 | ||||||||||||||||||||||||||||
93 |
Senior loan |
8/29/2017 | 51.2 | 47.5 | 47.5 | L + 3.35 | % | L + 3.35 | % | 10/9/2022 | Southern California |
Industrial | $96 / sqft | 65 | % | 3 | ||||||||||||||||||||||||||||
94 |
Senior loan |
2/20/2019 | 52.7 | 44.1 | 43.8 | L + 3.50 | % | L + 3.92 | % | 3/9/2024 | Calgary-CAN |
Office | $121 / sqft | 52 | % | 3 | ||||||||||||||||||||||||||||
95 |
Senior loan |
11/3/2017 | 45.0 | 44.0 | 43.9 | L + 3.00 | % | L + 3.26 | % | 11/1/2022 | Los Angeles |
Office | $205 / sqft | 50 | % | 1 | ||||||||||||||||||||||||||||
96 |
Senior loan |
2/21/2020 | 43.8 | 43.8 | 43.6 | L + 2.95 | % | L + 3.27 | % | 3/1/2025 | Atlanta |
Multi | $137,304 / unit | 68 | % | 3 | ||||||||||||||||||||||||||||
97 |
Senior loan |
6/26/2015 | 41.0 | 41.0 | 41.0 | L + 3.75 | % | L + 4.36 | % | 1/9/2021 | San Diego |
Office | $187 / sqft | 73 | % | 3 | ||||||||||||||||||||||||||||
98 |
Senior loan |
12/27/2016 | 36.0 | 36.0 | 36.0 | L + 3.10 | % | L + 3.45 | % | 7/9/2023 | New York |
Multi | $617,619 / unit | 64 | % | 3 | ||||||||||||||||||||||||||||
99 |
Senior loan |
12/13/2019 | 39.1 | 35.9 | 35.3 | L + 3.55 | % | L + 4.49 | % | 6/12/2024 | Diversified-FR |
Industrial | $25 / sqft | 55 | % | 3 | ||||||||||||||||||||||||||||
100 |
Senior loan |
11/19/2020 | 34.7 | 34.7 | 34.3 | L + 3.50 | % | L + 3.85 | % | 12/9/2025 | Scottsdale |
Multi | $203,880 / unit | 59 | % | 3 |
Loan Type (1) |
Origination Date (2) |
Total Loan (3)(4) |
Principal Balance (4) |
Net Book Value |
Cash Coupon (5) |
All-in Yield (5) |
Maximum Maturity (6) |
Location |
Property Type |
Loan Per SQFT / Unit / Key |
Origination LTV (2) |
Risk Rating | ||||||||||||||||||||||||||||||||
101 |
Senior loan |
10/31/2018 | 35.7 | 34.3 | 34.4 | L + 5.00 | % | L + 4.97 | % | 11/9/2023 | New York |
Condo | $444,934 / unit | 64 | % | 3 | ||||||||||||||||||||||||||||
102 |
Senior loan |
10/31/2019 | 33.9 | 33.2 | 33.2 | L + 3.25 | % | L + 3.34 | % | 11/1/2024 | Raleigh |
Multi | $163,786 / unit | 52 | % | 3 | ||||||||||||||||||||||||||||
103 |
Senior loan |
10/31/2019 | 31.5 | 31.5 | 31.4 | L + 3.25 | % | L + 3.33 | % | 11/1/2024 | Atlanta |
Multi | $165,711 / unit | 60 | % | 3 | ||||||||||||||||||||||||||||
104 |
Senior loan |
10/31/2019 | 30.2 | 30.0 | 30.0 | L + 3.25 | % | L + 3.33 | % | 11/1/2024 | Austin |
Multi | $158,929 / unit | 52 | % | 3 | ||||||||||||||||||||||||||||
105 |
Senior loan |
11/19/2020 | 37.8 | 28.2 | 27.9 | L + 3.50 | % | L + 3.90 | % | 12/9/2025 | Chicago |
Multi | $161,351 / unit | 53 | % | 3 | ||||||||||||||||||||||||||||
106 |
Senior loan |
11/19/2020 | 28.2 | 28.0 | 27.7 | L + 3.50 | % | L + 3.85 | % | 12/9/2025 | Charlotte |
Multi | $177,171 / unit | 61 | % | 3 | ||||||||||||||||||||||||||||
107 |
Senior loan |
11/19/2020 | 33.7 | 27.7 | 27.3 | L + 3.50 | % | L + 3.88 | % | 12/9/2025 | Virginia Beach |
Multi | $160,839 / unit | 61 | % | 3 | ||||||||||||||||||||||||||||
108 |
Senior loan |
10/31/2019 | 27.2 | 27.2 | 27.2 | L + 3.25 | % | L + 3.32 | % | 11/1/2024 | Austin |
Multi | $135,323 / unit | 53 | % | 3 | ||||||||||||||||||||||||||||
109 |
Senior loan |
6/26/2019 | 25.5 | 25.5 | 25.5 | L + 3.25 | % | L + 3.25 | % | 2/1/2021 | Lake Charles |
Multi | $95,149 / unit | 73 | % | 1 | ||||||||||||||||||||||||||||
110 |
Senior loan |
3/24/2020 | 22.0 | 22.0 | 22.0 | L + 3.25 | % | L + 3.26 | % | 10/1/2021 | San Jose |
Multi | $400,000 / unit | 58 | % | 3 | ||||||||||||||||||||||||||||
111 |
Senior loan |
3/8/2017 | 21.3 | 21.3 | 21.3 | 4.79 | % (8) |
5.12 | % (8) |
12/23/2021 | Montreal-CAN |
Office | $58 / sqft | 45 | % | 2 | ||||||||||||||||||||||||||||
112 |
Senior loan |
12/23/2019 | 26.2 | 21.1 | 21.0 | L + 2.85 | % | L + 3.21 | % | 1/9/2025 | Miami |
Office | $355 / sqft | 68 | % | 3 | ||||||||||||||||||||||||||||
113 |
Senior loan |
6/15/2018 | 22.0 | 20.4 | 20.6 | L + 3.60 | % | L + 3.67 | % | 7/1/2022 | Phoenix |
Multi | $71,430 / unit | 78 | % | 1 | ||||||||||||||||||||||||||||
114 |
Senior loan |
12/15/2017 | 20.1 | 20.1 | 20.0 | L + 5.00 | % | L + 5.24 | % | 12/9/2021 | Diversified-US |
Hospitality | $303,882 / key | 50 | % | 3 | ||||||||||||||||||||||||||||
115 |
Senior loan |
4/26/2019 | 20.0 | 20.0 | 20.0 | L + 2.93 | % | L + 3.38 | % | 5/1/2024 | Nashville |
Multi | $198,020 / unit | 73 | % | 3 | ||||||||||||||||||||||||||||
116 |
Senior loan |
3/30/2016 | 16.9 | 16.9 | 17.0 | 5.15 | % | 5.25 | % | 9/3/2021 | Diversified-CAN |
Self-Storage |
$3,682 / unit | 56 | % | 1 | ||||||||||||||||||||||||||||
117 |
Senior loan |
4/30/2019 | 15.5 | 14.8 | 14.7 | L + 3.00 | % | L + 3.32 | % | 5/1/2024 | Houston |
Multi | $47,837 / unit | 78 | % | 3 | ||||||||||||||||||||||||||||
118 |
Senior loan |
6/21/2019 | 14.8 | 14.5 | 14.4 | L + 3.30 | % | L + 3.41 | % | 7/1/2022 | Portland |
Multi | $130,180 / unit | 66 | % | 2 | ||||||||||||||||||||||||||||
119 |
Senior loan |
2/28/2019 | 15.3 | 14.3 | 14.3 | L + 3.00 | % | L + 3.29 | % | 3/1/2024 | San Antonio |
Multi | $62,223 / unit | 75 | % | 3 | ||||||||||||||||||||||||||||
120 |
Senior loan |
5/22/2014 | 14.0 | 14.0 | 14.0 | L + 2.90 | % | L + 3.15 | % | 6/15/2021 | Orange County |
Office | $25 / sqft | 74 | % | 2 | ||||||||||||||||||||||||||||
CECL reserve |
(173.5 | ) | ||||||||||||||||||||||||||||||||||||||||||
|
|
|
|
|
|
|
|
|
|
|
|
|
|
| ||||||||||||||||||||||||||||||
Loans receivable, net | $ | 21,417.6 | $ | 17,454.6 | $ | 16,399.2 | L + 3.24 | % | L + 3.58 | % | 3.1 yrs | 65 | % | 3.0 | ||||||||||||||||||||||||||||||
|
|
|
|
|
|
|
|
|
|
|
|
|
|
|
(1) | Senior loans include senior mortgages and similar credit quality loans, including related contiguous subordinate loans and pari passu participations in senior mortgage loans. |
(2) | Date loan was originated or acquired by us, and the LTV as of such date. Origination dates are subsequently updated to reflect material loan modifications. |
(3) | Total loan amount reflects outstanding principal balance as well as any related unfunded loan commitment. |
(4) | In certain instances, we finance our loans through the non-recourse sale of a senior loan interest that is not included in our consolidated financial statements. As of December 31, 2020, five loans in our portfolio have been financed with an aggregate $801.8 million of non-consolidated senior interest, which are included in the table above. Portfolio excludes our $79.2 million subordinate position in the $735.5 million 2018 Single Asset Securitization. Refer to Notes 4 and 16 to our consolidated financial statements for details of the 2018 Single Asset Securitization. |
(5) | The weighted-average cash coupon and all-in yield are expressed as a spread over the relevant floating benchmark rates, which include USD LIBOR, GBP LIBOR, EURIBOR, BBSY, and CDOR, as applicable to each loan. As of December 31, 2020, 98% of our loans by total loan exposure earned a floating rate of interest, primarily indexed to USD LIBOR, and $14.2 billion of such loans earned interest based on floors that are above the applicable index. The other 2% of our loans earned a fixed rate of interest, which we reflect as a spread over the relevant floating benchmark rates, as of December 31, 2020, for purposes of the weighted-averages. In addition to cash coupon, all-in yield includes the amortization of deferred origination and extension fees, loan origination costs, and purchase discounts, as well as the accrual of exit fees. Excludes loans accounted for under the cost-recovery method. |
(6) | Maximum maturity assumes all extension options are exercised, however our loans may be repaid prior to such date. |
(7) | Loans are accounted for under the cost-recovery method. |
(8) | Loan consists of one or more floating and fixed rate tranches. Coupon and all-in yield assume applicable floating benchmark rates for weighted-average calculation. |
ITEM 7A. |
QUANTITATIVE AND QUALITATIVE DISCLOSURES ABOUT MARKET RISK |
Assets (Liabilities) Sensitive to Changes in Interest Rates (1)(2)(3) |
Interest Rate Sensitivity as of December 31, 2020 |
|||||||||||||||||||||||
Increase in Rates |
Decrease in Rates (4) |
|||||||||||||||||||||||
Currency |
25 Basis Points |
50 Basis Points |
25 Basis Points |
50 Basis Points |
||||||||||||||||||||
USD |
$ | 12,516,341 | Income | $ | 7,871 | $ | 16,569 | $ | (4,272 | ) | $ | (4,272 | ) | |||||||||||
(9,087,879 | ) | Expense | (15,261 | ) | (30,869 | ) | 8,783 | 8,783 | ||||||||||||||||
|
|
|
|
|
|
|
|
|
|
|||||||||||||||
$ | 3,428,462 | Net interest | $ | (7,390 | ) | $ | (14,300 | ) | $ | 4,511 | $ | 4,511 | ||||||||||||
|
|
|
|
|
|
|
|
|
|
|||||||||||||||
EUR (5) |
$ | 3,420,351 | Income | $ | — | $ | — | $ | — | $ | — | |||||||||||||
(2,498,055 | ) | Expense | — | — | — | — | ||||||||||||||||||
|
|
|
|
|
|
|
|
|
|
|||||||||||||||
$ | 922,296 | Net interest | $ | — | $ | — | $ | — | $ | — | ||||||||||||||
|
|
|
|
|
|
|
|
|
|
|||||||||||||||
GBP |
$ | 1,578,932 | Income | $ | 1,439 | $ | 3,333 | $ | (142 | ) | $ | (142 | ) | |||||||||||
(1,124,222 | ) | Expense | (2,248 | ) | (4,497 | ) | 229 | 229 | ||||||||||||||||
|
|
|
|
|
|
|
|
|
|
|||||||||||||||
$ | 454,710 | Net interest | $ | (809 | ) | $ | (1,164 | ) | $ | 87 | $ | 87 | ||||||||||||
|
|
|
|
|
|
|
|
|
|
|||||||||||||||
AUD |
$ | 259,788 | Income | $ | — | $ | — | $ | — | $ | — | |||||||||||||
(188,420 | ) | Expense | (377 | ) | (754 | ) | 90 | 90 | ||||||||||||||||
|
|
|
|
|
|
|
|
|
|
|||||||||||||||
$ | 71,368 | Net interest | $ | (377 | ) | $ | (754 | ) | $ | 90 | $ | 90 | ||||||||||||
|
|
|
|
|
|
|
|
|
|
|||||||||||||||
CAD |
$ | 45,649 | Income | $ | 3 | $ | 6 | $ | (3 | ) | $ | (6 | ) | |||||||||||
(62,760 | ) | Expense | (126 | ) | (251 | ) | 126 | 231 | ||||||||||||||||
|
|
|
|
|
|
|
|
|
|
|||||||||||||||
$ | (17,111 | ) | Net interest | $ | (123 | ) | $ | (245 | ) | $ | 123 | $ | 225 | |||||||||||
|
|
|
|
|
|
|
|
|
|
|||||||||||||||
Total net interest | $ | (8,699 | ) | $ | (16,463 | ) | $ | 4,811 | $ | 4,913 | ||||||||||||||
|
|
|
|
|
|
|
|
(1) | Our floating rate loans and related liabilities are indexed to the various benchmark rates relevant in each case in terms of currency and payment frequency. Therefore the net exposure to each benchmark rate is in direct proportion to our net assets indexed to that rate. Increases (decreases) in interest income and expense are presented net of incentive fees. In addition, $14.2 billion of our loans earned interest based on floors that are above the applicable index as of December 31, 2020. Refer to Note 12 to our consolidated financial statements for additional details of our incentive fee calculation. |
(2) | Includes investment exposure to the 2018 Single Asset Securitization. Refer to Notes 4 and 16 to our consolidated financial statements for details of the subordinate position we own in the 2018 Single Asset Securitization. |
(3) | Includes amounts outstanding under secured debt agreements, securitizations, asset-specific financings, and secured term loans. |
(4) | Decrease in rates assumes the applicable benchmark rate for each currency does not decrease below 0%. |
(5) | Assets balance includes a loan denominated in British Pound Sterling, with an outstanding principal balance of £146.2 million as of December 31, 2020, that is hedged to Euro exposure through a foreign currency forward contract. Refer to Note 10 to our consolidated financial statements for additional discussion of our foreign currency derivatives. |
December 31, 2020 |
||||||||||||||||
Foreign currency assets (1)(2) |
€ | 2,817,831 | £ | 1,400,798 | C$ | 107,888 | A$ | 343,141 | ||||||||
Foreign currency liabilities (1) |
(2,044,299 | ) | (1,023,437 | ) | (79,944 | ) | (245,522 | ) | ||||||||
Foreign currency contracts – notional |
(763,132 | ) | (372,487 | ) | (26,200 | ) | (92,800 | ) | ||||||||
|
|
|
|
|
|
|
|
|||||||||
Net exposure to exchange rate fluctuations |
€ | 10,400 | £ | 4,874 | C$ | 1,744 | A$ | 4,819 | ||||||||
|
|
|
|
|
|
|
|
(1) | Balances include non-consolidated senior interests of £198.8 million. |
(2) | Euro balance includes a loan denominated in British Pound Sterling, with an outstanding principal balance of £146.2 million as of December 31, 2020, that is hedged to Euro exposure through a foreign currency forward contract. Refer to Note 10 to our consolidated financial statements for additional discussion of our foreign currency derivatives. |
December 31, 2019 |
||||||||||||||||
Foreign currency assets (1) |
€ | 2,736,673 | £ | 1,639,881 | C$ | 105,273 | A$ | 518,315 | ||||||||
Foreign currency liabilities (1) |
(2,122,767 | ) | (1,017,239 | ) | (77,550 | ) | (379,968 | ) | ||||||||
Foreign currency contracts – notional |
(525,600 | ) | (527,100 | ) | (23,200 | ) | (135,600 | ) | ||||||||
|
|
|
|
|
|
|
|
|||||||||
Net exposure to exchange rate fluctuations |
€ | 88,306 | £ | 95,542 | C$ | 4,523 | A$ | 2,747 | ||||||||
|
|
|
|
|
|
|
|
(1) | Balances include non-consolidated senior interests of £302.0 million. |
ITEM 8. |
FINANCIAL STATEMENTS AND SUPPLEMENTARY DATA |
ITEM 9. |
CHANGES IN AND DISAGREEMENTS WITH ACCOUNTANTS ON ACCOUNTING AND FINANCIAL DISCLOSURE |
ITEM 9A. |
CONTROLS AND PROCEDURES |
ITEM 9B. |
OTHER INFORMATION |
ITEM 10. |
DIRECTORS, EXECUTIVE OFFICERS AND CORPORATE GOVERNANCE |
ITEM 11. |
EXECUTIVE COMPENSATION |
ITEM 12. |
SECURITY OWNERSHIP OF CERTAIN BENEFICIAL OWNERS AND MANAGEMENT AND RELATED STOCKHOLDER MATTERS |
Plan category |
(a) Number of securities to be issued upon exercise of outstanding options, warrants, and rights |
(b) Weighted-average exercise price of outstanding options, warrants, and rights |
(c) Number of securities remaining available for future issuance under equity compensation plans (excluding securities reflected in column (a)) |
|||||||||
Equity compensation plans approved by security holders (1) |
306,691 | (2) |
$ | — | 2,263,098 | |||||||
Equity compensation plans not approved by security holders (3) |
— | — | — | |||||||||
|
|
|
|
|
|
|||||||
Total |
306,691 | $ | — | 2,263,098 |
(1) | The number of securities remaining for future issuances consists of an aggregate 2,263,098 shares issuable under our 2018 stock incentive plan and our 2018 manager incentive plan. Awards under the plans may include restricted stock, unrestricted stock, stock options, stock units, stock appreciation rights, performance shares, performance units, deferred share units, or other equity-based awards, as the board of directors may determine. |
(2) | Reflects deferred stock units granted to our non-employee directors. The deferred stock units are settled upon the non-employee director’s separation from service with the company by delivering to the non-employee director one share of class A common stock for each deferred stock unit settled. As these awards have no exercise price, the weighted average exercise price in column (b) does not take these awards into account. |
(3) | All of our equity compensation plans have been approved by security holders. |
ITEM 13. |
CERTAIN RELATIONSHIPS AND RELATED TRANSACTIONS, AND DIRECTOR INDEPENDENCE |
ITEM 14. |
PRINCIPAL ACCOUNTANT FEES AND SERVICES |
ITEM 15. |
EXHIBITS, FINANCIAL STATEMENT SCHEDULES |
(a) (1) |
Financial Statements | |
See the accompanying Index to Financial Statement Schedule on page F-1. | ||
(a) (2) |
Consolidated Financial Statement Schedules | |
See the accompanying Index to Financial Statement Schedule on page F-1. | ||
(a) (3) |
Exhibits |
Exhibit No. |
Exhibit Description | |||
2.1 | ||||
3.1.a | ||||
3.1.b | ||||
3.1.c | ||||
3.1.d | ||||
3.1.e | ||||
3.1.f | ||||
3.1.g | ||||
3.1.h | ||||
3.2 | ||||
4.1 | * | |||
4.2 | ||||
4.3 | ||||
4.4 | ||||
4.5 | ||||
4.6 |
Exhibit No. |
Exhibit Description | |||
10.1 | ||||
10.2 | ||||
10.3 | ||||
10.4 | + | |||
10.5 | + | |||
10.6 | + | |||
10.7 | + | |||
10.8 | + | |||
10.9 | + | |||
10.10 | + | |||
10.11 | + | |||
10.12 | + | |||
10.13 | + | |||
10.14 | + |
Exhibit No. |
Exhibit Description | |||
10.15 | + | |||
10.16 | + | |||
10.17 | + | |||
10.18 | + | |||
10.19 | + | |||
10.20 | + | |||
10.21 | + | |||
10.22 | + | |||
10.23 | ||||
10.24 | ||||
10.25 | ||||
10.26 | ||||
10.27 | ||||
10.28 |
Exhibit No. |
Exhibit Description | |||
10.29 | ||||
10.30 | ||||
10.31 | ||||
10.32 | ||||
10.33 | ||||
10.34 | ||||
10.35 | ||||
10.36 | ||||
10.37 | ||||
10.38 | ||||
10.39 |
Exhibit No. |
Exhibit Description | |||
10.40 | ||||
10.41 | ||||
10.42 | ||||
10.43 | ||||
10.44 | ||||
10.45 | ||||
10.46 | ||||
10.47 | ||||
10.48 | ||||
10.49 | ||||
10.50 |
Exhibit No. |
Exhibit Description | |||
10.51 | ||||
10.52 | ||||
10.53 | ||||
10.54 | ||||
10.55 | ||||
10.56 | ||||
10.57 | ||||
10.58 | ||||
10.59 | ||||
10.60 | ||||
10.61 |
Exhibit No. |
Exhibit Description | |||
10.62 | ||||
10.63 | ||||
10.64 | ||||
10.65 | ||||
10.66 | ||||
10.67 | ||||
10.68 | ||||
10.69 | ||||
10.70 | ||||
10.71 | ||||
10.72 |
Exhibit No. |
Exhibit Description | |||
10.73 | ||||
10.74 | ||||
10.75 | ||||
10.76 | ||||
10.77 | ||||
10.78 | ||||
10.79 | ||||
10.80 | ||||
10.81 | ||||
10.82 |
Exhibit No. |
Exhibit Description | |||
10.83 | ||||
10.84 | ||||
10.85 | ||||
21.1 | * | |||
23.1 | * | |||
31.1 | * | |||
31.2 | * | |||
32.1 | * | |||
32.2 | * | |||
101.INS | ++ | XBRL Instance Document—the instance document does not appear in the interactive data file because its XBRL tags are embedded within the inline XBRL document | ||
101.SCH | ++ | Inline XBRL Taxonomy Extension Schema Document | ||
101.CAL | ++ | Inline XBRL Taxonomy Extension Calculation Linkbase Document | ||
101.LAB | ++ | Inline XBRL Taxonomy Extension Label Linkbase Document | ||
101.PRE | ++ | Inline XBRL Taxonomy Extension Presentation Linkbase Document | ||
101.DEF | ++ | Inline XBRL Taxonomy Extension Definition Linkbase Document | ||
104 | Cover Page Interactive Data File (formatted as Inline XBRL and contained in Exhibit 101) |
* | Filed herewith. |
+ | This document has been identified as a management contract or compensatory plan or arrangement. |
++ | This exhibit shall not be deemed “filed” for purposes of Section 18 of the Securities Exchange Act of 1934, as amended (the “Exchange Act”) or otherwise subject to the liability of that Section. Such exhibit shall not be deemed incorporated into any filing under the Securities Act of 1933, as amended (the “Securities Act”), or the Exchange Act. |
ITEM 16. |
FORM 10-K SUMMARY |
BLACKSTONE MORTGAGE TRUST, INC. | ||||
February 10, 2021 |
By: |
/s/ Stephen D. Plavin | ||
Date |
Stephen D. Plavin Chief Executive Officer (Principal Executive Officer) |
February 10, 2021 Date |
/s/ Michael B. Nash Michael B. Nash Executive Chairman of the Board of Directors | |||
February 10, 2021 Date |
/s/ Stephen D. Plavin Stephen D. Plavin Chief Executive Officer and Director (Principal Executive Officer) | |||
February 10, 2021 Date |
/s/ Anthony F. Marone, Jr. Anthony F. Marone, Jr. Chief Financial Officer (Principal Financial Officer and Principal Accounting Officer) | |||
February 10, 2021 Date |
/s/ Leonard W. Cotton Leonard W. Cotton, Director | |||
February 10, 2021 Date |
/s/ Thomas E. Dobrowksi Thomas E. Dobrowski, Director | |||
February 10, 2021 Date |
/s/ Martin L. Edelman Martin L. Edelman, Director | |||
February 10, 2021 Date |
/s/ Henry N. Nassau Henry N. Nassau, Director | |||
February 10, 2021 Date |
/s/ Jonathan L. Pollack Jonathan L. Pollack, Director | |||
February 10, 2021 Date |
/s/ Lynne B. Sagalyn Lynne B. Sagalyn, Director |
F-2 | ||||
F-6 | ||||
F-7 | ||||
F-8 | ||||
F-9 | ||||
F-10 | ||||
F-12 | ||||
S-1 |
• | We tested the design and operating effectiveness of controls implemented by the Company in relation to the establishment of the CECL reserve. Specifically, in relation to the adjustments made to their CECL reserve to account for current and future economic conditions, we focused our procedures on internal controls related to evaluation of macroeconomic factors and other judgments involved in the determination of such adjustments. |
• | We evaluated the appropriateness and consistency of the methods and assumptions used by management to develop the adjustments, assessed macro-economic and industry trends, and performed benchmarking analysis against peers. |
• | We tested the accuracy and completeness of quantitative data used by management to develop the adjustments to account for current and future economic conditions. |
• | We tested the design and operating effectiveness of controls over the estimation of the fair value of the collateral underlying the impaired loans, including specifically management’s review of the valuation model and underlying assumptions utilized in estimating the fair value of the underlying collateral. |
• | We tested management’s assumptions through independent analysis and comparison to external sources. |
• | We utilized our internal fair value specialists to assist in the evaluation of management’s valuation methodologies and assumptions. With the assistance of our internal fair value specialists, we evaluated certain of these assumptions (e.g., guideline transactions, discount rates, capitalization rates). Our |
internal fair value specialist procedures included testing the underlying source information of the assumptions, as well as developing a range of independent estimates and comparing those to the assumptions used by management. |
December 31, 2020 |
December 31, 2019 |
|||||||
Assets |
||||||||
Cash and cash equivalents |
$ | $ | ||||||
Loans receivable |
||||||||
Current expected credit loss reserve |
( |
) | — | |||||
|
|
|
|
|||||
Loans receivable, net |
||||||||
Other assets |
||||||||
|
|
|
|
|||||
Total Assets |
$ | |
$ | |
||||
|
|
|
|
|||||
Liabilities and Equity |
||||||||
Secured debt agreements, net |
$ | $ | ||||||
Securitized debt obligations, net |
||||||||
Asset-specific debt agreements, net |
||||||||
Secured term loans, net |
||||||||
Convertible notes, net |
||||||||
Other liabilities |
||||||||
|
|
|
|
|||||
Total Liabilities |
||||||||
|
|
|
|
|||||
Commitments and contingencies |
||||||||
Equity |
||||||||
Class A common stock, $ |
||||||||
Additional paid-in capital |
||||||||
Accumulated other comprehensive income (loss) |
( |
) | ||||||
Accumulated deficit |
( |
) | ( |
) | ||||
|
|
|
|
|||||
Total Blackstone Mortgage Trust, Inc. stockholders’ equity |
||||||||
Non-controlling interests |
||||||||
|
|
|
|
|||||
Total Equity |
||||||||
|
|
|
|
|||||
Total Liabilities and Equity |
$ | $ | ||||||
|
|
|
|
Year Ended December 31, |
||||||||||||
2020 |
2019 |
2018 |
||||||||||
Income from loans and other investments |
||||||||||||
Interest and related income |
$ | $ | $ | |||||||||
Less: Interest and related expenses |
||||||||||||
|
|
|
|
|
|
|||||||
Income from loans and other investments, net |
||||||||||||
Other expenses |
||||||||||||
Management and incentive fees |
||||||||||||
General and administrative expenses |
||||||||||||
|
|
|
|
|
|
|||||||
Total other expenses |
||||||||||||
Increase in current expected credit loss reserve |
( |
) | — | — | ||||||||
|
|
|
|
|
|
|||||||
Income before income taxes |
||||||||||||
Income tax provision (benefit) |
( |
) | ||||||||||
|
|
|
|
|
|
|||||||
Net income |
||||||||||||
|
|
|
|
|
|
|||||||
Net income attributable to non-controlling interests |
( |
) | ( |
) | ( |
) | ||||||
|
|
|
|
|
|
|||||||
Net income attributable to Blackstone Mortgage Trust, Inc. |
$ | $ | $ | |||||||||
|
|
|
|
|
|
|||||||
Net income per share of common stock basic and diluted |
$ | $ | $ | |||||||||
|
|
|
|
|
|
|||||||
Weighted-average shares of common stock outstanding, basic and diluted |
||||||||||||
|
|
|
|
|
|
Year Ended December 31, |
||||||||||||
2020 |
2019 |
2018 |
||||||||||
Net income |
$ | $ | $ | |||||||||
Other comprehensive income |
||||||||||||
Unrealized gain (loss) on foreign currency translation |
( |
) | ||||||||||
Realized and unrealized (loss) gain on derivative financial instruments |
( |
) | ( |
) | ||||||||
|
|
|
|
|
|
|||||||
Other comprehensive income (loss) |
( |
) | ||||||||||
|
|
|
|
|
|
|||||||
Comprehensive income |
||||||||||||
Comprehensive income attributable to non-controlling interests |
( |
) | ( |
) | ( |
) | ||||||
|
|
|
|
|
|
|||||||
Comprehensive income attributable to Blackstone Mortgage Trust, Inc. |
$ | |
$ | |
$ | |
||||||
|
|
|
|
|
|
Blackstone Mortgage Trust, Inc. |
||||||||||||||||||||||||||||
Class A Common Stock |
Additional Paid- In Capital |
Accumulated Other Comprehensive (Loss) Income |
Accumulated Deficit |
Stockholders’ Equity |
Non-Controlling Interests |
Total Equity |
||||||||||||||||||||||
Balance at December 31, 2017 |
$ | $ | $ | ( |
) | $ | ( |
) | $ | $ | $ | |||||||||||||||||
Shares of class A common stock issued, net |
— | — | — | |||||||||||||||||||||||||
Restricted class A common stock earned |
— | — | — | — | ||||||||||||||||||||||||
Issuance of convertible notes |
— | — | — | — | ||||||||||||||||||||||||
Conversion of convertible notes |
— | ( |
) | — | — | ( |
) | — | ( |
) | ||||||||||||||||||
Dividends reinvested |
— | — | ( |
) | — | |||||||||||||||||||||||
Deferred directors’ compensation |
— | — | — | — | ||||||||||||||||||||||||
Other comprehensive loss |
— | — | ( |
) | — | ( |
) | — | ( |
) | ||||||||||||||||||
Net income |
— | — | — | |||||||||||||||||||||||||
Dividends declared on common stock, $ |
— | — | — | ( |
) | ( |
) | — | ( |
) | ||||||||||||||||||
Contributions from non-controlling interests |
— | — | — | — | — | |||||||||||||||||||||||
Distributions to non-controlling interests |
— | — | — | — | — | ( |
) | ( |
) | |||||||||||||||||||
|
|
|
|
|
|
|
|
|
|
|
|
|
|
|||||||||||||||
Balance at December 31, 2018 |
$ | $ | $ | ( |
) | $ | ( |
) | $ | $ | $ | |||||||||||||||||
|
|
|
|
|
|
|
|
|
|
|
|
|
|
|||||||||||||||
Shares of class A common stock issued, net |
— | — | — | |||||||||||||||||||||||||
Restricted class A common stock earned |
— | — | — | — | ||||||||||||||||||||||||
Dividends reinvested |
— | — | ( |
) | — | |||||||||||||||||||||||
Deferred directors’ compensation |
— | — | — | — | ||||||||||||||||||||||||
Other comprehensive income |
— | — | |
— | — | |||||||||||||||||||||||
Net income |
— | — | — | |
|
|||||||||||||||||||||||
Dividends declared on common stock, $ |
— | — | — | ( |
) | ( |
) | — | ( |
) | ||||||||||||||||||
Contributions from non-controlling interests |
— | — | — | — | — | |||||||||||||||||||||||
Distributions to non-controlling interests |
— | — | — | — | — | ( |
) | ( |
) | |||||||||||||||||||
|
|
|
|
|
|
|
|
|
|
|
|
|
|
|||||||||||||||
Balance at December 31, 2019 |
$ | $ | $ | ( |
) | $ | ( |
) | $ | $ | $ | |||||||||||||||||
|
|
|
|
|
|
|
|
|
|
|
|
|
|
|||||||||||||||
Adoption of ASU 2016-13 |
— | — | — | ( |
) | ( |
) | ( |
) | ( |
) | |||||||||||||||||
Shares of class A common stock issued, net |
— | — | — | |||||||||||||||||||||||||
Restricted class A common stock earned |
— | — | — | — | ||||||||||||||||||||||||
Dividends reinvested |
— | — | ( |
) | — | |||||||||||||||||||||||
Deferred directors’ compensation |
— | — | — | — | ||||||||||||||||||||||||
Other comprehensive income |
— | — | — | — | ||||||||||||||||||||||||
Net income |
— | — | — | |||||||||||||||||||||||||
Dividends declared on common stock, $ |
— | — | — | ( |
) | ( |
) | — | ( |
) | ||||||||||||||||||
Contributions from non-controlling interests |
— | — | — | — | — | |||||||||||||||||||||||
Distributions to non-controlling interests |
— | — | — | — | — | ( |
) | ( |
) | |||||||||||||||||||
|
|
|
|
|
|
|
|
|
|
|
|
|
|
|||||||||||||||
Balance at December 31, 2020 |
$ | |
$ | |
$ | $ | ( |
) | $ | |
$ | $ | |
|||||||||||||||
|
|
|
|
|
|
|
|
|
|
|
|
|
|
Year Ended December 31, |
||||||||||||
2020 |
2019 |
2018 |
||||||||||
Cash flows from operating activities |
||||||||||||
Net income |
$ | $ | $ | |||||||||
Adjustments to reconcile net income to net cash provided by operating activities |
||||||||||||
Non-cash compensation expense |
||||||||||||
Satisfaction of management and incentive fees in stock |
— | — | ||||||||||
Amortization of deferred fees on loans and debt securities |
( |
) | ( |
) | ( |
) | ||||||
Amortization of deferred financing costs and premiums/ |
||||||||||||
Increase in current expected credit loss reserve |
— | — | ||||||||||
Unrealized (gain) loss on assets denominated in foreign currencies, net |
( |
) | ( |
) | ||||||||
Unrealized (gain) loss on derivative financial instruments, net |
( |
) | ( |
) | ||||||||
Realized loss (gain) on derivative financial instruments, net |
( |
) | ||||||||||
Changes in assets and liabilities, net |
||||||||||||
Other assets |
( |
) | ( |
) | ||||||||
Other liabilities |
( |
) | ( |
) | ||||||||
|
|
|
|
|
|
|||||||
Net cash provided by operating activities |
||||||||||||
|
|
|
|
|
|
|||||||
Cash flows from investing activities |
||||||||||||
Origination and fundings of loans receivable |
( |
) | ( |
) | ( |
) | ||||||
Principal collections and sales proceeds from loans receivable and debt securities |
||||||||||||
Loan contributed to securitization |
— | — | ||||||||||
Investment in debt securities held-to-maturity |
— | — | ( |
) | ||||||||
Origination and exit fees received on loans receivable |
||||||||||||
Receipts under derivative financial instruments |
||||||||||||
Payments under derivative financial instruments |
( |
) | ( |
) | ( |
) | ||||||
Collateral deposited under derivative agreements |
( |
) | ( |
) | ( |
) | ||||||
Return of collateral deposited under derivative agreements |
||||||||||||
|
|
|
|
|
|
|||||||
Net cash used in investing activities |
( |
) | ( |
) | ( |
) | ||||||
|
|
|
|
|
|
Year Ended December 31, |
||||||||||||
2020 |
2019 |
2018 |
||||||||||
Cash flows from financing activities |
||||||||||||
Borrowings under secured debt agreements |
$ | $ | $ | |||||||||
Repayments under secured debt agreements |
( |
) | ( |
) | ( |
) | ||||||
Proceeds from issuance of securitized debt obligations |
— | — | ||||||||||
Repayment of securitized debt obligations |
( |
) | ( |
) | — | |||||||
Borrowings under asset-specific debt agreements |
||||||||||||
Repayments under asset-specific debt agreements |
( |
) | — | ( |
) | |||||||
Proceeds from sale of loan participations |
— | |||||||||||
Repayment of loan participations |
— | ( |
) | ( |
) | |||||||
Net proceeds from issuance of secured term loan |
— | |||||||||||
Repayments of secured term loan |
( |
) | ( |
) | — | |||||||
Payment of deferred financing costs |
( |
) | ( |
) | ( |
) | ||||||
Contributions from non-controlling interests |
||||||||||||
Distributions to non-controlling interests |
( |
) | ( |
) | ( |
) | ||||||
Net proceeds from issuance of convertible notes |
— | — | ||||||||||
Repayment of convertible notes |
— | — | ( |
) | ||||||||
Net proceeds from issuance of class A common stock |
||||||||||||
Dividends paid on class A common stock |
( |
) | ( |
) | ( |
) | ||||||
|
|
|
|
|
|
|||||||
Net cash (used in) provided by financing activities |
( |
) | ||||||||||
|
|
|
|
|
|
|||||||
Net increase (decrease) in cash and cash equivalents |
( |
) | ||||||||||
Cash and cash equivalents at beginning of year |
||||||||||||
Effects of currency translation on cash and cash equivalents |
( |
) | ||||||||||
|
|
|
|
|
|
|||||||
Cash and cash equivalents at end of year |
$ | $ | $ | |||||||||
|
|
|
|
|
|
|||||||
Supplemental disclosure of cash flows information |
||||||||||||
Payments of interest |
$ | ( |
) | $ | ( |
) | $ | ( |
) | |||
|
|
|
|
|
|
|||||||
(Payments) receipts of income taxes |
$ | ( |
) | $ | $ | ( |
) | |||||
|
|
|
|
|
|
|||||||
Supplemental disclosure of non-cash investing and financing activities |
||||||||||||
Dividends declared, not paid |
$ | ( |
) | $ | ( |
) | $ | ( |
) | |||
|
|
|
|
|
|
|||||||
Satisfaction of management and incentive fees in stock |
$ | $ | — | $ | — | |||||||
|
|
|
|
|
|
|||||||
Loan principal payments held by servicer, net |
$ | $ | $ | |||||||||
|
|
|
|
|
|
• |
U.S. Loans |
• |
Non-U.S. Loans |
• |
Unique Loans |
• |
Impaired Loans |
differ materially from these estimates. We only expect to realize the impairment losses if and when such amounts are deemed nonrecoverable upon a realization event. This is generally at the time a loan is repaid, or in the case of foreclosure, when the underlying asset is sold, but non-recoverability may also be concluded if, in our determination, it is nearly certain that all amounts due will not be collected. |
Impact of ASU 2016-13 Adoption |
||||
Assets: |
||||
Loans |
||||
U.S. Loans |
$ | |||
Non-U.S. Loans |
||||
Unique Loans |
||||
|
|
|||
CECL reserve on loans |
$ | |||
|
|
|||
CECL reserve on held-to-maturity |
||||
Liabilities: |
||||
CECL reserve on unfunded loan commitments |
||||
|
|
|||
Total impact of ASU 2016-13 adoption on retained earnings |
$ | |||
|
|
1 – |
Very Low Risk |
2 – |
Low Risk |
3 – |
Medium Risk |
4 – |
High Risk/Potential for Loss: |
5 – |
Impaired/Loss Likely: |
• | Level 1: Generally includes only unadjusted quoted prices that are available in active markets for identical financial instruments as of the reporting date. |
• | Level 2: Pricing inputs include quoted prices in active markets for similar instruments, quoted prices in less active or inactive markets for identical or similar instruments where multiple price quotes can be obtained, and other observable inputs, such as interest rates, yield curves, credit risks, and default rates. |
• | Level 3: Pricing inputs are unobservable for the financial instruments and include situations where there is little, if any, market activity for the financial instrument. These inputs require significant judgment or estimation by management of third-parties when determining fair value and generally represent anything that does not meet the criteria of Levels 1 and 2. |
• | Cash and cash equivalents: The carrying amount of cash and cash equivalents approximates fair value. |
• | Loans receivable, net: The fair values of these loans were estimated by our Manager based on a discounted cash flow methodology, taking into consideration various factors including capitalization rates, discount rates, leasing, credit worthiness of major tenants, occupancy rates, availability and cost of financing, exit plan, loan sponsorship, actions of other lenders, and other factors deemed relevant by our Manager. |
• | Debt securities held-to-maturity: |
• | Derivative financial instruments: The fair value of our foreign currency and interest rate contracts was estimated using advice from a third-party derivative specialist, based on contractual cash flows and observable inputs comprising foreign currency rates and credit spreads. |
• | Secured debt agreements, net: The fair value of these instruments was estimated based on the rate at which a similar credit facility would currently be priced. |
• | Securitized debt obligations, net: The fair value of these instruments was estimated by utilizing third-party pricing service providers. In determining the value of a particular investment, pricing service providers may use broker-dealer quotations, reported trades, or valuation estimates from their internal pricing models to determine the reported price. |
• | Asset-specific debt agreements, net: The fair value of these instruments was estimated based on the rate at which a similar agreement would currently be priced. |
• | Secured term loans, net: The fair value of these instruments was estimated by utilizing third-party pricing service providers. In determining the value of a particular investment, pricing service providers may use broker-dealer quotations, reported trades, or valuation estimates from their internal pricing models to determine the reported price. |
• | Convertible notes, net: Each series of the convertible notes is actively traded and their fair values were obtained using quoted market prices. |
December 31, |
December 31, |
|||||||
Number of loans |
||||||||
Principal balance |
$ | |
$ | |
||||
Net book value |
$ | $ | ||||||
Unfunded loan commitments (1) |
$ | $ | ||||||
Weighted-average cash coupon (2) |
% | % | ||||||
Weighted-average all-in yield(2) |
% | % | ||||||
Weighted-average maximum maturity (years) (3) |
(1) | Unfunded commitments will primarily be funded to finance our borrowers’ construction or development of real estate-related assets, capital improvements of existing assets, or lease-related expenditures. These commitments will generally be funded over the term of each loan, subject in certain cases to an expiration date. |
(2) | The weighted-average cash coupon and all-in yield are expressed as a spread over the relevant floating benchmark rates, which include USD LIBOR, GBP LIBOR, EURIBOR, BBSY, and CDOR, as applicable to each loan. As of December 31, 2020, all-in yield includes the amortization of deferred origination and extension fees, loan origination costs, and purchase discounts, as well as the accrual of exit fees. Excludes loans accounted for under the cost-recovery method. |
(3) | Maximum maturity assumes all extension options are exercised by the borrower, however our loans may be repaid prior to such date. As of December 31, 2020, |
Principal Balance |
Deferred Fees / Other Items (1) |
Net Book Value |
||||||||||
Loans Receivable, as of December 31, 2018 |
$ | |
$ | ( |
) | $ | |
|||||
Loan fundings |
— | |||||||||||
Loan repayments and sales proceeds |
( |
) | — | ( |
) | |||||||
Unrealized gain (loss) on foreign currency translation |
( |
) | ||||||||||
Deferred fees and other items |
— | ( |
) | ( |
) | |||||||
Amortization of fees and other items |
— | |||||||||||
|
|
|
|
|
|
|||||||
Loans Receivable, as of December 31, 2019 |
$ | $ | ( |
) | $ | |||||||
|
|
|
|
|
|
|||||||
Loan fundings |
— | |||||||||||
Loan repayments and sales |
( |
) | — | ( |
) | |||||||
Unrealized gain (loss) on foreign currency translation |
( |
) | ||||||||||
Deferred fees and other items |
— | ( |
) | ( |
) | |||||||
Amortization of fees and other items |
— | |||||||||||
|
|
|
|
|
|
|||||||
Loans Receivable, as of December 31, 2020 |
$ | $ | ( |
) | $ | |||||||
|
|
|
|
|
|
|||||||
CECL reserve |
( |
) | ||||||||||
|
|
|||||||||||
Loans Receivable, net, as of December 31, 2020 |
$ | |||||||||||
|
|
(1) | Other items primarily consist of purchase and sale discounts or premiums, exit fees, and deferred origination expenses. |
December 31, 2020 |
||||||||||||||
Property Type |
Number of Loans |
Net Book Value |
Total Loan Exposure (1)(2) |
Percentage of Portfolio |
||||||||||
Office |
$ | $ | % | |||||||||||
Hospitality |
||||||||||||||
Multifamily |
||||||||||||||
Industrial |
||||||||||||||
Retail |
||||||||||||||
Self-Storage |
||||||||||||||
Condominium |
||||||||||||||
Other |
||||||||||||||
|
|
|
|
|
|
|
||||||||
Total loans receivable |
$ | |
$ | |
|
% | ||||||||
|
|
|
|
|
|
|
||||||||
CECL reserve |
( |
) | ||||||||||||
|
|
|||||||||||||
Loans receivable, net |
$ | |||||||||||||
|
|
|||||||||||||
Geographic Location |
Number of Loans |
Net Book Value |
Total Loan Exposure (1)(2) |
Percentage of Portfolio |
||||||||||
United States |
||||||||||||||
Northeast |
$ | $ | % | |||||||||||
West |
||||||||||||||
Southeast |
||||||||||||||
Midwest |
||||||||||||||
Southwest |
||||||||||||||
Northwest |
||||||||||||||
|
|
|
|
|
|
|
||||||||
Subtotal |
||||||||||||||
International |
||||||||||||||
United Kingdom |
||||||||||||||
Ireland |
||||||||||||||
Spain |
||||||||||||||
Australia |
||||||||||||||
Germany |
||||||||||||||
Italy |
||||||||||||||
Netherlands |
||||||||||||||
Belgium |
||||||||||||||
Canada |
||||||||||||||
France |
||||||||||||||
|
|
|
|
|
|
|
||||||||
Subtotal |
||||||||||||||
|
|
|
|
|
|
|
||||||||
Total loans receivable |
$ | $ | % | |||||||||||
|
|
|
|
|
|
|
||||||||
CECL reserve |
( |
) | ||||||||||||
|
|
|||||||||||||
Loans receivable, net |
$ | |||||||||||||
|
|
(1) | In certain instances, we finance our loans through the non-recourse sale of a senior loan interest that is not included in our consolidated financial statements. See Note 2 for further discussion. Total loan exposure encompasses the entire loan we originated and financed, including $non-consolidated senior interests as of December 31, 2020. |
|
(2) | Excludes investment exposure to the $ million 2018 Single Asset Securitization. See Note 4 for details of the subordinate position we own in the 2018 Single Asset Securitization. |
|
December 31, 2019 |
||||||||||||||
Property Type |
Number of Loans |
Net Book Value |
Total Loan Exposure (1)(2) |
Percentage of Portfolio |
||||||||||
Office |
$ | $ | % | |||||||||||
Hospitality |
|
|||||||||||||
Multifamily |
||||||||||||||
Industrial |
||||||||||||||
Retail |
||||||||||||||
Self-Storage |
||||||||||||||
Condominium |
||||||||||||||
Other |
||||||||||||||
|
|
|
|
|
|
|
||||||||
$ | |
$ | |
|
% | |||||||||
|
|
|
|
|
|
|
||||||||
Geographic Location |
Number of Loans |
Net Book Value |
Total Loan Exposure (1)(2) |
Percentage of Portfolio |
||||||||||
United States |
||||||||||||||
Northeast |
$ | $ | % | |||||||||||
West |
||||||||||||||
Southeast |
||||||||||||||
Midwest |
||||||||||||||
Southwest |
||||||||||||||
Northwest |
||||||||||||||
|
|
|
|
|
|
|
||||||||
Subtotal |
||||||||||||||
International |
||||||||||||||
United Kingdom |
||||||||||||||
Ireland |
||||||||||||||
Spain |
||||||||||||||
Australia |
||||||||||||||
Germany |
||||||||||||||
Italy |
||||||||||||||
Belgium |
||||||||||||||
Canada |
||||||||||||||
France |
||||||||||||||
|
|
|
|
|
|
|
||||||||
Subtotal |
||||||||||||||
|
|
|
|
|
|
|
||||||||
Total |
$ | $ | % | |||||||||||
|
|
|
|
|
|
|
(1) | In certain instances, we finance our loans through the non-recourse sale of a senior loan interest that is not included in our consolidated financial statements. See Note 2 for further discussion. Total loan exposure encompasses the entire loan we originated and financed, including $non-consolidated senior interests as of December 31, 2019. |
(2) | Excludes investment exposure to the $ million 2018 Single Asset Securitization. See Note 4 for details of the subordinate position we own in the 2018 Single Asset Securitization. |
December 31, 2020 |
|
December 31, 2019 |
| |||||||||||||||||||||
Risk Rating |
Number of Loans |
|
Net Book Value |
|
Total Loan Exposure (1)(2) |
|
Number of Loans |
|
Net Book Value |
|
Total Loan Exposure (1)(2) |
| ||||||||||||
1 |
|
|
$ |
|
$ |
|
|
|
$ |
|
$ |
| ||||||||||||
2 |
|
|
|
|
|
|
|
|
|
|
|
| ||||||||||||
3 |
|
|
|
|
|
|
|
|
|
|
|
| ||||||||||||
4 |
|
|
|
|
|
|
|
|
|
|
|
| ||||||||||||
5 |
|
|
|
|
|
|
|
— |
|
|
— |
|
|
— |
| |||||||||
|
|
|
|
|
|
|
|
|
|
|
|
|
|
|
|
|
| |||||||
Total loans receivable |
|
|
$ |
|
$ |
|
|
|
$ |
|
$ |
| ||||||||||||
|
|
|
|
|
|
|
|
|
|
|
|
|
|
|
|
|
| |||||||
CECL reserve |
|
|
|
( |
|
|
|
|
|
|
— |
|
|
| ||||||||||
|
|
|
|
|
|
|
|
|
|
|
|
|
| |||||||||||
Loans receivable, net |
|
|
$ |
|
|
|
|
|
$ |
|
|
| ||||||||||||
|
|
|
|
|
|
|
|
|
|
|
|
|
|
(1) | In certain instances, we finance our loans through the non-recourse sale of a senior loan interest that is not included in our consolidated financial statements. See Note 2 for further discussion. Total loan exposure encompasses the entire loan we originated and financed, including $non-consolidated senior interests as of December 31, 2020 and December 31, 2019, respectively. |
(2) | Excludes investment exposure to the 2018 Single Asset Securitization of $ |
U.S. Loans |
Non-U.S. Loans |
Unique Loans |
Impaired Loans |
Total |
||||||||||||||||
Loans Receivable, Net |
||||||||||||||||||||
CECL reserve as of December 31, 2019 |
$ | $ | $ | $ | $ | |||||||||||||||
Initial CECL reserve on January 1, 2020 |
||||||||||||||||||||
Increase in CECL reserve |
||||||||||||||||||||
|
|
|
|
|
|
|
|
|
|
|||||||||||
CECL reserve as of December 31, 2020 |
$ | |
$ | |
$ | |
$ | |
$ | |
||||||||||
|
|
|
|
|
|
|
|
|
|
Net Book Value of Loans Receivable by Year of Origination (1)(2) |
||||||||||||||||||||||||||||
As of December 31, 2020 |
||||||||||||||||||||||||||||
Risk Rating |
2020 |
2019 |
2018 |
2017 |
2016 |
Prior |
Total |
|||||||||||||||||||||
U.S. loans |
||||||||||||||||||||||||||||
1 |
$ | $ | $ | $ | $ | $ | — | $ | ||||||||||||||||||||
2 |
— | |||||||||||||||||||||||||||
3 |
||||||||||||||||||||||||||||
4 |
— | |||||||||||||||||||||||||||
5 |
— | — | — | — | — | — | — | |||||||||||||||||||||
|
|
|
|
|
|
|
|
|
|
|
|
|
|
|||||||||||||||
Total U.S. loans |
$ | $ | $ | $ | $ | $ | $ | |||||||||||||||||||||
|
|
|
|
|
|
|
|
|
|
|
|
|
|
|||||||||||||||
Non-U.S. loans |
||||||||||||||||||||||||||||
1 |
$ | — | $ | — | $ | $ | $ | — | $ | — | $ | |||||||||||||||||
2 |
— | — | — | — | — | — | ||||||||||||||||||||||
3 |
— | — | ||||||||||||||||||||||||||
4 |
— | — | — | — | — | |||||||||||||||||||||||
5 |
— | — | — | — | — | — | — | |||||||||||||||||||||
|
|
|
|
|
|
|
|
|
|
|
|
|
|
|||||||||||||||
Total Non-U.S. loans |
$ | $ | $ | $ | $ | $ | — | $ | ||||||||||||||||||||
|
|
|
|
|
|
|
|
|
|
|
|
|
|
|||||||||||||||
Unique loans |
||||||||||||||||||||||||||||
1 |
$ | — | $ | — | $ | — | $ | — | $ | — | $ | — | $ | — | ||||||||||||||
2 |
— | — | — | — | — | — | — | |||||||||||||||||||||
3 |
— | — | — | — | ||||||||||||||||||||||||
4 |
— | — | — | — | ||||||||||||||||||||||||
5 |
— | — | — | — | — | — | — | |||||||||||||||||||||
|
|
|
|
|
|
|
|
|
|
|
|
|
|
|||||||||||||||
Total unique loans |
$ | — | $ | $ | $ | — | $ | — | $ | $ | ||||||||||||||||||
|
|
|
|
|
|
|
|
|
|
|
|
|
|
|||||||||||||||
Impaired loans |
||||||||||||||||||||||||||||
1 |
$ | — | $ | — | $ | — | $ | — | $ | — | $ | — | $ | — | ||||||||||||||
2 |
— | — | — | — | — | — | — | |||||||||||||||||||||
3 |
— | — | — | — | — | — | — | |||||||||||||||||||||
4 |
— | — | — | — | — | — | — | |||||||||||||||||||||
5 |
— | — | — | — | ||||||||||||||||||||||||
|
|
|
|
|
|
|
|
|
|
|
|
|
|
|||||||||||||||
Total impaired loans |
$ | — | $ | — | $ | $ | — | $ | — | $ | $ | |||||||||||||||||
|
|
|
|
|
|
|
|
|
|
|
|
|
|
|||||||||||||||
Total loans receivable |
||||||||||||||||||||||||||||
1 |
$ | $ | $ | $ | $ | $ | — | $ | ||||||||||||||||||||
2 |
— | |||||||||||||||||||||||||||
3 |
||||||||||||||||||||||||||||
4 |
— | |||||||||||||||||||||||||||
5 |
— | — | — | — | ||||||||||||||||||||||||
|
|
|
|
|
|
|
|
|
|
|
|
|
|
|||||||||||||||
Total loans receivable |
$ | |
$ | |
$ | |
$ | |
$ | |
$ | |
$ | |
||||||||||||||
|
|
|
|
|
|
|
|
|
|
|
|
|
|
|||||||||||||||
CECL reserve |
( |
) | ||||||||||||||||||||||||||
|
|
|||||||||||||||||||||||||||
Loans receivable, net |
$ | |||||||||||||||||||||||||||
|
|
(1) | Date loan was originated or acquired by us. Origination dates are subsequently updated to reflect material loan modifications. |
(2) | Excludes the $ held-to-maturity |
December 31, 2020 |
December 31, 2019 |
|||||||
Debt securities held-to-maturity (1) |
$ |
$ |
||||||
CECL reserve |
( |
) | ||||||
|
|
|
|
|||||
Debt securities held-to-maturity, |
||||||||
Loan portfolio payments held by servicer (2) |
||||||||
Accrued interest receivable |
||||||||
Collateral deposited under derivative agreements |
||||||||
Prepaid expenses |
||||||||
Derivative assets |
||||||||
Prepaid taxes |
||||||||
Other |
||||||||
|
|
|
|
|||||
Total |
$ | $ | |
|||||
|
|
|
|
(1) | Represents the subordinate position we own in the 2018 Single Asset Securitization, which held aggregate loan assets of $ |
|
(2) | Represents loan principal and interest payments held by our third-party loan servicer as of the balance sheet date which were remitted to us during the subsequent remittance cycle. |
|
U.S. Loans |
Non-U.S. Loans |
Unique Loans |
Impaired Loans |
Total |
||||||||||||||||
Debt Securities Held-To-Maturity |
||||||||||||||||||||
CECL reserve as of December 31, 2019 |
$ | $ | $ | $ | $ | |||||||||||||||
Initial CECL reserve on January 1, 2020 |
||||||||||||||||||||
Increase in CECL reserve |
||||||||||||||||||||
|
|
|
|
|
|
|
|
|
|
|||||||||||
CECL reserve as of December 31, 2020 |
$ |
|
$ |
$ |
|
$ |
|
$ |
|
|||||||||||
|
|
|
|
|
|
|
|
|
|
December 31, 2020 |
December 31, 2019 |
|||||||
Accrued dividends payable |
$ | $ | ||||||
Derivative liabilities |
||||||||
Accrued interest payable |
||||||||
Accrued management and incentive fees payable |
||||||||
Current expected credit loss reserve for unfunded loan commitments (1) |
||||||||
Accounts payable and other liabilities |
||||||||
|
|
|
|
|||||
Total |
$ | |
$ | |
||||
|
|
|
|
(1) | Represents the CECL reserve related to our unfunded loan commitments. See Note 2 for further discussion of the CECL reserve. |
|
U.S. Loans |
Non-U.S. Loans |
Unique Loans |
Impaired Loans |
Total |
||||||||||||||||
Unfunded Loan Commitments |
||||||||||||||||||||
CECL reserve as of December 31, 2019 |
$ | $ | $ | $ | $ | |||||||||||||||
Initial CECL reserve on January 1, 2020 |
||||||||||||||||||||
Increase in CECL reserve |
||||||||||||||||||||
|
|
|
|
|
|
|
|
|
|
|||||||||||
CECL reserve as of December 31, 2020 |
$ |
|
$ |
|
$ |
|
$ |
$ |
|
|||||||||||
|
|
|
|
|
|
|
|
|
|
Secured Debt Agreements Borrowings Outstanding |
||||||||
December 31, 2020 |
December 31, 2019 |
|||||||
Secured credit facilities |
$ | |
$ | |
||||
Revolving credit agreement |
— | |||||||
|
|
|
|
|||||
Total secured debt agreements |
$ | $ | ||||||
|
|
|
|
|||||
Deferred financing costs (1) |
( |
) | ( |
) | ||||
|
|
|
|
|||||
Net book value of secured debt |
$ | $ | ||||||
|
|
|
|
(1) | Costs incurred in connection with our secured debt agreements are recorded on our consolidated balance sheet when incurred and recognized as a component of interest expense over the life of each related agreement. |
December 31, 2020 |
||||||||||||||||||||
Credit Facility Borrowings |
Collateral Assets (2) |
|||||||||||||||||||
Lender |
Potential (1) |
Outstanding |
Available (1) |
|||||||||||||||||
Deutsche Bank |
$ | $ | $ | $ | ||||||||||||||||
Barclays |
||||||||||||||||||||
Wells Fargo |
||||||||||||||||||||
Citibank |
||||||||||||||||||||
Goldman Sachs |
— | |||||||||||||||||||
Bank of America |
— | |||||||||||||||||||
JP Morgan |
||||||||||||||||||||
Morgan Stanley |
||||||||||||||||||||
MetLife |
— | |||||||||||||||||||
Santander |
— | |||||||||||||||||||
Société Générale |
— | |||||||||||||||||||
US Bank - Multi. JV(3) |
||||||||||||||||||||
Goldman Sachs - Multi. JV(3) |
— | |||||||||||||||||||
Bank of America - Multi. JV(3) |
— | |||||||||||||||||||
|
|
|
|
|
|
|
|
|||||||||||||
$ | |
$ | |
$ | |
$ | |
|||||||||||||
|
|
|
|
|
|
|
|
(1) | Potential borrowings represents the total amount we could draw under each facility based on collateral already approved and pledged. When undrawn, these amounts are immediately available to us at our sole discretion under the terms of each credit facility. |
(2) | Represents the principal balance of the collateral assets. |
(3) | These facilities finance the loan investments of our consolidated Multifamily Joint Venture. Refer to Note 2 for additional discussion of our Multifamily Joint Venture. |
December 31, 2019 |
||||||||||||||||||||
Credit Facility Borrowings |
Collateral Assets (2) |
|||||||||||||||||||
Lender |
Potential (1) |
Outstanding |
Available (1) |
|||||||||||||||||
Wells Fargo |
$ | $ | $ | $ | ||||||||||||||||
Deutsche Bank |
||||||||||||||||||||
Barclays |
||||||||||||||||||||
Citibank |
||||||||||||||||||||
Bank of America |
||||||||||||||||||||
Morgan Stanley |
||||||||||||||||||||
Goldman Sachs |
||||||||||||||||||||
MetLife |
— | |||||||||||||||||||
Société Générale |
— | |||||||||||||||||||
US Bank - Multi. JV(3) |
||||||||||||||||||||
JP Morgan |
||||||||||||||||||||
Santander |
— | |||||||||||||||||||
Goldman Sachs - Multi. JV(3) |
— | |||||||||||||||||||
Bank of America - Multi. JV(3) |
— | |||||||||||||||||||
|
|
|
|
|
|
|
|
|||||||||||||
$ | |
$ | |
$ | |
$ | |
|||||||||||||
|
|
|
|
|
|
|
|
(1) | Potential borrowings represents the total amount we could draw under each facility based on collateral already approved and pledged. When undrawn, these amounts are immediately available to us at our sole discretion under the terms of each credit facility. |
(2) | Represents the principal balance of the collateral assets. |
(3) | These facilities finance the loan investments of our consolidated Multifamily Joint Venture. Refer to Note 2 for additional discussion of our Multifamily Joint Venture. |
Lender |
Currency |
Guarantee (1) |
Margin Call (2) |
Term/Maturity | ||||||||
Deutsche Bank |
$ / € | % (4) |
(6) | |||||||||
Barclays |
$ / £ / € | % | (6) | |||||||||
Wells Fargo |
$ / C$ | % (5) |
(6) | |||||||||
Citibank |
$ / £ / € / A$ / C$ | % | (6) | |||||||||
Goldman Sachs |
$ / £ / € | % | (6) | |||||||||
Bank of America |
$ | % | (7) | |||||||||
JP Morgan |
$ / £ | % | (8) | |||||||||
Morgan Stanley |
$ / £ / € | % | (9) | |||||||||
MetLife |
$ | % | (10) | |||||||||
Santander |
€ | % | (6) | |||||||||
Société Générale |
$ / £ / € | % | (6) | |||||||||
US Bank - Multi. JV(3) |
$ | % | (6) | |||||||||
Goldman Sachs - Multi. JV(3) |
$ | % | (11) | |||||||||
Bank of America - Multi. JV(3) |
$ | % | (12) |
(1) | Other than amounts guaranteed based on specific collateral asset types, borrowings under our credit facilities are non-recourse to us. |
(2) | Margin call provisions under our credit facilities do not permit valuation adjustments based on capital markets events, and are limited to collateral-specific credit marks. These provisions have been temporarily suspended on certain of our facilities as described above. |
(3) | These facilities finance the loan investments of our consolidated Multifamily Joint Venture. Refer to Note 2 for additional discussion of our Multifamily Joint Venture. |
(4) | Specific borrowings outstanding of $ |
(5) | In addition to the |
(6) | These secured credit facilities have various availability periods during which new advances can be made and which are generally subject to each lender’s discretion. Maturity dates for advances outstanding are tied to the term of each respective collateral asset. |
(7) | Includes two one-year extension options which may be exercised at our sole discretion. |
(8) | Includes two one-year extension options which may be exercised at our sole discretion. |
(9) | Includes two one-year extension options which may be exercised at our sole discretion. |
(10) | Includes four one-year extension options which may be exercised at our sole discretion. |
(11) | Includes a one-year extension option which may be exercised at our sole discretion. |
(12) | Includes two one-year extension options which may be exercised at our sole discretion. |
Currency |
Potential Borrowings (1) |
Outstanding Borrowings |
Floating Rate Index (2) |
Spread |
Advance Rate (3) | |||||||||
$ | $ | $ | ||||||||||||
€ | € | € | EURIBOR | |||||||||||
£ | £ | £ | GBP LIBOR | |||||||||||
A$ | A$ | A$ | BBSY | |||||||||||
C$ | C$ | C$ | CDOR | |||||||||||
|
|
|
|
|
| |||||||||
$ | $ | |||||||||||||
|
|
|
|
|
|
(1) | Potential borrowings represents the total amount we could draw under each facility based on collateral already approved and pledged. When undrawn, these amounts are immediately available to us at our sole discretion under the terms of each credit facility. |
(2) | Floating rate indices are generally matched to the payment timing under the terms of each secured credit facility and its respective collateral assets. |
(3) | Represents weighted-average advance rate based on the approved outstanding principal balance of the collateral assets pledged. |
December 31, 2020 |
||||||||||||||||||||
Securitized Debt Obligations |
Count |
Principal Balance |
Book Value |
Wtd. Avg. Yield/Cost (1) |
Term (2) |
|||||||||||||||
2020 FL3 Collateralized Loan Obligation |
||||||||||||||||||||
Collateral assets |
$ | $ | L+ |
% | ||||||||||||||||
Financing provided |
L+ |
% | |
|||||||||||||||||
2020 FL2 Collateralized Loan Obligation |
||||||||||||||||||||
Collateral assets |
L+ |
% | ||||||||||||||||||
Financing provided |
L+ |
% | ||||||||||||||||||
2017 FL1 Collateralized Loan Obligation |
||||||||||||||||||||
Collateral assets |
L+ |
% | ||||||||||||||||||
Financing provided |
L+ |
% | ||||||||||||||||||
2017 Single Asset Securitization |
||||||||||||||||||||
Collateral assets (3) |
L+ |
% | ||||||||||||||||||
Financing provided |
L+ |
% | ||||||||||||||||||
Total |
||||||||||||||||||||
Collateral assets |
$ | $ | L+ |
% | ||||||||||||||||
|
|
|
|
|
|
|
|
|||||||||||||
Financing provided (4) |
$ |
$ |
L+ |
% | ||||||||||||||||
|
|
|
|
|
|
|
|
|||||||||||||
December 31, 2019 |
||||||||||||||||||||
Securitized Debt Obligations |
Count |
Principal Balance |
Book Value |
Wtd. Avg. Yield/Cost (1) |
Term (2) |
|||||||||||||||
2017 FL1 Collateralized Loan Obligation |
||||||||||||||||||||
Collateral assets |
$ | $ | L+ |
% | ||||||||||||||||
Financing provided |
L+ |
% | ||||||||||||||||||
2017 Single Asset Securitization |
||||||||||||||||||||
Collateral assets (3) |
L+ |
% | ||||||||||||||||||
Financing provided |
L+ |
% | ||||||||||||||||||
Total |
||||||||||||||||||||
Collateral assets |
$ | $ | L+ |
% | ||||||||||||||||
|
|
|
|
|
|
|
|
|||||||||||||
Financing provided (4) |
$ | |
$ | |
L+ |
% | ||||||||||||||
|
|
|
|
|
|
|
|
(1) |
In addition to cash coupon, all-in yield includes the amortization of deferred origination and extension fees, loan origination costs, purchase discounts, and accrual of exit fees. All-in yield for the total portfolio assumes applicable floating benchmark rates for weighted-average calculation. |
(2) |
Loan term represents weighted-average final maturity, assuming all extension options are exercised by the borrower. Repayments of securitized debt obligations are tied to timing of the related collateral loan asset repayments. The term of these obligations represents the rated final distribution date of the securitizations. |
(3) | The collateral assets for the 2017 Single Asset Securitization include the total loan amount, of which we securitized $ |
(4) | During the years ended December 31, 2020 and 2019, we recorded $ |
December 31, 2020 |
|||||||||||||||||||||||
Asset-Specific Debt Agreements |
Count |
Principal Balance |
Book Value |
Wtd. Avg. Yield/Cost (1) |
(2) |
Wtd. Avg. Term (3) |
|||||||||||||||||
Collateral assets |
$ | $ | L+ |
% | n/a | Oct. | |||||||||||||||||
Financing provided |
$ | $ | L+ |
% | $ |
Oct. | |||||||||||||||||
December 31, 2019 |
|||||||||||||||||||||||
Asset-Specific Debt Agreements |
Count |
Principal Balance |
Book Value |
Wtd. Avg. Yield/Cost (1) |
(2) |
Wtd. Avg. Term (3) |
|||||||||||||||||
Collateral assets |
$ |
$ |
L+ |
% | n/a | Mar. | |||||||||||||||||
Financing provided |
$ | |
$ | |
L+ |
% | $ |
Mar. |
(1) | These floating rate loans and related liabilities are indexed to the various benchmark rates relevant in each arrangement in terms of currency and payment frequency. Therefore the net exposure to each benchmark rate is in direct proportion to our net assets indexed to that rate. In addition to cash coupon, yield/cost includes the amortization of deferred origination fees / financing costs. |
(2) | Other than amounts guaranteed on an asset-by-asset non-recourse to us. |
(3) | The weighted-average term is determined based on the maximum maturity of the corresponding loans, assuming all extension options are exercised by the borrower. Each of our asset-specific debt agreements is term-matched to the corresponding collateral loans. |
Term Loans |
Face Value |
Interest (1) |
All-in Cost (1)(2) |
Maturity |
||||||||||||
2019 Term Loan |
$ |
% | % | |
||||||||||||
2020 Term Loan |
% | % | |
(1) | The 2020 Term Loan includes a LIBOR floor of |
(2) | Includes issue discount and transaction expenses that are amortized through interest expense over the life of the Secured Term Loans. |
December 31, 2020 |
December 31, 2019 |
|||||||
Face value |
$ | $ | ||||||
Unamortized discount |
( |
) | ( |
) | ||||
Deferred financing costs |
( |
) | ( |
) | ||||
Net book value |
$ |
$ |
||||||
Convertible Notes Issuance |
Face Value |
Interest Rate |
All-in Cost (1) |
Conversion Rate (2) |
Maturity | |||||||||||||
$ | % | % | ||||||||||||||||
$ | |
% | % |
(1) | Includes issuance costs that are amortized through interest expense over the life of the Convertible Notes using the effective interest method. |
(2) | Represents the shares of class A common stock per $ |
December 31, 2020 |
December 31, 2019 |
|||||||
Face value |
$ | $ | ||||||
Unamortized discount |
( |
) | ( |
) | ||||
Deferred financing costs |
( |
) | ( |
) | ||||
|
|
|
|
|||||
Net book value |
$ | |
$ | |
||||
|
|
|
|
Year Ended December 31, |
||||||||||||
2020 |
2019 |
2018 |
||||||||||
Cash coupon |
$ | |
$ | |
$ | |
||||||
Discount and issuance cost amortization |
||||||||||||
|
|
|
|
|
|
|||||||
Total interest expense |
$ | $ | $ | |||||||||
|
|
|
|
|
|
December 31, 2020 | ||||||||||||||
Interest Rate Derivatives |
Number of Instruments |
Notional Amount |
Strike |
Index |
Wtd.-Avg. Maturity (Years) | |||||||||
Interest Rate Caps |
C$ |
% |
CDOR |
|||||||||||
December 31, 2019 | ||||||||||||||
Interest Rate Derivatives |
Number of Instruments |
Notional Amount |
Strike |
Index |
Wtd.-Avg. Maturity (Years) | |||||||||
Interest Rate Swaps |
C$ |
% |
CDOR |
|||||||||||
Interest Rate Caps |
C$ |
% |
CDOR |
December 31, 2020 |
December 31, 2019 |
|||||||||||||||
Foreign Currency Derivatives |
Number of Instruments |
Notional Amount |
Foreign Currency Derivatives |
Number of Instruments |
Notional Amount |
|||||||||||
Buy USD / Sell EUR Forward |
€ |
Buy USD / Sell GBP Forward |
£ |
|||||||||||||
Buy USD / Sell GBP Forward |
£ |
Buy USD / Sell EUR Forward |
€ |
|||||||||||||
Buy USD / Sell AUD Forward |
A$ |
Buy USD / Sell AUD Forward |
A$ |
|||||||||||||
Buy USD / Sell CAD Forward |
C$ |
Buy USD / Sell CAD Forward |
C$ |
December 31, 2020 |
December 31, 2019 |
|||||||||||||||||
Non-designated Hedges |
Number of Instruments |
Notional Amount |
Non-designated Hedges |
Number of Instruments |
Notional Amount |
|||||||||||||
Buy EUR / Sell GBP Forward |
£ |
Buy CAD / Sell USD Forward |
C$ |
|||||||||||||||
Buy USD / Sell EUR Forward |
€ |
Buy USD / Sell CAD Forward |
C$ |
|||||||||||||||
Buy GBP / Sell EUR Forward |
€ |
|||||||||||||||||
Buy AUD / Sell USD Forward |
A$ |
|||||||||||||||||
Buy USD / Sell AUD Forward |
A$ |
Increase (Decrease) to Interest Income and Interest Expense Exchange Contracts |
||||||||||||||||
Foreign Exchange Contracts in Hedging Relationships |
Location of Income (Expense) Recognized |
Year Ended December 31, 2020 |
Year Ended December 31, 2019 |
Year Ended December 31, 2018 |
||||||||||||
Designated Hedges |
Interest Income | (1) |
$ | $ | — | $ | — | |||||||||
Non-Designated Hedges |
Interest Income | (1) |
( |
) | — | — | ||||||||||
Non-Designated Hedges |
Interest Expense | ( 2 ) |
( |
) | ||||||||||||
|
|
|
|
|
|
|||||||||||
Total |
$ | ( |
) | $ | |
$ | ||||||||||
|
|
|
|
|
|
(1) | Represents the forward points earned on our foreign currency forward contracts, which reflect the interest rate differentials between the applicable base rate for our foreign currency investments and USD LIBOR. These forward contracts effectively convert the rate exposure to USD LIBOR, resulting in additional interest income earned in U.S. dollar terms. |
(2) | Represents the spot rate movement in our non-designated hedges, which are marked-to-market |
Fair Value of Derivatives in an Asset Position (1) as of |
Fair Value of Derivatives in a Liability Position (2) as of |
|||||||||||||||
December 31, 2020 |
December 31, 2019 |
December 31, 2020 |
December 31, 2019 |
|||||||||||||
Derivatives designated as hedging instruments: |
||||||||||||||||
Foreign exchange contracts |
$ | $ | — | $ | $ | |||||||||||
Interest rate derivatives |
— | — | ||||||||||||||
|
|
|
|
|
|
|
|
|||||||||
Total |
$ | $ | $ | $ | ||||||||||||
|
|
|
|
|
|
|
|
|||||||||
Derivatives not designated as hedging instruments: |
||||||||||||||||
Foreign exchange contracts |
$ | — | $ | $ | $ | |||||||||||
Interest rate derivatives |
— | — | — | — | ||||||||||||
|
|
|
|
|
|
|
|
|||||||||
Total |
$ | — | $ | $ | $ | |||||||||||
|
|
|
|
|
|
|
|
|||||||||
Total Derivatives |
$ | $ | $ | $ | |
|||||||||||
|
|
|
|
|
|
|
|
(1) | Included in other assets in our consolidated balance sheets. |
(2) | Included in other liabilities in our consolidated balance sheets. |
Derivatives in Hedging Relationships |
Amount of (Loss) Gain Recognized in OCI on Derivatives |
Location of Gain (Loss) Reclassified from |
Amount of Loss Reclassified from Accumulated OCI into Income |
|||||||||||||||||||||||||
Year Ended December 31, |
Accumulated |
Year Ended December 31, |
||||||||||||||||||||||||||
2020 |
2019 |
2018 |
OCI into Income |
2020 |
2019 |
2018 |
||||||||||||||||||||||
Net Investment Hedges |
||||||||||||||||||||||||||||
Foreign exchange contracts (1) |
$ | ( |
) | $ | ( |
) | $ | Interest Expense | $ | — | $ | — | $ | — | ||||||||||||||
Cash Flow Hedges |
||||||||||||||||||||||||||||
Interest rate derivatives |
( |
) | ( |
) | ( |
) | Interest Expense | (2) |
||||||||||||||||||||
|
|
|
|
|
|
|
|
|
|
|
|
|||||||||||||||||
Total |
$ | ( |
) | $ | ( |
) | $ | $ | $ | $ | ||||||||||||||||||
|
|
|
|
|
|
|
|
|
|
|
|
(1) | During the year ended December 31, 2020, we paid net cash settlements of $ |
(2) | During the years ended December 31, 2020, December 31, 2019, and December 31, 2018, we recorded total interest and related expenses of $ |
Class A Common Stock Offerings |
||||||||||||
2020 (1) |
2019 (2) |
2018 (3) |
||||||||||
Shares issued |
||||||||||||
Gross share issue price (4) |
$ | $ | $ | |||||||||
Net share issue price (5) |
$ | $ | $ | |||||||||
Net proceeds (6) |
$ | $ | $ |
(1) | Includes |
|
(2) | Issuance includes at-the-market |
|
(3) | Issuance includes at-the-market |
|
(4) |
Represents the weighted-average gross price per share paid by the underwriters or sales agents, as applicable. |
(5) |
Represents the weighted-average net proceeds per share after underwriting or sales discounts and commissions, as applicable. |
(6) |
Net proceeds represent proceeds received from the underwriters less applicable transaction costs. Includes $ |
Year Ended December 31, |
||||||||||||
Common Stock Outstanding (1) |
2020 |
2019 |
2018 |
|||||||||
Beginning balance |
||||||||||||
Issuance of class A common stock (2) |
||||||||||||
Issuance of restricted class A common stock, net(3) |
||||||||||||
Issuance of deferred stock units |
||||||||||||
|
|
|
|
|
|
|||||||
Ending balance |
||||||||||||
|
|
|
|
|
|
(1) |
Includes |
|
(2) | Includes shares, |
| |
|
(3) |
Includes |
|
Year Ended December 31, |
||||||||||||
2020 |
2019 |
2018 |
||||||||||
Dividends declared per share of common stock |
$ | $ | $ | |||||||||
Percent taxable as ordinary dividends |
% | % | % | |||||||||
Percent taxable as capital gain dividends |
— | % | % | % | ||||||||
|
|
|
|
|
|
|||||||
% | % | % |
Year Ended December 31, |
||||||||||||
2020 |
2019 |
2018 |
||||||||||
Net income (1) |
$ | 137,670 | $ | $ | ||||||||
Weighted-average shares outstanding, basic and diluted |
||||||||||||
|
|
|
|
|
|
|||||||
Per share amount, basic and diluted |
$ | $ | $ | |||||||||
|
|
|
|
|
|
(1) | Represents net income attributable to Blackstone Mortgage Trust. |
Year Ended December 31, |
||||||||||||
2020 |
2019 |
2018 |
||||||||||
Professional services (1) |
$ | $ | $ | |||||||||
Operating and other costs (1) |
||||||||||||
|
|
|
|
|
|
|||||||
Subtotal |
||||||||||||
Non-cash compensation expenses |
||||||||||||
Restricted class A common stock earned |
||||||||||||
Director stock-based compensation |
||||||||||||
|
|
|
|
|
|
|||||||
Subtotal |
||||||||||||
|
|
|
|
|
|
|||||||
Total general and administrative expenses |
$ | |
$ | |
$ | |
||||||
|
|
|
|
|
|
(1) | During the years ended December 31, 2020, 2019, and 2018, we recognized an aggregate $ |
Restricted Class A Common Stock |
Weighted-Average Grant Date Fair Value Per Share |
|||||||
Balance as of December 31, 2018 |
$ | |||||||
Granted |
||||||||
Vested |
( |
) | ||||||
Forfeited |
( |
) | ||||||
|
|
|
|
|||||
Balance as of December 31, 2019 |
$ | |||||||
|
|
|
|
|||||
Granted |
||||||||
Vested |
( |
) | ||||||
Forfeited |
( |
) | ||||||
|
|
|
|
|||||
Balance as of December 31, 2020 |
|
$ | |
|||||
|
|
|
|
December 31, 2020 |
December 31, 2019 |
|||||||||||||||||||||||||||||||
Level 1 |
Level 2 |
Level 3 |
Total |
Level 1 |
Level 2 |
Level 3 |
Total |
|||||||||||||||||||||||||
Assets |
||||||||||||||||||||||||||||||||
Derivatives |
$ | — | $ | $ | — | $ | $ | — | $ | $ | — | $ | ||||||||||||||||||||
Liabilities |
||||||||||||||||||||||||||||||||
Derivatives |
$ | — | $ | $ | — | $ | $ | — | $ | $ | — | $ |
December 31, 2020 |
December 31, 2019 |
|||||||||||||||||||||||
Book Value |
Face Amount |
Fair Value |
Book Value |
Face Amount |
Fair Value |
|||||||||||||||||||
Financial assets |
||||||||||||||||||||||||
Cash and cash equivalents |
$ | $ | $ | $ | $ | $ | ||||||||||||||||||
Loans receivable, net |
||||||||||||||||||||||||
Debt securities held-to-maturity (1) |
||||||||||||||||||||||||
Financial liabilities |
||||||||||||||||||||||||
Secured debt agreements, net |
||||||||||||||||||||||||
Securitized debt obligations, net |
||||||||||||||||||||||||
Asset-specific debt agreements, net |
||||||||||||||||||||||||
Secured term loans, net |
||||||||||||||||||||||||
Convertible notes, net |
(1) | Included in other assets on our consolidated balance sheets. |
December 31, 2020 |
December 31, 2019 |
|||||||
Assets: |
||||||||
Loans receivable |
$ | $ | ||||||
Current expected credit loss reserve |
( |
) | — |
|||||
|
|
|
|
|||||
Loans receivable, net |
||||||||
Other assets |
||||||||
|
|
|
|
|||||
Total assets |
$ | |
$ | |
||||
|
|
|
|
|||||
Liabilities: |
||||||||
Securitized debt obligations, net |
$ | $ | ||||||
Other liabilities |
||||||||
|
|
|
|
|||||
Total liabilities |
$ | $ | ||||||
|
|
|
|
Payment Timing |
||||||||||||||||||||
Total Obligation |
Less Than 1 Year |
1 to 3 Years |
3 to 5 Years |
More Than 5 Years |
||||||||||||||||
Principal repayments under secured debt agreements (1) |
$ | |
$ | $ | $ | $ | ||||||||||||||
Principal repayments under asset-specific debt agreements (1) |
— | — | ||||||||||||||||||
Principal repayments of secured term loans (2) |
||||||||||||||||||||
Principal repayments of convertible notes (3) |
— | — | — | |||||||||||||||||
|
|
|
|
|
|
|
|
|
|
|||||||||||
Total (4) |
$ | $ | |
$ | |
$ | |
$ | |
|||||||||||
|
|
|
|
|
|
|
|
|
|
(1) | The allocation of repayments under our secured debt agreements and asset-specific debt agreements is based on the earlier of (i) the maturity date of each agreement, or (ii) the maximum maturity date of the collateral loans, assuming all extension options are exercised by the borrower. |
(2) | The Secured Term Loans are partially amortizing, with an amount equal to |
(3) | Reflects the outstanding principal balance of Convertible Notes, excluding any potential conversion premium. Refer to Note 9 for further details on our Convertible Notes. |
(4) | Total does not include $ non-consolidated securitized debt obligations, and $non-consolidated senior interests, as the satisfaction of these liabilities will not require cash outlays from us. |
March 31 |
June 30 |
September 30 |
December 31 |
|||||||||||||
2020 |
||||||||||||||||
Income from loans and other investments, net |
$ | |
$ | |
$ | |
$ | |
||||||||
Net (loss) income |
$ | ( |
) | $ | $ | $ | ||||||||||
Net (loss) income attributable to |
||||||||||||||||
Blackstone Mortgage Trust, Inc. |
$ | ( |
) | $ | $ | $ | ||||||||||
Net (loss) income per share of class A common stock: |
||||||||||||||||
Basic and diluted |
$ | ( |
) | $ | $ | $ | ||||||||||
2019 |
||||||||||||||||
Income from loans and other investments, net |
$ | $ | $ | $ | ||||||||||||
Net income |
$ | $ | $ | $ | ||||||||||||
Net income attributable to |
||||||||||||||||
Blackstone Mortgage Trust, Inc. |
$ | $ | $ | $ | ||||||||||||
Net income per share of class A common stock: |
||||||||||||||||
Basic and diluted |
$ | $ | $ | $ |
Type of Loan/Borrower |
Description / Location |
Interest Payment Rates (2) |
Maximum Maturity Date (3) |
Periodic Payment Terms (4)(5) |
Prior Liens (6) |
Face Amount of Loans |
Carrying Amount of Loans (5)(7) |
|||||||||||||||||||||
Senior Mortgage Loans (1) |
|
|||||||||||||||||||||||||||
Senior loans in excess of 3% of the carrying amount of total loans |
|
|||||||||||||||||||||||||||
Borrower A | Office / Ireland | $ | — | $ | $ | |||||||||||||||||||||||
Borrower B | Mixed-Use / Spain |
— | ||||||||||||||||||||||||||
Borrower C | Office / Northeast | — | ||||||||||||||||||||||||||
Borrower D | Office / Southeast | — | ||||||||||||||||||||||||||
Senior loans less than 3% of the carrying amount of total loans |
|
|||||||||||||||||||||||||||
Senior mortgage loans | Office / Diversified | — | ||||||||||||||||||||||||||
Fixed |
||||||||||||||||||||||||||||
Senior mortgage loans | Hospitality / Diversified | — | ||||||||||||||||||||||||||
Senior mortgage loans | Mixed-Use / Diversified |
— | ||||||||||||||||||||||||||
Senior mortgage loans | Multifamily / Diversified | — | ||||||||||||||||||||||||||
Senior mortgage loans | Industrial / Diversified | — | ||||||||||||||||||||||||||
Senior mortgage loans | Other / Diversified | — | ||||||||||||||||||||||||||
Fixed |
||||||||||||||||||||||||||||
|
|
|
|
|
|
|||||||||||||||||||||||
— | ||||||||||||||||||||||||||||
|
|
|
|
|
|
|||||||||||||||||||||||
Total senior mortgage loans |
|
$ | — | $ | $ | |||||||||||||||||||||||
|
|
|
|
|
|
Type of Loan/Borrower |
Description / Location |
Interest Payment Rates (2) |
Maximum Maturity Date (3) |
Periodic Payment Terms (4)(5) |
Prior Liens (6) |
Face Amount of Loans |
Carrying Amount of Loans (5)(7) |
|||||||||||||||||||||
Subordinate Loans (8) |
|
|||||||||||||||||||||||||||
Subordinate loans less than 3% of the carrying amount of total loans |
|
|||||||||||||||||||||||||||
Subordinate loans | Various / Diversified | |||||||||||||||||||||||||||
Fixed |
||||||||||||||||||||||||||||
|
|
|
|
|
|
|||||||||||||||||||||||
Total subordinate loans |
|
|||||||||||||||||||||||||||
|
|
|
|
|
|
|||||||||||||||||||||||
Total loans |
|
$ | $ | $ | ||||||||||||||||||||||||
|
|
|
|
|
|
|||||||||||||||||||||||
CECL reserve (9) |
( |
) | ||||||||||||||||||||||||||
|
|
|||||||||||||||||||||||||||
Total loans, net |
$ | |||||||||||||||||||||||||||
|
|
(1) | Includes senior mortgages and similar credit quality loans, including related contiguous subordinate loans, and pari passu participations in senior mortgage loans. |
(2) | The interest payment rates are expressed as a spread over the relevant floating benchmark rates, which include USD LIBOR, GBP LIBOR, EURIBOR, BBSY, and CDOR, as applicable to each loan. |
(3) | Maximum maturity date assumes all extension options are exercised. |
(4) | I/O = interest only, P/I = principal and interest. |
(5) | As of December 31, 2020, there were no loans with delinquent principal or interest. |
(6) | Represents only third party liens. |
(7) | The tax basis of the loans included above is $ |
(8) | Includes subordinate interests in mortgages and mezzanine loans. |
(9) | As of December 31, 2020, we had a total CECL reserve of $ COVID-19 pandemic on commercial real estate markets generally, as well as certain loans assessed for impairment in our portfolio. |
1. |
Reconciliation of Mortgage Loans on Real Estate: |
2020 |
2019 |
2018 |
||||||||||
Balance at January 1, |
$ | $ | $ | |||||||||
Additions during period: |
||||||||||||
Loan fundings |
||||||||||||
Amortization of fees and other items |
||||||||||||
Deductions during period: |
||||||||||||
Loan repayments and sales proceeds |
( |
) | ( |
) | ( |
) | ||||||
Loan contributed to securitization |
— | — | ( |
) | ||||||||
Unrealized gain (loss) on foreign currency translation |
( |
) | ||||||||||
Deferred fees and other items |
( |
) | ( |
) | ( |
) | ||||||
Balance at December 31, |
$ | $ | $ | |||||||||
CECL reserve |
( |
) | — | — | ||||||||
Net balance at December 31, |
$ | $ | $ | |||||||||