
UNITED STATES
SECURITIES AND EXCHANGE COMMISSION
Washington, D.C. 20549
FORM
ANNUAL REPORT PURSUANT TO SECTION 13 OR 15(d) OF THE SECURITIES EXCHANGE ACT OF 1934 |
For the fiscal year ended
Or
TRANSITION REPORT PURSUANT TO SECTION 13 OR 15(d) OF THE SECURITIES EXCHANGE ACT OF 1934 |
For the transition period from to
Commission file number:
(Exact Name of Registrant as Specified in Its Charter)
|
|
|||
(State or Other Jurisdiction of |
|
|
(I.R.S. Employer Identification No.) |
|
Incorporation or Organization) |
|
|
|
|
|
|
|
||
|
|
|
||
(Address of Principal Executive Offices, Including Zip Code) |
|
|||
|
( |
|
|
|
(Registrant's Telephone Number, Including Area Code) |
|
|||
Securities registered pursuant to Section 12(b) of the Act: |
|
|||
|
|
|
|
|
Title of each class |
Trading Symbol(s) |
Name of each exchange on which registered |
||
Securities registered pursuant to Section 12(g) of the Act: NONE |
|
|||
Indicate by check mark if the registrant is a well-known seasoned issuer, as defined in Rule 405 of the Securities Act. |
No ☐ |
Indicate by check mark if the registrant is not required to file reports pursuant to Section 13 or Section 15(d) of the Act. Yes ☐ |
Indicate by check mark whether the registrant: (1) has filed all reports required to be filed by Section 13 or 15(d) of the Securities Exchange Act of 1934 during the preceding 12 months (or for such shorter that the registrant was required to file such reports), and (2) has been subject to such filing requirements for the past 90 days.
Indicate by check mark whether the registrant has submitted electronically every Interactive Data File required to be submitted pursuant to Rule 405 of Regulation S-T (§ 232.405 of this chapter) during the preceding 12 months (or for such shorter period that the registrant was required to submit such files).
Indicate by check mark whether the registrant is a large accelerated filer, an accelerated filer, a non-accelerated filer, smaller reporting company, or an emerging growth company.
See the definitions of "large accelerated filer," "accelerated filer," "smaller reporting company," and "emerging growth company" in Rule 12b-2 of the Exchange Act.
☒ |
Accelerated Filer |
☐ |
|
Non-accelerated Filer |
☐ |
Smaller Reporting Company |
|
|
|
Emerging Growth Company |
If an emerging growth company, indicate by check mark if the registrant has elected not to use the extended transition period for complying with any new or revised financial accounting standards provided pursuant to Section 13(a) of the Exchange Act. ☐
Indicate by check mark whether the registrant has filed a report on and attestation to its management’s assessment of the effectiveness of its internal control over financial reporting under Section 404(b) of the Sarbanes-Oxley Act (15 U.S.C. 7262(b)) by the registered public accounting firm that prepared or issued its audit report.
If securities are registered pursuant to Section 12(b) of the Act, indicate by check mark whether the financial statements of the registrant included in the filing reflect the correction of an error to previously issued financial statements.
Indicate by check mark whether any of those error corrections are restatements that required a recovery analysis of incentive-based compensation received by any of the registrant’s executive officers during the relevant recovery period pursuant to § 240.10D-1(b).
Indicate by check mark whether the registrant is a shell company (as defined in Rule 12b-2 of the Act). Yes ☐ No
As of June 30, 2022, the last business day of the registrant's most recently completed second fiscal quarter, the aggregate market value of the voting and non-voting common stock held by nonaffiliates of the registrant was approximately $
Class |
Outstanding at February 23, 2023 |
Common Stock, $0.001 par value per share |
DOCUMENTS INCORPORATED BY REFERENCE
Portions of the registrant's definitive proxy statement to be delivered to stockholders in connection with the Annual Meeting of Stockholders to be held on May 10, 2023 are incorporated by reference into Part III of this Form 10-K. The 2022 Proxy Statement will be filed with the U.S. Securities and Exchange Commission within 120 days after the end of the fiscal year to which this report relates.
Audit Firm Id:
SP PLUS CORPORATION
TABLE OF CONTENTS
1
Forward-Looking Statements
The Business section and other parts of this Annual Report on Form 10-K ("Form 10-K") contain forward-looking statements, within the meaning of the Private Securities Litigation Reform Act of 1995, that involve risks and uncertainties. Many of the forward-looking statements are located in "Management's Discussion and Analysis of Financial Condition and Results of Operations." Forward-looking statements provide current expectations of future events based on certain assumptions and include any statement that does not directly relate to any historical or current fact. Forward-looking statements can also be identified by words such as "future," "anticipates," "believes," "estimates," "expects," "intends," "plans," "predicts," "will," "would," "could," "can," "may," and similar terms. Forward-looking statements are not guarantees of future performance and SP Plus Corporation’s actual results may differ significantly from the results discussed in the forward-looking statements. Factors that might cause such differences include, but are not limited to, those discussed in Part I, Item 1A. of this Form 10-K under the heading "Risk Factors," which are incorporated herein by reference. The term the "Company" as used herein refers collectively to SP Plus Corporation and its wholly owned subsidiaries, unless otherwise stated. The Company assumes no obligation to revise or update any forward-looking statements for any reason, except as required by law.
2
PART I
Item 1. Business
Our Company
SP Plus Corporation, a Delaware corporation, which operates through its subsidiaries (collectively referred to as “SP+”, "we", "us", or "our"), blends industry-leading technology and best-in-class operations to deliver mobility solutions that enable the efficient movement of people, vehicles and personal belongings. We are committed to elevating the consumer experience while meeting the objectives of our diverse client base in North America and Europe. We are a leading provider of technology-driven mobility solutions for aviation, commercial, hospitality and institutional clients.
Acquisitions
On October 11, 2022, we acquired K M P Associates Limited ("KMP"), a United Kingdom based software and technology provider serving aviation and commercial parking clients, primarily through its AeroParker technology, throughout the United States and Europe, for approximately $13.8 million and assumed KMP’s debt of $0.3 million. Immediately following the acquisition, the Company repaid all of the debt assumed. KMP had $0.9 million of cash and cash equivalents as of the acquisition date. KMP’s operations are included in the Aviation segment.
On November 10, 2022, we acquired certain assets of DiVRT, Inc. ("DIVRT"), a developer of innovative software and technology solutions that enables frictionless parking capabilities, for approximately $17.6 million. In addition, we may be required to pay the former owner of DIVRT up to $7.0 million in contingent consideration if certain targets related to the number of our locations using the DIVRT technology are met. Based on a probability weighting of potential payouts, the Company accrued $4.0 million in projected contingent consideration as of the acquisition date. We will continue to evaluate the potential payouts in the future and adjust the contingent consideration for any changes in the estimated fair value each reporting period. DIVRT’s operations are included in the Commercial segment.
Our Operations
Our experience in the industries we serve has allowed us to develop and standardize a rigorous system of processes and controls that enable us to deliver consistent, transparent, value-added and high-quality services that, primarily through our technology-driven mobility solutions, facilitate the efficient movement of people, vehicles and personal belongings. We serve a variety of industries and have industry vertical specific specialization. Our Commercial segment serves clients in commercial real estate, residential communities, hotels and resorts, healthcare facilities, municipalities and government facilities, retail operations, large event venues, colleges and universities. Our Aviation segment primarily serves clients in the aviation industry (i.e. airports, airlines, cruise lines, certain hospitality clients and certain commercial clients within Europe that utilize our AeroParker technology).
We typically enter into contractual relationships with property owners or managers as opposed to owning facilities. We primarily operate under two types of arrangements: management type contracts and lease type contracts. See Part I. Industry Operating Arrangements for further discussion.
Our revenue is derived from a broad and diverse group of clients, industry vertical markets and geographies. Our clients include some of North America's largest private and public owners, municipalities and governments, managers and developers of major office buildings, residential properties, commercial properties, shopping centers and other retail properties, healthcare facilities and medical centers, sports and special event complexes, hotels and resorts, airlines and cruise lines. In addition, through our recent acquisition of KMP, we now service many airports and other clients in Europe. No single client accounted for more than 6% of our revenue, net of reimbursed management type contract revenue, during the year ended December 31, 2022. Additionally, we have built a diverse geographic footprint that spans operations in 46 states, the District of Columbia and Puerto Rico, 4 Canadian provinces and multiple countries within Europe. Our strategy is focused on building scale and leadership positions in large, strategic markets in order to leverage the advantages of scale across a larger number of clients in a single market.
Both acquisitions discussed above enhance our position as a global provider of frictionless Platform-as-a-Service ("PaaS") and Software-as-a-Service ("SaaS") solutions that are independent of our legacy parking management and transportation related operations. Our acquisitions of KMP and DIRVT have been accounted for as business combinations, and the assets acquired and liabilities assumed were recorded at their estimated fair values as of the acquisition dates. The results of each acquisition’s operations are reflected in our Consolidated Financial Statements from the date of acquisition.
Services
As a professional service and technology solutions provider, we provide comprehensive, turn-key service and technology-enabled offering packages to our clients. Under a typical management type contract structure, we are responsible for providing and supervising all personnel necessary to facilitate daily operations, which may include porters, baggage handlers, valet attendants, managers, bookkeepers, cashiers and a variety of ground transportation services, maintenance, marketing, customer service, and accounting and revenue control functions.
In addition to the conventional management services described above, we also offer an expanded range of ground transportation services, baggage delivery and handling services, technology enabled solutions and other ancillary services as described below for each of our Segments:
Commercial
3
Aviation
Industry Overview
Overview
The parking management, ground transportation services and baggage service providers, as well as technology solution providers that serve those industries, are large and fragmented. A substantial number of companies in these industries offer parking management services, ground transportation services, technology solutions and baggage services as non-core operations, and companies in these industries are large national competitors or small and private companies that operate in limited markets and geographies. Additionally, technological advancements are having an impact on both consumer behavior and information technology in these industries. From time to time, smaller operators and technology solution providers find they lack the financial resources, economies of scale and/or management techniques required to compete for the business of increasingly sophisticated clients and the increasing demands of clients. We expect this trend to continue and will provide larger professional service and/or technology solutions providers with greater opportunities to expand their businesses and potentially acquire smaller operators and/or technology solutions providers. We also expect that new small operators and technology solutions providers will continue to enter the market as they have in the past.
Impact of the COVID-19 pandemic (“COVID-19”)
COVID-19 had significant impacts on our operations and results during the years ended December 31, 2021 and 2020. See Item 1A. Risk Factors for risks related to COVID-19, as well as other risks related to our business and the industry.
Industry Operating Arrangements
Professional service businesses and technology solution providers within the industry, including our Company, operate primarily under two general types of arrangements, which include:
Management Type Contracts
Under management type contracts, the professional services operator typically receives a fixed and/or variable monthly fee for providing services and may receive an incentive fee based on the achievement of certain performance objectives. Professional services operators also generally charge fees for various ancillary services such as accounting support services, equipment leasing and consulting. Primary responsibilities under a management type contract include hiring, training and staffing personnel, and providing revenue collection, accounting, record-keeping, insurance and marketing services. The client is usually responsible for operating expenses associated with the client's operations, such as taxes, license and permit fees, insurance costs, payroll and accounts receivable processing and wages of personnel assigned to the operation, although some management type contracts, typically referred to as "reverse" management type contracts, require the professional service operator to pay certain of these cost categories but provide for payment to the operator of a larger management fee. Under a management type contract, the client usually is responsible for non-routine maintenance and repairs and capital improvements of the operation facility or location, such as structural and significant mechanical repairs. Management type contracts are typically for a term of one to three years (although the contracts may be terminated early and may contain renewal clauses).
Lease Type Contracts
Under lease type contracts, the professional services operator generally pays to the client or property owner a fixed base rent or fee, percentage rent that is tied to the financial performance of the operation, or a combination of both. The professional services operator collects all revenue and is responsible for most operating
4
expenses, but typically is not responsible for major maintenance, capital expenditures or real estate taxes. In contrast to management type contracts, lease type contracts typically have longer terms, generally three to ten years, and often contain a renewal term and provide for a fixed payment to the client regardless of the facility's operating earnings. In addition, many of these lease type contracts may be canceled by the client for various reasons, including development of the real estate for other uses, and on as little as 30 days' notice without cause. Lease type contracts generally require larger capital investment by the professional services operator than do management type contracts and therefore tend to have longer contract periods.
General Business Trends
We believe that sophisticated clients recognize the potential for technology-driven mobility solutions, parking services, parking management, ground transportation services, baggage handling services and other ancillary services to be a profit generator and/or a service differentiator to their customers. By outsourcing these services, our clients are able to capture additional profit and improve customer experiences by leveraging unique technology, operational skills and controls that an experienced services and technology solutions provider can offer. Our ability to consistently deliver a uniformly high level of services to our clients, including the use of various technological solutions and enhancements, allows us to maximize the profit and/or customer experience for our clients and improves our ability to win contracts and retain existing clients.
Our Competitive Strengths
We believe we have the following key competitive strengths:
5
Our Growth Strategy
Building on these competitive strengths, we believe we are well positioned to execute on the following growth strategies:
Business Development
We place a specific focus on marketing and relationship efforts that pertain to those clients or prospective clients having a large regional, national or international presence. Accordingly, we assign dedicated executives to these existing or prospective clients to manage the overall relationship, as well as to reinforce existing account relationships and to develop new relationships, as well as to take any other action that may further our business development interests.
Competition
We face competition from large and numerous smaller operators and technology solution providers, offering an array of services and technology solutions, which may include developers, hotels and resorts, airports, airlines, cruise lines, national services companies and other institutions that may elect to internally manage their own professional service offerings. Additionally, technological factors that improve ride-sharing capabilities increase the use of parking aggregators and the use of third-party technology-driven mobility solutions can impact our parking and parking management business. Some of our present and potential competitors have or may be able to obtain greater financial and marketing resources than we have, which may negatively impact our ability to retain existing contracts and gain new contracts. We also face significant competition in our efforts to provide ancillary services such as shuttle bus services and on-street parking enforcement because of the number of large companies that specialize in these services.
6
We compete for management contract type clients based on a variety of factors, including fees charged for services and technology solutions, providing a comprehensive suite of technology-driven mobility solutions, ability to generate revenues and control expenses for clients, accurate and timely reporting of operational results, providing high quality customer service and experience, and the ability to anticipate and respond to industry and technology related changes. Factors that affect our ability to compete for lease contract type locations include the ability to make financial commitments, long-term financial stability and the ability to generate revenues and control expenses. Factors affecting our ability to compete for employees include wages, benefits and working conditions.
Support Operations
We maintain regional and city offices throughout the United States, Canada, Puerto Rico, the United Kingdom and India. These offices serve as the centralized locations through which we provide the employees to staff our professional services as well as the on-site and support management staff to oversee those operations. Our administrative staff is primarily based in those same offices and facilitate the efficient, accurate and timely production and delivery of client deliverables, such as monthly reporting and invoicing. Having these all-inclusive operations and administrative teams located in regional and city offices allows us to add new professional services for new and existing clients in a seamless and cost-efficient manner.
Our overall basic corporate functions in the areas of finance, human resources, risk management, legal, purchasing and procurement, general administration, strategy, and product and technology development are primarily based in our Chicago corporate office, as well as the Nashville support office. We also perform product and technology development at our subsidiary in India.
Employees
As of December 31, 2022, we employed approximately 19,000 individuals, including 12,400 full-time and 6,600 part-time employees. Approximately 29% of our employees are covered by collective bargaining agreements and represented by labor unions, which include various local operational employees. Various union locals represent local operational employees in the following cities: Akron (OH), Arlington, Baltimore, Birmingham, Boston, Buffalo, Burbank, Chicago, Cincinnati, Cleveland, Dallas, Denver, Detroit, Kansas City, Las Vegas, Los Angeles, Manchester (NH), Meadowlands, Miami, New York City, Newark, Oakland, Ontario (Canada), Orlando, Oxon Hill, Philadelphia, Pittsburgh, Portland, Richmond, San Diego, San Francisco, San Jose, San Juan (Puerto Rico), Santa Monica, Seattle, Washington, D.C. and Windsor Locks.
We are frequently engaged in collective bargaining negotiations with various union locals. No single collective bargaining agreement covers a material number of our employees. We believe that our employee relations are generally healthy, as evidenced by higher than average rate of tenure and rate of internal promotions.
Central to our ability to execute on our business strategy is the commitment of our employees to delivering excellence in execution of all aspects of our day-to-day operations. We strive to create an inclusive environment which promotes diversity across our organization and a safe and engaging work environment where our employees have the opportunity to succeed and grow. Through our comprehensive development programs and talent management systems, our employees refine their skills and are able to access continued training and career development opportunities. In addition to base salary, our compensation and benefits programs are structured to retain and motivate our employees.
The health and safety of our employees is of paramount importance. Because the safety is the responsibility of everyone, each employee is expected to take all safety and health polices seriously and help enforce these policies within the workplace.
Insurance
We purchase comprehensive liability insurance covering certain claims that occur in the operations that we lease or manage including coverage for general/garage liability, garage keepers legal liability, and auto liability. In addition, we purchase workers' compensation insurance for all eligible employees and umbrella/excess liability coverage. Under our various liability and workers' compensation insurance policies, we are obligated to pay directly or reimburse the insurance carrier for the deductible / retention amount for each loss covered by our general/garage liability, automobile liability, workers' compensation, and garage keepers legal liability policy. As a result, we are effectively self-insured for all claims up to the deductible / retention amount for each loss. We also purchase property insurance that provides coverage for loss or damage to our property and in some cases our clients' property, as well as business interruption coverage for lost operating income and certain associated expenses. Because of the size of the operations covered and our claims experience, we purchase insurance policies at prices that we believe represent a discount to the prices that would typically be charged to our clients on a stand-alone basis. The clients for whom we provide professional services pursuant to management type contracts have the option of purchasing their own liability insurance policies (provided that we are named as an additional insured party), but historically most of our clients have chosen to obtain insurance coverage by being named as additional insureds under our master liability insurance policies. Pursuant to our management type contracts, we charge those clients insurance-related costs.
We provide group health insurance with respect to eligible full-time employees (whether they work at leased facilities, managed facilities or in our support offices). We self-insure the cost of the medical claims for these participants up to a stop-loss limit. Pursuant to our management type contracts, we charge those clients insurance-related costs.
Regulation
Our business is subject to numerous federal, foreign, state and local laws and regulations. In some cases, foreign, municipal and state authorities directly regulate or impose extensive governmental restrictions concerning automobile capacity, pricing, structural integrity and certain prohibited practices. Additionally, many cities impose a tax or surcharge on parking services, which generally range from 10% to 50% of revenues collected. We collect and remit sales/parking taxes and file tax returns for ourselves and on behalf of our clients. We are affected by laws and regulations that may impose a direct assessment on us for failure to remit sales/parking taxes or to file tax returns for ourselves and on behalf of our clients.
Under various federal, foreign, state and local environmental laws, ordinances and regulations, a current or previous owner or operator of real property may be liable for the costs of removal or remediation of hazardous or toxic substances on, under or in such property. Such laws typically impose liability without regard to whether the owner or operator knew of, or was responsible for, the presence of such hazardous or toxic substances. In connection with the operation of parking facilities, we may be potentially liable for any such costs.
Several foreign, state and local laws have been passed in recent years that encourage car-pooling and the use of mass transit or impose certain restrictions on automobile usage. These types of laws have adversely affected our revenues and could continue to do so in the future. For example, New York City and Boston imposed restrictions in the wake of terrorist attacks, which included street closures, traffic flow restrictions and a requirement for passenger cars entering certain bridges and tunnels to have more than one occupant during the morning rush hour. It is possible that cities could enact new or additional measures such as higher tolls, increased taxes and vehicle occupancy requirements in certain circumstances, which could adversely impact us. We are also affected by zoning and use restrictions and other laws and regulations that are common to any business that deals with real estate.
In addition, we are subject to laws generally applicable to businesses, including, but not limited to federal, foreign, state and local regulations relating to wage and hour matters, including minimum wage per hour laws and regulations imposed, employee classification, mandatory healthcare benefits, unlawful workplace
7
discrimination, human rights laws and whistle blowing. Several cities in which we have operations either have adopted or are considering the adoption of so-called "living wage" ordinances, which could adversely impact our profitability by requiring companies that contract with local governmental authorities and other employers to increase wages to levels substantially above the federal minimum wage. In addition, we are subject to provisions of the Occupational Safety and Health Act of 1970, as amended ("OSHA"), and related regulations. Any actual or alleged failure to comply with any regulation applicable to our business or any whistle-blowing claim, even if without merit, could result in costly litigation, regulatory action or otherwise harm our business, financial condition and results of operations.
In connection with ground transportation services and certain airline and cruise line transportation, baggage services and remote airline check-in services provided to our clients, the U.S. Department of Transportation, including the Transportation Security Administration (the "TSA"), the Federal Aviation Administration (the "FAA") and Department of Homeland Security, and various federal and state agencies, exercise broad powers over these certain transportation services, including shuttle bus operations, baggage delivery services, remote airline check-in, licensing and authorizations, safety, training and insurance requirements. Our employees must also comply with the various safety and fitness regulations promulgated by the U.S. Department of Transportation and other federal agencies, including those related to minimum training hours and requirements, drug and alcohol testing and service hours. We may become subject to new and more restrictive federal and state regulations. Compliance with such regulations may increase our operating costs.
Regulations by the FAA may affect our business. The FAA generally prohibits parking within 300 feet of airport terminals during times of heightened alert. The 300 feet rule and new regulations may prevent us from using a number of existing spaces during heightened security alerts at airports. Reductions in the number of parking spaces may reduce our operating income and cash flow.
Various other governmental regulations affect our operation of property or facilities, both directly and indirectly, including the Americans with Disabilities Act (the "ADA"). Under the ADA, all public accommodations, including parking facilities, are required to meet certain federal requirements related to access and use by disabled persons. For example, the ADA requires parking facilities to include handicapped spaces, headroom for wheelchair vans, attendants' booths that accommodate wheelchairs and elevators that are operable by disabled persons. When negotiating contracts with clients, we generally require that the property owner contractually assume responsibility for any ADA liability in connection with the property or facility. There can be no assurance, however, that the property owner has assumed such liability for any given property or that we would not be held liable despite assumption of responsibility for such liability by the property owner. We believe that the parking facilities we operate are in substantial compliance with ADA requirements.
We are also subject to consumer credit laws and credit card industry rules and regulations relating to the processing of credit card transactions, including the Fair and Accurate Credit Transactions Act and the Payment Card Data Security Standard. These laws and industry standards impose substantial financial penalties for non-compliance.
Intellectual Property
SP Plus®, SP+® and the SP+ logo, SP+ GAMEDAY®, Sphere TM, Sphere Technology by SP+TM, Parking.comTM and the Parking.com logoTM, AeroParker®, MetroParkerTM, KMP DigitataTM, Innovation In Operation®, Standard Parking® and the Standard Parking logo, Central Parking System®, Central Parking Corporation®, USA Parking®, the Bags logo, and Making Every Moment Matter for a World on the GoTM, are some of the important trademarks and service marks utilized in our business. Where appropriate, we have also sought protection for the names and logos of our material subsidiaries and divisions with the United States Patent and Trademark Office or the equivalent state registry. We invented the Multi-Level Vehicle Parking Facility Musical Theme Floor Reminder System. We have also registered the copyright in our proprietary software, such as Client View©, Hand Held Program©, License Plate Inventory Programs© and ParkStat© with the United States Copyright Office. We also own the URLs parking.com, spplus.com, and maketraveleasier.com. We deem our registered service marks to be important, but not critical, to our business and marketing efforts.
Corporate Information
Our Annual Report on Form 10-K, quarterly reports on Form 10-Q, current reports on Form 8-K and amendments to those reports filed or furnished pursuant to Section 13(a) or 15(d) of the Securities Exchange Act of 1934 (the “Exchange Act”) are available free of charge at www.spplus.com as soon as reasonably practicable after we file such material with, or furnish it to, the Securities and Exchange Commission ("SEC"). We provide references to our website for convenience, but our website is not incorporated into this or any of our other filings with the SEC.
Item 1A. Risk Factors
The following discussion of risk factors contains forward-looking statements. These risk factors may be important to understanding any statement in this Form 10-K or elsewhere. The following information should be read in conjunction with Part II, Item 7. "Management's Discussion and Analysis of Financial Condition and Results of Operations" and the Consolidated Financial Statements and related notes in Part IV, Item 15. "Exhibits and Financial Statement Schedules" of this Form 10-K.
The business, financial condition and operating results of the Company can be affected by a number of factors, whether currently known or unknown, including but not limited to those described below. Any one or more of such factors could directly or indirectly cause the Company's actual results of operations and financial condition to vary materially from past or anticipated future results of operations and financial condition. Any of these factors, in whole or in part, could materially and adversely affect the Company's business, financial condition, results of operations and stock price.
Because of the following factors, as well as other factors affecting the Company's financial condition and operating results, past financial performance should not be considered to be a reliable indicator of future performance, and investors should not use historical trends to anticipate results or trends in future periods.
Risks related to our business and industry
We are subject to intense competition that could constrain our ability to gain business and adversely impact our profitability.
Competition is intense in the parking facility management, valet, ground transportation service, event management and baggage delivery businesses including other ancillary services that we offer. Providers of similar services have traditionally competed on the basis of cost and quality of service. As we have worked to establish ourselves as a leader in the industries in which we operate, we compete predominately on the basis of high levels of service and strong relationships. We may not be able to, or may choose not to compete with certain competitors on the basis of price. As a result, a greater proportion of our clients may switch to other service providers or elect to self-manage the services we provide.
The low cost of entry into these businesses has led to strongly competitive, fragmented markets consisting of various sized entities, ranging from small local or single operators to large regional and national businesses and multi-facility operators, as well as governmental entities and companies that can perform for themselves one or more of the services we provide. Regional and local-owned and operated companies may have additional insights into local or smaller markets and significantly lower labor and overhead costs, providing them with a competitive advantage in those regards. Competitors may also be able to adapt more quickly to changes in customer requirements, devote greater resources to the promotion and sale of their services or develop technology that is as or more successful than our technology.
8
We provide nearly all of our services under contracts, many of which are obtained through competitive bidding, and many of our contracts require that our clients pay certain costs at specified rates. Our management type contracts are typically for a term of one to three years, although the contracts may be terminated by the client, without cause, on 30-days' notice or less, giving clients regular opportunities to attempt to negotiate a reduction in fees or other allocated costs. Any loss of a significant number of clients could, in the aggregate, materially adversely affect our operating results. We may experience higher operating costs related to changes in laws and regulations regarding employee benefits, employee minimum wage, and other entitlements promulgated by federal, state and local governments or as a result of increased local wages necessary to attract employees due to changes in the unemployment rate. If actual costs exceed the rates specified in the contacts or we are unable to renegotiate our specified rates in our contracts, our profitability may be negatively affected. Furthermore, these strong competitive pressures could impede our success in bidding for profitable business and our ability to maintain or increase prices even as costs rise, thereby reducing margins.
Changing consumer preferences and legislation affecting our industry or related industries may lead to a decline in parking demand, which could have a material adverse impact on our business, financial condition and results of operations.
While we devote considerable effort and resources to analyzing and responding to consumer preference and changes in the markets in which we operate, consumer preferences cannot be predicted with certainty and can change rapidly. Changes in consumer behaviors, including the use of mobile phone applications and on-line parking reservation services that help drivers reserve parking with garage, lots and individual owner spaces, cannot be predicted with certainty and could change current customers' parking preferences, which may have an impact on the price customers are willing to pay for our services. In addition, demand for ride share services, such as Uber and Lyft, and car sharing services, like Zipcar, along with the potential for driverless cars, may lead to a decline in parking demand in cities and urban areas. Additionally, urban congestion and congestion pricing due to state and local laws that have been or may be passed encouraging carpooling and use of mass transit systems or the aforementioned ride sharing services, may negatively impact parking demand and pricing that a customer would be willing to pay for our services. If we are unable to anticipate and respond to trends in the consumer marketplace and the industry, including, but not limited to, market displacement by livery service companies, car sharing companies and changing technologies, we could experience a material and adverse impact on our business, financial condition and results of operations. In addition, several state and local laws have been passed in recent years that encourage the use of carpooling and mass transit. In the future, local, state and federal environmental regulatory authorities may pursue or continue to pursue, measures related to climate change and greenhouse gas emissions which may have the effect of decreasing the number of cars being driven. Such laws or regulations could adversely impact the demand for our services and our business.
Our business success depends on our ability to preserve client relationships.
We primarily provide services pursuant to agreements that are cancelable by either party upon 30-days’ notice. As we generally incur initial costs on new contracts, our business associated with long-term client relationships is generally more profitable than short-term client relationships. Managing our existing client relationships, including those client relationships acquired as part of a business acquisition, is an important factor in contributing to our business success. If we lose a significant number of existing clients, or fail to win new clients, our profitability could be negatively impacted, even if we gain equivalent revenues from new clients or through client relationships acquired by acquisitions.
We may have difficulty obtaining, maintaining or renewing coverage for certain insurable risks or coverage for certain insurable risks at a reasonable cost to us or at all.
We use a combination of insured and self-insured programs to cover workers' compensation, general/garage liability, automobile liability, property damage, healthcare and other insurable risks, and we provide liability and workers' compensation insurance coverage, consistent with our obligations to our clients under our various contracts. We are responsible for claims in excess of our insurance policies' limits, and, while we endeavor to purchase insurance coverage that is appropriate to our assessment of risk, we are unable to predict with certainty the frequency, nature or magnitude of claims or direct or consequential damages. If our insurance proves to be inadequate or unavailable, our business may be negatively affected.
Recent consolidation within the insurance industry could impact our ability to obtain or renew policies at competitive rates. Should we be unable to obtain or renew our excess, umbrella, or other commercial insurance policies at competitive rates, it could have a material adverse impact on our business, as would the occurrence of catastrophic uninsured claims or the inability or refusal of our insurance carriers to pay otherwise insured claims.
We are subject to volatility associated with our high deductible and high retention insurance programs, including the possibility that changes in estimates of ultimate insurance losses could result in material charges against our operating results.
We are obligated to reimburse our insurance carriers for, or pay directly, each loss incurred up to the amount of a specified deductible or self-insured retention amount. We also purchase property insurance that provides coverage for loss or damage to our property and, in some cases, our clients' property, as well as business interruption coverage for lost operating income and certain associated expenses. The deductible or retention applicable to any given loss under the property insurance policies varies based upon the insured values and the peril that causes the loss. Our financial statements reflect our funding of all such obligations based upon guidance and evaluation received from third-party insurance professionals. However, our actual obligations at any particular time may exceed the amount presently funded or accrued, in which case we would need to set aside additional funds to reserve for any such excess.
The determination of required insurance reserves is dependent upon significant actuarial judgments. We use the results of actuarial studies to estimate insurance rates and reserves for future periods and adjust reserves as appropriate for the current year and prior years. Changes in insurance reserves as a result of periodic evaluations of the liabilities can cause swings in operating results that may not be indicative of the performance of our ongoing business. Actual experience related to our insurance reserves can cause us to change our estimates for reserves, and any such changes may materially impact our results of operations, causing volatility in our operating results. Additionally, our obligations could increase if we receive a greater number of insurance claims, or if the severity of, or the administrative costs associated with, those claims generally increases.
Further, to the extent that we self-insure our losses, deterioration in our loss control and/or our continuing claim management efforts could increase the overall costs of claims within our retained limits. A material change in our insurance costs due to changes in the frequency of claims, the severity of claims, the costs of excess/umbrella premiums, regulatory changes, or consolidation within the insurance industry could have a material adverse effect on our financial position, results of operations or cash flows.
Because of the size of the operations covered and our claims experience, we purchase insurance policies at prices that we believe represent a discount to the prices that would typically be charged to clients on a stand-alone basis. The clients for whom we provide professional services pursuant to management type contracts have the option of purchasing their own liability insurance policies (provided that we are named as an additional insured party). Historically, most of our clients have chosen to obtain insurance coverage by being named as additional insureds under our master liability insurance policies. Pursuant to our management type contracts, we charge those clients an allocated portion of our insurance-related costs. Our inability to purchase such policies at competitive rates or charge clients for such insurance-related costs, could have a material adverse effect on our financial position, results of operations or cash flows.
9
We do not maintain insurance coverage for all possible risks.
We maintain a comprehensive portfolio of insurance policies to help protect us against loss or damage incurred from a wide variety of insurable risks. Each year, we review with our third party insurance advisers whether the insurance policies and associated coverages that we maintain are sufficient to adequately protect us from the various types of risk to which we are exposed in the ordinary course of business. That analysis takes into account various pertinent factors such as the likelihood that we would incur a material loss from any given risk, as well as the cost of obtaining insurance coverage against any such risk. We are responsible for claims in excess of our insurance policies' limits, and, while we endeavor to purchase insurance coverage that is appropriate to our assessment of risk, we are unable to predict with certainty the frequency, nature or magnitude of claims or direct or consequential damages, including, in particular, due to unforeseen events, such as natural disasters, severe weather conditions, pandemic outbreaks and acts of terrorism and other geopolitical events. In addition, we may sustain material losses resulting from an event or occurrence where our insurance coverage is believed to be sufficient, but such coverage is either inadequate or we cannot access the coverage. Furthermore, our business interruption insurance, may not provide sufficient coverage, if any, for losses we incur in connection with these events, in addition to other specified exclusions. These scenarios may result in a material adverse impact on our results of operations.
Risks relating to our acquisition strategy may adversely impact our results of operations.
In the past, a significant portion of our growth has been generated by acquisitions. Any acquisition we make may not provide us with any of the benefits that we anticipated or anticipate when entering into such transaction, particularly acquisitions in adjacent professional services. The process of integrating an acquired business may create unforeseen difficulties and expenses. The areas in which we may face risks in connection with any potential acquisition of a business include, but are not limited to:
We are increasingly dependent on information technology, and potential disruption, cyber-attacks, cyber-terrorism and security breaches to our technology, or our third-party providers and clients, or the compromise of our data, present risks that could harm our business.
We are increasingly dependent on automated information technology systems to manage and support a variety of business processes and activities. In addition, a portion of our business operations is conducted electronically, increasing the risk of attack or interception that could cause loss or misuse of data, system failures, disruption of operations, unauthorized malware, computer or system viruses, or the compromise of data, such as theft of intellectual property or inappropriate disclosure of confidential, proprietary or personal information.
Furthermore, while we continue to devote resources to monitoring and updating our systems and implementing information security measures to protect our systems, the controls and procedures that we have in place may not be sufficient to protect us from security breaches. Improper activities by third parties, exploitation of encryption technology, new data-hacking tools and discoveries and other events or developments may result in a future compromise or breach of our networks, payment card terminals or other payment systems. In particular, the techniques used by criminals to obtain unauthorized access to sensitive data change frequently and often are not recognized until they have been deployed against a target. Accordingly, we may be unable to anticipate these techniques or implement adequate preventative measures.
Additionally, our systems could be subject to damage or interruption from system conversions, power outages, computer or telecommunications failures, computer viruses and malicious attack, security breaches and catastrophic events. If our systems are damaged or fail to function properly, we may incur substantial repair and/or replacement costs, experience data loss or theft and impediments to our ability to manage customer transactions, which could adversely affect our operations and our results of operations. The occurrence of acts of cyber terrorism, such as website defacement, denial of automated payment services, sabotage of our proprietary on-demand technology or the use of electronic social media to disseminate unfounded or otherwise harmful allegations to our reputation, could have a material adverse effect on our business. Any disruptions to our information technology systems, breaches or compromise of data and/or misappropriation of information could result in lost sales, negative publicity, litigation, violation of privacy laws, business interruptions or damage to our reputation that, in turn, could negatively impact our financial condition and results of operations. Our insurance coverage may be insufficient to cover all losses potentially incurred and would not remedy any damage to our reputation.
We do not have control over security measures taken by third-party vendors hired by our clients to prevent unauthorized access to electronic and other confidential information. There can be no assurance third-party vendors will not suffer an attack in the future in which unauthorized parties gain access to personal financial information of individuals associated with our company, our clients or our client's customers, and any such incident may not be discovered and remedied in a timely manner, or at all.
Our risk management and safety programs may not have the intended effect of allowing us to reduce our insurance costs.
We attempt to mitigate our business and operating risks through the implementation of Company-wide safety and loss control programs designed to decrease the incidence of accidents or events that might increase our exposure or liability. However, our insurance coverage may not be adequate, despite our implementation of Company-wide safety and loss control efforts, or may be inaccessible in certain instances, either of which would result in additional costs to us and may adversely impact our results of operations.
10
Our management type contracts and lease type contracts expose us to certain risks.
The loss or renewal on less favorable terms of a substantial number of management type contracts or lease type contracts could have a material adverse effect on our business, financial condition and results of operations. A material reduction in the operating income associated with the integrated services we provide under management type contracts and lease type contracts could have a material adverse effect on our business, financial condition and results of operations. Our management type contracts are typically for a term of one to three years, although the contracts may be terminated, without cause, on 30-days' notice or less, giving clients regular opportunities to attempt to negotiate a reduction in fees or other allocated costs. Any loss of a significant number of clients could in the aggregate materially adversely affect our operating results.
We are particularly exposed to increases in costs for locations that we operate under lease type contracts because we are generally responsible for all the operating expenses of our leased locations. Typically, during the first and fourth quarters of each year, seasonality generally impacts our performance with regard to moderating revenues, with the reduced levels of travel most clearly reflected in the parking activity associated with our aviation and hotel businesses as well as increases in certain costs of parking services, such as snow removal, all of which can negatively affect operating income.
Deterioration in economic conditions in general could reduce the demand for our services and, as a result, reduce our earnings and adversely affect our financial condition.
Adverse changes in global, national and local economic conditions could have a negative impact on our business. Adverse economic conditions, including inflation and rising interest rates, may result in client's customers reducing their discretionary spending, which includes travel and leisure spending. Because a portion of our revenue is tied to the volume of airline passengers, hotel guests, retail shoppers and sporting event attendees, our business could be adversely impacted by the curtailment of business travel, personal travel or discretionary spending caused by unfavorable changes in economic conditions and/or consumer confidence. Adverse changes in local, regional, national and international economic conditions could depress prices for our services or cause clients to cancel agreements for the services we provide to our clients and their customers.
In addition, our business operations tend to be concentrated in large urban areas. Many of our customers are workers who commute by car to their places of employment in these urban areas or who use services in the travel, leisure and hospitality industry. Our business could be materially adversely affected to the extent that weak economic conditions or demographic factors could result in the elimination of jobs and high unemployment in the large urban areas where our business operations are concentrated. In addition, increased unemployment levels, increased office vacancies in urban areas, movement toward home office or “work from home” alternatives or lower consumer spending could reduce demand for our services.
COVID-19 has had, and a further resurgence could have a negative effect on the global economy and the global financial markets, which has had and could in the future have an adverse effect on our business, financial condition and results of operations.
If COVID-19 or general economic weakness causes deterioration for the travel, leisure and hospitality industry or the other industries to which we provide services, we may not be able to expand the geographies in which we provide our services or acquire businesses that may enable us to expand or otherwise execute our strategic growth plan. COVID-19 has caused, and could in the future cause us to incur additional expenses in light of the public health implications posed by COVID-19, including additional or accelerated investments in technology solutions which may be mandated by local, state, federal, foreign or other governmental authorities or by recommendations from the Centers for Disease Control and Prevention. The full impact of COVID-19 on our business and the industries in which we operate, as well as the effect on local, regional and global economic conditions, is highly uncertain, and a future resurgence of COVID-19, or the existence of any future pandemic, could precipitate or magnify the other risks described below in this Item 1A “Risk Factors."
Labor disputes could lead to loss of revenues or expense variations.
When one or more of our major collective bargaining agreements becomes subject to renegotiation or we face union organizing drives, we may disagree with the union on important issues that, in turn, could lead to a strike, work slowdown or other job actions. We may not be able to renew existing labor union contracts on acceptable terms, particularly during times of economic distress, and, in such cases, we may not be able to staff sufficient employees for our short-term needs. A strike, work slowdown or other job action could in some cases disrupt our ability to provide services, resulting in reduced revenues. If declines in client service occur or if our clients are targeted for sympathy strikes by other unionized workers, contract cancellations could result. Negotiating a first time agreement or renegotiating an existing collective bargaining agreement could result in a substantial increase in labor and benefits expenses that we may be unable to pass through to clients. In addition, potential legislation could make it significantly easier for union organizing drives to be successful and could give third-party arbitrators the ability to impose terms of collective bargaining agreements upon us and a labor union if we are unable to agree with such union on the terms of a collective bargaining agreement. At December 31, 2022, approximately 28% of our employees were represented by labor unions and approximately 27% of our collective bargaining contracts are up for renewal in 2023, representing approximately 30% of our employees. In addition, at any given time, we may face a number of union organizing drives. In a market where we are unionized but our competitors are not unionized, we may lose clients as a result. Moreover, negotiating first-time collective bargaining agreements or renewing existing agreements, could result in substantial increases in labor and benefit costs that we may not be able to pass through to clients.
In addition, we make contributions to multi-employer benefit plans on behalf of certain employees covered by collective bargaining agreements, and we could be responsible for paying unfunded liabilities incurred by such benefit plans, which amounts could be material. If we become responsible for any such liability or liabilities, we could experience a material adverse impact on our results of operations and financial condition.
Catastrophic events could disrupt our business and services.
Catastrophic events, including natural disasters, severe weather conditions, pandemic outbreaks and acts of terrorism or other geopolitical events, have in the past, and may again in the future, cause economic dislocations throughout the country, lead to reduced levels of travel and result in an increase in certain costs of providing parking and remote bag check-in and handling services, any of which could negatively affect the use of our services and our operating income. In addition, terrorist attacks have resulted in, and may continue to result in, increased government regulation of airlines and airport facilities, including the imposition of minimum distances between parking facilities and terminals, resulting in the elimination of parking facilities we manage. We derive a significant percentage of our operating income from parking facilities and parking related services in and around airports. The FAA generally prohibits parking within 300 feet of airport terminals during periods of heightened security. Although the prohibition is not currently in effect, it may be reinstated in the future. The existing regulations governing parking within 300 feet of airport terminals during a period of heightened security or future regulations may prevent us from using certain parking spaces. Reductions in the number of parking spaces and air travelers may reduce our revenue and cash flow from both our leased facilities and those facilities and contracts we operate under management type contracts.
Because our business is affected by weather-related trends, typically in the first and fourth quarters of each year, our results may fluctuate from period to period, which could make it difficult to evaluate our business.
Weather conditions, including fluctuations in temperatures, snow or severe weather storms, heavy flooding, hurricanes or natural disasters, can negatively impact portions of our business. We have from time to time experienced fluctuations in our quarterly results arising from a number of factors, including the following:
11
These factors have typically had negative impacts to our operating income and could cause operating income reductions in the future. Fluctuations in our results could make it difficult to evaluate our business or cause instability in the market price of our common stock.
There are risks associated with operations outside the United States
We have operations outside the United States. As such, we are subject to risks inherent in conducting our business outside the United States. The economic environment in which we operate may become volatile and we could be impacted by changes in foreign exchange rates, tax or other regulatory changes in the countries in which we have operations. In addition, we may have difficulties managing our international operations across different geographic areas and cultures, including assuring compliance with the U.S. Foreign Corrupt Practices Act and other US and foreign anti-corruption laws. Any of these issues could have a material adverse impact on our business, financial condition and results of operations.
State and municipal government clients may sell or enter into long-term lease type contracts of parking-related assets with our competitors or property owners and developers may redevelop existing locations for alternative uses.
In order to raise additional revenue, a number of state and municipal governments have either sold or entered into long-term lease type contracts of public assets or may be contemplating such transactions. The assets that are the subject of such transactions have included government-owned parking garages located in downtown commercial districts and parking operations at airports. The sale or long-term leasing of such government-owned parking assets to our competitors or clients of our competitors could have a material adverse effect on our business, financial condition and results of operations.
Additionally, property owners and developers may elect to redevelop existing locations for alternative uses other than parking or significantly reduce the number of existing spaces used for parking at those facilities in which we either lease through a lease type contract or operate through a management type contract. Reductions in the number of parking spaces or potential loss of contracts due to redevelopment by property owners may reduce our operating income and cash flow for both our lease type contracts and those facilities or contracts we operate under management type contracts.
We have investments in joint ventures and may be subject to certain financial and operating risks with our joint venture investments.
We have acquired or invested in a number of joint ventures, and may acquire or enter into joint ventures with additional companies. These transactions create risks such as:
As a result of future acquisitions or joint ventures in which we may invest, we may need to issue additional equity securities, spend our cash, or incur debt and contingent liabilities, any of which could reduce our profitability and harm our business. In addition, valuations supporting our acquisitions or investments in joint ventures could change rapidly given the global economic environment. We could determine that such valuations have experienced impairments, resulting in other-than-temporary declines in fair value that could adversely impact our financial results.
Risks related to legal and regulatory matters
Adverse litigation judgments or settlements resulting from legal proceedings in which we may be involved could adversely affect our operations and financial condition.
In the normal course of business, we are from time to time involved in various legal proceedings, including class action litigation. The outcome of these and any other legal proceedings cannot be predicted. It is possible that an unfavorable outcome of some or all of the legal proceedings could cause us to incur substantial liabilities that may have a material adverse effect on our financial condition and results of operations. Any significant adverse litigation, judgments or settlements could have a negative effect on our business, financial condition and results of operations. Because our business employs a significant number of employees, we incur risks that these individuals will make claims against us for violating various employment-related federal, state and local laws. Some or all of these claims may lead to litigation, including class action litigation, and there may be negative publicity with respect to any alleged claims. Additionally, we are subject to legal and regulatory risks in the states where we have employees, including, for example, if there are new or unanticipated judicial interpretations of existing laws and those interpretations are applied to employers on a retroactive basis.
We operate in a highly regulated environment, and our compliance with laws and regulations, including any changes thereto, or our non-compliance with such laws and regulations, may impose significant costs on us.
Under various federal, state and local environmental laws, ordinances and regulations, current or previous owners or operators of real property may be liable for the costs of removal or remediation of hazardous or toxic substances on, under or in their properties. This could apply to properties we either own or operate. These laws typically impose liability without regard to whether the owner or operator knew of, or was responsible for, the presence of such hazardous or toxic substances. We may be potentially liable for such costs as a result of our operation of parking facilities. Additionally, we hold a partial ownership interest in four parking facilities, and companies that we previously acquired may have owned a large number of properties that we did not acquire. We may be held liable for certain costs as a result of such previous and current ownership. In addition, from time to time we are subject to legal claims and regulatory actions involving environmental issues at certain locations or otherwise in connection with our operations. The cost of defending against claims of liability, or remediation of a contaminated property, could have a material adverse effect on our business, financial condition and results of operations.
In connection with ground transportation services and certain transportation and baggage services provided to our clients, including shuttle bus operations, baggage handling and delivery services and remote airline check-in services, the U.S. Department of Transportation, including the TSA and Department of Homeland Security, and various federal and state agencies exercise broad powers over these transportation and baggage related services, including, licensing and authorizations, safety, training and insurance requirements. Our employees must also comply with the various safety and fitness regulations promulgated by the U.S. Department of Transportation and other federal agencies, including those related to minimum training hours and requirements, drug and alcohol testing and service hours. We may become subject to new and more restrictive federal and state regulations. Compliance with such regulations could hamper our ability to provide qualified drivers and increase our operating costs. Our compliance with any new rules and regulations, directives, anticipated rules or other forms of regulatory oversight may have a material adverse effect on our business, financial condition or results of operations.
12
We are also subject to consumer credit laws and credit card industry rules and regulations relating to the processing of credit card transactions, including the Fair and Accurate Credit Transactions Act and the Payment Card Data Security Standard. These laws and industry standards impose substantial financial penalties for non-compliance.
In addition, we are subject to laws generally applicable to businesses, including, but not limited, to federal, state and local regulations relating to data privacy, wage and hour matters, employee classification, mandatory healthcare benefits, unlawful workplace discrimination and whistle blowing. Any actual or alleged failure to comply with any regulation applicable to our business or any whistle-blowing claim, even if without merit, could result in costly litigation, regulatory action or otherwise harm our business, financial condition and results of operations.
We collect and remit sales/parking taxes and file tax returns for and on behalf of ourselves and our clients. We are affected, and may in the future be affected, by laws and regulations that may impose a direct assessment on us for failure to remit sales/parking taxes and filing of tax returns for ourselves and on behalf of our clients.
We cannot predict changes in laws and regulations made by federal, state or local government. Any such changes may pose additional regulatory burden and costs on our business or otherwise adversely affect our results of operations.
Rising healthcare costs may adversely affect our business and results of operations.
We provide healthcare and other benefits to employees. In certain circumstances, we charge our clients insurance-related costs. Costs for health care have increased more rapidly than general inflation in the U.S. economy. If this trend in health care continues and we are unable to raise the rates we charge our clients to cover expenses incurred due to the Patient Protection and Affordable Care Act or other healthcare initiatives, our operating income could be negatively impacted.
Changes in tax laws or rulings could materially affect our financial position, results of operations, and cash flows.
We are subject to income and other tax laws in the United States (federal, state and local) and other foreign jurisdictions, which include Canada, Puerto Rico, the United Kingdom and India. Changes in tax laws, regulations, tax rulings, administrative practices or changes in interpretations of existing laws, could materially affect our business. Due to economic and political conditions, tax rates in various jurisdictions may be subject to significant change, with or without notice, and our effective tax rate could be affected by changes in the mix of earnings in countries with differing statutory tax rates or changes in tax laws or their interpretation, including in the United States (federal, state and local) and the other foreign jurisdictions in which we operate. For example, the U.S. Congress has advanced a variety of tax legislation proposals, and while the final form of any legislation is uncertain, the current proposals, if enacted, could have a material effect on our effective tax rate. Our income tax expense, deferred tax assets and liabilities and our effective tax rates could be affected by numerous factors, including the relative amount of our foreign earnings, including earnings being lower than anticipated in jurisdictions where we have lower statutory rates and higher than anticipated in jurisdictions where we have higher statutory rates, the applicability of special tax regimes, losses incurred in jurisdictions for which we are not able to realize the related tax benefit, entry into new businesses or geographies, changes to our existing business and operations, acquisitions and investments and how they are financed and changes in the relevant tax, accounting and other laws regulation, administrative practices, principles and interpretations. Additionally, adverse changes in the underlying profitability and financial outlook of our operations or changes in tax law, as discussed above, could lead to changes in our valuation allowances against deferred tax assets on our consolidated balance sheets, which could materially affect our results of operations.
We are also subject to tax audits and examinations by governmental authorities in the United States (federal, state and local) and other foreign jurisdictions in which we operate. We regularly assess the likelihood of an adverse outcome resulting from these examinations to determine the adequacy of our provision for taxes, but our assessments as to the outcome of such tax audits and examinations involve a number of assumptions and may ultimately prove to be incorrect. Negative unexpected results from one or more such tax audits or examinations or our failure to sustain our reporting positions on examination could have an adverse effect on our results of operations and our effective tax rate.
Risks related to our liquidity and capital resources
Interest rate changes could have a material adverse effect on our results of operations.
We are exposed to interest rate risks primarily as a result of our borrowings and investing activities, which include long-term borrowings used to maintain liquidity and fund our business operations and capital requirements. The nature and amount of our long-term and short-term debt may vary from time to time as a result of business requirements, market conditions, and other factors.
On April 21, 2022, we entered into a fifth amendment (the “Fifth Amendment”) to our Amended Credit Agreement (as defined in Note 12. Borrowing Arrangements), pursuant to which the Lenders have made available to us a senior secured credit facility (the “Senior Credit Facility”). The Senior Credit Facility bears interest at a forward-looking SOFR term interest rate administered by Chicago Mercantile Exchange (“Term SOFR”). Our interest expense could increase due to changes in the Term SOFR rate and our available cash flow for general corporate requirements may be adversely affected. In addition, there remains uncertainty as to the longer-term impact of the adoption of Term SOFR and other alternative reference rates, which could affect our overall financial condition or results of operations.
Impairment charges could have a material adverse effect on our financial condition and results of operations.
Goodwill represents the excess of the purchase price of acquired businesses over the fair values of the assets acquired and liabilities assumed. October 1st is our annual impairment assessment date for goodwill. However, we could be required to evaluate the recoverability of goodwill prior to the annual assessment if we experience a significant under-performance relative to expected historical or projected future operating results, significant changes in the use of acquired assets or our business strategy, or significant negative industry or economic trends. The goodwill impairment test is performed at the reporting unit level. If the fair value of one of our reporting units is less than its carrying value, we would record impairment for the excess of the carrying amount over the implied fair value. The valuation of our reporting units requires significant judgment in evaluation of recent indicators of market activity and estimated future cash flows, discount rates, and other factors. Future events may indicate differences from our judgments and estimates which could, in turn, result in impairment charges. Future events that may result in impairment charges include economic volatility, increases in interest rates, which would impact discount rates, or other factors which could decrease revenues and profitability of our reporting units and changes in the cost structure of existing facilities.
We evaluate our long-lived assets, including lease right-of-use (“ROU”) and intangible assets, for impairment whenever events or changes in circumstances indicate that the carrying amount of such assets may not be recoverable. These events and circumstances include, but are not limited to, a current expectation that a long-lived asset will be disposed of significantly before the end of its previously estimated useful life, a significant adverse change in the extent or manner in which we use a long-lived asset or asset group, a change in a long-lived asset’s physical condition or a projection or forecast that demonstrates continuing losses associated with the use of the long-lived asset or asset group. When this occurs, a recoverability test is performed that compares the projected undiscounted cash flows from the use and eventual disposition of an asset or asset group to its carrying amount. If we conclude that the projected undiscounted cash flows are less than the carrying amount, impairment would be recorded for the excess of the carrying amount over the estimated fair value. During the year ended December 31, 2022,
13
we concluded that a certain ROU asset was impaired and we recorded an impairment charge of $3.7 million. See Notes 1. Significant Accounting Policies and Practices and Note 3. Leases to our Consolidated Financial Statements for further discussion.
Assumptions and estimates used to determine cash flows in the evaluation of impairment and the fair values used to determine the impairment are subject to a degree of judgment and complexity. Any future changes to the assumptions and estimates resulting from changes in actual results or market conditions from those anticipated may affect the carrying value of long-lived assets or asset groups and could result in additional impairment charges. Future events that may result in impairment charges include economic volatility or other factors which could decrease revenues and profitability of existing locations and changes in the cost structure of existing facilities.
We have incurred indebtedness, and we may incur indebtedness in the future, which could adversely affect our financial condition.
Our Amended Credit Agreement (as defined in Note 12. Borrowing Arrangements), which was amended on April 21, 2022, provides for a Senior Credit Facility that includes a $400.0 million revolving credit facility and a $200.0 million term loan that is scheduled to mature in April 2027. The Senior Credit Facility is secured by a lien on all of our assets. In connection with our Amended Credit Agreement, the negative and financial covenants in the Credit Agreement were amended and some additional covenants were added, as described in Note 12. Borrowing Arrangements. Failure to comply with covenants or to meet payment obligations under our Senior Credit Facility could result in an event of default which, if not cured or waived, could result in the acceleration of outstanding debt obligations.
We may incur additional indebtedness in the future, which could cause the related risks to intensify. We may need to refinance all or a portion of our indebtedness on or before their respective maturities. We may not be able to refinance any of our indebtedness, including indebtedness under our Senior Credit Facility, on commercially reasonable terms or at all. If we are unable to refinance our debt, we may default under the terms of our indebtedness, which could lead to an acceleration of the repayment of outstanding debt. We do not expect that we could repay all of our outstanding indebtedness if the repayment of such indebtedness was accelerated. If adequate capital is not available to us and our internal sources of liquidity prove to be insufficient, or if future financings require more restrictive covenants, such combination of events could adversely affect our ability to (i) acquire new businesses or enter new markets, (ii) service or refinance our existing debt, (iii) make necessary capital investments and (iv) make other expenditures necessary for the ongoing conduct of our business.
In addition, the terms of future debt agreements and amendments to our existing debt agreements could include more restrictive covenants, which may further restrict our business operations or cause future financing to be unavailable due to our covenant restrictions then in effect.
Our ability to maintain and expand our business will be dependent upon the availability of adequate capital.
The ability to maintain and expand our business will depend, in part, on the availability of adequate capital, which in turn will depend, in large part, on cash flow generated by our business and the availability of equity and debt capital. As a result, we may not have the ability to obtain adequate capital to maintain and expand our business.
The financial difficulties or bankruptcy of one or more of our major clients could adversely affect our results.
Future revenue and our ability to collect accounts receivable depend in part on the financial strength of our clients. We estimate an allowance for doubtful accounts, which adversely impacts profitability. In the event that any of our clients experience financial difficulty, become unable to obtain financing or seek bankruptcy protection, our profitability could be impacted by our inability to collect accounts receivable in excess of the estimated allowance. Additionally, our future revenue could be reduced by the loss of any such clients or by the cancellation of lease type contracts or management type contracts by clients in bankruptcy.
The sureties for our performance bond program may elect not to provide us with new or renewal performance bonds for any reason.
As is customary in the industry, a surety provider can refuse to provide a bond principal with new or renewal surety bonds. If any existing or future surety provider refuses to provide us with surety bonds, either generally or because we are unwilling or unable to post collateral at levels sufficient to satisfy the surety's requirements, we may not be able to find alternate providers on acceptable terms, or at all. Our inability to provide surety bonds could also result in the loss of existing contracts. Failure to find a provider of surety bonds, and our resulting inability to bid for new contracts or renew existing contracts, could have a material adverse effect on our business and financial condition.
General risk factors
Our business success depends on retaining senior management and attracting and retaining qualified personnel.
Our future performance depends on the continuing services and contributions of our senior management to execute on our acquisition and growth strategies and to identify and pursue new opportunities. Our future success also depends, in large part, on our continued ability to attract and retain qualified personnel. Any unplanned turnover in senior management or the inability to attract and retain qualified personnel could have a negative effect on our results of operations.
Additionally, we must attract, train and retain a large and growing number of qualified employees while controlling labor costs. Our ability to control labor costs is subject to numerous internal and external factors, including changes in immigration policy, regulatory changes, prevailing wage rates, and competition we face from other companies to attract and retain qualified employees. We may not be able to attract and retain qualified employees in the future, which could have a material adverse effect on our business, financial condition and results of operations.
Climate change may have a long-term impact on our business.
There are inherent climate-related risks wherever our business is conducted. Changes in market dynamics, stakeholder expectations, local, national and international climate change policies, and the frequency and intensity of extreme weather events on critical infrastructure in the United States and abroad, all have the potential to disrupt our business and operations. Such events could result in a significant increase in our costs and expenses and harm our future revenue, cash flows and financial performance. Global climate change is resulting, and may continue to result, in certain natural disasters and adverse weather, such as droughts, wildfires, storms, sea-levels rising and flooding, occurring more frequently or with greater intensity, which could cause business disruptions and impact employees’ abilities to commute to work or to work from home effectively. Government failure to address climate change could result in greater exposure to economic and other risks from climate change and impact our ability to achieve climate goals.
Actions of activist investors could disrupt our business.
Public companies have been the target of activist investors, including, in particular, during times of economic and market turmoil. In the event that a third-party, such as an activist investor, proposes to change our governance policies, board of directors, or other aspects of our operations, our review and consideration of such proposals may create a significant distraction for our management and employees. This could negatively impact our ability to execute our long-term growth plan and may require our management to expend significant time and resources responding to such proposals. Such proposals may also create uncertainties with respect to our financial position and operations and may adversely affect our ability to attract and retain key employees.
14
Item 1B. Unresolved Staff Comments
Not applicable.
Item 2. Properties
Our principal support office is located at 200 East Randolph Street, Suite 7700, Chicago, Illinois 60601.
Principal Properties as of December 31, 2022
Location |
|
Character of Office |
|
Approximate Square Feet |
|
|
Lease Expiration Date |
|
Segment |
|
Chicago, Illinois (1) |
|
Chicago Support Office |
|
|
35,000 |
|
|
September 2025 |
|
Other |
Nashville, Tennessee |
|
Nashville Support Office |
|
|
25,000 |
|
|
June 2024 |
|
Other |
In addition to the above properties, we have other offices, warehouses and parking facilities in various locations in the United States, Canada, Puerto Rico, the United Kingdom and India.
We believe that these properties are well maintained, in good operating condition and suitable for the purposes for which they are used.
Item 3. Legal Proceedings
General
We are subject to claims and litigation in the normal course of our business, including those related to labor and employment, contracts, personal injury and other related matters, some of which allege substantial monetary damages and claims. Some of these actions may be brought as class actions on behalf of a class or purported class of employees. While the outcomes of claims and legal proceedings brought against us are subject to significant uncertainty, we believe the final outcome will not have a material adverse effect on our financial position, results of operations or cash flows.
We accrue a charge when we determine that it is probable that an asset has been impaired or a liability has been incurred and the amount of loss can be reasonably estimated. When a loss is probable, we record an accrual based on the reasonably estimable loss or range of loss. When no point of loss is more likely than another, we record the lowest amount in the estimated range of loss and, if material, disclose the estimated range. We do not record liabilities for reasonably possible loss contingencies, but do disclose a range of reasonably possible losses if they are material and we are able to estimate such a range. If we cannot provide a range of reasonably possible losses, we explain the factors that prevent us from determining such a range. We regularly evaluate current information available to us to determine whether an accrual should be established or adjusted. Estimating the probability that a loss will occur and estimating the amount of a loss or a range of loss involves significant estimation and judgment.
Item 4. Mine Safety Disclosures
Not applicable.
15
PART II
Item 5. Market for Registrant's Common Equity, Related Stockholder Matters and Issuer Purchases of Equity Securities
Our common stock is listed on the Nasdaq Stock Market LLC under the symbol "SP".
Holders
As of February 13, 2023, we estimate that there were approximately 10,500 registered holders of our common stock.
Issuer Purchases of Equity Securities
The following table provides information about the purchases we made during the three months ended December 31, 2022 of equity securities that are registered by us pursuant Section 12 of the Exchange Act:
(millions, except share and per share data) (unaudited) |
Total Number of Shares Purchased |
|
Average Price Paid per Share |
|
Total Number of Shares Purchased as Part of Publicly Announced Plans |
|
Approximate Dollar Value of Shares That May Yet be Purchased Under the Plan (a) |
|
||||
10/01/2022 through 10/31/2022 |
|
211,900 |
|
$ |
34.22 |
|
|
211,900 |
|
$ |
25.2 |
|
11/01/2022 through 11/30/2022 |
|
209,000 |
|
|
34.72 |
|
|
209,000 |
|
|
17.9 |
|
12/01/2022 through 12/31/2022 |
|
209,600 |
|
|
34.65 |
|
|
209,600 |
|
|
10.6 |
|
Total |
|
630,500 |
|
$ |
34.53 |
|
|
630,500 |
|
$ |
10.6 |
|
(a) In May 2022, our Board of authorized us to repurchases in the open market shares of our outstanding common stock in an amount not to exceed $60.0 million.
As of December 31, 2022, $10.6 million remained available for repurchase under our May 2022 stock repurchase program. Repurchases of our common stock may be made in open market transactions effected through a broker-dealer at prevailing market prices, in block trades, or by other means in accordance with the Rules 10b-18, to the extent relied upon, and 10b5-1 under the Exchange Act at the time and prices considered to be appropriate at our discretion. The stock repurchase program does not obligate us to repurchase any particular amount of common stock and has no fixed termination date, and may be suspended at any time at our discretion.
On February 14, 2023, our Board of Directors ("Board") approved a new stock repurchase plan authorizing us to repurchase, on the open market, shares of our outstanding common stock in an amount not to exceed $60.0 million in aggregate.
Securities Authorized for Issuance Under Equity Compensation Plans
We have an amended and restated long-term incentive plan (the "Plan") that was adopted in conjunction with our initial public offering in 2004. On March 26, 2021, our Board approved an amendment and restatement of the Plan that increased the number of shares of common stock available under the Plan from 3,775,000 to 4,775,000. Company stockholders approved the Plan amendment and restatement on May 12, 2021. Under the Plan, we have granted stock options, stock grants and issued restricted stock units (“RSU’s”) and performance stock units (“PSU’s”) awards to certain employees. Forfeited and expired options under the Plan generally become available for reissuance. Additional information regarding the Plan appears in Note 1. Significant Accounting Policies and Practices and Note 7. Stock-Based Compensation to our Consolidated Financial Statements.
The status of the Plan as of December 31, 2022 was as follows:
|
|
|
|
|
|
|
|
Number of |
|
|||
|
|
|
|
|
|
|
|
Securities |
|
|||
|
|
|
|
|
|
|
|
Remaining |
|
|||
|
|
|
|
|
|
|
|
Available |
|
|||
|
|
Number of |
|
|
Weighted- |
|
|
for Future |
|
|||
|
|
Securities to be |
|
|
Average |
|
|
Issuance |
|
|||
|
|
Issued Upon |
|
|
Exercise |
|
|
Under Equity |
|
|||
|
|
Exercise of |
|
|
Price of |
|
|
Compensation |
|
|||
|
|
Outstanding |
|
|
Outstanding |
|
|
Plans |
|
|||
|
|
Options, |
|
|
Options, |
|
|
(Excluding |
|
|||
|
|
Warrants |
|
|
Warrants |
|
|
Securities |
|
|||
Plan Category |
|
Rights (Column A) |
|
|
Rights (Column B) |
|
|
Column A) |
|
|||
Equity compensation plans approved by securities holders (a) |
|
$ |
774,329 |
|
|
$ |
— |
|
|
$ |
902,511 |
|
Equity compensation plans not approved by securities holders |
|
|
— |
|
|
|
— |
|
|
|
— |
|
Total |
|
$ |
774,329 |
|
|
$ |
— |
|
|
$ |
902,511 |
|
16
Stock Performance Graph
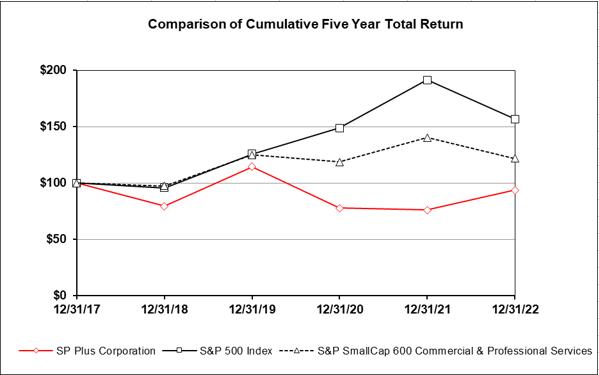
|
|
Years Ended December 31, |
|
|||||||||||||||||||||
Company / Index |
|
2017 |
|
|
2018 |
|
|
2019 |
|
|
2020 |
|
|
2021 |
|
|
2022 |
|
||||||
SP Plus Corporation |
|
$ |
100.00 |
|
|
$ |
79.62 |
|
|
$ |
114.37 |
|
|
$ |
77.71 |
|
|
$ |
76.06 |
|
|
$ |
93.58 |
|
S&P 500 Index |
|
$ |
100.00 |
|
|
$ |
95.62 |
|
|
$ |
125.72 |
|
|
$ |
148.85 |
|
|
$ |
191.58 |
|
|
$ |
156.88 |
|
S&P SmallCap 600 Commercial & Professional Services |
|
$ |
100.00 |
|
|
$ |
97.39 |
|
|
$ |
125.05 |
|
|
$ |
118.62 |
|
|
$ |
140.39 |
|
|
$ |
121.72 |
|
The performance graph above shows the cumulative total stockholder return of our common stock for the period starting on December 31, 2017 to December 31, 2022. This performance is compared with the cumulative total returns over the same period of the Standard & Poor's (“S&P”) 500 Index and the S&P SmallCap 600 Commercial and Professional Services Index, which includes our direct competitor, ABM Industries Incorporated. The graph assumes that on December 31, 2017, $100 was invested in each of the other two indices, and assumes reinvestment of dividends. The stock performance shown in the graph represents past performance and should not be considered an indication of future performance.
Item 6. [Reserved]
17
Item 7. Management's Discussion and Analysis of Financial Condition and Results of Operations
This Item 7. "Management's Discussion and Analysis of Financial Condition and Results of Operations" and other parts of this Form 10-K contain forward-looking statements, within the meaning of the Private Securities Litigation Reform Act of 1995, that involve risks and uncertainties. Forward-looking statements provide current expectations of future events based on certain assumptions and include any statement that does not directly relate to any historical or current fact. Forward-looking statements can also be identified by words such as "future," "anticipates," "believes," "estimates," "expects," "intends," "plans," "predicts," "will," "would," "could," "can," "may," and similar terms. Forward-looking statements are not guarantees of future performance, and SP Plus Corporation’s (“we”, "us" or "our") actual results may differ significantly from the results discussed in the forward-looking statements. Factors that might cause such differences include, but are not limited to, those discussed in Part I, Item 1A. "Risk Factors" of this Form 10-K, which are incorporated herein by reference. The following discussion should be read in conjunction with the Consolidated Financial Statements and notes thereto included in Part IV, Item 15. "Exhibits and Financial Statement Schedules" of this Form 10-K. Each of the terms the "We" and "Our" as used herein refers collectively to SP Plus Corporation and its wholly-owned subsidiaries, unless otherwise stated. We assume no obligation to revise or update any forward-looking statements for any reason, except as required by law.
A discussion regarding our financial condition and results of operations for the year-ended December 31, 2021 compared to the year-ended December 31, 2020 can be found in Part II Item 7. Management's Discussion and Analysis of Financial Condition and Results of Operations in our Annual Report on Form 10-K for the fiscal year ended December 31, 2021 as filed with the Securities and Exchange Commission on February 28, 2022.
General Overview
In evaluating our financial condition and operating performance, our primary area of focus is on our operating income. Revenue from lease type contracts includes all gross customer collections derived from our leased locations (net of local taxes), whereas revenue from management type contracts only includes our contractually agreed upon management fees and amounts attributable to ancillary services. Gross customer collections at facilities under management type contracts, therefore, are not included in our revenue. Accordingly, while a change in the proportion of our operating agreements that are structured as lease type contracts may cause significant fluctuations in reported revenue and cost of services, those changes will not artificially affect our gross profit. For example, as of December 31, 2022, 87% of our locations in the Commercial segment were operating under management type contracts. Only 65% of total revenue (excluding reimbursed management type contract revenue) during the year ended December 31, 2022, however, was from management type contracts. Under those contracts, the majority of revenue collected from customers belongs to our clients.
We believe that sophisticated clients (which also include property owners) recognize the potential for technology-driven mobility solutions, parking services, parking management, ground transportation services, baggage handling services and other ancillary services to be a profit generator and/or a service differentiator to their customers. By outsourcing these services, they are able to capture additional profit and improve customer experiences by leveraging the unique operational skills and controls that an experienced services company can offer. Our ability to consistently deliver uniformly high level of services to our clients, including the use of various technological enhancements, allows us to maximize the profit and/or customer experience for our clients and improves our ability to win contracts and retain existing clients. Our focus on customer service and satisfaction is a key driver of our high retention rate, which was approximately 93% and 91% for the years ended December 31, 2022 and 2021, respectively, for the Commercial segment.
Commercial Segment Facilities
The following table reflects our Commercial facilities (by contractual type) operated on the dates indicated:
|
|
December 31, |
|
||||
|
|
2022 |
|
2021 |
|
||
Lease-type facilities |
|
|
421 |
|
|
423 |
|
Management-type facilities |
|
|
2,709 |
|
|
2,601 |
|
Total Commercial segment facilities |
|
|
3,130 |
|
|
3,024 |
|
Aviation Segment - Airports Served
The following table reflects the number of airports where at least one of our services is provided as of the dates indicated:
|
|
December 31, |
|
||||
|
|
2022 |
|
2021 |
|
||
North America |
|
|
100 |
|
|
89 |
|
Europe |
|
|
58 |
|
|
— |
|
Total Airports |
|
|
158 |
|
|
89 |
|
The increase in 2022 included 65 unique airports added as a result of the acquisition of KMP.
Revenue
We recognize services revenue from our contracts and certain fees for using our technology-driven mobility solutions as the related services are provided. Substantially all of our revenue comes from the following two sources:
Lease type contracts. Consists of all revenue received at lease type locations, including gross receipts (net of local taxes), consulting and real estate development fees, fees for utilizing our technology-driven mobility solutions, gains on sales of contracts and payments for exercising termination rights. As discussed in Note 5. Revenue in the notes to the Consolidated Financial Statements, revenue from lease type contracts includes a reduction for certain expenses (primarily rent expense) related to service concession arrangements.
18
Management type contracts. Consists of management fees, including fixed, variable and/or performance-based fees, and amounts attributable to ancillary services such as accounting, equipment leasing, baggage services, payments received for exercising termination rights, consulting, developmental fees, gains on sales of contracts, insurance and other value-added services. We believe we generally can purchase required insurance at lower rates than our clients can obtain on their own because we effectively self-insure for all liability and worker’s compensation and health care claims by maintaining a large per-claim deductible. As a result, we have generated operating income on the insurance provided under our management type contracts by focusing on our risk management efforts and controlling losses. Management type contract revenues do not include gross customer collections, as those revenues belong to the client rather than to us. Management type contracts generally provide us with a management fee regardless of the operating performance of the underlying facility. In addition, management type contract revenue includes revenue related to our other aviation services. Other aviation services include our baggage delivery services, curbside concierge services, ecommerce technology fees, remote airline check-in services and other miscellaneous services provided to our airport and airline clients.
Reimbursed Management Type Contract Revenue. Consists of the direct reimbursement from the client for operating expenses incurred under a management type contract.
Cost of Services (Exclusive of Depreciation and Amortization)
Our cost of services consists of the following:
Lease type contracts. Consists of contractual rents or fees paid to the client and all operating expenses incurred in connection with operating the leased facility. Contractual rents or fees paid to the client are generally based on either a fixed contractual amount, a percentage of gross revenue or a combination thereof. Generally, under a lease type arrangement we are not responsible for major capital expenditures or real estate taxes.
Management type contracts. Expenses under a management type contract are generally the responsibility of the client. As a result, these costs are not included in our cost of services. However, "reverse" management type contracts, which typically provide for larger management fees, do require us to pay for certain costs, which are included in cost of services. In addition, certain costs related to providing our other aviation and ancillary services are included in cost of services.
Reimbursed Management Type Contract Expense. Consists of directly reimbursed costs incurred on behalf of a client under a management type contract.
Gross Profit
Gross profit equals our revenue less the cost of generating such revenue (“cost of services”) and depreciation and amortization expenses related to cost of services activities.
General and Administrative Expenses
General and administrative expenses include salaries, wages, incentive compensation, stock-based compensation, payroll taxes, insurance, travel and office related expenses for our headquarters, field offices and supervisory employees. Additionally, acquisition-related expenses are included in general and administrative expenses.
Depreciation and Amortization
Depreciation is determined using a straight-line method over the estimated useful lives of the various asset classes, or in the case of leasehold improvements, over the initial term of the operating lease or its useful life, whichever is shorter. Intangible assets determined to have finite lives, usually acquired through the acquisition of businesses, are amortized over their remaining estimated useful lives.
Operating Income (Loss)
Operating income (loss) represents revenue less cost of services, general and administrative expense, depreciation and amortization and impairment of goodwill and intangible assets. This is the key metric our Chief Operating Decision Maker (“CODM”) uses for making decisions, assessing performance and allocating resources to our Operating Segments, Commercial and Aviation.
Goodwill and other Intangible Assets, net
See Item 7. Critical Accounting Policies and Estimates, which describes our policy relating to goodwill and other intangible assets, net.
Goodwill
Due to the impacts of COVID-19 on our operations, revenues for certain markets in which we operate decreased significantly during 2020 as compared to the expectations as of the October 1, 2019 annual impairment test. In addition, certain Aviation contracts were terminated during August 2020. The termination of these contracts and the ongoing impacts of COVID-19 on our expected future operating cash flows triggered us to complete a quantitative goodwill impairment analysis for our Aviation reporting unit as of August 31, 2020. Based on the quantitative analysis, we determined the estimated carrying value exceeded implied fair value for the Aviation reporting unit and goodwill was impaired. See Note 10. Goodwill in the notes to the Consolidated Financial Statements for further discussion. No impairment was recorded during the years ended December 31, 2022 and 2021.
Other Intangibles Assets, net
As a result of the impact of COVID-19 on our expected future operating cash flows, we determined certain impairment testing triggers had occurred related to our Proprietary know how intangible assets within the Aviation segment as of June 30, 2020. Accordingly, we analyzed undiscounted cash flows for these intangible assets as of June 30, 2020. Based on the undiscounted cash flow analysis, we determined the estimated net carrying values exceeded undiscounted future cash flows for certain Proprietary know how intangible assets and therefore, as of June 30, 2020, certain Proprietary know how assets were impaired.
Additionally, as a result of the termination of certain contracts within the Aviation reporting unit during August 2020 and the ongoing impact of COVID-19 on our expected future operating cash flows, we determined certain impairment testing triggers had occurred related to our customer relationships and trade names and trademarks intangible assets. Accordingly, we analyzed undiscounted cash flows for these intangible assets as of August 31, 2020. Based on the undiscounted cash flow analysis, we determined the estimated net carrying values exceeded undiscounted future cash flows for certain customer relationships and trade names and trademarks intangible assets and therefore as of August 31, 2020, certain customer relationships and trade names and trademarks intangible assets were impaired. See Note 9. Other Intangible Assets, net in the notes to the Consolidated Financial Statements for further discussion. No impairment was recorded during the years ended December 31, 2022 and 2021.
For both goodwill and intangible assets, future events may indicate differences from our judgments and estimates which could, in turn, result in impairment charges. Future events that may result in impairment charges include economic volatility, increases in interest rates, which would impact discount rates, or other factors
19
which could decrease revenues and profitability of existing locations and changes in the cost structure of existing facilities, such as increasing labor and benefit costs.
Long-Lived Assets
See Item 7. Critical Accounting Policies and Estimates, which describes our policy relating to other long-lived assets.
During the years ended December 31, 2022, 2021 and 2020, we determined certain impairment triggers had occurred for certain right-of-use (“ROU”) assets. See Note 1. Significant Accounting Policies and Practices and Note 3. Leases in the notes to the Consolidated Financial Statements for further discussion.
Assumptions and estimates used to determine cash flows in the evaluation of impairment and the fair values used to determine the impairment are subject to a degree of judgment and complexity. Any future changes to the assumptions and estimates resulting from changes in actual results or market conditions from those anticipated may affect the carrying value of long-lived assets or asset groups and could result in additional impairment charges. Future events that may result in impairment charges include economic volatility or other factors which could decrease revenues and profitability of existing locations and changes in the cost structure of existing facilities, such as increasing labor and benefit costs.
Segments
An operating segment is defined as a component of an enterprise that engages in business activities from which it may earn revenue and incur expenses, and about which separate financial information is regularly evaluated by the CODM. Our CODM is our chief executive officer. The CODM uses this separate discrete financial information by segment to allocate resources and assess performance, primarily based on operating income.
Our operating segments are Commercial and Aviation, which are described below.
The Other segment includes costs related to our operational support teams and costs related to common and shared infrastructure, including finance, accounting, information technology, human resources, procurement and purchasing, legal and corporate development.
In March 2022, we changed our internal segment information reported to the CODM for certain costs that were allocated from the Other segment to the Commercial segment. All prior year amounts have been reclassified to conform to our current reporting structure.
Analysis of Results of Operations
New business relates to contracts that started during the current period. Contract terminations relate to contracts that have expired or terminated early during the current period but where we were operating the business in the comparative period presented. Conversions relate to contracts that were converted from lease type contracts to management type contracts after the prior year period.
2022 Compared to 2021
Consolidated results during the years ended December 31, 2022 and 2021, respectively, included the following notable items:
|
|
December 31, |
|
|
Variance |
|
||||||||||
(millions) |
|
2022 |
|
|
2021 |
|
|
Amount |
|
|
% |
|
||||
Services revenue |
|
$ |
1,553.5 |
|
|
$ |
1,177.2 |
|
|
$ |
376.3 |
|
|
|
32.0 |
% |
Cost of services (exclusive of depreciation and amortization)(1) |
|
|
1,331.8 |
|
|
|
997.4 |
|
|
|
334.4 |
|
|
|
33.5 |
% |
General and administrative expenses |
|
|
109.1 |
|
|
|
88.2 |
|
|
|
20.9 |
|
|
|
23.7 |
% |
Depreciation and amortization |
|
|
29.7 |
|
|
|
25.1 |
|
|
|
4.6 |
|
|
|
18.3 |
% |
Operating income (loss) |
|
|
82.9 |
|
|
|
66.5 |
|
|
|
16.4 |
|
|
|
24.7 |
% |
Income tax expense (benefit) |
|
|
17.5 |
|
|
|
10.5 |
|
|
|
7.0 |
|
|
|
66.7 |
% |
Services revenue increased by $376.3 million, or 32.0%, attributable to the following:
Cost of services (exclusive of depreciation and amortization) increased by $334.4 million, or 33.5%, attributable to the following:
20
General and administrative expenses increased $20.9 million, or 23.7%, primarily due to higher compensation, non-cash stock-based compensation and performance based compensation expenses, as well as our continued investment in technology, business development and growth initiatives and higher acquisition, restructuring, integration and other costs.
Depreciation and amortization expenses increased $4.6 million, or 18.3%, primarily due to our investment in technology and growth initiatives, as well as the amortization of intangibles related to the acquisitions of KMP and DIVRT.
Our effective tax rate was 26.7% during the year ended December 31, 2022 compared to 22.9% during the year ended December 31, 2021. The increase in the effective tax rate is due to the finalization of our 2020 U.S. Federal income tax return during the year ended December 31, 2021, which resulted in a $2.0 million additional benefit related to the ability to carryback our 2020 U.S. Federal Net Operating Loss (“NOL”) to previous tax years that had a higher tax rate.
The following tables summarize our revenues (excluding reimbursed management type contract revenue), gross profit, general and administrative expenses, depreciation and amortization, and operating income (loss) by segment during the years ended December 31, 2022 and 2021.
Commercial
|
|
Commercial |
|
|
Variance |
|
||||||||||
(millions) |
|
2022 |
|
|
2021 |
|
|
Amount |
|
|
% |
|
||||
Services revenue |
|
|
|
|
|
|
|
|
|
|
|
|
||||
Lease type contracts |
|
$ |
261.7 |
|
|
$ |
206.5 |
|
|
$ |
55.2 |
|
|
|
26.7 |
% |
Management type contracts |
|
|
276.8 |
|
|
|
232.5 |
|
|
|
44.3 |
|
|
|
19.1 |
% |
Total services revenue |
|
|
538.5 |
|
|
|
439.0 |
|
|
|
99.5 |
|
|
|
22.7 |
% |
Gross profit |
|
|
|
|
|
|
|
|
|
|
|
|
||||
Lease type contracts |
|
|
44.7 |
|
|
|
41.1 |
|
|
|
3.6 |
|
|
|
8.8 |
% |
Management type contracts |
|
|
123.4 |
|
|
|
100.2 |
|
|
|
23.2 |
|
|
|
23.2 |
% |
Lease impairment |
|
|
(3.7 |
) |
|
|
(3.5 |
) |
|
|
(0.2 |
) |
|
|
(5.7 |
)% |
Depreciation and amortization |
|
|
(7.9 |
) |
|
|
(7.9 |
) |
|
|
— |
|
|
|
— |
|
Total gross profit |
|
|
156.5 |
|
|
|
129.9 |
|
|
|
26.6 |
|
|
|
20.5 |
% |
General and administrative expenses |
|
|
29.3 |
|
|
|
23.0 |
|
|
|
6.3 |
|
|
|
27.4 |
% |
Depreciation and amortization(1) |
|
|
5.2 |
|
|
|
5.6 |
|
|
|
(0.4 |
) |
|
|
(7.1 |
)% |
Operating income |
|
$ |
122.0 |
|
|
$ |
101.3 |
|
|
$ |
20.7 |
|
|
|
20.4 |
% |
Gross Profit
General and administrative expenses increased $6.3 million, or 27.4%, to $29.3 million during the year ended December 31, 2022, compared to $23.0 million during the year ended December 31, 2021. The increase was primarily related to higher compensation and non-cash stock-based compensation expenses, as well as higher restructuring and other costs and our continued investments in growth initiatives.
Operating Income increased $20.7 million, or 20.4%, to $122.0 million during the year ended December 31, 2022, compared to $101.3 million during the year ended December 31, 2021, primarily due to the factors noted above and lower depreciation and amortization expenses.
21
Aviation
|
|
Aviation |
|
|
Variance |
|
||||||||||
(millions) |
|
2022 |
|
|
2021 |
|
|
Amount |
|
|
% |
|
||||
Services revenue |
|
|
|
|
|
|
|
|
|
|
|
|
||||
Lease type contracts |
|
$ |
14.0 |
|
|
$ |
9.1 |
|
|
$ |
4.9 |
|
|
|
53.8 |
% |
Management type contracts |
|
|
241.9 |
|
|
|
153.4 |
|
|
|
88.5 |
|
|
|
57.7 |
% |
Total services revenue |
|
|
255.9 |
|
|
|
162.5 |
|
|
|
93.4 |
|
|
|
57.5 |
% |
Gross profit |
|
|
|
|
|
|
|
|
|
|
|
|
||||
Lease type contracts |
|
|
5.2 |
|
|
|
3.9 |
|
|
|
1.3 |
|
|
|
33.3 |
% |
Management type contracts |
|
|
52.1 |
|
|
|
38.2 |
|
|
|
13.9 |
|
|
|
36.4 |
% |
Lease impairment |
|
|
— |
|
|
|
(0.1 |
) |
|
|
0.1 |
|
|
|
100.0 |
% |
Depreciation and amortization |
|
|
(5.8 |
) |
|
|
(4.6 |
) |
|
|
(1.2 |
) |
|
|
(26.1 |
)% |
Total gross profit |
|
|
51.5 |
|
|
|
37.4 |
|
|
|
14.1 |
|
|
|
37.7 |
% |
General and administrative expenses |
|
|
12.6 |
|
|
|
11.8 |
|
|
|
0.8 |
|
|
|
6.8 |
% |
Depreciation and amortization(1) |
|
|
5.4 |
|
|
|
3.8 |
|
|
|
1.6 |
|
|
|
42.1 |
% |
Operating income |
|
$ |
33.5 |
|
|
$ |
21.8 |
|
|
$ |
11.7 |
|
|
|
53.7 |
% |
Gross Profit
General and administrative expenses increased $0.8 million, or 6.8%, to $12.6 million during the year ended December 31, 2022, compared to $11.8 million during the year ended December 31, 2021, due to our continued investments in growth initiatives, partially offset by lower restructuring and other costs.
Operating Income increased $11.7 million, or 53.7%, to $33.5 million during the year ended December 31, 2022, compared to $21.8 million during the year ended December 31, 2021, primarily related to the factors noted above, partially offset by an increase in depreciation and amortization expenses.
Other
Operating expenses within the Other segment increased $16.0 million, or 28.3%, to $72.6 million during the year ended December 31, 2022, compared to $56.6 million during the year ended December 31, 2021, primarily due to higher compensation, non-cash stock-based compensation and performance based compensation expenses, as well as higher acquisition, restructuring, integration and other costs and our continued investments in technology, business development and growth initiatives.
Analysis of Financial Condition
Liquidity and Capital Resources
General
We continually project anticipated cash requirements for our operating, investing and financing needs, as well as cash flows generated from operating activities available to meet these needs. Our operating needs can include, among other items, commitments for cost of services, operating leases, payroll, insurance claims, interest and legal settlements. Our investing and financing spending can include payments for acquired businesses, joint ventures, capital expenditures, distributions to noncontrolling interests, share repurchases and payments on our outstanding indebtedness.
As of December 31, 2022, we had $12.4 million of cash and cash equivalents and $235.4 million of borrowing availability under our Senior Credit Facility (as defined in Note 12. Borrowing Arrangements in the Notes to the Consolidated Financial Statements). COVID-19 and the resulting global disruptions negatively affected the global economy, as well as our business and the businesses of our customers and clients. The full impact of COVID-19 and macroeconomic conditions, including higher inflation and rising interest rates, on our business and the businesses of our customers and clients is unknown. We believe we will be able to generate sufficient liquidity to satisfy our obligations and remain in compliance with our existing debt covenants for the next twelve months.
Outstanding Indebtedness
As of December 31, 2022, we had total indebtedness of approximately $344.2 million, an increase of $20.2 million from $324.0 million as of December 31, 2021. The $344.2 million included:
22
As of December 31, 2022, we were in compliance with our debt covenants under the Amended Credit Agreement (as defined in Note 12. Borrowing Arrangements in the Notes to the Consolidated Financial Statements).
As of December 31, 2022, we had $38.5 million of letters of credit outstanding under the Senior Credit Facility and borrowings against the Senior Credit Facility aggregated to $323.6 million.
The weighted average interest rate on our Senior Credit Facility was 5.6% and 3.6% during the years ended December 31, 2022 and December 31, 2021, respectively. That rate included the interest rate collars and letters of credit. The weighted average interest rate on all outstanding borrowings, not including letters of credit, was 6.0% and 3.8% during the years ended December 31, 2022 and December 31, 2021, respectively.
During the years ended December 31, 2022 and 2021, we incurred approximately $2.5 million and $1.3 million, respectively, for fees and other customary closing costs in connection with the Amended Credit Agreement.
Stock Repurchases
On February 14, 2023, the Board authorized us to repurchase, on the open market, additional shares of our outstanding common stock in an amount not to exceed $60.0 million in aggregate.
In May 2022, the Board authorized us to repurchase, on the open market, shares of our outstanding common stock in an amount not to exceed $60.0 million in aggregate. During the year ended December 31, 2022, we repurchased 1,474,300 shares of common stock at an average price of $33.47 under this program, of which $48.7 was paid in cash during the year ended December 31, 2022.
As of December 31, 2022, $10.6 million remained available for repurchase under the May 2022 stock repurchase program. Under the program, repurchases of our common stock may be made in open market transactions effected through a broker-dealer at prevailing market prices, in block trades or by other means in accordance with Rules 10b-18, to the extent relied upon, and 10b5-1 under the Exchange Act at times and prices considered to be appropriate at our discretion. The stock repurchase programs do not obligate us to repurchase any particular amount of common stock, have no fixed termination date, and may be suspended at any time at the Company's discretion.
Share repurchase activity under the May 2022 stock repurchase program during the year ended December 31, 2022 was as follows:
(millions, except for share and per share data) |
|
December 31, 2022 |
|
|
Total number of shares repurchased |
|
|
1,474,300 |
|
Average price paid per share |
|
$ |
33.47 |
|
Total value of stock repurchased |
|
$ |
49.4 |
|
The remaining authorized repurchase amount under the May 2022 repurchase program as of December 31, 2022 was as follows:
(millions) |
|
December 31, 2022 |
|
|
Total authorized repurchase amount |
|
$ |
60.0 |
|
Total value of shares repurchased |
|
|
49.4 |
|
Total remaining authorized repurchase amount |
|
$ |
10.6 |
|
Letters of Credit
We provided letters of credit totaling $30.8 million and $37.6 million to our casualty insurance carriers to collateralize our casualty insurance program as of December 31, 2022 and 2021, respectively.
We provided $7.7 million and $8.8 million in letters of credit to collateralize other obligations as of December 31, 2022 and 2021, respectively.
Interest Rate Collars
In May 2019, we entered into three-year interest rate collar contracts with an aggregate notional amount of $222.3 million. The interest rate collar contracts matured in April 2022. The interest rate collars were used to manage interest rate risk associated with variable interest rate borrowings under the Credit Agreement (as defined in Note 12. Borrowing Arrangements in the Notes to the Consolidated Financial Statements). The interest rate collars established a range where we paid the counterparties if the one-month London Interbank Offered Rate ("LIBOR") fell below the established floor rate, and the counterparties paid us if the one-month LIBOR exceeded the established ceiling rate of 2.5%. The interest rate collars settled monthly through the maturity date. No payments or receipts were exchanged on the interest rate collar contracts unless interest rates rose above or fell below the pre-determined ceiling or floor rates. The notional amount amortized consistently with the term loan portion of the Senior Credit Facility under the Credit Agreement prior to the third amendment to the Credit Agreement (the “Third Amendment”). The fair value of the interest rate collars was a Level 2 fair value measurement, as the fair value was determined based on quoted prices of similar instruments in active markets. As of December 31, 2021, the liability for the interest rate collars was $0.7 million, which was included in Other noncurrent liabilities within the Consolidated Balance Sheets. The interest rate collars were classified as cash flow hedges through May 5, 2020.
On May 6, 2020, concurrent with entering into the Third Amendment, we de-designated the interest rate collars. Prior to de-designation, the effective portion of the change in the fair value of the interest rate collars was reported in Accumulated other comprehensive loss. Upon de-designation, the balance in Accumulated other comprehensive loss was being reclassified to Other expense within the Consolidated Statements of Income (Loss) on a straight-line basis through April 2022, which was over the remaining life for which the interest rate collars had previously been designated as cash flow hedges. Changes in the fair value of the interest rate collars after de-designation were included in Other expense within the Consolidated Statements of Income (Loss). During the years ended December 31, 2022, 2021 and 2020, $0.8 million, $2.5 million and $1.6 million, respectively, was paid in interest related to the interest rate collars.
We do not enter into derivative instruments for any speculative purposes.
Daily Cash Collections
As a result of day-to-day activity at our parking locations, we collect significant amounts of cash. Lease type contract revenue is generally deposited into our local bank accounts, with a portion remitted to our clients in the form of rental payments based on the terms of the leases. Under management type contracts, clients may require us to deposit the daily receipts into one of our local bank accounts, with the cash in excess of our operating expenses and management fees remitted to the clients at negotiated intervals. Other clients may require us to deposit the daily receipts into client designated bank accounts and the clients then reimburse us for operating expenses and pay our management fee subsequent to month-end. In addition, our clients may require segregated bank accounts for receipts and
23
disbursements. Our working capital and liquidity may be adversely affected if a significant number of our clients require us to deposit all parking revenues into their respective accounts.
Our liquidity also fluctuates on an intra-month and intra-year basis depending on the contract mix and timing of significant cash payments. Additionally, our ability to utilize cash deposited into our local accounts is dependent upon the availability and movement of that cash into our corporate accounts. For all these reasons, from time to time, we carry a significant cash balance, while also utilizing our Senior Credit Facility.
Cash and Cash Equivalents
We had cash and cash equivalents of $12.4 million and $15.7 million as of December 31, 2022 and 2021, respectively. The cash balances reflect our ability to utilize funds deposited into our bank accounts. Availability, timing of deposits and the subsequent movement of cash into our corporate bank accounts may result in significant changes to our cash balances.
Summary of Cash Flows
Our primary sources of liquidity are cash flows from operating activities and availability under our Senior Credit Facility. Our cash flows during the years ended December 31, 2022, 2021 and 2020 were as follows:
|
|
Years ended December 31, |
|
|||||||||
(millions) |
|
2022 |
|
|
2021 |
|
|
2020 |
|
|||
Net cash provided by operating activities |
|
$ |
93.3 |
|
|
$ |
53.4 |
|
|
$ |
40.2 |
|
Net cash used in by investing activities |
|
|
(54.0 |
) |
|
|
(9.1 |
) |
|
|
(11.5 |
) |
Net cash used in financing activities |
|
|
(42.4 |
) |
|
|
(42.4 |
) |
|
|
(39.0 |
) |
Effect of exchange rate changes on cash and cash equivalents |
|
|
(0.2 |
) |
|
|
(0.1 |
) |
|
|
0.1 |
|
Net (decrease) increase in cash and cash equivalents |
|
|
(3.3 |
) |
|
|
1.8 |
|
|
|
(10.2 |
) |
Operating Activities
Net cash provided by operating activities increased $39.9 million to $93.3 million during the year ended December 31, 2022 from $53.4 million during the year ended December 31, 2021. The increase in net cash provided by operating activities primarily resulted from higher operating income, net of non-cash related items, due to improving business conditions, as well as the receipt of the $20.5 million U.S. Federal income tax refund related to our ability to carry back our 2020 U.S. Federal NOL and lower interest payments, partially offset by the payment of performance based compensation and higher income tax installment payments during the year ended December 31, 2022.
Net cash provided by operating activities increased $13.2 million to $53.4 million during the year ended December 31, 2021 from $40.2 million during the year ended December 31, 2020. The increase in net cash provided by operating activities primarily resulted from higher operating income, net of non-cash related items, due to improving business conditions, partially offset by the early repayment of deferred FICA taxes during the year ended December 31, 2021 and our significant efforts during March 2020 to control working capital to prepare for the uncertainty of COVID-19.
Investing Activities
Net cash used in investing activities was $54.0 million during the year ended December 31, 2022, an increase of $44.9 million from $9.1 million during the year ended December 31, 2021. The increase was primarily due to the acquisitions of businesses and other intangible assets, net of cash acquired, of $32.3 million during the year ended December 31, 2022. Cash used to purchase property and equipment, primarily related to our investments in internal-use software, was $21.9 million during the year ended December 31, 2022 as compared to $9.6 million during the year ended December 31, 2021, reflecting our continued investment in technology initiatives during the year ended December 31, 2022.
Net cash used in investing activities was $9.1 million during the year ended December 31, 2021, a decrease of $2.4 million from $11.5 million during the year ended December 31, 2020. The decrease was primarily due to the noncontrolling interest buyout of $1.7 million during the year ended December 31, 2020. Cash used to purchase property and equipment was $9.6 million during the year ended December 31, 2021 as compared to $8.4 million during the year ended December 31, 2020, reflecting our continued investment in technology initiatives during the year ended December 31, 2021.
Financing Activities
Net cash used in financing activities was $42.4 million during the years ended December 31, 2022 and 2021. During the year ended December 31, 2022 we repurchased $48.7 million of common stock under our May 2022 stock repurchase program, partially offset by an increase in borrowings under our Senior Credit Facility that were used, in addition to cash on hand, to fund the acquisitions noted above. During the year ended December 31, 2021, we paid down debt by $40.1 million.
Net cash used in financing activities was $42.4 million during the year ended December 31, 2021, an increase of $3.4 million from $39.0 million during the year ended December 31, 2020. The increase was primarily due to higher payments on debt during the year ended December 31, 2021, partially offset by the repurchases of common stock during the year ended December 31, 2020 that were suspended in March 2020.
Summary Disclosures about Contractual Obligations and Commercial Commitments
The following table summarizes certain contractual obligations as of December 31, 2022 and the effect such obligations are expected to have on our liquidity and cash flow in future periods. We do not have significant short-term purchase obligations.
|
|
Payments Due by Period |
|
|||||||||||||||||
|
|
|
|
|
|
|
|
|
|
|
|
|
|
2028 and |
|
|||||
(millions) |
|
Total |
|
|
2023 |
|
|
2024 - 2025 |
|
|
2026 - 2027 |
|
|
thereafter |
|
|||||
Contractual obligations |
|
|
|
|
|
|
|
|
|
|
|
|
|
|
|
|||||
Operating leases(1) |
|
$ |
253.8 |
|
|
$ |
69.4 |
|
|
$ |
91.3 |
|
|
$ |
50.2 |
|
|
$ |
42.9 |
|
Finance leases |
|
|
25.8 |
|
|
|
8.1 |
|
|
|
10.3 |
|
|
|
4.5 |
|
|
|
2.9 |
|
Service concession arrangements(2) |
|
|
179.4 |
|
|
|
72.2 |
|
|
|
74.0 |
|
|
|
25.8 |
|
|
|
7.4 |
|
Total contractual obligations |
|
$ |
459.0 |
|
|
$ |
149.7 |
|
|
$ |
175.6 |
|
|
$ |
80.5 |
|
|
$ |
53.2 |
|
24
Critical Accounting Policies and Estimates
The preparation of financial statements in conformity with accounting principles generally accepted in the United States ("US GAAP") requires us to make estimates and judgments that affect the reported amounts of assets and liabilities, revenues and expenses and related disclosures of contingent assets and liabilities in the Consolidated Financial Statements and accompanying notes. The SEC has defined a company's critical accounting policies and estimates as the ones that are most important to the portrayal of the company's financial condition and results of operations, and which require the company to make its most difficult and subjective judgments, often as a result of the need to make estimates of matters that are inherently uncertain. Based on this definition, we have identified the critical accounting policies and judgments addressed below. We base these estimates and judgments on historical experience and on various other assumptions that are believed to be reasonable under the circumstances, the results of which form the basis for making judgments about carrying values of assets and liabilities that are not readily apparent from other sources. Certain accounting estimates are particularly sensitive because of their complexity and the possibility that future events affecting them may differ materially from our current judgments and estimates.
This listing of critical accounting policies is not intended to be a comprehensive list of all of our accounting policies. We also have other key accounting policies, which involve the use of estimates, judgments, and assumptions that are significant to understanding our results, which are included in Note 1. Significant Accounting Policies and Practices in the notes to the Consolidated Financial Statements included in Part IV, Item 15. "Exhibits and Financial Statement Schedules."
Goodwill and Other Intangible Assets
Goodwill represents the excess of the purchase price paid over the fair value of net assets acquired. In accordance with the Financial Accounting Standards Board's ("FASB") authoritative accounting guidance on goodwill, we evaluate goodwill for impairment on an annual basis, or more often if events or circumstances change that could cause goodwill to become impaired. We have elected to assess the impairment of goodwill annually on October 1 or at an interim date if there is an event or change in circumstances indicating the carrying value may not be recoverable. The goodwill impairment test is performed at the reporting unit level; our reporting units represent our operating segments, consisting of Commercial and Aviation. Factors that could trigger an impairment review include significant under-performance relative to expected historical or projected future operating results, significant changes in the use of acquired assets or our business strategy, and significant negative industry or economic trends.
We may perform a qualitative, rather than quantitative, assessment to determine whether it is more likely than not that the fair value of a reporting unit is less than its carrying amount. If we determine impairment is present, we would need to perform a quantitative assessment. The determination of fair value of a reporting unit utilizes cash flow projections that assume certain future revenue and cost levels, comparable marketplace data, comparable company market valuations, assumed discount rates based upon current market conditions and other valuation factors, all of which involve the use of significant judgment and estimates. We also assess critical areas that may impact our business including economic conditions, market related exposures, competition, changes in service offerings and changes in key personnel.
Other intangible assets represent assets with finite lives that are amortized on a straight-line basis over their estimated useful lives. We evaluate other intangible assets on a periodic basis to determine whether events or circumstances warrant a revision to their remaining useful lives. In addition, other intangible assets are reviewed for impairment when circumstances change that would indicate the carrying value may not be recoverable. Assumptions and estimates about future values and remaining useful lives of intangible assets are complex and subjective, and can be affected by a variety of factors, including external factors such as industry and economic trends, and internal factors, such as changes in our business strategy and forecasts. Although we believe the historical assumptions and estimates are reasonable and appropriate, different assumptions and estimates could materially impact our reported financial results.
Long-Lived Assets
We evaluate long-lived assets, including ROU assets, leasehold improvements, equipment and construction in progress, for impairment whenever events or circumstances indicate that the carrying value of an asset or asset group may not be recoverable. We group assets at the lowest level for which cash flows are separately identified in order to measure an impairment. Events or circumstances that would result in an impairment review include a significant change in the use of an asset, the planned sale or disposal of an asset, or a projection or forecast that demonstrates continuing losses associated with the use of a long-lived asset or asset group. Recoverability of assets to be held and used is measured by a comparison of the carrying amount of the asset to future undiscounted cash flows expected to be generated by the asset or asset group. If the asset or asset group is determined to be impaired, the impairment recognized is measured by the amount by which the carrying value of the asset or asset group exceeds its fair value.
Assumptions and estimates used to determine cash flows in the evaluation of impairment and the fair values used to determine the impairment are subject to a degree of judgment and complexity. Any future changes to the assumptions and estimates resulting from changes in actual results or market conditions from those anticipated may affect the carrying value of long-lived assets and could result in additional impairment charges. Future events that may result in impairment charges include economic volatility, or other factors, which could decrease revenues and profitability of existing locations.
Insurance Reserves
We purchase comprehensive casualty insurance covering certain claims that arise in connection with our operations. In addition, we purchase umbrella/excess liability coverage. Under the various liability and workers' compensation insurance policies, we are obligated to pay directly or reimburse the insurance carrier for the deductible / retention amount of each loss covered by our general / garage, automobile, workers' compensation and garage keepers legal liability policies. As a result, we are effectively self-insured for all claims within the deductible / retention amount of each loss. Any loss over the deductible / retention is the responsibility of the third-party insurer. The expense recognition is based upon our determination of an unfavorable outcome of a claim being deemed as probable and capable of being reasonably estimated. This determination requires the use of judgment in both the estimation of probability and the amount to be recognized as an expense. We utilize historical claims experience and exposures specific to each type of insurance, along with actuarial methods performed quarterly by a third party actuarial adviser in determining the required level of insurance reserves. As of December 31, 2022, the insurance reserve for general, garage, automobile and workers’ compensation liabilities was $48.4 million, of which $24.0 million and $24.4 million was recorded in Accrued and other current liabilities and Other noncurrent liabilities, respectively, within the Consolidated Balance Sheets. Future information regarding historical loss experience may require changes to the level of insurance reserves and could result in increased expense in the future.
25
Allowance for Doubtful Accounts
Accounts receivable, net of the allowance for doubtful accounts, represents our estimate of the amount that ultimately will be realized in cash. We review the adequacy of the allowance for doubtful accounts on an ongoing basis, primarily using a review of specific accounts, as well as historical collection trends and aging of receivables, and record adjustments to the allowance as necessary. Changes in economic conditions or other circumstances could have an impact on the collection of existing receivable balances or future allowance considerations.
Income Taxes
Deferred income taxes are computed using the asset and liability method, such that deferred tax assets and liabilities are recognized for deductible temporary differences between US GAAP amounts and the tax basis of existing assets and liabilities based on currently enacted tax laws and tax rates in effect for the periods in which these temporary differences are expected to reverse or be settled. Income tax expense (benefit) is the tax payable (receivable) for the period plus the change during the period in deferred income taxes. We have certain state NOL carry forwards which expire in 2042. We consider a number of factors in our assessment of the recoverability of our NOL carryforwards including their expiration dates and the limitations imposed due to the change in ownership, as well as future projections of income. Future changes in our operating performance, along with these considerations, may significantly impact the amount of NOLs ultimately recovered, and our assessment of their recoverability.
We recognize deferred tax liabilities related to taxes on certain foreign earnings that are not considered to be permanently invested.
When evaluating our tax positions, we account for uncertainty in income taxes in our Consolidated Financial Statements. The evaluation of a tax position is a two-step process, the first step being recognition. The first step is to determine whether it is more-likely-than-not that a tax position will be sustained upon tax examination, including resolution of any related appeals or litigation processes, based on the technical merits of the position and the weight of available evidence. If a tax position does not meet the more-likely-than-not threshold, which is more than 50% likely of being realized, the benefit of that position is not recognized in our financial statements. The second step is measurement of the tax benefit. The tax position is measured as the largest amount of benefit that is more-likely-than-not of being realized, which is more than 50% likely of being realized upon ultimate resolution with a taxing authority.
Legal and Other Contingencies
We are subject to claims and litigation in the normal course of our business, including those related to labor and employment, contracts, personal injury and other related matters, some of which allege substantial monetary damages and claims. Some of these actions may be brought as class actions on behalf of a class or purported class of employees. While the outcomes of claims and legal proceedings brought against us are subject to uncertainty, we believe the final outcome will not have a material adverse effect on our financial position, results of operations or cash flows.
We accrue a charge when we determine that it is probable that an asset has been impaired or a liability has been incurred and the amount of loss can be reasonably estimated. When a loss is probable, we record an accrual based on the reasonably estimable loss or range of loss. When no point of loss is more likely than another, we record the lowest amount in the estimated range of loss, and if material, disclose the estimated range. We do not record liabilities for reasonably possible loss contingencies, but do disclose a range of reasonably possible losses if they are material and we are able to estimate such a range. If we cannot provide a range of reasonably possible losses, we explain the factors that prevent us from determining such a range. We regularly evaluate current information available to us to determine whether an accrual should be established or adjusted. Estimating the probability that a loss will occur and the amount of a loss or a range of loss involves significant estimation and judgment.
Item 7A. Quantitative and Qualitative Disclosures About Market Risk
Interest Rates
Our primary market risk exposure consists of risk related to changes in interest rates. We use the variable rate Senior Credit Facility to finance our operations. The Senior Credit Facility exposes us to variability in interest payments due to changes in interest rates. If interest rates increase, interest expense increases and conversely, if interest rates decrease, interest expense also decreases. We believe that it is prudent to limit our exposure to an increase in interest rates. See Note 12. Borrowing Arrangements in the Notes to the Consolidated Financial Statements for further discussion.
A one percent increase in the average market rate would result in an increase in our annual interest expense of $3.2 million related to borrowings outstanding on our Senior Credit Facility.
Foreign Currency Risk
We are exposed to the impact of foreign currency fluctuations in certain countries in which we operate. The exposure to foreign currency movements is limited in our Canada and India subsidiaries because the operating revenues and expenses are substantially in the local currency in which they operate. Even though our United Kingdom subsidiary transacts business in many countries, their exposure to foreign currency fluctuations is considered not significant. We had $0.8 million of foreign denominated cash instruments and no debt instruments denominated in foreign currencies as of December 31, 2022. We do not hold any hedging instruments related to foreign currency transactions.
We monitor foreign currency positions and may enter into certain hedging instruments in the future if we determine the exposure to foreign exchange risk has increased.
Item 8. Financial Statements and Supplementary Data
The Consolidated Financial Statements and related notes and schedules required by this item are incorporated into this Form 10-K and set forth in Part IV, Item 15. "Exhibits and Financial Statement Schedules" herein.
Item 9. Changes in and Disagreements with Accountants on Accounting and Financial Disclosure
None.
Item 9A. Controls and Procedures
Evaluation of Disclosure Controls and Procedures
Prior to the filing of our Annual Report on Form 10-K for the fiscal year ended December 31, 2022 and under the supervision and with the participation of our management, including our Chief Executive Officer, Chief Financial Officer and Corporate Controller, we carried out an evaluation of the effectiveness of the design and operation of our disclosure controls and procedures (the "Evaluation") as of the last day of the period covered by this Form 10-K.
26
Disclosure controls and procedures are defined by Rules 13a-15(e) and 15d-15(e) of the Exchange Act as controls and other procedures that are designed to ensure that information required to be disclosed in the reports that we file or submit under the Exchange Act is recorded, processed, summarized and reported within the time periods specified by the SEC's rules and forms. Disclosure controls and procedures include, without limitation, controls and procedures designed to ensure that information required to be disclosed in the reports that we file or submit under the Exchange Act is accumulated and communicated to our management, including our Chief Executive Officer, Chief Financial Officer and Corporate Controller, to allow timely decisions regarding required disclosures.
Based upon the Evaluation, our Chief Executive Officer, Chief Financial Officer and Corporate Controller concluded that, as of December 31, 2022, our disclosure controls and procedures were effective to promote reasonable assurance that information required to be disclosed by us in the reports that we file or submit under the Exchange Act is recorded, processed, summarized and reported accurately and within the time frames specified in the SEC's rules and forms and accumulated and communicated to our management, including our Chief Executive Officer, Chief Financial Officer and Corporate Controller, as appropriate to allow timely decisions regarding required disclosure.
Inherent Limitations of the Effectiveness of Internal Control
Our internal control over financial reporting is designed to provide reasonable assurance regarding the reliability of financial reporting and the preparation of financial statements for external purposes in accordance with US GAAP. Our internal control over financial reporting includes those policies and procedures that:
Management, including our Chief Executive Officer, Chief Financial Officer and Corporate Controller, does not expect that our internal controls will prevent or detect all errors and all fraud. A control system, no matter how well designed and operated, can provide only reasonable, not absolute, assurance that the objectives of the control system are met. Further, the design of a control system must reflect the fact that there are resource constraints, and the benefits of controls must be considered relative to their costs. Because of the inherent limitations in all control systems, no evaluation of internal controls can provide absolute assurance that all control issues and instances of fraud, if any, have been detected. Also, any evaluation of the effectiveness of controls in future periods are subject to the risk that those internal controls may become inadequate because of changes in business conditions, or that the degree of compliance with the policies or procedures may deteriorate.
Management's Annual Report on Internal Control over Financial Reporting
Our management is responsible for establishing and maintaining adequate internal control over financial reporting. Our internal control system was designed to provide reasonable assurance to our management and Board of Directors regarding the preparation and fair presentation of our published financial statements.
Prior to the filing of our Annual Report on Form 10-K for the fiscal year ended December 31, 2022, our management assessed the effectiveness of our internal control over financial reporting as of the last day of the period covered by the report. In making this assessment, our management used the criteria set forth by the Committee of Sponsoring Organizations of the Treadway Commission ("COSO") in Internal Control—Integrated Framework (2017 Framework). Based on our Evaluation under the COSO Framework, our management concluded that our internal control over financial reporting was effective as of December 31, 2022. Management's assessment of internal control over financial reporting as of December 31, 2022 excludes internal control over financial reporting related to KMP (acquired October 11, 2022) and DIVRT (acquired November 10, 2022). KMP and DIVRT constituted 4% of total assets as of December 31, 2022, and less than 1% of the revenues during the year ended December 31, 2022.
Ernst & Young LLP has audited the Consolidated Financial Statements included in this Annual Report on Form 10-K and, as part of its audit, has issued an attestation report, included herein, on the effectiveness of our internal control over financial reporting.
Changes in Internal Control over Financial Reporting
There have been no significant changes in our internal control over financial reporting that occurred during the quarter ended December 31, 2022, that were identified in connection with management’s evaluation required by paragraph (d) of Rules 13a-15 and 15d-15 under the Exchange Act, that have materially affected or are reasonably likely to materially affect our internal control over financial reporting.
Management's assessment and conclusions on the effectiveness of internal control over financial reporting did not include the internal control over KMP or DIVRT, which are included in 2022 Consolidated Financial Statements of SP Plus Corporation.
Item 9B. Other Information
None.
Item 9C. Disclosure Regarding Foreign Jurisdictions that Prevent Inspections
None.
27
PART III
Item 10. Directors, Executive Officers and Corporate Governance
Information required by this item with respect to our directors and compliance by our directors, executive officers and certain beneficial owners of our common stock with Section 16(a) of the Exchange Act is incorporated by reference to all information under the captions entitled "Board Matters—Nominees for Director," "Board Matters—Nomination Process," "Our Corporate Governance Practices—Codes of Conduct and Ethics," "Board Committees and Meetings," "Executive Officers" and "Delinquent Section 16(a) Reports" (if any) included in our 2023 Proxy Statement.
We have adopted a code of ethics as part of our compliance program. The code of ethics applies to our Chief Executive Officer (Principal Executive Officer), Chief Financial Officer (Principal Financial Officer) and Corporate Controller (Principal Accounting Officer). In addition, we have adopted a code of business conduct that applies to all of our officers and employees. Any amendments to, or waivers from, our code of ethics will be posted on our website www.spplus.com. A copy of these codes of conduct and ethics will be provided to you without charge upon request to investor_relations@spplus.com.
Item 11. Executive Compensation
Information required by this item is incorporated by reference to all information under the caption entitled "Board Committees and Meetings-Committees of the Board-Compensation Committee-Compensation Committee Interlocks and Insider Participation," "Compensation Discussion and Analysis," "Compensation Committee Report," "Executive Compensation," and "Non-Employee Director Compensation" included in our 2023 Proxy Statement.
Item 12. Security Ownership of Certain Beneficial Owners and Management and Related Stockholder Matters
Information required by this item is incorporated by reference to all information under the caption entitled "Equity Compensation Plan Information" and "Security Ownership" included in our 2023 Proxy Statement.
Information required by this item is incorporated by reference to all information under the caption "Board Matters—Nomination Process—Board Designees," "Our Corporate Governance Practices—Director Independence," "Our Corporate Governance Practices—Related-Party Transaction Policy," and "Transactions with Related Persons and Control Persons" included in our 2023 Proxy Statement.
Item 14. Principal Accountant Fees and Services
Information required by this item is incorporated by reference to all information under the caption "Audit Committee Disclosure—Principal Accounting Fees and Services," and "Audit Committee Disclosure—Procedures for Audit Committee Pre-Approval of Audit and Permissible Non-Audit Services of Independent Registered Public Accounting Firm" included in our 2023 Proxy Statement.
28
PART IV
Item 15. Exhibits and Financial Statement Schedules
(a) Documents filed as part of this report
1. All Financial Statements
Index to Consolidated Financial Statements
Report of Independent Registered Public Accounting Firm (PCAOB ID: 42) |
|
33 |
Report of Independent Registered Public Accounting Firm on Internal Control over Financial Reporting |
|
34 |
Audited Consolidated Financial Statements |
|
|
Consolidated Balance Sheets as of December 31, 2021 and 2020 |
|
35 |
For the years ended December 31, 2021, 2020 and 2019 |
|
|
|
36 |
|
|
37 |
|
|
38 |
|
|
39 |
|
|
40 |
2. Financial Statement Schedule
Schedules are omitted since the required information is not present or is not present in amounts sufficient to require submission of the schedule, or because the information required is included in the Consolidated Financial Statements or notes thereto.
3. Exhibits
|
|
|
|
Incorporated by Reference |
||||
Exhibit Number |
|
Description |
|
Form |
|
Exhibit |
|
Filing Date/Period End Date |
|
|
|
|
|
|
|
|
|
2.1 |
|
|
8-K |
|
2.1 |
|
October 17, 2018 |
|
|
|
|
|
|
|
|
|
|
3.1 |
|
Second Amended and Restated Certificate of Incorporation of the Company filed on June 2, 2004. |
|
10-K |
|
3.1 |
|
December 31, 2008 |
|
|
|
|
|
|
|
|
|
3.1.1 |
|
|
10-K |
|
3.1.1 |
|
December 31, 2008 |
|
|
|
|
|
|
|
|
|
|
3.1.2 |
|
|
10-Q |
|
3.1.3 |
|
June 30, 2010 |
|
|
|
|
|
|
|
|
|
|
3.1.3 |
|
|
10-Q |
|
3.1.4 |
|
June 30, 2010 |
|
|
|
|
|
|
|
|
|
|
3.1.4 |
|
|
8-K |
|
3.1 |
|
December 2, 2013 |
|
|
|
|
|
|
|
|
|
|
3.2 |
|
Fourth Amended and Restated Bylaws of the Company dated January 1, 2010. |
|
10-Q |
|
3.1 |
|
September 30, 2016 |
|
|
|
|
|
|
|
|
|
3.2.1 |
|
Amendment to Fourth Amended and Restated Bylaws of the Company dated February 19, 2016. |
|
10-Q |
|
3.1.1 |
|
September 30, 2016 |
|
|
|
|
|
|
|
|
|
3.2.2 |
|
Amendment to Fourth Amended and Restated Bylaws of the Company dated August 5, 2016. |
|
10-Q |
|
3.1.2 |
|
September 30, 2016 |
|
|
|
|
|
|
|
|
|
4.1 |
|
|
10-K |
|
4.1 |
|
December 31, 2015 |
|
|
|
|
|
|
|
|
|
|
4.2 |
|
|
10-K |
|
4.2 |
|
February 22, 2021 |
|
|
|
|
|
|
|
|
|
|
10.1 |
|
|
8-K |
|
10.1 |
|
November 30, 2018 |
|
|
|
|
|
|
|
|
|
|
10.1.1 |
|
|
10-K |
|
10.1.1 |
|
February 27, 2019 |
|
|
|
|
|
|
|
|
|
|
10.1.2 |
|
|
10-Q |
|
10.1 |
|
October 31, 2019 |
|
|
|
|
|
|
|
|
|
|
29
10.1.3 |
|
|
10-Q |
|
10.1 |
|
May 11, 2020 |
|
|
|
|
|
|
|
|
|
|
10.1.4 |
|
|
10-K |
|
10.1.4 |
|
February 22, 2021 |
|
|
|
|
|
|
|
|
|
|
10.1.5 |
|
|
8-K |
|
10.1 |
|
April 26, 2022 |
|
|
|
|
|
|
|
|
|
|
10.2+ |
|
|
10-K |
|
10.22.2 |
|
December 31, 2012 |
|
|
|
|
|
|
|
|
|
|
10.2.1+ |
|
|
8-K |
|
10.3 |
|
March 7, 2005 |
|
|
|
|
|
|
|
|
|
|
10.2.2+ |
|
|
|
|
|
|
|
|
|
|
|
|
|
|
|
|
|
10.2.3+ |
|
|
10-Q |
|
10.8 |
|
June 30, 2012 |
|
|
|
|
|
|
|
|
|
|
10.2.4 |
|
|
8-K |
|
10.2 |
|
December 30, 2022 |
|
|
|
|
|
|
|
|
|
|
10.3+ |
|
|
10-Q |
|
10.1 |
|
August 1, 2019 |
|
|
|
|
|
|
|
|
|
|
10.3.1+ |
|
|
8-K |
|
10.4 |
|
December 30, 2022 |
|
|
|
|
|
|
|
|
|
|
10.4+ |
|
Executive Employment Agreement by and between Baggage Airline Guest Services, Inc., and Robert Miles |
|
10-K |
|
10.5 |
|
February 22, 2021 |
|
|
|
|
|
|
|
|
|
10.5+ |
|
|
10-Q |
|
10.9 |
|
September 30, 2012 |
|
|
|
|
|
|
|
|
|
|
10.5.1+ |
|
|
10-K |
|
10.7.1 |
|
December 31, 2017 |
|
|
|
|
|
|
|
|
|
|
10.5.2+ |
|
Second Amendment to Employment Agreement dated February 15, 2017 between the Company and Rob Toy. |
|
10-K |
|
10.12.1 |
|
December 31, 2016 |
|
|
|
|
|
|
|
|
|
10.5.3+ |
|
|
8-K |
|
10.1 |
|
December 30, 2022 |
|
|
|
|
|
|
|
|
|
|
10.6+ |
|
Consulting Agreement between SP Plus Corporation and John Ricchiuto, dated as of December 29, 2022. |
|
8-K |
|
10.3 |
|
December 30, 2022 |
|
|
|
|
|
|
|
|
|
10.7+ |
|
|
8-K/A |
|
10.1 |
|
September 27, 2019 |
|
|
|
|
|
|
|
|
|
|
10.8+ |
|
|
8-K |
|
10.5 |
|
December 30, 2022 |
|
|
|
|
|
|
|
|
|
|
10.9+ |
|
|
10-K |
|
10.8 |
|
February 27, 2019 |
|
|
|
|
|
|
|
|
|
|
10.10+ |
|
Form of Performance Share Agreement between the Company and Recipient. |
|
10-K |
|
4.1 |
|
December 31, 2015 |
|
|
|
|
|
|
|
|
|
10.11+ |
|
Form of the Company's Restricted Stock Unit Agreement dated as of July 1, 2008. |
|
8-K |
|
10.1 |
|
July 2, 2008 |
|
|
|
|
|
|
|
|
|
10.11.1+ |
|
First Amendment to Form of the Company's Restricted Stock Unit Agreement. |
|
8-K |
|
10.1 |
|
August 6, 2009 |
|
|
|
|
|
|
|
|
|
10.11.2+ |
|
Second Amendment to Form of the Company's Restricted Stock Unit Agreement dated May 27, 2011. |
|
8-K |
|
10.1 |
|
June 2, 2011 |
|
|
|
|
|
|
|
|
|
10.11.3 |
|
Third Amendment to Form of the Company's Restricted Stock Unit Agreement dated March 2, 2017. |
|
10-Q |
|
10.1 |
|
May 6, 2019 |
|
|
|
|
|
|
|
|
|
30
10.12 |
|
|
10-K |
|
10.23 |
|
December 31, 2013 |
|
|
|
|
|
|
|
|
|
|
10.13 |
|
|
10-K |
|
10.24 |
|
December 31, 2013 |
|
|
|
|
|
|
|
|
|
|
10.14 |
|
|
10-K |
|
10.30 |
|
December 31, 2005 |
|
|
|
|
|
|
|
|
|
|
10.15 |
|
|
10-K |
|
10.27 |
|
December 31, 2008 |
|
|
|
|
|
|
|
|
|
|
10.16 |
|
|
10-K |
|
10.28 |
|
December 31, 2008 |
|
|
|
|
|
|
|
|
|
|
10.17 |
|
|
10-K |
|
10.29 |
|
December 31, 2008 |
|
|
|
|
|
|
|
|
|
|
10.18 |
|
SP Plus Corporation Long-Term Incentive Plan, as Amended and Restated, adopted as of March 4, 2021 |
|
S-8 |
|
10.1 |
|
May 14, 2021 |
|
|
|
|
|
|
|
|
|
21* |
|
|
|
|
|
|
|
|
|
|
|
|
|
|
|
|
|
23* |
|
Consent of Independent Registered Public Accounting Firm dated as of February 24, 2023. |
|
|
|
|
|
|
|
|
|
|
|
|
|
|
|
31.1* |
|
|
|
|
|
|
|
|
|
|
|
|
|
|
|
|
|
31.2* |
|
|
|
|
|
|
|
|
|
|
|
|
|
|
|
|
|
31.3* |
|
|
|
|
|
|
|
|
|
|
|
|
|
|
|
|
|
32** |
|
|
|
|
|
|
|
|
|
|
|
|
|
|
|
|
|
101.INS * |
|
Inline XBRL Instance Document - the instance document does not appear in the Interactive Data File because its XBRL tags are embedded within the Inline XBRL document. |
|
|
|
|
|
|
|
|
|
|
|
|
|
|
|
101.SCH * |
|
Inline XBRL Taxonomy Extension Schema. |
|
|
|
|
|
|
|
|
|
|
|
|
|
|
|
101.CAL * |
|
Inline XBRL Taxonomy Extension Calculation Linkbase. |
|
|
|
|
|
|
|
|
|
|
|
|
|
|
|
101.DEF * |
|
Inline XBRL Taxonomy Extension Definition Linkbase. |
|
|
|
|
|
|
|
|
|
|
|
|
|
|
|
101.LAB * |
|
Inline XBRL Taxonomy Extension Label Linkbase. |
|
|
|
|
|
|
|
|
|
|
|
|
|
|
|
101.PRE * |
|
Inline XBRL Taxonomy Extension Presentation Linkbase. |
|
|
|
|
|
|
104 |
|
Cover Page Interactive Data File (embedded within Inline XBRL document). |
|
|
|
|
|
|
|
|
|
|
|
|
|
|
|
* Filed herewith.
** Furnished herewith.
+ Management contract or compensation plan, contract or agreement.
Item 16. Form 10-K Summary
None.
31
SIGNATURES
Pursuant to the requirements of Section 13 or 15(d) of the Securities Exchange Act of 1934, the registrant has duly caused this report to be signed on its behalf by the undersigned, thereunto duly authorized.
|
SP PLUS CORPORATION |
||
Date: February 24, 2023 |
By: |
|
/s/ KRISTOPHER H. ROY |
|
|
|
Kristopher H. Roy |
|
|
|
Chief Financial Officer |
|
|
|
(Principal Financial Officer) |
|
|
|
|
Pursuant to the requirements of the Securities Exchange Act of 1934, this report has been signed below by the following persons on behalf of the Registrant and in the capacities and on the dates indicated.
Signature |
|
Title |
|
Date |
|
|
|
|
|
/s/ G MARC BAUMANN |
|
Chairman and Chief Executive Officer (Principal Executive Officer) |
|
February 24, 2023 |
G Marc Baumann |
|
|
|
|
|
|
|
|
|
/s/ ALICE M. PETERSON |
|
Director |
|
February 24, 2023 |
Alice M. Peterson |
|
|
|
|
/s/ GREGORY A. REID |
|
Director |
|
February 24, 2023 |
Gregory A. Reid |
|
|
|
|
/s/ WYMAN T. ROBERTS |
|
Director |
|
February 24, 2023 |
Wyman T. Roberts |
|
|
|
|
/s/ DIANA L. SANDS |
|
Director |
|
February 24, 2023 |
Diana L. Sands |
|
|
|
|
/s/ DOUGLAS R. WAGGONER |
|
Lead Independent Director |
|
February 24, 2023 |
Douglas R. Waggoner |
|
|
|
|
|
|
|
|
|
/s/ KRISTOPHER H. ROY |
|
Chief Financial Officer (Principal Financial Officer) |
|
February 24, 2023 |
Kristopher H. Roy |
|
|
|
|
|
|
|
|
|
/s/ GARY T. ROBERTS |
|
Senior Vice President, Corporate Controller and Assistant Treasurer (Principal Accounting Officer and Duly Authorized Officer) |
|
February 24, 2023 |
Gary T. Roberts |
|
|
|
|
|
|
|
|
|
32
Report of Independent Registered Public Accounting Firm
To the Stockholders and the Board of Directors of SP Plus Corporation
Opinion on the Financial Statements
We have audited the accompanying consolidated balance sheets of SP Plus Corporation (the Company) as of December 31, 2022 and 2021, the related consolidated statements of income (loss), comprehensive income (loss), stockholders’ equity and cash flows for each of the three years in the period ended December 31, 2022, and the related notes (collectively referred to as the “consolidated financial statements”). In our opinion, the consolidated financial statements present fairly, in all material respects, the financial position of the Company at December 31, 2022 and 2021, and the results of its operations and its cash flows for each of the three years in the period ended December 31, 2022, in conformity with U.S. generally accepted accounting principles.
We also have audited, in accordance with the standards of the Public Company Accounting Oversight Board (United States) (PCAOB), the Company's internal control over financial reporting as of December 31, 2022, based on criteria established in Internal Control-Integrated Framework issued by the Committee of Sponsoring Organizations of the Treadway Commission (2013 framework) and our report dated February 24, 2023 expressed an unqualified opinion thereon.
Basis for Opinion
These financial statements are the responsibility of the Company's management. Our responsibility is to express an opinion on the Company’s financial statements based on our audits. We are a public accounting firm registered with the PCAOB and are required to be independent with respect to the Company in accordance with the U.S. federal securities laws and the applicable rules and regulations of the Securities and Exchange Commission and the PCAOB.
We conducted our audits in accordance with the standards of the PCAOB. Those standards require that we plan and perform the audit to obtain reasonable assurance about whether the financial statements are free of material misstatement, whether due to error or fraud. Our audits included performing procedures to assess the risks of material misstatement of the financial statements, whether due to error or fraud, and performing procedures that respond to those risks. Such procedures included examining, on a test basis, evidence regarding the amounts and disclosures in the financial statements. Our audits also included evaluating the accounting principles used and significant estimates made by management, as well as evaluating the overall presentation of the financial statements. We believe that our audits provide a reasonable basis for our opinion.
Critical Audit Matter
The critical audit matter communicated below is a matter arising from the current period audit of the financial statements that was communicated or required to be communicated to the audit committee and that: (1) relates to accounts or disclosures that are material to the financial statements and (2) involved our especially challenging, subjective or complex judgments. The communication of the critical audit matter does not alter in any way our opinion on the consolidated financial statements, taken as a whole, and we are not, by communicating the critical audit matter below, providing a separate opinion on the critical audit matter or on the accounts or disclosures to which it relates.
|
|
Valuation of insurance reserves for claims incurred but not reported |
Description of the Matter |
|
As discussed in Note 1 to the consolidated financial statements, the Company purchases comprehensive liability insurance covering certain claims that occur in its operations, including coverage for general, garage and automobile liabilities. In addition, the Company purchases workers' compensation insurance coverage for all eligible employees and umbrella/excess liability insurance coverage. Under these various insurance policies, the Company is effectively self-insured for all claims up to the retention amount of each loss. Any loss over the retention is the responsibility of the third-party insurer. The Company’s insurance reserves for claims that have been incurred but not reported (IBNR) are based upon historical claims experience and actuarial methods performed by a third-party actuarial advisor. As of December 31, 2022, the insurance reserves for general, garage, automobile and workers’ compensation liabilities are recorded in Accrued and other current liabilities and Other noncurrent liabilities in the Consolidated Balance Sheets for $24.0 million and $24.4 million, respectively. Auditing management's insurance reserves was complex due to the estimation required in determining the reserves, which requires the use of actuarial methods and is dependent on claims experience history that is utilized in the actuarial analysis. |
How We Addressed the Matter in Our Audit |
|
We obtained an understanding, evaluated the design, and tested the operating effectiveness of controls over the Company’s IBNR process, including controls over management’s review of the actuarial analysis and the data inputs provided to the actuary to perform the analysis. To test the insurance reserves, we performed audit procedures over the completeness and accuracy of the underlying claims data provided to management’s third-party actuarial advisers, which is the basis used to estimate total ultimate dollar value of claims and the expected amount of IBNR claims. Furthermore, we involved our actuarial specialist to assist in our evaluation of the methodologies and assumptions applied by management’s third-party actuarial advisers in measuring the actuarially determined reserve. We compared the Company’s recorded reserves to a range which our actuarial specialist developed based on independently selected assumptions. We also reconciled management’s third-party actuarial advisers’ report to the Company’s insurance liability reserve to amounts recorded by the Company. |
|
||
/s/ ERNST & YOUNG LLP
We have served as the Company’s auditor since 1989.
Chicago, Illinois
February 24, 2023
33
Report of Independent Registered Public Accounting Firm
To the Stockholders and the Board of Directors of SP Plus Corporation
Opinion on Internal Control Over Financial Reporting
We have audited SP Plus Corporation’s internal control over financial reporting as of December 31, 2022, based on criteria established in Internal Control—Integrated Framework issued by the Committee of Sponsoring Organizations of the Treadway Commission (2013 framework) (the COSO criteria). In our opinion, SP Plus Corporation (the Company) maintained, in all material respects, effective internal control over financial reporting as of December 31, 2022, based on the COSO criteria.
As indicated in the accompanying Management's Report on Internal Control Over Financial Reporting, management’s assessment of and conclusion on the effectiveness of internal control over financial reporting did not include the internal controls of KMP Associates Limited and DIVRT, Inc., which are included in the 2022 consolidated financial statements of the Company and constituted 4% of total assets as of December 31, 2022, and less than 1% of revenues for the year then ended. Our audit of internal control over financial reporting of the Company also did not include an evaluation of the internal control over financial reporting of KMP Associates Limited and DIVRT, Inc.
We also have audited, in accordance with the standards of the Public Company Accounting Oversight Board (United States) (PCAOB), the consolidated balance sheets of the Company as of December 31, 2022 and 2021, the related consolidated statements of income (loss),comprehensive income(loss), stockholders’ equity and cash flows for each of the three years in the period ended December 31, 2022, and the related notes and our report dated February 24, 2023 expressed an unqualified opinion thereon.
Basis for Opinion
The Company’s management is responsible for maintaining effective internal control over financial reporting and for its assessment of the effectiveness of internal control over financial reporting included in the accompanying Management's Annual Report on Internal Control over Financial Reporting. Our responsibility is to express an opinion on the Company’s internal control over financial reporting based on our audit. We are a public accounting firm registered with the PCAOB and are required to be independent with respect to the Company in accordance with the U.S. federal securities laws and the applicable rules and regulations of the Securities and Exchange Commission and the PCAOB.
We conducted our audit in accordance with the standards of the PCAOB. Those standards require that we plan and perform the audit to obtain reasonable assurance about whether effective internal control over financial reporting was maintained in all material respects.
Our audit included obtaining an understanding of internal control over financial reporting, assessing the risk that a material weakness exists, testing and evaluating the design and operating effectiveness of internal control based on the assessed risk, and performing such other procedures as we considered necessary in the circumstances. We believe that our audit provides a reasonable basis for our opinion.
Definition and Limitations of Internal Control Over Financial Reporting
A company’s internal control over financial reporting is a process designed to provide reasonable assurance regarding the reliability of financial reporting and the preparation of financial statements for external purposes in accordance with generally accepted accounting principles. A company’s internal control over financial reporting includes those policies and procedures that (1) pertain to the maintenance of records that, in reasonable detail, accurately and fairly reflect the transactions and dispositions of the assets of the company; (2) provide reasonable assurance that transactions are recorded as necessary to permit preparation of financial statements in accordance with generally accepted accounting principles, and that receipts and expenditures of the company are being made only in accordance with authorizations of management and directors of the company; and (3) provide reasonable assurance regarding prevention or timely detection of unauthorized acquisition, use, or disposition of the company’s assets that could have a material effect on the financial statements.
Because of its inherent limitations, internal control over financial reporting may not prevent or detect misstatements. Also, projections of any evaluation of effectiveness to future periods are subject to the risk that controls may become inadequate because of changes in conditions, or that the degree of compliance with the policies or procedures may deteriorate.
/s/ ERNST & YOUNG LLP
Chicago, Illinois
February 24, 2023
34
SP Plus Corporation
Consolidated Balance Sheets
|
|
December 31, |
|
|||||
(millions, except for share and per share data) |
|
2022 |
|
|
2021 |
|
||
Assets |
|
|
|
|
|
|
||
Cash and cash equivalents |
|
$ |
|
|
$ |
|
||
Accounts and notes receivable, net |
|
|
|
|
|
|
||
Prepaid expenses and other current assets |
|
|
|
|
|
|
||
Total current assets |
|
|
|
|
|
|
||
Property and equipment, net |
|
|
|
|
|
|
||
Right-of-use assets |
|
|
|
|
|
|
||
Goodwill |
|
|
|
|
|
|
||
Other intangible assets, net |
|
|
|
|
|
|
||
Deferred taxes |
|
|
|
|
|
|
||
Other noncurrent assets, net |
|
|
|
|
|
|
||
Total noncurrent assets |
|
|
|
|
|
|
||
Total assets |
|
$ |
|
|
$ |
|
||
Liabilities and stockholders' equity |
|
|
|
|
|
|
||
Liabilities |
|
|
|
|
|
|
||
Accounts payable |
|
$ |
|
|
$ |
|
||
Accrued and other current liabilities |
|
|
|
|
|
|
||
Short-term lease liabilities |
|
|
|
|
|
|
||
Current portion of long-term borrowings |
|
|
|
|
|
|
||
Total current liabilities |
|
|
|
|
|
|
||
Long-term borrowings, excluding current portion |
|
|
|
|
|
|
||
Long-term lease liabilities |
|
|
|
|
|
|
||
Other noncurrent liabilities |
|
|
|
|
|
|
||
Total noncurrent liabilities |
|
|
|
|
|
|
||
Total liabilities |
|
$ |
|
|
$ |
|
||
Stockholders' equity |
|
|
|
|
|
|
||
Preferred Stock, par value $ |
|
$ |
|
|
$ |
|
||
Common stock, par value $ |
|
|
|
|
|
|
||
Treasury stock at cost; |
|
|
( |
) |
|
|
( |
) |
Additional paid-in capital |
|
|
|
|
|
|
||
Accumulated other comprehensive loss |
|
|
( |
) |
|
|
( |
) |
Retained earnings |
|
|
|
|
|
|
||
Total SP Plus Corporation stockholders' equity |
|
|
|
|
|
|
||
Noncontrolling interest |
|
|
( |
) |
|
|
( |
) |
Total stockholders' equity |
|
|
|
|
|
|
||
Total liabilities and stockholders' equity |
|
$ |
|
|
$ |
|
||
See Notes to Consolidated Financial Statements.
35
SP Plus Corporation
Consolidated Statements of Income (Loss)
|
|
Years Ended December 31, |
|
|||||||||
(millions, except for share and per share data) |
|
2022 |
|
|
2021 |
|
|
2020 |
|
|||
Services revenue |
|
|
|
|
|
|
|
|
|
|||
Lease type contracts |
|
$ |
|
|
$ |
|
|
$ |
|
|||
Management type contracts |
|
|
|
|
|
|
|
|
|
|||
|
|
|
|
|
|
|
|
|
|
|||
Reimbursed management type contract revenue |
|
|
|
|
|
|
|
|
|
|||
Total services revenue |
|
|
|
|
|
|
|
|
|
|||
Cost of services (exclusive of depreciation and amortization) |
|
|
|
|
|
|
|
|
|
|||
Lease type contracts |
|
|
|
|
|
|
|
|
|
|||
Management type contracts |
|
|
|
|
|
|
|
|
|
|||
Lease impairment |
|
|
|
|
|
|
|
|
|
|||
|
|
|
|
|
|
|
|
|
|
|||
Reimbursed management type contract expense |
|
|
|
|
|
|
|
|
|
|||
Total cost of services (exclusive of depreciation and amortization) |
|
|
|
|
|
|
|
|
|
|||
General and administrative expenses |
|
|
|
|
|
|
|
|
|
|||
Depreciation and amortization |
|
|
|
|
|
|
|
|
|
|||
Impairment of goodwill and intangible assets |
|
|
|
|
|
|
|
|
|
|||
Operating income (loss) |
|
|
|
|
|
|
|
|
( |
) |
||
Other expense (income) |
|
|
|
|
|
|
|
|
|
|||
Interest expense |
|
|
|
|
|
|
|
|
|
|||
Interest income |
|
|
( |
) |
|
|
( |
) |
|
|
( |
) |
Other income |
|
|
|
|
|
( |
) |
|
|
( |
) |
|
Total other expenses |
|
|
|
|
|
|
|
|
|
|||
Earnings (loss) before income taxes |
|
|
|
|
|
|
|
|
( |
) |
||
Income tax expense (benefit) |
|
|
|
|
|
|
|
|
( |
) |
||
Net income (loss) |
|
|
|
|
|
|
|
|
( |
) |
||
Less: Net income (loss) attributable to noncontrolling interest |
|
|
|
|
|
|
|
|
( |
) |
||
Net income (loss) attributable to SP Plus Corporation |
|
$ |
|
|
$ |
|
|
$ |
( |
) |
||
Common stock data |
|
|
|
|
|
|
|
|
|
|||
Net income (loss) per common share |
|
|
|
|
|
|
|
|
|
|||
Basic |
|
$ |
|
|
$ |
|
|
$ |
( |
) |
||
Diluted |
|
$ |
|
|
$ |
|
|
$ |
( |
) |
||
Weighted average shares outstanding |
|
|
|
|
|
|
|
|
|
|||
Basic |
|
|
|
|
|
|
|
|
|
|||
Diluted |
|
|
|
|
|
|
|
|
|
|||
See Notes to Consolidated Financial Statements.
36
SP Plus Corporation
Consolidated Statements of Comprehensive Income (Loss)
|
|
Years Ended December 31, |
|
|||||||||
(millions) |
|
2022 |
|
|
2021 |
|
|
2020 |
|
|||
Net income (loss) |
|
$ |
|
|
$ |
|
|
$ |
( |
) |
||
Reclassification of de-designated interest rate collars |
|
|
|
|
|
|
|
|
|
|||
Change in fair value of interest rate collars |
|
|
— |
|
|
|
— |
|
|
|
( |
) |
Foreign currency translation gain (loss) |
|
|
|
|
|
( |
) |
|
|
|
||
Comprehensive income (loss) |
|
|
|
|
|
|
|
|
( |
) |
||
Less: Comprehensive income (loss) attributable to noncontrolling interest |
|
|
|
|
|
|
|
|
( |
) |
||
Comprehensive income (loss) attributable to SP Plus Corporation |
|
$ |
|
|
$ |
|
|
$ |
( |
) |
||
See Notes to Consolidated Financial Statements
37
SP Plus Corporation
Consolidated Statements of Stockholders' Equity
|
|
Common Stock |
|
|
|
|
|
|
|
|
|
|
|
|
|
|
|
|
|
|
|
|||||||||||
|
|
Number |
|
|
|
|
|
|
|
|
Accumulated |
|
|
Retained |
|
|
|
|
|
|
|
|
|
|
||||||||
|
|
of |
|
|
|
|
|
Additional |
|
|
Other |
|
|
Earnings |
|
|
|
|
|
|
|
|
|
|
||||||||
|
|
Shares |
|
|
Par |
|
|
Paid-In |
|
|
Comprehensive |
|
|
(Accumulated |
|
|
Treasury |
|
|
Noncontrolling |
|
|
|
|
||||||||
(millions, except share data) |
|
Issued |
|
|
Value |
|
|
Capital |
|
|
Loss |
|
|
Deficit) |
|
|
Stock |
|
|
Interest |
|
|
Total |
|
||||||||
Balance at January 1, 2020 |
|
|
|
|
$ |
— |
|
|
$ |
|
|
$ |
( |
) |
|
$ |
|
|
$ |
( |
) |
|
$ |
( |
) |
|
$ |
|
||||
Net loss |
|
|
— |
|
|
|
— |
|
|
|
— |
|
|
|
— |
|
|
|
( |
) |
|
|
— |
|
|
|
( |
) |
|
|
( |
) |
Foreign currency translation |
|
|
— |
|
|
|
— |
|
|
|
— |
|
|
|
|
|
|
— |
|
|
|
— |
|
|
|
— |
|
|
|
|
||
Reclassification of de-designated interest rate collars |
|
|
— |
|
|
|
— |
|
|
|
— |
|
|
|
|
|
|
— |
|
|
|
— |
|
|
|
— |
|
|
|
|
||
Change in fair value of interest rate collars |
|
|
— |
|
|
|
— |
|
|
|
— |
|
|
|
( |
) |
|
|
— |
|
|
|
— |
|
|
|
— |
|
|
|
( |
) |
Issuance of stock grants |
|
|
|
|
|
— |
|
|
|
|
|
|
— |
|
|
|
— |
|
|
|
— |
|
|
|
— |
|
|
|
|
|||
Issuance of restricted stock units |
|
|
|
|
|
— |
|
|
|
— |
|
|
|
— |
|
|
|
— |
|
|
|
— |
|
|
|
— |
|
|
|
|
||
Issuance of performance stock units |
|
|
|
|
|
— |
|
|
|
— |
|
|
|
— |
|
|
|
— |
|
|
|
— |
|
|
|
— |
|
|
|
|
||
Noncontrolling interest buyout |
|
|
— |
|
|
|
— |
|
|
|
( |
) |
|
|
— |
|
|
|
— |
|
|
|
— |
|
|
|
— |
|
|
|
( |
) |
Repurchases of common stock |
|
|
— |
|
|
|
— |
|
|
|
— |
|
|
|
— |
|
|
|
— |
|
|
|
( |
) |
|
|
— |
|
|
|
( |
) |
Distributions to noncontrolling interest |
|
|
— |
|
|
|
— |
|
|
|
— |
|
|
|
— |
|
|
|
— |
|
|
|
— |
|
|
|
( |
) |
|
|
( |
) |
Balance at December 31, 2020 |
|
|
|
|
$ |
— |
|
|
$ |
|
|
$ |
( |
) |
|
$ |
( |
) |
|
$ |
( |
) |
|
$ |
( |
) |
|
$ |
|
|||
Net income |
|
|
— |
|
|
|
— |
|
|
|
— |
|
|
|
— |
|
|
|
|
|
|
— |
|
|
|
|
|
|
|
|||
Foreign currency translation |
|
|
— |
|
|
|
— |
|
|
|
— |
|
|
|
( |
) |
|
|
— |
|
|
|
— |
|
|
|
— |
|
|
|
( |
) |
Reclassification of de-designated interest rate collars |
|
|
— |
|
|
|
— |
|
|
|
— |
|
|
|
|
|
|
— |
|
|
|
— |
|
|
|
— |
|
|
|
|
||
Issuance of stock grants |
|
|
|
|
|
— |
|
|
|
|
|
|
— |
|
|
|
— |
|
|
|
— |
|
|
|
— |
|
|
|
|
|||
Issuance of restricted stock units |
|
|
|
|
|
— |
|
|
|
— |
|
|
|
— |
|
|
|
— |
|
|
|
— |
|
|
|
— |
|
|
|
|
||
Issuance of performance stock units |
|
|
|
|
|
— |
|
|
|
— |
|
|
|
— |
|
|
|
— |
|
|
|
— |
|
|
|
— |
|
|
|
|
||
Non-cash stock-based compensation |
|
|
— |
|
|
|
— |
|
|
|
|
|
|
— |
|
|
|
— |
|
|
|
— |
|
|
|
— |
|
|
|
|
||
Distributions to noncontrolling interest |
|
|
— |
|
|
|
— |
|
|
|
— |
|
|
|
— |
|
|
|
— |
|
|
|
— |
|
|
|
( |
) |
|
|
( |
) |
Balance at December 31, 2021 |
|
|
|
|
$ |
— |
|
|
$ |
|
|
$ |
( |
) |
|
$ |
|
|
$ |
( |
) |
|
$ |
( |
) |
|
$ |
|
||||
Net income |
|
|
— |
|
|
|
— |
|
|
|
— |
|
|
|
— |
|
|
|
|
|
|
— |
|
|
|
|
|
|
|
|||
Foreign currency translation |
|
|
— |
|
|
|
— |
|
|
|
— |
|
|
|
|
|
|
— |
|
|
|
— |
|
|
|
— |
|
|
|
|
||
Reclassification of de-designated interest rate collars |
|
|
— |
|
|
|
— |
|
|
|
— |
|
|
|
|
|
|
— |
|
|
|
— |
|
|
|
— |
|
|
|
|
||
Issuance of stock grants |
|
|
|
|
|
— |
|
|
|
|
|
|
— |
|
|
|
— |
|
|
|
— |
|
|
|
— |
|
|
|
|
|||
Issuance of restricted stock units |
|
|
|
|
|
— |
|
|
|
— |
|
|
|
— |
|
|
|
— |
|
|
|
— |
|
|
|
— |
|
|
|
— |
|
|
Non-cash stock-based compensation |
|
|
— |
|
|
|
— |
|
|
|
|
|
|
— |
|
|
|
— |
|
|
|
— |
|
|
|
— |
|
|
|
|
||
Repurchases of common stock |
|
|
— |
|
|
|
— |
|
|
|
— |
|
|
|
— |
|
|
|
— |
|
|
|
( |
) |
|
|
— |
|
|
|
( |
) |
Noncontrolling interest buyout |
|
|
— |
|
|
|
— |
|
|
|
( |
) |
|
|
— |
|
|
|
— |
|
|
|
— |
|
|
|
— |
|
|
|
( |
) |
Distributions to noncontrolling interest |
|
|
— |
|
|
|
— |
|
|
|
— |
|
|
|
— |
|
|
|
— |
|
|
|
— |
|
|
|
( |
) |
|
|
( |
) |
Balance at December 31, 2022 |
|
|
|
|
$ |
— |
|
|
$ |
|
|
$ |
( |
) |
|
$ |
|
|
$ |
( |
) |
|
$ |
( |
) |
|
$ |
|
||||
See Notes to Consolidated Financial Statements.
38
SP Plus Corporation
Consolidated Statements of Cash Flows
|
|
Year Ended December 31, |
|
|||||||||
(millions) |
|
2022 |
|
|
2021 |
|
|
2020 |
|
|||
Operating activities |
|
|
|
|
|
|
|
|
|
|||
Net income (loss) |
|
$ |
|
|
$ |
|
|
$ |
( |
) |
||
Adjustments to reconcile net income (loss) to net cash provided by operating activities: |
|
|
|
|
|
|
|
|
|
|||
Impairment |
|
|
|
|
|
|
|
|
|
|||
Depreciation and amortization |
|
|
|
|
|
|
|
|
|
|||
Non-cash stock-based compensation |
|
|
|
|
|
|
|
|
|
|||
Provisions for credit losses on accounts receivable |
|
|
|
|
|
|
|
|
|
|||
Deferred income taxes |
|
|
|
|
|
|
|
|
( |
) |
||
Other |
|
|
|
|
|
|
|
|
|
|||
Changes in operating assets and liabilities |
|
|
|
|
|
|
|
|
|
|||
Accounts and notes receivable |
|
|
( |
) |
|
|
( |
) |
|
|
|
|
Prepaid expenses and other current assets |
|
|
|
|
|
( |
) |
|
|
( |
) |
|
Accounts payable |
|
|
|
|
|
|
|
|
( |
) |
||
Accrued liabilities and other |
|
|
( |
) |
|
|
( |
) |
|
|
( |
) |
Net cash provided by operating activities |
|
|
|
|
|
|
|
|
|
|||
Investing activities |
|
|
|
|
|
|
|
|
|
|||
Purchases of property and equipment |
|
|
( |
) |
|
|
( |
) |
|
|
( |
) |
Acquisition of businesses, net of cash acquired |
|
|
( |
) |
|
|
|
|
|
|
||
Acquisition of other intangible assets |
|
|
( |
) |
|
|
|
|
|
|
||
Cost of contracts |
|
|
|
|
|
|
|
|
( |
) |
||
Proceeds from sale of other investments and equipment |
|
|
|
|
|
|
|
|
|
|||
Noncontrolling interest buyout |
|
|
|
|
|
|
|
|
( |
) |
||
Net cash used in investing activities |
|
|
( |
) |
|
|
( |
) |
|
|
( |
) |
Financing activities |
|
|
|
|
|
|
|
|
|
|||
Proceeds from credit facility revolver |
|
|
|
|
|
|
|
|
|
|||
Payments on credit facility revolver |
|
|
( |
) |
|
|
( |
) |
|
|
( |
) |
Proceeds from credit facility term loan |
|
|
|
|
|
|
|
|
|
|||
Payments on credit facility term loan |
|
|
( |
) |
|
|
( |
) |
|
|
( |
) |
Payments of debt issuance costs |
|
|
( |
) |
|
|
( |
) |
|
|
( |
) |
Payments on other long-term borrowings |
|
|
( |
) |
|
|
( |
) |
|
|
( |
) |
Distributions to noncontrolling interest |
|
|
( |
) |
|
|
( |
) |
|
|
( |
) |
Repurchases of common stock |
|
|
( |
) |
|
|
|
|
|
( |
) |
|
Net cash used in financing activities |
|
|
( |
) |
|
|
( |
) |
|
|
( |
) |
Effect of exchange rate changes on cash and cash equivalents |
|
|
( |
) |
|
|
( |
) |
|
|
|
|
(Decrease) increase in cash and cash equivalents |
|
|
( |
) |
|
|
|
|
|
( |
) |
|
Cash and cash equivalents at beginning of year |
|
|
|
|
|
|
|
|
|
|||
Cash and cash equivalents at end of year |
|
$ |
|
|
$ |
|
|
$ |
|
|||
Supplemental disclosures |
|
|
|
|
|
|
|
|
|
|||
Cash paid (received) during the period for: |
|
|
|
|
|
|
|
|
|
|||
Interest |
|
$ |
|
|
$ |
|
|
$ |
|
|||
Income taxes, net |
|
$ |
( |
) |
|
$ |
|
|
$ |
|
||
See Notes to Consolidated Financial Statements
39
SP Plus Corporation
Notes to Consolidated Financial Statements
(millions, except share and per share data)
1. Significant Accounting Policies and Practices
The Company
SP Plus Corporation (the "Company") blends industry-leading technology and best-in-class operations to deliver mobility solutions that enable the efficient movement of people, vehicles and personal belongings. The Company is committed to elevating the consumer experience while meeting the objectives of its diverse client base in North America and Europe. The Company is a leading provider of technology-driven mobility solutions for aviation, commercial, hospitality and institutional clients. The Company typically enters into contractual arrangements with property owners or managers as opposed to owning facilities.
Principles of Consolidation
The Consolidated Financial Statements include the accounts of the Company, its wholly owned subsidiaries, and Variable Interest Entities ("VIEs") in which the Company is the primary beneficiary. The Company is the primary beneficiary of a VIE when the Company has the power to direct activities that most significantly affect the economic performance of the VIE. If the Company is not the primary beneficiary in a VIE, the Company accounts for the investment in the VIE in accordance with applicable accounting principles generally accepted in the United States (“U.S. GAAP”). As of December 31, 2022 and 2021, assets related to consolidated VIEs were $
Use of Estimates
The preparation of financial statements in conformity with U.S. GAAP requires management to make estimates and assumptions that affect the amounts reported in the financial statements and accompanying notes. Actual results could differ from those estimates. Management evaluates its estimates and assumptions on an ongoing basis using historical experience and other factors, including the current environment.
Foreign Currency Translation
The Company's foreign operations include Canada, Puerto Rico, the United Kingdom and India. Assets and liabilities of the Company's foreign operations are translated into U.S. dollars at the rate in effect on the respective balance sheet date while income and expenses are translated at the weighted-average rates during the respective periods. Translation adjustments resulting from the fluctuations in exchange rates are recorded as a separate component of accumulated other comprehensive loss within stockholders’ equity, while transaction gains and losses are recorded in net income (loss). Deferred taxes are not recorded on cumulative foreign currency translation adjustments when the Company expects the foreign earnings to be permanently reinvested.
Cash and Cash Equivalents
Cash equivalents represent funds temporarily invested in money market instruments with maturities of three months or less. Cash equivalents are stated at cost, which approximates fair value. Cash and cash equivalents that are restricted as to withdrawal or use under the terms of certain contractual agreements were $
Allowance for Doubtful Accounts
Accounts receivable, net of the allowance for doubtful accounts, represents the Company's estimate of the amount that ultimately will be realized in cash. The Company reviews the adequacy of its allowance for doubtful accounts on an ongoing basis, primarily using a review of specific accounts, as well as historical collection trends and aging of receivables, and records adjustments to the allowance as necessary. Changes in economic conditions or other circumstances could have an impact on the collection of existing accounts receivable balances or future allowance considerations.
Transactions affecting the allowance for doubtful accounts during the years ended December 31, 2022, 2021 and 2020 were as follows:
(millions) |
|
December 31, 2022 |
|
|
December 31, 2021 |
|
|
December 31, 2020 |
|
|||
Beginning Balance |
|
$ |
|
|
$ |
|
|
$ |
|
|||
Provision for credit losses |
|
|
|
|
|
|
|
|
|
|||
Write offs and other |
|
|
— |
|
|
|
( |
) |
|
|
( |
) |
Ending Balance |
|
$ |
|
|
$ |
|
|
$ |
|
|||
Property and Equipment, net
Property and equipment includes the Company's equipment, internal-use software, vehicles, leasehold improvements and construction/development in process. Property and equipment are stated at cost, less accumulated depreciation and amortization, whenever applicable.
Certain costs incurred in the planning and evaluation stage of internal-use software projects are recorded to expense as incurred. Costs associated with directly obtaining, developing or upgrading internal-use software are capitalized and included as Software in Property and equipment, net, within the Consolidated Balance Sheets. When the internal-use software is ready for its intended use, it is amortized on a straight-line basis over the estimated useful life of the internal-use software, which is typically
Equipment and vehicles are depreciated on a straight-line basis over the estimated useful lives ranging from
40
Goodwill
Goodwill represents the excess of the purchase price paid over the fair value of net assets acquired. In accordance with the Financial Accounting Standards Board's ("FASB") authoritative accounting guidance on goodwill, the Company evaluates goodwill for impairment on an annual basis, or more often if events or circumstances change that could cause goodwill to become impaired. The Company has elected to assess the impairment of goodwill annually on October 1 or at an interim date if there is an event or change in circumstances indicating the carrying value may not be recoverable. The goodwill impairment test is performed at the reporting unit level; the Company's reporting units represent its operating segments, consisting of Commercial and Aviation. Factors that could trigger an impairment review include significant under-performance relative to expected historical or projected future operating results, significant changes in the use of acquired assets or the Company’s business strategy, and significant negative industry or economic trends.
The Company may perform a qualitative, rather than quantitative, assessment to determine whether it is more likely than not that the fair value of a reporting unit is less than its carrying amount. If the Company determines impairment is present, the Company would need to perform a quantitative assessment. The determination of fair value of a reporting unit utilizes cash flow projections that assume certain future revenue and cost levels, comparable marketplace data, comparable company market valuations, assumed discount rates based upon current market conditions and other valuation factors, all of which involve the use of significant judgment and estimates. The Company also assesses critical areas that may impact its business including economic conditions, market related exposures, competition, changes in service offerings and changes in key personnel. The Company completed a quantitative test of goodwill as of October 1, 2022, and concluded that the estimated fair values of each of the Company’s reporting units exceeded the carrying amount of net assets assigned to each reporting unit.
Due to the impacts of the COVID-19 pandemic (“COVID-19”) on the Company’s operations during 2020, revenues for certain markets in which the Company operates decreased significantly as compared to expectations as of the October 1, 2019 annual impairment test. In addition, certain Aviation contracts were terminated during August 2020. The termination of these contracts and the ongoing impacts of COVID-19 on the Company’s expected future operating cash flows triggered the Company to complete a quantitative goodwill impairment analysis for the Aviation reporting unit as of August 31, 2020. Based on the quantitative analysis, the Company determined that the estimated carrying value exceeded the implied fair value for the Aviation reporting unit and goodwill was impaired. See Note 10. Goodwill in the notes to the Consolidated Financial Statements for further discussion.
Other Intangible Assets, net
Other intangible assets represent assets with finite lives that are amortized on a straight-line basis over their estimated useful lives. The Company evaluates other intangible assets on a periodic basis to determine whether events or circumstances warrant a revision to their remaining useful lives. In addition, other intangible assets are reviewed for impairment when circumstances change that would indicate the carrying value may not be recoverable. Assumptions and estimates about future values and remaining useful lives of intangible assets are complex and subjective, and can be affected by a variety of factors, including external factors such as industry and economic trends, and internal factors, such as changes in the Company’s business strategy and forecasts. Although the Company believes the historical assumptions and estimates are reasonable and appropriate, difference assumptions and estimates could materially impact reported financial results.
As a result of the impact of COVID-19 on the Company’s expected future operating cash flows, the Company determined certain impairment triggers had occurred related to the Company’s Proprietary know how intangible assets within the Aviation segment as of June 30, 2020. Accordingly, the Company analyzed undiscounted cash flows for these intangible assets as of June 30, 2020. Based on the undiscounted cash flow analysis, the Company determined that estimated net carrying values exceeded undiscounted future cash flows for certain Proprietary know how intangible assets and therefore, as of June 30, 2020, certain Proprietary know how intangible assets were impaired.
Additionally, as a result of the termination of certain contracts within the Aviation reporting unit during August 2020 and the ongoing impact of COVID-19 on the Company’s expected future operating cash flows, the Company determined certain impairment testing triggers had occurred related to the Company’s customer relationships and trade names and trademarks intangible assets. Accordingly, the Company analyzed undiscounted cash flows for these intangible assets as of August 31, 2020. Based on the undiscounted cash flow analysis, the Company determined that estimated net carrying values exceeded undiscounted future cash flows for certain customer relationships and trade names and trademarks intangible assets and therefore, as of August 31, 2020, certain customer relationships and trade names and trademarks intangible assets were impaired.
The impairments recognized were measured by the amount by which the carrying value of the intangible assets exceeded their fair value. See Note 9. Other Intangible Assets, net in the notes to the Consolidated Financial Statements for further discussion.
For both goodwill and intangible assets, future events may indicate differences from the Company's judgments and estimates which could, in turn, result in impairment charges. Future events that may result in impairment charges include economic volatility, increases in interest rates, which would impact discount rates, or other factors which could decrease revenues and profitability of existing locations and changes in the cost structure of existing facilities, such as increasing labor and benefit costs.
Long-Lived Assets
The Company evaluates long-lived assets, including ROU assets, leasehold improvements, equipment and construction in progress, for impairment whenever events or circumstances indicate that the carrying value of an asset or asset group may not be recoverable. The Company groups assets at the lowest level for which cash flows are separately identified in order to measure an impairment. Events or circumstances that would result in an impairment review include a significant change in the use of an asset, the planned sale or disposal of an asset, or a projection or forecast that demonstrates continuing losses associated with the use of a long-lived asset or asset group. Recoverability of assets to be held and used is measured by a comparison of the carrying amount of the asset or asset group to future undiscounted cash flows expected to be generated by the asset or asset group. If the asset or asset group is determined to be impaired, the impairment recognized is measured by the amount by which the carrying value of the asset or asset group exceeds its fair value.
The Company determined impairment testing triggers had occurred for an ROU asset associated with a certain asset group as of December 31, 2022. Accordingly, the Company analyzed undiscounted cash flows for the ROU asset as of December 31, 2022. Based on the undiscounted cash flow analysis, the Company determined that the estimated net carrying value of the ROU asset exceeded undiscounted cash flows and therefore, the ROU asset was impaired as of December 31, 2022. The impairment recognized was measured by the amount by which the carrying value of the ROU asset exceeded its fair value. See Note 3. Leases in the notes to the Consolidated Financial Statements for further discussion.
Additionally, the Company determined impairment testing triggers had occurred for ROU assets associated with certain asset groups during the years ended December 31, 2021 and 2020. See Note 3. Leases in the notes to the Consolidated Financial Statements for further discussion.
Assumptions and estimates used to determine cash flows in the evaluation of impairment and the fair values used to determine the impairment are subject to a degree of judgment and complexity. Any future changes to the assumptions and estimates resulting from changes in actual results or market conditions from those anticipated may affect the carrying value of long-lived assets and could result in additional impairment charges. Future events that may result in impairment charges include economic volatility, or other factors, which could decrease revenues and profitability of existing locations.
41
Accrued and Other Current Liabilities
Components of Accrued and other current liabilities as of December 31, 2022 and 2021 were as follows:
(millions) |
|
December 31, 2022 |
|
|
December 31, 2021 |
|
||
Accrued rent |
|
$ |
|
|
$ |
|
||
Compensation and payroll withholdings |
|
|
|
|
|
|
||
Property, payroll and other taxes |
|
|
|
|
|
|
||
Accrued insurance |
|
|
|
|
|
|
||
Contract liabilities |
|
|
|
|
|
|
||
Contingent consideration |
|
|
|
|
|
— |
|
|
Accrued expenses |
|
|
|
|
|
|
||
Accrued and other current liabilities |
|
$ |
|
|
$ |
|
||
Financial Instruments
The carrying values of cash and cash equivalents, accounts and notes receivable and accounts payable approximate their fair value due to the short-term nature of these financial instruments. Book overdrafts of $
Insurance Reserves
The Company purchases comprehensive casualty insurance covering certain claims that arise in connection with the Company’s operations. In addition, the Company purchases umbrella/excess liability coverage. Under the various liability and workers' compensation insurance policies, the Company is obligated to pay directly or reimburse the insurance carrier for the deductible / retention amount of each loss covered by the Company’s general / garage, automobile, workers' compensation and garage keepers legal liability policies. As a result, the Company is, effectively self-insured for all claims within the deductible / retention amount of each loss. Any loss over the deductible / retention is the responsibility of the third-party insurer. The expense recognition is based upon the Company's determination of an unfavorable outcome of a claim being deemed as probable and capable of being reasonably estimated. This determination requires the use of judgment in both the estimation of probability and the amount to be recognized as an expense. The Company utilizes historical claims experience and exposures specific to each type of insurance, along with actuarial methods performed quarterly by a third party actuarial adviser in determining the required level of insurance reserves. As of December 31, 2022 and 2021, the insurance reserve for general, garage, automobile and workers’ compensation liabilities was $
Legal and Other Commitments and Contingencies
The Company is subject to litigation in the normal course of its business. The Company uses guidance from internal and external legal counsel on the potential outcome of litigation in determining the need to record liabilities for potential losses and the disclosure for pending legal claims. See Note 17. Legal and Other Commitments and Contingencies for further discussion.
Services Revenue
The Company's revenues are primarily derived from management type and lease type contracts; whereby the Company provides parking services, parking management, ground transportation services, baggage handling services and other ancillary services to commercial, hospitality, institutional, municipal and aviation clients. Ancillary services include fees associated with using the Company's technology-driven mobility solutions, as well as on-site parking management, facility maintenance, ground transportation services, event logistics, remote airline check-in, security services, municipal meter revenue collection and enforcement services, and scheduling and supervising all service personnel, as well as providing customer service, marketing, accounting and revenue control functions necessary to complete such services. Ancillary services also include payments received for exercising termination rights, consulting development fees, gains on sales of contracts, insurance (general, workers' compensation and health care) and other value-added services. In accordance with the guidance related to revenue recognition, entities are required to recognize revenue when control of the promised goods or services is transferred to customers at an amount that reflects the consideration to which the entity expects to be entitled to in exchange for those goods or services. The Company recognizes gross receipts (net of taxes collected from customers) as revenue from lease type contracts, and management fees for services, as the related services are performed. Ancillary services are primarily included in management type contracts and are recognized as revenue as those services are provided.
Reimbursed Management Type Contract Revenue and Expense
The Company recognizes both revenues and expenses, in equal amounts, that are directly reimbursed by the Company’s clients for operating expenses incurred under a management type contract. The Company has determined it is the principal in these transactions as the nature of the Company's performance obligations is for the Company to provide the services on behalf of the customer. As the principal to these related transactions, the Company has control of the promised services before they are provided to the customer.
Cost of Services
The Company recognizes costs for lease type contracts, non-reimbursed costs from management type contracts and reimbursed management type contract expenses as cost of services. Cost of services consists primarily of rent, payroll related costs and other miscellaneous expenses.
Stock-Based Compensation
Stock-based payments to employees, including grants of restricted stock and performance-based share units, are measured at the grant date, based on the estimated fair value of the award, and the related expense is recognized over the requisite employee service period or performance period (generally the vesting period) for awards expected to vest. The Company also grants stock to its Board of Directors (“Board”) on an annual basis, which is recorded as expense at the grant date, based on the fair value of the award. The Company accounts for forfeitures of stock-based awards as they occur. See Note 7. Stock-Based Compensation for further discussion.
42
Equity Investment in Unconsolidated Entities
The Company has ownership interests in
Noncontrolling Interests
Noncontrolling interests represent the noncontrolling holders' percentage share of income (losses) from the subsidiaries in which the Company holds a controlling interest, but less than 100 percent, ownership interest. The results of these subsidiaries are consolidated and included in the Company’s Consolidated Financial Statements.
Income Taxes
Deferred income taxes are computed using the asset and liability method, such that deferred tax assets and liabilities are recognized for deductible temporary differences between US GAAP amounts and the tax basis of existing assets and liabilities based on currently enacted tax laws and tax rates in effect for the periods in which these temporary differences are expected to reverse or be settled. Income tax expense (benefit) is the tax payable (receivable) for the period plus the change during the period in deferred income taxes. The Company has certain state net operating loss (“NOL”) carry forwards which expire in 2042. The Company considers a number of factors in its assessment of the recoverability of its NOL carryforwards including their expiration dates and the limitations imposed due to the change in ownership as well as future projections of income. Future changes in the Company's operating performance, along with these considerations, may significantly impact the amount of NOLs ultimately recovered, and the Company’s assessment of their recoverability.
The Company recognizes deferred tax liabilities related to taxes on certain foreign earnings that were not considered to be permanently reinvested. The Company also has recognized deferred tax liabilities on nondeductible intangible assets.
When evaluating the Company’s tax positions, the Company accounts for uncertainty in income taxes in its Consolidated Financial Statements. The evaluation of a tax position by the Company is a two-step process, the first step being recognition. The first step is to determine whether it is more-likely-than-not that a tax position will be sustained upon tax examination, including resolution of any related appeals or litigation processes, based on the technical merits of the position and the weight of available evidence. If a tax position does not meet the more-likely-than-not threshold, which is more than 50% likely of being realized, the benefit of that position is not recognized in the Company’s financial statements. The second step is measurement of the tax benefit. The tax position is measured as the largest amount of benefit that is more-likely-than-not of being realized, which is more than 50% likely of being realized upon ultimate resolution with a taxing authority.
See Note 14. Income Taxes for further discussion.
Recently Issued Accounting Pronouncements
Recently Adopted Accounting Pronouncements
During the year ended December 31, 2022, the Company
ASU |
Topic |
Method of Adoption |
Government assistant (Topic 832): Disclosure by Business Entities about Government Assistance |
Prospective |
|
Business Combinations (Topic 805): Accounting for Contract Assets and Contract Liabilities from Contracts with Customers |
Prospective |
2. Acquisitions
On
On
Both acquisitions enhance the Company's position as a global provider of frictionless technology solutions that are independent of the Company's legacy parking management and transportation related operations. The Company's acquisitions of KMP and DIVRT have been accounted for as business combinations, and the assets acquired and liabilities assumed were recorded at their estimated fair values as of the acquisition dates. Goodwill was measured as the excess of consideration over the assets acquired, including other intangible assets, less liabilities assumed, based on their estimated fair values at the acquisition date. The
43
tax deductible goodwill related to the acquisitions was $
The results of the acquisitions were immaterial to the Consolidated Financial Statements during the year ended December 31, 2022.
The Company incurred certain acquisition and integration costs associated with acquisitions completed or contemplated that were expensed as incurred and were reflected in General and administrative expenses within the Consolidated Statements of Income (Loss). See Note 4. Acquisition, Restructuring, Integration and Other Costs.
The Company believes the information gathered to date provides a reasonable basis for estimating the fair values of assets acquired and liabilities assumed, however, the provisional measurements of fair value for the other intangible assets and goodwill of KMP and DIVRT are subject to change. As a result, during the measurement period, which may be up to one year from the acquisition dates, adjustments to assets and liabilities assumed will be recorded with corresponding adjustments to goodwill. The Company expects to complete the purchase price allocation for the KMP and DIVRT acquisitions as soon as practicable but no later than one year from the acquisition date.
The estimated fair values of the assets acquired and liabilities assumed based on the information that was available as of the acquisition dates were as follows:
(millions) |
|
|
|
Cash and cash equivalents |
$ |
|
|
Accounts receivable |
|
|
|
Prepaid expenses and other current assets |
|
|
|
Other intangible assets |
|
|
|
Goodwill |
|
|
|
ROU asset |
|
|
|
Accounts payable |
|
( |
) |
Accrued and other current liabilities |
|
( |
) |
Deferred tax liability |
|
( |
) |
Other long-term borrowings |
|
( |
) |
Net assets acquired and liabilities assumed |
|
|
|
Less: cash and cash equivalents acquired |
|
|
|
Less: contingent consideration payable |
|
|
|
Net cash paid |
$ |
|
|
In addition to the acquisitions discussed above, on April 18, 2022, the Company acquired certain other intangible assets for a purchase price of $
As discussed above, during the year ended December 31, 2022, the Company recorded additions to other intangible assets of $
(millions) |
|
Estimated Life |
|
Estimated Fair Value |
|
|
Proprietary know how |
|
|
$ |
|
||
Customer relationships |
|
|
|
|
||
Trade names |
|
|
|
|
||
Covenant not to compete |
|
|
|
|||
Estimated fair value of identified intangible assets |
|
|
|
$ |
|
|
The fair values of other intangible assets acquired were determined to be Level 3 under the fair value hierarchy. The fair value estimate for all identifiable intangible assets is based on assumptions that market participants would use in pricing an asset, based on the most advantageous market for the asset.
The estimated fair value of the Proprietary know how was determined using the multi-period excess earnings method under the income approach utilizing projected financial information for each technology that was acquired. The estimated fair value of the customer relationships was determined using the distributor method and excess earnings method under the income approach. The estimated fair value of the trade names was determined using the relief from royalty savings method under the income approach. The Company considered the return on assets and market comparable methods when estimating an appropriate royalty rate for the trade names.
3. Leases
The Company leases parking facilities, office space, warehouses, vehicles and equipment and determines if an arrangement is a lease at inception. The Company subleases certain real estate to third parties. The Company's sublease portfolio consists of operating leases for space within leased parking facilities.
Operating lease ROU assets and lease liabilities are recognized at commencement date based on the present value of lease payments over the lease term. ROU assets represent the Company's "right-of-use" over an underlying asset for the lease term, and lease liabilities represent the Company’s obligation to make lease payments arising from the lease. ROU assets include cumulative prepaid or accrued rent, as well as lease incentives, initial direct costs and acquired lease contracts. The short term lease exception has been applied to leases with an initial term of 12 months or less and these leases are not recorded within the Consolidated Balance Sheets.
As most of the Company's leases do not provide an implicit rate, the Company uses its incremental borrowing rate based on the information available at commencement date in determining the present value of lease payments. The Company uses the implicit rate when readily determinable. Lease expense is recognized on a straight-line basis over the lease term.
For leases that include one or more options to renew, the exercise of such renewal options is at the Company's sole discretion or mutual agreement with the landlord. The Company’s lease term may include renewal options that are at the Company’s sole discretion and are reasonably certain to be exercised. Equipment and vehicle leases also include options to purchase the leased property. The depreciable life of assets and leasehold improvements are limited by the expected lease term, unless there is a transfer of title or purchase option reasonably certain of exercise.
Variable lease components comprising of payments that are a percentage of parking services revenue based on contractual levels and rental payments adjusted periodically for inflation are not included in the lease liability. The Company's lease agreements do not contain any material residual value guarantees or material restrictive covenants.
44
As discussed in Note 1. Significant Accounting Policies and Practices, the Company tests ROU assets when impairment indicators are present. During the year ended December 31, 2022, the Company determined impairment testing triggers had occurred for an ROU asset associated with a certain asset group within the Commercial segment. Therefore, the Company performed an undiscounted cash flow analysis for the ROU asset as of December 31, 2022. Based on the undiscounted cash flow analysis, the Company determined the ROU asset had a net carrying value that exceeded its estimated undiscounted future cash flows and the fair value for the ROU asset. The fair value of the ROU asset measured on a non-recurring basis, which is classified as Level 3 in the fair value hierarchy, was determined based on estimates of future discounted cash flows. The estimated fair value was compared to the net carrying value, and as a result, the ROU asset held and used with a carrying amount of $
In addition, the Company determined impairment testing triggers had occurred for operating lease ROU assets associated with certain asset groups during the year ended December 31, 2021. Accordingly, the Company performed undiscounted cash flow analysis on these ROU assets during the year ended December 31, 2021. Based on the undiscounted cash flow analysis as of March 31, 2021 and September 30, 2021, the Company determined these ROU asset groups had net carrying values that exceeded their estimated undiscounted future cash flows and the fair values for these asset groups were determined. The fair values were compared to the net carrying values, and, as a result, ROU assets held and used with a carrying amount of $
In April 2020, the FASB provided accounting elections for entities that receive or provide lease-related concessions to mitigate the economic effects of COVID-19 on lessees. The Company elected not to evaluate whether certain concessions provided by lessors in response to COVID-19, that are within the scope of additional interpretation provided by the FASB in April 2020, were lease modifications and also elected not to apply modification guidance. These concessions were recognized as a reduction of rent expense in the month they occurred and were recorded in Cost of services - lease type contracts within the Consolidated Statements of Income (Loss).
As a result of COVID-19, the Company was able to negotiate lease concessions with certain landlords. These rent concessions were recorded in accordance with the guidance noted above. Accordingly, the Company recorded $
Costs associated with the right to use the infrastructure on service concession arrangements are recorded as a reduction of revenue in accordance with the scope of ASU No. 2017-10, Service Concession Arrangements (Topic 853): Determining the Customer of the Operation Services. See Note 5. Revenue for further discussion on service concession arrangements.
The components of ROU assets and lease liabilities and the classification within the Consolidated Balance Sheets as of December 31, 2022 and 2021 were as follows:
(millions) |
|
Classification |
|
2022 |
|
|
2021 |
|
||
Assets |
|
|
|
|
|
|
|
|
||
Operating |
|
Right-of-use assets |
|
$ |
|
|
$ |
|
||
Finance |
|
|
|
|
|
|
|
|||
Total leased assets |
|
|
|
$ |
|
|
$ |
|
||
Liabilities |
|
|
|
|
|
|
|
|
||
Current |
|
|
|
|
|
|
|
|
||
Operating |
|
Short-term lease liabilities |
|
$ |
|
|
$ |
|
||
Finance |
|
|
|
|
|
|
|
|||
Noncurrent |
|
|
|
|
|
|
|
|
||
Operating |
|
Long-term lease liabilities |
|
|
|
|
|
|
||
Finance |
|
|
|
|
|
|
|
|||
Total lease liabilities |
|
|
|
$ |
|
|
$ |
|
||
The components of lease cost and classification within the Consolidated Statements of Income (Loss) during the years ended December 31, 2022, 2021 and 2020 were as follows:
(millions) |
|
Classification |
|
2022 |
|
|
2021 |
|
|
2020 |
|
|||
Operating lease (a)(b) |
|
Cost of services - lease type contracts |
|
$ |
|
|
$ |
|
|
$ |
|
|||
Short-term lease (a) |
|
Cost of services - lease type contracts |
|
|
|
|
|
|
|
|
|
|||
Variable lease |
|
Cost of services - lease type contracts |
|
|
|
|
|
|
|
|
|
|||
Operating lease cost |
|
|
|
|
|
|
|
|
|
|
|
|||
Finance lease cost |
|
|
|
|
|
|
|
|
|
|
|
|||
Amortization of leased assets |
|
Depreciation and amortization |
|
|
|
|
|
|
|
|
|
|||
Interest on lease liabilities |
|
Interest expense |
|
|
|
|
|
|
|
|
|
|||
Lease Impairment |
|
Lease impairment |
|
|
|
|
|
|
|
|
|
|||
Lease Impairment |
|
General and administrative expenses |
|
|
— |
|
|
|
— |
|
|
|
|
|
Net lease cost |
|
|
|
$ |
|
|
$ |
|
|
$ |
|
|||
Sublease income during the years ended December 31, 2022, 2021 and 2020 was $
The Company entered into new operating lease arrangements as of December 31, 2022 that commence in future periods. The total amount of ROU assets and lease liabilities related to these arrangements are immaterial.
45
Maturities, lease term and discount rate information of lease liabilities as of December 31, 2022 were as follows:
|
|
Operating |
|
|
Finance |
|
|
|
|
|||
(millions) |
|
Leases |
|
|
Leases |
|
|
Total |
|
|||
2023 |
|
$ |
|
|
$ |
|
|
$ |
|
|||
2024 |
|
|
|
|
|
|
|
|
|
|||
2025 |
|
|
|
|
|
|
|
|
|
|||
2026 |
|
|
|
|
|
|
|
|
|
|||
2027 |
|
|
|
|
|
|
|
|
|
|||
After 2027 |
|
|
|
|
|
|
|
|
|
|||
Total lease payments |
|
|
|
|
|
|
|
|
|
|||
Less: Imputed interest |
|
|
|
|
|
|
|
|
|
|||
Present value of lease liabilities |
|
$ |
|
|
$ |
|
|
$ |
|
|||
Weighted-average remaining lease term (years) |
|
|
|
|
|
|
|
|
|
|||
Weighted-average discount rate |
|
|
% |
|
|
% |
|
|
|
|||
Future sublease income for the periods shown above was excluded as the amounts are not material.
Supplemental cash flow information related to leases during the years ended December 31, 2022, 2021 and 2020 were as follows:
(millions) |
|
2022 |
|
|
2021 |
|
|
2020 |
|
|||
Cash paid for amounts included in the measurement of lease liabilities |
|
|
|
|
|
|
|
|
|
|||
Operating cash outflows related to operating leases |
|
$ |
|
|
$ |
|
|
$ |
|
|||
Operating cash outflows related to interest on finance leases |
|
|
|
|
|
|
|
|
|
|||
Financing cash outflows related to finance leases |
|
|
|
|
|
|
|
|
|
|||
Leased assets obtained in exchange for new operating lease liabilities |
|
|
|
|
|
|
|
|
|
|||
Leased assets obtained in exchange for new finance lease liabilities |
|
|
|
|
|
|
|
|
|
|||
4. Acquisition, Restructuring, Integration and Other Costs
The Company has incurred certain acquisition, restructuring, integration and other costs that were expensed as incurred, which included:
Acquisition, restructuring, integration and other costs during the years ended December 31, 2022, 2021 and 2020, were as follows:
|
|
Year Ended December 31, |
|
|||||||||
(millions) |
|
2022 |
|
|
2021 |
|
|
2020 |
|
|||
Commercial |
|
|
|
|
|
|
|
|
|
|||
Cost of services - lease type contracts(1) |
|
$ |
|
|
$ |
|
|
$ |
|
|||
Cost of services - management type contracts(2) |
|
|
|
|
|
|
|
|
|
|||
General and administrative expenses(3) |
|
|
|
|
|
|
|
|
|
|||
Aviation |
|
|
|
|
|
|
|
|
|
|||
Cost of services - management type contracts |
|
|
|
|
|
|
|
|
|
|||
General and administrative expenses(4) |
|
|
( |
) |
|
|
|
|
|
|
||
Other |
|
|
|
|
|
|
|
|
|
|||
General and administrative expenses(5)(6) |
|
|
|
|
|
|
|
|
|
|||
Total restructuring and other costs |
|
|
|
|
|
|
|
|
|
|||
Cost of services - lease type contracts |
|
|
|
|
|
|
|
|
|
|||
Cost of services - management type contracts |
|
|
|
|
|
|
|
|
|
|||
General and administrative expenses |
|
|
|
|
|
|
|
|
|
|||
Total |
|
$ |
|
|
$ |
|
|
$ |
|
|||
5. Revenue
The Company recognizes revenue when control of the promised goods or services is transferred to customers at an amount that reflects the consideration to which the entity expects to be entitled to in exchange for those goods or services.
Contracts with customers and clients
The Company accounts for a contract when it has the approval and commitment from both parties, the rights of the parties are identified, payment terms are identified, the contract has commercial substance and collectability of consideration is probable. Once a contract is identified, the Company evaluates whether the
46
contract should be accounted for as more than one performance obligation. Substantially all of the Company's revenues come from the following two types of arrangements: Lease type and Management type contracts.
Lease type contracts
Lease type contract revenue includes gross receipts (net of local taxes), consulting and real estate development fees, gains on sales of contracts and payments for exercising termination rights. Performance obligations related to lease type contracts include parking for transient and monthly parkers. Revenue is recognized over time as the Company provides services. Under lease type arrangements, the Company pays the property owner a fixed base rent, percentage rent that is tied to the facility’s financial performance, or a combination of both. The Company operates the parking facility and is responsible for most operating expenses, but typically is not responsible for major maintenance, capital expenditures or real estate taxes. As noted in Note 1. Significant Accounting Policies and Practices, certain expenses, primarily rental expense for the contractual arrangements that meet the definition of service concession arrangements, are recorded as a reduction of revenue.
Management type contracts
Management type contract revenue consists of management fees, including both fixed and performance-based fees. In exchange for this consideration, the Company may have a bundle of integrated services that comprise one performance obligation and include services such as managing the facility, as well as ancillary services such as accounting, equipment leasing, consulting, insurance and other value-added services. Management type contract revenues do not include gross customer collections at the managed facilities as these revenues belong to the property owners rather than to the Company. Management type contracts generally provide the Company with management fees regardless of the operating performance of the underlying facilities. Revenue is recognized over time as the Company provides services.
Service concession arrangements
Certain expenses (primarily rental expense), as well as depreciation and amortization, related to service concession arrangements for lease type contracts, are recorded as a reduction of Service revenue - lease type contracts.
As a result of COVID-19, the Company was able to negotiate cost reductions on certain lease type contracts related to service concession arrangements. The Company recorded $
Contract modifications and taxes
Contracts are often modified to account for changes in contract specifications and requirements. The Company considers contract modifications to exist when the parties to the contract have approved changes to or have new enforceable rights and obligations, which may include changes to the contract consideration due to the Company or creates new performance obligations. The Company assesses whether a contract modification results in either a new separate contract, the termination of the existing contract and the creation of a new contract, or modifies the existing contract. Typically, modifications are accounted for prospectively.
Taxes assessed by a governmental authority that are both imposed on and concurrent with a specific revenue-producing transaction, which are collected by the Company from a customer, are excluded from revenue.
Reimbursed management type contract revenue and expense
For certain management type contracts, the Company recognizes both revenues and expenses, in equal amounts, that are directly reimbursed from the property owner for operating expenses incurred. The Company has determined it is the principal in these transactions, as the nature of its performance obligations is for the Company to provide the services on behalf of the client. As the principal to these related transactions, the Company has control of the promised services before they are transferred to the client.
Disaggregation of revenue
The Company disaggregates its revenue from contracts with customers by type of arrangement for each of the reportable segments. The Company has concluded that such disaggregation of revenue best depicts the overall economic nature, timing and uncertainty of the Company's revenue and cash flows affected by the economic factors of the respective contractual arrangement. See Note 18. Segment Information for further information on disaggregation of the Company's revenue by segment.
Performance obligations
A performance obligation is a promise in a contract to transfer a distinct good or service to the customer or client, and is the unit of account under Topic 606. The contract transaction price is allocated to each distinct performance obligation and recognized as revenue when, or as, the performance obligation is satisfied. The majority of the Company’s contracts have a single performance obligation that is not separately identifiable from other promises in the contract and therefore not distinct, comprising the promise to provide an integrated bundle of monthly services or parking services for transient or monthly parkers.
The contract price is generally deemed to be the transaction price. Some management type contracts include performance incentives that are based on variable performance measures. These incentives are constrained at contract inception and recognized once the customer has confirmed that the Company has met the contractually agreed upon performance measures as defined in the contract.
The Company’s performance obligations are primarily satisfied over time as the Company provides the related services. Typically, revenue is recognized over time on a straight-line basis as the Company satisfies the related performance obligation. There are certain management type contracts where revenue is recognized based on costs incurred to date plus a reasonable margin. The Company has concluded this is a faithful depiction of how control is transferred to the customer.
The time between completion of the performance obligation and collection of cash is typically not more than 30 - 60 days. In certain contractual arrangements, such as monthly parker contracts, the payment is typically collected in advance of the Company commencing its performance obligations under the contractual arrangement.
47
As of December 31, 2022, the Company had $
The Company expects to recognize the remaining performance obligations as revenue in future periods as follows:
|
|
Remaining Performance |
|
|
(millions) |
|
Obligations |
|
|
|
$ |
|
||
|
|
|
||
|
|
|
||
|
|
|
||
|
|
|
||
|
|
|
||
Total |
|
$ |
|
|
Contract balances
The timing of revenue recognition, billings and cash collections results in accounts receivable, contract assets and contract liabilities. Accounts receivable represent amounts where the Company has an unconditional right to the consideration and therefore only the passage of time is required for the Company to receive consideration due from the customer or client. Both lease type and management type contracts have customers and clients where amounts are billed as work progresses or in advance in accordance with agreed-upon contractual terms. Billing may occur subsequent to or prior to revenue recognition, resulting in contract assets and liabilities. The Company, on occasion, receives advances or deposits from customers and clients, on both lease and management type contracts, before revenue is recognized, resulting in the recognition of contract liabilities.
Contract assets and liabilities are reported on a contract-by-contract basis and are included in Accounts and notes receivable, net and Accrued and other current liabilities, respectively, within the Consolidated Balance Sheets. See Note 1. Significant Accounting Policies and Practices for additional discussion on the write-off of accounts receivable. There were
The following table provides information about accounts receivable, contract assets and contract liabilities with customers and clients as of December 31, 2022 and 2021:
(millions) |
|
2022 |
|
|
2021 |
|
||
Accounts receivable |
|
$ |
|
|
$ |
|
||
Contract asset |
|
|
|
|
|
|
||
Contract liability |
|
|
( |
) |
|
|
( |
) |
Changes in contract assets, which include recognition of additional consideration due from the client, are offset by reclassifications of contract asset balances to accounts receivable when the Company obtains an unconditional right to consideration, thereby establishing an accounts receivable. The following table provides information about changes to contract asset balances during the years ended December 31, 2022 and 2021:
(millions) |
|
2022 |
|
|
2021 |
|
||
Balance, beginning of year |
|
$ |
|
|
$ |
|
||
Additional contract assets |
|
|
|
|
|
|
||
Reclassification to accounts receivable |
|
|
( |
) |
|
|
( |
) |
Balance, end of year |
|
$ |
|
|
$ |
|
||
Changes in contract liabilities primarily include additional contract liabilities and reductions of contract liabilities when revenue is recognized. The following table provides information about changes to contract liabilities during the years ended December 31, 2022 and 2021:
(millions) |
|
2022 |
|
|
2021 |
|
||
Balance, beginning of year |
|
$ |
( |
) |
|
$ |
( |
) |
Acquisitions |
|
|
( |
) |
|
|
— |
|
Additional contract liabilities |
|
|
( |
) |
|
|
( |
) |
Recognition of revenue from contract liabilities |
|
|
|
|
|
|
||
Balance, end of year |
|
$ |
( |
) |
|
$ |
( |
) |
Cost of contracts, net
Cost of contracts, net, represents the cost of obtaining contractual rights associated with providing services for management type contracts. Costs are amortized on a straight-line basis over the estimated life of the contracts, including anticipated renewals and terminations. The amortization period is consistent with the timing of when the Company satisfies the related performance obligations. Estimated lives are based on the contract life.
Cost of contracts, net, as of December 31, 2022 and 2021 was as follows:
|
|
December 31, |
|
|||||
(millions) |
|
2022 |
|
|
2021 |
|
||
Cost of contracts |
|
$ |
|
|
$ |
|
||
Accumulated amortization |
|
|
( |
) |
|
|
( |
) |
Cost of contracts, net |
|
$ |
|
|
$ |
|
||
48
Cost of contracts expense related to service concession arrangements and certain management type contracts are recorded as a reduction of revenue. Cost of contracts expense during the years ended December 31, 2022, 2021 and 2020, which was included in Services revenue within the Consolidated Statements of Income (Loss), was as follows:
|
|
Year Ended December 31, |
|
|||||||||
(millions) |
|
2022 |
|
|
2021 |
|
|
2020 |
|
|||
Cost of contracts expense |
|
$ |
|
|
$ |
|
|
$ |
|
|||
Weighted average life (years) |
|
|
|
|
|
|
|
|
|
|||
6. Net Income (Loss) per Common Share
Basic net income (loss) per common share is computed by dividing net income (loss) by the weighted daily average number of shares of common stock outstanding during the period. Diluted net income (loss) per common share is based upon the weighted daily average number of shares of common stock outstanding for the period plus all potentially dilutive stock-based awards, including restricted stock and performance share units, using the treasury-stock method. Unvested performance share units are excluded from the computation of weighted average diluted common shares outstanding if the performance targets upon which the issuance of the shares is contingent have not been achieved and the respective performance period has not been completed as of the end of the period. In periods where the Company has a net loss, stock-based awards are excluded from the calculation of net income (loss) per diluted common share, as their inclusion would be anti-dilutive.
Basic and diluted net income (loss) per common share and a reconciliation of the weighted average basic common shares outstanding to the weighted average diluted common shares outstanding during the years ending December 31, 2022, 2021 and 2020 was as follows:
|
|
Year Ended December 31, |
|
|||||||||
(millions, except share and per share data) |
|
2022 |
|
|
2021 |
|
|
2020 |
|
|||
Net income (loss) attributable to SP Plus Corporation |
|
$ |
|
|
$ |
|
|
$ |
( |
) |
||
Basic weighted average common shares outstanding |
|
|
|
|
|
|
|
|
|
|||
Dilutive impact of share-based awards |
|
|
|
|
|
|
|
|
— |
|
||
Diluted weighted average common shares outstanding |
|
|
|
|
|
|
|
|
|
|||
Net income (loss) per common share |
|
|
|
|
|
|
|
|
|
|||
Basic |
|
$ |
|
|
$ |
|
|
$ |
( |
) |
||
Diluted |
|
$ |
|
|
$ |
|
|
$ |
( |
) |
||
Due to the net loss during the year ended December 31, 2020, common stock equivalents arising from
There were
7. Stock-Based Compensation
The Company measures stock-based compensation expense at the grant date, based on the estimated fair value of the award based on assumptions, primarily the stock price, as of the grant date. The expense is recognized on a straight-line basis over the requisite employee service period or performance period (generally the vesting period) for awards expected to vest. For stock grants in which there is no requisite service period, the Company immediately recognizes the compensation expense. If an award is later modified, the Company may measure the award based on the estimated fair value at the modification date and recognize expense over the remaining requisite employee service period or performance period. The Company accounts for forfeitures of stock-based awards as they occur.
The Company has an amended and restated long-term incentive plan (the "Plan") under which the Company may grant future awards. On March 4, 2021, the Company’s Board of Directors (the “Board”) approved an amendment to the Plan that increased the number of shares of common stock available under the Plan from
Stock Grants
Stock-based compensation expense related to vested stock grants were included in General and administrative expenses within the Consolidated Statements of Income (Loss). The Company’s vested stock grants to the Board and related expense for the years ended December 31, 2022, 2021 and 2020, was as follows:
|
|
Year Ended December 31, |
|
|||||||||
(millions, except stock grants) |
|
2022 |
|
|
2021 |
|
|
2020 |
|
|||
Vested stock grants |
|
|
|
|
|
|
|
|
|
|||
Stock-based compensation expense |
|
$ |
|
|
$ |
|
|
$ |
|
|||
Restricted Stock Units
During the year ended December 31, 2022, the Company granted
During the year ended December 31, 2021, the Company granted
49
Nonvested restricted stock units as of December 31, 2022, and changes during the year ended December 31, 2022 were as follows:
|
|
Shares |
|
|
Weighted |
|
||
Nonvested as of December 31, 2021 |
|
|
|
|
$ |
|
||
Granted |
|
|
|
|
|
|
||
Vested |
|
|
( |
) |
|
|
|
|
Forfeited |
|
|
( |
) |
|
|
|
|
Nonvested as of December 31, 2022 |
|
|
|
|
$ |
|
||
The Company's stock-based compensation expense related to restricted stock units during the years ended December 31, 2022, 2021 and 2020, which was included in General and administrative expenses within the Consolidated Statements of Income (Loss), was as follows:
|
|
Year Ended December 31, |
|
|||||||||
(millions) |
|
2022 |
|
|
2021 |
|
|
2020 |
|
|||
Stock-based compensation expense |
|
$ |
|
|
$ |
|
|
$ |
|
|||
Unrecognized stock-based compensation expense related to restricted stock units and the respective weighted average periods in which the expense will be recognized as of December 31, 2022 was as follows:
|
|
Year Ended December 31, |
|
|
(millions) |
|
2022 |
|
|
Unrecognized stock-based compensation |
|
$ |
|
|
Weighted average (years) |
|
|
|
|
Performance Share Units (“PSU’s”)
In September 2014, the Board authorized a performance-based incentive program under the Plan (“Performance-based Incentive Program”), whereby the Company may issue PSU’s to certain individuals that represent shares potentially issuable in the future. The objective of the Performance-Based Incentive Program is to link compensation to business performance, encourage the ownership of the Company’s common stock, retain key employees and reward certain employees' performance. The Performance-Based Incentive Program provides participants with the opportunity to earn vested common stock if certain performance targets are achieved over the cumulative three-year period starting in the year of grant and the participants satisfy service-based vesting requirements. The stock-based compensation expense associated with PSU’s is recognized on a straight-line basis over the shorter of the vesting period or minimum service period and dependent upon the probable outcome of the number of shares that will ultimately be issued based on the achievement of the performance target defined in the award over the cumulative three-year period.
The Company granted awards during the years ended December 31, 2022, 2021 and 2020 of
The performance target for the awards granted in 2020 (“2020 PSU’s”) was based on the achievement of free cash flow before cash taxes and interest payments over the cumulative three-year period starting in the year of grant, subject to certain discretionary adjustments by the Board. The 2020 PSU’s expired December 31, 2022 and
Nonvested PSU’s as of December 31, 2022, and changes during the year ended December 31, 2022 were as follows:
|
|
Shares |
|
|
Weighted |
|
||
Nonvested as of December 31, 2021 |
|
|
|
|
$ |
|
||
Granted |
|
|
|
|
|
|
||
Forfeited |
|
|
( |
) |
|
|
|
|
Expired |
|
|
( |
) |
|
|
|
|
Nonvested as of December 31, 2022 |
|
|
|
|
$ |
|
||
The Company's stock-based compensation expense (net reduction of expense) related to PSU’s during the years ended December 31, 2022, 2021 and 2020, which was included in General and administrative expenses within the Consolidated Statements of Income (Loss), was as follows:
|
|
Year Ended December 31, |
|
|||||||||
(millions) |
|
2022 |
|
|
2021 |
|
|
2020 |
|
|||
Stock-based compensation expense |
|
$ |
|
|
$ |
|
|
$ |
( |
) |
||
Unrecognized stock-based compensation expense related to PSU’s and the respective weighted average periods in which the expense will be recognized as of December 31, 2022 was as follows:
50
|
|
Year Ended December 31, |
|
|
(millions) |
|
2022 |
|
|
Unrecognized stock-based compensation |
|
$ |
|
|
Weighted average (years) |
|
|
|
|
The Company could recognize additional future stock-based compensation of $
8. Property and Equipment, net
Property and equipment, and the related accumulated depreciation and amortization as of December 31, 2022, 2021 and 2020, were as follows:
|
|
|
|
December 31 |
|
|||||
(millions) |
|
Estimated Useful Life |
|
2022 |
|
|
2021 |
|
||
Equipment |
|
|
$ |
|
|
$ |
|
|||
Software |
|
|
|
|
|
|
|
|||
Vehicles |
|
|
|
|
|
|
|
|||
Other |
|
|
|
|
|
|
|
|||
|
|
Shorter of lease term or economic life up to |
|
|
|
|
|
|
||
Leasehold improvements |
|
|
|
|
|
|
|
|||
Construction in progress |
|
|
|
|
|
|
|
|
||
Property and equipment, gross |
|
|
|
|
|
|
|
|
||
Accumulated depreciation and amortization |
|
|
|
|
( |
) |
|
|
( |
) |
Property and equipment, net |
|
|
|
$ |
|
|
$ |
|
||
Asset additions are recorded at cost, which includes interest on significant projects. Depreciation is recorded on a straight-line basis over their estimated useful lives or the terms of the respective leases, whichever is shorter. Leasehold improvements, equipment and construction in progress are reviewed for impairment when conditions indicate an impairment may be present. If the assets are determined to be impaired, they are either written down or the useful life is adjusted to the remaining period of estimated useful life.
The Company's depreciation and amortization expense related to property and equipment during the years ended December 31, 2022, 2021 and 2020, which was included in Depreciation and amortization expense within the Consolidated Statements of Income (Loss), was as follows:
|
|
Year Ended December 31, |
|
|||||||||
(millions) |
|
2022 |
|
|
2021 |
|
|
2020 |
|
|||
Depreciation expense and amortization |
|
$ |
|
|
$ |
|
|
$ |
|
|||
9. Other Intangible Assets, net
The components of other intangible assets, net, as of December 31, 2022 and 2021, were as follows:
|
|
|
|
|
December 31, |
|
||||||||||||||||||||||
|
|
|
|
|
2022 |
|
|
2021 |
|
|||||||||||||||||||
|
|
Weighted |
|
|
|
|
|
|
|
|
|
|
|
|
|
|
|
|
|
|
|
|||||||
|
|
Average |
|
|
Intangible |
|
|
|
|
|
Intangible |
|
|
Intangible |
|
|
|
|
|
Intangible |
|
|||||||
|
|
Life |
|
|
Assets, |
|
|
Accumulated |
|
|
Assets, |
|
|
Assets, |
|
|
Accumulated |
|
|
Assets, |
|
|||||||
(millions) |
|
(Years) |
|
|
Gross |
|
|
Amortization |
|
|
Net |
|
|
Gross |
|
|
Amortization |
|
|
Net |
|
|||||||
Covenant not to compete |
|
|
|
|
$ |
|
|
$ |
( |
) |
|
$ |
|
|
$ |
|
|
$ |
( |
) |
|
$ |
|
|||||
Trade names and trademarks |
|
|
|
|
|
|
|
|
( |
) |
|
|
|
|
|
|
|
|
( |
) |
|
|
|
|||||
Proprietary know how |
|
|
|
|
|
|
|
|
( |
) |
|
|
|
|
|
|
|
|
( |
) |
|
|
|
|||||
Management contract rights |
|
|
|
|
|
|
|
|
( |
) |
|
|
|
|
|
|
|
|
( |
) |
|
|
|
|||||
Customer relationships |
|
|
|
|
|
|
|
|
( |
) |
|
|
|
|
|
|
|
|
( |
) |
|
|
|
|||||
Other intangible assets, net |
|
|
|
|
$ |
|
|
$ |
( |
) |
|
$ |
|
|
$ |
|
|
$ |
( |
) |
|
$ |
|
|||||
As discussed in Note 1. Significant Accounting Policies and Practices, due to the impact of COVID-19 on the Company’s expected future operating cash flows, the Company determined certain impairment testing triggers had occurred for Proprietary know how intangible assets as of June 30, 2020.
Accordingly, the Company analyzed undiscounted cash flows for these intangible assets as of June 30, 2020 and determined the carrying value for the Proprietary know how assets was higher than their projected undiscounted cash flows. As a result, the Company recorded $
Additionally, due to the termination of certain contracts within the Aviation segment during August 2020 and the impact of COVID-19 on the Company's expected future operating cash flows, the Company analyzed undiscounted cash flows for customer relationships and trade names and trademarks as of August 31, 2020. The Company determined the carrying values for certain customer relationships and trade names and trademarks were higher than their projected undiscounted cash flows. As a result, the Company recorded $
The fair value of these intangible assets were classified as Level 3 in the fair value hierarchy. See Note 11. Fair Value Measurement for further discussion.
51
Amortization expense related to other intangible assets during the years ended December 31, 2022, 2021 and 2020, which was included in Depreciation and amortization within the Consolidated Statements of Income (Loss), was as follows:
|
|
Year Ended December 31, |
|
|||||||||
(millions) |
|
2022 |
|
|
2021 |
|
|
2020 |
|
|||
Amortization expense |
|
$ |
|
|
$ |
|
|
$ |
|
|||
The expected future amortization of other intangible assets as of December 31, 2022 was as follows:
(millions) |
|
Intangible asset |
|
|
2023 |
|
$ |
|
|
2024 |
|
|
|
|
2025 |
|
|
|
|
2026 |
|
|
|
|
2027 |
|
|
|
|
2028 and thereafter |
|
|
|
|
Total |
|
$ |
|
|
10. Goodwill
The changes in the carrying amounts of goodwill during the years ended December 31, 2022, 2021 and 2020 were as follows:
(millions) |
|
Commercial |
|
|
Aviation |
|
|
Total |
|
|||
Net book values as of January 1, 2021 and December 31, 2021 |
|
|
|
|
|
|
|
|
|
|||
Goodwill |
|
$ |
|
|
$ |
|
|
$ |
|
|||
Accumulated impairment losses |
|
|
— |
|
|
|
( |
) |
|
|
( |
) |
Total |
|
$ |
|
|
$ |
|
|
$ |
|
|||
Acquisitions |
|
|
|
|
|
|
|
|
|
|||
Foreign currency translation |
|
|
( |
) |
|
|
|
|
|
|
||
Net book value as of December 31, 2022 |
|
|
|
|
|
|
|
|
|
|||
Goodwill |
|
$ |
|
|
$ |
|
|
$ |
|
|||
Accumulated impairment losses |
|
|
— |
|
|
|
( |
) |
|
|
( |
) |
Total |
|
$ |
|
|
$ |
|
|
$ |
|
|||
As discussed in Note 1. Significant Accounting Policies and Practices, due to the impacts of COVID-19, revenues for certain markets in which the Company operates dropped significantly during 2020 as compared to the expectations as of the October 1, 2019 annual impairment test. As a result, the Company recorded a $
11. Fair Value Measurement
Fair Value Measurements-Recurring Basis
In determining fair value, the Company uses various valuation approaches within the fair value measurement framework. Fair value measurements are determined based on the assumptions that market participants would use in pricing an asset or liability. Applicable accounting literature establishes a hierarchy for inputs used in measuring fair value that maximizes the use of observable inputs and minimizes the use of unobservable inputs by requiring that the most observable inputs be used when available. The fair value hierarchy is based on observable or unobservable inputs to valuation techniques that are used to measure fair value. Observable inputs reflect assumptions market participants would use in pricing an asset or liability based on market data obtained from independent sources while unobservable inputs reflect a reporting entity's pricing based upon its own market assumptions. Applicable accounting literature defines levels within the hierarchy based on the reliability of inputs as follows:
Cash and cash equivalents are financial assets measured at fair value on a recurring basis. See Note 1. Significant Accounting Policies and Practices for further discussion.
Contingent consideration are financial liabilities measured at fair value on a recurring basis using Level 3 under the fair value hierarchy. See Note 2. Acquisitions for further discussion.
Nonrecurring Fair Value Measurements
Certain assets are measured at fair value on a nonrecurring basis, generally as a result of acquisitions or the remeasurement of assets resulting in impairment charges. The purchase price of business acquisitions is primarily allocated to the tangible and identifiable intangible assets acquired and liabilities assumed based on their estimated fair values on the acquisition dates, with the excess, if applicable, recorded as goodwill. The Company utilizes Level 3 inputs in the determination of the initial fair value using certain assumptions.
Non-financial assets, such as goodwill, other intangible assets, and property and equipment are subsequently measured at fair value when there is an indicator of impairment and recorded at fair value when impairment is recognized. The Company assesses the impairment of intangible assets annually or whenever events or changes in circumstances indicate that the carrying amount of an intangible asset may not be recoverable. The fair value of the Company’s goodwill or other
52
intangible assets are not estimated if there is no change in events or circumstances that indicate the carrying amount of the goodwill and intangible assets may not be recoverable. During the years ended December 31, 2022, 2021 and 2020 the Company measured certain assets at fair value, which resulted in impairment charges. The fair value of these assets were determined using a discounted cash flow (“DCF”) model, which estimated the present value of net cash flows that the asset or asset group was expected to generate. The key inputs to the DCF model included the Company’s future projections of cash operating income, capital expenditures and current discount rates.
For those assets and asset groups for which impairment was recorded, the fair value as of the measurement date, net book value as of December 31, 2022, 2021 and 2020, and the related impairment charges during the years ended December 31, 2022, 2021 and 2020, were as follows:
|
Year ended December 31, 2022 |
|
|
As of |
|
||||||||
|
|
|
As of Measurement Date |
|
|
|
|
||||||
(millions) |
Measurement Date |
|
Impairment Charge |
|
|
Fair Value Measurement (Level 3) |
|
|
Net Book Value of Assets Assessed for Impairment |
|
|||
ROU assets |
|
$ |
|
|
$ |
|
|
|
|
||||
Total of ROU assets impaired |
|
|
$ |
|
|
$ |
|
|
$ |
|
|||
|
|
|
|
|
|
|
|
|
|
|
|||
|
Year ended December 31, 2021 |
|
|
As of |
|
||||||||
|
|
|
As of Measurement Date |
|
|
|
|
||||||
(millions) |
Measurement Date |
|
Impairment Charge |
|
|
Fair Value Measurement (Level 3) |
|
|
Net Book Value of Assets Assessed for Impairment |
|
|||
ROU assets |
|
$ |
|
|
$ |
— |
|
|
|
|
|||
ROU assets |
|
|
|
|
|
|
|
|
|
||||
Total of ROU assets impaired |
|
|
$ |
|
|
$ |
|
|
$ |
|
|||
|
|
|
|
|
|
|
|
|
|
|
|||
|
Year ended December 31, 2020 |
|
|
As of |
|
||||||||
|
|
|
As of Measurement Date |
|
|
|
|
||||||
(millions) |
Measurement Date |
|
Impairment Charge |
|
|
Fair Value Measurement (Level 3) |
|
|
Net Book Value of Assets Assessed for Impairment |
|
|||
ROU assets |
|
$ |
|
|
$ |
|
|
|
|
||||
ROU assets |
|
|
|
|
|
|
|
|
|
||||
ROU assets |
|
|
|
|
|
|
|
|
|
||||
ROU assets |
|
|
|
|
|
|
|
|
|
||||
Total of ROU assets impaired |
|
|
$ |
|
|
$ |
|
|
$ |
|
|||
Goodwill - Aviation reporting unit |
|
$ |
|
|
$ |
|
|
$ |
|
||||
|
|
|
|
|
|
|
|
|
|||||
|
|
|
|
|
|
|
|
|
|||||
|
|
|
|
|
|
|
|
|
|||||
|
|
$ |
|
|
$ |
|
|
$ |
|
||||
Financial Instruments Not Measured at Fair Value
The fair value of the Senior Credit Facility and other obligations approximates the carrying amount due to variable interest rates and would be classified as Level 2 in the fair value hierarchy. See Note 12. Borrowing Arrangements for further information.
12. Borrowing Arrangements
Long-term borrowings, as of December 31, 2022 and 2021, in order of preference, were as follows:
|
|
|
|
Amount Outstanding |
|
|||||
|
|
|
|
December 31, |
|
|||||
(millions) |
|
Maturity Date |
|
2022 |
|
|
2021 |
|
||
Senior Credit Facility, net of original discount on borrowings (1) |
|
|
$ |
|
|
$ |
|
|||
Other borrowings (2) |
|
|
|
|
|
|
|
|||
Deferred financing costs |
|
|
|
|
( |
) |
|
|
( |
) |
Total obligations |
|
|
|
|
|
|
|
|
||
Less: Current portion of long-term borrowings |
|
|
|
|
|
|
|
|
||
Long-term borrowings, excluding current portion |
|
|
|
$ |
|
|
$ |
|
||
53
At December 31, 2022, the future maturities of debt, including finance leases, were as follows:
(millions) |
|
|
|
|
2023 |
|
$ |
|
|
2024 |
|
|
|
|
2025 |
|
|
|
|
2026 |
|
|
|
|
2027 |
|
|
|
|
Thereafter |
|
|
|
|
Total |
|
$ |
|
|
Senior Credit Facility
On April 21, 2022 (the “Fifth Amendment Effective Date”), the Company entered into a fifth amendment (the “Fifth Amendment”) to the Company’s credit agreement (as amended prior to the Fifth Amendment Effective Date, the “Credit Agreement”; the Credit Agreement, as amended by the Fifth Amendment, the “Amended Credit Agreement”) with Bank of America, N.A. (“Bank of America”), as Administrative Agent, swing-line lender and a letter of credit issuer; certain subsidiaries of the Company, as guarantors; and the lenders party thereto (the “Lenders”), pursuant to which the Lenders have made available to the Company a senior secured credit facility (the “Senior Credit Facility”). The Senior Credit Facility permits aggregate borrowings of $
Borrowings under the Senior Credit Facility bear interest, at the Company’s option, at the (i) forward looking SOFR term interest rate administered by Chicago Mercantile Exchange ("Term SOFR") plus a credit spread adjustment, subject to a “floor” on Term SOFR of
The Amended Credit Agreement provided that the maximum Consolidated Leverage Ratio was
The Amended Credit Agreement provides that the Company shall maintain a minimum consolidated interest coverage ratio of
Term loans under the Senior Credit Facility are subject to scheduled quarterly payments of principal in installments equal to
Events of default under the Amended Credit Agreement include failure to pay principal or interest when due, failure to comply with the financial and operational covenants, the occurrence of any cross default event, non-compliance with other loan documents, the occurrence of a change in control event, and bankruptcy and other insolvency events.
Each wholly owned domestic subsidiary of the Company (subject to certain exceptions set forth in the Amended Credit Agreement) has guaranteed all existing and future indebtedness and liabilities of the other guarantors and the Company arising under the Credit Agreement. The Company’s obligations under the Credit Agreement and such domestic subsidiaries’ guaranty obligations are secured by substantially all of their respective assets.
As of December 31, 2022, the Company had $
The weighted average interest rate on the Company's Senior Credit Facility was
During the years ended December 31, 2022 and 2021, the Company incurred approximately $
Interest Rate Collars
In May 2019, the Company entered into
54
On May 6, 2020, concurrent with entering into the Third Amendment, the Company de-designated the interest rate collars. Prior to de-designation, the effective portion of the change in the fair value of the interest rate collars was reported in Accumulated other comprehensive loss. Upon de-designation, the balance in Accumulated other comprehensive loss was being reclassified to Other expense within the Consolidated Statements of Income (Loss) on a straight-line basis through April 2022, which was over the remaining life for which the interest rate collars had previously been designated as cash flow hedges. Changes in the fair value of the interest rate collars after de-designation were included in Other expense within the Consolidated Statements of Income (Loss). During the years ended December 31, 2022, 2021 and 2020, $
See Note 16. Comprehensive Income (Loss) for the amount reclassified from Accumulated other comprehensive loss to the Condensed Consolidated Statements of Income.
Subordinated Convertible Debentures
The Company acquired Subordinated Convertible Debentures ("Convertible Debentures") as a result of the October 2, 2012 acquisition of Central Parking Corporation. As of October 2, 2012, the convertible debentures were no longer redeemable for shares. The subordinated debenture holders have the right to redeem the Convertible Debentures for $
13. Stock Repurchase Program
On February 14, 2023, the Board authorized the Company to repurchase, on the open market, shares of the Company’s outstanding common stock in an amount not to exceed $
In May 2022, the Board authorized the Company to repurchase, on the open market, shares of the Company’s outstanding common stock in an amount not to exceed $
As of December 31, 2022, $
Share repurchase activity under the May 2022 stock repurchase program for the year ended December 31, 2022 was as follows:
(millions, except for share and per share data) |
|
December 31, 2022 |
|
|
Total number of shares repurchased |
|
|
|
|
Average price paid per share |
|
$ |
|
|
Total value of stock repurchased |
|
$ |
|
|
The remaining authorized repurchase amount under the May 2022 repurchase program as of December 31, 2022 is as follows:
(millions) |
|
December 31, 2022 |
|
|
Total authorized repurchase amount |
|
$ |
|
|
Total value of shares repurchased |
|
|
|
|
Total remaining authorized repurchase amount |
|
$ |
|
|
14. Income Taxes
Earnings (loss) before income taxes during the years ended December 31, 2022, 2021 and 2020, was as follows:
|
|
Year Ended December 31, |
|
|||||||||
(millions) |
|
2022 |
|
|
2021 |
|
|
2020 |
|
|||
United States |
|
$ |
|
|
$ |
|
|
$ |
( |
) |
||
Foreign |
|
|
|
|
|
|
|
|
( |
) |
||
Total |
|
$ |
|
|
$ |
|
|
$ |
( |
) |
||
The components of income tax expense (benefit) during the years ended December 31, 2022, 2021 and 2020 were as follows:
|
|
Year Ended December 31, |
|
|||||||||
(millions) |
|
2022 |
|
|
2021 |
|
|
2020 |
|
|||
Current |
|
|
|
|
|
|
|
|
|
|||
U.S. Federal |
|
$ |
|
|
$ |
( |
) |
|
$ |
( |
) |
|
Foreign |
|
|
|
|
|
|
|
|
|
|||
State |
|
|
|
|
|
|
|
|
|
|||
Total current |
|
|
|
|
|
( |
) |
|
|
( |
) |
|
Deferred |
|
|
|
|
|
|
|
|
|
|||
U.S. Federal |
|
|
|
|
|
|
|
|
( |
) |
||
Foreign |
|
|
— |
|
|
|
|
|
|
— |
|
|
State |
|
|
|
|
|
|
|
|
( |
) |
||
Total deferred |
|
|
|
|
|
|
|
|
( |
) |
||
Income tax expense (benefit) |
|
$ |
|
|
$ |
|
|
$ |
( |
) |
||
55
Deferred income taxes reflect the net effects of temporary differences between the carrying amounts of assets and liabilities for U.S. GAAP purposes and the amount used for income tax purposes.
The c
|
|
December 31, |
|
|||||
(millions) |
|
2022 |
|
|
2021 |
|
||
Deferred tax assets |
|
|
|
|
|
|
||
NOL carry forwards and tax credits |
|
$ |
|
|
$ |
|
||
Lease liabilities |
|
|
|
|
|
|
||
Accrued expenses |
|
|
|
|
|
|
||
Accrued compensation |
|
|
|
|
|
|
||
Depreciation |
|
|
|
|
|
|
||
Other |
|
|
|
|
|
|
||
Total deferred tax assets |
|
|
|
|
|
|
||
Valuation allowances |
|
|
( |
) |
|
|
( |
) |
Net deferred tax assets |
|
|
|
|
|
|
||
Deferred tax liabilities |
|
|
|
|
|
|
||
ROU assets |
|
|
( |
) |
|
|
( |
) |
Depreciation and amortization |
|
|
( |
) |
|
|
( |
) |
Goodwill |
|
|
( |
) |
|
|
( |
) |
Equity investments in unconsolidated entities |
|
|
( |
) |
|
|
( |
) |
Other |
|
|
( |
) |
|
|
( |
) |
Total deferred tax liabilities |
|
|
( |
) |
|
|
( |
) |
Total net deferred tax asset |
|
$ |
|
|
$ |
|
||
|
|
|
|
|
|
|
||
Amounts per Consolidated Balance Sheets |
|
|
|
|
|
|
||
Deferred tax assets |
|
|
|
|
|
|
||
Deferred tax liabilities (included in Other noncurrent liabilities) |
|
|
( |
) |
|
|
— |
|
Total net deferred tax asset |
|
$ |
|
|
$ |
|
||
Changes affecting the valuation allowances on deferred tax assets during the years ended December 31, 2022, 2021 and 2020, were as follows:
|
|
December 31, |
|
|||||||||
(millions) |
|
2022 |
|
|
2021 |
|
|
2020 |
|
|||
Beginning Balance |
|
$ |
|
|
$ |
|
|
$ |
|
|||
Current year (benefit) expense |
|
|
( |
) |
|
|
|
|
|
|
||
Ending Balance |
|
$ |
|
|
$ |
|
|
$ |
|
|||
The accounting guidance for income taxes requires the Company to assess the realizability of deferred tax assets at each reporting period. These assessments generally consider several factors including the reversal of existing temporary differences, projected future taxable income and potential tax planning strategies. The Company has valuation allowances of $
The Company has $
A reconciliation of differences between the U.S. Federal statutory income tax rate and the Company's effective income tax rate during the years ended December 31, 2022, 2021 and 2020, was as follows:
|
|
Year Ended December 31, |
|
|||||||||
(percentages) |
|
2022 |
|
|
2021 |
|
|
2020 |
|
|||
Tax at statutory rate |
|
|
% |
|
|
% |
|
|
% |
|||
Permanent differences |
|
|
% |
|
|
% |
|
|
( |
)% |
||
State and local income taxes, net of federal benefit |
|
|
% |
|
|
% |
|
|
% |
|||
Foreign taxes |
|
|
% |
|
|
% |
|
|
( |
)% |
||
Federal NOL carryback rate differential |
|
|
|
|
|
( |
)% |
|
|
% |
||
Noncontrolling interest |
|
|
( |
)% |
|
|
( |
)% |
|
|
|
|
Recognition of tax credits |
|
|
( |
)% |
|
|
( |
)% |
|
|
% |
|
|
|
|
% |
|
|
% |
|
|
% |
|||
Change in valuation allowance |
|
|
( |
)% |
|
|
% |
|
|
( |
)% |
|
Effective tax rate |
|
|
% |
|
|
% |
|
|
% |
|||
Due to the Coronavirus Aid, Relief, and Economic Security Act in 2020, the Company was able to carry back its 2020 U.S. Federal taxable loss to the 2015 and 2016 tax years, which had a higher corporate tax rate. As a result, based on the Company’s initial estimates as of December 31, 2020, the Company recorded an income tax refund receivable of $
Taxes refunded, net of payments, were $
As of December 31, 2022 and 2021, the Company had not identified any uncertain tax positions that would have a material impact on the Company's financial position.
56
The Company would recognize potential interest and penalties related to uncertain tax positions, if any, in income tax expense.
|
United States - federal income tax |
|
|
United States - state and local income tax |
|
|
Foreign - Canada and Puerto Rico |
15. Benefit Plans
Deferred Compensation Arrangements
The Company offers deferred compensation arrangements for certain key executives. Certain employees are offered supplemental pension arrangements, subject to their continued employment by the Company, in which the employees will receive a defined monthly benefit upon attaining age
In addition, the Company has agreements with certain former key executives that provide for aggregate annual payments over periods ranging from
Life insurance contracts with a face value of approximately $
Defined Contribution Plans
The Company sponsors savings and retirement plans whereby the participants may elect to contribute a portion of their compensation to the plans. The plan is a qualified defined contribution plan 401(k). The Company contributes an amount in cash or other property as a Company match equal to
Additionally, the Company offers a non-qualified deferred compensation plan to those employees whose participation in the 401(k) plan is limited by statute or regulation. This plan allows certain employees to defer a portion of their compensation, limited to a maximum of $
Multi-Employer Defined Benefit and Contribution Plans
The Company contributes to multiemployer defined benefit plans under the terms of collective-bargaining agreements that cover its union-represented employees. The risks of participating in these multiemployer plans are different from single-employer plans in the following aspects:
The Company's contributions represented more than 5% of total contributions to the Teamsters Local Union No. 727 and Local 272 Labor Management Benefit Funds during the plan years ending February 28, 2022 and November 30, 2022, respectively. The Company does not contribute more than 5% to any other fund. The Company's participation in these plans for the annual periods ended December 31, 2022, 2021 and 2020, is presented in the table below. The "EIN/Pension Plan Number" column provides the Employee Identification Number ("EIN") and the three-digit plan number, if applicable. The zone status was based on information that the Company received from the plan and was certified by the plan's actuary. Among other factors, plans in the red zone are generally less than 65 percent funded, plans in the yellow zone are less than 80 percent funded, and plans in the green zone are at least 80 percent funded. The "FIP/RP Status Pending/Implementation" column indicates plans for which a Financial Improvement Plan ("FIP") or a Rehabilitation Plan ("RP") is either pending or has been implemented. Finally, the "Expiration Date of Collective Bargaining Agreement" column lists the expiration dates of the agreements to which the plans are subject.
|
|
|
|
|
|
|
|
|
|
|
|
|
|
|
|
|
|
|
|
|
|
|
Zone |
|
|
|||
|
|
|
|
|
|
|
|
|
|
|
|
|
|
|
|
|
|
|
|
|
|
|
Status |
|
|
|||
|
|
|
|
Pension Protection |
|
|
|
|
|
|
|
|
|
|
|
|
|
|
as of the |
|
Expiration |
|||||||
|
|
EIN/ |
|
Zone Status |
|
|
|
Contributions (millions) |
|
|
|
|
Most |
|
Date of |
|||||||||||||
|
|
Pension |
|
|
|
|
|
|
|
FIP/FR |
|
|
|
|
|
|
|
|
|
|
|
|
Recent |
|
Collective |
|||
|
|
Plan |
|
|
|
|
|
|
|
Pending |
|
|
|
|
|
|
|
|
|
|
Surcharge |
|
Annual |
|
Bargaining |
|||
Pension |
|
Number |
|
2022 |
|
2020 |
|
2019 |
|
Implementation |
|
2022 |
|
|
2021 |
|
|
2020 |
|
|
Imposed |
|
Report |
|
Agreement |
|||
Teamsters Local |
|
36-61023973 |
|
|
|
|
N/A |
|
$ |
|
|
$ |
|
|
$ |
|
|
No |
|
2022 |
|
10/31/2026 |
||||||
Local 272 Labor |
|
13-5673836 |
|
|
|
|
N/A |
|
$ |
|
|
$ |
|
|
$ |
|
|
No |
|
2022 |
|
9/8/2023 |
||||||
57
Net expenses for contributions not reimbursed by clients related to multiemployer defined benefit and defined contribution benefit plans were $
The Company currently does not have any intentions to cease participating in these multiemployer pension plans.
16. Comprehensive (Loss) Income
The components of other comprehensive income (loss) and the income tax benefit allocated to each component during the years ended December 31, 2022, 2021 and 2020, were as follows:
|
|
2022 |
|
|
2021 |
|
|
2020 |
|
|||||||||||||||||||||
(millions) |
|
Before Tax Amount |
|
Income Tax |
|
Net of Tax Amount |
|
|
Before Tax Amount |
|
Income Tax |
|
Net of Tax Amount |
|
|
Before Tax Amount |
|
Income Tax |
|
Net of Tax Amount |
|
|||||||||
Translation adjustments |
|
$ |
|
$ |
— |
|
$ |
|
|
$ |
( |
) |
$ |
— |
|
$ |
( |
) |
|
$ |
|
$ |
— |
|
$ |
|
||||
De-designation of interest rate collars |
|
|
|
|
|
|
|
|
|
|
|
|
|
|
|
|
|
|
|
|
|
|||||||||
Change in fair value of interest rate collars |
|
|
— |
|
|
— |
|
|
— |
|
|
|
— |
|
|
— |
|
|
— |
|
|
|
( |
) |
|
( |
) |
|
( |
) |
Other Comprehensive income (loss) |
|
$ |
|
$ |
|
$ |
|
|
$ |
|
$ |
|
$ |
|
|
$ |
( |
) |
$ |
( |
) |
$ |
( |
) |
||||||
The changes to accumulated other comprehensive loss by component during the years ended December 31, 2022, 2021 and 2020, were as follows:
|
|
|
|
|
|
|
|
Total |
|
|||
|
|
Foreign |
|
|
|
|
|
Accumulated |
|
|||
|
|
Currency |
|
|
|
|
|
Other |
|
|||
|
|
Translation |
|
|
Interest Rate |
|
|
Comprehensive |
|
|||
(millions) |
|
Adjustments |
|
|
Collars |
|
|
Loss |
|
|||
Balance as of January 1, 2020 |
|
$ |
( |
) |
|
$ |
( |
) |
|
$ |
( |
) |
Other comprehensive income (loss) before reclassification |
|
|
|
|
|
( |
) |
|
|
( |
) |
|
Amounts reclassified from accumulated other comprehensive loss |
|
|
|
|
|
|
|
|
|
|||
Balance as of December 31, 2020 |
|
|
( |
) |
|
|
( |
) |
|
|
( |
) |
Other comprehensive loss before reclassification |
|
|
( |
) |
|
|
— |
|
|
|
( |
) |
Amounts reclassified from accumulated other comprehensive loss |
|
|
— |
|
|
|
|
|
|
|
||
Balance as of December 31, 2021 |
|
|
( |
) |
|
|
( |
) |
|
|
( |
) |
Other comprehensive income before reclassification |
|
|
|
|
|
— |
|
|
|
|
||
Amounts reclassified from accumulated other comprehensive loss |
|
|
|
|
|
|
|
|
|
|||
Balance as of December 31, 2022 |
|
$ |
( |
) |
|
$ |
|
|
$ |
( |
) |
|
Reclassifications from accumulated other comprehensive loss during the years ended December 31, 2022, 2021 and 2020, were as follows:
(millions) |
|
2022 |
|
|
2021 |
|
|
2020 |
|
Classification in the Consolidated Statements of Income (Loss) |
|||
Interest Rate Collars: |
|
|
|
|
|
|
|
|
|
|
|||
Net realized loss |
|
$ |
|
|
$ |
|
|
$ |
|
Other expenses |
|||
Reclassifications before tax |
|
|
|
|
|
|
|
|
|
|
|||
Income tax benefit |
|
|
|
|
|
|
|
|
|
|
|||
Reclassifications, net of tax |
|
$ |
|
|
$ |
|
|
$ |
|
|
|||
17. Legal and Other Commitments and Contingencies
The Company is subject to claims and litigation in the normal course of its business, including those related to labor and employment, contracts, personal injury and other related matters, some of which allege substantial monetary damages and claims. Some of these actions may be brought as class actions on behalf of a class or purported class of employees. While the outcomes of claims and legal proceedings brought against the Company are subject to significant uncertainty, the Company believes the final outcome will not have a material adverse effect on its financial position, results of operations or cash flows.
The Company accrues a charge when it determines that it is probable that an asset has been impaired or a liability has been incurred and the amount of loss can be reasonably estimated. When a loss is probable, the Company records an accrual based on the reasonably estimable loss or range of loss. When no point of loss is more likely than another, the Company records the lowest amount in the estimated range of loss, and if material, discloses the estimated range. The Company does not record liabilities for reasonably possible loss contingencies, but does disclose a range of reasonably possible losses if they are material and the Company is able to estimate such a range. If the Company cannot provide a range of reasonably possible losses, it explains the factors that prevent it from determining such a range. The Company regularly evaluates current information available to determine whether an accrual should be established or adjusted. Estimating the probability that a loss will occur and the amount of a loss or a range of loss involves significant estimation and judgment.
18. Segment Information
Segment information is presented in accordance with a “management approach,” which designates the internal reporting used by the Company's Chief Operating Decision Maker (“CODM”) for making decisions and assessing performance as the source of the Company’s reportable segments. The Company’s segments are organized in a manner consistent with which discrete financial information is available and evaluated regularly by the CODM in deciding how to allocate resources and assess performance.
An operating segment is defined as a component of an enterprise that engages in business activities from which it may earn revenue and incur expenses, and about which separate financial information is regularly evaluated by the CODM. The Company’s CODM is the Company’s chief executive officer.
58
Each of the operating segments are directly responsible for revenue and expenses related to their operations, including direct segment general and administrative expenses. The CODM assesses the performance of each operating segment using information about operating income (loss) as its primary measure of performance, but does not evaluate segments using discrete asset information. There were no inter-segment transactions during the years ended December 31, 2022, 2021 and 2020, and the Company does not allocate other expense (income), interest expense (income) or income tax expense (benefit) to the operating segments. The accounting policies for segment reporting are the same as for the Company as a whole.
In March 2022, the Company changed its internal segment information reported to the CODM for certain costs that were allocated from the Other segment to the Commercial segment. All prior year amounts have been reclassified to conform to the Company's current reporting structure.
The Company’s operating segments are Commercial and Aviation:
The Other segment includes costs related to the Company's operational support teams and costs related to common and shared infrastructure, including finance, accounting, information technology, human resources, procurement and purchasing, legal and corporate development.
Revenue, operating income (loss), general and administrative expenses, depreciation and amortization, and impairment of goodwill and intangible assets by operating segment during the years ended December 31, 2022, 2021 and 2020 were as follows:
|
|
Year Ended December 31, |
||||||||||||||||
(millions) |
|
2022 |
|
|
|
|
2021 |
|
|
|
|
2020 |
|
|
|
|||
Services revenue |
|
|
|
|
|
|
|
|
|
|
|
|
|
|
|
|||
Commercial |
|
|
|
|
|
|
|
|
|
|
|
|
|
|
|
|||
Lease type contracts |
|
$ |
|
|
|
|
$ |
|
|
|
|
$ |
|
|
|
|||
Management type contracts |
|
|
|
|
|
|
|
|
|
|
|
|
|
|
|
|||
Total Commercial |
|
|
|
|
|
|
|
|
|
|
|
|
|
|
|
|||
Aviation |
|
|
|
|
|
|
|
|
|
|
|
|
|
|
|
|||
Lease type contracts |
|
|
|
|
|
|
|
|
|
|
|
|
|
|
|
|||
Management type contracts |
|
|
|
|
|
|
|
|
|
|
|
|
|
|
|
|||
Total Aviation |
|
|
|
|
|
|
|
|
|
|
|
|
|
|
|
|||
Reimbursed management type contract revenue |
|
|
|
|
|
|
|
|
|
|
|
|
|
|
|
|||
Total services revenue |
|
$ |
|
|
|
|
$ |
|
|
|
|
$ |
|
|
|
|||
Operating income (loss) |
|
|
|
|
|
|
|
|
|
|
|
|
|
|
|
|||
Commercial |
|
$ |
|
|
|
|
$ |
|
|
|
|
$ |
( |
) |
|
|
||
Aviation |
|
|
|
|
|
|
|
|
|
|
|
|
( |
) |
|
|
||
Other |
|
|
( |
) |
|
|
|
|
( |
) |
|
|
|
|
( |
) |
|
|
Total operating income (loss) |
|
$ |
|
|
|
|
$ |
|
|
|
|
$ |
( |
) |
|
|
||
General and administrative expenses |
|
|
|
|
|
|
|
|
|
|
|
|
|
|
|
|||
Commercial |
|
$ |
|
|
|
|
$ |
|
|
|
|
$ |
|
|
|
|||
Aviation |
|
|
|
|
|
|
|
|
|
|
|
|
|
|
|
|||
Other |
|
|
|
|
|
|
|
|
|
|
|
|
|
|
|
|||
Total general and administrative expenses |
|
$ |
|
|
|
|
$ |
|
|
|
|
$ |
|
|
|
|||
Depreciation and amortization |
|
|
|
|
|
|
|
|
|
|
|
|
|
|
|
|||
Commercial(1) |
|
$ |
|
|
|
|
$ |
|
|
|
|
$ |
|
|
|
|||
Aviation(2) |
|
|
|
|
|
|
|
|
|
|
|
|
|
|
|
|||
Other |
|
|
|
|
|
|
|
|
|
|
|
|
|
|
|
|||
Total depreciation and amortization |
|
$ |
|
|
|
|
$ |
|
|
|
|
$ |
|
|
|
|||
Impairment of goodwill and intangible assets |
|
|
|
|
|
|
|
|
|
|
|
|
|
|
|
|||
Aviation |
|
|
— |
|
|
|
|
|
— |
|
|
|
|
|
|
|
|
|
Total impairment of goodwill and intangible assets |
|
$ |
— |
|
|
|
|
$ |
— |
|
|
|
|
$ |
|
|
|
|
59