Exhibit 99.1

First BanCorp. Announces Earnings for the Quarter and Year Ended December 31, 2012
SAN JUAN, Puerto Rico – February 5, 2013 – First BanCorp. (the “Corporation”) (NYSE: FBP), the bank holding company for FirstBank Puerto Rico (“FirstBank” or “the Bank”), today reported net income of $14.5 million for the fourth quarter of 2012 compared to net income of $19.1 million for the third quarter of 2012 and net loss of $14.8 million for the fourth quarter of 2011. For the year ended December 31, 2012, the Corporation reported net income of $29.8 million, an improvement compared to the net loss of $82.2 million for the year ended December 31, 2011.
This press release includes certain non-GAAP financial measures, including adjusted pre-tax, pre-provision income, adjusted net interest income and margin, and certain capital ratios, and should be read in conjunction with the accompanying tables (Exhibit A), which are an integral part of this press release.
2012 Fourth Quarter Highlights and Comparison with 2012 Third Quarter:
| • | Net income of $14.5 million, or $0.07 per diluted share. |
| • | Adjusted pre-tax, pre-provision income of $54.5 million, up $3.1 million. |
| • | Net interest income essentially unchanged: |
| • | Net interest income of $125.2 million, excluding fair value adjustments of $0.4 million, a decrease of $0.1 million. |
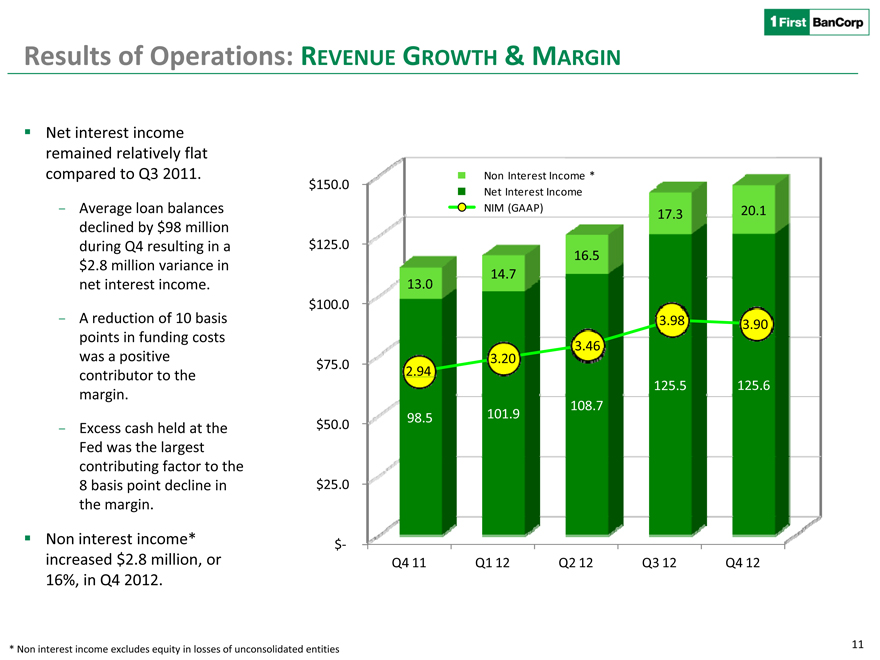
| • | Net interest margin, excluding fair value adjustments, decreased by 8 basis points to 3.90% driven by higher average cash balances maintained at the Federal Reserve. |
| • | Provision for loan and lease losses of $30.5 million, up $1.5 million. |
| • | Stable credit quality metrics: |
| • | Total non-performing assets decreased for the eleventh consecutive quarter, declining by $21.1 million to $1.24 billion. |
| • | The level of non-performing loans decreased by $30.2 million from the previous quarter to $977.8 million. |
| • | Net charge-offs remained flat at $40.6 million, or an annualized 1.59% of average loans. |
| • | Equity in losses of unconsolidated entities of $8.3 million, a negative variance of $6.1 million impacting net income, compared to losses of $2.2 million in the third quarter of 2012. |
| • | Increase of $2.0 million in revenues from the mortgage banking business. |
| • | Decrease of $0.9 million in non-interest expenses led by lower losses on real estate owned (REO) operations. |
| • | Strong regulatory capital ratios continued to increase through earnings generation: |
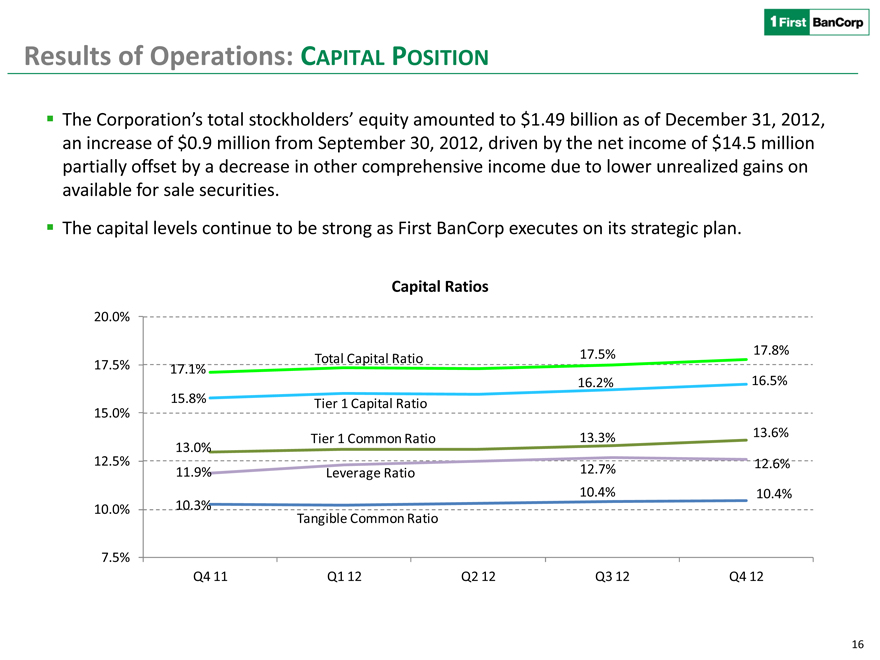
| • | Total capital, Tier 1 capital, and leverage ratios of the Corporation were 17.82%, 16.51%, and 12.60%, respectively, as of December 31, 2012, compared to 17.52%, 16.20%, and 12.71%, respectively, as of September 30, 2012. |
| • | Total capital, Tier 1 capital, and leverage ratios of the Corporation’s wholly owned banking subsidiary, FirstBank were 17.35%, 16.04%, and 12.25%, respectively, as of December 31, 2012, compared to 17.03%, 15.71%, and 12.35%, respectively, as of September 30, 2012. |
| • | Tier 1 common risk-based capital ratio of the Corporation of 13.61% as of December 31, 2012, up from 13.33% as of September 30, 2012. |
| • | Tangible common equity ratio of the Corporation of 10.44% as of December 31, 2012, up from 10.39% as of September 30, 2012. |
| • | Growth in total deposits: |
| • | Non-brokered deposits, excluding government fund deposits, increased by $151.5 million. |
| • | Government fund deposits decreased by $149.5 million. |
| • | Brokered certificates of deposit (CDs) decreased by $33.8 million. |
First BanCorp. Announces Earnings for the Quarter and Year Ended December 31, 2012 – Page 2 of 30
Aurelio Alemán, President and Chief Executive Officer of First BanCorp., commented: “Fourth quarter results capped a year of strong progress for First BanCorp., and we are pleased to report our third consecutive quarterly profit and first profitable year since 2008. The progress in advancing the franchise operating metrics is evident, pre-tax, pre-provision income reached $54.5 million for the quarter, up $26.0 million, or 91%, compared to the same quarter last year. Results for year 2012 reflect year-over-year improvements in a number of key areas, including an expanded net interest margin, stabilization in credit quality metrics, and a significant growth in non-brokered deposits and fee income. The net profit growth was also aided by lower provisions for loan losses. This growth has occurred in a challenging economic environment and demonstrates the strength of our franchise and the continued benefits from effectively executing our strategic plan.
During the year 2012, we have achieved significant improvements, including pre-tax, pre-provision income of $178.5 million, up 38% from the prior year; net interest income of $461.7 million, an increase of $68.2 million from last year; net interest margin of 3.63%, up significantly from 2.82% in 2011; and fee income derived from deposits, loan products and transaction fees increased by approximately $6 million, including fee income generated from the credit card portfolio acquired in 2012. The Corporation’s credit-risk profile improved as total non-performing assets decreased $99.1 million, or 7%, from last year and total net charge-offs decreased $116.5 million, or 39%. The quality of our deposit base improved in 2012 with a $313.7 million, or 5%, growth in non-brokered deposits while the number of consumer and commercial deposit customers in Puerto Rico grew 11% and 20%, respectively.
Lower rates paid on both brokered and non-brokered deposits and the reduction in the overall cost of funds were key to the expanded net interest margin, as we continued to improve the overall funding mix through our strategic focus on growing non-brokered deposits. In addition, the First Bank-branded credit card portfolio acquired in 2012 was an important contributor to our improvement in net interest income, diversified our revenue stream, and provides opportunities to broaden and deepen our relationship with our customers. Many of our credit quality performance metrics continued to show signs of improvement as reflected by the decrease in non-performing assets and net charge-offs; nevertheless, non-performing asset levels remain elevated and continue to be a challenge in the current economic environment. Improving asset quality continues to be our first priority as we continue with our emphasis on loan workouts and non-performing assets disposition strategies.”
Mr. Alemán stated further: “Earnings generation over the past three quarters has strengthened our capital position. We will continue to evaluate opportunities to invest in our franchise through enhanced products and services, and work to improve our credit quality and operating efficiency in order to achieve consistent, profitable growth in the future and generate appropriate returns for our shareholders.”
First BanCorp. Announces Earnings for the Quarter and Year Ended December 31, 2012 – Page 3 of 30
The following table provides details with respect to the calculation of the earnings per common share for the quarters ended December 31, 2012, September 30, 2012, and December 31, 2011 and for the years ended December 31, 2012 and 2011:
| (In thousands, except per share information) | Quarter Ended | Year Ended | ||||||||||||||||||
| December 31, | September 30, | December 31, | December 31, | December 31, | ||||||||||||||||
| 2012 | 2012 | 2011 | 2012 | 2011 | ||||||||||||||||
| Net income (loss) |
$ | 14,535 | $ | 19,073 | $ | (14,842 | ) | $ | 29,782 | $ | (82,232 | ) | ||||||||
| Cumulative convertible preferred stock dividend (Series G) |
— | — | (997 | ) | — | (16,903 | ) | |||||||||||||
| Preferred stock discount accretion (Series G) |
— | — | (145 | ) | — | (5,634 | ) | |||||||||||||
| Favorable impact from issuing common stock in exchange for Series G preferred stock, net of issuance costs (1) |
— | — | 277,995 | — | 277,995 | |||||||||||||||
|
|
|
|
|
|
|
|
|
|
|
|||||||||||
| Net income attributable to common stockholders - basic |
$ | 14,535 | $ | 19,073 | $ | 262,011 | $ | 29,782 | $ | 173,226 | ||||||||||
| Convertible preferred stock dividends and accretion |
— | — | 1,142 | — | 22,537 | |||||||||||||||
|
|
|
|
|
|
|
|
|
|
|
|||||||||||
| Net income attributable to common stockholders - diluted |
$ | 14,535 | $ | 19,073 | $ | 263,153 | $ | 29,782 | $ | 195,763 | ||||||||||
|
|
|
|
|
|
|
|
|
|
|
|||||||||||
| Average common shares outstanding |
205,416 | 205,415 | 192,546 | 205,366 | 64,466 | |||||||||||||||
| Average potential common shares |
804 | 508 | 2,195 | 462 | 25,192 | |||||||||||||||
|
|
|
|
|
|
|
|
|
|
|
|||||||||||
| Average common shares outstanding - assuming dilution |
206,220 | 205,923 | 194,741 | 205,828 | 89,658 | |||||||||||||||
|
|
|
|
|
|
|
|
|
|
|
|||||||||||
| Basic earnings per common share |
$ | 0.07 | $ | 0.09 | $ | 1.36 | $ | 0.15 | $ | 2.69 | ||||||||||
|
|
|
|
|
|
|
|
|
|
|
|||||||||||
| Diluted earnings per common share |
$ | 0.07 | $ | 0.09 | $ | 1.35 | (2) | $ | 0.14 | $ | 2.18 | (2) | ||||||||
|
|
|
|
|
|
|
|
|
|
|
|||||||||||
| (1) | Excess of carrying amount of the Series G Preferred Stock exchanged over the fair value of new common shares issued in the fourth quarter of 2011. |
| (2) | For the quarter and year ended December 31, 2011, the diluted (loss) per share, excluding the one-time favorable impact of $ 278.0 million from issuing common stock in exchange for the Series G Preferred Stock, held by the U.S. Treasury, was $(0.08) and $(1.63), respectively. |
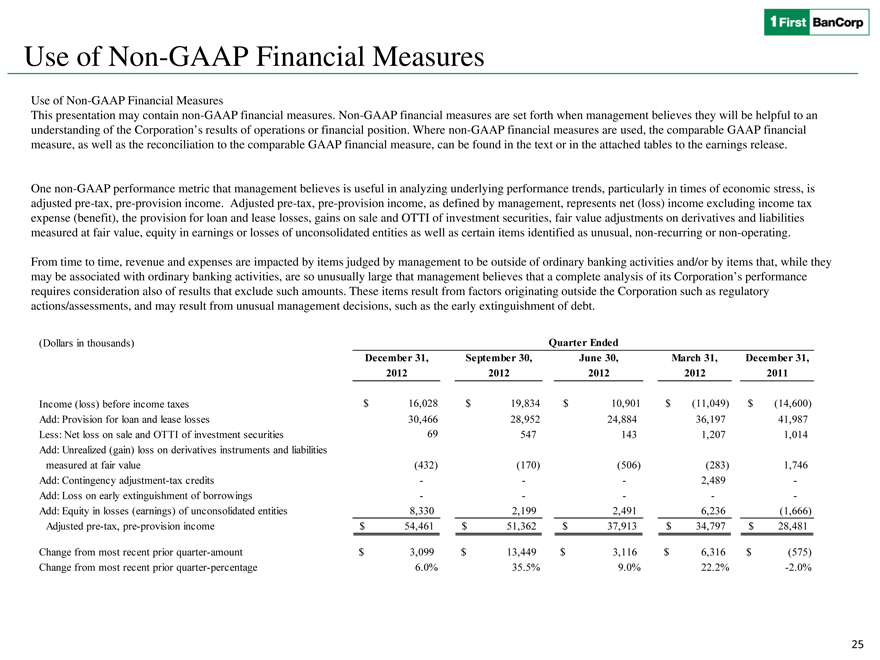
Adjusted Pre-Tax, Pre-Provision Income Trends
One metric that management believes is useful in analyzing performance is the level of earnings adjusted to exclude tax expense, the provision for loan and lease losses, securities gains or losses, fair value adjustments on derivatives and liabilities measured at fair value and equity in earnings or losses of unconsolidated entities, a non-GAAP financial measure. In addition, from time to time, earnings are adjusted also for items judged by management to be outside of ordinary banking activities and/or for items that, while they may be associated with ordinary banking activities, are so unusually large that management believes that a complete analysis of the Corporation’s performance requires consideration also of results that exclude such amounts (for additional information about these non-GAAP financial measures, see “Adjusted Pre-Tax, Pre-Provision Income” in “Basis of Presentation”).
The following table shows adjusted pre-tax, pre-provision income of $54.5 million in the fourth quarter of 2012, up from $51.4 million in the prior quarter:
| (Dollars in thousands) | Quarter Ended | |||||||||||||||||||
| December 31, | September 30, | June 30, | March 31, | December 31, | ||||||||||||||||
| 2012 | 2012 | 2012 | 2012 | 2011 | ||||||||||||||||
| Income (loss) before income taxes |
$ | 16,028 | $ | 19,834 | $ | 10,901 | $ | (11,049 | ) | $ | (14,600 | ) | ||||||||
| Add: Provision for loan and lease losses |
30,466 | 28,952 | 24,884 | 36,197 | 41,987 | |||||||||||||||
| Less: Net loss on sale and OTTI of investment securities |
69 | 547 | 143 | 1,207 | 1,014 | |||||||||||||||
| Add: Unrealized (gain) loss on derivatives instruments and liabilities measured at fair value |
(432 | ) | (170 | ) | (506 | ) | (283 | ) | 1,746 | |||||||||||
| Add: Contingency adjustment-tax credits |
— | — | — | 2,489 | — | |||||||||||||||
| Add: Loss on early extinguishment of borrowings |
— | — | — | — | — | |||||||||||||||
| Add: Equity in losses (earnings) of unconsolidated entities |
8,330 | 2,199 | 2,491 | 6,236 | (1,666 | ) | ||||||||||||||
|
|
|
|
|
|
|
|
|
|
|
|||||||||||
| Adjusted pre-tax, pre-provision income (1) |
$ | 54,461 | $ | 51,362 | $ | 37,913 | $ | 34,797 | $ | 28,481 | ||||||||||
|
|
|
|
|
|
|
|
|
|
|
|||||||||||
| Change from most recent prior quarter-amount |
$ | 3,099 | $ | 13,449 | $ | 3,116 | $ | 6,316 | $ | (575 | ) | |||||||||
| Change from most recent prior quarter-percentage |
6.0 | % | 35.5 | % | 9.0 | % | 22.2 | % | -2.0 | % | ||||||||||
| (1) | See “Basis of Presentation” for definition. |
First BanCorp. Announces Earnings for the Quarter and Year Ended December 31, 2012 – Page 4 of 30
As discussed in the sections that follow, the increase in adjusted pre-tax, pre-provision income from the 2012 third quarter primarily reflected an increase of $2.0 million in revenues from the mortgage banking business, driven by a higher gain on sales and securitizations of residential mortgage loans, and a $0.9 million decrease in non-interest expenses led by lower losses on REO operations and a decrease in professional services fees.
Net Interest Income
Net interest income, excluding fair value adjustments on derivatives and financial liabilities measured at fair value (“valuations”), and net interest income on a tax-equivalent basis are non-GAAP measures. (See “Basis of Presentation – Net Interest Income, Excluding Valuations and on a Tax-Equivalent Basis” below for additional information.) The following table reconciles net interest income in accordance with GAAP to net interest income, excluding valuations, and net interest income on a tax-equivalent basis. The table also reconciles net interest spread and net interest margin on a GAAP basis to these items excluding valuations and on a tax-equivalent basis.
| (Dollars in Thousands) | Quarter Ended | |||||||||||||||||||
| December 31, 2012 | September 30, 2012 | June 30, 2012 | March 31, 2012 | December 31, 2011 | ||||||||||||||||
| Net Interest Income |
||||||||||||||||||||
| Interest Income—GAAP |
$ | 165,054 | $ | 166,964 | $ | 153,652 | $ | 152,107 | $ | 156,752 | ||||||||||
| Unrealized (gain) loss on derivative instruments |
(432 | ) | (170 | ) | 33 | (332 | ) | (246 | ) | |||||||||||
|
|
|
|
|
|
|
|
|
|
|
|||||||||||
| Interest income excluding valuations |
164,622 | 166,794 | 153,685 | 151,775 | 156,506 | |||||||||||||||
| Tax-equivalent adjustment |
1,451 | 1,463 | 1,634 | 1,741 | 1,456 | |||||||||||||||
|
|
|
|
|
|
|
|
|
|
|
|||||||||||
| Interest income on a tax-equivalent basis excluding valuations |
166,073 | 168,257 | 155,319 | 153,516 | 157,962 | |||||||||||||||
| Interest Expense—GAAP |
39,423 | 41,461 | 44,947 | 50,241 | 58,209 | |||||||||||||||
| Unrealized gain (loss) on derivative instruments and liabilities measured at fair value |
— | — | 539 | (49 | ) | (1,992 | ) | |||||||||||||
|
|
|
|
|
|
|
|
|
|
|
|||||||||||
| Interest expense excluding valuations |
39,423 | 41,461 | 45,486 | 50,192 | 56,217 | |||||||||||||||
|
|
|
|
|
|
|
|
|
|
|
|||||||||||
| Net interest income—GAAP |
$ | 125,631 | $ | 125,503 | $ | 108,705 | $ | 101,866 | $ | 98,543 | ||||||||||
|
|
|
|
|
|
|
|
|
|
|
|||||||||||
| Net interest income excluding valuations |
$ | 125,199 | $ | 125,333 | $ | 108,199 | $ | 101,583 | $ | 100,289 | ||||||||||
|
|
|
|
|
|
|
|
|
|
|
|||||||||||
| Net interest income on a tax-equivalent basis excluding valuations |
$ | 126,650 | $ | 126,796 | $ | 109,833 | $ | 103,324 | $ | 101,745 | ||||||||||
|
|
|
|
|
|
|
|
|
|
|
|||||||||||
| Average Balances |
||||||||||||||||||||
| Loans and leases |
$ | 10,199,808 | $ | 10,297,835 | $ | 10,183,229 | $ | 10,389,246 | $ | 10,637,523 | ||||||||||
| Total securities and other short-term investments |
2,576,421 | 2,238,701 | 2,450,198 | 2,397,918 | 2,665,918 | |||||||||||||||
|
|
|
|
|
|
|
|
|
|
|
|||||||||||
| Average Interest-Earning Assets |
$ | 12,776,229 | $ | 12,536,536 | $ | 12,633,427 | $ | 12,787,164 | $ | 13,303,441 | ||||||||||
|
|
|
|
|
|
|
|
|
|
|
|||||||||||
| Average Interest-Bearing Liabilities |
$ | 10,700,868 | $ | 10,518,169 | $ | 10,577,054 | $ | 10,725,162 | $ | 11,255,725 | ||||||||||
|
|
|
|
|
|
|
|
|
|
|
|||||||||||
| Average Yield/Rate |
||||||||||||||||||||
| Average yield on interest-earning assets—GAAP |
5.14 | % | 5.30 | % | 4.89 | % | 4.78 | % | 4.67 | % | ||||||||||
| Average rate on interest-bearing liabilities—GAAP |
1.47 | % | 1.57 | % | 1.71 | % | 1.88 | % | 2.05 | % | ||||||||||
|
|
|
|
|
|
|
|
|
|
|
|||||||||||
| Net interest spread—GAAP |
3.67 | % | 3.73 | % | 3.18 | % | 2.90 | % | 2.62 | % | ||||||||||
|
|
|
|
|
|
|
|
|
|
|
|||||||||||
| Net interest margin—GAAP |
3.91 | % | 3.98 | % | 3.46 | % | 3.20 | % | 2.94 | % | ||||||||||
|
|
|
|
|
|
|
|
|
|
|
|||||||||||
| Average yield on interest-earning assets excluding valuations |
5.13 | % | 5.29 | % | 4.89 | % | 4.77 | % | 4.67 | % | ||||||||||
| Average rate on interest-bearing liabilities excluding valuations |
1.47 | % | 1.57 | % | 1.73 | % | 1.88 | % | 1.98 | % | ||||||||||
|
|
|
|
|
|
|
|
|
|
|
|||||||||||
| Net interest spread excluding valuations |
3.66 | % | 3.72 | % | 3.16 | % | 2.89 | % | 2.69 | % | ||||||||||
|
|
|
|
|
|
|
|
|
|
|
|||||||||||
| Net interest margin excluding valuations |
3.90 | % | 3.98 | % | 3.44 | % | 3.20 | % | 2.99 | % | ||||||||||
|
|
|
|
|
|
|
|
|
|
|
|||||||||||
| Average yield on interest-earning assets on a tax-equivalent basis and excluding valuations |
5.17 | % | 5.34 | % | 4.94 | % | 4.83 | % | 4.71 | % | ||||||||||
| Average rate on interest-bearing liabilities excluding valuations |
1.47 | % | 1.57 | % | 1.73 | % | 1.88 | % | 1.98 | % | ||||||||||
|
|
|
|
|
|
|
|
|
|
|
|||||||||||
| Net interest spread on a tax-equivalent basis and excluding valuations |
3.70 | % | 3.77 | % | 3.21 | % | 2.95 | % | 2.73 | % | ||||||||||
|
|
|
|
|
|
|
|
|
|
|
|||||||||||
| Net interest margin on a tax-equivalent basis and excluding valuations |
3.94 | % | 4.02 | % | 3.50 | % | 3.25 | % | 3.03 | % | ||||||||||
|
|
|
|
|
|
|
|
|
|
|
|||||||||||
Net interest income, excluding valuations, remained relatively flat reflecting a decrease of $0.1 million when compared to the third quarter of 2012. The slight decrease was primarily related to a $116.2 million decrease in average commercial loans and an 8 basis point decrease in the net interest margin, mainly driven by higher cash balances maintained at the Federal Reserve, partially offset by a reduction in total funding costs. The decrease in the average balance of commercial loans continued to be driven by principal repayments. The average cash balances maintained at the Federal Reserve, at a rate of 0.25%, were higher by approximately $280.5 million compared to the third quarter due to heightened regulatory liquidity expectations for the industry and limited available investment alternatives.
First BanCorp. Announces Earnings for the Quarter and Year Ended December 31, 2012 – Page 5 of 30
Low market interest rates and diligence in managing deposit pricing resulted in the fourth quarter cost of interest-bearing deposits declining 10 basis points in comparison to the previous quarter, driving the reduction in total funding costs. The average cost of brokered CDs decreased by 21 basis points. During the fourth quarter of 2012, the Corporation repaid approximately $710.6 million of maturing brokered CDs with an all-in cost of 1.99% and new issuances amounted to $678.2 million with an all-in cost of 1.03%. Meanwhile, the average rate paid on non-brokered deposits, including interest-bearing checking accounts, savings and retail CDs, declined by 2 basis points to 1.01% during the fourth quarter of 2012. The Corporation’s strategic focus remains to grow non-brokered deposits and improve the overall funding mix. Average non-brokered deposits increased by $24.9 million compared to the third quarter of 2012.
Provision for Loan and Lease Losses
The provision for loan and lease losses for the fourth quarter of 2012 was $30.5 million, up $1.5 million from the third quarter 2012 provision, primarily reflecting increases in the provision for commercial mortgage loans in the United States portfolio driven by higher charges to the specific reserve of impaired collateral dependent loans and losses on non-performing loans sold. Partially offsetting this increase was a loan loss reserve release for construction loans. Historical loss rates, adjusted for current risk factors, continued to improve as lower recent charge-off activity has replaced higher levels rolled out of the 24-months look back period used when evaluating the general reserve determination. Lower charges to the specific reserve of certain impaired construction loans in the Virgin Islands also contributed to the variance in the provision. The provision for loan and lease losses in the fourth quarter of 2012 was $10.1 million lower than net charge-offs, reflecting a slow but steady improvement in credit quality (see “Credit Quality” section below for a full discussion).
Non-Interest Income
| Quarter Ended | ||||||||||||||||||||
| (In thousands) | December 31, 2012 |
September 30, 2012 |
June 30, 2012 |
March 31, 2012 |
December 31, 2011 |
|||||||||||||||
| Other service charges |
$ | 1,492 | $ | 1,098 | $ | 1,226 | $ | 1,519 | $ | 2,116 | ||||||||||
| Service charges on deposit accounts |
3,228 | 3,267 | 3,240 | 3,247 | 2,988 | |||||||||||||||
| Mortgage banking activities |
6,700 | 4,728 | 4,057 | 4,475 | 3,717 | |||||||||||||||
| (Loss) gain on sale of investments, net of impairments |
(69 | ) | (547 | ) | (143 | ) | (1,207 | ) | (1,014 | ) | ||||||||||
| Broker-dealer income |
— | 20 | 1,347 | 1,263 | 381 | |||||||||||||||
| Other operating income |
8,747 | 8,759 | 6,786 | 5,414 | 4,816 | |||||||||||||||
| Loss on early extinguishment of borrowings |
— | — | — | — | — | |||||||||||||||
| Equity in (losses) earnings of unconsolidated entities |
(8,330 | ) | (2,199 | ) | (2,491 | ) | (6,236 | ) | 1,666 | |||||||||||
|
|
|
|
|
|
|
|
|
|
|
|||||||||||
| Non-interest income |
$ | 11,768 | $ | 15,126 | $ | 14,022 | $ | 8,475 | $ | 14,670 | ||||||||||
|
|
|
|
|
|
|
|
|
|
|
|||||||||||
Non-interest income decreased $3.4 million from the 2012 third quarter primarily due to:
| • | Equity in losses of unconsolidated entities of approximately $8.3 million recorded in the fourth quarter, a negative variance of $6.1 million, compared to $2.2 million for the third quarter of 2012. This adjustment is related to the Bank’s investment in CPG/GS PR NPL, LLC (“CPG/GS”), the entity that purchased $269.2 million of loans from FirstBank in 2011. The Bank holds a 35% subordinated ownership interest in CPG/GS. This investment is accounted under the equity method and following the hypothetical liquidation book value (“HLBV”) method to determine the Bank’s share in CPG/GS earnings or losses. Under the HLBV method the Bank determines its share in CPG/GS earnings or losses by determining the difference between its claim on CPG/GS book value at the end of the period as compared to the beginning of the period assuming the liquidation of the entity at the end of each reporting period. The negative variance results from changes in the fair value of loans receivable held by CPG/GS where fair value is determined on a discounted cash flows basis. At valuation dates, key |
First BanCorp. Announces Earnings for the Quarter and Year Ended December 31, 2012 – Page 6 of 30
| inputs and assumptions are updated to reflect changes in the market, the performance of the underlying assets, and expectations of a market participant. |
Partially offset by:
| • | A $2.0 million increase in revenues from the mortgage banking business, including a $1.5 million increase in gain on sales and securitizations of residential mortgage loans. The Corporation sold and securitized approximately $141.4 million of residential mortgage loans in the fourth quarter of 2012, realizing gains of $6.0 million (including the recognition of servicing assets), compared to sales and securitizations of $112.7 million and gains of $4.5 million recorded in the third quarter. |
| • | A decrease of $0.5 million in other-than-temporary impairment charges (OTTI) on private label MBS compared to the OTTI recorded in the third quarter. |
| • | A $0.4 million increase in credit card merchant fees driven by higher processing volumes, included as part of “Other service charges” in the table above. |
Non-Interest Expenses
| Quarter Ended | ||||||||||||||||||||
| (In thousands) | December 31, 2012 |
September 30, 2012 |
June 30, 2012 |
March 31, 2012 |
December 31, 2011 |
|||||||||||||||
| Employees’ compensation and benefits |
$ | 31,840 | $ | 31,058 | $ | 31,101 | $ | 31,611 | $ | 29,254 | ||||||||||
| Occupancy and equipment |
14,972 | 15,208 | 15,181 | 15,676 | 15,603 | |||||||||||||||
| Deposit insurance premium |
11,897 | 11,657 | 11,982 | 11,987 | 12,411 | |||||||||||||||
| Other insurance and supervisory fees |
1,366 | 1,366 | 1,320 | 1,021 | 890 | |||||||||||||||
| Taxes, other than income taxes |
3,013 | 3,499 | 3,435 | 3,416 | 3,442 | |||||||||||||||
| Professional fees |
5,557 | 6,295 | 5,322 | 5,179 | 4,692 | |||||||||||||||
| Business promotion |
4,067 | 4,004 | 3,475 | 2,547 | 3,482 | |||||||||||||||
| Net loss on REO operations |
6,201 | 8,686 | 6,786 | 3,443 | 8,602 | |||||||||||||||
| Other |
11,992 | 10,070 | 8,340 | 10,313 | 7,450 | |||||||||||||||
|
|
|
|
|
|
|
|
|
|
|
|||||||||||
| Total |
$ | 90,905 | $ | 91,843 | $ | 86,942 | $ | 85,193 | $ | 85,826 | ||||||||||
|
|
|
|
|
|
|
|
|
|
|
|||||||||||
Non-interest expenses decreased $0.9 million to $90.9 million in the fourth quarter of 2012, compared to the third quarter of 2012, substantially related to:
| • | A $2.5 million decrease in losses from REO activities primarily reflecting lower losses at the time of sale of both commercial and residential REO properties and decreased property tax expenses. |
| • | A $0.7 million decrease in professional fees mainly related to legal fees. |
| • | A $0.5 million decrease in municipal taxes. |
| • | A $0.8 million decrease in the provision for uncollectible accounts receivable and sundry losses. |
Partially offset by:
| • | Charges of $0.8 million related to a contingent payment agreement associated with the credit card portfolio acquired from FIA Card Services, included as part of “Other” in the table above. For the term of the Interim Service Agreement with FIA Card Services, the Corporation is charged when actual credit losses are lower than estimated monthly loan losses at the time of acquisition of the credit card portfolio based on pre-agreed thresholds. The amounts of the contingent payments are capped under the terms of the agreement. |
| • | A $0.7 million increase in servicing and data processing fees, included as part of “Other” in the table above. |
First BanCorp. Announces Earnings for the Quarter and Year Ended December 31, 2012 – Page 7 of 30
| • | A $0.5 million negative variance in the provision for off-balance sheet exposures (mainly for unfunded loan commitments), included as part of “Other” in the table above, as this quarter reflects a reserve release of $0.8 million compared to a release of $1.3 million in the third quarter of 2012. |
| • | A $0.8 million increase in employees’ compensation and benefits expenses reflecting higher recruiting expenses and severance payments incurred in the fourth quarter. |
Income Taxes
The income tax expense for the fourth quarter of 2012 amounted to $1.5 million compared to an income tax expense of $0.8 million for the third quarter of 2012, a variance driven by higher taxable income of profitable subsidiaries, including a recovery of $1.8 million related to previously fully charged-off consumer loans sold during the quarter. As of December 31, 2012, the deferred tax asset, net of a valuation allowance of $359.4 million, amounted to $4.9 million compared to $4.6 million as of September 30, 2012. Under the Puerto Rico Internal Revenue Code, the Corporation and its subsidiaries are treated as separate taxable entities and are not entitled to file consolidated tax returns; thus, losses of one entity cannot offset income of another entity.
CREDIT QUALITY
| Non-Performing Assets (Dollars in thousands) |
December 31, 2012 |
September 30, 2012 |
June 30, 2012 |
March 31, 2012 |
December 31, 2011 |
|||||||||||||||
| Non-performing loans held for investment: |
||||||||||||||||||||
| Residential mortgage |
$ | 13,626 | $ | 320,913 | $ | 333,043 | $ | 41,188 | $ | 38,208 | ||||||||||
| Commercial mortgage |
205,440 | 231,163 | 239,881 | 244,391 | 240,414 | |||||||||||||||
| Commercial and Industrial |
239,430 | 230,459 | 255,253 | 263,604 | 270,171 | |||||||||||||||
| Construction |
178,190 | 189,458 | 202,133 | 231,071 | 250,022 | |||||||||||||||
| Consumer and Finance leases |
38,875 | 36,051 | 35,378 | 39,159 | 39,547 | |||||||||||||||
|
|
|
|
|
|
|
|
|
|
|
|||||||||||
| Total non-performing loans held for investment |
975,561 | 1,008,044 | 1,065,688 | 1,119,413 | 1,138,362 | |||||||||||||||
|
|
|
|
|
|
|
|
|
|
|
|||||||||||
| REO |
185,764 | 177,001 | 167,341 | 135,905 | 114,292 | |||||||||||||||
| Other repossessed property |
10,107 | 9,775 | 10,601 | 12,494 | 15,392 | |||||||||||||||
| Other assets (1) |
64,543 | 64,543 | 64,543 | 64,543 | 64,543 | |||||||||||||||
|
|
|
|
|
|
|
|
|
|
|
|||||||||||
| Total non-performing assets, excluding loans held for sale |
$ | 1,235,975 | $ | 1,259,363 | $ | 1,308,173 | $ | 1,332,355 | $ | 1,332,589 | ||||||||||
| Non-performing loans held for sale |
2,243 | — | — | — | 4,764 | |||||||||||||||
|
|
|
|
|
|
|
|
|
|
|
|||||||||||
| Total non-performing assets, including loans held for sale (2) |
$ | 1,238,218 | $ | 1,259,363 | $ | 1,308,173 | $ | 1,332,355 | $ | 1,337,353 | ||||||||||
|
|
|
|
|
|
|
|
|
|
|
|||||||||||
| Past-due loans 90 days and still accruing |
$ | 142,012 | $ | 141,028 | $ | 120,585 | $ | 133,191 | $ | 130,816 | ||||||||||
| Non-performing loans held for investment to total loans held for investment |
9.70 | % | 9.89 | % | 10.35 | % | 10.87 | % | 10.78 | % | ||||||||||
| Non-performing assets, excluding non-performing loans held for sale, to total assets, excluding non-performing loans held for sale |
9.44 | % | 9.58 | % | 10.13 | % | 10.18 | % | 10.15 | % | ||||||||||
| Non-performing assets to total assets |
9.45 | % | 9.58 | % | 10.13 | % | 10.18 | % | 10.19 | % | ||||||||||
| (1) | Collateral pledged with Lehman Brothers Special Financing, Inc. |
| (2) | Amount excludes purchased credit impaired loans with a carrying value as of December 31, 2012 of approximately $10.6 million acquired as part of the credit card portfolio acquired from FIA. |
Credit quality continued to improve at a slow but steady pace in the fourth quarter of 2012. Total non-performing loans, including non-performing loans held for sale, decreased by $30.2 million led by foreclosures, charge-offs, principal repayments, modified loans with a sustained performance period, and, to a lesser extent, loan sales in the United States. These factors offset an increase of $21.0 million of non-performing loans inflows, driven by several C&I relationships in excess of $1 million. Total non-performing assets, which include repossessed assets, decreased by $21.1 million, or 2%. Total delinquencies, which include all loans 30 days or more past due and non-accrual loans, decreased by $66.2 million and the level of adversely classified commercial and construction loans held for investment decreased by $24.0 million, or 2% compared to the prior quarter. The initial fair value of purchased credit-impaired (PCI) loans includes an estimate of credit losses expected to be realized over the remaining lives of the loans, and, therefore, PCI loans with a carrying value as of December 31, 2012 of approximately $10.6 million purchased as part of the credit card portfolio acquired from FIA are excluded from delinquency and non-performing loan statistics. The net charge-off activity remained relatively flat at $40.6 million. Given the prolonged recession and uncertainties in the economic environment in Puerto Rico, the Corporation continued to face pressures related to its non-performing and charge-offs levels. The Corporation continues with its emphasis on loan workouts and the evaluation of opportunities for dispositions. During the fourth quarter of 2012, approximately $2.2 million (net of
First BanCorp. Announces Earnings for the Quarter and Year Ended December 31, 2012 – Page 8 of 30
charge-offs of $2.3 million) of non-performing commercial mortgage and C&I loans were transferred to held for sale and $4.8 million (net of charge-offs of $1.8 million) of non-performing commercial mortgage loans were sold in the United States.
Non-Performing Loans and Non-Performing Assets
Total non-performing loans, including non-performing loans held for sale, were $977.8 million at December 31, 2012. This represents a decrease of $30.2 million, or 3%, from $1.01 billion at September 30, 2012.
Non-performing commercial mortgage loans, including non-performing commercial mortgage loans held for sale, decreased by $24.7 million, or 11%, from the end of the third quarter of 2012. A combination of factors contributed to the decrease, including: (i) foreclosures of $9.0 million, (ii) restoration to accrual status after a sustained performance period of $7.9 million of modified loans, (iii) charge-offs of $5.0 million, (iv) the sale of $4.8 million of loans in the United States, and (v) principal repayments of $3.9 million. Non-performing commercial mortgage loans decreased by $10.7 million in Puerto Rico, led by modified loans restored to accrual status, foreclosures and principal repayments, while non-performing commercial mortgage loans in the United States decreased by $13.4 million driven by foreclosures and sales. The decrease of $0.5 million in the Virgin Islands was driven by a $2.9 million modified loan restored to accrual status after a sustained period of performance, partially offset by the inflow of a $2.3 million loan. Total inflows of non-performing commercial mortgage loans of $5.9 million during the fourth quarter of 2012 decreased by $8.5 million compared to inflows of $14.4 million in the third quarter.
Non-performing construction loans decreased by $11.3 million, or 6%, from the end of the third quarter of 2012 primarily reflecting principal repayments of $7.7 million, foreclosures of $2.5 million and net charge-offs of $1.8 million. The decrease in non-performing construction loans was primarily in Puerto Rico with a reduction of $11.0 million. The inflows of non-performing construction loans of $0.7 million during the fourth quarter of 2012 decreased by $0.6 million compared to inflows of $1.3 million in the third quarter.
Non-performing residential mortgage loans decreased by $7.3 million, or 2%, from September 30, 2012. The decrease includes approximately $19.6 million of loans with cured delinquencies and also reflects reductions due to foreclosures of $15.4 million and the restoration to accrual status of approximately $7.0 million of modified loans that successfully completed a trial performance period. Borrowers’ payments and charge-offs also contributed to the decrease. Non-performing residential mortgage loans decreased by $4.9 million, $1.9 million, and $0.5 million in Puerto Rico, the United States, and Virgin Islands, respectively, compared to the third quarter. The level of inflows of non-performing residential mortgage loans increased from $44.1 million for the third quarter of 2012 to $51.0 million in the fourth quarter. Approximately $170.6 million, or 54% of total non-performing residential mortgage loans, have been written down to their net realizable value.
Non-performing C&I loans, including non-performing C&I loans held for sale, increased by $10.1 million, or 4%, on a sequential quarter basis driven by inflows of $34.5 million mainly concentrated on six relationships in Puerto Rico in individual amounts that exceed $1 million and aggregate $31.4 million. Total inflows of non-performing C&I loans increased by $19.2 million from $15.3 million for the third quarter of 2012 to $34.5 million in the fourth quarter of 2012. Partially offsetting the inflows were charge-offs of $10.7 million, foreclosures of $4.9 million, and $4.1 million of modified loans restored to accrual status after a sustained period of performance.
The levels of non-performing consumer loans, including finance leases, showed a $2.8 million increase during the fourth quarter of 2012 mainly related to auto loans. The inflows of non-performing consumer loans increased from $15.4 million for the third quarter of 2012 to $19.5 million for the fourth quarter of 2012.
As of December 31, 2012, approximately $248.8 million, or 26%, of total non-performing loans held for investment have been charged-off to their net realizable value. (See “Allowance for Loan and Lease Losses” discussion below for additional information.)
First BanCorp. Announces Earnings for the Quarter and Year Ended December 31, 2012 – Page 9 of 30
The REO portfolio, which is part of non-performing assets, increased by $8.8 million to $185.8 million, mainly reflecting increases in foreclosures of residential in Puerto Rico and commercial properties in the United States. We expect to see continued movement of credits in and out of REO as we continue to execute our loan resolution strategies.
The following table shows the activity during the fourth quarter of 2012 of the REO portfolio by geographic region and type of property:
| (In thousands) | As of December 31, 2012 | |||||||||||||||||||||||||||||||||||||||
| Puerto Rico | Virgin Islands | United States | Consolidated | |||||||||||||||||||||||||||||||||||||
| Residential | Commercial | Construction | Residential | Commercial | Construction | Residential | Commercial | Construction | ||||||||||||||||||||||||||||||||
| Beginning Balance |
$ | 59,349 | $ | 55,748 | $ | 22,778 | $ | 4,700 | $ | 4,201 | $ | 17,741 | $ | 2,328 | $ | 6,415 | $ | 3,741 | $ | 177,001 | ||||||||||||||||||||
| Additions |
19,850 | 7,580 | 2,326 | 128 | — | — | 329 | 6,095 | — | 36,308 | ||||||||||||||||||||||||||||||
| Sales |
(9,369 | ) | (3,190 | ) | (1,317 | ) | (1,026 | ) | (1,183 | ) | — | (1,190 | ) | (724 | ) | (1,145 | ) | (19,144 | ) | |||||||||||||||||||||
| Fair value adjustments |
(3,472 | ) | (4,334 | ) | (266 | ) | — | — | (302 | ) | (27 | ) | — | — | (8,401 | ) | ||||||||||||||||||||||||
|
|
|
|
|
|
|
|
|
|
|
|
|
|
|
|
|
|
|
|
|
|||||||||||||||||||||
| Ending balance |
$ | 66,358 | $ | 55,804 | $ | 23,521 | $ | 3,802 | $ | 3,018 | $ | 17,439 | $ | 1,440 | $ | 11,786 | $ | 2,596 | $ | 185,764 | ||||||||||||||||||||
|
|
|
|
|
|
|
|
|
|
|
|
|
|
|
|
|
|
|
|
|
|||||||||||||||||||||
The over 90-days delinquent, but still accruing loans, excluding loans guaranteed by the U.S. Government, decreased during the fourth quarter of 2012 by $0.9 million to $48.7 million, or 0.48% of total loans held for investment, at December 31, 2012. Loans 30 to 89 days delinquent decreased by $36.9 million, to $246.1 million as of December 31, 2012.
Allowance for Loan and Lease Losses
The following table sets forth an analysis of the allowance for loan and lease losses during the periods indicated:
| (Dollars in thousands) | December 31, 2012 |
September 30, 2012 |
June 30, 2012 |
March 31, 2012 |
December 31, 2011 |
|||||||||||||||
| Allowance for loan and lease losses, beginning of period |
$ | 445,531 | $ | 457,153 | $ | 483,943 | $ | 493,917 | $ | 519,687 | ||||||||||
|
|
|
|
|
|
|
|
|
|
|
|||||||||||
| Provision (recovery) for loan and lease losses: |
||||||||||||||||||||
| Residential mortgage |
8,744 | 9,083 | 16,368 | 2,336 | 8,423 | |||||||||||||||
| Commercial mortgage |
4,119 | (6,617 | ) | 142 | 1,578 | 21,746 | ||||||||||||||
| Commercial and Industrial |
8,071 | 8,117 | 2,427 | 20,158 | 5,302 | |||||||||||||||
| Construction |
(2,474 | ) | 6,379 | (666 | ) | 7,716 | (1,096 | ) | ||||||||||||
| Consumer and finance leases |
12,006 | 11,990 | 6,613 | 4,409 | 7,612 | |||||||||||||||
|
|
|
|
|
|
|
|
|
|
|
|||||||||||
| Total provision for loan and lease losses |
30,466 | 28,952 | 24,884 | 36,197 | 41,987 | |||||||||||||||
|
|
|
|
|
|
|
|
|
|
|
|||||||||||
| Loans net charge-offs: |
||||||||||||||||||||
| Residential mortgage |
(9,555 | ) | (7,358 | ) | (14,211 | ) | (5,731 | ) | (9,077 | ) | ||||||||||
| Commercial mortgage |
(6,101 | ) | (5,002 | ) | (6,271 | ) | (3,594 | ) | (13,555 | ) | ||||||||||
| Commercial and Industrial |
(12,601 | ) | (12,261 | ) | (8,385 | ) | (12,669 | ) | (17,285 | ) | ||||||||||
| Construction |
(1,837 | ) | (8,326 | ) | (15,186 | ) | (15,392 | ) | (19,492 | ) | ||||||||||
| Consumer and finance leases |
(10,489 | ) | (7,627 | ) | (7,621 | ) | (8,785 | ) | (8,348 | ) | ||||||||||
|
|
|
|
|
|
|
|
|
|
|
|||||||||||
| Net charge-offs |
(40,583 | ) | (40,574 | ) | (51,674 | ) | (46,171 | ) | (67,757 | ) | ||||||||||
|
|
|
|
|
|
|
|
|
|
|
|||||||||||
| Allowance for loan and lease losses, end of period |
$ | 435,414 | $ | 445,531 | $ | 457,153 | $ | 483,943 | $ | 493,917 | ||||||||||
|
|
|
|
|
|
|
|
|
|
|
|||||||||||
| Allowance for loan and lease losses to period end total loans held for investment |
4.33 | % | 4.37 | % | 4.44 | % | 4.70 | % | 4.68 | % | ||||||||||
| Net charge-offs (annualized) to average loans outstanding during the period |
1.59 | % | 1.58 | % | 2.03 | % | 1.78 | % | 2.55 | % | ||||||||||
| Provision for loan and lease losses to net charge-offs during the period |
0.75 | x | 0.71 | x | 0.48 | x | 0.78 | x | 0.62 | x | ||||||||||
Provision for Loan and Lease Losses
The provision for loan and lease losses of $30.5 million in the fourth quarter of 2012 was $1.5 million higher than the provision recorded in the third quarter of 2012. The increase in the provision was principally related to the commercial mortgage loan portfolio in the United States. This was partially offset by a reserve release for construction loans. It is important to note that, despite the total decrease of $10.1 million in the allowance for loan losses, the reserve coverage for non-performing loans shows a slight increase. The allowance for loan losses to total non-performing loans ratio was 44.63% as of December 31, 2012 compared to 44.20% at the end of the prior quarter.
First BanCorp. Announces Earnings for the Quarter and Year Ended December 31, 2012 – Page 10 of 30
The Corporation recorded a provision for loan and lease losses of $3.2 million in the United States for the fourth quarter of 2012 compared to a reserve release of $6.9 million for the third quarter of 2012. The increase in the provision was mainly related to higher charges to the specific reserve of impaired collateral dependent commercial mortgage loans and losses related to non-performing loans sold.
In Puerto Rico, the Corporation recorded a provision for loan and lease losses of $23.9 million, a decrease of $2.5 million compared to the third quarter of 2012. The decrease was primarily related to a $1.4 million decrease in the provision for residential mortgage loans mainly related to improvements in delinquency trends, reserve releases for construction loans that were $1.3 million higher than the prior quarter reflecting improvements in the cumulative charge-off history used for the general reserve determination and a $0.7 million decrease in the provision for consumer loans mainly related to the credit cards portfolio. These reductions were partially offset by an increase of $1.0 million in the provision for commercial mortgage loans driven by charge-offs of loans transferred to held for sale. The provision for C&I loans was stable showing a decrease of $0.1 million.
With respect to the Virgin Islands portfolio, the Corporation recorded a provision for loan and lease losses of $3.5 million for the fourth quarter of 2012, compared to a provision of $9.5 million for the third quarter of 2012. Most of the decrease was associated with lower charges to the specific reserve for two construction commercial projects.
The following table sets forth information concerning the ratio of the allowance to non-performing loans held for investment as of December 31, 2012 and September 30, 2012 by loan category:
| (Dollars in thousands) | Residential Mortgage Loans |
Commercial Mortgage Loans |
C&I Loans | Construction Loans |
Consumer and Finance Leases |
Total | ||||||||||||||||||
| As of December 31, 2012 |
||||||||||||||||||||||||
| Non-performing loans held for investment charged-off to realizable value |
$ | 170,555 | $ | 7,194 | $ | 25,925 | $ | 43,943 | $ | 1,219 | $ | 248,836 | ||||||||||||
| Other non-performing loans held for investment |
143,071 | 198,246 | 213,505 | 134,247 | 37,656 | 726,725 | ||||||||||||||||||
|
|
|
|
|
|
|
|
|
|
|
|
|
|||||||||||||
| Total non-performing loans held for investment |
$ | 313,626 | $ | 205,440 | $ | 239,430 | $ | 178,190 | $ | 38,875 | $ | 975,561 | ||||||||||||
|
|
|
|
|
|
|
|
|
|
|
|
|
|||||||||||||
| Allowance to non-performing loans held for investment |
21.79 | % | 42.47 | % | 65.72 | % | 34.57 | % | 156.57 | % | 44.63 | % | ||||||||||||
| Allowance to non-performing loans held for investment, excluding non-performing loans charged-off to realizable value |
47.78 | % | 44.01 | % | 73.70 | % | 45.89 | % | 161.64 | % | 59.91 | % | ||||||||||||
| As of September 30, 2012 |
||||||||||||||||||||||||
| Non-performing loans held for investment charged-off to realizable value |
$ | 157,399 | $ | 8,722 | $ | 25,102 | $ | 24,330 | $ | 1,175 | $ | 216,728 | ||||||||||||
| Other non-performing loans held for investment |
163,514 | 222,441 | 205,357 | 165,128 | 34,876 | 791,316 | ||||||||||||||||||
|
|
|
|
|
|
|
|
|
|
|
|
|
|||||||||||||
| Total non-performing loans held for investment |
$ | 320,913 | $ | 231,163 | $ | 230,459 | $ | 189,458 | $ | 36,051 | $ | 1,008,044 | ||||||||||||
|
|
|
|
|
|
|
|
|
|
|
|
|
|||||||||||||
| Allowance to non-performing loans held for investment |
21.55 | % | 38.60 | % | 70.24 | % | 34.79 | % | 164.63 | % | 44.20 | % | ||||||||||||
| Allowance to non-performing loans held for investment, excluding non-performing loans charged-off to realizable value |
42.30 | % | 40.11 | % | 78.83 | % | 39.92 | % | 170.18 | % | 56.30 | % | ||||||||||||
First BanCorp. Announces Earnings for the Quarter and Year Ended December 31, 2012 – Page 11 of 30
The following table sets forth information concerning the composition of the Corporation’s allowance for loan and lease losses as of December 31, 2012 and September 30, 2012 by loan category and by whether the allowance and related provisions were calculated individually for impairment purposes or through a general valuation allowance.
| (Dollars in thousands) | Residential Mortgage Loans |
Commercial Mortgage Loans |
C&I Loans | Construction Loans |
Consumer and Finance Leases |
Total | ||||||||||||||||||
| As of December 31, 2012 |
||||||||||||||||||||||||
| Impaired loans without specific reserves: |
||||||||||||||||||||||||
| Principal balance of loans, net of charge-offs |
$ | 122,056 | $ | 44,495 | $ | 35,673 | $ | 21,179 | $ | 2,615 | $ | 226,018 | ||||||||||||
| Impaired loans with specific reserves: |
||||||||||||||||||||||||
| Principal balance of loans, net of charge-offs |
462,663 | 300,690 | 228,865 | 147,107 | 22,722 | 1,162,047 | ||||||||||||||||||
| Allowance for loan and lease losses |
47,171 | 49,304 | 58,283 | 32,276 | 3,880 | 190,914 | ||||||||||||||||||
| Allowance for loan and lease losses to principal balance |
10.20 | % | 16.40 | % | 25.47 | % | 21.94 | % | 17.08 | % | 16.43 | % | ||||||||||||
| PCI loans: |
||||||||||||||||||||||||
| Carrying value of PCI loans |
— | — | — | — | 10,611 | 10,611 | ||||||||||||||||||
| Allowance for PCI loans |
— | — | — | — | — | — | ||||||||||||||||||
| Allowance for PCI loans to carrying value |
— | — | — | — | — | — | ||||||||||||||||||
| Loans with general allowance: |
||||||||||||||||||||||||
| Principal balance of loans |
2,162,498 | 1,150,280 | 3,172,342 | 193,589 | 1,976,729 | 8,655,438 | ||||||||||||||||||
| Allowance for loan and lease losses |
21,183 | 37,941 | 99,064 | 29,324 | 56,988 | 244,500 | ||||||||||||||||||
| Allowance for loan and lease losses to principal balance |
0.98 | % | 3.30 | % | 3.12 | % | 15.15 | % | 2.88 | % | 2.82 | % | ||||||||||||
| Total loans held for investment: |
||||||||||||||||||||||||
| Principal balance of loans |
$ | 2,747,217 | $ | 1,495,465 | $ | 3,436,880 | $ | 361,875 | $ | 2,012,677 | $ | 10,054,114 | ||||||||||||
| Allowance for loan and lease losses |
68,354 | 87,245 | 157,347 | 61,600 | 60,868 | 435,414 | ||||||||||||||||||
| Allowance for loan and lease losses to principal balance |
2.49 | % | 5.83 | % | 4.58 | % | 17.02 | % | 3.02 | % | 4.33 | % | ||||||||||||
| As of September 30, 2012 |
||||||||||||||||||||||||
| Impaired loans without specific reserves: |
||||||||||||||||||||||||
| Principal balance of loans, net of charge-offs |
$ | 106,554 | $ | 50,043 | $ | 31,047 | $ | 38,863 | $ | 1,647 | $ | 228,154 | ||||||||||||
| Impaired loans with specific reserves: |
||||||||||||||||||||||||
| Principal balance of loans, net of charge-offs |
488,234 | 313,490 | 207,465 | 139,599 | 23,196 | 1,171,984 | ||||||||||||||||||
| Allowance for loan and lease losses |
49,640 | 51,351 | 57,001 | 33,349 | 2,813 | 194,154 | ||||||||||||||||||
| Allowance for loan and lease losses to principal balance |
10.17 | % | 16.38 | % | 27.47 | % | 23.89 | % | 12.13 | % | 16.57 | % | ||||||||||||
| PCI loans: |
||||||||||||||||||||||||
| Carrying value of PCI loans |
— | — | — | — | 12,741 | 12,741 | ||||||||||||||||||
| Allowance for PCI loans |
— | — | — | — | — | — | ||||||||||||||||||
| Allowance for PCI loans to carrying value |
— | — | — | — | — | — | ||||||||||||||||||
| Loans with general allowance: |
||||||||||||||||||||||||
| Principal balance of loans |
2,167,630 | 1,095,585 | 3,389,134 | 174,429 | 1,948,507 | 8,775,285 | ||||||||||||||||||
| Allowance for loan and lease losses |
19,525 | 37,876 | 104,876 | 32,562 | 56,538 | 251,377 | ||||||||||||||||||
| Allowance for loan and lease losses to principal balance |
0.90 | % | 3.46 | % | 3.09 | % | 18.67 | % | 2.90 | % | 2.86 | % | ||||||||||||
| Total loans held for investment: |
||||||||||||||||||||||||
| Principal balance of loans |
$ | 2,762,418 | $ | 1,459,118 | $ | 3,627,646 | $ | 352,891 | $ | 1,986,091 | $ | 10,188,164 | ||||||||||||
| Allowance for loan and lease losses |
69,165 | 89,227 | 161,877 | 65,911 | 59,351 | 445,531 | ||||||||||||||||||
| Allowance for loan and lease losses to principal balance |
2.50 | % | 6.12 | % | 4.46 | % | 18.68 | % | 2.99 | % | 4.37 | % | ||||||||||||
First BanCorp. Announces Earnings for the Quarter and Year Ended December 31, 2012 – Page 12 of 30
Net Charge-Offs
Total net charge-offs for the fourth quarter of 2012 were $40.6 million, or 1.59% of average loans on an annualized basis, compared to $40.6 million, or an annualized 1.58%, for the third quarter of 2012.
Construction loans net charge-offs in the fourth quarter of 2012 were $1.8 million, or an annualized 2.06% of related average loans, down from $8.3 million, or an annualized 9.11% of related loans, in the third quarter of 2012. Construction loans net charge-offs in the fourth quarter include a $1.2 million charge-off on one commercial project in Puerto Rico.
C&I loans net charge-offs in the fourth quarter of 2012 totaled $12.6 million, or an annualized 1.40% of related average loans, up from $12.3 million, or an annualized 1.33% of related loans, in the third quarter of 2012. Substantially all of the charge-offs recorded in the fourth quarter were in Puerto Rico and spread through several industries, including $5.5 million on three relationships with individual charge-offs in excess of $1 million. The charge-offs for the fourth quarter also included $1.2 million related to C&I loans transferred to held for sale.
Residential mortgage loans net charge-offs in the fourth quarter of 2012 were $9.6 million, or an annualized 1.36% of related average loans, up from $7.4 million, or an annualized 1.05%, in the third quarter. Approximately $5.7 million in charge-offs for the fourth quarter of 2012 resulted from valuations for impairment purposes of residential mortgage loans considered homogeneous given high delinquency and loan-to-value levels, compared to $4.2 million in the third quarter of 2012. Net charge-offs on residential mortgage loans also included $2.9 million related to foreclosures, compared to $2.5 million in the third quarter of 2012.
Commercial mortgage loans net charge-offs in the fourth quarter of 2012 were $6.1 million, or an annualized 1.70% of related average loans, up from $5.0 million, or an annualized 1.36% of related loans, in the third quarter of 2012. Commercial mortgage loans net charge-offs in the fourth quarter of $3.4 million were related to relationships in Puerto Rico, including $1.4 million related to loans transferred to held for sale, while commercial mortgage loans net charge-offs in the United States amounted to $2.7 million, including $1.8 million of non-performing loans sold. No individual charge-off in excess of $1 million was recorded in the fourth quarter.
Net charge-offs on consumer loans and finance leases in the fourth quarter of 2012 were $10.5 million, or an annualized 2.10% of related average loans, compared to $7.6 million, or an annualized 1.55% of average loans in the third quarter of 2012. The increase was mainly related to the credit card portfolio. Charge-offs for the non-PCI credit card portfolio amounted to $5.0 million for the fourth quarter of 2012 compared to $1.3 million in the third quarter of 2012. Credit cards are charged-off at 180 days delinquent.
First BanCorp. Announces Earnings for the Quarter and Year Ended December 31, 2012 – Page 13 of 30
The following table presents annualized net charge-offs to average loans held-in-portfolio:
| Quarter Ended | ||||||||||||||||||||
| December 31, 2012 |
September 30, 2012 |
June 30, 2012 |
March 31, 2012 |
December 31, 2011 |
||||||||||||||||
| Residential mortgage |
1.36 | % | 1.05 | % | 2.04 | % | 0.82 | % | 1.29 | % | ||||||||||
| Commercial mortgage |
1.70 | %(1) | 1.36 | % | 1.68 | % | 0.92 | % | 3.44 | % | ||||||||||
| Commercial and Industrial |
1.40 | %(2) | 1.33 | % | 0.88 | % | 1.25 | % | 1.64 | % | ||||||||||
| Construction |
2.06 | % | 9.11 | % | 15.21 | % | 14.23 | % | 16.43 | % | ||||||||||
| Consumer and finance leases |
2.10 | % | 1.55 | % | 1.81 | % | 2.26 | % | 2.13 | % | ||||||||||
| Total loans |
1.59 | %(3) | 1.58 | % | 2.03 | % | 1.78 | % | 2.55 | % | ||||||||||
| (1) | Includes net charge-offs totaling $1.4 million associated with loans transferred to held for sale in the fourth quarter of 2012. Commercial mortgage net charge-offs to average loans, excluding charge-offs associated with loans transferred to held for sale, was 1.31%. |
| (2) | Includes net charge-offs totaling $1.2 million associated with loans transferred to held for sale in the fourth quarter of 2012. Commercial and Industrial net charge-offs to average loans, excluding charge-offs associated with loans transferred to held for sale, was 1.26%. |
| (3) | Includes net charge-offs totaling $2.6 million associated with loans transferred to held for sale in the fourth quarter of 2012. Total net charge-offs to average loans, excluding charge-offs associated with loans transferred to held for sale, was 1.49%. |
The ratios above are based on annualized net charge-offs and are not necessarily indicative of the results expected in subsequent periods.
The following table presents annualized net charge-offs to average loans by geographic segment:
| Quarter Ended | ||||||||||||||||||||
| December 31, 2012 |
September 30, 2012 |
June 30, 2012 |
March 31, 2011 |
December 31, 2011 |
||||||||||||||||
| PUERTO RICO: |
||||||||||||||||||||
| Residential mortgage |
1.61 | % | 1.33 | % | 2.42 | % | 0.95 | % | 1.15 | % | ||||||||||
| Commercial mortgage |
1.32 | % | 2.08 | % | 1.18 | % | 0.98 | % | 4.25 | % | ||||||||||
| Commercial and Industrial |
1.50 | % | 1.43 | % | 0.98 | % | 1.33 | % | 1.72 | % | ||||||||||
| Construction |
2.44 | % | 2.28 | % | 3.63 | % | 15.78 | % | 19.45 | % | ||||||||||
| Consumer and finance leases |
2.13 | % | 1.56 | % | 1.73 | % | 2.28 | % | 2.22 | % | ||||||||||
| Total loans |
1.67 | % | 1.53 | % | 1.58 | % | 1.80 | % | 2.57 | % | ||||||||||
| VIRGIN ISLANDS: |
||||||||||||||||||||
| Residential mortgage |
0.46 | % | -0.02 | %(3) | 0.08 | % | 0.08 | % | 0.27 | % | ||||||||||
| Commercial mortgage |
0.00 | % | 0.00 | % | 0.00 | % | 0.00 | % | 0.00 | % | ||||||||||
| Commercial and Industrial |
0.00 | % | 0.00 | % | 0.00 | % | 0.03 | % | 0.00 | % | ||||||||||
| Construction |
1.71 | % | 26.04 | % | 42.57 | % | 19.29 | % | 12.92 | % | ||||||||||
| Consumer and finance leases |
1.10 | % | 1.16 | % | 1.07 | % | 0.90 | % | 0.14 | % | ||||||||||
| Total loans |
0.51 | % | 3.48 | % | 6.23 | % | 3.22 | % | 2.24 | % | ||||||||||
| UNITED STATES: |
||||||||||||||||||||
| Residential mortgage |
0.69 | % | 0.30 | % | 1.91 | % | 0.90 | % | 3.76 | % | ||||||||||
| Commercial mortgage |
3.08 | % | -0.40 | %(4) | 3.32 | % | 0.93 | % | 1.98 | % | ||||||||||
| Commercial and Industrial |
-0.01 | %(1) | -0.01 | %(1) | -3.38 | %(1) | 0.72 | % | 3.34 | % | ||||||||||
| Construction |
-0.33 | %(2) | -0.50 | %(2) | -0.76 | %(2) | -33.52 | %(2) | 0.92 | % | ||||||||||
| Consumer and finance leases |
2.33 | % | 1.64 | % | 6.92 | % | 3.59 | % | 1.20 | % | ||||||||||
| Total loans |
1.85 | % | -0.04 | %(5) | 2.45 | % | 0.00 | % | 2.61 | % | ||||||||||
| (1) | For the fourth, third, and second quarter of 2012, recoveries in commercial and industrial loans in Florida exceeded charge-offs. |
| (2) | For the fourth, third, second, and first quarter of 2012, recoveries in construction loans in Florida exceeded charge-offs. |
| (3) | For the third quarter of 2012, recoveries in residential mortgage loans in the Virgin Island exceeded charge-offs. |
| (4) | For the third quarter of 2012, recoveries in commercial mortgage loans in Florida exceeded charge-offs. |
| (5) | For the third quarter of 2012, recoveries in total loans in Florida exceeded charge-offs. |
First BanCorp. Announces Earnings for the Quarter and Year Ended December 31, 2012 – Page 14 of 30
Balance Sheet
Total assets were approximately $13.1 billion as of December 31, 2012, down $40.0 million from September 30, 2012. The decrease was primarily reflected in total loans, net of allowance, which declined $106.9 million, led by repayments of commercial loans, charge-offs and foreclosures, partially offset by increases in auto and consumer personal loans. Cash and cash equivalents decreased by $56.9 million and total investments increased by $132.3 million mainly due to purchases of approximately $214 million of FHLB Notes in light of increased liquidity.
The Corporation is experiencing continued loan demand and has continued with its targeted origination strategy. During the fourth quarter of 2012, total loan originations, including refinancings and draws from existing revolving and non-revolving commitments, amounted to approximately $816.4 million, up from $660.2 million in loan originations in the previous quarter, mainly reflecting increases in C&I, government, residential, and construction loan originations. C&I loan originations (excluding government loans) amounted to $303.3 million, an increase of $75.8 million compared to the prior quarter, mainly related to draws from revolving commitments and renewals. Government loan originations amounted to $49.4 million, an increase of $33.8 million compared to the previous quarter. Residential mortgage loan originations and purchases amounted to $213.7 million for the fourth quarter of 2012 compared to $187.0 million for the third quarter of 2012. Originations of auto loans (including finance leases) amounted to $149.9 million for the fourth quarter of 2012 compared to $151.2 million for the third quarter of 2012 and other personal loan originations amounted to $57.5 million, which was relatively flat compared to the prior quarter. The aforementioned figures exclude the utilization activity on outstanding credit cards of approximately $97.7 million for the fourth quarter of 2012 compared to $95.0 million in the third quarter.
As of December 31, 2012, liabilities totaled $11.6 billion, a decrease of approximately $40.9 million from September 30, 2012. The decrease in total liabilities is mainly attributable to a decline of $33.8 million in brokered CDs and repayments of $10.0 million of matured FHLB advances. Non-brokered deposits increased by $2.0 million, reflecting an increase of $151.5 million in core savings and, demand deposits, and retail CDs, partially offset by a decrease of $149.5 million in government fund deposits.
The Corporation’s total stockholders’ equity amounted to $1.49 billion as of December 31, 2012, an increase of $0.9 million from September 30, 2012, driven by the net income of $14.5 million partially offset by a decrease in other comprehensive income due to lower unrealized gains on available for sale securities.
The Corporation’s total capital, Tier 1 capital, and leverage ratios as of December 31, 2012 were 17.82%, 16.51%, and 12.60%, respectively, compared to total capital, Tier 1 capital and leverage ratios of 17.52%, 16.20%, and 12.71%, respectively, at the end of the prior quarter. Meanwhile, the total capital, Tier 1 capital, and leverage ratios as of December 31, 2012 of its banking subsidiary, FirstBank Puerto Rico, were 17.35%, 16.04%, and 12.25%, respectively, compared to total capital, Tier 1 capital, and leverage ratios of 17.03%, 15.71%, and 12.35%, respectively, at the end of the prior quarter. Earnings generation continues to strengthen the Corporation’s capital position and a reduction in risk-weighted assets reflects primarily the effect of repayments of commercial loans. All of the regulatory capital ratios for the Bank are well above the minimum required under the Consent Order entered into with the Federal Deposit Insurance Corporation (FDIC) and the Office of the Commissioner of Financial Institutions of the Commonwealth of Puerto Rico. Given the Consent Order, however, the Bank cannot be considered to be a well-capitalized institution.
Although uncertainty exists regarding final capital rules, based on our current interpretation of the proposed Basel III capital rules we anticipate to exceed the fully phased-in minimum capital ratios as established in the current proposal. The proposed Basel III capital rules and our interpretations used in estimating our Basel III calculations are subject to change depending on the final Basel III capital rules.
First BanCorp. Announces Earnings for the Quarter and Year Ended December 31, 2012 – Page 15 5 of 30
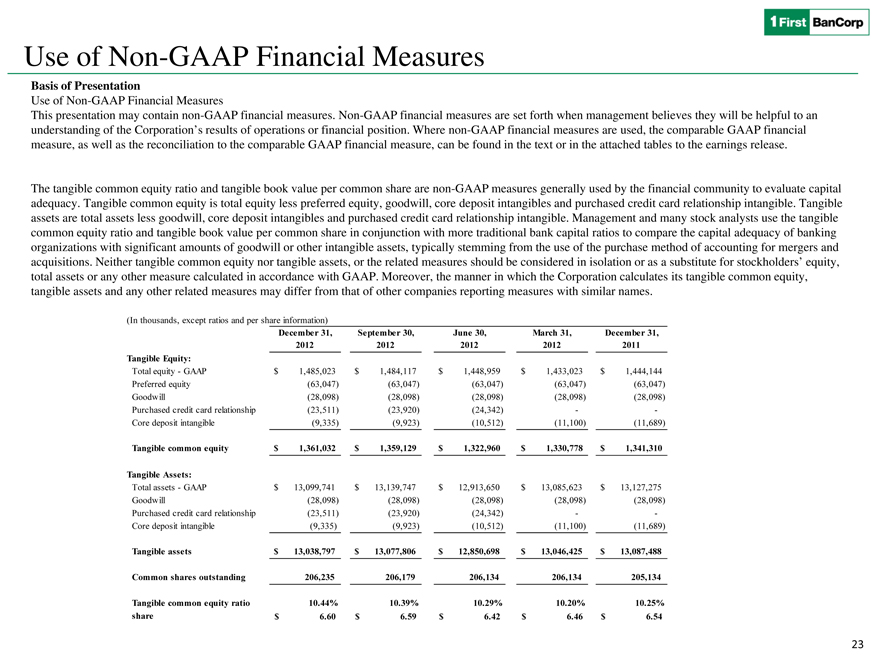
Tangible Common Equity
The Corporation’s tangible common equity ratio increased to 10.44% as of December 31, 2012 from 10.39% as of September 30, 2012 and the Tier 1 common equity to risk-weighted assets ratio increased to 13.61% as of December 31, 2012 from 13.33% as of September 30, 2012.
The following table is a reconciliation of the Corporation’s tangible common equity and tangible assets over the last five quarters to the comparable GAAP items:
| (In thousands, except ratios and per share information) | ||||||||||||||||||||
| December 31, 2012 |
September 30, 2012 |
June 30, 2012 |
March 31, 2012 |
December 31, 2011 |
||||||||||||||||
| Tangible Equity: |
||||||||||||||||||||
| Total equity - GAAP |
$ | 1,485,023 | $ | 1,484,117 | $ | 1,448,959 | $ | 1,433,023 | $ | 1,444,144 | ||||||||||
| Preferred equity |
(63,047 | ) | (63,047 | ) | (63,047 | ) | (63,047 | ) | (63,047 | ) | ||||||||||
| Goodwill |
(28,098 | ) | (28,098 | ) | (28,098 | ) | (28,098 | ) | (28,098 | ) | ||||||||||
| Purchased credit card relationship |
(23,511 | ) | (23,920 | ) | (24,342 | ) | - | - | ||||||||||||
| Core deposit intangible |
(9,335 | ) | (9,923 | ) | (10,512 | ) | (11,100 | ) | (11,689 | ) | ||||||||||
|
|
|
|
|
|
|
|
|
|
|
|
||||||||||
| Tangible common equity |
$ | 1,361,032 | $ | 1,359,129 | $ | 1,322,960 | $ | 1,330,778 | $ | 1,341,310 | ||||||||||
|
|
|
|
|
|
|
|
|
|
|
|
||||||||||
| Tangible Assets: |
||||||||||||||||||||
| Total assets - GAAP |
$ | 13,099,741 | $ | 13,139,747 | $ | 12,913,650 | $ | 13,085,623 | $ | 13,127,275 | ||||||||||
| Goodwill |
(28,098 | ) | (28,098 | ) | (28,098 | ) | (28,098 | ) | (28,098 | ) | ||||||||||
| Purchased credit card relationship |
(23,511 | ) | (23,920 | ) | (24,342 | ) | - | - | ||||||||||||
| Core deposit intangible |
(9,335 | ) | (9,923 | ) | (10,512 | ) | (11,100 | ) | (11,689 | ) | ||||||||||
|
|
|
|
|
|
|
|
|
|
|
|
||||||||||
| Tangible assets |
$ |
13,038,797 |
|
$ |
13,077,806 |
|
$ |
12,850,698 |
|
$ |
13,046,425 |
|
$ | 13,087,488 | ||||||
|
|
|
|
|
|
|
|
|
|
|
|
||||||||||
| Common shares outstanding |
206,235 | 206,179 | 206,134 | 206,134 | 205,134 | |||||||||||||||
|
|
|
|
|
|
|
|
|
|
|
|||||||||||
| Tangible common equity ratio |
10.44 | % | 10.39 | % | 10.29 | % | 10.20 | % | 10.25 | % | ||||||||||
| Tangible book value per common share |
$ | 6.60 | $ | 6.59 | $ | 6.42 | $ | 6.46 | $ | 6.54 |
||||||||||
First BanCorp. Announces Earnings for the Quarter and Year Ended December 31, 2012 – Page 16 of 30
The following table reconciles stockholders’ equity (GAAP) to Tier 1 common equity:
| (Dollars in thousands) | As of | |||||||||||||||||||
| December 31, 2012 |
September 30, 2012 |
June 30, 2012 |
March 31, 2012 |
December 31, 2011 |
||||||||||||||||
| Tier 1 Common Equity: |
||||||||||||||||||||
| Total equity—GAAP |
$ | 1,485,023 | $ | 1,484,117 | $ | 1,448,959 | $ | 1,433,023 | $ | 1,444,144 | ||||||||||
| Qualifying preferred stock |
(63,047 | ) | (63,047 | ) | (63,047 | ) | (63,047 | ) | (63,047 | ) | ||||||||||
| Unrealized gain on available-for-sale securities (1) |
(28,476 | ) | (42,528 | ) | (26,623 | ) | (20,233 | ) | (19,234 | ) | ||||||||||
| Disallowed deferred tax asset (2) |
— | (40 | ) | (41 | ) | (25 | ) | — | ||||||||||||
| Goodwill |
(28,098 | ) | (28,098 | ) | (28,098 | ) | (28,098 | ) | (28,098 | ) | ||||||||||
| Core deposit intangible |
(9,335 | ) | (9,923 | ) | (10,512 | ) | (11,100 | ) | (11,689 | ) | ||||||||||
| Cumulative change gain in fair value of liabilities accounted for under a fair value option |
— | — | — | (2,434 | ) | (2,009 | ) | |||||||||||||
| Other disallowed assets |
(4,032 | ) | (4,155 | ) | (2,917 | ) | (807 | ) | (922 | ) | ||||||||||
|
|
|
|
|
|
|
|
|
|
|
|||||||||||
| Tier 1 common equity |
$ | 1,352,035 | $ | 1,336,326 | $ | 1,317,721 | $ | 1,307,279 | $ | 1,319,145 | ||||||||||
|
|
|
|
|
|
|
|
|
|
|
|||||||||||
| Total risk-weighted assets |
$ | 9,933,719 | $ | 10,026,572 | $ | 10,046,284 | $ | 9,947,559 | $ | 10,180,226 | ||||||||||
|
|
|
|
|
|
|
|
|
|
|
|||||||||||
| Tier 1 common equity to risk-weighted assets ratio |
13.61 | % | 13.33 | % | 13.12 | % | 13.14 | % | 12.96 | % | ||||||||||
| 1- | Tier 1 capital excludes net unrealized gains (losses) on available-for-sale debt securities and net unrealized gains on available-for-sale equity securities with readily determinable fair values, in accordance with regulatory risk-based capital guidelines. In arriving at Tier 1 capital, institutions are required to deduct net unrealized losses on available-for-sale equity securities with readily determinable fair values, net of tax. |
| 2- | Approximately $11 million of the Corporation’s deferred tax assets at December 31, 2012 (September 30, 2012—$12 million; June 30, 2012—$12 million; March 31, 2012—$12 million; December 31, 2011—$13 million) was included without limitation in regulatory capital pursuant to the risk-based capital guidelines, while approximately $0 of such assets at December 31, 2012 (September 30, 2012—$40k; June 30, 2012—$41k; March 31, 2012—$25k; December 31, 2011—$0) exceeded the limitation imposed by these guidelines and, as “disallowed deferred tax assets,” was deducted in arriving at Tier 1 capital. According to regulatory capital guidelines, the deferred tax assets that are dependent upon future taxable income are limited for inclusion in Tier 1 capital to the lesser of: (i) the amount of such deferred tax asset that the entity expects to realize within one year of the calendar quarter-end date, based on its projected future taxable income for that year, or (ii) 10% of the amount of the entity’s Tier 1 capital. Approximately $6 million of the Corporation’s other net deferred tax liability at December 31, 2012 (September 30, 2012—$7 million; June 30, 2012—$7 million; March 31, 2012—$7 million; December 31, 2011—$8 million) represented primarily the deferred tax effects of unrealized gains and losses on available-for-sale debt securities, which are permitted to be excluded prior to deriving the amount of net deferred tax assets subject to limitation under the guidelines. |
First BanCorp. Announces Earnings for the Quarter and Year Ended December 31, 2012 – Page 17 of 30
Conference Call / Webcast Information
First BanCorp’s senior management will host an earnings conference call and live webcast on Tuesday, February 5, 2013, at 10:00 a.m. (Eastern Time). The call may be accessed via a live Internet webcast through the investor relations section of the Corporation’s web site: www.firstbankpr.com or through a dial-in telephone number at (888) 317-6016 or (412) 317–6016 for international callers. Listeners are recommended to go to the web site at least 15 minutes prior to the call to download and install any necessary software. A replay of the webcast will be archived in the investor relations section of First BanCorp’s web site, www.firstbankpr.com, until February 5, 2014. A telephone replay will be available one hour after the end of the conference call through 9:00 a.m. Eastern time March 5, 2013 at (877) 344-7529 or (412) 317-0088 for international callers. The conference number is 10024656.
Safe Harbor
This press release may contain “forward-looking statements” concerning the Corporation’s future economic performance. The words or phrases “expect,” “anticipate,” “look forward,” “should,” “believes” and similar expressions are meant to identify “forward-looking statements” within the meaning of Section 27A of the Private Securities Litigation Reform Act of 1995, and are subject to the safe harbor created by such section. The Corporation wishes to caution readers not to place undue reliance on any such “forward-looking statements,” which speak only as of the date made, and to advise readers that various factors, including, but not limited to, the following could cause actual results to differ materially from those expressed in, or implied by such forward-looking statements: uncertainty about whether the Corporation and FirstBank will be able to fully comply with the written agreement dated June 3, 2010 that the Corporation entered into with the Federal Reserve Bank of New York (the “Federal Reserve”) and the order dated June 2, 2010 that FirstBank entered into with the FDIC and the Office of the Commissioner of Financial Institutions of the Commonwealth of Puerto Rico (the “FDIC Order”) that, among other things, require FirstBank to maintain certain capital levels and reduce its special mention, classified, delinquent, and non-performing assets; the risk of being subject to possible additional regulatory actions; uncertainty as to the availability of certain funding sources, such as retail brokered CDs; the Corporation’s reliance on brokered CDs and its ability to obtain, on a periodic basis, approval from the FDIC to issue brokered CDs to fund operations and provide liquidity in accordance with the terms of the FDIC Order; the risk of not being able to fulfill the Corporation’s cash obligations or resume paying dividends to the Corporation’s stockholders in the future due to the Corporation’s inability to receive approval from the Federal Reserve to receive dividends from FirstBank or FirstBank’s failure to generate sufficient cash flow to make a dividend payment to the Corporation; the strength or weakness of the real estate markets and of the consumer and commercial credit sectors and their impact on the credit quality of the Corporation’s loans and other assets, including the Corporation’s construction and commercial real estate loan portfolios, which have contributed and may continue to contribute to, among other things, the high levels of non-performing assets, charge-offs, and the provision expense and may subject the Corporation to further risk from loan defaults and foreclosures; adverse changes in general economic conditions in Puerto Rico, the U.S., and the U.S. Virgin Islands and British Virgin Islands, including the interest rate environment, market liquidity, housing absorption rates, real estate prices, and disruptions in the U.S. capital markets, which may reduce interest margins, impact funding sources, and affect demand for all of the Corporation’s products and services and reduce the Corporation’s revenues, earnings, and the value of the Corporation’s assets; an adverse change in the Corporation’s ability to attract new clients and retain existing ones; a decrease in demand for the Corporation’s products and services and lower revenues and earnings because of the continued recession in Puerto Rico, the current fiscal problems, and budget deficit of the Puerto Rico government and recent credit downgrades of the Puerto Rico government; uncertainty about regulatory and legislative changes for financial services companies in Puerto Rico, the U.S., and the U.S. and British Virgin Islands, which could affect the Corporation’s financial condition or performance and could cause the Corporation’s actual results for future periods to differ materially from prior results and anticipated or projected results; uncertainty regarding the timing and final substance of any capital or liquidity standards, including the Final Basel III requirements and their implementation through rulemaking by the Federal Reserve, including anticipated requirements to hold higher levels of regulatory capital and liquidity and meet higher regulatory capital ratios as a result of Final Basel III or other capital or liquidity standards; uncertainty about the effectiveness of the various actions undertaken to stimulate the U.S. economy and stabilize the U.S. financial markets, and the impact such actions may have on the Corporation’s business, financial condition and results of operations; changes in the fiscal and monetary policies and regulations of the federal government, including those
First BanCorp. Announces Earnings for the Quarter and Year Ended December 31, 2012 – Page 18 of 30
determined by the Federal Reserve, the FDIC, government-sponsored housing agencies, and regulators in Puerto Rico and the U.S. and British Virgin Islands; the risk of possible failure or circumvention of controls and procedures and the risk that the Corporation’s risk management policies may not be adequate; the risk that the FDIC may further increase the deposit insurance premium and/or require special assessments to replenish its insurance fund, causing an additional increase in the Corporation’s non-interest expenses; the risks of not being able to recover the assets pledged to Lehman Brothers Special Financing, Inc.; the impact on the Corporation’s results of operations and financial condition of acquisitions and disposition transactions; a need to recognize additional impairments on financial instruments, goodwill, or other intangible assets relating to acquisitions; the risks that downgrades in the credit ratings of the Corporation’s long-term senior debt will adversely affect the Corporation’s ability to access necessary external funds; the impact of the Dodd-Frank Wall Street Reform and Consumer Protection Act on the Corporation’s businesses, business practices, and cost of operations; and general competitive factors and industry consolidation. The Corporation does not undertake, and specifically disclaims any obligation, to update any “forward-looking statements” to reflect occurrences or unanticipated events or circumstances after the date of such statements except as required by the federal securities laws.
Basis of Presentation
Use of Non-GAAP Financial Measures
This press release contains non-GAAP financial measures. Non-GAAP financial measures are set forth when management believes they will be helpful to an understanding of the Corporation’s results of operations or financial position. Where non-GAAP financial measures are used, the comparable GAAP financial measure, as well as the reconciliation to the comparable GAAP financial measure, can be found in the text or in the attached tables to this earnings release.
Tangible Common Equity Ratio and Tangible Book Value per Common Share
The tangible common equity ratio and tangible book value per common share are non-GAAP measures generally used by the financial community to evaluate capital adequacy. Tangible common equity is total equity less preferred equity, goodwill, core deposit intangibles, and other intangibles, such as the purchased credit card relationship intangible. Tangible assets are total assets less goodwill, core deposit intangibles, and other intangibles, such as the purchased credit card relationship intangible. Management and many stock analysts use the tangible common equity ratio and tangible book value per common share in conjunction with more traditional bank capital ratios to compare the capital adequacy of banking organizations with significant amounts of goodwill or other intangible assets, typically stemming from the use of the purchase method of accounting for mergers and acquisitions. Neither tangible common equity nor tangible assets, or the related measures should be considered in isolation or as a substitute for stockholders’ equity, total assets, or any other measure calculated in accordance with GAAP. Moreover, the manner in which the Corporation calculates its tangible common equity, tangible assets, and any other related measures may differ from that of other companies reporting measures with similar names.
Tier 1 Common Equity to Risk-Weighted Assets Ratio
The Tier 1 common equity to risk-weighted assets ratio is calculated by dividing (a) Tier 1 capital less non-common elements including qualifying perpetual preferred stock and qualifying trust preferred securities by (b) risk-weighted assets, which assets are calculated in accordance with applicable bank regulatory requirements. The Tier 1 common equity ratio is not required by GAAP or on a recurring basis by applicable bank regulatory requirements. Management is currently monitoring this ratio, along with the other ratios discussed above, in evaluating the Corporation’s capital levels and believes that, at this time, the ratio may be of interest to investors.
Adjusted Pre-Tax, Pre-Provision Income
A non-GAAP performance metric that management believes is useful in analyzing underlying performance trends, particularly in times of economic stress, is adjusted pre-tax, pre-provision income. Adjusted pre-tax, pre-provision
First BanCorp. Announces Earnings for the Quarter and Year Ended December 31, 2012 – Page 19 of 30
income, as defined by management, represents net (loss) income excluding income tax expense (benefit), the provision for loan and lease losses, gains on sale and OTTI of investment securities, fair value adjustments on derivatives, and liabilities measured at fair value, equity in earnings or losses of unconsolidated entities as well as certain items identified as unusual, non-recurring or non-operating.
From time to time, revenue and expenses are impacted by items judged by management to be outside of ordinary banking activities and/or by items that, while they may be associated with ordinary banking activities, are so unusually large that management believes that a complete analysis of its Corporation’s performance requires consideration also of results that exclude such amounts. These items result from factors originating outside the Corporation such as regulatory actions/assessments, and may result from unusual management decisions, such as the early extinguishment of debt.
Net Interest Income, Excluding Valuations and on a Tax-Equivalent Basis
Net interest income, interest rate spread, and net interest margin are reported excluding the changes in the fair value of derivative instruments and financial liabilities elected to be measured at fair value on a tax-equivalent basis. The presentation of net interest income excluding valuations provides additional information about the Corporation’s net interest income and facilitates comparability and analysis. The changes in the fair value of derivative instruments and unrealized gains and losses on liabilities measured at fair value have no effect on interest due or interest earned on interest-bearing liabilities or interest-earning assets, respectively. The tax-equivalent adjustment to net interest income recognizes the income tax savings when comparing taxable and tax-exempt assets and assumes a marginal income tax rate. Income from tax-exempt earning assets is increased by an amount equivalent to the taxes that would have been paid if this income had been taxable at statutory rates. Management believes that it is a standard practice in the banking industry to present net interest income, interest rate spread, and net interest margin on a fully tax-equivalent basis. This adjustment puts all earning assets, most notably tax-exempt securities and certain loans, on a common basis that facilitates comparison of results to results of peers.
First BanCorp. Announces Earnings for the Quarter and Year Ended December 31, 2012 – Page 20 of 30
FIRST BANCORP
Condensed Consolidated Statements of Financial Condition
| As of | ||||||||||||
| (In thousands, except for share information) | December 31, 2012 |
September 30, 2012 |
December 31, 2011 |
|||||||||
| ASSETS |
||||||||||||
| Cash and due from banks |
$ | 730,016 | $ | 786,788 | $ | 206,897 | ||||||
|
|
|
|
|
|
|
|||||||
| Money market investments: |
||||||||||||
| Federal funds sold |
— | — | 2,603 | |||||||||
| Time deposits with other financial institutions |
505 | 605 | 955 | |||||||||
| Other short-term investments |
216,330 | 216,327 | 236,111 | |||||||||
|
|
|
|
|
|
|
|||||||
| Total money market investments |
216,835 | 216,932 | 239,669 | |||||||||
|
|
|
|
|
|
|
|||||||
| Investment securities available for sale, at fair value |
1,731,077 | 1,597,847 | 1,923,268 | |||||||||
| Other equity securities |
38,757 | 39,656 | 37,951 | |||||||||
|
|
|
|
|
|
|
|||||||
| Total investment securities |
1,769,834 | 1,637,503 | 1,961,219 | |||||||||
|
|
|
|
|
|
|
|||||||
| Investment in unconsolidated entities |
23,970 | 32,300 | 43,401 | |||||||||
|
|
|
|
|
|
|
|||||||
| Loans, net of allowance for loan and lease losses of $435,414 |
9,618,700 | 9,742,633 | 10,065,475 | |||||||||
| Loans held for sale, at lower of cost or market |
85,394 | 68,349 | 15,822 | |||||||||
|
|
|
|
|
|
|
|||||||
| Total loans, net |
9,704,094 | 9,810,982 | 10,081,297 | |||||||||
|
|
|
|
|
|
|
|||||||
| Premises and equipment, net |
181,363 | 182,733 | 194,942 | |||||||||
| Other real estate owned |
185,764 | 177,001 | 114,292 | |||||||||
| Accrued interest receivable on loans and investments |
51,671 | 53,216 | 49,957 | |||||||||
| Other assets |
236,194 | 242,292 | 235,601 | |||||||||
|
|
|
|
|
|
|
|||||||
| Total assets |
$ | 13,099,741 | $ | 13,139,747 | $ | 13,127,275 | ||||||
|
|
|
|
|
|
|
|||||||
| LIABILITIES |
||||||||||||
| Deposits: |
||||||||||||
| Non-interest-bearing deposits |
$ | 837,387 | $ | 780,717 | $ | 705,789 | ||||||
| Interest-bearing deposits |
9,027,159 | 9,115,685 | 9,201,965 | |||||||||
|
|
|
|
|
|
|
|||||||
| Total deposits |
9,864,546 | 9,896,402 | 9,907,754 | |||||||||
|
|
|
|
|
|
|
|||||||
| Securities sold under agreements to repurchase |
900,000 | 900,000 | 1,000,000 | |||||||||
| Advances from the Federal Home Loan Bank (FHLB) |
508,440 | 518,440 | 367,440 | |||||||||
| Notes payable |
— | — | 23,342 | |||||||||
| Other borrowings |
231,959 | 231,959 | 231,959 | |||||||||
| Accounts payable and other liabilities |
109,773 | 108,829 | 152,636 | |||||||||
|
|
|
|
|
|
|
|||||||
| Total liabilities |
11,614,718 | 11,655,630 | 11,683,131 | |||||||||
|
|
|
|
|
|
|
|||||||
| STOCKHOLDERS’ EQUITY |
||||||||||||
| Preferred Stock, authorized 50,000,000 shares: issued 22,828,174 shares; outstanding 2,521,872; aggregate liquidation value $63,047 |
63,047 | 63,047 | 63,047 | |||||||||
|
|
|
|
|
|
|
|||||||
| Common stock, $0.10 par value, authorized 2,000,000,000 shares; issued 206,730,318 |
20,673 | 20,667 | 20,579 | |||||||||
| Less: Treasury stock (at par value) |
(49 | ) | (49 | ) | (66 | ) | ||||||
|
|
|
|
|
|
|
|||||||
| Common stock outstanding, 206,235,465 shares outstanding |
20,624 | 20,618 | 20,513 | |||||||||
|
|
|
|
|
|
|
|||||||
| Additional paid-in capital |
885,754 | 885,327 | 884,002 | |||||||||
| Retained earnings |
487,168 | 472,633 | 457,384 | |||||||||
| Accumulated other comprehensive income |
28,430 | 42,492 | 19,198 | |||||||||
|
|
|
|
|
|
|
|||||||
| Total stockholders’ equity |
1,485,023 | 1,484,117 | 1,444,144 | |||||||||
|
|
|
|
|
|
|
|||||||
| Total liabilities and stockholders’ equity |
$ | 13,099,741 | $ | 13,139,747 | $ | 13,127,275 | ||||||
|
|
|
|
|
|
|
|||||||
First BanCorp. Announces Earnings for the Quarter and Year Ended December 31, 2012 – Page 21 of 30
FIRST BANCORP
Condensed Consolidated Statements of Income (Loss)
| Quarter Ended | Year Ended | |||||||||||||||||||
| (In thousands, except per share information) | December 31, 2012 |
September 30, 2012 |
December 31, 2011 |
December 31, 2012 |
December 31, 2011 |
|||||||||||||||
| Net interest income: |
||||||||||||||||||||
| Interest income |
$ | 165,054 | $ | 166,964 | $ | 156,752 | $ | 637,777 | $ | 659,615 | ||||||||||
| Interest expense |
39,423 | 41,461 | 58,209 | 176,072 | 266,103 | |||||||||||||||
|
|
|
|
|
|
|
|
|
|
|
|||||||||||
| Net interest income |
125,631 | 125,503 | 98,543 | 461,705 | 393,512 | |||||||||||||||
| Provision for loan and lease losses |
30,466 | 28,952 | 41,987 | 120,499 | 236,349 | |||||||||||||||
|
|
|
|
|
|
|
|
|
|
|
|||||||||||
| Net interest income after provision for loan and lease losses |
95,165 | 96,551 | 56,556 | 341,206 | 157,163 | |||||||||||||||
|
|
|
|
|
|
|
|
|
|
|
|||||||||||
| Non-interest income: |
||||||||||||||||||||
| Other service charges |
1,492 | 1,098 | 2,116 | 5,335 | 6,775 | |||||||||||||||
| Service charges on deposit accounts |
3,228 | 3,267 | 2,988 | 12,982 | 12,472 | |||||||||||||||
| Mortgage banking activities |
6,700 | 4,728 | 3,717 | 19,960 | 23,320 | |||||||||||||||
| Net (loss) gain on investments and impairments |
(69 | ) | (547 | ) | (1,014 | ) | (1,966 | ) | 51,825 | |||||||||||
| Loss on early extinguishment of borrowings |
— | — | — | — | (10,835 | ) | ||||||||||||||
| Equity in (losses) earnings of unconsolidated entities |
(8,330 | ) | (2,199 | ) | 1,666 | (19,256 | ) | (4,227 | ) | |||||||||||
| Other non-interest income |
8,747 | 8,779 | 5,197 | 32,336 | 28,651 | |||||||||||||||
|
|
|
|
|
|
|
|
|
|
|
|||||||||||
| Total non-interest income |
11,768 | 15,126 | 14,670 | 49,391 | 107,981 | |||||||||||||||
|
|
|
|
|
|
|
|
|
|
|
|||||||||||
| Non-interest expenses: |
||||||||||||||||||||
| Employees’ compensation and benefits |
31,840 | 31,058 | 29,254 | 125,610 | 118,475 | |||||||||||||||
| Occupancy and equipment |
14,972 | 15,208 | 15,603 | 61,037 | 61,924 | |||||||||||||||
| Business promotion |
4,067 | 4,004 | 3,482 | 14,093 | 12,283 | |||||||||||||||
| Professional fees |
5,557 | 6,295 | 4,692 | 22,353 | 21,884 | |||||||||||||||
| Taxes, other than income taxes |
3,013 | 3,499 | 3,442 | 13,363 | 13,395 | |||||||||||||||
| Insurance and supervisory fees |
13,263 | 13,023 | 13,301 | 52,596 | 57,923 | |||||||||||||||
| Net loss on real estate owned (REO) operations |
6,201 | 8,686 | 8,602 | 25,116 | 25,025 | |||||||||||||||
| Other non-interest expenses |
11,992 | 10,070 | 7,450 | 40,715 | 27,145 | |||||||||||||||
|
|
|
|
|
|
|
|
|
|
|
|||||||||||
| Total non-interest expenses |
90,905 | 91,843 | 85,826 | 354,883 | 338,054 | |||||||||||||||
|
|
|
|
|
|
|
|
|
|
|
|||||||||||
| Income (loss) before income taxes |
16,028 | 19,834 | (14,600 | ) | 35,714 | (72,910 | ) | |||||||||||||
| Income tax expense |
(1,493 | ) | (761 | ) | (242 | ) | (5,932 | ) | (9,322 | ) | ||||||||||
|
|
|
|
|
|
|
|
|
|
|
|||||||||||
| Net income (loss) |
$ | 14,535 | $ | 19,073 | $ | (14,842 | ) | $ | 29,782 | $ | (82,232 | ) | ||||||||
|
|
|
|
|
|
|
|
|
|
|
|||||||||||
| Net income attributable to common stockholders—basic |
$ | 14,535 | $ | 19,073 | $ | 262,011 | $ | 29,782 | $ | 173,226 | ||||||||||
|
|
|
|
|
|
|
|
|
|
|
|||||||||||
| Net income attributable to common stockholders—diluted |
$ | 14,535 | $ | 19,073 | $ | 263,153 | $ | 29,782 | $ | 195,763 | ||||||||||
|
|
|
|
|
|
|
|
|
|
|
|||||||||||
| Earnings per common share: |
||||||||||||||||||||
| Basic |
$ | 0.07 | $ | 0.09 | $ | 1.36 | $ | 0.15 | $ | 2.69 | ||||||||||
|
|
|
|
|
|
|
|
|
|
|
|||||||||||
| Diluted |
$ | 0.07 | $ | 0.09 | $ | 1.35 | $ | 0.14 | $ | 2.18 | ||||||||||
|
|
|
|
|
|
|
|
|
|
|
|||||||||||
First BanCorp. Announces Earnings for the Quarter and Year Ended December 31, 2012 – Page 22 of 30
About First BanCorp.
First BanCorp. is the parent corporation of FirstBank Puerto Rico, a state-chartered commercial bank with operations in Puerto Rico, the Virgin Islands and Florida, and of FirstBank Insurance Agency. First BanCorp. and FirstBank Puerto Rico operate within U.S. banking laws and regulations. The Corporation operates a total of 154 branches, stand-alone offices, and in-branch service centers throughout Puerto Rico, the U.S. and British Virgin Islands, and Florida. Among the subsidiaries of FirstBank Puerto Rico are First Federal Finance Corp., a small loan company; FirstBank Puerto Rico Securities, a broker-dealer subsidiary; First Management of Puerto Rico; and FirstMortgage, Inc., a mortgage origination company. In the U.S. Virgin Islands, FirstBank operates First Express, a small loan company. First BanCorp’s common shares trade on the New York Stock Exchange under the symbol FBP. Additional information about First BanCorp. may be found at www.firstbankpr.com.
###
First BanCorp.
John B. Pelling III
Investor Relations Officer
john.pelling@firstbankpr.com
(305) 577-6000 Ext. 162
First BanCorp. Announces Earnings for the Quarter and Year Ended December 31, 2012 – Page 23 of 30
EXHIBIT A
Table 1 – Selected Financial Data
| (In thousands, except for per share and financial ratios) | Quarter Ended | Year Ended | ||||||||||||||||||
| December 31, 2012 |
September 30, 2012 |
December 31, 2011 |
December 31, 2012 |
December 31, 2011 |
||||||||||||||||
| Condensed Income Statements: |
||||||||||||||||||||
| Total interest income |
$ | 165,054 | $ | 166,964 | $ | 156,752 | $ | 637,777 | $ | 659,615 | ||||||||||
| Total interest expense |
39,423 | 41,461 | 58,209 | 176,072 | 266,103 | |||||||||||||||
| Net interest income |
125,631 | 125,503 | 98,543 | 461,705 | 393,512 | |||||||||||||||
| Provision for loan and lease losses |
30,466 | 28,952 | 41,987 | 120,499 | 236,349 | |||||||||||||||
| Non-interest income |
11,768 | 15,126 | 14,670 | 49,391 | 107,981 | |||||||||||||||
| Non-interest expenses |
90,905 | 91,843 | 85,826 | 354,883 | 338,054 | |||||||||||||||
| Income (loss) before income taxes |
16,028 | 19,834 | (14,600 | ) | 35,714 | (72,910 | ) | |||||||||||||
| Income tax expense |
(1,493 | ) | (761 | ) | (242 | ) | (5,932 | ) | (9,322 | ) | ||||||||||
| Net income (loss) |
14,535 | 19,073 | (14,842 | ) | 29,782 | (82,232 | ) | |||||||||||||
| Net income attributable to common stockholders—basic |
14,535 | 19,073 | 262,011 | 29,782 | 173,226 | |||||||||||||||
| Net income attributable to common stockholders—diluted |
14,535 | 19,073 | 263,153 | 29,782 | 195,763 | |||||||||||||||
| Per Common Share Results: |
||||||||||||||||||||
| Net earnings per share basic |
$ | 0.07 | $ | 0.09 | $ | 1.36 | $ | 0.15 | $ | 2.69 | ||||||||||
| Net earnings per share diluted |
$ | 0.07 | $ | 0.09 | $ | 1.35 | $ | 0.14 | $ | 2.18 | ||||||||||
| Cash dividends declared |
$ | — | $ | — | $ | — | $ | — | $ | — | ||||||||||
| Average shares outstanding |
205,416 | 205,415 | 192,546 | 205,366 | 64,466 | |||||||||||||||
| Average shares outstanding diluted |
206,220 | 205,923 | 194,741 | 205,828 | 89,658 | |||||||||||||||
| Book value per common share |
$ | 6.89 | $ | 6.89 | $ | 6.73 | $ | 6.89 | $ | 6.73 | ||||||||||
| Tangible book value per common share (1) |
$ | 6.60 | $ | 6.59 | $ | 6.54 | $ | 6.60 | $ | 6.54 | ||||||||||
| Selected Financial Ratios (In Percent): |
||||||||||||||||||||
| Profitability: |
||||||||||||||||||||
| Return on Average Assets |
0.44 | 0.59 | (0.43 | ) | 0.23 | (0.57 | ) | |||||||||||||
| Interest Rate Spread (2) |
3.70 | 3.77 | 2.73 | 3.41 | 2.59 | |||||||||||||||
| Net Interest Margin (2) |
3.94 | 4.02 | 3.03 | 3.68 | 2.86 | |||||||||||||||
| Return on Average Total Equity |
3.89 | 5.19 | (4.16 | ) | 2.04 | (7.31 | ) | |||||||||||||
| Return on Average Common Equity |
4.06 | 5.43 | (4.77 | ) | 2.14 | (13.38 | ) | |||||||||||||
| Average Total Equity to Average Total Assets |
11.35 | 11.37 | 10.45 | 11.24 | 7.83 | |||||||||||||||
| Total capital |
17.82 | 17.52 | 17.12 | 17.82 | 17.12 | |||||||||||||||
| Tier 1 capital |
16.51 | 16.20 | 15.79 | 16.51 | 15.79 | |||||||||||||||
| Leverage |
12.60 | 12.71 | 11.91 | 12.60 | 11.91 | |||||||||||||||
| Tangible common equity ratio (1) |
10.44 | 10.39 | 10.25 | 10.44 | 10.25 | |||||||||||||||
| Tier 1 common equity to risk-weight assets (1) |
13.61 | 13.33 | 12.96 | 13.61 | 12.96 | |||||||||||||||
| Dividend payout ratio |
— | — | — | — | — | |||||||||||||||
| Efficiency ratio (3) |
66.16 | 65.31 | 75.81 | 69.44 | 67.41 | |||||||||||||||
| Asset Quality: |
||||||||||||||||||||
| Allowance for loan and lease losses to loans held for investment |
4.33 | 4.37 | 4.68 | 4.33 | 4.68 | |||||||||||||||
| Net charge-offs (annualized) to average loans |
1.59 | 1.58 | 2.55 | 1.74 | 2.68 | |||||||||||||||
| Provision for loan and lease losses to net charge-offs |
75.07 | 71.36 | 61.97 | 67.32 | 79.99 | |||||||||||||||
| Non-performing assets to total assets |
9.45 | 9.58 | 10.19 | 9.45 | 10.19 | |||||||||||||||
| Non-performing loans held for investment to total loans held for investment |
9.70 | 9.89 | 10.78 | 9.70 | 10.78 | |||||||||||||||
| Allowance to total non-performing loans held for investment |
44.63 | 44.20 | 43.39 | 44.63 | 43.39 | |||||||||||||||
| Allowance to total non-performing loans held for investment excluding residential real estate loans |
65.78 | 64.84 | 61.73 | 65.78 | 61.73 | |||||||||||||||
| Other Information: |
||||||||||||||||||||
| Common Stock Price: End of period |
$ | 4.58 | $ | 4.42 | $ | 3.49 | $ | 4.58 | $ | 3.49 | ||||||||||
| 1- | Non-GAAP measure. See pages 15-16 for GAAP to Non-GAAP reconciliations. |
| 2- | On a tax-equivalent basis and excluding fair value valuations. See page 4 for GAAP to Non-GAAP reconciliations and refer to discussions in Tables 2 and 3 below. |
| 3- | Non-interest expenses to the sum of net interest income and non-interest income. The denominator includes non-recurring income and changes in the fair value of derivative instruments and financial liabilities measured at fair value. |
First BanCorp. Announces Earnings for the Quarter and Year Ended December 31, 2012 – Page 24 of 30
Table 2 – Quarterly Statement of Average Interest-Earning Assets and Average Interest-Bearing Liabilities (On a Tax-Equivalent Basis and Excluding Valuations)
| (Dollars in thousands) | ||||||||||||||||||||||||||||||||||||
| Average volume | Interest income (1) / expense | Average rate (1) | ||||||||||||||||||||||||||||||||||
| Year ended | December 31, 2012 |
September 30, 2012 |
December 31, 2011 |
December 31, 2012 |
September 30, 2012 |
December 31, 2011 |
December 31, 2012 |
September 30, 2012 |
December 31, 2011 |
|||||||||||||||||||||||||||
| Interest-earning assets: |
||||||||||||||||||||||||||||||||||||
| Money market & other short-term investments |
$ | 849,350 | $ | 553,283 | $ | 733,072 | $ | 607 | $ | 395 | $ | 522 | 0.28 | % | 0.28 | % | 0.28 | % | ||||||||||||||||||
| Government obligations (2) |
258,456 | 336,598 | 960,234 | 1,601 | 1,069 | 3,943 | 2.46 | % | 1.26 | % | 1.63 | % | ||||||||||||||||||||||||
| Mortgage-backed securities |
1,429,292 | 1,313,353 | 931,008 | 10,584 | 10,705 | 7,804 | 2.95 | % | 3.24 | % | 3.33 | % | ||||||||||||||||||||||||
| Corporate bonds |
— | 959 | 2,000 | — | 16 | 29 | 0.00 | % | 6.64 | % | 5.75 | % | ||||||||||||||||||||||||
| FHLB stock |
37,946 | 33,131 | 38,227 | 355 | 318 | 324 | 3.72 | % | 3.82 | % | 3.36 | % | ||||||||||||||||||||||||
| Equity securities |
1,377 | 1,377 | 1,377 | 6 | — | — | 1.73 | % | 0.00 | % | 0.00 | % | ||||||||||||||||||||||||
|
|
|
|
|
|
|
|
|
|
|
|
|
|||||||||||||||||||||||||
| Total investments (3) |
2,576,421 | 2,238,701 | 2,665,918 | 13,153 | 12,503 | 12,622 | 2.03 | % | 2.22 | % | 1.88 | % | ||||||||||||||||||||||||
|
|
|
|
|
|
|
|
|
|
|
|
|
|||||||||||||||||||||||||
| Residential mortgage loans |
2,811,954 | 2,815,261 | 2,805,567 | 37,395 | 37,897 | 38,665 | 5.29 | % | 5.36 | % | 5.47 | % | ||||||||||||||||||||||||
| Construction loans |
356,617 | 365,656 | 474,647 | 2,662 | 2,480 | 2,963 | 2.97 | % | 2.70 | % | 2.48 | % | ||||||||||||||||||||||||
| C&I and commercial mortgage loans |
5,035,391 | 5,151,641 | 5,791,380 | 51,032 | 52,514 | 59,966 | 4.03 | % | 4.06 | % | 4.11 | % | ||||||||||||||||||||||||
| Finance leases |
237,564 | 237,986 | 249,394 | 5,127 | 5,222 | 5,230 | 8.59 | % | 8.73 | % | 8.32 | % | ||||||||||||||||||||||||
| Consumer loans |
1,758,282 | 1,727,291 | 1,316,535 | 56,705 | 57,641 | 38,516 | 12.83 | % | 13.28 | % | 11.61 | % | ||||||||||||||||||||||||
|
|
|
|
|
|
|
|
|
|
|
|
|
|||||||||||||||||||||||||
| Total loans (4) (5) |
10,199,808 | 10,297,835 | 10,637,523 | 152,921 | 155,754 | 145,340 | 5.96 | % | 6.02 | % | 5.42 | % | ||||||||||||||||||||||||
|
|
|
|
|
|
|
|
|
|
|
|
|
|||||||||||||||||||||||||
| Total interest-earning assets |
$ | 12,776,229 | $ | 12,536,536 | $ | 13,303,441 | $ | 166,074 | $ | 168,257 | $ | 157,962 | 5.17 | % | 5.34 | % | 4.71 | % | ||||||||||||||||||
|
|
|
|
|
|
|
|
|
|
|
|
|
|||||||||||||||||||||||||
| Interest-bearing liabilities: |
||||||||||||||||||||||||||||||||||||
| Brokered CDs |
$ | 3,443,661 | $ | 3,400,984 | $ | 4,104,884 | $ | 13,883 | $ | 15,435 | $ | 22,726 | 1.60 | % | 1.81 | % | 2.20 | % | ||||||||||||||||||
| Other interest-bearing deposits |
5,614,308 | 5,589,449 | 5,505,317 | 14,202 | 14,516 | 19,276 | 1.01 | % | 1.03 | % | 1.39 | % | ||||||||||||||||||||||||
| Other borrowed funds |
1,131,959 | 1,131,959 | 1,253,921 | 8,419 | 8,557 | 10,639 | 2.96 | % | 3.01 | % | 3.37 | % | ||||||||||||||||||||||||
| FHLB advances |
510,940 | 395,777 | 391,603 | 2,920 | 2,953 | 3,576 | 2.27 | % | 2.97 | % | 3.62 | % | ||||||||||||||||||||||||
|
|
|
|
|
|
|
|
|
|
|
|
|
|||||||||||||||||||||||||
| Total interest-bearing liabilities (6) |
$ | 10,700,868 | $ | 10,518,169 | $ | 11,255,725 | $ | 39,424 | $ | 41,461 | $ | 56,217 | 1.47 | % | 1.57 | % | 1.98 | % | ||||||||||||||||||
|
|
|
|
|
|
|
|
|
|
|
|
|
|||||||||||||||||||||||||
| Net interest income |
$ | 126,650 | $ | 126,796 | $ | 101,745 | ||||||||||||||||||||||||||||||
|
|
|
|
|
|
|
|||||||||||||||||||||||||||||||
| Interest rate spread |
3.70 | % | 3.77 | % | 2.73 | % | ||||||||||||||||||||||||||||||
| Net interest margin |
3.94 | % | 4.02 | % | 3.03 | % | ||||||||||||||||||||||||||||||
| 1- | On a tax-equivalent basis. The tax-equivalent yield was estimated by dividing the interest rate spread on exempt assets by 1 less the Puerto Rico statutory tax rate (30% for 2012; 30% for the Corporation’s subsidiaries other than International Banking Entities (IBEs) and 25% for the Corporation’s IBEs in 2011) and adding to it the cost of interest-bearing liabilities. When adjusted to a tax-equivalent basis, yields on taxable and exempt assets are comparable. Changes in the fair value of derivative instruments and unrealized gains or losses on liabilities measured at fair value are excluded from interest income and interest expense because the changes in valuation do not affect interest paid or received. |
| 2- | Government obligations include debt issued by government-sponsored agencies. |
| 3- | Unrealized gains and losses on available-for-sale securities are excluded from the average volumes. |
| 4- | Average loan balances include the average of total non-performing loans. |
| 5- | Interest income on loans includes $3.7 million, $3.7 million and $2.6 million for the quarters ended December 31, 2012, September 30, 2012, and December 31, 2011, respectively, of income from prepayment penalties and late fees related to the Corporation’s loan portfolio. |
| 6- | Unrealized gains and losses on liabilities measured at fair value are excluded from the average volumes. |
First BanCorp. Announces Earnings for the Quarter and Year Ended December 31, 2012 – Page 25 of 30
Table 3 – Year to Date Statement of Average Interest-Earning Assets and Average Interest-Bearing Liabilities (On a Tax- Equivalent Basis and Excluding Valuations)
| (Dollars in thousands) | ||||||||||||||||||||||||
| Average volume | Interest income (1) / expense | Average rate (1) | ||||||||||||||||||||||
| Year Ended | December 31, 2012 |
December 31, 2011 |
December 31, 2012 |
December 31, 2011 |
December 31, 2012 |
December 31, 2011 |
||||||||||||||||||
| Interest-earning assets: |
||||||||||||||||||||||||
| Money market & other short-term investments |
$ | 640,644 | $ | 567,548 | $ | 1,827 | $ | 1,556 | 0.29 | % | 0.27 | % | ||||||||||||
| Government obligations (2) |
555,364 | 1,350,505 | 9,839 | 20,992 | 1.77 | % | 1.55 | % | ||||||||||||||||
| Mortgage-backed securities |
1,182,142 | 1,181,183 | 37,090 | 44,140 | 3.14 | % | 3.74 | % | ||||||||||||||||
| Corporate bonds |
1,204 | 2,000 | 76 | 116 | 6.31 | % | 5.80 | % | ||||||||||||||||
| FHLB stock |
35,035 | 43,676 | 1,427 | 1,885 | 4.07 | % | 4.32 | % | ||||||||||||||||
| Equity securities |
1,377 | 1,377 | 6 | 1 | 0.44 | % | 0.07 | % | ||||||||||||||||
|
|
|
|
|
|
|
|
|
|||||||||||||||||
| Total investments (3) |
2,415,766 | 3,146,289 | 50,265 | 68,690 | 2.08 | % | 2.18 | % | ||||||||||||||||
|
|
|
|
|
|
|
|
|
|||||||||||||||||
| Residential mortgage loans |
2,800,647 | 2,944,367 | 150,854 | 165,502 | 5.39 | % | 5.62 | % | ||||||||||||||||
| Construction loans |
388,404 | 616,980 | 10,357 | 17,026 | 2.67 | % | 2.76 | % | ||||||||||||||||
| C&I and commercial mortgage loans |
5,277,593 | 5,849,444 | 214,510 | 237,410 | 4.06 | % | 4.06 | % | ||||||||||||||||
| Finance leases |
239,699 | 263,403 | 20,887 | 21,879 | 8.71 | % | 8.31 | % | ||||||||||||||||
| Consumer loans |
1,561,085 | 1,357,381 | 196,293 | 157,451 | 12.57 | % | 11.60 | % | ||||||||||||||||
|
|
|
|
|
|
|
|
|
|||||||||||||||||
| Total loans (4) (5) |
10,267,428 | 11,031,575 | 592,901 | 599,268 | 5.77 | % | 5.43 | % | ||||||||||||||||
|
|
|
|
|
|
|
|
|
|||||||||||||||||
| Total interest-earning assets |
$ | 12,683,194 | $ | 14,177,864 | $ | 643,166 | $ | 667,958 | 5.07 | % | 4.71 | % | ||||||||||||
|
|
|
|
|
|
|
|
|
|||||||||||||||||
| Interest-bearing liabilities: |
||||||||||||||||||||||||
| Brokered CDs |
$ | 3,488,312 | $ | 5,134,699 | $ | 66,854 | $ | 111,477 | 1.92 | % | 2.17 | % | ||||||||||||
| Other interest-bearing deposits |
5,566,240 | 5,307,051 | 61,405 | 80,249 | 1.10 | % | 1.51 | % | ||||||||||||||||
| Other borrowed funds |
1,171,615 | 1,459,476 | 36,162 | 53,873 | 3.09 | % | 3.69 | % | ||||||||||||||||
| FHLB advances |
404,033 | 467,522 | 12,142 | 16,336 | 3.01 | % | 3.49 | % | ||||||||||||||||
|
|
|
|
|
|
|
|
|
|||||||||||||||||
| Total interest-bearing liabilities (6) |
$ | 10,630,200 | $ | 12,368,748 | $ | 176,563 | $ | 261,935 | 1.66 | % | 2.12 | % | ||||||||||||
|
|
|
|
|
|
|
|
|
|||||||||||||||||
| Net interest income |
$ | 466,603 | $ | 406,023 | ||||||||||||||||||||
|
|
|
|
|
|||||||||||||||||||||
| Interest rate spread |
3.41 | % | 2.59 | % | ||||||||||||||||||||
| Net interest margin |
3.68 | % | 2.86 | % | ||||||||||||||||||||
| 1- | On a tax-equivalent basis. The tax-equivalent yield was estimated by dividing the interest rate spread on exempt assets by 1 less the Puerto Rico statutory tax rate (30% for 2012; 30% for the Corporation’s subsidiaries other than IBEs and 25% for the Corporation’s IBEs in 2011) and adding to it the cost of interest-bearing liabilities. When adjusted to a tax-equivalent basis, yields on taxable and exempt assets are comparable. Changes in the fair value of derivative instruments and unrealized gains or losses on liabilities measured at fair value are excluded from interest income and interest expense because the changes in valuation do not affect interest paid or received. |
| 2- | Government obligations include debt issued by government-sponsored agencies. |
| 3- | Unrealized gains and losses on available-for-sale securities are excluded from the average volumes. |
| 4- | Average loan balances include the average of total non-performing loans. |
| 5- | Interest income on loans includes $12.7 million and $9.8 million for the years ended December 31, 2012 and 2011, respectively, of income from prepayment penalties and late fees related to the Corporation’s loan portfolio. |
| 6- | Unrealized gains and losses on liabilities measured at fair value are excluded from the average volumes. |
First BanCorp. Announces Earnings for the Quarter and Year Ended December 31, 2012 – Page 26 of 30
Table 4 – Non-Interest Income
| Quarter Ended | Year Ended | |||||||||||||||||||
| (In thousands) | December 31, 2012 |
September 30, 2012 |
December 31, 2011 |
December 31, 2012 |
December 31, 2011 |
|||||||||||||||
| Other service charges |
$ | 1,492 | $ | 1,098 | $ | 2,116 | $ | 5,335 | $ | 6,775 | ||||||||||
| Service charges on deposit accounts |
3,228 | 3,267 | 2,988 | 12,982 | 12,472 | |||||||||||||||
| Mortgage banking activities |
6,700 | 4,728 | 3,717 | 19,960 | 23,320 | |||||||||||||||
| Insurance income |
1,328 | 1,429 | 1,002 | 5,549 | 4,456 | |||||||||||||||
| Broker-dealer income |
— | 20 | 381 | 2,630 | 1,385 | |||||||||||||||
| Other operating income |
7,419 | 7,330 | 3,814 | 24,157 | 22,810 | |||||||||||||||
|
|
|
|
|
|
|
|
|
|
|
|||||||||||
| Non-interest income before net gain on investments, loss on early extinguishment of borrowings and equity in losses of unconsolidated entities |
20,167 | 17,872 | 14,018 | 70,613 | 71,218 | |||||||||||||||
|
|
|
|
|
|
|
|
|
|
|
|||||||||||
| Proceeds from securities litigation settlement and other proceeds |
— | 10 | — | 36 | 679 | |||||||||||||||
| Net gain on sale of investments |
— | — | — | — | 53,117 | |||||||||||||||
| OTTI on debt securities |
(69 | ) | (557 | ) | (1,014 | ) | (2,002 | ) | (1,971 | ) | ||||||||||
|
|
|
|
|
|
|
|
|
|
|
|||||||||||
| Net (loss) gain on investments |
(69 | ) | (547 | ) | (1,014 | ) | (1,966 | ) | 51,825 | |||||||||||
|
|
|
|
|
|
|
|
|
|
|
|||||||||||
| Loss on early extinguishment of borrowings |
— | — | — | — | (10,835 | ) | ||||||||||||||
|
|
|
|
|
|
|
|
|
|
|
|||||||||||
| Equity in losses of unconsolidated entities |
(8,330 | ) | (2,199 | ) | 1,666 | (19,256 | ) | (4,227 | ) | |||||||||||
|
|
|
|
|
|
|
|
|
|
|
|||||||||||
| $ | 11,768 | $ | 15,126 | $ | 14,670 | $ | 49,391 | $ | 107,981 | |||||||||||
|
|
|
|
|
|
|
|
|
|
|
|||||||||||
Table 5 – Non-Interest Expenses
| Quarter Ended | Year Ended | |||||||||||||||||||
| (In thousands) | December 31, 2012 |
September 30, 2012 |
December 31, 2011 |
December 31, 2012 |
December 31, 2011 |
|||||||||||||||
| Employees’ compensation and benefits |
$ | 31,840 | $ | 31,058 | $ | 29,254 | $ | 125,610 | $ | 118,475 | ||||||||||
| Occupancy and equipment |
14,972 | 15,208 | 15,603 | 61,037 | 61,924 | |||||||||||||||
| Deposit insurance premium |
11,897 | 11,657 | 12,411 | 47,523 | 53,603 | |||||||||||||||
| Other insurance and supervisory fees |
1,366 | 1,366 | 890 | 5,073 | 4,320 | |||||||||||||||
| Taxes, other than income taxes |
3,013 | 3,499 | 3,442 | 13,363 | 13,395 | |||||||||||||||
| Professional fees |
5,557 | 6,295 | 4,692 | 22,353 | 21,884 | |||||||||||||||
| Servicing and processing fees |
6,012 | 5,305 | 2,454 | 16,494 | 9,145 | |||||||||||||||
| Business promotion |
4,067 | 4,004 | 3,482 | 14,093 | 12,283 | |||||||||||||||
| Communications |
1,809 | 1,797 | 1,724 | 7,085 | 7,117 | |||||||||||||||
| Net loss on REO operations |
6,201 | 8,686 | 8,602 | 25,116 | 25,025 | |||||||||||||||
| Other |
4,171 | 2,968 | 3,272 | 17,136 | 10,883 | |||||||||||||||
|
|
|
|
|
|
|
|
|
|
|
|||||||||||
| Total |
$ | 90,905 | $ | 91,843 | $ | 85,826 | $ | 354,883 | $ | 338,054 | ||||||||||
|
|
|
|
|
|
|
|
|
|
|
|||||||||||
First BanCorp. Announces Earnings for the Quarter and Year Ended December 31, 2012 – Page 27 of 30
Table 6 – Selected Balance Sheet Data
| As of | ||||||||||||
| (In thousands) | December 31, 2012 |
September 30, 2012 |
December 31, 2011 |
|||||||||
| Balance Sheet Data: |
||||||||||||
| Loans, including loans held for sale |
$ | 10,139,508 | $ | 10,256,513 | $ | 10,575,214 | ||||||
| Allowance for loan and lease losses |
435,414 | 445,531 | 493,917 | |||||||||
| Money market and investment securities |
1,986,669 | 1,854,435 | 2,200,888 | |||||||||
| Intangible assets |
60,944 | 61,941 | 39,787 | |||||||||
| Deferred tax asset, net |
4,867 | 4,577 | 5,442 | |||||||||
| Total assets |
13,099,741 | 13,139,747 | 13,127,275 | |||||||||
| Deposits |
9,864,546 | 9,896,402 | 9,907,754 | |||||||||
| Borrowings |
1,640,399 | 1,650,399 | 1,622,741 | |||||||||
| Total preferred equity |
63,047 | 63,047 | 63,047 | |||||||||
| Total common equity |
1,393,546 | 1,378,578 | 1,361,899 | |||||||||
| Accumulated other comprehensive income, net of tax |
28,430 | 42,492 | 19,198 | |||||||||
| Total equity |
1,485,023 | 1,484,117 | 1,444,144 | |||||||||
Table 7 – Consolidated Loan Portfolio
Composition of the loan portfolio including loans held for sale at period-end.
| As of | ||||||||||||
| December 31, | September 30, | December 31, | ||||||||||
| (In thousands) | 2012 | 2012 | 2011 | |||||||||
| Residential mortgage loans |
$ | 2,747,217 | $ | 2,762,418 | $ | 2,873,785 | ||||||
|
|
|
|
|
|
|
|||||||
| Commercial loans: |
||||||||||||
| Construction loans |
361,875 | 352,891 | 427,863 | |||||||||
| Commercial mortgage loans |
1,495,465 | 1,459,118 | 1,565,411 | |||||||||
| Commercial and Industrial loans |
3,181,490 | 3,369,305 | 3,856,695 | |||||||||
| Loans to local financial institutions collateralized by real estate mortgages |
255,390 | 258,341 | 273,821 | |||||||||
|
|
|
|
|
|
|
|||||||
| Commercial loans |
5,294,220 | 5,439,655 | 6,123,790 | |||||||||
|
|
|
|
|
|
|
|||||||
| Finance leases |
236,926 | 239,556 | 247,003 | |||||||||
|
|
|
|
|
|
|
|||||||
| Consumer loans |
1,775,751 | 1,746,535 | 1,314,814 | |||||||||
|
|
|
|
|
|
|
|||||||
| Loans held for investment |
10,054,114 | 10,188,164 | 10,559,392 | |||||||||
| Loans held for sale |
85,394 | 68,349 | 15,822 | |||||||||
|
|
|
|
|
|
|
|||||||
| Total loans |
$ | 10,139,508 | $ | 10,256,513 | $ | 10,575,214 | ||||||
|
|
|
|
|
|
|
|||||||
First BanCorp. Announces Earnings for the Quarter and Year Ended December 31, 2012 – Page 28 of 30
Table 8 – Loan Portfolio by Geography
| As of December 31, 2012 | ||||||||||||||||
| (In thousands) | Puerto Rico | Virgin Islands | United States | Consolidated | ||||||||||||
| Residential mortgage loans |
$ | 2,092,450 | $ | 380,660 | $ | 274,107 | $ | 2,747,217 | ||||||||
|
|
|
|
|
|
|
|
|
|||||||||
| Commercial loans: |
||||||||||||||||
| Construction loans |
241,775 | 98,040 | 22,060 | 361,875 | ||||||||||||
| Commercial mortgage loans |
1,098,315 | 62,981 | 334,169 | 1,495,465 | ||||||||||||
| Commercial and Industrial loans |
3,007,148 | 122,104 | 52,238 | 3,181,490 | ||||||||||||
| Loans to a local financial institution collateralized by real estate mortgages |
255,390 | 0 | 0 | 255,390 | ||||||||||||
|
|
|
|
|
|
|
|
|
|||||||||
| Commercial loans |
4,602,628 | 283,125 | 408,467 | 5,294,220 | ||||||||||||
|
|
|
|
|
|
|
|
|
|||||||||
| Finance leases |
236,926 | — | — | 236,926 | ||||||||||||
|
|
|
|
|
|
|
|
|
|||||||||
| Consumer loans |
1,692,878 | 51,213 | 31,660 | 1,775,751 | ||||||||||||
|
|
|
|
|
|
|
|
|
|||||||||
| Loans held for investment |
8,624,882 | 714,998 | 714,234 | 10,054,114 | ||||||||||||
| Loans held for sale |
81,546 | 3,848 | — | 85,394 | ||||||||||||
|
|
|
|
|
|
|
|
|
|||||||||
| Total loans |
$ | 8,706,428 | $ | 718,846 | $ | 714,234 | $ | 10,139,508 | ||||||||
|
|
|
|
|
|
|
|
|
|||||||||
Table 9 – Non-Performing Assets
| (Dollars in thousands) | December 31, 2012 |
September 30, 2012 |
December 31, 2011 |
|||||||||
| Non-performing loans held for investment: |
||||||||||||
| Residential mortgage |
$ | 313,626 | $ | 320,913 | $ | 338,208 | ||||||
| Commercial mortgage |
205,440 | 231,163 | 240,414 | |||||||||
| Commercial and Industrial |
239,430 | 230,459 | 270,171 | |||||||||
| Construction |
178,190 | 189,458 | 250,022 | |||||||||
| Consumer and Finance leases |
38,875 | 36,051 | 39,547 | |||||||||
|
|
|
|
|
|
|
|||||||
| Total non-performing loans held for investment |
975,561 | 1,008,044 | 1,138,362 | |||||||||
|
|
|
|
|
|
|
|||||||
| REO |
185,764 | 177,001 | 114,292 | |||||||||
| Other repossessed property |
10,107 | 9,775 | 15,392 | |||||||||
| Other Assets (1) |
64,543 | 64,543 | 64,543 | |||||||||
|
|
|
|
|
|
|
|||||||
| Total non-performing assets, excluding loans held for sale |
$ | 1,235,975 | $ | 1,259,363 | $ | 1,332,589 | ||||||
| Non-performing loans held for sale |
2,243 | — | 4,764 | |||||||||
|
|
|
|
|
|
|
|||||||
| Total non-performing assets, including loans held for sale (2) |
$ | 1,238,218 | $ | 1,259,363 | $ | 1,337,353 | ||||||
|
|
|
|
|
|
|
|||||||
| Past-due loans 90 days and still accruing |
$ | 142,012 | $ | 141,028 | $ | 130,816 | ||||||
| Allowance for loan and lease losses |
435,414 | 445,531 | 493,917 | |||||||||
| Allowance to total non-performing loans held for investment |
44.63 | % | 44.20 | % | 43.39 | % | ||||||
| Allowance to total non-performing loans held for investment, excluding residential real estate loans |
65.78 | % | 64.84 | % | 61.73 | % | ||||||
| (1) | Collateral pledged to Lehman Brothers Special Financing, Inc. |
| (2) | Amount excludes purchased credit impaired loans with a carrying value as of December 31, 2012 of approximately $10.6 million acquired as part of the credit card portfolio acquired from FIA. |
First BanCorp. Announces Earnings for the Quarter and Year Ended December 31, 2012 – Page 29 of 30
Table 10 – Non-Performing Assets by Geography
| (In thousands) | December 31, 2012 |
September 30, 2012 |
December 31, 2011 |
|||||||||
| Puerto Rico: |
||||||||||||
| Non-performing loans held for investment: |
||||||||||||
| Residential mortgage |
$ | 281,086 | $ | 285,994 | $ | 297,595 | ||||||
| Commercial mortgage |
163,194 | 175,007 | 170,949 | |||||||||
| Commercial and Industrial |
225,325 | 216,602 | 261,189 | |||||||||
| Construction |
99,383 | 110,378 | 137,478 | |||||||||
| Finance leases |
3,182 | 3,061 | 3,485 | |||||||||
| Consumer |
32,529 | 30,005 | 34,888 | |||||||||
|
|
|
|
|
|
|
|||||||
| Total non-performing loans held for investment |
804,699 | 821,047 | 905,584 | |||||||||
|
|
|
|
|
|
|
|||||||
| REO |
145,683 | 137,877 | 85,788 | |||||||||
| Other repossessed property |
10,070 | 9,700 | 15,283 | |||||||||
| Investment securities |
64,543 | 64,543 | 64,543 | |||||||||
|
|
|
|
|
|
|
|||||||
| Total non-performing assets, excluding loans held for sale |
$ | 1,024,995 | $ | 1,033,167 | $ | 1,071,198 | ||||||
| Non-performing loans held for sale |
2,243 | — | 4,764 | |||||||||
|
|
|
|
|
|
|
|||||||
| Total non-performing assets, including loans held for sale (1) |
$ | 1,027,238 | $ | 1,033,167 | $ | 1,075,962 | ||||||
|
|
|
|
|
|
|
|||||||
| Past-due loans 90 days and still accruing |
$ | 137,288 | $ | 138,431 | $ | 118,888 | ||||||
| Virgin Islands: |
||||||||||||
| Non-performing loans held for investment: |
||||||||||||
| Residential mortgage |
$ | 18,054 | $ | 18,559 | $ | 11,470 | ||||||
| Commercial mortgage |
11,232 | 11,751 | 12,851 | |||||||||
| Commercial and Industrial |
12,905 | 12,657 | 7,276 | |||||||||
| Construction |
72,648 | 72,786 | 110,594 | |||||||||
| Consumer |
804 | 921 | 518 | |||||||||
|
|
|
|
|
|
|
|||||||
| Total non-performing loans held for investment |
115,643 | 116,674 | 142,709 | |||||||||
|
|
|
|
|
|
|
|||||||
| REO |
24,260 | 26,642 | 7,200 | |||||||||
| Other repossessed property |
17 | 57 | 67 | |||||||||
|
|
|
|
|
|
|
|||||||
| Total non-performing assets, excluding loans held for sale |
$ | 139,920 | $ | 143,373 | $ | 149,976 | ||||||
| Non-performing loans held for sale |
— | — | — | |||||||||
|
|
|
|
|
|
|
|||||||
| Total non-performing assets, including loans held for sale |
$ | 139,920 | $ | 143,373 | $ | 149,976 | ||||||
|
|
|
|
|
|
|
|||||||
| Past-due loans 90 days and still accruing |
$ | 4,068 | $ | 2,597 | $ | 11,204 | ||||||
| United States: |
||||||||||||
| Non-performing loans held for investment: |
||||||||||||
| Residential mortgage |
$ | 14,486 | $ | 16,360 | $ | 29,143 | ||||||
| Commercial mortgage |
31,014 | 44,405 | 56,614 | |||||||||
| Commercial and Industrial |
1,200 | 1,200 | 1,706 | |||||||||
| Construction |
6,159 | 6,294 | 1,950 | |||||||||
| Consumer |
2,360 | 2,064 | 656 | |||||||||
|
|
|
|
|
|
|
|||||||
| Total non-performing loans held for investment |
55,219 | 70,323 | 90,069 | |||||||||
|
|
|
|
|
|
|
|||||||
| REO |
15,821 | 12,482 | 21,304 | |||||||||
| Other repossessed property |
20 | 18 | 42 | |||||||||
|
|
|
|
|
|
|
|||||||
| Total non-performing assets, excluding loans held for sale |
$ | 71,060 | $ | 82,823 | $ | 111,415 | ||||||
| Non-performing loans held for sale |
— | — | — | |||||||||
|
|
|
|
|
|
|
|||||||
| Total non-performing assets, including loans held for sale |
$ | 71,060 | $ | 82,823 | $ | 111,415 | ||||||
|
|
|
|
|
|
|
|||||||
| Past-due loans 90 days and still accruing |
$ | 656 | $ | — | $ | 724 | ||||||
| (1) | Amount excludes purchased credit impaired loans with a carrying value as of December 31, 2012 of approximately $10.6 million acquired as part of the credit card portfolio acquired from FIA. |
First BanCorp. Announces Earnings for the Quarter and Year Ended December 31, 2012 – Page 30 of 30
Table 11 – Allowance for Loan and Lease Losses
| Quarter Ended | Year Ended | |||||||||||||||||||
| (Dollars in thousands) | December 31, | September 30, | December 31, | December 31, | December 31, | |||||||||||||||
| 2012 | 2012 | 2011 | 2012 | 2011 | ||||||||||||||||
| Allowance for loan and lease losses, beginning of period |
$ | 445,531 | $ | 457,153 | $ | 519,687 | $ | 493,917 | $ | 553,025 | ||||||||||
|
|
|
|
|
|
|
|
|
|
|
|||||||||||
| Provision (recovery) for loan and lease losses: |
||||||||||||||||||||
| Residential mortgage |
8,744 | 9,083 | 8,423 | 36,531 | 45,339 | |||||||||||||||
| Commercial mortgage |
4,119 | (6,617 | ) | 21,746 | (778 | ) | 54,513 | |||||||||||||
| Commercial and Industrial |
8,071 | 8,117 | 5,302 | 38,773 | 78,711 | |||||||||||||||
| Construction |
(2,474 | ) | 6,379 | (1,096 | ) | 10,955 | 40,174 | |||||||||||||
| Consumer and finance leases |
12,006 | 11,990 | 7,612 | 35,018 | 17,612 | |||||||||||||||
|
|
|
|
|
|
|
|
|
|
|
|||||||||||
| Total provision for loan and lease losses |
30,466 | 28,952 | 41,987 | 120,499 | 236,349 | |||||||||||||||
|
|
|
|
|
|
|
|
|
|
|
|||||||||||
| Loans net charge-offs: |
||||||||||||||||||||
| Residential mortgage |
(9,555 | ) | (7,358 | ) | (9,077 | ) | (36,855 | ) | (38,991 | ) | ||||||||||
| Commercial mortgage |
(6,101 | ) | (5,002 | ) | (13,555 | ) | (20,968 | ) | (51,118 | ) | ||||||||||
| Commercial and Industrial |
(12,601 | ) | (12,261 | ) | (17,285 | ) | (45,916 | ) | (66,862 | ) | ||||||||||
| Construction |
(1,837 | ) | (8,326 | ) | (19,492 | ) | (40,741 | ) | (100,760 | ) | ||||||||||
| Consumer and finance leases |
(10,489 | ) | (7,627 | ) | (8,348 | ) | (34,522 | ) | (37,726 | ) | ||||||||||
|
|
|
|
|
|
|
|
|
|
|
|||||||||||
| Net charge-offs |
(40,583 | ) | (40,574 | ) | (67,757 | ) | (179,002 | ) | (295,457 | ) | ||||||||||
|
|
|
|
|
|
|
|
|
|
|
|||||||||||
| Allowance for loan and lease losses, end of period |
$ | 435,414 | $ | 445,531 | $ | 493,917 | $ | 435,414 | $ | 493,917 | ||||||||||
|
|
|
|
|
|
|
|
|
|
|
|||||||||||
| Allowance for loan and lease losses to period end total loans held for investment |
4.33 | % | 4.37 | % | 4.68 | % | 4.33 | % | 4.68 | % | ||||||||||
| Net charge-offs (annualized) to average loans outstanding during the period |
1.59 | % | 1.58 | % | 2.55 | % | 1.74 | % | 2.68 | % | ||||||||||
| Provision for loan and lease losses to net charge-offs during the period |
0.75x | 0.71x | 0.62x | 0.67x | 0.80x | |||||||||||||||
Table 12 – Net Charge-Offs to Average Loans
| Year ended | ||||||||||||||||||||
| December 31, | December 31, | December 31, | December 31, | December 31, | ||||||||||||||||
| 2012 | 2011 | 2010 | 2009 | 2008 | ||||||||||||||||
| Residential mortgage |
1.32 | % | 1.32 | % | 1.80 | %(4) | 0.82 | % | 0.19 | % | ||||||||||
| Commercial mortgage |
1.41 | %(1) | 3.21 | % | 5.02 | %(5) | 1.64 | % | 0.27 | % | ||||||||||
| Commercial and Industrial |
1.21 | %(2) | 1.57 | % | 2.16 | %(6) | 0.72 | % | 0.59 | % | ||||||||||
| Construction |
10.49 | % | 16.33 | % | 23.80 | %(7) | 11.54 | % | 0.52 | % | ||||||||||
| Consumer and finance leases |
1.92 | % | 2.33 | % | 2.98 | % | 3.05 | % | 3.19 | % | ||||||||||
| Total loans |
1.74 | %(3) | 2.68 | % | 4.76 | %(8) | 2.48 | % | 0.87 | % | ||||||||||
| (1) | Includes net charge-offs totaling $1.4 million associated with loans transferred to held for sale in the fourth quarter of 2012. Commercial mortgage net charge-offs to average loans, excluding charge-offs associated with loans transferred to held for sale, was 1.32%. |
| (2) | Includes net charge-offs totaling $1.2 million associated with loans transferred to held for sale in the fourth quarter of 2012. Commercial and Industrial net charge-offs to average loans, excluding charge-offs associated with loans transferred to held for sale, was 1.18%. |
| (3) | Includes net charge-offs totaling $2.6 million associated with loans transferred to held for sale in the fourth quarter of 2012. Total net charge-offs to average loans, excluding charge-offs associated with loans transferred to held for sale, was 1.72%. |
| (4) | Includes net charge-offs totaling $7.8 million associated with non-performing residential mortgage loans sold in a bulk sale. |
| (5) | Includes net charge-offs totaling $29.5 million associated with loans transferred to held for sale in the fourth quarter of 2010. Commercial mortgage net charge-offs to average loans, excluding charge-offs associated with loans transferred to held for sale, was 3.38%. |
| (6) | Includes net charge-offs totaling $8.6 million associated with loans transferred to held for sale in the fourth quarter of 2010. Commercial and Industrial net charge-offs to average loans, excluding charge-offs associated with loans transferred to held for sale, was 1.98%. |
| (7) | Includes net charge-offs totaling $127.0 million associated with loans transferred to held for sale in the fourth quarter of 2010. Construction net charge-offs to average loans, excluding charge-offs associated with loans transferred to held for sale, was 18.93%. |
| (8) | Includes net charge-offs totaling $165.1 million associated with loans transferred to held for sale in the fourth quarter of 2010. Total net charge-offs to average loans, excluding charge-offs associated with loans transferred to held for sale, was 3.60%. |
###