Exhibit 99.1
First
BanCorp. Announces Results for the Quarter Ended June 30, 2015
2015
Second Quarter Highlights and Comparison with First Quarter
-
Net
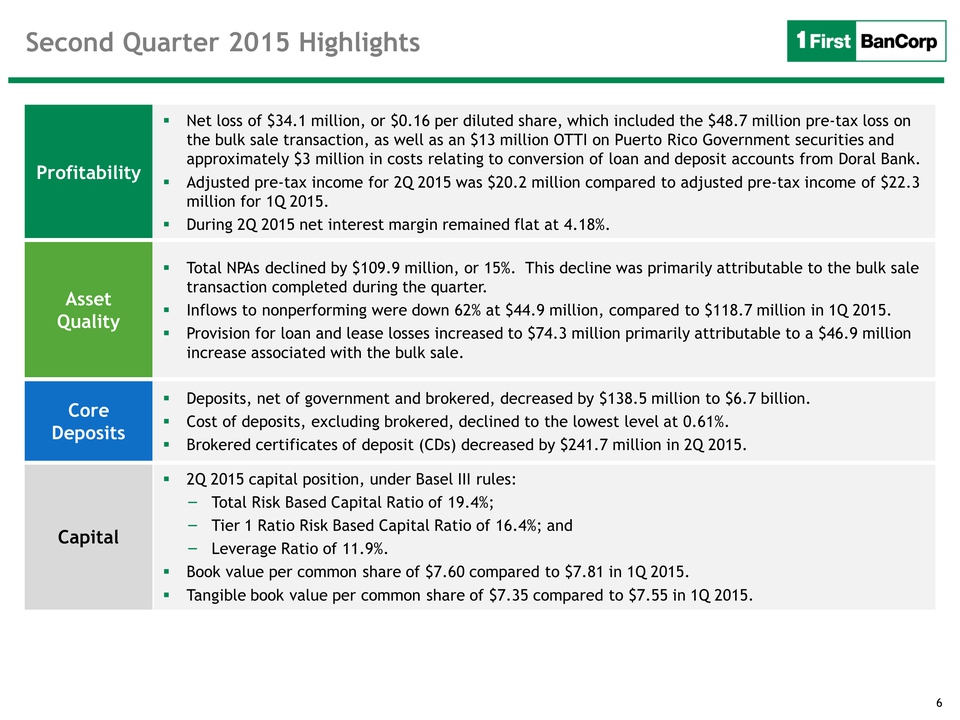
loss of $34.1 million, or $0.16 per diluted share, compared to net
income of $25.6 million, or $0.12 per diluted share, for the first
quarter of 2015. The net loss for the second quarter includes:
-
A
$48.7 million pre-tax loss on a bulk sale of assets, mostly
comprised of non-performing and adversely classified commercial
loans, including transaction expenses.
-
A
$12.9 million other-than-temporary impairment on Puerto Rico
Government securities.
-
Pre-tax
costs of $2.6 million related to the conversion of loan and
deposit accounts acquired from Doral Bank (“Doral”) to the First
Bank systems completed in the second quarter.
-
Adjusted
pre-tax income of $20.2 million, excluding the aforementioned items,
compared to adjusted pre-tax income of $22.3 million for the first
quarter of 2015. Adjusted pre-tax income for the first quarter of 2015
excludes a $13.4 million pre-tax bargain purchase gain on assets
acquired and liabilities assumed from Doral and $2.1 million of
pre-tax related acquisition and conversion costs.
-
As
previously announced, the Corporation completed the bulk sale of a
commercial loan portfolio with a book value of $147.5 million
(principal balance of $196.5 million), comprised mostly of
non-performing and adversely classified loans, as well as other real
estate owned (“OREO”) with a book value of $2.9 million, for $87.3
million in a cash transaction.
-
Adjusted
pre-tax, pre-provision income of $47.7 million, compared to $55.4
million for the first quarter of 2015.
-
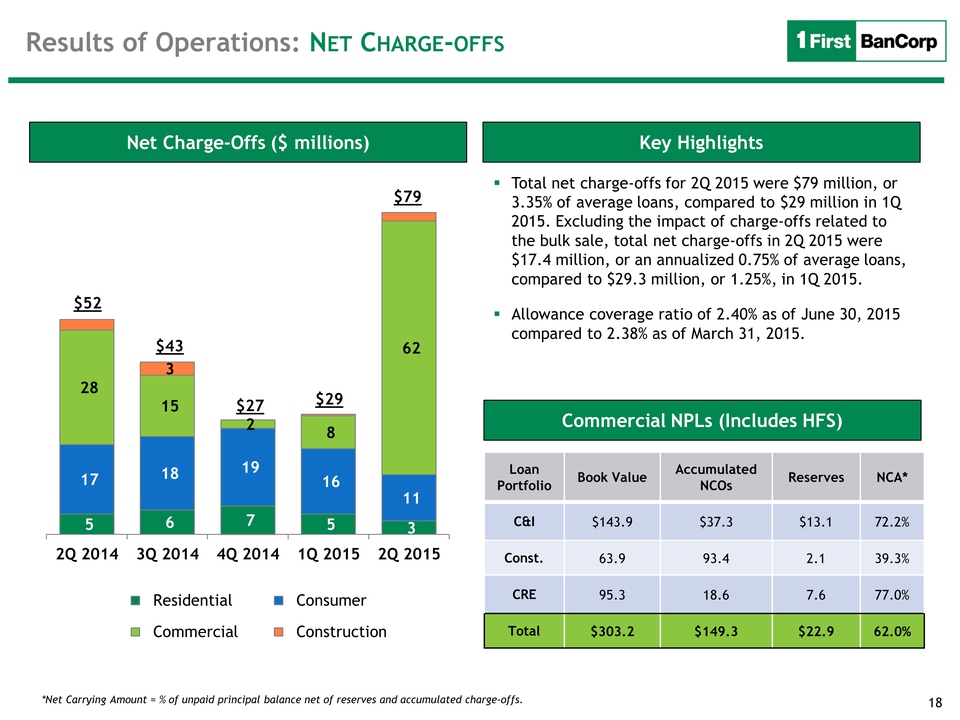
Net
interest income increased by $0.8 million to $126.5 million and the
net interest margin remained unchanged at 4.18%.
-
Provision
for loan and lease losses of $74.3 million, including a $46.9 million
charge associated with the bulk sale of assets transaction, compared
to $33.0 million for the first quarter of 2015.
-
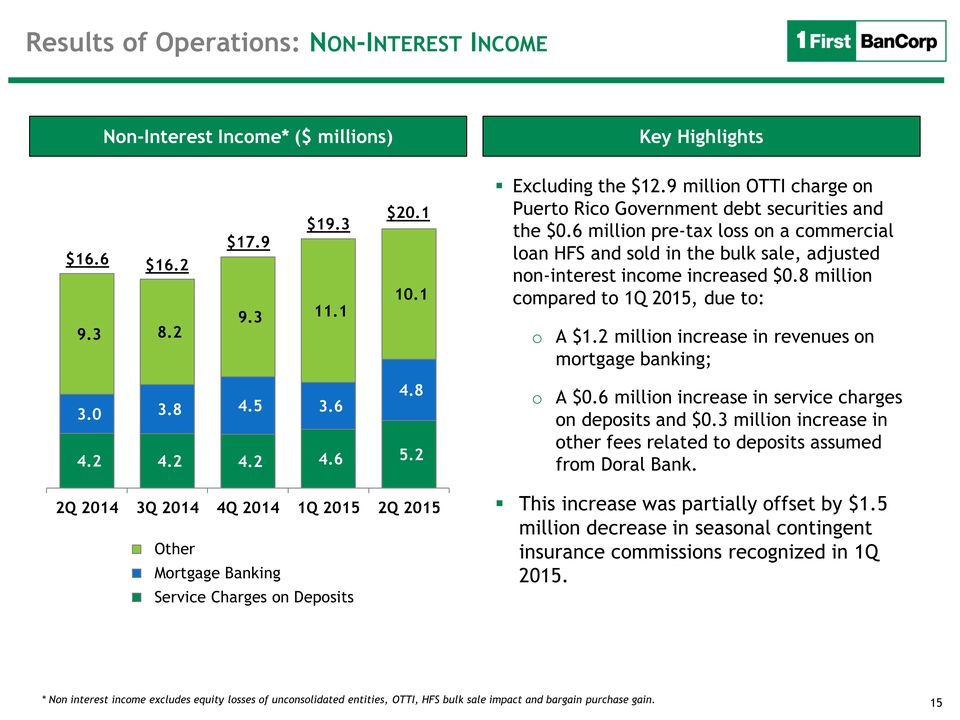
Adjusted
non-interest income increased by $0.8 million to $20.1 million for the
quarter, compared to $19.3 million for the first quarter of 2015. The
improvement was primarily due to an increase in revenues from the
mortgage banking business and the full quarter contribution of service
charges on deposits and fees associated with deposits assumed from
Doral in late February 2015.
-
Adjusted
non-interest expenses for the quarter increased by $9.4 million to
$99.1 million compared to $89.6 million for the first quarter of 2015.
The increase reflects, among other things, the full quarter impact of
interim servicing costs and other recurring operating expenses related
to Doral branches acquired, and an increase in OREO losses, employees’
compensation, and professional service fees.
-
Income
tax benefit of $9.8 million, compared to income tax expense of $8.0
million for the first quarter of 2015.
-
Credit
quality variances:
-
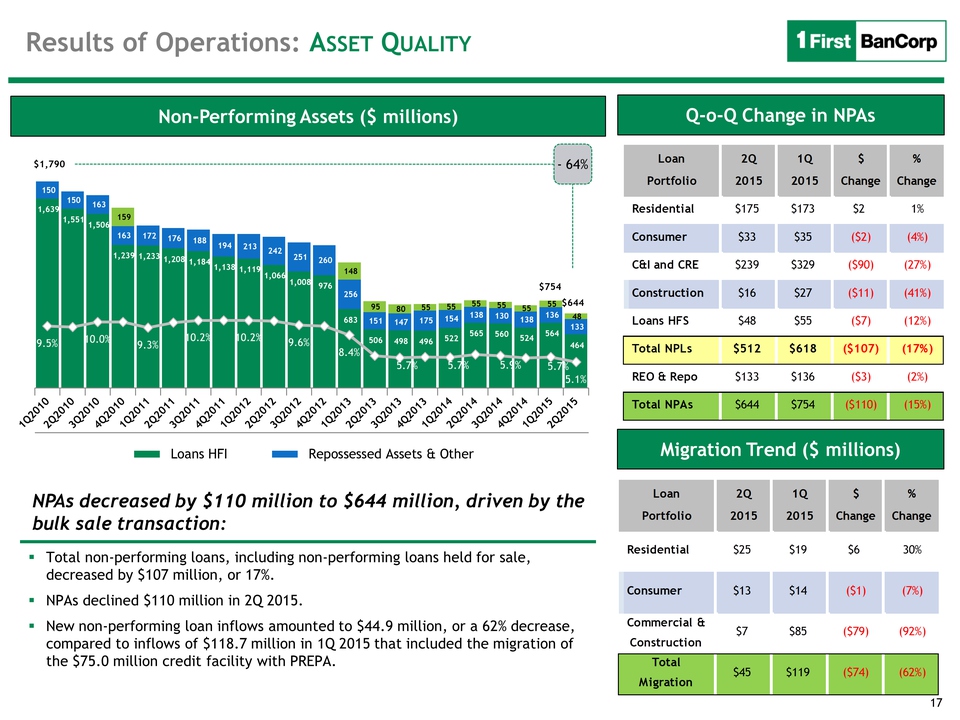
Non-performing
assets decreased in the quarter by $109.9 million, or 15%, to
$644.4 million, primarily attributable to the bulk sale of assets
that included $91.9 million of non-performing commercial and
construction loans and $2.9 million of OREO. Excluding the impact
of the bulk sale, non-performing assets decreased by $15.2 million.
-
New
non-performing loan inflows amounted to $44.9 million, or a 62%
decrease, compared to inflows of $118.7 million in the first
quarter of 2015 that included the migration of the $75.0 million
credit facility with the Puerto Rico Electric Power Authority
(“PREPA”).
-
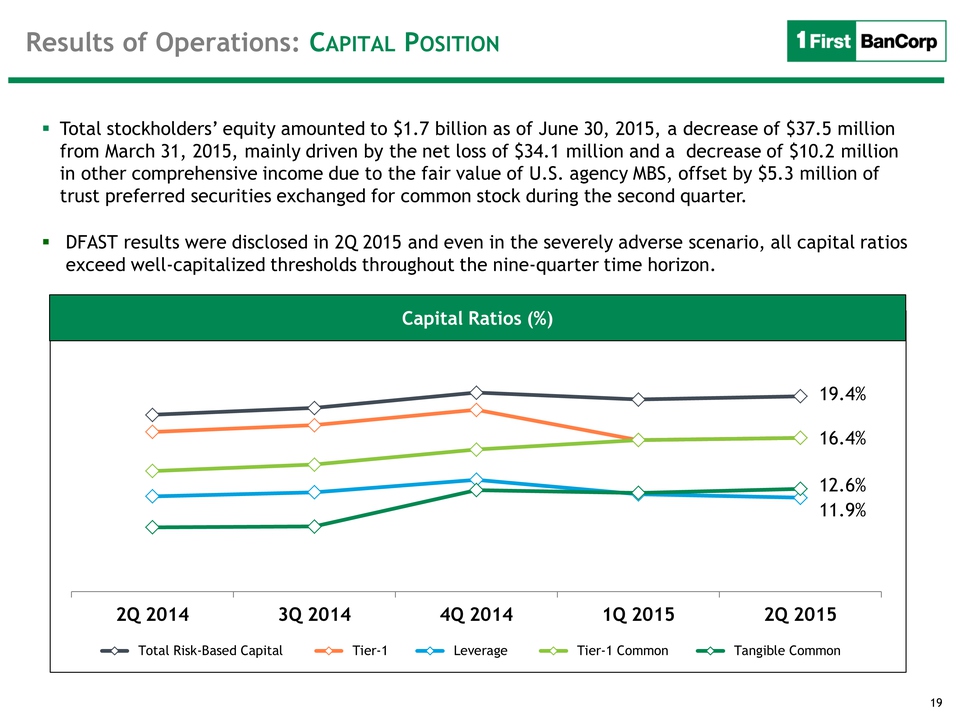
Total
capital, common equity Tier 1 capital, Tier 1 capital, and leverage
ratios calculated under the transition provisions of Basel III rules
of 19.44%, 16.37%, 16.37%, and 11.94%, respectively, as of June 30,
2015. Tangible common equity ratio of 12.61% as of June 30, 2015.
-
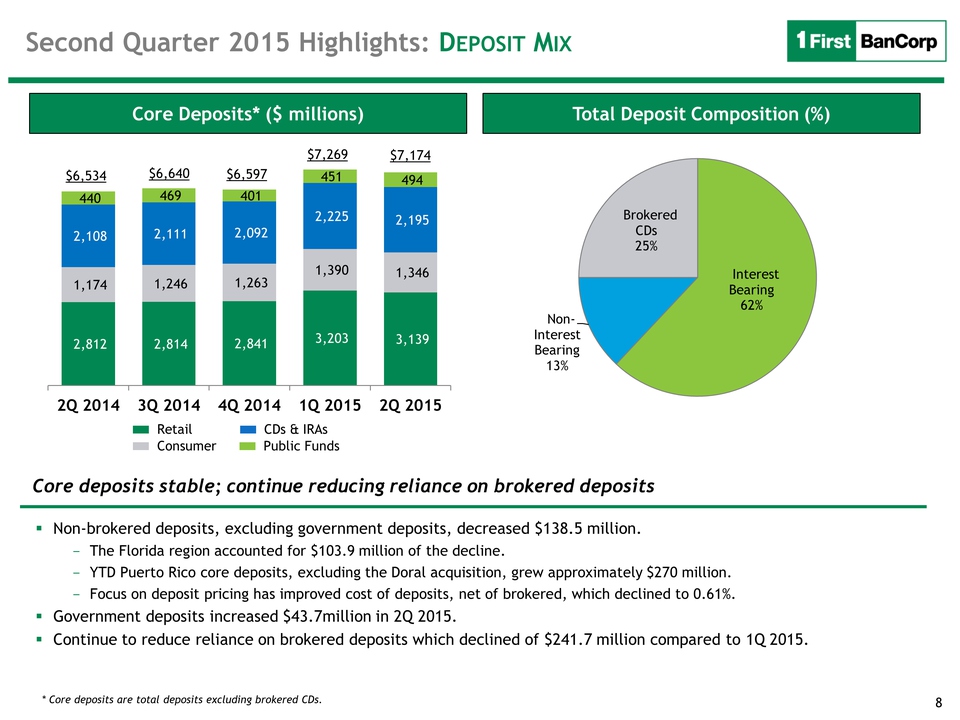
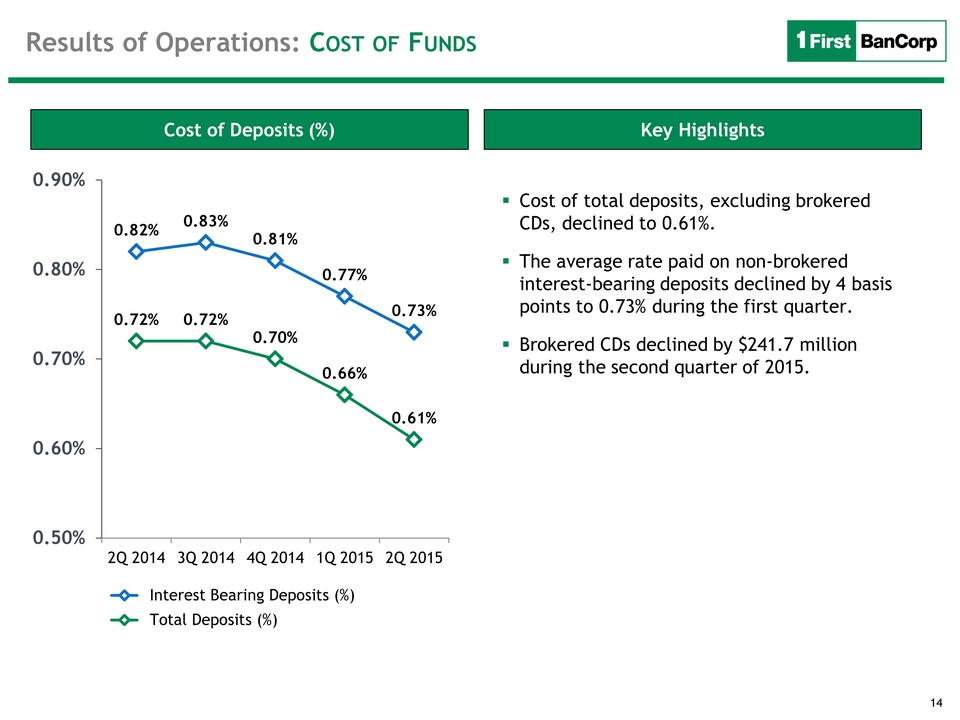
Total
deposits, excluding brokered certificates of deposits and government
deposits, down $138.5 million to $6.7 billion as of June 30, 2015, a
decrease primarily reflected in the Florida region.
-
Brokered
certificates of deposit decreased in the quarter by $241.7 million to
$2.3 billion as of June 30, 2015.
-
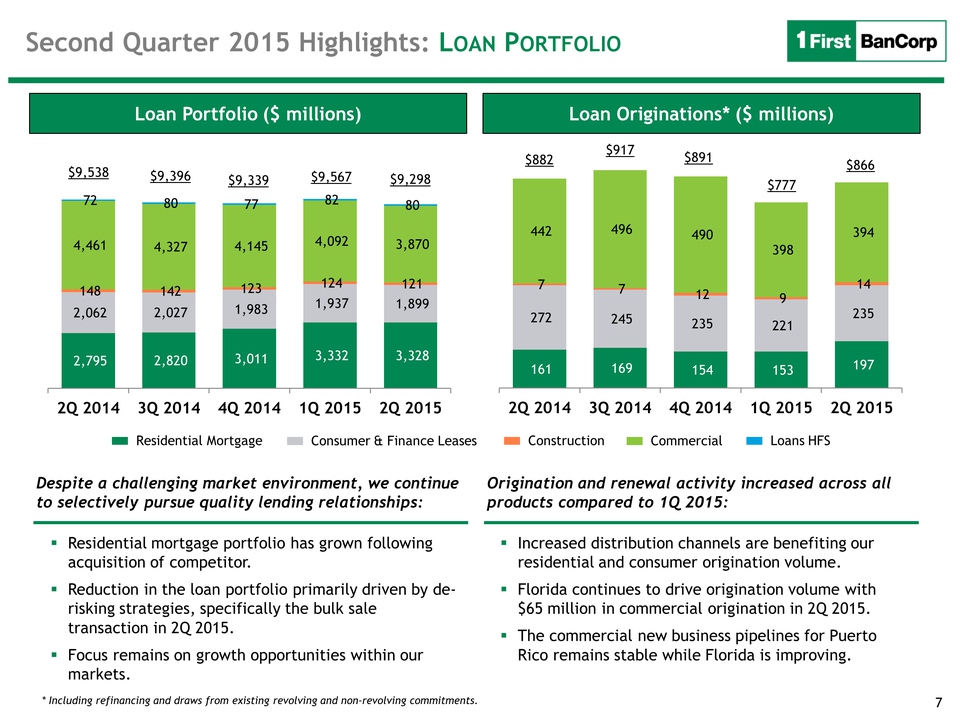
Total
loans decreased in the quarter by $269.4 million to $9.3 billion as of
June 30, 2015. Commercial and construction loans decreased by $232.0
million, mainly due to the $147.5 million of loans included in the
bulk sale of assets, and consumer loans decreased by $38.0 million.
-
Total
loan originations, including refinancings, renewals and draws from
existing commitments (excluding credit card utilization activity), of
$767.0 million for the second quarter of 2015, compared to $688.9
million for the first quarter of 2015, an increase primarily related
to commercial loan originations in the Florida region and an increased
volume of residential mortgage loan originations in both the Puerto
Rico and Florida regions.
-
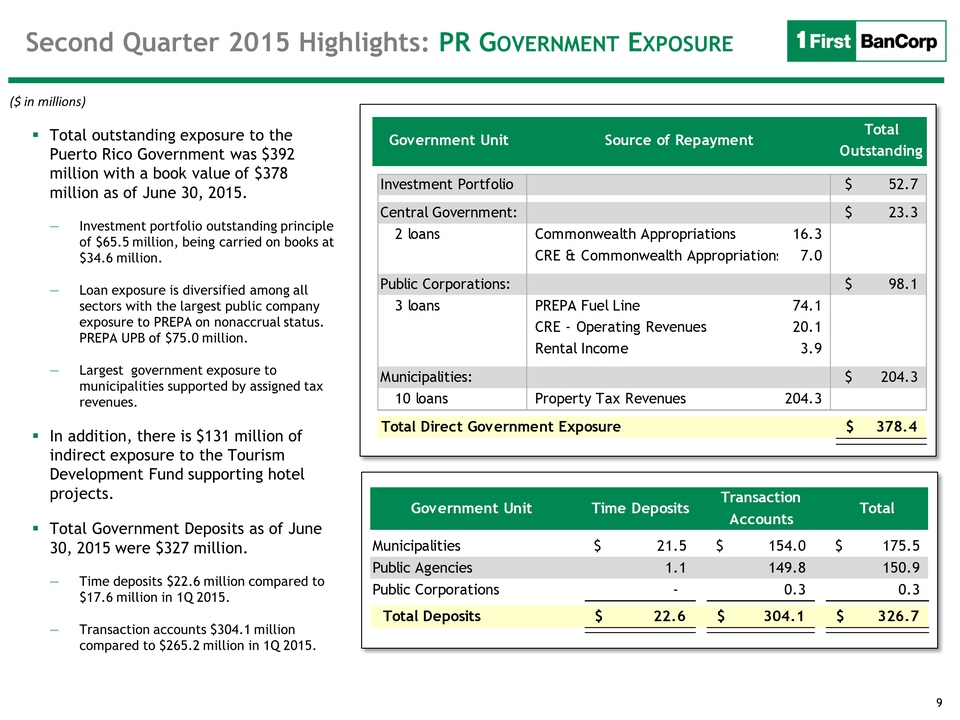
As of
June 30, 2015, the Corporation has $378.5 million of exposure to loans
and obligations of the Commonwealth of Puerto Rico central government
and instrumentalities, of which $204.3 million, or 53%, represents
exposure to municipalities.
SAN JUAN, Puerto Rico--(BUSINESS WIRE)--July 29, 2015--First BanCorp.
(the “Corporation”) (NYSE: FBP), the bank holding company for FirstBank
Puerto Rico (“FirstBank” or “the Bank”), today reported a net loss of
$34.1 million for the second quarter of 2015, or $0.16 per diluted
share, compared to net income of $25.6 million, or $0.12 per diluted
share, for the first quarter of 2015 and net income of $21.2 million, or
$0.11 per diluted share, for the second quarter of 2014.
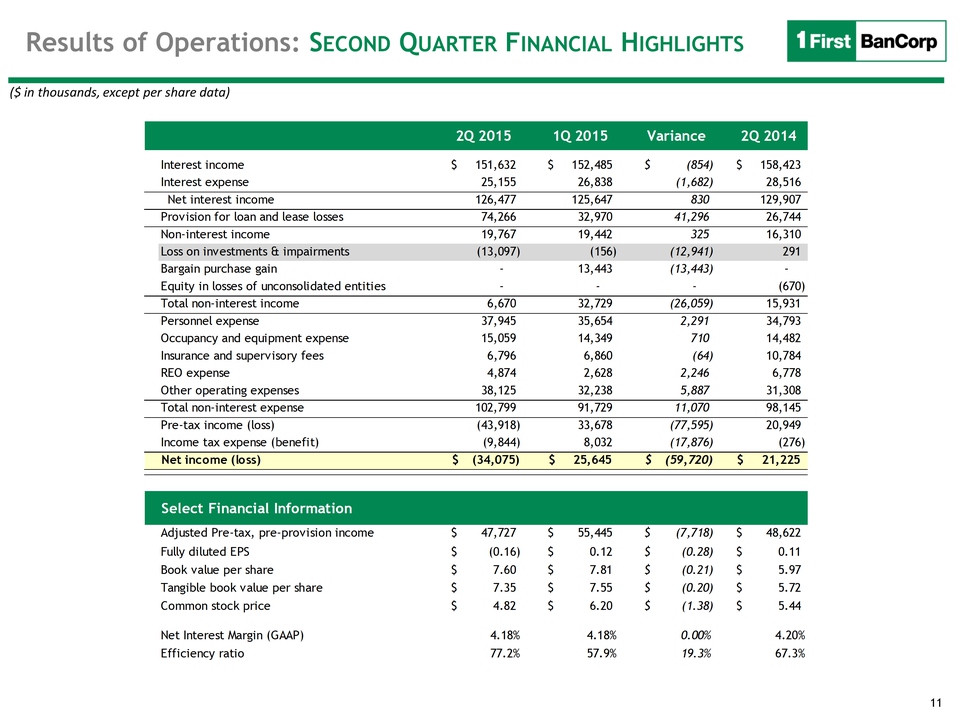
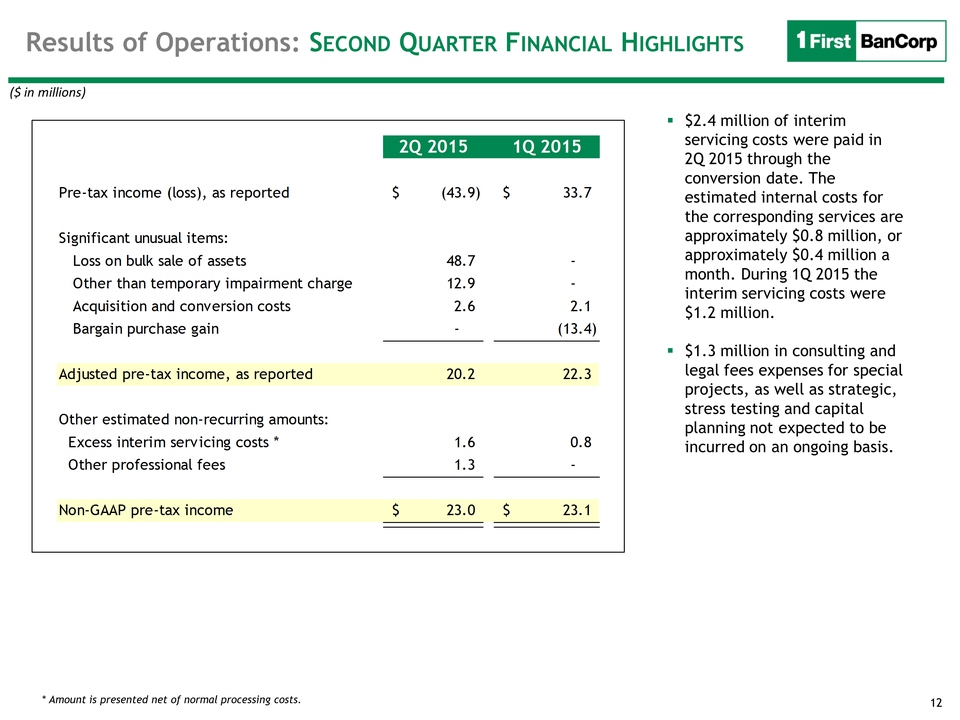
For the second quarter of 2015, the pre-tax loss was $43.9 million
compared to pre-tax income of $33.7 million for the first quarter of
2015 and pre-tax income of $20.9 million for the second quarter of 2014.
The pre-tax loss for the second quarter of 2015 includes:
-
A $48.7 million pre-tax loss on a bulk sale of assets, mostly
comprised of non-performing and adversely classified commercial loans,
including transaction expenses.
-
A $12.9 million other-than-temporary impairment on Puerto Rico
Government securities.
-
Pre-tax costs of $2.6 million related to the conversion of loan and
deposit accounts acquired from Doral to the FirstBank systems
completed in the second quarter.
Adjusted pre-tax income for the second quarter of 2015 was $20.2
million, excluding the aforementioned items, compared to adjusted
pre-tax income of $22.3 million for the first quarter of 2015, excluding
the $13.4 million pre-tax bargain purchase gain on assets acquired and
liabilities assumed from Doral and the $2.1 million of pre-tax
acquisition and conversion costs incurred in the first quarter.
Aurelio Alemán, President and Chief Executive Officer of First BanCorp.,
commented: “Throughout the quarter we updated the market on several
important accomplishments: our consent order which had been in place
with the FDIC for five years was lifted; and, we executed an accelerated
de-risking transaction that improved our asset quality metrics to levels
we have not seen since 2009. We also posted our results for the
Dodd-Frank Act Stress Test which show that even in a severely adverse
economic environment, which we are not currently in, our capital ratios
exceed the well-capitalized thresholds throughout the nine-quarter
horizon. In addition, during the quarter we successfully completed the
integration and rebranding of the acquired Doral branches and mortgage
portfolio.
We posted a net loss for the quarter of $34.1 million due largely to the
bulk sale transaction. Our profitability was also impacted this quarter
by an OTTI charge of $12.9 million that we took on our government
securities. Our deposit base remains stable and our cost of deposits are
at their lowest level in recent years, our loan originations improved
and delinquencies are stable across all of our portfolios.
The Puerto Rico economic situation continues to face hurdles, we know
how to operate in an adverse economy and have been doing so for years.
We are prepared to manage through more challenging economic conditions
and as our stress tests reflect we have the capital strength and market
position to not only do so but to take advantage of opportunities that
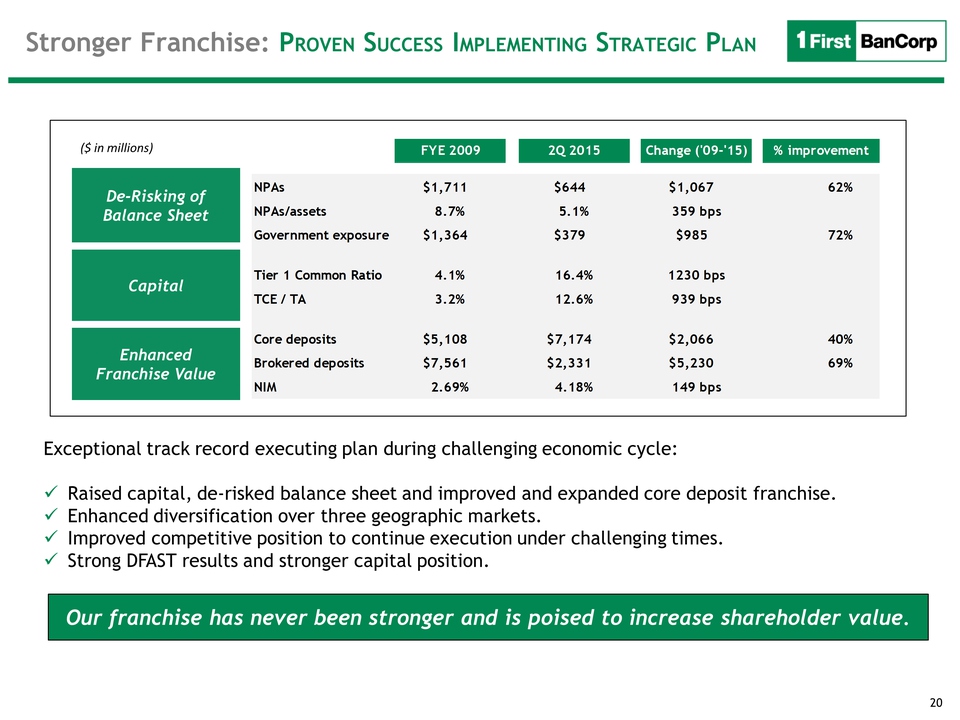
also appear in challenging times. The reality is that the franchise has
never been stronger and poised to increase shareholder value. We
encourage our government officials to work together with the private
industry and provide more clarity to the market in order to remove
uncertainty and avoid further economic deterioration.
That said, we have a plan and we are well-prepared to execute. The
successful integration of our recent acquisition and de-risking will
drive bottom line results in the quarters to come.”
This press release includes certain non-GAAP financial measures,
including adjusted pre-tax income, adjusted non-interest income,
adjusted non-interest expenses, adjusted pre-tax, pre-provision income,
adjusted net interest income and margin, certain capital ratios, and
certain other financial measures that exclude the effect of the bulk
sale of assets, the other-than-temporary impairment on Puerto Rico
Government debt securities, and the bargain purchase gain and
acquisition and conversion costs related to the Doral transaction, and
should be read in conjunction with the accompanying tables (Exhibit A),
which are an integral part of this press release.
RECENT EVENTS
Bulk Sale of Assets
As previously announced, during the second quarter of 2015 the
Corporation completed the sale of commercial and construction loans with
a book value of $147.5 million (principal balance of $196.5 million),
comprised mostly of non-performing and adversely classified loans, as
well as OREO with a book value of $2.9 million, in a cash transaction.
The sale price of this bulk sale was $87.3 million. Approximately $15.3
million of reserves had been allocated to the loans. This transaction
resulted in total charge-offs of $61.4 million and an incremental
pre-tax loss of $48.7 million, including $0.9 million in professional
service fees directly attributable to the bulk sale.
The inclusion of the $61.4 million of charge-offs from the bulk sale in
the historical loss rates had an impact of approximately $15.5 million
on the general reserve for loan losses determined for loans collectively
evaluated for impairment.
Doral Bank Transaction
During the second quarter of 2015, the Corporation successfully
completed the system conversion of loan and deposit accounts acquired
from Doral to the FirstBank systems and recorded approximately $2.6
million of pre-tax conversion costs in the second quarter compared to
$2.1 million in the first quarter of 2015. In addition, the Corporation
incurred approximately $2.4 million in interim servicing costs in the
second quarter compared to $1.2 million in the first quarter of 2015. As
previously reported, the Corporation recorded in the first quarter of
2015 a $13.4 million pre-tax bargain purchase gain in connection with
assets acquired and liabilities assumed from Doral.
Other-Than-Temporary Impairment on Puerto Rico Government Obligations
During the second quarter of 2015, the Corporation recorded a $12.9
million other-than-temporary impairment (“OTTI”) on three Puerto Rico
Government debt securities held by the Corporation as part of its
available for sale securities portfolio, specifically bonds of the
Government Development Bank for Puerto Rico and the Puerto Rico Public
Buildings Authority. The credit-related impairment loss estimate is
based on the probability of default and loss severity in the event of
default in consideration of the debt securities credit ratings and the
latest available information about the Puerto Rico Government’s
financial condition, including the Puerto Rico Government’s intentions
to restructure its outstanding bond obligations. Given the significant
uncertainty of a debt restructuring process, the Corporation cannot be
certain that future impairment charges will not be required on these
securities. As of June 30, 2015, the Corporation owns Puerto Rico
Government debt securities in the aggregate amount of $52.7 million (net
of the $12.9 million OTTI), carried on its books at a fair value of
$34.6 million.
The following table shows a reconciliation of certain non-GAAP financial
measures (“adjusted net charge-offs,” “adjusted provision for loan and
lease losses,” “adjusted non-interest income,” “adjusted non-interest
expenses,” and “adjusted pre-tax income”), which reflect the exclusion
of the realized loss on the bulk sale of assets, the OTTI charge on
Puerto Rico Government debt securities, system conversion costs related
to the Doral transaction and the bargain purchase gain, to the
corresponding measures calculated and presented in accordance with GAAP.
NON-GAAP RECONCILIATION
|
(Dollars in thousands)
|
|
|
|
|
|
|
|
|
|
|
|
Second Quarter of 2015
|
|
As Reported (GAAP)
|
|
Bulk Sale
Transaction Impact
|
|
Acquisition and
Conversion Costs
|
|
OTTI on Puerto Rico
Government Debt
Securities
|
|
Excluding Bulk Sale
Transaction, acquisition
and
conversion costs and
OTTI on Puerto Rico
Government
Debt
Securities (Non-GAAP)
|
|
|
|
|
|
|
|
|
|
|
|
|
|
Total net charge-offs (1)
|
|
$
|
78,812
|
|
|
$
|
61,435
|
|
|
$
|
-
|
|
$
|
-
|
|
$
|
17,377
|
|
|
Total net charge-offs to average loans
|
|
|
3.35
|
%
|
|
|
|
|
|
|
|
|
0.75
|
%
|
|
Commercial mortgage
|
|
|
41,665
|
|
|
|
37,590
|
|
|
|
-
|
|
|
-
|
|
|
4,075
|
|
|
Commercial mortgage loans net charge-offs to average loans
|
|
|
10.37
|
%
|
|
|
|
|
|
|
|
|
1.06
|
%
|
|
Commercial and Industrial
|
|
|
20,417
|
|
|
|
20,570
|
|
|
|
-
|
|
|
-
|
|
|
(153
|
)
|
|
Commercial and Industrial loans net charge-offs (recoveries) to
average loans
|
|
|
3.41
|
%
|
|
|
|
|
|
|
|
|
-0.03
|
%
|
|
Construction
|
|
|
2,083
|
|
|
|
3,275
|
|
|
|
-
|
|
|
-
|
|
|
(1,192
|
)
|
|
Construction loans net charge-offs (recoveries) to average loans
|
|
|
4.90
|
%
|
|
|
|
|
|
|
|
|
-2.94
|
%
|
|
|
|
|
|
|
|
|
|
|
|
|
|
Provision for loan and lease losses
|
|
$
|
74,266
|
|
|
$
|
46,947
|
|
|
$
|
-
|
|
$
|
-
|
|
$
|
27,319
|
|
|
|
|
|
|
|
|
|
|
|
|
|
|
Non-interest income
|
|
$
|
6,670
|
|
|
$
|
552
|
|
|
$
|
-
|
|
$
|
12,856
|
|
$
|
20,078
|
|
|
Net (loss) gain on investments and impairments
|
|
|
(13,097
|
)
|
|
|
-
|
|
|
|
-
|
|
|
12,856
|
|
|
(241
|
)
|
|
Other non-interest income
|
|
|
9,785
|
|
|
|
552
|
|
|
|
-
|
|
|
-
|
|
|
10,337
|
|
|
|
|
|
|
|
|
|
|
|
|
|
|
Non-interest expenses
|
|
$
|
102,799
|
|
|
$
|
1,168
|
|
|
$
|
2,562
|
|
$
|
-
|
|
$
|
99,069
|
|
|
Employees' compensation and benefits
|
|
|
37,945
|
|
|
|
|
|
104
|
|
|
-
|
|
|
37,841
|
|
|
Professional fees
|
|
|
19,005
|
|
|
|
918
|
|
|
|
1,983
|
|
|
-
|
|
|
16,104
|
|
|
Business promotion
|
|
|
3,934
|
|
|
|
-
|
|
|
|
274
|
|
|
-
|
|
|
3,660
|
|
|
Net loss on OREO operations
|
|
|
4,874
|
|
|
|
250
|
|
|
|
-
|
|
|
-
|
|
|
4,624
|
|
|
Other expenses
|
|
|
12,055
|
|
|
|
-
|
|
|
|
201
|
|
|
-
|
|
|
11,854
|
|
|
|
|
|
|
|
|
|
|
|
|
|
|
Pre-tax (loss) income
|
|
$
|
(43,918
|
)
|
|
$
|
48,667
|
|
|
$
|
2,562
|
|
$
|
12,856
|
|
$
|
20,167
|
|
|
|
|
|
|
|
|
|
|
|
|
|
|
(1) Charge-offs percentages annualized.
|
|
|
|
|
|
|
|
|
|
|
|
|
|
(Dollars in thousands)
|
|
|
|
|
|
|
|
|
|
|
|
|
|
|
|
|
|
|
|
|
|
|
|
First Quarter of 2015
|
|
As Reported (GAAP)
|
|
Bargain Purchase
Gain
|
|
Acquisition and
Conversion Costs
|
|
OTTI on Puerto Rico
Government Debt
Securities
|
|
Excluding Bargain
Purchase Gain and
acquisition
and
conversion costs
(Non-GAAP)
|
|
|
|
|
|
|
|
|
|
|
|
|
|
|
|
|
|
|
|
|
|
|
|
|
|
Non-interest income
|
|
$
|
32,729
|
|
|
$
|
(13,443
|
)
|
|
$
|
-
|
|
$
|
-
|
|
$
|
19,286
|
|
|
Bargain Purchase Gain
|
|
|
13,443
|
|
|
|
(13,443
|
)
|
|
|
-
|
|
|
-
|
|
|
-
|
|
|
|
|
|
|
|
|
|
|
|
|
|
|
Non-interest expenses
|
|
$
|
91,728
|
|
|
$
|
-
|
|
|
$
|
2,084
|
|
$
|
-
|
|
$
|
89,644
|
|
|
Occupancy and equipment
|
|
|
14,349
|
|
|
|
-
|
|
|
|
118
|
|
|
-
|
|
|
14,231
|
|
|
Professional fees
|
|
|
15,218
|
|
|
|
-
|
|
|
|
1,726
|
|
|
-
|
|
|
13,492
|
|
|
Business promotion
|
|
|
2,868
|
|
|
|
-
|
|
|
|
163
|
|
|
-
|
|
|
2,705
|
|
|
Other expenses
|
|
|
11,150
|
|
|
|
-
|
|
|
|
77
|
|
|
-
|
|
|
11,073
|
|
|
|
|
|
|
|
|
|
|
|
|
|
|
Pre-tax income
|
|
$
|
33,678
|
|
|
$
|
(13,443
|
)
|
|
$
|
2,084
|
|
$
|
-
|
|
$
|
22,319
|
|
|
|
|
|
|
|
|
|
|
|
|
|
ADJUSTED PRE-TAX, PRE-PROVISION INCOME TRENDS
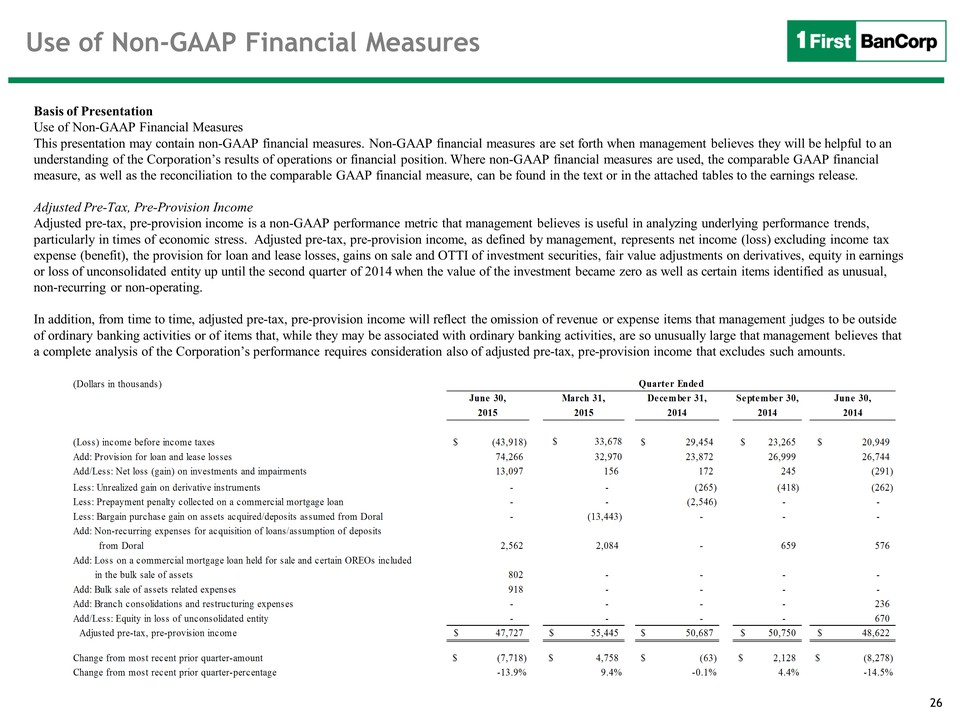
Adjusted pre-tax, pre-provision income is a non-GAAP financial measure
that management believes is useful in analyzing performance. This metric
is earnings adjusted to exclude tax expense, the provision for loan and
lease losses, securities gains or losses and impairments, fair value
adjustments on derivatives and equity in earnings or loss of
unconsolidated entity up until the second quarter of 2014 when the value
of the investment became zero. In addition, from time to time, earnings
are adjusted also for items judged by management to be outside of
ordinary banking activities and/or for items that, while they may be
associated with ordinary banking activities, are so unusually large that
management believes that a complete analysis of the Corporation’s
performance requires consideration also of results that exclude such
amounts (for additional information about this non-GAAP financial
measure, see “Adjusted Pre-Tax, Pre-Provision Income” in “Basis
of Presentation”).
The following table reconciles income before income taxes to adjusted
pre-tax, pre-provision income for the last five quarters including
adjusted pre-tax, pre-provision income of $47.7 million in the second
quarter of 2015, down $7.7 million from the prior quarter:
|
|
|
|
|
|
|
|
|
|
|
|
|
(Dollars in thousands)
|
|
Quarter Ended
|
|
|
|
June 30,
|
|
March 31,
|
|
December 31,
|
|
September 30,
|
|
June 30,
|
|
|
|
2015
|
|
2015
|
|
2014
|
|
2014
|
|
2014
|
|
|
|
|
|
|
|
|
|
|
|
|
|
(Loss) income before income taxes
|
|
$
|
(43,918
|
)
|
|
$
|
33,678
|
|
|
$
|
29,454
|
|
|
$
|
23,265
|
|
|
$
|
20,949
|
|
|
Add: Provision for loan and lease losses
|
|
|
74,266
|
|
|
|
32,970
|
|
|
|
23,872
|
|
|
|
26,999
|
|
|
|
26,744
|
|
|
Add/Less: Net loss (gain) on investments and impairments
|
|
|
13,097
|
|
|
|
156
|
|
|
|
172
|
|
|
|
245
|
|
|
|
(291
|
)
|
|
|
|
|
|
|
|
|
|
|
|
|
|
Less: Unrealized gain on derivative instruments
|
|
|
-
|
|
|
|
-
|
|
|
|
(265
|
)
|
|
|
(418
|
)
|
|
|
(262
|
)
|
|
Less: Prepayment penalty collected on a commercial mortgage loan
|
|
|
-
|
|
|
|
-
|
|
|
|
(2,546
|
)
|
|
|
-
|
|
|
|
-
|
|
|
Less: Bargain purchase gain on assets acquired/deposits assumed from
Doral
|
|
|
-
|
|
|
|
(13,443
|
)
|
|
|
-
|
|
|
|
-
|
|
|
|
-
|
|
|
Add: Non-recurring expenses for acquisition of loans/assumption of
deposits from Doral
|
|
|
2,562
|
|
|
|
2,084
|
|
|
|
-
|
|
|
|
659
|
|
|
|
576
|
|
|
Add: Loss on a commercial mortgage loan held for sale and certain
OREOs included in the bulk sale of assets
|
|
|
802
|
|
|
|
-
|
|
|
|
-
|
|
|
|
-
|
|
|
|
-
|
|
|
Add: Bulk sale of assets related expenses
|
|
|
918
|
|
|
|
-
|
|
|
|
-
|
|
|
|
-
|
|
|
|
-
|
|
|
Add: Branch consolidations and restructuring expenses
|
|
|
-
|
|
|
|
-
|
|
|
|
-
|
|
|
|
-
|
|
|
|
236
|
|
|
Add/Less: Equity in loss of unconsolidated entity
|
|
|
-
|
|
|
|
-
|
|
|
|
-
|
|
|
|
-
|
|
|
|
670
|
|
|
Adjusted pre-tax, pre-provision income (1)
|
|
$
|
47,727
|
|
|
$
|
55,445
|
|
|
$
|
50,687
|
|
|
$
|
50,750
|
|
|
$
|
48,622
|
|
|
|
|
|
|
|
|
|
|
|
|
|
|
Change from most recent prior quarter-amount
|
|
$
|
(7,718
|
)
|
|
$
|
4,758
|
|
|
$
|
(63
|
)
|
|
$
|
2,128
|
|
|
$
|
(8,278
|
)
|
|
Change from most recent prior quarter-percentage
|
|
|
-13.9
|
%
|
|
|
9.4
|
%
|
|
|
-0.1
|
%
|
|
|
4.4
|
%
|
|
|
-14.5
|
%
|
|
|
|
|
|
|
|
|
|
|
|
|
|
(1) See "Basis of Presentation" for definition.
|
|
|
The decrease in adjusted pre-tax, pre-provision income from the 2015
first quarter primarily reflected:
-
A $9.4 million increase in adjusted non-interest expenses of $99.1
million for the second quarter of 2015, as compared to $89.6 million
for the first quarter of 2015, primarily reflecting the impact of
interim servicing costs and other recurring operating expenses related
to the acquired Doral branches, and an increase in OREO losses,
employees’ compensation, and professional service fees expenses. See Non-Interest
Expenses section below for additional information.
Adjusted non-interest expenses exclude certain costs that were
considered non-recurring such as expenses and losses directly
attributable to the bulk sale of assets in the second quarter of 2015
and acquisition and conversion costs related to the Doral transaction.
See Recent Events-Non-GAAP Reconciliation section above for a
reconciliation of this non-GAAP financial measure to the corresponding
GAAP measure.
Partially offset by:
-
A $0.8 million increase in adjusted non-interest income of $20.1
million for the second quarter of 2015, as compared to $19.3 million
for the first quarter of 2015, mainly due to an increase in revenues
from the mortgage banking business and the full quarter contribution
of service charges on deposits and fees associated with deposits
assumed from Doral. See Non-Interest Income section below for
additional information.
Adjusted non-interest income excludes the loss on a commercial mortgage
loan held for sale included in the bulk sale of assets completed in the
second quarter of 2015, the bargain purchase gain on assets acquired and
deposits assumed from Doral in the first quarter of 2015 and the OTTI
charge on Puerto Rico Government debt securities. See Recent
Events-Non-GAAP Reconciliation section above for a reconciliation of
this non-GAAP financial measure to the corresponding GAAP measure.
-
A $0.8 million increase in net interest income primarily reflecting
the full quarter contribution of the residential mortgage loan
portfolio acquired from Doral in late February 2015 and a decrease in
interest expense achieved through the reduction in the average balance
of brokered CDs and the benefit from the offsetting accounting for a
reverse repurchase agreement entered into in the second quarter,
partially offset by a higher premium amortization expense on U.S.
agency mortgage-backed securities (“MBS”) and the decrease in interest
income earned on the commercial and consumer loan portfolios. See Net
Interest Income discussion below for additional information.
NET INTEREST INCOME
The following table reconciles net interest income in accordance with
GAAP to net interest income excluding fair value adjustments (unrealized
gains in the table) on derivatives (“valuations”) and the $2.5 million
prepayment penalty collected on a commercial mortgage loan paid off in
the fourth quarter of 2014, and net interest income on a tax-equivalent
basis. Net interest income, excluding valuations and the aforementioned
$2.5 million prepayment penalty, and net interest income on a
tax-equivalent basis are non-GAAP measures. (See “Basis
of Presentation – Net Interest Income, Excluding Valuations and
Prepayment Penalty, and on a Tax-Equivalent Basis” below
for additional information.) The table also reconciles net
interest spread and net interest margin on a GAAP basis to these items
excluding valuations and the prepayment penalty, and on a tax-equivalent
basis.
|
(Dollars in thousands)
|
|
|
|
|
|
|
|
|
|
|
|
|
|
Quarter Ended
|
|
|
|
June 30, 2015
|
|
March 31, 2015
|
|
December 31, 2014
|
|
September 30, 2014
|
|
June 30, 2014
|
|
Net Interest Income
|
|
|
|
|
|
|
|
|
|
|
|
Interest income - GAAP
|
|
$
|
151,632
|
|
|
$
|
152,485
|
|
|
$
|
158,293
|
|
|
$
|
156,662
|
|
|
$
|
158,423
|
|
|
Unrealized gain on
|
|
|
|
|
|
|
|
|
|
|
|
derivative instruments
|
|
|
-
|
|
|
|
-
|
|
|
|
(265
|
)
|
|
|
(418
|
)
|
|
|
(262
|
)
|
|
Interest income excluding valuations
|
|
|
151,632
|
|
|
|
152,485
|
|
|
|
158,028
|
|
|
|
156,244
|
|
|
|
158,161
|
|
|
Prepayment penalty on a commercial mortgage loan tied to an interest
rate swap
|
|
|
-
|
|
|
|
-
|
|
|
|
(2,546
|
)
|
|
|
-
|
|
|
|
-
|
|
|
Interest income excluding valuations and a $2.5 million prepayment
penalty collected
|
|
|
151,632
|
|
|
|
152,485
|
|
|
|
155,482
|
|
|
|
156,244
|
|
|
|
158,161
|
|
|
Tax-equivalent adjustment
|
|
|
4,623
|
|
|
|
4,005
|
|
|
|
3,968
|
|
|
|
3,995
|
|
|
|
5,005
|
|
|
Prepayment penalty collected on a commercial mortgage loan
|
|
|
-
|
|
|
|
-
|
|
|
|
2,546
|
|
|
|
-
|
|
|
|
-
|
|
|
Interest income on a tax-equivalent basis excluding valuations
|
|
|
156,255
|
|
|
|
156,490
|
|
|
|
161,996
|
|
|
|
160,239
|
|
|
|
163,166
|
|
|
|
|
|
|
|
|
|
|
|
|
|
|
Interest expense - GAAP
|
|
|
25,155
|
|
|
|
26,838
|
|
|
|
29,141
|
|
|
|
28,968
|
|
|
|
28,516
|
|
|
|
|
|
|
|
|
|
|
|
|
|
|
Net interest income - GAAP
|
|
$
|
126,477
|
|
|
$
|
125,647
|
|
|
$
|
129,152
|
|
|
$
|
127,694
|
|
|
$
|
129,907
|
|
|
|
|
|
|
|
|
|
|
|
|
|
|
Net interest income excluding valuations and a $2.5 million
prepayment penalty collected
|
|
$
|
126,477
|
|
|
$
|
125,647
|
|
|
$
|
126,341
|
|
|
$
|
127,276
|
|
|
$
|
129,645
|
|
|
|
|
|
|
|
|
|
|
|
|
|
|
Net interest income on a tax-equivalent basis excluding valuations
|
|
$
|
131,100
|
|
|
$
|
129,652
|
|
|
$
|
132,855
|
|
|
$
|
131,271
|
|
|
$
|
134,650
|
|
|
|
|
|
|
|
|
|
|
|
|
|
|
Average Balances
|
|
|
|
|
|
|
|
|
|
|
|
Loans and leases
|
|
$
|
9,409,417
|
|
|
$
|
9,379,755
|
|
|
$
|
9,488,427
|
|
|
$
|
9,476,576
|
|
|
$
|
9,560,792
|
|
|
Total securities and other short-term investments
|
|
|
2,741,466
|
|
|
|
2,808,330
|
|
|
|
2,764,390
|
|
|
|
2,768,923
|
|
|
|
2,811,178
|
|
|
Average interest-earning assets
|
|
$
|
12,150,883
|
|
|
$
|
12,188,085
|
|
|
$
|
12,252,817
|
|
|
$
|
12,245,499
|
|
|
$
|
12,371,970
|
|
|
|
|
|
|
|
|
|
|
|
|
|
|
Average interest-bearing liabilities
|
|
$
|
9,768,667
|
|
|
$
|
10,042,209
|
|
|
$
|
10,186,134
|
|
|
$
|
10,245,634
|
|
|
$
|
10,395,437
|
|
|
|
|
|
|
|
|
|
|
|
|
|
|
Average Yield/Rate
|
|
|
|
|
|
|
|
|
|
|
|
Average yield on interest-earning assets - GAAP
|
|
|
5.01
|
%
|
|
|
5.07
|
%
|
|
|
5.13
|
%
|
|
|
5.08
|
%
|
|
|
5.14
|
%
|
|
Average rate on interest-bearing liabilities - GAAP
|
|
|
1.03
|
%
|
|
|
1.08
|
%
|
|
|
1.14
|
%
|
|
|
1.12
|
%
|
|
|
1.10
|
%
|
|
Net interest spread - GAAP
|
|
|
3.98
|
%
|
|
|
3.99
|
%
|
|
|
3.99
|
%
|
|
|
3.96
|
%
|
|
|
4.04
|
%
|
|
Net interest margin - GAAP
|
|
|
4.18
|
%
|
|
|
4.18
|
%
|
|
|
4.18
|
%
|
|
|
4.14
|
%
|
|
|
4.21
|
%
|
|
|
|
|
|
|
|
|
|
|
|
|
|
Average yield on interest-earning assets excluding valuations and a
$2.5 million prepayment penalty
|
|
|
5.01
|
%
|
|
|
5.07
|
%
|
|
|
5.03
|
%
|
|
|
5.06
|
%
|
|
|
5.13
|
%
|
|
Average rate on interest-bearing liabilities excluding valuations
|
|
|
1.03
|
%
|
|
|
1.08
|
%
|
|
|
1.14
|
%
|
|
|
1.12
|
%
|
|
|
1.10
|
%
|
|
Net interest spread excluding valuations and a $2.5 million
prepayment penalty collected
|
|
|
3.98
|
%
|
|
|
3.99
|
%
|
|
|
3.89
|
%
|
|
|
3.94
|
%
|
|
|
4.03
|
%
|
|
Net interest margin excluding valuations and a $2.5 million
prepayment penalty collected
|
|
|
4.18
|
%
|
|
|
4.18
|
%
|
|
|
4.09
|
%
|
|
|
4.12
|
%
|
|
|
4.20
|
%
|
|
|
|
|
|
|
|
|
|
|
|
|
|
Average yield on interest-earning assets on a tax-equivalent basis
and excluding valuations
|
|
|
5.16
|
%
|
|
|
5.21
|
%
|
|
|
5.25
|
%
|
|
|
5.19
|
%
|
|
|
5.29
|
%
|
|
Average rate on interest-bearing liabilities excluding valuations
|
|
|
1.03
|
%
|
|
|
1.08
|
%
|
|
|
1.14
|
%
|
|
|
1.12
|
%
|
|
|
1.10
|
%
|
|
Net interest spread on a tax-equivalent basis and excluding
valuations
|
|
|
4.14
|
%
|
|
|
4.13
|
%
|
|
|
4.11
|
%
|
|
|
4.07
|
%
|
|
|
4.19
|
%
|
|
Net interest margin on a tax-equivalent basis and excluding
valuations
|
|
|
4.33
|
%
|
|
|
4.31
|
%
|
|
|
4.30
|
%
|
|
|
4.25
|
%
|
|
|
4.37
|
%
|
|
|
|
|
|
|
|
|
|
|
|
|
|
|
|
|
|
|
|
|
|
|
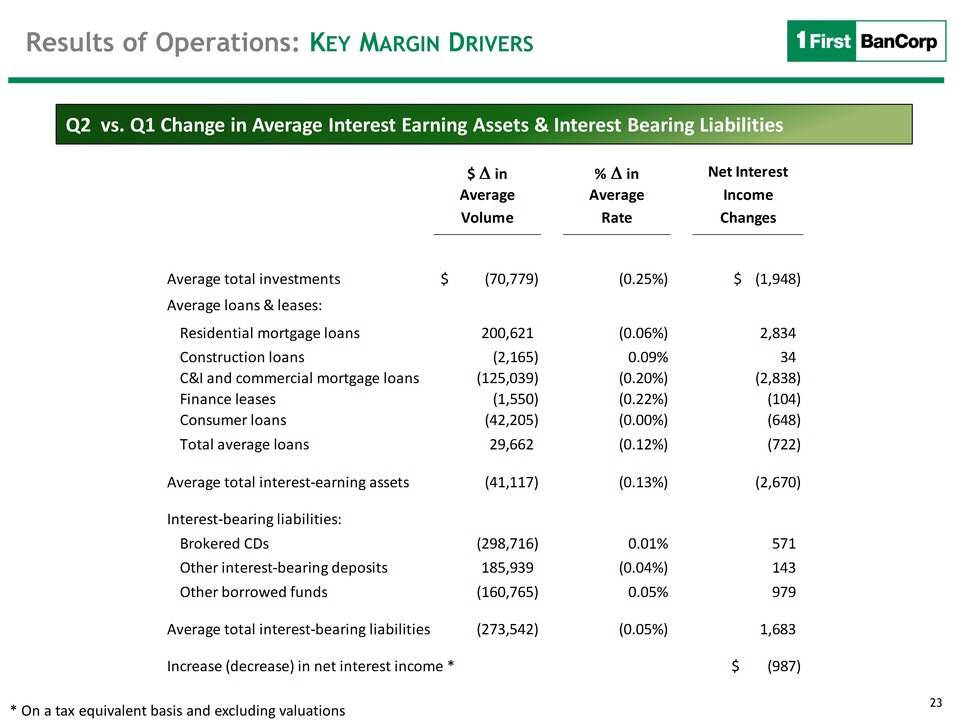
Net interest income amounted to $126.5 million, an increase of $0.8
million when compared to the first quarter of 2015. The net interest
margin remained unchanged at 4.18% for the second quarter of 2015
compared to the first quarter of 2015. The increase in net interest
income was mainly due to:
-
A $2.8 million increase in interest income on residential mortgage
loans primarily reflecting the full quarter contribution of loans
acquired from Doral in late February 2015. Interest income on this
residential mortgage loan portfolio acquired from Doral amounted to
$4.6 million in the second quarter of 2015 compared to $1.6 million in
the first quarter of 2015, an increase of $3.0 million.
-
A $1.7 million decrease in total interest expense primarily driven by:
(i) a $1.0 million decrease in interest expense on repurchase
agreements mainly reflecting the effect of the netting in accordance
with GAAP of the $0.8 million interest income earned on a $200 million
reverse repurchase agreement entered into in April 2015 as part of an
agreement with an existing counterparty against interest expense on
repurchase agreements with such counterparty, and the full quarter
impact of the $400 million repurchase agreements restructured in the
first quarter, and (ii) a $0.7 million decrease in interest expense on
deposits (net of a $0.2 million increase associated with the full
quarter impact of deposits acquired from Doral) mainly related to the
$298.7 million decrease in the average balance of brokered CDs and
lower rates paid on interest-bearing deposits.
Partially offset by:
-
A $1.6 million decrease in interest income on U.S. agency MBS mainly
due to a higher premium amortization expense as prepayment speeds
accelerated during the second quarter.
-
A $1.5 million decrease in interest income on commercial and
construction loans adversely impacted by a decrease of $0.6 million
related to interest income recorded in the first quarter on loans sold
as part of the bulk sale and approximately $0.9 million in interest
payments received in the second quarter from the PREPA credit facility
accounted for on a cost recovery basis.
-
A $0.8 million decrease in interest income on consumer loans driven by
a $43.8 million decrease in the average volume of loans, primarily
auto loans.
PROVISION FOR LOAN AND LEASE LOSSES
The provision for loan and lease losses for the second quarter of 2015
was $74.3 million, including the $46.9 million charge associated with
the bulk sale transaction, compared to $33.0 million for the first
quarter of 2015. Excluding the $46.9 million charge related to the bulk
sale, the provision decreased by $5.7 million driven by the following
variances:
-
An $11.5 million decrease in the provision for consumer loans mainly
due to lower historical loss rates that reflect, among other things,
improvements in charge-off trends and declining loss severity rates on
auto loans. Consumer loans net charge-offs decreased by $4.8 million
in the second quarter, as compared to the first quarter of 2015,
driven by loan loss recoveries of $2.7 million on the sale of certain
auto and personal loans that had been fully charged-off in prior
periods. The decrease in the provision also reflects the decline in
the size of this portfolio.
Partially offset by:
-
A $4.0 million increase in the provision for construction and
commercial loans driven by a $15.5 million increase to the general
reserves as a result of the incorporation of the $61.4 million of
charge-offs from the bulk sale in the historical loss rates used to
estimate inherent losses for non-impaired loans, partially offset by a
decrease of approximately $8.0 million related to adjustments to
general reserve factors applied to some asset classifications for
improvements in loans’ migration experience and a $2.9 million
increase in loan loss recoveries that was mainly associated with loans
in the Florida region.
-
A $1.9 million increase in the provision for residential mortgage
loans driven by a reserve of $3.1 million established in the second
quarter attributable to the purchased credit-impaired loans acquired
from Doral in May 2014. The reserve is driven by a revision to the
expected cash flows of the portfolio for the remaining term of the
loan pool based on market conditions. This was partially offset by a
$1.8 million decrease in residential mortgage loans net charge-offs.
See Credit Quality discussion below for additional information
regarding the allowance for loan and lease losses, including variances
in charge-offs and loss recoveries.
NON-INTEREST INCOME
|
|
|
|
Quarter Ended
|
|
|
|
|
June 30,
|
|
March 31,
|
|
December 31,
|
|
September 30,
|
|
June 30,
|
|
(In thousands)
|
|
2015
|
|
2015
|
|
2014
|
|
2014
|
|
2014
|
|
|
|
|
|
|
|
|
|
|
|
|
|
|
|
Service charges on deposit accounts
|
|
$
|
5,219
|
|
|
$
|
4,555
|
|
|
$
|
4,155
|
|
|
$
|
4,205
|
|
|
$
|
4,222
|
|
|
|
Mortgage banking activities
|
|
|
4,763
|
|
|
|
3,618
|
|
|
|
4,472
|
|
|
|
3,809
|
|
|
|
3,036
|
|
|
|
Net (loss) gain on investments and impairments
|
|
|
(13,097
|
)
|
|
|
(156
|
)
|
|
|
(172
|
)
|
|
|
(245
|
)
|
|
|
291
|
|
|
|
Other operating income
|
|
|
9,785
|
|
|
|
11,269
|
|
|
|
9,438
|
|
|
|
8,405
|
|
|
|
9,052
|
|
|
|
Bargain purchase gain
|
|
|
-
|
|
|
|
13,443
|
|
|
|
-
|
|
|
|
-
|
|
|
|
-
|
|
|
|
Equity in loss of unconsolidated entity
|
|
|
-
|
|
|
|
-
|
|
|
|
-
|
|
|
|
-
|
|
|
|
(670
|
)
|
|
|
|
|
|
|
|
|
|
|
|
|
|
|
|
Non-interest income
|
|
$
|
6,670
|
|
|
$
|
32,729
|
|
|
$
|
17,893
|
|
|
$
|
16,174
|
|
|
$
|
15,931
|
|
|
|
|
|
|
|
|
|
|
|
|
|
|
|
|
|
|
|
|
|
|
|
|
Non-interest income for the second quarter of 2015 amounted to $6.7
million, compared to $32.7 million for the first quarter of 2015.
Excluding the $12.9 million OTTI charge on Puerto Rico Government debt
securities in the second quarter of 2015, the $0.6 million pre-tax loss
on a commercial mortgage loan held for sale included in the bulk sale of
assets in the second quarter of 2015 and the $13.4 million pre-tax
bargain purchase gain on the assets acquired and liabilities assumed
from Doral recorded in the first quarter of 2015, adjusted non-interest
income increased by $0.8 million. The increase was primarily due to:
-
A $1.1 million increase in revenues from the mortgage banking business
driven by a higher volume of sales in the secondary market. Loans sold
and securitized in the secondary market to U.S. government-sponsored
entities amounted to $121.2 million with a related gain of $3.4
million in the second quarter of 2015, compared to $85.3 million with
a related gain of $2.9 million in the first quarter of 2015. In
addition, there was a $0.6 million increase in income from mortgage
hedging activities related to gains/losses on to-be-announced (TBAs)
MBS forward contracts.
-
A $0.6 million increase in service charges on deposits and an increase
of $0.3 million in other fees reflecting the full quarter contribution
of deposits assumed from Doral late in February 2015.
Partially offset by:
-
A $1.5 million decrease in income from insurance commissions, mainly
reflecting seasonal contingent commissions received in the first
quarter by the insurance agency based on the prior year’s production
of insurance policies.
NON-INTEREST EXPENSES
|
|
|
|
Quarter Ended
|
|
|
|
|
June 30,
|
|
March 31,
|
|
December 31,
|
|
September 30,
|
|
June 30,
|
|
(In thousands)
|
|
2015
|
|
2015
|
|
2014
|
|
2014
|
|
2014
|
|
|
|
|
|
|
|
|
|
|
|
|
|
|
|
Employees' compensation and benefits
|
|
$
|
37,841
|
|
$
|
35,654
|
|
$
|
33,854
|
|
$
|
33,877
|
|
$
|
34,793
|
|
|
Occupancy and equipment
|
|
|
15,059
|
|
|
14,231
|
|
|
14,763
|
|
|
14,727
|
|
|
14,246
|
|
|
Deposit insurance premium
|
|
|
5,405
|
|
|
5,770
|
|
|
6,682
|
|
|
8,335
|
|
|
9,579
|
|
|
Other insurance and supervisory fees
|
|
|
1,391
|
|
|
1,090
|
|
|
1,182
|
|
|
1,158
|
|
|
1,205
|
|
|
Taxes, other than income taxes
|
|
|
3,131
|
|
|
3,001
|
|
|
4,482
|
|
|
4,528
|
|
|
4,504
|
|
|
Professional fees:
|
|
|
|
|
|
|
|
|
|
|
|
|
Collections, appraisals and other credit related fees
|
|
|
3,777
|
|
|
3,432
|
|
|
4,244
|
|
|
2,914
|
|
|
2,717
|
|
|
Outsourcing technology services
|
|
|
4,789
|
|
|
4,704
|
|
|
4,775
|
|
|
4,840
|
|
|
4,600
|
|
|
Other professional fees
|
|
|
7,539
|
|
|
5,356
|
|
|
4,420
|
|
|
3,641
|
|
|
4,073
|
|
|
Credit and debit card processing expenses
|
|
|
3,945
|
|
|
3,957
|
|
|
4,002
|
|
|
3,741
|
|
|
3,882
|
|
|
Branch consolidations and restructuring expenses
|
|
|
-
|
|
|
-
|
|
|
-
|
|
|
-
|
|
|
236
|
|
|
Business promotion
|
|
|
3,660
|
|
|
2,705
|
|
|
4,491
|
|
|
3,925
|
|
|
4,142
|
|
|
Communications
|
|
|
2,045
|
|
|
1,608
|
|
|
1,851
|
|
|
2,143
|
|
|
1,894
|
|
|
Net loss on OREO operations
|
|
|
4,624
|
|
|
2,628
|
|
|
3,655
|
|
|
4,326
|
|
|
6,778
|
|
|
Loss on sale of certain OREOs included in the bulk sale
|
|
|
250
|
|
|
-
|
|
|
-
|
|
|
-
|
|
|
-
|
|
|
Bulk sale of assets related expenses
|
|
|
918
|
|
|
-
|
|
|
-
|
|
|
-
|
|
|
-
|
|
|
Acquisitions of loans/assumption of deposits from Doral
non-recurring expenses
|
|
|
2,562
|
|
|
2,084
|
|
|
-
|
|
|
659
|
|
|
576
|
|
|
Other
|
|
|
5,863
|
|
|
5,508
|
|
|
5,318
|
|
|
4,790
|
|
|
4,920
|
|
|
Total
|
|
$
|
102,799
|
|
$
|
91,728
|
|
$
|
93,719
|
|
$
|
93,604
|
|
$
|
98,145
|
|
|
|
|
|
|
|
|
|
|
|
|
|
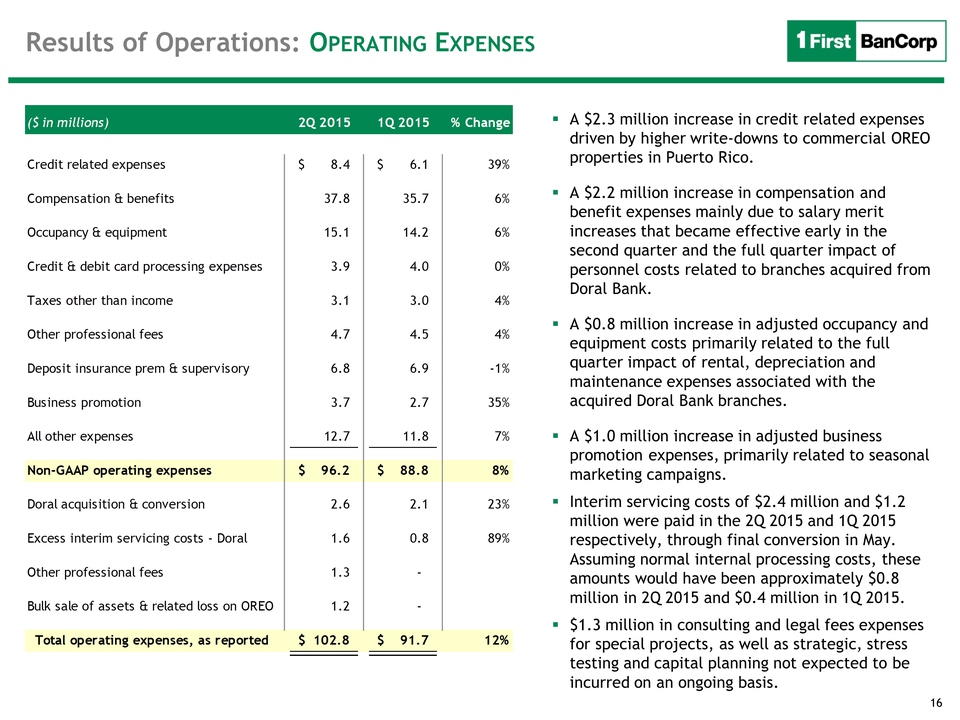
Non-interest expenses in the second quarter of 2015 amounted to $102.8
million, an increase of $11.1 million from $91.7 million for the first
quarter of 2015. Excluding non-recurring acquisition and conversion
costs related to the Doral transaction of $2.6 million and $2.1 million
for the second quarter and first quarter of 2015, respectively, and $1.2
million of expenses and losses directly associated with the bulk sale
transaction in the second quarter, non-interest expenses increased to
$99.1 million for the second quarter of 2015 from $89.6 million in the
first quarter. The main drivers of the increase were:
-
A $2.6 million increase in adjusted professional service fees due to,
among other things, a $1.2 million increase in interim servicing costs
related to loans and deposits acquired from Doral, as the conversion
to the FirstBank systems was completed two months into the second
quarter. The Corporation incurred approximately $2.4 million in
interim servicing costs in the second quarter compared to $1.2 million
in the first quarter of 2015. Upon completion of the conversion, the
ongoing costs related to the processing and maintenance of these
accounts are lower. In addition, there was an increase of $1.3 million
in consulting and legal expenses for special projects as well as
strategic, stress testing and capital planning matters that are not
expected to be incurred on an ongoing basis.
-
A $2.2 million increase in adjusted employees’ compensation and
benefit expenses mainly due to salary merit increases that became
effective early in the second quarter that accounted for approximately
$1.4 million of the increase, including $0.2 million of lump-sum
payments, and the full quarter impact of personnel costs related to
branches acquired from Doral that account for approximately $0.4
million of the increase. In addition, there was an increase of
approximately $0.4 million for one additional business day in the
second quarter, as compared to the first quarter of 2015.
-
A $2.0 million increase in adjusted OREO losses driven by higher
write-downs to commercial OREO properties. Write-downs on OREO
properties amounted to $4.6 million in the second quarter of 2015,
primarily related to one commercial property in Puerto Rico, compared
to $3.0 million in the first quarter of 2015. In addition there was a
$0.9 million decrease in realized gains at the time of disposition, as
the previous quarter included a gain of $1.3 million on the sale of
certain commercial OREO properties. These variances were partially
offset by a $0.4 million increase in rental income on OREO properties.
-
A $1.0 million increase in adjusted business promotion expenses,
primarily attributable to the seasonality of marketing campaigns.
-
A $0.8 million increase in adjusted occupancy and equipment costs
primarily related to the full quarter impact of rental, depreciation
and maintenance expenses associated with the acquired Doral branches
that account for $0.6 million of the increase.
-
A $0.8 million aggregate increase in communications and other
operating expenses in the table above, including increases of $0.3
million in the core deposit intangible amortization and $0.3 million
in communications, supplies, and processing expenses that reflect the
full quarter impact of the acquired Doral branches.
See Recent Events-Non-GAAP Reconciliation section above for a
reconciliation of the non-GAAP financial measures, adjusted professional
service fees, adjusted employees’ compensation and benefit expenses,
adjusted OREO losses, adjusted business promotion expenses and adjusted
occupancy and equipment costs, to the corresponding GAAP measures.
INCOME TAXES
The Corporation recorded an income tax benefit for the second quarter of
2015 of $9.8 million compared to an income tax expense of $8.0 million
for the first quarter of 2015. As of June 30, 2015, the Corporation had
a net deferred tax asset of $310.4 million (net of a valuation allowance
of $204.9 million, including a valuation allowance of $179.7 million
against the deferred tax assets of the Corporation’s banking subsidiary,
FirstBank).
CREDIT QUALITY
Non-Performing Assets
|
(Dollars in thousands)
|
|
June 30,
|
|
March 31,
|
|
December 31,
|
|
September 30,
|
|
June 30,
|
|
|
|
|
2015
|
|
2015
|
|
2014
|
|
2014
|
|
2014
|
|
Non-performing loans held for investment:
|
|
|
|
|
|
|
|
|
|
|
|
|
Residential mortgage
|
|
$
|
175,035
|
|
|
$
|
172,583
|
|
|
$
|
180,707
|
|
|
$
|
185,025
|
|
|
$
|
175,404
|
|
|
|
Commercial mortgage
|
|
|
95,088
|
|
|
|
142,385
|
|
|
|
148,473
|
|
|
|
169,967
|
|
|
|
166,218
|
|
|
|
Commercial and Industrial
|
|
|
143,935
|
|
|
|
186,500
|
|
|
|
122,547
|
|
|
|
130,917
|
|
|
|
143,669
|
|
|
|
Construction
|
|
|
16,118
|
|
|
|
27,163
|
|
|
|
29,354
|
|
|
|
30,111
|
|
|
|
38,830
|
|
|
|
Consumer and Finance leases
|
|
|
33,397
|
|
|
|
34,913
|
|
|
|
42,815
|
|
|
|
43,496
|
|
|
|
40,510
|
|
|
|
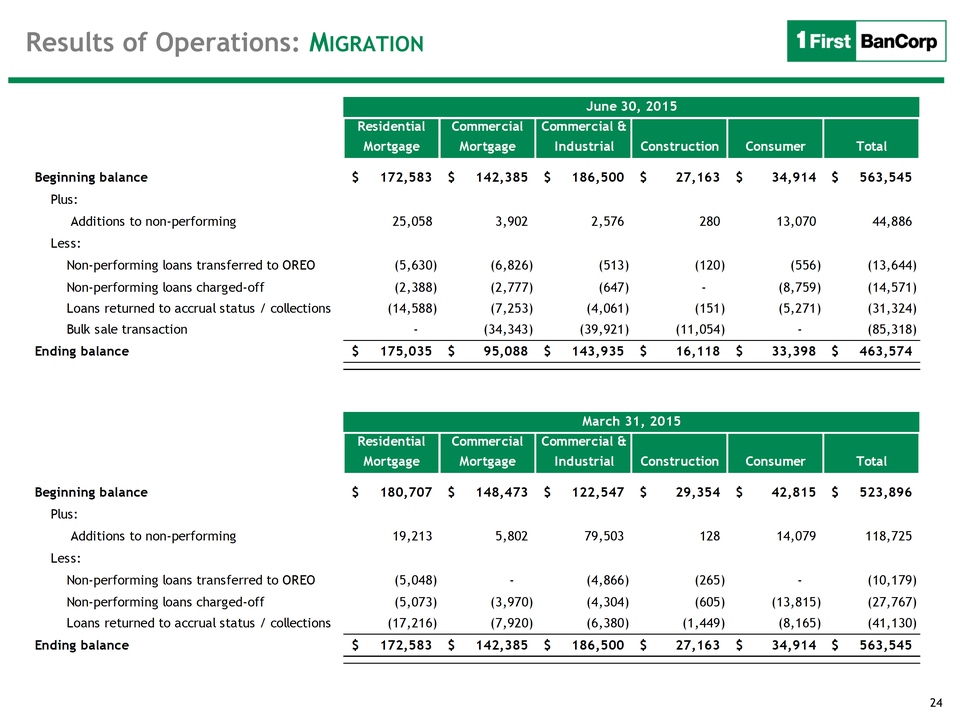
Total non-performing loans held for investment
|
|
|
463,573
|
|
|
|
563,544
|
|
|
|
523,896
|
|
|
|
559,516
|
|
|
|
564,631
|
|
|
|
|
|
|
|
|
|
|
|
|
|
|
|
OREO
|
|
|
122,129
|
|
|
|
122,628
|
|
|
|
124,003
|
|
|
|
112,803
|
|
|
|
121,842
|
|
|
Other repossessed property
|
|
|
10,706
|
|
|
|
13,585
|
|
|
|
14,229
|
|
|
|
17,467
|
|
|
|
16,114
|
|
|
|
Total non-performing assets, excluding loans held for sale
|
|
$
|
596,408
|
|
|
$
|
699,757
|
|
|
$
|
662,128
|
|
|
$
|
689,786
|
|
|
$
|
702,587
|
|
|
|
|
|
|
|
|
|
|
|
|
|
|
|
Non-performing loans held for sale
|
|
|
48,032
|
|
|
|
54,588
|
|
|
|
54,641
|
|
|
|
54,641
|
|
|
|
54,755
|
|
|
|
Total non-performing assets, including loans held for sale (1)
|
|
$
|
644,440
|
|
|
$
|
754,345
|
|
|
$
|
716,769
|
|
|
$
|
744,427
|
|
|
$
|
757,342
|
|
|
|
|
|
|
|
|
|
|
|
|
|
|
|
Past-due loans 90 days and still accruing (2)
|
|
$
|
196,547
|
|
|
$
|
178,572
|
|
|
$
|
162,887
|
|
|
$
|
143,535
|
|
|
$
|
143,916
|
|
|
Non-performing loans held for investment to total loans held for
investment
|
|
|
5.03
|
%
|
|
|
5.94
|
%
|
|
|
5.66
|
%
|
|
|
6.01
|
%
|
|
|
5.96
|
%
|
|
Non-performing loans to total loans
|
|
|
5.50
|
%
|
|
|
6.46
|
%
|
|
|
6.19
|
%
|
|
|
6.54
|
%
|
|
|
6.49
|
%
|
|
Non-performing assets, excluding non-performing loans held for
sale, to total assets, excluding non-performing loans held for sale
|
|
|
4.76
|
%
|
|
|
5.34
|
%
|
|
|
5.22
|
%
|
|
|
5.48
|
%
|
|
|
5.63
|
%
|
|
Non-performing assets to total assets
|
|
|
5.12
|
%
|
|
|
5.74
|
%
|
|
|
5.63
|
%
|
|
|
5.89
|
%
|
|
|
6.05
|
%
|
|
|
|
|
|
|
|
|
|
|
|
|
|
|
(1)
|
Purchased credit impaired loans of $178.5 million accounted for
under ASC 310-30 as of June 30, 2015, primarily mortgage loans
acquired from Doral in the first quarter of 2015 and second quarter
of 2014, are excluded and not considered non-performing due to the
application of the accretion method, under which these loans will
accrete interest income over the remaining life of the loans using
estimated cash flow analysis.
|
|
|
|
|
|
(2)
|
Amount includes purchased credit impaired loans with individual
delinquencies over 90 days and still accruing with a carrying value
as of June 30, 2015 of approximately $18.2 million, primarily
related to loans acquired from Doral in the first quarter of 2015
and second quarter of 2014.
|
|
|
|
|
|
Credit quality metrics variances:
-
Total non-performing assets decreased by $109.9 million to $644.4
million as of June 30, 2015, compared to $754.3 million as of March
31, 2015. Total non-performing loans, including non-performing loans
held for sale, decreased by $106.5 million, or 17%, from the first
quarter of 2015. The decrease in non-performing assets was primarily
attributable to the bulk sale of assets that included $91.9 million of
non-performing commercial and construction loans and $2.9 million of
OREO. Excluding the impact of the bulk sale, non-performing assets
decreased by $15.2 million primarily due to certain commercial loans
brought current, charge-offs and cash collections.
-
Inflows to non-performing loans held for investment were $44.9
million, a decrease of $73.8 million, or 62%, compared to inflows of
$118.7 million in the first quarter of 2015 that included the $75.0
million credit facility of PREPA. Excluding the aforementioned $75.0
million credit facility to PREPA, total inflows in the second quarter
remained relatively flat compared to the first quarter of 2015.
-
Adversely classified commercial and construction loans held for
investment decreased by $93.3 million to $411.0 million, or 19% from
the first quarter of 2015, driven by the bulk sale of assets that
included $146.6 million of adversely classified loans, partially
offset by the migration of approximately $44.4 million of syndicated
commercial loan participations to adverse classification categories.
-
The OREO balance decreased by $0.5 million, driven by sales of $9.1
million and valuation adjustments of $6.6 million, partially offset by
additions of $15.2 million in the second quarter of 2015.
-
Total Troubled Debt Restructurings (“TDRs”) held for investment were
$634.8 million as of June 30, 2015, down $70.4 million, or 10% from
March 31, 2015, driven by the bulk sale of assets that included $89.4
million of TDRs. Approximately $400.8 million of total TDRs held for
investment were in accrual status as of June 30, 2015.
Allowance for Loan and Lease Losses
The following table sets forth an analysis of the allowance for loan and
lease losses during the periods indicated:
|
|
|
|
|
|
|
|
|
|
|
|
|
|
Quarter Ended
|
|
|
(Dollars in thousands)
|
|
June 30,
|
|
|
March 31,
|
|
December 31,
|
|
September 30,
|
|
June 30,
|
|
|
|
|
2015
|
|
|
2015
|
|
2014
|
|
2014
|
|
2014
|
|
|
|
|
|
|
|
|
|
|
|
|
|
|
|
|
Allowance for loan and lease losses, beginning of period
|
|
$
|
226,064
|
|
|
|
$
|
222,395
|
|
|
$
|
225,434
|
|
|
$
|
241,177
|
|
|
$
|
266,778
|
|
|
|
Provision for loan and lease losses
|
|
|
74,266
|
|
(1)
|
|
|
32,970
|
|
|
|
23,872
|
|
|
|
26,999
|
|
|
|
26,744
|
|
(6)
|
|
Net (charge-offs) recoveries of loans:
|
|
|
|
|
|
|
|
|
|
|
|
|
|
Residential mortgage
|
|
|
(3,257
|
)
|
|
|
|
(5,094
|
)
|
|
|
(6,522
|
)
|
|
|
(5,734
|
)
|
|
|
(4,687
|
)
|
|
|
Commercial mortgage
|
|
|
(41,665
|
)
|
(2)
|
|
|
(3,730
|
)
|
|
|
(1,383
|
)
|
|
|
1,116
|
|
|
|
(9,126
|
)
|
|
|
Commercial and Industrial
|
|
|
(20,417
|
)
|
(3)
|
|
|
(3,895
|
)
|
|
|
(992
|
)
|
|
|
(16,431
|
)
|
|
|
(19,036
|
)
|
(7)
|
|
Construction
|
|
|
(2,083
|
)
|
(4)
|
|
|
(398
|
)
|
|
|
680
|
|
|
|
(3,205
|
)
|
|
|
(2,606
|
)
|
|
|
Consumer and finance leases
|
|
|
(11,390
|
)
|
|
|
|
(16,184
|
)
|
|
|
(18,694
|
)
|
|
|
(18,488
|
)
|
|
|
(16,890
|
)
|
|
|
Net charge-offs
|
|
|
(78,812
|
)
|
(5)
|
|
|
(29,301
|
)
|
|
|
(26,911
|
)
|
|
|
(42,742
|
)
|
|
|
(52,345
|
)
|
(7)
|
|
Allowance for loan and lease losses, end of period
|
|
$
|
221,518
|
|
|
|
$
|
226,064
|
|
|
$
|
222,395
|
|
|
$
|
225,434
|
|
|
$
|
241,177
|
|
|
|
|
|
|
|
|
|
|
|
|
|
|
|
|
|
Allowance for loan and lease losses to period end total loans held
for investment
|
|
|
2.40
|
%
|
|
|
|
2.38
|
%
|
|
|
2.40
|
%
|
|
|
2.42
|
%
|
|
|
2.55
|
%
|
|
|
Net charge-offs (annualized) to average loans outstanding during the
period
|
|
|
3.35
|
%
|
|
|
|
1.25
|
%
|
|
|
1.13
|
%
|
|
|
1.80
|
%
|
|
|
2.19
|
%
|
|
|
Net charge-offs (annualized), excluding charge-offs of $61.4
million related to the bulk sale of assets in the second quarter
of 2015 and $6.9 million related to the acquisition of mortgage
loans from Doral in the second quarter of 2014, to average loans
outstanding during the period
|
|
|
0.75
|
%
|
|
|
|
1.25
|
%
|
|
|
1.13
|
%
|
|
|
1.80
|
%
|
|
|
1.90
|
%
|
|
|
Provision for loan and lease losses to net charge-offs during the
period
|
|
0.94x
|
|
|
1.13x
|
|
0.89x
|
|
0.63x
|
|
0.51x
|
|
|
Provision for loan and lease losses to net charge-offs during the
period, excluding impact of the bulk sale of assets in the second
quarter of 2015 and the acquisition of mortgage loans from Doral
in the second quarter of 2014
|
|
1.57x
|
|
|
1.13x
|
|
0.89x
|
|
0.63x
|
|
0.56x
|
|
|
(1) Includes provision of $46.9 million associated with the bulk
sale of assets.
|
|
(2) Includes net charge-offs totaling $37.6 million associated with
the bulk sale of assets.
|
|
(3) Includes net charge-offs totaling $20.6 million associated with
the bulk sale of assets.
|
|
(4) Includes net charge-offs totaling $3.3 million associated with
the bulk sale of assets.
|
|
(5) Includes net charge-offs totaling $61.4 million associated with
the bulk sale of assets.
|
|
(6) Includes a provision of $1.4 million associated with the
acquisition of mortgage loans from Doral.
|
|
(7) Includes net charge-offs totaling $6.9 million associated with
the acquisition of mortgage loans from Doral.
|
|
|
|
|
|
|
|
|
|
-
The ratio of the allowance for loan and lease losses to total loans
held for investment was 2.40% as of June 30, 2015, a slight increase
from the 2.38% as of March 31, 2015. The ratio of the allowance to
non-performing loans held for investment was 47.79% as of June 30,
2015 compared to 40.11% as of March 31, 2015. The increase in the
ratio is driven by the reduction in non-performing loans as a result
of the bulk sale of assets completed during the second quarter.
The following table sets forth information concerning the composition of
the Corporation’s allowance for loan and lease losses as of June 30,
2015 and March 31, 2015 by loan category and by whether the allowance
and related provisions were calculated individually for impairment
purposes or through a general valuation allowance:
|
|
|
|
|
|
|
|
|
|
|
(Dollars in thousands)
|
|
Residential
Mortgage Loans
|
|
Commercial (including
Commercial Mortgage,
C&I,
and Construction
loans)
|
|
Consumer and
Finance Leases
|
|
Total
|
|
|
|
|
|
|
|
|
|
|
|
As of June 30, 2015
|
|
|
|
|
|
|
|
|
|
Impaired loans:
|
|
|
|
|
|
|
|
|
|
Principal balance of loans, net of charge-offs
|
|
$
|
447,311
|
|
|
$
|
340,052
|
|
|
$
|
37,453
|
|
|
$
|
824,816
|
|
|
Allowance for loan and lease losses
|
|
|
17,136
|
|
|
|
24,477
|
|
|
|
8,305
|
|
|
|
49,918
|
|
|
Allowance for loan and lease losses to principal balance
|
|
|
3.83
|
%
|
|
|
7.20
|
%
|
|
|
22.17
|
%
|
|
|
6.05
|
%
|
|
|
|
|
|
|
|
|
|
|
|
PCI loans:
|
|
|
|
|
|
|
|
|
|
Carrying value of PCI loans
|
|
|
175,234
|
|
|
|
3,260
|
|
|
|
-
|
|
|
|
178,494
|
|
|
Allowance for PCI loans
|
|
|
3,061
|
|
|
|
102
|
|
|
|
-
|
|
|
|
3,163
|
|
|
Allowance for PCI loans to carrying value
|
|
|
1.75
|
%
|
|
|
3.13
|
%
|
|
|
-
|
|
|
|
1.77
|
%
|
|
|
|
|
|
|
|
|
|
|
|
Loans with general allowance:
|
|
|
|
|
|
|
|
|
|
Principal balance of loans
|
|
|
2,704,805
|
|
|
|
3,647,798
|
|
|
|
1,861,762
|
|
|
|
8,214,365
|
|
|
Allowance for loan and lease losses
|
|
|
13,586
|
|
|
|
100,278
|
|
|
|
54,573
|
|
|
|
168,437
|
|
|
Allowance for loan and lease losses to principal balance
|
|
|
0.50
|
%
|
|
|
2.75
|
%
|
|
|
2.93
|
%
|
|
|
2.05
|
%
|
|
|
|
|
|
|
|
|
|
|
|
Total loans held for investment:
|
|
|
|
|
|
|
|
|
|
Principal balance of loans
|
|
$
|
3,327,350
|
|
|
$
|
3,991,110
|
|
|
$
|
1,899,215
|
|
|
$
|
9,217,675
|
|
|
Allowance for loan and lease losses
|
|
|
33,783
|
|
|
|
124,857
|
|
|
|
62,878
|
|
|
|
221,518
|
|
|
Allowance for loan and lease losses to principal balance
|
|
|
1.02
|
%
|
|
|
3.13
|
%
|
|
|
3.31
|
%
|
|
|
2.40
|
%
|
|
|
|
|
|
|
|
|
|
|
|
As of March 31, 2015
|
|
|
|
|
|
|
|
|
|
|
|
|
|
|
|
|
|
|
|
Impaired loans:
|
|
|
|
|
|
|
|
|
|
Principal balance of loans, net of charge-offs
|
|
$
|
429,526
|
|
|
$
|
488,614
|
|
|
$
|
36,841
|
|
|
$
|
954,981
|
|
|
Allowance for loan and lease losses
|
|
|
14,862
|
|
|
|
41,490
|
|
|
|
5,788
|
|
|
|
62,140
|
|
|
Allowance for loan and lease losses to principal balance
|
|
|
3.46
|
%
|
|
|
8.49
|
%
|
|
|
15.71
|
%
|
|
|
6.51
|
%
|
|
|
|
|
|
|
|
|
|
|
|
PCI loans:
|
|
|
|
|
|
|
|
|
|
Carrying value of PCI loans
|
|
|
177,601
|
|
|
|
3,279
|
|
|
|
234
|
|
|
|
181,114
|
|
|
Allowance for PCI loans
|
|
|
-
|
|
|
|
-
|
|
|
|
-
|
|
|
|
-
|
|
|
Allowance for PCI loans to carrying value
|
|
|
-
|
|
|
|
-
|
|
|
|
-
|
|
|
|
-
|
|
|
|
|
|
|
|
|
|
|
|
|
Loans with general allowance:
|
|
|
|
|
|
|
|
|
|
Principal balance of loans
|
|
|
2,724,493
|
|
|
|
3,724,677
|
|
|
|
1,900,107
|
|
|
|
8,349,277
|
|
|
Allowance for loan and lease losses
|
|
|
13,820
|
|
|
|
87,355
|
|
|
|
62,749
|
|
|
|
163,924
|
|
|
Allowance for loan and lease losses to principal balance
|
|
|
0.51
|
%
|
|
|
2.35
|
%
|
|
|
3.30
|
%
|
|
|
1.96
|
%
|
|
|
|
|
|
|
|
|
|
|
|
Total loans held for investment:
|
|
|
|
|
|
|
|
|
|
Principal balance of loans
|
|
$
|
3,331,620
|
|
|
$
|
4,216,570
|
|
|
$
|
1,937,182
|
|
|
$
|
9,485,372
|
|
|
Allowance for loan and lease losses
|
|
|
28,682
|
|
|
|
128,845
|
|
|
|
68,537
|
|
|
|
226,064
|
|
|
Allowance for loan and lease losses to principal balance
|
|
|
0.86
|
%
|
|
|
3.06
|
%
|
|
|
3.54
|
%
|
|
|
2.38
|
%
|
|
|
|
|
|
|
|
|
|
|
Net Charge-Offs
The following table presents annualized net charge-offs to average loans
held-in-portfolio:
|
|
|
|
|
|
|
|
|
|
|
|
|
|
Quarter Ended
|
|
|
|
|
June 30,
|
|
|
March 31,
|
|
December 31,
|
|
September 30,
|
|
June 30,
|
|
|
|
|
2015
|
|
|
2015
|
|
2014
|
|
2014
|
|
2014
|
|
|
|
|
|
|
|
|
|
|
|
|
|
|
|
|
Residential mortgage
|
|
0.39
|
%
|
|
|
0.65
|
%
|
|
0.87
|
%
|
|
0.82
|
%
|
|
0.71
|
%
|
|
|
|
|
|
|
|
|
|
|
|
|
|
|
|
|
Commercial mortgage
|
|
10.37
|
%
|
(1)
|
|
0.90
|
%
|
|
0.31
|
%
|
|
-0.24
|
%
|
|
2.00
|
%
|
|
|
|
|
|
|
|
|
|
|
|
|
|
|
|
|
Commercial and Industrial
|
|
3.41
|
%
|
(2)
|
|
0.63
|
%
|
|
0.16
|
%
|
|
2.54
|
%
|
|
2.69
|
%
|
(5)
|
|
|
|
|
|
|
|
|
|
|
|
|
|
|
|
Construction
|
|
4.90
|
%
|
(3)
|
|
0.93
|
%
|
|
-1.48
|
%
|
|
6.57
|
%
|
|
5.25
|
%
|
|
|
|
|
|
|
|
|
|
|
|
|
|
|
|
|
Consumer and finance leases
|
|
2.38
|
%
|
|
|
3.30
|
%
|
|
3.73
|
%
|
|
3.62
|
%
|
|
3.27
|
%
|
|
|
|
|
|
|
|
|
|
|
|
|
|
|
|
|
Total loans
|
|
3.35
|
%
|
(4)
|
|
1.25
|
%
|
|
1.13
|
%
|
|
1.80
|
%
|
|
2.19
|
%
|
(6)
|
|
|
|
|
|
|
|
|
|
|
|
|
|
|
|
(1) Includes net charge-offs totaling $37.6 million associated with
the bulk sale of assets. The ratio of commercial mortgage net
charge-offs to average loans, excluding charge-offs associated with
the bulk sale of assets, was 1.06%.
|
|
(2) Includes net charge-offs totaling $20.6 million associated with
the bulk sale of assets. The ratio of commercial and industrial net
charge-offs to average loans, excluding charge-offs associated with
the bulk sale of assets, was (0.03)%.
|
|
(3) Includes net charge-offs totaling $3.3 million associated with
the bulk sale of assets. The ratio of construction net charge-offs
to average loans, excluding charge-offs associated with the bulk
sale of assets, was (2.94)%.
|
|
(4) Includes net charge-offs totaling $61.4 million associated with
the bulk sale of assets. The ratio of total charge-offs to average
loans, excluding charge-offs associated with the bulk sale of
assets, was 0.75%.
|
|
(5) Includes net charge-offs totaling $6.9 million associated with
the acquisition of mortgage loans from Doral. The ratio of
commercial and industrial net charge-offs to average loans,
excluding charge-offs associated with the acquisition of mortgage
loans from Doral, was 1.81%.
|
|
(6) Includes net charge-offs totaling $6.9 million associated with
the acquisition of mortgage loans from Doral. The ratio of total net
charge-offs to average loans, excluding charge-offs associated with
the acquisition of mortgage loans from Doral, was 1.90%.
|
|
|
The ratios above are based on annualized net charge-offs and are not
necessarily indicative of the results expected in subsequent periods.
Net charge-offs for the second quarter of 2015 were $78.8 million, or an
annualized 3.35% of average loans, including $61.4 million of
charge-offs related to the bulk sale of assets. Excluding the impact of
charge-offs related to the bulk sale, total net charge-offs in the
second quarter of 2015 were $17.4 million, or an annualized 0.75% of
average loans, compared to $29.3 million, or an annualized 1.25%, in the
first quarter of 2015. The decrease was mainly related to:
-
A $4.8 million decrease in consumer loan net charge-offs, including
the effect of $2.7 million of loss recoveries on the sale of certain
loans that had been fully charged-off in prior periods.
-
A $5.2 million decrease in commercial and construction loan net
charge-offs, primarily related to the commercial and industrial loan
portfolio in Puerto Rico. In addition, the decrease reflects a $1.6
million increase in loan loss recoveries in the Florida region.
-
A $1.8 million decrease in residential mortgage loan net charge-offs.
STATEMENT OF FINANCIAL CONDITION
Total assets were approximately $12.6 billion as of June 30, 2015, down
$569.1 million from March 31, 2015.
The decrease was mainly due to:
-
A $269.4 million decrease in total loans driven by the $147.5 million
of loans included in the bulk sale of assets, an additional $84.6
million decrease in commercial and construction loans that included
$20.0 million sold in a participation and certain large repayments in
Puerto Rico, and a $38.0 million decrease in consumer loans.
Total loan originations, including refinancings, renewals, and draws
from existing revolving and non-revolving commitments, amounted to
approximately $767.0 million, compared to $688.9 million in the first
quarter of 2015. The increase was mainly due to a $44.8 million increase
in residential mortgage loan originations, primarily refinancing and
conforming loan originations, and a $58.2 million increase in commercial
loan originations in Florida. These figures exclude the credit card
utilization activity.
-
A $302.0 million decrease in cash and cash equivalents primarily due
to funds used for the $200 million reverse repurchase agreement
entered into in April 2015 under a master netting arrangement. As
mentioned above, this agreement qualifies for offsetting accounting,
thus, the reverse repurchase agreement was netted against repurchase
agreements in the consolidated statement of financial condition. The
remainder of the variance is primarily linked to the decrease in
brokered CDs.
-
An $8.6 million decrease in investment securities driven by a $15.5
million decrease in the fair value of U.S. agency MBS, a $6.9 million
decrease in the fair value of Puerto Rico Government debt securities,
the redemption of a $12.0 million U.S. agency debt obligation prior to
maturity, and MBS prepayments of approximately $68 million, partially
offset by purchases of approximately $97 million (average yield of
2.09%) of U.S. agency securities.
Total liabilities were approximately $10.9 billion as of June 30, 2015,
down $531.6 million from March 31, 2015.
The decrease was mainly due to:
-
A $138.5 million decrease in deposits, excluding government deposits
and brokered CDs, primarily in the Florida region that accounted for
$103.9 million of the decrease.
-
A $241.7 million decrease in brokered CDs.
-
The netting of the $200 million reverse repurchase agreement against a
repurchase agreement with the same counterparty, as described above.
Partially offset by:
-
A $43.7 million increase in government deposits, primarily
transactional accounts of municipalities in Puerto Rico.
Total stockholders’ equity amounted to $1.7 billion as of June 30, 2015,
a decrease of $37.5 million from March 31, 2015, mainly driven by:
-
The net loss of $34.1 million reported in the second quarter.
-
A decrease of $10.2 million in other comprehensive income mainly
attributable to the $15.5 million decrease in the fair value of U.S.
agency MBS.
Partially offset by:
-
The exchange of $5.3 million of trust preferred securities for shares
of the Corporation’s common stock. During the second quarter of 2015,
the Corporation exchanged trust preferred securities with a
liquidation value of $5.3 million for 852,831 shares of the
Corporation’s common stock.
On January 1, 2015, the Basel III rules became effective, subject to
on-going, multi-year transition provisions primarily related to
regulatory deductions and adjustments impacting common equity tier 1
capital, tier 1 capital and total capital. The Corporation’s common
equity tier 1 capital, tier 1 capital, total capital and leverage ratios
under the Basel III rules as of June 30, 2015 (including the 2015
phase-in of regulatory capital transition provisions) were 16.37%,
16.37%, 19.44% and 11.94%, respectively, compared to common equity tier
1 capital, tier 1 capital, total capital and leverage ratios of 16.15%,
16.15%, 19.20%, and 12.16%, respectively, as of the end of the first
quarter of 2015.
Meanwhile, the common equity tier 1 capital, tier 1 capital, total
capital and leverage ratios as of June 30, 2015 of our banking
subsidiary, FirstBank Puerto Rico, were 15.81%, 17.85%, 19.13%, and
13.03%, respectively, compared to common equity tier 1 capital, tier 1
capital, total capital and leverage ratios of 15.62%, 17.61%, 18.89% and
13.28%, respectively, as of the end of the prior quarter.
Tangible Common Equity
The Corporation’s tangible common equity ratio increased to 12.61% as of
June 30, 2015 from 12.33% as of March 31, 2015.
The following table is a reconciliation of the Corporation’s tangible
common equity and tangible assets over the last five quarters to the
comparable GAAP items:
|
|
|
|
|
|
|
|
|
(In thousands, except ratios and per share information)
|
|
|
|
|
|
|
|
|
|
|
|
|
|
|
|
|
|
|
|
June 30,
|
|
March 31,
|
|
December 31,
|
|
September 30,
|
|
June 30,
|
|
|
|
2015
|
|
2015
|
|
2014
|
|
2014
|
|
2014
|
|
Tangible Equity:
|
|
|
|
|
|
|
|
|
|
|
|
Total equity - GAAP
|
|
$
|
1,668,220
|
|
|
$
|
1,705,750
|
|
|
$
|
1,671,743
|
|
|
$
|
1,324,157
|
|
|
$
|
1,306,001
|
|
|
Preferred equity
|
|
|
(36,104
|
)
|
|
|
(36,104
|
)
|
|
|
(36,104
|
)
|
|
|
(36,104
|
)
|
|
|
(36,104
|
)
|
|
Goodwill
|
|
|
(28,098
|
)
|
|
|
(28,098
|
)
|
|
|
(28,098
|
)
|
|
|
(28,098
|
)
|
|
|
(28,098
|
)
|
|
Purchased credit card relationship
|
|
|
(14,854
|
)
|
|
|
(15,622
|
)
|
|
|
(16,389
|
)
|
|
|
(17,235
|
)
|
|
|
(18,080
|
)
|
|
Core deposit intangible
|
|
|
(10,283
|
)
|
|
|
(10,914
|
)
|
|
|
(5,420
|
)
|
|
|
(5,810
|
)
|
|
|
(6,200
|
)
|
|
|
|
|
|
|
|
|
|
|
|
|
|
Tangible common equity
|
|
$
|
1,578,881
|
|
|
$
|
1,615,012
|
|
|
$
|
1,585,732
|
|
|
$
|
1,236,910
|
|
|
$
|
1,217,519
|
|
|
|
|
|
|
|
|
|
|
|
|
|
|
Tangible Assets:
|
|
|
|
|
|
|
|
|
|
|
|
Total assets - GAAP
|
|
$
|
12,578,813
|
|
|
$
|
13,147,919
|
|
|
$
|
12,727,835
|
|
|
$
|
12,643,280
|
|
|
$
|
12,523,251
|
|
|
Goodwill
|
|
|
(28,098
|
)
|
|
|
(28,098
|
)
|
|
|
(28,098
|
)
|
|
|
(28,098
|
)
|
|
|
(28,098
|
)
|
|
Purchased credit card relationship
|
|
|
(14,854
|
)
|
|
|
(15,622
|
)
|
|
|
(16,389
|
)
|
|
|
(17,235
|
)
|
|
|
(18,080
|
)
|
|
Core deposit intangible
|
|
|
(10,283
|
)
|
|
|
(10,914
|
)
|
|
|
(5,420
|
)
|
|
|
(5,810
|
)
|
|
|
(6,200
|
)
|
|
|
|
|
|
|
|
|
|
|
|
|
|
Tangible assets
|
|
$
|
12,525,578
|
|
|
$
|
13,093,285
|
|
|
$
|
12,677,928
|
|
|
$
|
12,592,137
|
|
|
$
|
12,470,873
|
|
|
|
|
|
|
|
|
|
|
|
|
|
|
Common shares outstanding
|
|
|
214,694
|
|
|
|
213,827
|
|
|
|
212,985
|
|
|
|
212,978
|
|
|
|
212,760
|
|
|
|
|
|
|
|
|
|
|
|
|
|
|
Tangible common equity ratio
|
|
|
12.61
|
%
|
|
|
12.33
|
%
|
|
|
12.51
|
%
|
|
|
9.82
|
%
|
|
|
9.76
|
%
|
|
Tangible book value per common share
|
|
$
|
7.35
|
|
|
$
|
7.55
|
|
|
$
|
7.45
|
|
|
$
|
5.81
|
|
|
$
|
5.72
|
|
|
|
|
|
|
|
|
|
|
|
|
|
|
|
|
|
|
|
|
|
|
|
Exposure to Puerto Rico Government
As of June 30, 2015, the Corporation had $340.0 million of credit
facilities, excluding investment securities, granted to the Puerto Rico
Government, its municipalities and public corporations, of which $326.7
million was outstanding (book value of $325.8 million), compared to
$321.7 million outstanding as of March 31, 2015. Approximately $204.3
million of the granted credit facilities outstanding consisted of loans
to municipalities in Puerto Rico for which, in most cases, the good
faith, credit and unlimited taxing power of the applicable municipality
have been pledged to their repayment. Approximately $23.3 million
consisted of loans to units of the central government, and approximately
$99.0 million ($98.1 million book value) consisted of loans to public
corporations, including the direct exposure to PREPA with a book value
of $74.1 million as of June 30, 2015. In addition, the Corporation had
$131.0 million outstanding in financings to the hotel industry in Puerto
Rico guaranteed by the Puerto Rico Tourism Development Fund as of June
30, 2015, down $1.5 million, compared to $132.5 million outstanding as
of March 31, 2015.
The Corporation held $52.7 million of obligations of the Puerto Rico
government as part of its available-for-sale investment securities
portfolio, net of the $12.9 million other-than-temporary credit
impairment recorded in the second quarter, carried on its books at a
fair value of $34.6 million as of June 30, 2015.
As of June 30, 2015, the Corporation had $326.9 million of public sector
deposits in Puerto Rico, compared to $283.0 million as of March 31,
2015. Approximately 54% is from municipalities in Puerto Rico and 46% is
from public corporations and the central government and agencies.
Conference Call / Webcast Information
First BanCorp’s senior management will host an earnings conference call
and live webcast on Thursday, July 30, 2015, at 10:00 a.m. (Eastern
Time). The call may be accessed via a live Internet webcast through the
investor relations section of the Corporation’s web site: www.1firstbank.com
or through a dial-in telephone number at (877) 506-6537 or (412)
380–2001 for international callers. The Corporation recommends that
listeners go to the web site at least 15 minutes prior to the call to
download and install any necessary software. Following the webcast
presentation, a question and answer session will be made available to
research analysts and institutional investors. A replay of the webcast
will be archived in the investor relations section of First BanCorp’s
web site, www.1firstbank.com, until July 29, 2016. A telephone
replay will be available one hour after the end of the conference call
through August 30, 2015 at (877) 344-7529 or (412) 317-0088 for
international callers. The conference number is 10069784.
Safe Harbor
This press release may contain “forward-looking statements” concerning
the Corporation’s future economic performance. The words or phrases
“expect,” “anticipate,” “look forward,” “should,” “believes” and similar
statements of a future or forward-looking nature that reflect our
current views with respect to future events and financial performance
are meant to identify “forward-looking statements” within the meaning of
Section 27A of the Securities Act of 1933, as amended, and Section 21E
of the Securities Exchange Act of 1934, as amended, and are subject to
the safe harbor created by such sections. The Corporation wishes to
caution readers not to place undue reliance on any such “forward-looking
statements,” which speak only as of the date made, and to advise readers
that various factors, including, but not limited to, the following could
cause actual results to differ materially from those expressed in, or
implied by such forward-looking statements: uncertainty about whether
the Corporation will be able to continue to fully comply with the
written agreement dated June 3, 2010 that the Corporation entered into
with the Federal Reserve Bank of New York (the “New York Fed”) that,
among other things, requires the Corporation to serve as a source of
strength to FirstBank and that, except with the consent generally of the
New York Fed and the Board of Governors of the Federal Reserve System
(the “Federal Reserve Board”), prohibits the Corporation from paying
dividends to stockholders or receiving dividends from FirstBank, making
payments on trust preferred securities or subordinated debt and
incurring, increasing or guaranteeing debt or repurchasing any capital
securities; uncertainty as to the availability of certain funding
sources, such as brokered CDs; the Corporation’s reliance on brokered
CDs to fund operations and provide liquidity; the risk of not being able
to fulfill the Corporation’s cash obligations or resume paying dividends
to the Corporation’s stockholders in the future due to the Corporation’s
need to receive approval from the New York Fed and the Federal Reserve
Board to receive dividends from FirstBank or FirstBank’s failure to
generate sufficient cash flow to make a dividend payment to the
Corporation; the strength or weakness of the real estate markets and of
the consumer and commercial sectors and their impact on the credit
quality of the Corporation’s loans and other assets, which has
contributed and may continue to contribute to, among other things, high
levels of non-performing assets, charge-offs and provisions for loan and
lease losses and may subject the Corporation to further risk from loan
defaults and foreclosures; the ability of FirstBank to realize the
benefits of its deferred tax assets subject to the remaining valuation
allowance; additional adverse changes in general economic conditions in
Puerto Rico, the U.S., and the U.S. Virgin Islands and British Virgin
Islands, including the interest rate environment, market liquidity,
housing absorption rates, real estate prices, and disruptions in the
U.S. capital markets, which has reduced interest margins and affected
funding sources, and has affected demand for all of the Corporation’s
products and services and reduced the Corporation’s revenues and
earnings, and the value of the Corporation’s assets; a credit default by
the Puerto Rico government or any of its public corporations or other
instrumentalities, and recent and any future downgrades of the long-term
and short-term debt ratings of the Puerto Rico government, which could
exacerbate Puerto Rico’s adverse economic conditions; an adverse change
in the Corporation’s ability to attract new clients and retain existing
ones; a decrease in demand for the Corporation’s products and services
and lower revenues and earnings because of the continued recession in
Puerto Rico, the current fiscal problems of the Puerto Rico government
and recent credit downgrades of the Puerto Rico government’s debt; the
risk that any portion of the unrealized losses in the Corporation’s
investment portfolio is determined to be other-than-temporary, including
additional impairments on the Puerto Rico government’s obligations;
uncertainty about regulatory and legislative changes for financial
services companies in Puerto Rico, the U.S., the U.S. Virgin Islands and
British Virgin Islands, which could affect the Corporation’s financial
condition or performance and could cause the Corporation’s actual
results for future periods to differ materially from prior results and
anticipated or projected results; changes in the fiscal and monetary
policies and regulations of the U.S. federal government and the Puerto
Rico and other governments, including those determined by the Federal
Reserve Board, the New York Fed, the FDIC, government-sponsored housing
agencies, and regulators in Puerto Rico and the U.S. and British Virgin
Islands; the risk of possible failure or circumvention of controls and
procedures and the risk that the Corporation’s risk management policies
may not be adequate; the risk that the FDIC may increase the deposit
insurance premium and/or require special assessments to replenish its
insurance fund, causing an additional increase in the Corporation’s
non-interest expenses; the impact on the Corporation’s results of
operations and financial condition of acquisitions and dispositions,
including the recent acquisition of loans and branches of Doral Bank as
well as the assumption of deposits at the branches; a need to recognize
impairments on financial instruments, goodwill, or other intangible
assets relating to acquisitions; the risk that downgrades in the credit
ratings of the Corporation’s long-term senior debt will adversely affect
the Corporation’s ability to access necessary external funds; the impact
of the Dodd-Frank Wall Street Reform and Consumer Protection Act on the
Corporation’s businesses, business practices, and cost of operations;
and general competitive factors and industry consolidation. The
Corporation does not undertake, and specifically disclaims any
obligation, to update any “forward-looking statements” to reflect
occurrences or unanticipated events or circumstances after the date of
such statements except as required by the federal securities laws.
Basis of Presentation
Use of Non-GAAP Financial Measures
This press release contains non-GAAP financial measures. Non-GAAP
financial measures are set forth when management believes they will be
helpful to an understanding of the Corporation’s results of operations
or financial position. Where non-GAAP financial measures are used, the
comparable GAAP financial measure, as well as the reconciliation to the
comparable GAAP financial measure, can be found in the text or in the
attached tables to this earnings release.
Tangible Common Equity Ratio and Tangible Book Value per Common Share
The tangible common equity ratio and tangible book value per common
share are non-GAAP financial measures generally used by the financial
community to evaluate capital adequacy. Tangible common equity is total
equity less preferred equity, goodwill, core deposit intangibles, and
other intangibles, such as the purchased credit card relationship
intangible. Tangible assets are total assets less goodwill, core deposit
intangibles, and other intangibles, such as the purchased credit card
relationship intangible. Management and many stock analysts use the
tangible common equity ratio and tangible book value per common share in
conjunction with more traditional bank capital ratios to compare the
capital adequacy of banking organizations with significant amounts of
goodwill or other intangible assets, typically stemming from the use of
the purchase method of accounting for mergers and acquisitions. Neither
tangible common equity nor tangible assets, or the related measures
should be considered in isolation or as a substitute for stockholders’
equity, total assets, or any other measure calculated in accordance with
GAAP. Moreover, the manner in which the Corporation calculates its
tangible common equity, tangible assets, and any other related measures
may differ from that of other companies reporting measures with similar
names.
Adjusted Pre-Tax, Pre-Provision Income
Adjusted pre-tax, pre-provision income is a non-GAAP performance metric
that management believes is useful in analyzing underlying performance
trends, particularly in times of economic stress. Adjusted pre-tax,
pre-provision income, as defined by management, represents net income
(loss) excluding income tax expense (benefit), the provision for loan
and lease losses, gains on sale and OTTI of investment securities, fair
value adjustments on derivatives, equity in earnings or loss of
unconsolidated entity up until the second quarter of 2014 when the value
of the investment became zero as well as certain items identified as
unusual, non-recurring or non-operating.
In addition, from time to time, adjusted pre-tax, pre-provision income
will reflect the omission of revenue or expense items that management
judges to be outside of ordinary banking activities or of items that,
while they may be associated with ordinary banking activities, are so
unusually large that management believes that a complete analysis of the
Corporation’s performance requires consideration also of adjusted
pre-tax, pre-provision income that excludes such amounts.
Net Interest Income, Excluding Valuations and Prepayment Penalty, and
on a Tax-Equivalent Basis
Net interest income, interest rate spread, and net interest margin are
reported excluding the changes in the fair value of derivative
instruments and a $2.5 million prepayment penalty collected on a
commercial mortgage loan paid off in the fourth quarter of 2014, and on
a tax-equivalent basis. The presentation of net interest income
excluding valuations and the $2.5 million prepayment penalty provides
additional information about the Corporation’s net interest income and
facilitates comparability and analysis. The changes in the fair value of
derivative instruments have no effect on interest due or interest earned
on interest-bearing liabilities or interest-earning assets,
respectively. The tax-equivalent adjustment to net interest income
recognizes the income tax savings when comparing taxable and tax-exempt
assets and assumes a marginal income tax rate. Income from tax-exempt
earning assets is increased by an amount equivalent to the taxes that
would have been paid if this income had been taxable at statutory rates.
Management believes that it is a standard practice in the banking
industry to present net interest income, interest rate spread, and net
interest margin on a fully tax-equivalent basis. This adjustment puts
all earning assets, most notably tax-exempt securities and certain
loans, on a common basis that facilitates comparison of results to
results of peers.
Financial measures adjusted to exclude the effect of the bulk sale of
assets, the OTTI charge on Puerto Rico Government debt securities, the
bargain purchase gain and certain non-recurring expenses related to the
acquisition of loans and assumption of deposits from Doral.
To supplement the Corporation’s financial statements presented in
accordance with GAAP, the Corporation provides additional measures of
adjusted net charge-offs, adjusted non-interest expenses, adjusted
non-interest income, and adjusted pre-tax income. Adjusted non-interest
expenses exclude certain acquisition and conversion costs incurred in
the Doral transaction that are considered non-recurring in nature and
expenses and losses directly associated with the bulk sale of assets.
Adjusted non-interest income excludes the $12.9 million OTTI charge on
Puerto Rico Government debt securities recorded in the second quarter of
2015, the $0.6 million loss on a commercial mortgage loan held for sale
included as part of the bulk sale of assets in the second quarter, and
the $13.4 million bargain purchase gain on assets acquired and deposits
assumed from Doral in the first quarter of 2015. Adjusted pre-tax income
excludes the effect of all the aforementioned non-recurring items.
Management believes that these non-GAAP measures enhance the ability of
analysts and investors to analyze trends in the Corporation’s business
and to better understand the performance of the Corporation. In
addition, the Corporation may utilize these non-GAAP financial measures
as a guide in its budgeting and long-term planning process. Any analysis
of these non-GAAP financial measures should be used only in conjunction
with results presented in accordance with GAAP. See Recent
Events-Non-GAAP Reconciliation section above for reconciliations of
these non-GAAP financial measures to the corresponding measures
calculated and presented in accordance with GAAP.
|
|
|
|
|
FIRST BANCORP
|
|
CONDENSED CONSOLIDATED STATEMENTS OF FINANCIAL CONDITION
|
|
|
|
|
|
|
|
|
|
|
|
As of
|
|
|
|
June 30,
|
|
March 31,
|
|
December 31,
|
|
(In thousands, except for share information)
|
|
2015
|
|
2015
|
|
2014
|
|
ASSETS
|
|
|
|
|
|
|
|
|
|
|
|
|
|
|
|
Cash and due from banks
|
|
$
|
462,934
|
|
|
$
|
767,471
|
|
|
$
|
779,147
|
|
|
|
|
|
|
|
|
|
|
Money market investments:
|
|
|
|
|
|
|
|
Time deposits with other financial institutions
|
|
|
3,000
|
|
|
|
300
|
|
|
|
300
|
|
|
Other short-term investments
|
|
|
216,469
|
|
|
|
216,665
|
|
|
|
16,661
|
|
|
Total money market investments
|
|
|
219,469
|
|
|
|
216,965
|
|
|
|
16,961
|
|
|
|
|
|
|
|
|
|
|
Investment securities available for sale, at fair value
|
|
|
1,965,683
|
|
|
|
1,974,226
|
|
|
|
1,965,666
|
|
|
|
|
|
|
|
|
|
|
|
|
|
|
|
|
|
|
Other equity securities
|
|
|
26,152
|
|
|
|
26,185
|
|
|
|
25,752
|
|
|
|
|
|
|
|
|
|
|
Total investment securities
|
|
|
1,991,835
|
|
|
|
2,000,411
|
|
|
|
1,991,418
|
|
|
|
|
|
|
|
|
|
|
|
|
|
|
|
|
|
|
|
|
|
|
|
|
|
|
Loans, net of allowance for loan and lease losses of $221,518
|
|
|
|
|
|
|
|
(March 31, 2015 - $226,064; December 31, 2014 - $222,395)
|
|
|
8,996,157
|
|
|
|
9,259,308
|
|
|
|
9,040,041
|
|
|
Loans held for sale, at lower of cost or market
|
|
|
80,026
|
|
|
|
81,723
|
|
|
|
76,956
|
|
|
Total loans, net
|
|
|
9,076,183
|
|
|
|
9,341,031
|
|
|
|
9,116,997
|
|
|
|
|
|
|
|
|
|
|
Premises and equipment, net
|
|
|
164,643
|
|
|
|
166,799
|
|
|
|
166,926
|
|
|
Other real estate owned
|
|
|
122,129
|
|
|
|
122,628
|
|
|
|
124,003
|
|
|
Accrued interest receivable on loans and investments
|
|
|
50,191
|
|
|
|
49,302
|
|
|
|
50,796
|
|
|
Other assets
|
|
|
491,429
|
|
|
|
483,312
|
|
|
|
481,587
|
|
|
Total assets
|
|
$
|
12,578,813
|
|
|
$
|
13,147,919
|
|
|
$
|
12,727,835
|
|
|
|
|
|
|
|
|
|
|
LIABILITIES
|
|
|
|
|
|
|
|
|
|
|
|
|
|
|
|
Deposits:
|
|
|
|
|
|
|
|
Non-interest-bearing deposits
|
|
$
|
1,271,464
|
|
|
$
|
1,175,943
|
|
|
$
|
900,616
|
|
|
Interest-bearing deposits
|
|
|
8,233,112
|
|
|
|
8,665,095
|
|
|
|
8,583,329
|
|
|
Total deposits
|
|
|
9,504,576
|
|
|
|
9,841,038
|
|
|
|
9,483,945
|
|
|
|
|
|
|
|
|
|
|
Securities sold under agreements to repurchase
|
|
|
700,000
|
|
|
|
900,000
|
|
|
|
900,000
|
|
|
Advances from the Federal Home Loan Bank (FHLB)
|
|
|
325,000
|
|
|
|
325,000
|
|
|
|
325,000
|
|
|
Other borrowings
|
|
|
226,492
|
|
|
|
231,959
|
|
|
|
231,959
|
|
|
Accounts payable and other liabilities
|
|
|
154,525
|
|
|
|
144,172
|
|
|
|
115,188
|
|
|
Total liabilities
|
|
|
10,910,593
|
|
|
|
11,442,169
|
|
|
|
11,056,092
|
|
|
|
|
|
|
|
|
|
|
STOCKHOLDERS' EQUITY
|
|
|
|
|
|
|
|
|
|
|
|
|
|
|
|
|
|
|
|
|
|
|
|
Preferred Stock, authorized 50,000,000 shares; issued
|
|
|
|
|
|
|
|
|
|
|
|
|
|
22,828,174 shares; outstanding 1,444,146 shares; aggregate
|
|
|
|
|
|
|
|
|
|
|
|
|
|
liquidation value of $36,104
|
|
|
36,104
|
|
|
|
36,104
|
|
|
|
36,104
|
|
|
|
|
|
|
|
|
|
|
Common stock, $0.10 par value, authorized 2,000,000,000
|
|
|
|
|
|
|
|
|
|
|
|
|
|
shares; issued, 215,552,377 shares (March 31, 2015 -
|
|
|
|
|
|
|
|
|
|
|
|
|
|
214,618,015 shares issued; December 31, 2014 - 213,724,749
|
|
|
|
|
|
|
|
|
|
|
|
|
|
shares issued)
|
|
|
21,555
|
|
|
|
21,462
|
|
|
|
21,372
|
|
|
Less: Treasury stock (at par value)
|
|
|
(86
|
)
|
|
|
(79
|
)
|
|
|
(74
|
)
|
|
|
|
|
|
|
|
|
|
Common stock outstanding, 214,694,470 shares outstanding
|
|
|
|
|
|
|
|
(March 31, 2015 - 213,827,258 shares outstanding; December 31,
|
|
|
|
|
|
|
|
|
|
|
|
|
|
2014 - 212,984,700 shares outstanding)
|
|
|
21,469
|
|
|
|
21,383
|
|
|
|
21,298
|
|
|
Additional paid-in capital
|
|
|
923,829
|
|
|
|
917,203
|
|
|
|
916,067
|
|
|
Retained earnings
|
|
|
708,197
|
|
|
|
742,271
|
|
|
|
716,625
|
|
|
Accumulated other comprehensive loss
|
|
|
(21,379
|
)
|
|
|
(11,211
|
)
|
|
|
(18,351
|
)
|
|
Total stockholders' equity
|
|
|
1,668,220
|
|
|
|
1,705,750
|
|
|
|
1,671,743
|
|
|
Total liabilities and stockholders' equity
|
|
$
|
12,578,813
|
|
|
$
|
13,147,919
|
|
|
$
|
12,727,835
|
|
|
|
|
|
|
|
|
|
|
|
|
FIRST BANCORP
|
|
CONDENSED CONSOLIDATED STATEMENTS OF (LOSS) INCOME
|
|
|
|
|
|
|
|
|
|
|
|
|
|
|
|
Quarter Ended
|
|
Six-Month Period Ended
|
|
|
|
June 30,
|
|
March 31,
|
|
June 30,
|
|
June 30,
|
|
June 30,
|
|
(In thousands, except per share information)
|
|
2015
|
|
2015
|
|
2014
|
|
2015
|
|
2014
|
|
|
|
|
|
|
|
|
|
|
|
|
|
Net interest income:
|
|
|
|
|
|
|
|
|
|
|
|
Interest income
|
|
$
|
151,632
|
|
|
$
|
152,485
|
|
|
$
|
158,423
|
|
|
$
|
304,117
|
|
|
$
|
318,994
|
|
|
Interest expense
|
|
|
25,155
|
|
|
|
26,838
|
|
|
|
28,516
|
|
|
|
51,993
|
|
|
|
57,767
|
|
|
Net interest income
|
|
|
126,477
|
|
|
|
125,647
|
|
|
|
129,907
|
|
|
|
252,124
|
|
|
|
261,227
|
|
|
Provision for loan and lease losses
|
|
|
74,266
|
|
|
|
32,970
|
|
|
|
26,744
|
|
|
|
107,236
|
|
|
|
58,659
|
|
|
Net interest income after provision for loan and lease losses
|
|
|
52,211
|
|
|
|
92,677
|
|
|
|
103,163
|
|
|
|
144,888
|
|
|
|
202,568
|
|
|
|
|
|
|
|
|
|
|
|
|
|
|
Non-interest income:
|
|
|
|
|
|
|
|
|
|
|
|
Service charges on deposit accounts
|
|
|
5,219
|
|
|
|
4,555
|
|
|
|
4,222
|
|
|
|
9,774
|
|
|
|
8,349
|
|
|
Mortgage banking activities
|
|
|
4,763
|
|
|
|
3,618
|
|
|
|
3,036
|
|
|
|
8,381
|
|
|
|
6,404
|
|
|
Net (loss) gain on investments and impairments
|
|
|
(13,097
|
)
|
|
|
(156
|
)
|
|
|
291
|
|
|
|
(13,253
|
)
|
|
|
291
|
|
|
Equity in loss of unconsolidated entity
|
|
|
-
|
|
|
|
-
|
|
|
|
(670
|
)
|
|
|
-
|
|
|
|
(7,280
|
)
|
|
Bargain purchase gain
|
|
|
-
|
|
|
|
13,443
|
|
|
|
-
|
|
|
|
13,443
|
|
|
|
-
|
|
|
Other non-interest income
|
|
|
9,785
|
|
|
|
11,269
|
|
|
|
9,052
|
|
|
|
21,054
|
|
|
|
19,517
|
|
|
Total non-interest income
|
|
|
6,670
|
|
|
|
32,729
|
|
|
|
15,931
|
|
|
|
39,399
|
|
|
|
27,281
|
|
|
|
|
|
|
|
|
|
|
|
|
|
|
Non-interest expenses:
|
|
|
|
|
|
|
|
|
|
|
|
Employees' compensation and benefits
|
|
|
37,945
|
|
|
|
35,654
|
|
|
|
34,793
|
|
|
|
73,599
|
|
|
|
67,691
|
|
|
Occupancy and equipment
|
|
|
15,059
|
|
|
|
14,349
|
|
|
|
14,482
|
|
|
|
29,408
|
|
|
|
28,800
|
|
|
Business promotion
|
|
|
3,934
|
|
|
|
2,868
|
|
|
|
4,142
|
|
|
|
6,802
|
|
|
|
8,115
|
|
|
Professional fees
|
|
|
19,005
|
|
|
|
15,218
|
|
|
|
11,955
|
|
|
|
34,223
|
|
|
|
22,448
|
|
|
Taxes, other than income taxes
|
|
|
3,131
|
|
|
|
3,001
|
|
|
|
4,504
|
|
|
|
6,132
|
|
|
|
9,079
|
|
|
Insurance and supervisory fees
|
|
|
6,796
|
|
|
|
6,860
|
|
|
|
10,784
|
|
|
|
13,656
|
|
|
|
21,774
|
|
|
Net loss on other real estate owned operations
|
|
|
4,874
|
|
|
|
2,628
|
|
|
|
6,778
|
|
|
|
7,502
|
|
|
|
12,615
|
|
|
Other non-interest expenses
|
|
|
12,055
|
|
|
|
11,150
|
|
|
|
10,707
|
|
|
|
23,205
|
|
|
|
20,408
|
|
|
Total non-interest expenses
|
|
|
102,799
|
|
|
|
91,728
|
|
|
|
98,145
|
|
|
|
194,527
|
|
|
|
190,930
|
|
|
|
|
|
|
|
|
|
|
|
|
|
|
(Loss) income before income taxes
|
|
|
(43,918
|
)
|
|
|
33,678
|
|
|
|
20,949
|
|
|
|
(10,240
|
)
|
|
|
38,919
|
|
|
Income tax benefit (expense)
|
|
|
9,844
|
|
|
|
(8,032
|
)
|
|
|
276
|
|
|
|
1,812
|
|
|
|
(611
|
)
|
|
|
|
|
|
|
|
|
|
|
|
|
|
Net (loss) income
|
|
$
|
(34,074
|
)
|
|
$
|
25,646
|
|
|
$
|
21,225
|
|
|
$
|
(8,428
|
)
|
|
$
|
38,308
|
|
|
|
|
|
|
|
|
|
|
|
|
|
|
Net (loss) income attributable to common stockholders
|
|
$
|
(34,074
|
)
|
|
$
|
25,646
|
|
|
$
|
22,505
|
|
|
$
|
(8,428
|
)
|
|
$
|
39,967
|
|
|
|
|
|
|
|
|
|
|
|
|
|
|
(Loss) earnings per common share:
|
|
|
|
|
|
|
|
|
|
|
|
|
|
|
|
|
|
|
|
|
|
|
|
Basic
|
|
$
|
(0.16
|
)
|
|
$
|
0.12
|
|
|
$
|
0.11
|
|
|
$
|
(0.04
|
)
|
|
$
|
0.19
|
|
|
Diluted
|
|
$
|
(0.16
|
)
|
|
$
|
0.12
|
|
|
$
|
0.11
|
|
|
$
|
(0.04
|
)
|
|
$
|
0.19
|
|
|
|
|
|
|
|
|
|
|
|
|
|
About First BanCorp.
First BanCorp. is the parent corporation of FirstBank Puerto Rico, a
state-chartered commercial bank with operations in Puerto Rico, the
Virgin Islands and Florida, and of FirstBank Insurance Agency. First
BanCorp. and FirstBank Puerto Rico operate within U.S. banking laws and
regulations. The Corporation operates a total of 166 branches,
stand-alone offices, and in-branch service centers throughout Puerto
Rico, the U.S. and British Virgin Islands, and Florida. Among the
subsidiaries of FirstBank Puerto Rico are First Federal Finance Corp., a
small loan company; FirstBank Puerto Rico Securities, a broker-dealer
subsidiary; and First Management of Puerto Rico, a domestic corporation
that holds tax-exempt assets. In the U.S. Virgin Islands, FirstBank
operates First Express, a small loan company. First BanCorp’s shares of
common stock trade on the New York Stock Exchange under the symbol FBP.
Additional information about First BanCorp. may be found at www.1firstbank.com.
EXHIBIT A
Table 1 – Selected Financial Data
|
(In thousands, except for per share and financial ratios)
|
|
|
|
Quarter Ended
|
|
Six Month Period Ended
|
|
|
|
June 30,
|
|
March 31,
|
|
June 30,
|
|
June 30,
|
|
June 30,
|
|
|
|
|
2015
|
|
2015
|
|
2014
|
|
2015
|
|
2014
|
|
|
Condensed Income Statements:
|
|
|
|
|
|
|
|
|
|
|
|
|
Total interest income
|
|
$
|
151,632
|
|
|
$
|
152,485
|
|
|
$
|
158,423
|
|
$
|
304,117
|
|
|
$
|
318,994
|
|
|
|
Total interest expense
|
|
|
25,155
|
|
|
|
26,838
|
|
|
|
28,516
|
|
|
51,993
|
|
|
|
57,767
|
|
|
|
Net interest income
|
|
|
126,477
|
|
|
|
125,647
|
|
|
|
129,907
|
|
|
252,124
|
|
|
|
261,227
|
|
|
|
Provision for loan and lease losses
|
|
|
74,266
|
|
|
|
32,970
|
|
|
|
26,744
|
|
|
107,236
|
|
|
|
58,659
|
|
|
|
Non-interest income
|
|
|
6,670
|
|
|
|
32,729
|
|
|
|
15,931
|
|
|
39,399
|
|
|
|
27,281
|
|
|
|
Non-interest expenses
|
|
|
102,799
|
|
|
|
91,728
|
|
|
|
98,145
|
|
|
194,527
|
|
|
|
190,930
|
|
|
|
(Loss) income before income taxes
|
|
|
(43,918
|
)
|
|
|
33,678
|
|
|
|
20,949
|
|
|
(10,240
|
)
|
|
|
38,919
|
|
|
|
Income tax benefit (expense)
|
|
|
9,844
|
|
|
|
(8,032
|
)
|
|
|
276
|
|
|
1,812
|
|
|
|
(611
|
)
|
|
|
Net (loss) income
|
|
|
(34,074
|
)
|
|
|
25,646
|
|
|
|
21,225
|
|
|
(8,428
|
)
|
|
|
38,308
|
|
|
|
Net (loss) income attributable to common stockholders
|
|
|
(34,074
|
)
|
|
|
25,646
|
|
|
|
22,505
|
|
|
(8,428
|
)
|
|
|
39,967
|
|
|
|
|
|
|
|
|
|
|
|
|
|
|
|
|
|
|
|
|
|
|
|
|
|
|
|
|
|
Per Common Share Results:
|
|
|
|
|
|
|
|
|
|
|
|
|
Net (loss) earnings per share basic
|
|
$
|
(0.16
|
)
|
|
$
|
0.12
|
|
|
$
|
0.11
|
|
$
|
(0.04
|
)
|
|
$
|
0.19
|
|
|
|
Net (loss) earnings per share diluted
|
|
$
|
(0.16
|
)
|
|
$
|
0.12
|
|
|
$
|
0.11
|
|
$
|
(0.04
|
)
|
|
$
|
0.19
|
|
|
|
Cash dividends declared
|
|
$
|
-
|
|
|
$
|
-
|
|
|
$
|
-
|
|
$
|
-
|
|
|
$
|
-
|
|
|
|
Average shares outstanding
|
|
|
211,247
|
|
|
|
210,686
|
|
|
|
208,202
|
|
|
210,968
|
|
|
|
206,974
|
|
|
|
Average shares outstanding diluted
|
|
|
211,247
|
|
|
|
212,746
|
|
|
|
210,144
|
|
|
210,968
|
|
|
|
208,517
|
|
|
|
Book value per common share
|
|
$
|
7.60
|
|
|
$
|
7.81
|
|
|
$
|
5.97
|
|
$
|
7.60
|
|
|
$
|
5.97
|
|
|
|
Tangible book value per common share (1)
|
|
$
|
7.35
|
|
|
$
|
7.55
|
|
|
$
|
5.72
|
|
$
|
7.35
|
|
|
$
|
5.72
|
|
|
|
|
|
|
|
|
|
|
|
|
|
|
|
|
Selected Financial Ratios (In Percent):
|
|
|
|
|
|
|
|
|
|
|
|
|
|
|
|
|
|
|
|
|
|
|
|
|
|
Profitability:
|
|
|
|
|
|
|
|
|
|
|
|
|
Return on Average Assets
|
|
|
(1.06
|
)
|
|
|
0.81
|
|
|
|
0.67
|
|
|
(0.13
|
)
|
|
|
0.61
|
|
|
|
Interest Rate Spread (2)
|
|
|
4.13
|
|
|
|
4.13
|
|
|
|
4.19
|
|
|
4.12
|
|
|
|
4.22
|
|
|
|
Net Interest Margin (2)
|
|
|
4.33
|
|
|
|
4.31
|
|
|
|
4.37
|
|
|
4.32
|
|
|
|
4.40
|
|
|
|
Return on Average Total Equity
|
|
|
(8.06
|
)
|
|
|
6.15
|
|
|
|
6.66
|
|
|
(1.00
|
)
|
|
|
6.12
|
|
|
|
Return on Average Common Equity
|
|
|
(8.23
|
)
|
|
|
6.29
|
|
|
|
6.95
|
|
|
(1.03
|
)
|
|
|
6.41
|
|
|
|
Average Total Equity to Average Total Assets
|
|
|
13.19
|
|
|
|
13.13
|
|
|
|
10.10
|
|
|
13.16
|
|
|
|
9.93
|
|
|
|
Total capital
|
|
|
19.44
|
|
|
|
19.20
|
|
|
|
18.06
|
|
|
19.44
|
|
|
|
18.06
|
|
|
|
Common equity Tier 1 capital
|
|
|
16.37
|
|
|
|
16.15
|
|
|
|
13.92
|
|
|
16.37
|
|
|
|
13.92
|
|
|
|
Tier 1 capital
|
|
|
16.37
|
|
|
|
16.15
|
|
|
|
16.80
|
|
|
16.37
|
|
|
|
16.80
|
|
|
|
Leverage
|
|
|
11.94
|
|
|
|
12.16
|
|
|
|
12.04
|
|
|
11.94
|
|
|
|
12.04
|
|
|
|
Tangible common equity ratio (1)
|
|
|
12.61
|
|
|
|
12.33
|
|
|
|
9.76
|
|
|
12.61
|
|
|
|
9.76
|
|
|
|
Dividend payout ratio
|
|
|
-
|
|
|
|
-
|
|
|
|
-
|
|
|
-
|
|
|
|
-
|
|
|
|
Efficiency ratio (3)
|
|
|
77.21
|
|
|
|
57.92
|
|
|
|
67.30
|
|
|
66.73
|
|
|
|
66.18
|
|
|
|
|
|
|
|
|
|
|
|
|
|
|
|
|
Asset Quality:
|
|
|
|
|
|
|
|
|
|
|
|
|
Allowance for loan and lease losses to loans held for investment
|
|
|
2.40
|
|
|
|
2.38
|
|
|
|
2.55
|
|
|
2.40
|
|
|
|
2.55
|
|
|
|
Net charge-offs (annualized) to average loans
|
|
|
3.35
|
|
(4)
|
|
1.25
|
|
|
|
2.19
|
(6)
|
|
2.30
|
|
(4)
|
|
2.15
|
|
(6)
|
|
Provision for loan and lease losses to net charge-offs
|
|
|
94.23
|
|
(5)
|
|
112.52
|
|
|
|
51.09
|
(7)
|
|
99.19
|
|
(5)
|
|
56.76
|
|
(7)
|
|
Non-performing assets to total assets
|
|
|
5.12
|
|
|
|
5.74
|
|
|
|
6.05
|
|
|
5.12
|
|
|
|
6.05
|
|
|
|
Non-performing loans held for investment to total loans held for
investment
|
|
|
5.03
|
|
|
|
5.94
|
|
|
|
5.96
|
|
|
5.03
|
|
|
|
5.96
|
|
|
|
Allowance to total non-performing loans held for investment
|
|
|
47.79
|
|
|
|
40.11
|
|
|
|
42.71
|
|
|
47.79
|
|
|
|
42.71
|
|
|
|
Allowance to total non-performing loans held for investment
excluding residential real estate loans
|
|
|
76.77
|
|
|
|
57.82
|
|
|
|
61.96
|
|
|
76.77
|
|
|
|
61.96
|
|
|
|
|
|
|
|
|
|
|
|
|
|
|
|
|
Other Information:
|
|
|
|
|
|
|
|
|
|
|
|
|
Common Stock Price: End of period
|
|
$
|
4.82
|
|
|
$
|
6.20
|
|
|
$
|
5.44
|
|
$
|
4.82
|
|
|
$
|
5.44
|
|
|
|
|
|
|
|
|
|
|
|
|
|
|
|
|
|
|
|
|
|
|
|
|
|
|
|
|
|
1- Non-GAAP measure. See page 15 for GAAP to Non-GAAP
reconciliations.
|
|
2- On a tax-equivalent basis and excluding changes in the fair value
of derivative instruments (Non-GAAP measure). See page 6 for GAAP to
Non-GAAP reconciliations and refer to discussions in Tables 2 and 3
below.
|
|
3- Non-interest expenses to the sum of net interest income and
non-interest income. The denominator includes non-recurring income
and changes in the fair value of derivative instruments.
|
|
4 - The ratio of net charge-offs to average loans, excluding
charge-offs associated with the bulk sale of assets, was 0.75% and
1.01% for the quarter and six-month period ended June 30, 2015,
respectively.
|
|
5 - The ratio of provision for loan and lease losses to net
charge-offs, excluding the impact of the bulk sale of assets, was
157.21% and 129.16% for the quarter and six-month period ended June
30, 2015, respectively.
|
|
6 - The ratio of net charge-offs to average loans, excluding the
impact associated with the acquisition of mortgage loans from Doral
in the second quarter of 2014, was 1.90% and 2.01% for the quarter
and six-month period ended June 30, 2014, respectively.
|
|
7 - The ratio of provision for loan and lease losses to net
charge-offs, excluding the impact associated with the acquisition of
mortgage loans from Doral in the second quarter of 2014, was 55.72%
and 59.35% for the quarter and six-month period ended June 30, 2014,
respectively.
|
|
|
|
|
|
|
|
|
|
Table 2 – Quarterly Statement of Average Interest-Earning Assets and
Average Interest-Bearing
Liabilities (On a Tax-Equivalent
Basis and Excluding Valuations)
|
|
|
|
|
|
|
|
|
|
|
|
|
|
|
|
|
|
|
|
|
(Dollars in thousands)
|
|
|
|
Average volume
|
|
Interest income (1) / expense
|
|
Average rate (1)
|
|
|
|
June 30,
|
|
March 31,
|
|
June 30,
|
|
June 30,
|
|
March 31,
|
|
June 30,
|
|
June 30,
|
|
March 31,
|
|
June 30,
|
|
Quarter ended
|
|
2015
|
|
2015
|
|
2014
|
|
2015
|
|
2015
|
|
2014
|
|
2015
|
|
2015
|
|
2014
|
|
|
|
|
|
|
|
|
|
|
|
|
|
|
|
|
|
|
|
|
|
Interest-earning assets:
|
|
|
|
|
|
|
|
|
|
|
|
|
|
|
|
|
|
|
|
Money market & other short-term investments
|
|
$
|
737,227
|
|
$
|
808,754
|
|
$
|
729,302
|
|
$
|
510
|
|
$
|
537
|
|
$
|
454
|
|
0.28
|
%
|
|
0.27
|
%
|
|
0.25
|
%
|
|
Government obligations (2)
|
|
|
469,155
|
|
|
421,948
|
|
|
335,813
|
|
|
2,617
|
|
|
2,338
|
|
|
2,101
|
|
2.24
|
%
|
|
2.25
|
%
|
|
2.51
|
%
|
|
Mortgage-backed securities
|
|
|
1,508,831
|
|
|
1,551,804
|
|
|
1,717,748
|
|
|
10,297
|
|
|
12,501
|
|
|
14,191
|
|
2.74
|
%
|
|
3.27
|
%
|
|
3.31
|
%
|
|
FHLB stock
|
|
|
25,435
|
|
|
25,467
|
|
|
27,995
|
|
|
257
|
|
|
295
|
|
|
273
|
|
4.05
|
%
|
|
4.70
|
%
|
|
3.91
|
%
|
|
Other investments
|
|
|
818
|
|
|
357
|
|
|
320
|
|
|
-
|
|
|
-
|
|
|
-
|
|
0.00
|
%
|
|
0.00
|
%
|
|
0.00
|
%
|
|
Total investments (3)
|
|
|
2,741,466
|
|
|
2,808,330
|
|
|
2,811,178
|
|
|
13,681
|
|
|
15,671
|
|
|
17,019
|
|
2.00
|
%
|
|
2.26
|
%
|
|
2.43
|
%
|
|
Residential mortgage loans
|
|
|
3,321,269
|
|
|
3,120,648
|
|
|
2,635,082
|
|
|
46,310
|
|
|
43,482
|
|
|
36,707
|
|
5.59
|
%
|
|
5.65
|
%
|
|
5.59
|
%
|
|
Construction loans
|
|
|
169,890
|
|
|
172,055
|
|
|
198,665
|
|
|
1,566
|
|
|
1,532
|
|
|
1,691
|
|
3.70
|
%
|
|
3.61
|
%
|
|
3.41
|
%
|
|
C&I and commercial mortgage loans
|
|
|
4,002,266
|
|
|
4,127,305
|
|
|
4,658,776
|
|
|
43,316
|
|
|
43,671
|
|
|
50,473
|
|
4.34
|
%
|
|
4.29
|
%
|
|
4.35
|
%
|
|
Finance leases
|
|
|
228,749
|
|
|
230,299
|
|
|
243,014
|
|
|
4,507
|
|
|
4,611
|
|
|
4,985
|
|
7.90
|
%
|
|
8.12
|
%
|
|
8.23
|
%
|
|
Consumer loans
|
|
|
1,687,243
|
|
|
1,729,448
|
|
|
1,825,255
|
|
|
46,875
|
|
|
47,523
|
|
|
52,291
|
|
11.14
|
%
|
|
11.14
|
%
|
|
11.49
|
%
|
|
Total loans (4) (5)
|
|
|
9,409,417
|
|
|
9,379,755
|
|
|
9,560,792
|
|
|
142,574
|
|
|
140,819
|
|
|
146,147
|
|
6.08
|
%
|
|
6.09
|
%
|
|
6.13
|
%
|
|
Total interest-earning assets
|
|
$
|
12,150,883
|
|
$
|
12,188,085
|
|
$
|
12,371,970
|
|
$
|
156,255
|
|
$
|
156,490
|
|
$
|
163,166
|
|
5.16
|
%
|
|
5.21
|
%
|
|
5.29
|
%
|
|
|
|
|
|
|
|
|
|
|
|
|
|
|
|
|
|
|
|
|
|
Interest-bearing liabilities:
|
|
|
|
|
|
|
|
|
|
|
|
|
|
|
|
|
|
|
|
Brokered CDs
|
|
$
|
2,437,937
|
|
$
|
2,736,653
|
|
$
|
3,124,808
|
|
$
|
6,039
|
|
$
|
6,610
|
|
$
|
7,496
|
|
0.99
|
%
|
|
0.98
|
%
|
|
0.96
|
%
|
|
Other interest-bearing deposits
|
|
|
6,034,536
|
|
|
5,848,597
|
|
|
5,838,450
|
|
|
10,941
|
|
|
11,084
|
|
|
11,970
|
|
0.73
|
%
|
|
0.77
|
%
|
|
0.82
|
%
|
|
Other borrowed funds
|
|
|
971,194
|
|
|
1,131,959
|
|
|
1,131,959
|
|
|
7,231
|
|
|
8,210
|
|
|
8,217
|
|
2.99
|
%
|
|
2.94
|
%
|
|
2.91
|
%
|
|
FHLB advances
|
|
|
325,000
|
|
|
325,000
|
|
|
300,220
|
|
|
944
|
|
|
934
|
|
|
833
|
|
1.17
|
%
|
|
1.17
|
%
|
|
1.11
|
%
|
|
Total interest-bearing liabilities
|
|
$
|
9,768,667
|
|
$
|
10,042,209
|
|
$
|
10,395,437
|
|
$
|
25,155
|
|
$
|
26,838
|
|
$
|
28,516
|
|
1.03
|
%
|
|
1.08
|
%
|
|
1.10
|
%
|
|
Net interest income
|
|
|
|
|
|
|
|
$
|
131,100
|
|
$
|
129,652
|
|
$
|
134,650
|
|
|
|
|
|
|
|
Interest rate spread
|
|
|
|
|
|
|
|
|
|
|
|
|
|
4.13
|
%
|
|
4.13
|
%
|
|
4.19
|
%
|
|
Net interest margin
|
|
|
|
|
|
|
|
|
|
|
|
|
|
4.33
|
%
|
|
4.31
|
%
|
|
4.37
|
%
|
|
|
|
|
|
|
|
|
|
|
|
|
|
|
|
|
|
|
|
|
|
1- On a tax-equivalent basis. The tax-equivalent yield was estimated
by dividing the interest rate spread on exempt assets by 1 less the
Puerto Rico statutory tax rate of 39% and adding to it the cost of
interest-bearing liabilities. When adjusted to a tax-equivalent
basis, yields on taxable and exempt assets are comparable. Changes
in the fair value of derivative instruments are excluded from
interest income because the changes in valuation do not affect
interest paid or received.
|
|
|
|
|
|
|
|
|
|
|
|
|
|
|
|
|
|
|
|
|
|
2- Government obligations include debt issued by
government-sponsored agencies.
|
|
|
|
|
|
|
|
|
|
|
|
|
|
|
|
|
|
|
|
|
|
3- Unrealized gains and losses on available-for-sale securities are
excluded from the average volumes.
|
|
|
|
|
|
|
|
|
|
|
|
|
|
|
|
|
|
|
|
|
|
4- Average loan balances include the average of non-performing loans.
|
|
|
|
|
|
|
|
|
|
|
|
|
|
|
|
|
|
|
|
|
|
5- Interest income on loans includes $2.5 million, $2.7 million and
$2.8 million for the quarters ended June 30, 2015, March 31, 2015,
and June 30, 2014, respectively, of income from prepayment penalties
and late fees related to the Corporation's loan portfolio.
|
|
|
|
|
|
|
Table 3 – Year-to-Date Statement of Average Interest-Earning Assets
and Average Interest-Bearing
Liabilities (On a Tax-Equivalent
Basis and Excluding Valuations)
|
|
|
|
|
|
|
|
|
|
|
|
|
|
|
(Dollars in thousands)
|
|
|
|
|
|
|
|
|
|
|
|
|
|
|
|
Average volume
|
|
Interest income (1) / expense
|
|
Average rate (1)
|
|
|
|
June 30,
|
|
June 30,
|
|
June 30,
|
|
June 30,
|
|
June 30,
|
|
June 30,
|
|
Six-Month Period Ended
|
|
2015
|
|
2014
|
|
2015
|
|
2014
|
|
2015
|
|
2014
|
|
|
|
|
|
|
|
|
|
|
|
|
|
|
|
Interest-earning assets:
|
|
|
|
|
|
|
|
|
|
|
|
|
|
Money market & other short-term investments
|
|
$
|
774,782
|
|
$
|
736,772
|
|
$
|
1,047
|
|
$
|
954
|
|
0.27
|
%
|
|
0.26
|
%
|
|
Government obligations (2)
|
|
|
445,682
|
|
|
339,313
|
|
|
4,955
|
|
|
4,159
|
|
2.24
|
%
|
|
2.47
|
%
|
|
Mortgage-backed securities
|
|
|
1,530,197
|
|
|
1,709,097
|
|
|
22,798
|
|
|
30,283
|
|
3.00
|
%
|
|
3.57
|
%
|
|
FHLB stock
|
|
|
25,451
|
|
|
28,199
|
|
|
552
|
|
|
614
|
|
4.37
|
%
|
|
4.39
|
%
|
|
Other investments
|
|
|
590
|
|
|
320
|
|
|
-
|
|
|
-
|
|
0.00
|
%
|
|
0.00
|
%
|
|
Total investments (3)
|
|
|
2,776,702
|
|
|
2,813,701
|
|
|
29,352
|
|
|
36,010
|
|
2.13
|
%
|
|
2.58
|
%
|
|
Residential mortgage loans
|
|
|
3,221,513
|
|
|
2,592,738
|
|
|
89,792
|
|
|
71,665
|
|
5.62
|
%
|
|
5.57
|
%
|
|
Construction loans
|
|
|
170,967
|
|
|
207,553
|
|
|
3,098
|
|
|
3,706
|
|
3.65
|
%
|
|
3.60
|
%
|
|
C&I and commercial mortgage loans
|
|
|
4,064,440
|
|
|
4,741,613
|
|
|
86,987
|
|
|
101,785
|
|
4.32
|
%
|
|
4.33
|
%
|
|
Finance leases
|
|
|
229,520
|
|
|
244,613
|
|
|
9,118
|
|
|
10,175
|
|
8.01
|
%
|
|
8.39
|
%
|
|
Consumer loans
|
|
|
1,708,229
|
|
|
1,824,966
|
|
|
94,398
|
|
|
105,306
|
|
11.14
|
%
|
|
11.64
|
%
|
|
Total loans (4) (5)
|
|
|
9,394,669
|
|
|
9,611,483
|
|
|
283,393
|
|
|
292,637
|
|
6.08
|
%
|
|
6.14
|
%
|
|
Total interest-earning assets
|
|
$
|
12,171,371
|
|
$
|
12,425,184
|
|
$
|
312,745
|
|
$
|
328,647
|
|
5.18
|
%
|
|
5.33
|
%
|
|
|
|
|
|
|
|
|
|
|
|
|
|
|
|
Interest-bearing liabilities:
|
|
|
|
|
|
|
|
|
|
|
|
|
|
Brokered CDs
|
|
$
|
2,586,470
|
|
$
|
3,154,996
|
|
$
|
12,649
|
|
$
|
15,103
|
|
0.99
|
%
|
|
0.97
|
%
|
|
Other interest-bearing deposits
|
|
|
5,900,493
|
|
|
5,881,642
|
|
|
22,025
|
|
|
24,662
|
|
0.75
|
%
|
|
0.85
|
%
|
|
Other borrowed funds
|
|
|
1,051,132
|
|
|
1,131,959
|
|
|
15,441
|
|
|
16,345
|
|
2.96
|
%
|
|
2.91
|
%
|
|
FHLB advances
|
|
|
325,000
|
|
|
300,110
|
|
|
1,878
|
|
|
1,657
|
|
1.17
|
%
|
|
1.11
|
%
|
|
Total interest-bearing liabilities
|
|
$
|
9,863,095
|
|
$
|
10,468,707
|
|
$
|
51,993
|
|
$
|
57,767
|
|
1.06
|
%
|
|
1.11
|
%
|
|
Net interest income
|
|
|
|
|
|
$
|
260,752
|
|
$
|
270,880
|
|
|
|
|
|
Interest rate spread
|
|
|
|
|
|
|
|
|
|
4.12
|
%
|
|
4.22
|
%
|
|
Net interest margin
|
|
|
|
|
|
|
|
|
|
4.32
|
%
|
|
4.40
|
%
|
|
|
|
|
|
|
|
|
|
|
|
|
|
|
|
1- On a tax-equivalent basis. The tax-equivalent yield was estimated
by dividing the interest rate spread on exempt assets by 1 less the
Puerto Rico statutory tax rate of 39% and adding to it the cost of
interest-bearing liabilities. When adjusted to a tax-equivalent
basis, yields on taxable and exempt assets are comparable. Changes
in the fair value of derivative instruments are excluded from
interest income because the changes in valuation do not affect
interest paid or received.
|
|
|
|
|
|
|
|
|
|
|
|
|
|
|
|
2- Government obligations include debt issued by
government-sponsored agencies.
|
|
|
|
|
|
|
|
|
|
|
|
|
|
|
|
3- Unrealized gains and losses on available-for-sale securities are
excluded from the average volumes.
|
|
|
|
|
|
|
|
|
|
|
|
|
|
|
|
4- Average loan balances include the average of non-performing loans.
|
|
|
|
|
|
|
|
|
|
|
|
|
|
|
|
5- Interest income on loans includes $5.2 million, and $5.8 million
for the six-month period ended June 30, 2015 and 2014, respectively,
of income from prepayment penalties and late fees related to the
Corporation's loan portfolio.
|
|
|
|
|
|
|
|
|
Table 4 – Non-Interest Income
|
|
|
|
|
|
|
|
|
|
|
Quarter Ended
|
|
Six-Month Period Ended
|
|
|
|
|
June 30,
|
|
March 31,
|
|
June 30,
|
|
June 30,
|
|
June 30,
|
|
(In thousands)
|
|
2015
|
|
2015
|
|
2014
|
|
2015
|
|
2014
|
|
|
|
|
|
|
|
|
|
|
|
|
|
|
|
Service charges on deposit accounts
|
|
$
|
5,219
|
|
|
$
|
4,555
|
|
|
$
|
4,222
|
|
|
$
|
9,774
|
|
|
$
|
8,349
|
|
|
|
Mortgage banking activities
|
|
|
4,763
|
|
|
|
3,618
|
|
|
|
3,036
|
|
|
|
8,381
|
|
|
|
6,404
|
|
|
|
Insurance income
|
|
|
1,522
|
|
|
|
3,022
|
|
|
|
1,467
|
|
|
|
4,544
|
|
|
|
4,038
|
|
|
|
Broker-dealer income
|
|
|
-
|
|
|
|
-
|
|
|
|
-
|
|
|
|
-
|
|
|
|
459
|
|
|
|
Other operating income
|
|
|
8,263
|
|
|
|
8,247
|
|
|
|
7,585
|
|
|
|
16,510
|
|
|
|
15,020
|
|
|
|
|
|
|
|
|
|
|
|
|
|
|
|
|
|
|
|
|
|
|
|
|
|
|
|
|
|
|
|
|
|
|
|
|
|
|
|
|
|
|
|
|
|
|
|
|
|
|
|
|
|
Non-interest income before net (loss)
|
|
|
|
|
|
|
|
|
|
|
|
|
|
|
|
|
|
|
|
|
|
|
gain on investments, bargain purchase
|
|
|
|
|
|
|
|
|
|
|
|
|
|
|
|
|
|
|
|
|
|
|
gain and equity in loss of
|
|
|
|
|
|
|
|
|
|
|
|
|
|
|
|
|
|
|
|
|
|
|
unconsolidated entity
|
|
|
19,767
|
|
|
|
19,442
|
|
|
|
16,310
|
|
|
|
39,209
|
|
|
|
34,270
|
|
|
|
|
|
|
|
|
|
|
|
|
|
|
|
|
Net gain on sale of investments
|
|
|
-
|
|
|
|
-
|
|
|
|
291
|
|
|
|
-
|
|
|
|
291
|
|
|
|
OTTI on debt securities
|
|
|
(13,097
|
)
|
|
|
(156
|
)
|
|
|
-
|
|
|
|
(13,253
|
)
|
|
|
-
|
|
|
|
Net (loss) gain on investments
|
|
|
(13,097
|
)
|
|
|
(156
|
)
|
|
|
291
|
|
|
|
(13,253
|
)
|
|
|
291
|
|
|
|
|
|
|
|
|
|
|
|
|
|
|
|
|
|
|
|
|
|
|
|
|
|
|
|
|
|
Bargain purchase gain
|
|
|
-
|
|
|
|
13,443
|
|
|
|
-
|
|
|
|
13,443
|
|
|
|
-
|
|
|
|
Equity in loss of unconsolidated entity
|
|
|
-
|
|
|
|
-
|
|
|
|
(670
|
)
|
|
|
-
|
|
|
|
(7,280
|
)
|
|
|
|
|
$
|
6,670
|
|
|
$
|
32,729
|
|
|
$
|
15,931
|
|
|
$
|
39,399
|
|
|
$
|
27,281
|
|
|
|
|
|
|
|
|
|
|
|
|
|
|
Table 5 – Non-Interest Expenses
|
|
|
|
|
|
|
|
|
|
|
Quarter Ended
|
|
Six-Month Period Ended
|
|
|
|
|
June 30,
|
|
March 31,
|
|
June 30,
|
|
June 30,
|
|
June 30,
|
|
(In thousands)
|
|
2015
|
|
2015
|
|
2014
|
|
2015
|
|
2014
|
|
|
|
|
|
|
|
|
|
|
|
|
|
|
|
Employees' compensation and benefits
|
|
$
|
37,841
|
|
$
|
35,654
|
|
$
|
34,793
|
|
$
|
73,495
|
|
$
|
67,691
|
|
|
Occupancy and equipment
|
|
|
15,059
|
|
|
14,231
|
|
|
14,246
|
|
|
29,290
|
|
|
27,846
|
|
|
Deposit insurance premium
|
|
|
5,405
|
|
|
5,770
|
|
|
9,579
|
|
|
11,175
|
|
|
19,401
|
|
|
Other insurance and supervisory fees
|
|
|
1,391
|
|
|
1,090
|
|
|
1,205
|
|
|
2,481
|
|
|
2,373
|
|
|
Taxes, other than income taxes
|
|
|
3,131
|
|
|
3,001
|
|
|
4,504
|
|
|
6,132
|
|
|
9,079
|
|
|
Professional fees:
|
|
|
|
|
|
|
|
|
|
|
|
|
Collections, appraisals and other credit related fees
|
|
|
3,777
|
|
|
3,432
|
|
|
2,717
|
|
|
7,209
|
|
|
4,471
|
|
|
Outsourcing technology services
|
|
|
4,789
|
|
|
4,704
|
|
|
4,600
|
|
|
9,493
|
|
|
8,814
|
|
|
Other professional fees
|
|
|
7,539
|
|
|
5,356
|
|
|
4,073
|
|
|
12,895
|
|
|
8,598
|
|
|
Credit and debit card processing expenses
|
|
|
3,945
|
|
|
3,957
|
|
|
3,882
|
|
|
7,902
|
|
|
7,706
|
|
|
Branch consolidations and other restructuring expenses
|
|
|
-
|
|
|
-
|
|
|
236
|
|
|
-
|
|
|
954
|
|
|
Business promotion
|
|
|
3,660
|
|
|
2,705
|
|
|
4,142
|
|
|
6,365
|
|
|
8,115
|
|
|
Communications
|
|
|
2,045
|
|
|
1,608
|
|
|
1,894
|
|
|
3,653
|
|
|
3,773
|
|
|
Net loss on OREO operations
|
|
|
4,624
|
|
|
2,628
|
|
|
6,778
|
|
|
7,252
|
|
|
12,615
|
|
|
Loss on sale of certain OREOs included in the bulk sale
|
|
|
250
|
|
|
-
|
|
|
-
|
|
|
250
|
|
|
-
|
|
|
Expenses related to bulk sale of assets
|
|
|
918
|
|
|
-
|
|
|
-
|
|
|
918
|
|
|
-
|
|
|
Non-recurring expenses related to
|
|
|
|
|
|
|
|
|
|
|
|
|
acquisitions of loans/assumption
|
|
|
|
|
|
|
|
|
|
|
|
|
|
|
|
|
|
of deposits from Doral
|
|
|
2,562
|
|
|
2,084
|
|
|
576
|
|
|
4,646
|
|
|
576
|
|
|
Other
|
|
|
5,863
|
|
|
5,508
|
|
|
4,920
|
|
|
11,371
|
|
|
8,918
|
|
|
Total
|
|
$
|
102,799
|
|
$
|
91,728
|
|
$
|
98,145
|
|
$
|
194,527
|
|
$
|
190,930
|
|
|
|
|
|
|
|
|
|
|
|
|
|
Table 6 – Selected Balance Sheet Data
|
|
|
|
|
|
|
|
|
(In thousands)
|
|
As of
|
|
|
|
|
June 30,
|
|
March 31,
|
|
December 31,
|
|
|
|
|
2015
|
|
2015
|
|
2014
|
|
Balance Sheet Data:
|
|
|
|
|
|
|
|
|
Loans, including loans held for sale
|
|
$
|
9,297,701
|
|
|
$
|
9,567,095
|
|
|
$
|
9,339,392
|
|
|
|
Allowance for loan and lease losses
|
|
|
221,518
|
|
|
|
226,064
|
|
|
|
222,395
|
|
|
|
Money market and investment securities
|
|
|
2,211,304
|
|
|
|
2,217,376
|
|
|
|
2,008,380
|
|
|
|
Intangible assets
|
|
|
53,235
|
|
|
|
54,634
|
|
|
|
49,907
|
|
|
|
Deferred tax asset, net
|
|
|
310,385
|
|
|
|
310,869
|
|
|
|
313,045
|
|
|
|
Total assets
|
|
|
12,578,813
|
|
|
|
13,147,919
|
|
|
|
12,727,835
|
|
|
|
Deposits
|
|
|
9,504,576
|
|
|
|
9,841,038
|
|
|
|
9,483,945
|
|
|
|
Borrowings
|
|
|
1,251,492
|
|
|
|
1,456,959
|
|
|
|
1,456,959
|
|
|
|
Total preferred equity
|
|
|
36,104
|
|
|
|
36,104
|
|
|
|
36,104
|
|
|
|
Total common equity
|
|
|
1,653,495
|
|
|
|
1,680,857
|
|
|
|
1,653,990
|
|
|
|
Accumulated other comprehensive loss, net of tax
|
|
|
(21,379
|
)
|
|
|
(11,211
|
)
|
|
|
(18,351
|
)
|
|
|
Total equity
|
|
|
1,668,220
|
|
|
|
1,705,750
|
|
|
|
1,671,743
|
|
|
|
|
|
|
|
|
|
|
Table 7 – Loan Portfolio
Composition of the loan portfolio including loans held for sale at
period-end.
|
|
|
|
|
|
|
|
|
(In thousands)
|
|
As of
|
|
|
|
|
June 30,
|
|
March 31,
|
|
December 31,
|
|
|
|
|
2015
|
|
2015
|
|
2014
|
|
|
|
|
|
|
|
|
|
|
Residential mortgage loans
|
|
$
|
3,327,350
|
|
$
|
3,331,620
|
|
$
|
3,011,187
|
|
|
|
|
|
|
|
|
|
|
Commercial loans:
|
|
|
|
|
|
|
|
|
Construction loans
|
|
|
120,848
|
|
|
124,440
|
|
|
123,480
|
|
|
Commercial mortgage loans
|
|
|
1,518,151
|
|
|
1,649,263
|
|
|
1,665,787
|
|
|
Commercial and Industrial loans
|
|
|
2,352,111
|
|
|
2,442,867
|
|
|
2,479,437
|
|
Commercial loans
|
|
|
3,991,110
|
|
|
4,216,570
|
|
|
4,268,704
|
|
|
|
|
|
|
|
|
|
|
Finance leases
|
|
|
228,280
|
|
|
230,183
|
|
|
232,126
|
|
|
|
|
|
|
|
|
|
|
Consumer loans
|
|
|
1,670,935
|
|
|
1,706,999
|
|
|
1,750,419
|
|
|
Loans held for investment
|
|
|
9,217,675
|
|
|
9,485,372
|
|
|
9,262,436
|
|
Loans held for sale
|
|
|
80,026
|
|
|
81,723
|
|
|
76,956
|
|
|
Total loans
|
|
$
|
9,297,701
|
|
$
|
9,567,095
|
|
$
|
9,339,392
|
|
|
|
|
|
|
|
|
|
Table 8 – Loan Portfolio by Geography
|
|
|
|
|
|
|
|
|
|
|
(In thousands)
|
|
As of June 30, 2015
|
|
|
|
|
Puerto Rico
|
|
|
Virgin Islands
|
|
|
United States
|
|
|
Consolidated
|
|
|
|
|
|
|
|
|
|
|
|
|
|
|
|
Residential mortgage loans
|
|
$
|
2,612,613
|
|
|
$
|
333,914
|
|
|
$
|
380,823
|
|
|
$
|
3,327,350
|
|
|
|
|
|
|
|
|
|
|
|
|
|
|
|
Commercial loans:
|
|
|
|
|
|
|
|
|
|
|
|
|
|
Construction loans
|
|
|
62,037
|
|
|
|
30,168
|
|
|
|
28,643
|
|
|
|
120,848
|
|
|
Commercial mortgage loans
|
|
|
1,182,764
|
|
|
|
73,516
|
|
|
|
261,871
|
|
|
|
1,518,151
|
|
|
Commercial and Industrial loans
|
|
|
1,925,811
|
|
|
|
121,361
|
|
|
|
304,939
|
|
|
|
2,352,111
|
|
Commercial loans
|
|
|
3,170,612
|
|
|
|
225,045
|
|
|
|
595,453
|
|
|
|
3,991,110
|
|
|
|
|
|
|
|
|
|
|
|
|
|
|
|
Finance leases
|
|
|
228,280
|
|
|
|
-
|
|
|
|
-
|
|
|
|
228,280
|
|
|
|
|
|
|
|
|
|
|
|
|
|
|
|
Consumer loans
|
|
|
1,583,342
|
|
|
|
47,071
|
|
|
|
40,522
|
|
|
|
1,670,935
|
|
Loans held for investment
|
|
|
7,594,847
|
|
|
|
606,030
|
|
|
|
1,016,798
|
|
|
|
9,217,675
|
|
|
|
|
|
|
|
|
|
|
|
|
|
|
|
Loans held for sale
|
|
|
38,425
|
|
|
|
40,170
|
|
|
|
1,431
|
|
|
|
80,026
|
|
|
Total loans
|
|
$
|
7,633,272
|
|
|
$
|
646,200
|
|
|
$
|
1,018,229
|
|
|
$
|
9,297,701
|
|
|
|
|
|
|
|
|
|
|
|
|
|
|
|
|
|
|
|
|
|
|
|
|
|
|
|
|
|
(In thousands)
|
|
As of March 31, 2015
|
|
|
|
|
Puerto Rico
|
|
|
Virgin Islands
|
|
|
United States
|
|
|
Consolidated
|
|
|
|
|
|
|
|
|
|
|
|
|
|
|
|
Residential mortgage loans
|
|
$
|
2,632,602
|
|
|
$
|
336,916
|
|
|
$
|
362,102
|
|
|
$
|
3,331,620
|
|
|
|
|
|
|
|
|
|
|
|
|
|
|
|
Commercial loans:
|
|
|
|
|
|
|
|
|
|
|
|
|
|
Construction loans
|
|
|
69,810
|
|
|
|
28,564
|
|
|
|
26,066
|
|
|
|
124,440
|
|
|
Commercial mortgage loans
|
|
|
1,309,257
|
|
|
|
68,367
|
|
|
|
271,639
|
|
|
|
1,649,263
|
|
|
Commercial and Industrial loans
|
|
|
2,018,229
|
|
|
|
125,389
|
|
|
|
299,249
|
|
|
|
2,442,867
|
|
Commercial loans
|
|
|
3,397,296
|
|
|
|
222,320
|
|
|
|
596,954
|
|
|
|
4,216,570
|
|
|
|
|
|
|
|
|
|
|
|
|
|
|
|
Finance leases
|
|
|
230,183
|
|
|
|
-
|
|
|
|
-
|
|
|
|
230,183
|
|
|
|
|
|
|
|
|
|
|
|
|
|
|
|
Consumer loans
|
|
|
1,621,126
|
|
|
|
47,273
|
|
|
|
38,600
|
|
|
|
1,706,999
|
|
Loans held for investment
|
|
|
7,881,207
|
|
|
|
606,509
|
|
|
|
997,656
|
|
|
|
9,485,372
|
|
|
|
|
|
|
|
|
|
|
|
|
|
|
|
Loans held for sale
|
|
|
40,284
|
|
|
|
40,314
|
|
|
|
1,125
|
|
|
|
81,723
|
|
|
Total loans
|
|
$
|
7,921,491
|
|
|
$
|
646,823
|
|
|
$
|
998,781
|
|
|
$
|
9,567,095
|
|
|
|
|
|
|
|
|
|
|
|
|
|
|
|
|
|
|
|
|
|
|
|
|
|
|
|
|
|
(In thousands)
|
|
As of December 31, 2014
|
|
|
|
|
Puerto Rico
|
|
|
Virgin Islands
|
|
|
United States
|
|
|
Consolidated
|
|
|
|
|
|
|
|
|
|
|
|
|
|
|
|
Residential mortgage loans
|
|
$
|
2,325,455
|
|
|
$
|
341,098
|
|
|
$
|
344,634
|
|
|
$
|
3,011,187
|
|
|
|
|
|
|
|
|
|
|
|
|
|
|
|
Commercial loans:
|
|
|
|
|
|
|
|
|
|
|
|
|
|
Construction loans
|
|
|
70,618
|
|
|
|
30,011
|
|
|
|
22,851
|
|
|
|
123,480
|
|
|
Commercial mortgage loans
|
|
|
1,305,057
|
|
|
|
69,629
|
|
|
|
291,101
|
|
|
|
1,665,787
|
|
|
Commercial and Industrial loans
|
|
|
2,072,265
|
|
|
|
120,947
|
|
|
|
286,225
|
|
|
|
2,479,437
|
|
Commercial loans
|
|
|
3,447,940
|
|
|
|
220,587
|
|
|
|
600,177
|
|
|
|
4,268,704
|
|
|
|
|
|
|
|
|
|
|
|
|
|
|
|
Finance leases
|
|
|
232,126
|
|
|
|
-
|
|
|
|
-
|
|
|
|
232,126
|
|
|
|
|
|
|
|
|
|
|
|
|
|
|
|
Consumer loans
|
|
|
1,666,373
|
|
|
|
47,811
|
|
|
|
36,235
|
|
|
|
1,750,419
|
|
Loans held for investment
|
|
|
7,671,894
|
|
|
|
609,496
|
|
|
|
981,046
|
|
|
|
9,262,436
|
|
|
|
|
|
|
|
|
|
|
|
|
|
|
|
Loans held for sale
|
|
|
34,972
|
|
|
|
40,317
|
|
|
|
1,667
|
|
|
|
76,956
|
|
|
Total loans
|
|
$
|
7,706,866
|
|
|
$
|
649,813
|
|
|
$
|
982,713
|
|
|
$
|
9,339,392
|
|
|
|
|
|
|
|
|
|
|
|
|
|
|
Table 9 – Non-Performing Assets
|
|
|
|
|
|
|
|
|
(Dollars in thousands)
|
|
June 30,
|
|
March 31,
|
|
December 31,
|
|
|
|
|
2015
|
|
2015
|
|
2014
|
|
Non-performing loans held for investment:
|
|
|
|
|
|
|
|
|
Residential mortgage
|
|
$
|
175,035
|
|
|
$
|
172,583
|
|
|
$
|
180,707
|
|
|
|
Commercial mortgage
|
|
|
95,088
|
|
|
|
142,385
|
|
|
|
148,473
|
|
|
|
Commercial and Industrial
|
|
|
143,935
|
|
|
|
186,500
|
|
|
|
122,547
|
|
|
|
Construction
|
|
|
16,118
|
|
|
|
27,163
|
|
|
|
29,354
|
|
|
|
Consumer and Finance leases
|
|
|
33,397
|
|
|
|
34,913
|
|
|
|
42,815
|
|
|
|
Total non-performing loans held for investment
|
|
|
463,573
|
|
|
|
563,544
|
|
|
|
523,896
|
|
|
|
|
|
|
|
|
|
|
|
OREO
|
|
|
122,129
|
|
|
|
122,628
|
|
|
|
124,003
|
|
|
Other repossessed property
|
|
|
10,706
|
|
|
|
13,585
|
|
|
|
14,229
|
|
|
|
Total non-performing assets, excluding loans held for sale
|
|
$
|
596,408
|
|
|
$
|
699,757
|
|
|
$
|
662,128
|
|
|
|
|
|
|
|
|
|
|
|
Non-performing loans held for sale
|
|
|
48,032
|
|
|
|
54,588
|
|
|
|
54,641
|
|
|
|
Total non-performing assets, including loans held for sale (1)
|
|
$
|
644,440
|
|
|
$
|
754,345
|
|
|
$
|
716,769
|
|
|
|
|
|
|
|
|
|
|
|
Past-due loans 90 days and still accruing (2)
|
|
$
|
196,547
|
|
|
$
|
178,572
|
|
|
$
|
162,887
|
|
|
Allowance for loan and lease losses
|
|
$
|
221,518
|
|
|
$
|
226,064
|
|
|
$
|
222,395
|
|
|
Allowance to total non-performing loans held for investment
|
|
|
47.79
|
%
|
|
|
40.11
|
%
|
|
|
42.45
|
%
|
|
Allowance to total non-performing loans held for investment,
excluding residential real estate loans
|
|
|
76.77
|
%
|
|
|
57.82
|
%
|
|
|
64.80
|
%
|
|
|
|
|
|
|
|
|
|
|
(1)
|
Purchased credit impaired loans of $178.5 million accounted for
under ASC 310-30 as of June 30, 2015, primarily mortgage loans
acquired from Doral in the first quarter of 2015 and second quarter
of 2014, are excluded and not considered non-performing due to the
application of the accretion method, under which these loans will
accrete interest income over the remaining life of the loans using
estimated cash flow analysis.
|
|
|
|
|
|
(2)
|
Amount includes purchased credit impaired loans with individual
delinquencies over 90 days and still accruing with a carrying value
as of June 30, 2015 of approximately $18.2 million, primarily
related to loans acquired from Doral in the first quarter of 2015
and second quarter of 2014.
|
|
|
|
|
|
|
|
|
Table 10– Non-Performing Assets by Geography
|
|
|
|
|
|
|
|
|
(In thousands)
|
|
June 30,
|
|
March 31,
|
|
December 31,
|
|
|
|
|
2015
|
|
2015
|
|
2014
|
|
Puerto Rico:
|
|
|
|
|
|
|
|
Non-performing loans held for investment:
|
|
|
|
|
|
|
|
|
Residential mortgage
|
|
$
|
154,446
|
|
$
|
149,156
|
|
$
|
156,361
|
|
|
Commercial mortgage
|
|
|
77,436
|
|
|
120,770
|
|
|
121,879
|
|
|
Commercial and Industrial
|
|
|
138,481
|
|
|
180,793
|
|
|
116,301
|
|
|
Construction
|
|
|
12,398
|
|
|
23,269
|
|
|
24,526
|
|
|
Finance leases
|
|
|
3,257
|
|
|
2,979
|
|
|
5,245
|
|
|
Consumer
|
|
|
28,247
|
|
|
30,003
|
|
|
35,286
|
|
|
Total non-performing loans held for investment
|
|
|
414,265
|
|
|
506,970
|
|
|
459,598
|
|
|
|
|
|
|
|
|
|
|
OREO
|
|
|
110,551
|
|
|
110,378
|
|
|
111,041
|
|
Other repossessed property
|
|
|
10,653
|
|
|
13,520
|
|
|
14,150
|
|
|
Total non-performing assets, excluding loans held for sale
|
|
$
|
535,469
|
|
$
|
630,868
|
|
$
|
584,789
|
|
Non-performing loans held for sale
|
|
|
8,027
|
|
|
14,583
|
|
|
14,636
|
|
|
Total non-performing assets, including loans held for sale (1)
|
|
$
|
543,496
|
|
$
|
645,451
|
|
$
|
599,425
|
|
Past-due loans 90 days and still accruing (2)
|
|
$
|
189,619
|
|
$
|
176,361
|
|
$
|
154,375
|
|
|
|
|
|
|
|
|
|
|
Virgin Islands:
|
|
|
|
|
|
|
|
Non-performing loans held for investment:
|
|
|
|
|
|
|
|
|
Residential mortgage
|
|
$
|
14,265
|
|
$
|
16,522
|
|
$
|
15,483
|
|
|
Commercial mortgage
|
|
|
10,642
|
|
|
12,909
|
|
|
11,770
|
|
|
Commercial and Industrial
|
|
|
5,454
|
|
|
5,707
|
|
|
6,246
|
|
|
Construction
|
|
|
3,565
|
|
|
3,738
|
|
|
4,064
|
|
|
Consumer
|
|
|
531
|
|
|
549
|
|
|
887
|
|
|
Total non-performing loans held for investment
|
|
|
34,457
|
|
|
39,425
|
|
|
38,450
|
|
|
|
|
|
|
|
|
|
|
OREO
|
|
|
6,152
|
|
|
6,064
|
|
|
6,967
|
|
Other repossessed property
|
|
|
17
|
|
|
30
|
|
|
22
|
|
|
Total non-performing assets, excluding loans held for sale
|
|
$
|
40,626
|
|
$
|
45,519
|
|
$
|
45,439
|
|
Non-performing loans held for sale
|
|
|
40,005
|
|
|
40,005
|
|
|
40,005
|
|
|
Total non-performing assets, including loans held for sale
|
|
$
|
80,631
|
|
$
|
85,524
|
|
$
|
85,444
|
|
Past-due loans 90 days and still accruing
|
|
$
|
6,303
|
|
$
|
2,004
|
|
$
|
5,281
|
|
|
|
|
|
|
|
|
|
|
United States:
|
|
|
|
|
|
|
|
Non-performing loans held for investment:
|
|
|
|
|
|
|
|
|
Residential mortgage
|
|
$
|
6,324
|
|
$
|
6,905
|
|
$
|
8,863
|
|
|
Commercial mortgage
|
|
|
7,010
|
|
|
8,706
|
|
|
14,824
|
|
|
Commercial and Industrial
|
|
|
-
|
|
|
-
|
|
|
-
|
|
|
Construction
|
|
|
155
|
|
|
156
|
|
|
764
|
|
|
Consumer
|
|
|
1,362
|
|
|
1,382
|
|
|
1,397
|
|
|
Total non-performing loans held for investment
|
|
|
14,851
|
|
|
17,149
|
|
|
25,848
|
|
|
|
|
|
|
|
|
|
|
OREO
|
|
|
5,426
|
|
|
6,186
|
|
|
5,995
|
|
Other repossessed property
|
|
|
36
|
|
|
35
|
|
|
57
|
|
|
Total non-performing assets, excluding loans held for sale
|
|
$
|
20,313
|
|
$
|
23,370
|
|
$
|
31,900
|
|
Non-performing loans held for sale
|
|
|
-
|
|
|
-
|
|
|
-
|
|
|
Total non-performing assets, including loans held for sale
|
|
$
|
20,313
|
|
$
|
23,370
|
|
$
|
31,900
|
|
Past-due loans 90 days and still accruing
|
|
$
|
625
|
|
$
|
207
|
|
$
|
3,231
|
|
|
|
|
|
|
|
|
|
|
(1)
|
Purchased credit impaired loans of $178.5 million accounted for
under ASC 310-30 as of June 30, 2015, primarily mortgage loans
acquired from Doral in the first quarter of 2015 and second quarter
of 2014, are excluded and not considered non-performing due to the
application of the accretion method, under which these loans will
accrete interest income over the remaining life of the loans using
estimated cash flow analysis.
|
|
|
|
|
|
|
|
(2)
|
Amount includes purchased credit impaired loans with individual
delinquencies over 90 days and still accruing with a carrying value
as of June 30, 2015 of approximately $18.2 million, primarily
related to loans acquired from Doral in the first quarter of 2015
and second quarter of 2014.
|
|
|
|
|
|
|
|
Table 11 – Allowance for Loan and Lease Losses
|
|
|
|
|
|
|
|
|
|
|
|
|
Quarter Ended
|
|
Year Ended
|
|
|
(Dollars in thousands)
|
|
June 30,
|
|
March 31,
|
|
June 30,
|
|
June 30,
|
|
June 30,
|
|
|
|
|
2015
|
|
2015
|
|
|
2014
|
|
2015
|
|
2014
|
|
|
|
|
|
|
|
|
|
|
|
|
|
|
|
Allowance for loan and lease losses, beginning of period
|
|
$
|
226,064
|
|
|
$
|
222,395
|
|
|
$
|
266,778
|
|
|
$
|
222,395
|
|
|
$
|
285,858
|
|
|
|
Provision for loan and lease losses
|
|
|
74,266
|
|
(1)
|
|
32,970
|
|
|
|
26,744
|
|
(6)
|
|
107,236
|
|
(1)
|
|
58,659
|
|
(6)
|
|
Net (charge-offs) recoveries of loans:
|
|
|
|
|
|
|
|
|
|
|
|
|
Residential mortgage
|
|
|
(3,257
|
)
|
|
|
(5,094
|
)
|
|
|
(4,687
|
)
|
|
|
(8,351
|
)
|
|
|
(11,040
|
)
|
|
|
Commercial mortgage
|
|
|
(41,665
|
)
|
(2)
|
|
(3,730
|
)
|
|
|
(9,126
|
)
|
|
|
(45,395
|
)
|
(2)
|
|
(14,901
|
)
|
|
|
Commercial and Industrial
|
|
|
(20,417
|
)
|
(3)
|
|
(3,895
|
)
|
|
|
(19,036
|
)
|
(7)
|
|
(24,312
|
)
|
(3)
|
|
(40,832
|
)
|
(7)
|
|
Construction
|
|
|
(2,083
|
)
|
(4)
|
|
(398
|
)
|
|
|
(2,606
|
)
|
|
|
(2,481
|
)
|
(4)
|
|
(2,959
|
)
|
|
|
Consumer and finance leases
|
|
|
(11,390
|
)
|
|
|
(16,184
|
)
|
|
|
(16,890
|
)
|
|
|
(27,574
|
)
|
|
|
(33,608
|
)
|
|
|
Net charge-offs
|
|
|
(78,812
|
)
|
(5)
|
|
(29,301
|
)
|
|
|
(52,345
|
)
|
(7)
|
|
(108,113
|
)
|
(5)
|
|
(103,340
|
)
|
(7)
|
|
Allowance for loan and lease losses, end of period
|
|
$
|
221,518
|
|
|
$
|
226,064
|
|
|
$
|
241,177
|
|
|
$
|
221,518
|
|
|
$
|
241,177
|
|
|
|
|
|
|
|
|
|
|
|
|
|
|
|
|
Allowance for loan and lease losses to period end total loans
|
|
|
|
|
|
|
|
|
|
|
|
|
|
|
|
|
|
|
|
|
|
|
held for investment
|
|
|
2.40
|
%
|
|
|
2.38
|
%
|
|
|
2.55
|
%
|
|
|
2.40
|
%
|
|
|
2.55
|
%
|
|
|
Net charge-offs (annualized) to average loans outstanding
|
|
|
|
|
|
|
|
|
|
|
|
|
|
|
|
|
|
|
|
|
|
|
during the period
|
|
|
3.35
|
%
|
|
|
1.25
|
%
|
|
|
2.19
|
%
|
|
|
2.30
|
%
|
|
|
2.15
|
%
|
|
|
Net charge-offs (annualized), excluding charge-offs of $61.4
|
|
|
|
|
|
|
|
|
|
|
|
|
|
|
|
|
|
|
|
|
|
|
million related to the bulk sale of assets in the second
|
|
|
|
|
|
|
|
|
|
|
|
|
|
|
|
|
|
|
|
|
|
|
quarter of 2015 and $6.9 million related to the acquisition
|
|
|
|
|
|
|
|
|
|
|
|
|
|
|
|
|
|
|
|
|
|
|
of mortgage loans from Doral in the second quarter of 2014,
|
|
|
|
|
|
|
|
|
|
|
|
|
|
|
|
|
|
|
|
|
|
|
to average loans outstanding during the period
|
|
|
0.75
|
%
|
|
|
1.25
|
%
|
|
|
1.90
|
%
|
|
|
1.01
|
%
|
|
|
2.01
|
%
|
|
|
Provision for loan and lease losses to net charge-offs during
|
|
0.94x
|
|
1.13x
|
|
0.51x
|
|
0.99x
|
|
0.57x
|
|
|
the period
|
|
|
|
|
|
|
|
|
|
|
|
|
Provision for loan and lease losses to net charge-offs during
|
|
1.57x
|
|
1.13x
|
|
0.56x
|
|
1.29x
|
|
0.59x
|
|
|
the period, excluding impact of the bulk sale of assets in
|
|
|
|
|
|
|
|
|
|
|
|
|
the second quarter of 2015 and the acquisition of mortgage
|
|
|
|
|
|
|
|
|
|
|
|
|
loans from Doral in the second quarter of 2014
|
|
|
|
|
|
|
|
|
|
|
|
|
(1) Includes provision of $46.9 million associated with the bulk
sale of assets.
|
|
(2) Includes net charge-offs totaling $37.6 million associated with
the bulk sale of assets.
|
|
(3) Includes net charge-offs totaling $20.6 million associated with
the bulk sale of assets.
|
|
(4) Includes net charge-offs totaling $3.3 million associated with
the bulk sale of assets.
|
|
(5) Includes net charge-offs totaling $61.4 million associated with
the bulk sale of assets.
|
|
(6) Includes a provision of $1.4 million associated with the
acquisition of mortgage loans from Doral.
|
|
(7) Includes net charge-offs totaling $6.9 million associated with
the acquisition of mortgage loans from Doral.
|
|
|
|
|
Table 12 – Net Charge-Offs to Average Loans
|
|
|
|
|
|
|
|
|
Six-Month
Period ended
|
|
Year Ended
|
|
|
|
June 30, 2015
|
|
December 31,
|
|
December 31,
|
|
December 31,
|
|
December 31,
|
|
|
|
(annualized)
|
|
2014
|
|
2013
|
|
2012
|
|
2011
|
|
|
|
|
|
|
|
|
|
|
|
|
|
Residential mortgage
|
|
0.52%
|
|
0.85%
|
|
4.77%
|
(7)
|
1.32
|
%
|
|
1.32
|
%
|
|
|
|
|
|
|
|
|
|
|
|
|
|
Commercial mortgage
|
|
5.55%
|
(1)
|
0.84%
|
|
3.44%
|
(8)
|
1.41
|
%
|
|
3.21
|
%
|
|
|
|
|
|
|
|
|
|
|
|
|
|
Commercial and Industrial
|
|
2.00%
|
(2)
|
2.13%
|
(5)
|
3.52%
|
(9)
|
1.21
|
%
|
|
1.57
|
%
|
|
|
|
|
|
|
|
|
|
|
|
|
|
Construction
|
|
2.90%
|
(3)
|
2.76%
|
|
15.11%
|
(10)
|
10.49
|
%
|
|
16.33
|
%
|
|
|
|
|
|
|
|
|
|
|
|
|
|
Consumer and finance leases
|
|
2.85%
|
|
3.46%
|
|
2.76%
|
|
1.92
|
%
|
|
2.33
|
%
|
|
|
|
|
|
|
|
|
|
|
|
|
|
Total loans
|
|
2.30%
|
(4)
|
1.81%
|
(6)
|
4.01%
|
(11)
|
1.74
|
%
|
|
2.68
|
%
|
|
|
|
|
|
|
|
|
|
|
|
|
|
(1) Includes net charge-offs totaling $37.6 million associated with
the bulk sale of assets. The ratio of commercial mortgage net
charge-offs to average loans, excluding charge-offs associated with
the bulk sale of assets, was 1.00%.
|
|
(2) Includes net charge-offs totaling $20.6 million associated with
the bulk sale of assets. The ratio of commercial and industrial net
charge-offs to average loans, excluding charge-offs associated with
the bulk sale of assets, was 0.31%.
|
|
(3) Includes net charge-offs totaling $3.3 million associated with
the bulk sale of assets. The ratio of construction net charge-offs
to average loans, excluding charge-offs associated with the bulk
sale of assets, was (0.98)%.
|
|
(4) Includes net charge-offs totaling $61.4 million associated with
the bulk sale of assets. The ratio of total charge-offs to average
loans, excluding charge-offs associated with the bulk sale of
assets, was 1.01%.
|
|
(5) Includes net charge-offs totaling $6.9 million associated with
the acquisition of mortgage loans from Doral in the second quarter
of 2014. The ratio of commercial and industrial net charge-offs to
average loans, excluding charge-offs associated with the acquisition
of mortgage loans from Doral, was 1.95%.
|
|
(6) Includes net charge-offs totaling $6.9 million associated with
the acquisition of mortgage loans from Doral in the second quarter
of 2014. The ratio of total net charge-offs to average loans,
excluding charge-offs associated with the acquisition of mortgage
loans from Doral, was 1.74%.
|
|
(7) Includes net charge-offs totaling $99.0 million associated with
the bulk loan sales. The ratio of residential mortgage net
charge-offs to average loans, excluding charge-offs associated with
the bulk loan sales, was 1.13%.
|
|
(8) Includes net charge-offs totaling $54.6 million associated with
the bulk sale of adversely classified commercial assets and the
transfer of loans to held for sale in the first quarter of 2013. The
ratio of commercial mortgage net charge-offs to average loans,
excluding charge-offs associated with the bulk sale of adversely
classified commercial assets and the transfer of loans to held for
sale, was 0.45%.
|
|
(9) Includes net charge-offs totaling $44.7 million associated with
the bulk sale of adversely classified commercial assets. The ratio
of commercial and industrial net charge-offs to average loans,
excluding charge-offs associated with the bulk sale of adversely
classified commercial assets, was 2.04%.
|
|
(10) Includes net charge-offs totaling $34.2 million associated with
the bulk loan sales and the transfer of loans to held for sale. The
ratio of construction loan net charge-offs to average loans,
excluding charge-offs associated with the bulk loan sales and the
transfer of loans to held for sale, was 2.91%.
|
|
(11) Includes net charge-offs totaling $232.4 million associated
with the bulk loan sales and the transfer of loans to held for sale.
The ratio of total net charge-offs to average loans, excluding
charge-offs associated with the bulk loan sales and the transfer of
loans to held for sale, was 1.68%.
|
|
|
|
|
|
|
|
|
|
CONTACT:
First BanCorp.
John B. Pelling III, 305-577-6000
Ext. 162
Investor Relations Officer
john.pelling@firstbankpr.com