First Bancorp. Announces Earnings for the Quarter and Year Ended December 31, 2014
2014 Fourth Quarter Highlights and Comparison with Third Quarter
|
●
|
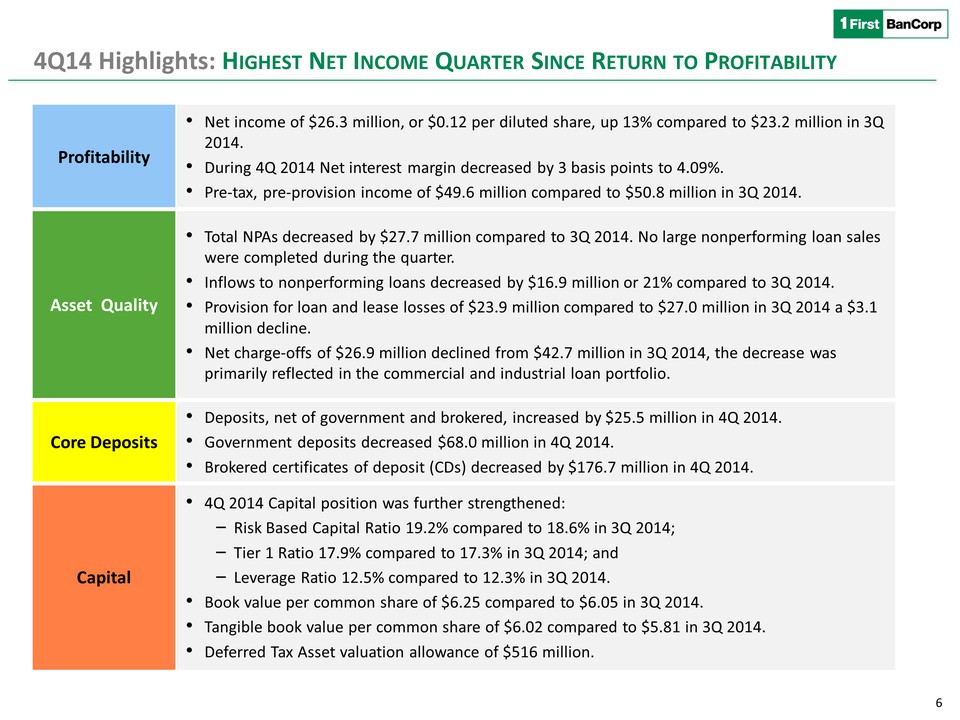
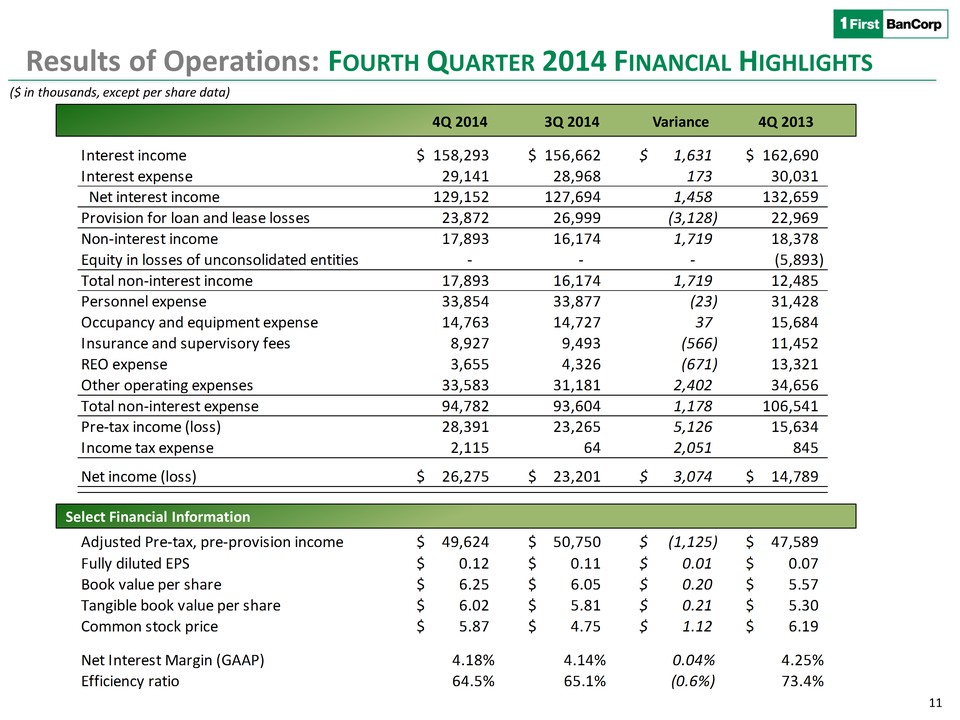
Net income of $26.3 million, or $0.12 per diluted share, compared to $23.2 million, or $0.11 per diluted share, for the third quarter of 2014.
|
|
●
|
Pre-tax, pre-provision income of $49.6 million, compared to $50.8 million for the third quarter of 2014.
|
|
●
|
Provision for loan and lease losses for the quarter decreased by $3.1 million to $23.9 million, mainly reflecting a reduction in net charge-offs, reserve releases due to improvements in the risk classification of certain commercial and industrial loans, and a decline in the migration of commercial mortgage loans to a worse loan classification.
|
|
●
|
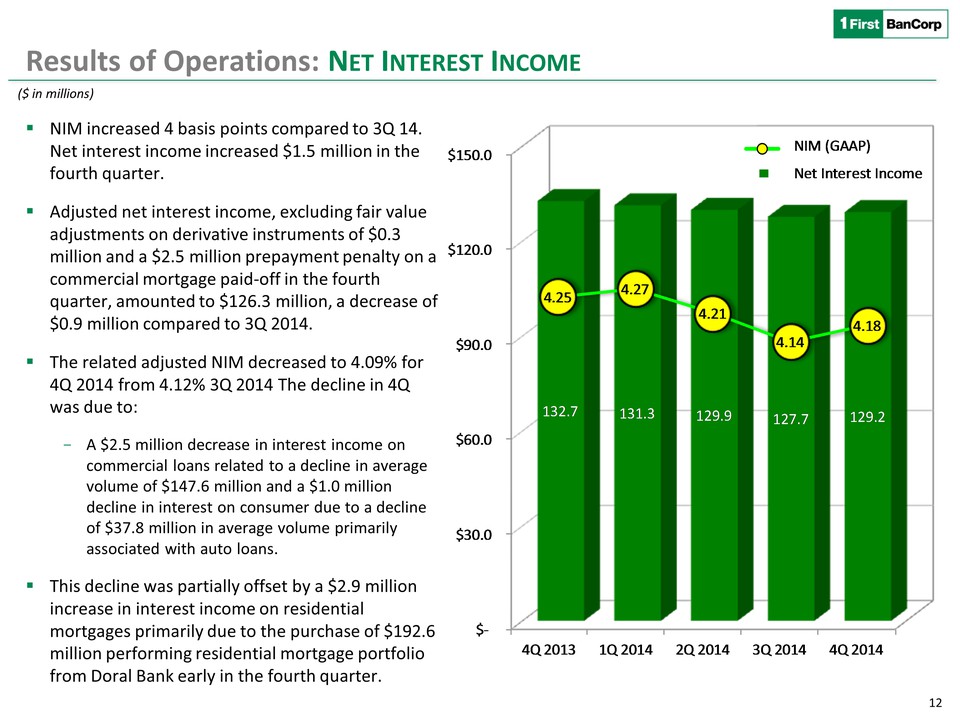
Net interest income increased by $1.5 million to $129.2 million. Adjusted net interest income, excluding fair value adjustments on derivative instruments of $0.3 million and a $2.5 million prepayment penalty collected on a commercial mortgage loan paid off in the fourth quarter, decreased by $0.9 million to $126.3 million driven by declines in the size of the commercial portfolios. The related net interest margin decreased by 3 basis points in the fourth quarter of 2014 to 4.09% compared to 4.12% in the third quarter of 2014.
|
|
●
|
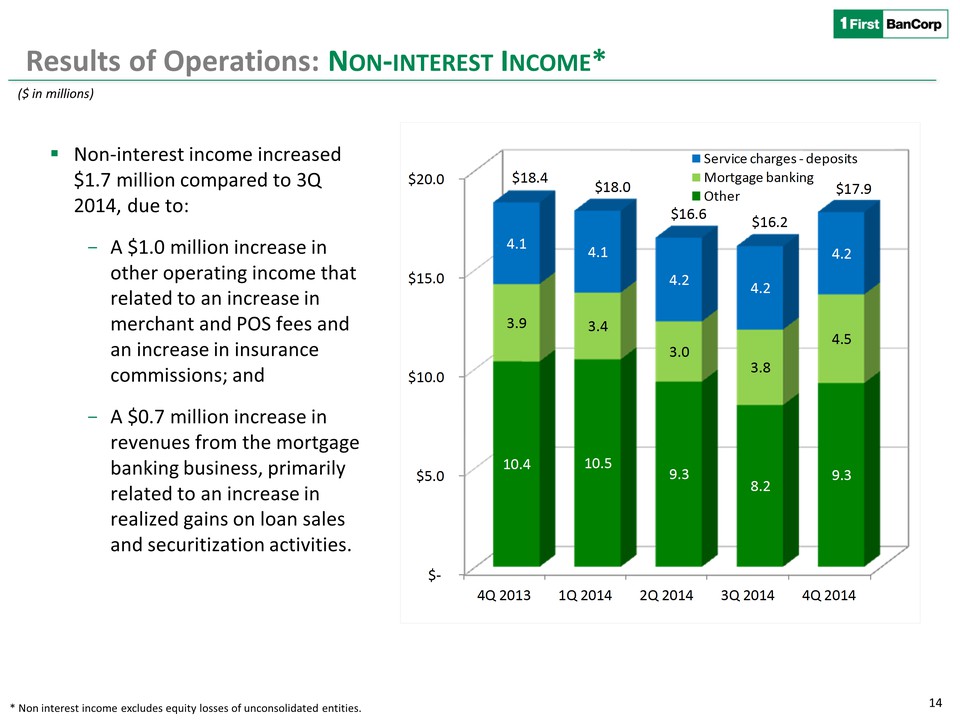
Non-interest income increased by $1.7 million to $17.9 million for the quarter, primarily due to an increase in merchant and Point of Sale (“POS”) fees as a result of seasonally higher transaction volumes and an increase in revenues from the mortgage banking business.
|
|
●
|
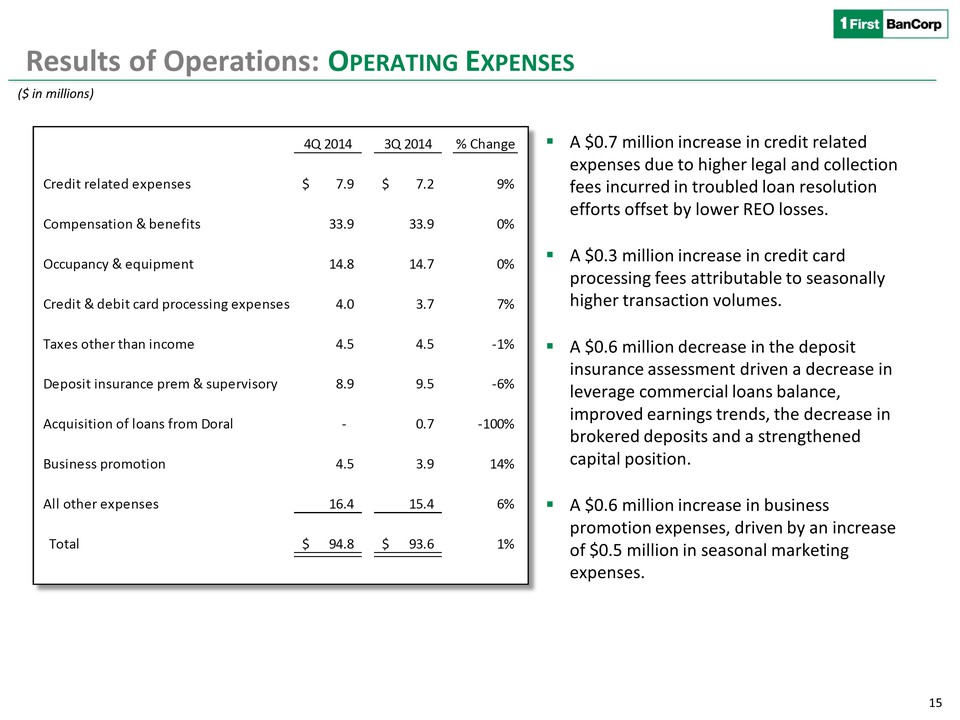
Non-interest expenses for the quarter increased by $1.2 million to $94.8 million, primarily reflecting, among other things, increases in professional service fees and business promotion expenses.
|
|
●
|
Credit quality variances:
|
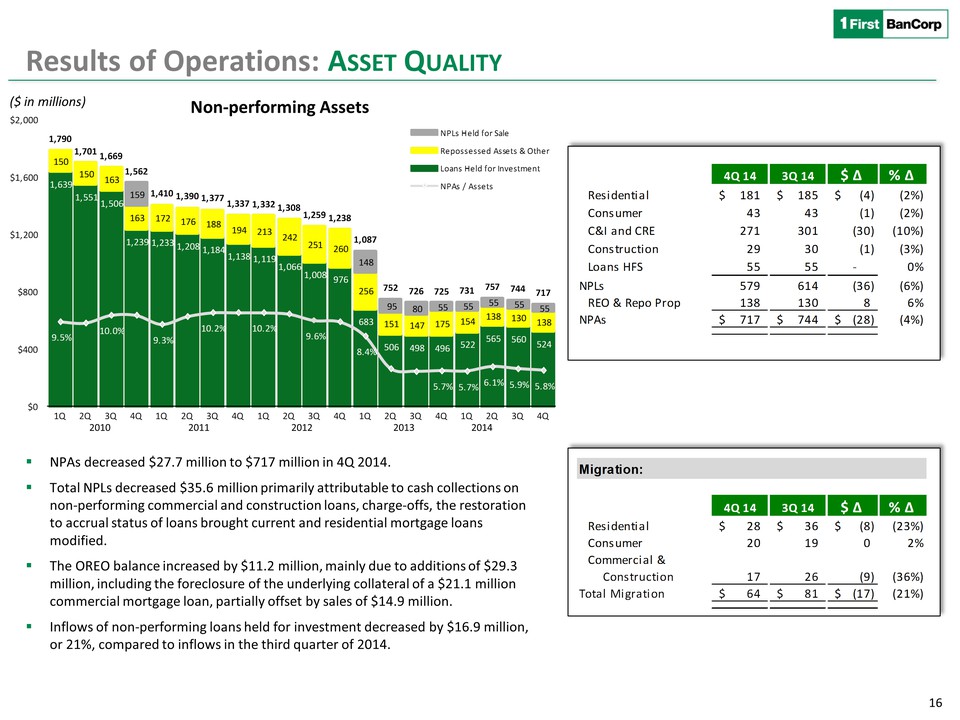
- Non-performing assets decreased by $27.7 million, or 4%, to $716.8 million.
- Non-performing loans, including non-performing loans held for sale, decreased by $35.6 million to $578.5 million.
- New non-performing loan inflows decreased by $16.9 million to $64.2 million, or 21%, compared to inflows of $81.1 million in the third quarter of 2014.
- The other real estate owned inventory balance increased by $11.2 million to $124.0 million, mainly due to additions of $29.3 million, including the foreclosure of the underlying collateral of a $21.1 million commercial mortgage loan, partially offset by sales of $14.9 million completed in the fourth quarter and adjustments to value of $3.2 million.
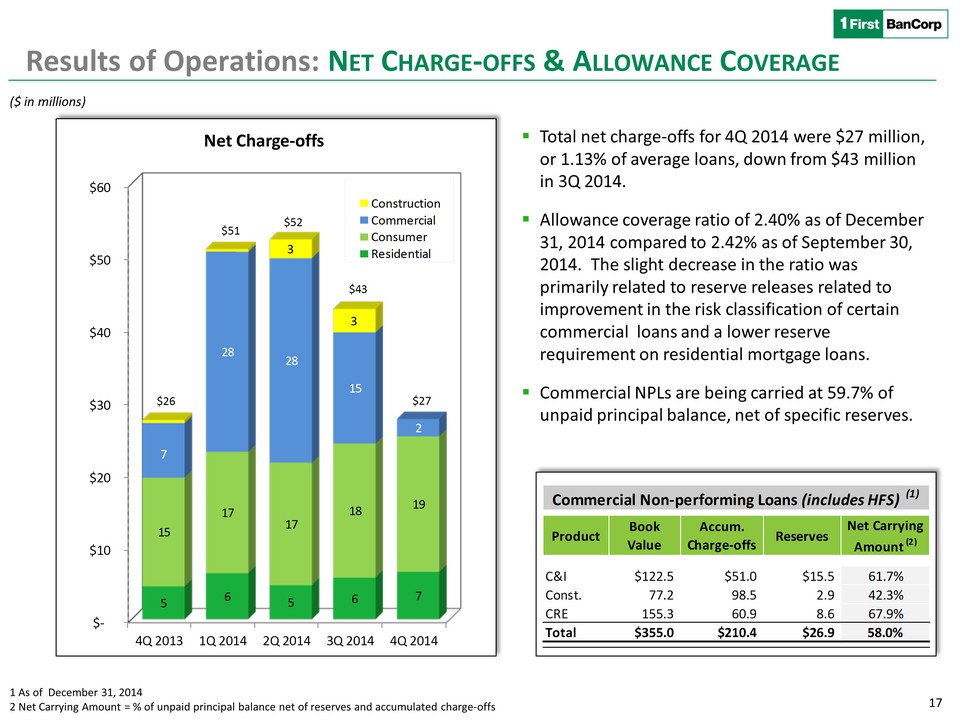
- Net charge-offs of $26.9 million compared to $42.7 million for the third quarter of 2014, a decrease primarily reflected in the commercial and industrial loan portfolio.
|
●
|
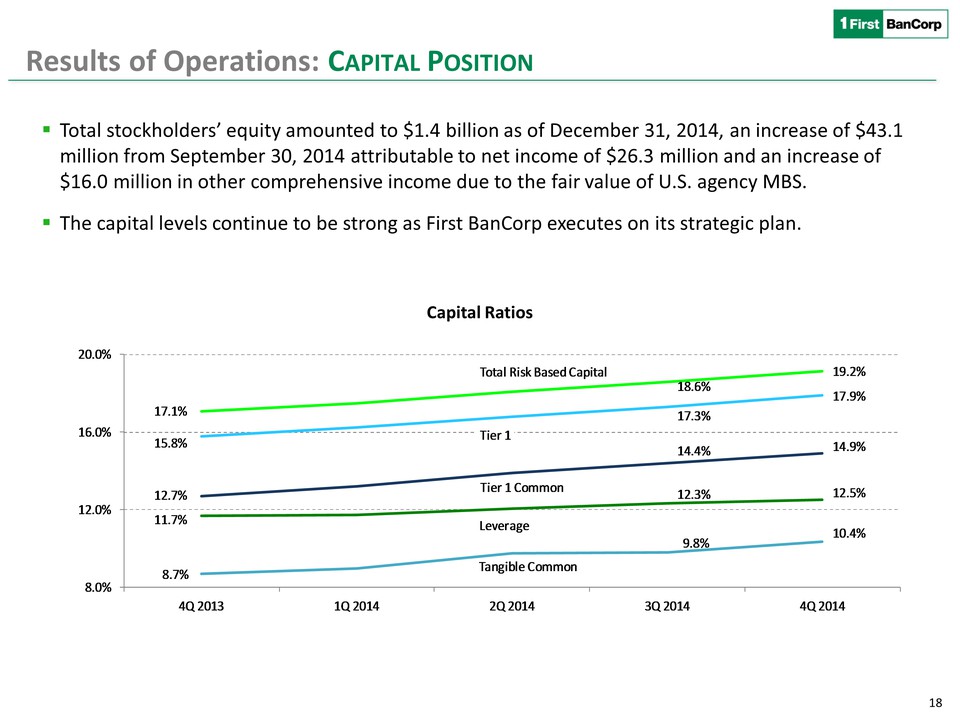
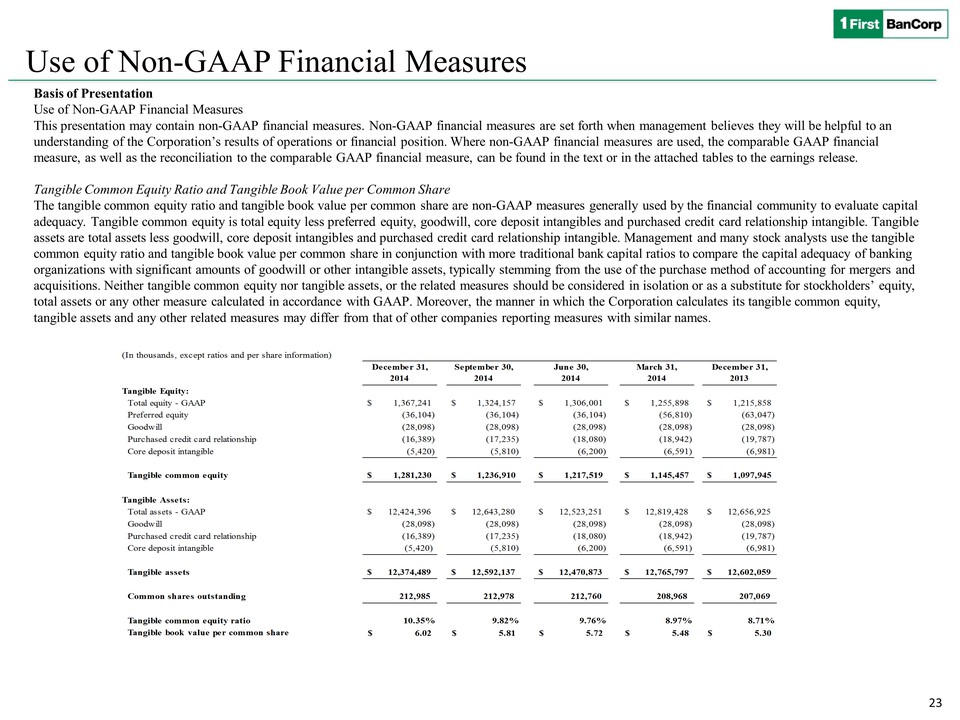
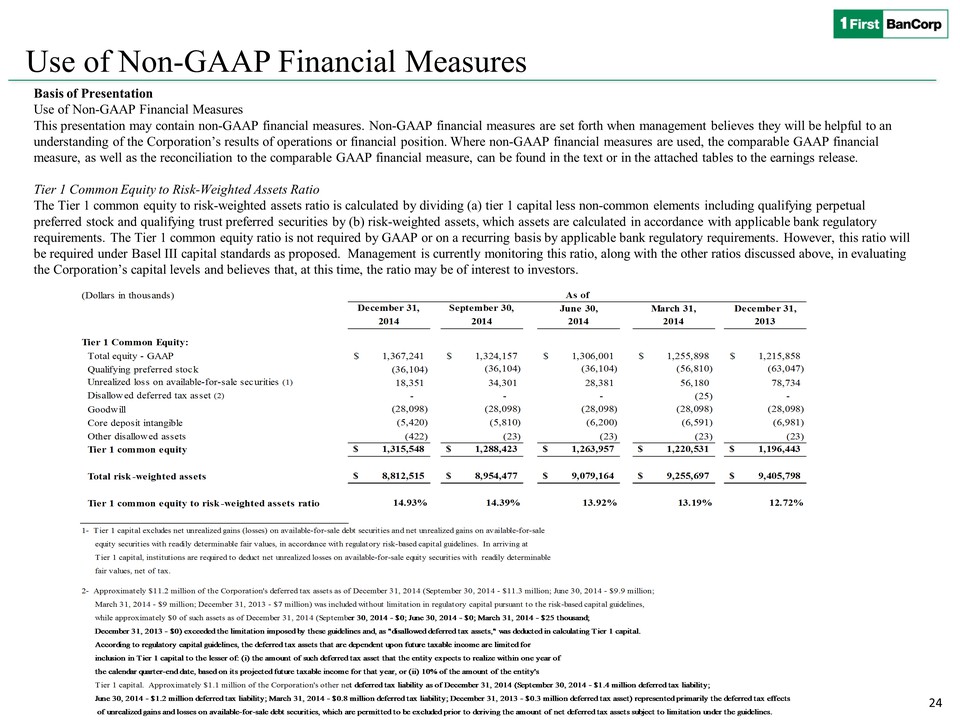
Total capital, Tier 1 capital, and leverage ratios of 19.16%, 17.89%, and 12.54%, respectively, as of December 31, 2014. Common equity Tier 1 capital ratio of 14.93% and tangible common equity ratio of 10.35% as of December 31, 2014.
|
|
●
|
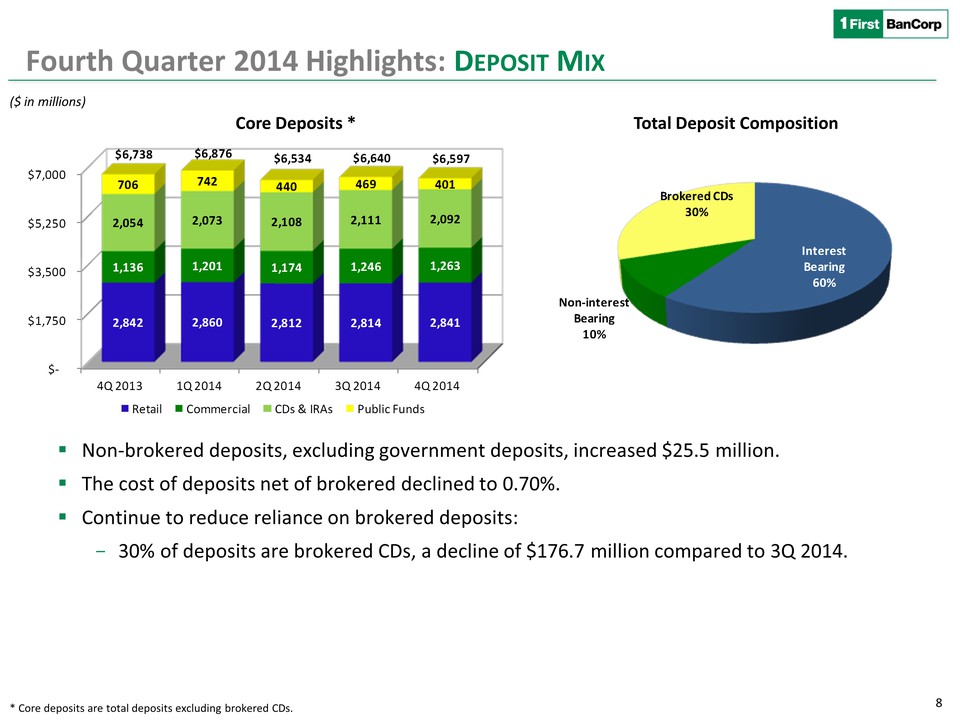
Non-brokered deposits, excluding government deposits, up $25.5 million to $6.2 billion as of December 31, 2014.
|
|
●
|
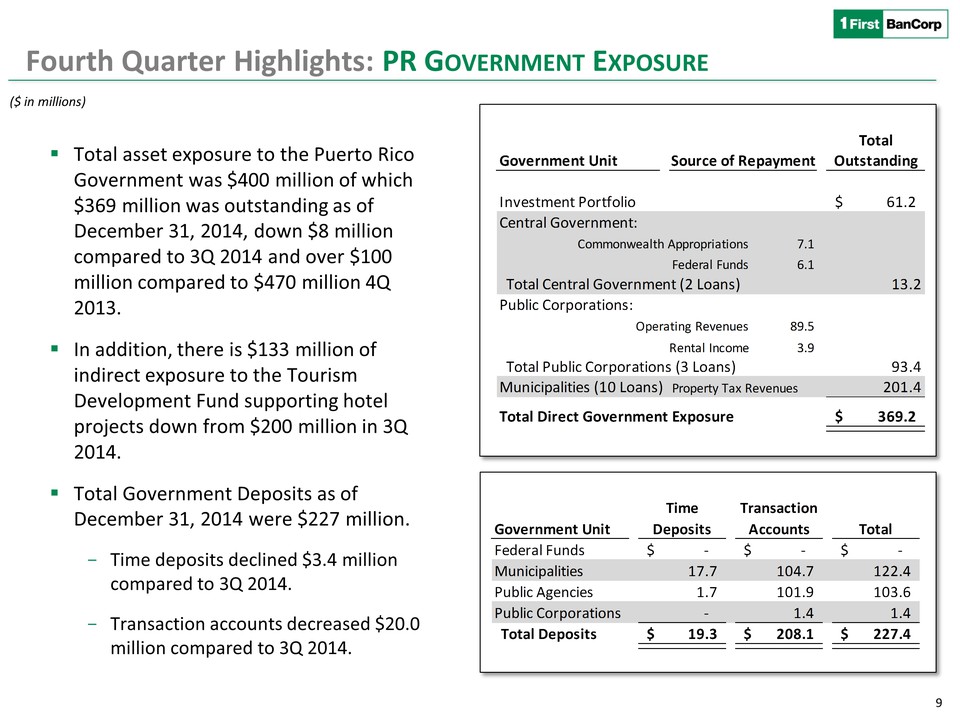
Government deposits decreased by $68.0 million to $400.7 million as of December 31, 2014 from $468.7 million as of September 30, 2014, reflecting decreases in both our Puerto Rico and Virgin Islands regions. As of December 31, 2014, the Corporation had $227.4 million of government deposits in Puerto Rico and $173.3 million in the Virgin Islands.
|
|
●
|
Brokered certificates of deposit decreased by $176.7 million to $2.9 billion as of December 31, 2014.
|
|
●
|
Total loan originations, including refinancings, renewals and draws from existing commitments (excluding credit card utilization activity), of $791.8 million for the fourth quarter of 2014, compared to $821.2 million for the third quarter of 2014.
|
SAN JUAN, Puerto Rico--(BUSINESS WIRE)--February 5, 2015--First BanCorp. (the “Corporation”) (NYSE: FBP), the bank holding company for FirstBank Puerto Rico (“FirstBank” or “the Bank”), today reported net income of $26.3 million for the fourth quarter of 2014, or $0.12 per diluted share, compared to $23.2 million, or $0.11 per diluted share, for the third quarter of 2014 and $14.8 million, or $0.07 per diluted share, for the fourth quarter of 2013.
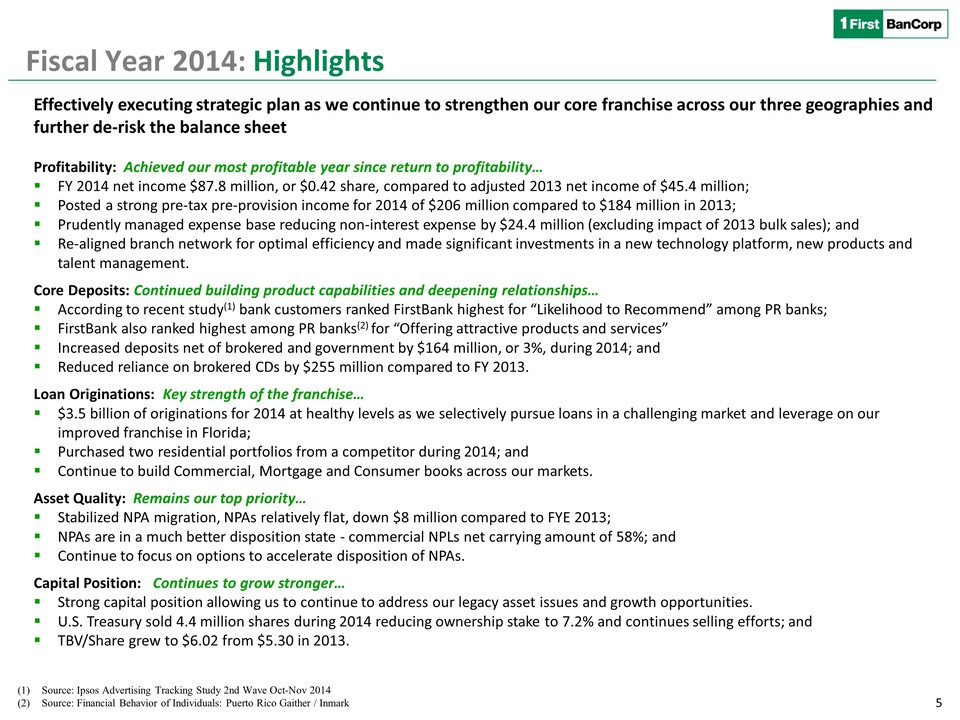
For the year ended December 31, 2014, the Corporation reported net income of $87.8 million, or $0.42 per diluted share, compared to a net loss of $164.5 million, or $0.80 loss per diluted share, for the year ended December 31, 2013. The results for the year ended December 31, 2013 were negatively impacted by two significant items: (i) an aggregate loss of $140.8 million on two separate bulk sales of adversely classified and non-performing assets and valuation adjustments to certain loans transferred to held for sale, and (ii) a $66.6 million loss related to the write-off of assets pledged as collateral to Lehman Brothers, Inc. together with an additional $2.5 million for a loss contingency of attorneys’ fees awarded to the counterparty related to this matter. Excluding these items, net income for the year ended December 31, 2013 was $45.4 million.
The Corporation’s subsidiary bank, FirstBank, has continued to evaluate its deferred tax assets valuation allowance position on a regular basis and is currently analyzing several scenarios. The results disclosed in this earnings release do not reflect any adjustments related to a reversal of FirstBank’s deferred tax assets valuation allowance. If, as a result of the completion of this ongoing process, any adjustments are determined to be applicable to the fourth quarter of 2014, appropriate disclosures will be provided and the financial statements included in the Corporation’s annual report on Form 10-K will reflect the adjustments.
Aurelio Alemán, President and Chief Executive Officer of First BanCorp., commented: “We just completed a turnaround year for First BanCorp achieving net income of $87.8 million for the year, almost twice the adjusted net income of $45 million achieved in 2013. Our annual pre-tax, pre-provision income improved to $205.9 million compared to $183.6 million in 2013. Results for the quarter were also strong, reaching $26.3 million, our highest net income quarter since returning to profitability and 13% higher than last quarter. We achieved a $28 million reduction in non-performing assets for the quarter and will continue to look at all options to accelerate the reduction of our non-performing assets and improve our asset quality ratios. While we have continued to face margin pressures, we have been able to maintain healthy margins reaching 4.09% for the quarter.
The Puerto Rico economic situation continues to face hurdles. The recent decline in oil prices should be positive for the Puerto Rico consumer but it is still too early to determine the direct impact on our clients. Also, the possible implications of the proposed comprehensive tax reform and any restructuring of the public authorities are yet to be seen. That said, we are confident of our capabilities to continue to execute our business plans under this scenario and of the strength of our franchise. The decline in our loan portfolio this quarter was related to lower origination volumes and de-risking activities including the sale of participations, note sales and a further reduction in our government exposure. Given the challenging environment in Puerto Rico, we will look to our Florida region and non-organic opportunities to rebuild our loan portfolio.”
This press release includes certain non-GAAP financial measures, including adjusted pre-tax, pre-provision income, adjusted net interest income and margin, and certain capital ratios and should be read in conjunction with the accompanying tables (Exhibit A), which are an integral part of this press release.
ADJUSTED PRE-TAX, PRE-PROVISION INCOME TRENDS
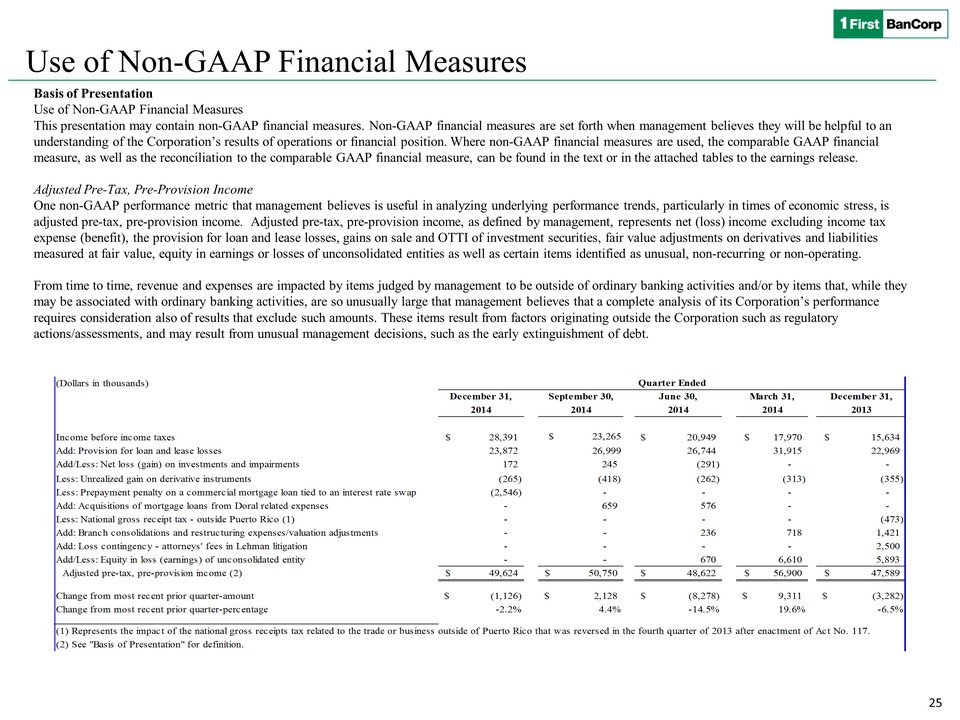
One metric that management believes is useful in analyzing performance is the level of earnings adjusted to exclude tax expense, the provision for loan and lease losses, securities gains or losses, fair value adjustments on derivatives measured at fair value and equity in earnings or loss of unconsolidated entity up until the second quarter of 2014 when the value of the investment became zero, which is a non-GAAP financial measure. In addition, from time to time, earnings are adjusted also for items judged by management to be outside of ordinary banking activities and/or for items that, while they may be associated with ordinary banking activities, are so unusually large that management believes that a complete analysis of the Corporation’s performance requires consideration also of results that exclude such amounts (for additional information about this non-GAAP financial measure, see “Adjusted Pre-Tax, Pre-Provision Income” in “Basis of Presentation”).
The following table reconciles income before income taxes to adjusted pre-tax, pre-provision income for the last five quarters including adjusted pre-tax, pre-provision income of $49.6 million in the fourth quarter of 2014, down $1.1 million from the prior quarter:
| |
|
|
|
(Dollars in thousands)
|
|
Quarter Ended
|
| |
|
December 31,
|
|
September 30,
|
|
June 30,
|
|
March 31,
|
|
December 31,
|
| |
|
|
2014
|
|
|
|
2014
|
|
|
|
2014
|
|
|
|
2014
|
|
|
|
2013
|
|
| |
|
|
|
|
|
|
|
|
|
|
|
Income before income taxes
|
|
$
|
28,391
|
|
|
$
|
23,265
|
|
|
$
|
20,949
|
|
|
$
|
17,970
|
|
|
$
|
15,634
|
|
|
Add: Provision for loan and lease losses
|
|
|
23,872
|
|
|
|
26,999
|
|
|
|
26,744
|
|
|
|
31,915
|
|
|
|
22,969
|
|
|
Add/Less: Net loss (gain) on investments and impairments
|
|
|
172
|
|
|
|
245
|
|
|
|
(291
|
)
|
|
|
-
|
|
|
|
-
|
|
| |
|
|
|
|
|
|
|
|
|
|
|
Less: Unrealized gain on derivative instruments
|
|
|
(265
|
)
|
|
|
(418
|
)
|
|
|
(262
|
)
|
|
|
(313
|
)
|
|
|
(355
|
)
|
|
Less: Prepayment penalty collected on a commercial mortgage loan
|
|
|
(2,546
|
)
|
|
|
-
|
|
|
|
-
|
|
|
|
-
|
|
|
|
-
|
|
|
Add: Acquisitions of mortgage loans from Doral related expenses
|
|
|
-
|
|
|
|
659
|
|
|
|
576
|
|
|
|
-
|
|
|
|
-
|
|
|
Less: National gross receipt tax - outside Puerto Rico (1)
|
|
|
-
|
|
|
|
-
|
|
|
|
-
|
|
|
|
-
|
|
|
|
(473
|
)
|
|
Add: Branch consolidations and restructuring expenses/valuation adjustments
|
|
|
-
|
|
|
|
-
|
|
|
|
236
|
|
|
|
718
|
|
|
|
1,421
|
|
|
Add: Loss contingency - attorneys' fees in Lehman litigation
|
|
|
-
|
|
|
|
-
|
|
|
|
-
|
|
|
|
-
|
|
|
|
2,500
|
|
|
Add/Less: Equity in loss (earnings) of unconsolidated entity
|
|
|
-
|
|
|
|
-
|
|
|
|
670
|
|
|
|
6,610
|
|
|
|
5,893
|
|
|
Adjusted pre-tax, pre-provision income (2)
|
|
$
|
49,624
|
|
|
$
|
50,750
|
|
|
$
|
48,622
|
|
|
$
|
56,900
|
|
|
$
|
47,589
|
|
| |
|
|
|
|
|
|
|
|
|
|
|
Change from most recent prior quarter-amount
|
|
$
|
(1,126
|
)
|
|
$
|
2,128
|
|
|
$
|
(8,278
|
)
|
|
$
|
9,311
|
|
|
$
|
(3,282
|
)
|
|
Change from most recent prior quarter-percentage
|
|
|
-2.2
|
%
|
|
|
4.4
|
%
|
|
|
-14.5
|
%
|
|
|
19.6
|
%
|
|
|
-6.5
|
%
|
| |
|
|
|
|
|
|
|
|
|
|
|
(1) Represents the impact of the national gross receipts tax related to the trade or business outside of Puerto Rico that was reversed in the fourth quarter of 2013 after enactment of Act No. 117.
|
|
(2) See "Basis of Presentation" for definition.
|
| |
The decrease in adjusted pre-tax, pre-provision income from the 2014 third quarter primarily reflected:
|
●
|
A $0.9 million decrease in adjusted net interest income, excluding fair value adjustments of $0.3 million and a prepayment penalty of $2.5 million collected on a commercial mortgage loan paid off, mainly driven by the decline in the average volume of commercial and consumer loans, a decrease in commercial loans’ average yield driven by the impact in the previous quarter of past due interest collected on certain non-performing loans paid off, and the contractual repricing of a $100 million repurchase agreement, partially offset by higher interest income on residential mortgage loans attributable to the purchase of approximately $192.6 million of loans from Doral Bank early in the fourth quarter. See Net Interest Income discussion below for additional information.
|
The $2.5 million contractual prepayment penalty collected was paid by the borrower to compensate for the economic loss sustained by the Corporation in the early termination of an interest rate swap agreement that provided an economic hedge of the cash flows associated to this loan. Such loss equals the mark-to-market unrealized losses recorded by the Corporation in prior periods for the terminated interest rate swap.
|
●
|
A $1.6 million increase in adjusted non-interest income of $18.1 million for the fourth quarter of 2014, as compared to $16.4 million for the third quarter of 2014, reflecting, among other things, a $0.7 million increase in merchant and POS fees primarily as a result of seasonally higher transaction volumes and a $0.7 million increase in revenues from the mortgage banking business. Merchant and POS fees increased by $0.4 million in the fourth quarter of 2014 compared to the same quarter in 2013.
|
Adjusted non-interest income in the last two quarters excludes gain or loss on sales of investment securities and other-than-temporary impairment (“OTTI”) on investment securities. See Basis of Presentation section below for a reconciliation of this non-GAAP financial measure to the corresponding GAAP measure.
Partially offset by:
|
●
|
A $1.8 million increase in adjusted non-interest expenses of $94.8 million for the fourth quarter of 2014, as compared to adjusted non-interest expenses of $92.9 million for the third quarter of 2014, primarily due to a $2.0 million increase in adjusted professional service fees, a $0.6 million increase in business promotion expenses, and a $0.3 million increase in credit and debit card processing expenses. These variances were partially offset by a $0.7 million decrease in OREO losses and related operating expenses, and a $0.6 million decrease in the deposit insurance assessment. See Non-Interest Expenses section below for additional information.
|
Adjusted non-interest expenses and adjusted professional service fees exclude expenses incurred during the third quarter of 2014 in the acquisition of performing residential mortgage loans from Doral Bank. See Basis of Presentation section below for a reconciliation of this non-GAAP financial measure to the corresponding GAAP measure.
NET INTEREST INCOME
Net interest income excluding fair value adjustments on derivatives (“valuations”) and the $2.5 million prepayment penalty collected on a commercial mortgage loan paid off in the fourth quarter of 2014, and net interest income on a tax-equivalent basis are non-GAAP measures. (See “Basis of Presentation – Net Interest Income, Excluding Valuations and Prepayment Penalty, and on a Tax-Equivalent Basis” below for additional information.) The following table reconciles net interest income in accordance with GAAP to net interest income excluding valuations and the aforementioned prepayment penalty, and net interest income on a tax-equivalent basis. The table also reconciles net interest spread and net interest margin on a GAAP basis to these items excluding valuations and the prepayment penalty, and on a tax-equivalent basis.
| |
|
(Dollars in thousands)
|
|
|
|
|
|
|
|
|
|
|
| |
|
Quarter Ended
|
| |
|
December 31, 2014
|
|
September 30, 2014
|
|
June 30, 2014
|
|
March 31, 2014
|
|
December 31, 2013
|
|
Net Interest Income
|
|
|
|
|
|
|
|
|
|
|
|
Interest income - GAAP
|
|
$
|
158,293
|
|
|
$
|
156,662
|
|
|
$
|
158,423
|
|
|
$
|
160,571
|
|
|
$
|
162,690
|
|
| |
|
|
|
|
|
|
|
|
|
|
|
Unrealized gain on derivative instruments
|
|
|
(265
|
)
|
|
|
(418
|
)
|
|
|
(262
|
)
|
|
|
(313
|
)
|
|
|
(355
|
)
|
|
Interest income excluding valuations
|
|
|
158,028
|
|
|
|
156,244
|
|
|
|
158,161
|
|
|
|
160,258
|
|
|
|
162,335
|
|
|
Prepayment penalty on a commercial mortgage loan tied to an interest rate swap
|
|
|
(2,546
|
)
|
|
|
-
|
|
|
|
-
|
|
|
|
-
|
|
|
|
-
|
|
|
Interest income excluding valuations and a $2.5 million prepayment penalty collected
|
|
|
155,482
|
|
|
|
156,244
|
|
|
|
158,161
|
|
|
|
160,258
|
|
|
|
162,335
|
|
|
Tax-equivalent adjustment
|
|
|
3,968
|
|
|
|
3,995
|
|
|
|
5,005
|
|
|
|
5,223
|
|
|
|
5,122
|
|
|
Prepayment penalty collected on a commercial mortgage loan
|
|
|
2,546
|
|
|
|
-
|
|
|
|
-
|
|
|
|
-
|
|
|
|
-
|
|
|
Interest income on a tax-equivalent basis excluding valuations
|
|
|
161,996
|
|
|
|
160,239
|
|
|
|
163,166
|
|
|
|
165,481
|
|
|
|
167,457
|
|
| |
|
|
|
|
|
|
|
|
|
|
|
Interest expense - GAAP
|
|
|
29,141
|
|
|
|
28,968
|
|
|
|
28,516
|
|
|
|
29,251
|
|
|
|
30,031
|
|
| |
|
|
|
|
|
|
|
|
|
|
|
Net interest income - GAAP
|
|
$
|
129,152
|
|
|
$
|
127,694
|
|
|
$
|
129,907
|
|
|
$
|
131,320
|
|
|
$
|
132,659
|
|
| |
|
|
|
|
|
|
|
|
|
|
|
Net interest income excluding valuations and a $2.5 million prepayment penalty collected
|
|
$
|
126,341
|
|
|
$
|
127,276
|
|
|
$
|
129,645
|
|
|
$
|
131,007
|
|
|
$
|
132,304
|
|
| |
|
|
|
|
|
|
|
|
|
|
|
Net interest income on a tax-equivalent basis excluding valuations
|
|
$
|
132,855
|
|
|
$
|
131,271
|
|
|
$
|
134,650
|
|
|
$
|
136,230
|
|
|
$
|
137,426
|
|
| |
|
|
|
|
|
|
|
|
|
|
|
Average Balances
|
|
|
|
|
|
|
|
|
|
|
|
Loans and leases
|
|
$
|
9,488,427
|
|
|
$
|
9,476,576
|
|
|
$
|
9,560,792
|
|
|
$
|
9,662,735
|
|
|
$
|
9,665,013
|
|
|
Total securities and other short-term investments
|
|
|
2,764,390
|
|
|
|
2,768,923
|
|
|
|
2,811,178
|
|
|
|
2,816,253
|
|
|
|
2,719,241
|
|
|
Average interest-earning assets
|
|
$
|
12,252,817
|
|
|
$
|
12,245,499
|
|
|
$
|
12,371,970
|
|
|
$
|
12,478,988
|
|
|
$
|
12,384,254
|
|
| |
|
|
|
|
|
|
|
|
|
|
|
Average interest-bearing liabilities
|
|
$
|
10,186,134
|
|
|
$
|
10,245,634
|
|
|
$
|
10,395,437
|
|
|
$
|
10,542,793
|
|
|
$
|
10,450,671
|
|
| |
|
|
|
|
|
|
|
|
|
|
|
Average Yield/Rate
|
|
|
|
|
|
|
|
|
|
|
|
Average yield on interest-earning assets - GAAP
|
|
|
5.13
|
%
|
|
|
5.08
|
%
|
|
|
5.14
|
%
|
|
|
5.22
|
%
|
|
|
5.21
|
%
|
|
Average rate on interest-bearing liabilities - GAAP
|
|
|
1.14
|
%
|
|
|
1.12
|
%
|
|
|
1.10
|
%
|
|
|
1.13
|
%
|
|
|
1.14
|
%
|
|
Net interest spread - GAAP
|
|
|
3.99
|
%
|
|
|
3.96
|
%
|
|
|
4.04
|
%
|
|
|
4.09
|
%
|
|
|
4.07
|
%
|
|
Net interest margin - GAAP
|
|
|
4.18
|
%
|
|
|
4.14
|
%
|
|
|
4.21
|
%
|
|
|
4.27
|
%
|
|
|
4.25
|
%
|
| |
|
|
|
|
|
|
|
|
|
|
|
Average yield on interest-earning assets excluding valuations and a $2.5 million prepayment penalty
|
|
|
5.03
|
%
|
|
|
5.06
|
%
|
|
|
5.13
|
%
|
|
|
5.21
|
%
|
|
|
5.20
|
%
|
|
Average rate on interest-bearing liabilities excluding valuations
|
|
|
1.14
|
%
|
|
|
1.12
|
%
|
|
|
1.10
|
%
|
|
|
1.13
|
%
|
|
|
1.14
|
%
|
|
Net interest spread excluding valuations and a $2.5 million prepayment penalty collected
|
|
|
3.89
|
%
|
|
|
3.94
|
%
|
|
|
4.03
|
%
|
|
|
4.08
|
%
|
|
|
4.06
|
%
|
|
Net interest margin excluding valuations and a $2.5 million prepayment penalty collected
|
|
|
4.09
|
%
|
|
|
4.12
|
%
|
|
|
4.20
|
%
|
|
|
4.26
|
%
|
|
|
4.24
|
%
|
| |
|
|
|
|
|
|
|
|
|
|
|
Average yield on interest-earning assets on a tax-equivalent basis and excluding valuations
|
|
|
5.25
|
%
|
|
|
5.19
|
%
|
|
|
5.29
|
%
|
|
|
5.38
|
%
|
|
|
5.36
|
%
|
|
Average rate on interest-bearing liabilities excluding valuations
|
|
|
1.14
|
%
|
|
|
1.12
|
%
|
|
|
1.10
|
%
|
|
|
1.13
|
%
|
|
|
1.14
|
%
|
|
Net interest spread on a tax-equivalent basis and excluding valuations
|
|
|
4.11
|
%
|
|
|
4.07
|
%
|
|
|
4.19
|
%
|
|
|
4.25
|
%
|
|
|
4.22
|
%
|
|
Net interest margin on a tax-equivalent basis and excluding valuations
|
|
|
4.30
|
%
|
|
|
4.25
|
%
|
|
|
4.37
|
%
|
|
|
4.43
|
%
|
|
|
4.40
|
%
|
| |
|
|
|
|
|
|
|
|
|
|
|
|
|
|
|
|
|
|
|
|
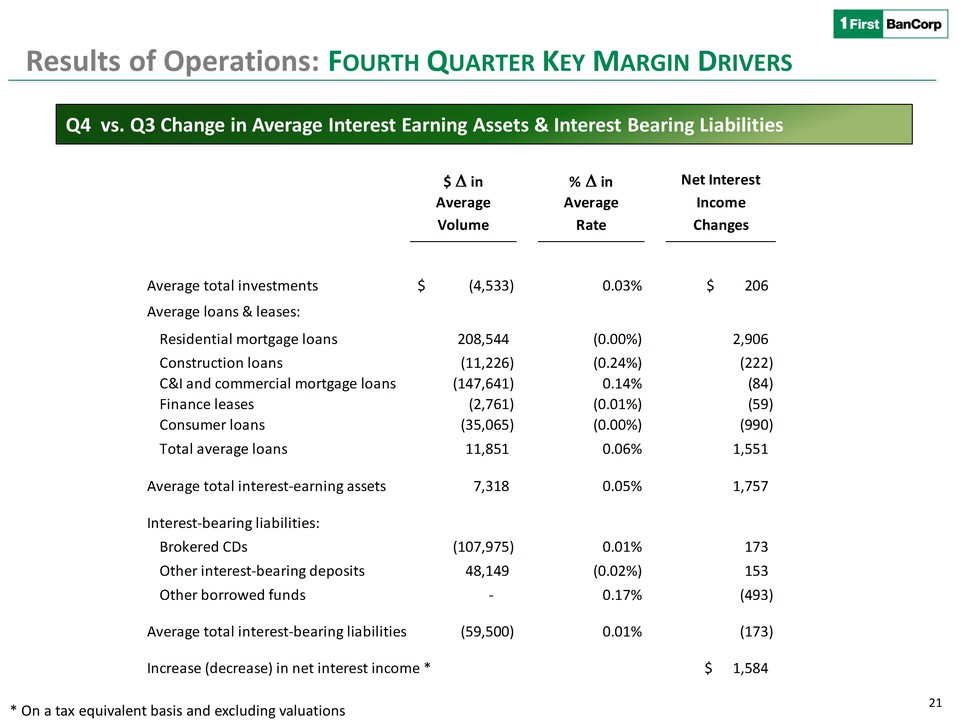
Net interest income amounted to $129.2 million, an increase of $1.5 million when compared to the third quarter of 2014. Adjusted net interest income, excluding fair value adjustments on derivative instruments of $0.3 million and the $2.5 million prepayment penalty collected, amounted to $126.3 million, a decrease of $0.9 million compared to the third quarter of 2014. The related adjusted net interest margin decreased to 4.09% for the fourth quarter of 2014 from 4.12% for the third quarter of 2014. The decreases in adjusted net interest income and margin were mainly due to:
|
●
|
A $2.5 million decrease in interest income on commercial loans mainly attributable to a $147.6 million reduction in the average volume of commercial loans, or an adverse impact of approximately $1.6 million, and a 9 basis point decrease, or an adverse impact of approximately $0.9 million, in the commercial loans’ average yield mainly due to the impact in the previous quarter of past due interest collected on certain non-performing loans paid off in that quarter.
|
|
●
|
A $1.0 million decrease in interest income on consumer loans mainly attributable to a $37.8 million reduction in the average volume, primarily in auto loans.
|
|
●
|
A 21 basis point increase in the average cost of repurchase agreements, or an increase of approximately $0.5 million in interest expense, attributable to the contractual repricing of a $100 million agreement.
|
Partially offsetting the aforementioned items was:
|
●
|
A $2.9 million increase in interest income on residential mortgage loans primarily due to the purchase from Doral Bank early in the fourth quarter of approximately $192.6 million in performing residential mortgage loans.
|
|
●
|
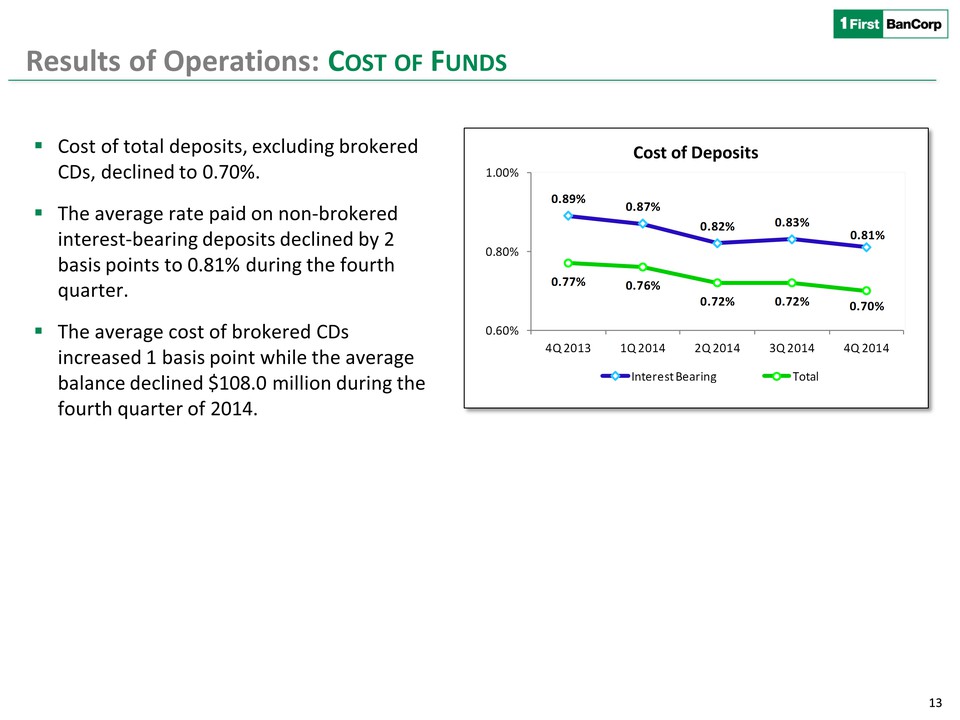
A $0.3 million decrease in interest expense on deposits attributable to both a decline in the average balance of brokered CDs and lower rates paid on savings and interest-bearing checking accounts.
|
PROVISION FOR LOAN AND LEASE LOSSES
The provision for loan and lease losses for the fourth quarter of 2014 was $23.9 million, a decrease of $3.1 million, compared to $27.0 million for the third quarter of 2014, driven by the following variances:
|
●
|
A $5.2 million decrease in the provision for commercial and construction loans in Puerto Rico mainly reflecting a reduction in net charge-offs, reserve releases due to improvements in the risk classification of certain commercial and industrial loans, and a decline in the migration of commercial mortgage loans to a worse loan classification.
|
|
●
|
A $2.3 million decrease in the provision for commercial and construction loans in the Virgin Islands. The Corporation recorded a negative provision of $2.0 million for commercial and construction loans in the fourth quarter mainly attributable to the improvement in the risk classification of a commercial and industrial loan and a decrease in the general reserve for commercial mortgage loans.
|
|
●
|
A $2.0 million decrease in the provision for residential mortgage loans, primarily related to lower reserves allocated to loans evaluated for impairment purposes in the United States.
|
Partially offset by:
|
●
|
A $3.6 million decrease in loan loss recoveries related to commercial mortgage and construction loans in the United States. Commercial and construction loan loss recoveries in the United States for the fourth quarter of 2014 amounted to $2.8 million compared to $6.4 million in the third quarter.
|
|
●
|
A $2.1 million increase in the provision for consumer loans primarily related to higher loss severity rates on the auto loan portfolio.
|
See Credit Quality discussion below for additional information regarding the allowance for loan and lease losses, including variances in charge-offs and loss recoveries.
| |
|
|
|
|
|
|
|
|
|
|
|
Non-Interest Income
|
|
|
|
|
|
|
|
|
|
|
| |
|
Quarter Ended
|
| |
|
December 31,
|
|
September 30,
|
|
June 30,
|
|
March 31,
|
|
December 31,
|
|
(In thousands)
|
|
|
2014
|
|
|
|
2014
|
|
|
|
2014
|
|
|
|
2014
|
|
|
|
2013
|
|
| |
|
|
|
|
|
|
|
|
|
|
|
Service charges on deposit accounts
|
|
$
|
4,155
|
|
|
$
|
4,205
|
|
|
$
|
4,222
|
|
|
$
|
4,127
|
|
|
$
|
4,114
|
|
|
Mortgage banking activities
|
|
|
4,472
|
|
|
|
3,809
|
|
|
|
3,036
|
|
|
|
3,368
|
|
|
|
3,906
|
|
|
Net (loss) gain on investments and impairments
|
|
|
(172
|
)
|
|
|
(245
|
)
|
|
|
291
|
|
|
|
-
|
|
|
|
-
|
|
|
Broker-dealer income
|
|
|
-
|
|
|
|
-
|
|
|
|
-
|
|
|
|
459
|
|
|
|
97
|
|
|
Branch consolidations - valuation adjustments on fixed assets
|
|
|
-
|
|
|
|
-
|
|
|
|
-
|
|
|
|
-
|
|
|
|
(529
|
)
|
|
Other operating income
|
|
|
9,438
|
|
|
|
8,405
|
|
|
|
9,052
|
|
|
|
10,006
|
|
|
|
10,790
|
|
|
Equity in (loss) earnings of unconsolidated entity
|
|
|
-
|
|
|
|
-
|
|
|
|
(670
|
)
|
|
|
(6,610
|
)
|
|
|
(5,893
|
)
|
| |
|
|
|
|
|
|
|
|
|
|
|
Non-interest income
|
|
$
|
17,893
|
|
|
$
|
16,174
|
|
|
$
|
15,931
|
|
|
$
|
11,350
|
|
|
$
|
12,485
|
|
| |
|
|
|
|
|
|
|
|
|
|
|
|
|
|
|
|
|
|
|
|
Non-interest income for the fourth quarter of 2014 amounted to $17.9 million, compared to $16.2 million for the third quarter of 2014. The increase was primarily due to:
|
●
|
A $1.0 million increase in other operating income that includes a $0.7 million increase in merchant and POS fees as a result of seasonally higher transaction volumes and a $0.25 million increase in insurance commissions’ income, net of reserves.
|
|
●
|
A $0.7 million increase in revenues from the mortgage banking business, primarily related to a $0.7 million increase in realized gains on loan sales and securitization activities attributable to a higher volume of sales. Loans sold and securitized in the secondary market to government-sponsored entities amounted to $91.8 million with a related gain of $3.4 million in the fourth quarter of 2014, compared to $75.1 million and a gain of $2.7 million recorded in the third quarter of 2014. Also contributing to the increase in revenues from the mortgage banking business were a $0.2 million increase in servicing fees and the impact in the previous quarter of charges amounting to $0.2 million related to compensatory fees imposed by government-sponsored agencies. These variances were partially offset by a $0.4 million adverse variance in mark-to-market adjustments on to-be-announced (“TBA”) MBS forward contracts used to hedge the securitization pipeline.
|
| |
|
|
|
|
|
|
|
|
|
|
|
NON-INTEREST EXPENSES
|
|
|
|
|
|
|
|
|
|
|
| |
|
Quarter Ended
|
| |
|
December 31,
|
|
September 30,
|
|
June 30,
|
|
March 31,
|
|
December 31,
|
|
(In thousands)
|
|
|
2014
|
|
|
2014
|
|
|
2014
|
|
|
2014
|
|
|
2013
|
| |
|
|
|
|
|
|
|
|
|
|
|
Employees' compensation and benefits
|
|
$
|
33,854
|
|
$
|
33,877
|
|
$
|
34,793
|
|
$
|
32,898
|
|
$
|
31,014
|
|
Occupancy and equipment
|
|
|
14,763
|
|
|
14,727
|
|
|
14,246
|
|
|
13,600
|
|
|
15,204
|
|
Deposit insurance premium
|
|
|
7,745
|
|
|
8,335
|
|
|
9,579
|
|
|
9,822
|
|
|
10,495
|
|
Other insurance and supervisory fees
|
|
|
1,182
|
|
|
1,158
|
|
|
1,205
|
|
|
1,168
|
|
|
957
|
|
Taxes, other than income taxes
|
|
|
4,482
|
|
|
4,528
|
|
|
4,504
|
|
|
4,575
|
|
|
4,101
|
|
Professional fees:
|
|
|
|
|
|
|
|
|
|
|
|
Collections, appraisals and other credit related fees
|
|
|
4,244
|
|
|
2,914
|
|
|
2,717
|
|
|
1,754
|
|
|
2,524
|
|
Outsourcing technology services
|
|
|
4,775
|
|
|
4,840
|
|
|
4,600
|
|
|
4,214
|
|
|
4,202
|
|
Other professional fees
|
|
|
4,420
|
|
|
3,641
|
|
|
4,073
|
|
|
4,525
|
|
|
4,893
|
|
Credit and debit card processing expenses
|
|
|
4,002
|
|
|
3,741
|
|
|
3,882
|
|
|
3,824
|
|
|
4,869
|
|
Branch consolidations and restructuring expenses
|
|
|
-
|
|
|
-
|
|
|
236
|
|
|
718
|
|
|
892
|
|
Business promotion
|
|
|
4,491
|
|
|
3,925
|
|
|
4,142
|
|
|
3,973
|
|
|
5,251
|
|
Communications
|
|
|
1,851
|
|
|
2,143
|
|
|
1,894
|
|
|
1,879
|
|
|
1,836
|
|
Net loss on OREO operations
|
|
|
3,655
|
|
|
4,326
|
|
|
6,778
|
|
|
5,837
|
|
|
13,321
|
|
Acquisitions of loans from Doral related expenses
|
|
|
-
|
|
|
659
|
|
|
576
|
|
|
-
|
|
|
-
|
|
Loss contingency for attorneys' fees - Lehman litigation
|
|
|
-
|
|
|
-
|
|
|
-
|
|
|
-
|
|
|
2,500
|
|
Other
|
|
|
5,318
|
|
|
4,790
|
|
|
4,920
|
|
|
3,998
|
|
|
4,482
|
|
Total
|
|
$
|
94,782
|
|
$
|
93,604
|
|
$
|
98,145
|
|
$
|
92,785
|
|
$
|
106,541
|
| |
|
|
|
|
|
|
|
|
|
|
Non-interest expenses in the fourth quarter of 2014 amounted to $94.8 million, an increase of $1.2 million from $93.6 million for the third quarter of 2014. The main drivers of the increase were:
|
●
|
A $1.4 million increase in professional service fees, driven by a $1.3 million increase in legal, collection fees and other costs incurred in troubled loans resolution efforts and a $0.3 million increase in consulting fees primarily related to regulatory matters, partially offset by $0.65 million of professional service fees incurred in the previous quarter on the acquisition of mortgage loans from Doral Bank.
|
|
●
|
A $0.6 million increase in business promotion expenses, driven by an increase of $0.5 million in marketing and charitable contribution expenses and a $0.2 million increase in expenses related to the credit card portfolio rewards program attributed to seasonally higher transaction volumes.
|
|
●
|
A $0.3 million increase in credit and debit card processing expenses also attributable to seasonally higher transaction volumes.
|
|
●
|
A $0.3 million increase in losses on sales of repossessed boats, included as part of “Other” in the table above.
|
Partially offset by:
|
●
|
A $0.7 million decrease in losses on OREO properties. Total write-downs on OREO properties in the fourth quarter of 2014 amounted to $2.2 million compared to $2.8 million for the third quarter of 2014, a decrease of $0.6 million.
|
|
●
|
A $0.3 million decrease in postage and mailing expenses, included as part of “Communications” in the table above.
|
|
●
|
A $0.6 million decrease in the deposit insurance assessment driven by a decrease in leverage commercial loans balance, improved earnings trends, the decrease in brokered deposits and a strengthened capital position.
|
INCOME TAXES
The Corporation recorded an income tax expense for the fourth quarter of 2014 of $2.1 million compared to $0.1 million for the third quarter of 2014. The increase was primarily attributable to higher income of profitable subsidiaries and adjustments related to the alternative minimum tax computation. Under the Puerto Rico Internal Revenue Code, the Corporation and its subsidiaries are treated as separate taxable entities and are not entitled to file consolidated tax returns and, thus, the Corporation is not able to utilize losses from one subsidiary to offset gains in another subsidiary.
As of December 31, 2014, the Corporation had a deferred tax assets valuation allowance of $516.1 million, including FirstBank’s deferred tax assets valuation allowance of $492.6 million. As noted above, FirstBank has continued to evaluate its deferred tax assets valuation allowance position on a regular basis and is currently analyzing several scenarios. The results disclosed in this earnings release do not reflect any adjustments related to a reversal of FirstBank’s deferred tax assets valuation allowance.
| |
|
|
|
|
|
|
|
|
|
|
|
CREDIT QUALITY
|
|
|
|
|
|
|
|
|
|
|
| |
|
|
|
|
|
|
|
|
|
|
|
Non-Performing Assets
|
|
|
|
|
|
|
|
|
|
|
| |
|
|
|
|
|
|
|
|
|
|
|
(Dollars in thousands)
|
|
December 31,
|
|
September 30,
|
|
June 30,
|
|
March 31,
|
|
December 31,
|
| |
|
|
|
2014
|
|
|
|
2014
|
|
|
|
2014
|
|
|
|
2014
|
|
|
|
2013
|
|
|
Non-performing loans held for investment:
|
|
|
|
|
|
|
|
|
|
|
| |
Residential mortgage
|
|
$
|
180,707
|
|
|
$
|
185,025
|
|
|
$
|
175,404
|
|
|
$
|
172,796
|
|
|
$
|
161,441
|
|
| |
Commercial mortgage
|
|
|
148,473
|
|
|
|
169,967
|
|
|
|
166,218
|
|
|
|
145,535
|
|
|
|
120,107
|
|
| |
Commercial and Industrial
|
|
|
122,547
|
|
|
|
130,917
|
|
|
|
143,669
|
|
|
|
113,996
|
|
|
|
114,833
|
|
| |
Construction
|
|
|
29,354
|
|
|
|
30,111
|
|
|
|
38,830
|
|
|
|
50,387
|
|
|
|
58,866
|
|
| |
Consumer and Finance leases
|
|
|
42,815
|
|
|
|
43,496
|
|
|
|
40,510
|
|
|
|
39,061
|
|
|
|
40,302
|
|
| |
Total non-performing loans held for investment
|
|
|
523,896
|
|
|
|
559,516
|
|
|
|
564,631
|
|
|
|
521,775
|
|
|
|
495,549
|
|
| |
|
|
|
|
|
|
|
|
|
|
|
|
OREO
|
|
|
124,003
|
|
|
|
112,803
|
|
|
|
121,842
|
|
|
|
138,622
|
|
|
|
160,193
|
|
|
Other repossessed property
|
|
|
14,229
|
|
|
|
17,467
|
|
|
|
16,114
|
|
|
|
15,587
|
|
|
|
14,865
|
|
| |
Total non-performing assets, excluding loans held for sale
|
|
$
|
662,128
|
|
|
$
|
689,786
|
|
|
$
|
702,587
|
|
|
$
|
675,984
|
|
|
$
|
670,607
|
|
| |
|
|
|
|
|
|
|
|
|
|
|
|
Non-performing loans held for sale
|
|
|
54,641
|
|
|
|
54,641
|
|
|
|
54,755
|
|
|
|
54,755
|
|
|
|
54,801
|
|
| |
Total non-performing assets, including loans held for sale (1)
|
|
$
|
716,769
|
|
|
$
|
744,427
|
|
|
$
|
757,342
|
|
|
$
|
730,739
|
|
|
$
|
725,408
|
|
| |
|
|
|
|
|
|
|
|
|
|
|
|
Past-due loans 90 days and still accruing (2)
|
|
$
|
162,887
|
|
|
$
|
143,535
|
|
|
$
|
143,916
|
|
|
$
|
118,049
|
|
|
$
|
120,082
|
|
|
Non-performing loans held for investment to total loans held for investment
|
|
|
5.66
|
%
|
|
|
6.01
|
%
|
|
|
5.96
|
%
|
|
|
5.45
|
%
|
|
|
5.14
|
%
|
|
Non-performing loans to total loans
|
|
|
6.19
|
%
|
|
|
6.54
|
%
|
|
|
6.49
|
%
|
|
|
5.98
|
%
|
|
|
5.67
|
%
|
|
Non-performing assets, excluding non-performing loans held for sale,
|
|
|
|
|
|
|
|
|
|
|
|
to total assets, excluding non-performing loans held for sale
|
|
|
5.35
|
%
|
|
|
5.48
|
%
|
|
|
5.63
|
%
|
|
|
5.30
|
%
|
|
|
5.32
|
%
|
|
Non-performing assets to total assets
|
|
|
5.77
|
%
|
|
|
5.89
|
%
|
|
|
6.05
|
%
|
|
|
5.70
|
%
|
|
|
5.73
|
%
|
| |
|
|
|
|
|
|
|
|
|
|
|
|
(1)
|
Purchased credit impaired loans of $102.6 million accounted for under ASC 310-30 as of December 31, 2014, primarily mortgage loans acquired from Doral in the second quarter of 2014, are excluded and not considered non-performing due to the application of the accretion method, under which these loans will accrete interest income over the remaining life of the loans using estimated cash flow analysis.
|
|
(2)
|
Amount includes purchased credit impaired loans with individual delinquencies over 90 days and still accruing with a carrying value as of December 31, 2014 of approximately $15.7 million, primarily related to loans acquired from Doral.
|
| |
|
|
|
|
|
|
|
|
|
|
|
Credit quality metrics variances:
|
●
|
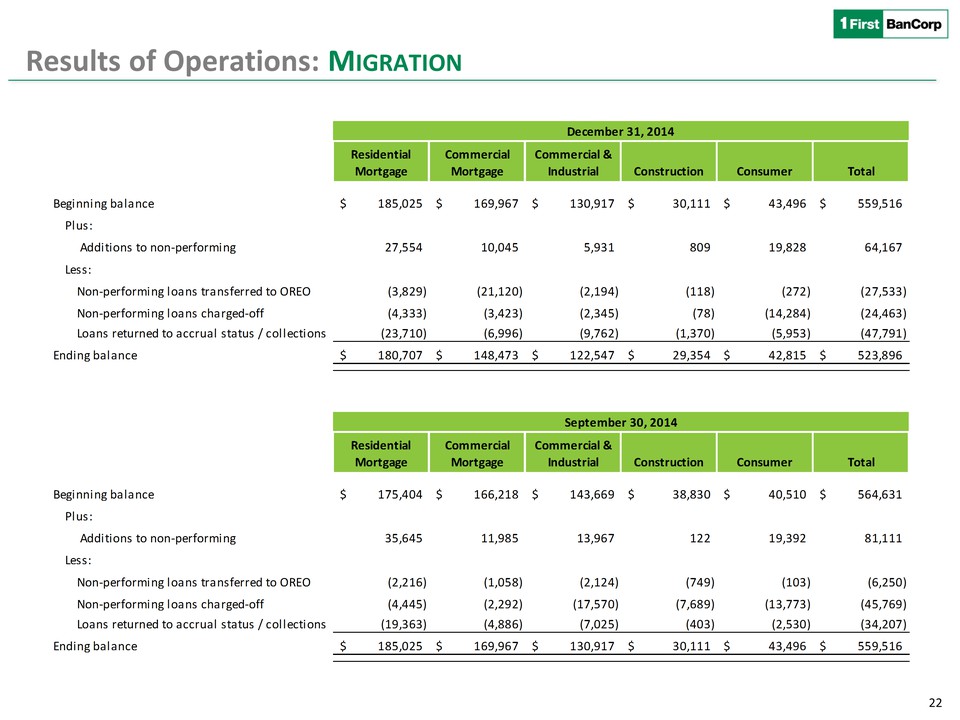
Total non-performing assets decreased by $27.7 million to $716.8 million as of December 31, 2014, compared to $744.4 million as of September 30, 2014. Total non-performing loans, including non-performing loans held for sale, decreased by $35.6 million, or 5%, from the third quarter of 2014. The decrease in non-performing assets was primarily attributable to cash collections on non-performing commercial and construction loans, charge-offs, the restoration to accrual status of loans brought current (including a $4.3 million commercial and industrial loan) and residential mortgage loans modified in trouble debt restructurings (“TDRs”) after a sustained performance period. The decrease in non-performing loans also includes the impact of foreclosures completed in the quarter that were transferred to the OREO inventory, including the collateral underlying a $21.1 million commercial mortgage loan.
|
|
●
|
Inflows to non-performing loans held for investment were $64.2 million, a decrease of $16.9 million, or 21%, compared to inflows of $81.1 million in the third quarter of 2014. This decrease was primarily reflected in the commercial and industrial loan portfolio that showed inflows of $5.9 million in the fourth quarter of 2014, an $8.0 million decrease, compared to inflows of $13.9 million in the third quarter of 2014 and inflows of non-performing residential mortgage loans of $27.5 million in the fourth quarter of 2014, a decline of $8.1 million, compared to inflows of $35.6 million in the third quarter of 2014.
|
|
●
|
Adversely classified commercial and construction loans held for investment decreased by $13.8 million to $557.6 million, or 2%, from the third quarter of 2014.
|
|
●
|
The OREO balance increased by $11.2 million, driven by additions of $29.3 million, including the aforementioned foreclosure of the underlying collateral of a $21.1 million commercial mortgage loan, partially offset by sales of $14.9 million and adjustments to value of $3.2 million.
|
|
●
|
Total TDRs held for investment were $694.5 million at December 31, 2014, down $6.7 million, or 1%, from September 30, 2014. Approximately $494.6 million of total TDRs held for investment were in accrual status as of December 31, 2014.
|
Allowance for Loan and Lease Losses
The following table sets forth an analysis of the allowance for loan and lease losses during the periods indicated:
| |
|
|
|
| |
|
|
Quarter Ended
|
|
(Dollars in thousands)
|
|
December 31,
|
|
September 30,
|
|
June 30,
|
|
March 31,
|
|
December 31,
|
| |
|
|
|
2014
|
|
|
|
2014
|
|
|
|
2014
|
|
|
|
2014
|
|
|
|
2013
|
|
| |
|
|
|
|
|
|
|
|
|
|
|
|
Allowance for loan and lease losses, beginning of period
|
|
$
|
225,434
|
|
|
$
|
241,177
|
|
|
$
|
266,778
|
|
|
$
|
285,858
|
|
|
$
|
289,379
|
|
|
Provision for loan and lease losses
|
|
|
23,872
|
|
|
|
26,999
|
|
|
|
26,744
|
|
(1
|
)
|
|
31,915
|
|
|
|
22,969
|
|
|
Net (charge-offs) recoveries of loans:
|
|
|
|
|
|
|
|
|
|
|
| |
Residential mortgage
|
|
|
(6,522
|
)
|
|
|
(5,734
|
)
|
|
|
(4,687
|
)
|
|
|
(6,353
|
)
|
|
|
(4,544
|
)
|
| |
Commercial mortgage
|
|
|
(1,383
|
)
|
|
|
1,116
|
|
|
|
(9,126
|
)
|
|
|
(5,775
|
)
|
|
|
2,605
|
|
| |
Commercial and Industrial
|
|
|
(992
|
)
|
|
|
(16,431
|
)
|
|
|
(19,036
|
)
|
(2
|
)
|
|
(21,796
|
)
|
|
|
(9,146
|
)
|
| |
Construction
|
|
|
680
|
|
|
|
(3,205
|
)
|
|
|
(2,606
|
)
|
|
|
(353
|
)
|
|
|
(435
|
)
|
| |
Consumer and finance leases
|
|
|
(18,694
|
)
|
|
|
(18,488
|
)
|
|
|
(16,890
|
)
|
|
|
(16,718
|
)
|
|
|
(14,970
|
)
|
|
Net charge-offs
|
|
|
(26,911
|
)
|
|
|
(42,742
|
)
|
|
|
(52,345
|
)
|
(2
|
)
|
|
(50,995
|
)
|
|
|
(26,490
|
)
|
|
Allowance for loan and lease losses, end of period
|
|
$
|
222,395
|
|
|
$
|
225,434
|
|
|
$
|
241,177
|
|
|
$
|
266,778
|
|
|
$
|
285,858
|
|
| |
|
|
|
|
|
|
|
|
|
|
|
|
Allowance for loan and lease losses to period end total loans held for investment
|
|
|
2.40
|
%
|
|
|
2.42
|
%
|
|
|
2.55
|
%
|
|
|
2.79
|
%
|
|
|
2.97
|
%
|
|
Net charge-offs (annualized) to average loans outstanding during the period
|
|
|
1.13
|
%
|
|
|
1.80
|
%
|
|
|
2.19
|
%
|
|
|
2.11
|
%
|
|
|
1.10
|
%
|
|
Net charge-offs (annualized), excluding charge-offs of $6.9 million related to the acquisition of mortgage loans from Doral, to average loans outstanding during the period
|
|
|
1.13
|
%
|
|
|
1.80
|
%
|
|
|
1.90
|
%
|
|
|
2.11
|
%
|
|
|
1.10
|
%
|
|
Provision for loan and lease losses to net charge-offs during the period
|
|
0.89x
|
|
0.63x
|
|
0.51x
|
|
0.63x
|
|
0.87x
|
|
Provision for loan and lease losses to net charge-offs during the period, excluding impact of the acquisition of mortgage loans from Doral
|
|
0.89x
|
|
0.63x
|
|
0.56x
|
|
0.63x
|
|
0.87x
|
|
(1) Includes a provision of $1.4 million associated with the acquisition of mortgage loans from Doral.
|
|
(2) Includes net charge-offs totaling $6.9 million associated with the acquisition of mortgage loans from Doral.
|
| |
|
●
|
The ratio of the allowance for loan and lease losses to total loans held for investment was 2.40% as of December 31, 2014, compared to 2.42% as of September 30, 2014. The slight decrease in the ratio was primarily due to reserve releases related to improvement in the risk classification of certain commercial and industrial loans, and lower reserve requirements on residential mortgage loans evaluated for impairment purposes in the United States. The ratio of the allowance to non-performing loans held for investment was 42.45% as of December 31, 2014 compared to 40.29% as of September 30, 2014.
|
The following table sets forth information concerning the composition of the Corporation’s allowance for loan and lease losses as of December 31, 2014 and September 30, 2014 by loan category and by whether the allowance and related provisions were calculated individually for impairment purposes or through a general valuation allowance:
| |
|
|
|
|
|
|
|
|
|
(Dollars in thousands)
|
|
Residential
Mortgage Loans
|
|
Commercial (including
Commercial Mortgage,
C&I, and Construction
loans)
|
|
Consumer and
Finance Leases
|
|
Total
|
| |
|
|
|
|
|
|
|
|
|
|
|
As of December 31, 2014
|
|
|
|
|
|
|
|
|
|
|
|
Impaired loans:
|
|
|
|
|
|
|
|
|
|
|
|
Principal balance of loans, net of charge-offs
|
|
$
|
424,244
|
|
|
|
$
|
486,576
|
|
|
|
$
|
34,587
|
|
|
$
|
945,407
|
|
|
Allowance for loan and lease losses
|
|
|
10,854
|
|
|
|
|
38,180
|
|
|
|
|
6,171
|
|
|
|
55,205
|
|
|
Allowance for loan and lease losses to principal balance
|
|
|
2.56
|
%
|
|
|
|
7.85
|
%
|
|
|
|
17.84
|
%
|
|
|
5.84
|
%
|
| |
|
|
|
|
|
|
|
|
|
|
|
PCI loans:
|
|
|
|
|
|
|
|
|
|
|
|
Carrying value of PCI loans
|
|
|
98,494
|
|
|
|
|
3,393
|
|
|
|
|
717
|
|
|
|
102,604
|
|
|
Allowance for PCI loans
|
|
|
-
|
|
|
|
|
-
|
|
|
|
|
-
|
|
|
|
-
|
|
|
Allowance for PCI loans to carrying value
|
|
|
-
|
|
|
|
|
-
|
|
|
|
|
-
|
|
|
|
-
|
|
| |
|
|
|
|
|
|
|
|
|
|
|
Loans with general allowance:
|
|
|
|
|
|
|
|
|
|
|
|
Principal balance of loans
|
|
|
2,488,449
|
|
|
|
|
3,778,735
|
|
|
|
|
1,947,241
|
|
|
|
8,214,425
|
|
|
Allowance for loan and lease losses
|
|
|
16,447
|
|
|
|
|
89,257
|
|
|
|
|
61,486
|
|
|
|
167,190
|
|
|
Allowance for loan and lease losses to principal balance
|
|
|
0.66
|
%
|
|
|
|
2.36
|
%
|
|
|
|
3.16
|
%
|
|
|
2.04
|
%
|
| |
|
|
|
|
|
|
|
|
|
|
|
Total loans held for investment:
|
|
|
|
|
|
|
|
|
|
|
|
Principal balance of loans
|
|
$
|
3,011,187
|
|
|
|
$
|
4,268,704
|
|
|
|
$
|
1,982,545
|
|
|
$
|
9,262,436
|
|
|
Allowance for loan and lease losses
|
|
|
27,301
|
|
|
|
|
127,437
|
|
|
|
|
67,657
|
|
|
|
222,395
|
|
|
Allowance for loan and lease losses to principal balance
|
|
|
0.91
|
%
|
|
|
|
2.99
|
%
|
|
|
|
3.41
|
%
|
|
|
2.40
|
%
|
| |
|
|
|
|
|
|
|
|
|
|
|
As of September 30, 2014
|
|
|
|
|
|
|
|
|
|
|
| |
|
|
|
|
|
|
|
|
|
|
|
Impaired loans:
|
|
|
|
|
|
|
|
|
|
|
|
Principal balance of loans, net of charge-offs
|
|
$
|
421,823
|
|
|
|
$
|
519,186
|
|
|
|
$
|
32,005
|
|
|
$
|
973,014
|
|
|
Allowance for loan and lease losses
|
|
|
11,658
|
|
|
|
|
38,331
|
|
|
|
|
5,295
|
|
|
|
55,284
|
|
|
Allowance for loan and lease losses to principal balance
|
|
|
2.76
|
%
|
|
|
|
7.38
|
%
|
|
|
|
16.54
|
%
|
|
|
5.68
|
%
|
| |
|
|
|
|
|
|
|
|
|
|
|
PCI loans:
|
|
|
|
|
|
|
|
|
|
|
|
Carrying value of PCI loans
|
|
|
99,535
|
|
|
|
|
3,418
|
|
|
|
|
1,360
|
|
|
|
104,313
|
|
|
Allowance for PCI loans
|
|
|
-
|
|
|
|
|
-
|
|
|
|
|
-
|
|
|
|
-
|
|
|
Allowance for PCI loans to carrying value
|
|
|
-
|
|
|
|
|
-
|
|
|
|
|
-
|
|
|
|
-
|
|
| |
|
|
|
|
|
|
|
|
|
|
|
Loans with general allowance:
|
|
|
|
|
|
|
|
|
|
|
|
Principal balance of loans
|
|
|
2,298,290
|
|
|
|
|
3,946,563
|
|
|
|
|
1,993,222
|
|
|
|
8,238,075
|
|
|
Allowance for loan and lease losses
|
|
|
18,248
|
|
|
|
|
91,995
|
|
|
|
|
59,907
|
|
|
|
170,150
|
|
|
Allowance for loan and lease losses to principal balance
|
|
|
0.79
|
%
|
|
|
|
2.33
|
%
|
|
|
|
3.01
|
%
|
|
|
2.07
|
%
|
| |
|
|
|
|
|
|
|
|
|
|
|
Total loans held for investment:
|
|
|
|
|
|
|
|
|
|
|
|
Principal balance of loans
|
|
$
|
2,819,648
|
|
|
|
$
|
4,469,167
|
|
|
|
$
|
2,026,587
|
|
|
$
|
9,315,402
|
|
|
Allowance for loan and lease losses
|
|
|
29,906
|
|
|
|
|
130,326
|
|
|
|
|
65,202
|
|
|
|
225,434
|
|
|
Allowance for loan and lease losses to principal balance
|
|
|
1.06
|
%
|
|
|
|
2.92
|
%
|
|
|
|
3.22
|
%
|
|
|
2.42
|
%
|
| |
|
|
|
|
|
|
|
|
|
|
Net Charge-Offs
The following table presents annualized net charge-offs to average loans held-in-portfolio:
| |
|
|
|
|
|
|
|
|
|
| |
|
|
Quarter Ended
|
| |
|
|
December 31,
|
|
September 30,
|
|
June 30,
|
|
March 31,
|
|
December 31,
|
| |
|
|
2014
|
|
2014
|
|
2014
|
|
2014
|
|
2013
|
| |
|
|
|
|
|
|
|
|
|
|
|
| |
Residential mortgage
|
|
0.87
|
%
|
|
0.82
|
%
|
|
0.71
|
%
|
|
1.00
|
%
|
|
0.72
|
%
|
| |
|
|
|
|
|
|
|
|
|
|
|
| |
Commercial mortgage
|
|
0.31
|
%
|
|
-0.24
|
%
|
|
2.00
|
%
|
|
1.27
|
%
|
|
-0.57
|
%
|
| |
|
|
|
|
|
|
|
|
|
|
|
| |
Commercial and Industrial
|
|
0.16
|
%
|
|
2.54
|
%
|
|
2.69
|
%
|
(1
|
)
|
2.90
|
%
|
|
1.21
|
%
|
| |
|
|
|
|
|
|
|
|
|
|
|
| |
Construction
|
|
-1.48
|
%
|
|
6.57
|
%
|
|
5.25
|
%
|
|
0.65
|
%
|
|
0.81
|
%
|
| |
|
|
|
|
|
|
|
|
|
|
|
| |
Consumer and finance leases
|
|
3.73
|
%
|
|
3.62
|
%
|
|
3.27
|
%
|
|
3.23
|
%
|
|
2.91
|
%
|
| |
|
|
|
|
|
|
|
|
|
|
|
| |
Total loans
|
|
1.13
|
%
|
|
1.80
|
%
|
|
2.19
|
%
|
(2
|
)
|
2.11
|
%
|
|
1.10
|
%
|
| |
|
|
|
|
|
|
|
|
|
|
|
|
(1) Includes net charge-offs totaling $6.9 million associated with the acquisition of mortgage loans from Doral. The ratio of commercial and industrial net charge-offs to average loans, excluding charge-offs associated with the acquisition of mortgage loans from Doral, was 1.81%.
|
|
(2) Includes net charge-offs totaling $6.9 million associated with the acquisition of mortgage loans from Doral. The ratio of total net charge-offs to average loans, excluding charge-offs associated with the acquisition of mortgage loans from Doral, was 1.90%.
|
| |
|
|
|
The ratios above are based on annualized net charge-offs and are not necessarily indicative of the results expected in subsequent periods.
|
●
|
Net charge-offs for the fourth quarter of 2014 were $26.9 million, or an annualized 1.13%, compared to $42.7 million, or an annualized 1.80% in the third quarter of 2014. The decrease was primarily reflected in the commercial and industrial loan portfolio, as the previous quarter included $16.0 million of charge-offs related to two collateral dependent relationships in Puerto Rico. Recoveries of amounts previously charged-off decreased to $6.7 million in the fourth quarter of 2014 from $11.2 million in the third quarter of 2014.
|
STATEMENT OF FINANCIAL CONDITION
Total assets were approximately $12.4 billion as of December 31, 2014, down $218.9 million from September 30, 2014.
The decrease was mainly due to:
|
●
|
A $173.9 million decrease in cash and cash equivalents, tied to the purchase of residential mortgage loans from Doral Bank and planned pay downs of maturing brokered CDs.
|
|
●
|
A $200.5 million decrease in commercial and construction loans and a $44.0 million decrease in consumer loans, which more than offset the increase of $191.5 million in residential mortgage loans held for investment. Most of the decrease in the commercial and construction loan portfolios was in Puerto Rico, including: (i) an aggregate decrease of approximately $98.7 million related to the payoff of two commercial loans in the fourth quarter, and (ii) the sale of loan participations and significant principal payments that reduced the risk exposure on another three commercial loans from approximately $247.6 million as of September 30, 2014 to $186.6 million as of December 31, 2014, a decrease of approximately $61 million.
|
Total loan originations, including refinancings, renewals, and draws from existing revolving and non-revolving commitments, amounted to approximately $791.8 million, compared to $821.2 million in the third quarter of 2014. These figures exclude the credit card utilization activity. The decrease was mainly reflected in the consumer and residential mortgage loan originations.
Total liabilities were approximately $11.1 billion as of December 31, 2014, down $262.0 million from September 30, 2014.
The decrease was mainly due to:
|
●
|
A $176.7 million decrease in brokered CDs.
|
|
●
|
A $68.0 million decrease in government deposits, mainly related to transactional accounts in both our Puerto Rico and Virgin Islands regions.
|
Partially offset by:
|
●
|
A $25.5 million increase in non-brokered deposits, excluding government deposits, mainly demand deposits in all of our regions.
|
Total stockholders’ equity amounted to $1.4 billion as of December 31, 2014, an increase of $43.1 million from September 30, 2014, mainly driven by:
|
●
|
The net income of $26.3 million reported in the fourth quarter.
|
|
●
|
An increase of $16.0 million in other comprehensive income mainly attributable to an increase in the fair value of U.S. agency MBS and debt securities of approximately $18.5 million, partially offset by a $3.2 million decrease in the fair value of Puerto Rico government obligations held by the Corporation as part of its available-for-sale investment securities portfolio. See Exposure to Puerto Rico Government section below for additional information.
|
The Corporation’s total capital, Tier 1 capital, and leverage ratios as of December 31, 2014 were 19.16%, 17.89%, and 12.54%, respectively, compared to total capital, Tier 1 capital and leverage ratios of 18.57%, 17.30%, and 12.34%, respectively, as of the end of the third quarter of 2014. Meanwhile, the total capital, Tier 1 capital, and leverage ratios as of December 31, 2014 of our banking subsidiary, FirstBank Puerto Rico, were 18.82%, 17.55%, and 12.32%, respectively, compared to total capital, Tier 1 capital, and leverage ratios of 18.21%, 16.95%, and 12.10%, respectively, as of the end of the prior quarter. All of the regulatory capital ratios for the Bank are above the minimum required under the consent order entered into with the FDIC and the Office of the Commissioner of Financial Institutions of the Commonwealth of Puerto Rico. Given such consent order, however, the Bank cannot be considered to be a well-capitalized institution.
Based on our current interpretation of the international regulatory capital requirements adopted by the Basel Committee on Banking Supervision (known as “Basel 3”), as those requirements have been and continue to be implemented in the U.S. by the federal banking agencies, we anticipate that, when these requirements are effective, we will exceed the fully phased-in minimum capital ratios these rules establish.
Tangible Common Equity
The Corporation’s tangible common equity ratio increased to 10.35% as of December 31, 2014 from 9.82% as of September 30, 2014, and the Tier 1 common equity to risk-weighted assets ratio increased to 14.93% as of December 31, 2014 from 14.39% as of September 30, 2014.
The following table is a reconciliation of the Corporation’s tangible common equity and tangible assets over the last five quarters to the comparable GAAP items:
| |
|
|
|
|
|
|
|
|
|
|
(In thousands, except ratios and per share information)
|
|
|
|
|
|
|
|
|
|
| |
|
|
December 31,
|
|
September 30,
|
|
June 30,
|
|
March 31,
|
|
December 31,
|
| |
|
|
|
2014
|
|
|
2014
|
|
|
2014
|
|
|
2014
|
|
|
2013
|
|
Tangible Equity:
|
|
|
|
|
|
|
|
|
|
|
| |
Total equity - GAAP
|
|
$
|
1,367,241
|
|
|
$
|
1,324,157
|
|
|
$
|
1,306,001
|
|
|
$
|
1,255,898
|
|
|
$
|
1,215,858
|
|
| |
Preferred equity
|
|
|
(36,104
|
)
|
|
|
(36,104
|
)
|
|
|
(36,104
|
)
|
|
|
(56,810
|
)
|
|
|
(63,047
|
)
|
| |
Goodwill
|
|
|
(28,098
|
)
|
|
|
(28,098
|
)
|
|
|
(28,098
|
)
|
|
|
(28,098
|
)
|
|
|
(28,098
|
)
|
| |
Purchased credit card relationship
|
|
|
(16,389
|
)
|
|
|
(17,235
|
)
|
|
|
(18,080
|
)
|
|
|
(18,942
|
)
|
|
|
(19,787
|
)
|
| |
Core deposit intangible
|
|
|
(5,420
|
)
|
|
|
(5,810
|
)
|
|
|
(6,200
|
)
|
|
|
(6,591
|
)
|
|
|
(6,981
|
)
|
| |
|
|
|
|
|
|
|
|
|
|
|
| |
Tangible common equity
|
|
$
|
1,281,230
|
|
|
$
|
1,236,910
|
|
|
$
|
1,217,519
|
|
|
$
|
1,145,457
|
|
|
$
|
1,097,945
|
|
| |
|
|
|
|
|
|
|
|
|
|
|
|
Tangible Assets:
|
|
|
|
|
|
|
|
|
|
|
| |
Total assets - GAAP
|
|
$
|
12,424,396
|
|
|
$
|
12,643,280
|
|
|
$
|
12,523,251
|
|
|
$
|
12,819,428
|
|
|
$
|
12,656,925
|
|
| |
Goodwill
|
|
|
(28,098
|
)
|
|
|
(28,098
|
)
|
|
|
(28,098
|
)
|
|
|
(28,098
|
)
|
|
|
(28,098
|
)
|
| |
Purchased credit card relationship
|
|
|
(16,389
|
)
|
|
|
(17,235
|
)
|
|
|
(18,080
|
)
|
|
|
(18,942
|
)
|
|
|
(19,787
|
)
|
| |
Core deposit intangible
|
|
|
(5,420
|
)
|
|
|
(5,810
|
)
|
|
|
(6,200
|
)
|
|
|
(6,591
|
)
|
|
|
(6,981
|
)
|
| |
|
|
|
|
|
|
|
|
|
|
|
| |
Tangible assets
|
|
$
|
12,374,489
|
|
|
$
|
12,592,137
|
|
|
$
|
12,470,873
|
|
|
$
|
12,765,797
|
|
|
$
|
12,602,059
|
|
| |
|
|
|
|
|
|
|
|
|
|
|
| |
Common shares outstanding
|
|
|
212,985
|
|
|
|
212,978
|
|
|
|
212,760
|
|
|
|
208,968
|
|
|
|
207,069
|
|
| |
|
|
|
|
|
|
|
|
|
|
|
| |
Tangible common equity ratio
|
|
|
10.35
|
%
|
|
|
9.82
|
%
|
|
|
9.76
|
%
|
|
|
8.97
|
%
|
|
|
8.71
|
%
|
| |
Tangible book value per common share
|
|
$
|
6.02
|
|
|
$
|
5.81
|
|
|
$
|
5.72
|
|
|
$
|
5.48
|
|
|
$
|
5.30
|
|
| |
|
|
|
|
|
|
|
|
|
|
|
|
|
|
|
|
|
|
|
|
|
The following table reconciles stockholders’ equity (GAAP) to Tier 1 common equity based on current applicable bank regulatory requirements (known as “Basel 1”):
| |
|
|
|
|
|
|
|
|
|
(Dollars in thousands)
|
|
As of
|
| |
|
|
December 31,
|
|
September 30,
|
June 30,
|
|
March 31,
|
|
December 31,
|
| |
|
|
|
2014
|
|
|
|
2014
|
|
|
|
2014
|
|
|
|
2014
|
|
|
|
2013
|
|
| |
|
|
|
|
|
|
|
|
|
|
|
|
Tier 1 Common Equity:
|
|
|
|
|
|
|
|
|
|
|
| |
Total equity - GAAP
|
|
$
|
1,367,241
|
|
|
$
|
1,324,157
|
|
|
$
|
1,306,001
|
|
|
$
|
1,255,898
|
|
|
$
|
1,215,858
|
|
| |
Qualifying preferred stock
|
|
|
(36,104
|
)
|
|
|
(36,104
|
)
|
|
|
(36,104
|
)
|
|
|
(56,810
|
)
|
|
|
(63,047
|
)
|
| |
Unrealized loss on available-for-sale securities (1)
|
|
|
18,351
|
|
|
|
34,301
|
|
|
|
28,381
|
|
|
|
56,180
|
|
|
|
78,734
|
|
| |
Disallowed deferred tax asset (2)
|
|
|
-
|
|
|
|
-
|
|
|
|
-
|
|
|
|
(25
|
)
|
|
|
-
|
|
| |
Goodwill
|
|
|
(28,098
|
)
|
|
|
(28,098
|
)
|
|
|
(28,098
|
)
|
|
|
(28,098
|
)
|
|
|
(28,098
|
)
|
| |
Core deposit intangible
|
|
|
(5,420
|
)
|
|
|
(5,810
|
)
|
|
|
(6,200
|
)
|
|
|
(6,591
|
)
|
|
|
(6,981
|
)
|
| |
Other disallowed assets
|
|
|
(422
|
)
|
|
|
(23
|
)
|
|
|
(23
|
)
|
|
|
(23
|
)
|
|
|
(23
|
)
|
| |
Tier 1 common equity
|
|
$
|
1,315,548
|
|
|
$
|
1,288,423
|
|
|
$
|
1,263,957
|
|
|
$
|
1,220,531
|
|
|
$
|
1,196,443
|
|
| |
|
|
|
|
|
|
|
|
|
|
|
| |
Total risk-weighted assets
|
|
$
|
8,812,515
|
|
|
$
|
8,954,477
|
|
|
$
|
9,079,164
|
|
|
$
|
9,255,697
|
|
|
$
|
9,405,798
|
|
| |
|
|
|
|
|
|
|
|
|
|
|
| |
Tier 1 common equity to risk-weighted assets ratio
|
|
|
14.93
|
%
|
|
|
14.39
|
%
|
|
|
13.92
|
%
|
|
|
13.19
|
%
|
|
|
12.72
|
%
|
| |
|
|
|
|
|
|
|
|
|
|
|
|
1- Tier 1 capital excludes net unrealized gains (losses) on available-for-sale debt securities and net unrealized gains on available-for-sale equity securities with readily determinable fair values, in accordance with regulatory risk-based capital guidelines. In arriving at Tier 1 capital, institutions are required to deduct net unrealized losses on available-for-sale equity securities with readily determinable fair values, net of tax.
|
|
2- Approximately $11.2 million of the Corporation's deferred tax assets as of December 31, 2014 (September 30, 2014 - $11.3 million; June 30, 2014 - $9.9 million; March 31, 2014 - $9 million; December 31, 2013 - $7 million) was included without limitation in regulatory capital pursuant to the risk-based capital guidelines, while approximately $0 of such assets as of December 31, 2014 (September 30, 2014 - $0; June 30, 2014 - $0; March 31, 2014 - $25 thousand; December 31, 2013 - $0) exceeded the limitation imposed by these guidelines and, as "disallowed deferred tax assets," was deducted in calculating Tier 1 capital. According to regulatory capital guidelines, the deferred tax assets that are dependent upon future taxable income are limited for inclusion in Tier 1 capital to the lesser of: (i) the amount of such deferred tax asset that the entity expects to realize within one year of the calendar quarter-end date, based on its projected future taxable income for that year, or (ii) 10% of the amount of the entity's Tier 1 capital. Approximately $1.1 million of the Corporation's other net deferred tax liability as of December 31, 2014 (September 30, 2014 - $1.4 million deferred tax liability; June 30, 2014 - $1.2 million deferred tax liability; March 31, 2014 - $0.8 million deferred tax liability; December 31, 2013 - $0.3 million deferred tax asset) represented primarily the deferred tax effects of unrealized gains and losses on available-for-sale debt securities, which are permitted to be excluded prior to deriving the amount of net deferred tax assets subject to limitation under the guidelines.
|
| |
| |
Exposure to Puerto Rico Government
As of December 31, 2014, the Corporation had $339.0 million of credit facilities granted to the Puerto Rico Government, its municipalities and public corporations, of which $308.0 million was outstanding, compared to $316.3 million outstanding as of September 30, 2014. Approximately $201.4 million of the granted credit facilities outstanding consisted of loans to municipalities in Puerto Rico for which, in most cases, the good faith, credit and unlimited taxing power of the applicable municipality have been pledged to their repayment. Approximately $13.2 million consisted of loans to units of the central government, and approximately $93.4 million consisted of loans to public corporations, including a $75.0 million direct exposure to the Puerto Rico Electric Power Authority (“PREPA”). In addition, the Corporation had $133.3 million outstanding in financings to the hotel industry in Puerto Rico guaranteed by the Puerto Rico Tourism Development Fund as of December 31, 2014, down $67.1 million, compared to $200.4 million outstanding as of September 30, 2014.
In August 2014, PREPA entered into a forbearance agreement with a group of banks, including FirstBank, to extend its maturing credit lines to March 31, 2015. As a result of the forbearance, this credit facility was classified as a TDR during the third quarter of 2014. This loan which continues performing under the terms of the agreement continues to be maintained in accrual status based on the estimated cash flows analysis performed on this noncollateral dependent loan, repayment prospects and compliance with contractual terms.
The Corporation had outstanding $61.2 million in obligations of the Puerto Rico government as part of its available-for-sale investment securities portfolio carried on its books at a fair value of $43.2 million as of December 31, 2014. The fair value of the Puerto Rico government obligations held by the Corporation decreased by approximately $3.2 million during the fourth quarter of 2014.
As of December 31, 2014, the Corporation had $227.4 million of public sector deposits in Puerto Rico, compared to $250.9 million as of September 30, 2014. Approximately 54% is from municipalities in Puerto Rico and 46% is from public corporations and the central government and agencies.
Conference Call / Webcast Information
First BanCorp’s senior management will host an earnings conference call and live webcast on Thursday, February 5, 2015, at 2:00 p.m. (Eastern Time). The call may be accessed via a live Internet webcast through the investor relations section of the Corporation’s web site: www.firstbankpr.com or through a dial-in telephone number at (877) 506-6537 or (412) 380–2001 for international callers. The Corporation recommends that listeners go to the web site at least 15 minutes prior to the call to download and install any necessary software. Following the webcast presentation, a question and answer session will be made available to research analysts and institutional investors. A replay of the webcast will be archived in the investor relations section of First BanCorp’s web site, www.firstbankpr.com, until February 5, 2016. A telephone replay will be available one hour after the end of the conference call through March 7, 2015 at (877) 344-7529 or (412) 317-0088 for international callers. The conference number is 10059637.
Safe Harbor
This press release may contain “forward-looking statements” concerning the Corporation’s future economic performance. The words or phrases “expect,” “anticipate,” “look forward,” “should,” “believes” and similar expressions are meant to identify “forward-looking statements” within the meaning of Section 27A of the Securities Act of 1933, as amended, and Section 21E of the Securities Exchange Act of 1934, as amended, and are subject to the safe harbor created by such sections. The Corporation wishes to caution readers not to place undue reliance on any such “forward-looking statements,” which speak only as of the date made, and to advise readers that various factors, including, but not limited to, the following could cause actual results to differ materially from those expressed in, or implied by such forward-looking statements: uncertainty about whether the Corporation and FirstBank will be able to continue to fully comply with the written agreement dated June 3, 2010 that the Corporation entered into with the Federal Reserve Bank of New York (the “New York Fed”) and the consent order dated June 2, 2010 that FirstBank entered into with the FDIC and the Office of the Commissioner of Financial Institutions of the Commonwealth of Puerto Rico (the “FDIC Order”) that, among other things, require FirstBank to maintain certain capital levels and reduce its special mention, classified, delinquent, and non-performing assets; the risk of being subject to possible additional regulatory actions; uncertainty as to the availability of certain funding sources, such as brokered CDs; the Corporation’s reliance on brokered CDs and its ongoing ability to obtain, on a periodic basis, approval from the FDIC to issue brokered CDs to fund operations and provide liquidity in accordance with the terms of the FDIC Order; the risk of not being able to fulfill the Corporation’s cash obligations or resume paying dividends to the Corporation’s stockholders in the future due to the Corporation’s need to receive approval from the New York Fed or the Board of Governors of the Federal Reserve System (the “Federal Reserve Board”) to receive dividends from FirstBank, or FirstBank’s failure to generate sufficient cash flow to make a dividend payment to the Corporation; the strength or weakness of the real estate markets and of the consumer and commercial sectors and their impact on the credit quality of the Corporation’s loans and other assets, which has contributed and may continue to contribute to, among other things, high levels of non-performing assets, charge-offs and provisions and may subject the Corporation to further risk from loan defaults and foreclosures; the ability of FirstBank to realize the benefit of its deferred tax asset; additional adverse changes in general economic conditions in Puerto Rico, the U.S., and the U.S. Virgin Islands and British Virgin Islands, including the interest rate environment, market liquidity, housing absorption rates, real estate prices, and disruptions in the U.S. capital markets, which has reduced and may once again reduce interest margins and impact funding sources, and has affected demand for all of the Corporation’s products and services and reduce the Corporation’s revenues and earnings, and the value of the Corporation’s assets; a credit default by the Puerto Rico government or any of its public corporations or other instrumentalities, and recent and any future downgrades of the long-term and short-term debt ratings of the Puerto Rico government, which could exacerbate Puerto Rico’s adverse economic conditions; an adverse change in the Corporation’s ability to attract new clients and retain existing ones; a decrease in demand for the Corporation’s products and services and lower revenues and earnings because of the continued recession in Puerto Rico, the current fiscal problems of the Puerto Rico government and recent credit downgrades of the Puerto Rico government’s debt; the risk that any portion of the unrealized losses in the Corporation’s investment portfolio is determined to be other-than-temporary, including unrealized losses on the Puerto Rico government’s obligations; uncertainty about regulatory and legislative changes for financial services companies in Puerto Rico, the U.S., and the U.S. Virgin Islands and British Virgin Islands, which could affect the Corporation’s financial condition or performance and could cause the Corporation’s actual results for future periods to differ materially from prior results and anticipated or projected results; changes in the fiscal and monetary policies and regulations of the U.S. federal government and the Puerto Rico government, including those determined by the Federal Reserve Board, the New York Fed, the FDIC, government-sponsored housing agencies, and regulators in Puerto Rico and the U.S. and British Virgin Islands; the risk of possible failure or circumvention of controls and procedures and the risk that the Corporation’s risk management policies may not be adequate; the risk that the FDIC may increase the deposit insurance premium and/or require special assessments to replenish its insurance fund, causing an additional increase in the Corporation’s non-interest expenses; the impact on the Corporation’s results of operations and financial condition of acquisitions and dispositions; a need to recognize additional impairments on financial instruments, goodwill, or other intangible assets relating to acquisitions; the risk that downgrades in the credit ratings of the Corporation’s long-term senior debt will adversely affect the Corporation’s ability to access necessary external funds; the impact of the Dodd-Frank Wall Street Reform and Consumer Protection Act on the Corporation’s businesses, business practices, and cost of operations; and general competitive factors and industry consolidation. The Corporation does not undertake, and specifically disclaims any obligation, to update any “forward-looking statements” to reflect occurrences or unanticipated events or circumstances after the date of such statements except as required by the federal securities laws.
Basis of Presentation
Use of Non-GAAP Financial Measures
This press release contains non-GAAP financial measures. Non-GAAP financial measures are set forth when management believes they will be helpful to an understanding of the Corporation’s results of operations or financial position. Where non-GAAP financial measures are used, the comparable GAAP financial measure, as well as the reconciliation to the comparable GAAP financial measure, can be found in the text or in the attached tables to this earnings release.
Tangible Common Equity Ratio and Tangible Book Value per Common Share
The tangible common equity ratio and tangible book value per common share are non-GAAP financial measures generally used by the financial community to evaluate capital adequacy. Tangible common equity is total equity less preferred equity, goodwill, core deposit intangibles, and other intangibles, such as the purchased credit card relationship intangible. Tangible assets are total assets less goodwill, core deposit intangibles, and other intangibles, such as the purchased credit card relationship intangible. Management and many stock analysts use the tangible common equity ratio and tangible book value per common share in conjunction with more traditional bank capital ratios to compare the capital adequacy of banking organizations with significant amounts of goodwill or other intangible assets, typically stemming from the use of the purchase method of accounting for mergers and acquisitions. Neither tangible common equity nor tangible assets, or the related measures should be considered in isolation or as a substitute for stockholders’ equity, total assets, or any other measure calculated in accordance with GAAP. Moreover, the manner in which the Corporation calculates its tangible common equity, tangible assets, and any other related measures may differ from that of other companies reporting measures with similar names.
Tier 1 Common Equity to Risk-Weighted Assets Ratio
The Tier 1 common equity to risk-weighted assets ratio is calculated by dividing (a) Tier 1 capital less non-common elements including qualifying perpetual preferred stock and qualifying trust preferred securities by (b) risk-weighted assets, which assets are calculated in accordance with current applicable bank regulatory requirements (Basel 1). The Tier 1 common equity ratio is not required by GAAP or on a recurring basis by applicable bank regulatory requirements. Management is currently monitoring this ratio, along with the other ratios discussed above, in evaluating the Corporation’s capital levels and believes that, at this time, the ratio may be of interest to investors.
Adjusted Pre-Tax, Pre-Provision Income
Adjusted pre-tax, pre-provision income is a non-GAAP performance metric that management believes is useful in analyzing underlying performance trends, particularly in times of economic stress. Adjusted pre-tax, pre-provision income, as defined by management, represents net income (loss) excluding income tax expense (benefit), the provision for loan and lease losses, gains on sale and OTTI of investment securities, fair value adjustments on derivatives, equity in earnings or loss of unconsolidated entity up until the second quarter of 2014 when the value of the investment became zero as well as certain items identified as unusual, non-recurring or non-operating.
In addition, from time to time, adjusted pre-tax, pre-provision income will reflect the omission of revenue or expense items that management judges to be outside of ordinary banking activities or of items that, while they may be associated with ordinary banking activities, are so unusually large that management believes that a complete analysis of the Corporation’s performance requires consideration also of adjusted pre-tax, pre-provision income that excludes such amounts.
Net Interest Income, Excluding Valuations and Prepayment Penalty, and on a Tax-Equivalent Basis
Net interest income, interest rate spread, and net interest margin are reported excluding the changes in the fair value of derivative instruments and a $2.5 million prepayment penalty collected on a commercial mortgage loan paid off, and on a tax-equivalent basis. The presentation of net interest income excluding valuations and the $2.5 million prepayment penalty collected provides additional information about the Corporation’s net interest income and facilitates comparability and analysis. The changes in the fair value of derivative instruments have no effect on interest due or interest earned on interest-bearing liabilities or interest-earning assets, respectively. The tax-equivalent adjustment to net interest income recognizes the income tax savings when comparing taxable and tax-exempt assets and assumes a marginal income tax rate. Income from tax-exempt earning assets is increased by an amount equivalent to the taxes that would have been paid if this income had been taxable at statutory rates. Management believes that it is a standard practice in the banking industry to present net interest income, interest rate spread, and net interest margin on a fully tax-equivalent basis. This adjustment puts all earning assets, most notably tax-exempt securities and certain loans, on a common basis that facilitates comparison of results to results of peers.
Financial measures adjusted to exclude the effect of expenses related to the acquisition of performing mortgage loans from Doral, gains or losses on sales of investment securities and OTTI of investment securities.
To supplement the Corporation’s financial statements presented in accordance with GAAP, the Corporation provides additional measures of adjusted non-interest expenses and adjusted non-interest income. Adjusted non-interest expenses exclude professional service fees specifically related to the acquisition of performing mortgage loans from Doral Bank. Adjusted non-interest income excludes gains (losses) on sales of investments and OTTI of investment securities. Management believes that these non-GAAP measures enhance the ability of analysts and investors to analyze trends in the Corporation’s business and to better understand the performance of the Corporation. In addition, the Corporation may utilize these non-GAAP financial measures as a guide in its budgeting and long-term planning process. Any analysis of these non-GAAP financial measures should be used only in conjunction with results presented in accordance with GAAP. The following table shows reconciliations of these non-GAAP financial measures to the corresponding measures calculated and presented in accordance with GAAP.
| |
|
|
|
|
|
|
|
|
|
|
(Dollars in thousands)
|
|
|
|
|
|
|
|
|
|
| |
|
|
|
|
|
|
|
|
|
|
2014 Fourth Quarter
|
|
As Reported
(GAAP)
|
|
Acquisition of
mortgage loans
from Doral related
expenses
|
Loss on sale of
investment
securities and
OTTI on debt
securities
|
Adjusted
(Non-GAAP)
|
| |
|
|
|
|
|
|
|
|
|
| |
|
|
|
|
|
|
|
|
|
|
Non-interest income
|
|
$
|
17,893
|
|
|
$
|
-
|
|
|
$
|
172
|
|
$
|
18,065
|
| |
|
|
|
|
|
|
|
|
|
|
Non-interest expenses
|
|
$
|
94,782
|
|
|
$
|
-
|
|
|
$
|
-
|
|
$
|
94,782
|
| |
|
|
|
|
|
|
|
|
|
| |
|
|
|
|
|
|
|
|
|
| |
|
|
|
|
|
|
|
|
|
|
(Dollars in thousands)
|
|
|
|
|
|
|
|
|
|
| |
|
|
|
|
|
|
|
|
|
|
2014 Third Quarter
|
|
As Reported
(GAAP)
|
|
Acquisition of
mortgage loans
from Doral
related
expenses
|
OTTI on debt
securities
|
Adjusted
(Non-GAAP)
|
| |
|
|
|
|
|
|
|
|
|
| |
|
|
|
|
|
|
|
|
|
|
Non-interest income
|
|
$
|
16,174
|
|
|
$
|
-
|
|
|
$
|
245
|
|
$
|
16,419
|
| |
|
|
|
|
|
|
|
|
|
|
Non-interest expenses
|
|
$
|
93,604
|
|
|
$
|
(659
|
)
|
|
$
|
-
|
|
$
|
92,945
|
| |
|
|
|
|
|
|
|
|
|
|
|
|
|
|
| |
|
|
FIRST BANCORP
|
|
Condensed Consolidated Statements of Financial Condition
|
| |
|
|
|
|
|
|
| |
|
As of
|
| |
|
December 31,
|
|
September 30,
|
|
December 31,
|
|
(In thousands, except for share information)
|
|
|
2014
|
|
|
|
2014
|
|
|
|
2013
|
|
|
ASSETS
|
|
|
|
|
|
|
| |
|
|
|
|
|
|
|
Cash and due from banks
|
|
$
|
779,147
|
|
|
$
|
953,038
|
|
|
$
|
454,302
|
|
| |
|
|
|
|
|
|
|
Money market investments:
|
|
|
|
|
|
|
|
Time deposits with other financial institutions
|
|
|
300
|
|
|
|
300
|
|
|
|
300
|
|
|
Other short-term investments
|
|
|
16,661
|
|
|
|
16,657
|
|
|
|
201,069
|
|
|
Total money market investments
|
|
|
16,961
|
|
|
|
16,957
|
|
|
|
201,369
|
|
| |
|
|
|
|
|
|
|
Investment securities available for sale, at fair value
|
|
|
1,965,666
|
|
|
|
1,977,137
|
|
|
|
1,978,282
|
|
| |
|
|
|
|
|
|
| |
|
|
|
|
|
|
|
Other equity securities
|
|
|
25,752
|
|
|
|
25,752
|
|
|
|
28,691
|
|
| |
|
|
|
|
|
|
|
Total investment securities
|
|
|
1,991,418
|
|
|
|
2,002,889
|
|
|
|
2,006,973
|
|
| |
|
|
|
|
|
|
|
Investment in unconsolidated entity
|
|
|
-
|
|
|
|
-
|
|
|
|
7,279
|
|
| |
|
|
|
|
|
|
|
Loans, net of allowance for loan and lease losses of $222,395 (September 30, 2014 - $225,434; December 31, 2013 - $285,858)
|
|
|
9,040,041
|
|
|
|
9,089,968
|
|
|
|
9,350,312
|
|
|
Loans held for sale, at lower of cost or market
|
|
|
76,956
|
|
|
|
80,014
|
|
|
|
75,969
|
|
|
Total loans, net
|
|
|
9,116,997
|
|
|
|
9,169,982
|
|
|
|
9,426,281
|
|
| |
|
|
|
|
|
|
|
Premises and equipment, net
|
|
|
166,926
|
|
|
|
167,916
|
|
|
|
166,946
|
|
|
Other real estate owned
|
|
|
124,003
|
|
|
|
112,803
|
|
|
|
160,193
|
|
|
Accrued interest receivable on loans and investments
|
|
|
50,796
|
|
|
|
48,516
|
|
|
|
54,012
|
|
|
Other assets
|
|
|
178,148
|
|
|
|
171,179
|
|
|
|
179,570
|
|
|
Total assets
|
|
$
|
12,424,396
|
|
|
$
|
12,643,280
|
|
|
$
|
12,656,925
|
|
| |
|
|
|
|
|
|
|
LIABILITIES
|
|
|
|
|
|
|
| |
|
|
|
|
|
|
|
Deposits:
|
|
|
|
|
|
|
|
Non-interest-bearing deposits
|
|
$
|
900,616
|
|
|
$
|
862,422
|
|
|
$
|
851,212
|
|
|
Interest-bearing deposits
|
|
|
8,583,329
|
|
|
|
8,840,752
|
|
|
|
9,028,712
|
|
|
Total deposits
|
|
|
9,483,945
|
|
|
|
9,703,174
|
|
|
|
9,879,924
|
|
| |
|
|
|
|
|
|
|
Securities sold under agreements to repurchase
|
|
|
900,000
|
|
|
|
900,000
|
|
|
|
900,000
|
|
|
Advances from the Federal Home Loan Bank (FHLB)
|
|
|
325,000
|
|
|
|
325,000
|
|
|
|
300,000
|
|
|
Other borrowings
|
|
|
231,959
|
|
|
|
231,959
|
|
|
|
231,959
|
|
|
Accounts payable and other liabilities
|
|
|
116,251
|
|
|
|
158,990
|
|
|
|
129,184
|
|
|
Total liabilities
|
|
|
11,057,155
|
|
|
|
11,319,123
|
|
|
|
11,441,067
|
|
| |
|
|
|
|
|
|
|
STOCKHOLDERS' EQUITY
|
|
|
|
|
|
|
| |
|
|
|
|
|
|
| |
|
|
|
|
|
| |
|
|
Preferred Stock, authorized 50,000,000 shares: issued 22,828,174 shares; outstanding 1,444,146 shares (September 30, 2014 - 1,444,146 shares outstanding; December 31, 2013 - 2,521,872 shares outstanding); aggregate liquidation value of $36,104 (September 30, 2014 - $36,104; December 31, 2013 - $63,047)
|
|
|
36,104
|
|
|
|
36,104
|
|
|
|
63,047
|
|
|
Common stock, $0.10 par value, authorized 2,000,000,000 shares; issued, 213,724,749 shares (September 30, 2014 - 213,642,311 shares issued; December 31, 2013 - 207,635,157 shares issued)
|
|
|
21,372
|
|
|
|
21,364
|
|
|
|
20,764
|
|
|
Less: Treasury stock (at par value)
|
|
|
(74
|
)
|
|
|
(66
|
)
|
|
|
(57
|
)
|
|
Common stock outstanding, 212,984,700 shares outstanding (September 30, 2014 - 212,977,588 shares outstanding; December 31, 2013 - 207,068,978 shares outstanding)
|
|
|
21,298
|
|
|
|
21,298
|
|
|
|
20,707
|
|
|
Additional paid-in capital
|
|
|
916,067
|
|
|
|
915,231
|
|
|
|
888,161
|
|
|
Retained earnings
|
|
|
412,123
|
|
|
|
385,847
|
|
|
|
322,679
|
|
|
Accumulated other comprehensive loss
|
|
|
(18,351
|
)
|
|
|
(34,323
|
)
|
|
|
(78,736
|
)
|
|
Total stockholders' equity
|
|
|
1,367,241
|
|
|
|
1,324,157
|
|
|
|
1,215,858
|
|
|
Total liabilities and stockholders' equity
|
|
$
|
12,424,396
|
|
|
$
|
12,643,280
|
|
|
$
|
12,656,925
|
|
| |
|
|
|
|
|
|
|
|
|
|
|
|
| |
|
FIRST BANCORP
|
|
Condensed Consolidated Statements of Income (Loss)
|
| |
|
|
|
|
|
|
|
|
|
|
| |
|
Quarter Ended
|
|
Year Ended
|
| |
|
December 31,
|
|
September 30,
|
|
December 31,
|
|
December 31,
|
|
December 31,
|
|
(In thousands, except per share information)
|
|
|
2014
|
|
|
|
2014
|
|
|
|
2013
|
|
|
|
2014
|
|
|
|
2013
|
|
| |
|
|
|
|
|
|
|
|
|
|
|
Net interest income:
|
|
|
|
|
|
|
|
|
|
|
|
Interest income
|
|
$
|
158,293
|
|
|
$
|
156,662
|
|
|
$
|
162,690
|
|
|
$
|
633,949
|
|
|
$
|
645,788
|
|
|
Interest expense
|
|
|
29,141
|
|
|
|
28,968
|
|
|
|
30,031
|
|
|
|
115,876
|
|
|
|
130,843
|
|
|
Net interest income
|
|
|
129,152
|
|
|
|
127,694
|
|
|
|
132,659
|
|
|
|
518,073
|
|
|
|
514,945
|
|
|
Provision for loan and lease losses
|
|
|
23,872
|
|
|
|
26,999
|
|
|
|
22,969
|
|
|
|
109,530
|
|
|
|
243,751
|
|
|
Net interest income after provision for loan and lease losses
|
|
|
105,280
|
|
|
|
100,695
|
|
|
|
109,690
|
|
|
|
408,543
|
|
|
|
271,194
|
|
| |
|
|
|
|
|
|
|
|
|
|
|
Non-interest income (loss):
|
|
|
|
|
|
|
|
|
|
|
|
Service charges on deposit accounts
|
|
|
4,155
|
|
|
|
4,205
|
|
|
|
4,114
|
|
|
|
16,709
|
|
|
|
16,974
|
|
|
Mortgage banking activities
|
|
|
4,472
|
|
|
|
3,809
|
|
|
|
3,906
|
|
|
|
14,685
|
|
|
|
16,830
|
|
|
Net (loss) gain on investments and impairments
|
|
|
(172
|
)
|
|
|
(245
|
)
|
|
|
-
|
|
|
|
(126
|
)
|
|
|
(159
|
)
|
|
Equity in (loss) earnings of unconsolidated entity
|
|
|
-
|
|
|
|
-
|
|
|
|
(5,893
|
)
|
|
|
(7,280
|
)
|
|
|
(16,691
|
)
|
|
Impairment of collateral pledged to Lehman
|
|
|
-
|
|
|
|
-
|
|
|
|
-
|
|
|
|
-
|
|
|
|
(66,574
|
)
|
|
Other non-interest income
|
|
|
9,438
|
|
|
|
8,405
|
|
|
|
10,358
|
|
|
|
37,360
|
|
|
|
34,131
|
|
|
Total non-interest income (loss)
|
|
|
17,893
|
|
|
|
16,174
|
|
|
|
12,485
|
|
|
|
61,348
|
|
|
|
(15,489
|
)
|
| |
|
|
|
|
|
|
|
|
|
|
|
Non-interest expenses:
|
|
|
|
|
|
|
|
|
|
|
|
Employees' compensation and benefits
|
|
|
33,854
|
|
|
|
33,877
|
|
|
|
31,428
|
|
|
|
135,422
|
|
|
|
130,815
|
|
|
Occupancy and equipment
|
|
|
14,763
|
|
|
|
14,727
|
|
|
|
15,684
|
|
|
|
58,290
|
|
|
|
60,746
|
|
|
Business promotion
|
|
|
4,491
|
|
|
|
3,925
|
|
|
|
5,251
|
|
|
|
16,531
|
|
|
|
15,977
|
|
|
Professional fees
|
|
|
13,439
|
|
|
|
12,054
|
|
|
|
11,619
|
|
|
|
47,940
|
|
|
|
49,444
|
|
|
Taxes, other than income taxes
|
|
|
4,482
|
|
|
|
4,528
|
|
|
|
4,100
|
|
|
|
18,089
|
|
|
|
18,109
|
|
|
Insurance and supervisory fees
|
|
|
8,927
|
|
|
|
9,493
|
|
|
|
11,452
|
|
|
|
40,194
|
|
|
|
48,470
|
|
|
Net loss on other real estate owned operations
|
|
|
3,655
|
|
|
|
4,326
|
|
|
|
13,321
|
|
|
|
20,596
|
|
|
|
42,512
|
|
|
Other non-interest expenses
|
|
|
11,171
|
|
|
|
10,674
|
|
|
|
13,686
|
|
|
|
42,254
|
|
|
|
48,955
|
|
|
Total non-interest expenses
|
|
|
94,782
|
|
|
|
93,604
|
|
|
|
106,541
|
|
|
|
379,316
|
|
|
|
415,028
|
|
| |
|
|
|
|
|
|
|
|
|
|
|
Income (loss) before income taxes
|
|
|
28,391
|
|
|
|
23,265
|
|
|
|
15,634
|
|
|
|
90,575
|
|
|
|
(159,323
|
)
|
|
Income tax expense
|
|
|
(2,115
|
)
|
|
|
(64
|
)
|
|
|
(845
|
)
|
|
|
(2,790
|
)
|
|
|
(5,164
|
)
|
| |
|
|
|
|
|
|
|
|
|
|
|
Net income (loss)
|
|
$
|
26,276
|
|
|
$
|
23,201
|
|
|
$
|
14,789
|
|
|
$
|
87,785
|
|
|
$
|
(164,487
|
)
|
| |
|
|
|
|
|
|
|
|
|
|
|
Net income (loss) attributable to common stockholders
|
|
$
|
26,276
|
|
|
$
|
23,201
|
|
|
$
|
14,789
|
|
|
$
|
89,444
|
|
|
$
|
(164,487
|
)
|
| |
|
|
|
|
|
|
|
|
|
|
|
Earnings (loss) per common share:
|
|
|
|
|
|
|
|
|
|
|
| |
|
|
|
|
|
|
|
|
|
|
|
Basic
|
|
$
|
0.12
|
|
|
$
|
0.11
|
|
|
$
|
0.07
|
|
|
$
|
0.43
|
|
|
$
|
(0.80
|
)
|
|
Diluted
|
|
$
|
0.12
|
|
|
$
|
0.11
|
|
|
$
|
0.07
|
|
|
$
|
0.42
|
|
|
$
|
(0.80
|
)
|
| |
|
|
|
|
|
|
|
|
|
|
About First BanCorp.
First BanCorp. is the parent corporation of FirstBank Puerto Rico, a state-chartered commercial bank with operations in Puerto Rico, the Virgin Islands and Florida, and of FirstBank Insurance Agency. First BanCorp. and FirstBank Puerto Rico operate within U.S. banking laws and regulations. The Corporation operates a total of 143 branches, stand-alone offices, and in-branch service centers throughout Puerto Rico, the U.S. and British Virgin Islands, and Florida. Among the subsidiaries of FirstBank Puerto Rico are First Federal Finance Corp., a small loan company; FirstBank Puerto Rico Securities, a broker-dealer subsidiary; First Management of Puerto Rico, a domestic corporation that holds tax-exempt assets; and FirstMortgage, Inc., a mortgage origination company. In the U.S. Virgin Islands, FirstBank operates First Express, a small loan company. First BanCorp’s shares of common stock trade on the New York Stock Exchange under the symbol FBP. Additional information about First BanCorp. may be found at www.firstbankpr.com.
| |
|
|
|
|
|
|
|
|
|
EXHIBIT A
|
|
|
|
|
|
|
|
|
|
Table 1 – Selected Financial Data
|
|
|
|
|
|
|
|
|
| |
|
|
|
|
|
|
|
|
|
(In thousands, except for per share and financial ratios data)
|
|
Quarter Ended
|
|
Year Ended
|
|
| |
|
|
December 31,
|
|
September 30,
|
|
December 31,
|
|
December 31,
|
|
December 31,
|
|
| |
|
|
|
2014
|
|
|
|
2014
|
|
|
|
2013
|
|
|
|
2014
|
|
|
|
2013
|
|
|
|
Condensed Income Statements:
|
|
|
|
|
|
|
|
|
|
|
|
| |
Total interest income
|
|
$
|
158,293
|
|
|
$
|
156,662
|
|
|
$
|
162,690
|
|
|
$
|
633,949
|
|
|
$
|
645,788
|
|
|
| |
Total interest expense
|
|
|
29,141
|
|
|
|
28,968
|
|
|
|
30,031
|
|
|
|
115,876
|
|
|
|
130,843
|
|
|
| |
Net interest income
|
|
|
129,152
|
|
|
|
127,694
|
|
|
|
132,659
|
|
|
|
518,073
|
|
|
|
514,945
|
|
|
| |
Provision for loan and lease losses
|
|
|
23,872
|
|
|
|
26,999
|
|
|
|
22,969
|
|
|
|
109,530
|
|
|
|
243,751
|
|
|
| |
Non-interest income (loss)
|
|
|
17,893
|
|
|
|
16,174
|
|
|
|
12,485
|
|
|
|
61,348
|
|
|
|
(15,489
|
)
|
|
| |
Non-interest expenses
|
|
|
94,782
|
|
|
|
93,604
|
|
|
|
106,541
|
|
|
|
379,316
|
|
|
|
415,028
|
|
|
| |
Income (loss) before income taxes
|
|
|
28,391
|
|
|
|
23,265
|
|
|
|
15,634
|
|
|
|
90,575
|
|
|
|
(159,323
|
)
|
|
| |
Income tax expense
|
|
|
(2,115
|
)
|
|
|
(64
|
)
|
|
|
(845
|
)
|
|
|
(2,790
|
)
|
|
|
(5,164
|
)
|
|
| |
Net income (loss)
|
|
|
26,276
|
|
|
|
23,201
|
|
|
|
14,789
|
|
|
|
87,785
|
|
|
|
(164,487
|
)
|
|
| |
Net income (loss) attributable to common stockholders
|
|
|
26,276
|
|
|
|
23,201
|
|
|
|
14,789
|
|
|
|
89,444
|
|
|
|
(164,487
|
)
|
|
| |
|
|
|
|
|
|
|
|
|
|
|
|
| |
|
|
|
|
|
|
|
|
|
|
|
|
|
Per Common Share Results:
|
|
|
|
|
|
|
|
|
|
|
|
| |
Net earnings (loss) per share basic
|
|
$
|
0.12
|
|
|
$
|
0.11
|
|
|
$
|
0.07
|
|
|
$
|
0.43
|
|
|
$
|
(0.80
|
)
|
|
| |
Net earnings (loss) per share diluted
|
|
$
|
0.12
|
|
|
$
|
0.11
|
|
|
$
|
0.07
|
|
|
$
|
0.42
|
|
|
$
|
(0.80
|
)
|
|
| |
Cash dividends declared
|
|
$
|
-
|
|
|
$
|
-
|
|
|
$
|
-
|
|
|
$
|
-
|
|
|
$
|
-
|
|
|
| |
Average shares outstanding
|
|
|
210,539
|
|
|
|
210,466
|
|
|
|
205,634
|
|
|
|
208,752
|
|
|
|
205,542
|
|
|
| |
Average shares outstanding diluted
|
|
|
212,713
|
|
|
|
212,359
|
|
|
|
207,235
|
|
|
|
210,540
|
|
|
|
205,542
|
|
|
| |
Book value per common share
|
|
$
|
6.25
|
|
|
$
|
6.05
|
|
|
$
|
5.57
|
|
|
$
|
6.25
|
|
|
$
|
5.57
|
|
|
| |
Tangible book value per common share (1)
|
|
$
|
6.02
|
|
|
$
|
5.81
|
|
|
$
|
5.30
|
|
|
$
|
6.02
|
|
|
$
|
5.30
|
|
|
| |
|
|
|
|
|
|
|
|
|
|
|
|
|
Selected Financial Ratios (In Percent):
|
|
|
|
|
|
|
|
|
|
|
|
| |
|
|
|
|
|
|
|
|
|
|
|
|
|
Profitability:
|
|
|
|
|
|
|
|
|
|
|
|
| |
Return on Average Assets
|
|
|
0.83
|
|
|
|
0.73
|
|
|
|
0.46
|
|
|
|
0.69
|
|
|
|
(1.28
|
)
|
|
| |
Interest Rate Spread (2)
|
|
|
4.11
|
|
|
|
4.07
|
|
|
|
4.22
|
|
|
|
4.16
|
|
|
|
4.01
|
|
|
| |
Net Interest Margin (2)
|
|
|
4.30
|
|
|
|
4.25
|
|
|
|
4.40
|
|
|
|
4.34
|
|
|
|
4.21
|
|
|
| |
Return on Average Total Equity
|
|
|
7.75
|
|
|
|
7.01
|
|
|
|
4.75
|
|
|
|
6.77
|
|
|
|
(12.39
|
)
|
|
| |
Return on Average Common Equity
|
|
|
7.97
|
|
|
|
7.21
|
|
|
|
5.01
|
|
|
|
7.03
|
|
|
|
(13.01
|
)
|
|
| |
Average Total Equity to Average Total Assets
|
|
|
10.68
|
|
|
|
10.44
|
|
|
|
9.76
|
|
|
|
10.25
|
|
|
|
10.36
|
|
|
| |
Total capital
|
|
|
19.16
|
|
|
|
18.57
|
|
|
|
17.06
|
|
|
|
19.16
|
|
|
|
17.06
|
|
|
| |
Tier 1 capital
|
|
|
17.89
|
|
|
|
17.30
|
|
|
|
15.78
|
|
|
|
17.89
|
|
|
|
15.78
|
|
|
| |
Leverage
|
|
|
12.54
|
|
|
|
12.34
|
|
|
|
11.71
|
|
|
|
12.54
|
|
|
|
11.71
|
|
|
| |
Tangible common equity ratio (1)
|
|
|
10.35
|
|
|
|
9.82
|
|
|
|
8.71
|
|
|
|
10.35
|
|
|
|
8.71
|
|
|
| |
Tier 1 common equity to risk-weight assets (1)
|
|
|
14.93
|
|
|
|
14.39
|
|
|
|
12.72
|
|
|
|
14.93
|
|
|
|
12.72
|
|
|
| |
Dividend payout ratio
|
|
|
-
|
|
|
|
-
|
|
|
|
-
|
|
|
|
-
|
|
|
|
-
|
|
|
| |
Efficiency ratio (3)
|
|
|
64.46
|
|
|
|
65.06
|
|
|
|
73.40
|
|
|
|
65.46
|
|
|
|
83.10
|
|
|
| |
|
|
|
|
|
|
|
|
|
|
|
|
|
Asset Quality:
|
|
|
|
|
|
|
|
|
|
|
|
| |
Allowance for loan and lease losses to loans held for investment
|
|
|
2.40
|
|
|
|
2.42
|
|
|
|
2.97
|
|
|
|
2.40
|
|
|
|
2.97
|
|
|
| |
Net charge-offs (annualized) to average loans
|
|
|
1.13
|
|
|
|
1.80
|
|
|
|
1.10
|
|
|
|
1.81
|
|
(4
|
)
|
|
4.01
|
|
(6
|
)
|
| |
Provision for loan and lease losses to net charge-offs
|
|
|
88.71
|
|
|
|
63.17
|
|
|
|
86.71
|
|
|
|
63.31
|
|
(5
|
)
|
|
61.97
|
|
(7
|
)
|
| |
Non-performing assets to total assets
|
|
|
5.77
|
|
|
|
5.89
|
|
|
|
5.73
|
|
|
|
5.77
|
|
|
|
5.73
|
|
|
| |
Non-performing loans held for investment to total loans held for investment
|
|
|
5.66
|
|
|
|
6.01
|
|
|
|
5.14
|
|
|
|
5.66
|
|
|
|
5.14
|
|
|
| |
Allowance to total non-performing loans held for investment
|
|
|
42.45
|
|
|
|
40.29
|
|
|
|
57.69
|
|
|
|
42.45
|
|
|
|
57.69
|
|
|
| |
Allowance to total non-performing loans held for investment
|
|
|
|
|
|
|
|
| |
excluding residential real estate loans
|
|
|
64.80
|
|
|
|
60.20
|
|
|
|
85.56
|
|
|
|
64.80
|
|
|
|
85.56
|
|
|
| |
|
|
|
|
|
|
|
|
|
|
|
|
|
Other Information:
|
|
|
|
|
|
|
|
|
|
|
|
| |
Common Stock Price: End of period
|
|
$
|
5.87
|
|
|
$
|
4.75
|
|
|
$
|
6.19
|
|
|
$
|
5.87
|
|
|
$
|
6.19
|
|
|
| |
|
|
|
|
|
|
|
|
|
|
|
|
| |
|
|
|
|
|
|
|
|
|
|
|
|
|
1- Non-GAAP measure. See pages 13-14 for GAAP to Non-GAAP reconciliations.
|
|
|
|
|
|
2- On a tax-equivalent basis and excluding changes in the fair value of derivative instruments (Non-GAAP measure). See page 4 for GAAP to Non-GAAP reconciliations and refer to discussions in Tables 2 and 3 below.
|
|
3- Non-interest expenses to the sum of net interest income and non-interest income. The denominator includes non-recurring income and changes in the fair value of derivative instruments.
|
|
4- The net charge-offs to average loans ratio, excluding the impact associated with the acquisition of mortgage loans from Doral, was 1.74% for the year ended December 31, 2014.
|
|
5- The provision for loan and lease losses to net charge-offs ratio, excluding the impact associated with the acquisition of mortgage loans from Doral, was 65.09% for the year ended December 31, 2014.
|
|
6- The net charge-offs to average loans ratio, excluding the impact associated with the bulk sales of assets and the transfer of loans to held for sale, was 1.68% for the year ended December 31, 2013.
|
|
7- The provision for loan and lease losses to net charge-offs ratio, excluding the impact associated with the bulk sales of assets and the transfer of loans to held for sale, was 69.47% for the year ended December 31, 2013.
|
| |
|
|
|
|
|
|
|
|
|
|
| |
|
Table 2 – Quarterly Statement of Average Interest-Earning Assets and Average Interest-Bearing Liabilities
|
|
(On a Tax-Equivalent Basis and Excluding Valuations)
|
| |
|
|
|
|
|
|
|
|
|
|
|
|
|
|
|
|
|
|
|
(Dollars in thousands)
|
| |
|
Average volume
|
|
Interest income (1) / expense
|
|
Average rate (1)
|
| |
|
December 31,
|
|
September 30,
|
|
December 31,
|
|
December 31,
|
|
September 30,
|
|
December 31,
|
|
December 31,
|
|
September 30,
|
|
December 31,
|
|
Quarter ended
|
|
2014
|
|
2014
|
|
2013
|
|
2014
|
|
2014
|
|
2013
|
|
2014
|
|
2014
|
|
2013
|
| |
|
|
|
|
|
|
|
|
|
|
|
|
|
|
|
|
|
|
|
Interest-earning assets:
|
|
|
|
|
|
|
|
|
|
|
|
|
|
|
|
|
|
|
|
Money market & other short-term investments
|
|
$
|
753,234
|
|
$
|
744,738
|
|
$
|
609,398
|
|
$
|
465
|
|
$
|
473
|
|
$
|
433
|
|
0.24
|
%
|
|
0.25
|
%
|
|
0.28
|
%
|
|
Government obligations (2)
|
|
|
382,460
|
|
|
339,261
|
|
|
342,769
|
|
|
2,143
|
|
|
1,956
|
|
|
2,045
|
|
2.22
|
%
|
|
2.29
|
%
|
|
2.37
|
%
|
|
Mortgage-backed securities
|
|
|
1,602,910
|
|
|
1,657,816
|
|
|
1,737,331
|
|
|
12,023
|
|
|
11,985
|
|
|
16,908
|
|
2.98
|
%
|
|
2.87
|
%
|
|
3.86
|
%
|
|
FHLB stock
|
|
|
25,467
|
|
|
26,788
|
|
|
28,466
|
|
|
272
|
|
|
283
|
|
|
311
|
|
4.24
|
%
|
|
4.19
|
%
|
|
4.33
|
%
|
|
Equity securities
|
|
|
319
|
|
|
320
|
|
|
1,277
|
|
|
-
|
|
|
-
|
|
|
-
|
|
0.00
|
%
|
|
0.00
|
%
|
|
0.00
|
%
|
|
Total investments (3)
|
|
|
2,764,390
|
|
|
2,768,923
|
|
|
2,719,241
|
|
|
14,903
|
|
|
14,697
|
|
|
19,697
|
|
2.14
|
%
|
|
2.11
|
%
|
|
2.87
|
%
|
|
Residential mortgage loans
|
|
|
3,011,682
|
|
|
2,803,138
|
|
|
2,536,086
|
|
|
42,307
|
|
|
39,401
|
|
|
35,345
|
|
5.57
|
%
|
|
5.58
|
%
|
|
5.53
|
%
|
|
Construction loans
|
|
|
183,882
|
|
|
195,108
|
|
|
214,528
|
|
|
1,688
|
|
|
1,910
|
|
|
1,690
|
|
3.64
|
%
|
|
3.88
|
%
|
|
3.13
|
%
|
|
C&I and commercial mortgage loans
|
|
|
4,287,157
|
|
|
4,434,798
|
|
|
4,854,366
|
|
|
48,959
|
|
|
49,043
|
|
|
51,443
|
|
4.53
|
%
|
|
4.39
|
%
|
|
4.20
|
%
|
|
Finance leases
|
|
|
234,613
|
|
|
237,374
|
|
|
243,659
|
|
|
4,648
|
|
|
4,707
|
|
|
5,195
|
|
7.86
|
%
|
|
7.87
|
%
|
|
8.46
|
%
|
|
Consumer loans
|
|
|
1,771,093
|
|
|
1,806,158
|
|
|
1,816,374
|
|
|
49,491
|
|
|
50,481
|
|
|
54,087
|
|
11.09
|
%
|
|
11.09
|
%
|
|
11.81
|
%
|
|
Total loans (4) (5)
|
|
|
9,488,427
|
|
|
9,476,576
|
|
|
9,665,013
|
|
|
147,093
|
|
|
145,542
|
|
|
147,760
|
|
6.15
|
%
|
|
6.09
|
%
|
|
6.07
|
%
|
|
Total interest-earning assets
|
|
$
|
12,252,817
|
|
$
|
12,245,499
|
|
$
|
12,384,254
|
|
$
|
161,996
|
|
$
|
160,239
|
|
$
|
167,457
|
|
5.25
|
%
|
|
5.19
|
%
|
|
5.36
|
%
|
| |
|
|
|
|
|
|
|
|
|
|
|
|
|
|
|
|
|
|
|
Interest-bearing liabilities:
|
|
|
|
|
|
|
|
|
|
|
|
|
|
|
|
|
|
|
|
Brokered CDs
|
|
$
|
2,989,383
|
|
$
|
3,097,358
|
|
$
|
3,110,888
|
|
$
|
7,309
|
|
$
|
7,482
|
|
$
|
7,686
|
|
0.97
|
%
|
|
0.96
|
%
|
|
0.98
|
%
|
|
Other interest-bearing deposits
|
|
|
5,739,792
|
|
|
5,691,643
|
|
|
5,907,094
|
|
|
11,709
|
|
|
11,862
|
|
|
13,186
|
|
0.81
|
%
|
|
0.83
|
%
|
|
0.89
|
%
|
|
Other borrowed funds
|
|
|
1,131,959
|
|
|
1,131,959
|
|
|
1,131,959
|
|
|
9,168
|
|
|
8,675
|
|
|
8,308
|
|
3.21
|
%
|
|
3.04
|
%
|
|
2.91
|
%
|
|
FHLB advances
|
|
|
325,000
|
|
|
324,674
|
|
|
300,730
|
|
|
955
|
|
|
949
|
|
|
851
|
|
1.17
|
%
|
|
1.16
|
%
|
|
1.12
|
%
|
|
Total interest-bearing liabilities
|
|
$
|
10,186,134
|
|
$
|
10,245,634
|
|
$
|
10,450,671
|
|
$
|
29,141
|
|
$
|
28,968
|
|
$
|
30,031
|
|
1.14
|
%
|
|
1.12
|
%
|
|
1.14
|
%
|
|
Net interest income
|
|
|
|
|
|
|
|
$
|
132,855
|
|
$
|
131,271
|
|
$
|
137,426
|
|
|
|
|
|
|
|
Interest rate spread
|
|
|
|
|
|
|
|
|
|
|
|
|
|
4.11
|
%
|
|
4.07
|
%
|
|
4.22
|
%
|
|
Net interest margin
|
|
|
|
|
|
|
|
|
|
|
|
|
|
4.30
|
%
|
|
4.25
|
%
|
|
4.40
|
%
|
| |
|
|
|
|
|
|
|
|
|
|
|
|
|
|
|
|
|
|
|
1- On a tax-equivalent basis. The tax-equivalent yield was estimated by dividing the interest rate spread on exempt assets by 1 less the Puerto Rico statutory tax rate of 39% and adding to it the cost of interest-bearing liabilities. When adjusted to a tax-equivalent basis, yields on taxable and exempt assets are comparable. Changes in the fair value of derivative instruments are excluded from interest income because the changes in valuation do not affect interest paid or received.
|
|
2- Government obligations include debt issued by government-sponsored agencies.
|
|
|
|
3- Unrealized gains and losses on available-for-sale securities are excluded from the average volumes.
|
|
4- Average loan balances include the average of total non-performing loans.
|
|
5- Interest income on loans includes $5.4 million, $3.1 million and $3.0 million for the quarters ended December 31, 2014, September 30, 2014, and December 31, 2013, respectively, of income from prepayment penalties and late fees related to the Corporation's loan portfolio.
|
| |
Table 3 – Statement of Average Interest-Earning Assets and Average Interest-Bearing Liabilities (On a Tax-Equivalent Basis and Excluding Valuations) For Years 2014 and 2013
| |
|
|
|
|
|
|
|
|
|
|
|
|
|
(Dollars in thousands)
|
| |
|
Average volume
|
|
Interest income (1) / expense
|
|
Average rate (1)
|
| |
|
December 31,
|
|
December 31,
|
|
December 31,
|
|
December 31,
|
|
December 31,
|
|
December 31,
|
|
Year Ended
|
|
2014
|
|
2013
|
|
2014
|
|
2013
|
|
2014
|
|
2013
|
| |
|
|
|
|
|
|
|
|
|
|
|
|
|
Interest-earning assets:
|
|
|
|
|
|
|
|
|
|
|
|
|
|
Money market & other short-term investments
|
|
$
|
742,929
|
|
$
|
684,074
|
|
$
|
1,892
|
|
$
|
1,927
|
|
0.25
|
%
|
|
0.28
|
%
|
|
Government obligations (2)
|
|
|
350,175
|
|
|
338,571
|
|
|
8,258
|
|
|
7,892
|
|
2.36
|
%
|
|
2.33
|
%
|
|
Mortgage-backed securities
|
|
|
1,669,406
|
|
|
1,666,091
|
|
|
54,291
|
|
|
52,841
|
|
3.25
|
%
|
|
3.17
|
%
|
|
FHLB stock
|
|
|
27,155
|
|
|
30,941
|
|
|
1,169
|
|
|
1,359
|
|
4.30
|
%
|
|
4.39
|
%
|
|
Equity securities
|
|
|
320
|
|
|
1,330
|
|
|
-
|
|
|
-
|
|
0.00
|
%
|
|
0.00
|
%
|
|
Total investments (3)
|
|
|
2,789,985
|
|
|
2,721,007
|
|
|
65,610
|
|
|
64,019
|
|
2.35
|
%
|
|
2.35
|
%
|
|
Residential mortgage loans
|
|
|
2,751,366
|
|
|
2,681,753
|
|
|
153,373
|
|
|
148,033
|
|
5.57
|
%
|
|
5.52
|
%
|
|
Construction loans
|
|
|
198,450
|
|
|
272,917
|
|
|
7,304
|
|
|
8,722
|
|
3.68
|
%
|
|
3.20
|
%
|
|
C&I and commercial mortgage loans
|
|
|
4,549,732
|
|
|
4,804,608
|
|
|
199,787
|
|
|
196,814
|
|
4.39
|
%
|
|
4.10
|
%
|
|
Finance leases
|
|
|
240,268
|
|
|
240,479
|
|
|
19,530
|
|
|
20,591
|
|
8.13
|
%
|
|
8.56
|
%
|
|
Consumer loans
|
|
|
1,806,646
|
|
|
1,799,402
|
|
|
205,278
|
|
|
220,089
|
|
11.36
|
%
|
|
12.23
|
%
|
|
Total loans (4) (5)
|
|
|
9,546,462
|
|
|
9,799,159
|
|
|
585,272
|
|
|
594,249
|
|
6.13
|
%
|
|
6.06
|
%
|
|
Total interest-earning assets
|
|
$
|
12,336,447
|
|
$
|
12,520,166
|
|
$
|
650,882
|
|
$
|
658,268
|
|
5.28
|
%
|
|
5.26
|
%
|
| |
|
|
|
|
|
|
|
|
|
|
|
|
|
Interest-bearing liabilities:
|
|
|
|
|
|
|
|
|
|
|
|
|
|
Brokered CDs
|
|
$
|
3,098,724
|
|
$
|
3,251,091
|
|
$
|
29,894
|
|
$
|
38,252
|
|
0.96
|
%
|
|
1.18
|
%
|
|
Other interest-bearing deposits
|
|
|
5,797,998
|
|
|
5,782,501
|
|
|
48,233
|
|
|
53,535
|
|
0.83
|
%
|
|
0.93
|
%
|
|
Other borrowed funds
|
|
|
1,131,959
|
|
|
1,131,959
|
|
|
34,188
|
|
|
33,025
|
|
3.02
|
%
|
|
2.92
|
%
|
|
FHLB advances
|
|
|
312,575
|
|
|
357,661
|
|
|
3,561
|
|
|
6,031
|
|
1.14
|
%
|
|
1.69
|
%
|
|
Total interest-bearing liabilities
|
|
$
|
10,341,256
|
|
$
|
10,523,212
|
|
$
|
115,876
|
|
$
|
130,843
|
|
1.12
|
%
|
|
1.24
|
%
|
|
Net interest income
|
|
|
|
|
|
$
|
535,006
|
|
$
|
527,425
|
|
|
|
|
|
Interest rate spread
|
|
|
|
|
|
|
|
|
|
4.16
|
%
|
|
4.02
|
%
|
|
Net interest margin
|
|
|
|
|
|
|
|
|
|
4.34
|
%
|
|
4.21
|
%
|
| |
|
|
|
|
|
|
|
|
|
|
|
|
|
1- On a tax-equivalent basis. The tax-equivalent yield was estimated by dividing the interest rate spread on exempt assets by 1 less the Puerto Rico statutory tax rate of 39% and adding to it the cost of interest-bearing liabilities. When adjusted to a tax-equivalent basis, yields on taxable and exempt assets are comparable. Changes in the fair value of derivative instruments are excluded from interest income because the changes in valuation do not affect interest paid or received.
|
|
2- Government obligations include debt issued by government-sponsored agencies.
|
|
3- Unrealized gains and losses on available-for-sale securities are excluded from the average volumes.
|
|
4- Average loan balances include the average of total non-performing loans.
|
|
5- Interest income on loans includes $14.2 million, and $13.8 million for the year ended December 31, 2014 and 2013, respectively, of income from prepayment penalties and late fees related to the Corporation's loan portfolio.
|
| |
|
|
|
|
|
|
| |
|
|
|
|
|
|
|
Table 4 – Non-Interest Income
|
|
|
|
|
|
|
| |
|
|
|
|
|
|
| |
|
Quarter Ended
|
|
Year Ended
|
|
|
| |
|
December 31,
|
|
September 30,
|
|
December 31,
|
|
December 31,
|
|
December 31,
|
|
(In thousands)
|
|
|
2014
|
|
|
|
2014
|
|
|
|
2013
|
|
|
|
2014
|
|
|
|
2013
|
|
| |
|
|
|
|
|
|
|
|
|
|
|
Service charges on deposit accounts
|
|
$
|
4,155
|
|
|
$
|
4,205
|
|
|
$
|
4,114
|
|
|
$
|
16,709
|
|
|
$
|
16,974
|
|
|
Mortgage banking activities
|
|
|
4,472
|
|
|
|
3,809
|
|
|
|
3,906
|
|
|
|
14,685
|
|
|
|
16,830
|
|
|
Insurance income
|
|
|
1,540
|
|
|
|
1,290
|
|
|
|
1,124
|
|
|
|
6,868
|
|
|
|
5,955
|
|
|
Broker-dealer income
|
|
|
-
|
|
|
|
-
|
|
|
|
97
|
|
|
|
459
|
|
|
|
97
|
|
|
Branch consolidations - valuation adjustments fixed assets
|
|
|
-
|
|
|
|
-
|
|
|
|
(529
|
)
|
|
|
-
|
|
|
|
(529
|
)
|
|
Other operating income
|
|
|
7,898
|
|
|
|
7,115
|
|
|
|
9,666
|
|
|
|
30,033
|
|
|
|
28,608
|
|
| |
|
|
|
|
|
|
|
|
|
|
| |
|
|
|
|
|
|
|
|
|
|
|
Non-interest income before net (loss) gain on investments, equity in earnings (loss) of unconsolidated entity, and write-off of collateral pledged to Lehman
|
|
|
18,065
|
|
|
|
16,419
|
|
|
|
18,378
|
|
|
|
68,754
|
|
|
|
67,935
|
|
| |
|
|
|
|
|
|
|
|
|
|
|
Net gain on sale of investments
|
|
|
(29
|
)
|
|
|
-
|
|
|
|
-
|
|
|
|
262
|
|
|
|
-
|
|
|
OTTI on equity securities
|
|
|
-
|
|
|
|
-
|
|
|
|
-
|
|
|
|
-
|
|
|
|
(42
|
)
|
|
OTTI on debt securities
|
|
|
(143
|
)
|
|
|
(245
|
)
|
|
|
-
|
|
|
|
(388
|
)
|
|
|
(117
|
)
|
|
Net (loss) gain on investments
|
|
|
(172
|
)
|
|
|
(245
|
)
|
|
|
-
|
|
|
|
(126
|
)
|
|
|
(159
|
)
|
| |
|
|
|
|
|
|
|
|
|
|
| |
|
|
|
|
|
|
|
|
|
|
|
Impairment - collateral pledged to Lehman
|
|
|
-
|
|
|
|
-
|
|
|
|
-
|
|
|
|
-
|
|
|
|
(66,574
|
)
|
|
Equity in earnings (loss) of unconsolidated entity
|
|
|
-
|
|
|
|
-
|
|
|
|
(5,893
|
)
|
|
|
(7,280
|
)
|
|
|
(16,691
|
)
|
| |
|
$
|
17,893
|
|
|
$
|
16,174
|
|
|
$
|
12,485
|
|
|
$
|
61,348
|
|
|
$
|
(15,489
|
)
|
| |
|
|
|
|
|
|
|
|
|
|
|
|
|
|
|
|
|
|
|
|
| |
|
|
|
|
|
|
|
Table 5 – Non-Interest Expenses
|
|
|
|
|
|
|
| |
|
|
|
|
|
|
|
(in thousands)
|
|
Quarter Ended
|
|
Year Ended
|
| |
|
December 31,
|
|
September 30,
|
|
December 31,
|
|
December 31,
|
|
December 31,
|
| |
|
|
2014
|
|
|
2014
|
|
|
2013
|
|
|
2014
|
|
|
2013
|
| |
|
|
|
|
|
|
|
|
|
|
|
Employees' compensation and benefits
|
|
$
|
33,854
|
|
$
|
33,877
|
|
$
|
31,014
|
|
$
|
135,422
|
|
$
|
130,401
|
|
Occupancy and equipment
|
|
|
14,763
|
|
|
14,727
|
|
|
15,204
|
|
|
57,336
|
|
|
60,379
|
|
Deposit insurance premium
|
|
|
7,745
|
|
|
8,335
|
|
|
10,495
|
|
|
35,481
|
|
|
43,921
|
|
Other insurance and supervisory fees
|
|
|
1,182
|
|
|
1,158
|
|
|
957
|
|
|
4,713
|
|
|
4,549
|
|
Taxes, other than income taxes
|
|
|
4,482
|
|
|
4,528
|
|
|
4,101
|
|
|
18,089
|
|
|
17,997
|
|
Professional fees:
|
|
|
|
|
|
|
|
|
|
|
|
Collections, appraisals and other credit related fees
|
|
|
4,244
|
|
|
2,914
|
|
|
2,524
|
|
|
11,629
|
|
|
10,760
|
|
Outsourcing technology services
|
|
|
4,775
|
|
|
4,840
|
|
|
4,202
|
|
|
18,429
|
|
|
14,144
|
|
Other professional fees
|
|
|
4,420
|
|
|
3,641
|
|
|
4,893
|
|
|
16,659
|
|
|
15,770
|
|
Credit and debit card processing expenses
|
|
|
4,002
|
|
|
3,741
|
|
|
4,869
|
|
|
15,449
|
|
|
12,909
|
|
Credit card processing platform conversion costs
|
|
|
-
|
|
|
-
|
|
|
-
|
|
|
-
|
|
|
1,715
|
|
Branch consolidations and other restructuring expenses
|
|
|
-
|
|
|
-
|
|
|
892
|
|
|
954
|
|
|
892
|
|
Business promotion
|
|
|
4,491
|
|
|
3,925
|
|
|
5,251
|
|
|
16,531
|
|
|
15,780
|
|
Communications
|
|
|
1,851
|
|
|
2,143
|
|
|
1,836
|
|
|
7,766
|
|
|
7,401
|
|
Net loss on OREO operations
|
|
|
3,655
|
|
|
4,326
|
|
|
13,321
|
|
|
20,596
|
|
|
40,633
|
|
Secondary offering costs
|
|
|
-
|
|
|
-
|
|
|
-
|
|
|
-
|
|
|
1,669
|
|
Terminated preferred stock exchange offer expenses
|
|
|
-
|
|
|
-
|
|
|
-
|
|
|
-
|
|
|
1,333
|
|
Acquisitions of loans from Doral related expenses
|
|
|
-
|
|
|
659
|
|
|
-
|
|
|
1,235
|
|
|
-
|
|
Bulk sales expenses
|
|
|
-
|
|
|
-
|
|
|
-
|
|
|
-
|
|
|
8,840
|
|
Loss contingency for attorneys' fees - Lehman litigation
|
|
|
-
|
|
|
-
|
|
|
2,500
|
|
|
-
|
|
|
2,500
|
|
Other
|
|
|
5,318
|
|
|
4,790
|
|
|
4,482
|
|
|
19,027
|
|
|
23,435
|
|
Total
|
|
$
|
94,782
|
|
$
|
93,604
|
|
$
|
106,541
|
|
$
|
379,316
|
|
$
|
415,028
|
| |
|
|
|
|
|
|
|
|
|
|
| |
|
|
|
Table 6 – Selected Balance Sheet Data
|
|
|
| |
|
|
|
(In thousands)
|
|
As of
|
| |
|
December 31,
|
|
September 30,
|
|
December 31,
|
| |
|
|
2014
|
|
|
|
2014
|
|
|
|
2013
|
|
|
Balance Sheet Data:
|
|
|
|
|
|
|
|
Loans, including loans held for sale
|
|
$
|
9,339,392
|
|
|
$
|
9,395,416
|
|
|
$
|
9,712,139
|
|
|
Allowance for loan and lease losses
|
|
|
222,395
|
|
|
|
225,434
|
|
|
|
285,858
|
|
|
Money market and investment securities
|
|
|
2,008,380
|
|
|
|
2,019,846
|
|
|
|
2,208,342
|
|
|
Intangible assets
|
|
|
49,907
|
|
|
|
51,143
|
|
|
|
54,866
|
|
|
Deferred tax asset, net
|
|
|
10,146
|
|
|
|
9,853
|
|
|
|
7,644
|
|
|
Total assets
|
|
|
12,424,396
|
|
|
|
12,643,280
|
|
|
|
12,656,925
|
|
|
Deposits
|
|
|
9,483,945
|
|
|
|
9,703,174
|
|
|
|
9,879,924
|
|
|
Borrowings
|
|
|
1,456,959
|
|
|
|
1,456,959
|
|
|
|
1,431,959
|
|
|
Total preferred equity
|
|
|
36,104
|
|
|
|
36,104
|
|
|
|
63,047
|
|
|
Total common equity
|
|
|
1,349,488
|
|
|
|
1,322,376
|
|
|
|
1,231,547
|
|
|
Accumulated other comprehensive loss, net of tax
|
|
|
(18,351
|
)
|
|
|
(34,323
|
)
|
|
|
(78,736
|
)
|
|
Total equity
|
|
|
1,367,241
|
|
|
|
1,324,157
|
|
|
|
1,215,858
|
|
| |
|
|
|
|
|
|
|
|
|
|
|
|
| |
|
|
|
|
|
|
|
Table 7 – Loan Portfolio
|
|
|
|
|
|
|
| |
|
|
|
|
|
|
|
Composition of the loan portfolio including loans held for sale at period-end.
|
| |
|
|
|
|
|
|
|
(In thousands)
|
|
|
|
|
|
|
| |
|
As of
|
| |
|
|
December 31,
|
|
September 30,
|
|
December 31,
|
| |
|
|
|
2014
|
|
|
2014
|
|
|
2013
|
| |
|
|
|
|
|
|
|
|
Residential mortgage loans
|
|
$
|
3,011,187
|
|
$
|
2,819,648
|
|
$
|
2,549,008
|
| |
|
|
|
|
|
|
|
|
Commercial loans:
|
|
|
|
|
|
|
| |
Construction loans
|
|
|
123,480
|
|
|
141,689
|
|
|
168,713
|
| |
Commercial mortgage loans
|
|
|
1,665,787
|
|
|
1,812,094
|
|
|
1,823,608
|
| |
Commercial and Industrial loans
|
|
|
2,479,437
|
|
|
2,515,384
|
|
|
2,788,250
|
| |
Loans to local financial institutions collateralized by real estate mortgages
|
|
|
-
|
|
|
-
|
|
|
240,072
|
|
Commercial loans
|
|
|
4,268,704
|
|
|
4,469,167
|
|
|
5,020,643
|
| |
|
|
|
|
|
|
|
|
Finance leases
|
|
|
232,126
|
|
|
236,115
|
|
|
245,323
|
| |
|
|
|
|
|
|
|
|
Consumer loans
|
|
|
1,750,419
|
|
|
1,790,472
|
|
|
1,821,196
|
| |
Loans held for investment
|
|
|
9,262,436
|
|
|
9,315,402
|
|
|
9,636,170
|
|
Loans held for sale
|
|
|
76,956
|
|
|
80,014
|
|
|
75,969
|
| |
Total loans
|
|
$
|
9,339,392
|
|
$
|
9,395,416
|
|
$
|
9,712,139
|
Table 8 – Loan Portfolio by Geography
| |
|
|
|
|
|
|
|
|
|
(In thousands)
|
|
As of December 31, 2014
|
| |
|
|
Puerto Rico
|
|
Virgin Islands
|
|
United States
|
|
Consolidated
|
| |
|
|
|
|
|
|
|
|
|
|
Residential mortgage loans
|
|
$
|
2,325,455
|
|
$
|
341,098
|
|
$
|
344,634
|
|
$
|
3,011,187
|
| |
|
|
|
|
|
|
|
|
|
|
Commercial loans:
|
|
|
|
|
|
|
|
|
| |
Construction loans
|
|
|
70,618
|
|
|
30,011
|
|
|
22,851
|
|
|
123,480
|
| |
Commercial mortgage loans
|
|
|
1,305,057
|
|
|
69,629
|
|
|
291,101
|
|
|
1,665,787
|
| |
Commercial and Industrial loans
|
|
|
2,072,265
|
|
|
120,947
|
|
|
286,225
|
|
|
2,479,437
|
|
Commercial loans
|
|
|
3,447,940
|
|
|
220,587
|
|
|
600,177
|
|
|
4,268,704
|
| |
|
|
|
|
|
|
|
|
|
|
Finance leases
|
|
|
232,126
|
|
|
-
|
|
|
-
|
|
|
232,126
|
| |
|
|
|
|
|
|
|
|
|
|
Consumer loans
|
|
|
1,666,373
|
|
|
47,811
|
|
|
36,235
|
|
|
1,750,419
|
|
Loans held for investment
|
|
|
7,671,894
|
|
|
609,496
|
|
|
981,046
|
|
|
9,262,436
|
| |
|
|
|
|
|
|
|
|
|
|
Loans held for sale
|
|
|
34,972
|
|
|
40,317
|
|
|
1,667
|
|
|
76,956
|
| |
Total loans
|
|
$
|
7,706,866
|
|
$
|
649,813
|
|
$
|
982,713
|
|
$
|
9,339,392
|
| |
|
|
|
|
|
|
|
|
|
| |
|
|
|
|
|
|
|
|
|
| |
|
|
|
|
|
|
|
|
|
|
(In thousands)
|
|
As of September 30, 2014
|
| |
|
|
Puerto Rico
|
|
Virgin Islands
|
|
United States
|
|
Consolidated
|
| |
|
|
|
|
|
|
|
|
|
|
Residential mortgage loans
|
|
$
|
2,139,435
|
|
$
|
343,620
|
|
$
|
336,593
|
|
$
|
2,819,648
|
| |
|
|
|
|
|
|
|
|
|
|
Commercial loans:
|
|
|
|
|
|
|
|
|
| |
Construction loans
|
|
|
92,734
|
|
|
25,631
|
|
|
23,324
|
|
|
141,689
|
| |
Commercial mortgage loans
|
|
|
1,445,044
|
|
|
71,888
|
|
|
295,162
|
|
|
1,812,094
|
| |
Commercial and Industrial loans
|
|
|
2,131,996
|
|
|
109,943
|
|
|
273,445
|
|
|
2,515,384
|
|
Commercial loans
|
|
|
3,669,774
|
|
|
207,462
|
|
|
591,931
|
|
|
4,469,167
|
| |
|
|
|
|
|
|
|
|
|
|
Finance leases
|
|
|
236,115
|
|
|
-
|
|
|
-
|
|
|
236,115
|
| |
|
|
|
|
|
|
|
|
|
|
Consumer loans
|
|
|
1,705,885
|
|
|
48,841
|
|
|
35,746
|
|
|
1,790,472
|
|
Loans held for investment
|
|
|
7,751,209
|
|
|
599,923
|
|
|
964,270
|
|
|
9,315,402
|
| |
|
|
|
|
|
|
|
|
|
|
Loans held for sale
|
|
|
37,909
|
|
|
40,325
|
|
|
1,780
|
|
|
80,014
|
| |
Total loans
|
|
$
|
7,789,118
|
|
$
|
640,248
|
|
$
|
966,050
|
|
$
|
9,395,416
|
| |
|
|
|
|
|
|
|
|
|
| |
|
|
|
|
|
|
|
|
|
|
(In thousands)
|
|
As of December 31, 2013
|
| |
|
|
Puerto Rico
|
|
Virgin Islands
|
|
United States
|
|
Consolidated
|
| |
|
|
|
|
|
|
|
|
|
|
Residential mortgage loans
|
|
$
|
1,906,982
|
|
$
|
348,816
|
|
$
|
293,210
|
|
$
|
2,549,008
|
| |
|
|
|
|
|
|
|
|
|
|
Commercial loans:
|
|
|
|
|
|
|
|
|
| |
Construction loans
|
|
|
105,830
|
|
|
33,744
|
|
|
29,139
|
|
|
168,713
|
| |
Commercial mortgage loans
|
|
|
1,464,085
|
|
|
74,271
|
|
|
285,252
|
|
|
1,823,608
|
| |
Commercial and Industrial loans
|
|
|
2,436,709
|
|
|
125,757
|
|
|
225,784
|
|
|
2,788,250
|
| |
Loans to a local financial institution collateralized by real estate mortgages
|
|
|
240,072
|
|
|
-
|
|
|
-
|
|
|
240,072
|
|
Commercial loans
|
|
|
4,246,696
|
|
|
233,772
|
|
|
540,175
|
|
|
5,020,643
|
| |
|
|
|
|
|
|
|
|
|
|
Finance leases
|
|
|
245,323
|
|
|
-
|
|
|
-
|
|
|
245,323
|
| |
|
|
|
|
|
|
|
|
|
|
Consumer loans
|
|
|
1,739,478
|
|
|
49,689
|
|
|
32,029
|
|
|
1,821,196
|
|
Loans held for investment
|
|
|
8,138,479
|
|
|
632,277
|
|
|
865,414
|
|
|
9,636,170
|
| |
|
|
|
|
|
|
|
|
|
|
Loans held for sale
|
|
|
35,394
|
|
|
40,575
|
|
|
-
|
|
|
75,969
|
| |
Total loans
|
|
$
|
8,173,873
|
|
$
|
672,852
|
|
$
|
865,414
|
|
$
|
9,712,139
|
| |
|
|
|
|
|
|
|
|
|
|
|
|
|
Table 9 – Non-Performing Assets
| |
|
|
|
|
|
|
|
Consolidated Non-Performing Assets
|
|
|
|
|
|
|
|
(Dollars in thousands)
|
|
December 31,
|
|
September 30,
|
|
December 31,
|
| |
|
|
|
2014
|
|
|
|
2014
|
|
|
|
2013
|
|
|
Non-performing loans held for investment:
|
|
|
|
|
|
|
| |
Residential mortgage
|
|
$
|
180,707
|
|
|
$
|
185,025
|
|
|
$
|
161,441
|
|
| |
Commercial mortgage
|
|
|
148,473
|
|
|
|
169,967
|
|
|
|
120,107
|
|
| |
Commercial and Industrial
|
|
|
122,547
|
|
|
|
130,917
|
|
|
|
114,833
|
|
| |
Construction
|
|
|
29,354
|
|
|
|
30,111
|
|
|
|
58,866
|
|
| |
Consumer and Finance leases
|
|
|
42,815
|
|
|
|
43,496
|
|
|
|
40,302
|
|
| |
Total non-performing loans held for investment
|
|
|
523,896
|
|
|
|
559,516
|
|
|
|
495,549
|
|
| |
|
|
|
|
|
|
|
|
OREO
|
|
|
124,003
|
|
|
|
112,803
|
|
|
|
160,193
|
|
|
Other repossessed property
|
|
|
14,229
|
|
|
|
17,467
|
|
|
|
14,865
|
|
| |
Total non-performing assets, excluding loans held for sale
|
|
$
|
662,128
|
|
|
$
|
689,786
|
|
|
$
|
670,607
|
|
| |
|
|
|
|
|
|
|
|
Non-performing loans held for sale
|
|
|
54,641
|
|
|
|
54,641
|
|
|
|
54,801
|
|
| |
Total non-performing assets, including loans held for sale (1)
|
|
$
|
716,769
|
|
|
$
|
744,427
|
|
|
$
|
725,408
|
|
| |
|
|
|
|
|
|
|
|
Past-due loans 90 days and still accruing (2)
|
|
$
|
162,887
|
|
|
$
|
143,535
|
|
|
$
|
120,082
|
|
|
Allowance for loan and lease losses
|
|
$
|
222,395
|
|
|
$
|
225,434
|
|
|
$
|
285,858
|
|
|
Allowance to total non-performing loans held for investment
|
|
|
42.45
|
%
|
|
|
40.29
|
%
|
|
|
57.69
|
%
|
|
Allowance to total non-performing loans held for investment, excluding residential real estate loans
|
|
|
64.80
|
%
|
|
|
60.20
|
%
|
|
|
85.56
|
%
|
| |
|
|
|
|
|
|
|
|
(1)
|
Purchased credit impaired loans of $102.6 million accounted for under ASC 310-30 as of December 31, 2014, primarily mortgage loans acquired from Doral in the second quarter of 2014, are excluded and not considered non-performing due to the application of the accretion method, under which these loans will accrete interest income over the remaining life of the loans using estimated cash flow analysis.
|
|
(2)
|
Amount includes purchased credit impaired loans with individual delinquencies over 90 days and still accruing with a carrying value as of December 31, 2014 of approximately $15.7 million, primarily related to loans acquired from Doral.
|
| |
|
|
|
|
|
|
|
Table 10– Non-Performing Assets by Geography
| |
|
|
|
|
|
|
|
(In thousands)
|
|
December 31,
|
|
September 30,
|
|
December 31,
|
| |
|
|
2014
|
|
2014
|
|
2013
|
|
Puerto Rico:
|
|
|
|
|
|
|
|
Non-performing loans held for investment:
|
|
|
|
|
|
|
| |
Residential mortgage
|
|
$
|
156,361
|
|
$
|
159,740
|
|
$
|
139,771
|
| |
Commercial mortgage
|
|
|
121,879
|
|
|
147,909
|
|
|
101,255
|
| |
Commercial and Industrial
|
|
|
116,301
|
|
|
124,406
|
|
|
109,224
|
| |
Construction
|
|
|
24,526
|
|
|
25,780
|
|
|
43,522
|
| |
Finance leases
|
|
|
5,245
|
|
|
4,501
|
|
|
3,082
|
| |
Consumer
|
|
|
35,286
|
|
|
36,722
|
|
|
34,660
|
| |
Total non-performing loans held for investment
|
|
|
459,598
|
|
|
499,058
|
|
|
431,514
|
| |
|
|
|
|
|
|
|
|
OREO
|
|
|
111,041
|
|
|
99,721
|
|
|
123,851
|
|
Other repossessed property
|
|
|
14,150
|
|
|
17,437
|
|
|
14,806
|
| |
Total non-performing assets, excluding loans held for sale
|
|
$
|
584,789
|
|
$
|
616,216
|
|
$
|
570,171
|
|
Non-performing loans held for sale
|
|
|
14,636
|
|
|
14,636
|
|
|
14,796
|
| |
Total non-performing assets, including loans held for sale (1)
|
|
$
|
599,425
|
|
$
|
630,852
|
|
$
|
584,967
|
|
Past-due loans 90 days and still accruing (2)
|
|
$
|
154,375
|
|
$
|
140,229
|
|
$
|
118,097
|
| |
|
|
|
|
|
|
|
|
Virgin Islands:
|
|
|
|
|
|
|
|
Non-performing loans held for investment:
|
|
|
|
|
|
|
| |
Residential mortgage
|
|
$
|
15,483
|
|
$
|
13,576
|
|
$
|
8,439
|
| |
Commercial mortgage
|
|
|
11,770
|
|
|
7,044
|
|
|
6,827
|
| |
Commercial and Industrial
|
|
|
6,246
|
|
|
6,511
|
|
|
5,609
|
| |
Construction
|
|
|
4,064
|
|
|
4,173
|
|
|
11,214
|
| |
Consumer
|
|
|
887
|
|
|
861
|
|
|
514
|
| |
Total non-performing loans held for investment
|
|
|
38,450
|
|
|
32,165
|
|
|
32,603
|
| |
|
|
|
|
|
|
|
|
OREO
|
|
|
6,967
|
|
|
7,904
|
|
|
14,894
|
|
Other repossessed property
|
|
|
22
|
|
|
3
|
|
|
5
|
| |
Total non-performing assets, excluding loans held for sale
|
|
$
|
45,439
|
|
$
|
40,072
|
|
$
|
47,502
|
|
Non-performing loans held for sale
|
|
|
40,005
|
|
|
40,005
|
|
|
40,005
|
| |
Total non-performing assets, including loans held for sale
|
|
$
|
85,444
|
|
$
|
80,077
|
|
$
|
87,507
|
|
Past-due loans 90 days and still accruing
|
|
$
|
5,281
|
|
$
|
2,766
|
|
$
|
1,985
|
| |
|
|
|
|
|
|
|
|
United States:
|
|
|
|
|
|
|
|
Non-performing loans held for investment:
|
|
|
|
|
|
|
| |
Residential mortgage
|
|
$
|
8,863
|
|
$
|
11,709
|
|
$
|
13,231
|
| |
Commercial mortgage
|
|
|
14,824
|
|
|
15,014
|
|
|
12,025
|
| |
Commercial and Industrial
|
|
|
-
|
|
|
-
|
|
|
-
|
| |
Construction
|
|
|
764
|
|
|
158
|
|
|
4,130
|
| |
Consumer
|
|
|
1,397
|
|
|
1,412
|
|
|
2,046
|
| |
Total non-performing loans held for investment
|
|
|
25,848
|
|
|
28,293
|
|
|
31,432
|
| |
|
|
|
|
|
|
|
|
OREO
|
|
|
5,995
|
|
|
5,178
|
|
|
21,448
|
|
Other repossessed property
|
|
|
57
|
|
|
27
|
|
|
54
|
| |
Total non-performing assets, excluding loans held for sale
|
|
$
|
31,900
|
|
$
|
33,498
|
|
$
|
52,934
|
|
Non-performing loans held for sale
|
|
|
-
|
|
|
-
|
|
|
-
|
| |
Total non-performing assets, including loans held for sale
|
|
$
|
31,900
|
|
$
|
33,498
|
|
$
|
52,934
|
|
Past-due loans 90 days and still accruing
|
|
$
|
3,231
|
|
$
|
540
|
|
$
|
-
|
| |
|
|
|
|
|
|
|
|
(1)
|
Purchased credit impaired loans of $102.6 million accounted for under ASC 310-30 as of December 31, 2014, primarily mortgage loans acquired from Doral in the second quarter of 2014, are excluded and not considered non-performing due to the application of the accretion method, under which these loans will accrete interest income over the remaining life of the loans using estimated cash flow analysis.
|
|
(2)
|
Amount includes purchased credit impaired loans with individual delinquencies over 90 days and still accruing with a carrying value as of December 31, 2014 of approximately $15.7 million, primarily related to loans acquired from Doral.
|
| |
|
Table 11 – Allowance for Loan and Lease Losses
| |
|
|
Quarter Ended
|
|
Year Ended
|
|
(Dollars in thousands)
|
|
December 31,
|
|
September 30,
|
|
December 31,
|
|
December 31,
|
|
December 31,
|
| |
|
|
|
2014
|
|
|
|
2014
|
|
|
|
2013
|
|
|
|
2014
|
|
|
|
2013
|
|
| |
|
|
|
|
|
|
|
|
|
|
|
|
Allowance for loan and lease losses, beginning of period
|
|
$
|
225,434
|
|
|
$
|
241,177
|
|
|
$
|
289,379
|
|
|
$
|
285,858
|
|
|
$
|
435,414
|
|
|
Provision for loan and lease losses
|
|
|
23,872
|
|
|
|
26,999
|
|
|
|
22,969
|
|
|
|
109,530
|
|
(1
|
)
|
|
243,751
|
|
|
Net (charge-offs) recoveries of loans:
|
|
|
|
|
|
|
|
|
|
|
| |
Residential mortgage
|
|
|
(6,522
|
)
|
|
|
(5,734
|
)
|
|
|
(4,544
|
)
|
|
|
(23,296
|
)
|
|
|
(127,999
|
)
|
| |
Commercial mortgage
|
|
|
(1,383
|
)
|
|
|
1,116
|
|
|
|
2,605
|
|
|
|
(15,168
|
)
|
|
|
(62,602
|
)
|
| |
Commercial and Industrial
|
|
|
(992
|
)
|
|
|
(16,431
|
)
|
|
|
(9,146
|
)
|
|
|
(58,255
|
)
|
(2
|
)
|
|
(105,213
|
)
|
| |
Construction
|
|
|
680
|
|
|
|
(3,205
|
)
|
|
|
(435
|
)
|
|
|
(5,484
|
)
|
|
|
(41,247
|
)
|
| |
Consumer and finance leases
|
|
|
(18,694
|
)
|
|
|
(18,488
|
)
|
|
|
(14,970
|
)
|
|
|
(70,790
|
)
|
|
|
(56,246
|
)
|
|
Net charge-offs
|
|
|
(26,911
|
)
|
|
|
(42,742
|
)
|
|
|
(26,490
|
)
|
|
|
(172,993
|
)
|
(2
|
)
|
|
(393,307
|
)
|
|
Allowance for loan and lease losses, end of period
|
|
$
|
222,395
|
|
|
$
|
225,434
|
|
|
$
|
285,858
|
|
|
$
|
222,395
|
|
|
$
|
285,858
|
|
| |
|
|
|
|
|
|
|
|
|
|
|
|
Allowance for loan and lease losses to period end total loans held for investment
|
|
|
2.40
|
%
|
|
|
2.42
|
%
|
|
|
2.97
|
%
|
|
|
2.40
|
%
|
|
|
2.97
|
%
|
|
Net charge-offs (annualized) to average loans outstanding during the period
|
|
|
1.13
|
%
|
|
|
1.80
|
%
|
|
|
1.10
|
%
|
|
|
1.81
|
%
|
|
|
4.01
|
%
|
| |
|
|
|
|
|
| |
|
|
|
|
|
|
Net charge-offs (annualized), excluding charge-offs related to the acquisition of mortgage loans from Doral, loans sold and loans transferred to held for sale, to average loans outstanding during the period
|
|
|
1.13
|
%
|
|
|
1.80
|
%
|
|
|
1.10
|
%
|
|
|
1.74
|
%
|
|
|
1.68
|
%
|
|
Provision for loan and lease losses to net charge-offs during the period
|
|
0.89x
|
|
0.63x
|
|
0.87x
|
|
0.63x
|
|
0.62x
|
|
Provision for loan and lease losses to net charge-offs during the period, excluding impact of the acquisition of mortgage loans from Doral, loans sold and the transfer of loans to held for sale
|
|
0.89x
|
|
0.63x
|
|
0.87x
|
|
0.65x
|
|
0.69x
|
|
(1) Includes a provision of $1.4 million associated with the acquisition of mortgage loans from Doral.
|
|
(2) Includes net charge-offs totaling $6.9 million associated with the acquisition of mortgage loans from Doral.
|
|
(3) Includes provision of $132.0 million associated with the bulk sales and the transfer of loans to held for sale.
|
|
(4) Includes net charge-offs totaling $99.0 million associated with the bulk sales.
|
|
(5) Includes net charge-offs of $54.6 million associated with the bulk sale of adversely classified commercial assets and the transfer of loans to held for sale.
|
|
(6) Includes net charge-offs totaling $44.7 million associated with the bulk sale of adversely classified commercial assets.
|
|
(7) Includes net charge-offs of $34.2 million associated with the bulk sales and the transfer of loans to held for sale.
|
|
(8) Includes net charge-offs of $232.4 million associated with the bulk sales and the transfer of loans to held for sale.
|
| |
Table 12 – Net Charge-Offs to Average Loans
| |
|
|
Year ended
|
| |
|
|
December 31,
|
|
December 31,
|
|
December 31,
|
|
December 31,
|
|
December 31,
|
| |
|
|
2014
|
|
2013
|
|
2012
|
|
2011
|
|
2010
|
| |
|
|
|
|
|
|
|
|
|
|
|
|
|
|
|
|
| |
Residential mortgage
|
|
0.85%
|
|
|
4.77%
|
(3)
|
|
1.32%
|
|
|
1.32%
|
|
|
1.80%
|
(8)
|
| |
|
|
|
|
|
|
|
|
|
|
|
|
|
|
|
|
| |
Commercial mortgage
|
|
0.84%
|
|
|
3.44%
|
(4)
|
|
1.41%
|
|
|
3.21%
|
|
|
5.02%
|
(9)
|
| |
|
|
|
|
|
|
|
|
|
|
|
|
|
|
|
|
| |
Commercial and Industrial
|
|
2.13%
|
(1)
|
|
3.52%
|
(5)
|
|
1.21%
|
|
|
1.57%
|
|
|
2.16%
|
(10)
|
| |
|
|
|
|
|
|
|
|
|
|
|
|
|
|
|
|
| |
Construction
|
|
2.76%
|
|
|
15.11%
|
(6)
|
|
10.49%
|
|
|
16.33%
|
|
|
23.80%
|
(11)
|
| |
|
|
|
|
|
|
|
|
|
|
|
|
|
|
|
|
| |
Consumer and finance leases
|
|
3.46%
|
|
|
2.76%
|
|
|
1.92%
|
|
|
2.33%
|
|
|
2.98%
|
|
| |
|
|
|
|
|
|
|
|
|
|
|
|
|
|
|
|
| |
Total loans
|
|
1.81%
|
(2)
|
|
4.01%
|
(7)
|
|
1.74%
|
|
|
2.68%
|
|
|
4.76%
|
(12)
|
| |
|
|
|
|
|
|
|
|
|
|
|
|
|
|
|
|
|
(1) Includes net charge-offs totaling $6.9 million associated with the acquisition of mortgage loans from Doral. The ratio of commercial and industrial net charge-offs to average loans, excluding charge-offs associated with the acquisition of mortgage loans from Doral, was 1.95%.
|
|
(2) Includes net charge-offs totaling $6.9 million associated with the acquisition of mortgage loans from Doral. The ratio of total net charge-offs to average loans, excluding charge-offs associated with the acquisition of mortgage loans from Doral, was 1.74%.
|
|
(3) Includes net charge-offs totaling $99.0 million associated with the bulk loan sales. The ratio of residential mortgage net charge-offs to average loans, excluding charge-offs associated with the bulk loan sales, was 1.13%.
|
|
(4) Includes net charge-offs totaling $54.6 million associated with the bulk sale of adversely classified commercial assets and the transfer of loans to held for sale in the first quarter of 2013. The ratio of commercial mortgage net charge-offs to average loans, excluding charge-offs associated with the bulk sale of adversely classified commercial assets and the transfer of loans to held for sale, was 0.45%.
|
|
(5) Includes net charge-offs totaling $44.7 million associated with the bulk sale of adversely classified commercial assets. The ratio of commercial and industrial net charge-offs to average loans, excluding charge-offs associated with the bulk sale of adversely classified commercial assets, was 2.04%.
|
|
(6) Includes net charge-offs totaling $34.2 million associated with the bulk loan sales and the transfer of loans to held for sale. The ratio of construction loan net charge-offs to average loans, excluding charge-offs associated with the bulk loan sales and the transfer of loans to held for sale, was 2.91%.
|
|
(7) Includes net charge-offs totaling $232.4 million associated with the bulk loan sales and the transfer of loans to held for sale. The ratio of total net charge-offs to average loans, excluding charge-offs associated with the bulk loan sales and the transfer of loans to held for sale, was 1.68%.
|
|
(8) Includes net charge-offs totaling $7.8 million associated with non-performing residential mortgage loans sold in a bulk sale.
|
|
(9) Includes net charge-offs totaling $29.5 million associated with the transfer of loans to held for sale in the fourth quarter of 2010. The ratio of commercial mortgage net charge-offs to average loans, excluding charge-offs associated with the transfer of loans to held for sale, was 3.38%.
|
|
(10) Includes net charge-offs totaling $8.6 million associated with the transfer of loans to held for sale in the fourth quarter of 2010. The ratio of commercial and industrial net charge-offs to average loans, excluding charge-offs associated with the transfer of loans to held for sale, was 1.98%.
|
|
(11) Includes net charge-offs totaling $127.0 million associated with the transfer of loans to held for sale in the fourth quarter of 2010. The ratio of construction net charge-offs to average loans, excluding charge-offs associated with the transfer of loans to held for sale, was 18.93%.
|
|
(12) Includes net charge-offs totaling $165.1 million associated with the transfer of loans to held for sale in the fourth quarter of 2010. The ratio of total net charge-offs to average loans, excluding charge-offs associated with the transfer of loans to held for sale, was 3.60%.
|
CONTACT:
First BanCorp.
John B. Pelling III, 305-577-6000, Ext. 162
Investor Relations Officer
john.pelling@firstbankpr.com