Exhibit 99.2
 Financial Results
 Fourth Quarter & Year End 2013 Fourth Quarter & Year
End 2013
Financial Results
Financial Results Fourth Quarter & Year End 2013 Fourth Quarter & Year
End 2013
 Forward-Looking
Statements This presentation may contain “forward-looking statements”
concerning the Corporation’s future economic performance. The words or
phrases “expect,” “anticipate,” “look forward,” “should,” “believes” and
similar expressions are meant to identify “forward-looking statements”
within the meaning of Section 27A of the Securities Act of 1933, as
amended, and Section 21E of the Securities Exchange Act of 1934, as
amended, and are subject to the safe harbor created by such sections.
The Corporation wishes to caution readers not to place undue reliance on
any such “forward-looking statements,” which speak only as of the date
made, and to advise readers that various factors, including, but not
limited to, the following could cause actual results to differ
materially from those expressed in, or implied by such forward-looking
statements: uncertainty about whether the Corporation and FirstBank will
be able to fully comply with the written agreement dated June 3, 2010
that the Corporation entered into with the Federal Reserve Bank of New
York (the “New York Fed”) and the consent order dated June 2, 2010 that
FirstBank entered into with the FDIC and the Office of the Commissioner
of Financial Institutions of the Commonwealth of Puerto Rico (the “FDIC
Order”) that, among other things, require FirstBank to maintain certain
capital levels and reduce its special mention, classified, delinquent,
and non-performing assets; the risk of being subject to possible
additional regulatory actions; uncertainty as to the availability of
certain funding sources, such as brokered CDs; the Corporation’s
reliance on brokered CDs and its ability to obtain, on a periodic basis,
approval from the FDIC to issue brokered CDs to fund operations and
provide liquidity in accordance with the terms of the FDIC Order; the
risk of not being able to fulfill the Corporation’s cash obligations or
resume paying dividends to the Corporation’s stockholders in the future
due to the Corporation’s inability to receive approval from the New York
Fed or the Board of Governors of the Federal Reserve System (“Federal
Reserve Board”) to receive dividends from FirstBank or FirstBank’s
failure to generate sufficient cash flow to make a dividend payment to
the Corporation; the strength or weakness of the real estate markets and
of the consumer and commercial credit sectors and their impact on the
credit quality of the Corporation’s loans and other assets, which has
contributed and may continue to contribute to, among other things, the
high levels of non-performing assets, charge-offs, and provisions and
may subject the Corporation to further risk from loan defaults and
foreclosures; the ability of FirstBank to realize the benefit of the
deferred tax asset; adverse changes in general economic conditions in
Puerto Rico, the U.S., and the U.S. Virgin Islands and British Virgin
Islands, including the interest rate environment, market liquidity,
housing absorption rates, real estate prices, and disruptions in the
U.S. capital markets, which may reduce interest margins, impact funding
sources, and affect demand for all of the Corporation’s products and
services and reduce the Corporation’s revenues, earnings, and the value
of the Corporation’s assets; an adverse change in the Corporation’s
ability to attract new clients and retain existing ones; a decrease in
demand for the Corporation’s products and services and lower revenues
and earnings because of the continued recession in Puerto Rico, the
current fiscal problems and budget deficit of the Puerto Rico government
and recent credit downgrades of the Puerto Rico government; a credit
default by the Puerto Rico government or any of its public corporations
or other instrumentalities, and recent and/or future downgrades of the
long-term debt ratings of the Puerto Rico government, which could
adversely affect economic conditions in Puerto Rico; the risk that any
portion of the unrealized losses in the Corporation’s investment
portfolio is determined to be other-than-temporary, including unrealized
losses on Puerto Rico government obligations; uncertainty about
regulatory and legislative changes for financial services companies in
Puerto Rico, the U.S., and the U.S. Virgin Islands and British Virgin
Islands, which could affect the Corporation’s financial condition or
performance and could cause the Corporation’s actual results for future
periods to differ materially from prior results and anticipated or
projected results; changes in the fiscal and monetary policies and
regulations of the federal government, including those determined by the
Federal Reserve Board, the New York Fed, the FDIC, government-sponsored
housing agencies, and regulators in Puerto Rico and the U.S. and British
Virgin Islands; the risk of possible failure or circumvention of
controls and procedures and the risk that the Corporation’s risk
management policies may not be adequate; the risk that the FDIC may
further increase the deposit insurance premium and/or require special
assessments to replenish its insurance fund, causing an additional
increase in the Corporation’s non-interest expenses; the impact on the
Corporation’s results of operations and financial condition of
acquisitions and dispositions; a need to recognize additional
impairments on financial instruments, goodwill, or other intangible
assets relating to acquisitions; the risks that downgrades in the credit
ratings of the Corporation’s long-term senior debt will adversely affect
the Corporation’s ability to access necessary external funds; the impact
of the Dodd-Frank Wall Street Reform and Consumer Protection Act on the
Corporation’s businesses, business practices, and cost of operations;
the risk of losses in the value of investments in unconsolidated
entities that the Corporation does not control; and general competitive
factors and industry consolidation. The Corporation does not undertake,
and specifically disclaims any obligation, to update any
“forward-looking statements” to reflect occurrences or unanticipated
events or circumstances after the date of such statements except as
required by the federal securities laws.
Forward-Looking
Statements This presentation may contain “forward-looking statements”
concerning the Corporation’s future economic performance. The words or
phrases “expect,” “anticipate,” “look forward,” “should,” “believes” and
similar expressions are meant to identify “forward-looking statements”
within the meaning of Section 27A of the Securities Act of 1933, as
amended, and Section 21E of the Securities Exchange Act of 1934, as
amended, and are subject to the safe harbor created by such sections.
The Corporation wishes to caution readers not to place undue reliance on
any such “forward-looking statements,” which speak only as of the date
made, and to advise readers that various factors, including, but not
limited to, the following could cause actual results to differ
materially from those expressed in, or implied by such forward-looking
statements: uncertainty about whether the Corporation and FirstBank will
be able to fully comply with the written agreement dated June 3, 2010
that the Corporation entered into with the Federal Reserve Bank of New
York (the “New York Fed”) and the consent order dated June 2, 2010 that
FirstBank entered into with the FDIC and the Office of the Commissioner
of Financial Institutions of the Commonwealth of Puerto Rico (the “FDIC
Order”) that, among other things, require FirstBank to maintain certain
capital levels and reduce its special mention, classified, delinquent,
and non-performing assets; the risk of being subject to possible
additional regulatory actions; uncertainty as to the availability of
certain funding sources, such as brokered CDs; the Corporation’s
reliance on brokered CDs and its ability to obtain, on a periodic basis,
approval from the FDIC to issue brokered CDs to fund operations and
provide liquidity in accordance with the terms of the FDIC Order; the
risk of not being able to fulfill the Corporation’s cash obligations or
resume paying dividends to the Corporation’s stockholders in the future
due to the Corporation’s inability to receive approval from the New York
Fed or the Board of Governors of the Federal Reserve System (“Federal
Reserve Board”) to receive dividends from FirstBank or FirstBank’s
failure to generate sufficient cash flow to make a dividend payment to
the Corporation; the strength or weakness of the real estate markets and
of the consumer and commercial credit sectors and their impact on the
credit quality of the Corporation’s loans and other assets, which has
contributed and may continue to contribute to, among other things, the
high levels of non-performing assets, charge-offs, and provisions and
may subject the Corporation to further risk from loan defaults and
foreclosures; the ability of FirstBank to realize the benefit of the
deferred tax asset; adverse changes in general economic conditions in
Puerto Rico, the U.S., and the U.S. Virgin Islands and British Virgin
Islands, including the interest rate environment, market liquidity,
housing absorption rates, real estate prices, and disruptions in the
U.S. capital markets, which may reduce interest margins, impact funding
sources, and affect demand for all of the Corporation’s products and
services and reduce the Corporation’s revenues, earnings, and the value
of the Corporation’s assets; an adverse change in the Corporation’s
ability to attract new clients and retain existing ones; a decrease in
demand for the Corporation’s products and services and lower revenues
and earnings because of the continued recession in Puerto Rico, the
current fiscal problems and budget deficit of the Puerto Rico government
and recent credit downgrades of the Puerto Rico government; a credit
default by the Puerto Rico government or any of its public corporations
or other instrumentalities, and recent and/or future downgrades of the
long-term debt ratings of the Puerto Rico government, which could
adversely affect economic conditions in Puerto Rico; the risk that any
portion of the unrealized losses in the Corporation’s investment
portfolio is determined to be other-than-temporary, including unrealized
losses on Puerto Rico government obligations; uncertainty about
regulatory and legislative changes for financial services companies in
Puerto Rico, the U.S., and the U.S. Virgin Islands and British Virgin
Islands, which could affect the Corporation’s financial condition or
performance and could cause the Corporation’s actual results for future
periods to differ materially from prior results and anticipated or
projected results; changes in the fiscal and monetary policies and
regulations of the federal government, including those determined by the
Federal Reserve Board, the New York Fed, the FDIC, government-sponsored
housing agencies, and regulators in Puerto Rico and the U.S. and British
Virgin Islands; the risk of possible failure or circumvention of
controls and procedures and the risk that the Corporation’s risk
management policies may not be adequate; the risk that the FDIC may
further increase the deposit insurance premium and/or require special
assessments to replenish its insurance fund, causing an additional
increase in the Corporation’s non-interest expenses; the impact on the
Corporation’s results of operations and financial condition of
acquisitions and dispositions; a need to recognize additional
impairments on financial instruments, goodwill, or other intangible
assets relating to acquisitions; the risks that downgrades in the credit
ratings of the Corporation’s long-term senior debt will adversely affect
the Corporation’s ability to access necessary external funds; the impact
of the Dodd-Frank Wall Street Reform and Consumer Protection Act on the
Corporation’s businesses, business practices, and cost of operations;
the risk of losses in the value of investments in unconsolidated
entities that the Corporation does not control; and general competitive
factors and industry consolidation. The Corporation does not undertake,
and specifically disclaims any obligation, to update any
“forward-looking statements” to reflect occurrences or unanticipated
events or circumstances after the date of such statements except as
required by the federal securities laws.
 Agenda Fourth
Quarter & Year End 2013 Highlights: Aurelio Alemán, President & Chief
Executive Officer Fourth Quarter Results of Operations: Orlando Berges,
Executive Vice President & Chief Financial Officer Summary Questions &
Answers
Agenda Fourth
Quarter & Year End 2013 Highlights: Aurelio Alemán, President & Chief
Executive Officer Fourth Quarter Results of Operations: Orlando Berges,
Executive Vice President & Chief Financial Officer Summary Questions &
Answers
 FOURTH QUARTER &
FISCAL YEAR 2013 Highlights
FOURTH QUARTER &
FISCAL YEAR 2013 Highlights
 FOURTH QUARTER &
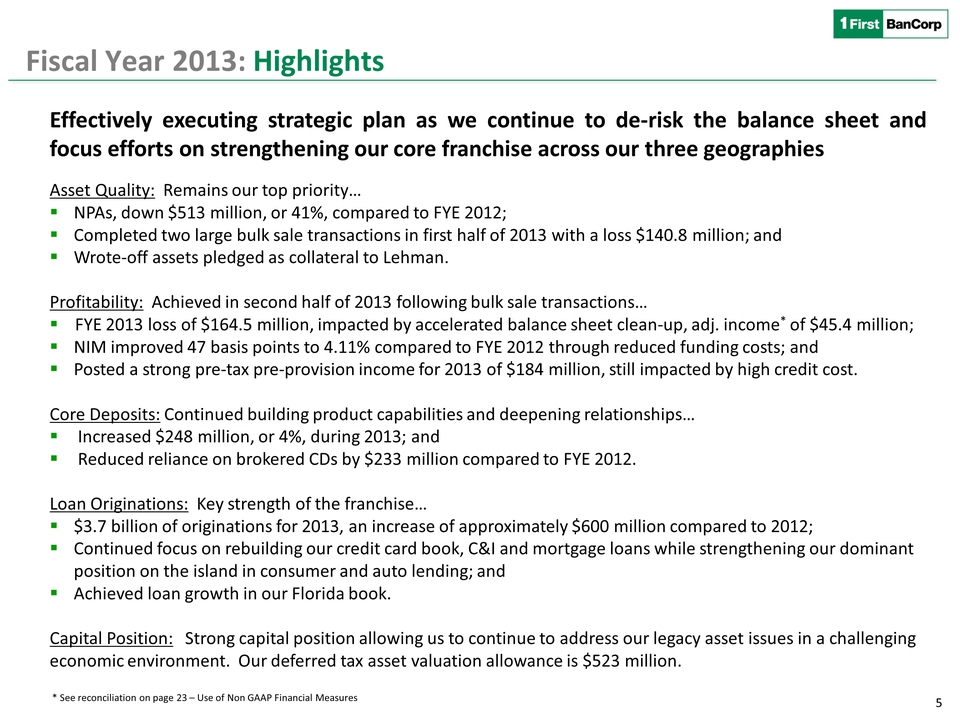
FISCAL YEAR 2013 Highlights Effectively executing strategic plan as we
continue to de-risk the balance sheet and focus efforts on strengthening
our core franchise across our three geographies Asset Quality: Remains
our top priority… NPAs, down $513 million, or 41%, compared to FYE 2012;
Completed two large bulk sale transactions in first half of 2013 with a
loss $140.8 million; and Wrote-off assets pledged as collateral to
Lehman. Profitability: Achieved in second half of 2013 following bulk
sale transactions… FYE 2013 loss of $164.5 million, impacted by
accelerated balance sheet clean-up, adj. income* of $45.4 million; NIM
improved 47 basis points to 4.11% compared to FYE 2012 through reduced
funding costs; and Posted a strong pre-tax pre-provision income for 2013
of $184 million, still impacted by high credit cost. Core Deposits:
Continued building product capabilities and deepening relationships…
Increased $248 million, or 4%, during 2013; and Reduced reliance on
brokered CDs by $233 million compared to FYE 2012. Loan Originations:
Key strength of the franchise… $3.7 billion of originations for 2013, an
increase of approximately $600 million compared to 2012; Continued focus
on rebuilding our credit card book, C&I and mortgage loans while
strengthening our dominant position on the island in consumer and auto
lending; and Achieved loan growth in our Florida book. Capital Position:
Strong capital position allowing us to continue to address our legacy
asset issues in a challenging economic environment. Our deferred tax
asset valuation allowance is $523 million. Fiscal Year 2013: Highlights
* See reconciliation on page 23 – Use of Non GAAP Financial Measures
FOURTH QUARTER &
FISCAL YEAR 2013 Highlights Effectively executing strategic plan as we
continue to de-risk the balance sheet and focus efforts on strengthening
our core franchise across our three geographies Asset Quality: Remains
our top priority… NPAs, down $513 million, or 41%, compared to FYE 2012;
Completed two large bulk sale transactions in first half of 2013 with a
loss $140.8 million; and Wrote-off assets pledged as collateral to
Lehman. Profitability: Achieved in second half of 2013 following bulk
sale transactions… FYE 2013 loss of $164.5 million, impacted by
accelerated balance sheet clean-up, adj. income* of $45.4 million; NIM
improved 47 basis points to 4.11% compared to FYE 2012 through reduced
funding costs; and Posted a strong pre-tax pre-provision income for 2013
of $184 million, still impacted by high credit cost. Core Deposits:
Continued building product capabilities and deepening relationships…
Increased $248 million, or 4%, during 2013; and Reduced reliance on
brokered CDs by $233 million compared to FYE 2012. Loan Originations:
Key strength of the franchise… $3.7 billion of originations for 2013, an
increase of approximately $600 million compared to 2012; Continued focus
on rebuilding our credit card book, C&I and mortgage loans while
strengthening our dominant position on the island in consumer and auto
lending; and Achieved loan growth in our Florida book. Capital Position:
Strong capital position allowing us to continue to address our legacy
asset issues in a challenging economic environment. Our deferred tax
asset valuation allowance is $523 million. Fiscal Year 2013: Highlights
* See reconciliation on page 23 – Use of Non GAAP Financial Measures
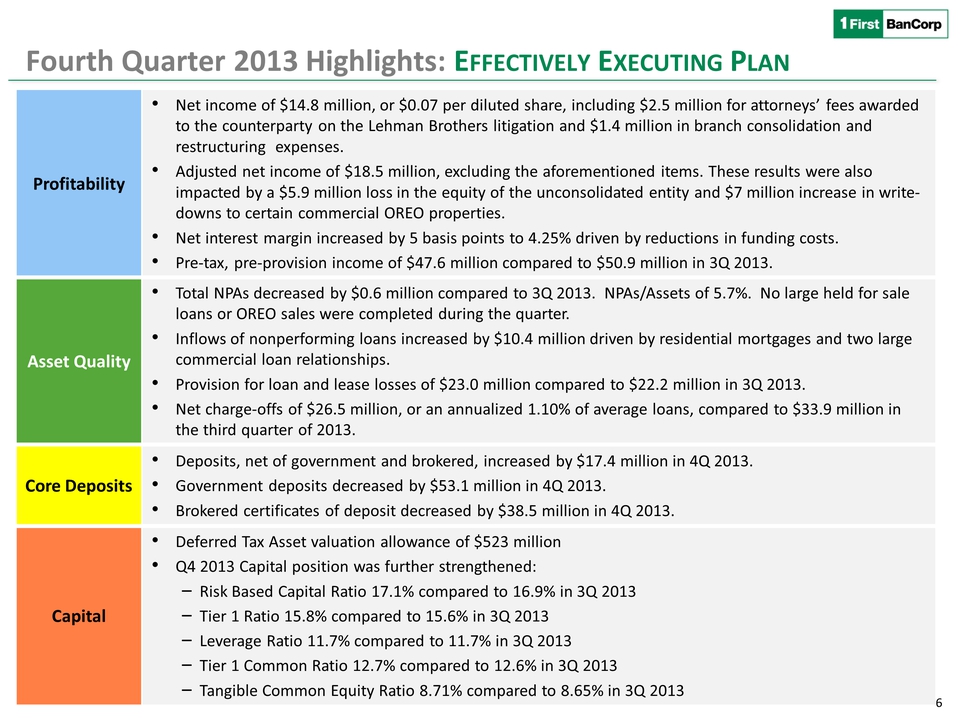 Profitability Net
income of $14.8 million, or $0.07 per diluted share, including $2.5
million for attorneys’ fees awarded to the counterparty on the Lehman
Brothers litigation and $1.4 million in branch consolidation and
restructuring expenses. Adjusted net income of $18.5 million, excluding
the aforementioned items. These results were also impacted by a $5.9
million loss in the equity of the unconsolidated entity and $7 million
increase in write-downs to certain commercial OREO properties. Net
interest margin increased by 5 basis points to 4.25% driven by
reductions in funding costs. Pre-tax, pre-provision income of $47.6
million compared to $50.9 million in 3Q 2013. Asset Quality Total NPAs
decreased by $0.6 million compared to 3Q 2013. NPAs/Assets of 5.7%. No
large held for sale loans or OREO sales were completed during the
quarter. Inflows of nonperforming loans increased by $10.4 million
driven by residential mortgages and two large commercial loan
relationships. Provision for loan and lease losses of $23.0 million
compared to $22.2 million in 3Q 2013. Net charge-offs of $26.5 million,
or an annualized 1.10% of average loans, compared to $33.9 million in
the third quarter of 2013. Core Deposits Deposits, net of government and
brokered, increased by $17.4 million in 4Q 2013. Government deposits
decreased by $53.1 million in 4Q 2013. Brokered certificates of deposit
decreased by $38.5 million in 4Q 2013. Capital Deferred Tax Asset
valuation allowance of $523 million Q4 2013 Capital position was further
strengthened: ‒Risk Based Capital Ratio 17.1% compared to 16.9% in 3Q
2013 ‒Tier 1 Ratio 15.8% compared to 15.6% in 3Q 2013 ‒Leverage Ratio
11.7% compared to 11.7% in 3Q 2013 ‒Tier 1 Common Ratio 12.7% compared
to 12.6% in 3Q 2013 ‒Tangible Common Equity Ratio 8.71% compared to
8.65% in 3Q 2013 Fourth Quarter 2013 Highlights: EFFECTIVELY EXECUTING
PLAN
Profitability Net
income of $14.8 million, or $0.07 per diluted share, including $2.5
million for attorneys’ fees awarded to the counterparty on the Lehman
Brothers litigation and $1.4 million in branch consolidation and
restructuring expenses. Adjusted net income of $18.5 million, excluding
the aforementioned items. These results were also impacted by a $5.9
million loss in the equity of the unconsolidated entity and $7 million
increase in write-downs to certain commercial OREO properties. Net
interest margin increased by 5 basis points to 4.25% driven by
reductions in funding costs. Pre-tax, pre-provision income of $47.6
million compared to $50.9 million in 3Q 2013. Asset Quality Total NPAs
decreased by $0.6 million compared to 3Q 2013. NPAs/Assets of 5.7%. No
large held for sale loans or OREO sales were completed during the
quarter. Inflows of nonperforming loans increased by $10.4 million
driven by residential mortgages and two large commercial loan
relationships. Provision for loan and lease losses of $23.0 million
compared to $22.2 million in 3Q 2013. Net charge-offs of $26.5 million,
or an annualized 1.10% of average loans, compared to $33.9 million in
the third quarter of 2013. Core Deposits Deposits, net of government and
brokered, increased by $17.4 million in 4Q 2013. Government deposits
decreased by $53.1 million in 4Q 2013. Brokered certificates of deposit
decreased by $38.5 million in 4Q 2013. Capital Deferred Tax Asset
valuation allowance of $523 million Q4 2013 Capital position was further
strengthened: ‒Risk Based Capital Ratio 17.1% compared to 16.9% in 3Q
2013 ‒Tier 1 Ratio 15.8% compared to 15.6% in 3Q 2013 ‒Leverage Ratio
11.7% compared to 11.7% in 3Q 2013 ‒Tier 1 Common Ratio 12.7% compared
to 12.6% in 3Q 2013 ‒Tangible Common Equity Ratio 8.71% compared to
8.65% in 3Q 2013 Fourth Quarter 2013 Highlights: EFFECTIVELY EXECUTING
PLAN
 Fourth Quarter 2013
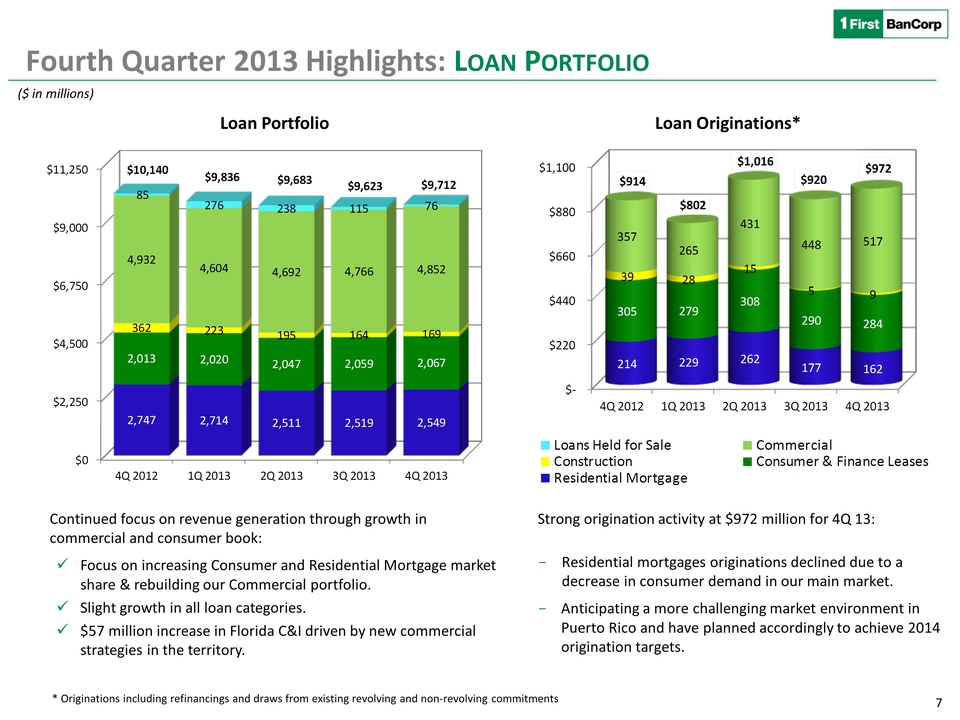
Highlights: LOAN PORTFOLIO Strong origination activity at $972 million
for 4Q 13: -Residential mortgages originations declined due to a
decrease in consumer demand in our main market. -Anticipating a more
challenging market environment in Puerto Rico and have planned
accordingly to achieve 2014 origination targets. ($ in millions) Loan
Originations* Continued focus on revenue generation through growth in
commercial and consumer book: Focus on increasing Consumer and
Residential Mortgage market share & rebuilding our Commercial portfolio.
Slight growth in all loan categories. $57 million increase in Florida
C&I driven by new commercial strategies in the territory. * Originations
including refinancings and draws from existing revolving and
non-revolving commitments Loan Portfolio
$0$2,250$4,500$6,750$9,000$11,2503Q2,7672,7472,7142,5112,5191,9862,0132,0202,0472,0593533622231951645,0874,9324,6044,6924,76616485276238115$10,257
$10,140 $9,836 $9,683 9,623 Loans Held for Sale Commercial Construction
Consumer & Finance Leases Residential
Mortgage$0$2,250$4,500$6,750$9,000$11,2504Q 20121Q 20132Q 20133Q 20134Q
20132,7472,7142,5112,5192,5492,0132,0202,0472,0592,0673622231951641694,9324,6044,6924,7664,8528527623811576$10,140
$9,836 $9,683 $9,623 $9,712 $-$220 $440 $660 $880 $1,100 4Q 20121Q
20132Q 20133Q 20134Q 2013214 229 262 177 162 305 279 308 290 284 39 28
15 5 9 357 265 431 448 517 $914 $802 $1,016 $920 $972
Fourth Quarter 2013
Highlights: LOAN PORTFOLIO Strong origination activity at $972 million
for 4Q 13: -Residential mortgages originations declined due to a
decrease in consumer demand in our main market. -Anticipating a more
challenging market environment in Puerto Rico and have planned
accordingly to achieve 2014 origination targets. ($ in millions) Loan
Originations* Continued focus on revenue generation through growth in
commercial and consumer book: Focus on increasing Consumer and
Residential Mortgage market share & rebuilding our Commercial portfolio.
Slight growth in all loan categories. $57 million increase in Florida
C&I driven by new commercial strategies in the territory. * Originations
including refinancings and draws from existing revolving and
non-revolving commitments Loan Portfolio
$0$2,250$4,500$6,750$9,000$11,2503Q2,7672,7472,7142,5112,5191,9862,0132,0202,0472,0593533622231951645,0874,9324,6044,6924,76616485276238115$10,257
$10,140 $9,836 $9,683 9,623 Loans Held for Sale Commercial Construction
Consumer & Finance Leases Residential
Mortgage$0$2,250$4,500$6,750$9,000$11,2504Q 20121Q 20132Q 20133Q 20134Q
20132,7472,7142,5112,5192,5492,0132,0202,0472,0592,0673622231951641694,9324,6044,6924,7664,8528527623811576$10,140
$9,836 $9,683 $9,623 $9,712 $-$220 $440 $660 $880 $1,100 4Q 20121Q
20132Q 20133Q 20134Q 2013214 229 262 177 162 305 279 308 290 284 39 28
15 5 9 357 265 431 448 517 $914 $802 $1,016 $920 $972
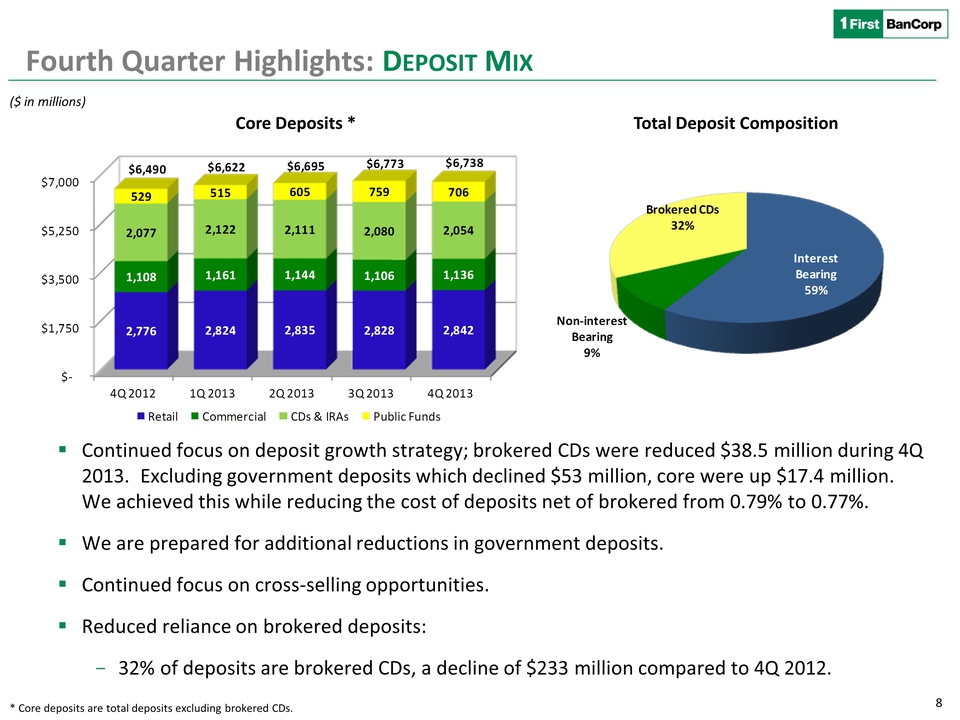 Continued focus on
deposit growth strategy; brokered CDs were reduced $38.5 million during
4Q 2013. Excluding government deposits which declined $53 million, core
were up $17.4 million. We achieved this while reducing the cost of
deposits net of brokered from 0.79% to 0.77%. We are prepared for
additional reductions in government deposits. Continued focus on
cross-selling opportunities. Reduced reliance on brokered deposits: -32%
of deposits are brokered CDs, a decline of $233 million compared to 4Q
2012. 8 ($ in millions) Core Deposits * Total Deposit Composition Fourth
Quarter Highlights: DEPOSIT MIX * Core deposits are total deposits
excluding brokered CDs. Interest Bearing59%Non-interest
Bearing9%Brokered CDs32%$-$1,750 $3,500 $5,250 $7,000 4Q 20121Q 20132Q
20133Q 20134Q 20132,776 2,824 2,835 2,828 2,842 1,108 1,161 1,144 1,106
1,136 2,077 2,122 2,111 2,080 2,054 529 515 605 759 706 $6,490 $6,622
$6,695 $6,773 $6,738 Retail Commercial CDs & IRAs Public Funds
Continued focus on
deposit growth strategy; brokered CDs were reduced $38.5 million during
4Q 2013. Excluding government deposits which declined $53 million, core
were up $17.4 million. We achieved this while reducing the cost of
deposits net of brokered from 0.79% to 0.77%. We are prepared for
additional reductions in government deposits. Continued focus on
cross-selling opportunities. Reduced reliance on brokered deposits: -32%
of deposits are brokered CDs, a decline of $233 million compared to 4Q
2012. 8 ($ in millions) Core Deposits * Total Deposit Composition Fourth
Quarter Highlights: DEPOSIT MIX * Core deposits are total deposits
excluding brokered CDs. Interest Bearing59%Non-interest
Bearing9%Brokered CDs32%$-$1,750 $3,500 $5,250 $7,000 4Q 20121Q 20132Q
20133Q 20134Q 20132,776 2,824 2,835 2,828 2,842 1,108 1,161 1,144 1,106
1,136 2,077 2,122 2,111 2,080 2,054 529 515 605 759 706 $6,490 $6,622
$6,695 $6,773 $6,738 Retail Commercial CDs & IRAs Public Funds
 FOURTH QUARTER &
FISCAL YEAR 2013 Results of Operations
FOURTH QUARTER &
FISCAL YEAR 2013 Results of Operations
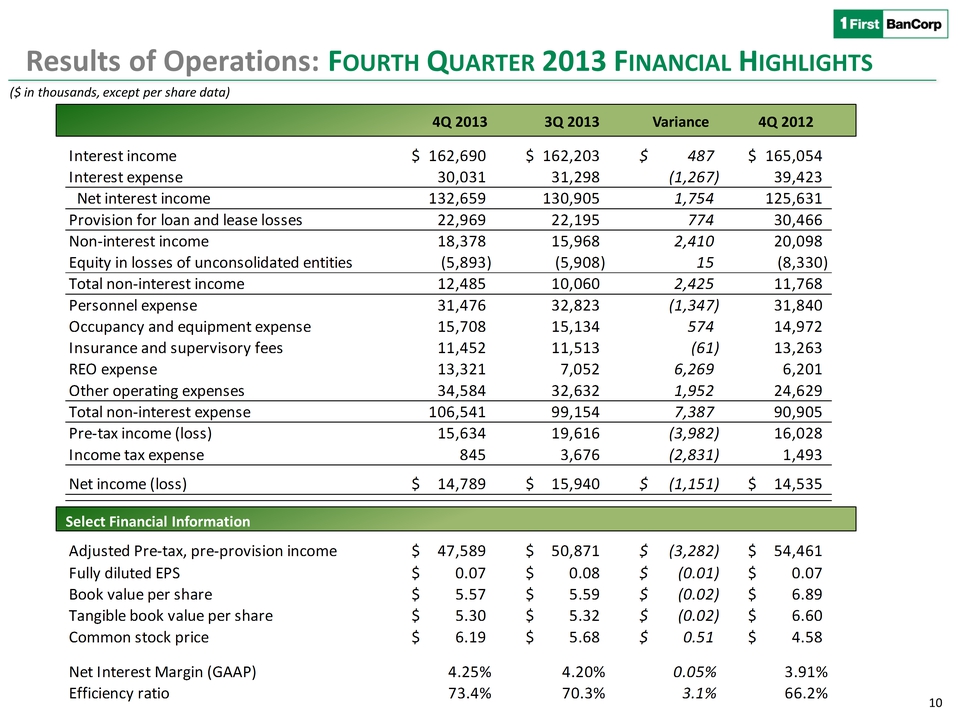 FOURTH QUARTER &
FISCAL YEAR 2013 Results of Operations Interest income162,690$ 162,203$
487 $165,054 $ Interest expense30,031 31,298 (1,267) 39,423 Net interest
income132,659 130,905 1,754 125,631 Provision for loan and lease
losses22,969 22,195 774 30,466 Non-interest income18,378 15,968 2,410
20,098 Equity in losses of unconsolidated entities(5,893) (5,908) 15
(8,330) Total non-interest income12,485 10,060 2,425 11,768 Personnel
expense31,476 32,823 (1,347) 31,840 Occupancy and equipment
expense15,708 15,134 574 14,972 Insurance and supervisory fees11,452
11,513 (61) 13,263 REO expense13,321 7,052 6,269 6,201 Other operating
expenses34,584 32,632 1,952 24,629 Total non-interest expense106,541
99,154 7,387 90,905 Pre-tax income (loss)15,634 19,616 (3,982) 16,028
Income tax expense 845 3,676 (2,831) 1,493 Net income (loss)14,789$
15,940$ (1,151)$ 14,535$ Adjusted Pre-tax, pre-provision income47,589$
50,871$ (3,282)$ 54,461$ Fully diluted EPS0.07$ 0.08$ (0.01)$ 0.07$ Book
value per share5.57$ 5.59$ (0.02)$ 6.89$ Tangible book value per
share5.30$ 5.32$ (0.02)$ 6.60$ Common stock price6.19$ 5.68$ 0.51$ 4.58$
Net Interest Margin (GAAP)4.25%4.20%0.05%3.91%Efficiency
ratio73.4%70.3%3.1%66.2% ($ in thousands, except per share data) Select
Financial Information 4Q 2013 3Q 2013 Variance Results of Operations:
FOURTH QUARTER 2013 FINANCIAL HIGHLIGHTS 4Q 2012 $-$35.0 $70.0 $105.0
$140.0 4Q 20121Q 20132Q 20133Q 20134Q 2013125.6124.5126.9130.9132.7
FOURTH QUARTER &
FISCAL YEAR 2013 Results of Operations Interest income162,690$ 162,203$
487 $165,054 $ Interest expense30,031 31,298 (1,267) 39,423 Net interest
income132,659 130,905 1,754 125,631 Provision for loan and lease
losses22,969 22,195 774 30,466 Non-interest income18,378 15,968 2,410
20,098 Equity in losses of unconsolidated entities(5,893) (5,908) 15
(8,330) Total non-interest income12,485 10,060 2,425 11,768 Personnel
expense31,476 32,823 (1,347) 31,840 Occupancy and equipment
expense15,708 15,134 574 14,972 Insurance and supervisory fees11,452
11,513 (61) 13,263 REO expense13,321 7,052 6,269 6,201 Other operating
expenses34,584 32,632 1,952 24,629 Total non-interest expense106,541
99,154 7,387 90,905 Pre-tax income (loss)15,634 19,616 (3,982) 16,028
Income tax expense 845 3,676 (2,831) 1,493 Net income (loss)14,789$
15,940$ (1,151)$ 14,535$ Adjusted Pre-tax, pre-provision income47,589$
50,871$ (3,282)$ 54,461$ Fully diluted EPS0.07$ 0.08$ (0.01)$ 0.07$ Book
value per share5.57$ 5.59$ (0.02)$ 6.89$ Tangible book value per
share5.30$ 5.32$ (0.02)$ 6.60$ Common stock price6.19$ 5.68$ 0.51$ 4.58$
Net Interest Margin (GAAP)4.25%4.20%0.05%3.91%Efficiency
ratio73.4%70.3%3.1%66.2% ($ in thousands, except per share data) Select
Financial Information 4Q 2013 3Q 2013 Variance Results of Operations:
FOURTH QUARTER 2013 FINANCIAL HIGHLIGHTS 4Q 2012 $-$35.0 $70.0 $105.0
$140.0 4Q 20121Q 20132Q 20133Q 20134Q 2013125.6124.5126.9130.9132.7
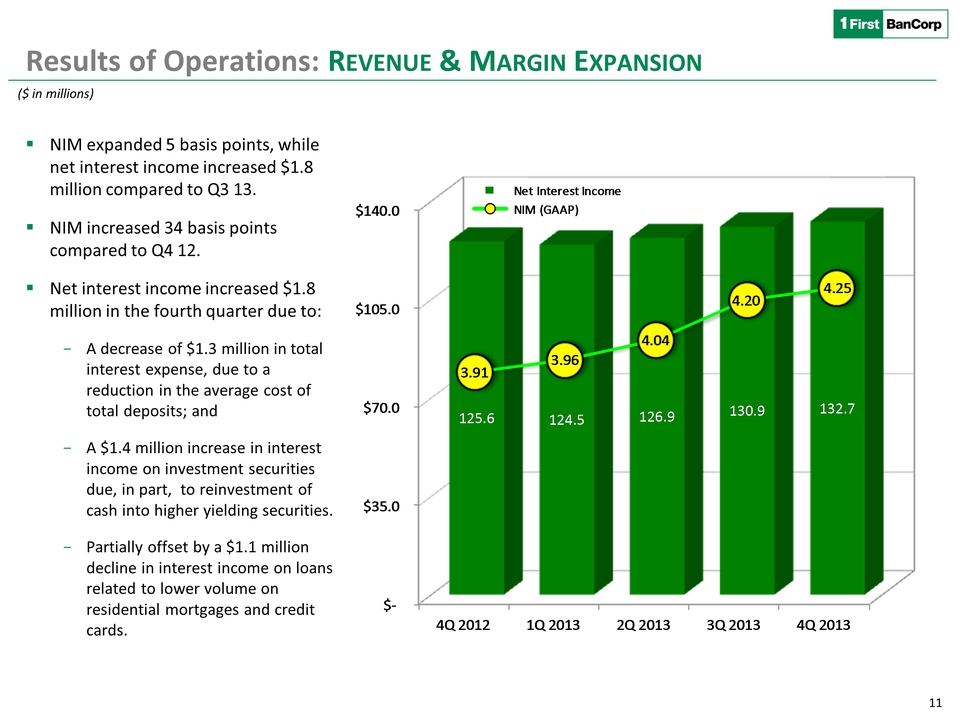 Net Interest Income
NIM (GAAP)3.913.964.044.204.25 Results of Operations: REVENUE & MARGIN
EXPANSION NIM expanded 5 basis points, while net interest income
increased $1.8 million compared to Q3 13. NIM increased 34 basis points
compared to Q4 12. Net interest income increased $1.8 million in the
fourth quarter due to: -A decrease of $1.3 million in total interest
expense, due to a reduction in the average cost of total deposits; and
-A $1.4 million increase in interest income on investment securities
due, in part, to reinvestment of cash into higher yielding securities.
-Partially offset by a $1.1 million decline in interest income on loans
related to lower volume on residential mortgages and credit cards.
2.602.752.943.203.46Net Interest …($ in millions)
Net Interest Income
NIM (GAAP)3.913.964.044.204.25 Results of Operations: REVENUE & MARGIN
EXPANSION NIM expanded 5 basis points, while net interest income
increased $1.8 million compared to Q3 13. NIM increased 34 basis points
compared to Q4 12. Net interest income increased $1.8 million in the
fourth quarter due to: -A decrease of $1.3 million in total interest
expense, due to a reduction in the average cost of total deposits; and
-A $1.4 million increase in interest income on investment securities
due, in part, to reinvestment of cash into higher yielding securities.
-Partially offset by a $1.1 million decline in interest income on loans
related to lower volume on residential mortgages and credit cards.
2.602.752.943.203.46Net Interest …($ in millions)
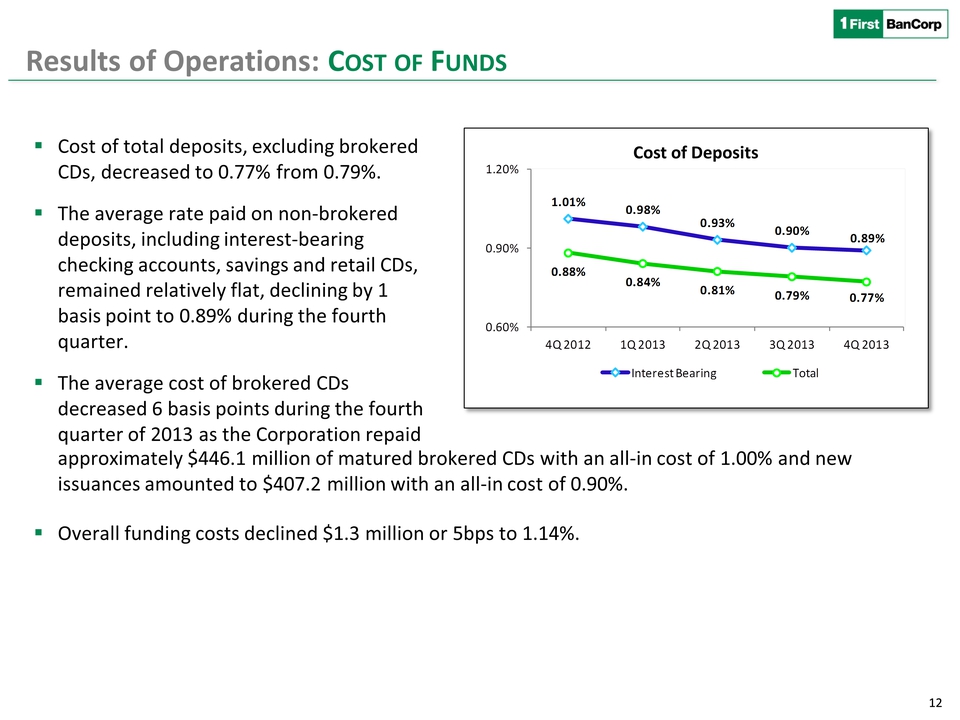 Results of
Operations: COST OF FUNDS Cost of total deposits, excluding brokered
CDs, decreased to 0.77% from 0.79%. The average rate paid on
non-brokered deposits, including interest-bearing checking accounts,
savings and retail CDs, remained relatively flat, declining by 1 basis
point to 0.89% during the fourth quarter. The average cost of brokered
CDs decreased 6 basis points during the fourth quarter of 2013 as the
Corporation repaid approximately $446.1 million of matured brokered CDs
with an all-in cost of 1.00% and new issuances amounted to $407.2
million with an all-in cost of 0.90%. Overall funding costs declined
$1.3 million or 5bps to 1.14%. Cost of Deposits
.01%0.98%0.93%0.90%0.89%0.88%0.84%0.81%0.79%0.77%0.60%0.90%1.20%4Q
20121Q 20132Q 20133Q 20134Q 2013Interest Bearing Total
Results of
Operations: COST OF FUNDS Cost of total deposits, excluding brokered
CDs, decreased to 0.77% from 0.79%. The average rate paid on
non-brokered deposits, including interest-bearing checking accounts,
savings and retail CDs, remained relatively flat, declining by 1 basis
point to 0.89% during the fourth quarter. The average cost of brokered
CDs decreased 6 basis points during the fourth quarter of 2013 as the
Corporation repaid approximately $446.1 million of matured brokered CDs
with an all-in cost of 1.00% and new issuances amounted to $407.2
million with an all-in cost of 0.90%. Overall funding costs declined
$1.3 million or 5bps to 1.14%. Cost of Deposits
.01%0.98%0.93%0.90%0.89%0.88%0.84%0.81%0.79%0.77%0.60%0.90%1.20%4Q
20121Q 20132Q 20133Q 20134Q 2013Interest Bearing Total
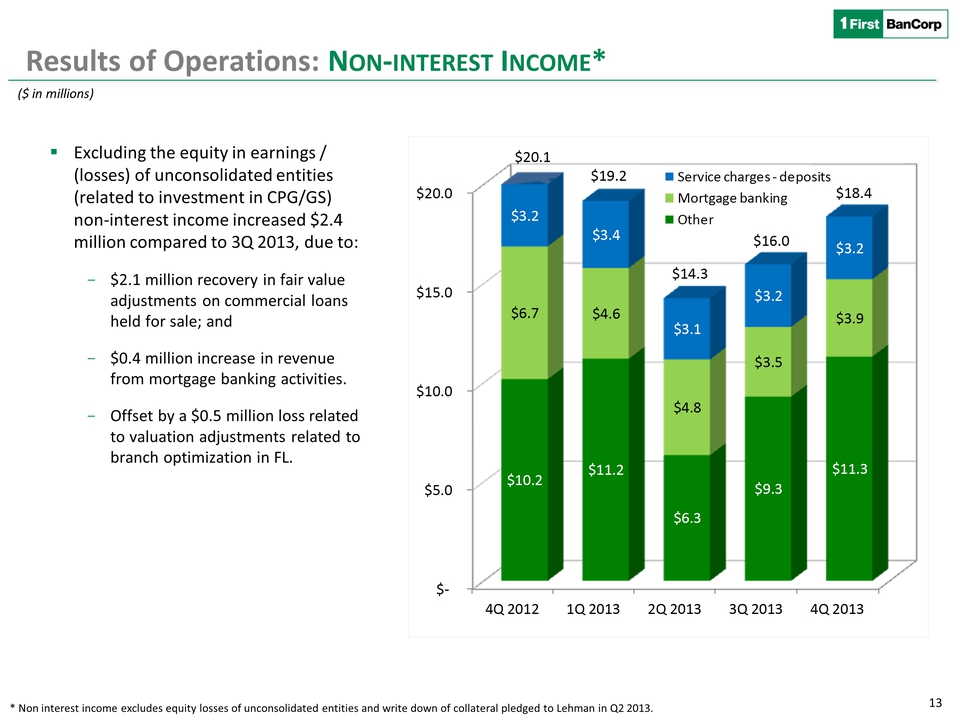 Results of
Operations: NON-INTEREST INCOME* Excluding the equity in earnings /
(losses) of unconsolidated entities (related to investment in CPG/GS)
non-interest income increased $2.4 million compared to 3Q 2013, due to:
-$2.1 million recovery in fair value adjustments on commercial loans
held for sale; and -$0.4 million increase in revenue from mortgage
banking activities. -Offset by a $0.5 million loss related to valuation
adjustments related to branch optimization in FL. * Non interest income
excludes equity losses of unconsolidated entities and write down of
collateral pledged to Lehman in Q2 2013. ($ in millions) $-$5.0 $10.0
$15.0 $20.0 4Q 20121Q 20132Q 20133Q 20134Q 2013$10.2 $11.2 $6.3 $9.3
$11.3 $6.7 $4.6 $4.8 $3.5 $3.9 $3.2 $3.4 $3.1 $3.2 $3.2 $20.1 $19.2
$14.3 $16.0 $18.4 Service charges –deposits Mortgage banking Other
Results of
Operations: NON-INTEREST INCOME* Excluding the equity in earnings /
(losses) of unconsolidated entities (related to investment in CPG/GS)
non-interest income increased $2.4 million compared to 3Q 2013, due to:
-$2.1 million recovery in fair value adjustments on commercial loans
held for sale; and -$0.4 million increase in revenue from mortgage
banking activities. -Offset by a $0.5 million loss related to valuation
adjustments related to branch optimization in FL. * Non interest income
excludes equity losses of unconsolidated entities and write down of
collateral pledged to Lehman in Q2 2013. ($ in millions) $-$5.0 $10.0
$15.0 $20.0 4Q 20121Q 20132Q 20133Q 20134Q 2013$10.2 $11.2 $6.3 $9.3
$11.3 $6.7 $4.6 $4.8 $3.5 $3.9 $3.2 $3.4 $3.1 $3.2 $3.2 $20.1 $19.2
$14.3 $16.0 $18.4 Service charges –deposits Mortgage banking Other
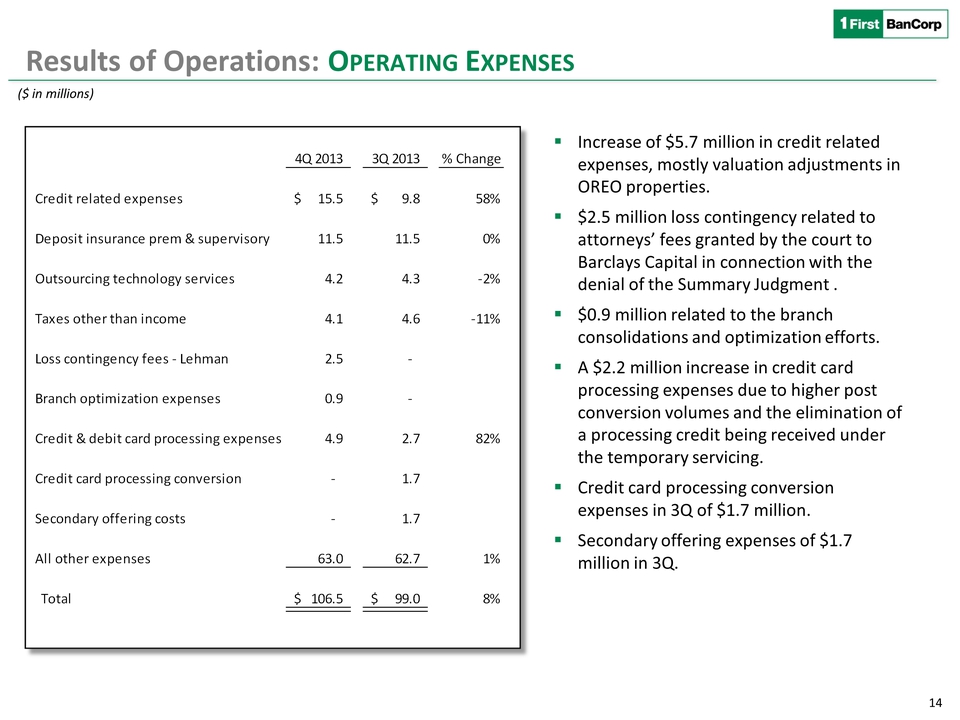 Results of
Operations: OPERATING EXPENSES Increase of $5.7 million in credit
related expenses, mostly valuation adjustments in OREO properties. $2.5
million loss contingency related to attorneys’ fees granted by the court
to Barclays Capital in connection with the denial of the Summary
Judgment . $0.9 million related to the branch consolidations and
optimization efforts. A $2.2 million increase in credit card processing
expenses due to higher post conversion volumes and the elimination of a
processing credit being received under the temporary servicing. Credit
card processing conversion expenses in 3Q of $1.7 million. Secondary
offering expenses of $1.7 million in 3Q. ($ in millions) 4Q 20133Q 2013%
Change Credit related expenses15.5$ 9.8$ 58% Deposit insurance prem &
supervisory 11.5 11.5 0% Outsourcing technology services4.2 4.3 -2%Taxes
other than income4.1 4.6 -11%Loss contingency fees - Lehman2.5 - Branch
optimization expenses0.9 - Credit & debit card processing expenses 4.9
2.7 82% Credit card processing conversion - 1.7 Secondary offering costs
- 1.7 All other expenses 63.0 62.7 1% Total 106.5 $ 99.0 $ 8%
Results of
Operations: OPERATING EXPENSES Increase of $5.7 million in credit
related expenses, mostly valuation adjustments in OREO properties. $2.5
million loss contingency related to attorneys’ fees granted by the court
to Barclays Capital in connection with the denial of the Summary
Judgment . $0.9 million related to the branch consolidations and
optimization efforts. A $2.2 million increase in credit card processing
expenses due to higher post conversion volumes and the elimination of a
processing credit being received under the temporary servicing. Credit
card processing conversion expenses in 3Q of $1.7 million. Secondary
offering expenses of $1.7 million in 3Q. ($ in millions) 4Q 20133Q 2013%
Change Credit related expenses15.5$ 9.8$ 58% Deposit insurance prem &
supervisory 11.5 11.5 0% Outsourcing technology services4.2 4.3 -2%Taxes
other than income4.1 4.6 -11%Loss contingency fees - Lehman2.5 - Branch
optimization expenses0.9 - Credit & debit card processing expenses 4.9
2.7 82% Credit card processing conversion - 1.7 Secondary offering costs
- 1.7 All other expenses 63.0 62.7 1% Total 106.5 $ 99.0 $ 8%
 2010 2011 2012 2013
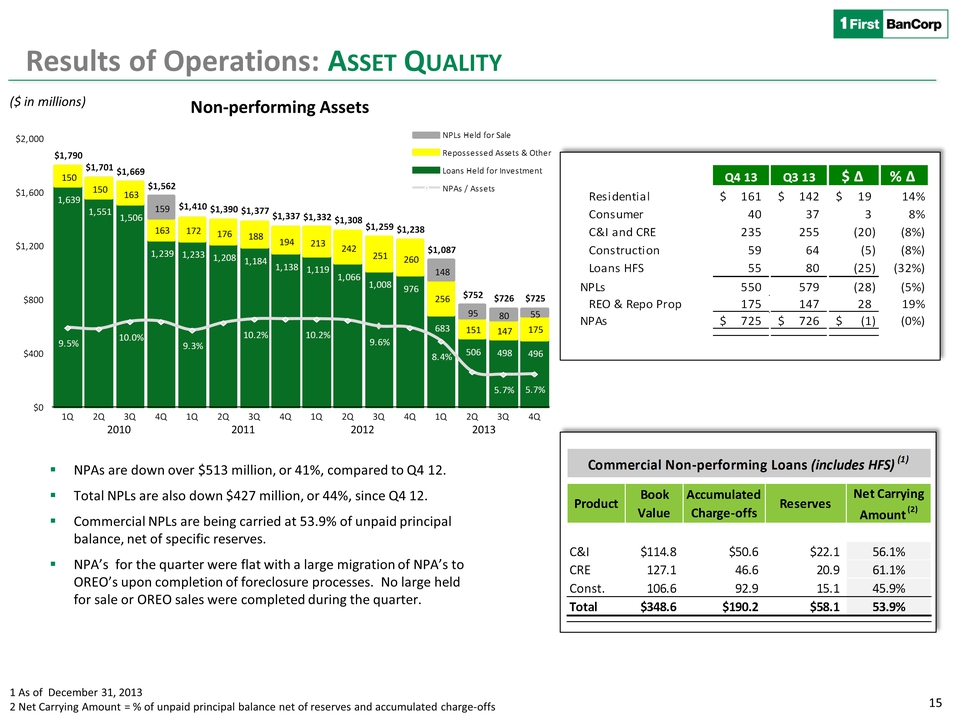
15 Results of Operations: ASSET QUALITY NPAs are down over $513 million,
or 41%, compared to Q4 12. Total NPLs are also down $427 million, or
44%, since Q4 12. Commercial NPLs are being carried at 53.9% of unpaid
principal balance, net of specific reserves. NPA’s for the quarter were
flat with a large migration of NPA’s to OREO’s upon completion of
foreclosure processes. No large held for sale or OREO sales were
completed during the quarter. ($ in millions) 1 As of December 31, 2013
2 Net Carrying Amount = % of unpaid principal balance net of reserves
and accumulated charge-offs Non-performing Assets 1,639 1,551 1,506
1,239 1,233 1,208 1,184 1,138 1,119 1,066 1,008 976 683 506 498 496 150
150 163 163 172 176 188 194 213 242 251 260 256 151 147 175 159 148 95
80 55 $1,790 $1,701 $1,669 $1,562 $1,410 $1,390 $1,377 $1,337 $1,332
$1,308 $1,259 $1,238 $1,087 $752 $726 $725 9.5% 10.0% 9.3% 10.2% 10.2%
9.6% 8.4% 5.7% 5.7%
$0$400$800$1,200$1,600$2,0001Q2Q3Q4Q1Q2Q3Q4Q1Q2Q3Q4Q1Q2Q3Q4QNPLs Held
for Sale Repossessed Assets & Other Loans Held for Investment NPAs /
AssetsQ4 13Q3 13$ ∆ % ∆ Residential161$ 142$ 19$ 14%Consumer 40 37 3
8%C&I and CRE235 255 (20) (8%)Construction59 64 (5) (8%)Loans HFS55 80
(25) (32%)NPLs550 579 (28) (5%)REO & Repo Prop175 147 28 19%NPAs725$
726$ (1)$ (0%)Product Book Value Accumulated Charge-offs Reserves Net
Carrying Amount (2)C&I$114.8$50.6$22.156.1%CRE127.1 46.6 20.9
61.1%Const.106.6 92.9 15.1 45.9%Total$348.6$190.2$58.153.9%Commercial
Non-performing Loans (includes HFS)(1)
2010 2011 2012 2013
15 Results of Operations: ASSET QUALITY NPAs are down over $513 million,
or 41%, compared to Q4 12. Total NPLs are also down $427 million, or
44%, since Q4 12. Commercial NPLs are being carried at 53.9% of unpaid
principal balance, net of specific reserves. NPA’s for the quarter were
flat with a large migration of NPA’s to OREO’s upon completion of
foreclosure processes. No large held for sale or OREO sales were
completed during the quarter. ($ in millions) 1 As of December 31, 2013
2 Net Carrying Amount = % of unpaid principal balance net of reserves
and accumulated charge-offs Non-performing Assets 1,639 1,551 1,506
1,239 1,233 1,208 1,184 1,138 1,119 1,066 1,008 976 683 506 498 496 150
150 163 163 172 176 188 194 213 242 251 260 256 151 147 175 159 148 95
80 55 $1,790 $1,701 $1,669 $1,562 $1,410 $1,390 $1,377 $1,337 $1,332
$1,308 $1,259 $1,238 $1,087 $752 $726 $725 9.5% 10.0% 9.3% 10.2% 10.2%
9.6% 8.4% 5.7% 5.7%
$0$400$800$1,200$1,600$2,0001Q2Q3Q4Q1Q2Q3Q4Q1Q2Q3Q4Q1Q2Q3Q4QNPLs Held
for Sale Repossessed Assets & Other Loans Held for Investment NPAs /
AssetsQ4 13Q3 13$ ∆ % ∆ Residential161$ 142$ 19$ 14%Consumer 40 37 3
8%C&I and CRE235 255 (20) (8%)Construction59 64 (5) (8%)Loans HFS55 80
(25) (32%)NPLs550 579 (28) (5%)REO & Repo Prop175 147 28 19%NPAs725$
726$ (1)$ (0%)Product Book Value Accumulated Charge-offs Reserves Net
Carrying Amount (2)C&I$114.8$50.6$22.156.1%CRE127.1 46.6 20.9
61.1%Const.106.6 92.9 15.1 45.9%Total$348.6$190.2$58.153.9%Commercial
Non-performing Loans (includes HFS)(1)
 Results of
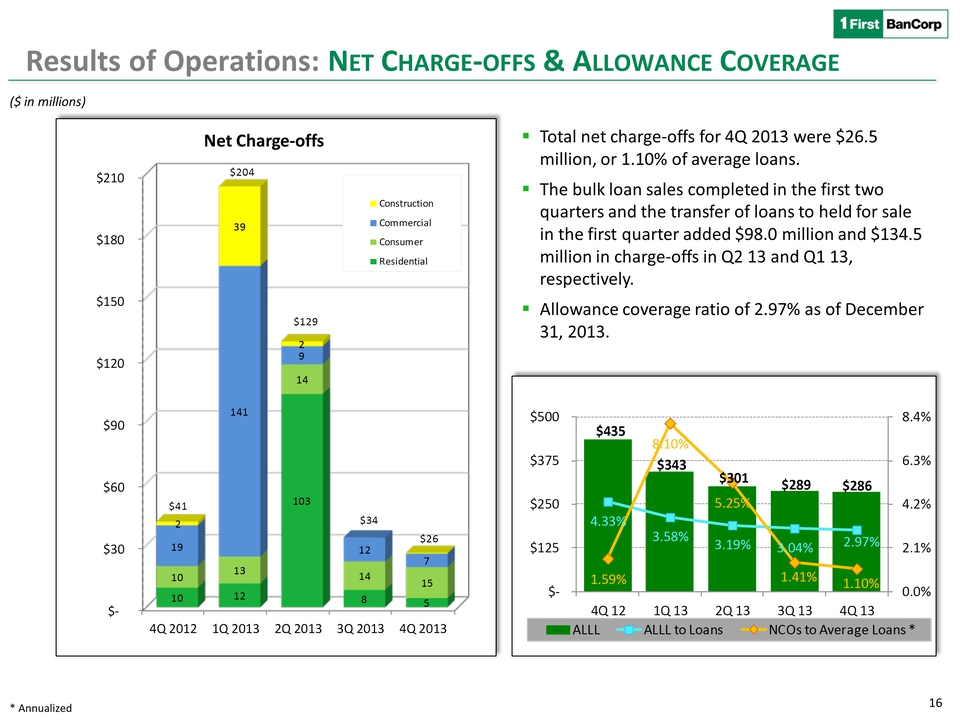
Operations: NET CHARGE-OFFS & ALLOWANCE COVERAGE ($ in millions) Total
net charge-offs for 4Q 2013 were $26.5 million, or 1.10% of average
loans. The bulk loan sales completed in the first two quarters and the
transfer of loans to held for sale in the first quarter added $98.0
million and $134.5 million in charge-offs in Q2 13 and Q1 13,
respectively. Allowance coverage ratio of 2.97% as of December 31, 2013.
Net Charge-offs * Annualized $-$30 $60 $90 $120 $150 $180 $210 4Q 20121Q
20132Q 20133Q 20134Q 201310 12 103 8 5 10 13 14 14 15 19 141 9 12 7 2 39
2 $41 $204 $129 $34 $26 Construction Commercial Consumer Residential$435
$343 $301 $289 $286
4.33%3.58%3.19%3.04%2.97%1.59%8.10%5.25%1.41%1.10%0.0%2.1%4.2%6.3%8.4%$-$125
$250 $375 $500 4Q 121Q 132Q 133Q 134Q 13ALLLALLL to Loans NCOs to
Average Loans *
Results of
Operations: NET CHARGE-OFFS & ALLOWANCE COVERAGE ($ in millions) Total
net charge-offs for 4Q 2013 were $26.5 million, or 1.10% of average
loans. The bulk loan sales completed in the first two quarters and the
transfer of loans to held for sale in the first quarter added $98.0
million and $134.5 million in charge-offs in Q2 13 and Q1 13,
respectively. Allowance coverage ratio of 2.97% as of December 31, 2013.
Net Charge-offs * Annualized $-$30 $60 $90 $120 $150 $180 $210 4Q 20121Q
20132Q 20133Q 20134Q 201310 12 103 8 5 10 13 14 14 15 19 141 9 12 7 2 39
2 $41 $204 $129 $34 $26 Construction Commercial Consumer Residential$435
$343 $301 $289 $286
4.33%3.58%3.19%3.04%2.97%1.59%8.10%5.25%1.41%1.10%0.0%2.1%4.2%6.3%8.4%$-$125
$250 $375 $500 4Q 121Q 132Q 133Q 134Q 13ALLLALLL to Loans NCOs to
Average Loans *
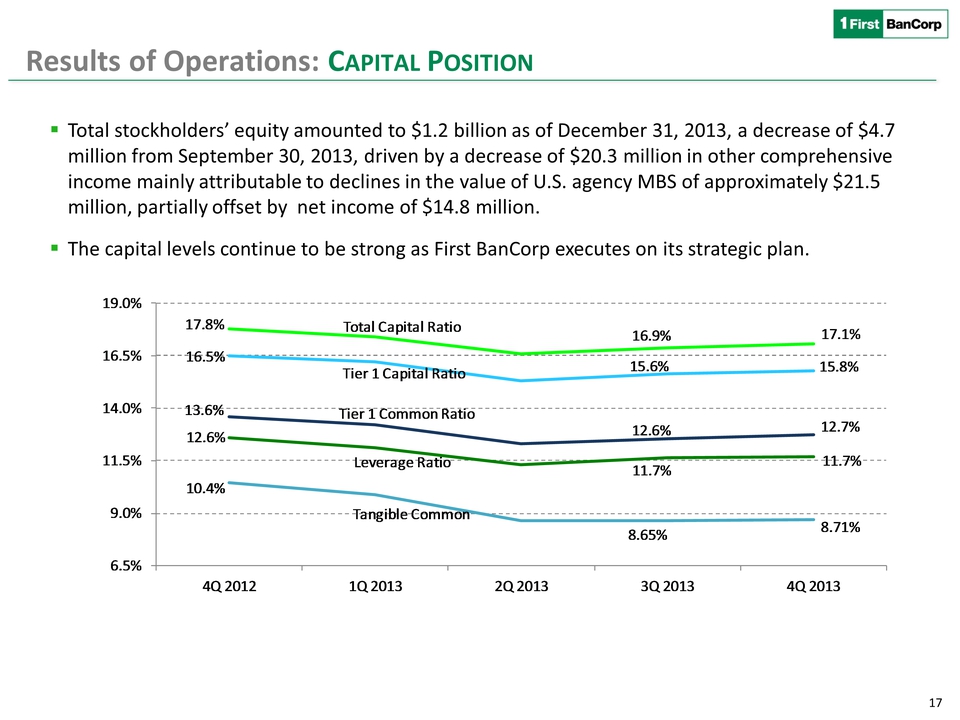 Results of
Operations: CAPITAL POSITION Total stockholders’ equity amounted to $1.2
billion as of December 31, 2013, a decrease of $4.7 million from
September 30, 2013, driven by a decrease of $20.3 million in other
comprehensive income mainly attributable to declines in the value of
U.S. agency MBS of approximately $21.5 million, partially offset by net
income of $14.8 million. The capital levels continue to be strong as
First BanCorp executes on its strategic plan. Capital Ratios 17.8%Total
Capital Ratio16.9%17.1%16.5%Tier 1 Capital Ratio15.6%15.8%12.6%Leverage
Ratio11.7%11.7%13.6%Tier 1 Common Ratio12.6%12.7%10.4%Tangible
Common8.65%8.71%6.5%9.0%11.5%14.0%16.5%19.0%4Q 20121Q 20132Q 20133Q
20134Q 2013
Results of
Operations: CAPITAL POSITION Total stockholders’ equity amounted to $1.2
billion as of December 31, 2013, a decrease of $4.7 million from
September 30, 2013, driven by a decrease of $20.3 million in other
comprehensive income mainly attributable to declines in the value of
U.S. agency MBS of approximately $21.5 million, partially offset by net
income of $14.8 million. The capital levels continue to be strong as
First BanCorp executes on its strategic plan. Capital Ratios 17.8%Total
Capital Ratio16.9%17.1%16.5%Tier 1 Capital Ratio15.6%15.8%12.6%Leverage
Ratio11.7%11.7%13.6%Tier 1 Common Ratio12.6%12.7%10.4%Tangible
Common8.65%8.71%6.5%9.0%11.5%14.0%16.5%19.0%4Q 20121Q 20132Q 20133Q
20134Q 2013
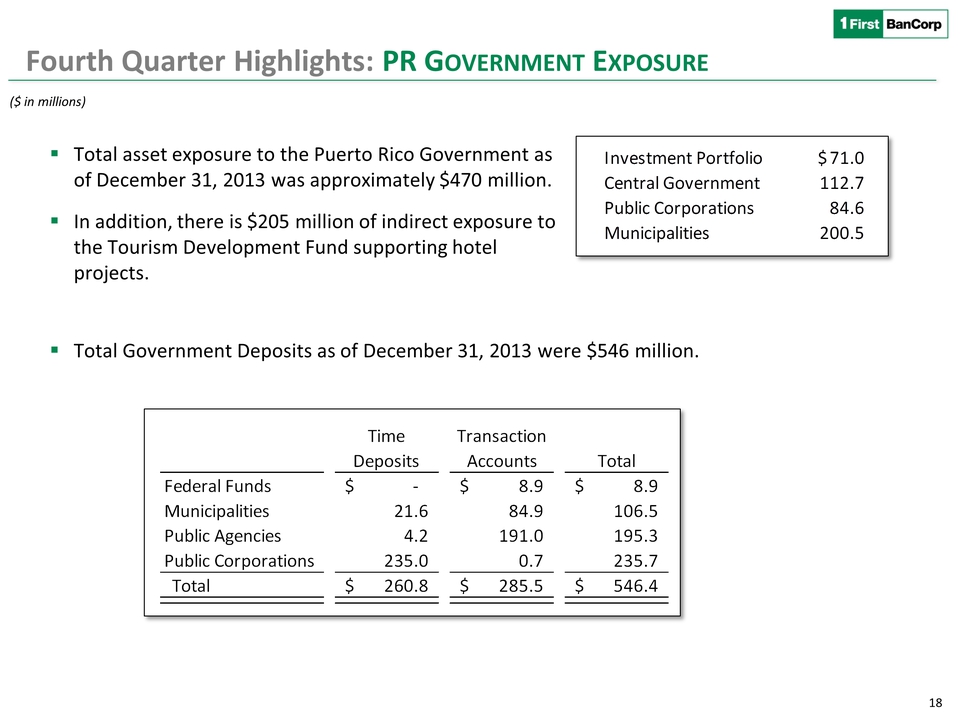 Fourth Quarter
Highlights: PR GOVERNMENT EXPOSURE ($ in millions) Total asset exposure
to the Puerto Rico Government as of December 31, 2013 was approximately
$470 million. In addition, there is $205 million of indirect exposure to
the Tourism Development Fund supporting hotel projects. Total Government
Deposits as of December 31, 2013 were $546 million. Time Deposits
Transaction Accounts Total Federal Funds - $ 8.9 $ 8.9 $ Municipalities
21.6 84.9 106.5 Public Agencies 4.2 191.0 195.3 Public Corporations
235.0 0.7 235.7 Total 260.8 $ 285.5 $ 546.4 $ Investment Portfolio 71.0
$ Central Government 112.7 Public Corporations 84.6 Municipalities 200.5
Fourth Quarter
Highlights: PR GOVERNMENT EXPOSURE ($ in millions) Total asset exposure
to the Puerto Rico Government as of December 31, 2013 was approximately
$470 million. In addition, there is $205 million of indirect exposure to
the Tourism Development Fund supporting hotel projects. Total Government
Deposits as of December 31, 2013 were $546 million. Time Deposits
Transaction Accounts Total Federal Funds - $ 8.9 $ 8.9 $ Municipalities
21.6 84.9 106.5 Public Agencies 4.2 191.0 195.3 Public Corporations
235.0 0.7 235.7 Total 260.8 $ 285.5 $ 546.4 $ Investment Portfolio 71.0
$ Central Government 112.7 Public Corporations 84.6 Municipalities 200.5
 FOURTH QUARTER &
FISCAL YEAR 2013 Q&A
FOURTH QUARTER &
FISCAL YEAR 2013 Q&A
 EXHIBITS
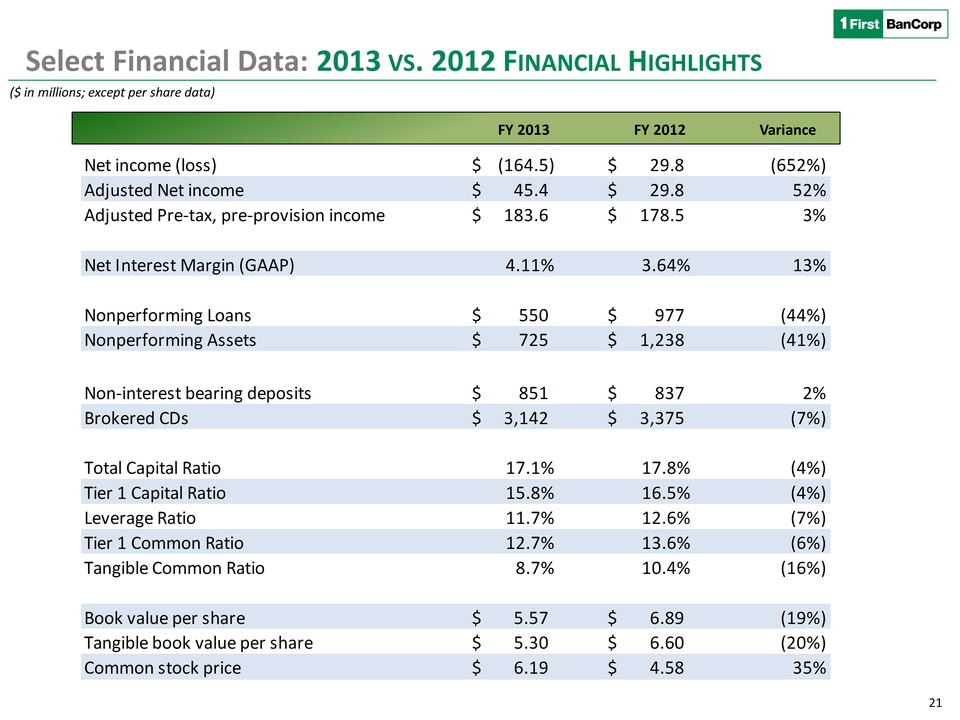 ($ in millions;
except per share data) Select Financial Data: 2013 VS. 2012 FINANCIAL
HIGHLIGHTS FY 2013 FY 2012 Variance Net income (loss) (164.5) $ 29.8$
(652%) Adjusted Net income 45.4 $ 29.8 $ 52%Adjusted Pre-tax,
pre-provision income183.6$ 178.5$ 3% Net Interest Margin (GAAP) 4.11%
3.64% 13% Nonperforming Loans 550 $ 977 $ (44%) Nonperforming Assets725$
1,238$ (41%) Non-interest bearing deposits851$ 837$ 2% Brokered CDs3,
142 $ 3,375 $ (7%) Total Capital Ratio 17.1% 17.8% (4%) Tier 1 Capital
Ratio 15.8% 16.5% (4%) Leverage Ratio 11.7% 12.6% (7%) Tier 1 Common
Ratio 12.7% 13.6% (6%) Tangible Common Ratio 8.7% 10.4% (16%) Book value
per share5.57$ 6.89$ (19%) Tangible book value per share 5.30 $ 6.60 $
(20%) Common stock price 6.19 $ 4.58 $ 35%
($ in millions;
except per share data) Select Financial Data: 2013 VS. 2012 FINANCIAL
HIGHLIGHTS FY 2013 FY 2012 Variance Net income (loss) (164.5) $ 29.8$
(652%) Adjusted Net income 45.4 $ 29.8 $ 52%Adjusted Pre-tax,
pre-provision income183.6$ 178.5$ 3% Net Interest Margin (GAAP) 4.11%
3.64% 13% Nonperforming Loans 550 $ 977 $ (44%) Nonperforming Assets725$
1,238$ (41%) Non-interest bearing deposits851$ 837$ 2% Brokered CDs3,
142 $ 3,375 $ (7%) Total Capital Ratio 17.1% 17.8% (4%) Tier 1 Capital
Ratio 15.8% 16.5% (4%) Leverage Ratio 11.7% 12.6% (7%) Tier 1 Common
Ratio 12.7% 13.6% (6%) Tangible Common Ratio 8.7% 10.4% (16%) Book value
per share5.57$ 6.89$ (19%) Tangible book value per share 5.30 $ 6.60 $
(20%) Common stock price 6.19 $ 4.58 $ 35%
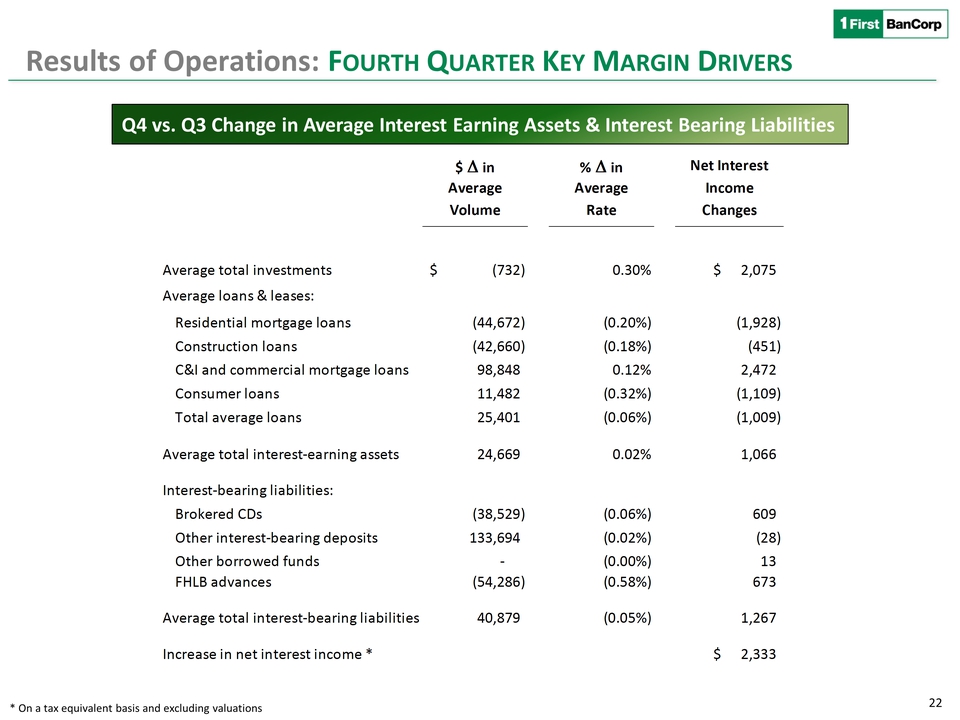 Results of
Operations: FOURTH QUARTER KEY MARGIN DRIVERS Q4 vs. Q3 Change in
Average Interest Earning Assets & Interest Bearing Liabilities * On a
tax equivalent basis and excluding valuations $ D in % D in Average
Average Volume Rate Average total investments(732)$ 0.30%2,075$ Average
loans & leases: Residential mortgage loans(44,672) (0.20%)(1,928)
Construction loans(42,660) (0.18%)(451) C&I and commercial mortgage
loans98,848 0.12%2,472 Consumer loans11,482 (0.32%)(1,109) Total average
loans25,401 (0.06%)(1,009) Average total interest-earning assets24,669
0.02%1,066 Interest-bearing liabilities: Brokered CDs(38,529) (0.06%)609
Other interest-bearing deposits133,694 (0.02%)(28) Other borrowed funds-
(0.00%)13 FHLB advances(54,286) (0.58%)673 Average total
interest-bearing liabilities40,879 (0.05%)1,267 Increase in net interest
income *2,333$ Net Interest Income Changes
Results of
Operations: FOURTH QUARTER KEY MARGIN DRIVERS Q4 vs. Q3 Change in
Average Interest Earning Assets & Interest Bearing Liabilities * On a
tax equivalent basis and excluding valuations $ D in % D in Average
Average Volume Rate Average total investments(732)$ 0.30%2,075$ Average
loans & leases: Residential mortgage loans(44,672) (0.20%)(1,928)
Construction loans(42,660) (0.18%)(451) C&I and commercial mortgage
loans98,848 0.12%2,472 Consumer loans11,482 (0.32%)(1,109) Total average
loans25,401 (0.06%)(1,009) Average total interest-earning assets24,669
0.02%1,066 Interest-bearing liabilities: Brokered CDs(38,529) (0.06%)609
Other interest-bearing deposits133,694 (0.02%)(28) Other borrowed funds-
(0.00%)13 FHLB advances(54,286) (0.58%)673 Average total
interest-bearing liabilities40,879 (0.05%)1,267 Increase in net interest
income *2,333$ Net Interest Income Changes
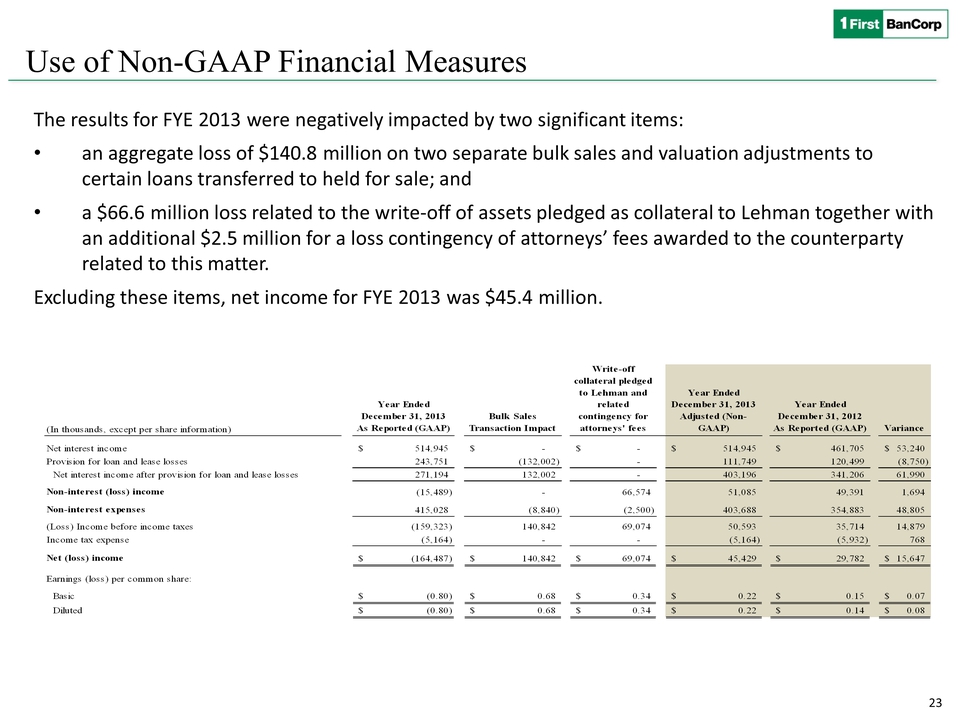 Select Financial
Information (In thousands, except per share information)Year Ended
December 31, 2013 As Reported (GAAP)Bulk Sales Transaction Impact
Write-off collateral pledged to Lehman and related contingency for
attorneys' fees Year Ended December 31, 2013 Adjusted (Non-GAAP)Year
Ended December 31, 2012 As Reported (GAAP)Variance Net interest
income514,945$ -$ -$ 514,945$ 461,705$ 53,240$ Provision for loan and
lease losses243,751 (132,002) - 111,749 120,499 (8,750) Net interest
income after provision for loan and lease losses271,194 132,002 -
403,196 341,206 61,990 Non-interest (loss) income(15,489) - 66,574
51,085 49,391 1,694 Non-interest expenses415,028 (8,840) (2,500) 403,688
354,883 48,805 (Loss) Income before income taxes(159,323) 140,842 69,074
50,593 35,714 14,879 Income tax expense(5,164) - - (5,164) (5,932) 768
Net (loss) income (164,487)$ 140,842$ 69,074$ 45,429$ 29,782$ 15,647$
Earnings (loss) per common share: Basic(0.80)$ 0.68$ 0.34$ 0.22$ 0.15$
0.07$ Diluted(0.80)$ 0.68$ 0.34$ 0.22$ 0.14$ 0.08$ The results for FYE
2013 were negatively impacted by two significant items: an aggregate
loss of $140.8 million on two separate bulk sales and valuation
adjustments to certain loans transferred to held for sale; and a $66.6
million loss related to the write-off of assets pledged as collateral to
Lehman together with an additional $2.5 million for a loss contingency
of attorneys’ fees awarded to the counterparty related to this matter.
Excluding these items, net income for FYE 2013 was $45.4 million. Use of
Non-GAAP Financial Measures
Select Financial
Information (In thousands, except per share information)Year Ended
December 31, 2013 As Reported (GAAP)Bulk Sales Transaction Impact
Write-off collateral pledged to Lehman and related contingency for
attorneys' fees Year Ended December 31, 2013 Adjusted (Non-GAAP)Year
Ended December 31, 2012 As Reported (GAAP)Variance Net interest
income514,945$ -$ -$ 514,945$ 461,705$ 53,240$ Provision for loan and
lease losses243,751 (132,002) - 111,749 120,499 (8,750) Net interest
income after provision for loan and lease losses271,194 132,002 -
403,196 341,206 61,990 Non-interest (loss) income(15,489) - 66,574
51,085 49,391 1,694 Non-interest expenses415,028 (8,840) (2,500) 403,688
354,883 48,805 (Loss) Income before income taxes(159,323) 140,842 69,074
50,593 35,714 14,879 Income tax expense(5,164) - - (5,164) (5,932) 768
Net (loss) income (164,487)$ 140,842$ 69,074$ 45,429$ 29,782$ 15,647$
Earnings (loss) per common share: Basic(0.80)$ 0.68$ 0.34$ 0.22$ 0.15$
0.07$ Diluted(0.80)$ 0.68$ 0.34$ 0.22$ 0.14$ 0.08$ The results for FYE
2013 were negatively impacted by two significant items: an aggregate
loss of $140.8 million on two separate bulk sales and valuation
adjustments to certain loans transferred to held for sale; and a $66.6
million loss related to the write-off of assets pledged as collateral to
Lehman together with an additional $2.5 million for a loss contingency
of attorneys’ fees awarded to the counterparty related to this matter.
Excluding these items, net income for FYE 2013 was $45.4 million. Use of
Non-GAAP Financial Measures
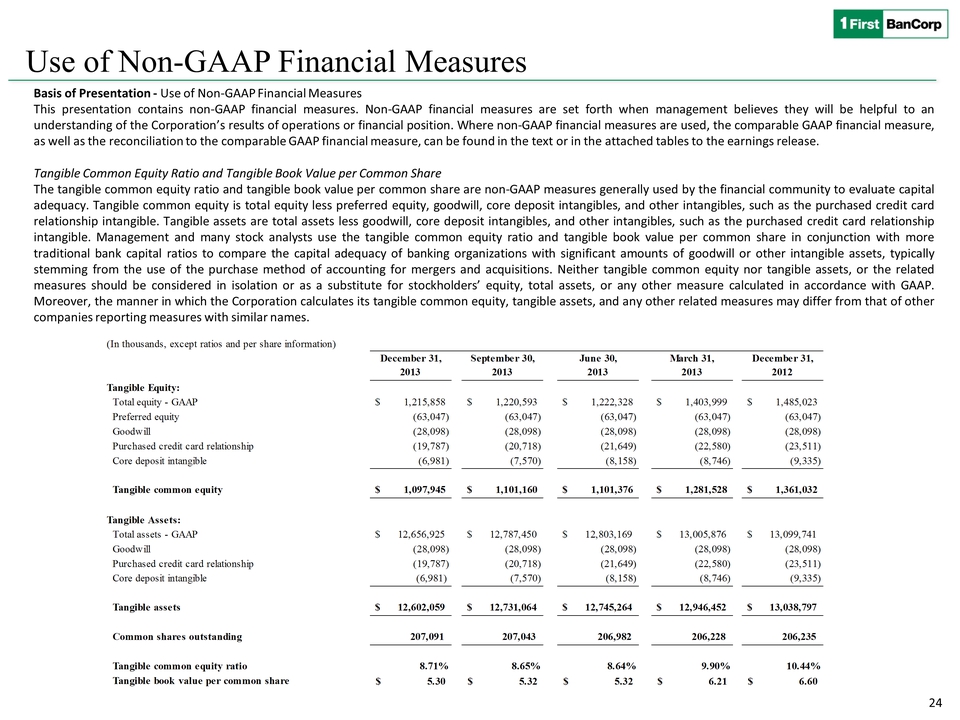 Use of Non-GAAP
Financial Measures Basis of Presentation - Use of Non-GAAP Financial
Measures This presentation contains non-GAAP financial measures.
Non-GAAP financial measures are set forth when management believes they
will be helpful to an understanding of the Corporation’s results of
operations or financial position. Where non-GAAP financial measures are
used, the comparable GAAP financial measure, as well as the
reconciliation to the comparable GAAP financial measure, can be found in
the text or in the attached tables to the earnings release. Tangible
Common Equity Ratio and Tangible Book Value per Common Share The
tangible common equity ratio and tangible book value per common share
are non-GAAP measures generally used by the financial community to
evaluate capital adequacy. Tangible common equity is total equity less
preferred equity, goodwill, core deposit intangibles, and other
intangibles, such as the purchased credit card relationship intangible.
Tangible assets are total assets less goodwill, core deposit
intangibles, and other intangibles, such as the purchased credit card
relationship intangible. Management and many stock analysts use the
tangible common equity ratio and tangible book value per common share in
conjunction with more traditional bank capital ratios to compare the
capital adequacy of banking organizations with significant amounts of
goodwill or other intangible assets, typically stemming from the use of
the purchase method of accounting for mergers and acquisitions. Neither
tangible common equity nor tangible assets, or the related measures
should be considered in isolation or as a substitute for stockholders’
equity, total assets, or any other measure calculated in accordance with
GAAP. Moreover, the manner in which the Corporation calculates its
tangible common equity, tangible assets, and any other related measures
may differ from that of other companies reporting measures with similar
names. (In thousands, except ratios and per share information)December
31,September 30,June 30,March 31,December 31,20132013201320132012Total
equity - GAAP $ 1,215,858 $ 1,220,593 $ 1,222,328 $ 1,403,999 $
1,485,023 Preferred
equity(63,047)(63,047)(63,047)(63,047)(63,047)Goodwill(28,098)(28,098)(28,098)(28,098)(28,098)Purchased
credit card relationship (19,787) (20,718) (21,649) (22,580)
(23,511)Core deposit
intangible(6,981)(7,570)(8,158)(8,746)(9,335)Tangible common equity $
1,097,945 $ 1,101,160 $ 1,101,376 $ 1,281,528 $ 1,361,032 Total assets -
GAAP $ 12,656,925 $ 12,787,450 $ 12,803,169 $ 13,005,876 $ 13,099,741
Goodwill(28,098)(28,098)(28,098)(28,098)(28,098)Purchased credit card
relationship (19,787) (20,718) (21,649) (22,580) (23,511)Core deposit
intangible (6,981)(7,570)(8,158)(8,746)(9,335)Tangible assets $
12,602,059 $ 12,731,064 $ 12,745,264 $ 12,946,452 $ 13,038,797 Common
shares outstanding 207,091 207,043 206,982 206,228 206,235 Tangible
common equity ratio8.71%8.65%8.64%9.90%10.44%Tangible book value per
common share5.30$ 5.32$ 5.32$ 6.21$ 6.60$ Tangible Equity: Tangible
Assets:
Use of Non-GAAP
Financial Measures Basis of Presentation - Use of Non-GAAP Financial
Measures This presentation contains non-GAAP financial measures.
Non-GAAP financial measures are set forth when management believes they
will be helpful to an understanding of the Corporation’s results of
operations or financial position. Where non-GAAP financial measures are
used, the comparable GAAP financial measure, as well as the
reconciliation to the comparable GAAP financial measure, can be found in
the text or in the attached tables to the earnings release. Tangible
Common Equity Ratio and Tangible Book Value per Common Share The
tangible common equity ratio and tangible book value per common share
are non-GAAP measures generally used by the financial community to
evaluate capital adequacy. Tangible common equity is total equity less
preferred equity, goodwill, core deposit intangibles, and other
intangibles, such as the purchased credit card relationship intangible.
Tangible assets are total assets less goodwill, core deposit
intangibles, and other intangibles, such as the purchased credit card
relationship intangible. Management and many stock analysts use the
tangible common equity ratio and tangible book value per common share in
conjunction with more traditional bank capital ratios to compare the
capital adequacy of banking organizations with significant amounts of
goodwill or other intangible assets, typically stemming from the use of
the purchase method of accounting for mergers and acquisitions. Neither
tangible common equity nor tangible assets, or the related measures
should be considered in isolation or as a substitute for stockholders’
equity, total assets, or any other measure calculated in accordance with
GAAP. Moreover, the manner in which the Corporation calculates its
tangible common equity, tangible assets, and any other related measures
may differ from that of other companies reporting measures with similar
names. (In thousands, except ratios and per share information)December
31,September 30,June 30,March 31,December 31,20132013201320132012Total
equity - GAAP $ 1,215,858 $ 1,220,593 $ 1,222,328 $ 1,403,999 $
1,485,023 Preferred
equity(63,047)(63,047)(63,047)(63,047)(63,047)Goodwill(28,098)(28,098)(28,098)(28,098)(28,098)Purchased
credit card relationship (19,787) (20,718) (21,649) (22,580)
(23,511)Core deposit
intangible(6,981)(7,570)(8,158)(8,746)(9,335)Tangible common equity $
1,097,945 $ 1,101,160 $ 1,101,376 $ 1,281,528 $ 1,361,032 Total assets -
GAAP $ 12,656,925 $ 12,787,450 $ 12,803,169 $ 13,005,876 $ 13,099,741
Goodwill(28,098)(28,098)(28,098)(28,098)(28,098)Purchased credit card
relationship (19,787) (20,718) (21,649) (22,580) (23,511)Core deposit
intangible (6,981)(7,570)(8,158)(8,746)(9,335)Tangible assets $
12,602,059 $ 12,731,064 $ 12,745,264 $ 12,946,452 $ 13,038,797 Common
shares outstanding 207,091 207,043 206,982 206,228 206,235 Tangible
common equity ratio8.71%8.65%8.64%9.90%10.44%Tangible book value per
common share5.30$ 5.32$ 5.32$ 6.21$ 6.60$ Tangible Equity: Tangible
Assets:
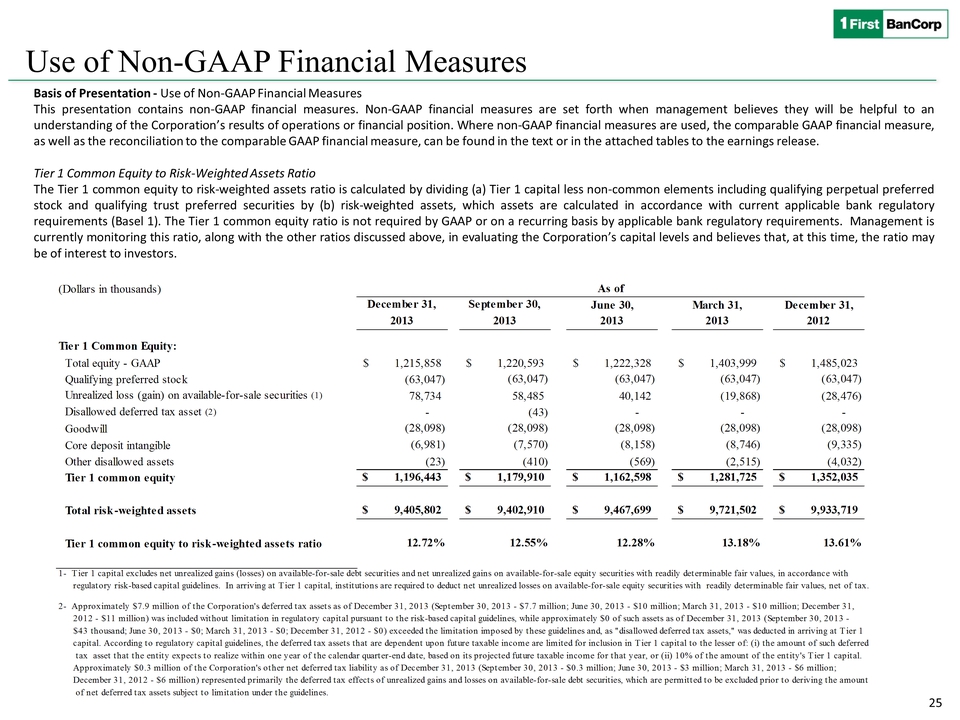 Use of Non-GAAP
Financial Measures Basis of Presentation - Use of Non-GAAP Financial
Measures This presentation contains non-GAAP financial measures.
Non-GAAP financial measures are set forth when management believes they
will be helpful to an understanding of the Corporation’s results of
operations or financial position. Where non-GAAP financial measures are
used, the comparable GAAP financial measure, as well as the
reconciliation to the comparable GAAP financial measure, can be found in
the text or in the attached tables to the earnings release. Tier 1
Common Equity to Risk-Weighted Assets Ratio The Tier 1 common equity to
risk-weighted assets ratio is calculated by dividing (a) Tier 1 capital
less non-common elements including qualifying perpetual preferred stock
and qualifying trust preferred securities by (b) risk-weighted assets,
which assets are calculated in accordance with current applicable bank
regulatory requirements (Basel 1). The Tier 1 common equity ratio is not
required by GAAP or on a recurring basis by applicable bank regulatory
requirements. Management is currently monitoring this ratio, along with
the other ratios discussed above, in evaluating the Corporation’s
capital levels and believes that, at this time, the ratio may be of
interest to investors. (Dollars in thousands)December 31,September
30,June 30,March 31,December 31,20132013201320132012Total equity -
GAAP1,215,858$ 1,220,593$ 1,222,328$ 1,403,999$ 1,485,023$ Qualifying
preferred stock(63,047)(63,047)(63,047)(63,047)(63,047)Unrealized loss
(gain) on available-for-sale securities (1)78,734 58,485 40,142 (19,868)
(28,476) Disallowed deferred tax asset (2)- (43) - - -
Goodwill(28,098)(28,098)(28,098)(28,098)(28,098)Core deposit
intangible(6,981)(7,570)(8,158)(8,746)(9,335)Other disallowed assets(23)
(410) (569) (2,515) (4,032) Tier 1 common equity $ 1,196,443 $ 1,179,910
$ 1,162,598 $ 1,281,725 $ 1,352,035 Total risk-weighted assets $
9,405,802 $ 9,402,910 $ 9,467,699 $ 9,721,502 $ 9,933,719 Tier 1 common
equity to risk-weighted assets ratio12.72%12.55%12.28%13.18%13.61%1-
Tier 1 capital excludes net unrealized gains (losses) on
available-for-sale debt securities and net unrealized gains on
available-for-sale equity securities with readily determinable fair
values, in accordance with regulatory risk-based capital guidelines. In
arriving at Tier 1 capital, institutions are required to deduct net
unrealized losses on available-for-sale equity securities with readily
determinable fair values, net of tax.2- Approximately $7.9 million of
the Corporation's deferred tax assets as of December 31, 2013 (September
30, 2013 - $7.7 million; June 30, 2013 - $10 million; March 31, 2013 -
$10 million; December 31, 2012 - $11 million) was included without
limitation in regulatory capital pursuant to the risk-based capital
guidelines, while approximately $0 of such assets as of December 31,
2013 (September 30, 2013 - $43 thousand; June 30, 2013 - $0; March 31,
2013 - $0; December 31, 2012 - $0) exceeded the limitation imposed by
these guidelines and, as "disallowed deferred tax assets," was deducted
in arriving at Tier 1 capital. According to regulatory capital
guidelines, the deferred tax assets that are dependent upon future
taxable income are limited for inclusion in Tier 1 capital to the lesser
of: (i) the amount of such deferred tax asset that the entity expects to
realize within one year of the calendar quarter-end date, based on its
projected future taxable income for that year, or (ii) 10% of the amount
of the entity's Tier 1 capital. Approximately $0.3 million of the
Corporation's other net deferred tax liability as of December 31, 2013
(September 30, 2013 - $0.3 million; June 30, 2013 - $3 million; March
31, 2013 - $6 million; December 31, 2012 - $6 million) represented
primarily the deferred tax effects of unrealized gains and losses on
available-for-sale debt securities, which are permitted to be excluded
prior to deriving the amount of net deferred tax assets subject to
limitation under the guide lines. As of Tier 1 Common Equity:
Use of Non-GAAP
Financial Measures Basis of Presentation - Use of Non-GAAP Financial
Measures This presentation contains non-GAAP financial measures.
Non-GAAP financial measures are set forth when management believes they
will be helpful to an understanding of the Corporation’s results of
operations or financial position. Where non-GAAP financial measures are
used, the comparable GAAP financial measure, as well as the
reconciliation to the comparable GAAP financial measure, can be found in
the text or in the attached tables to the earnings release. Tier 1
Common Equity to Risk-Weighted Assets Ratio The Tier 1 common equity to
risk-weighted assets ratio is calculated by dividing (a) Tier 1 capital
less non-common elements including qualifying perpetual preferred stock
and qualifying trust preferred securities by (b) risk-weighted assets,
which assets are calculated in accordance with current applicable bank
regulatory requirements (Basel 1). The Tier 1 common equity ratio is not
required by GAAP or on a recurring basis by applicable bank regulatory
requirements. Management is currently monitoring this ratio, along with
the other ratios discussed above, in evaluating the Corporation’s
capital levels and believes that, at this time, the ratio may be of
interest to investors. (Dollars in thousands)December 31,September
30,June 30,March 31,December 31,20132013201320132012Total equity -
GAAP1,215,858$ 1,220,593$ 1,222,328$ 1,403,999$ 1,485,023$ Qualifying
preferred stock(63,047)(63,047)(63,047)(63,047)(63,047)Unrealized loss
(gain) on available-for-sale securities (1)78,734 58,485 40,142 (19,868)
(28,476) Disallowed deferred tax asset (2)- (43) - - -
Goodwill(28,098)(28,098)(28,098)(28,098)(28,098)Core deposit
intangible(6,981)(7,570)(8,158)(8,746)(9,335)Other disallowed assets(23)
(410) (569) (2,515) (4,032) Tier 1 common equity $ 1,196,443 $ 1,179,910
$ 1,162,598 $ 1,281,725 $ 1,352,035 Total risk-weighted assets $
9,405,802 $ 9,402,910 $ 9,467,699 $ 9,721,502 $ 9,933,719 Tier 1 common
equity to risk-weighted assets ratio12.72%12.55%12.28%13.18%13.61%1-
Tier 1 capital excludes net unrealized gains (losses) on
available-for-sale debt securities and net unrealized gains on
available-for-sale equity securities with readily determinable fair
values, in accordance with regulatory risk-based capital guidelines. In
arriving at Tier 1 capital, institutions are required to deduct net
unrealized losses on available-for-sale equity securities with readily
determinable fair values, net of tax.2- Approximately $7.9 million of
the Corporation's deferred tax assets as of December 31, 2013 (September
30, 2013 - $7.7 million; June 30, 2013 - $10 million; March 31, 2013 -
$10 million; December 31, 2012 - $11 million) was included without
limitation in regulatory capital pursuant to the risk-based capital
guidelines, while approximately $0 of such assets as of December 31,
2013 (September 30, 2013 - $43 thousand; June 30, 2013 - $0; March 31,
2013 - $0; December 31, 2012 - $0) exceeded the limitation imposed by
these guidelines and, as "disallowed deferred tax assets," was deducted
in arriving at Tier 1 capital. According to regulatory capital
guidelines, the deferred tax assets that are dependent upon future
taxable income are limited for inclusion in Tier 1 capital to the lesser
of: (i) the amount of such deferred tax asset that the entity expects to
realize within one year of the calendar quarter-end date, based on its
projected future taxable income for that year, or (ii) 10% of the amount
of the entity's Tier 1 capital. Approximately $0.3 million of the
Corporation's other net deferred tax liability as of December 31, 2013
(September 30, 2013 - $0.3 million; June 30, 2013 - $3 million; March
31, 2013 - $6 million; December 31, 2012 - $6 million) represented
primarily the deferred tax effects of unrealized gains and losses on
available-for-sale debt securities, which are permitted to be excluded
prior to deriving the amount of net deferred tax assets subject to
limitation under the guide lines. As of Tier 1 Common Equity:
 Use of Non-GAAP
Financial Measures Basis of Presentation - Use of Non-GAAP Financial
Measures This presentation contains non-GAAP financial measures.
Non-GAAP financial measures are set forth when management believes they
will be helpful to an understanding of the Corporation’s results of
operations or financial position. Where non-GAAP financial measures are
used, the comparable GAAP financial measure, as well as the
reconciliation to the comparable GAAP financial measure, can be found in
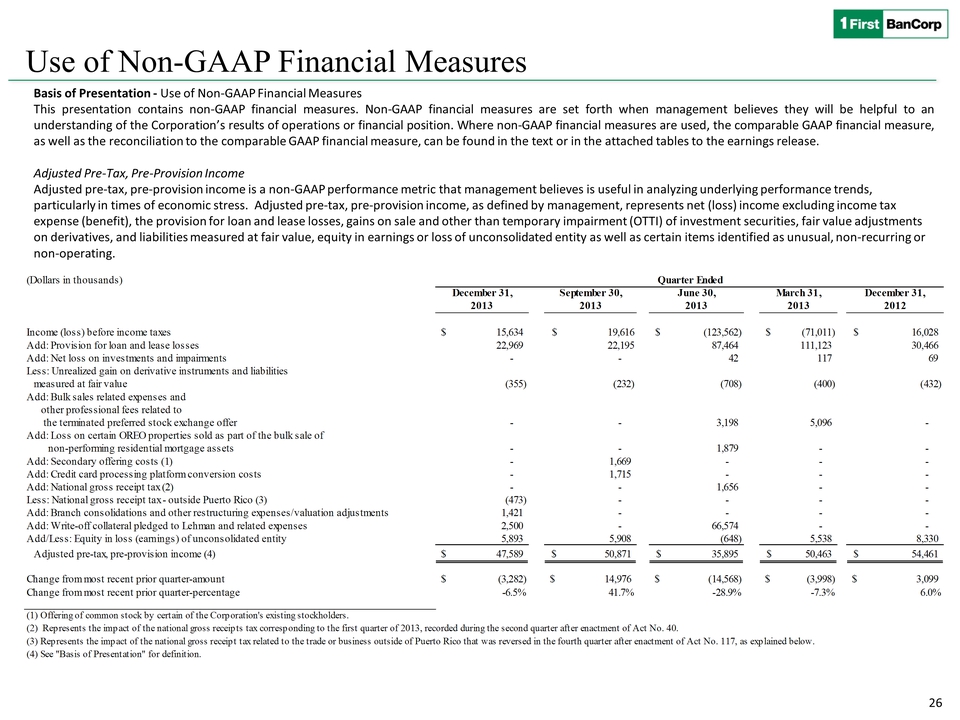
the text or in the attached tables to the earnings release. Adjusted
Pre-Tax, Pre-Provision Income Adjusted pre-tax, pre-provision income is
a non-GAAP performance metric that management believes is useful in
analyzing underlying performance trends, particularly in times of
economic stress. Adjusted pre-tax, pre-provision income, as defined by
management, represents net (loss) income excluding income tax expense
(benefit), the provision for loan and lease losses, gains on sale and
other than temporary impairment (OTTI) of investment securities, fair
value adjustments on derivatives, and liabilities measured at fair
value, equity in earnings or loss of unconsolidated entity as well as
certain items identified as unusual, non-recurring or non-operating. In
addition, from time to time, adjusted pre-tax, pre-provision income will
reflect the omission of revenue or expenses items that management judges
to be outside of ordinary banking activities and/or of items that, while
they may be associated with ordinary banking activities, are so
unusually large that management believes that a complete analysis of the
Corporation’s performance requires consideration also of adjusted
pre-tax, pre-provision income that excludes such amounts. (Dollars in
thousands)December 31,September 30,June 30,March 31,December
31,20132013201320132012Income (loss) before income taxes 15,634$ $
19,616 (123,562)$ (71,011)$ 16,028$ Add: Provision for loan and lease
losses22,969 22,19587,464 111,123 30,466 Add: Net loss on investments
and impairments- - 42 117 69 Less: Unrealized gain on derivative
instruments and liabilities measured at fair value(355) (232) (708)
(400) (432) Add: Bulk sales related expenses and other professional fees
related to the terminated preferred stock exchange offer - - 3,198 5,096
- Add: Loss on certain OREO properties sold as part of the bulk sale of
non-performing residential mortgage assets - - 1,879 - - Add: Secondary
offering costs (1)- 1,669 - - - Add: Credit card processing platform
conversion costs- 1,715 - - - Add: National gross receipt tax (2)- -
1,656 - - Less: National gross receipt tax - outside Puerto Rico
(3)(473) - - - - Add: Branch consolidations and other restructuring
expenses/valuation adjustments1,421 - - - - Add: Write-off collateral
pledged to Lehman and related expenses2,500 - 66,574 - - Add/Less:
Equity in loss (earnings) of unconsolidated entity5,893 5,908 (648)
5,538 8,330 Adjusted pre-tax, pre-provision income (4)47,589$ 50,871$
35,895$ 50,463$ 54,461$ Change from most recent prior
quarter-amount(3,282)$ 14,976$ (14,568)$ (3,998)$ 3,099$ Change from
most recent prior quarter-percentage-6.5%41.7%-28.9%-7.3%6.0%(1)
Offering of common stock by certain of the Corporation's existing
stockholders.(2) Represents the impact of the national gross receipts
tax corresponding to the first quarter of 2013, recorded during the
second quarter after enactment of Act No. 40.(3) Represents the impact
of the national gross receipt tax related to the trade or business
outside of Puerto Rico that was reversed in the fourth quarter after
enactment of Act No. 117, as explained below.(4) See "Basis of
Presentation" for definition. Quarter Ended
Use of Non-GAAP
Financial Measures Basis of Presentation - Use of Non-GAAP Financial
Measures This presentation contains non-GAAP financial measures.
Non-GAAP financial measures are set forth when management believes they
will be helpful to an understanding of the Corporation’s results of
operations or financial position. Where non-GAAP financial measures are
used, the comparable GAAP financial measure, as well as the
reconciliation to the comparable GAAP financial measure, can be found in
the text or in the attached tables to the earnings release. Adjusted
Pre-Tax, Pre-Provision Income Adjusted pre-tax, pre-provision income is
a non-GAAP performance metric that management believes is useful in
analyzing underlying performance trends, particularly in times of
economic stress. Adjusted pre-tax, pre-provision income, as defined by
management, represents net (loss) income excluding income tax expense
(benefit), the provision for loan and lease losses, gains on sale and
other than temporary impairment (OTTI) of investment securities, fair
value adjustments on derivatives, and liabilities measured at fair
value, equity in earnings or loss of unconsolidated entity as well as
certain items identified as unusual, non-recurring or non-operating. In
addition, from time to time, adjusted pre-tax, pre-provision income will
reflect the omission of revenue or expenses items that management judges
to be outside of ordinary banking activities and/or of items that, while
they may be associated with ordinary banking activities, are so
unusually large that management believes that a complete analysis of the
Corporation’s performance requires consideration also of adjusted
pre-tax, pre-provision income that excludes such amounts. (Dollars in
thousands)December 31,September 30,June 30,March 31,December
31,20132013201320132012Income (loss) before income taxes 15,634$ $
19,616 (123,562)$ (71,011)$ 16,028$ Add: Provision for loan and lease
losses22,969 22,19587,464 111,123 30,466 Add: Net loss on investments
and impairments- - 42 117 69 Less: Unrealized gain on derivative
instruments and liabilities measured at fair value(355) (232) (708)
(400) (432) Add: Bulk sales related expenses and other professional fees
related to the terminated preferred stock exchange offer - - 3,198 5,096
- Add: Loss on certain OREO properties sold as part of the bulk sale of
non-performing residential mortgage assets - - 1,879 - - Add: Secondary
offering costs (1)- 1,669 - - - Add: Credit card processing platform
conversion costs- 1,715 - - - Add: National gross receipt tax (2)- -
1,656 - - Less: National gross receipt tax - outside Puerto Rico
(3)(473) - - - - Add: Branch consolidations and other restructuring
expenses/valuation adjustments1,421 - - - - Add: Write-off collateral
pledged to Lehman and related expenses2,500 - 66,574 - - Add/Less:
Equity in loss (earnings) of unconsolidated entity5,893 5,908 (648)
5,538 8,330 Adjusted pre-tax, pre-provision income (4)47,589$ 50,871$
35,895$ 50,463$ 54,461$ Change from most recent prior
quarter-amount(3,282)$ 14,976$ (14,568)$ (3,998)$ 3,099$ Change from
most recent prior quarter-percentage-6.5%41.7%-28.9%-7.3%6.0%(1)
Offering of common stock by certain of the Corporation's existing
stockholders.(2) Represents the impact of the national gross receipts
tax corresponding to the first quarter of 2013, recorded during the
second quarter after enactment of Act No. 40.(3) Represents the impact
of the national gross receipt tax related to the trade or business
outside of Puerto Rico that was reversed in the fourth quarter after
enactment of Act No. 117, as explained below.(4) See "Basis of
Presentation" for definition. Quarter Ended