Exhibit 99.1

MFA FINANCIAL, INC.
One Vanderbilt Ave
New York, New York 10017
| PRESS RELEASE | FOR IMMEDIATE RELEASE | |
| August 4, 2022 | NEW YORK METRO |
| INVESTOR CONTACT: | InvestorRelations@mfafinancial.com | NYSE: MFA |
| 212-207-6488 | ||
| www.mfafinancial.com | ||
| MEDIA CONTACT: | Abernathy MacGregor | |
| Tom Johnson | ||
| 212-371-5999 |
MFA Financial, Inc. Announces Second Quarter 2022 Financial Results
NEW YORK - MFA Financial, Inc. (NYSE:MFA) today provided its financial results for the second quarter ended June 30, 2022.
Second Quarter 2022 financial results update:
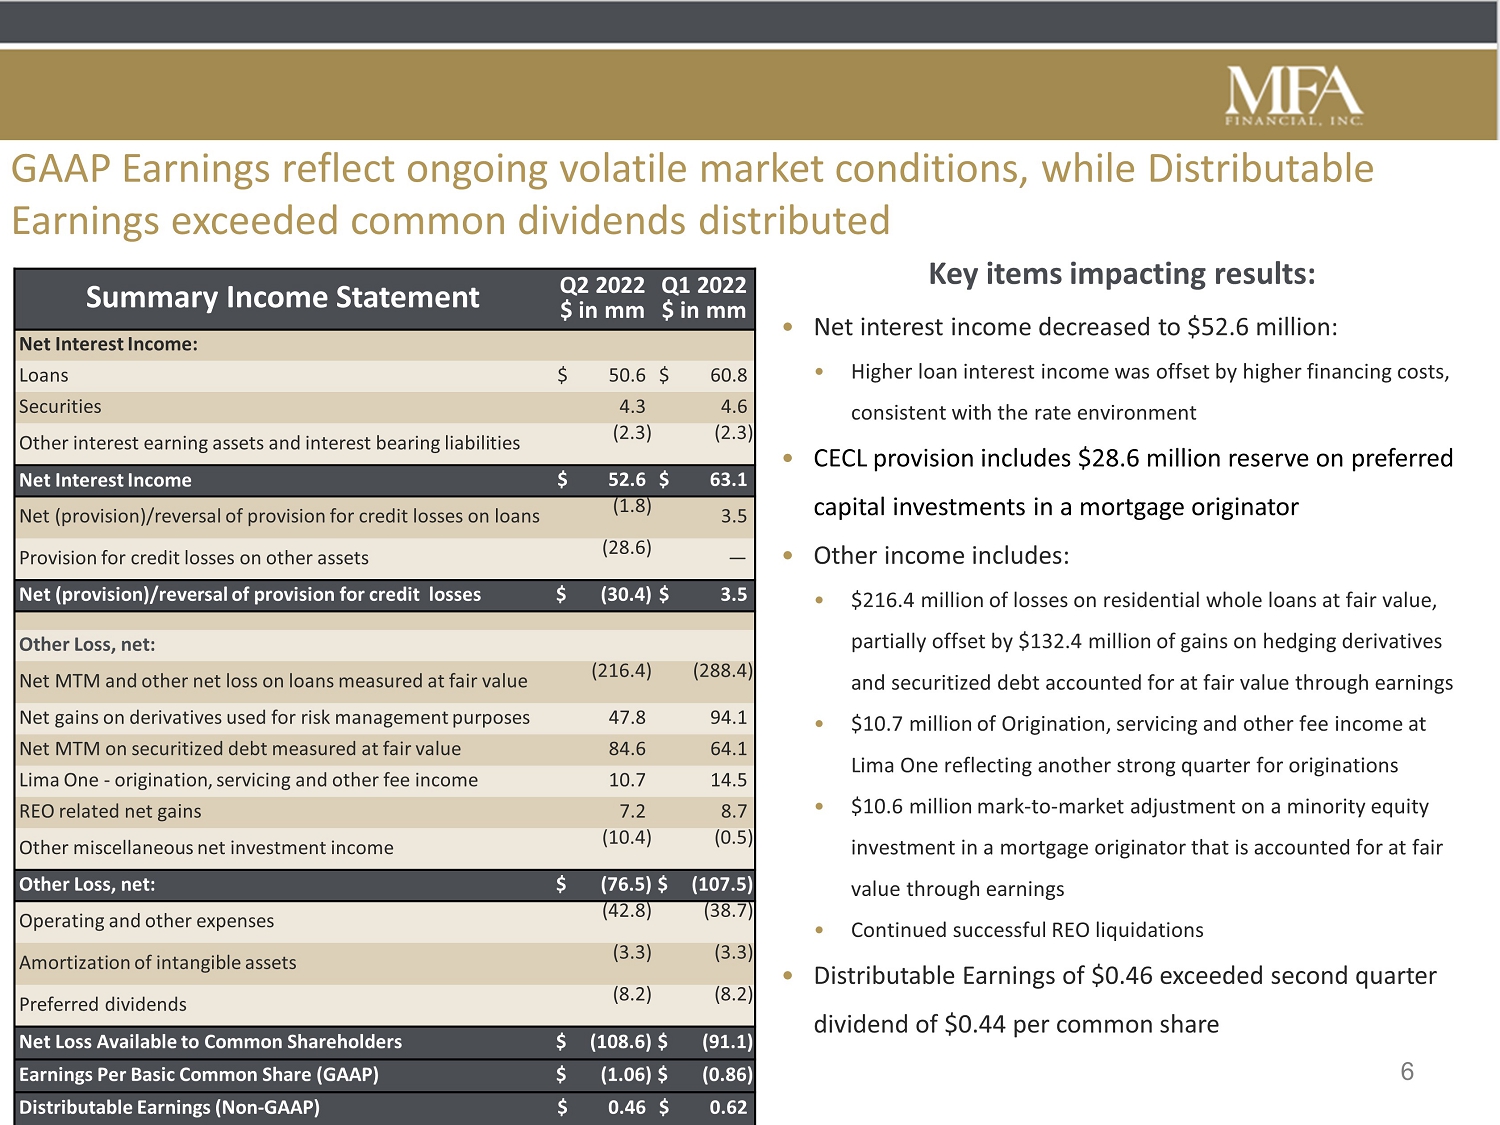
| · | MFA generated a GAAP loss for the second quarter of ($108.6) million, or ($1.06) per common share1. Distributable Earnings, a non-GAAP financial measure, was $47.2 million, or $0.46 per common share. |
| · | GAAP book value at June 30, 2022 was $16.42 per common share, while Economic book value, a non-GAAP financial measure of MFA’s financial position, was $17.25 per common share at quarter-end. |
| · | Continued increases in interest rates and wider spreads resulted in losses on our residential whole loans that are measured at fair value through earnings of $216.4 million. This was partially offset by unrealized gains on securitized debt measured at fair value through earnings as well as gains on derivatives used for risk management purposes totaling $132.4 million. |
| 1 | For all periods presented all per share amounts and common shares outstanding have been adjusted to reflect the Company’s 1-for-4 reverse stock split which was effected following the close of business on April 4, 2022. |
1
| · | Net interest income for the second quarter was $52.6 million. Interest income from residential whole loans increased 3% over the immediately prior quarter to $102.4 million. Interest expense was $13.4 million higher than the immediately prior quarter, consistent with the rising rate environment, which impacted both repurchase agreement funding and securitization execution. For the second quarter, the overall net interest spread generated by all of our interest-bearing assets, including the carrying cost associated with swaps used for economic hedging purposes, was 1.37%. |
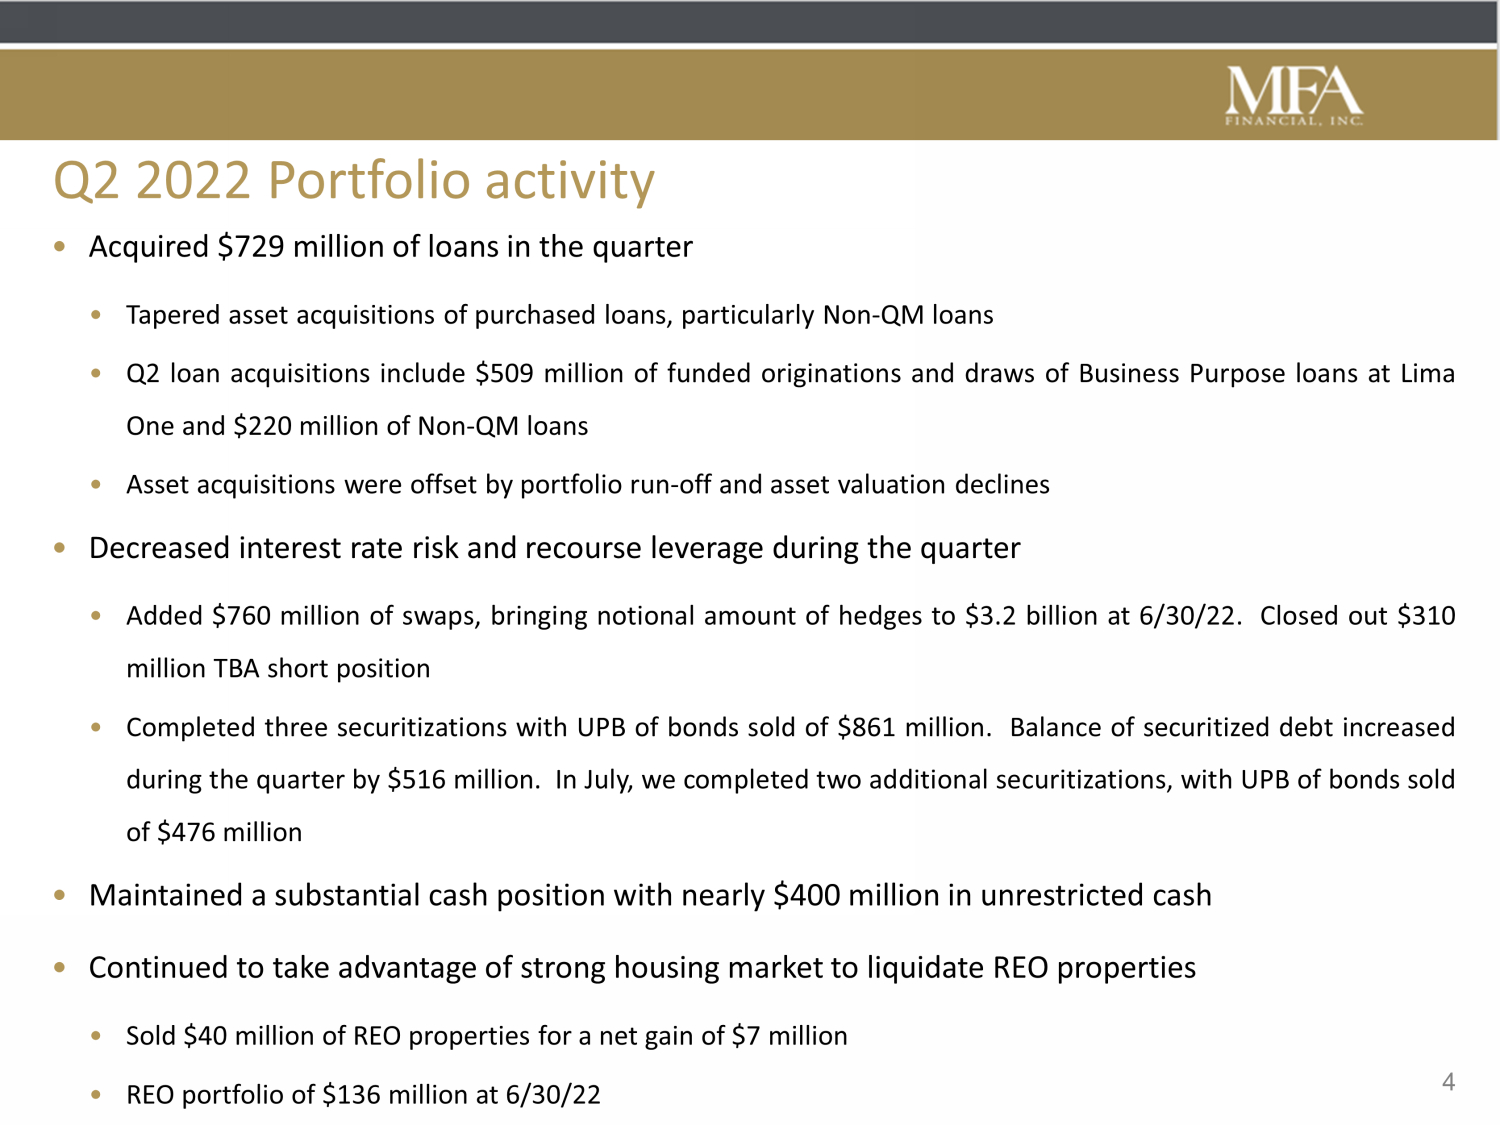
| · | During the quarter, we completed two securitizations of Business Purpose loans, totaling $509.5 million, including our first securitization of approximately $250.0 million of Rehabilitation loans. We also completed another securitization of Non-QM loans totaling $540.7 million, providing longer term, non-recourse, non-mark-to-market financing. In connection with these transactions, we generated additional liquidity of $58.2 million. Subsequent to quarter end we completed two additional securitizations totaling $550.2 million, further reducing our use of recourse, mark-to-market financing. |
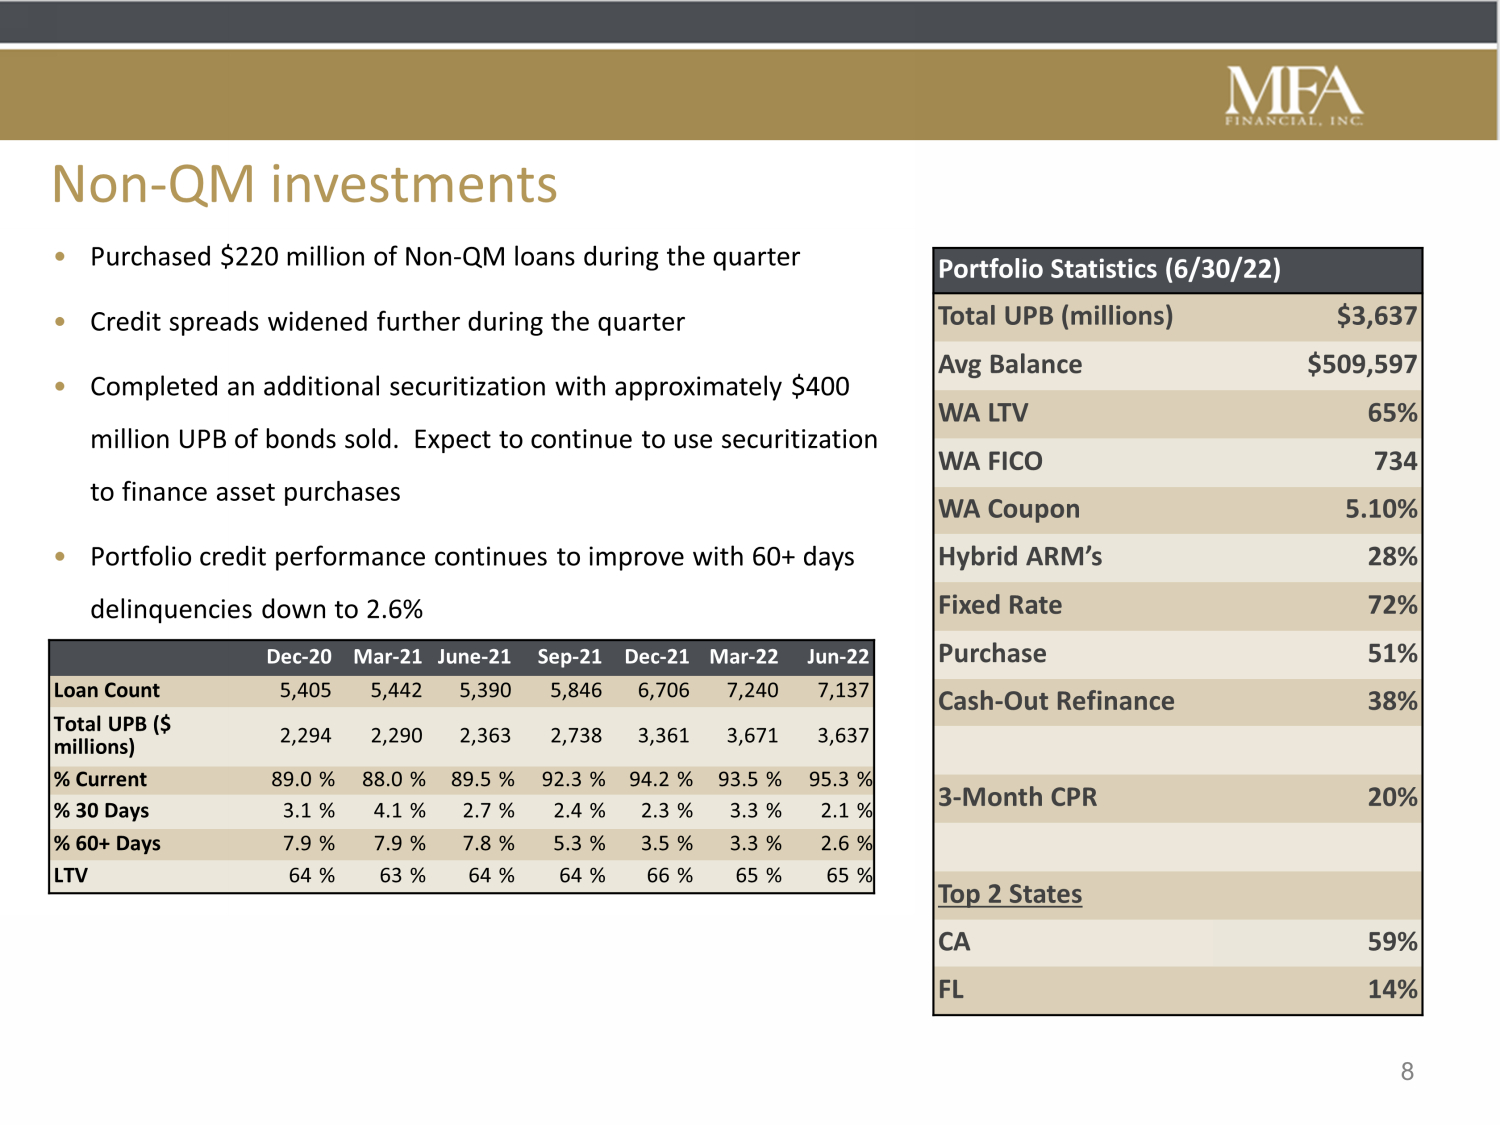
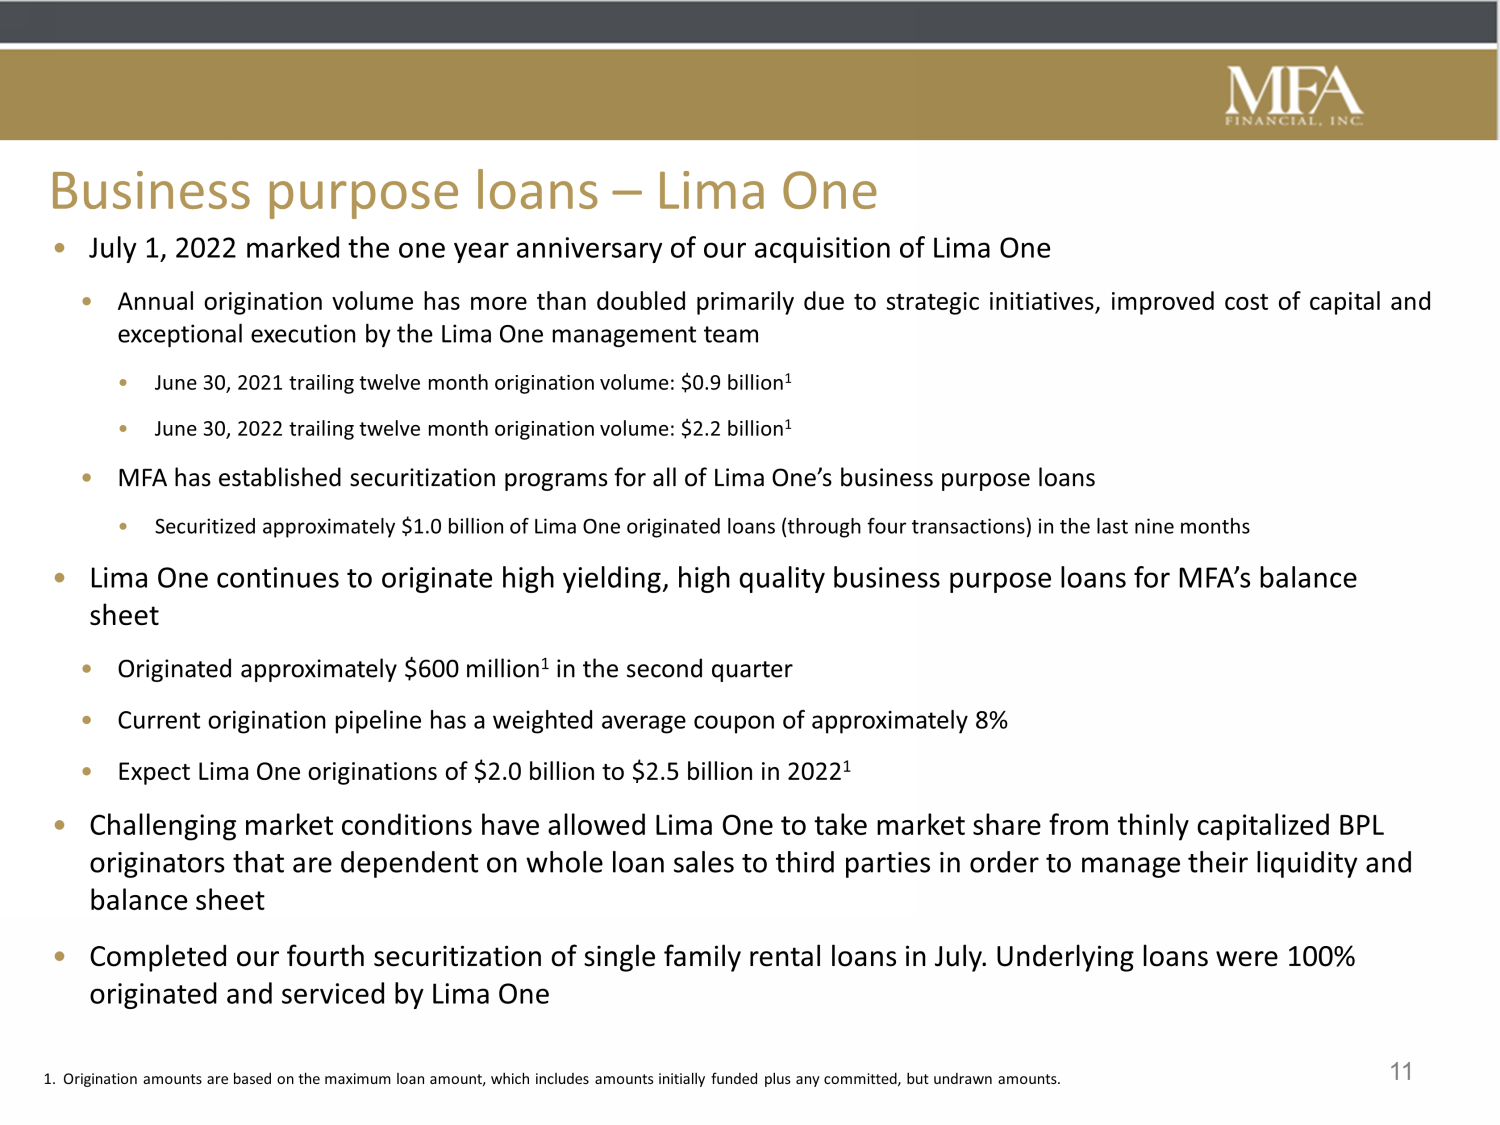
| · | Loan acquisition activity of $728.6 million included $508.5 million of funded originations (including draws on Rehabilitation loans) of Business Purpose loans (approximately $600 million maximum loan amount inclusive of undrawn amounts) and $220.1 million of Non-QM loan acquisitions. |
| · | On July 29, 2022, MFA paid a regular cash dividend for the second quarter of $0.44 per share of common stock. |
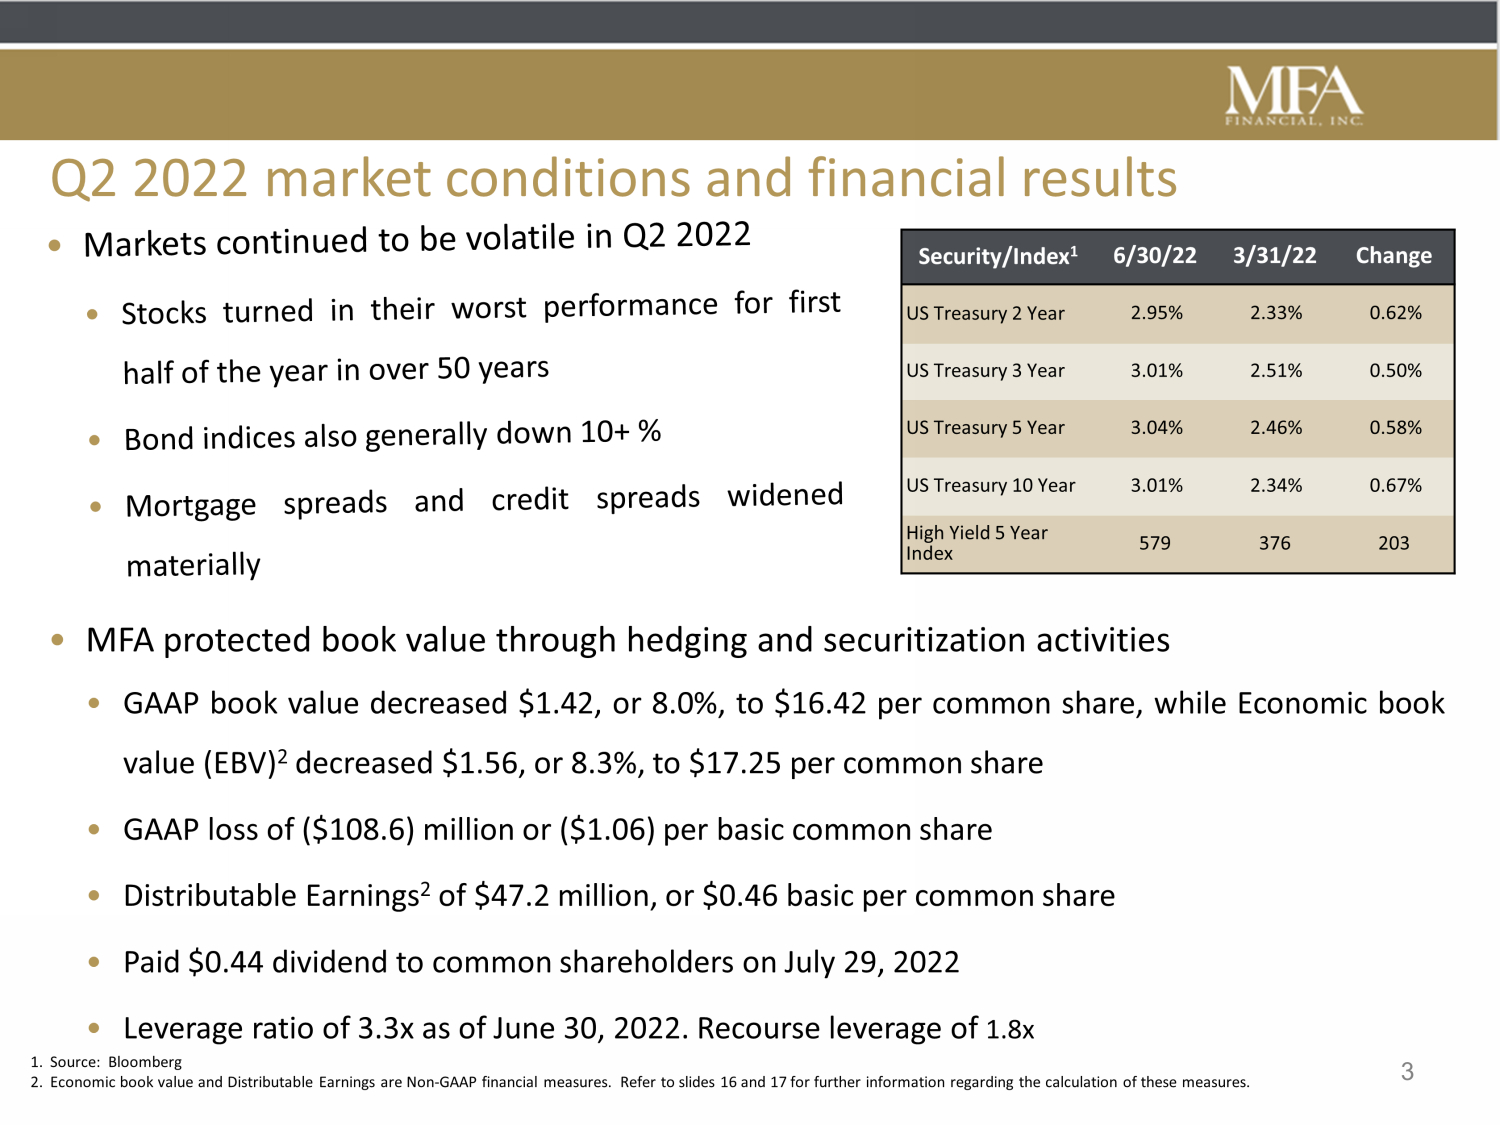
Commenting on the second quarter, Craig Knutson, MFA’s CEO and President said, “The second quarter of 2022 was an extremely challenging period across all financial markets. The S&P 500 Index was down over 16% in the second quarter and posted its worst first half of the year in more than 50 years. Bond markets continued to sell off after a difficult first quarter and bond indices are generally down over 10% year-to-date. Mortgage spreads widened materially as did credit spreads, with high yield corporates wider by almost 300 basis points year-to-date. Through this difficult period, our team at MFA has protected book value and preserved capital as we wait for more favorable market conditions. Mortgage REIT book values are down substantially since the beginning of 2022, and while MFA has certainly not been immune to these forces, our book value performance has been better than most in the peer group. We proactively addressed these market challenges beginning late last year in an effort to hedge our exposure to interest rate risk and marshal liquidity. Our interest rate swap position, which was $900 million at the beginning of 2022, is now $3.2 billion as we actively managed our hedge position through the rate cycle, and the floating receive leg of these swaps now exceeds the fixed pay leg by over 50 basis points. Despite difficult market conditions, we have continued to execute securitizations, which fix and term out our financing for our loan portfolio while generating more liquidity. Lima One has been able to take advantage of market disruptions that have made it difficult for competitors who rely on loan sales to third-parties. The current origination pipeline has a weighted average coupon of approximately 8%. We slowed our new investment activity in Non-QM loans further in the second quarter, given the uncertainty around rates and credit spreads.
Mr. Knutson added, “During the quarter we maintained a substantial cash position and closed the quarter with nearly $400 million in unrestricted cash. Despite ongoing declines in residential loan valuations, our strategy of maintaining an under borrowing cushion on our mark-to-market financings resulted in minimal margin call requests. Overall leverage increased slightly, mainly due to declines in asset values, but remains relatively low at 3.3 times debt to equity. Excluding securitized debt, our recourse leverage is 1.8 times debt to equity. We reported a GAAP loss of ($1.06) per common share in the second quarter, as earnings were negatively impacted by market value decreases in our loan portfolio held at fair value. Our GAAP book value decreased $1.42, or 8.0%, to $16.42 per share, and our Economic book value declined $1.56 or 8.3% to $17.25 per share. Distributable Earnings, a non-GAAP metric intended to provide a measure of earnings that primarily eliminates non-cash, unrealized gains and losses that impact our GAAP earnings, were $47.2 million or $0.46 per common share.”
2
Q2 2022 Portfolio Activity
MFA’s residential mortgage investment portfolio decreased by $85.0 million during the second quarter. Loan acquisitions of $728.6 million, including $508.5 million of funded originations (including draws on Rehabilitation loans) of Business Purpose loans and $220.1 million of Non-QM loan acquisitions, were largely offset by portfolio run-off and asset valuation declines.
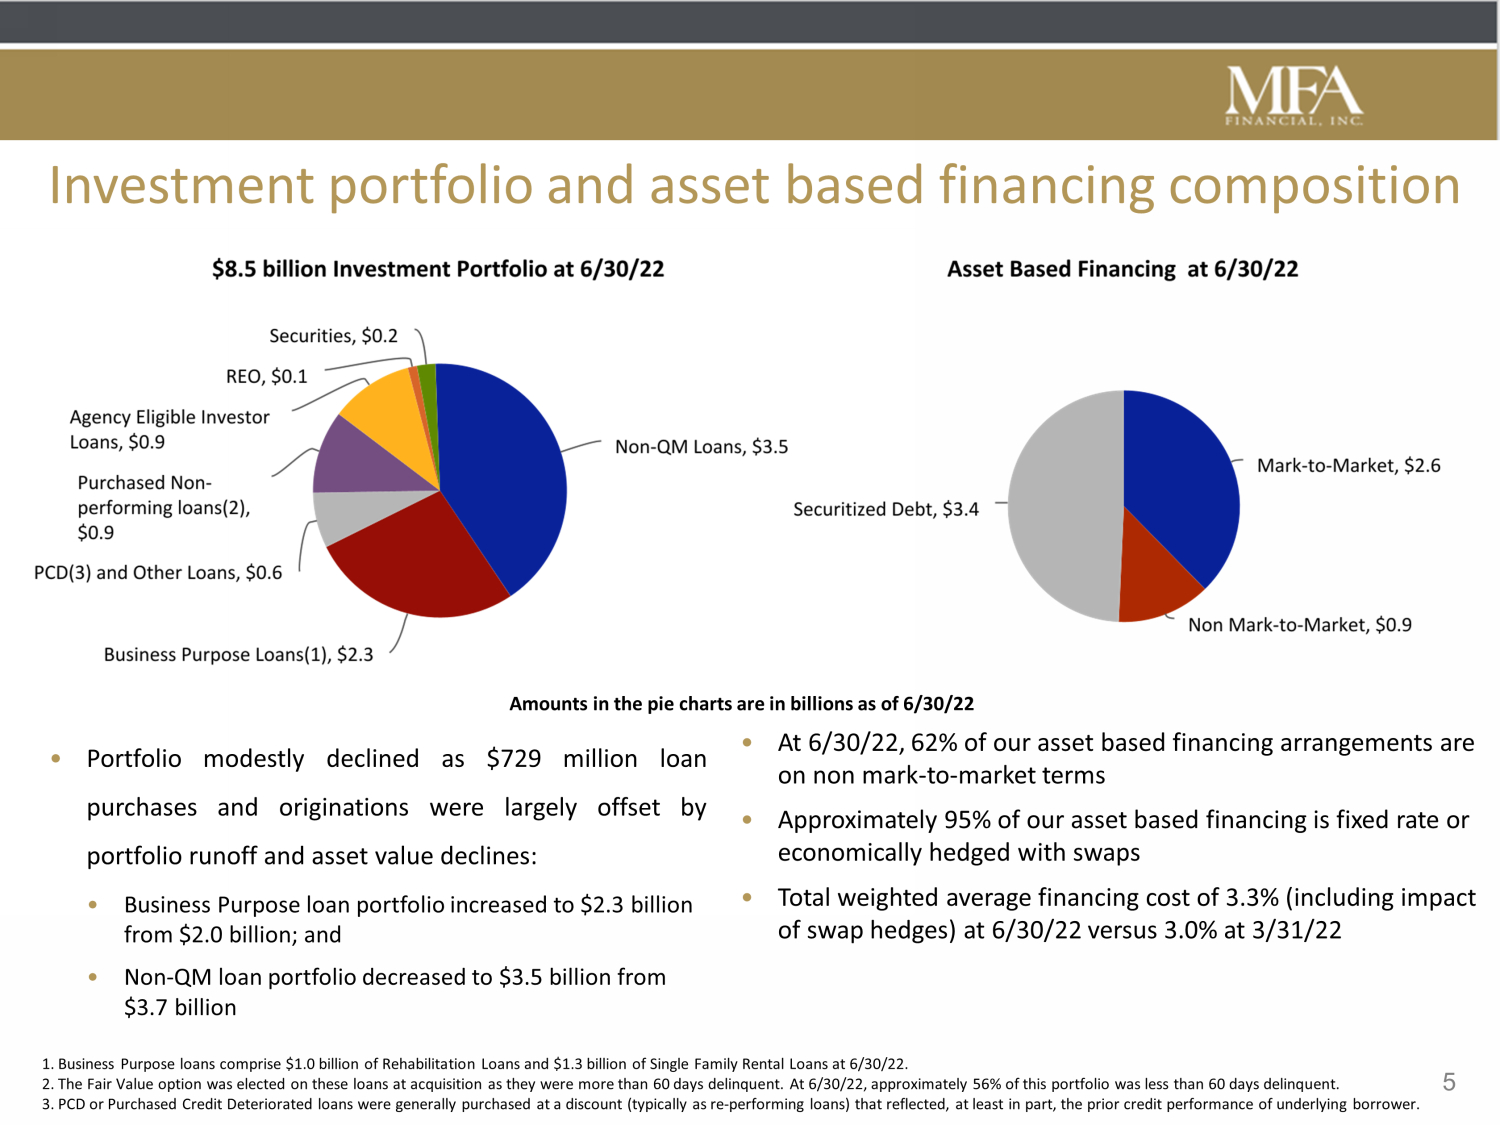
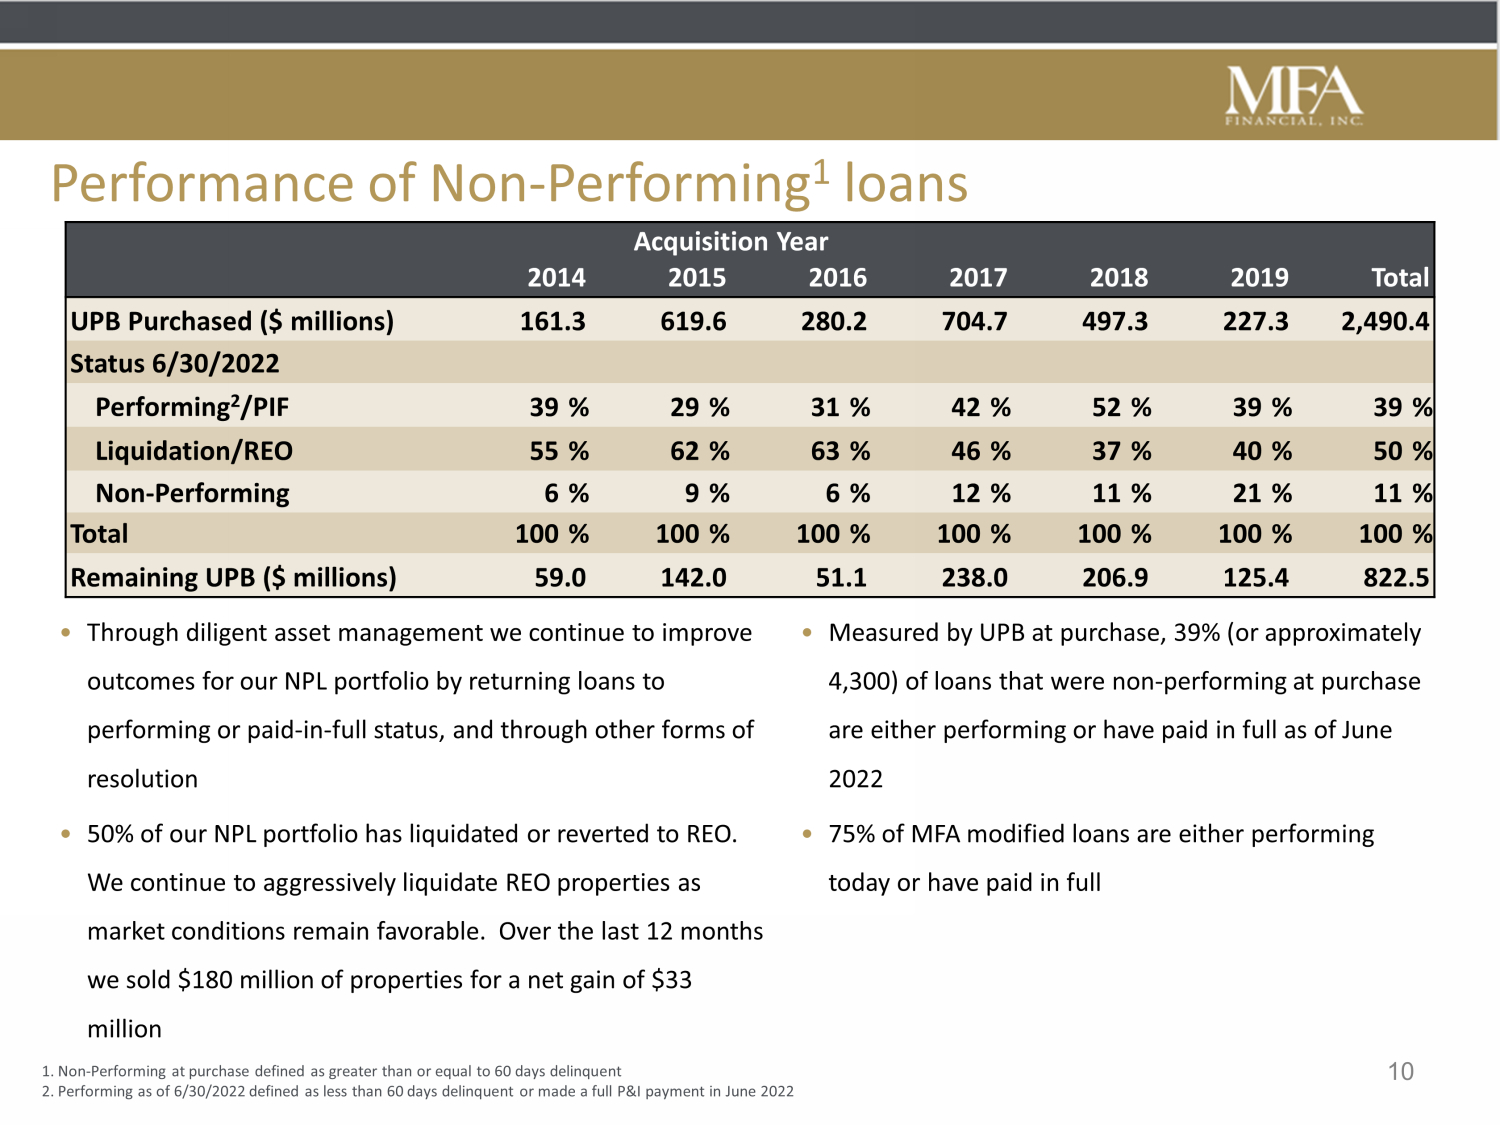
At June 30, 2022, our investments in residential whole loans totaled $8.2 billion. Of this amount, $6.8 billion are Purchased Performing Loans, $474.9 million are Purchased Credit Deteriorated Loans and $922.1 million are Purchased Non-performing Loans. During the quarter, we recognized approximately $102.4 million of Interest Income on residential whole loans in our consolidated statements of operations, representing a yield of 4.85%. Purchased Performing Loans generated a yield of 4.20%, Purchased Credit Deteriorated Loans generated a yield of 6.85% and Purchased Non-performing Loans generated a yield of 9.40%. Interest income from our residential whole loan portfolio increased on a sequential quarter basis by almost 3% and overall delinquency rates across all loan products in our Purchased Performing Loan portfolio were lower than the prior quarter. In addition, the amount of Purchased Credit Deteriorated Loans that were 90 or more days delinquent, measured as a percentage of the unpaid principal balance, decreased from 18.3% at March 31, 2022 to 17.7% at June 30, 2022. The percentage amount of Purchased Non-performing Loans that were 90 or more days delinquent decreased to 41.8% at June 30, 2022 from 43.0% at March 31, 2022.
Lima One had another strong quarter, funding more than $425.2 million of business purpose loans with a maximum loan amount of approximately $600 million, and generating approximately $10.7 million of origination, servicing, and other fee income.
For the second quarter, a provision for credit losses of $1.8 million was recorded on residential whole loans held at carrying value, primarily reflecting adjustments to lower future estimates of prepayment speeds given recent and expected future increases in market interest rates, partially offset by the run-off of loans held at carrying value. The total allowance for credit losses recorded on residential whole loans held at carrying value at June 30, 2022 was $36.9 million. In addition, we recorded an impairment charge in earnings of $28.6 million against the carrying value of our investment in one loan origination partner, bringing the net carrying value of our investment to zero at June 30, 2022.
3
During the second quarter we increased our position in interest rate swaps to a notional amount of $3.2 billion. At June 30, 2022, these swaps had a weighted average fixed pay interest rate of 1.69% and a weighted average variable receive interest rate of 1.50%. After including the impact of these swaps and other derivatives that have been entered into for economic hedging purposes, as well as the effect of securitized and other fixed rate debt, we estimate that the net effective duration of our investment portfolio at June 30, 2022 was 0.93.
Our Purchased Non-performing Loans and certain of our Purchased Performing Loans are measured at fair value as a result of the election of the fair value option at acquisition, with changes in the fair value and other non-interest related income from these loans recorded in Other income, net each period. For the second quarter, net losses of $216.4 million were recorded, primarily reflecting unrealized fair value changes in the underlying loans. These losses were partially offset by $47.8 million of gains on derivatives used for risk management purposes, as well as $84.6 million of mark-to-market gains on securitized debt held at fair value through earnings.
We also continued to take advantage of a strong housing market to reduce our REO portfolio, selling 124 properties in the second quarter for aggregate proceeds of $39.6 million and generating $7.3 million of gains. Our REO portfolio was $135.8 million at June 30, 2022, a 34% decrease since June 30, 2021.
At the end of the second quarter, MFA held $245.6 million of Securities, at fair value, including $152.9 million of MSR-related assets and $92.7 million of CRT securities.
General and Administrative and other expenses
For the three months ended June 30, 2022, MFA’s costs for compensation and benefits and other general and administrative expenses were $29.6 million. Expenses this quarter include $13.0 million of compensation and other general and administrative expenses recorded at Lima One.
Segment reporting
Included in this press release for the first time is information on our reportable segments, including GAAP Net Income and Distributable Earnings for each segment for the three month periods ended March 31 and June 30, 2022 and segment assets of December 31, 2021 and June 30, 2022.
4
The following table presents MFA’s asset allocation as of June 30, 2022, and the second quarter 2022 yield on average interest-earning assets, average cost of funds and net interest rate spread for the various asset types.
Table 1 - Asset Allocation
| At June 30, 2022 | Purchased Performing Loans (1) | Purchased Credit Deteriorated Loans (2) | Purchased Non-Performing Loans | Securities, at fair value | Real Estate Owned | Other, net (3) | Total | |||||||||||||||||||||
| (Dollars in Millions) | ||||||||||||||||||||||||||||
| Fair Value/Carrying Value | $ | 6,794 | $ | 475 | $ | 922 | $ | 246 | $ | 136 | $ | 705 | $ | 9,278 | ||||||||||||||
| Financing Agreements with Non-mark-to-market Collateral Provisions | (589 | ) | (115 | ) | (192 | ) | — | (9 | ) | — | (905 | ) | ||||||||||||||||
| Financing Agreements with Mark-to-market Collateral Provisions | (2,223 | ) | (99 | ) | (129 | ) | (158 | ) | (16 | ) | — | (2,625 | ) | |||||||||||||||
| Less Securitized Debt | (2,904 | ) | (177 | ) | (275 | ) | — | (19 | ) | — | (3,375 | ) | ||||||||||||||||
| Less Convertible Senior Notes | — | — | — | — | — | (227 | ) | (227 | ) | |||||||||||||||||||
| Net Equity Allocated | $ | 1,078 | $ | 84 | $ | 326 | $ | 88 | $ | 92 | $ | 478 | $ | 2,146 | ||||||||||||||
| Debt/Net Equity Ratio (4) | 5.3 | x | 4.7 | x | 1.8 | x | 1.8 | x | 0.5 | x | 3.3 | x | ||||||||||||||||
| For the Quarter Ended June 30, 2022 | ||||||||||||||||||||||||||||
| Yield on Average Interest Earning Assets (5) | 4.20 | % | 6.85 | % | 9.40 | % | 10.09 | % | N/A | 4.75 | % | |||||||||||||||||
| Less Average Cost of Funds (6) | (3.28 | ) | (3.17 | ) | (3.34 | ) | (2.54 | ) | (3.41 | ) | (3.38 | ) | ||||||||||||||||
| Net Interest Rate Spread | 0.92 | % | 3.68 | % | 6.06 | % | 7.55 | % | (3.41 | )% | 1.37 | % | ||||||||||||||||
| (1) | Includes $3.5 billion of Non-QM loans, $1.0 billion of Rehabilitation loans, $1.3 billion of Single-family rental loans, $92.9 million of Seasoned performing loans, and $912.2 million of Agency eligible investor loans. At June 30, 2022, the total fair value of these loans is estimated to be approximately $6.7 billion. |
| (2) | At June 30, 2022, the total fair value of these loans is estimated to be approximately $528.4 million. |
| (3) | Includes $385.6 million of cash and cash equivalents, $159.7 million of restricted cash, and $32.0 million of capital contributions made to loan origination partners, as well as other assets and other liabilities. |
| (4) | Total Debt/Net Equity ratio represents the sum of borrowings under our financing agreements noted above as a multiple of net equity allocated. |
| (5) | Yields reported on our interest earning assets are calculated based on the interest income recorded and the average amortized cost for the quarter of the respective asset. At June 30, 2022, the amortized cost of our securities, at fair value, was $211.3 million. In addition, the yield for residential whole loans was 4.83%, net of two basis points of servicing fee expense incurred during the quarter. For GAAP reporting purposes, such expenses are included in Loan servicing and other related operating expenses in our statement of operations. |
| (6) | Average cost of funds includes interest on financing agreements, Convertible Senior Notes and securitized debt. Cost of funding also includes the impact of the net carrying cost (the amount by which swap interest expense paid exceeds swap interest income received) on our Swaps. While we have not elected hedge accounting treatment for Swaps and accordingly the net carrying cost is not presented in interest expense in our consolidated statement of operations, we believe it is appropriate to allocate the net carrying cost to the cost of funding to reflect the economic impact of our interest rate swap agreements (or Swaps) on the funding costs shown in the table above. For the quarter ended June 30, 2022, this increased the overall funding cost by 25 basis points for our Residential whole loans, 23 basis points for our Purchased Performing Loans, 43 basis points for our Purchased Credit Deteriorated Loans, and 29 basis points for our Purchased Non-Performing Loans. |
5
The following table presents the activity for our residential mortgage asset portfolio for the three months ended June 30, 2022:
Table 2 - Investment Portfolio Activity Q2 2022
| (In Millions) | March 31, 2022 | Runoff (1) | Acquisitions (2) | Other (3) | June 30, 2022 | Change | ||||||||||||||||||
| Residential whole loans and REO | $ | 8,407 | $ | (585 | ) | $ | 729 | $ | (225 | ) | $ | 8,326 | $ | (81 | ) | |||||||||
| Securities, at fair value | 250 | (1 | ) | — | (3 | ) | 246 | (4 | ) | |||||||||||||||
| Totals | $ | 8,657 | $ | (586 | ) | $ | 729 | $ | (228 | ) | $ | 8,572 | $ | (85 | ) | |||||||||
| (1) | Primarily includes principal repayments and sales of REO. |
| (2) | Includes draws on previously originated Rehabilitation loans. |
| (3) | Primarily includes changes in fair value and changes in the allowance for credit losses. |
The following tables present information on our investments in residential whole loans.
Table 3 - Portfolio composition
| Held at Carrying Value | Held at Fair Value | Total | ||||||||||||||||||||||
| (Dollars in Thousands) | June 30, 2022 | December 31, 2021 | June 30, 2022 | December 31, 2021 | June 30, 2022 | December 31, 2021 | ||||||||||||||||||
| Purchased Performing Loans: | ||||||||||||||||||||||||
| Non-QM loans | $ | 1,113,696 | $ | 1,448,162 | $ | 2,381,214 | $ | 2,013,369 | $ | 3,494,910 | $ | 3,461,531 | ||||||||||||
| Rehabilitation loans | 111,164 | 217,315 | 932,667 | 517,530 | 1,043,831 | 734,845 | ||||||||||||||||||
| Single-family rental loans | 247,129 | 331,808 | 1,016,109 | 619,415 | 1,263,238 | 951,223 | ||||||||||||||||||
| Seasoned performing loans | 92,909 | 102,041 | — | — | 92,909 | 102,041 | ||||||||||||||||||
| Agency eligible investor loans | — | — | 912,245 | 1,082,765 | 912,245 | 1,082,765 | ||||||||||||||||||
| Total Purchased Performing Loans | $ | 1,564,898 | $ | 2,099,326 | $ | 5,242,235 | $ | 4,233,079 | $ | 6,807,133 | $ | 6,332,405 | ||||||||||||
| Purchased Credit Deteriorated Loans | $ | 498,317 | $ | 547,772 | $ | — | $ | — | $ | 498,317 | $ | 547,772 | ||||||||||||
| Allowance for Credit Losses | $ | (36,927 | ) | $ | (39,447 | ) | $ | — | $ | — | $ | (36,927 | ) | $ | (39,447 | ) | ||||||||
| Purchased Non-Performing Loans | $ | — | $ | — | $ | 922,058 | $ | 1,072,270 | $ | 922,058 | $ | 1,072,270 | ||||||||||||
| Total Residential Whole Loans | $ | 2,026,288 | $ | 2,607,651 | $ | 6,164,293 | $ | 5,305,349 | $ | 8,190,581 | $ | 7,913,000 | ||||||||||||
| Number of loans | 7,813 | 9,361 | 17,762 | 14,734 | 25,575 | 24,095 | ||||||||||||||||||
6
Table 4 - Yields and average balances
| For the Three-Month Period Ended | ||||||||||||||||||||||||||||||||||||
| June 30, 2022 | March 31, 2022 | June 30, 2021 | ||||||||||||||||||||||||||||||||||
| (Dollars in Thousands) | Interest | Average Balance | Average Yield | Interest | Average Balance | Average Yield | Interest | Average Balance | Average Yield | |||||||||||||||||||||||||||
| Purchased Performing Loans: | ||||||||||||||||||||||||||||||||||||
| Non-QM loans | $ | 34,512 | $ | 3,766,691 | 3.66 | % | $ | 32,952 | $ | 3,658,912 | 3.60 | % | $ | 21,968 | $ | 2,327,256 | 3.78 | % | ||||||||||||||||||
| Rehabilitation loans | 15,188 | 953,320 | 6.37 | % | 14,861 | 814,055 | 7.30 | % | 7,328 | 454,939 | 6.44 | % | ||||||||||||||||||||||||
| Single-family rental loans | 16,413 | 1,263,966 | 5.19 | % | 13,325 | 1,024,731 | 5.20 | % | 6,906 | 479,233 | 5.76 | % | ||||||||||||||||||||||||
| Seasoned performing loans | 1,155 | 95,650 | 4.83 | % | 1,010 | 100,032 | 4.04 | % | 1,540 | 125,056 | 4.93 | % | ||||||||||||||||||||||||
| Agency eligible investor loans | 7,604 | 1,051,737 | 2.89 | % | 7,583 | 1,075,013 | 2.82 | % | 263 | 32,114 | 3.28 | % | ||||||||||||||||||||||||
| Total Purchased Performing Loans | 74,872 | 7,131,364 | 4.20 | % | 69,731 | 6,672,743 | 4.18 | % | 38,005 | 3,418,598 | 4.45 | % | ||||||||||||||||||||||||
| Purchased Credit Deteriorated Loans | 8,672 | 506,653 | 6.85 | % | 9,009 | 530,828 | 6.79 | % | 11,303 | 630,217 | 7.17 | % | ||||||||||||||||||||||||
| Purchased Non-Performing Loans | 18,810 | 800,102 | 9.40 | % | 20,726 | 844,206 | 9.82 | % | 19,709 | 987,860 | 7.98 | % | ||||||||||||||||||||||||
| Total Residential whole loans | $ | 102,354 | $ | 8,438,119 | 4.85 | % | $ | 99,466 | $ | 8,047,777 | 4.94 | % | $ | 69,017 | $ | 5,036,675 | 5.48 | % | ||||||||||||||||||
Table 5 - Net Interest Spread
| For the Three-Month Period Ended | ||||||||||||
| June 30, 2022 | March 31, 2022 | June 30, 2021 | ||||||||||
| Purchased Performing Loans | ||||||||||||
| Net Yield (1) | 4.20 | % | 4.18 | % | 4.45 | % | ||||||
| Cost of Funding (2) | 3.28 | % | 2.74 | % | 2.09 | % | ||||||
| Net Interest Spread | 0.92 | % | 1.44 | % | 2.36 | % | ||||||
| Purchased Credit Deteriorated Loans | ||||||||||||
| Net Yield (1) | 6.85 | % | 6.79 | % | 7.17 | % | ||||||
| Cost of Funding (2) | 3.17 | % | 2.88 | % | 2.39 | % | ||||||
| Net Interest Spread | 3.68 | % | 3.91 | % | 4.78 | % | ||||||
| Purchased Non-Performing Loans | ||||||||||||
| Net Yield (1) | 9.40 | % | 9.82 | % | 7.98 | % | ||||||
| Cost of Funding (2) | 3.34 | % | 3.09 | % | 2.71 | % | ||||||
| Net Interest Spread | 6.06 | % | 6.73 | % | 5.27 | % | ||||||
| Total Residential Whole Loans | ||||||||||||
| Net Yield (1) | 4.85 | % | 4.94 | % | 5.48 | % | ||||||
| Cost of Funding (2) | 3.28 | % | 2.79 | % | 2.25 | % | ||||||
| Net Interest Spread | 1.57 | % | 2.15 | % | 3.23 | % | ||||||
| (1) | Reflects annualized interest income on Residential whole loans divided by average amortized cost of Residential whole loans. Excludes servicing costs. |
| (2) | Reflects annualized interest expense divided by average balance of agreements with mark-to-market collateral provisions (repurchase agreements), agreements with non-mark-to-market collateral provisions, and securitized debt. Cost of funding shown in the table above for the quarterly periods ended June 30, 2022 and March 31, 2022 includes the impact of the net carrying cost (the amount by which swap interest expense paid exceeds swap interest income received) on our Swaps. While we have not elected hedge accounting treatment for Swaps and, accordingly, the net carrying cost is not presented in interest expense in our consolidated statement of operations, we believe it is appropriate to allocate the net carrying cost to the cost of funding to reflect the economic impact of our Swaps on the funding costs shown in the table above. For the quarter ended June 30, 2022, this increased the overall funding cost by 25 basis points for our Residential whole loans, 23 basis points for our Purchased Performing Loans, 43 basis points for our Purchased Credit Deteriorated Loans, and 29 basis points for our Purchased Non-Performing Loans. For the quarter ended March 31, 2022, this increased the overall funding cost by 35 basis points for our Residential whole loans, 33 basis points for our Purchased Performing Loans, 56 basis points for our Purchased Credit Deteriorated Loans, and 39 basis points for our Purchased Non-Performing Loans. We did not have any Swaps during the quarter ended June 30, 2021. |
7
Table 6 - Allowance for Credit Losses
The following table presents a roll-forward of the allowance for credit losses on the Company’s Residential Whole Loans, at Carrying Value:
| Six Months Ended June 30, 2022 | ||||||||||||||||||||||||
| (Dollars In Thousands) | Non-QM Loans | Rehabilitation Loans (1)(2) | Single-family Rental Loans | Seasoned Performing Loans | Purchased Credit Deteriorated Loans (3) | Totals | ||||||||||||||||||
| Allowance for credit losses at December 31, 2021 | $ | 8,289 | $ | 6,881 | $ | 1,451 | $ | 46 | $ | 22,780 | $ | 39,447 | ||||||||||||
| Current provision | (909 | ) | (1,460 | ) | (122 | ) | (1 | ) | (975 | ) | (3,467 | ) | ||||||||||||
| Write-offs | (51 | ) | (219 | ) | (27 | ) | — | (226 | ) | (523 | ) | |||||||||||||
| Allowance for credit losses at March 31, 2022 | $ | 7,329 | $ | 5,202 | $ | 1,302 | $ | 45 | $ | 21,579 | $ | 35,457 | ||||||||||||
| Current provision/(reversal) | (199 | ) | (23 | ) | 174 | 1 | 1,877 | 1,830 | ||||||||||||||||
| Write-offs | — | (118 | ) | (184 | ) | — | (58 | ) | (360 | ) | ||||||||||||||
| Allowance for credit losses at June 30, 2022 | $ | 7,130 | $ | 5,061 | $ | 1,292 | $ | 46 | $ | 23,398 | $ | 36,927 | ||||||||||||
| Six Months Ended June 30, 2021 | ||||||||||||||||||||||||
| (Dollars In Thousands) | Non-QM Loans | Rehabilitation Loans (1)(2) | Single-family Rental Loans | Seasoned Performing Loans | Purchased Credit Deteriorated Loans (3) | Totals | ||||||||||||||||||
| Allowance for credit losses at December 31, 2020 | $ | 21,068 | $ | 18,371 | $ | 3,918 | $ | 107 | $ | 43,369 | $ | 86,833 | ||||||||||||
| Current provision | (6,523 | ) | (3,700 | ) | (1,172 | ) | (41 | ) | (10,936 | ) | (22,372 | ) | ||||||||||||
| Write-offs | — | (1,003 | ) | — | — | (214 | ) | (1,217 | ) | |||||||||||||||
| Allowance for credit losses at March 31, 2021 | $ | 14,545 | $ | 13,668 | $ | 2,746 | $ | 66 | $ | 32,219 | $ | 63,244 | ||||||||||||
| Current provision/(reversal) | (2,416 | ) | (1,809 | ) | (386 | ) | (9 | ) | (3,963 | ) | (8,583 | ) | ||||||||||||
| Write-offs | (37 | ) | (255 | ) | — | — | (108 | ) | (400 | ) | ||||||||||||||
| Valuation adjustment on loans held for sale | — | — | — | — | — | — | ||||||||||||||||||
| Allowance for credit losses at June 30, 2021 | $ | 12,092 | $ | 11,604 | $ | 2,360 | $ | 57 | $ | 28,148 | $ | 54,261 | ||||||||||||
| (1) | In connection with purchased Rehabilitation loans at carrying value, the Company had unfunded commitments of $10.1 million and $40.3 million as of June 30, 2022 and 2021, respectively, with an allowance for credit losses of $110,000 and $512,000 at June 30, 2022 and 2021, respectively. Such allowance is included in “Other liabilities” in the Company’s consolidated balance sheets (see Note 7). |
| (2) | Includes $71.9 million and $120.4 million of loans that were assessed for credit losses based on a collateral dependent methodology as of June 30, 2022 and 2021, respectively. |
| (3) | Includes $63.8 million and $83.1 million of loans that were assessed for credit losses based on a collateral dependent methodology as of June 30, 2022 and 2021, respectively. |
8
Table 7 - Credit related metrics/Residential Whole Loans
June 30, 2022
| Fair Value / | Unpaid Principal | Weighted Average | Weighted Average Term to | Weighted Average | Weighted Average | Aging by UPB | ||||||||||||||||||||||||||||||||||
| (Dollars | Carrying | Balance | Coupon | Maturity | LTV | Original | Past Due Days | |||||||||||||||||||||||||||||||||
| In Thousands) | Value | (“UPB”) | (1) | (Months) | Ratio (2) | FICO (3) | Current | 30-59 | 60-89 | 90+ | ||||||||||||||||||||||||||||||
| Purchased Performing Loans: | ||||||||||||||||||||||||||||||||||||||||
| Non-QM loans | $ | 3,487,780 | $ | 3,636,992 | 4.96 | % | 356 | 65 | % | 734 | $ | 3,465,427 | $ | 76,261 | $ | 17,781 | $ | 77,523 | ||||||||||||||||||||||
| Rehabilitation loans | 1,038,770 | 1,044,722 | 7.18 | 13 | 67 | 743 | 952,587 | 3,230 | 6,913 | 81,992 | ||||||||||||||||||||||||||||||
| Single-family rental loans | 1,261,946 | 1,319,956 | 5.40 | 326 | 70 | 737 | 1,283,285 | 5,169 | 2,009 | 29,493 | ||||||||||||||||||||||||||||||
| Seasoned performing loans | 92,863 | 101,811 | 2.82 | 156 | 31 | 722 | 93,000 | 807 | 577 | 7,427 | ||||||||||||||||||||||||||||||
| Agency eligible investor loans | 912,245 | 1,015,832 | 3.40 | 348 | 61 | 767 | 1,011,769 | 2,653 | 596 | 814 | ||||||||||||||||||||||||||||||
| Total Purchased Performing Loans | $ | 6,793,604 | $ | 7,119,313 | 5.11 | % | 296 | |||||||||||||||||||||||||||||||||
| Purchased Credit Deteriorated Loans | $ | 474,919 | $ | 587,058 | 4.57 | % | 280 | 65 | % | N/A | $ | 425,803 | $ | 40,047 | $ | 17,416 | $ | 103,792 | ||||||||||||||||||||||
| Purchased Non-Performing Loans | $ | 922,058 | $ | 969,007 | 4.92 | % | 280 | 70 | % | N/A | $ | 460,929 | $ | 83,631 | $ | 34,546 | $ | 389,901 | ||||||||||||||||||||||
| Residential whole loans, total or weighted average | $ | 8,190,581 | $ | 8,675,378 | 5.06 | % | 293 | |||||||||||||||||||||||||||||||||
December 31, 2021
| Fair Value / | Unpaid Principal | Weighted Average | Weighted Average Term to | Weighted Average | Weighted Average | Aging by UPB | ||||||||||||||||||||||||||||||||||
| (Dollars | Carrying | Balance | Coupon | Maturity | LTV | Original | Past Due Days | |||||||||||||||||||||||||||||||||
| In Thousands) | Value | (“UPB”) | (1) | (Months) | Ratio (2) | FICO (3) | Current | 30-59 | 60-89 | 90+ | ||||||||||||||||||||||||||||||
| Purchased Performing Loans: | ||||||||||||||||||||||||||||||||||||||||
| Non-QM loans | $ | 3,453,242 | $ | 3,361,164 | 5.07 | % | 355 | 66 | % | 731 | $ | 3,165,964 | $ | 77,581 | $ | 22,864 | $ | 94,755 | ||||||||||||||||||||||
| Rehabilitation loans | 727,964 | 731,154 | 7.18 | 11 | 67 | 735 | 616,733 | 5,834 | 5,553 | 103,034 | ||||||||||||||||||||||||||||||
| Single-family rental loans | 949,772 | 924,498 | 5.46 | 329 | 70 | 732 | 898,166 | 2,150 | 695 | 23,487 | ||||||||||||||||||||||||||||||
| Seasoned performing loans | 101,995 | 111,710 | 2.76 | 162 | 37 | 722 | 102,047 | 938 | 481 | 8,244 | ||||||||||||||||||||||||||||||
| Agency eligible investor loans | 1,082,765 | 1,060,486 | 3.40 | 354 | 62 | 767 | 1,039,257 | 21,229 | — | — | ||||||||||||||||||||||||||||||
| Total Purchased Performing Loans | $ | 6,315,738 | $ | 6,189,012 | 5.05 | % | 307 | |||||||||||||||||||||||||||||||||
| Purchased Credit Deteriorated Loans | $ | 524,992 | $ | 643,187 | 4.55 | % | 283 | 69 | % | N/A | $ | 456,924 | $ | 50,048 | $ | 18,736 | $ | 117,479 | ||||||||||||||||||||||
| Purchased Non-Performing Loans | $ | 1,072,270 | $ | 1,073,544 | 4.87 | % | 283 | 73 | % | N/A | $ | 492,481 | $ | 87,041 | $ | 40,876 | $ | 453,146 | ||||||||||||||||||||||
| Residential whole loans, total or weighted average | $ | 7,913,000 | $ | 7,905,743 | 4.99 | % | 301 | |||||||||||||||||||||||||||||||||
| (1) | Weighted average is calculated based on the interest bearing principal balance of each loan within the related category. For loans acquired with servicing rights released by the seller, interest rates included in the calculation do not reflect loan servicing fees. For loans acquired with servicing rights retained by the seller, interest rates included in the calculation are net of servicing fees. |
| (2) | LTV represents the ratio of the total unpaid principal balance of the loan to the estimated value of the collateral securing the related loan as of the most recent date available, which may be the origination date. For Rehabilitation loans, the LTV presented is the ratio of the maximum unpaid principal balance of the loan, including unfunded commitments, to the estimated “after repaired” value of the collateral securing the related loan, where available. For certain Rehabilitation loans, totaling $172.3 million and $137.3 million at June 30, 2022 and December 31, 2021, respectively, an after repaired valuation was not obtained and the loan was underwritten based on an “as is” valuation. The weighted average LTV of these loans based on the current unpaid principal balance and the valuation obtained during underwriting, is 72% and 71% at June 30, 2022 and December 31, 2021, respectively. Excluded from the calculation of weighted average LTV are certain low value loans secured by vacant lots, for which the LTV ratio is not meaningful. |
| (3) | Excludes loans for which no Fair Isaac Corporation (“FICO”) score is available. |
9
Table 8 - LTV 90+ Days Delinquencies
The following table presents certain information regarding the Company’s Residential whole loans that are 90 days or more delinquent:
| June 30, 2022 | ||||||||||||
| (Dollars In Thousands) | Carrying Value / Fair Value | UPB | LTV (1) | |||||||||
| Purchased Performing Loans | ||||||||||||
| Non-QM loans | $ | 78,037 | $ | 77,523 | 66.6 | % | ||||||
| Rehabilitation loans | $ | 81,432 | $ | 81,992 | 70.8 | % | ||||||
| Single-family rental loans | $ | 29,577 | $ | 29,493 | 75.2 | % | ||||||
| Seasoned performing loans | $ | 6,854 | $ | 7,427 | 45.4 | % | ||||||
| Agency eligible investor loans | $ | 718 | $ | 814 | 59.2 | % | ||||||
| Total Purchased Performing Loans | $ | 196,618 | $ | 197,249 | ||||||||
| Purchased Credit Deteriorated Loans | $ | 83,606 | $ | 103,792 | 77.1 | % | ||||||
| Purchased Non-Performing Loans | $ | 385,233 | $ | 389,901 | 79.7 | % | ||||||
| Total Residential whole loans | $ | 665,457 | $ | 690,942 | ||||||||
| December 31, 2021 | ||||||||||||
| (Dollars In Thousands) | Carrying Value / Fair Value | UPB | LTV (1) | |||||||||
| Purchased Performing Loans | ||||||||||||
| Non-QM loans | $ | 96,473 | $ | 94,755 | 64.6 | % | ||||||
| Rehabilitation loans | $ | 103,166 | $ | 103,034 | 67.6 | % | ||||||
| Single-family rental loans | $ | 23,524 | $ | 23,487 | 73.4 | % | ||||||
| Seasoned performing loans | $ | 7,740 | $ | 8,244 | 45.6 | % | ||||||
| Agency eligible investor loans | $ | — | $ | — | — | % | ||||||
| Total Purchased Performing Loans | $ | 230,903 | $ | 229,520 | ||||||||
| Purchased Credit Deteriorated Loans | $ | 95,899 | $ | 117,479 | 79.1 | % | ||||||
| Purchased Non-Performing Loans | $ | 454,443 | $ | 453,146 | 80.2 | % | ||||||
| Total Residential whole loans | $ | 781,245 | $ | 800,145 | ||||||||
| (1) | LTV represents the ratio of the total unpaid principal balance of the loan to the estimated value of the collateral securing the related loan as of the most recent date available, which may be the origination date. For Rehabilitation loans, the LTV presented is the ratio of the maximum unpaid principal balance of the loan, including unfunded commitments, to the estimated “after repaired” value of the collateral securing the related loan, where available. For certain Rehabilitation loans, an after repaired valuation was not obtained and the loan was underwritten based on an “as is” valuation. Excluded from the calculation of weighted average LTV are certain low value loans secured by vacant lots, for which the LTV ratio is not meaningful. |
10
Table 9 - Shock Table
The information presented in the following “Shock Table” projects the potential impact of sudden parallel changes in interest rates on the value of our portfolio, including the impact of Swaps and securitized debt, over the next 12 months based on the assets in our investment portfolio at June 30, 2022. Changes in portfolio value are measured as the percentage change when comparing the projected portfolio value to the base interest rate scenario at June 30, 2022.
| Change in Interest Rates | Percentage Change in Portfolio Value | Percentage Change in Equity | ||||||
| +100 Basis Point Increase | (1.27 | )% | (5.36 | )% | ||||
| + 50 Basis Point Increase | (0.55 | )% | (2.34 | )% | ||||
| Actual at June 30, 2022 | — | % | — | % | ||||
| - 50 Basis Point Decrease | 0.39 | % | 1.66 | % | ||||
| -100 Basis Point Decrease | 0.63 | % | 2.64 | % | ||||
Webcast
MFA Financial, Inc. plans to host a live audio webcast of its investor conference call on Thursday, August 4, 2022, at 11:00 a.m. (Eastern Time) to discuss its second quarter 2022 financial results. The live audio webcast will be accessible to the general public over the internet at http://www.mfafinancial.com through the “Webcasts & Presentations” link on MFA’s home page. To listen to the conference call over the internet, please go to the MFA website at least 15 minutes before the call to register and to download and install any needed audio software. Earnings presentation materials will be posted on the MFA website prior to the conference call and an audio replay will be available on the website following the call.
Cautionary Language Regarding Forward-Looking Statements
When used in this press release or other written or oral communications, statements which are not historical in nature, including those containing words such as “will,” “believe,” “expect,” “anticipate,” “estimate,” “plan,” “continue,” “intend,” “should,” “could,” “would,” “may,” the negative of these words or similar expressions, are intended to identify “forward-looking statements” within the meaning of Section 27A of the Securities Act of 1933, as amended, and Section 21E of the Securities Exchange Act of 1934, as amended, and, as such, may involve known and unknown risks, uncertainties and assumptions. These forward-looking statements include information about possible or assumed future results with respect to our business, financial condition, liquidity, results of operations, plans and objectives. Among the important factors that could cause our actual results to differ materially from those projected in any forward-looking statements we make are: changes in inflation and interest rates and the market (i.e., fair) value of MFA’s residential whole loans, MBS, securitized debt and other assets and liabilities accounted for at fair value through earnings, the effectiveness of hedging transactions; changes in the prepayment rates on residential mortgage assets, an increase of which could result in a reduction of the yield on certain investments in MFA’s portfolio and could require MFA to reinvest the proceeds received by it as a result of such prepayments in investments with lower coupons, while a decrease in which could result in an increase in the interest rate duration of certain investments in MFA’s portfolio making their valuation more sensitive to changes in interest rates and could result in lower forecasted cash flows; credit risks underlying MFA’s assets, including changes in the default rates and management’s assumptions regarding default rates on the mortgage loans in MFA’s residential whole loan portfolio; MFA’s ability to borrow to finance its assets and the terms, including the cost, maturity and other terms, of any such borrowings; implementation of or changes in government regulations or programs affecting MFA’s business; MFA’s estimates regarding taxable income, the actual amount of which is dependent on a number of factors, including, but not limited to, changes in the amount of interest income and financing costs, the method elected by MFA to accrete the market discount on residential whole loans and the extent of prepayments, realized losses and changes in the composition of MFA’s residential whole loan portfolios that may occur during the applicable tax period, including gain or loss on any MBS disposals and whole loan modifications, foreclosures and liquidations; the timing and amount of distributions to stockholders, which are declared and paid at the discretion of MFA’s Board and will depend on, among other things, MFA’s taxable income, its financial results and overall financial condition and liquidity, maintenance of its REIT qualification and such other factors as MFA’s Board deems relevant; MFA’s ability to maintain its qualification as a REIT for federal income tax purposes; MFA’s ability to maintain its exemption from registration under the Investment Company Act of 1940, as amended (or the “Investment Company Act”), including statements regarding the concept release issued by the Securities and Exchange Commission (“SEC”) relating to interpretive issues under the Investment Company Act with respect to the status under the Investment Company Act of certain companies that are engaged in the business of acquiring mortgages and mortgage-related interests; MFA’s ability to continue growing its residential whole loan portfolio, which is dependent on, among other things, the supply of loans offered for sale in the market; expected returns on MFA’s investments in nonperforming residential whole loans (“NPLs”), which are affected by, among other things, the length of time required to foreclose upon, sell, liquidate or otherwise reach a resolution of the property underlying the NPL, home price values, amounts advanced to carry the asset (e.g., taxes, insurance, maintenance expenses, etc. on the underlying property) and the amount ultimately realized upon resolution of the asset; targeted or expected returns on MFA’s investments in recently-originated loans, the performance of which is, similar to MFA’s other mortgage loan investments, subject to, among other things, differences in prepayment risk, credit risk and financing cost associated with such investments; risks associated with MFA’s investments in MSR-related assets, including servicing, regulatory and economic risks, risks associated with our investments in loan originators, risks associated with investing in real estate assets, including changes in business conditions and the general economy and risks associated with the integration and ongoing operation of Lima One Holdings, LLC (including, without limitation, unanticipated expenditures relating to or liabilities arising from the transaction and/or the inability to obtain, or delays in obtaining, expected benefits (including expected growth in loan origination volumes) from the transaction); and other risks, uncertainties and factors described in the annual, quarterly and current reports that MFA files with the SEC. All forward-looking statements are based on beliefs, assumptions and expectations of MFA’s future performance, taking into account all information currently available. Readers are cautioned not to place undue reliance on these forward-looking statements, which speak only as of the date on which they are made. New risks and uncertainties arise over time and it is not possible to predict those events or how they may affect MFA. Except as required by law, MFA is not obligated to, and does not intend to, update or revise any forward-looking statements, whether as a result of new information, future events or otherwise.
11
MFA FINANCIAL, INC.
CONSOLIDATED BALANCE SHEETS
| (In Thousands, Except Per Share Amounts) | June 30, 2022 | December 31, 2021 | ||||||
| (unaudited) | ||||||||
| Assets: | ||||||||
| Residential whole loans, net ($6,164,293 and $5,305,349 held at fair value, respectively) (1) | $ | 8,190,581 | $ | 7,913,000 | ||||
| Securities, at fair value | 245,613 | 256,685 | ||||||
| Cash and cash equivalents | 385,598 | 304,696 | ||||||
| Restricted cash | 159,745 | 99,751 | ||||||
| Other assets | 498,089 | 565,556 | ||||||
| Total Assets | $ | 9,479,626 | $ | 9,139,688 | ||||
| Liabilities: | ||||||||
| Financing agreements ($4,199,458 and $3,266,773 held at fair value, respectively) | $ | 7,132,366 | $ | 6,378,782 | ||||
| Other liabilities | 200,872 | 218,058 | ||||||
| Total Liabilities | $ | 7,333,238 | $ | 6,596,840 | ||||
| Stockholders’ Equity: | ||||||||
| Preferred stock, $0.01 par value; 7.5% Series B cumulative redeemable; 8,050 shares authorized; 8,000 shares issued and outstanding ($200,000 aggregate liquidation preference) | $ | 80 | $ | 80 | ||||
| Preferred stock, $0.01 par value; 6.5% Series C fixed-to-floating rate cumulative redeemable; 12,650 shares authorized; 11,000 shares issued and outstanding ($275,000 aggregate liquidation preference) | 110 | 110 | ||||||
| Common stock, $0.01 par value; 874,300 and 874,300 shares authorized; 101,793 and 108,138 shares issued and outstanding, respectively | 1,018 | 1,082 | ||||||
| Additional paid-in capital, in excess of par | 3,679,078 | 3,775,482 | ||||||
| Accumulated deficit | (1,570,817 | ) | (1,279,484 | ) | ||||
| Accumulated other comprehensive income | 36,919 | 45,578 | ||||||
| Total Stockholders’ Equity | $ | 2,146,388 | $ | 2,542,848 | ||||
| Total Liabilities and Stockholders’ Equity | $ | 9,479,626 | $ | 9,139,688 | ||||
| (1) | Includes approximately $3.9 billion and $3.0 billion of Residential whole loans transferred to consolidated variable interest entities (“VIEs”) at June 30, 2022 and December 31, 2021, respectively. Such assets can be used only to settle the obligations of each respective VIE. |
12
MFA FINANCIAL, INC.
CONSOLIDATED STATEMENTS OF OPERATIONS
Three Months Ended June 30, | Six Months Ended June 30, | |||||||||||||||
| (In Thousands, Except Per Share Amounts) | 2022 | 2021 | 2022 | 2021 | ||||||||||||
| (Unaudited) | ||||||||||||||||
| Interest Income: | ||||||||||||||||
| Residential whole loans | $ | 102,354 | $ | 69,016 | $ | 201,820 | $ | 133,554 | ||||||||
| Securities, at fair value | 5,294 | 15,345 | 10,569 | 31,804 | ||||||||||||
| Other interest-earning assets | 1,349 | 108 | 2,855 | 108 | ||||||||||||
| Cash and cash equivalent investments | 324 | 59 | 426 | 113 | ||||||||||||
| Interest Income | $ | 109,321 | $ | 84,528 | $ | 215,670 | $ | 165,579 | ||||||||
| Interest Expense: | ||||||||||||||||
| Asset-backed and other collateralized financing arrangements | $ | 52,805 | $ | 21,640 | $ | 92,170 | $ | 47,691 | ||||||||
| Other interest expense | 3,937 | 3,915 | 7,868 | 7,934 | ||||||||||||
| Interest Expense | $ | 56,742 | $ | 25,555 | $ | 100,038 | $ | 55,625 | ||||||||
| Net Interest Income | $ | 52,579 | $ | 58,973 | $ | 115,632 | $ | 109,954 | ||||||||
| (Provision)/Reversal of Provision for Credit Losses on Residential Whole Loans | $ | (1,817 | ) | $ | 8,867 | $ | 1,694 | $ | 31,617 | |||||||
| Provision for Credit Losses on Other Assets | $ | (28,579 | ) | $ | — | $ | (28,579 | ) | $ | — | ||||||
| Net Interest Income after (Provision)/Reversal of Provision for Credit Losses | $ | 22,183 | $ | 67,840 | $ | 88,747 | $ | 141,571 | ||||||||
| Other Income, net: | ||||||||||||||||
| Net mark-to-market and other net (loss)/gain on residential whole loans measured at fair value | $ | (216,414 | ) | $ | 6,021 | $ | (504,789 | ) | $ | 37,510 | ||||||
| Net gains/(losses) on derivatives used for risk management purposes | 47,804 | (1,057 | ) | 141,905 | (1,057 | ) | ||||||||||
| Net mark-to-market on Securitized debt measured at fair value | 84,573 | (232 | ) | 148,690 | (1,243 | ) | ||||||||||
| Net gain on real estate owned | 7,185 | 4,456 | 15,917 | 6,896 | ||||||||||||
| Lima One - origination, servicing and other fee income | 10,673 | — | 25,167 | — | ||||||||||||
| Other, net | (10,269 | ) | 12,459 | (10,854 | ) | 13,860 | ||||||||||
| Other (Loss)/Income, net | $ | (76,448 | ) | $ | 21,647 | $ | (183,964 | ) | $ | 55,966 | ||||||
| Operating and Other Expense: | ||||||||||||||||
| Compensation and benefits | $ | 19,060 | $ | 8,886 | $ | 38,616 | $ | 17,323 | ||||||||
| Other general and administrative expense | 10,507 | 7,887 | 19,204 | 14,679 | ||||||||||||
| Loan servicing, financing and other related costs | 13,235 | 6,000 | 23,636 | 13,299 | ||||||||||||
| Amortization of intangible assets | 3,300 | — | 6,600 | — | ||||||||||||
| Operating and Other Expense | $ | 46,102 | $ | 22,773 | $ | 88,056 | $ | 45,301 | ||||||||
| Net (Loss)/Income | $ | (100,367 | ) | $ | 66,714 | $ | (183,273 | ) | $ | 152,236 | ||||||
| Less Preferred Stock Dividend Requirement | $ | 8,219 | $ | 8,219 | $ | 16,438 | $ | 16,438 | ||||||||
| Net (Loss)/Income Available to Common Stock and Participating Securities | $ | (108,586 | ) | $ | 58,495 | $ | (199,711 | ) | $ | 135,798 | ||||||
| Basic (Loss)/Earnings per Common Share | $ | (1.06 | ) | $ | 0.53 | $ | (1.91 | ) | $ | 1.21 | ||||||
| Diluted (Loss)/Earnings per Common Share | $ | (1.06 | ) | $ | 0.53 | $ | (1.91 | ) | $ | 1.20 | ||||||
13
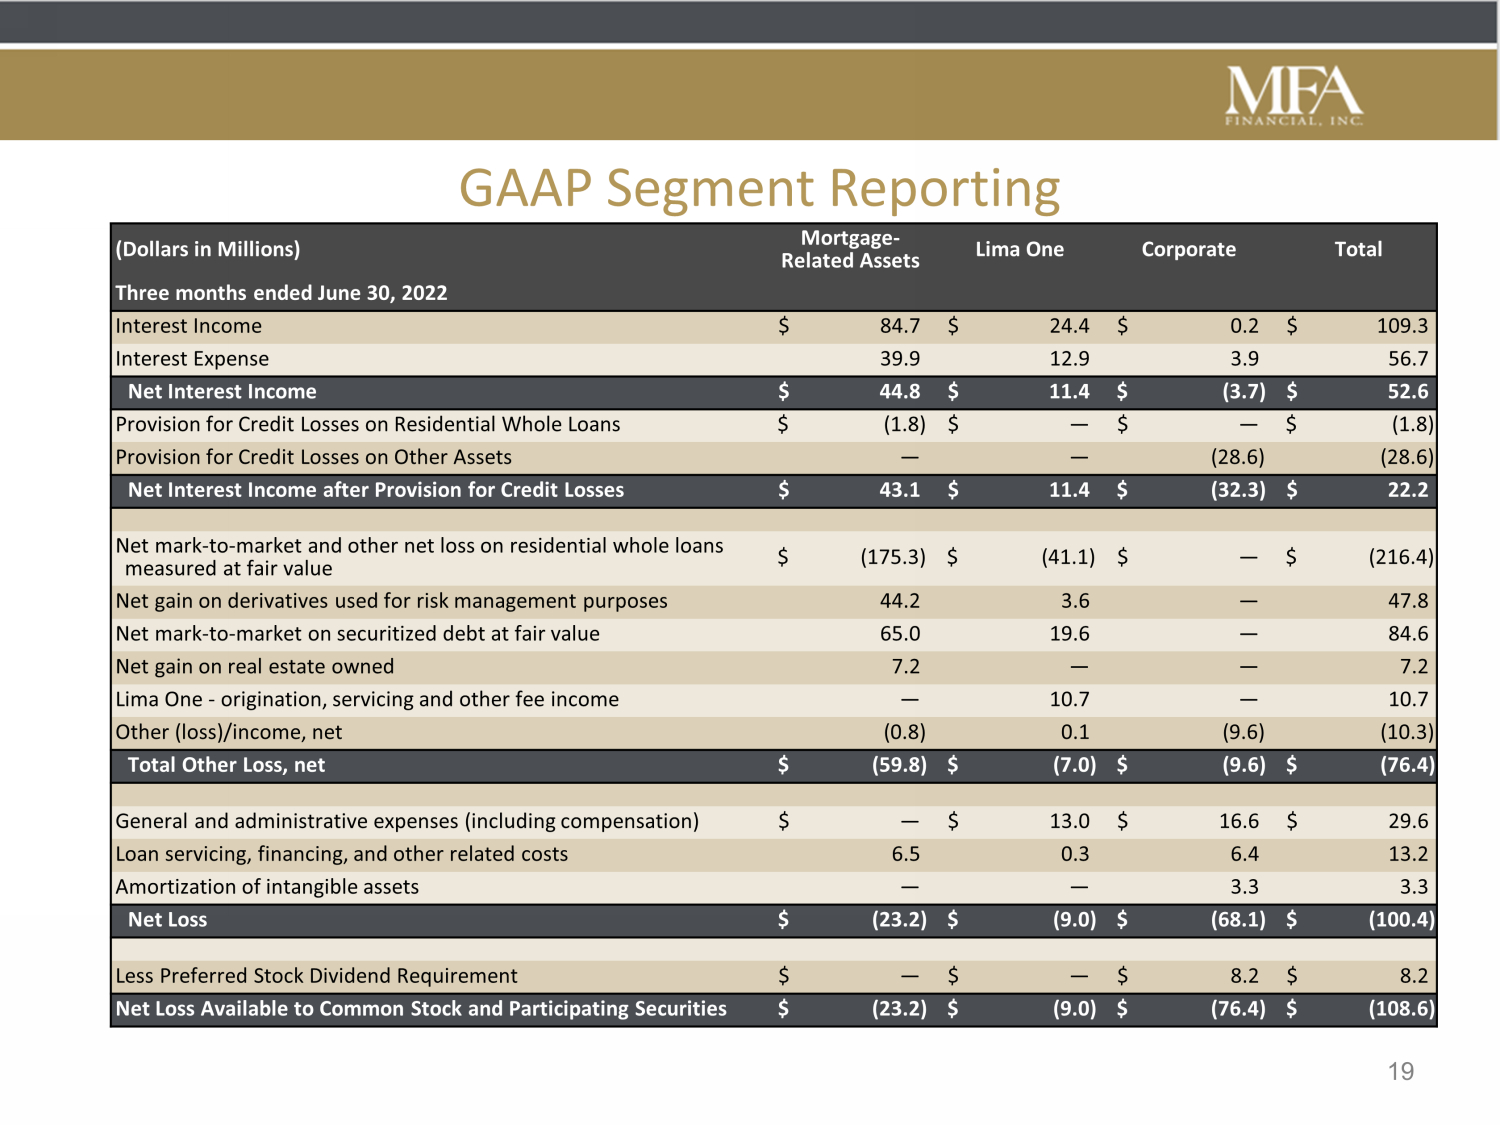
Segment Reporting
At June 30, 2022, the Company’s reportable segments include (i) mortgage-related assets, (ii) Lima One, and (iii) Corporate. The Corporate segment primarily consists of corporate cash and related interest income, investments in loan originators and related economics, general and administrative expenses not directly attributable to Lima One, interest expense on unsecured convertible senior notes, securitization issuance costs, intangible assets and preferred stock dividends.
The following tables summarize segment financial information, which in total reconciles to the same data for the Company as a whole. MFA is not presenting comparable segment statements of operations for the three and six months ended June 30, 2021 because MFA did not consolidate Lima One during those periods.
| (Dollars in Thousands) | Mortgage- Related Assets | Lima One | Corporate | Total | ||||||||||||
| Three months ended June 30, 2022 | ||||||||||||||||
| Interest Income | $ | 84,732 | $ | 24,353 | $ | 236 | $ | 109,321 | ||||||||
| Interest Expense | 39,889 | 12,916 | 3,937 | 56,742 | ||||||||||||
| Net Interest Income | $ | 44,843 | $ | 11,437 | $ | (3,701 | ) | $ | 52,579 | |||||||
| Provision for Credit Losses on Residential Whole Loans | $ | (1,785 | ) | $ | (32 | ) | $ | — | $ | (1,817 | ) | |||||
| Provision for Credit Losses on Other Assets | — | — | (28,579 | ) | (28,579 | ) | ||||||||||
| Net Interest Income after Provision for Credit Losses | $ | 43,058 | $ | 11,405 | $ | (32,280 | ) | $ | 22,183 | |||||||
| Net mark-to-market and other net loss on residential whole loans measured at fair value | $ | (175,281 | ) | $ | (41,133 | ) | $ | — | $ | (216,414 | ) | |||||
| Net gain on derivatives used for risk management purposes | 44,161 | 3,643 | — | 47,804 | ||||||||||||
| Net mark-to-market on securitized debt at fair value | 64,966 | 19,607 | — | 84,573 | ||||||||||||
| Net gain on real estate owned | 7,150 | 35 | — | 7,185 | ||||||||||||
| Lima One - origination, servicing and other fee income | — | 10,673 | — | 10,673 | ||||||||||||
| Other (loss)/income, net | (787 | ) | 129 | (9,611 | ) | (10,269 | ) | |||||||||
| Total Other Loss, net | $ | (59,791 | ) | $ | (7,046 | ) | $ | (9,611 | ) | $ | (76,448 | ) | ||||
| General and administrative expenses (including compensation) | $ | — | $ | 13,013 | $ | 16,554 | $ | 29,567 | ||||||||
| Loan servicing, financing, and other related costs | 6,513 | 323 | 6,399 | 13,235 | ||||||||||||
| Amortization of intangible assets | — | — | 3,300 | 3,300 | ||||||||||||
| Net Loss | $ | (23,246 | ) | $ | (8,977 | ) | $ | (68,144 | ) | $ | (100,367 | ) | ||||
| Less Preferred Stock Dividend Requirement | $ | — | $ | — | $ | 8,219 | $ | 8,219 | ||||||||
| Net Loss Available to Common Stock and Participating Securities | $ | (23,246 | ) | $ | (8,977 | ) | $ | (76,363 | ) | $ | (108,586 | ) | ||||
14
| (Dollars in Thousands) | Mortgage- Related Assets | Lima One | Corporate | Total | ||||||||||||
| Three Months Ended March 31, 2022 | ||||||||||||||||
| Interest Income | $ | 88,822 | $ | 17,500 | $ | 27 | $ | 106,349 | ||||||||
| Interest Expense | 33,009 | 6,356 | 3,931 | 43,296 | ||||||||||||
| Net Interest Income | $ | 55,813 | $ | 11,144 | $ | (3,904 | ) | $ | 63,053 | |||||||
| Provision for Credit Losses on Residential Whole Loans | $ | 3,516 | $ | (5 | ) | $ | — | $ | 3,511 | |||||||
| Provision for Credit Losses on Other Assets | — | — | — | — | ||||||||||||
| Net Interest Income after Provision for Credit Losses | $ | 59,329 | $ | 11,139 | $ | (3,904 | ) | $ | 66,564 | |||||||
| Net mark-to-market and other net loss on residential whole loans measured at fair value | $ | (253,410 | ) | $ | (34,965 | ) | $ | — | $ | (288,375 | ) | |||||
| Net gain on derivatives used for risk management purposes | 86,235 | 7,866 | — | 94,101 | ||||||||||||
| Net mark-to-market on securitized debt at fair value | 57,579 | 6,538 | — | 64,117 | ||||||||||||
| Net gain on real estate owned | 8,735 | (3 | ) | — | 8,732 | |||||||||||
| Lima One - origination, servicing and other fee income | — | 14,494 | — | 14,494 | ||||||||||||
| Other (loss)/income, net | (1,319 | ) | 211 | 523 | (585 | ) | ||||||||||
| Total Other Loss, net | $ | (102,180 | ) | $ | (5,859 | ) | $ | 523 | $ | (107,516 | ) | |||||
| General and administrative expenses (including compensation) | $ | — | $ | 12,219 | $ | 16,034 | $ | 28,253 | ||||||||
| Loan servicing, financing, and other related costs | 6,932 | 236 | 3,233 | 10,401 | ||||||||||||
| Amortization of intangible assets | — | — | 3,300 | 3,300 | ||||||||||||
| Net Loss | $ | (49,783 | ) | $ | (7,175 | ) | $ | (25,948 | ) | $ | (82,906 | ) | ||||
| Less Preferred Stock Dividend Requirement | $ | — | $ | — | $ | 8,219 | $ | 8,219 | ||||||||
| Net Loss Available to Common Stock and Participating Securities | $ | (49,783 | ) | $ | (7,175 | ) | $ | (34,167 | ) | $ | (91,125 | ) | ||||
| (Dollars in Thousands) | Mortgage- Related Assets | Lima One | Corporate | Total | ||||||||||||
| June 30, 2022 | ||||||||||||||||
| Total Assets | $ | 6,976,030 | $ | 1,950,538 | $ | 553,058 | $ | 9,479,626 | ||||||||
| December 31, 2021 | ||||||||||||||||
| Total Assets | $ | 7,482,171 | $ | 1,203,174 | $ | 454,343 | $ | 9,139,688 | ||||||||
Reconciliation of GAAP Net Income to non-GAAP Distributable Earnings
“Distributable earnings” is a non-GAAP financial measure of our operating performance, within the meaning of Regulation G and Item 10(e) of Regulation S-K, as promulgated by the Securities and Exchange Commission. Distributable earnings is determined by adjusting GAAP net income/(loss) by removing certain unrealized gains and losses, primarily on residential mortgage investments, associated debt, and hedges that are, in each case, accounted for at fair value through earnings, certain realized gains and losses, as well as certain non-cash expenses and securitization-related transaction costs. Management believes that the adjustments made to GAAP earnings result in the removal of (i) income or expenses that are not reflective of the longer term performance of our investment portfolio, (ii) certain non-cash expenses, and (iii) expense items required to be recognized solely due to the election of the fair value option on certain related residential mortgage assets and associated liabilities. Distributable earnings is one of the factors that our Board of Directors considers when evaluating distributions to our shareholders. Accordingly, we believe that the adjustments to compute Distributable earnings specified below provide investors and analysts with additional information to evaluate our financial results.
15
Distributable earnings should be used in conjunction with results presented in accordance with GAAP. Distributable earnings does not represent and should not be considered as a substitute for net income or cash flows from operating activities, each as determined in accordance with GAAP, and our calculation of this measure may not be comparable to similarly titled measures reported by other companies.
The following table provides a reconciliation of our GAAP net (loss)/income used in the calculation of basic EPS to our non-GAAP Distributable earnings for the quarters ended June 30, 2022 and 2021:
| Quarter Ended | ||||||||||||||||||||
| (In Thousands, Except Per Share Amounts) | June 30, 2022 | March 31, 2022 | December 31, 2021 | September 30, 2021 | June 30, 2021 | |||||||||||||||
| GAAP Net (loss)/income used in the calculation of Basic EPS | $ | (108,760 | ) | $ | (91,266 | ) | $ | 35,734 | $ | 123,858 | $ | 58,290 | ||||||||
| Adjustments: | ||||||||||||||||||||
| Unrealized gains and losses on: | ||||||||||||||||||||
| Residential whole loans held at fair value | 218,181 | 287,935 | 42,564 | (20,494 | ) | (6,226 | ) | |||||||||||||
| Securities held at fair value | 1,459 | 2,934 | 364 | (494 | ) | (1,374 | ) | |||||||||||||
| Interest rate swaps | (31,767 | ) | (80,753 | ) | (71 | ) | — | — | ||||||||||||
| Securitized debt held at fair value | (84,348 | ) | (62,855 | ) | (6,137 | ) | (857 | ) | 232 | |||||||||||
| Investments in loan origination partners | 39,162 | 780 | (23,956 | ) | (48,933 | ) | — | |||||||||||||
| Expense items: | ||||||||||||||||||||
| Amortization of intangible assets | 3,300 | 3,300 | 3,300 | 3,300 | — | |||||||||||||||
| Equity based compensation | 3,540 | 2,645 | 2,306 | 2,306 | 2,744 | |||||||||||||||
| Securitization-related transaction costs | 6,399 | 3,233 | 5,178 | — | — | |||||||||||||||
| Total adjustments | 155,926 | 157,219 | 23,548 | (65,172 | ) | (4,624 | ) | |||||||||||||
| Distributable earnings | $ | 47,166 | $ | 65,953 | $ | 59,282 | $ | 58,686 | $ | 53,666 | ||||||||||
| GAAP (loss)/earnings per basic common share | $ | (1.06 | ) | $ | (0.86 | ) | $ | 0.33 | $ | 1.12 | $ | 0.53 | ||||||||
| Distributable earnings per basic common share | $ | 0.46 | $ | 0.62 | $ | 0.54 | $ | 0.53 | $ | 0.49 | ||||||||||
| Weighted average common shares for basic earnings per share | 102,515 | 106,568 | 109,468 | 110,222 | 110,383 | |||||||||||||||
16
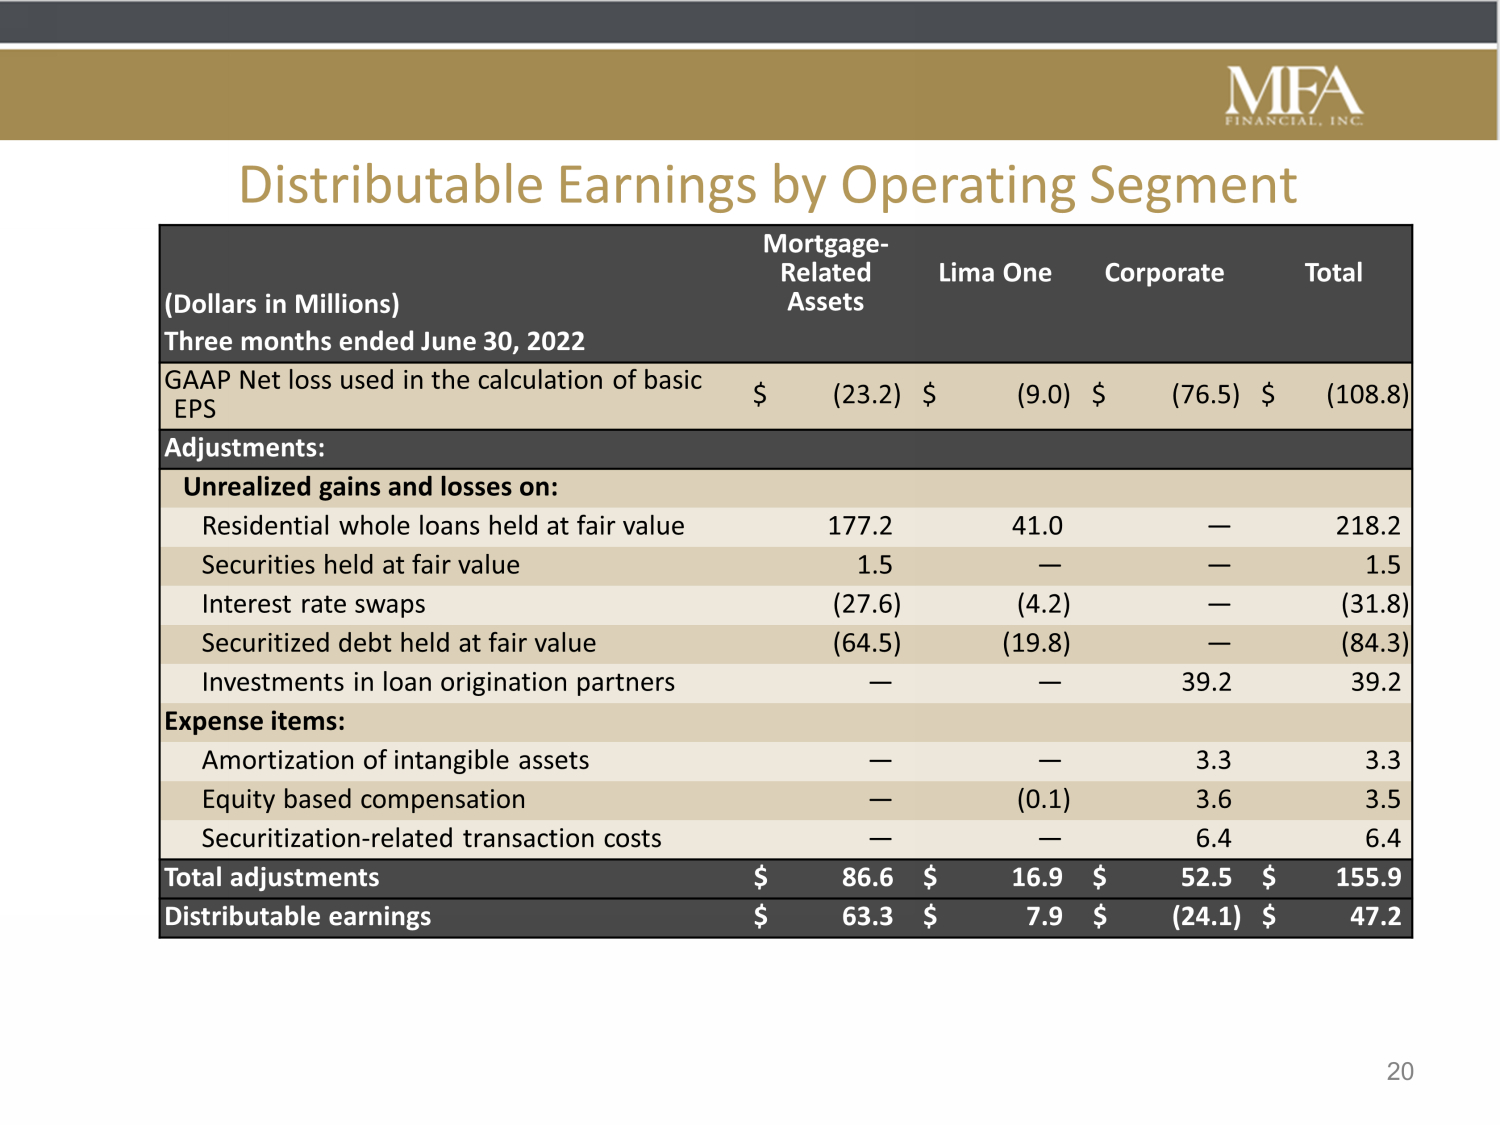
The following table presents our non-GAAP Distributable earnings by segment for the quarterly periods below:
| (Dollars in Thousands) | Mortgage- Related Assets | Lima One | Corporate | Total | ||||||||||||
| Three months ended June 30, 2022 | ||||||||||||||||
| GAAP Net loss used in the calculation of basic EPS | $ | (23,246 | ) | $ | (8,977 | ) | $ | (76,537 | ) | $ | (108,760 | ) | ||||
| Adjustments: | ||||||||||||||||
| Unrealized gains and losses on: | ||||||||||||||||
| Residential whole loans held at fair value | 177,203 | 40,978 | — | 218,181 | ||||||||||||
| Securities held at fair value | 1,459 | — | — | 1,459 | ||||||||||||
| Interest rate swaps | (27,558 | ) | (4,209 | ) | — | (31,767 | ) | |||||||||
| Securitized debt held at fair value | (64,517 | ) | (19,831 | ) | — | (84,348 | ) | |||||||||
| Investments in loan origination partners | — | — | 39,162 | 39,162 | ||||||||||||
| Expense items: | ||||||||||||||||
| Amortization of intangible assets | — | — | 3,300 | 3,300 | ||||||||||||
| Equity based compensation | — | (58 | ) | 3,598 | 3,540 | |||||||||||
| Deferred taxes | — | — | — | — | ||||||||||||
| Securitization-related transaction costs | — | — | 6,399 | 6,399 | ||||||||||||
| Total adjustments | $ | 86,587 | $ | 16,880 | $ | 52,459 | $ | 155,926 | ||||||||
| Distributable earnings | $ | 63,341 | $ | 7,903 | $ | (24,078 | ) | $ | 47,166 | |||||||
| (Dollars in Thousands) | Mortgage- Related Assets | Lima One | Corporate | Total | ||||||||||||
| Three months ended March 31, 2022 | ||||||||||||||||
| GAAP Net loss used in the calculation of basic EPS | $ | (49,783 | ) | $ | (7,175 | ) | $ | (34,308 | ) | $ | (91,266 | ) | ||||
| Adjustments: | ||||||||||||||||
| Unrealized gains and losses on: | ||||||||||||||||
| Residential whole loans held at fair value | 253,127 | 34,808 | — | 287,935 | ||||||||||||
| Securities held at fair value | 2,934 | — | — | 2,934 | ||||||||||||
| Interest rate swaps | (72,308 | ) | (8,445 | ) | — | (80,753 | ) | |||||||||
| Securitized debt held at fair value | (56,317 | ) | (6,538 | ) | — | (62,855 | ) | |||||||||
| Investments in loan origination partners | — | — | 780 | 780 | ||||||||||||
| Expense items: | ||||||||||||||||
| Amortization of intangible assets | — | — | 3,300 | 3,300 | ||||||||||||
| Equity based compensation | — | 107 | 2,538 | 2,645 | ||||||||||||
| Securitization-related transaction costs | — | — | 3,233 | 3,233 | ||||||||||||
| Total adjustments | $ | 127,436 | $ | 19,932 | $ | 9,851 | $ | 157,219 | ||||||||
| Distributable earnings | $ | 77,653 | $ | 12,757 | $ | (24,457 | ) | $ | 65,953 | |||||||
17
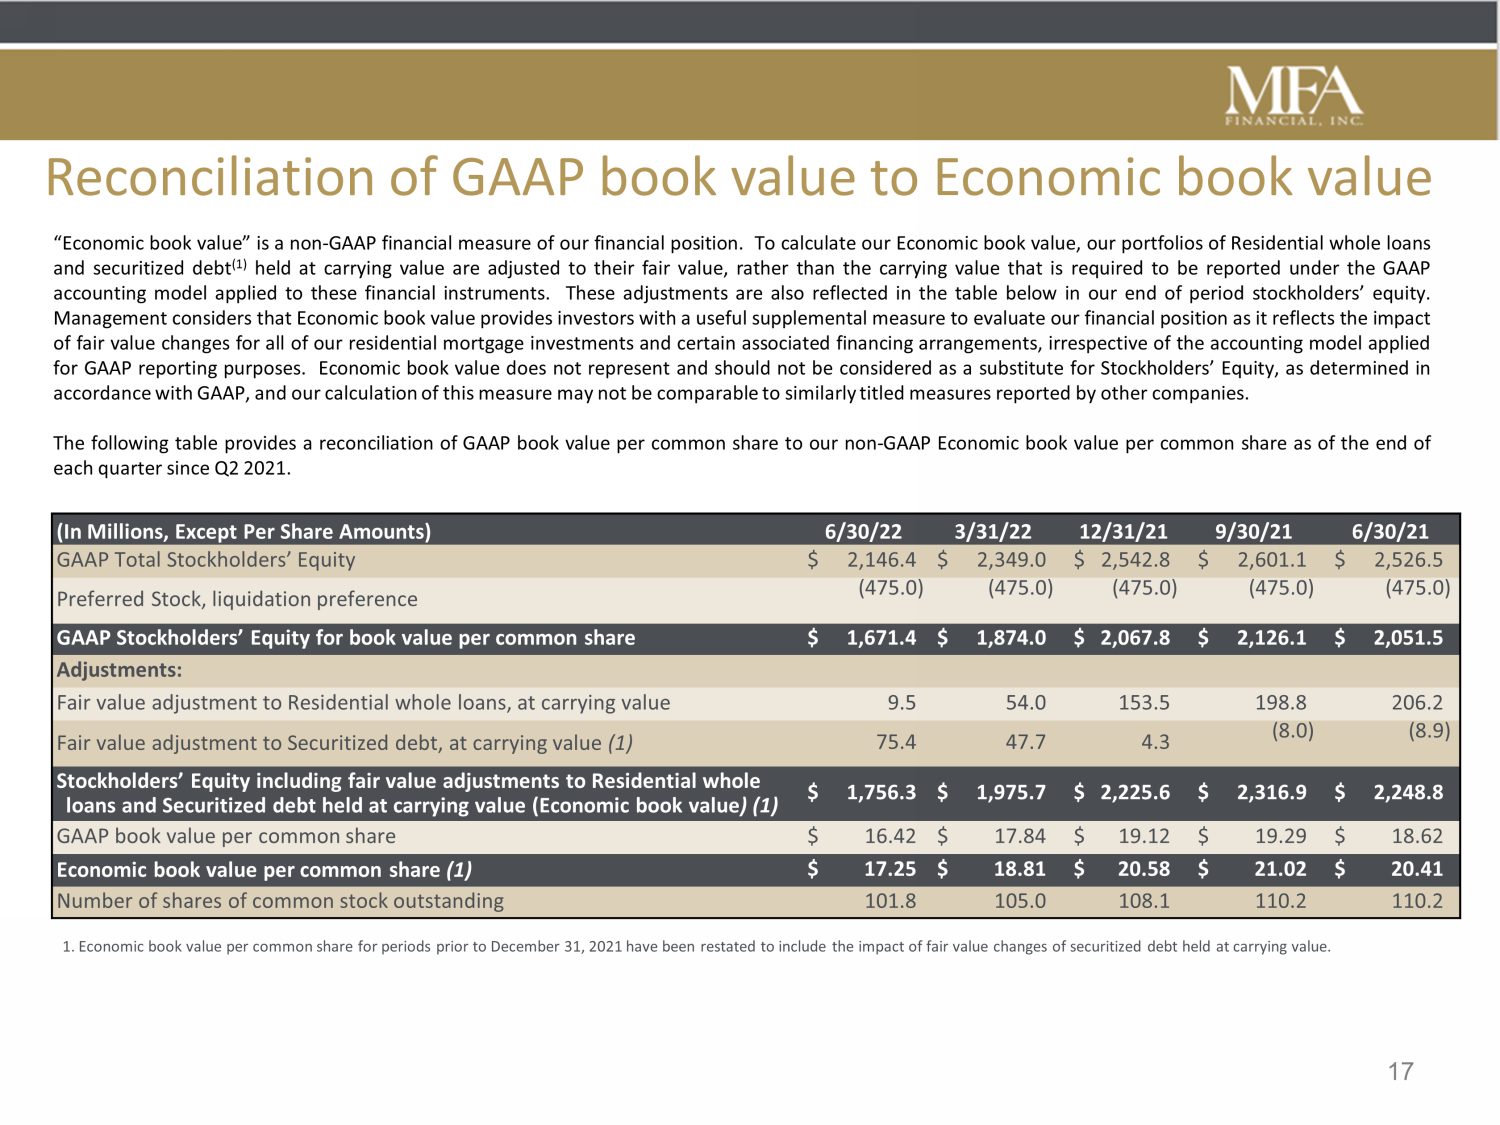
Reconciliation of GAAP Book Value per Common Share to non-GAAP Economic Book Value per Common Share
“Economic book value” is a non-GAAP financial measure of our financial position. To calculate our Economic book value, our portfolios of Residential whole loans and securitized debt held at carrying value are adjusted to their fair value, rather than the carrying value that is required to be reported under the GAAP accounting model applied to these financial instruments. These adjustments are also reflected in the table below in our end of period stockholders’ equity. Management considers that Economic book value provides investors with a useful supplemental measure to evaluate our financial position as it reflects the impact of fair value changes for all of our residential mortgage investments and certain associated financing arrangements, irrespective of the accounting model applied for GAAP reporting purposes. Economic book value does not represent and should not be considered as a substitute for Stockholders’ Equity, as determined in accordance with GAAP, and our calculation of this measure may not be comparable to similarly titled measures reported by other companies.
The following table provides a reconciliation of our GAAP book value per common share to our non-GAAP Economic book value per common share as of the quarterly periods below:
| Quarter Ended: | ||||||||||||||||||||
| (In Millions, Except Per Share Amounts) | June 30, 2022 | March 31, 2022 | December 31, 2021 | September 30, 2021 | June 30, 2021 | |||||||||||||||
| GAAP Total Stockholders’ Equity | $ | 2,146.4 | $ | 2,349.0 | $ | 2,542.8 | $ | 2,601.1 | $ | 2,526.5 | ||||||||||
| Preferred Stock, liquidation preference | (475.0 | ) | (475.0 | ) | (475.0 | ) | (475.0 | ) | (475.0 | ) | ||||||||||
| GAAP Stockholders’ Equity for book value per common share | 1,671.4 | 1,874.0 | 2,067.8 | 2,126.1 | 2,051.5 | |||||||||||||||
| Adjustments: | ||||||||||||||||||||
| Fair value adjustment to Residential whole loans, at carrying value | 9.5 | 54.0 | 153.5 | 198.8 | 206.2 | |||||||||||||||
| Fair value adjustment to Securitized debt, at carrying value (1) | 75.4 | 47.7 | 4.3 | (8.0 | ) | (8.9 | ) | |||||||||||||
| Stockholders’ Equity including fair value adjustments to Residential whole loans and Securitized debt held at carrying value (Economic book value) (1) | $ | 1,756.3 | $ | 1,975.7 | $ | 2,225.6 | $ | 2,316.9 | $ | 2,248.8 | ||||||||||
| GAAP book value per common share | $ | 16.42 | $ | 17.84 | $ | 19.12 | $ | 19.29 | $ | 18.62 | ||||||||||
| Economic book value per common share (1) | $ | 17.25 | $ | 18.81 | $ | 20.58 | $ | 21.02 | $ | 20.41 | ||||||||||
| Number of shares of common stock outstanding | 101.8 | 105.0 | 108.1 | 110.2 | 110.2 | |||||||||||||||
| (1) | Economic book value per common share for periods prior to December 31, 2021 have been restated to include the impact of fair value changes in securitized debt held at carrying value. |
18