Exhibit 99.1

| MFA | |
| FINANCIAL, INC. | |
| 350 Park Avenue | |
| New York, New York 10022 |
| PRESS RELEASE | FOR IMMEDIATE RELEASE |
| February 23, 2021 | NEW YORK METRO | |
| INVESTOR CONTACT: | InvestorRelations@mfafinancial.com | NYSE: MFA |
| 212-207-6488 | ||
| www.mfafinancial.com | ||
| MEDIA CONTACT: | Abernathy MacGregor | |
| Tom Johnson | ||
| 212-371-5999 |
MFA Financial, Inc. Announces Fourth Quarter 2020 Financial Results
Earnings continue to stabilize as financing initiatives are implemented
$50.7 million of accretive common stock repurchases
Limited dilution from execution of warrant transactions with Apollo and Athene
NEW YORK - MFA Financial, Inc. (NYSE:MFA) today provided its financial results for the fourth quarter ended December 31, 2020.
Fourth Quarter 2020 financial results update:
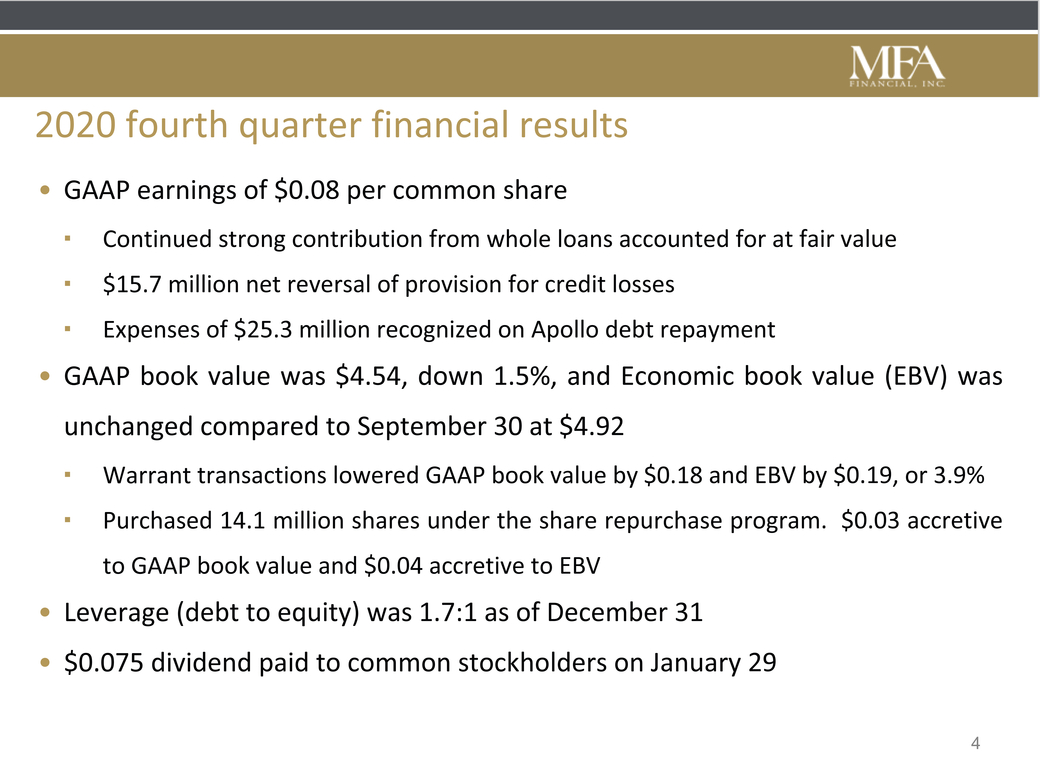
| • | MFA generated fourth quarter net income of $37.6 million, or $0.08 per common share. |
| • | MFA paid a regular cash dividend for the fourth quarter of $0.075 per share of common stock on January 29, 2021. |
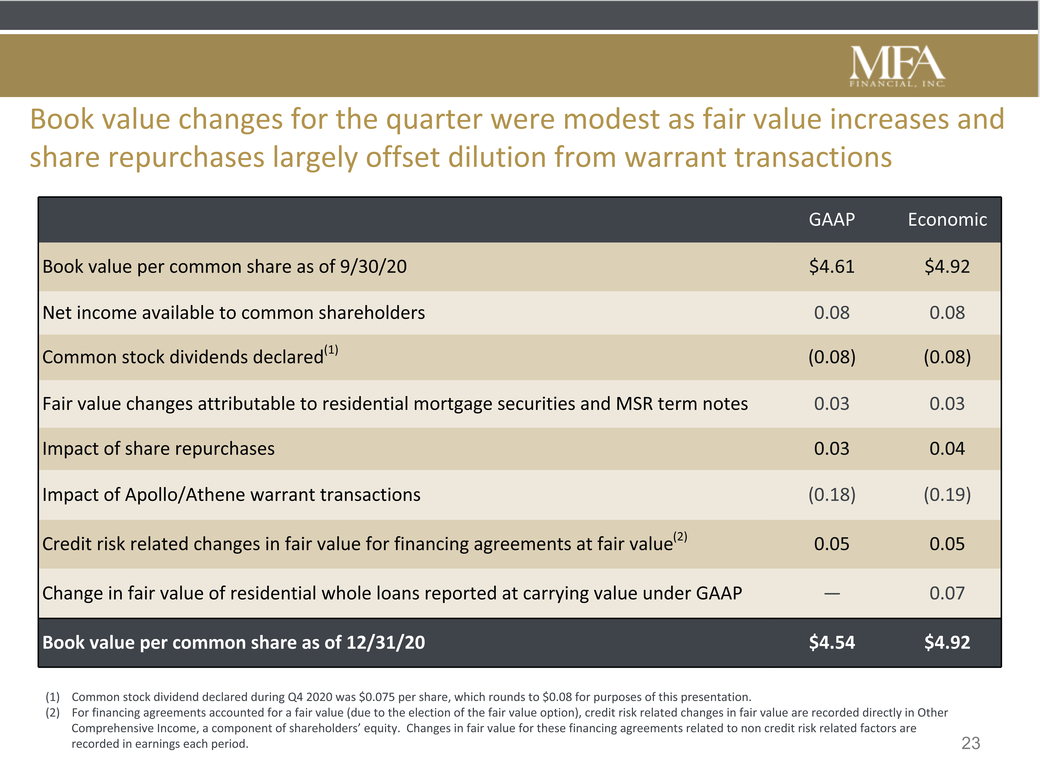
| • | GAAP book value at December 31, 2020 was $4.54 per common share, while Economic book value, a non-GAAP financial measure of MFA’s financial position that adjusts GAAP book value by the amount of unrealized market value changes in residential whole loans held at carrying value for GAAP reporting, was $4.92 per common share at quarter-end. |
1
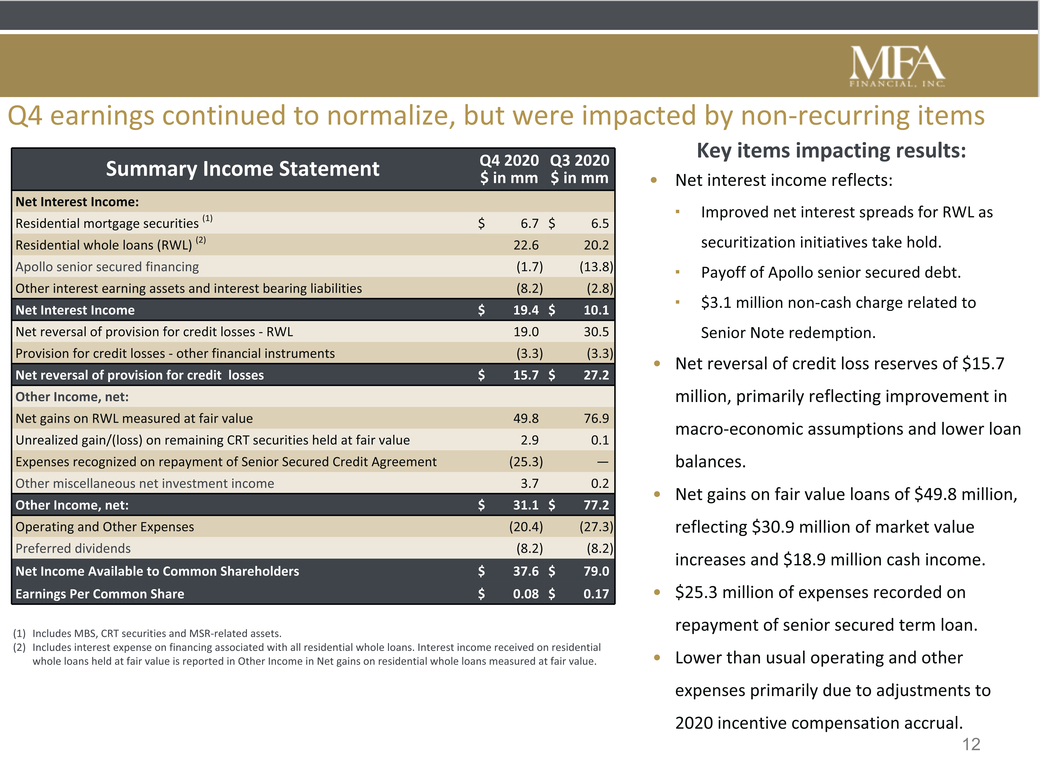
| • | Markets for residential mortgage assets further stabilized following the disruptions experienced earlier in 2020. Earnings and changes in book value continued to be positively impacted by improvements in the values of residential mortgage assets. Income from residential whole loans at fair value included $30.9 million of market value gains, while changes in the fair value of loans held on our balance sheet at carrying value also resulted in an increase in Economic book value during the quarter of approximately $0.07 per common share. While MFA’s fourth quarter financial results had fewer unusual items than prior periods, they were impacted by certain items that will not reoccur in future periods. In particular, fourth quarter net income included expenses totaling $25.3 million (or $0.06 per common share) recognized on the repayment of the senior secured term loan from Apollo and Athene and a $3.1 million non-cash charge (or $0.01 per common share) related to the redemption of our 8% Senior Notes (both items discussed further below). |
| • | Additionally, during the quarter, we completed two transactions with Apollo and Athene that eliminated potential future dilution from the warrants that were issued in connection with the loan. In the first transaction, the Company repurchased, for $33.7 million, approximately 48% of the warrants and in the second transaction, the remaining warrants were exercised by Apollo and Athene, resulting in MFA issuing approximately 12.3 million shares of common stock and receiving $6.5 million in cash. The combined impact of the warrant exercise and repurchase transactions decreased MFA’s GAAP book value per common share by $0.18 and Economic book value per common share by $0.19, reflecting less than 4% dilution of previously reported book value. |
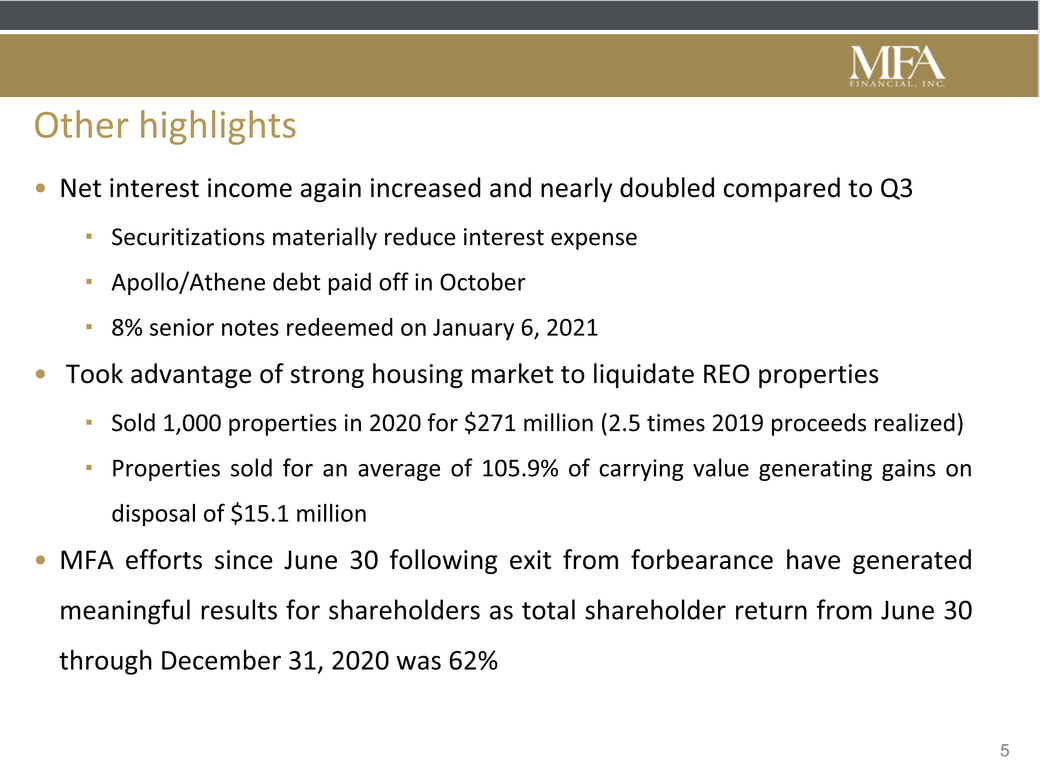
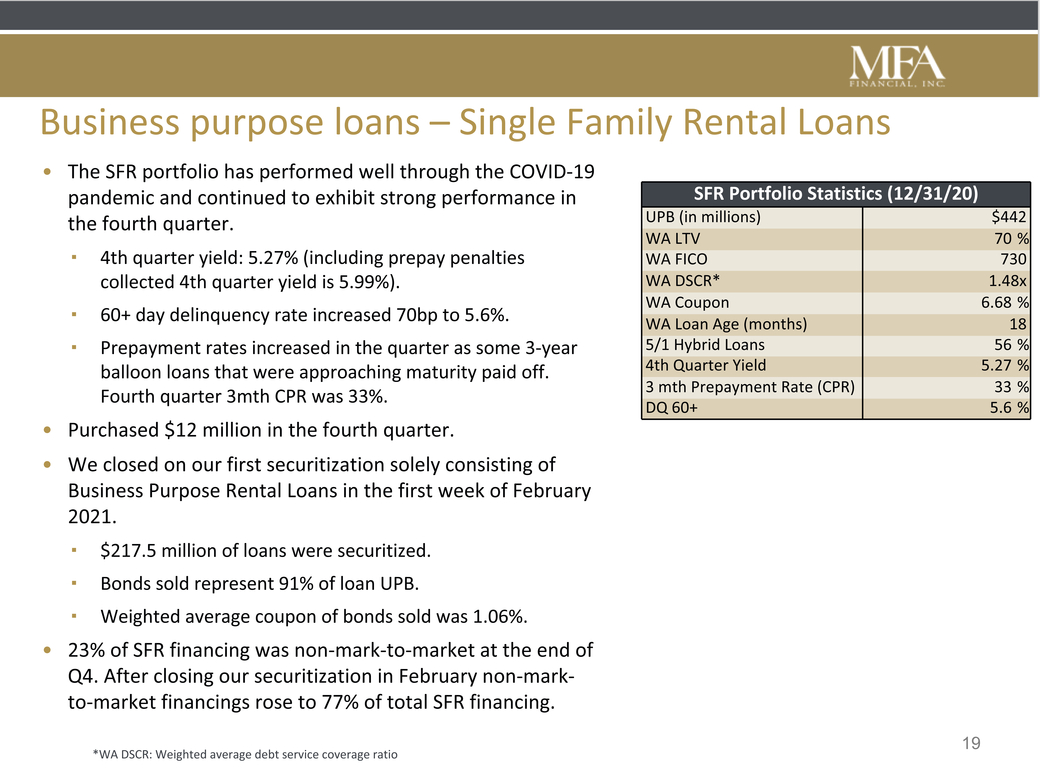
| • | We continued to make significant progress on initiatives to lower the cost of financing our investments with more durable forms of borrowing. During the quarter, we completed two Non-QM securitization transactions, totaling $951.6 million, that generated $214.6 million of additional liquidity and lowered the funding rate for the associated assets by approximately 193 basis points. After the end of the fourth quarter, we completed a securitization solely consisting of $217.5 million of Business Purpose Rental Loans, generating $48.4 million of additional liquidity. As the weighted average coupon of the bonds sold was 1.06%, this transaction is expected to lower the funding rate of the underlying assets by more than 150 basis points. |
| • | During the fourth quarter, under our previously announced stock repurchase program we repurchased 14,085,678 shares of common stock at an average price of approximately $3.61 per share. These repurchases were accretive to MFA’s GAAP book value by $0.03 per common share and Economic book value by $0.04 per common share. |
| • | On January 6, 2021, we completed the redemption of the $100 million 8% Senior Notes due 2042 (the “Senior Notes”). In connection with this redemption, we recorded in our fourth quarter interest expense a non-cash charge of approximately $3.1 million representing remaining unamortized deferred expenses incurred when the Senior Notes were originally issued in 2012. |
Commenting on the fourth quarter 2020 results, Craig Knutson, MFA’s CEO and President said, “MFA’s fourth quarter financial results were a continuation of a return to normal, as we put the capital transactions necessary to emerge from our COVID-19 pandemic-induced distress behind us. The Apollo/Athene debt was fully paid off during the fourth quarter, and the associated warrants have been extinguished through a combination of repurchases and exercise. While the warrant settlement was mildly dilutive, a strong quarter and the impact of accretive common stock repurchases mitigated this dilution, with GAAP book value down just 1.5% and Economic book value flat compared to September 30. The net impact of the warrant transactions decreased reported book value amounts by roughly 3.9%.”
2
Mr. Knutson added, “We continued to make substantial progress on multiple initiatives by seizing market opportunities in the fourth quarter that we believe should have a significant positive impact on our results as we enter 2021. With interest rates at historic lows and robust demand for mortgage credit, particularly rated mortgage credit, we executed two new securitizations in the fourth quarter and another subsequent to year-end. This brings our aggregate securitizations to just over $1.5 billion since September. These transactions substantially reduce our interest costs and also generate significant additional liquidity. In addition to paying off expensive debt (including our 8% Senior Notes that we redeemed in early January), we also deployed capital to repurchase MFA common stock at levels well below book value.”
Mr. Knutson continued, “We also took advantage of a strong housing market to materially reduce our REO portfolio in 2020, selling over 1,000 properties for aggregate proceeds of $271 million, which was nearly 2.5 times the proceeds realized in 2019. These properties sold for an average of 105.9% of carrying value, generating gains on disposal of $15.1 million.”
Q4 2020 Portfolio Activity
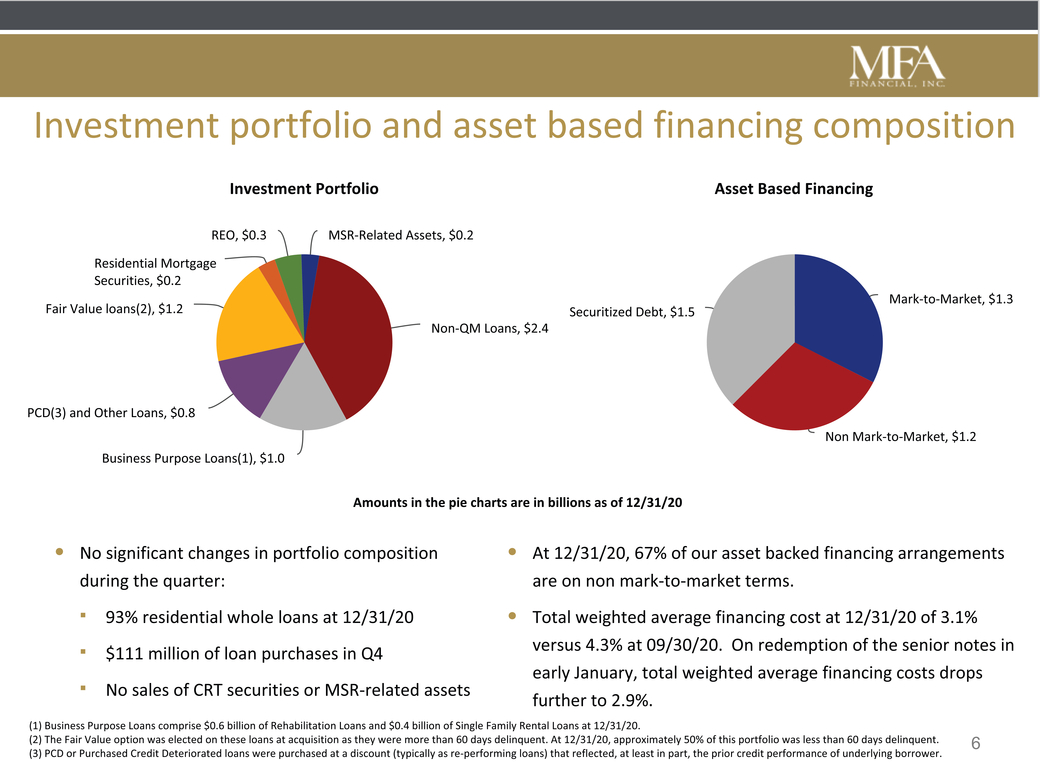
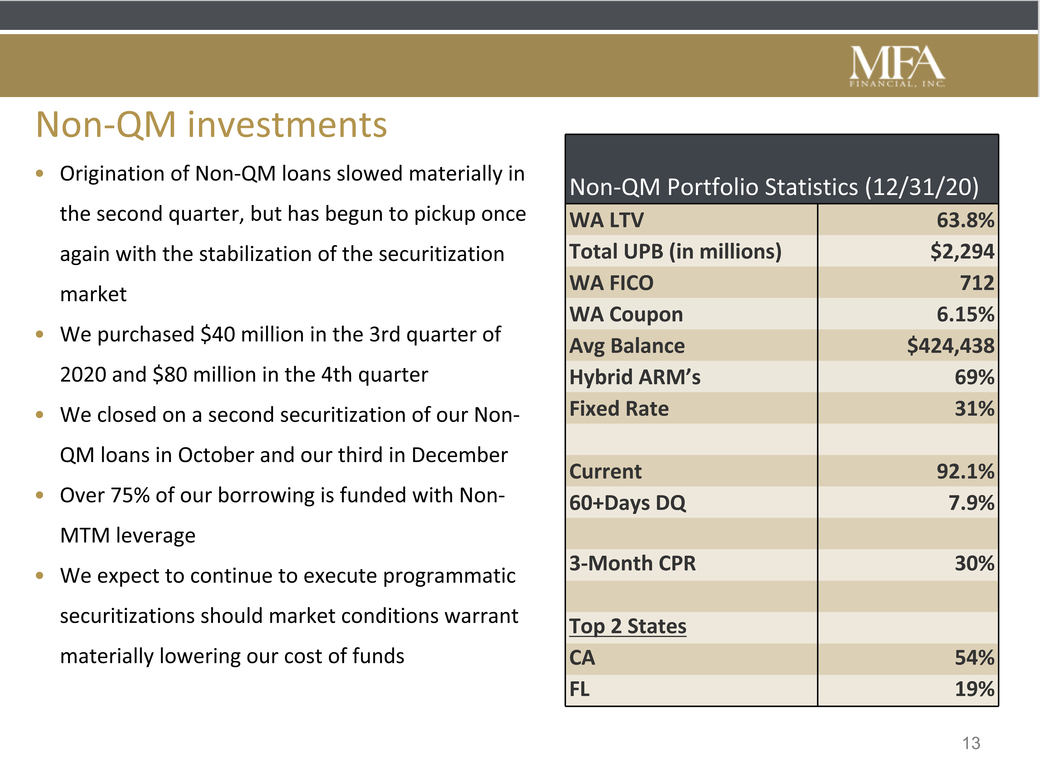
MFA’s residential mortgage investment portfolio decreased by $346.0 million during the fourth quarter, primarily due to portfolio run-off. Acquisition of new investments continued to be modest, with $83.2 million of Non-QM loans and $27.3 million of Business Purpose loans purchased during the quarter.
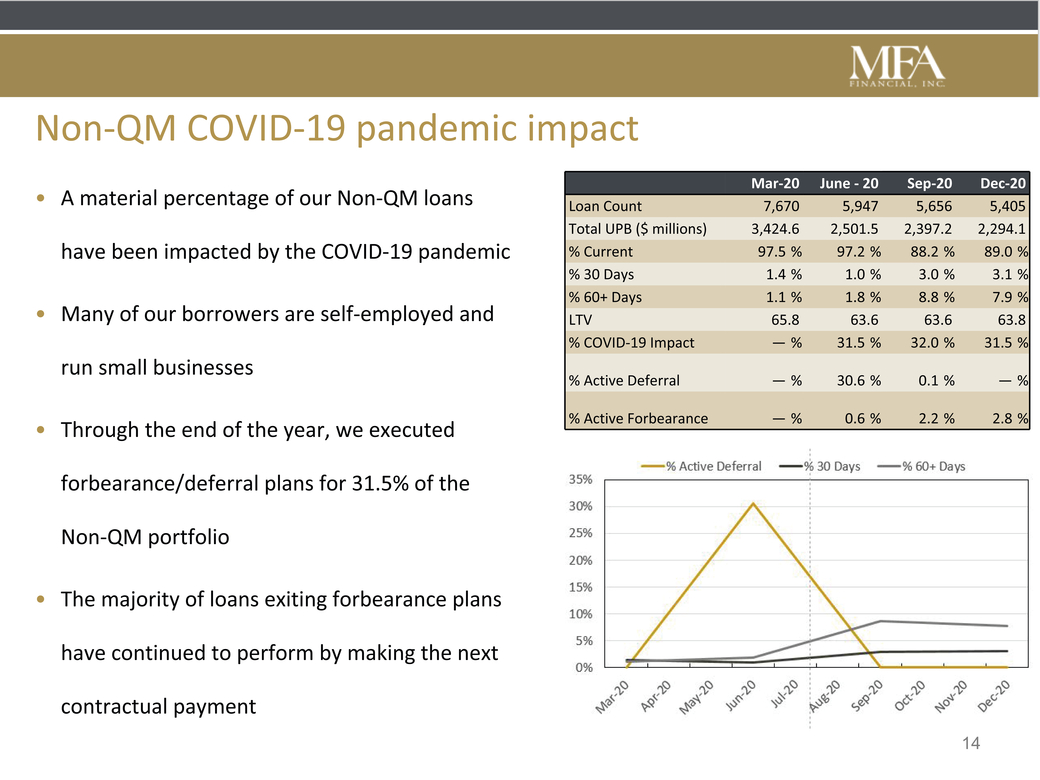
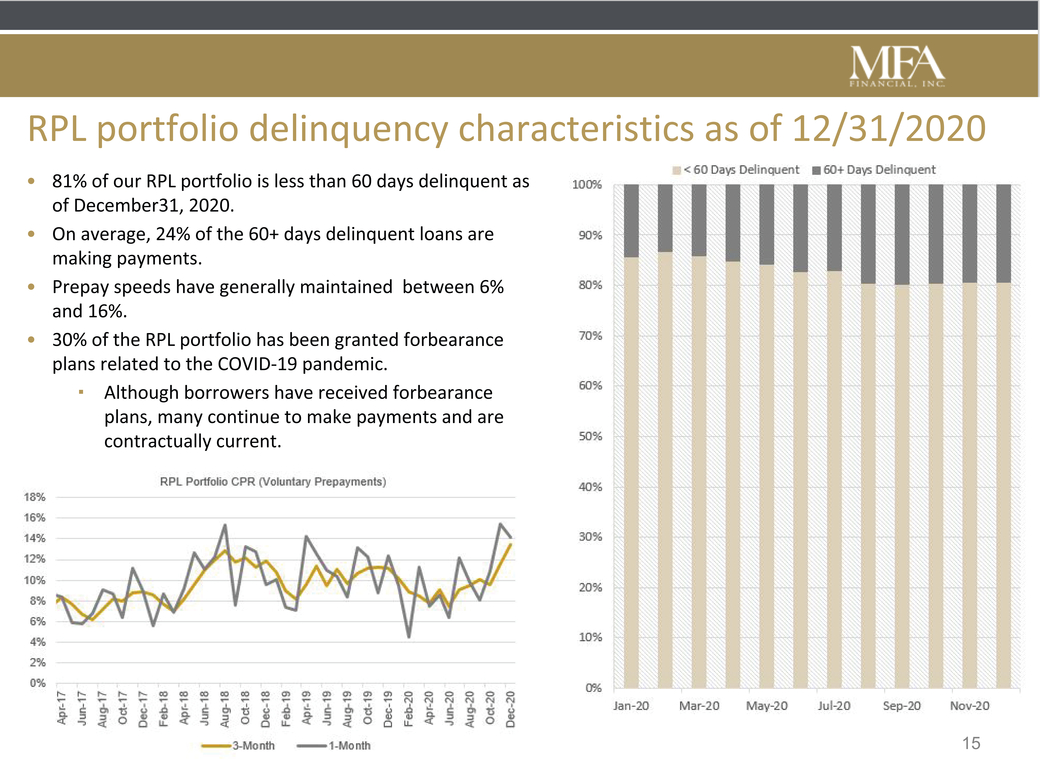
At December 31, 2020, the net carrying value of our investments in residential whole loans totaled $5.3 billion. Of this amount, $4.1 billion is recorded at carrying value and $1.2 billion is recorded at fair value on our consolidated balance sheet. Loans held at carrying value generated an overall yield of 4.66% during the quarter, a slight increase from the prior quarter. Yields on purchased performing loans were essentially unchanged from the prior quarter at 4.57%, while yields on purchased credit deteriorated loans increased to 5.16% from 4.89% in the prior quarter. Overall delinquency rates on loans held at carrying value were largely unchanged from the prior quarter. The amount of Non-QM loans that were 60 or more days delinquent, measured as a percentage of the unpaid principal balance, declined during the quarter and was 7.9% at December 31, 2020, compared to 8.8% at September 30, 2020. In addition, the amount of purchased credit deteriorated loans that were 90 or more days delinquent, measured as a percentage of the unpaid principal balance, marginally increased during the quarter and was 18.5% at December 31, 2020, compared to 18.2% at September 30, 2020. Delinquency levels for our Rehabilitation loans also increased from the prior quarter, with loans that were 60 or more days delinquent totaling $161.8 million, compared to $143.3 million at September 30, 2020.
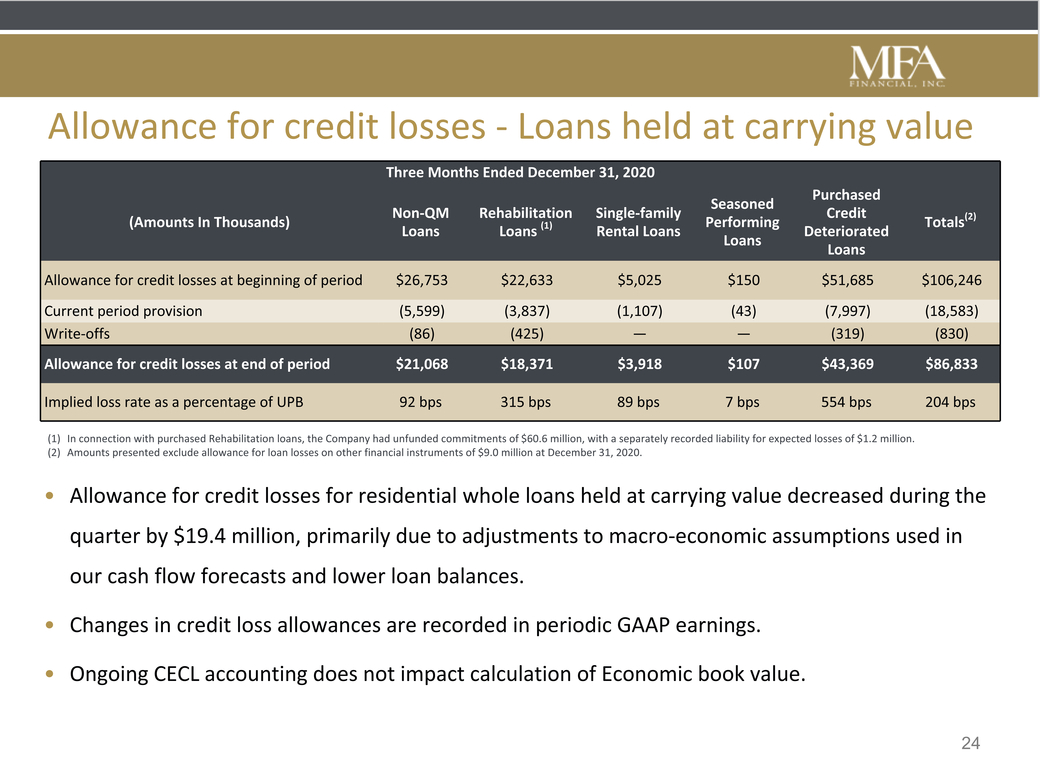
For the fourth quarter, a reversal of the provision for credit losses of $19.0 million was recorded on residential whole loans held at carrying value, primarily reflecting lower estimates of future rates of unemployment and lower loan balances. The total allowance for credit losses recorded on residential whole loans held at carrying value at December 31, 2020 was $86.8 million. In addition, as of December 31, 2020, reserves for credit losses totaling approximately $1.2 million were recorded related to undrawn commitments on loans held at carrying value. Further, we recorded a provision for credit losses on other financial instruments of $3.3 million during the fourth quarter. The total allowance for credit losses on other financial instruments was $9.0 million as of December 31, 2020.
3
Net gains for the quarter on residential whole loans measured at fair value through earnings were $49.8 million, including unrealized gains in the fair value of the underlying loans of $30.9 million, and $18.9 million of coupon interest payments and other gains realized during the quarter. The percentage amount of fair value loans that were 90 or more days delinquent decreased to 47.0% at December 31, 2020 from 49.0% at September 30, 2020.
In addition, as of the end of the quarter, we held approximately $250 million of REO properties, which has decreased from $299 million as of the end of the third quarter as foreclosure activity in recent months has slowed, while asset sales continued. MFA’s proactive asset management team has been able to shorten liquidation timelines and increase property sale proceeds, leading to improved outcomes and better returns.
At the end of the fourth quarter, MFA held approximately $53.9 million of RPL/NPL MBS. In addition, our investments in MSR-related assets totaled $239.0 million at December 31, 2020. Our investments in CRT securities totaled $104.2 million at December 31, 2020.
Expenses recognized on repayment of senior secured term loan
Included in Other income are expenses of approximately $25.3 million recorded on the repayment of the remaining balance of the $500 million senior secured term loan from Apollo and Athene that was obtained on June 26, 2020. These expenses are recognized as the loan was repaid at its par value and include accelerated accretion of original issue discount and the reversal of unrealized market value gains recorded in the prior quarter.
Impact of warrant transactions
During the quarter, the Company repurchased approximately 48% of the warrants that were issued to Apollo and Athene in connection with the senior secured term loan. These warrants were repurchased for $33.7 million, reflecting the market value of the warrants at the time of repurchase. The impact of this transaction is reflected directly in the Company’s stockholders’ equity and had no impact on current period net income. In addition, the remaining warrants were exercised by Apollo and Athene late in the quarter, resulting in the Company issuing approximately 12.3 million shares of common stock and receiving $6.5 million in cash.
General and Administrative and other expenses
For the three months ended December 31, 2020, MFA’s costs for compensation and benefits and other general and administrative expenses were $8.6 million, or an annualized 1.37% of average stockholders’ equity for the quarter ended December 31, 2020. Compensation related expenses for the quarter were lower than our normal expected run rate, primarily due to the finalization of incentive compensation accruals for 2020, which resulted in a reduction in accrued incentive compensation of approximately $3.1 million.
4
Stock Repurchase Program
On November 2, 2020, MFA’s Board of Directors authorized a share repurchase program under which MFA may repurchase up to $250 million of its common stock through the end of 2022. Under this program during the fourth quarter, the Company repurchased 14,085,678 shares of common stock at an average price of approximately $3.61 per share. In addition, as previously discussed, during the year ended December 31, 2020 the Company repurchased 17,593,576 warrants for $33.7 million that were included in the stock repurchase program. As of December 31, 2020, the Company was permitted to purchase an additional $165.7 million of its common stock.
MFA expects to fund the share repurchases from current cash balances and future investment portfolio run-off. The Company currently has approximately 451.7 million shares of common stock outstanding.
5
The following table presents MFA’s asset allocation as of December 31, 2020, and the fourth quarter 2020 yield on average interest-earning assets, average cost of funds and net interest rate spread for the various asset types.
Table 1 - Asset Allocation
| At December 31, 2020 | Residential Whole Loans, at Carrying Value (1) | Residential Whole Loans, at Fair Value | Residential Mortgage Securities | MSR- Related Assets | Other, net (2) | Total | ||||||||||||||||||
| ($ in Millions) | ||||||||||||||||||||||||
| Fair Value/Carrying Value | $ | 4,108 | $ | 1,217 | $ | 161 | $ | 239 | $ | 1,137 | $ | 6,862 | ||||||||||||
| Financing Agreements with non-mark-to-market collateral provisions | (906 | ) | (253 | ) | — | — | — | (1,159 | ) | |||||||||||||||
| Financing Agreements with mark-to-market collateral provisions | (839 | ) | (285 | ) | (89 | ) | (125 | ) | — | (1,338 | ) | |||||||||||||
| Less Securitized Debt | (1,261 | ) | (254 | ) | — | — | — | (1,515 | ) | |||||||||||||||
| Less Convertible Senior Notes | — | — | — | — | (225 | ) | (225 | ) | ||||||||||||||||
| Less Senior Notes | — | — | — | — | (100 | ) | (100 | ) | ||||||||||||||||
| Net Equity Allocated | $ | 1,102 | $ | 425 | $ | 72 | $ | 114 | $ | 812 | $ | 2,525 | ||||||||||||
| Debt/Net Equity Ratio (3) | 2.7 | x | 1.9 | x | 1.2 | x | 1.1 | x | 1.7 | x | ||||||||||||||
| For the Quarter Ended December 31, 2020 | ||||||||||||||||||||||||
| Yield on Average Interest Earning Assets (4)(5) | 4.66 | % | N/A | 7.22 | % | 12.27 | % | 4.44 | % | |||||||||||||||
| Less Average Cost of Funds (6) | (2.81 | ) | (3.57 | ) | (2.71 | ) | (2.67 | ) | (3.37 | ) | ||||||||||||||
| Net Interest Rate Spread | 1.85 | % | N/A | 4.51 | % | 9.60 | % | 1.07 | % | |||||||||||||||
| (1) | Includes $2.3 billion of Non-QM loans, $563.4 million of Rehabilitation loans, $442.5 million of Single-family rental loans, $136.2 million of Seasoned performing loans and $630.3 million of Purchased Credit Deteriorated Loans. At December 31, 2020, the total fair value of these loans is estimated to be approximately $4.3 billion. |
| (2) | Includes $814.4 million of cash and cash equivalents, $7.2 million of restricted cash, $249.7 million of real estate owned, and $47.1 million of capital contributions made to loan origination partners, as well as other assets and other liabilities. |
| (3) | Total Debt/Net Equity ratio represents the sum of borrowings under our financing agreements noted above as a multiple of net equity allocated. |
| (4) | Yields reported on our interest earning assets are calculated based on the interest income recorded and the average amortized cost for the quarter of the respective asset. At December 31, 2020, the amortized cost of our interest earning assets were as follows: Legacy Non-Agency MBS - $2.2 million; RPL/NPL MBS - $46.9 million; Credit Risk Transfer securities - $86.2 million; Residential Whole Loans at carrying value - $4.2 billion; and MSR-related assets - $184.9 million. In addition, the yield for residential whole loans at carrying value was 4.61%, net of 5 basis points of servicing fee expense incurred during the quarter. For GAAP reporting purposes, such expenses are included in Loan servicing and other related operating expenses in our statement of operations. |
| (5) | Interest payments received on residential whole loans at fair value is reported in Other Income as Net (loss)/gain on residential whole loans measured at fair value through earnings in our statement of operations. Accordingly, no yield is presented as such loans are not included in interest earning assets for reporting purposes. |
| (6) | Average cost of funds includes interest on financing agreements, Convertible Senior Notes, Senior Notes, securitized debt and Secured Term notes. Total average cost of funds excludes the non-cash charge of $3.1 million recorded in connection with the redemption of the Senior Notes that was completed early in 2021. |
6
The following table presents the activity for our residential mortgage asset portfolio for the three months ended December 31, 2020:
Table 2 - Investment Portfolio Activity Q4 2020
| (In Millions) | September 30, 2020 | Runoff (1) | Acquisitions | Other (2) | December 31, 2020 | Change | ||||||||||||||||||
| Residential whole loans and REO | $ | 5,916 | $ | (511 | ) | $ | 111 | $ | 59 | $ | 5,575 | $ | (341 | ) | ||||||||||
| MSR-related assets | 252 | (21 | ) | — | 8 | 239 | (13 | ) | ||||||||||||||||
| Residential mortgage securities | 153 | (2 | ) | — | 10 | 161 | 8 | |||||||||||||||||
| Totals | $ | 6,321 | $ | (534 | ) | $ | 111 | $ | 77 | $ | 5,975 | $ | (346 | ) | ||||||||||
| (1) | Primarily includes principal repayments, cash collections on Purchased Credit Deteriorated Loans and sales of REO. |
| (2) | Primarily includes changes in fair value and adjustments to record lower of cost or estimated fair value adjustments on REO. |
The following tables present information on our investments in residential whole loans.
Residential Whole Loans, at Carrying Value at December 31, 2020 and December 31, 2019:
Table 3 - Portfolio composition
| (Dollars In Thousands) | December 31, 2020 | December 31, 2019 | ||||||
| Purchased Performing Loans: | ||||||||
| Non-QM loans | $ | 2,357,185 | $ | 3,707,245 | ||||
| Rehabilitation loans | 581,801 | 1,026,097 | ||||||
| Single-family rental loans | 446,374 | 460,742 | ||||||
| Seasoned performing loans | 136,264 | 176,569 | ||||||
| Total Purchased Performing Loans | 3,521,624 | 5,370,653 | ||||||
| Purchased Credit Deteriorated Loans (1) | 673,708 | 698,717 | ||||||
| Total Residential whole loans, at carrying value | $ | 4,195,332 | $ | 6,069,370 | ||||
| Allowance for credit losses on residential whole loans held at carrying value | (86,833 | ) | (3,025 | ) | ||||
| Total Residential whole loans at carrying value, net | $ | 4,108,499 | $ | 6,066,345 | ||||
| Number of loans | 13,112 | 17,082 | ||||||
| (1) | The amortized cost basis of Purchased Credit Deteriorated Loans was increased by $62.6 million on January 1, 2020 in connection with the adoption of ASU 2016-13. |
7
Table 4 - Yields and average balances
| For the Three-Month Period Ended | ||||||||||||||||||||||||||||||||||||
| (Dollars in Thousands) | December 31, 2020 | September 30, 2020 | December 31, 2019 | |||||||||||||||||||||||||||||||||
| Interest | Average Balance | Average Yield (1) | Interest | Average Balance | Average Yield | Interest | Average Balance | Average Yield | ||||||||||||||||||||||||||||
| Purchased Performing Loans: | ||||||||||||||||||||||||||||||||||||
| Non-QM loans | $ | 24,316 | $ | 2,435,751 | 3.99 | % | $ | 25,884 | $ | 2,534,967 | 4.08 | % | $ | 37,032 | $ | 3,130,041 | 4.73 | % | ||||||||||||||||||
| Rehabilitation loans | 9,983 | 669,320 | 5.97 | % | 10,863 | 802,661 | 5.41 | % | 16,087 | 1,010,975 | 6.36 | % | ||||||||||||||||||||||||
| Single-family rental loans | 6,193 | 470,197 | 5.27 | % | 6,917 | 489,536 | 5.65 | % | 6,091 | 404,600 | 6.02 | % | ||||||||||||||||||||||||
| Seasoned performing loans | 1,993 | 143,926 | 5.54 | % | 1,945 | 153,003 | 5.08 | % | 2,730 | 184,532 | 5.92 | % | ||||||||||||||||||||||||
| Total Purchased Performing Loans | 42,485 | 3,719,194 | 4.57 | % | 45,609 | 3,980,167 | 4.58 | % | 61,940 | 4,730,148 | 5.24 | % | ||||||||||||||||||||||||
| Purchased Credit Deteriorated Loans | 8,973 | 694,988 | 5.16 | % | 8,784 | 718,957 | 4.89 | % | 10,314 | 712,914 | 5.79 | % | ||||||||||||||||||||||||
| Total Residential whole loans, at carrying value | $ | 51,458 | $ | 4,414,182 | 4.66 | % | $ | 54,393 | $ | 4,699,124 | 4.63 | % | $ | 72,254 | $ | 5,443,062 | 5.31 | % | ||||||||||||||||||
| (1) | Average yield reported for Single-family rental loans for the three-month period ended December 31, 2020 excludes $846,000 of prepayment penalties that are collected on loans that payoff before a specified date. For GAAP reporting purposes prepayment penalties are reported in Other income. If such fees were included in interest income, the reported yield for the period ended December 31, 2020 would have been 5.99%. |
8
Table 5 - Credit related metrics
December 31, 2020
| Weighted | ||||||||||||||||||||||||||||||||||||||||||||
| Unpaid | Weighted | Average | Weighted | Weighted | ||||||||||||||||||||||||||||||||||||||||
| Principal | Average | Term to | Average | Average | Aging by Amortized Cost Basis | |||||||||||||||||||||||||||||||||||||||
| Carrying | Amortized | Balance | Coupon | Maturity | LTV | Original | Past Due Days | |||||||||||||||||||||||||||||||||||||
| (Dollars In Thousands) | Value | Cost Basis | (“UPB”) | (1) | (Months) | Ratio (2) | FICO (3) | Current | 30-59 | 60-89 | 90+ | |||||||||||||||||||||||||||||||||
| Purchased Performing Loans: | ||||||||||||||||||||||||||||||||||||||||||||
| Non-QM loans (4) | $ | 2,336,117 | $ | 2,357,185 | $ | 2,294,086 | 5.84 | % | 351 | 64 | % | 712 | $ | 2,099,134 | $ | 73,163 | $ | 36,501 | $ | 148,387 | ||||||||||||||||||||||||
| Rehabilitation loans (4) | 563,430 | 581,801 | 581,801 | 7.29 | 3 | 63 | 719 | 390,706 | 29,315 | 25,433 | 136,347 | |||||||||||||||||||||||||||||||||
| Single-family rental loans (4) | 442,456 | 446,374 | 442,208 | 6.32 | 324 | 70 | 730 | 415,386 | 6,652 | 3,948 | 20,388 | |||||||||||||||||||||||||||||||||
| Seasoned performing loans (4) | 136,157 | 136,264 | 149,004 | 3.30 | 171 | 40 | 723 | 124,877 | 2,186 | 1,170 | 8,031 | |||||||||||||||||||||||||||||||||
| Purchased Credit Deteriorated Loans (4)(5) | 630,339 | 673,708 | 782,319 | 4.46 | 287 | 76 | N/A | N/M | N/M | N/M | 119,621 | |||||||||||||||||||||||||||||||||
| Residential whole loans, at carrying value, total or weighted average | $ | 4,108,499 | $ | 4,195,332 | $ | 4,249,418 | 5.77 | % | 282 | |||||||||||||||||||||||||||||||||||
December 31, 2019
| Weighted | ||||||||||||||||||||||||||||||||||||||||||||
| Unpaid | Weighted | Average | Weighted | Weighted | ||||||||||||||||||||||||||||||||||||||||
| Principal | Average | Term to | Average | Average | Aging by Amortized Cost Basis | |||||||||||||||||||||||||||||||||||||||
| Carrying | Amortized | Balance | Coupon | Maturity | LTV | Original | Past Due Days | |||||||||||||||||||||||||||||||||||||
| (Dollars In Thousands) | Value | Cost Basis | (“UPB”) | (1) | (Months) | Ratio (2) | FICO (3) | Current | 30-59 | 60-89 | 90+ | |||||||||||||||||||||||||||||||||
| Purchased Performing Loans: | ||||||||||||||||||||||||||||||||||||||||||||
| Non-QM loans (4) | $ | 3,706,857 | $ | 3,707,245 | $ | 3,592,701 | 5.96 | % | 368 | 67 | % | 716 | $ | 3,492,533 | $ | 59,963 | $ | 19,605 | $ | 20,600 | ||||||||||||||||||||||||
| Rehabilitation loans (4) | 1,023,766 | 1,026,097 | 1,026,097 | 7.30 | 8 | 64 | 717 | 868,281 | 67,747 | 27,437 | 62,632 | |||||||||||||||||||||||||||||||||
| Single-family rental loans (4) | 460,679 | 460,741 | 457,146 | 6.29 | 324 | 70 | 734 | 432,936 | 15,948 | 2,047 | 6,215 | |||||||||||||||||||||||||||||||||
| Seasoned performing loans | 176,569 | 176,569 | 192,151 | 4.24 | 181 | 46 | 723 | 187,683 | 2,164 | 430 | 1,874 | |||||||||||||||||||||||||||||||||
| Purchased Credit Impaired Loans (5) | 698,474 | 698,718 | 873,326 | 4.46 | 294 | 81 | N/A | N/M | N/M | N/M | 108,998 | |||||||||||||||||||||||||||||||||
| Residential whole loans, at carrying value, total or weighted average | $ | 6,066,345 | $ | 6,069,370 | $ | 6,141,421 | 5.96 | % | 288 | |||||||||||||||||||||||||||||||||||
| (1) | Weighted average is calculated based on the interest bearing principal balance of each loan within the related category. For loans acquired with servicing rights released by the seller, interest rates included in the calculation do not reflect loan servicing fees. For loans acquired with servicing rights retained by the seller, interest rates included in the calculation are net of servicing fees. |
| (2) | LTV represents the ratio of the total unpaid principal balance of the loan to the estimated value of the collateral securing the related loan as of the most recent date available, which may be the origination date. For Rehabilitation loans, the LTV presented is the ratio of the maximum unpaid principal balance of the loan, including unfunded commitments, to the estimated “after repaired” value of the collateral securing the related loan, where available. For certain Rehabilitation loans, totaling $189.9 million and $269.2 million at December 31, 2020 and December 31, 2019, respectively, an after repaired valuation was not obtained and the loan was underwritten based on an “as is” valuation. The weighted average LTV of these loans based on the current unpaid principal balance and the valuation obtained during underwriting, is 68% and 69% at December 31, 2020 and December 31, 2019, respectively. Excluded from the calculation of weighted average LTV are certain low value loans secured by vacant lots, for which the LTV ratio is not meaningful. |
| (3) | Excludes loans for which no Fair Isaac Corporation (“FICO”) score is available. |
| (4) | At December 31, 2020 and December 31, 2019 the difference between the Carrying Value and Amortized Cost Basis represents the related allowance for credit losses. |
| (5) | Purchased Credit Deteriorated Loans tend to be characterized by varying performance of the underlying borrowers over time, including loans where multiple months of payments are received in a period to bring the loan to current status, followed by months where no payments are received. Accordingly, delinquency information is presented for loans that are more than 90 days past due that are considered to be seriously delinquent. |
9
Table 6 - LTV 90+ Days Delinquencies
The following table presents certain information regarding the Company’s Residential whole loans that are 90 days or more delinquent:
| December 31, 2020 | ||||||||||||
| (Dollars In Thousands) | Carrying Value / Fair Value | UPB | LTV (1) | |||||||||
| Purchased Credit Deteriorated Loans | $ | 119,621 | $ | 145,028 | 86.7 | % | ||||||
| Non-QM loans | $ | 148,387 | $ | 144,681 | 65.9 | % | ||||||
| Rehabilitation loans | $ | 136,347 | $ | 136,347 | 65.8 | % | ||||||
| Single-family rental loans | $ | 20,388 | $ | 20,233 | 72.7 | % | ||||||
| Seasoned performing loans | $ | 8,031 | $ | 8,823 | 55.1 | % | ||||||
| Residential whole loans, at fair value | $ | 571,729 | $ | 625,621 | 86.8 | % | ||||||
| (1) | LTV represents the ratio of the total unpaid principal balance of the loan to the estimated value of the collateral securing the related loan as of the most recent date available, which may be the origination date. For Rehabilitation loans, the LTV presented is the ratio of the maximum unpaid principal balance of the loan, including unfunded commitments, to the estimated “after repaired” value of the collateral securing the related loan, where available. For certain Rehabilitation loans, an after repaired valuation was not obtained and the loan was underwritten based on an “as is” valuation. Excluded from the calculation of weighted average LTV are certain low value loans secured by vacant lots, for which the LTV ratio is not meaningful. |
Table 7 - Allowance for Credit Losses
The following table presents a roll-forward of the allowance for credit losses on the Company’s Residential Whole Loans, at Carrying Value:
| For the Year Ended December 31, 2020 | ||||||||||||||||||||||||
| (Dollars In Thousands) | Non-QM Loans |
Rehabilitation Loans (1)(2) | Single-family Rental Loans | Seasoned Performing Loans | Purchased Credit Deteriorated Loans (3) | Totals | ||||||||||||||||||
| Allowance for credit losses at December 31, 2019 | $ | 388 | $ | 2,331 | $ | 62 | $ | — | $ | 244 | $ | 3,025 | ||||||||||||
| Transition adjustment on adoption of ASU 2016-13 (4) | 6,904 | 517 | 754 | 19 | 62,361 | 70,555 | ||||||||||||||||||
| Current provision | 26,358 | 33,213 | 6,615 | 230 | 8,481 | 74,897 | ||||||||||||||||||
| Write-offs | — | (428 | ) | — | — | (219 | ) | (647 | ) | |||||||||||||||
| Valuation adjustment on loans held for sale | 70,181 | — | — | — | — | 70,181 | ||||||||||||||||||
| Allowance for credit and valuation losses at March 31, 2020 | $ | 103,831 | $ | 35,633 | $ | 7,431 | $ | 249 | $ | 70,867 | $ | 218,011 | ||||||||||||
| Current provision/(reversal) | (2,297 | ) | (5,213 | ) | (500 | ) | (25 | ) | (2,579 | ) | (10,614 | ) | ||||||||||||
| Write-offs | — | (420 | ) | — | — | (207 | ) | (627 | ) | |||||||||||||||
| Valuation adjustment on loans held for sale | (70,181 | ) | — | — | — | — | (70,181 | ) | ||||||||||||||||
| Allowance for credit losses at June 30, 2020 | $ | 31,353 | $ | 30,000 | $ | 6,931 | $ | 224 | $ | 68,081 | $ | 136,589 | ||||||||||||
| Current provision/(reversal) | (4,568 | ) | (7,140 | ) | (1,906 | ) | (74 | ) | (16,374 | ) | (30,062 | ) | ||||||||||||
| Write-offs | (32 | ) | (227 | ) | — | — | (22 | ) | (281 | ) | ||||||||||||||
| Allowance for credit losses at September 30, 2020 | $ | 26,753 | $ | 22,633 | $ | 5,025 | $ | 150 | $ | 51,685 | $ | 106,246 | ||||||||||||
| Current provision/(reversal) | (5,599 | ) | (3,837 | ) | (1,107 | ) | (43 | ) | (7,997 | ) | (18,583 | ) | ||||||||||||
| Write-offs | (86 | ) | (425 | ) | — | — | (319 | ) | (830 | ) | ||||||||||||||
| Allowance for credit losses at December 31, 2020 | $ | 21,068 | $ | 18,371 | $ | 3,918 | $ | 107 | $ | 43,369 | $ | 86,833 | ||||||||||||
10
| For the Year Ended December 31, 2019 | ||||||||||||||||||||||||
| (Dollars In Thousands) | Non-QM Loans |
Rehabilitation Loans |
Single-family Rental Loans |
Seasoned Performing Loans |
Purchased Credit Deteriorated Loans |
Totals | ||||||||||||||||||
| Allowance for credit losses at December 31, 2018 | $ | — | $ | — | $ | — | $ | — | $ | 968 | $ | 968 | ||||||||||||
| Current provision | — | 500 | — | — | 183 | 683 | ||||||||||||||||||
| Write-offs | — | — | — | — | — | — | ||||||||||||||||||
| Allowance for credit losses at March 31, 2019 | $ | — | $ | 500 | $ | — | $ | — | $ | 1,151 | $ | 1,651 | ||||||||||||
| Current provision | — | — | — | — | 385 | 385 | ||||||||||||||||||
| Write-offs | — | (50 | ) | — | — | — | (50 | ) | ||||||||||||||||
| Allowance for credit losses at June 30, 2019 | $ | — | $ | 450 | $ | — | $ | — | $ | 1,536 | $ | 1,986 | ||||||||||||
| Current provision | — | — | — | — | 347 | 347 | ||||||||||||||||||
| Write-offs | — | (62 | ) | — | — | — | (62 | ) | ||||||||||||||||
| Allowance for credit losses at September 30, 2019 | $ | — | $ | 388 | $ | — | $ | — | $ | 1,883 | $ | 2,271 | ||||||||||||
| Current provision/(reversal) | 388 | 2,220 | 62 | — | (1,639 | ) | 1,031 | |||||||||||||||||
| Write-offs | — | (277 | ) | — | — | — | (277 | ) | ||||||||||||||||
| Allowance for credit losses at December 31, 2019 | $ | 388 | $ | 2,331 | $ | 62 | $ | — | $ | 244 | $ | 3,025 | ||||||||||||
| (1) | In connection with purchased Rehabilitation loans, the Company had unfunded commitments of $60.6 million, with an allowance for credit losses of $1.2 million at December 31, 2020. Such allowance is included in “Other liabilities” in the Company’s consolidated balance sheets. |
| (2) | Includes $161.8 million of loans that were assessed for credit losses based on a collateral dependent methodology. |
| (3) | Includes $70.3 million of loans that were assessed for credit losses based on a collateral dependent methodology. |
| (4) | Of the $70.6 million of reserves recorded on adoption of ASU 2016-13, $8.3 million was recorded as an adjustment to stockholders’ equity and $62.4 million was recorded as a “gross up” of the amortized cost basis of Purchased Credit Deteriorated Loans. |
11
Residential Whole Loans, at fair value at December 31, 2020 and December 31, 2019:
Table 8 - Credit related metrics
| (Dollars in Thousands) | December 31, 2020 | December 31, 2019 | ||||||||
| Less than 60 Days Past Due: | ||||||||||
| Outstanding principal balance | $ | 602,292 | $ | 666,026 | ||||||
| Aggregate fair value | $ | 595,521 | $ | 641,616 | ||||||
| Weighted Average LTV Ratio (1) | 72.57 | % | 76.69 | % | ||||||
| Number of loans | 3,033 | 3,159 | ||||||||
| 60 Days to 89 Days Past Due: | ||||||||||
| Outstanding principal balance | $ | 54,180 | $ | 58,160 | ||||||
| Aggregate fair value | $ | 49,652 | $ | 53,485 | ||||||
| Weighted Average LTV Ratio (1) | 82.11 | % | 79.48 | % | ||||||
| Number of loans | 263 | 313 | ||||||||
| 90 Days or More Past Due: | ||||||||||
| Outstanding principal balance | $ | 625,621 | $ | 767,320 | ||||||
| Aggregate fair value | $ | 571,729 | $ | 686,482 | ||||||
| Weighted Average LTV Ratio (1) | 86.78 | % | 89.69 | % | ||||||
| Number of loans | 2,326 | 2,983 | ||||||||
| Total Residential whole loans, at fair value | $ | 1,216,902 | $ | 1,381,583 | ||||||
| (1) | LTV represents the ratio of the total unpaid principal balance of the loan, to the estimated value of the collateral securing the related loan. Excluded from the calculation of weighted average LTV are certain low value loans secured by vacant lots, for which the LTV ratio is not meaningful. |
Table 9 - Net gain on residential whole loans measured at fair value through earnings
| For the Year Ended December 31, | |||||||
| (In Thousands) | 2020 | 2019 | |||||
| Coupon payments, realized gains, and other income received (1) | $ | 72,700 | $ | 91,438 | |||
| Net unrealized gains | 17,204 | 47,849 | |||||
| Net gain on transfers to REO | 4,309 | 19,043 | |||||
| Total | $ | 94,213 | $ | 158,330 | |||
| (1) | Primarily includes gains on liquidation of non-performing loans, including the recovery of delinquent interest payments, recurring coupon interest payments received on mortgage loans that are contractually current, and cash payments received from private mortgage insurance on liquidated loans. |
12
Webcast
MFA Financial, Inc. plans to host a live audio webcast of its investor conference call on Tuesday, February 23, 2021, at 10:00 a.m. (Eastern Time) to discuss its fourth quarter 2020 financial results. The live audio webcast will be accessible to the general public over the internet at http://www.mfafinancial.com through the “Webcasts & Presentations” link on MFA’s home page. To listen to the conference call over the internet, please go to the MFA website at least 15 minutes before the call to register and to download and install any needed audio software. Earnings presentation materials will be posted on the MFA website prior to the conference call and an audio replay will be available on the website following the call.
Cautionary Language Regarding Forward-Looking Statements
When used in this press release or other written or oral communications, statements which are not historical in nature, including those containing words such as “will,” “believe,” “expect,” “anticipate,” “estimate,” “plan,” “continue,” “intend,” “should,” “could,” “would,” “may,” the negative of these words or similar expressions, are intended to identify “forward-looking statements” within the meaning of Section 27A of the Securities Act of 1933, as amended, and Section 21E of the Securities Exchange Act of 1934, as amended, and, as such, may involve known and unknown risks, uncertainties and assumptions. These forward-looking statements include information about possible or assumed future results with respect to our business, financial condition, liquidity, results of operations, plans and objectives. Statements regarding the following subjects, among others, may be forward-looking: risks related to the ongoing spread of the novel coronavirus and the COVID-19 pandemic, including the pandemic’s effect on the general economy and our business, financial position and results of operations (including, among other potential effects, increased delinquencies and greater than expected losses in our whole loan portfolio); changes in interest rates and the market (i.e., fair) value of MFA’s residential whole loans, MBS and other assets; changes in the prepayment rates on residential mortgage assets, an increase of which could result in a reduction of the yield on certain investments in its portfolio and could require MFA to reinvest the proceeds received by it as a result of such prepayments in investments with lower coupons, while a decrease in which could result in an increase in the interest rate duration of certain investments in MFA’s portfolio making their valuation more sensitive to changes in interest rates and could result in lower forecasted cash flows; credit risks underlying MFA’s assets, including changes in the default rates and management’s assumptions regarding default rates on the mortgage loans in MFA’s residential whole loan portfolio; MFA’s ability to borrow to finance its assets and the terms, including the cost, maturity and other terms, of any such borrowings; implementation of or changes in government regulations or programs affecting MFA’s business; MFA’s estimates regarding taxable income, the actual amount of which is dependent on a number of factors, including, but not limited to, changes in the amount of interest income and financing costs, the method elected by MFA to accrete the market discount on residential whole loans and the extent of prepayments, realized losses and changes in the composition of MFA’s residential whole loan portfolios that may occur during the applicable tax period, including gain or loss on any MBS disposals and whole loan modifications, foreclosures and liquidations; the timing and amount of distributions to stockholders, which are declared and paid at the discretion of MFA’s Board and will depend on, among other things, MFA’s taxable income, its financial results and overall financial condition and liquidity, maintenance of its REIT qualification and such other factors as MFA’s Board deems relevant; MFA’s ability to maintain its qualification as a REIT for federal income tax purposes; MFA’s ability to maintain its exemption from registration under the Investment Company Act of 1940, as amended (or the “Investment Company Act”), including statements regarding the concept release issued by the Securities and Exchange Commission (“SEC”) relating to interpretive issues under the Investment Company Act with respect to the status under the Investment Company Act of certain companies that are engaged in the business of acquiring mortgages and mortgage-related interests; MFA’s ability to continue growing its residential whole loan portfolio, which is dependent on, among other things, the supply of loans offered for sale in the market; expected returns on MFA’s investments in nonperforming residential whole loans (“NPLs”), which are affected by, among other things, the length of time required to foreclose upon, sell, liquidate or otherwise reach a resolution of the property underlying the NPL, home price values, amounts advanced to carry the asset (e.g., taxes, insurance, maintenance expenses, etc. on the underlying property) and the amount ultimately realized upon resolution of the asset; targeted or expected returns on MFA’s investments in recently-originated loans, the performance of which is, similar to MFA’s other mortgage loan investments, subject to, among other things, differences in prepayment risk, credit risk and financing cost associated with such investments; risks associated with MFA’s investments in MSR-related assets, including servicing, regulatory and economic risks, risks associated with our investments in loan originators, and risks associated with investing in real estate assets, including changes in business conditions and the general economy. These and other risks, uncertainties and factors, including those described in the annual, quarterly and current reports that MFA files with the SEC, could cause MFA’s actual results to differ materially from those projected in any forward-looking statements it makes. All forward-looking statements are based on beliefs, assumptions and expectations of MFA’s future performance, taking into account all information currently available. Readers are cautioned not to place undue reliance on these forward-looking statements, which speak only as of the date on which they are made. New risks and uncertainties arise over time and it is not possible to predict those events or how they may affect MFA. Except as required by law, MFA is not obligated to, and does not intend to, update or revise any forward-looking statements, whether as a result of new information, future events or otherwise.
13
MFA FINANCIAL, INC.
CONSOLIDATED STATEMENTS OF OPERATIONS
| (In Thousands, Except Per Share Amounts) | December 31, 2020 | December 31, 2019 | ||||||
| Assets: | ||||||||
| Residential whole loans: | ||||||||
| Residential whole loans, at carrying value ($2,704,646 and $4,847,782 pledged as collateral, respectively) (1) | $ | 4,195,332 | $ | 6,069,370 | ||||
| Residential whole loans, at fair value ($827,001 and $794,684 pledged as collateral, respectively) (1) | 1,216,902 | 1,381,583 | ||||||
| Allowance for credit losses on residential whole loans held at carrying value | (86,833 | ) | (3,025 | ) | ||||
| Total residential whole loans, net | 5,325,401 | 7,447,928 | ||||||
| Residential mortgage securities, at fair value ($161,000 and $3,966,591 pledged as collateral, respectively) | 161,000 | 3,983,519 | ||||||
| Mortgage servicing rights (“MSR”) related assets ($238,999 and $1,217,002 pledged as collateral, respectively) | 238,999 | 1,217,002 | ||||||
| Cash and cash equivalents | 814,354 | 70,629 | ||||||
| Restricted cash | 7,165 | 64,035 | ||||||
| Other assets | 385,381 | 785,057 | ||||||
| Total Assets | $ | 6,932,300 | $ | 13,568,170 | ||||
| Liabilities: | ||||||||
| Financing agreements ($3,366,772 and $0 held at fair value, respectively) | $ | 4,336,976 | $ | 10,031,606 | ||||
| Other liabilities | 70,522 | 152,612 | ||||||
| Total Liabilities | $ | 4,407,498 | $ | 10,184,218 | ||||
| Stockholders’ Equity: | ||||||||
| Preferred stock, $0.01 par value; 7.50% Series B cumulative redeemable; 8,050 shares authorized; 8,000 shares issued and outstanding ($200,000 aggregate liquidation preference) | $ | 80 | $ | 80 | ||||
| Preferred stock, $0.01 par value; 6.50% Series C fixed-to-floating rate cumulative redeemable; 12,650 shares authorized; 11,000 shares issued and outstanding ($275,000 aggregate liquidation preference) | 110 | — | ||||||
| Common stock, $0.01 par value; 874,300 and 886,950 shares authorized; 451,714 and 452,369 shares issued and outstanding, respectively | 4,517 | 4,524 | ||||||
| Additional paid-in capital, in excess of par | 3,848,129 | 3,640,341 | ||||||
| Accumulated deficit | (1,405,327 | ) | (631,040 | ) | ||||
| Accumulated other comprehensive income | 77,293 | 370,047 | ||||||
| Total Stockholders’ Equity | $ | 2,524,802 | $ | 3,383,952 | ||||
| Total Liabilities and Stockholders’ Equity | $ | 6,932,300 | $ | 13,568,170 | ||||
| (1) | Includes approximately $1.4 billion and $186.4 million of Residential whole loans, at carrying value and $382.3 million and $567.4 million of Residential whole loans, at fair value transferred to consolidated variable interest entities (“VIEs”) at December 31, 2020 and 2019, respectively. Such assets can be used only to settle the obligations of each respective VIE. |
14
MFA FINANCIAL, INC.
CONSOLIDATED STATEMENTS OF OPERATIONS
| Three Months Ended December 31, | Year Ended December 31, | |||||||||||||||
| (In Thousands, Except Per Share Amounts) | 2020 | 2019 | 2020 | 2019 | ||||||||||||
| (Unaudited) | (Unaudited) | (Unaudited) | ||||||||||||||
| Interest Income: | ||||||||||||||||
| Residential whole loans held at carrying value | $ | 51,458 | $ | 72,254 | $ | 258,764 | $ | 243,980 | ||||||||
| Residential mortgage securities | 2,459 | 62,880 | 54,137 | 274,554 | ||||||||||||
| MSR-related assets | 5,768 | 14,415 | 35,957 | 52,647 | ||||||||||||
| Other interest-earning assets | 761 | 2,879 | 9,850 | 7,152 | ||||||||||||
| Cash and cash equivalent investments | 30 | 690 | 676 | 3,393 | ||||||||||||
| Interest Income | $ | 60,476 | $ | 153,118 | $ | 359,384 | $ | 581,726 | ||||||||
| Interest Expense: | ||||||||||||||||
| Asset-backed and other collateralized financing arrangements | $ | 32,041 | $ | 76,570 | $ | 242,039 | $ | 315,344 | ||||||||
| Other interest expense | 9,003 | 5,893 | 26,719 | 17,012 | ||||||||||||
| Interest Expense | $ | 41,044 | $ | 82,463 | $ | 268,758 | $ | 332,356 | ||||||||
| Net Interest Income | $ | 19,432 | $ | 70,655 | $ | 90,626 | $ | 249,370 | ||||||||
| Reversal/(Provision) for credit and valuation losses on residential whole loans and other financial instruments | $ | 15,709 | $ | (1,032 | ) | $ | (22,381 | ) | $ | (2,569 | ) | |||||
| Net Interest Income after Provision for Credit and Valuation Losses | $ | 35,141 | $ | 69,623 | $ | 68,245 | $ | 246,801 | ||||||||
| Other Income, net: | ||||||||||||||||
| Impairment and other losses on securities available-for-sale and other assets | $ | — | $ | (180 | ) | $ | (425,082 | ) | $ | (180 | ) | |||||
| Net realized gain/(loss) on sales of residential mortgage securities and residential whole loans | — | 11,975 | (188,847 | ) | 62,002 | |||||||||||
| Net unrealized gain/(loss) on residential mortgage securities measured at fair value through earnings | 2,946 | (897 | ) | (10,486 | ) | 7,080 | ||||||||||
| Net gain on residential whole loans measured at fair value through earnings | 49,782 | 41,415 | 94,213 | 158,330 | ||||||||||||
| Loss on terminated swaps previously designated as hedges for accounting purposes | — | — | (57,034 | ) | — | |||||||||||
| Other, net | (21,654 | ) | 3,084 | (18,885 | ) | (1,375 | ) | |||||||||
| Other Income/(Loss), net | $ | 31,074 | $ | 55,397 | $ | (606,121 | ) | $ | 225,857 | |||||||
| Operating and Other Expense: | ||||||||||||||||
| Compensation and benefits | $ | 1,908 | $ | 7,920 | $ | 31,042 | $ | 32,235 | ||||||||
| Other general and administrative expense | 6,727 | 4,812 | 25,666 | 20,413 | ||||||||||||
| Loan servicing, financing and other related costs | 11,763 | 11,667 | 40,372 | 41,893 | ||||||||||||
| Costs associated with restructuring/forbearance agreement | — | — | 44,434 | $ | — | |||||||||||
| Operating and Other Expense | $ | 20,398 | $ | 24,399 | $ | 141,514 | $ | 94,541 | ||||||||
| Net Income/(Loss) | $ | 45,817 | $ | 100,621 | $ | (679,390 | ) | $ | 378,117 | |||||||
| Less Preferred Stock Dividend Requirement | $ | 8,218 | $ | 3,750 | $ | 29,796 | 15,000 | |||||||||
| Net Income/(Loss) Available to Common Stock and Participating Securities | $ | 37,599 | $ | 96,871 | $ | (709,186 | ) | $ | 363,117 | |||||||
| Basic Earnings/(Loss) per Common Share | $ | 0.08 | $ | 0.21 | $ | (1.57 | ) | $ | 0.80 | |||||||
| Diluted Earnings/(Loss) per Common Share | $ | 0.08 | $ | 0.21 | $ | (1.57 | ) | $ | 0.79 | |||||||
15
MFA FINANCIAL, INC.
CONSOLIDATED STATEMENTS OF OPERATIONS
Reconciliation of GAAP Book Value per Common Share to non-GAAP Economic Book Value per Common Share
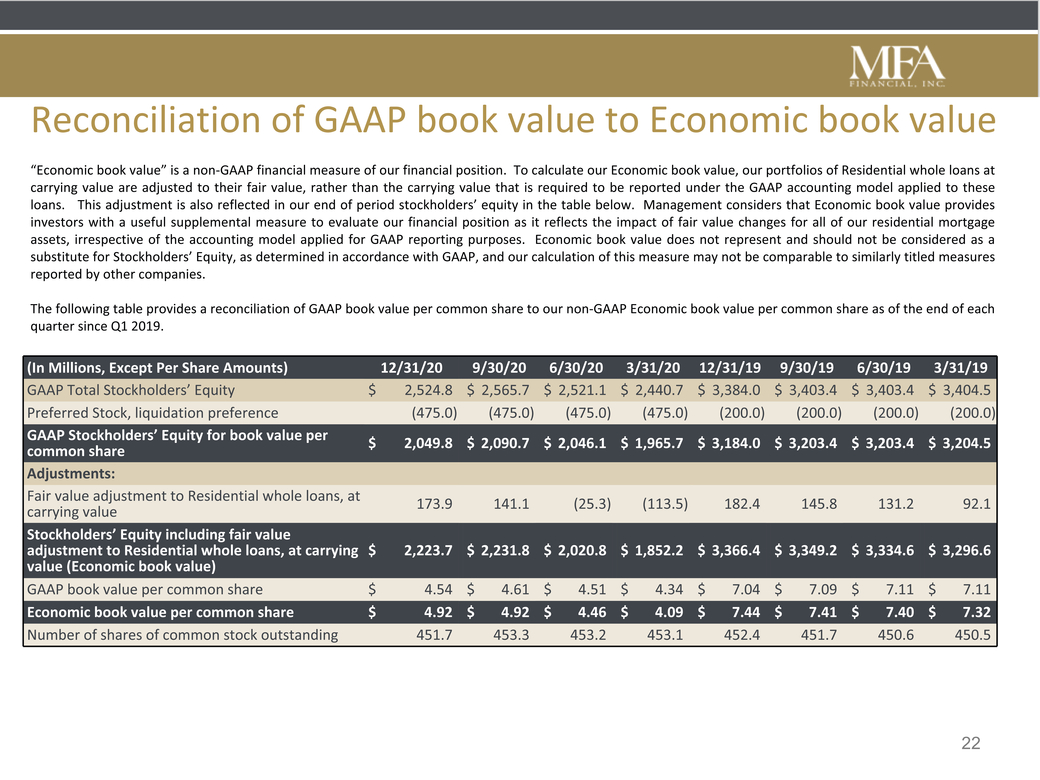
“Economic book value” is a non-GAAP financial measure of our financial position. To calculate our Economic book value, our portfolios of Residential whole loans at carrying value are adjusted to their fair value, rather than the carrying value that is required to be reported under the GAAP accounting model applied to these loans. This adjustment is also reflected in our end of period stockholders’ equity in the table below. Management considers that Economic book value provides investors with a useful supplemental measure to evaluate our financial position as it reflects the impact of fair value changes for all of our residential mortgage assets, irrespective of the accounting model applied for GAAP reporting purposes. Economic book value does not represent and should not be considered as a substitute for Stockholders’ Equity, as determined in accordance with GAAP, and our calculation of this measure may not be comparable to similarly titled measures reported by other companies.
The following table provides a reconciliation of our GAAP book value per common share to our non-GAAP Economic book value per common share for the quarterly periods below:
| (In Millions, Except Per Share Amounts) | December 31, 2020 | September 30, 2020 | June 30, 2020 | March 31, 2020 | December 31, 2019 | |||||||||||||||
| GAAP Total Stockholders’ Equity | $ | 2,524.8 | $ | 2,565.7 | $ | 2,521.1 | $ | 2,440.7 | $ | 3,384.0 | ||||||||||
| Preferred Stock, liquidation preference | (475.0 | ) | (475.0 | ) | (475.0 | ) | (475.0 | ) | (200.0 | ) | ||||||||||
| GAAP Stockholders’ Equity for book value per common share | 2,049.8 | 2,090.7 | 2,046.1 | 1,965.7 | 3,184.0 | |||||||||||||||
| Adjustments: | ||||||||||||||||||||
| Fair value adjustment to Residential whole loans, at carrying value | 173.9 | 141.1 | (25.3 | ) | (113.5 | ) | 182.4 | |||||||||||||
| Stockholders’ Equity including fair value adjustment to Residential whole loans, at carrying value (Economic book value) | $ | 2,223.7 | $ | 2,231.8 | $ | 2,020.8 | $ | 1,852.2 | $ | 3,366.4 | ||||||||||
| GAAP book value per common share | $ | 4.54 | $ | 4.61 | $ | 4.51 | $ | 4.34 | $ | 7.04 | ||||||||||
| Economic book value per common share | $ | 4.92 | $ | 4.92 | $ | 4.46 | $ | 4.09 | $ | 7.44 | ||||||||||
| Number of shares of common stock outstanding | 451.7 | 453.3 | 453.2 | 453.1 | 452.4 | |||||||||||||||
16