Exhibit 99.1
|
|
|
|
|
|
|
MFA |
|
|
FINANCIAL, INC. |
|
|
|
|
|
350 Park Avenue |
|
|
New York, New York 10022 |
|

|
PRESS RELEASE |
FOR IMMEDIATE RELEASE |
|
|
|
|
November 3, 2016 |
NEW YORK METRO |
|
INVESTOR CONTACT: |
InvestorRelations@mfafinancial.com |
NYSE: MFA |
|
|
212-207-6433 |
|
|
|
www.mfafinancial.com |
|
|
|
|
|
|
MEDIA CONTACT: |
Abernathy MacGregor |
|
|
|
Tom Johnson, Andrew Johnson |
|
|
|
212-371-5999 |
|
MFA Financial, Inc.
Announces Third Quarter 2016 Financial Results
NEW YORK - MFA Financial, Inc. (NYSE:MFA) today announced its financial results for the third quarter ended September 30, 2016.
Third Quarter 2016 and other highlights:
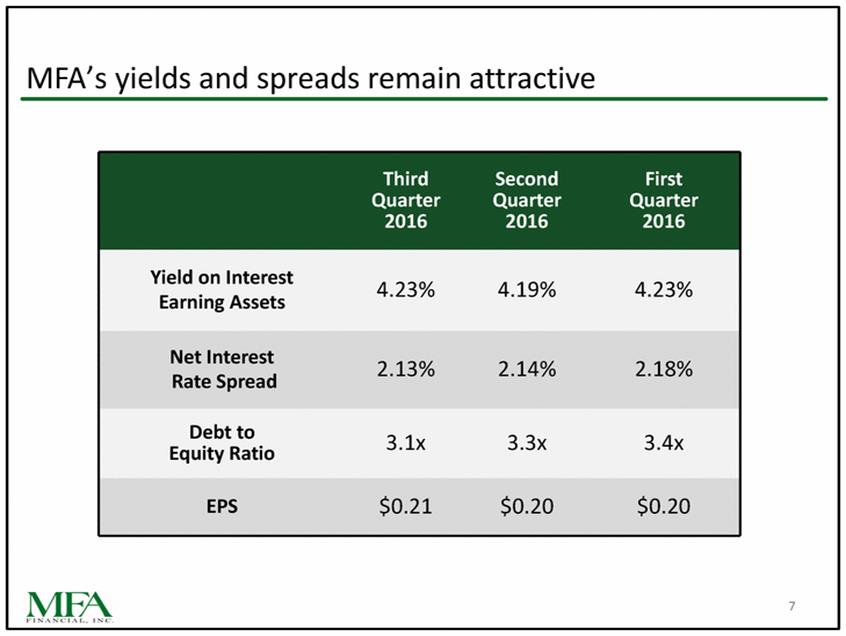
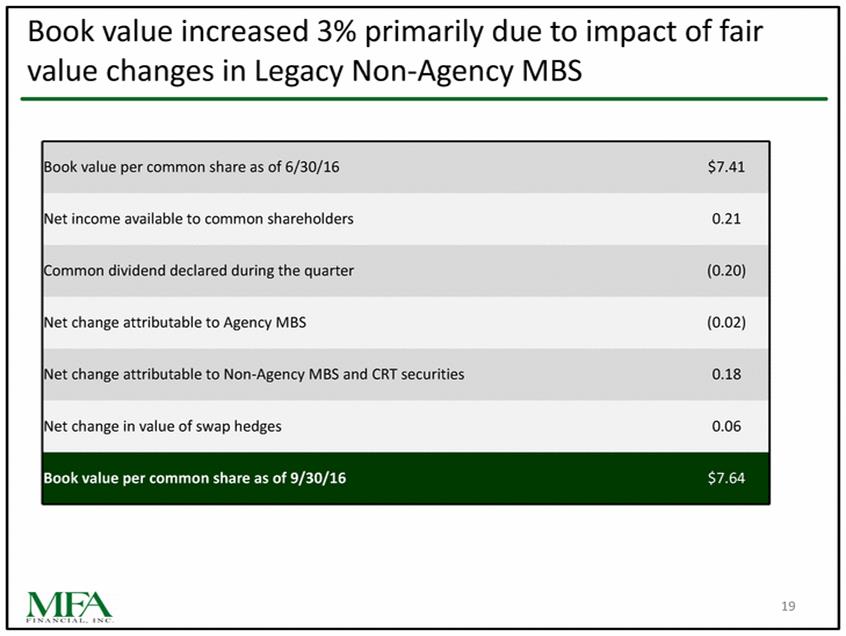
· Generated third quarter net income available to common shareholders of $79.3 million, or $0.21 per common share (based on 373.1 million weighted average common shares outstanding). As of September 30, 2016, book value per common share was $7.64.
· On October 31, 2016, MFA paid its third quarter 2016 dividend of $0.20 per share of common stock to shareholders of record as of September 28, 2016.
· MFA acquired $374.8 million of 3 year step-up securities and $311.6 million of credit sensitive residential whole loans during the quarter. Additionally, MFA acquired $60.4 million of Credit Risk Transfer securities and was both an opportunistic buyer and seller of Legacy Non-Agency MBS during the quarter.
William Gorin, MFA’s CEO, said, “In the third quarter, we continued to execute our strategy of targeted investment within the residential mortgage universe with a focus on credit sensitive assets. We acquired
$374.8 million of 3 year step-up securities, $311.6 million of credit sensitive residential whole loans and $60.4 million of Credit Risk Transfer securities during the quarter. Further, we opportunistically purchased $38.7 million of Non-Agency MBS issued prior to 2008 (“Legacy Non-Agency MBS”) and sold $13.2 million of Legacy Non-Agency MBS, realizing gains of $7.1 million for the quarter. This is the seventeenth consecutive quarter we have realized gains through selected sales of Legacy Non-Agency MBS based on our projections of future cash flows relative to market pricing. We did not acquire any Agency MBS in this quarter.
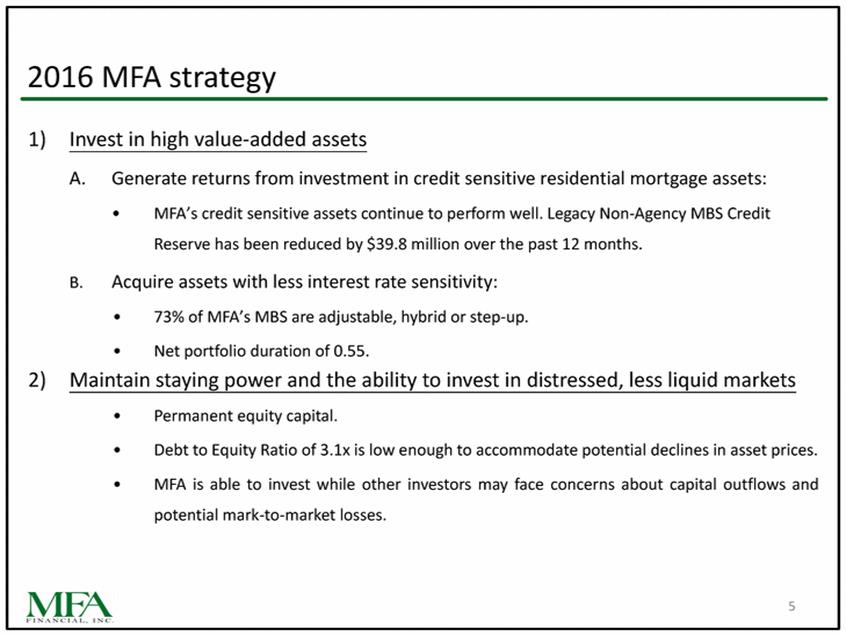
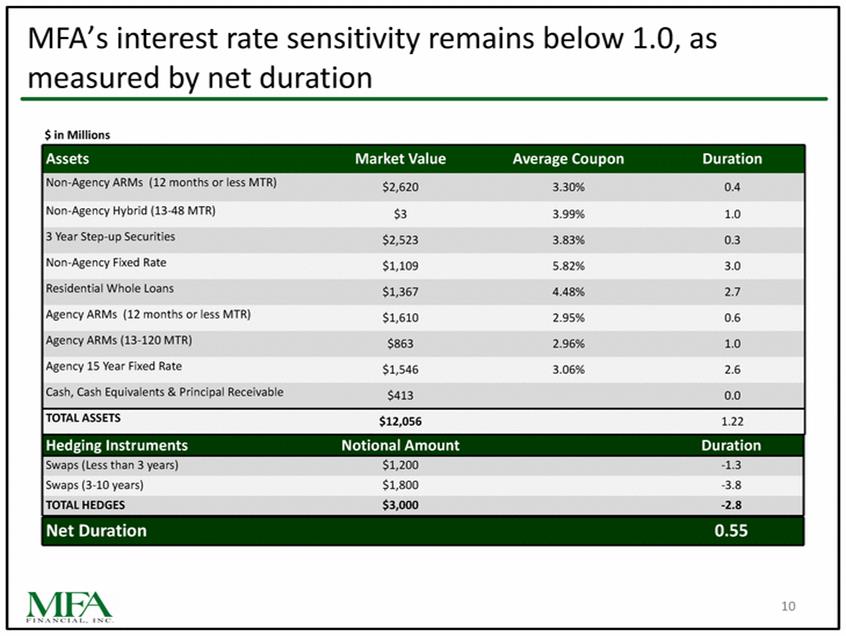
“MFA remains well positioned to generate attractive returns despite this period of extremely low interest rates. Rates are being held down, as on a worldwide basis there appears to be insufficient growth and a bias towards low inflation. Clearly, accommodative monetary policy also continues to impact rates. Through asset selection and hedging strategy, the estimated effective duration, a gauge of MFA’s interest rate sensitivity, remains below 1.0 and measured 0.55 at quarter-end. Leverage, which reflects the ratio of our financing obligations to equity, was 3.1:1 at quarter-end.”
Craig Knutson, MFA’s President and COO, added, “MFA’s portfolio asset selection process continues to emphasize residential mortgage credit exposure while seeking to minimize sensitivity to interest rates. As housing prices maintain their upward trend and borrowers repair their credit and balance sheets, MFA’s Legacy Non-Agency portfolio continues to outperform our credit assumptions. In the third quarter of 2016, we reduced our credit reserve by $6.8 million. Also, our credit sensitive residential whole loans offer additional exposure to residential mortgage credit while affording us the opportunity to improve outcomes through sensible and effective servicing decisions.”
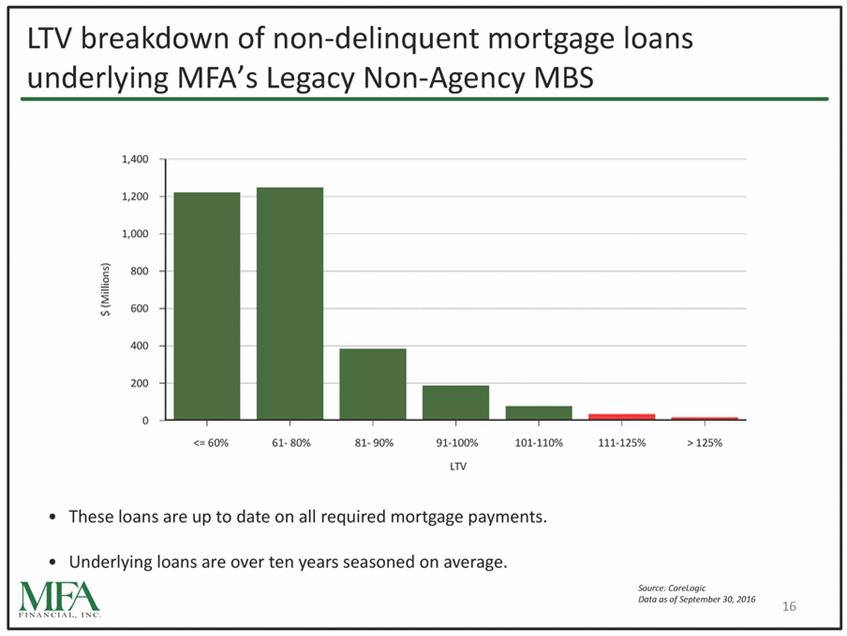
MFA’s Legacy Non-Agency MBS had a face amount of $3.8 billion with an amortized cost of $2.8 billion and a net purchase discount of $1.0 billion at September 30, 2016. This discount consists of a $715.0 million credit reserve and other-than-temporary impairments and a $294.0 million net accretable discount. We believe this credit reserve appropriately factors in remaining uncertainties regarding underlying mortgage performance and the potential impact on future cash flows. Our Legacy Non-Agency MBS loss adjusted yield of 8.09% for the third quarter is based on projected defaults equal to 21% of underlying loan balances. On average, these loans are approximately ten years seasoned and approximately 12.5% are currently 60 or more days delinquent.
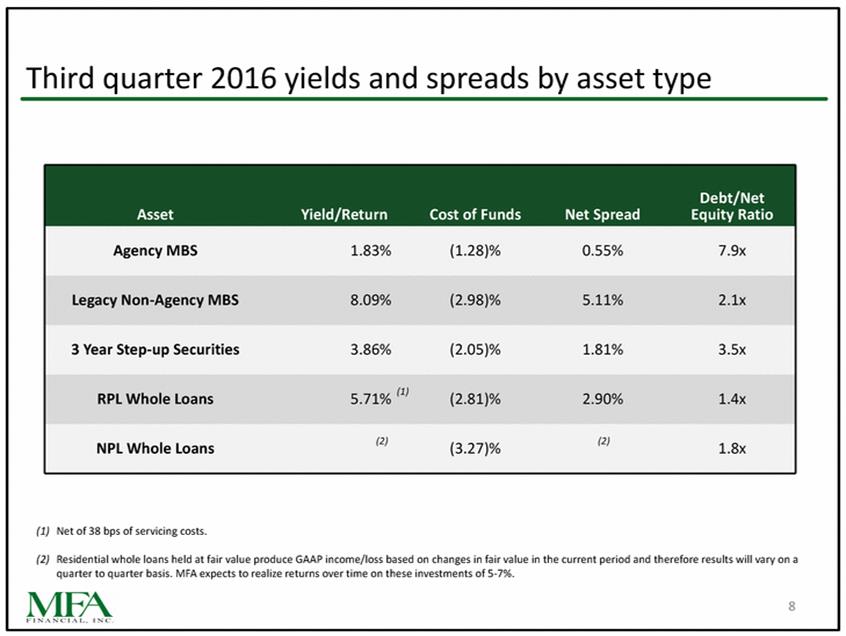
The Agency MBS portfolio had an average amortized cost basis of 103.8% of par as of September 30, 2016, and generated a 1.83% yield in the third quarter. The Legacy Non-Agency MBS portfolio had an average amortized cost of 73.3% of par as of September 30, 2016, and generated a loss-adjusted yield of 8.09% in the third quarter. At the end of the third quarter, MFA held approximately $2.5 billion of the senior most tranches of 3 year step-up securities. These securities had an amortized cost of 99.9% of par and generated a 3.86% yield for the quarter.
In addition, at September 30, 2016, our investments in credit sensitive residential whole loans totaled $1.3 billion. Of this amount, $550.6 million is recorded at carrying value, or 86.4% of the interest-bearing unpaid principal balance and generated a loss-adjusted yield of 6.09% (5.71% net of servicing costs) during the quarter and $797.2 million is recorded at fair value on our consolidated balance sheet. On this portion of the portfolio we recorded gains for the quarter of approximately $18.7 million,
primarily reflecting changes in the fair value of the underlying loans and coupon interest payments received during the quarter.
For the three months ended September 30, 2016, MFA’s costs for compensation and benefits and other general and administrative expenses were $10.8 million, or an annualized 1.42% of stockholders’ equity as of September 30, 2016.
The following table presents the weighted average prepayment speed on MFA’s MBS portfolio.
Table 1
|
|
|
Third Quarter |
|
Second Quarter |
|
|
Agency MBS |
|
16.7 |
% |
13.9 |
% |
|
Legacy Non-Agency MBS |
|
15.9 |
% |
16.1 |
% |
|
3 Year Step-up securities (1) |
|
32.2 |
% |
25.4 |
% |
(1) All principal payments are considered to be prepayments for conditional prepayment rate (CPR) purposes. 3 year step-up securities are MBS that are backed by securitized Re-performing and Non-performing Loans. The securities are structured such that the coupon steps-up 300 basis points at 36 months or sooner.
As of September 30, 2016, under its swap agreements, MFA had a weighted average fixed-pay rate of interest of 1.82% and a floating receive rate of 0.53% on notional balances totaling $3.0 billion, with an average maturity of 37 months.
The following table presents MFA’s asset allocation as of September 30, 2016, and yield on average interest earning assets, average cost of funds and net interest rate spread for the various asset types for the quarter ended September 30, 2016.
Table 2
ASSET ALLOCATION
|
At September 30, 2016 |
|
Agency MBS |
|
Legacy |
|
3 Year Step- |
|
Residential |
|
Residential |
|
Other, |
|
Total |
| |||||||
|
Fair Value/ Carrying Value |
|
$ |
4,021,535 |
|
$ |
3,385,588 |
|
$ |
2,523,227 |
|
$ |
550,623 |
|
$ |
797,191 |
|
$ |
862,916 |
|
$ |
12,141,080 |
|
|
Less Payable for Unsettled Purchases |
|
— |
|
— |
|
— |
|
(111,232 |
) |
(92,728 |
) |
— |
|
(203,960 |
) | |||||||
|
Less Repurchase Agreements |
|
(3,356,803 |
) |
(2,287,178 |
) |
(1,963,760 |
) |
(213,781 |
) |
(419,628 |
) |
(241,606 |
) |
(8,482,756 |
) | |||||||
|
Less FHLB advances |
|
(215,000 |
) |
— |
|
— |
|
— |
|
— |
|
— |
|
(215,000 |
) | |||||||
|
Less Senior Notes |
|
— |
|
— |
|
— |
|
— |
|
— |
|
(96,724 |
) |
(96,724 |
) | |||||||
|
Equity Allocated |
|
$ |
449,732 |
|
$ |
1,098,410 |
|
$ |
559,467 |
|
$ |
225,610 |
|
$ |
284,835 |
|
$ |
524,586 |
|
$ |
3,142,640 |
|
|
Less Swaps at Market Value |
|
— |
|
— |
|
— |
|
— |
|
— |
|
(109,202 |
) |
(109,202 |
) | |||||||
|
Net Equity Allocated |
|
$ |
449,732 |
|
$ |
1,098,410 |
|
$ |
559,467 |
|
$ |
225,610 |
|
$ |
284,835 |
|
$ |
415,384 |
|
$ |
3,033,438 |
|
|
Debt/Net Equity Ratio (2) |
|
7.9x |
|
2.1x |
|
3.5x |
|
1.4x |
|
1.8x |
|
— |
|
3.1x |
| |||||||
|
|
|
|
|
|
|
|
|
|
|
|
|
|
|
|
| |||||||
|
For the Quarter Ended September 30, 2016 |
|
|
|
|
|
|
|
|
|
|
|
|
|
|
| |||||||
|
Yield on Average Interest Earning Assets (3) |
|
1.83 |
% |
8.09 |
% |
3.86 |
% |
6.09 |
% |
N/A |
|
— |
% |
4.23 |
% | |||||||
|
Less Average Cost of Funds (4) |
|
(1.28 |
) |
(2.98 |
) |
(2.05 |
) |
(2.81 |
) |
(3.27 |
) |
— |
|
(2.10 |
) | |||||||
|
Net Interest Rate Spread |
|
0.55 |
% |
5.11 |
% |
1.81 |
% |
3.28 |
% |
N/A |
|
— |
% |
2.13 |
% | |||||||
(1) Includes cash and cash equivalents and restricted cash of $411.4 million, securities obtained and pledged as collateral, $347.6 million of CRT securities, other assets, obligation to return securities obtained as collateral and other liabilities.
(2) Represents the sum of borrowings under repurchase agreements, Federal Home Loan Bank advances and payable for unsettled purchases as a multiple of net equity allocated. The numerator of our Total Debt/Net Equity Ratio also includes the obligation to return securities obtained as collateral of $506.2 million, Senior Notes and repurchase agreements financing CRT security purchases.
(3) Yields reported on our interest earning assets are calculated based on the interest income recorded and the average amortized cost for the quarter of the respective asset. At September 30, 2016, the amortized cost of our interest earning assets were as follows: Agency MBS - $3,974,896; Legacy Non-Agency MBS - $2,766,024; 3 year step-up securities - $2,515,487; and Residential Whole Loans at carrying value - $550,623. In addition, the yield for residential whole loans at carrying value was 5.71% net of 38 basis points of servicing fee expense incurred during the quarter. For GAAP reporting purposes, such expenses are included in Loan servicing and other related operating expenses in our statement of operations. Interest payments received on residential whole loans at fair value is reported in Other Income as Net gain on residential whole loans held at fair value in our statement of operations. Accordingly, no yield is presented as such loans are not included in interest earning assets for reporting purposes.
(4) Average cost of funds includes interest on repurchase agreements and other advances, the cost of swaps and Senior Notes. Agency cost of funds includes 62 basis points and Legacy Non-Agency cost of funds includes 74 basis points associated with Swaps to hedge interest rate sensitivity on these assets.
At September 30, 2016, MFA’s $7.4 billion of Agency and Legacy Non-Agency MBS were backed by Hybrid, adjustable and fixed-rate mortgages. Additional information about these MBS, including average months to reset and three-month average CPR, is presented below:
Table 3
|
|
|
Agency MBS |
|
Legacy Non-Agency MBS (1) |
|
Total (1) |
| |||||||||||||||
|
($ in Thousands) |
|
Fair |
|
Average |
|
3 Month |
|
Fair |
|
Average |
|
3 Month |
|
Fair |
|
Average |
|
3 Month |
| |||
|
< 2 years (5) |
|
$ |
1,826,632 |
|
7 |
|
19.3 |
% |
$ |
2,276,780 |
|
5 |
|
15.4 |
% |
$ |
4,103,412 |
|
6 |
|
17.0 |
% |
|
2-5 years |
|
511,385 |
|
33 |
|
21.5 |
|
— |
|
— |
|
— |
|
511,385 |
|
33 |
|
21.5 |
| |||
|
> 5 years |
|
135,798 |
|
71 |
|
15.2 |
|
— |
|
— |
|
— |
|
135,798 |
|
71 |
|
15.2 |
| |||
|
ARM-MBS Total |
|
$ |
2,473,815 |
|
16 |
|
19.5 |
% |
$ |
2,276,780 |
|
5 |
|
15.4 |
% |
$ |
4,750,595 |
|
11 |
|
17.4 |
% |
|
15-year fixed (6) |
|
$ |
1,545,954 |
|
|
|
12.2 |
% |
$ |
6,357 |
|
|
|
18.6 |
% |
$ |
1,552,311 |
|
|
|
12.2 |
% |
|
30-year fixed (6) |
|
— |
|
|
|
— |
|
1,096,328 |
|
|
|
17.1 |
|
1,096,328 |
|
|
|
17.1 |
| |||
|
40-year fixed (6) |
|
— |
|
|
|
— |
|
6,123 |
|
|
|
16.5 |
|
6,123 |
|
|
|
16.5 |
| |||
|
Fixed-Rate Total |
|
$ |
1,545,954 |
|
|
|
12.2 |
% |
$ |
1,108,808 |
|
|
|
17.1 |
% |
$ |
2,654,762 |
|
|
|
14.4 |
% |
|
MBS Total |
|
$ |
4,019,769 |
|
|
|
16.7 |
% |
$ |
3,385,588 |
|
|
|
15.9 |
% |
$ |
7,405,357 |
|
|
|
16.3 |
% |
(1) Excludes $2.5 billion of 3 year step-up securities. Refer to Table 4 for further information.
(2) Does not include principal payments receivable of $1.8 million.
(3) Months to Reset is the number of months remaining before the coupon interest rate resets. At reset, the MBS coupon will adjust based upon the underlying benchmark interest rate index, margin and periodic or lifetime caps. Months to Reset does not reflect scheduled amortization or prepayments.
(4) 3 month average CPR weighted by positions as of beginning of each month in the quarter.
(5) Includes floating rate MBS that may be collateralized by fixed-rate mortgages.
(6) Information presented based on data available at time of loan origination.
Table 4
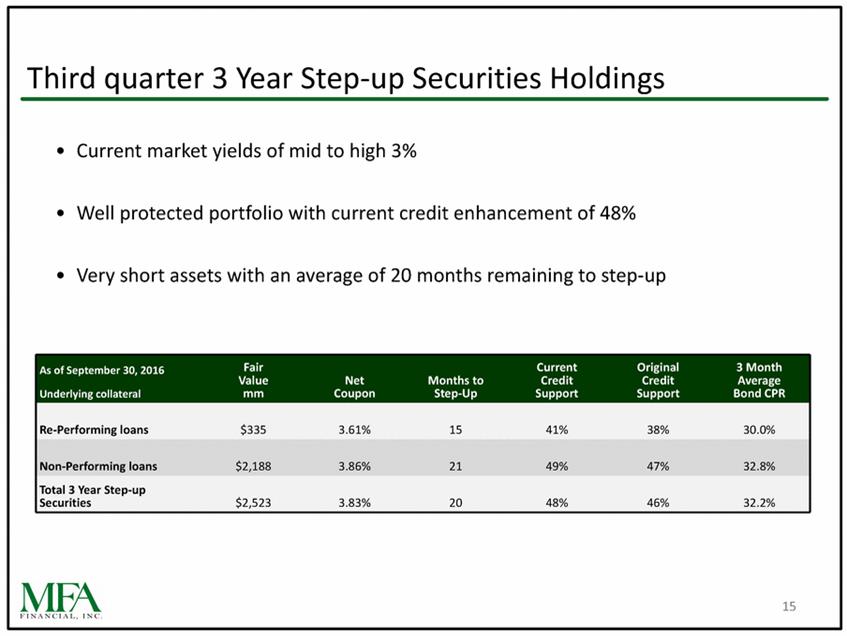
The following table presents certain information about our 3 year step-up securities portfolio at September 30, 2016:
|
Underlying collateral |
|
Fair Value |
|
Net Coupon |
|
Months to |
|
Current |
|
Original |
|
3 Month |
| |
|
Re-Performing loans |
|
$ |
334,931 |
|
3.61 |
% |
15 |
|
41 |
% |
38 |
% |
30.0 |
% |
|
Non-Performing loans |
|
2,188,296 |
|
3.86 |
|
21 |
|
49 |
|
47 |
|
32.8 |
| |
|
Total 3 year step-up securities |
|
$ |
2,523,227 |
|
3.83 |
% |
20 |
|
48 |
% |
46 |
% |
32.2 |
% |
(1) Months to step-up is the weighted average number of months remaining before the coupon interest rate increases pursuant to the first coupon reset. We anticipate that the securities will be redeemed prior to the step-up date.
(2) Credit Support for a particular security is expressed as a percentage of all outstanding mortgage loan collateral. A particular security will not be subject to principal loss as long as credit enhancement is greater than zero.
(3) All principal payments are considered to be prepayments for CPR purposes.
Webcast
MFA Financial, Inc. plans to host a live audio webcast of its investor conference call on Thursday, November 3, 2016, at 11:00 a.m. (Eastern Time) to discuss its third quarter 2016 financial results. The live audio webcast will be accessible to the general public over the internet at http://www.mfafinancial.com through the “Webcasts & Presentations” link on MFA’s home page. To listen to the conference call over the internet, please go to the MFA website at least 15 minutes before
the call to register and to download and install any needed audio software. Earnings presentation materials will be posted on the MFA website prior to the conference call and an audio replay will be available on the website following the call.
Cautionary Language Regarding Forward Looking Statements
When used in this press release or other written or oral communications, statements which are not historical in nature, including those containing words such as “will,” “believe,” “expect,” “anticipate,” “estimate,” “plan,” “continue,” “intend,” “could,” “would,” “should,” “may” or similar expressions, are intended to identify “forward-looking statements” within the meaning of Section 27A of the Securities Act of 1933, as amended, and Section 21E of the Securities Exchange Act of 1934, as amended, and, as such, may involve known and unknown risks, uncertainties and assumptions. Statements regarding the following subjects, among others, may be forward-looking: changes in interest rates and the market value of MFA’s MBS; changes in the prepayment rates on the mortgage loans securing MFA’s MBS, an increase of which could result in a reduction of the yield on MBS in our portfolio and could require us to reinvest the proceeds received by us as a result of such prepayments in MBS with lower coupons; credit risks underlying MFA’s assets, including changes in the default rates and management’s assumptions regarding default rates on the mortgage loans securing MFA’s Non-Agency MBS and relating to MFA’s residential whole loan portfolio; MFA’s ability to borrow to finance its assets and the terms, including the cost, maturity and other terms, of any such borrowings; implementation of or changes in government regulations or programs affecting MFA’s business; MFA’s estimates regarding taxable income the actual amount of which is dependent on a number of factors, including, but not limited to, changes in the amount of interest income and financing costs, the method elected by MFA to accrete the market discount on Non-Agency MBS and residential whole loans and the extent of prepayments, realized losses and changes in the composition of MFA’s Agency MBS, Non-Agency MBS and residential whole loan portfolios that may occur during the applicable tax period, including gain or loss on any MBS disposals and whole loan modification, foreclosure and liquidation; the timing and amount of distributions to stockholders, which are declared and paid at the discretion of MFA’s Board of Directors and will depend on, among other things, MFA’s taxable income, its financial results and overall financial condition and liquidity, maintenance of its REIT qualification and such other factors as the Board deems relevant; MFA’s ability to maintain its qualification as a REIT for federal income tax purposes; MFA’s ability to maintain its exemption from registration under the Investment Company Act of 1940, as amended (or the “Investment Company Act”), including statements regarding the Concept Release issued by the Securities and Exchange Commission (“SEC”) relating to interpretive issues under the Investment Company Act with respect to the status under the Investment Company Act of certain companies that are in engaged in the business of acquiring mortgages and mortgage-related interests; MFA’s ability to successfully implement its strategy to grow its residential whole loan portfolio; expected returns on our investments in non-performing residential whole loans (“NPLs”), which are affected by, among other things, the length of time required to foreclose upon, sell, liquidate or otherwise reach a resolution of the property underlying the NPL, home price values, amounts advanced to carry the asset (e.g., taxes, insurance, maintenance expenses, etc. on the underlying property) and the amount ultimately realized upon resolution of the asset; and risks associated with investing in real estate assets, including changes in business conditions and general economic conditions. These and other risks, uncertainties and factors, including those described in the annual, quarterly and current reports that MFA files with the SEC, could cause MFA’s actual results to differ materially from those projected in any forward-looking statements it makes. All forward-looking statements speak only as of the date on which they are made. New risks and uncertainties arise over time and it is not possible to predict those events or how they may affect MFA. Except as required by law, MFA is not obligated to, and does not intend to, update or revise any forward-looking statements, whether as a result of new information, future events or otherwise.
MFA FINANCIAL, INC.
CONSOLIDATED BALANCE SHEETS
|
(In Thousands, Except Share and Per Share Amounts) |
|
September 30, |
|
December 31, |
| ||
|
|
|
(Unaudited) |
|
|
| ||
|
Assets: |
|
|
|
|
| ||
|
Mortgage-backed securities (“MBS”) and credit risk transfer (“CRT”) securities: |
|
|
|
|
| ||
|
Agency MBS, at fair value ($3,783,913 and $4,532,094 pledged as collateral, respectively) |
|
$ |
4,021,535 |
|
$ |
4,752,244 |
|
|
Non-Agency MBS, at fair value ($4,882,017 and $4,874,372 pledged as collateral, respectively) |
|
5,721,796 |
|
5,822,519 |
| ||
|
Non-Agency MBS transferred to consolidated variable interest entities (“VIEs”), at fair value |
|
187,019 |
|
598,298 |
| ||
|
CRT securities, at fair value ($320,852 and $170,352 pledged as collateral, respectively) |
|
347,640 |
|
183,582 |
| ||
|
Securities obtained and pledged as collateral, at fair value |
|
506,182 |
|
507,443 |
| ||
|
Residential whole loans, at carrying value ($273,419 and $93,692 pledged as collateral, respectively) |
|
550,623 |
|
271,845 |
| ||
|
Residential whole loans, at fair value ($618,846 and $585,971 pledged as collateral, respectively) |
|
797,191 |
|
623,276 |
| ||
|
Cash and cash equivalents |
|
288,698 |
|
165,007 |
| ||
|
Restricted cash |
|
122,656 |
|
71,538 |
| ||
|
Other assets |
|
208,049 |
|
166,799 |
| ||
|
Total Assets |
|
$ |
12,751,389 |
|
$ |
13,162,551 |
|
|
|
|
|
|
|
| ||
|
Liabilities: |
|
|
|
|
| ||
|
Repurchase agreements and other advances |
|
$ |
8,697,756 |
|
$ |
9,387,622 |
|
|
Obligation to return securities obtained as collateral, at fair value |
|
506,182 |
|
507,443 |
| ||
|
8% Senior Notes due 2042 (“Senior Notes”) |
|
96,724 |
|
96,697 |
| ||
|
Payable for unsettled residential whole loans purchases |
|
203,960 |
|
— |
| ||
|
Other liabilities |
|
213,329 |
|
203,528 |
| ||
|
Total Liabilities |
|
$ |
9,717,951 |
|
$ |
10,195,290 |
|
|
|
|
|
|
|
| ||
|
Stockholders’ Equity: |
|
|
|
|
| ||
|
Preferred stock, $.01 par value; 7.50% Series B cumulative redeemable; 8,050 shares authorized; 8,000 shares issued and outstanding ($200,000 aggregate liquidation preference) |
|
$ |
80 |
|
$ |
80 |
|
|
Common stock, $.01 par value; 886,950 shares authorized; 371,083 and 370,584 shares issued and outstanding, respectively |
|
3,711 |
|
3,706 |
| ||
|
Additional paid-in capital, in excess of par |
|
3,023,033 |
|
3,019,956 |
| ||
|
Accumulated deficit |
|
(566,917 |
) |
(572,332 |
) | ||
|
Accumulated other comprehensive income |
|
573,531 |
|
515,851 |
| ||
|
Total Stockholders’ Equity |
|
$ |
3,033,438 |
|
$ |
2,967,261 |
|
|
Total Liabilities and Stockholders’ Equity |
|
$ |
12,751,389 |
|
$ |
13,162,551 |
|
MFA FINANCIAL, INC.
CONSOLIDATED STATEMENTS OF OPERATIONS
|
|
|
Three Months Ended September 30, |
|
Nine Months Ended September 30, |
| ||||||||
|
(In Thousands, Except Per Share Amounts) |
|
2016 |
|
2015 |
|
2016 |
|
2015 |
| ||||
|
|
|
(Unaudited) |
| ||||||||||
|
Interest Income: |
|
|
|
|
|
|
|
|
| ||||
|
Agency MBS |
|
$ |
18,957 |
|
$ |
23,618 |
|
$ |
64,546 |
|
$ |
81,030 |
|
|
Non-Agency MBS |
|
80,370 |
|
79,276 |
|
241,116 |
|
241,440 |
| ||||
|
Non-Agency MBS transferred to consolidated VIEs |
|
3,268 |
|
11,154 |
|
12,439 |
|
34,792 |
| ||||
|
CRT securities |
|
3,983 |
|
1,593 |
|
9,897 |
|
4,477 |
| ||||
|
Residential whole loans held at carrying value |
|
5,917 |
|
4,033 |
|
16,112 |
|
11,817 |
| ||||
|
Cash and cash equivalent investments |
|
221 |
|
32 |
|
531 |
|
88 |
| ||||
|
Interest Income |
|
$ |
112,716 |
|
$ |
119,706 |
|
$ |
344,641 |
|
$ |
373,644 |
|
|
|
|
|
|
|
|
|
|
|
| ||||
|
Interest Expense: |
|
|
|
|
|
|
|
|
| ||||
|
Repurchase agreements and other advances |
|
$ |
46,158 |
|
$ |
41,331 |
|
$ |
137,127 |
|
$ |
122,736 |
|
|
Senior Notes and other interest expense |
|
2,009 |
|
2,372 |
|
6,360 |
|
7,756 |
| ||||
|
Interest Expense |
|
$ |
48,167 |
|
$ |
43,703 |
|
$ |
143,487 |
|
$ |
130,492 |
|
|
|
|
|
|
|
|
|
|
|
| ||||
|
Net Interest Income |
|
$ |
64,549 |
|
$ |
76,003 |
|
$ |
201,154 |
|
$ |
243,152 |
|
|
|
|
|
|
|
|
|
|
|
| ||||
|
Other-Than-Temporary Impairments: |
|
|
|
|
|
|
|
|
| ||||
|
Total other-than-temporary impairment losses |
|
$ |
(1,255 |
) |
$ |
— |
|
$ |
(1,255 |
) |
$ |
(525 |
) |
|
Portion of loss recognized in/(reclassed from) other comprehensive income |
|
770 |
|
— |
|
770 |
|
(180 |
) | ||||
|
Net Impairment Losses Recognized in Earnings |
|
$ |
(485 |
) |
$ |
— |
|
$ |
(485 |
) |
$ |
(705 |
) |
|
|
|
|
|
|
|
|
|
|
| ||||
|
Other Income, net: |
|
|
|
|
|
|
|
|
| ||||
|
Net gain on residential whole loans held at fair value |
|
$ |
18,701 |
|
$ |
5,565 |
|
$ |
45,052 |
|
$ |
10,823 |
|
|
Gain on sales of MBS |
|
7,083 |
|
11,196 |
|
26,069 |
|
25,248 |
| ||||
|
Other, net |
|
8,117 |
|
(259 |
) |
12,521 |
|
(626 |
) | ||||
|
Other Income, net |
|
$ |
33,901 |
|
$ |
16,502 |
|
$ |
83,642 |
|
$ |
35,445 |
|
|
|
|
|
|
|
|
|
|
|
| ||||
|
Operating and Other Expense: |
|
|
|
|
|
|
|
|
| ||||
|
Compensation and benefits |
|
$ |
7,078 |
|
$ |
6,482 |
|
$ |
21,507 |
|
$ |
19,759 |
|
|
Other general and administrative expense |
|
3,709 |
|
3,538 |
|
12,508 |
|
11,673 |
| ||||
|
Loan servicing and other related operating expenses |
|
4,167 |
|
2,975 |
|
10,265 |
|
6,706 |
| ||||
|
Operating and Other Expense |
|
$ |
14,954 |
|
$ |
12,995 |
|
$ |
44,280 |
|
$ |
38,138 |
|
|
|
|
|
|
|
|
|
|
|
| ||||
|
Net Income |
|
$ |
83,011 |
|
$ |
79,510 |
|
$ |
240,031 |
|
$ |
239,754 |
|
|
Less Preferred Stock Dividends |
|
3,750 |
|
3,750 |
|
11,250 |
|
11,250 |
| ||||
|
Net Income Available to Common Stock and Participating Securities |
|
$ |
79,261 |
|
$ |
75,760 |
|
$ |
228,781 |
|
$ |
228,504 |
|
|
|
|
|
|
|
|
|
|
|
| ||||
|
Earnings per Common Share - Basic and Diluted |
|
$ |
0.21 |
|
$ |
0.20 |
|
$ |
0.61 |
|
$ |
0.61 |
|
|
|
|
|
|
|
|
|
|
|
| ||||
|
Dividends Declared per Share of Common Stock |
|
$ |
0.20 |
|
$ |
0.20 |
|
$ |
0.60 |
|
$ |
0.60 |
|