Exhibit 99.1

|
MFA |
|
| |
|
|
FINANCIAL, INC. |
|
| |
|
|
350 Park Avenue |
|
|
New York, New York 10022 |
|
|
PRESS RELEASE |
FOR IMMEDIATE RELEASE | |
|
|
| |
|
February 13, 2014 |
NEW YORK METRO | |
|
|
|
|
|
INVESTOR CONTACT: |
InvestorRelations@mfafinancial.com |
NYSE: MFA |
|
|
212-207-6433 |
|
|
|
www.mfafinancial.com |
|
|
|
|
|
|
MEDIA CONTACT: |
Abernathy MacGregor |
|
|
|
Tom Johnson, Andrew Johnson |
|
|
|
212-371-5999 |
|
MFA Financial, Inc.
Announces Fourth Quarter 2013 Financial Results
NEW YORK - MFA Financial, Inc. (NYSE:MFA) today announced financial results for the fourth quarter ended December 31, 2013.
Fourth Quarter 2013 and other highlights:
· Generated fourth quarter net income available to common shareholders of $74.8 million, or $0.20 per common share.
· Book value per common share increased to $8.06 as of December 31, 2013 from $7.85 as of September 30, 2013 due primarily to Non-Agency MBS price appreciation.
· On January 31, 2014, MFA paid its fourth quarter 2013 dividend of $0.20 per share of common stock to stockholders of record as of December 31, 2013.
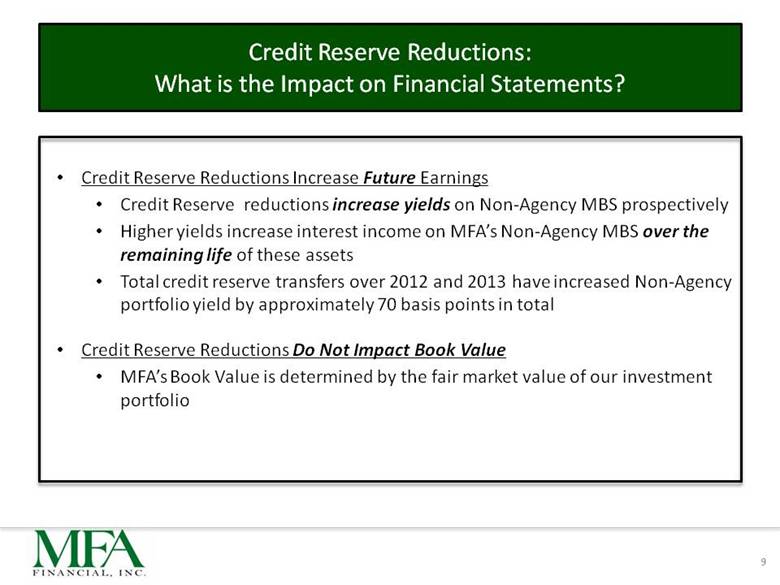
· In the fourth quarter, MFA transferred $47.2 million from credit reserve to accretable discount, bringing the total transferred in 2013 to $207.9 million. This increase in accretable discount is expected to increase the interest income realized over the remaining life of MFA’s Non-Agency MBS.
· Due primarily to increases in accretable discount and to changes in the forward curve, the loss-adjusted yield on MFA’s Non-Agency portfolio increased from 7.33% in the third quarter to 7.77% in the fourth quarter.
William Gorin, MFA’s CEO, said, “Despite changing interest rates and prepayment speeds, MFA’s key metrics remained generally consistent throughout 2013. Net interest rate spread was 2.34% in the fourth quarter versus a high of 2.38% in the second quarter and a low of 2.24% in the third quarter. The debt to equity ratio at the end of the fourth quarter was 3.0:1 versus 3.1:1 at the end of the first three quarters of the year.
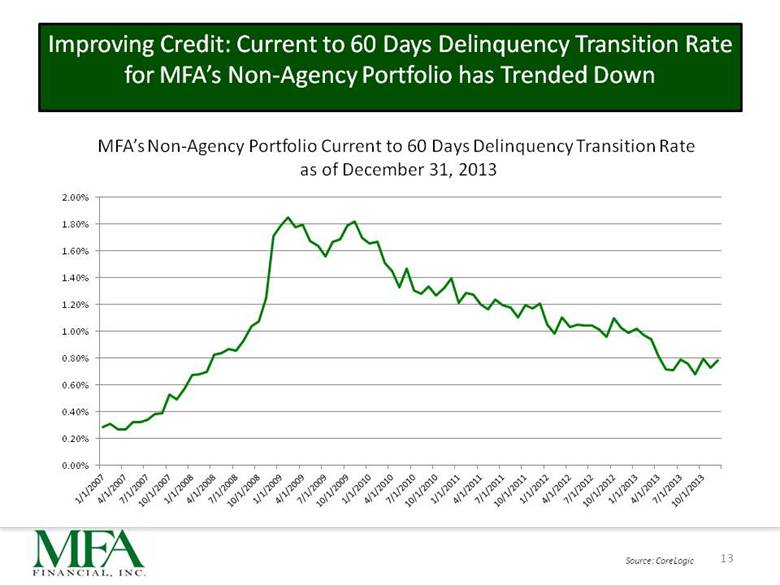
“Our Non-Agency MBS portfolio continues to benefit from its exposure to positive trends in housing fundamentals. Home price appreciation and underlying mortgage loan amortization continue to decrease the Loan-To-Value Ratio (“LTV”) for many of the mortgages underlying MFA’s Non-Agency portfolio. We estimate that the LTV of mortgage loans underlying our Non-Agency MBS has declined from approximately 105% as of January 2012 to less than 85% as of December 31, 2013. As a result, we continue to reduce our estimate of future losses.”
Craig Knutson, MFA’s President and COO, added, “More than half of the underlying loans in the Non-Agency portfolio are in California and Florida (approximately 46% and 8% respectively), both of which have experienced home price appreciation in excess of 10% over the last 12 months. This home price appreciation is generally due to a combination of limited housing supply, low mortgage rates, capital flows into own-to-rent foreclosure purchases and demographic-driven U.S. household formation.
“MFA’s Non-Agency MBS had a face amount of $5.616 billion with an amortized cost of $4.114 billion and a net purchase discount of $1.502 billion at December 31, 2013. This discount consists of a $1.043 billion credit reserve and other-than-temporary impairments and a $459.4 million net accretable discount. We believe this credit reserve appropriately factors in remaining uncertainties regarding underlying mortgage performance and the potential impact on future cash flows. Our Non-Agency MBS loss adjusted yield of 7.77% is based on projected defaults equal to 30% of underlying loan balances. On average, these loans are more than 7.5 years seasoned and only 16.5% are currently more than 60 days delinquent.”
For the fourth quarter ended December 31, 2013, MFA generated net income available to common stockholders of $74.8 million, or $0.20 per share of common stock. Net income includes a $375,000 increase in the fair value of the securities underlying “Linked Transactions,” $6.1 million of gains realized on sales of MBS and US Treasury Securities, and $1.2 million of gains realized on the closeout of Agency MBS TBA short positions.
In the quarter, the yield on interest earning assets increased due to the higher yield on Non-Agency MBS resulting primarily from improvements in underlying credit fundamentals and the higher yield on Agency MBS due to lower premium amortization. The Agency portfolio had an average amortized cost basis of 103.6% of par as of December 31, 2013, and generated a 2.37% yield in the fourth quarter. The Non-Agency portfolio had an average amortized cost of 73.2% of par as of December 31, 2013, and generated a loss-adjusted yield of 7.77% in the fourth quarter. For the three months ended December 31, 2013, MFA’s costs for compensation and benefits and other general and administrative expenses were $7.7 million or an annualized 0.98% of stockholders’ equity as of December 31, 2013.
Prepayments for MFA’s MBS portfolio decreased in the fourth quarter. The average CPR for the MBS portfolio declined 29%, with the largest decline in the Agency MBS portion of the portfolio. The following table presents the weighted average prepayment speed on MFA’s MBS portfolio.
Table 1
|
|
|
Fourth Quarter |
|
Third Quarter |
|
Percent |
|
|
MBS Portfolio |
|
13.42 |
% |
18.77 |
% |
(28.50 |
)% |
|
Agency MBS |
|
12.87 |
% |
19.25 |
% |
(33.14 |
)% |
|
Non-Agency MBS |
|
14.16 |
% |
18.15 |
% |
(21.98 |
)% |
As of December 31, 2013, under its swap agreements, MFA had a weighted average fixed-pay rate of interest of 1.91% and a floating receive rate of 0.17% on notional balances totaling $4.045 billion, with an average maturity of 49 months. MFA’s estimated effective duration, which is the measure of price sensitivity to changes in interest rates, was approximately 0.90 as of December 31, 2013.
The following table presents MFA’s asset allocation as of December 31, 2013 and the fourth quarter 2013 yield on average interest earning assets, average cost of funds and net interest rate spread for the various asset types.
Table 2
ASSET ALLOCATION
|
At December 31, 2013 |
|
Agency MBS |
|
Non-Agency |
|
MBS Portfolio |
|
Cash (2) |
|
Other, net (3) |
|
Total |
| ||||||
|
($ in Thousands) |
|
|
|
|
|
|
|
|
|
|
|
|
| ||||||
|
Amortized Cost |
|
$ |
6,504,846 |
|
$ |
4,240,097 |
|
$ |
10,744,943 |
|
$ |
602,890 |
|
$ |
(31,509 |
) |
$ |
11,316,324 |
|
|
Market Value |
|
$ |
6,519,221 |
|
$ |
4,982,927 |
|
$ |
11,502,148 |
|
$ |
602,890 |
|
$ |
(31,509 |
) |
$ |
12,073,529 |
|
|
Less Payable for Unsettled Purchases |
|
(6,737 |
) |
— |
|
(6,737 |
) |
— |
|
— |
|
(6,737 |
) | ||||||
|
Less Repurchase Agreements |
|
(5,750,053 |
) |
(2,309,323 |
) |
(8,059,376 |
) |
— |
|
— |
|
(8,059,376 |
) | ||||||
|
Less Multi-year Collateralized Financing Arrangements |
|
— |
|
(383,743 |
) |
(383,743 |
) |
— |
|
— |
|
(383,743 |
) | ||||||
|
Less Securitized Debt |
|
— |
|
(366,205 |
) |
(366,205 |
) |
— |
|
— |
|
(366,205 |
) | ||||||
|
Less Senior Notes |
|
— |
|
— |
|
— |
|
— |
|
(100,000 |
) |
(100,000 |
) | ||||||
|
Equity Allocated |
|
$ |
762,431 |
|
$ |
1,923,656 |
|
$ |
2,686,087 |
|
$ |
602,890 |
|
$ |
(131,509 |
) |
$ |
3,157,468 |
|
|
Less Swaps at Market Value |
|
— |
|
— |
|
— |
|
— |
|
(15,217 |
) |
(15,217 |
) | ||||||
|
Net Equity Allocated |
|
$ |
762,431 |
|
$ |
1,923,656 |
|
$ |
2,686,087 |
|
$ |
602,890 |
|
$ |
(146,726 |
) |
$ |
3,142,251 |
|
|
|
|
|
|
|
|
|
|
|
|
|
|
|
| ||||||
|
Debt/Net Equity Ratio (4) |
|
7.6 |
x |
1.6 |
x |
— |
|
— |
|
— |
|
3.0 |
x | ||||||
|
|
|
|
|
|
|
|
|
|
|
|
|
|
| ||||||
|
For the Quarter Ended December 31, 2013 |
|
|
|
|
|
|
|
|
|
|
|
|
| ||||||
|
Yield on Average Interest Earning Assets |
|
2.37 |
% |
7.77 |
% |
4.48 |
% |
0.02 |
% |
— |
|
4.26 |
% | ||||||
|
Less Average MBS Cost of Funds (5) |
|
(1.26 |
) |
(3.01 |
) |
(1.85 |
) |
— |
|
— |
|
(1.85 |
) | ||||||
|
Senior Notes (6) |
|
— |
|
— |
|
— |
|
— |
|
(8.03 |
)% |
(8.03 |
) | ||||||
|
Net Interest Rate Spread |
|
1.11 |
% |
4.76 |
% |
2.63 |
% |
0.02 |
% |
(8.03 |
)% |
2.34 |
% | ||||||
(1) Information presented with respect to Non-Agency MBS, related repurchase agreement borrowings and resulting totals are presented on a non-GAAP basis. Includes $130.8 million Non-Agency MBS and $102.7 million repurchase agreements underlying “linked transactions.” The purchase of a Non-Agency MBS and contemporaneous repurchase borrowing of this MBS with the same counterparty are accounted for under GAAP as a linked transaction. The two components of a linked transaction (MBS and associated borrowings under a repurchase agreement) are evaluated on a combined basis and are presented net as linked transactions on our consolidated balance sheet.
(2) Includes cash, cash equivalents and restricted cash.
(3) Includes securities obtained and pledged as collateral, interest receivable, goodwill, prepaid and other assets, borrowings under repurchase agreements of $382.7 million for which U.S. Treasury securities are pledged as collateral, interest payable, dividends payable, excise tax and interest payable and accrued expenses and other liabilities.
(4) For the Agency and Non-Agency MBS portfolio, represents the sum of borrowings under repurchase agreements, payable for unsettled purchases, multi-year collateralized financing arrangements of $383.7 million and securitized debt as a multiple of net equity allocated. The numerator of our Total Debt/Net Equity ratio also includes borrowings under repurchase agreements of $382.7 million for which U.S. Treasury securities are pledged as collateral and Senior Notes.
(5) Average cost of funds includes interest on repurchase agreements, including the cost of swaps, and securitized debt. Non-Agency cost of funds includes 72 basis points associated with Swaps to hedge additional interest rate sensitivity on these assets.
(6) Includes amortization costs in connection with the issuance in of Senior Notes.
At December 31, 2013, MFA’s $11.502 billion of Agency and Non-Agency MBS, which includes MBS underlying Linked Transactions, were backed by hybrid, adjustable and fixed-rate mortgages. Additional information about these MBS, including months to reset and three month average CPR, is presented below:
Table 3
|
|
|
Agency MBS |
|
Non-Agency MBS |
|
Total |
| |||||||||||||||
|
($ in thousands) |
|
Fair |
|
Avg |
|
Avg |
|
Fair |
|
Avg |
|
Avg |
|
Fair |
|
Avg |
|
Avg |
| |||
|
Time to Reset |
|
Value |
|
MTR (1) |
|
CPR (2) |
|
Value |
|
MTR (1) |
|
CPR (2) |
|
Value |
|
MTR (1) |
|
CPR (2) |
| |||
|
< 2 years (3) |
|
$ |
1,994,323 |
|
10 |
|
16.3 |
% |
$ |
3,072,603 |
|
4 |
|
12.3 |
% |
$ |
5,066,926 |
|
6 |
|
13.8 |
% |
|
2-5 years |
|
1,155,070 |
|
43 |
|
18.5 |
|
410,635 |
|
35 |
|
22.6 |
|
1,565,705 |
|
41 |
|
19.7 |
| |||
|
> 5 years |
|
909,762 |
|
76 |
|
12.1 |
|
— |
|
— |
|
— |
|
909,762 |
|
76 |
|
12.1 |
| |||
|
ARM-MBS Total |
|
$ |
4,059,155 |
|
34 |
|
15.9 |
% |
$ |
3,483,238 |
|
8 |
|
13.6 |
% |
$ |
7,542,393 |
|
22 |
|
14.8 |
% |
|
15-year fixed (4) |
|
$ |
2,460,066 |
|
|
|
8.8 |
% |
$ |
16,756 |
|
|
|
18.6 |
% |
$ |
2,476,822 |
|
|
|
8.1 |
% |
|
30-year fixed (4) |
|
— |
|
|
|
— |
|
1,477,099 |
|
|
|
15.1 |
|
1,477,099 |
|
|
|
15.1 |
| |||
|
40-year fixed (4) |
|
— |
|
|
|
— |
|
5,834 |
|
|
|
10.5 |
|
5,834 |
|
|
|
10.5 |
| |||
|
Fixed-Rate Total |
|
$ |
2,460,066 |
|
|
|
8.8 |
% |
$ |
1,499,689 |
|
|
|
15.1 |
% |
$ |
3,959,755 |
|
|
|
10.6 |
% |
|
MBS Total |
|
$ |
6,519,221 |
|
|
|
12.9 |
% |
$ |
4,982,927 |
|
|
|
14.0 |
% |
$ |
11,502,148 |
|
|
|
13.4 |
% |
1) MTR or Months To Reset is the number of months remaining before the coupon interest rate resets. At reset, the MBS coupon will adjust based upon the underlying benchmark interest rate index, margin and periodic or lifetime caps. The MTR does not reflect scheduled amortization or prepayments.
2) Average CPR weighted by positions as of beginning of each month in the quarter.
3) Includes floating rate MBS that may be collateralized by fixed rate mortgages.
4) Information presented based on data available at time of loan origination.
MFA Financial, Inc. plans to host a live audio webcast of its investor conference call on Thursday, February 13, 2014, at 10:00 a.m. (Eastern Time) to discuss its fourth quarter 2013 financial results. The live audio webcast will be accessible to the general public over the internet at http://www.mfafinancial.com through the “Webcasts & Presentations” link on MFA’s home page. To listen to the conference call over the internet, please go to the MFA website at least 15 minutes before the call to register and to download and install any needed audio software. Earnings presentation materials will be posted on the MFA website prior to the conference call and an audio replay will be available on the website following the call.
When used in this press release or other written or oral communications, statements which are not historical in nature, including those containing words such as “will,” “believe,” “expect,” “anticipate,” “estimate,” “plan,” “continue,” “intend,” “should,” “may” or similar expressions, are intended to identify “forward-looking statements” within the meaning of Section 27A of the Securities Act of 1933, as amended, and Section 21E of the Securities Exchange Act of 1934, as amended, and, as such, may involve known and unknown risks, uncertainties and assumptions. Statements regarding the following subjects, among others, may be forward-looking: changes in interest rates and the market value of MFA’s MBS; changes in the prepayment rates on the mortgage loans securing MFA’s MBS; changes in the default rates and management’s assumptions regarding default rates on the mortgage loans securing MFA’s Non-Agency MBS; MFA’s ability to borrow to finance its assets and the terms, including the cost, maturity and other terms, of any such borrowing; implementation of or changes in government regulations or programs affecting MFA’s business; MFA’s estimates regarding taxable income the actual amount of which is dependent on a number of factors, including, but not limited to, changes in the amount of interest income and financing costs, the method elected by the Company to accrete the market discount on Non-Agency MBS and the extent of prepayments, realized losses and changes in the composition of MFA’s Agency MBS and Non-Agency MBS portfolios that may occur during the applicable tax period, including gain or loss on any MBS disposals; the timing and amount of distributions to stockholders, which are declared and paid at the discretion of MFA’s Board of Directors and will depend on, among other things, MFA’s taxable income, its financial results and overall financial condition and liquidity, maintenance of its REIT qualification and such other factors as the Board deems relevant; MFA’s ability to maintain its qualification as a REIT for federal income tax purposes; MFA’s ability to maintain its exemption from registration under the Investment Company Act of 1940, as amended (or the Investment Company Act), including statements regarding the Concept Release issued by the SEC relating to interpretive issues under the Investment Company Act with respect to the status under the Investment Company Act of certain companies that are in engaged in the business of acquiring mortgages and mortgage-related interests; and risks associated with investing in real estate assets, including changes in business conditions and the general economy. These and other risks, uncertainties and factors, including those described in the annual, quarterly and current reports that MFA files with the Securities and Exchange Commission, could cause MFA’s actual results to differ materially from those projected in any forward-looking statements it makes. All forward-looking statements speak only as of the date on which they are made. New risks and uncertainties arise over time and it is not possible to predict those events or how they may affect MFA. Except as required by law, MFA is not obligated to, and does not intend to, update or revise any forward-looking statements, whether as a result of new information, future events or otherwise.
MFA FINANCIAL, INC.
CONSOLIDATED BALANCE SHEETS
|
(In Thousands Except Per Share Amounts) |
|
December 31, |
|
December 31, |
| ||
|
|
|
(Unaudited) |
|
|
| ||
|
Assets: |
|
|
|
|
| ||
|
Mortgage-backed securities (“MBS”): |
|
|
|
|
| ||
|
Agency MBS, at fair value ($6,142,306 and $6,747,299 pledged as collateral, respectively) |
|
$ |
6,519,221 |
|
$ |
7,225,460 |
|
|
Non-Agency MBS, at fair value ($1,778,067 and $1,602,953 pledged as collateral, respectively) |
|
2,569,766 |
|
2,762,006 |
| ||
|
Non-Agency MBS transferred to consolidated variable interest entities (“VIEs”) |
|
2,282,371 |
|
2,620,159 |
| ||
|
Securities obtained and pledged as collateral, at fair value |
|
383,743 |
|
408,833 |
| ||
|
Cash and cash equivalents |
|
565,370 |
|
401,293 |
| ||
|
Restricted cash |
|
37,520 |
|
5,016 |
| ||
|
Interest Receivable |
|
35,828 |
|
44,033 |
| ||
|
Derivative instruments: |
|
|
|
|
| ||
|
MBS linked transactions, net (“Linked Transactions”), at fair value |
|
28,181 |
|
12,704 |
| ||
|
Derivative hedging instruments, at fair value |
|
13,000 |
|
203 |
| ||
|
Goodwill |
|
7,189 |
|
7,189 |
| ||
|
Prepaid and other assets |
|
29,719 |
|
30,654 |
| ||
|
Total Assets |
|
$ |
12,471,908 |
|
$ |
13,517,550 |
|
|
|
|
|
|
|
| ||
|
Liabilities: |
|
|
|
|
| ||
|
Repurchase agreements |
|
$ |
8,339,297 |
|
$ |
8,752,472 |
|
|
Securitized debt |
|
366,205 |
|
646,816 |
| ||
|
Obligation to return securities obtained as collateral, at fair value |
|
383,743 |
|
508,827 |
| ||
|
8% Senior Notes due 2042 (“Senior Notes”) |
|
100,000 |
|
100,000 |
| ||
|
Accrued interest payable |
|
14,726 |
|
16,104 |
| ||
|
Derivative hedging instruments, at fair value |
|
28,217 |
|
63,034 |
| ||
|
Dividends and dividend equivalents rights (“DERs”) payable |
|
73,643 |
|
72,222 |
| ||
|
Payable for unsettled purchases |
|
6,737 |
|
33,479 |
| ||
|
Excise tax and interest payable |
|
6,398 |
|
7,500 |
| ||
|
Accrued expenses and other liabilities |
|
10,691 |
|
6,090 |
| ||
|
Total Liabilities |
|
$ |
9,329,657 |
|
$ |
10,206,544 |
|
|
|
|
|
|
|
| ||
|
Commitments and contingencies |
|
|
|
|
| ||
|
|
|
|
|
|
| ||
|
Stockholders’ Equity: |
|
|
|
|
| ||
|
Preferred stock, $.01 par value; 8.50% Series A cumulative redeemable 5,000 shares authorized; 0 and 3,840 shares issued and outstanding, respectively ($0 and $96,000 aggregate liquidation preference, respectively) |
|
$ |
— |
|
$ |
38 |
|
|
Preferred stock, $.01 par value; 7.50% Series B cumulative redeemable 8,050 and 0 shares authorized; 8,000 and 0 shares issued and outstanding, respectively ($200,000 and $0 aggregate liquidation preference, respectively) |
|
80 |
|
— |
| ||
|
Common stock, $.01 par value; 886,950 and 895,000 shares authorized; 365,125 and 357,546 shares issued and outstanding, respectively |
|
3,651 |
|
3,575 |
| ||
|
Additional paid-in capital, in excess of par |
|
2,972,369 |
|
2,805,724 |
| ||
|
Accumulated deficit |
|
(571,544 |
) |
(260,308 |
) | ||
|
Accumulated other comprehensive income |
|
737,695 |
|
761,977 |
| ||
|
Total Stockholders’ Equity |
|
$ |
3,142,251 |
|
$ |
3,311,006 |
|
|
Total Liabilities and Stockholders’ Equity |
|
$ |
12,471,908 |
|
$ |
13,517,550 |
|
MFA FINANCIAL, INC.
CONSOLIDATED STATEMENTS OF OPERATIONS
|
|
|
Three Months Ended |
|
For the Year Ended |
| ||||||||
|
(In Thousands, Except Per Share Amounts) |
|
2013 |
|
2012 |
|
2013 |
|
2012 |
| ||||
|
|
|
(Unaudited) |
|
(Unaudited) |
|
(Unaudited) |
|
|
| ||||
|
Interest Income: |
|
|
|
|
|
|
|
|
| ||||
|
Agency MBS |
|
$ |
39,064 |
|
$ |
46,010 |
|
$ |
156,046 |
|
$ |
196,058 |
|
|
Non-Agency MBS |
|
42,310 |
|
39,346 |
|
170,485 |
|
134,901 |
| ||||
|
Non-Agency MBS transferred to consolidated VIEs |
|
39,644 |
|
39,569 |
|
156,285 |
|
168,071 |
| ||||
|
Cash and cash equivalent investments |
|
31 |
|
43 |
|
124 |
|
127 |
| ||||
|
Interest Income |
|
$ |
121,049 |
|
$ |
124,968 |
|
$ |
482,940 |
|
$ |
499,157 |
|
|
|
|
|
|
|
|
|
|
|
| ||||
|
Interest Expense: |
|
|
|
|
|
|
|
|
| ||||
|
Repurchase agreements |
|
$ |
38,700 |
|
$ |
37,128 |
|
$ |
143,885 |
|
$ |
148,767 |
|
|
Securitized debt |
|
2,719 |
|
3,920 |
|
12,100 |
|
17,106 |
| ||||
|
Senior Notes |
|
2,008 |
|
2,006 |
|
8,028 |
|
5,797 |
| ||||
|
Total Interest Expense |
|
$ |
43,427 |
|
$ |
43,054 |
|
$ |
164,013 |
|
$ |
171,670 |
|
|
|
|
|
|
|
|
|
|
|
| ||||
|
Net Interest Income |
|
$ |
77,622 |
|
$ |
81,914 |
|
$ |
318,927 |
|
$ |
327,487 |
|
|
|
|
|
|
|
|
|
|
|
| ||||
|
Other-Than-Temporary Impairments: |
|
|
|
|
|
|
|
|
| ||||
|
Total other-than-temporary impairment losses |
|
$ |
— |
|
$ |
— |
|
$ |
— |
|
$ |
(879 |
) |
|
Portion of loss reclassed from other comprehensive income |
|
— |
|
— |
|
— |
|
(321 |
) | ||||
|
Net Impairment Losses Recognized in Earnings |
|
$ |
— |
|
$ |
— |
|
$ |
— |
|
$ |
(1,200 |
) |
|
|
|
|
|
|
|
|
|
|
| ||||
|
Other Income, net: |
|
|
|
|
|
|
|
|
| ||||
|
Unrealized net gains and net interest income from Linked Transactions |
|
$ |
1,440 |
|
$ |
1,166 |
|
$ |
3,225 |
|
$ |
12,610 |
|
|
Gains/(Losses) on TBA short positions |
|
1,207 |
|
— |
|
(7,517 |
) |
— |
| ||||
|
Gain on sales of MBS and U.S. Treasury securities, net |
|
6,147 |
|
1,769 |
|
25,825 |
|
9,001 |
| ||||
|
Other, net |
|
54 |
|
8 |
|
219 |
|
10 |
| ||||
|
Other Income, net |
|
$ |
8,848 |
|
$ |
2,943 |
|
$ |
21,752 |
|
$ |
21,621 |
|
|
|
|
|
|
|
|
|
|
|
| ||||
|
Operating and Other Expense: |
|
|
|
|
|
|
|
|
| ||||
|
Compensation and benefits |
|
$ |
4,477 |
|
$ |
5,337 |
|
$ |
20,328 |
|
$ |
22,089 |
|
|
Other general and administrative expense |
|
3,186 |
|
2,801 |
|
13,361 |
|
11,480 |
| ||||
|
Excise tax and interest |
|
250 |
|
7,500 |
|
2,250 |
|
7,500 |
| ||||
|
Impairment of resecuritization related costs |
|
— |
|
— |
|
2,031 |
|
— |
| ||||
|
Operating and Other Expense |
|
$ |
7,913 |
|
$ |
15,638 |
|
$ |
37,970 |
|
$ |
41,069 |
|
|
|
|
|
|
|
|
|
|
|
| ||||
|
Net Income |
|
$ |
78,557 |
|
$ |
69,129 |
|
$ |
302,709 |
|
$ |
306,839 |
|
|
Less Preferred Stock Dividends |
|
3,750 |
|
2,040 |
|
13,750 |
|
8,160 |
| ||||
|
Less Issuance Costs of Redeemed Preferred Stock |
|
— |
|
— |
|
3,947 |
|
— |
| ||||
|
Net Income Available to Common Stock and Participating Securities |
|
$ |
74,807 |
|
$ |
67,179 |
|
$ |
285,012 |
|
$ |
298,679 |
|
|
|
|
|
|
|
|
|
|
|
| ||||
|
Earnings per Common Share - Basic and Diluted |
|
$ |
0.20 |
|
$ |
0.19 |
|
$ |
0.78 |
|
$ |
0.83 |
|
|
|
|
|
|
|
|
|
|
|
| ||||
|
Dividends Declared per Share of Common Stock |
|
$ |
0.20 |
|
$ |
0.20 |
|
$ |
1.64 |
|
$ |
0.88 |
|