☒ |
ANNUALREPORT PURSUANT TO SECTION 13 OR 15(d) OF THE SECURITIES EXCHANGE ACT OF 1934 | |
For the fiscal year ended December 31 , 2022 | ||
or | ||
☐ |
TRANSITIONREPORT PURSUANT TO SECTION 13 OR 15(d) OF THE SECURITIES EXCHANGE ACT OF 1934 |
98-0181725 | ||
State or other jurisdiction of incorporation or organization |
(I.R.S. Employer Identification No.) | |
8310 South Valley Highway Suite 350 Englewood Colorado |
80112 | |
(Address of principal executive offices) |
(Zip Code) |
Title of each class |
Trading Symbol(s) |
Name of each exchange on which registered | ||
Common stock , par value $0.01 per share |
IOSP |
NASDAQ |
Large accelerated filer |
☒ |
Accelerated filer |
☐ | |||
Non-accelerated filer |
☐ |
Smaller reporting company |
☐ | |||
Emerging growth company |
☐ |
TABLE OF CONTENTS
CAUTIONARY STATEMENT RELATIVE TO FORWARD-LOOKING STATEMENTS
FORWARD-LOOKING STATEMENTS
This Form 10-K contains certain “forward-looking statements” within the meaning of the Private Securities Litigation Reform Act of 1995. All statements other than statements of historical facts included or incorporated herein may constitute forward-looking statements. Such forward-looking statements include statements (covered by words like “expects,” “estimates,” “anticipates,” “may,” “could,” “believes,” “feels,” “plans,” “intends” or similar words or expressions, for example) which relate to earnings, growth potential, operating performance, events or developments that we expect or anticipate will or may occur in the future. Although forward-looking statements are believed by management to be reasonable when made, they are subject to certain risks, uncertainties and assumptions, and our actual performance or results may differ materially from these forward-looking statements. You are urged to review our discussion of risks and uncertainties that could cause actual results to differ from forward-looking statements under the heading “Risk Factors.” Innospec undertakes no obligation to publicly update or revise any forward-looking statements, whether as a result of new information, future events or otherwise.
1
PART I
Item 1 | Business |
When we use the terms “Innospec,” “the Corporation,” “the Company,” “Registrant,” “we,” “us” and “our,” we are referring to Innospec Inc. and its consolidated subsidiaries unless otherwise indicated or the context otherwise requires.
General
Innospec develops, manufactures, blends, markets and supplies a wide range of specialty chemicals to markets in the Americas, Europe, the Middle East, Africa and Asia-Pacific. Our Performance Chemicals business creates innovative technology-based solutions for our customers in the personal care, home care, agrochemical, mining and industrial markets. Our Fuel Specialties business specializes in manufacturing and supplying fuel additives that improve fuel efficiency, boost engine performance and reduce harmful emissions. Our Oilfield Services business supplies drilling, completion and production chemicals which make exploration and production more effective, cost-efficient and environmentally friendly.
Segment Information
The Company reports its financial performance based on three reportable segments which are Performance Chemicals, Fuel Specialties and Oilfield Services.
Our Octane Additives segment has previously ceased trading and is no longer a reporting segment from July 1, 2020, as reported in our Quarterly Report on Form 10-Q for the quarter ended June 30, 2020.
For financial information about each of our segments, see Note 3 of the Notes to the Consolidated Financial Statements.
Performance Chemicals
Our Performance Chemicals segment provides innovative technology-based solutions for our customers’ processes or products focused in the personal care, home care, agrochemical, mining and other industrial markets.
This segment has grown through acquisitions, together with the organic development and marketing of innovative products in these end-markets.
Our customers in this segment include large multinational companies, manufacturers of personal care and home care products and global mining, agriculture and building products and other industrial companies.
Fuel Specialties
Our Fuel Specialties segment develops, manufactures, blends, markets and supplies a range of specialty chemical products used as additives in diesel, jet, marine, fuel oil and other fuels.
2
These fuel additive products help improve fuel efficiency, boost engine performance and reduce harmful emissions; and are most commonly used in the efficient operation of commercial trucking, marine and aviation engines, power station generators, heating oil and other industrial machinery applications.
The segment has grown organically through our development of new products to address increased demand for fuel, focus on fuel economy, higher efficiency engine technologies and legislative developments, including tightening global emissions regulations. We are also applying these fuels technologies to an increasing number of non-fuel applications in a variety of industries.
Our customers in this segment include national and multinational oil companies, fuel marketers and retailers, fuel terminals, marine lines, coating & plastics producers and other heavy industrial end-users.
Oilfield Services
Our Oilfield Services segment develops and markets chemical solutions for fracturing, drilling, stimulation and completion operations, products for oil and gas production and transport which aid flow assurance and maintain asset integrity.
Our customers in this segment include multinational public and independent exploration & production and oilfield services companies currently operating principally in the Americas.
Strategy
Our strategy is to develop new and improved products and technologies to continue to strengthen and increase our market positions within our Performance Chemicals, Fuel Specialties and Oilfield Services segments. We also actively continue to assess potential strategic acquisitions, partnerships and other opportunities that would enhance and expand our customer offering. We focus on opportunities that would extend our technology base, geographical coverage or product portfolio. We believe that focusing on the Performance Chemicals, Fuel Specialties and Oilfield Services segments, in which the Company has existing experience, expertise and knowledge, provides opportunities for positive returns on investment with reduced operating risk. We also continue to expand our geographical footprint, consistent with the development of global markets.
Geographical Area Information
Financial information with respect to our domestic and foreign operations is contained in Note 3 of the Notes to the Consolidated Financial Statements.
Working Capital
The nature of our customers’ businesses generally requires us to hold appropriate amounts of inventory in order to respond quickly to customers’ needs. We therefore require corresponding amounts of working capital for normal operations. We do not believe that this is materially different to our competitors.
3
The purchase of large amounts of certain raw materials across all our segments can create some variations in working capital requirements, but these are planned and managed by the business.
We do not believe that our terms of sale or purchase differ markedly from those of our competitors.
Raw Materials and Product Supply
We use a variety of raw materials and chemicals in our manufacturing and blending processes and believe that sources for these are adequate for our current operations. Our major purchases are oleochemicals and derivatives, cetane number improvers, ethylene, various solvents, amines, alcohols, olefin and polyacrylamides. These purchases account for a substantial portion of the Company’s variable manufacturing costs. These materials are, with the exception of ethylene for our operations in Germany, available from more than one source. Although ethylene is, in theory, available from several sources, it is not permissible to transport ethylene by road in Germany. As a result, we source ethylene for our German operations via a direct pipeline, making it effectively a single source. Ethylene is used as a primary raw material for one of our German operations in products representing approximately 5% of Innospec’s sales.
We use long-term contracts (generally with fixed or formula-based costs) and advance bulk purchases to help ensure availability and continuity of supply, and to manage the risk of cost increases. From time to time, for some raw materials, the risk of cost increases is managed with commodity swaps.
We continue to monitor the situation and adjust our procurement strategies as we deem appropriate. The Company forecasts its raw material requirements substantially in advance, and seeks to build long-term relationships and contractual positions with supply partners to safeguard its raw material positions. In addition, the Company operates an extensive risk management program which seeks to source key raw materials from multiple sources and to develop suitable contingency plans.
Intellectual Property
Our intellectual property, including trademarks, patents and licenses, forms a significant part of the Company’s competitive advantage for all our segments. The Company does not, however, consider its business as a whole to be dependent on any one trademark, patent or license.
The Company has a portfolio of trademarks and patents, both granted and in the application stage, covering products and processes in several jurisdictions. The majority of these patents were developed by the Company and, subject to maintenance obligations including the payment of renewal fees, have at least 10 years life remaining.
The trademark “Innospec and the Innospec device” in Classes 1, 2 and 4 of the “International Classification of Goods and Services for the Purposes of the Registration of Marks” are
4
registered in all jurisdictions in which the Company has a significant market presence. The Company also has trademark registrations for certain product names in all jurisdictions in which it has a significant market presence.
We actively protect our inventions, new technologies, and product developments by filing patent applications and maintaining trade secrets. In addition, we vigorously participate in patent opposition proceedings around the world where necessary to secure a technology base free from infringement of intellectual property.
Customers
In 2022, the Company had a significant customer in the Oilfield Services segment which accounted for $222.2 million (11.3%) of our net group sales.
Competition
Certain markets in which the Company operates are subject to significant competition. The Company competes on the basis of a number of factors including, but not limited to, product quality and performance, specialized product lines, customer relationships and service, and regulatory expertise.
Performance Chemicals: Within the Performance Chemicals segment we operate in the personal care, home care, agrochemical, mining markets and other industrial markets, which are highly fragmented, and the Company experiences substantial competition from a large number of multinational and specialty chemical suppliers in each geographical market. Our competitive position in these markets is based on us supplying a superior, diverse product portfolio which solves particular customer problems or enhances the performance of new or existing products. In a number of specialty chemicals markets, we also supply niche product lines, where we enjoy market-leading positions.
Fuel Specialties: The Fuel Specialties segment is generally characterized by a small number of competitors, none of which hold a dominant position. We consider our competitive edge to be our proven technical development capacity, independence from major oil companies and strong long-term customer relationships. We believe we remain the world’s only producer of tetra ethyl lead (“TEL”) for use in aviation gasoline, which we market as our AvGas product line.
Oilfield Services: Our Oilfield Services segment is very fragmented and although there are a small number of very large competitors, there are also a large number of smaller players focused on specific technologies or regions. Our competitive strength is our proven technology, broad regional coverage and strong customer relationships.
Research, Development, Testing and Technical Support
Research, product/application development and technical support (“R&D”) provide the basis for the growth of our Performance Chemicals, Fuel Specialties and Oilfield Services
5
segments. Accordingly, the Company’s R&D activity has been, and will continue to be, focused on the development of new products and formulations. Our R&D department provides technical support for all of our reporting segments. Expenditures to support R&D services were $38.7 million, $37.4 million and $30.9 million in 2022, 2021 and 2020, respectively.
We believe that our proven technical capabilities provide us with a significant competitive advantage. Our Performance Chemicals business has launched significant new mild surfactants, which are well aligned with developing customer needs. In addition, the business has developed further formulations in emollients, silicones and surfactants for the personal care, home care, agrochemical, mining markets and other industrial markets. Fuel Specialties has continued to innovate, focused on bringing new technologies to market which reduce pollution and improve fuel economy, including detergents and cold flow improvers. In Oilfield Services, new technologies have been introduced to improve the hydrocarbon yield from customers’ operations and to protect assets, including friction modifiers, biocide formulations and additives to improve drilling muds.
Health, Safety and Environmental Matters
We are subject to environmental laws in the countries in which we operate and conduct business. Management believes that the Company is in material compliance with applicable environmental laws and has made the necessary provisions for the continued costs of compliance with environmental laws.
Our principal site giving rise to asset retirement obligations is our Ellesmere Port manufacturing site in the United Kingdom. There are also asset retirement obligations and environmental remediation liabilities on a much smaller scale in respect of other manufacturing sites. We regularly review the future expected costs of remediation and the current estimate is reflected in the Consolidated Balance Sheets and Note 13 of the Notes to the Consolidated Financial Statements.
The European Union (“E.U.”) legislation known as the Registration, Evaluation and Authorization of Chemical Substances Regulations (“REACH”) requires most of the substances in the Company’s products to be registered with the European Chemicals Agency. Under this legislation the Company has to demonstrate that the substances it uses in its products are safe for use and appropriate for their intended purposes in the E.U.. During this registration and continual evaluation process, the Company incurs expenses to test and register substances it manufactures or imports in the E.U..
Following the end of the Brexit transition process, on January 11, 2021 the United Kingdom (“U.K.”) government introduced U.K. REACH with the same registration requirements for substances produced in or imported into the U.K.. Furthermore, globally, similar regulatory regimes to the E.U. and U.K. REACH are also entering into force or are being proposed in several other countries. These registration based regulatory regimes will result in increasing test expenses and registration fees to ensure Innospec products remain compliant with the appropriate regulations and can continue to be sold in these markets.
6
Environmental, Social & Governance (“ESG”) and Corporate Social Responsibility Reporting
As part of our commitment to being open and transparent about our performance, our latest Responsible Business Report, which is our 2021 Report, was independently assured to assess its adherence to the globally recognized AA1000 Assurance Standard.
The Responsible Business Report, along with further information on our sustainability program and performance is available online in the “Corporate Social Responsibility” section of the Company’s website at https://innospecsustainability.com. Such information does not constitute part of, and is not incorporated by reference into this Annual Report on Form 10-K.
Employees and Human Capital Management
The Company had approximately 2,100 employees in 25 countries as at December 31, 2022.
Human capital management is critical to Innospec’s ongoing business success, which requires investing in our people. Our aim is to create a highly engaged and motivated workforce where employees are inspired by leadership, engaged in purpose-driven, meaningful work and have opportunities for growth and development.
An effective approach to human capital management requires that we invest in talent, development, culture and employee engagement. We aim to create an environment where our employees are encouraged to make positive contributions and fulfill their potential.
The Company’s Board of Directors (the “Board”) is also actively involved in reviewing and approving executive compensation, selections and succession plans so that we have leadership in place with the requisite skills and experience to deliver results the right way. The Company’s Chief Executive Officer (“CEO”) periodically provides the Board with an assessment of senior executives that have potential as successor for the CEO position, as well as perspectives on potential candidates for other senior management positions.
Core Values & Culture
Responsible Growth through Innovation and Customer Service: Financial stability and growth are essential to maintain our goal of making a positive contribution towards a more sustainable future. Generating economic benefits for our employees, stockholders, and local communities, while encouraging ongoing innovation in our product portfolio alongside excellent customer service which will allow our business to be competitive and sustainable.
Caring for People: We strive to create a safe and caring culture where our employees are supported and encouraged to make positive contributions. Our continued success depends on keeping people safe, promoting a healthy lifestyle, protecting human rights, improving education, training and maintaining good relations with our neighbors.
Conserving & Protecting the Environment: We aim to use resources as efficiently as practicable and minimize the impact of our operations on the environment. We look to supply
7
safe, sustainable products, designed to meet the needs of society now and in the future while minimizing their environmental impact.
Leading by Example: We understand that honest, ethical and transparent conduct is vital to our success and reputation. Every employee plays an essential part in complying with local and national laws, rules and regulations. We uphold a high standard of corporate and business integrity across all of our activities.
Employee Engagement
Attracting Talent: We believe our hardworking team of employees is our greatest asset. We employ approximately 2,100 people across 25 countries and we believe that the skills, commitment and enthusiasm of our employees helps us to deliver long-term growth for investors.
Training: Across our sites, we provide local support and opportunities for the next generation of talent in our industry by offering a range of placements, internships, work experience and apprenticeships. We strive to attract and retain the best talent in a changing and competitive working environment.
As an organization, we are committed to making Innospec a great company to work for and we invest, as appropriate, in the development of our employees to meet this ambition.
Our employees are offered both internal and external training, where appropriate, to support their continued development and to meet the needs of our business. Where relevant, we support our employees’ ongoing professional training and development to encourage their progression within our business.
Pay and Benefits: We offer what we believe are competitive reward and recognition programs, based on both business-wide and individual performance. Our packages have been designed to attract and retain the best employees, reward achievement and encourage our teams to deliver superior performance for our customers and our company.
In addition to our company-wide performance incentive plans, we encourage our employees to share in the long-term success of our company with incentive programs, such as our Global Sharesave Plan. This plan gives employees the opportunity to participate in a savings plan linked to an option to buy shares in Innospec at a discount and, therefore, benefit from any growth in the share price over the savings period. We also provide a range of other benefits in line with the market practice in each location we operate in, including insurance and pension arrangements.
Performance Management Framework: We conduct an annual performance management process across the organization. Together with their line managers, employees agree upon annual objectives, and, at the end of the year, review with their line manager their performance against those objectives and their overall performance. The results of each annual performance review affect performance bonus amounts, pay reviews and career advancement decisions.
8
Senior Leadership Communications and Transparency: We actively seek opportunities for regular engagement and communication by our CEO and other senior executives with our broader employee population. Communications are through a variety of means including written communications, webcasts and conference calls. For example, we hold a CEO Call at least once a year, during which the CEO and CFO discuss current issues and developments in the business, including a Q&A session answering questions raised by employees. The CEO Call is accessible to all employees across the Company. In addition to the CEO Calls, each financial quarter, following the quarterly financial results announcement, the CEO and CFO provide a written review of the financial results to all employees.
Diversity and Inclusion
Innospec aims to attract and retain the best people by ensuring that employment decisions are based on merit, performance, ability and contribution to the Company. As part of our Global HR Policy, our diversity and equal opportunities policy ensures that current and prospective employees receive equal opportunities irrespective of gender, sexual orientation, race, color, ethnic or national origin, marital status, age, disability, religion or belief.
Health and Safety
Objectives: We prioritize the safety of employees, communities and everyone involved in the manufacture, use or disposal of our products. We set high standards for process and occupational safety, which is managed by our network of Safety, Health and Environment (“SHE”) professionals throughout the business. Our three core objectives being that:
• | No-one gets hurt |
• | We don’t annoy our neighbors |
• | We leave only the gentlest footprints on our environment |
Leadership: The Company periodically reviews the Corporate SHE structure and organization so that we have the optimum resources and correct approach. We strive to embed SHE in our culture by having leadership that comes from executive management. Our Responsible Care Executive Committee (known as RESPECT) comprises members of the senior leadership team and is led by the CEO. RESPECT is responsible for setting the group’s SHE and Sustainability policies and objectives across the global business. It also monitors ongoing performance in these areas throughout the year. Through this structure, we have established a strong culture of safety within our organization.
Training: Training is an essential part of our health and safety strategy. To minimize the risk of accident or injury, we give our employees the information they need, delivered effectively and at the appropriate time. Our ongoing training programs demonstrate our commitment to targeting zero accidents, making sure that safety is always front of mind and that we continually raise standards.
Every year, employees across our sites take part in a variety of site-specific training courses to enable them to be competent and safe in their roles.
9
Available Information
Our corporate website is www.innospec.com. We make available, free of charge, on or through this website our annual, quarterly and current reports, and any amendments to those reports, as soon as reasonably practicable after electronically filing such material with, or furnishing it to, the U.S. Securities and Exchange Commission (“SEC”). In addition, the SEC maintains an internet site at www.sec.gov that contains reports, proxy and information statements, and other information that we file electronically with the SEC.
The Company routinely posts important information for investors on its website (under Investors). The Company uses this website as a means of disclosing material, non-public information and for complying with its disclosure obligations under SEC Regulation FD (“Fair Disclosure”). Accordingly, investors should monitor the Investors portion of the Company’s website, in addition to following the Company’s press releases, SEC filings, public conference calls, presentations and webcasts.
10
Item 1A Risk Factors
The factors described below represent the principal risks associated with our business.
Global Conditions
Competition and market conditions may adversely affect our operating results.
In certain markets, our competitors are larger than us and may have greater access to financial, technological and other resources. As a result, competitors may be better able to adapt to changes in conditions in our industries, fluctuations in the costs of raw materials or changes in global economic conditions. Competitors may also be able to introduce new products with enhanced features that may cause a decline in the demand and sales of our products. Consolidation of customers or competitors, or economic problems of customers in our markets could cause a loss of market share for our products, place downward pressure on prices, result in payment delays or non-payment, or declining plant utilization rates. These risks could adversely impact our results of operations, financial position and cash flows.
Russian military invasion of the sovereign state of Ukraine.
On February 24, 2022, Russia launched an invasion into Ukraine which has had some effect on our ability to obtain and import certain raw materials used to manufacture our products and our ability to export and sell our products in these countries. The ongoing conflict, and sanctions imposed upon Russia and Belarus, may impact on the Company’s sales, cost of procuring raw materials or distribution costs in future periods. The wider implications of the conflict have driven up the cost of energy and utilities used to operate our manufacturing plants, particularly in Europe, with the further potential for issues relating to the supply of energy, particularly natural gas, for our manufacturing sites in countries reliant on supplies from Russia. The fluidity and continuation of the conflict may result in additional economic sanctions and other impacts which could have a negative impact on the Company’s financial condition, results of operations and cash flows. These include decreased sales; supply chain and logistics disruptions; volatility in foreign exchange rates and interest rates; inflationary pressures on raw materials and energy; and heightened cybersecurity threats.
Continuing adverse global economic conditions could materially affect our current and future businesses.
Global economic factors affecting our business include, but are not limited to, geopolitical instability in some markets, consumer demand for premium personal care and cosmetic products, miles driven by passenger and commercial vehicles, legislation to control fuel quality, impact of alternative propulsion systems, and oil and gas drilling and production rates. The availability, cost and terms of credit have been, and may continue to be, adversely affected by the foregoing factors and these circumstances have produced, and may in the future result in, illiquid markets and wider credit spreads, which may make it difficult or more expensive for us to obtain credit.
11
The level of inflation and energy costs, particularly in Europe, may result in an adverse impact to the Group’s results from employee wages and other costs of operations of our manufacturing sites.
Continuing uncertainties in the U.S. and international markets and economies leading to a decline in business and consumer spending could adversely impact our results of operations, financial position and cash flows.
Domestic or international natural disasters or terrorist attacks may disrupt our operations, decrease the demand for our products or otherwise have an adverse impact on our business.
Chemical related assets, and U.S. corporations such as us, may be at greater risk of future terrorist attacks than other possible targets in the U.S., the U.K. and throughout the world. Extraordinary events such as natural disasters may negatively affect local economies, including those of our customers or suppliers. The occurrence and consequences of such events cannot be predicted, but they can adversely impact economic conditions in general and in our specific markets. The resulting damage from such events could include loss of life, severe injury and property damage or site closure. Any of these matters could adversely impact our results of operations, financial position and cash flows.
While Innospec maintains business continuity plans that are intended to allow it to continue operations or mitigate the effects of events that could disrupt its business, Innospec cannot provide assurances that its plans would fully protect it from all such events. In addition, insurance maintained by Innospec to protect against property damage, loss of business and other related consequences resulting from catastrophic events is subject to coverage limitations, depending on the nature of the risk insured. This insurance may not be sufficient to cover all of Innospec’s damages or damages to others in the event of a catastrophe. In addition, insurance related to these types of risks may not be available now or, if available, may not be available in the future at commercially reasonable rates.
Our business and operations have been, and may in the future, be adversely affected by epidemics, pandemics, outbreaks of disease and other adverse public health developments, including COVID-19.
Epidemics, pandemics, outbreaks of novel diseases and other adverse public health developments in countries and states where we operate may arise at any time. Such developments, including the COVID-19 pandemic, have had, and in the future may have, an adverse effect on our business, financial condition and results of operations. These effects include a potentially negative impact on the availability of our key personnel, labor shortages and increased turnover, temporary closures of our facilities or facilities of our business partners, customers, suppliers, third-party service providers or other vendors, and interruption of domestic and global supply chains, distribution channels and liquidity and capital or financial markets. In particular, restrictions on or disruptions of transportation, port closures or increased border controls or closures, or other impacts on domestic and global supply chains or distribution channels, could increase our costs for raw materials and commodity costs,
12
increase demand for raw materials and commodities from competing purchasers, limit our ability to meet customer demand or otherwise have a material adverse effect on our business, financial condition and results of operations or cash flows.
Precautionary measures that we may take in the future intended to limit the impact of any epidemic, pandemic, disease outbreak or other public health development, may result in additional costs. In addition, such epidemics, pandemics, disease outbreaks or other public health developments may adversely affect economies and financial markets throughout the world, such as the effect that COVID-19 has had on world economies and financial markets, which may affect our ability to obtain additional financing for our businesses and demand for our products and services. The extent to which COVID-19 or other pandemics will impact our business and our financial results in the future will depend on future developments, which are highly uncertain and cannot be predicted. Such developments may include ongoing spread of the virus, disease severity, outbreak duration, extent of any reoccurrence of the coronavirus or any evolutions or mutations of the virus, and availability, administration and effectiveness of vaccines and development of therapeutic treatments that can restore consumer and business economic confidence.
Business Operations
We face risks related to our foreign operations that may adversely affect our business.
We serve global markets and operate in certain countries with political and economic instability, including the Middle East, Northern Africa, Asia-Pacific, Eastern Europe and South American regions. Our international operations are subject to numerous international business risks including, but not limited to, geopolitical and economic conditions, military actions and war, risk of expropriation, import and export restrictions, trade wars, exchange controls, national and regional labor strikes, high or unexpected taxes, government royalties and restrictions on repatriation of earnings or proceeds from liquidated assets of overseas subsidiaries. Any of these could have a material adverse impact on our results of operations, financial position and cash flows.
We may not be able to consummate, finance or successfully integrate future acquisitions, partnerships or other opportunities into our business, which could hinder our strategy or result in unanticipated expenses and losses.
Part of our strategy is to pursue strategic acquisitions, partnerships and other opportunities to complement and expand our existing business. The success of these transactions depends on our ability to efficiently complete transactions, integrate assets and personnel acquired in these transactions and apply our internal control processes to these acquired businesses. Consummating acquisitions, partnerships or other opportunities and integrating acquisitions involves considerable expense, resources and management time commitments, and our failure to manage these as intended could result in unanticipated expenses and losses. Post-acquisition integration may result in unforeseen difficulties and may deplete significant financial and management resources that could otherwise be available for the ongoing
13
development or expansion of existing operations. Furthermore, we may not realize the benefits of an acquisition in the way we anticipated when we first entered the transaction. Any of these risks could adversely impact our results of operations, financial position and cash flows.
Our success depends on our management team and other key personnel, the loss of any of whom could disrupt our business operations.
Our future success will depend in substantial part on the continued services of our senior management. The loss of the services of one or more of our key executive personnel could affect the implementation of our business plan and result in reduced profitability. Our future success also depends on the continued ability to attract, develop, retain and motivate highly-qualified technical and support staff. We cannot guarantee that we will be able to retain our key personnel or attract or retain qualified personnel in the future. If we are unsuccessful in our efforts in this regard, this could adversely impact our results of operations, financial position and cash flows.
An information technology system failure may adversely affect our business.
We rely on information technology systems to transact our business. Like other global companies, we and our third party service providers have, from time to time, been and will likely in the future be, subject to or targets of unauthorized or fraudulent access, including, but not limited to, physical or electronic break-ins or unauthorized tampering, as well as attempted cyber and other security threats and other computer-related penetrations including by state actors, terrorists or organized crime. Also, like other global companies, we have an increasing challenge of attracting and retaining highly qualified security personnel to assist us in combatting these security threats. The frequency and sophistication of such threats continue to increase, with malicious actors frequently changing tactics and techniques. These threats often become further heightened in connection with geopolitical tensions. Although we have implemented administrative and technical controls and take protective actions to reduce the risk of cyber incidents and breaches of our information technology, and we endeavor to modify such procedures as circumstances warrant, such measures may be insufficient to prevent physical and electronic break-ins, cyber-attacks or other security breaches to our computer systems.
Our systems, processes, software and network and those of our third party service providers may be vulnerable to internal or external security breaches, computer viruses, malware or other malicious code or cyber-attacks, catastrophic events, power interruptions, hardware failures, fire, natural disasters, human error, system failures and disruptions, and other events that could have security consequences. An information technology failure or disruption could prevent us from being able to process transactions with our customers, operate our manufacturing facilities, and properly report those transactions in a timely manner. Our information technology costs may increase to ensure the appropriate level of cyber security as we continuously adapt to the changing technological environment.
While we have limited insurance coverage in place that may, subject to policy terms and conditions, cover certain aspects of cyber risks, this insurance coverage is subject to certain
14
limitations and may not be applicable to a particular incident or otherwise be sufficient to cover all our losses beyond any coverage limitations. Furthermore, a significant or protracted information technology system failure may result in a material adverse effect on our results of operations, financial position and cash flows.
Decline in our AvGas business
The sales of our AvGas product line for use in aviation fuel are recorded within our Fuel Specialties business. The piston aviation industry has been, and is currently, researching a safe replacement fuel to replace leaded fuel. The U.S. Federal Aviation Administration (“FAA”) program (Piston Aviation Fuels Initiative) has been established to identify a replacement fuel, and candidate fuels are at an early pre-screening stage. In 2022, the FAA created a new team named Eliminate Aviation Gasoline Lead Emissions (“EAGLE”). This is a government-industry partnership that also encompasses fuel producers and distributors, airport operators, communities that support general aviation airports, and environmental experts. The most significant announcement impacting the Company is the stated aim of EAGLE to eliminate lead emissions from general aviation by the end of 2030. There are also regulatory projects underway for the European Union, which are considering the phase out of leaded fuel for the aviation industry earlier than the FAA timetable.
While we expect that at some point in the future a replacement fuel will be identified, trialed and supplied to the industry, there is no currently available alternative. If a suitable product is identified and the use of leaded fuel is prohibited in piston aviation the Company’s future operating income and cash flows from operating activities would be adversely impacted.
Failure to protect our intellectual property rights could adversely affect our future performance and cash flows.
Failure to maintain or protect our intellectual property rights may result in the loss of valuable technologies, or us having to pay other companies for infringing on their intellectual property rights. Measures taken by us to protect our intellectual property may be challenged, invalidated, circumvented or rendered unenforceable. In addition, international intellectual property laws may be more restrictive or may offer lower levels of protection than under U.S. law. We may also face patent infringement claims from our competitors which may result in substantial litigation costs, claims for damages or a tarnishing of our reputation even if we are successful in defending against these claims, which may cause our customers to switch to our competitors. Any of these events could adversely impact our results of operations, financial position and cash flows.
Industry Matters
Trends in oil and gas prices affect the level of exploration, development and production activity of our customers, and the demand for our services and products, which could have a material adverse impact on our business.
Demand for our services and products in our Oilfield Services business is particularly sensitive to the level of exploration, development and production activity of, and the
15
corresponding capital spending by, oil and gas companies. The level of exploration, development and production activity is directly affected by trends in demand for and prices of oil and gas, which historically have been volatile and are likely to continue to be volatile. Prices for oil and gas are subject to large fluctuations in response to relatively minor changes in the supply of and demand for oil and gas, market uncertainty, and a variety of other economic and political factors that are beyond our control. Even the perception of longer-term lower oil and gas prices by oil and gas companies can similarly reduce or defer major expenditures given the long-term nature of many large-scale development projects. Factors affecting the prices of oil and gas include, but are not limited to, the level of supply and demand for oil and gas; governmental regulations, including the policies of governments regarding the exploration for and production and development of their oil and gas reserves; weather conditions and natural disasters; worldwide political, military and economic conditions; the level of oil and gas production by non-OPEC (“Organization of the Petroleum Exporting Countries”) countries and the available excess production capacity within OPEC; the cost of producing and delivering oil and gas; and potential acceleration of the development of alternative power generation, fuels and engine technologies. Any prolonged reduction in oil and gas prices will depress the immediate levels of exploration, development and production activity, which could have a material adverse impact on our results of operations, financial position and cash flows.
We could be adversely affected by technological changes in our industry.
Our ability to maintain or enhance our technological capabilities, develop and market products and applications that meet changing customer requirements, and successfully anticipate or respond to technological changes in a cost effective and timely manner will likely impact our future business success. We compete on a number of fronts including, but not limited to, product quality and performance. In the case of some of our products, our competitors are larger than us and may have greater access to financial, technological and other resources. Technological changes include, but are not limited to, the development of electric and hybrid vehicles, and the subsequent impact on the demand for gasoline and diesel. Our inability to maintain a technological edge, innovate and improve our products could cause a decline in the demand and sales of our products, and adversely impact our results of operations, financial position and cash flows.
Sharp and unexpected fluctuations in the cost of our raw materials and energy could adversely affect our profit margins.
We use a variety of raw materials, chemicals and energy in our manufacturing and blending processes. Many of these raw materials are derived from petrochemical-based and vegetable-based feedstocks which can be subject to periods of rapid and significant cost instability. These fluctuations in cost can be caused by political instability in oil producing nations and elsewhere, weather conditions or other factors influencing global supply and demand of these materials, over which we have little or no control. We use long-term contracts (generally with fixed or formula-based costs) and advance bulk purchases to help ensure availability and continuity of supply, and to manage the risk of cost increases. From time to time, we have
16
entered into hedging arrangements for certain utilities and raw materials, but do not typically enter into hedging arrangements for all raw materials, chemicals or energy costs. If the costs of raw materials, chemicals or energy increase, and we are not able to pass on these cost increases to our customers, then profit margins and cash flows from operating activities would be adversely impacted. If raw material costs increase significantly, then our need for working capital could increase. Any of these risks could adversely impact our results of operations, financial position and cash flows.
Our business is subject to the risk of manufacturing disruptions, the occurrence of which would adversely affect our results of operations.
We are subject to hazards which are common to chemical manufacturing, blending, storage, handling and transportation. These hazards include, but are not limited to, fires, explosions, chemical spills and the release or discharge of toxic or hazardous substances together with the more generic risks of labor strikes or slowdowns, mechanical failure in scheduled downtime, extreme weather or transportation interruptions. These hazards could result in loss of life, severe injury, property damage, environmental contamination and temporary or permanent manufacturing cessation. Any of these factors could adversely impact our results of operations, financial position and cash flows.
Legal, Regulatory and Tax Matters
We are subject to extensive regulation of our international operations that could adversely affect our business and results of operations.
Due to our global operations, we are subject to many laws governing international commercial activity, conduct and relations, including, but are not limited to, those that prohibit improper payments to government officials, restrict where and with whom we can do business and limit the products, software and technology that we can supply to certain countries and customers. These laws include, but are not limited to, the U.S. Foreign Corrupt Practices Act and U.K. Bribery Act, sanctions and assets control programs administered by the U.S. Department of the Treasury and/or the European Union from time to time, and the U.S. export control laws such as the regulations under the U.S. Export Administration Act, as well as similar laws and regulations in other countries relevant to our business operations. Violations of any of these laws or regulations, which are often complex in their application, may result in criminal or civil penalties that could have a material adverse effect on our results of operations, financial position and cash flows.
Our United Kingdom defined benefit pension plan could adversely impact our financial condition, results of operations and cash flows.
Movements in the underlying plan asset value and Projected Benefit Obligation (“PBO”) of our United Kingdom defined benefit pension plan (“UK Plan”) are dependent on our assumptions in respect of the discount rate, annual member mortality rates, future return on assets and future inflation. A change in any one of these assumptions could impact the plan asset value, PBO and pension credit recognized in the income statement.
17
In May 2022, the Trustees of the UK Plan entered into an agreement with Legal and General Assurance Society Limited to acquire an insurance policy that operates as an investment asset, with the intent of matching the remaining uninsured part of the UK Plan’s future cash outflow arising from the accrued pension liabilities of members. Such an arrangement is commonly termed as a “buy-in”. The benefit obligation was not transferred to the insurer, and the Company remains responsible for paying pension benefits. The initial value of the asset associated with this contract was equal to the premium paid to secure the contract and is adjusted each reporting period to reflect the estimated fair value of the premium that would be paid for such a contract at that time. The buy-in reduces the UK Plan’s value at risk in relation to key risks associated with improved longevity, inflation and interest rate movements while improving the security to the UK Plan and its members. The Company consequently benefits from the buy-in as it reduces the UK Plan’s potential reliance on the Company for future cash funding requirements. However, should an unexpected issue arise, there could be consequences which adversely impact our results of operations, financial position and cash flows.
We may have additional tax liabilities.
We are subject to income and other taxes in the U.S., the U.K., and a number of other jurisdictions. Tax laws are dynamic and subject to change as new laws are passed and new interpretations of the law are issued or applied. Significant judgment is required in estimating our worldwide provision for income taxes. In the ordinary course of our business, there are many transactions and calculations where the ultimate tax determination is uncertain. Although we believe our tax estimates are reasonable, any final determination pursuant to tax audits and any related litigation could be materially different to the amounts reflected in our Consolidated Financial Statements. Should any tax authority disagree with our estimates and determine any additional tax liabilities, including interest and penalties for us, this could adversely impact our results of operations, financial position and cash flows.
Our products are subject to extensive government scrutiny and regulation.
We are subject to regulation by federal, state, local and foreign government authorities. In some cases, we need government approval of our products, manufacturing processes and facilities before we may sell certain products. Many products are required to be registered with the U.S. Environmental Protection Agency (EPA), with the European Chemicals Agency (ECHA) and with comparable government agencies elsewhere. We are also subject to ongoing reviews of our products, manufacturing processes and facilities by government authorities, and must also produce product data and comply with detailed regulatory requirements.
In order to obtain regulatory approval of certain new products we must, among other things, demonstrate that the product is appropriate and effective for its intended uses, that the product has been appropriately tested for safety and that we are capable of manufacturing the product in accordance with applicable regulations. This approval process can be costly, time consuming, and subject to unanticipated and significant delays. We cannot be sure that necessary approvals will be granted on a timely basis or at all. Any delay in obtaining, or any
18
failure to obtain or maintain, these approvals would adversely affect our ability to introduce new products and to generate income from those products. New or stricter laws and regulations may be introduced that could result in additional compliance costs and prevent or inhibit the development, manufacture, distribution and sale of our products. Such outcomes could adversely impact our results of operations, financial position and cash flows.
Diverse chemical regulatory processes in different countries around the world might create complexity and additional cost. U.K. REACH, which was precipitated by the U.K.’s exit from the E.U., is one such example.
Legal proceedings and other claims could impose substantial costs on us.
We are from time to time involved in legal proceedings that result from, and are incidental to, the conduct of our business, including employee and product liability claims. Although we maintain insurance to protect us against a variety of claims, if our insurance coverage is not adequate to cover such claims, then we may be required to pay directly for such liabilities. Such outcomes could adversely impact our results of operations, financial position and cash flows.
Environmental liabilities and compliance costs could have a substantial adverse impact on our results of operations.
We operate a number of manufacturing sites and are subject to extensive federal, state, local and foreign environmental, health and safety laws and regulations, including, but not limited to, those relating to emissions to the air, discharges to land and water, and the generation, handling, treatment and disposal of hazardous waste and other materials on these sites. We operate under numerous environmental permits and licenses, many of which require periodic notification and renewal, which is not automatic. New or stricter laws and regulations could increase our compliance burden or costs and adversely affect our ability to develop, manufacture, blend, market and supply products.
Our operations, and the operations of prior owners of our sites, pose the risk of environmental contamination which may result in fines or criminal sanctions being imposed or require significant amounts in environmental remediation payments.
We anticipate that certain manufacturing sites may cease production over time and on closure, will require safely decommissioning and some environmental remediation. The extent of our obligations will depend on the future use of the sites that are affected and the environmental laws in effect at the time. We currently hold a plant closure provision in our Consolidated Financial Statements based on current known obligations, anticipated plans for sites or existing environmental laws. If there were to be unexpected or unknown contamination at these sites, or future plans for the sites or environmental laws change, then current provisions may prove inadequate, which could adversely impact our results of operations, financial position and cash flows.
19
We may be exposed to certain regulatory and financial risks related to climate change
The outcome of new or potential legislation or regulation in the U.S. and other jurisdictions in which we operate may result in new or additional requirements, additional charges to fund energy efficiency activities, fees or restrictions on certain activities. Compliance with these initiatives may also result in additional costs to us, including, among other things, increased production costs, additional taxes, reduced emission allowances or additional restrictions on production or operations. Any climate change regulations enacted in the future could also negatively impact our ability to compete with companies situated in areas not subject to such limitations. Even without such regulation, increased public awareness and adverse publicity about potential impacts on climate change emanating from us or our industry could harm us. We may not be able to recover the cost of compliance with new or more stringent laws and regulations, which could adversely affect our business and negatively impact our growth. Furthermore, the potential impacts of climate change and related regulation on our customers are highly uncertain and may adversely affect us.
Key Third Party Relationships
Having a small number of significant customers may have a material adverse impact on our results of operations.
Our principal customers are personal and home care companies, oil refiners, oil and gas exploration and production companies, and other chemical and industrial companies. These industries are characterized by a concentration of a few large participants. The loss of a significant customer, a material reduction in demand by a significant customer or termination or non-renewal of a significant customer contract could adversely impact our results of operations, financial position and cash flows.
A disruption in the supply of raw materials or transportation services would have a material adverse impact on our results of operations.
Although we try to anticipate problems with supplies of raw materials or transportation services by building certain inventories of strategic importance, transport operations are exposed to various risks such as extreme weather conditions, natural disasters, technological problems, work stoppages, geopolitical tensions, pandemics, as well as transportation regulations. If the Company experiences transportation problems, or if there are significant changes in the cost of these services, the Company may not be able to arrange efficient alternatives and timely means to obtain raw materials or ship finished products, which could adversely impact our results of operations, financial position and cash flows.
The inability of counterparties to meet their contractual obligations could have a substantial adverse impact on our results of operations.
Credit limits, ongoing credit evaluation and account monitoring procedures are used to minimize bad debt risk. Collateral is not generally required. We have in place a credit facility with a syndicate of banks. From time to time, we use derivatives, including, but not limited to,
20
interest rate swaps, commodity swaps and foreign currency forward exchange contracts, in the normal course of business to manage market risks. We enter into derivative instruments with a diversified group of major financial institutions in order to manage the exposure to non-performance of such instruments.
We remain subject to market and credit risks including the ability of counterparties to meet their contractual obligations and the potential non-performance of counterparties to deliver contracted commodities or services at the contracted price. The inability of counterparties to meet their contractual obligations could have an adverse impact on our results of operations, financial position and cash flows.
Finance and Investment
We are exposed to fluctuations in foreign currency exchange rates, which may adversely affect our results of operations.
We generate a portion of our revenues and incur some operating costs in currencies other than the U.S. dollar. In addition, the financial position and results of operations of some of our overseas subsidiaries are reported in the relevant local currency and then translated to U.S. dollars at the applicable currency exchange rates for inclusion in our Consolidated Financial Statements. Fluctuations in these currency exchange rates affect the recorded levels of our assets and liabilities, results of operations and cash flows.
The primary exchange rate fluctuation exposures we have are with the E.U. euro, British pound sterling and Brazilian real. Exchange rates between these currencies and the U.S. dollar have fluctuated in recent years and may continue to do so. We cannot accurately predict future exchange rate variability among these currencies or relative to the U.S. dollar. While we take steps to manage currency exchange rate exposure, including entering into hedging transactions, we cannot eliminate all exposure to future exchange rate variability. These exchange risks could adversely impact our results of operations, financial position and cash flows.
A high concentration of significant stockholders may have a material adverse impact on our stock price.
Approximately 44% of our common stock is held by four stockholders. A decision by any of these, or other substantial, stockholders to sell all or a significant part of its holding, or a sudden or unexpected disposition of our stock, could result in a significant decline in our stock price. This could in turn adversely impact our ability to access equity markets, which could adversely impact our results of operations, financial position and cash flows.
21
Our amended and restated by-laws designate specific Delaware courts as the exclusive forum for certain litigation that may be initiated by our stockholders, which could limit our stockholders’ ability to obtain a favorable judicial forum for disputes with us or our directors, officers or employees.
Our amended and restated by-laws (the “By-laws”) provide that, unless we consent in writing to the selection of an alternative forum, the appropriate court within the State of Delaware is the sole and exclusive forum, to the fullest extent provided by law, for the following types of actions or proceedings:
• | any derivative action or proceeding brought on behalf of the Corporation, |
• | any action asserting a claim of breach of a fiduciary duty owed by any director, officer, other employee or stockholder of the Corporation to the Corporation or the Corporation’s stockholders, |
• | any action asserting a claim arising pursuant to any provision of the Delaware General Corporation Law (“DGCL”), our amended and restated certificate of incorporation, the By-laws, or as to which the DGCL confers jurisdiction upon the Court of Chancery of the State of Delaware, |
• | any action asserting a claim governed by the internal affairs doctrine, or |
• | any other internal corporate claim as defined in Section 115 of the DGCL. |
This includes, to the extent permitted by the federal securities laws, lawsuits asserting both state law claims and claims under the federal securities laws.
This forum selection provision in the By-laws may limit our stockholders’ ability to obtain a favorable judicial forum for disputes with us. It is also possible that, notwithstanding the forum selection clause included in the By-laws, a court could rule that such a provision is inapplicable or unenforceable.
Application of the choice of forum provision may be limited in some instances by law. Section 27 of the Securities Exchange Act of 1934 (“Exchange Act”) provides for exclusive federal court jurisdiction over Exchange Act claims. Accordingly, to the extent the exclusive forum provision is held to cover a shareholder derivative action asserting claims under the Exchange Act, such claims could not be brought in the Delaware Court of Chancery and would instead be within the jurisdiction of the federal district court for the District of Delaware. Section 22 of the Securities Act of 1933 (“Securities Act”) creates concurrent jurisdiction for federal and state courts over all suits brought to enforce any duty or liability created by the Securities Act or the rules and regulations thereunder. Our stockholders will not be deemed by operation of our choice of forum provision to have waived our compliance with the federal securities laws and the regulations promulgated thereunder. The selection of legal jurisdiction for litigation claims may impact the outcome of legal proceedings which could in turn impact our results of operations, financial position and cash flows.
22
The provisions of our revolving credit facility may restrict our ability to incur additional indebtedness or to otherwise expand our business.
Our revolving credit facility contains restrictive clauses which may limit our activities as well as operational and financial flexibility. We may not be able to borrow under the revolving credit facility if an event of default under the terms of the facility occurs. An event of default under the credit facility includes a material adverse change to our assets, operations or financial condition, and certain other events. The revolving credit facility also contains a number of restrictions that limit our ability, among other things, and subject to certain limited exceptions, to incur additional indebtedness, pledge our assets as security, guarantee obligations of third parties, make investments, undergo a merger or consolidation, dispose of assets or materially change our line of business.
In addition, the revolving credit facility requires us to meet certain financial ratios, including ratios based on net debt to earnings before income tax, depreciation and amortization (“EBITDA”) and net interest expense to EBITDA. Net debt, net interest expense and EBITDA are non-GAAP measures of liquidity defined in the credit facility. Our ability to meet these financial covenants depends upon the future successful operating performance of the business. If we fail to comply with these financial covenants, we would be in default under the revolving credit facility and the maturity of our outstanding debt could be accelerated unless we were able to obtain waivers from our lenders. If we were found to be in default under the revolving credit facility, it could adversely impact our results of operations, financial position and cash flows.
Item 1B | Unresolved Staff Comments |
None.
23
Item 2 | Properties |
General
A summary of the Company’s principal properties is shown in the following table. Each of these properties is owned by the Company except where otherwise noted:
Location | Reporting Segment | Operations | ||
Englewood, Colorado (1) | Fuel Specialties | Corporate Headquarters/ Business Teams/ Sales/Administration | ||
Newark, Delaware (1) | Fuel Specialties | Research & Development | ||
Herne, Germany | Fuel Specialties | Sales/Manufacturing/Administration/ Research & Development | ||
Vernon, France | Fuel Specialties | Sales/Manufacturing/Administration/ Research & Development | ||
Moscow, Russia (1) | Fuel Specialties | Sales/Administration | ||
Leuna, Germany | Fuel Specialties | Sales/Manufacturing/Administration/ Research & Development | ||
Ellesmere Port, United Kingdom | Fuel Specialties, Performance Chemicals | European Headquarters Business Teams/ Sales/Manufacturing/Administration/ Research & Development/ Fuel Technology Center | ||
Beijing, China (1) | Fuel Specialties and Performance Chemicals | Sales/Administration | ||
Singapore, Singapore (1) | Fuel Specialties and Performance Chemicals | Asia-Pacific Headquarters/ Business Teams/ Sales/Administration | ||
Milan, Italy (1) | Fuel Specialties and Performance Chemicals | Sales/Administration | ||
Rio de Janeiro, Brazil (1) | Fuel Specialties, Performance Chemicals and Oilfield Services | Sales/Administration | ||
High Point, North Carolina | Performance Chemicals | Manufacturing/Administration/ Research & Development | ||
Salisbury, North Carolina | Performance Chemicals | Manufacturing/Administration/ Research & Development | ||
Chatsworth, California (1) | Performance Chemicals | Sales/Manufacturing/Administration | ||
Saint Mihiel, France | Performance Chemicals | Manufacturing/Administration/Research & Development | ||
Castiglione, Italy | Performance Chemicals | Manufacturing/Administration/Research & Development |
24
Location | Reporting Segment | Operations | ||
Barcelona, Spain (1) | Performance Chemicals | Manufacturing/Administration/Research & Development | ||
Oklahoma City, Oklahoma | Oilfield Services | Sales/Manufacturing/Administration | ||
Midland, Texas | Oilfield Services | Sales/Manufacturing/Administration | ||
Pleasanton, Texas | Oilfield Services | Sales/Manufacturing/Administration | ||
Sugar Land, Texas (1) | Oilfield Services | Sales/Administration/Research & Development | ||
The Woodlands, Houston, Texas (1) | Oilfield Services | Sales/Administration/Research & Development | ||
Williston, North Dakota | Oilfield Services | Sales/Warehouse | ||
Casper, Wyoming (1) | Oilfield Services | Warehouse |
(1) | Leased property |
Manufacturing Capacity
We believe that our plants and supply agreements are sufficient to meet current sales levels. Operating rates of the plants are generally flexible and varied with product mix and normal sales demand swings. We believe that all of our facilities are maintained to appropriate levels and in sufficient operating condition though there remains an ongoing need for maintenance and capital investment.
Item 3 | Legal Proceedings |
Legal matters
While we are involved from time to time in claims and legal proceedings that result from, and are incidental to, the conduct of our business including business and commercial litigation, employee and product liability claims, there are no material pending legal proceedings to which the Company or any of its subsidiaries is a party, or of which any of the Company’s property is subject. It is possible, however, that an adverse resolution of an unexpectedly large number of such individual claims or proceedings could in the aggregate have a material adverse effect on results of operations for a particular year or quarter.
Item 4 | Mine Safety Disclosures |
Not applicable.
25
PART II
Item 5 | Market for Registrant’s Common Equity, Related Stockholder Matters and Issuer Purchases of Equity Securities |
Market Information and Holders
The Company’s common stock is listed on the NASDAQ under the symbol “IOSP.” As of February 15, 2023 there were 670 registered holders of the common stock.
Unregistered Sales of Equity Securities
There were no unregistered sales of equity securities during the fourth quarter of 2022.
Issuer Purchases of Equity Securities
During the quarter ended December 31, 2022, the Company purchased its common stock as part of a share repurchase program and in connection with the exercising of stock options by employees.
The following table provides information about our repurchases of equity securities in the quarter ended December 31, 2022.
Issuer Purchases of Equity Securities
Period |
Total number of shares purchased |
Average price paid per share |
Total number of shares purchased as part of publicly announced plans or programs1 |
Approximate dollar value of shares that may yet be purchased under the plans or programs |
||||||||||||
October 1, 2022 through October 31, 2022 |
8,302 | $ | 90.39 | 8,302 | $ | 44.3 million | ||||||||||
November 1, 2022 through November 30, 2022 |
1,059 | $ | 106.49 | 212 | $ | 44.2 million | ||||||||||
December 1, 2022 through December 31, 2022 |
0 | $ | 0.00 | 0 | $ | 44.2 million | ||||||||||
|
|
|
|
|
|
|
|
|||||||||
Total |
9,361 | $ | 92.21 | 8,514 | $ | 44.2 million | ||||||||||
|
|
|
|
|
|
|
|
1 On February 15, 2022 the Company announced a repurchase plan for up to $50 million of the Company’s common stock over a three-year period commencing on February 16, 2022.
Stock Price Performance Graph
The graph below compares the cumulative total return to stockholders on the common stock of the Corporation, S&P 500 Index, S&P 1500 Specialty Chemicals Index and Russell 2000
26
Index since December 31, 2017, assuming a $100 investment and the re-investment of any dividends thereafter. Historical stock price performance should not be relied upon as an indication of future stock price performance.
For the year ended December 31, 2022, we have changed one of the comparative indices from the NASDAQ Composite to the S&P 1500 Specialty Chemicals Index which we believe provides an improved peer group comparative. The total return to stockholders of the new and the old comparative indices is shown in the table below the following graph.
Value of $100 Investment made December 31, 2017*
2017 | 2018 | 2019 | 2020 | 2021 | 2022 | |||||||||||||||||||
Innospec Inc. |
$ | 100.00 | $ | 88.74 | $ | 150.09 | $ | 133.16 | $ | 134.29 | $ | 154.80 | ||||||||||||
S&P 500 Index |
100.00 | 95.62 | 125.72 | 148.85 | 191.58 | 156.88 | ||||||||||||||||||
S&P 1500 Specialty Chemicals Index |
100.00 | 93.97 | 111.15 | 129.30 | 165.17 | 124.09 | ||||||||||||||||||
NASDAQ Composite |
100.00 | 96.41 | 133.31 | 192.48 | 235.16 | 158.65 | ||||||||||||||||||
Russell 2000 Index |
$ | 100.00 | $ | 88.99 | $ | 111.70 | $ | 134.00 | $ | 153.85 | $ | 122.41 |
* Excludes purchase commissions.
27
Item 6 | [Reserved] |
28
Item 7 | Management’s Discussion and Analysis of Financial Condition and Results of Operations |
This discussion should be read in conjunction with our Consolidated Financial Statements and the Notes thereto.
EXECUTIVE OVERVIEW
In 2022 Innospec delivered double-digit sales and operating income growth with expanded margins, and each of our businesses contributed meaningfully to our results. We benefited from our balanced end-market exposure in late 2022 as the negative impact of year-end customer destocking in Performance Chemicals was offset by continued growth in Oilfield Services and Fuel Specialties.
In Performance Chemicals, despite aggressive customer destocking which drove lower volumes and margins in the fourth quarter, full-year operating income increased by 34 percent, and operating margin improved for the fifth consecutive year. Our industry-leading personal care technologies drove the majority of operating income growth in 2022.
Fuel Specialties delivered double-digit operating income growth for the full year. Gross margins remained below our expected range, but improvement continues to be a key focus and opportunity for our business in 2023. We believe there is potential for gross margin expansion once inflation normalizes and demand for our higher margin jet fuel additives recovers.
Oilfield Services achieved significant sales and operating income growth over the prior year. In 2023, we anticipate that a portion of our sales will moderate versus the extremely strong third and fourth quarters of 2022. However, we expect potential for further improvement in the other markets within our oilfield business.
CRITICAL ACCOUNTING ESTIMATES
Note 2 of the Notes to the Consolidated Financial Statements includes a summary of the significant accounting policies and methods used in the preparation of the consolidated financial statements.
Plant Closure Provisions
We are subject to environmental laws in the countries in which we conduct business. Ellesmere Port in the United Kingdom is our principal site giving rise to asset retirement obligations, associated with the production of TEL. There are also asset retirement obligations and environmental remediation liabilities on a much smaller scale in respect of other manufacturing sites. At Ellesmere Port there is a continuing asset retirement program related to certain manufacturing units that have been closed.
Plant closure provisions at December 31, 2022 amounted to $57.2 million and relate principally to our Ellesmere Port site in the United Kingdom. We recognize environmental
29
remediation liabilities when they are probable and costs can be reasonably estimated, and asset retirement obligations when there is a legal requirement, including those arising from a Company promise, and the costs can be reasonably estimated. The Company has to anticipate the program of work required and the associated future expected costs, and comply with environmental legislation in the countries in which it operates or has operated in. We develop these assumptions utilizing the latest information available together with recent costs. While we believe our assumptions for plant closure provisions are reasonable, they are subjective estimates and it is possible that variations in any of the assumptions will result in materially different calculations to the liabilities we have reported.
Income Taxes
We are subject to income and other taxes in the U.S., the U.K., and a number of other jurisdictions. Tax laws are dynamic and subject to change as new laws are passed and new interpretations of the law are issued or applied.
The calculation of our tax liabilities involves evaluating uncertainties in the application of accounting principles and complex tax regulations. We recognize liabilities for anticipated tax audit issues based on our estimate of whether, and the extent to which, additional taxes will be required. If we ultimately determine that payment of these amounts is unnecessary, we reverse the liability and recognize a tax benefit during the period in which we determine that the liability is no longer necessary.
We also recognize tax benefits to the extent that it is more likely than not that our positions will be sustained, based on technical merits of the position, when challenged by the taxing authorities. To the extent that we prevail in matters for which liabilities have been established or are required to pay amounts in excess of the liabilities recorded in our financial statements, our effective tax rate in a given period may be materially affected. An unfavorable tax settlement may require cash payments and result in an increase in our effective tax rate in the year of resolution. We report interest and penalties related to uncertain tax positions as income taxes. For additional information regarding uncertain income tax positions, see Note 11 of the Notes to the Consolidated Financial Statements.
Pensions
The Company maintains a defined benefit pension plan covering certain current and former employees in the United Kingdom (“UK Plan”). The UK Plan is closed to future service accrual but has a large number of deferred and current pensioners. The Company also has other smaller pension arrangements in the U.S. and overseas.
In May 2022, the Trustees of the UK Plan entered into an agreement with Legal and General Assurance Society Limited to acquire an insurance policy that operates as an investment asset, with the intent of matching the remaining uninsured part of the UK Plan’s future cash outflow arising from the accrued pension liabilities of members. Such an arrangement is commonly termed as a “buy-in”. The benefit obligation was not transferred to the insurer, and the Company remains responsible for paying pension benefits. The initial value of the asset associated with this contract was equal to the premium paid to secure the contract and is
30
adjusted each reporting period to reflect the estimated fair value of the premium that would be paid for such a contract at that time. The buy-in reduces the UK Plan’s value at risk in relation to key risks associated with improved longevity, inflation and interest rate movements while improving the security to the UK Plan and its members. The Company consequently benefits from the buy-in as it reduces the UK Plan’s potential reliance on the Company for future cash funding requirements.
Movements in the UK Plan’s Projected Benefit Obligation (“PBO”) are dependent on our assumptions in respect of the discount rate, annual member mortality rates, future return on assets and future inflation. A change in any one of these assumptions could impact the plan asset value, PBO and pension charge recognized in the income statement. Such changes could adversely impact our results of operations and financial position. For example, a 0.25% change in the discount rate assumption would change the PBO at December 31, 2022 by approximately $10.3 million and the net pension credit for 2023 would change by approximately $0.1 million. A 0.25% change in the level of price inflation assumption would change the PBO at December 31, 2022 by approximately $6.5 million and the net pension credit for 2022 by approximately $0.6 million.
Further information is provided in Note 10 of the Notes to the Consolidated Financial Statements.
Goodwill
The Company’s reporting units, the level at which goodwill is assessed for potential impairment, are consistent with the reportable segments. The components in each segment (including products, markets and competitors) have similar economic characteristics and the segments, therefore, reflect the lowest level at which operations and cash flows can be sufficiently distinguished, operationally and for financial reporting purposes, from the rest of the Company.
To test for impairment the Company performs a qualitative step zero assessment to determine whether it is more likely than not (that is, a likelihood of more than 50 percent) that the fair value of a segment is less than the carrying amount prior to performing the quantitative goodwill impairment test. Factors utilized in the qualitative assessment process include macroeconomic conditions; industry and market considerations; cost factors; overall financial performance; and Company specific events.
If a quantitative test is required, we assess the fair value based on projected post-tax cash flows discounted at the Company’s weighted average cost of capital. These fair value techniques require management judgment and estimates including revenue growth rates, projected operating margins, changes in working capital and discount rates. We would develop these assumptions by considering recent financial performance and trends and industry growth estimates. While we believe our assumptions for impairment assessments are reasonable, they are subjective judgments, and it is possible that variations in any of the assumptions will result in materially different calculations of any potential impairment charges.
31
At December 31, 2022 we had $358.8 million of goodwill relating to our Performance Chemicals, Fuel Specialties and Oilfield Services segments. Our step zero impairment review at December 31, 2022 indicated the fair value of each segment is, more likely than not, higher than the carrying value, meaning no step one impairment review was required to be performed.
Property, Plant and Equipment and Other Intangible Assets (Net of Depreciation and Amortization, respectively)
As at December 31, 2022 we had $220.9 million of property, plant and equipment and $45.0 million of other intangible assets (net of depreciation and amortization, respectively), that are discussed in Notes 6 and 9 of the Notes to the Consolidated Financial Statements, respectively. These long-lived assets relate to all of our reporting segments and are being amortized or depreciated straight-line over periods of up to 17 years in respect of the other intangible assets and up to 25 years in respect of the property, plant and equipment.
We continually assess the markets and products related to these long-lived assets, as well as their specific carrying values, and have concluded that these carrying values, and amortization and depreciation periods, remain appropriate.
32
RESULTS OF OPERATIONS
The following table provides sales, gross profit and operating income by reporting segment:
(in millions) |
2022 | 2021 | 2020 | |||||||||
Net sales: |
||||||||||||
Performance Chemicals |
$ | 639.7 | $ | 525.3 | $ | 425.4 | ||||||
Fuel Specialties |
730.2 | 618.3 | 512.7 | |||||||||
Oilfield Services |
593.8 | 339.8 | 255.0 | |||||||||
|
|
|
|
|
|
|||||||
$ | 1,963.7 | $ | 1,483.4 | $ | 1,193.1 | |||||||
|
|
|
|
|
|
|||||||
Gross profit: |
||||||||||||
Performance Chemicals |
$ | 150.0 | $ | 125.2 | $ | 103.8 | ||||||
Fuel Specialties |
221.9 | 193.2 | 160.3 | |||||||||
Oilfield Services |
214.8 | 116.5 | 80.8 | |||||||||
Octane Additives |
— | — | (2.2 | ) | ||||||||
|
|
|
|
|
|
|||||||
$ | 586.7 | $ | 434.9 | $ | 342.7 | |||||||
|
|
|
|
|
|
|||||||
Operating income: |
||||||||||||
Performance Chemicals |
$ | 95.3 | $ | 70.9 | $ | 54.8 | ||||||
Fuel Specialties |
121.7 | 104.6 | 84.5 | |||||||||
Oilfield Services |
41.7 | 10.4 | (9.5 | ) | ||||||||
Octane Additives |
— | — | (2.8 | ) | ||||||||
Corporate costs |
(71.4 | ) | (55.6 | ) | (52.2 | ) | ||||||
Restructuring charge |
— | — | (21.3 | ) | ||||||||
Impairment of intangible assets |
— | — | (19.8 | ) | ||||||||
Profit on disposal |
— | 1.8 | — | |||||||||
|
|
|
|
|
|
|||||||
Total operating income |
$ | 187.3 | $ | 132.1 | $ | 33.7 | ||||||
|
|
|
|
|
|
|||||||
Other income/(expense), net |
$ | (1.6 | ) | $ | 3.8 | $ | 7.8 | |||||
Interest expense, net |
(1.1 | ) | (1.5 | ) | (1.8 | ) | ||||||
|
|
|
|
|
|
|||||||
Income before income taxes |
184.6 | 134.4 | 39.7 | |||||||||
Income taxes |
(51.6 | ) | (41.3 | ) | (11.0 | ) | ||||||
|
|
|
|
|
|
|||||||
Net income |
$ | 133.0 | $ | 93.1 | $ | 28.7 | ||||||
|
|
|
|
|
|
33
Results of Operations – Fiscal 2022 compared to Fiscal 2021:
(in millions, except ratios) |
2022 | 2021 | Change | |||||||||||||
Net sales: |
||||||||||||||||
Performance Chemicals |
$ | 639.7 | $ | 525.3 | $ | 114.4 | +22 | % | ||||||||
Fuel Specialties |
730.2 | 618.3 | 111.9 | +18 | % | |||||||||||
Oilfield Services |
593.8 | 339.8 | 254.0 | +75 | % | |||||||||||
|
|
|
|
|
|
|||||||||||
$ | 1,963.7 | $ | 1,483.4 | $ | 480.3 | +32 | % | |||||||||
|
|
|
|
|
|
|||||||||||
Gross profit: |
||||||||||||||||
Performance Chemicals |
$ | 150.0 | $ | 125.2 | $ | 24.8 | +20 | % | ||||||||
Fuel Specialties |
221.9 | 193.2 | 28.7 | +15 | % | |||||||||||
Oilfield Services |
214.8 | 116.5 | 98.3 | +84 | % | |||||||||||
|
|
|
|
|
|
|||||||||||
$ | 586.7 | $ | 434.9 | $ | 151.8 | +35 | % | |||||||||
|
|
|
|
|
|
|||||||||||
Gross margin (%): |
||||||||||||||||
Performance Chemicals |
23.4 | 23.8 | -0.4 | |||||||||||||
Fuel Specialties |
30.4 | 31.2 | -0.8 | |||||||||||||
Oilfield Services |
36.2 | 34.3 | +1.9 | |||||||||||||
Aggregate |
29.9 | 29.3 | +0.6 | |||||||||||||
Operating expenses: |
||||||||||||||||
Performance Chemicals |
$ | (54.7 | ) | $ | (54.3 | ) | $ | (0.4 | ) | +1 | % | |||||
Fuel Specialties |
(100.2 | ) | (88.6 | ) | (11.6 | ) | +13 | % | ||||||||
Oilfield Services |
(173.1 | ) | (106.1 | ) | (67.0 | ) | +63 | % | ||||||||
Corporate costs |
(71.4 | ) | (55.6 | ) | (15.8 | ) | +28 | % | ||||||||
Profit on disposal |
— | 1.8 | (1.8 | ) | +100 | % | ||||||||||
|
|
|
|
|
|
|
|
|||||||||
$ | (399.4 | ) | $ | (302.8 | ) | $ | (96.6 | ) | +32 | % | ||||||
|
|
|
|
|
|
|
|
Financial information with respect to our domestic and foreign operations is contained in Note 3 of the Notes to the Consolidated Financial Statements.
Performance Chemicals
Net sales: the table below details the components which comprise the year over year change in net sales spread across the markets in which we operate:
Change (%) |
Americas | EMEA | ASPAC | Total | ||||||||||||
Volume |
+20 | -9 | +7 | +2 | ||||||||||||
Price and product mix |
+20 | +33 | +18 | +28 | ||||||||||||
Exchange rates |
— | -14 | -7 | -8 | ||||||||||||
|
|
|
|
|
|
|
|
|||||||||
+40 | +10 | +18 | +22 | |||||||||||||
|
|
|
|
|
|
|
|
Higher sales volumes for the Americas and ASPAC were primarily driven by increased demand for our personal care products. Lower sales volumes for EMEA were due to
34
reductions in demand for our home care products when compared to strong sales volumes in the prior year. All our regions benefited from a favorable price and product mix due to increased sales of higher priced products together with the impact of increased raw materials pricing being passed on through higher selling prices. EMEA and ASPAC were adversely impacted by exchange rate movements year over year, due to a strengthening of the U.S. dollar against the British pound sterling and the European Union euro.
Gross margin: the year over year decrease of 0.4 percentage points was primarily due to adverse manufacturing variances and higher raw materials costs in the fourth quarter of 2022, being partly offset by a favorable sales mix from increased sales of higher margin products.
Operating expenses: the year over year increase of $0.4 million was due to higher selling expenses to support our increased sales and higher personnel-related expenses, including higher share-based compensation accruals and higher performance-related remuneration accruals; being partly offset by lower provisions for doubtful debts.
Fuel Specialties
Net sales: the table below details the components which comprise the year over year change in net sales spread across the markets in which we operate:
Change (%) |
Americas | EMEA | ASPAC | AvGas | Total | |||||||||||||||
Volume |
+10 | -11 | +11 | +4 | — | |||||||||||||||
Price and product mix |
+28 | +32 | +14 | -7 | +26 | |||||||||||||||
Exchange rates |
— | -17 | -4 | — | -8 | |||||||||||||||
|
|
|
|
|
|
|
|
|
|
|||||||||||
+38 | +4 | +21 | -3 | +18 | ||||||||||||||||
|
|
|
|
|
|
|
|
|
|
The Americas and ASPAC sales volumes have increased year over year as the global demand for refined fuel products has increased. EMEA sales volumes were lower year over year primarily due to a reduction for the sales of higher volume lower margin products. Price and product mix was favorable in all our regions due to a favorable sales mix with an increased proportion of sales of higher margin products, together with the impact of increased raw materials pricing being passed on through higher selling prices. AvGas volumes were higher than the prior year due to variations in the demand from customers, being offset by an adverse price and product mix with a higher proportion of sales being made to lower margin customers. EMEA and ASPAC were adversely impacted by exchange rate movements year over year, due to a strengthening of the U.S. dollar against the British pound sterling and the European Union euro.
Gross margin: the year over year decrease of 0.8 percentage points was due to the impact of the time lag for passing higher raw material costs through to selling prices.
Operating expenses: the year over year increase of $11.6 million was due to higher personnel-related expenses, including higher share-based compensation accruals, higher travel expenses, increased sales promotions and increased provisions for doubtful debts.
35
Oilfield Services
Net sales: have increased year over year by $254.0 million, or 75 percent, with the majority of our customer activity being concentrated in the Americas region. Customer demand has increased through each quarter in 2022, which we believe represents a positive sign for further sales growth going into 2023.
Gross margin: the year over year increase of 1.9 percentage points was due to a favorable sales mix, while management are continuing to maintain prices in a competitive market.
Operating expenses: the year over year increase of $67.0 million was driven by higher customer service costs which are necessary to support the increase in demand, together with higher personnel-related expenses, including higher share-based compensation accruals and higher performance-related remuneration accruals, and increased provisions for doubtful debts.
Other Income Statement Captions
Corporate costs: the year over year increase of $15.8 million was driven by higher personnel-related expenses, including higher share-based compensation accruals and higher performance-related remuneration accruals, together with increased maintenance expenditure for our information technology infrastructure.
Profit on disposal: in the prior year there was a profit on disposal of $1.8 million, which principally related to the sale of land within our oilfield services business in the U.S..
Other net income/(expense): for 2022 and 2021, includes the following:
(in millions) |
2022 | 2021 | Change | |||||||||
Net pensions credit |
$ | 4.8 | $ | 5.4 | $ | (0.6 | ) | |||||
Foreign exchange gains/(losses) on translation |
(7.1 | ) | (2.6 | ) | (4.5 | ) | ||||||
Foreign currency forward contracts gains/(losses) |
0.7 | 1.0 | (0.3 | ) | ||||||||
|
|
|
|
|
|
|||||||
$ | (1.6 | ) | $ | 3.8 | $ | (5.4 | ) | |||||
|
|
|
|
|
|
Interest expense, net: was $1.1 million in 2022 compared to $1.5 million in 2021. Interest expense includes a commitment fee to retain the Company’s revolving credit facility for the term of the agreement.
Income taxes: The effective tax rate was 28.0% and 30.7% in 2022 and 2021, respectively. The adjusted effective tax rate, once adjusted for the items set out in the following table, was 27.0% in 2022 compared with 22.7% in 2021. The Company believes that this adjusted effective tax rate, a non-GAAP financial measure, provides useful information to investors and may assist them in evaluating the Company’s underlying performance and identifying operating trends. In addition, management uses this non-GAAP financial measure internally to evaluate the performance of the Company’s operations and for planning and forecasting in subsequent periods.
36
(in millions, except ratios) |
2022 | 2021 | ||||||
Income before income taxes |
$ | 184.6 | 134.4 | |||||
Adjustment for stock compensation |
6.7 | 4.4 | ||||||
Indemnification asset regarding tax audit |
0.1 | 0.1 | ||||||
Legacy cost of closed operations |
3.5 | 3.4 | ||||||
Acquisition costs |
— | 0.8 | ||||||
|
|
|
|
|||||
Adjusted income before income taxes |
$ | 194.9 | 143.1 | |||||
|
|
|
|
|||||
Income taxes |
$ | 51.6 | 41.3 | |||||
Adjustment of income tax provisions |
— | (0.5 | ) | |||||
Tax on stock compensation |
0.6 | 1.3 | ||||||
Tax loss / (gain) on distribution |
— | (0.2 | ) | |||||
Change in UK statutory tax rate |
— | (7.3 | ) | |||||
Tax on legacy cost of closed operations |
0.7 | (1.5 | ) | |||||
Tax on acquisition costs |
— | 0.2 | ||||||
Other discrete items |
(0.3 | ) | (0.8 | ) | ||||
|
|
|
|
|||||
Adjusted income taxes |
$ | 52.6 | 32.5 | |||||
|
|
|
|
|||||
GAAP effective tax rate |
28.0 | % | 30.7 | % | ||||
|
|
|
|
|||||
Adjusted effective tax rate |
27.0 | % | 22.7 | % | ||||
|
|
|
|
The GAAP effective tax rate and adjusted effective tax rate in 2022 have been negatively impacted by foreign income inclusions, net of foreign tax credits, which arise each year from certain types of income earned overseas being taxable under U.S. tax regulations.
As a consequence of the Company having operations outside of the U.S., it is exposed to foreign currency fluctuations. These have also had a negative impact on the GAAP effective tax rate and adjusted effective tax rate in 2022.
The adjusted effective tax rate is lower than the GAAP effective tax rate, primarily due to elimination of stock compensation activity to better reflect the Company’s underlying business performance.
The most significant factor impacting our adjusted effective tax rate in 2021 is the elimination of the impact of the increase in the U.K. statutory income tax rate.
For additional information regarding the GAAP effective tax rate in 2022, see Note 11 of the Notes to the Consolidated Financial Statements.
37
Results of Operations – Fiscal 2021 compared to Fiscal 2020:
(in millions, except ratios) |
2021 | 2020 | Change | |||||||||||||
Net sales: |
||||||||||||||||
Performance Chemicals |
$ | 525.3 | $ | 425.4 | $ | 99.9 | +23 | % | ||||||||
Fuel Specialties |
618.3 | 512.7 | 105.6 | +21 | % | |||||||||||
Oilfield Services |
339.8 | 255.0 | 84.8 | +33 | % | |||||||||||
|
|
|
|
|
|
|||||||||||
$ | 1,483.4 | $ | 1,193.1 | $ | 290.3 | +24 | % | |||||||||
|
|
|
|
|
|
|||||||||||
Gross profit: |
||||||||||||||||
Performance Chemicals |
$ | 125.2 | $ | 103.8 | 21.4 | +21 | % | |||||||||
Fuel Specialties |
193.2 | 160.3 | 32.9 | +21 | % | |||||||||||
Oilfield Services |
116.5 | 80.8 | 35.7 | +44 | % | |||||||||||
Octane Additives |
— | (2.2 | ) | 2.2 | -100 | % | ||||||||||
|
|
|
|
|
|
|||||||||||
$ | 434.9 | $ | 342.7 | 92.2 | +27 | % | ||||||||||
|
|
|
|
|
|
|||||||||||
Gross margin (%): |
||||||||||||||||
Performance Chemicals |
23.8 | 24.4 | -0.6 | |||||||||||||
Fuel Specialties |
31.2 | 31.3 | -0.1 | |||||||||||||
Oilfield Services |
34.3 | 31.7 | +2.6 | |||||||||||||
Aggregate |
29.3 | 28.7 | +0.6 | |||||||||||||
Operating expenses: |
||||||||||||||||
Performance Chemicals |
$ | (54.3 | ) | $ | (49.0 | ) | $ | (5.3 | ) | +11 | % | |||||
Fuel Specialties |
(88.6 | ) | (75.8 | ) | (12.8 | ) | +17 | % | ||||||||
Oilfield Services |
(106.1 | ) | (90.3 | ) | (15.8 | ) | +17 | % | ||||||||
Octane Additives |
— | (0.6 | ) | 0.6 | -100 | % | ||||||||||
Corporate costs |
(55.6 | ) | (52.2 | ) | (3.4 | ) | +7 | % | ||||||||
Restructuring charge |
— | (21.3 | ) | 21.3 | -100 | % | ||||||||||
Impairment of intangible assets |
— | (19.8 | ) | 19.8 | -100 | % | ||||||||||
Profit on disposal |
1.8 | — | 1.8 | +100 | % | |||||||||||
|
|
|
|
|
|
|||||||||||
$ | (302.8 | ) | $ | (309.0 | ) | $ | 6.2 | -2 | % | |||||||
|
|
|
|
|
|
Financial information with respect to our domestic and foreign operations is contained in Note 3 of the Notes to the Consolidated Financial Statements.
Performance Chemicals
Net sales: the table below details the components which comprise the year on year change in net sales spread across the markets in which we operate:
Change (%) |
Americas | EMEA | ASPAC | Total | ||||||||||||
Volume |
+33 | +1 | -11 | +10 | ||||||||||||
Price and product mix |
+12 | +10 | +8 | +10 | ||||||||||||
Exchange rates |
— | +4 | +2 | +3 | ||||||||||||
|
|
|
|
|
|
|
|
|||||||||
+45 | +15 | -1 | +23 | |||||||||||||
|
|
|
|
|
|
|
|
38
Higher volumes for the Americas were driven by increased demand for our personal care products. Volumes in EMEA were favorable including the continued recovery of demand across several markets which have been adversely impacted by the pandemic. Lower volumes in ASPAC were primarily driven by a reduction in demand for our personal care products. All our regions benefited from a favorable price and product mix due to increased sales of higher priced products and increased raw materials pricing being passed on through higher selling prices. EMEA and ASPAC benefited from favorable exchange rate movements year over year, due to a strengthening of the British pound sterling and the European Union euro against the U.S. dollar.
Gross margin: the year over year decrease of 0.6 percentage points was due to adverse manufacturing variances as activity slowed over the holiday season in the fourth quarter, together with some one-off provisions.
Operating expenses: the year over year increase of $5.3 million was due to increased spending on research and development, an increase in the allowance for doubtful debts and higher personnel-related expenses including higher share-based compensation accruals and higher performance related remuneration accruals.
Fuel Specialties
Net sales: the table below details the components which comprise the year on year change in net sales spread across the markets in which we operate:
Change (%) |
Americas | EMEA | ASPAC | AvGas | Total | |||||||||||||||
Volume |
+22 | +6 | +4 | -32 | +9 | |||||||||||||||
Price and product mix |
+5 | +8 | +7 | +36 | +9 | |||||||||||||||
Exchange rates |
— | +7 | +1 | — | +3 | |||||||||||||||
|
|
|
|
|
|
|
|
|
|
|||||||||||
+27 | +21 | +12 | +4 | +21 | ||||||||||||||||
|
|
|
|
|
|
|
|
|
|
Volumes in all our regions have increased year over year, as the global demand for refined fuel products has returned to near the pre-pandemic levels. Price and product mix was favorable in all our regions due to increased sales of higher margin products and increased raw materials pricing being passed on through higher selling prices. AvGas volumes were lower than the prior year due to variations in the demand from customers, being offset by a favorable price and product mix with a higher proportion of sales to higher margin customers. EMEA and ASPAC benefited from favorable exchange rate movements year over year, due to a strengthening of the British pound sterling and the European Union euro against the U.S. dollar.
Gross margin: the year over year decrease of 0.1 percentage points was impacted by the time lag for passing higher raw material costs through to selling prices in the second half of the year.
Operating expenses: the year over year increase of $12.8 million was due to higher selling expenses to support the increased sales, together with higher research and development costs
39
and higher personnel-related expenses including higher share-based compensation accruals and higher performance related remuneration accruals.
Oilfield Services
Net sales: have increased year over year by $84.8 million, or 33 percent, with the majority of our customer activity continuing to be in the Americas region. Customer demand has increased throughout the year as the pandemic recovery has continued. We expect to see continued growth in customer demand into 2022.
Gross margin: the year over year increase of 2.6 percentage points was due to a favorable sales mix compared to a prior year comparative which was adversely impacted by the pandemic, while management have successfully maintained prices in a competitive market.
Operating expenses: the year over year increase of $15.8 million was driven by our continuing customer service flexibility which allows us to support the increase in demand as the pandemic recovery has continued, together with higher personnel-related expenses including higher share-based compensation accruals and higher performance related remuneration accruals.
Octane Additives
The Octane Additives business ceased trading and is no longer a reporting segment from July 1, 2020 as the production of TEL for use in motor gasoline has finished. Legacy costs related to these operations have now been recorded as operating expenses within corporate costs.
Prior to the business ceasing trade there were no sales in 2020, together with a gross loss of $2.2 million and operating expenses of $0.6 million.
Other Income Statement Captions
Corporate costs: the year over year increase of $3.4 million was driven by higher personnel-related expenses including higher share-based compensation accruals and higher performance related remuneration accruals, together with the adverse impact of the foreign currency translation of our costs at Ellesmere Port in the United Kingdom due to a strengthening of the British pound sterling against the U.S. dollar.
Profit on disposal: there has been a profit on disposal of assets for $1.8 million in 2021, which principally relates to the sale of land within our oilfield services business in the U.S..
40
Other net income/(expense): for 2021 and 2020, includes the following:
(in millions) |
2021 | 2020 | Change | |||||||||
United Kingdom pension credit |
$ | 6.5 | $ | 6.2 | $ | 0.3 | ||||||
German pension charge |
(1.1 | ) | (0.9 | ) | (0.2 | ) | ||||||
Foreign exchange gains/(losses) on translation |
(2.6 | ) | 4.0 | (6.6 | ) | |||||||
Foreign currency forward contracts gains/(losses) |
1.0 | (1.5 | ) | 2.5 | ||||||||
|
|
|
|
|
|
|||||||
$ | 3.8 | $ | 7.8 | $ | (4.0 | ) | ||||||
|
|
|
|
|
|
Interest expense, net: was $1.5 million in 2021 compared to $1.8 million in 2020, driven by the repayment in full of our revolving credit facility in the second half of 2020. Interest expense includes a commitment fee to retain the Company’s revolving credit facility for the term of the agreement.
Income taxes: The effective tax rate was 30.7% and 27.7% in 2021 and 2020, respectively. The adjusted effective tax rate, once adjusted for the items set out in the following table, was 22.7% in 2021 compared with 23.5% in 2020. The Company believes that this adjusted effective tax rate, a non-GAAP financial measure, provides useful information to investors and may assist them in evaluating the Company’s underlying performance and identifying operating trends. In addition, management uses this non-GAAP financial measure internally to evaluate the performance of the Company’s operations and for planning and forecasting in subsequent periods.
41
(in millions, except ratios) |
2021 | 2020 | ||||||
Income before income taxes |
$ | 134.4 | $ | 39.7 | ||||
Adjustment for stock compensation |
4.4 | 5.8 | ||||||
Indemnification asset regarding tax audit |
0.1 | 0.2 | ||||||
Restructuring charge |
— | 21.3 | ||||||
Impairment of acquired intangible assets |
— | 19.8 | ||||||
Legacy cost of closed operations |
3.4 | 2.5 | ||||||
Acquisition costs |
0.8 | 4.2 | ||||||
|
|
|
|
|||||
Adjusted income before income taxes |
$ | 143.1 | $ | 93.5 | ||||
|
|
|
|
|||||
Income taxes |
$ | 41.3 | $ | 11.0 | ||||
Adjustment of income tax provisions |
(0.5 | ) | 0.7 | |||||
Tax on stock compensation |
1.3 | 1.7 | ||||||
Tax on restructuring charge |
— | 4.3 | ||||||
Tax on impairment of acquired intangible asset |
— | 4.6 | ||||||
Tax loss / (gain) on distribution |
(0.2 | ) | 0.4 | |||||
Change in U.K. statutory tax rate |
(7.3 | ) | (2.7 | ) | ||||
Tax on legacy cost of closed operations |
(1.5 | ) | 0.5 | |||||
Tax on acquisition costs |
0.2 | 0.9 | ||||||
Other discrete items |
(0.8 | ) | 0.6 | |||||
|
|
|
|
|||||
Adjusted income taxes |
$ | 32.5 | $ | 22.0 | ||||
|
|
|
|
|||||
GAAP effective tax rate |
30.7 | % | 27.7 | % | ||||
|
|
|
|
|||||
Adjusted effective tax rate |
22.7 | % | 23.5 | % | ||||
|
|
|
|
The most significant factor impacting our adjusted effective tax rate in 2021 is the elimination of the impact of the increase in the statutory income tax rate in the U.K..
The most significant factors impacting our adjusted effective tax rate in 2020 are the restructuring charge relating to the cessation of production and sales of TEL for use in motor gasoline, the impairment of acquired intangible assets in our Oilfield Services segment, and the elimination of the impact of the increase in the statutory income tax rate in the U.K..
LIQUIDITY AND FINANCIAL CONDITION
Working Capital
In 2022 our working capital increased by $75.3 million, while our adjusted working capital increased by $88.7 million. The difference is primarily due to the exclusion of the increase in our cash and cash equivalents, together with the movements for income taxes.
The Company believes that adjusted working capital, a non-GAAP financial measure, provides useful information to investors in evaluating the Company’s underlying performance and identifying operating trends. Management uses this non-GAAP financial measure internally to allocate resources and evaluate the performance of the Company’s operations. Items excluded from the adjusted working capital calculation are listed in the table below and
42
represent factors which do not fluctuate in line with the day to day working capital needs of the business.
(in millions) |
2022 | 2021 | ||||||
Total current assets |
$ | 872.6 | $ | 728.1 | ||||
Total current liabilities |
(405.8 | ) | (336.6 | ) | ||||
|
|
|
|
|||||
Working capital |
466.8 | 391.5 | ||||||
Less cash and cash equivalents |
(147.1 | ) | (141.8 | ) | ||||
Less prepaid income taxes |
(3.3 | ) | (5.8 | ) | ||||
Less other current assets |
(0.4 | ) | (0.4 | ) | ||||
Add back current portion of accrued income taxes |
18.4 | 3.7 | ||||||
Add back current portion of finance leases |
— | 0.1 | ||||||
Add back current portion of plant closure provisions |
5.3 | 5.2 | ||||||
Add back current portion of operating lease liabilities |
13.9 | 12.4 | ||||||
|
|
|
|
|||||
Adjusted working capital |
$ | 353.6 | $ | 264.9 | ||||
|
|
|
|
The movements in our adjusted working capital are explained as follows:
We had a $50.1 million increase in trade and other accounts receivable primarily driven by increased trading activity across our reporting segments. Days’ sales outstanding in our Performance Chemicals segment decreased from 64 days to 60 days; increased in our Fuel Specialties segment from 53 days to 54 days; and increased from 52 days to 54 days in our Oilfield Services segment.
We had a $95.5 million increase in inventories, net of a $1.7 million increase in allowances, as we managed inventory levels to support future demand, with the intention of mitigating the risk of potential supply chain disruption for certain key raw materials. Days’ sales in inventory in our Performance Chemicals segment increased from 59 days to 78 days; increased in our Fuel Specialties segment from 108 days to 138 days; and decreased from 76 days to 58 days in our Oilfield Services segment.
Prepaid expenses decreased $3.9 million, from $18.0 million to $14.1 million principally due to the reduction in prepaid customer marketing arrangements.
We had a $53.0 million increase in accounts payable and accrued liabilities primarily due to increased activity across all our reporting segments. Creditor days (including goods received not invoiced) decreased in our Performance Chemicals segment from 47 days to 42 days; decreased in our Fuel Specialties segment from 50 days to 45 days; and increased from 48 days to 54 days in our Oilfield Services segment.
Operating Cash Flows
We generated cash from operating activities of $81.7 million in 2022 compared to cash inflows of $93.2 million in 2021. The reduction in cash generated from operating activities
43
was primarily related to the increases for our working capital being partly offset by the improvements in our earnings before depreciation and amortization.
Cash
At December 31, 2022 and 2021, we had cash and cash equivalents of $147.1 million and $141.8 million, respectively, of which $76.4 million and $55.1 million, respectively, were held by non-U.S. subsidiaries principally in the United Kingdom.
The $5.3 million increase in cash and cash equivalents in 2022 was driven by the cash inflows from operating activities, while being partly offset by increased working capital levels, continued investments in capital projects and the payment of our semi-annual dividends.
Debt
As at December 31, 2022 and December 31, 2021 the Company had repaid all of its borrowings under the revolving credit facility and as a result, the related deferred finance costs of $0.6 million (December 31, 2021 – $1.0 million) are now included within other current and non-current assets at the balance sheet date.
On September 16, 2020, Innospec and certain of its subsidiaries agreed to extend the term of its revolving credit facility, as described below, until September 25, 2024. The costs of $0.3 million for extending the term have been capitalized on the balance sheet, which are being amortized over the expected life of the facility.
On September 30, 2019 the Company repaid its pre-existing term loan and revolving credit facility that had been amended and restated on December 14, 2016, and replaced this borrowing with the new credit facility. As a result, refinancing costs of $1.5 million were capitalized which are being amortized over the expected life of the facility.
On September 26, 2019, Innospec and certain of its subsidiaries entered into a new agreement for a $250.0 million revolving credit facility until September 25, 2023 with an option to request an extension to the facility for a further year. The facility also contains an accordion feature whereby the Company may elect to increase the total available borrowings by an aggregate amount of up to $125.0 million.
The revolving credit facility contains terms which, if breached, would result in it becoming repayable on demand. It requires, among other matters, compliance with the following financial covenant ratios measured on a quarterly basis: (1) our ratio of net debt to EBITDA must not be greater than 3.0:1.0 and (2) our ratio of EBITDA to net interest must not be less than 4.0:1.0 Management has determined that the Company has not breached these covenants and does not expect to breach these covenants for the next 12 months.
The revolving credit facility contains restrictions which may limit our activities as well as operational and financial flexibility. We may not be able to borrow if an event of default is outstanding, which includes a material adverse change to our assets, operations or financial
44
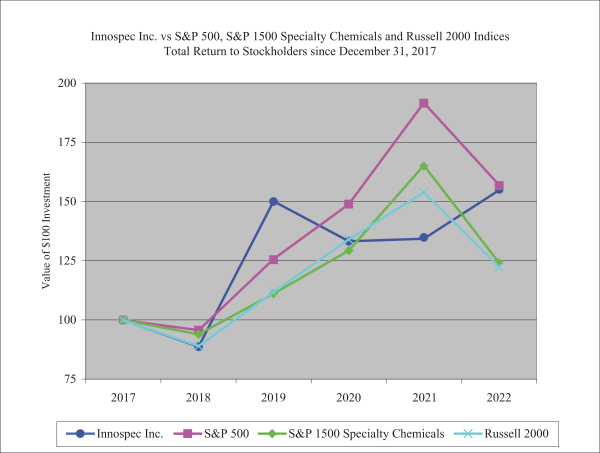
condition. The credit facility contains a number of restrictions that limit our ability, among other things, and subject to certain limited exceptions, to incur additional indebtedness, pledge our assets as security, guarantee obligations of third parties, make investments, effect a merger or consolidation, dispose of assets, or materially change our line of business.
At December 31, 2022, we had no debt outstanding under the revolving credit facility and no obligations under finance leases.
Contractual Commitments
The following represents contractual commitments at December 31, 2022 and the effect of those obligations on future cash flows:
(in millions) |
Total | 2023 | 2024-25 | 2026-27 | Thereafter | |||||||||||||||
Operating activities |
||||||||||||||||||||
Operating lease liabilities |
45.3 | 13.9 | 13.8 | 5.6 | 12.0 | |||||||||||||||
Operating lease future commitments |
2.7 | 0.9 | 1.8 | — | — | |||||||||||||||
Interest payments on debt |
1.6 | 0.9 | 0.7 | — | — | |||||||||||||||
Investing activities |
||||||||||||||||||||
Capital commitments |
37.7 | 30.6 | 7.1 | — | — | |||||||||||||||
Internally developed software |
25.0 | 20.5 | 4.5 | — | — | |||||||||||||||
|
|
|
|
|
|
|
|
|
|
|||||||||||
Total |
$ | 112.3 | $ | 66.8 | $ | 27.9 | $ | 5.6 | $ | 12.0 | ||||||||||
|
|
|
|
|
|
|
|
|
|
Operating activities
Operating lease commitments relate primarily to right-of-use assets at third party manufacturing facilities, office space, motor vehicles and various items of computer and office equipment which are expected to be renewed and replaced in the normal course of business.
The estimated payments on debt are the commitment fees for our $250.0 million revolving credit facility. Any interest income has been excluded.
Due to the uncertainty regarding the nature of tax audits, particularly those which are not currently underway, it is not meaningful to predict the outcome of obligations related to unrecognized tax benefits. Further disclosure is provided in Note 11 of the Notes to the Consolidated Financial Statements.
Investing activities
Capital commitments relate to certain capital projects that the Company has committed to undertake.
Internally developed software relates to the planned completion costs for the implementation of our new Enterprise Resource Planning system for EMEA and ASPAC, including the acquisition costs for the software as well as the external and internal costs of the development.
45
Outlook
Despite the general recessionary outlook for 2023, we continue to anticipate technology-based organic growth opportunities across all our businesses. Over the medium to long-term, we do not expect any change in our customers’ drive towards cleaner formulations, lower carbon footprint and operational efficiency. We plan to continue our investment in R&D to improve our products and technology. Our innovative chemistries and highly-responsive technical service directly support our customers’ priorities.
Our strong balance sheet gives us the flexibility to move in parallel on all of our capital allocation priorities. In 2023, we expect to substantially complete our $70 million Performance Chemicals expansion while continuing dividend growth and, based on our assessment of market conditions, share repurchases. In parallel, we intend to continue to pursue potential acquisitions that complement and expand our geographic, technology and end-market footprint.
Environmental Matters and Plant Closures
Under certain environmental laws the Company is responsible for the environmental remediation of hazardous substances or wastes at currently or formerly owned or operated properties.
As most of our manufacturing operations have been conducted outside the U.S., we expect that liability pertaining to the investigation and environmental remediation of contaminated properties is likely to be determined under non-U.S. law.
We evaluate costs for environmental remediation, decontamination and demolition projects on a regular basis. Full provision is made for those costs amounting to $57.2 million at December 31, 2022. See Note 13 of the Notes to the Consolidated Financial Statements for further details. Expenditure utilizing these provisions was $4.2 million, $5.3 million and $4.1 million in the years 2022, 2021 and 2020, respectively.
46
Item 7A | Quantitative and Qualitative Disclosures about Market Risk |
The Company uses floating rate debt to finance its global operations. The Company is subject to business risks inherent in non-U.S. activities, including political and economic uncertainty, import and export limitations, and market risk related to changes in interest rates and foreign currency exchange rates. The political and economic risks are mitigated by the stability of the countries in which the Company’s largest operations are located. Credit limits, ongoing credit evaluation and account monitoring procedures are used to minimize bad debt risk. Collateral is not generally required.
From time to time, the Company uses derivatives, including interest rate swaps, commodity swaps and foreign currency forward exchange contracts, in the normal course of business to manage market risks. The derivatives used in hedging activities are considered risk management tools and are not used for trading purposes. In addition, the Company enters into derivative instruments with a diversified group of major financial institutions in order to manage the exposure to non-performance of such instruments. The Company’s objective in managing the exposure to changes in interest rates is to limit the impact of such changes on earnings and cash flows and to lower overall borrowing costs. The Company’s objective in managing the exposure to changes in foreign currency exchange rates is to reduce volatility on earnings and cash flows associated with such changes.
The Company offers fixed prices for some long-term sales contracts. As manufacturing and raw material costs are subject to variability the Company may use commodity swaps to hedge the cost of some raw materials thus reducing volatility on earnings and cash flows. The derivatives are considered risk management tools and are not used for trading purposes. The Company’s objective is to manage its exposure to fluctuating costs of raw materials.
Interest Rate Risk
From time to time, the Company uses interest rate swaps to manage interest rate exposure. The Company retains a $250.0 million revolving credit facility which is available to draw down as required. The credit facility carries an interest rate based on U.S. dollar LIBOR plus a margin of between 1.05% and 2.30% which is dependent on the Company’s ratio of net debt to EBITDA. Net debt and EBITDA are non-GAAP measures of liquidity defined in the credit facility.
At December 31, 2022, $0.0 million was drawn under the revolving credit facility.
The Company previously entered into interest rate swap contracts to reduce interest rate risk on its core debt. As at December 31, 2022 and December 31, 2021, there were no interest rate swaps in place. Interest rate swaps have previously been used to hedge interest rate risk on a term loan for a notional value that matched the repayment profile of the term loan.
As at December 31, 2022, the Company had no debt or finance leases and $147.1 million cash and cash equivalents. Assuming variable interest returns on the cash balances, a hypothetical absolute increase or decrease of 1% in U.S. base interest rates for a one-year period would increase or decrease net income and cash flows by approximately $1.5 million before tax.
47
The above does not consider the effect of interest or exchange rate changes on overall activity nor management action to mitigate such changes.
Exchange Rate Risk
The Company generates an element of its revenues and incurs some operating costs in currencies other than the U.S. dollar. The reporting currency of the Company is the U.S. dollar.
The Company evaluates the functional currency of each reporting unit according to the economic environment in which it operates. Several major subsidiaries of the Company operating outside of the U.S. have the U.S. dollar as their functional currency due to the nature of the markets in which they operate. In addition, the financial position and results of operations of some of our overseas subsidiaries are reported in the relevant local currency and then translated to U.S. dollars at the applicable currency exchange rate for inclusion in our Consolidated Financial Statements.
The primary foreign currencies in which we have exchange rate fluctuation exposure are the European Union euro, British pound sterling and Brazilian Real. Changes in exchange rates between these foreign currencies and the U.S. dollar will affect the recorded levels of our assets and liabilities, to the extent that such figures reflect the inclusion of foreign assets and liabilities which are translated into U.S. dollars for presentation in our Consolidated Financial Statements, as well as our results of operations.
The Company’s objective in managing the exposure to foreign currency fluctuations is to reduce earnings and cash flow volatility associated with foreign currency exchange rate changes. Accordingly, the Company enters into various contracts that change in value as foreign currency exchange rates change to protect the U.S. dollar value of its existing foreign currency denominated assets, liabilities, commitments, and cash flows. The Company also uses foreign currency forward exchange contracts to offset a portion of the Company’s exposure to certain foreign currency denominated revenues so that gains and losses on these contracts offset changes in the U.S. dollar value of the related foreign currency denominated revenues. The objective of the hedging program is to reduce earnings and cash flow volatility related to changes in foreign currency exchange rates.
The trading of our Performance Chemicals, Fuel Specialties and Oilfield Services segments is inherently naturally hedged and accordingly changes in exchange rates would not be material to our earnings or financial position. The cost base of our corporate costs, however, are largely denominated in British pound sterling. A 5% strengthening in the U.S. dollar against British pound sterling would increase reported operating income by approximately $1.6 million for a one-year period excluding the impact of any foreign currency forward exchange contracts. Where a 5% strengthening of the U.S. dollar has been used as an illustration, a 5% weakening would be expected to have the opposite effect on operating income.
48
Raw Material Cost Risk
We use a variety of raw materials, chemicals and energy in our manufacturing and blending processes. Many of the raw materials that we use are derived from petrochemical-based and vegetable-based feedstocks which can be subject to periods of rapid and significant cost instability. These fluctuations in cost can be caused by political instability in oil producing nations and elsewhere, or other factors influencing global supply and demand of these materials, over which we have little or no control. We use long-term contracts (generally with fixed or formula-based costs) and advance bulk purchases to help ensure availability and continuity of supply, and to manage the risk of cost increases. From time to time we enter into hedging arrangements for certain raw materials, but do not typically enter into hedging arrangements for all raw materials, chemicals or energy costs. Should the costs of raw materials, chemicals or energy increase, and should we not be able to pass on these cost increases to our customers, then operating margins and cash flows from operating activities would be adversely impacted. Should raw material costs increase significantly, then the Company’s need for working capital could similarly increase. Any of these risks could adversely impact our results of operations, financial position and cash flows.
49
Item 8 |
Financial Statements and Supplementary Data |
Years ended December 31 |
||||||||||||
2022 |
2021 |
2020 |
||||||||||
Net sales |
$ | $ | $ | |||||||||
Cost of goods sold |
( |
) | ( |
) | ( |
) | ||||||
|
|
|
|
|
|
|||||||
Gross profit |
||||||||||||
|
|
|
|
|
|
|||||||
Operating expenses: |
||||||||||||
Selling, general and administrative |
( |
) | ( |
) | ( |
) | ||||||
Research and development |
( |
) | ( |
) | ( |
) | ||||||
Restructuring charge |
( |
) | ||||||||||
Impairment of intangible assets |
( |
) | ||||||||||
Profit on disposal |
||||||||||||
|
|
|
|
|
|
|||||||
Total operating expenses |
( |
) | ( |
) | ( |
) | ||||||
|
|
|
|
|
|
|||||||
Operating income |
||||||||||||
Other (expense)/income, net |
( |
) | ||||||||||
Interest expense, net |
( |
) | ( |
) | ( |
) | ||||||
|
|
|
|
|
|
|||||||
Income before income tax expense |
||||||||||||
Income tax expense |
( |
) | ( |
) | ( |
) | ||||||
|
|
|
|
|
|
|||||||
Net income |
$ | $ | $ | |||||||||
|
|
|
|
|
|
|||||||
Earnings per share: |
||||||||||||
Basic |
$ | $ | $ | |||||||||
|
|
|
|
|
|
|||||||
Diluted |
$ | $ | $ | |||||||||
|
|
|
|
|
|
|||||||
Weighted average shares outstanding (in thousands): |
||||||||||||
Basic |
||||||||||||
|
|
|
|
|
|
|||||||
Diluted |
||||||||||||
|
|
|
|
|
|
Total comprehensive income for the years ended December 31 |
2022 |
2021 |
2020 |
|||||||||||||
Net income |
$ | $ | $ | |||||||||||||
Changes in cumulative translation adjustment, net of tax of $ |
( |
) | ( |
) | ||||||||||||
Amortization of prior service cost/(credit), net of tax of $( |
( |
) | ||||||||||||||
Amortization of actuarial net losses, net of tax of $( |
||||||||||||||||
Actuarial net gains/(losses) arising during the year, net of tax of $ |
( |
) | ( |
) | ||||||||||||
|
|
|
|
|
|
|||||||||||
Total comprehensive income |
$ | $ | $ | |||||||||||||
|
|
|
|
|
|
At December 31 |
||||||||
2022 |
2021 |
|||||||
Assets |
||||||||
Current assets: |
||||||||
Cash and cash equivalents |
$ | $ | ||||||
Trade and other accounts receivable (less allowances of $ |
||||||||
Inventories (less allowances of $ |
||||||||
Finished goods |
||||||||
Raw materials |
||||||||
|
|
|
|
|||||
Total inventories |
||||||||
Prepaid expenses |
||||||||
Prepaid income taxes |
||||||||
Other current assets |
||||||||
|
|
|
|
|||||
Total current assets |
||||||||
Net property, plant and equipment |
||||||||
Operating leases right-of-use |
||||||||
Goodwill |
||||||||
Other intangible assets |
||||||||
Deferred tax assets |
||||||||
Pension asset |
||||||||
Other non-current assets |
||||||||
|
|
|
|
|||||
Total assets |
$ | $ | ||||||
|
|
|
|
|||||
Liabilities and Equity |
||||||||
Current liabilities: |
||||||||
Accounts payable |
$ | $ | ||||||
Accrued liabilities |
||||||||
Current portion of finance leases |
||||||||
Current portion of operating lease liabilities |
||||||||
Current portion of plant closure provisions |
||||||||
Current portion of accrued income taxes |
||||||||
|
|
|
|
|||||
Total current liabilities |
||||||||
Operating lease liabilities, net of current portion |
||||||||
Plant closure provisions, net of current portion |
||||||||
Accrued income taxes, net of current portion |
||||||||
Unrecognized tax benefits, net of current portion |
||||||||
Deferred tax liabilities |
||||||||
Pension liabilities and post-employment benefits |
||||||||
Other non-current liabilities |
||||||||
|
|
|
|
|||||
Total liabilities |
||||||||
Equity: |
||||||||
Common stock, $ |
||||||||
Additional paid-in capital |
||||||||
Treasury stock ( |
( |
) | ( |
) | ||||
Retained earnings |
||||||||
Accumulated other comprehensive loss |
( |
) | ( |
) | ||||
|
|
|
|
|||||
Total Innospec stockholders’ equity |
||||||||
Non-controlling interest |
||||||||
|
|
|
|
|||||
Total equity |
||||||||
|
|
|
|
|||||
Total liabilities and equity |
$ | $ | ||||||
|
|
|
|
Years ended December 31 |
||||||||||||
2022 |
2021 |
2020 |
||||||||||
Cash Flows from Operating Activities |
||||||||||||
Net income |
$ | $ | $ | |||||||||
Adjustments to reconcile net income to net cash provided by operating activities: |
||||||||||||
Depreciation and amortization |
||||||||||||
Impairment of intangible assets |
||||||||||||
Impairment of tangible assets |
||||||||||||
Deferred taxes |
( |
) | ( |
) | ||||||||
Profit on disposal |
( |
) | ||||||||||
Non-cash income of defined benefit pension plans |
( |
) | ( |
) | ( |
) | ||||||
Stock option compensation |
||||||||||||
Changes in assets and liabilities, net of effects of acquired and divested companies: |
||||||||||||
Trade and other accounts receivable |
( |
) | ( |
) | ||||||||
Inventories |
( |
) | ( |
) | ||||||||
Prepaid expenses |
( |
) | ( |
) | ||||||||
Accounts payable and accrued liabilities |
( |
) | ||||||||||
Plant closure provisions |
( |
) | ||||||||||
Accrued income taxes |
( |
) | ( |
) | ||||||||
Unrecognized tax benefits |
( |
) | ( |
) | ||||||||
Other assets and liabilities |
( |
) | ( |
) | ||||||||
|
|
|
|
|
|
|||||||
Net cash provided by operating activities |
||||||||||||
Cash Flows from Investing Activities |
||||||||||||
Capital expenditures |
( |
) | ( |
) | ( |
) | ||||||
Proceeds on disposal of property, plant and equipment |
||||||||||||
Internally developed software |
( |
) | ||||||||||
|
|
|
|
|
|
|||||||
Net cash used in investing activities |
( |
) | ( |
) | ( |
) | ||||||
Cash Flows from Financing Activities |
||||||||||||
Non-controlling interest |
||||||||||||
Proceeds from revolving credit facility |
||||||||||||
Repayments of revolving credit facility |
( |
) | ||||||||||
Repayment of finance leases |
( |
) | ( |
) | ( |
) | ||||||
Refinancing costs |
( |
) | ||||||||||
Dividend paid |
( |
) | ( |
) | ( |
) | ||||||
Issue of treasury stock |
||||||||||||
Repurchase of common stock |
( |
) | ( |
) | ( |
) | ||||||
|
|
|
|
|
|
|||||||
Net cash used in financing activities |
( |
) | ( |
) | ( |
) | ||||||
Effect of foreign currency exchange rate changes on cash |
( |
) | ( |
) | ||||||||
|
|
|
|
|
|
|||||||
Net change in cash and cash equivalents |
||||||||||||
Cash and cash equivalents at beginning of year |
||||||||||||
|
|
|
|
|
|
|||||||
Cash and cash equivalents at end of year |
$ | $ | $ | |||||||||
|
|
|
|
|
|
Common Stock |
Additional Paid-In Capital |
Treasury Stock |
Retained Earnings |
Accumulated Other Comprehensive Loss |
Non- controlling Interest |
Total Equity |
||||||||||||||||||||||
Balance at December 31, 2019 |
$ | $ | $ | ( |
) | $ | $ | ( |
) | $ | $ | |||||||||||||||||
Net income |
||||||||||||||||||||||||||||
Dividend paid ($ |
( |
) | ( |
) | ||||||||||||||||||||||||
Changes in cumulative translation adjustment, net of tax |
||||||||||||||||||||||||||||
Share of net income |
||||||||||||||||||||||||||||
Treasury stock re-issued |
( |
) | ||||||||||||||||||||||||||
Treasury stock repurchased |
( |
) | ( |
) | ||||||||||||||||||||||||
Stock option compensation |
||||||||||||||||||||||||||||
Amortization of prior service credit, net of tax |
( |
) | ( |
) | ||||||||||||||||||||||||
Amortization of actuarial net losses, net of tax |
||||||||||||||||||||||||||||
Actuarial net losses arising during the year, net of tax |
( |
) | ( |
) | ||||||||||||||||||||||||
Balance at December 31, 2020 |
$ | $ | $ | ( |
) | $ | $ | ( |
) | $ | $ | |||||||||||||||||
Net income |
||||||||||||||||||||||||||||
Dividend paid ($ |
( |
) | ( |
) | ||||||||||||||||||||||||
Changes in cumulative translation adjustment, net of tax |
( |
) | ( |
) | ||||||||||||||||||||||||
Share of net income |
||||||||||||||||||||||||||||
Treasury stock re-issued |
||||||||||||||||||||||||||||
Treasury stock repurchased |
( |
) | ( |
) | ||||||||||||||||||||||||
Stock option compensation |
||||||||||||||||||||||||||||
Amortization of prior service cost, net of tax |
||||||||||||||||||||||||||||
Amortization of actuarial net losses, net of tax |
||||||||||||||||||||||||||||
Actuarial net gains arising during the year, net of tax |
||||||||||||||||||||||||||||
Balance at December 31 2021 |
$ | $ | $ | ( |
) | $ | $ | ( |
) | $ | $ | |||||||||||||||||
Net income |
||||||||||||||||||||||||||||
Dividend paid ($ |
( |
) | ( |
) | ||||||||||||||||||||||||
Changes in cumulative translation adjustment, net of tax |
( |
) | ( |
) | ||||||||||||||||||||||||
Non-controlling interest investment |
||||||||||||||||||||||||||||
Treasury stock re-issued |
||||||||||||||||||||||||||||
Treasury stock repurchased |
( |
) | ( |
) | ||||||||||||||||||||||||
Stock option compensation |
||||||||||||||||||||||||||||
Amortization of prior service cost, net of tax |
||||||||||||||||||||||||||||
Amortization of actuarial net losses, net of tax |
||||||||||||||||||||||||||||
Actuarial net losses arising during the year, net of tax |
( |
) | ( |
) | ||||||||||||||||||||||||
Balance at December 31 2022 |
$ | $ | $ | ( |
) | $ | $ | ( |
) | $ | $ |
Buildings |
||||
Equipment |
Technology |
||||
Customer lists |
||||
Brand names |
||||
Product rights |
||||
Internally developed software |
||||
Marketing related |
(in millions) |
2022 |
2021 |
2020 |
|||||||||
Net Sales: |
||||||||||||
Personal Care |
$ | $ | $ | |||||||||
Home Care |
||||||||||||
Other |
||||||||||||
|
|
|
|
|
|
|||||||
Performance Chemicals |
||||||||||||
|
|
|
|
|
|
|||||||
Refinery and Performance |
||||||||||||
Other |
||||||||||||
|
|
|
|
|
|
|||||||
Fuel Specialties |
||||||||||||
|
|
|
|
|
|
|||||||
Oilfield Services |
||||||||||||
|
|
|
|
|
|
|||||||
$ | $ | $ | ||||||||||
|
|
|
|
|
|
|||||||
Operating income/(expense): |
||||||||||||
Performance Chemicals |
$ | $ | $ | |||||||||
Fuel Specialties |
||||||||||||
Oilfield Services |
( |
) | ||||||||||
Octane Additives |
( |
) | ||||||||||
Corporate costs |
( |
) | ( |
) | ( |
) | ||||||
Restructuring charge |
( |
) | ||||||||||
Impairment of intangible assets |
( |
) | ||||||||||
Profit on disposal |
||||||||||||
|
|
|
|
|
|
|||||||
Total operating income |
$ | $ | $ | |||||||||
|
|
|
|
|
|
|||||||
Identifiable assets at year-end: |
||||||||||||
Performance Chemicals |
$ | $ | $ | |||||||||
Fuel Specialties |
||||||||||||
Oilfield Services |
||||||||||||
Corporate |
||||||||||||
|
|
|
|
|
|
|||||||
$ | $ | $ | ||||||||||
|
|
|
|
|
|
• | managing the group as a company with securities listed on the NASDAQ and registered with the SEC; |
• | the President/CEO’s office, group finance, group human resources, group legal and compliance counsel, and investor relations; |
• | running the corporate offices in the U.S. and Europe; |
• | the corporate development function since they do not relate to the current trading activities of our other reporting segments; and |
• | the corporate share of the information technology, product technology, safety, health, environment, accounting and human resources departments. |
(in millions) |
2022 |
2021 |
2020 |
|||||||||
Net sales by source: |
||||||||||||
United States & North America |
$ | $ | $ | |||||||||
United Kingdom |
||||||||||||
Rest of Europe |
||||||||||||
Rest of World |
||||||||||||
Sales between areas |
( |
) | ( |
) | ( |
) | ||||||
$ | $ | $ | ||||||||||
Income before income taxes: |
||||||||||||
United States & North America |
$ | $ | $ | |||||||||
United Kingdom |
||||||||||||
Rest of Europe |
||||||||||||
Rest of World |
||||||||||||
$ | $ | $ | ||||||||||
Long-lived assets at year-end: |
||||||||||||
United States & North America |
$ | $ | $ | |||||||||
United Kingdom |
||||||||||||
Rest of Europe |
||||||||||||
Rest of World |
||||||||||||
$ | $ | $ | ||||||||||
Identifiable assets at year-end: |
||||||||||||
United States & North America |
$ | $ | $ | |||||||||
United Kingdom |
||||||||||||
Rest of Europe |
||||||||||||
Rest of World |
||||||||||||
Goodwill |
||||||||||||
$ | $ | $ | ||||||||||
2022 |
2021 |
2020 |
||||||||||
Numerator (in millions): |
||||||||||||
Net income available to common stockholders |
$ | $ | $ | |||||||||
Denominator (in thousands): |
||||||||||||
Weighted average common shares outstanding |
||||||||||||
Dilutive effect of stock options and awards |
||||||||||||
Denominator for diluted earnings per share |
||||||||||||
Net income per share, basic: |
$ | $ | $ | |||||||||
Net income per share, diluted: |
$ | $ | $ | |||||||||
(in millions) |
2022 |
2021 |
||||||
Land |
$ | $ | ||||||
Buildings |
||||||||
Equipment |
||||||||
Work in progress |
||||||||
Total gross cost |
||||||||
Less accumulated depreciation and impairment |
( |
) | ( |
) | ||||
Total net book value |
$ | $ | ||||||
(in millions) |
Twelve Months Ended December 31 |
||||||
2022 |
2021 |
|||||||
Finance lease cost: |
||||||||
Amortization of right-of-use |
$ | $ | ||||||
Interest on lease liabilities |
||||||||
Total finance lease cost |
||||||||
Operating lease cost |
||||||||
Short-term lease cost |
||||||||
Variable lease cost |
||||||||
Total lease cost |
$ | $ | ||||||
(in millions) |
Twelve Months Ended December 31 |
||||||
2022 |
2021 |
|||||||
Cash paid for amounts included in the measurement of lease liabilities: |
||||||||
Operating cash flows from operating leases |
$ | $ | ||||||
Operating cash flows from finance leases |
||||||||
Finance cash flows from finance leases |
||||||||
Right-of-use |
||||||||
Operating leases |
$ | $ | ||||||
Finance leases |
(in millions except lease term and discount rate) |
December 31 2022 |
December 31 2021 |
||||||
Operating leases: |
||||||||
Operating lease right-of-use |
$ | $ | ||||||
Current portion of operating lease liabilities |
$ | $ | ||||||
Operating lease liabilities, net of current portion |
||||||||
Total operating lease liabilities |
$ | $ | ||||||
Finance leases: |
||||||||
Property, plant and equipment at cost |
$ | $ | ||||||
Accumulated depreciation |
( |
) | ||||||
Net property, plant and equipment |
$ | $ | ||||||
of |
$ | $ | ||||||
Finance leases, net of current portion |
— | — | ||||||
Total finance lease liabilities |
$ | $ | ||||||
(in millions except lease term and discount rate) |
December 31 2022 |
December 31 2021 |
||||||
Weighted average remaining lease term: |
||||||||
Operating leases |
||||||||
Finance leases |
— | |||||||
Weighted average discount rate: |
||||||||
Operating leases |
% | % | ||||||
Finance leases |
% |
(in millions) |
Operating Leases |
|||
Within one year |
$ | |||
Year two |
||||
Year three |
||||
Year four |
||||
Year five |
||||
Thereafter |
||||
Total lease payments |
||||
Less imputed interest |
( |
) | ||
Total |
$ | |||
(in millions) |
Operating Leases |
Finance Leases |
||||||
Within one year |
$ | $ | ||||||
Year two |
||||||||
Year three |
||||||||
Year four |
||||||||
Year five |
||||||||
Thereafter |
||||||||
Total lease payments |
||||||||
Less imputed interest |
( |
) | ||||||
Total |
$ | $ | ||||||
(in millions) |
Performance Chemicals |
Fuel Specialties |
Oilfield Services |
Total |
||||||||||||
At December 31, 2020 |
||||||||||||||||
Gross cost |
$ | $ | $ | $ | ||||||||||||
Accumulated impairment losses |
||||||||||||||||
|
|
|
|
|
|
|
|
|||||||||
Net book amount |
$ | $ | $ | $ | ||||||||||||
|
|
|
|
|
|
|
|
|||||||||
Exchange effect |
( |
) | ( |
) | ( |
) | ||||||||||
At December 31, 2021 |
||||||||||||||||
Gross cost |
$ | $ | $ | $ | ||||||||||||
Accumulated impairment losses |
||||||||||||||||
|
|
|
|
|
|
|
|
|||||||||
Net book amount |
$ | $ | $ | $ | ||||||||||||
|
|
|
|
|
|
|
|
|||||||||
Exchange effect |
( |
) | ( |
) | ( |
) | ||||||||||
At December 31, 2022 |
||||||||||||||||
Gross cost |
$ | $ | $ | $ | ||||||||||||
Accumulated impairment losses |
||||||||||||||||
|
|
|
|
|
|
|
|
|||||||||
Net book amount |
$ | $ | $ | $ | ||||||||||||
|
|
|
|
|
|
|
|
(in millions) |
2022 |
2021 |
||||||
Gross cost at January 1 |
$ | $ | ||||||
Additions |
||||||||
Written down in the year |
( |
) | ||||||
Exchange effect |
( |
) | ( |
) | ||||
|
|
|
|
|||||
Gross cost at December 31 |
||||||||
|
|
|
|
|||||
Accumulated amortization at January 1 |
( |
) | ( |
) | ||||
Amortization expense |
( |
) | ( |
) | ||||
Written down in the year |
||||||||
Exchange effect |
||||||||
|
|
|
|
|||||
Accumulated amortization at December 31 |
( |
) | ( |
) | ||||
|
|
|
|
|||||
Net book amount at December 31 |
$ | $ | ||||||
|
|
|
|
(in millions) |
Gross carrying amount |
Accumulated amortization |
||||||
Product rights |
$ | $ | ( |
) | ||||
Brand names |
( |
) | ||||||
Technology |
( |
) | ||||||
Customer relationships |
( |
) | ||||||
Internally developed software |
( |
) | ||||||
Other |
( |
) | ||||||
|
|
|
|
|||||
$ | $ | ( |
) | |||||
|
|
|
|
(in millions) |
Gross carrying amount |
Accumulated amortization |
||||||
Product rights |
$ | $ | ( |
) | ||||
Brand names |
( |
) | ||||||
Technology |
( |
) | ||||||
Customer relationships |
( |
) | ||||||
Internally developed software |
( |
) | ||||||
Other |
( |
) | ||||||
$ | $ | ( |
) | |||||
(in millions) |
||||
2023 |
$ | |||
2024 |
$ | |||
2025 |
$ | |||
2026 |
$ | |||
2027 |
$ |
(in millions) |
2022 |
2021 |
2020 |
|||||||||
Service cost |
$ | $ | $ | |||||||||
( |
) | ( |
) | ( |
) | |||||||
Amortization of prior service cost/(credit) |
( |
) | ||||||||||
Amortization of actuarial net losses |
||||||||||||
Settlement event |
( |
) | ||||||||||
Net periodic benefit |
$ | ( |
) | $ | ( |
) | $ | ( |
) | |||
Plan assumptions at December 31, (%): |
20 22 |
2021 |
2020 |
|||||||||
Discount rate |
||||||||||||
Inflation rate |
||||||||||||
Rate of return on plan assets – overall on bid-value |
||||||||||||
Plan asset allocation by category (%): |
2022 |
2021 |
2020 |
|||||||||
Debt securities and insurance contracts |
||||||||||||
Equity securities and real estate |
||||||||||||
Cash |
||||||||||||
(in millions) |
2022 |
2021 |
||||||
Change in PBO: |
||||||||
Opening balance |
$ | $ | ||||||
Interest cost |
||||||||
Service cost |
||||||||
Benefits paid |
( |
) | ( |
) | ||||
Settlements |
( |
) | ||||||
Plan amendments |
||||||||
Actuarial losses/(gains) |
( |
) | ( |
) | ||||
Exchange effect |
( |
) | ( |
) | ||||
Closing balance |
$ | $ | ||||||
Fair value of plan assets: |
||||||||
Opening balance |
$ | $ | ||||||
Benefits paid |
( |
) | ( |
) | ||||
Settlements |
( |
) | ||||||
Actual return on assets |
( |
) | ||||||
Exchange effect |
( |
) | ( |
) | ||||
Closing balance |
$ | $ | ||||||
Net pension asset |
$ | $ | ||||||
(in millions) |
Quoted Prices in Active Markets for Identical Assets (Level 1) |
Significant Other Observable Inputs (Level 2) |
Significant Unobservable Inputs (Level 3) |
Total |
||||||||||||
At December 31, 2022 |
||||||||||||||||
Debt securities: |
||||||||||||||||
Debt securities issued by non-U.S. governments and government agencies |
$ | $ | $ | $ | ||||||||||||
Corporate debt securities |
||||||||||||||||
Equity backed securities: |
||||||||||||||||
Other financial derivatives |
||||||||||||||||
Other asset backed securities: |
||||||||||||||||
Insurance contracts |
||||||||||||||||
Real estate |
||||||||||||||||
Total assets at fair value |
||||||||||||||||
Cash |
||||||||||||||||
Total plan assets |
$ | $ | $ | $ | ||||||||||||
(in millions) |
Quoted Prices in Active Markets for Identical Assets (Level 1) |
Significant Other Observable Inputs (Level 2) |
Significant Unobservable Inputs (Level 3) |
Total |
||||||||||||
At December 31, 2021 |
||||||||||||||||
Debt securities: |
||||||||||||||||
Debt securities issued by non-U.S. governments and government agencies |
$ | $ | $ | $ | ||||||||||||
Corporate debt securities |
||||||||||||||||
Equity backed securities: |
||||||||||||||||
Other financial derivatives |
( |
) | ( |
) | ||||||||||||
Other asset backed securities: |
||||||||||||||||
Insurance contracts |
||||||||||||||||
Real estate |
||||||||||||||||
Total assets at fair value |
||||||||||||||||
Cash |
||||||||||||||||
Total plan assets |
$ | $ | $ | $ | ||||||||||||
(1) |
Certain investments that are measured at fair value using the net asset value per share (or its equivalent) have not been categorized in the fair value table with a hierarchy. The fair value amounts presented in this table are intended to permit reconciliation of the fair value hierarchy to the amounts presented in the statement of financial position. |
(in millions) |
Other Assets |
|||
Balance at December 31, 2020 |
$ | |||
Realized/unrealized gains/(losses): |
||||
Relating to assets still held at the reporting date |
||||
Purchases, issuances and settlements |
( |
) | ||
Exchange effect |
( |
) | ||
Balance at December 31, 2021 |
$ | |||
Realized/unrealized gains/(losses): |
||||
Relating to assets still held at the reporting date |
( |
) | ||
Purchases, issuances and settlements |
||||
Exchange effect |
( |
) | ||
Balance at December 31, 2022 |
$ | |||
(in millions) |
||||
Service cost |
$ | |||
Interest cost on PBO |
||||
Expected return on plan assets |
( |
) | ||
Amortization of prior service credit |
||||
Amortization of actuarial net losses |
( |
) | ||
Net periodic benefit |
$ | ( |
) | |
(in millions) |
||||
2023 |
$ | |||
2024 |
$ | |||
2025 |
$ | |||
2026 |
$ | |||
2027 |
$ | |||
2028-2032 |
$ |
(in millions) |
2022 |
2021 |
2020 |
|||||||||
Service cost |
$ | $ | $ | |||||||||
Interest cost on PBO |
||||||||||||
Amortization of actuarial net loss |
||||||||||||
Net periodic cost |
$ | $ | $ | |||||||||
Discount rate |
||||||||||||
Inflation rate |
||||||||||||
Rate of increase in compensation levels |
(in millions) |
2022 |
2021 |
||||||
Change in PBO: |
||||||||
Opening balance |
$ | $ | ||||||
Service cost |
||||||||
Interest cost |
||||||||
Benefits paid |
( |
) | ( |
) | ||||
Actuarial losses/(gains) |
( |
) | ( |
) | ||||
Exchange effect |
( |
) | ( |
) | ||||
Closing balance |
$ | $ | ||||||
(in millions) |
Unrecognised Tax Benefits |
Interest and Penalties |
Total |
|||||||||
Opening balance at January 1, 2020 |
$ | $ | $ | |||||||||
Reductions for tax positions of prior periods |
( |
) | ( |
) | ( |
) | ||||||
Additions for tax positions of prior periods |
||||||||||||
|
|
|
|
|
|
|||||||
Closing balance at 31 December, 2020 |
||||||||||||
Current |
||||||||||||
|
|
|
|
|
|
|||||||
Non-current |
$ | $ | $ | |||||||||
|
|
|
|
|
|
|||||||
Opening balance at January 1, 2021 |
$ | $ | $ | |||||||||
Reductions for tax positions of prior periods |
( |
) | ( |
) | ||||||||
Additions for tax positions of prior periods |
||||||||||||
|
|
|
|
|
|
|||||||
Closing balance at 31 December, 2021 |
||||||||||||
Current |
||||||||||||
|
|
|
|
|
|
|||||||
Non-current |
$ | $ | $ | |||||||||
|
|
|
|
|
|
|||||||
Opening balance at January 1, 2022 |
$ | $ | $ | |||||||||
Reductions for tax positions of prior periods |
( |
) | ( |
) | ||||||||
Additions for tax positions of prior periods |
||||||||||||
|
|
|
|
|
|
|||||||
Closing balance at 31 December, 2022 |
||||||||||||
Current |
||||||||||||
|
|
|
|
|
|
|||||||
Non-current |
$ | $ | $ | |||||||||
|
|
|
|
|
|
(in millions) |
2022 |
2021 |
2020 |
|||||||||
Domestic |
$ | $ | $ | ( |
) | |||||||
Foreign |
||||||||||||
|
|
|
|
|
|
|||||||
$ | $ | $ | ||||||||||
|
|
|
|
|
|
(in millions) |
2022 |
2021 |
2020 |
|||||||||
Current: |
||||||||||||
Federal |
$ | $ | $ | |||||||||
State and local |
||||||||||||
Foreign |
||||||||||||
|
|
|
|
|
|
|||||||
|
|
|
|
|
|
|||||||
Deferred: |
||||||||||||
Federal |
( |
) | ( |
) | ( |
) | ||||||
State and local |
( |
) | ( |
) | ( |
) | ||||||
Foreign |
( |
) | ||||||||||
|
|
|
|
|
|
|||||||
( |
) | ( |
) | |||||||||
|
|
|
|
|
|
|||||||
$ | $ | $ | ||||||||||
|
|
|
|
|
|
(in percent) |
2022 |
2021 |
2020 |
|||||||||
Statutory rate |
% | % | % | |||||||||
Foreign income inclusions |
||||||||||||
Foreign tax rate differential |
||||||||||||
Tax charge/(credit) from previous years |
||||||||||||
Net charge/(credit) from unrecognized tax benefits |
( |
) | ( |
) | ||||||||
Foreign currency transactions |
( |
) | ||||||||||
Tax on unremitted earnings |
||||||||||||
Non-deductible foreign interest |
||||||||||||
Change in U.K. statutory tax rate |
||||||||||||
State and local taxes |
||||||||||||
U.S. incentive for foreign derived intangible income |
( |
) | ( |
) | ( |
) | ||||||
Innovation incentives – current year |
( |
) | ( |
) | ( |
) | ||||||
Innovation incentives – prior years |
( |
) | ||||||||||
Non-deductible officer compensation |
||||||||||||
Tax on closure of legacy operations |
||||||||||||
Other items and adjustments, net |
( |
) | ( |
) | ||||||||
|
|
|
|
|
|
|||||||
% | % | % | ||||||||||
|
|
|
|
|
|
(in millions) |
2022 |
2021 |
||||||
Deferred tax assets: |
||||||||
Stock compensation |
$ | $ | ||||||
Net operating loss carry forwards |
||||||||
Other intangible assets |
||||||||
Accretion expense |
||||||||
Restructuring provision |
||||||||
Employee related liabilities |
||||||||
Foreign tax credits |
||||||||
Operating lease liabilities |
||||||||
Inventory provisions |
||||||||
Research and experimental expenditure |
||||||||
Other |
||||||||
|
|
|
|
|||||
Subtotal |
||||||||
Less valuation allowance |
( |
) | ( |
) | ||||
|
|
|
|
|||||
Total net deferred tax assets |
$ | $ | ||||||
|
|
|
|
|||||
Deferred tax liabilities: |
||||||||
Property, plant and equipment |
$ | ( |
) | $ | ( |
) | ||
Intangible assets including goodwill |
( |
) | ( |
) | ||||
Pension asset |
( |
) | ( |
) | ||||
Customer relationships |
( |
) | ( |
) | ||||
Unremitted overseas earnings |
( |
) | ( |
) | ||||
Right-of-use |
( |
) | ( |
) | ||||
Other |
( |
) | ( |
) | ||||
|
|
|
|
|||||
Total deferred tax liabilities |
$ | ( |
) | $ | ( |
) | ||
|
|
|
|
|||||
Net deferred tax liability |
$ | ( |
) | $ | ( |
) | ||
|
|
|
|
|||||
Deferred tax assets |
$ | $ | ||||||
Deferred tax liabilities |
( |
) | ( |
) | ||||
|
|
|
|
|||||
$ | ( |
) | $ | ( |
) | |||
|
|
|
|
(in millions) |
2022 |
2021 |
||||||
Gross cost at January 1 |
$ | $ | ||||||
Capitalized in the year |
||||||||
|
|
|
|
|||||
|
|
|
|
|||||
Accumulated amortization at January 1 |
$ | ( |
) | $ | ( |
) | ||
Amortization in the year |
( |
) | ( |
) | ||||
|
|
|
|
|||||
$ | ( |
) | $ | ( |
) | |||
|
|
|
|
|||||
Net book value at December 31 |
$ | $ | ||||||
|
|
|
|
(in millions) |
2022 |
2021 |
2020 |
|||||||||
Total at January 1 |
$ | $ | $ | |||||||||
Charge for the period excluding restructuring |
||||||||||||
Restructuring (see Note 5) |
||||||||||||
Utilized in the period |
( |
) | ( |
) | ( |
) | ||||||
Exchange effect |
( |
) | ( |
) | ||||||||
|
|
|
|
|
|
|||||||
Total at December 31 |
||||||||||||
Due within one year |
( |
) | ( |
) | ( |
) | ||||||
|
|
|
|
|
|
|||||||
Due after one year |
$ | $ | $ | |||||||||
|
|
|
|
|
|
|
|
|
|
|
|
|
December 31, 2022 |
December 31, 2021 |
|||||||||||||||
(in millions) |
Carrying Amount |
Fair Value |
Carrying Amount |
Fair Value |
||||||||||||
Assets |
||||||||||||||||
Non-derivatives: |
||||||||||||||||
Cash and cash equivalents |
$ | $ | $ | $ | ||||||||||||
Derivatives (Level 1 measurement): |
||||||||||||||||
Other current and non-current assets: |
||||||||||||||||
Emissions Trading Scheme credits |
||||||||||||||||
Liabilities |
||||||||||||||||
Non-derivatives: |
||||||||||||||||
Finance leases (including current portion) |
$ | $ | $ | $ | ||||||||||||
Derivatives (Level 1 measurement): |
||||||||||||||||
Other current liabilities: |
||||||||||||||||
Foreign currency forward exchange contracts |
||||||||||||||||
Non-financial liabilities (Level 3 measurement): |
||||||||||||||||
Stock equivalent units |
Common Stock |
Treasury Stock |
|||||||||||||||||||||||
(number of shares in thousands) |
2022 |
2021 |
2020 |
2022 |
2021 |
2020 |
||||||||||||||||||
At January 1 |
||||||||||||||||||||||||
Exercise of options |
( |
) | ( |
) | ( |
) | ||||||||||||||||||
Stock purchases |
||||||||||||||||||||||||
|
|
|
|
|
|
|
|
|
|
|
|
|||||||||||||
At December 31 |
||||||||||||||||||||||||
|
|
|
|
|
|
|
|
|
|
|
|
2022 |
2021 |
2020 |
||||||||||
Dividend yield |
% | % | % | |||||||||
Expected life |
||||||||||||
Volatility |
% | % | % | |||||||||
Risk free interest rate |
% | % | % |
Number of shares |
Weighted Average Grant-Date Fair Value |
|||||||
Nonvested at December 31, 2021 |
$ | |||||||
Granted |
$ | |||||||
Vested |
( |
) | $ | |||||
Forfeited |
( |
) | $ | |||||
Nonvested at December 31, 2022 |
$ | |||||||
Number of shares |
Weighted Average Exercise price |
|||||||
Outstanding at December 31, 2021 |
$ | |||||||
Granted |
$ | |||||||
Exercised |
( |
) | $ | |||||
Forfeited |
( |
) | $ | |||||
Outstanding at December 31, 2022 |
$ | |||||||
Exercisable at December 31, 2022 |
$ |
(in millions) |
Amount Reclassified from AOCL |
Affected Line Item in the Statement where Net Income is Presented | ||||
Details about AOCL Components | ||||||
Defined benefit pension plan items: |
||||||
Amortization of prior service cost |
$ | See (1) below | ||||
Amortization of actuarial net losses |
See (1) below | |||||
Total before tax | ||||||
( |
) | Income tax expense | ||||
Total reclassifications |
$ | Net of tax | ||||
(1) |
These items are included in the computation of net periodic pension cost. See Note 10 of the Notes to the Consolidated Financial Statements for additional information. |
(in millions) |
Defined Benefit Pension Plan Items |
Cumulative Translation Adjustments |
Total |
|||||||||
Balance at December 31, 2021 |
$ | $ | ( |
) | $ | ( |
) | |||||
|
|
|
|
|
|
|||||||
Other comprehensive income/(losses) before reclassifications |
( |
) | ( |
) | ||||||||
Amounts reclassified from AOCL |
||||||||||||
Actuarial net gains/(losses) arising during the year |
( |
) | ( |
) | ||||||||
|
|
|
|
|
|
|||||||
Net current period other comprehensive income/(losses) |
( |
) | ( |
) | ( |
) | ||||||
|
|
|
|
|
|
|||||||
Balance at December 31, 2022 |
$ | ( |
) | $ | ( |
) | $ | ( |
) | |||
|
|
|
|
|
|
(in millions) |
Amount Reclassified from AOCL |
Affected Line Item in the Statement where Net Income is Presented |
||||||
Details about AOCL Components | ||||||||
Defined benefit pension plan items: |
||||||||
Amortization of prior service cost |
$ | See (1) below | ||||||
Amortization of actuarial net losses |
See (1) below | |||||||
|
|
|||||||
Total before tax | ||||||||
( |
) | Income tax expense | ||||||
|
|
|||||||
Total reclassifications |
$ | Net of tax | ||||||
|
|
(1) |
These items are included in the computation of net periodic pension cost. See Note 10 of the Notes to the Consolidated Financial Statements for additional information. |
(in millions) |
Defined Benefit Pension Plan Items |
Cumulative Translation Adjustments |
Total |
|||||||||
Balance at December 31, 2020 |
$ | ( |
) | $ | ( |
) | $ | ( |
) | |||
|
|
|
|
|
|
|||||||
Other comprehensive income/(losses) before reclassifications |
— | ( |
) | ( |
) | |||||||
Amounts reclassified from AOCL |
— | |||||||||||
Actuarial net gains arising during the year |
— | |||||||||||
|
|
|
|
|
|
|||||||
Net current period other comprehensive income/(losses) |
( |
) | ||||||||||
|
|
|
|
|
|
|||||||
Balance at December 31, 2021 |
$ | $ | ( |
) | $ | ( |
) | |||||
|
|
|
|
|
|
Item 9 |
Changes in and Disagreements with Accountants on Accounting and Financial Disclosure |
Item 9A |
Controls and Procedures |
• | pertain to the maintenance of records that, in reasonable detail, accurately and fairly reflect the transactions and dispositions of our assets; |
• | provide reasonable assurance that transactions are recorded as necessary to permit preparation of financial statements in accordance with accounting principles generally accepted in the United States of America and that our receipts and expenditures are being made only in accordance with authorization of our management and directors; and |
• | provide reasonable assurance regarding prevention or timely detection of unauthorized acquisition, use or disposition of assets that could have a material effect on the consolidated financial statements. |
Item 9B |
Other Information |
Item 9C |
Disclosure Regarding Foreign Jurisdictions that Prevent Inspections |
Item 10 |
Directors, Executive Officers and Corporate Governance |
Item 11 |
Executive Compensation |
Item 12 |
Security Ownership of Certain Beneficial Owners and Management and Related Stockholder Matters |
Item 13 |
Certain Relationships and Related Transactions, and Director Independence |
Item 14 |
Principal Accountant Fees and Services |
Item 15 |
Exhibits and Financial Statement Schedules |
(1) |
Financial Statements |
(2) |
Financial Statement Schedules |
(3) |
Exhibits |
2.1 |
3.1 |
3.2 |
3.3 |
3.4 |
4.1 |
10.1 |
10.2 |
10.3 |
10.5 |
10.6 |
10.7 |
10.8 |
10.9 |
10.10 |
10.11 |
10.12 |
10.13 |
10.14 |
Item 16 |
Form 10-K Summary |
INNOSPEC INC. | By: | /s/ PATRICK S. WILLIAMS | ||
(Registrant) | Patrick S. Williams | |||
Date: |
President and Chief Executive Officer | |||
February 22, 2023 |
/s/ MILTON C. BLACKMORE Milton C. Blackmore |
Chairman and Director | |||
/s/ PATRICK S. WILLIAMS Patrick S. Williams |
President and Chief Executive Officer (Principal Executive Officer); Director | |||
/s/ IAN P. CLEMINSON Ian P. Cleminson |
Executive Vice President and Chief Financial Officer | |||
/s/ GRAEME BLAIR Graeme Blair |
Head of Group Finance (Principal Accounting Officer) | |||
s/ KELLER ARNOLD Keller Arnold |
Director | |||
/s/ DAVID F. LANDLESS David F. Landless |
Director | |||
/s/ LAWRENCE J. PADFIELD Lawrence J. Padfield |
Director | |||
/s/ ROBERT I. PALLER Robert I. Paller |
Director | |||
/s/ LESLIE J. PARRETTE Leslie J. Parrette |
Director | |||
/s/ CLAUDIA POCCIA Claudia Poccia |
Director |