| OMB APPROVAL | ||
OMB Number: 3235-0570
|
||
Expires: January 31, 2014 |
||
Estimated average burden hours per response: 20.6 |
||
SECURITIES AND EXCHANGE COMMISSION
INVESTMENT COMPANIES
 |
| Annual Report to Shareholders | October 31, 2011 |
A: ACDAX § B: ACDBX § C: ACDCX § R: ACDRX § Y: ACDYX § Investor: ACDIX
Institutional: ACDVX
2 |
Letters to Shareholders | |
4 |
Performance Summary | |
4 |
Management Discussion | |
6 |
Long-Term Fund Performance | |
8 |
Supplemental Information | |
9 |
Schedule of Investments | |
12 |
Financial Statements | |
14 |
Notes to Financial Statements | |
20 |
Financial Highlights | |
21 |
Auditor's Report | |
22 |
Fund Expenses | |
23 |
Approval of Investment Advisory and Sub-Advisory Agreements | |
T-1 |
Trustees and Officers | |

Philip Taylor

Senior Managing Director, Invesco Ltd.

Bruce Crockett

Independent Chair
Invesco Funds Board of Trustees
Class A Shares |
3.64 | % | ||
Class B Shares |
2.83 | |||
Class C Shares |
2.84 | |||
Class R Shares |
3.39 | |||
Class Y Shares |
3.89 | |||
Investor Class Shares |
3.64 | |||
Institutional Class Shares |
4.13 | |||
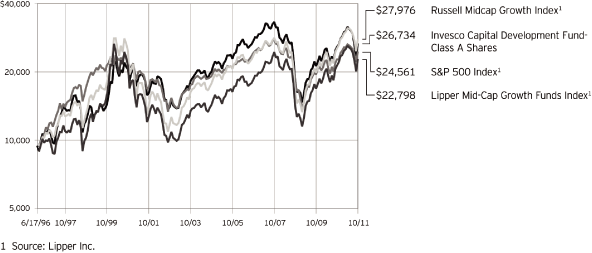
S&P 500 Index▼(Broad Market Index) |
8.07 | |||
Russell Midcap Growth Index▼(Style-Specific Index) |
10.08 | |||
Lipper Mid-Cap Growth Funds Index▼(Peer Group Index) |
6.78 | |||
| n | The price target set at purchase has been reached. | |
| n | There is deterioration in fundamentals. | |
| n | The catalysts for growth are no longer present or are reflected in the stock price. | |
| n | There is a more attractive investment opportunity. |
Consumer Discretionary |
26.2 | % | ||
Information Technology |
16.6 | |||
Health Care |
15.3 | |||
Industrials |
14.3 | |||
Energy |
9.2 | |||
Materials |
6.2 | |||
Consumer Staples |
4.2 | |||
Telecommunication Services |
3.0 | |||
Financials |
2.5 | |||
Money Market Funds |
||||
Plus Other Assets Less Liabilities |
2.5 | |||
| 1. | Abercrombie & Fitch Co.-Class A |
2.7 | % | |||||
| 2. | Cameron International Corp. |
2.3 | ||||||
| 3. | Kansas City Southern |
2.2 | ||||||
| 4. | Airgas, Inc. |
2.2 | ||||||
| 5. | Aetna, Inc. |
2.1 | ||||||
| 6. | Amphenol Corp.-Class A |
2.1 | ||||||
| 7. | DaVita, Inc. |
2.0 | ||||||
| 8. | Discovery Communications, Inc. -Class A |
2.0 | ||||||
| 9. | Gardner Denver Inc. |
1.9 | ||||||
| 10. | Gentex Corp. |
1.8 | ||||||
| 1. | Specialty Stores |
5.2 | % | |||||
| 2. | Oil & Gas Equipment & Services |
4.7 | ||||||
| 3. | Health Care Services |
3.9 | ||||||
| 4. | Managed Health Care |
3.5 | ||||||
| 5. | Oil & Gas Exploration & Development |
3.5 | ||||||
Total Net Assets |
$637.7 million | |||
Total Number of Holdings* |
71 | |||

Chartered Financial Analyst, portfolio manager, is manager of Invesco Capital Development Fund. Mr. Leach began his investment career in 1993 and joined Invesco in 2011. He leads Invesco’s U.S. Mid-Cap Growth Equity team. Mr. Leach earned a B.S. in mechanical engineering from the University of California and an M.B.A. from the Stern School of Business at New York University.
Fund data from 6/17/96, index data from 6/30/96
| Class A Shares | ||||||||
| Inception (6/17/96) | 6.61 | % | ||||||
| 10 | Years |
4.60 | ||||||
| 5 | Years |
-1.61 | ||||||
| 1 | Year |
-2.07 | ||||||
| Class B Shares | ||||||||
| Inception (10/1/96) | 5.91 | % | ||||||
| 10 | Years |
4.61 | ||||||
| 5 | Years |
-1.54 | ||||||
| 1 | Year |
-2.17 | ||||||
| Class C Shares | ||||||||
| Inception (8/4/97) | 4.55 | % | ||||||
| 10 | Years |
4.44 | ||||||
| 5 | Years |
-1.23 | ||||||
| 1 | Year |
1.84 | ||||||
| Class R Shares | ||||||||
| 10 | Years |
4.96 | % | |||||
| 5 | Years |
-0.74 | ||||||
| 1 | Year |
3.39 | ||||||
| Class Y Shares | ||||||||
| 10 | Years |
5.27 | % | |||||
| 5 | Years |
-0.34 | ||||||
| 1 | Year |
3.89 | ||||||
| Investor Class Shares | ||||||||
| 10 | Years |
5.20 | % | |||||
| 5 | Years |
-0.49 | ||||||
| 1 | Year |
3.64 | ||||||
| Institutional Class Shares | ||||||||
| Inception (3/15/02) | 4.19 | % | ||||||
| 5 | Years |
-0.01 | ||||||
| 1 | Year |
4.13 | ||||||
| Class A Shares | ||||||||
| Inception (6/17/96) | 5.75 | % | ||||||
| 10 | Years |
3.47 | ||||||
| 5 | Years |
-3.44 | ||||||
| 1 | Year |
-10.64 | ||||||
| Class B Shares | ||||||||
| Inception (10/1/96) | 5.04 | % | ||||||
| 10 | Years |
3.48 | ||||||
| 5 | Years |
-3.38 | ||||||
| 1 | Year |
-10.74 | ||||||
| Class C Shares | ||||||||
| Inception (8/4/97) | 3.64 | % | ||||||
| 10 | Years |
3.32 | ||||||
| 5 | Years |
-3.08 | ||||||
| 1 | Year |
-7.07 | ||||||
| Class R Shares | ||||||||
| 10 | Years |
3.84 | % | |||||
| 5 | Years |
-2.58 | ||||||
| 1 | Year |
-5.55 | ||||||
| Class Y Shares | ||||||||
| 10 | Years |
4.15 | % | |||||
| 5 | Years |
-2.19 | ||||||
| 1 | Year |
-5.13 | ||||||
| Investor Class Shares | ||||||||
| 10 | Years |
4.07 | % | |||||
| 5 | Years |
-2.34 | ||||||
| 1 | Year |
-5.42 | ||||||
| Institutional Class Shares | ||||||||
| Inception (3/15/02) | 2.83 | % | ||||||
| 5 | Years |
-1.87 | ||||||
| 1 | Year |
-4.94 | ||||||
| n | Unless otherwise stated, information presented in this report is as of October 31, 2011, and is based on total net assets. | |
| n | Unless otherwise noted, all data provided by Invesco. | |
| n | To access your Fund’s reports/prospectus, visit invesco.com/fundreports. |
| n | Class B shares may not be purchased or acquired by exchange from share classes other than Class B shares. Please see the prospectus for more information. | |
| n | Class R shares are available only to certain retirement plans. Please see the prospectus for more information. | |
| n | Class Y shares are available to only certain investors. Please see the prospectus for more information. | |
| n | All Investor Class shares are closed to new investors. Contact your financial adviser about purchasing our other share classes. | |
| n | Institutional Class shares are offered exclusively to institutional investors, including defined contribution plans that meet certain criteria. Please see the prospectus for more information. |
| n | Active trading risk. The Fund engages in frequent trading of portfolio securities. Active trading results in added expenses and may result in a lower return and increased tax liability. | |
| n | Foreign securities risk. The Fund’s foreign investments may be affected by changes in a foreign country’s exchange rates; political and social instability; changes in economic or taxation policies; difficulties when enforcing obligations; decreased liquidity; and increased volatility. Foreign companies may be subject to less regulation resulting in less publicly available information about the companies. | |
| n | Growth investing risk. Growth stocks tend to be more expensive relative to their earnings or assets compared with other types of stock. As a result they tend to be more sensitive to changes in their earnings and can be more volatile. | |
| n | Initial public offering (IPO) risk. Although the Fund’s return during the reporting period was positively |
| impacted by its investments in initial public offerings (IPOs), there can be no assurance that the Fund will have favorable IPO investment opportunities in the future. | ||
| n | Management risk. The investment techniques and risk analysis used by the Fund’s portfolio managers may not produce the desired results. | |
| n | Market risk. The prices of and the income generated by the Fund’s securities may decline in response to, among other things, investor sentiment; general economic and market conditions; regional or global instability; and currency and interest rate fluctuations. | |
| n | Small- and mid-capitalization risk. Stocks of small and mid-sized companies tend to be more vulnerable to adverse developments in the above factors and may have little or no operating history or track record of success, and limited product lines, markets, management and financial resources. The securities of small and mid-sized companies may be more volatile due to less market interest and less publicly available information about the issuer. They also may be illiquid or restricted as to resale, or may trade less frequently and in smaller volumes, all of which may cause difficulty when establishing or closing a position at a desirable price. |
| n | The S&P 500® Index is an unmanaged index considered representative of the U.S. stock market. | |
| n | The Russell Midcap® Growth Index is an unmanaged index considered representative of mid-cap growth stocks. The Russell Midcap Growth Index is a trademark/service mark of the Frank Russell Co. Russell® is a trademark of the Frank Russell Co. | |
| n | The Lipper Mid-Cap Growth Funds Index is an unmanaged index considered representative of mid-cap growth funds tracked by Lipper. |
| n | The Fund is not managed to track the performance of any particular index, including the index(es) defined here, and consequently, the performance of the Fund may deviate significantly from the performance of the index(es). | |
| n | A direct investment cannot be made in an index. Unless otherwise indicated, index results include reinvested dividends, and they do not reflect sales charges. Performance of the peer group, if applicable, reflects fund expenses; performance of a market index does not. |
| n | The Chartered Financial Analyst® (CFA®) designation is globally recognized and attests to a charterholder’s success in a rigorous and comprehensive study program in the field of investment management and research analysis. | |
| n | The returns shown in management’s discussion of Fund performance are based on net asset values calculated for shareholder transactions. Generally accepted accounting principles require adjustments to be made to the net assets of the Fund at period end for financial reporting purposes, and as such, the net asset values for shareholder transactions and the returns based on those net asset values may differ from the net asset values and returns reported in the Financial Highlights. | |
| n | Industry classifications used in this report are generally according to the Global Industry Classification Standard, which was developed by and is the exclusive property and a service mark of MSCI Inc. and Standard & Poor’s. |
NOT FDIC INSURED |
MAY LOSE VALUE | NO BANK GUARANTEE | ||||||
Class A Shares |
ACDAX | |||
Class B Shares |
ACDBX | |||
Class C Shares |
ACDCX | |||
Class R Shares |
ACDRX | |||
Class Y Shares |
ACDYX | |||
Investor Class Shares |
ACDIX | |||
Institutional Class Shares |
ACDVX | |||
| Shares | Value | |||||||
|
Common Stocks & Other Equity Interests–97.48% |
||||||||
|
Air Freight & Logistics–1.47% |
||||||||
|
C.H. Robinson Worldwide, Inc.
|
134,945 | $ | 9,369,231 | |||||
|
Apparel Retail–2.65% |
||||||||
|
Abercrombie & Fitch Co.–Class A
|
227,202 | 16,903,829 | ||||||
|
Apparel, Accessories & Luxury Goods–1.68% |
||||||||
|
Coach, Inc.
|
164,861 | 10,727,505 | ||||||
|
Application Software–1.41% |
||||||||
|
Citrix Systems,
Inc.(b)
|
123,130 | 8,967,558 | ||||||
|
Asset Management & Custody Banks–0.96% |
||||||||
|
Affiliated Managers Group,
Inc.(b)
|
66,090 | 6,120,595 | ||||||
|
Auto Parts & Equipment–3.46% |
||||||||
|
BorgWarner,
Inc.(b)
|
136,060 | 10,407,229 | ||||||
|
Gentex Corp.
|
388,221 | 11,693,217 | ||||||
| 22,100,446 | ||||||||
|
Automobile Manufacturers–0.76% |
||||||||
|
Tesla Motors,
Inc.(b)(c)
|
164,862 | 4,841,997 | ||||||
|
Biotechnology–2.26% |
||||||||
|
BioMarin Pharmaceutical
Inc.(b)
|
228,210 | 7,784,243 | ||||||
|
United Therapeutics
Corp.(b)
|
152,266 | 6,658,592 | ||||||
| 14,442,835 | ||||||||
|
Broadcasting–2.00% |
||||||||
|
Discovery Communications,
Inc.–Class A(b)
|
293,081 | 12,737,300 | ||||||
|
Communications Equipment–1.67% |
||||||||
|
F5 Networks,
Inc.(b)
|
58,241 | 6,054,152 | ||||||
|
Juniper Networks,
Inc.(b)
|
21,965 | 537,484 | ||||||
|
Sycamore Networks, Inc.
|
211,491 | 4,064,857 | ||||||
| 10,656,493 | ||||||||
|
Construction & Engineering–0.45% |
||||||||
|
MasTec
Inc.(b)
|
132,567 | 2,866,099 | ||||||
|
Construction & Farm Machinery & Heavy Trucks–2.62% |
||||||||
|
AGCO
Corp.(b)
|
196,620 | 8,617,855 | ||||||
|
Navistar International
Corp.(b)
|
192,363 | 8,092,711 | ||||||
| 16,710,566 | ||||||||
|
Consumer Finance–1.50% |
||||||||
|
Discover Financial Services
|
406,287 | 9,572,122 | ||||||
|
Electrical Components & Equipment–1.46% |
||||||||
|
Cooper Industries PLC (Ireland)
|
177,679 | 9,321,040 | ||||||
|
Electronic Components–2.10% |
||||||||
|
Amphenol Corp.–Class A
|
281,598 | 13,373,089 | ||||||
|
Fertilizers & Agricultural Chemicals–1.61% |
||||||||
|
Intrepid Potash,
Inc.(b)
|
368,582 | 10,257,637 | ||||||
|
Footwear–2.74% |
||||||||
|
Crocs,
Inc.(b)
|
330,673 | 5,842,992 | ||||||
|
Deckers Outdoor
Corp.(b)
|
101,008 | 11,640,162 | ||||||
| 17,483,154 | ||||||||
|
General Merchandise Stores–1.48% |
||||||||
|
Dollar Tree,
Inc.(b)
|
117,988 | 9,434,320 | ||||||
|
Health Care Equipment–1.31% |
||||||||
|
CareFusion
Corp.(b)
|
325,996 | 8,345,498 | ||||||
|
Health Care Facilities–2.54% |
||||||||
|
Brookdale Senior Living
Inc.(b)
|
302,059 | 5,008,138 | ||||||
|
Universal Health Services, Inc.–Class B
|
280,336 | 11,205,030 | ||||||
| 16,213,168 | ||||||||
|
Health Care Services–3.92% |
||||||||
|
DaVita,
Inc.(b)
|
185,516 | 12,986,120 | ||||||
|
Express Scripts,
Inc.(b)
|
209,071 | 9,560,817 | ||||||
|
HMS Holdings
Corp.(b)
|
99,148 | 2,423,177 | ||||||
| 24,970,114 | ||||||||
|
Health Care Technology–1.46% |
||||||||
|
Allscripts Healthcare Solutions,
Inc.(b)
|
485,076 | 9,289,205 | ||||||
|
Hotels, Resorts & Cruise Lines–1.57% |
||||||||
|
Starwood Hotels & Resorts Worldwide, Inc.
|
199,399 | 9,991,884 | ||||||
|
Household Products–1.80% |
||||||||
|
Church & Dwight Co., Inc.
|
259,574 | 11,467,979 | ||||||
|
Human Resource & Employment Services–1.34% |
||||||||
|
Robert Half International, Inc.
|
324,192 | 8,568,395 | ||||||
|
Industrial Gases–2.17% |
||||||||
|
Airgas, Inc.
|
200,698 | 13,838,127 | ||||||
|
Industrial Machinery–3.29% |
||||||||
|
Flowserve Corp.
|
94,194 | 8,730,842 | ||||||
|
Gardner Denver Inc.
|
158,391 | 12,248,376 | ||||||
| 20,979,218 | ||||||||
|
Internet Retail–1.20% |
||||||||
|
Shutterfly,
Inc.(b)
|
184,352 | 7,681,948 | ||||||
|
Internet Software & Services–1.25% |
||||||||
|
Equinix,
Inc.(b)
|
83,041 | 7,972,766 | ||||||
| Shares | Value | |||||||
|
IT Consulting & Other Services–2.35% |
||||||||
|
Cognizant Technology Solutions
Corp.–Class A(b)
|
121,672 | $ | 8,851,638 | |||||
|
Gartner,
Inc.(b)
|
159,440 | 6,141,629 | ||||||
| 14,993,267 | ||||||||
|
Life Sciences Tools & Services–0.29% |
||||||||
|
Illumina,
Inc.(b)
|
60,750 | 1,860,165 | ||||||
|
Managed Health Care–3.54% |
||||||||
|
Aetna Inc.
|
338,339 | 13,452,359 | ||||||
|
Aveta, Inc.
(Acquired 12/21/05-02/21/06,
Cost $13,947,028)(b)(d)
|
1,014,837 | 9,133,533 | ||||||
| 22,585,892 | ||||||||
|
Movies & Entertainment–1.38% |
||||||||
|
Cinemark Holdings, Inc.
|
426,577 | 8,817,347 | ||||||
|
Oil & Gas Drilling–1.06% |
||||||||
|
Patterson-UTI Energy, Inc.
|
333,158 | 6,769,771 | ||||||
|
Oil & Gas Equipment & Services–4.66% |
||||||||
|
Cameron International
Corp.(b)
|
299,873 | 14,735,759 | ||||||
|
Complete Production Services,
Inc.(b)
|
119,171 | 3,908,809 | ||||||
|
Key Energy Services,
Inc.(b)
|
346,942 | 4,485,960 | ||||||
|
Weatherford International
Ltd.(b)
|
426,662 | 6,613,261 | ||||||
| 29,743,789 | ||||||||
|
Oil & Gas Exploration & Production–3.51% |
||||||||
|
Cabot Oil & Gas Corp.
|
147,771 | 11,484,762 | ||||||
|
Whiting Petroleum
Corp.(b)
|
234,519 | 10,916,860 | ||||||
| 22,401,622 | ||||||||
|
Packaged Foods & Meats–2.36% |
||||||||
|
Green Mountain Coffee Roasters,
Inc.(b)
|
108,953 | 7,084,124 | ||||||
|
H.J. Heinz Co.
|
148,755 | 7,949,467 | ||||||
| 15,033,591 | ||||||||
|
Railroads–2.20% |
||||||||
|
Kansas City
Southern(b)
|
222,152 | 14,033,342 | ||||||
|
Restaurants–1.53% |
||||||||
|
Panera Bread
Co.–Class A(b)
|
72,960 | 9,754,022 | ||||||
|
Semiconductor Equipment–2.96% |
||||||||
|
KLA-Tencor Corp.
|
201,186 | 9,473,849 | ||||||
|
Lam Research
Corp.(b)
|
218,515 | 9,393,960 | ||||||
| 18,867,809 | ||||||||
|
Semiconductors–2.72% |
||||||||
|
Avago Technologies Ltd. (Singapore)
|
240,650 | 8,126,750 | ||||||
|
Linear Technology Corp.
|
285,809 | 9,234,489 | ||||||
| 17,361,239 | ||||||||
|
Specialized Consumer Services–0.54% |
||||||||
|
Coinstar,
Inc.(b)(c)
|
71,810 | 3,428,209 | ||||||
|
Specialty Chemicals–2.43% |
||||||||
|
Albemarle Corp.
|
168,169 | 8,961,726 | ||||||
|
LyondellBasell Industries N.V.–Class A (Netherlands)
|
198,305 | 6,516,302 | ||||||
| 15,478,028 | ||||||||
|
Specialty Stores–5.24% |
||||||||
|
Dick’s Sporting Goods,
Inc.(b)
|
295,369 | 11,545,974 | ||||||
|
PetSmart, Inc.
|
233,351 | 10,955,829 | ||||||
|
Ulta Salon, Cosmetics & Fragrance,
Inc.(b)
|
162,374 | 10,926,147 | ||||||
| 33,427,950 | ||||||||
|
Systems Software–1.02% |
||||||||
|
Check Point Software Technologies Ltd.
(Israel)(b)
|
113,050 | 6,515,071 | ||||||
|
Technology Distributors–1.09% |
||||||||
|
Avnet,
Inc.(b)
|
228,303 | 6,919,864 | ||||||
|
Trucking–1.51% |
||||||||
|
J.B. Hunt Transport Services, Inc.
|
227,117 | 9,609,320 | ||||||
|
Wireless Telecommunication Services–2.96% |
||||||||
|
NII Holdings
Inc.(b)
|
309,780 | 7,289,124 | ||||||
|
SBA Communications
Corp.–Class A(b)
|
304,736 | 11,607,394 | ||||||
| 18,896,518 | ||||||||
|
Total Common Stocks & Other Equity Interests
(Cost $561,736,897)
|
621,700,934 | |||||||
|
Money Market Funds–3.11% |
||||||||
|
Liquid Assets Portfolio–Institutional
Class(e)
|
9,908,928 | 9,908,928 | ||||||
|
Premier Portfolio–Institutional
Class(e)
|
9,908,928 | 9,908,928 | ||||||
|
Total Money Market Funds (Cost $19,817,856)
|
19,817,856 | |||||||
|
TOTAL INVESTMENTS (excluding investments purchased with cash
collateral from securities on loan)–100.59%
(Cost $581,554,753)
|
641,518,790 | |||||||
|
Investments Purchased with Cash Collateral from Securities on Loan |
||||||||
|
Money Market Funds–0.98% |
||||||||
|
Liquid Assets Portfolio–Institutional Class
(Cost $6,272,039)(e)(f)
|
6,272,039 | 6,272,039 | ||||||
|
TOTAL INVESTMENTS–101.57% (Cost $587,826,792)
|
647,790,829 | |||||||
|
OTHER ASSETS LESS LIABILITIES–(1.57)%
|
(10,045,295 | ) | ||||||
|
NET ASSETS–100.00%
|
$ | 637,745,534 | ||||||
| (a) | Industry and/or sector classifications used in this report are generally according to the Global Industry Classification Standard, which was developed by and is the exclusive property and a service mark of MSCI Inc. and Standard & Poor’s. | |
| (b) | Non-income producing security. | |
| (c) | All or a portion of this security was out on loan at October 31, 2011. | |
| (d) | Security purchased or received in a transaction exempt from registration under the Securities Act of 1933, as amended. The security may be resold pursuant to an exemption from registration under the 1933 Act, typically to qualified institutional buyers. The value of this security at October 31, 2011 represented 1.43% of the Fund’s Net Assets. | |
| (e) | The money market fund and the Fund are affiliated by having the same investment adviser. | |
| (f) | The security has been segregated to satisfy the commitment to return the cash collateral received in securities lending transactions upon the borrower’s return of the securities loaned. See Note 1I. |
|
Assets: |
||||
|
Investments, at value (Cost $561,736,897)*
|
$ | 621,700,934 | ||
|
Investments in affiliated money market funds, at value and cost
|
26,089,895 | |||
|
Total investments, at value (Cost $587,826,792)
|
647,790,829 | |||
|
Receivable for:
|
||||
|
Investments sold
|
4,701,283 | |||
|
Fund shares sold
|
305,567 | |||
|
Dividends
|
33,319 | |||
|
Investment for trustee deferred compensation and retirement plans
|
64,941 | |||
|
Other assets
|
26,294 | |||
|
Total assets
|
652,922,233 | |||
|
Liabilities: |
||||
|
Payable for:
|
||||
|
Investments purchased
|
6,426,253 | |||
|
Fund shares reacquired
|
1,584,590 | |||
|
Collateral upon return of securities loaned
|
6,272,039 | |||
|
Accrued fees to affiliates
|
566,607 | |||
|
Accrued other operating expenses
|
119,309 | |||
|
Trustee deferred compensation and retirement plans
|
207,901 | |||
|
Total liabilities
|
15,176,699 | |||
|
Net assets applicable to shares outstanding
|
$ | 637,745,534 | ||
|
Net assets consist of: |
||||
|
Shares of beneficial interest
|
$ | 726,375,591 | ||
|
Undistributed net investment income (loss)
|
(199,629 | ) | ||
|
Undistributed net realized gain (loss)
|
(148,394,465 | ) | ||
|
Unrealized appreciation
|
59,964,037 | |||
| $ | 637,745,534 | |||
|
Net Assets: |
||||
|
Class A
|
$ | 464,067,085 | ||
|
Class B
|
$ | 33,335,249 | ||
|
Class C
|
$ | 52,724,956 | ||
|
Class R
|
$ | 28,768,567 | ||
|
Class Y
|
$ | 6,581,450 | ||
|
Investor Class
|
$ | 9,214,052 | ||
|
Institutional Class
|
$ | 43,054,175 | ||
|
Shares outstanding, $0.001 par value per share, with an unlimited number of shares authorized: |
||||
|
Class A
|
29,653,800 | |||
|
Class B
|
2,483,927 | |||
|
Class C
|
3,934,147 | |||
|
Class R
|
1,884,906 | |||
|
Class Y
|
417,377 | |||
|
Investor Class
|
588,361 | |||
|
Institutional Class
|
2,587,864 | |||
|
Class A:
|
||||
|
Net asset value per share
|
$ | 15.65 | ||
|
Maximum offering price per share
(Net asset value of $15.65 divided by 94.50%) |
$ | 16.56 | ||
|
Class B:
|
||||
|
Net asset value and offering price per share
|
$ | 13.42 | ||
|
Class C:
|
||||
|
Net asset value and offering price per share
|
$ | 13.40 | ||
|
Class R:
|
||||
|
Net asset value and offering price per share
|
$ | 15.26 | ||
|
Class Y:
|
||||
|
Net asset value and offering price per share
|
$ | 15.77 | ||
|
Investor Class:
|
||||
|
Net asset value and offering price per share
|
$ | 15.66 | ||
|
Institutional Class:
|
||||
|
Net asset value and offering price per share
|
$ | 16.64 | ||
| * | At October 31, 2011, securities with an aggregate value of $6,004,751 were on loan to brokers. |
|
Investment income: |
||||
|
Dividends (net of foreign withholding taxes of $10,822)
|
$ | 7,234,249 | ||
|
Dividends from affiliated money market funds (includes
securities lending income of $48,189)
|
61,925 | |||
|
Total investment income
|
7,296,174 | |||
|
Expenses: |
||||
|
Advisory fees
|
5,354,380 | |||
|
Administrative services fees
|
240,941 | |||
|
Custodian fees
|
37,488 | |||
|
Distribution fees:
|
||||
|
Class A
|
1,429,312 | |||
|
Class B
|
434,217 | |||
|
Class C
|
609,673 | |||
|
Class R
|
198,848 | |||
|
Investor Class
|
26,586 | |||
|
Transfer agent fees — A, B, C, R, Y and Investor
|
2,030,551 | |||
|
Transfer agent fees — Institutional
|
53,031 | |||
|
Trustees’ and officers’ fees and benefits
|
41,463 | |||
|
Other
|
244,650 | |||
|
Total expenses
|
10,701,140 | |||
|
Less: Fees waived, expenses reimbursed and expense offset
arrangement(s)
|
(28,116 | ) | ||
|
Net expenses
|
10,673,024 | |||
|
Net investment income (loss)
|
(3,376,850 | ) | ||
|
Realized and unrealized gain (loss) from: |
||||
|
Net realized gain from:
|
||||
|
Investment securities (includes net gains from securities sold
to affiliates of $5,820,739)
|
155,325,965 | |||
|
Foreign currencies
|
152 | |||
| 155,326,117 | ||||
|
Change in net unrealized appreciation (depreciation) of:
|
||||
|
Investment securities
|
(116,343,756 | ) | ||
|
Foreign currencies
|
(116 | ) | ||
| (116,343,872 | ) | |||
|
Net realized and unrealized gain
|
38,982,245 | |||
|
Net increase in net assets resulting from operations
|
$ | 35,605,395 | ||
| 2011 | 2010 | |||||||
|
Operations: |
||||||||
|
Net investment income (loss)
|
$ | (3,376,850 | ) | $ | (4,772,401 | ) | ||
|
Net realized gain
|
155,326,117 | 140,613,813 | ||||||
|
Change in net unrealized appreciation (depreciation)
|
(116,343,872 | ) | 35,925,411 | |||||
|
Net increase in net assets resulting from operations
|
35,605,395 | 171,766,823 | ||||||
|
Share transactions–net: |
||||||||
|
Class A
|
(145,861,107 | ) | (183,872,881 | ) | ||||
|
Class B
|
(16,993,121 | ) | (19,838,802 | ) | ||||
|
Class C
|
(10,870,971 | ) | (11,804,760 | ) | ||||
|
Class R
|
(20,557,049 | ) | (12,282,714 | ) | ||||
|
Class Y
|
(979,872 | ) | 269,939 | |||||
|
Investor Class
|
(1,597,133 | ) | (765,422 | ) | ||||
|
Institutional Class
|
(24,581,195 | ) | (46,124,103 | ) | ||||
|
Net increase (decrease) in net assets resulting from share
transactions
|
(221,440,448 | ) | (274,418,743 | ) | ||||
|
Net increase (decrease) in net assets
|
(185,835,053 | ) | (102,651,920 | ) | ||||
|
Net assets: |
||||||||
|
Beginning of year
|
823,580,587 | 926,232,507 | ||||||
|
End of year (includes undistributed net investment income (loss)
of $(199,629) and $(189,704), respectively)
|
$ | 637,745,534 | $ | 823,580,587 | ||||
| A. | Security Valuations — Securities, including restricted securities, are valued according to the following policy. | |
| A security listed or traded on an exchange (except convertible bonds) is valued at its last sales price or official closing price as of the close of the customary trading session on the exchange where the security is principally traded, or lacking any sales or official closing price on a particular day, the security may be valued at the closing bid price on that day. Securities traded in the over-the-counter market are valued based on prices furnished by independent pricing services or market makers. When such securities are valued by an independent pricing service they may be considered fair valued. Futures contracts are valued at the final settlement price set by an exchange on which they are principally traded. Listed options are valued at the mean between the last bid and ask prices from the exchange on which they are principally traded. Options not listed on an exchange are valued by an independent source at the mean between the last bid and ask prices. For purposes of determining net asset value per share, futures and option contracts generally are valued 15 minutes after the close of the customary trading session of the New York Stock Exchange (“NYSE”). |
| Investments in open-end and closed-end registered investment companies that do not trade on an exchange are valued at the end of day net asset value per share. Investments in open-end and closed-end registered investment companies that trade on an exchange are valued at the last sales price or official closing price as of the close of the customary trading session on the exchange where the security is principally traded. | ||
| Debt obligations (including convertible bonds) and unlisted equities are fair valued using an evaluated quote provided by an independent pricing service. Evaluated quotes provided by the pricing service may be determined without exclusive reliance on quoted prices, and may reflect appropriate factors such as institution-size trading in similar groups of securities, developments related to specific securities, dividend rate, yield, quality, type of issue, coupon rate, maturity, individual trading characteristics and other market data. Debt securities are subject to interest rate and credit risks. In addition, all debt securities involve some risk of default with respect to interest and/or principal payments. | ||
| Foreign securities (including foreign exchange contracts) are converted into U.S. dollar amounts using the applicable exchange rates as of the close of the NYSE. If market quotations are available and reliable for foreign exchange traded equity securities, the securities will be valued at the market quotations. Because trading hours for certain foreign securities end before the close of the NYSE, closing market quotations may become unreliable. If between the time trading ends on a particular security and the close of the customary trading session on the NYSE, events occur that are significant and make the closing price unreliable, the Fund may fair value the security. If the event is likely to have affected the closing price of the security, the security will be valued at fair value in good faith using procedures approved by the Board of Trustees. Adjustments to closing prices to reflect fair value may also be based on a screening process of an independent pricing service to indicate the degree of certainty, based on historical data, that the closing price in the principal market where a foreign security trade is not the current value as of the close of the NYSE. Foreign securities meeting the approved degree of certainty that the price is not reflective of current value will be priced at the indication of fair value from the independent pricing service. Multiple factors may be considered by the independent pricing service in determining adjustments to reflect fair value and may include information relating to sector indices, American Depositary Receipts and domestic and foreign index futures. Foreign securities may have additional risks including exchange rate changes, potential for sharply devalued currencies and high inflation, political and economical upheaval, the relative lack of issuer information, relatively low market liquidity and the potential lack of strict financial and accounting controls and standards. | ||
| Securities for which market prices are not provided by any of the above methods may be valued based upon quotes furnished by independent sources. The last bid price may be used to value equity securities. The mean between the last bid and asked prices is used to value debt obligations, including Corporate Loans. | ||
| Securities for which market quotations are not readily available or are unreliable are valued at fair value as determined in good faith by or under the supervision of the Trust’s officers following procedures approved by the Board of Trustees. Issuer specific events, market trends, bid/ask quotes of brokers and information providers and other market data may be reviewed in the course of making a good faith determination of a security’s fair value. | ||
| Valuations change in response to many factors including the historical and prospective earnings of the issuer, the value of the issuer’s assets, general economic conditions, interest rates, investor perceptions and market liquidity. Because of the inherent uncertainties of valuation, the values reflected in the financial statements may materially differ from the value received upon actual sale of those investments. | ||
| B. | Securities Transactions and Investment Income — Securities transactions are accounted for on a trade date basis. Realized gains or losses on sales are computed on the basis of specific identification of the securities sold. Interest income is recorded on the accrual basis from settlement date. Dividend income (net of withholding tax, if any) is recorded on the ex-dividend date. | |
| The Fund may periodically participate in litigation related to Fund investments. As such, the Fund may receive proceeds from litigation settlements. Any proceeds received are included in the Statement of Operations as realized gain (loss) for investments no longer held and as unrealized gain (loss) for investments still held. | ||
| Brokerage commissions and mark ups are considered transaction costs and are recorded as an increase to the cost basis of securities purchased and/or a reduction of proceeds on a sale of securities. Such transaction costs are included in the determination of net realized and unrealized gain (loss) from investment securities reported in the Statement of Operations and the Statement of Changes in Net Assets and the net realized and unrealized gains (losses) on securities per share in the Financial Highlights. Transaction costs are included in the calculation of the Fund’s net asset value and, accordingly, they reduce the Fund’s total returns. These transaction costs are not considered operating expenses and are not reflected in net investment income reported in the Statement of Operations and Statement of Changes in Net Assets, or the net investment income per share and ratios of expenses and net investment income reported in the Financial Highlights, nor are they limited by any expense limitation arrangements between the Fund and the investment adviser. | ||
| The Fund allocates income and realized and unrealized capital gains and losses to a class based on the relative net assets of each class. | ||
| C. | Country Determination — For the purposes of making investment selection decisions and presentation in the Schedule of Investments, the investment adviser may determine the country in which an issuer is located and/or credit risk exposure based on various factors. These factors include the laws of the country under which the issuer is organized, where the issuer maintains a principal office, the country in which the issuer derives 50% or more of its total revenues and the country that has the primary market for the issuer’s securities, as well as other criteria. Among the other criteria that may be evaluated for making this determination are the country in which the issuer maintains 50% or more of its assets, the type of security, financial guarantees and enhancements, the nature of the collateral and the sponsor organization. Country of issuer and/or credit risk exposure has been determined to be the United States of America, unless otherwise noted. | |
| D. | Distributions — Distributions from income and net realized capital gain, if any, are generally paid annually and recorded on ex-dividend date. The Fund may elect to treat a portion of the proceeds from redemptions as distributions for federal income tax purposes. | |
| E. | Federal Income Taxes — The Fund intends to comply with the requirements of Subchapter M of the Internal Revenue Code necessary to qualify as a regulated investment company and to distribute substantially all of the Fund’s taxable earnings to shareholders. As such, the Fund will not be subject to federal income taxes on otherwise taxable income (including net realized capital gain) that is distributed to shareholders. Therefore, no provision for federal income taxes is recorded in the financial statements. | |
| The Fund files tax returns in the U.S. Federal jurisdiction and certain other jurisdictions. Generally, the Fund is subject to examinations by such taxing authorities for up to three years after the filing of the return for the tax period. |
| F. | Expenses — Fees provided for under the Rule 12b-1 plan of a particular class of the Fund are charged to the operations of such class. Transfer agency fees and expenses and other shareholder recordkeeping fees and expenses attributable to the Institutional Class are charged to such class. Transfer agency fees and expenses and other shareholder recordkeeping fees and expenses relating to all other classes are allocated among those classes based on relative net assets. All other expenses are allocated among the classes based on relative net assets. | |
| G. | Accounting Estimates — The preparation of financial statements in conformity with accounting principles generally accepted in the United States of America (“GAAP”) requires management to make estimates and assumptions that affect the reported amounts of assets and liabilities at the date of the financial statements and the reported amounts of revenues and expenses during the reporting period including estimates and assumptions related to taxation. Actual results could differ from those estimates by a significant amount. In addition, the Fund monitors for material events or transactions that may occur or become known after the period-end date and before the date the financial statements are released to print. | |
| H. | Indemnifications — Under the Trust’s organizational documents, each Trustee, officer, employee or other agent of the Trust is indemnified against certain liabilities that may arise out of performance of their duties to the Fund. Additionally, in the normal course of business, the Fund enters into contracts, including the Fund’s servicing agreements that contain a variety of indemnification clauses. The Fund’s maximum exposure under these arrangements is unknown as this would involve future claims that may be made against the Fund that have not yet occurred. The risk of material loss as a result of such indemnification claims is considered remote. | |
| I. | Securities Lending — The Fund may lend portfolio securities having a market value up to one-third of the Fund’s total assets. Such loans are secured by collateral equal to no less than the market value of the loaned securities determined daily by the securities lending provider. Such collateral will be cash or debt securities issued or guaranteed by the U.S. Government or any of its sponsored agencies. Cash collateral received in connection with these loans is invested in short-term money market instruments or affiliated money market funds and is shown as such on the Schedule of Investments. It is the Fund’s policy to obtain additional collateral from or return excess collateral to the borrower by the end of the next business day, following the valuation date of the securities loaned. Therefore, the value of the collateral held may be temporarily less than the value of the securities on loan. Lending securities entails a risk of loss to the Fund if and to the extent that the market value of the securities loaned were to increase and the borrower did not increase the collateral accordingly, and the borrower fails to return the securities. Upon the failure of the borrower to return the securities, collateral may be liquidated and the securities may be purchased on the open market to replace the loaned securities. The Fund could experience delays and costs in gaining access to the collateral. The Fund bears the risk of any deficiency in the amount of the collateral available for return to the borrower due to any loss on the collateral invested. Dividends received on cash collateral investments for securities lending transactions, which are net of compensation to counterparties, is included in Dividends from affiliates on the Statement of Operations. The aggregate value of securities out on loan is shown as a footnote on the Statement of Assets and Liabilities, if any. | |
| J. | Foreign Currency Translations — Foreign currency is valued at the close of the NYSE based on quotations posted by banks and major currency dealers. Portfolio securities and other assets and liabilities denominated in foreign currencies are translated into U.S. dollar amounts at date of valuation. Purchases and sales of portfolio securities (net of foreign taxes withheld on disposition) and income items denominated in foreign currencies are translated into U.S. dollar amounts on the respective dates of such transactions. The Fund does not separately account for the portion of the results of operations resulting from changes in foreign exchange rates on investments and the fluctuations arising from changes in market prices of securities held. The combined results of changes in foreign exchange rates and the fluctuation of market prices on investments (net of estimated foreign tax withholding) are included with the net realized and unrealized gain or loss from investments in the Statement of Operations. Reported net realized foreign currency gains or losses arise from (1) sales of foreign currencies, (2) currency gains or losses realized between the trade and settlement dates on securities transactions, and (3) the difference between the amounts of dividends, interest, and foreign withholding taxes recorded on the Fund’s books and the U.S. dollar equivalent of the amounts actually received or paid. Net unrealized foreign currency gains and losses arise from changes in the fair values of assets and liabilities, other than investments in securities at fiscal period end, resulting from changes in exchange rates. | |
| The Fund may invest in foreign securities which may be subject to foreign taxes on income, gains on investments or currency repatriation, a portion of which may be recoverable. | ||
| K. | Foreign Currency Contracts — The Fund may enter into foreign currency contracts to manage or minimize currency or exchange rate risk. The Fund may also enter into foreign currency contracts for the purchase or sale of a security denominated in a foreign currency in order to “lock in” the U.S. dollar price of that security. A foreign currency contract is an obligation to purchase or sell a specific currency for an agreed-upon price at a future date. The use of foreign currency contracts does not eliminate fluctuations in the price of the underlying securities the Fund owns or intends to acquire but establishes a rate of exchange in advance. Fluctuations in the value of these contracts are measured by the difference in the contract date and reporting date exchange rates and are recorded as unrealized appreciation (depreciation) until the contracts are closed. When the contracts are closed, realized gains (losses) are recorded. Realized and unrealized gains (losses) on the contracts are included in the Statement of Operations. The primary risks associated with foreign currency contracts include failure of the counterparty to meet the terms of the contract and the value of the foreign currency changing unfavorably. These risks may be in excess of the amounts reflected in the Statement of Assets and Liabilities. |
| Average Daily Net Assets | Rate | |||
|
First $350 million
|
0 | .75% | ||
|
Over $350 million
|
0 | .625% | ||
| Level 1 — | Prices are determined using quoted prices in an active market for identical assets. | |
| Level 2 — | Prices are determined using other significant observable inputs. Observable inputs are inputs that other market participants may use in pricing a security. These may include quoted prices for similar securities, interest rates, prepayment speeds, credit risk, yield curves, loss severities, default rates, discount rates, volatilities and others. | |
| Level 3 — | Prices are determined using significant unobservable inputs. In situations where quoted prices or observable inputs are unavailable (for example, when there is little or no market activity for an investment at the end of the period), unobservable inputs may be used. Unobservable inputs reflect the Fund’s own assumptions about the factors market participants would use in determining fair value of the securities or instruments and would be based on the best available information. |
| Level 1 | Level 2 | Level 3 | Total | |||||||||||||
|
Equity Securities
|
$ | 638,657,296 | $ | 9,133,533 | $ | — | $ | 647,790,829 | ||||||||
| 2011 | ||||
|
Net unrealized appreciation — investments
|
$ | 57,826,230 | ||
|
Temporary book/tax differences
|
(199,629 | ) | ||
|
Capital loss carryforward
|
(146,256,658 | ) | ||
|
Shares of beneficial interest
|
726,375,591 | |||
|
Total net assets
|
$ | 637,745,534 | ||
|
Capital Loss |
||||
| Expiration | Carryforward* | |||
|
October 31, 2017
|
$ | 146,256,658 | ||
| * | Capital loss carryforward as of the date listed above is reduced for limitations, if any, to the extent required by the Internal Revenue Code. |
| Unrealized Appreciation (Depreciation) of Investment Securities on a Tax Basis | ||||
|
Aggregate unrealized appreciation of investment securities
|
$ | 89,743,262 | ||
|
Aggregate unrealized (depreciation) of investment securities
|
(31,917,032 | ) | ||
|
Net unrealized appreciation of investment securities
|
$ | 57,826,230 | ||
| Cost of investments for tax purposes is $589,964,599. | ||||
| Summary of Share Activity | ||||||||||||||||
| Years ended October 31, | ||||||||||||||||
| 2011(a) | 2010 | |||||||||||||||
| Shares | Amount | Shares | Amount | |||||||||||||
|
Sold:
|
||||||||||||||||
|
Class A
|
2,453,549 | $ | 41,052,936 | 2,961,356 | $ | 41,345,095 | ||||||||||
|
Class B
|
92,148 | 1,314,867 | 298,915 | 3,619,133 | ||||||||||||
|
Class C
|
535,523 | 7,647,940 | 547,087 | 6,661,457 | ||||||||||||
|
Class R
|
921,475 | 14,680,173 | 1,104,325 | 15,108,465 | ||||||||||||
|
Class Y
|
148,600 | 2,419,695 | 198,608 | 2,862,998 | ||||||||||||
|
Investor Class
|
186,320 | 3,173,946 | 165,446 | 2,346,735 | ||||||||||||
|
Institutional Class
|
615,319 | 10,846,347 | 988,527 | 14,526,489 | ||||||||||||
|
Automatic conversion of Class B shares to Class A shares:
|
||||||||||||||||
|
Class A
|
566,870 | 9,571,662 | 887,648 | 12,482,157 | ||||||||||||
|
Class B
|
(658,507 | ) | (9,571,662 | ) | (1,023,716 | ) | (12,482,157 | ) | ||||||||
|
Reacquired:
|
||||||||||||||||
|
Class A
|
(12,188,350 | ) | (196,485,705 | ) | (17,188,729 | ) | (237,700,133 | ) | ||||||||
|
Class B
|
(620,084 | ) | (8,736,326 | ) | (909,497 | ) | (10,975,778 | ) | ||||||||
|
Class C
|
(1,305,976 | ) | (18,518,911 | ) | (1,531,657 | ) | (18,466,217 | ) | ||||||||
|
Class R
|
(2,171,639 | ) | (35,237,222 | ) | (1,994,256 | ) | (27,391,179 | ) | ||||||||
|
Class Y
|
(203,348 | ) | (3,399,567 | ) | (184,761 | ) | (2,593,059 | ) | ||||||||
|
Investor Class
|
(287,656 | ) | (4,771,079 | ) | (222,108 | ) | (3,112,157 | ) | ||||||||
|
Institutional Class
|
(2,056,352 | ) | (35,427,542 | ) | (4,141,708 | ) | (60,650,592 | ) | ||||||||
|
Net increase (decrease) in share activity
|
(13,972,108 | ) | $ | (221,440,448 | ) | (20,044,520 | ) | $ | (274,418,743 | ) | ||||||
| (a) | There are entities that are record owners of more than 5% of the outstanding shares of the Fund and in the aggregate own 26% of the outstanding shares of the Fund. IDI has an agreement with these entities to sell Fund shares. The Fund, Invesco and/or Invesco affiliates may make payments to these entities, which are considered to be related to the Fund, for providing services to the Fund, Invesco and/or Invesco affiliates including but not limited to services such as securities brokerage, distribution, third party record keeping and account servicing. The Fund has no knowledge as to whether all or any portion of the shares owned of record by these entities are also owned beneficially. |
|
Ratio of |
Ratio of |
|||||||||||||||||||||||||||||||||||||||||||||||
|
Net gains |
expenses |
expenses |
||||||||||||||||||||||||||||||||||||||||||||||
|
(losses) on |
to average |
to average net |
Ratio of net |
|||||||||||||||||||||||||||||||||||||||||||||
|
Net asset |
Net |
securities |
Distributions |
net assets |
assets without |
investment |
||||||||||||||||||||||||||||||||||||||||||
|
value, |
investment |
(both |
Total from |
from net |
Net asset |
Net assets, |
with fee
waivers |
fee waivers |
income (loss) |
|||||||||||||||||||||||||||||||||||||||
|
beginning |
income |
realized and |
investment |
realized |
value, end |
Total |
end of period |
and/or
expenses |
and/or
expenses |
to average |
Portfolio |
|||||||||||||||||||||||||||||||||||||
| of period | (loss)(a) | unrealized) | operations | gains | of period | return(b) | (000s omitted) | absorbed | absorbed | net assets | turnover(c) | |||||||||||||||||||||||||||||||||||||
| Class A | ||||||||||||||||||||||||||||||||||||||||||||||||
| Year ended 10/31/11 | $ | 15.10 | $ | (0.06 | ) | $ | 0.61 | $ | 0.55 | $ | — | $ | 15.65 | 3.64 | % | $ | 464,067 | 1.28 | %(d) | 1.28 | %(d) | (0.35 | )%(d) | 127 | % | |||||||||||||||||||||||
| Year ended 10/31/10 | 12.44 | (0.06 | ) | 2.72 | 2.66 | — | 15.10 | 21.38 | 586,166 | 1.31 | 1.31 | (0.47 | ) | 68 | ||||||||||||||||||||||||||||||||||
| Year ended 10/31/09 | 10.62 | (0.08 | ) | 1.90 | 1.82 | — | 12.44 | 17.14 | 649,013 | 1.44 | 1.44 | (0.72 | ) | 94 | ||||||||||||||||||||||||||||||||||
| Year ended 10/31/08 | 21.59 | (0.10 | ) | (8.85 | ) | (8.95 | ) | (2.02 | ) | 10.62 | (45.35 | ) | 664,270 | 1.25 | 1.26 | (0.59 | ) | 109 | ||||||||||||||||||||||||||||||
| Year ended 10/31/07 | 19.73 | (0.13 | ) | 3.99 | 3.86 | (2.00 | ) | 21.59 | 21.13 | 1,511,918 | 1.20 | 1.20 | (0.62 | ) | 99 | |||||||||||||||||||||||||||||||||
| Class B | ||||||||||||||||||||||||||||||||||||||||||||||||
| Year ended 10/31/11 | 13.04 | (0.16 | ) | 0.54 | 0.38 | — | 13.42 | 2.91 | 33,335 | 2.03 | (d) | 2.03 | (d) | (1.10 | )(d) | 127 | ||||||||||||||||||||||||||||||||
| Year ended 10/31/10 | 10.83 | (0.15 | ) | 2.36 | 2.21 | — | 13.04 | 20.41 | 47,880 | 2.06 | 2.06 | (1.22 | ) | 68 | ||||||||||||||||||||||||||||||||||
| Year ended 10/31/09 | 9.32 | (0.13 | ) | 1.64 | 1.51 | — | 10.83 | 16.20 | 57,452 | 2.19 | 2.19 | (1.47 | ) | 94 | ||||||||||||||||||||||||||||||||||
| Year ended 10/31/08 | 19.33 | (0.20 | ) | (7.79 | ) | (7.99 | ) | (2.02 | ) | 9.32 | (45.71 | ) | 74,231 | 2.00 | 2.01 | (1.34 | ) | 109 | ||||||||||||||||||||||||||||||
| Year ended 10/31/07 | 17.98 | (0.25 | ) | 3.60 | 3.35 | (2.00 | ) | 19.33 | 20.27 | 213,235 | 1.95 | 1.95 | (1.37 | ) | 99 | |||||||||||||||||||||||||||||||||
| Class C | ||||||||||||||||||||||||||||||||||||||||||||||||
| Year ended 10/31/11 | 13.03 | (0.16 | ) | 0.53 | 0.37 | — | 13.40 | 2.84 | 52,725 | 2.03 | (d) | 2.03 | (d) | (1.10 | )(d) | 127 | ||||||||||||||||||||||||||||||||
| Year ended 10/31/10 | 10.82 | (0.15 | ) | 2.36 | 2.21 | — | 13.03 | 20.43 | 61,286 | 2.06 | 2.06 | (1.22 | ) | 68 | ||||||||||||||||||||||||||||||||||
| Year ended 10/31/09 | 9.30 | (0.14 | ) | 1.66 | 1.52 | — | 10.82 | 16.34 | 61,531 | 2.19 | 2.19 | (1.47 | ) | 94 | ||||||||||||||||||||||||||||||||||
| Year ended 10/31/08 | 19.30 | (0.19 | ) | (7.79 | ) | (7.98 | ) | (2.02 | ) | 9.30 | (45.74 | ) | 64,620 | 2.00 | 2.01 | (1.34 | ) | 109 | ||||||||||||||||||||||||||||||
| Year ended 10/31/07 | 17.96 | (0.25 | ) | 3.59 | 3.34 | (2.00 | ) | 19.30 | 20.23 | 151,259 | 1.95 | 1.95 | (1.37 | ) | 99 | |||||||||||||||||||||||||||||||||
| Class R | ||||||||||||||||||||||||||||||||||||||||||||||||
| Year ended 10/31/11 | 14.76 | (0.10 | ) | 0.60 | 0.50 | — | 15.26 | 3.39 | 28,769 | 1.53 | (d) | 1.53 | (d) | (0.60 | )(d) | 127 | ||||||||||||||||||||||||||||||||
| Year ended 10/31/10 | 12.19 | (0.10 | ) | 2.67 | 2.57 | — | 14.76 | 21.08 | 46,272 | 1.56 | 1.56 | (0.72 | ) | 68 | ||||||||||||||||||||||||||||||||||
| Year ended 10/31/09 | 10.44 | (0.10 | ) | 1.85 | 1.75 | — | 12.19 | 16.76 | 49,083 | 1.69 | 1.69 | (0.97 | ) | 94 | ||||||||||||||||||||||||||||||||||
| Year ended 10/31/08 | 21.30 | (0.14 | ) | (8.70 | ) | (8.84 | ) | (2.02 | ) | 10.44 | (45.46 | ) | 48,027 | 1.50 | 1.51 | (0.84 | ) | 109 | ||||||||||||||||||||||||||||||
| Year ended 10/31/07 | 19.53 | (0.18 | ) | 3.95 | 3.77 | (2.00 | ) | 21.30 | 20.86 | 79,655 | 1.45 | 1.45 | (0.87 | ) | 99 | |||||||||||||||||||||||||||||||||
| Class Y | ||||||||||||||||||||||||||||||||||||||||||||||||
| Year ended 10/31/11 | 15.18 | (0.02 | ) | 0.61 | 0.59 | — | 15.77 | 3.89 | 6,581 | 1.03 | (d) | 1.03 | (d) | (0.10 | )(d) | 127 | ||||||||||||||||||||||||||||||||
| Year ended 10/31/10 | 12.47 | (0.03 | ) | 2.74 | 2.71 | — | 15.18 | 21.73 | 7,165 | 1.06 | 1.06 | (0.22 | ) | 68 | ||||||||||||||||||||||||||||||||||
| Year ended 10/31/09 | 10.63 | (0.05 | ) | 1.89 | 1.84 | — | 12.47 | 17.31 | 5,717 | 1.19 | 1.19 | (0.47 | ) | 94 | ||||||||||||||||||||||||||||||||||
| Year ended 10/31/08(e) | 12.21 | (0.00 | ) | (1.58 | ) | (1.58 | ) | — | 10.63 | (12.94 | ) | 2,595 | 1.06 | (f) | 1.07 | (f) | (0.40 | )(f) | 109 | |||||||||||||||||||||||||||||
| Investor Class | ||||||||||||||||||||||||||||||||||||||||||||||||
| Year ended 10/31/11 | 15.11 | (0.06 | ) | 0.61 | 0.55 | — | 15.66 | 3.64 | 9,214 | 1.28 | (d) | 1.28 | (d) | (0.35 | )(d) | 127 | ||||||||||||||||||||||||||||||||
| Year ended 10/31/10 | 12.45 | (0.06 | ) | 2.72 | 2.66 | — | 15.11 | 21.37 | 10,420 | 1.31 | 1.31 | (0.47 | ) | 68 | ||||||||||||||||||||||||||||||||||
| Year ended 10/31/09 | 10.64 | (0.08 | ) | 1.89 | 1.81 | — | 12.45 | 17.01 | 9,292 | 1.44 | 1.44 | (0.72 | ) | 94 | ||||||||||||||||||||||||||||||||||
| Year ended 10/31/08 | 21.60 | (0.10 | ) | (8.84 | ) | (8.94 | ) | (2.02 | ) | 10.64 | (45.27 | ) | 6,261 | 1.25 | 1.26 | (0.59 | ) | 109 | ||||||||||||||||||||||||||||||
| Year ended 10/31/07 | 19.74 | (0.13 | ) | 3.99 | 3.86 | (2.00 | ) | 21.60 | 21.12 | 12,237 | 1.20 | 1.20 | (0.62 | ) | 99 | |||||||||||||||||||||||||||||||||
| Institutional Class | ||||||||||||||||||||||||||||||||||||||||||||||||
| Year ended 10/31/11 | 15.98 | 0.01 | 0.65 | 0.66 | — | 16.64 | 4.13 | 43,054 | 0.85 | (d) | 0.85 | (d) | 0.08 | (d) | 127 | |||||||||||||||||||||||||||||||||
| Year ended 10/31/10 | 13.11 | 0.00 | 2.87 | 2.87 | — | 15.98 | 21.89 | 64,392 | 0.84 | 0.84 | 0.01 | 68 | ||||||||||||||||||||||||||||||||||||
| Year ended 10/31/09 | 11.13 | (0.02 | ) | 2.00 | 1.98 | — | 13.11 | 17.79 | 94,145 | 0.88 | 0.88 | (0.16 | ) | 94 | ||||||||||||||||||||||||||||||||||
| Year ended 10/31/08 | 22.42 | (0.03 | ) | (9.24 | ) | (9.27 | ) | (2.02 | ) | 11.13 | (45.07 | ) | 87,467 | 0.80 | 0.81 | (0.14 | ) | 109 | ||||||||||||||||||||||||||||||
| Year ended 10/31/07 | 20.33 | (0.04 | ) | 4.13 | 4.09 | (2.00 | ) | 22.42 | 21.68 | 133,433 | 0.75 | 0.75 | (0.17 | ) | 99 | |||||||||||||||||||||||||||||||||
| (a) | Calculated using average shares outstanding. | |
| (b) | Includes adjustments in accordance with accounting principles generally accepted in the United States of America and as such, the net asset value for financial reporting purposes and the returns based upon those net asset values may differ from the net asset value and returns for shareholder transactions. Does not include sales charges and is not annualized for periods less than one year, if applicable. | |
| (c) | Portfolio turnover is calculated at the fund level and is not annualized for periods less than one year, if applicable. | |
| (d) | Ratios are based on average daily net assets (000’s omitted) of $571,725, $43,422, $60,967, $39,770, $7,128, $10,635 and $53,055 for Class A, Class B, Class C, Class R, Class Y, Investor Class and Institutional Class shares, respectively. | |
| (e) | Commencement date of October 3, 2008. | |
| (f) | Annualized. |
and Shareholders of Invesco Capital Development Fund:
|
HYPOTHETICAL |
||||||||||||||||||||||||||||||
| ACTUAL | (5% annual return before expenses) | |||||||||||||||||||||||||||||
|
Beginning |
Ending |
Expenses |
Ending |
Expenses |
Annualized |
|||||||||||||||||||||||||
|
Account Value |
Account Value |
Paid During |
Account Value |
Paid During |
Expense |
|||||||||||||||||||||||||
| Class | (05/01/11) | (10/31/11)1 | Period2 | (10/31/11) | Period2 | Ratio | ||||||||||||||||||||||||
|
A
|
$ | 1,000.00 | $ | 845.50 | $ | 6.08 | $ | 1,018.61 | $ | 6.65 | 1.31 | % | ||||||||||||||||||
|
B
|
1,000.00 | 842.40 | 9.56 | 1,014.83 | 10.45 | 2.06 | ||||||||||||||||||||||||
|
C
|
1,000.00 | 842.20 | 9.56 | 1,014.83 | 10.45 | 2.06 | ||||||||||||||||||||||||
|
R
|
1,000.00 | 844.50 | 7.25 | 1,017.34 | 7.93 | 1.56 | ||||||||||||||||||||||||
|
Y
|
1,000.00 | 846.90 | 4.92 | 1,019.87 | 5.39 | 1.06 | ||||||||||||||||||||||||
|
Investor
|
1,000.00 | 845.60 | 6.09 | 1,018.60 | 6.67 | 1.31 | ||||||||||||||||||||||||
|
Institutional
|
1,000.00 | 847.70 | 4.10 | 1,020.77 | 4.48 | 0.88 | ||||||||||||||||||||||||
| 1 | The actual ending account value is based on the actual total return of the Fund for the period May 1, 2011 through October 31, 2011, after actual expenses and will differ from the hypothetical ending account value which is based on the Fund’s expense ratio and a hypothetical annual return of 5% before expenses. |
| 2 | Expenses are equal to the Fund’s annualized expense ratio as indicated above multiplied by the average account value over the period, multiplied by 184/365 to reflect the most recent fiscal half year. |
| Approval of Investment Advisory and Sub-Advisory Contracts |
| A. | Nature, Extent and Quality of Services Provided by Invesco Advisers and the Affiliated Sub-Advisers |
| B. | Fund Performance |
| C. | Advisory and Sub-Advisory Fees and Fee Waivers |
| D. | Economies of Scale and Breakpoints |
| E. | Profitability and Financial Resources |
| F. | Collateral Benefits to Invesco Advisers and its Affiliates |
|
Number of |
||||||||
|
Funds in |
||||||||
|
Fund Complex |
||||||||
|
Name, Year of
Birth and |
Trustee
and/ |
Principal
Occupation(s) |
Overseen by |
Other
Directorship(s) |
||||
| Position(s) Held with the Trust | or Officer Since | During Past 5 Years | Trustee | Held by Trustee | ||||
|
Interested
Persons
|
||||||||
|
Martin L.
Flanagan1 —
1960
Trustee |
2007 | Executive Director, Chief Executive Officer and President, Invesco Ltd. (ultimate parent of Invesco and a global investment management firm); Advisor to the Board, Invesco Advisers, Inc. (formerly known as Invesco Institutional (N.A.), Inc.); Trustee, The Invesco Funds; Vice Chair, Investment Company Institute; and Member of Executive Board, SMU Cox School of Business | 141 | None | ||||
| Formerly: Chairman, Invesco Advisers, Inc. (registered investment adviser); Director, Chairman, Chief Executive Officer and President, IVZ Inc. (holding company), INVESCO Group Services, Inc. (service provider) and Invesco North American Holdings, Inc. (holding company); Director, Chief Executive Officer and President, Invesco Holding Company Limited (parent of Invesco and a global investment management firm); Director, Invesco Ltd.; Chairman, Investment Company Institute and President, Co-Chief Executive Officer, Co-President, Chief Operating Officer and Chief Financial Officer, Franklin Resources, Inc. (global investment management organization) | ||||||||
|
Philip A.
Taylor2 —
1954
Trustee, President and Principal Executive Officer |
2006 | Head of North American Retail and Senior Managing Director, Invesco Ltd.; Director, Co-Chairman, Co-President and Co-Chief Executive Officer, Invesco Advisers, Inc. (formerly known as Invesco Institutional (N.A.), Inc.) (registered investment adviser); Director, Chairman, Chief Executive Officer and President, Invesco Management Group, Inc. (formerly Invesco Aim Management Group, Inc.) (financial services holding company); Director and President, INVESCO Funds Group, Inc. (registered investment adviser and registered transfer agent); Director and Chairman, Invesco Investment Services, Inc. (formerly known as Invesco Aim Investment Services, Inc.) (registered transfer agent) and IVZ Distributors, Inc. (formerly known as INVESCO Distributors, Inc.) (registered broker dealer); Director, President and Chairman, Invesco Inc. (holding company) and Invesco Canada Holdings Inc. (holding company); Chief Executive Officer, Invesco Corporate Class Inc. (corporate mutual fund company) and Invesco Canada Fund Inc. (corporate mutual fund company); Director, Chairman and Chief Executive Officer, Invesco Canada Ltd. (formerly known as Invesco Trimark Ltd./Invesco Trimark Ltèe) (registered investment adviser and registered transfer agent); Trustee, President and Principal Executive Officer, The Invesco Funds (other than AIM Treasurer’s Series Trust (Invesco Treasurer’s Series Trust) and Short-Term Investments Trust); Trustee and Executive Vice President, The Invesco Funds (AIM Treasurer’s Series Trust (Invesco Treasurer’s Series Trust) and Short-Term Investments Trust only); Director, Invesco Investment Advisers LLC (formerly known as Van Kampen Asset Management); Director, Chief Executive Officer and President, Van Kampen Exchange Corp. | 141 | None | ||||
| Formerly: Director and Chairman, Van Kampen Investor Services Inc.: | ||||||||
| Director, Chief Executive Officer and President, 1371 Preferred Inc. (holding company); and Van Kampen Investments Inc.; Director and President, AIM GP Canada Inc. (general partner for limited partnerships); and Van Kampen Advisors, Inc.; Director and Chief Executive Officer, Invesco Trimark Dealer Inc. (registered broker dealer); Director, Invesco Distributors, Inc. (formerly known as Invesco Aim Distributors, Inc.) (registered broker dealer); Manager, Invesco PowerShares Capital Management LLC; Director, Chief Executive Officer and President, Invesco Advisers, Inc.; Director, Chairman, Chief Executive Officer and President, Invesco Aim Capital Management, Inc.; President, Invesco Trimark Dealer Inc. and Invesco Trimark Ltd./Invesco Trimark Ltèe; Director and President, AIM Trimark Corporate Class Inc. and AIM Trimark Canada Fund Inc.; Senior Managing Director, Invesco Holding Company Limited; Trustee and Executive Vice President, Tax-Free Investments Trust; Director and Chairman, Fund Management Company (former registered broker dealer); President and Principal Executive Officer, The Invesco Funds (AIM Treasurer’s Series Trust (Invesco Treasurer’s Series Trust), Short-Term Investments Trust and Tax-Free Investments Trust only); President, AIM Trimark Global Fund Inc. and AIM Trimark Canada Fund Inc. | ||||||||
|
Wayne W.
Whalen3 —
1939
Trustee |
2010 | Of Counsel, and prior to 2010, partner in the law firm of Skadden, Arps, Slate, Meagher & Flom LLP, legal counsel to funds in the Fund Complex | 159 | Director of the Abraham Lincoln Presidential Library Foundation | ||||
|
Independent
Trustees
|
||||||||
|
Bruce L. Crockett — 1944
Trustee and Chair |
1993 | Chairman, Crockett Technology Associates (technology consulting company) | 141 | ACE Limited (insurance company); and Investment Company Institute | ||||
| Formerly: Director, Captaris (unified messaging provider); Director, President and Chief Executive Officer COMSAT Corporation; and Chairman, Board of Governors of INTELSAT (international communications company) | ||||||||
|
David C. Arch — 1945
Trustee |
2010 | Chairman and Chief Executive Officer of Blistex Inc., a consumer health care products manufacturer. | 159 | Member of the Heartland Alliance Advisory Board, a nonprofit organization serving human needs based in Chicago. Board member of the Illinois Manufacturers’ Association. Member of the Board of Visitors, Institute for the Humanities, University of Michigan | ||||
| 1 | Mr. Flanagan is considered an interested person of the Trust because he is an officer of the adviser to the Trust, and an officer and a director of Invesco Ltd., ultimate parent of the adviser to the Trust. |
| 2 | Mr. Taylor is considered an interested person of the Trust because he is an officer and a director of the adviser to, and a director of the principal underwriter of, the Trust. |
| 3 | Mr. Whalen has been deemed to be an interested person of the Trust because of his prior service as counsel to the predecessor funds of certain Invesco open-end funds and his affiliation with the law firm that served as counsel to such predecessor funds and continues to serve as counsel to the Invesco Van Kampen closed-end funds. |
|
Number of |
||||||||
|
Funds in |
||||||||
|
Fund Complex |
||||||||
|
Name, Year of
Birth and |
Trustee
and/ |
Principal
Occupation(s) |
Overseen by |
Other
Directorship(s) |
||||
| Position(s) Held with the Trust | or Officer Since | During Past 5 Years | Trustee | Held by Trustee | ||||
|
Independent
Trustees—(continued)
|
||||||||
|
Bob R. Baker — 1936
Trustee |
2003 | Retired | 141 | None | ||||
| Formerly: President and Chief Executive Officer, AMC Cancer Research Center; and Chairman and Chief Executive Officer, First Columbia Financial Corporation | ||||||||
|
Frank S. Bayley — 1939
Trustee |
2001 |
Retired Formerly: Director, Badgley Funds, Inc. (registered investment company) (2 portfolios) and Partner, law firm of Baker & McKenzie |
141 | Director and Chairman, C.D. Stimson Company (a real estate investment company) | ||||
|
James T. Bunch — 1942
Trustee |
2003 |
Founder, Green, Manning & Bunch Ltd. (investment banking firm)
Formerly: Executive Committee, United States Golf Association; and Director, Policy Studies, Inc. and Van Gilder Insurance Corporation |
141 | Vice Chairman, Board of Governors, Western Golf Association/Evans Scholars Foundation and Director, Denver Film Society | ||||
|
Rodney F. Dammeyer — 1940
Trustee |
2010 |
President of CAC, LLC, a private company offering capital investment and management advisory services.
Formerly: Prior to January 2004, Director of TeleTech Holdings Inc.; Prior to 2002, Director of Arris Group, Inc.; Prior to 2001, Managing Partner at Equity Group Corporate Investments. Prior to 1995, Vice Chairman of Anixter International. Prior to 1985, experience includes Senior Vice President and Chief Financial Officer of Household International, Inc, Executive Vice President and Chief Financial Officer of Northwest Industries, Inc. and Partner of Arthur Andersen & Co. |
159 | Director of Quidel Corporation and Stericycle, Inc. Prior to May 2008, Trustee of The Scripps Research Institute. Prior to February 2008, Director of Ventana Medical Systems, Inc. Prior to April 2007, Director of GATX Corporation. Prior to April 2004, Director of TheraSense, Inc. | ||||
|
Albert R. Dowden — 1941
Trustee |
2000 | Director of a number of public and private business corporations, including the Boss Group, Ltd. (private investment and management); Reich & Tang Funds (5 portfolios) (registered investment company); and Homeowners of America Holding Corporation/ Homeowners of America Insurance Company (property casualty company) | 141 | Board of Nature’s Sunshine Products, Inc. | ||||
| Formerly: Director, Continental Energy Services, LLC (oil and gas pipeline service); Director, CompuDyne Corporation (provider of product and services to the public security market) and Director, Annuity and Life Re (Holdings), Ltd. (reinsurance company); Director, President and Chief Executive Officer, Volvo Group North America, Inc.; Senior Vice President, AB Volvo; Director of various public and private corporations; Chairman, DHJ Media, Inc.; Director Magellan Insurance Company; and Director, The Hertz Corporation, Genmar Corporation (boat manufacturer), National Media Corporation; Advisory Board of Rotary Power International (designer, manufacturer, and seller of rotary power engines); and Chairman, Cortland Trust, Inc. (registered investment company) | ||||||||
|
Jack M. Fields — 1952
Trustee |
1997 | Chief Executive Officer, Twenty First Century Group, Inc. (government affairs company); and Owner and Chief Executive Officer, Dos Angelos Ranch, L.P. (cattle, hunting, corporate entertainment), Discovery Global Education Fund (non-profit) and Cross Timbers Quail Research Ranch (non-profit) | 141 | Administaff | ||||
| Formerly: Chief Executive Officer, Texana Timber LP (sustainable forestry company) and member of the U.S. House of Representatives | ||||||||
|
Carl Frischling — 1937
Trustee |
1988 | Partner, law firm of Kramer Levin Naftalis and Frankel LLP | 141 | Director, Reich & Tang Funds (6 portfolios) | ||||
|
Prema Mathai-Davis — 1950
Trustee |
1998 | Retired | 141 | None | ||||
| Formerly: Chief Executive Officer, YWCA of the U.S.A. | ||||||||
|
Larry Soll — 1942
Trustee |
2003 | Retired | 141 | None | ||||
| Formerly, Chairman, Chief Executive Officer and President, Synergen Corp. (a biotechnology company) | ||||||||
|
Number of |
||||||||
|
Funds in |
||||||||
|
Fund Complex |
||||||||
|
Name, Year of
Birth and |
Trustee
and/ |
Principal
Occupation(s) |
Overseen by |
Other
Directorship(s) |
||||
| Position(s) Held with the Trust | or Officer Since | During Past 5 Years | Trustee | Held by Trustee | ||||
|
Independent
Trustees—(continued)
|
||||||||
|
Hugo F. Sonnenschein — 1940
Trustee |
2010 | President Emeritus and Honorary Trustee of the University of Chicago and the Adam Smith Distinguished Service Professor in the Department of Economics at the University of Chicago. Prior to July 2000, President of the University of Chicago. | 159 | Trustee of the University of Rochester and a member of its investment committee. Member of the National Academy of Sciences, the American Philosophical Society and a fellow of the American Academy of Arts and Sciences | ||||
|
Raymond Stickel, Jr. — 1944
Trustee |
2005 | Retired | 141 | Director of Long Cove Club Owners’ Association (home owner’s association) | ||||
| Formerly: Director, Mainstay VP Series Funds, Inc. (25 portfolios) and Partner, Deloitte & Touche | ||||||||
|
Other
Officers
|
||||||||
|
Russell C. Burk — 1958
Senior Vice President and Senior Officer |
2005 | Senior Vice President and Senior Officer of Invesco Funds | N/A | N/A | ||||
|
John M. Zerr — 1962
Senior Vice President, Chief Legal Officer and Secretary |
2006 | Director, Senior Vice President, Secretary and General Counsel, Invesco Management Group, Inc. (formerly known as Invesco Aim Management Group, Inc.) and Van Kampen Exchange Corp.; Senior Vice President, Invesco Advisers, Inc. (formerly known as Invesco Institutional (N.A.), Inc.) (registered investment adviser); Senior Vice President and Secretary, Invesco Distributors, Inc. (formerly known as Invesco Aim Distributors, Inc.); Director, Vice President and Secretary, Invesco Investment Services, Inc. (formerly known as Invesco Aim Investment Services, Inc.) and IVZ Distributors, Inc. (formerly known as INVESCO Distributors, Inc.); Director and Vice President, INVESCO Funds Group, Inc.; Senior Vice President, Chief Legal Officer and Secretary, The Invesco Funds; Manager, Invesco PowerShares Capital Management LLC; Director, Secretary and General Counsel, Invesco Investment Advisers LLC (formerly known as Van Kampen Asset Management); Secretary and General Counsel, Van Kampen Funds Inc. and Chief Legal Officer, PowerShares Exchange-Traded Fund Trust, PowerShares Exchange-Traded Fund Trust II, PowerShares India Exchange-Traded Fund Trust and PowerShares Actively Managed Exchange-Traded Fund Trust | N/A | N/A | ||||
| Formerly: Director and Secretary, Van Kampen Advisors Inc.; Director Vice President, Secretary and General Counsel Van Kampen Investor Services Inc.; Director, Invesco Distributors, Inc. (formerly known as Invesco Aim Distributors, Inc.); Director, Senior Vice President, General Counsel and Secretary, Invesco Advisers, Inc.; and Van Kampen Investments Inc.; Director, Vice President and Secretary, Fund Management Company; Director, Senior Vice President, Secretary, General Counsel and Vice President, Invesco Aim Capital Management, Inc.; Chief Operating Officer and General Counsel, Liberty Ridge Capital, Inc. (an investment adviser); Vice President and Secretary, PBHG Funds (an investment company) and PBHG Insurance Series Fund (an investment company); Chief Operating Officer, General Counsel and Secretary, Old Mutual Investment Partners (a broker-dealer); General Counsel and Secretary, Old Mutual Fund Services (an administrator) and Old Mutual Shareholder Services (a shareholder servicing center); Executive Vice President, General Counsel and Secretary, Old Mutual Capital, Inc. (an investment adviser); and Vice President and Secretary, Old Mutual Advisors Funds (an investment company) | ||||||||
|
Lisa O. Brinkley — 1959
Vice President |
2004 |
Global Compliance Director, Invesco Ltd.; Chief Compliance Officer, Invesco Investment Services, Inc.(formerly known as Invesco Aim Investment Services, Inc.); and Vice President, The Invesco Funds
Formerly: Chief Compliance Officer, Invesco Distributors, Inc. (formerly known as Invesco Aim Distributors, Inc.) and Van Kampen Investor Services Inc.; Senior Vice President, Invesco Management Group, Inc.; Senior Vice President and Chief Compliance Officer, Invesco Advisers, Inc. and The Invesco Funds; Vice President and Chief Compliance Officer, Invesco Aim Capital Management, Inc. and Invesco Distributors, Inc.; Vice President, Invesco Investment Services, Inc. and Fund Management Company |
N/A | N/A | ||||
|
Sheri Morris — 1964
Vice President, Treasurer and Principal Financial Officer |
1999 | Vice President, Treasurer and Principal Financial Officer, The Invesco Funds; and Vice President, Invesco Advisers, Inc. (formerly known as Invesco Institutional (N.A.), Inc.) (registered investment adviser). | N/A | N/A | ||||
| Formerly: Treasurer, PowerShares Exchange-Traded Fund Trust, PowerShares Exchange-Traded Fund Trust II, PowerShares India Exchange-Traded Fund Trust and PowerShares Actively Managed Exchange-Traded Fund Trust; Vice President, Invesco Advisers, Inc., Invesco Aim Capital Management, Inc. and Invesco Aim Private Asset Management, Inc.; Assistant Vice President and Assistant Treasurer, The Invesco Funds and Assistant Vice President, Invesco Advisers, Inc., Invesco Aim Capital Management, Inc. and Invesco Aim Private Asset Management, Inc. | ||||||||
|
Karen Dunn Kelley — 1960
Vice President |
2004 | Head of Invesco’s World Wide Fixed Income and Cash Management Group; Senior Vice President, Invesco Advisers, Inc. (formerly known as Invesco Institutional (N.A.), Inc.) (registered investment adviser); Executive Vice President, Invesco Distributors, Inc. (formerly known as Invesco Aim Distributors, Inc.); Senior Vice President, Invesco Management Group, Inc. (formerly known as Invesco Aim Management Group, Inc.); and Director, Invesco Mortgage Capital Inc.; Vice President, The Invesco Funds (other than AIM Treasurer’s Series Trust (Invesco Treasurer’s Series Trust) and Short-Term Investments Trust); President and Principal Executive Officer, The Invesco Funds (AIM Treasurer’s Series Trust (Invesco Treasurer’s Series Trust) and Short-Term Investments Trust only). | N/A | N/A | ||||
| Formerly: Senior Vice President, Van Kampen Investments Inc.; Vice President, Invesco Advisers, Inc. (formerly known as Invesco Institutional (N.A.), Inc.); Director of Cash Management and Senior Vice President, Invesco Advisers, Inc. and Invesco Aim Capital Management, Inc.; President and Principal Executive Officer, Tax-Free Investments Trust; Director and President, Fund Management Company; Chief Cash Management Officer, Director of Cash Management, Senior Vice President, and Managing Director, Invesco Aim Capital Management, Inc.; Director of Cash Management, Senior Vice President, and Vice President, Invesco Advisers, Inc. and The Invesco Funds (AIM Treasurer’s Series Trust (Invesco Treasurer’s Series Trust), Short-Term Investments Trust and Tax-Free Investments Trust only) | ||||||||
|
Number of |
||||||||
|
Funds in |
||||||||
|
Fund Complex |
||||||||
|
Name, Year of
Birth and |
Trustee
and/ |
Principal
Occupation(s) |
Overseen by |
Other
Directorship(s) |
||||
| Position(s) Held with the Trust | or Officer Since | During Past 5 Years | Trustee | Held by Trustee | ||||
|
Other
Officers—(continued)
|
||||||||
|
Lance A. Rejsek — 1967
Anti-Money Laundering Compliance Officer |
2005 | Anti-Money Laundering Compliance Officer, Invesco Advisers, Inc. (formerly known as Invesco Institutional (N.A.), Inc.) (registered investment adviser); Invesco Distributors, Inc. (formerly known as Invesco Aim Distributors, Inc.), Invesco Investment Services, Inc. (formerly known as Invesco Aim Investment Services, Inc.), The Invesco Funds, PowerShares Exchange-Traded Fund Trust, PowerShares Exchange-Traded Fund Trust II, PowerShares India Exchange-Traded Fund Trust, PowerShares Actively Managed Exchange-Traded Fund Trust, Invesco Investment Advisers LLC (formerly known as Van Kampen Asset Management) and Van Kampen Funds Inc. | N/A | N/A | ||||
| Formerly: Anti-Money Laundering Compliance Officer, Van Kampen Investor Services Inc., Fund Management Company, Invesco Advisers, Inc., Invesco Aim Capital Management, Inc. and Invesco Aim Private Asset Management, Inc. | ||||||||
|
Todd L. Spillane — 1958
Chief Compliance Officer |
2006 | Senior Vice President, Invesco Management Group, Inc. (formerly known as Invesco Aim Management Group, Inc.) and Van Kampen Exchange Corp.; Senior Vice President and Chief Compliance Officer, Invesco Advisers, Inc. (registered investment adviser) (formerly known as Invesco Institutional (N.A.), Inc.); Chief Compliance Officer, The Invesco Funds, PowerShares Exchange-Traded Fund Trust, PowerShares Exchange-Traded Fund Trust II, PowerShares India Exchange-Traded Fund Trust, PowerShares Actively Managed Exchange-Traded Fund Trust, INVESCO Private Capital Investments, Inc. (holding company) and Invesco Private Capital, Inc. (registered investment adviser); Vice President, Invesco Distributors, Inc. (formerly known as Invesco Aim Distributors, Inc.) and Invesco Investment Services, Inc. (formerly known as Invesco Aim Investment Services, Inc.). | N/A | N/A | ||||
| Formerly: Chief Compliance Officer, Invesco Van Kampen Closed-End Funds; Senior Vice President, Van Kampen Investments Inc.; Senior Vice President and Chief Compliance Officer, Invesco Advisers, Inc. and Invesco Aim Capital Management, Inc.; Chief Compliance Officer, Invesco Global Asset Management (N.A.), Inc., Invesco Senior Secured Management, Inc. (registered investment adviser) and Van Kampen Investor Services Inc.; Vice President, Invesco Aim Capital Management, Inc. and Fund Management Company | ||||||||
|
Office of the Fund 11 Greenway Plaza, Suite 2500 Houston, TX 77046-1173 |
Investment Adviser Invesco Advisers, Inc. 1555 Peachtree Street, N.E. Atlanta, GA 30309 |
Distributor Invesco Distributors, Inc. 11 Greenway Plaza, Suite 2500 Houston, TX 77046-1173 |
Auditors PricewaterhouseCoopers LLP 1201 Louisiana Street, Suite 2900 Houston, TX 77002-5678 |
|||
|
Counsel to the Fund Stradley Ronon Stevens & Young, LLP 2600 One Commerce Square Philadelphia, PA 19103 |
Counsel to the Independent Trustees Kramer, Levin, Naftalis & Frankel LLP 1177 Avenue of the Americas New York, NY 10036-2714 |
Transfer Agent Invesco Investment Services, Inc. 11 Greenway Plaza, Suite 2500 Houston, TX 77046-1173 |
Custodian State Street Bank and Trust Company 225 Franklin Boston, MA 02110-2801 |


| CDV-AR-1 | Invesco Distributors, Inc. |
 |
| Annual Report to Shareholders | October 31, 2011 |
A: CHTRX § B: BCHTX § C: CHTCX § R: CHRRX § S: CHRSX § Y: CHTYX
Institutional: CHTVX
2 |
Letters to Shareholders | |
4 |
Performance Summary | |
4 |
Management Discussion | |
6 |
Long-Term Fund Performance | |
8 |
Supplemental Information | |
9 |
Schedule of Investments | |
11 |
Financial Statements | |
13 |
Notes to Financial Statements | |
22 |
Financial Highlights | |
23 |
Auditor's Report | |
24 |
Fund Expenses | |
25 |
Approval of Investment Advisory and Sub-Advisory Agreements | |
27 |
Tax Information | |
T-1 |
Trustees and Officers |

Philip Taylor

Senior Managing Director, Invesco Ltd.

Bruce Crockett

Independent Chair
Invesco Funds Board of Trustees
Class A Shares |
7.50 | % | ||
Class B Shares |
6.74 | |||
Class C Shares |
6.72 | |||
Class R Shares |
7.26 | |||
Class S Shares |
7.62 | |||
Class Y Shares |
7.78 | |||
Institutional Class Shares |
7.92 | |||
S&P 500 Index▼ (Broad Market Index) |
8.07 | |||
Russell 1000 Index▼ (Style-Specific Index) |
8.01 | |||
Lipper Large-Cap Core Funds Index▼ (Peer Group Index) |
5.83 | |||
| Source(s): ▼Lipper Inc. | ||
By sector
Information Technology |
17.2 | % | ||
Financials |
13.1 | |||
Energy |
13.0 | |||
Health Care |
12.2 | |||
Industrials |
11.7 | |||
Consumer Discretionary |
5.4 | |||
Consumer Staples |
5.3 | |||
Materials |
3.0 | |||
Utilities |
2.0 | |||
Telecommunication Services |
1.8 | |||
Money Market Funds |
||||
Plus Other Assets Less Liabilities |
15.3 | |||
| 1. | Cisco Systems, Inc. |
2.8 | % | |||||
| 2. | American Express Co. |
2.7 | ||||||
| 3. | Progressive Corp. (The) |
2.7 | ||||||
| 4. | Kroger Co. (The) |
2.7 | ||||||
| 5. | Symantec Corp. |
2.6 | ||||||
| 6. | Microsoft Corp. |
2.6 | ||||||
| 7. | Berkshire Hathaway, Inc.-Class A |
2.2 | ||||||
| 8. | QUALCOMM, Inc. |
2.0 | ||||||
| 9. | Roche Holding AG |
2.0 | ||||||
| 10. | Macy’s, Inc. |
2.0 | ||||||
Total Net Assets |
$5.1 billion | |||
Total Number of Holdings* |
74 | |||

Chartered Financial Analyst, portfolio manager, is lead manager of Invesco Charter Fund. Mr. Sloan joined Invesco in 1998. He earned both a B.S. in business administration and an M.B.A. from the University of Missouri.

Chartered Financial Analyst, portfolio manager, is manager of Invesco Charter Fund. Mr. Dann joined Invesco in 2004. He earned a B.A. from Princeton University.

Chartered Financial Analyst, portfolio manager, is manager of Invesco Charter Fund. Mr. Nelson joined Invesco in 1997. He earned a B.A. from the University of California Santa Barbara.
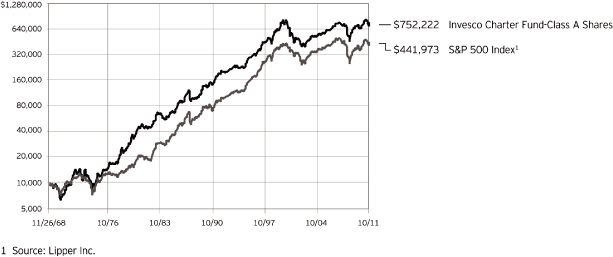
| Class A Shares | ||||||||
| Inception (11/26/68) | 10.59 | % | ||||||
| 10 | Years |
4.66 | ||||||
| 5 | Years |
1.58 | ||||||
| 1 | Year |
1.59 | ||||||
| Class B Shares | ||||||||
| Inception (6/26/95) | 6.17 | % | ||||||
| 10 | Years |
4.64 | ||||||
| 5 | Years |
1.60 | ||||||
| 1 | Year |
1.74 | ||||||
| Class C Shares | ||||||||
| Inception (8/4/97) | 2.95 | % | ||||||
| 10 | Years |
4.50 | ||||||
| 5 | Years |
1.97 | ||||||
| 1 | Year |
5.72 | ||||||
| Class R Shares | ||||||||
| 10 | Years |
4.99 | % | |||||
| 5 | Years |
2.48 | ||||||
| 1 | Year |
7.26 | ||||||
| Class S Shares | ||||||||
| 10 | Years |
5.28 | % | |||||
| 5 | Years |
2.77 | ||||||
| 1 | Year |
7.62 | ||||||
| Class Y Shares | ||||||||
| 10 | Years |
5.34 | % | |||||
| 5 | Years |
2.89 | ||||||
| 1 | Year |
7.78 | ||||||
| Institutional Class Shares | ||||||||
| Inception (7/30/91) | 7.70 | % | ||||||
| 10 | Years |
5.74 | ||||||
| 5 | Years |
3.18 | ||||||
| 1 | Year |
7.92 | ||||||
| Class A Shares | ||||||||
| Inception (11/26/68) | 10.37 | % | ||||||
| 10 | Years |
4.16 | ||||||
| 5 | Years |
0.20 | ||||||
| 1 | Year |
-5.17 | ||||||
| Class B Shares | ||||||||
| Inception (6/26/95) | 5.61 | % | ||||||
| 10 | Years |
4.14 | ||||||
| 5 | Years |
0.19 | ||||||
| 1 | Year |
-5.33 | ||||||
| Class C Shares | ||||||||
| Inception (8/4/97) | 2.30 | % | ||||||
| 10 | Years |
3.98 | ||||||
| 5 | Years |
0.57 | ||||||
| 1 | Year |
-1.41 | ||||||
| Class R Shares | ||||||||
| 10 | Years |
4.48 | % | |||||
| 5 | Years |
1.07 | ||||||
| 1 | Year |
0.06 | ||||||
| Class S Shares | ||||||||
| 10 | Years |
4.76 | % | |||||
| 5 | Years |
1.38 | ||||||
| 1 | Year |
0.46 | ||||||
| Class Y Shares | ||||||||
| 10 | Years |
4.82 | % | |||||
| 5 | Years |
1.49 | ||||||
| 1 | Year |
0.57 | ||||||
| Institutional Class Shares | ||||||||
| Inception (7/30/91) | 7.24 | % | ||||||
| 10 | Years |
5.22 | ||||||
| 5 | Years |
1.78 | ||||||
| 1 | Year |
0.75 | ||||||
| n | Unless otherwise stated, information presented in this report is as of October 31, 2011, and is based on total net assets. |
| n | Unless otherwise noted, all data provided by Invesco. | |
| n | To access your Fund’s reports/prospectus, visit invesco.com/fundreports. |
| n | Class B shares may not be purchased or acquired by exchange from share classes other than Class B shares. Please see the prospectus for more information. | |
| n | Class R shares are available only to certain retirement plans. Please see the prospectus for more information. | |
| n | Class S shares are closed to most investors. See the prospectus for more information. | |
| n | Class Y shares are available to only certain investors. Please see the prospectus for more information. | |
| n | Institutional Class shares are offered exclusively to institutional investors, including defined contribution plans that meet certain criteria. Please see the prospectus for more information. |
| n | Cash/cash equivalents risk. Holding cash or cash equivalents may negatively affect performance. |
| n | Foreign securities risk. The Fund’s foreign investments may be affected by changes in a foreign country’s exchange rates; political and social instability; changes in economic or taxation policies; difficulties when enforcing obligations; decreased liquidity; and increased volatility. Foreign companies may be subject to less regulation resulting in less publicly available information about the companies. |
| n | Management risk. The investment techniques and risk analysis used by the Fund’s portfolio managers may not produce the desired results. |
| n | Market risk. The prices of and the income generated by the Fund’s securities may decline in response to, among other things, investor sentiment; general economic and market conditions; regional or global instability; and currency and interest rate fluctuations. |
| n | The S&P 500® Index is an unmanaged index considered representative of the U.S. stock market. | |
| n | The Russell 1000® Index is an unmanaged index considered representative of large-cap stocks. The Russell 1000 Index is a trademark/service mark of the Frank Russell Co. Russell® is a trademark of the Frank Russell Co. | |
| n | The Lipper Large-Cap Core Funds Index is an unmanaged index considered representative of large-cap core funds tracked by Lipper. | |
| n | The Fund is not managed to track the performance of any particular index, including the index(es) defined here, and consequently, the performance of the Fund may deviate significantly from the performance of the index(es). | |
| n | A direct investment cannot be made in an index. Unless otherwise indicated, index results include reinvested dividends, and they do not reflect sales charges. Performance of the peer group, if applicable, reflects fund expenses; performance of a market index does not. |
| n | The Chartered Financial Analyst® (CFA®) designation is globally recognized and attests to a charterholder’s success in a rigorous and comprehensive study program in the field of investment management and research analysis. | |
| n | The returns shown in management’s discussion of Fund performance are based on net asset values calculated for shareholder transactions. Generally accepted accounting principles require adjustments to be made to the net assets of the Fund at period end for financial reporting purposes, and as such, the net asset values for shareholder transactions and the returns based on those net asset values may differ from the net asset values and returns reported in the Financial Highlights. | |
| n | Industry classifications used in this report are generally according to the Global Industry Classification Standard, which was developed by and is the exclusive property and a service mark of MSCI Inc. and Standard & Poor’s. |
Class A Shares |
CHTRX | |||
Class B Shares |
BCHTX | |||
Class C Shares |
CHTCX | |||
Class R Shares |
CHRRX | |||
Class S Shares |
CHRSX | |||
Class Y Shares |
CHTYX | |||
Institutional Class Shares |
CHTVX | |||
| Shares | Value | |||||||
|
Common Stocks & Other Equity Interests–84.71% |
||||||||
|
Aerospace & Defense–0.93% |
||||||||
|
ITT Corp.
|
1,042,039 | $ | 47,516,978 | |||||
|
Air Freight & Logistics–0.75% |
||||||||
|
United Parcel Service, Inc.–Class B
|
545,716 | 38,331,092 | ||||||
|
Application Software–1.64% |
||||||||
|
Adobe Systems
Inc.(b)
|
2,855,641 | 83,984,402 | ||||||
|
Asset Management & Custody Banks–2.64% |
||||||||
|
Legg Mason, Inc.
|
2,268,099 | 62,372,723 | ||||||
|
Northern Trust Corp.
|
1,794,862 | 72,638,065 | ||||||
| 135,010,788 | ||||||||
|
Auto Parts & Equipment–0.26% |
||||||||
|
Johnson Controls, Inc.
|
405,716 | 13,360,228 | ||||||
|
Automobile Manufacturers–0.28% |
||||||||
|
General Motors
Co.(b)
|
553,198 | 14,300,168 | ||||||
|
Biotechnology–1.38% |
||||||||
|
Gilead Sciences,
Inc.(b)
|
1,694,813 | 70,605,910 | ||||||
|
Communications Equipment–5.12% |
||||||||
|
Cisco Systems, Inc.
|
7,659,569 | 141,931,813 | ||||||
|
Motorola Mobility Holdings,
Inc.(b)
|
414,326 | 16,108,995 | ||||||
|
QUALCOMM, Inc.
|
2,014,410 | 103,943,556 | ||||||
| 261,984,364 | ||||||||
|
Computer & Electronics Retail–0.74% |
||||||||
|
Best Buy Co., Inc.
|
1,434,865 | 37,636,509 | ||||||
|
Computer Hardware–0.35% |
||||||||
|
Hewlett-Packard Co.
|
669,837 | 17,824,363 | ||||||
|
Construction Materials–0.76% |
||||||||
|
CRH PLC (Ireland)
|
2,173,344 | 39,108,927 | ||||||
|
Consumer Finance–2.73% |
||||||||
|
American Express Co.
|
2,761,511 | 139,787,687 | ||||||
|
Department Stores–2.01% |
||||||||
|
Macy’s, Inc.
|
3,370,717 | 102,907,990 | ||||||
|
Diversified Banks–1.26% |
||||||||
|
U.S. Bancorp
|
2,522,342 | 64,546,732 | ||||||
|
Drug Retail–1.82% |
||||||||
|
CVS Caremark Corp.
|
2,561,000 | 92,964,300 | ||||||
|
Electric Utilities–2.05% |
||||||||
|
Edison International
|
790,296 | 32,086,018 | ||||||
|
Exelon Corp.
|
1,641,588 | 72,870,091 | ||||||
| 104,956,109 | ||||||||
|
Electrical Components & Equipment–1.08% |
||||||||
|
Emerson Electric Co.
|
1,148,541 | 55,267,793 | ||||||
|
Electronic Manufacturing Services–1.40% |
||||||||
|
TE Connectivity Ltd. (Switzerland)
|
2,008,243 | 71,393,039 | ||||||
|
Environmental & Facilities Services–1.11% |
||||||||
|
Waste Management, Inc.
|
1,730,921 | 56,999,228 | ||||||
|
Food Retail–2.71% |
||||||||
|
Kroger Co. (The)
|
5,971,206 | 138,412,555 | ||||||
|
Gold–0.88% |
||||||||
|
Agnico-Eagle Mines Ltd. (Canada)
|
507,355 | 22,014,133 | ||||||
|
Newcrest Mining Ltd. (Australia)
|
660,998 | 23,269,558 | ||||||
| 45,283,691 | ||||||||
|
Health Care Equipment–3.06% |
||||||||
|
Baxter International Inc.
|
622,560 | 34,228,349 | ||||||
|
Boston Scientific
Corp.(b)
|
9,213,090 | 54,265,100 | ||||||
|
Covidien PLC (Ireland)
|
989,438 | 46,543,164 | ||||||
|
Medtronic, Inc.
|
612,003 | 21,260,984 | ||||||
| 156,297,597 | ||||||||
|
Heavy Electrical Equipment–1.22% |
||||||||
|
ABB Ltd. (Switzerland)
|
1,694,357 | 31,946,948 | ||||||
|
ABB Ltd.–ADR (Switzerland)
|
1,626,400 | 30,592,584 | ||||||
| 62,539,532 | ||||||||
|
Home Improvement Retail–1.28% |
||||||||
|
Lowe’s Cos., Inc.
|
3,106,590 | 65,300,522 | ||||||
|
Hypermarkets & Super Centers–0.80% |
||||||||
|
Wal-Mart Stores, Inc.
|
718,800 | 40,770,336 | ||||||
|
Industrial Conglomerates–3.64% |
||||||||
|
3M Co.
|
945,928 | 74,747,231 | ||||||
|
General Electric Co.
|
4,281,356 | 71,541,459 | ||||||
|
Koninklijke Philips Electronics N.V. (Netherlands)
|
1,924,218 | 39,851,795 | ||||||
| 186,140,485 | ||||||||
|
Industrial Gases–1.32% |
||||||||
|
Air Products & Chemicals, Inc.
|
786,897 | 67,783,308 | ||||||
| Shares | Value | |||||||
|
Industrial Machinery–2.02% |
||||||||
|
Illinois Tool Works Inc.
|
1,643,938 | $ | 79,944,705 | |||||
|
Ingersoll-Rand PLC
(Ireland)(b)
|
754,623 | 23,491,414 | ||||||
| 103,436,119 | ||||||||
|
Insurance Brokers–1.14% |
||||||||
|
Marsh & McLennan Cos., Inc.
|
1,897,084 | 58,088,712 | ||||||
|
Integrated Oil & Gas–1.59% |
||||||||
|
ConocoPhillips
|
407,337 | 28,371,022 | ||||||
|
Hess Corp.
|
475,633 | 29,755,601 | ||||||
|
Petroleo Brasileiro S.A.–ADR (Brazil)
|
860,121 | 23,231,868 | ||||||
| 81,358,491 | ||||||||
|
Investment Banking & Brokerage–0.37% |
||||||||
|
Charles Schwab Corp. (The)
|
1,525,057 | 18,727,700 | ||||||
|
Life Sciences Tools & Services–1.87% |
||||||||
|
Agilent Technologies,
Inc.(b)
|
1,600,625 | 59,335,169 | ||||||
|
Thermo Fisher Scientific,
Inc.(b)
|
720,324 | 36,210,687 | ||||||
| 95,545,856 | ||||||||
|
Managed Health Care–1.58% |
||||||||
|
WellPoint, Inc.
|
1,171,624 | 80,724,894 | ||||||
|
Movies & Entertainment–0.43% |
||||||||
|
Walt Disney Co. (The)
|
632,475 | 22,060,728 | ||||||
|
Oil & Gas Equipment & Services–6.20% |
||||||||
|
Baker Hughes Inc.
|
1,607,994 | 93,247,572 | ||||||
|
Cameron International
Corp.(b)
|
544,972 | 26,779,924 | ||||||
|
National Oilwell Varco Inc.
|
528,721 | 37,713,669 | ||||||
|
Schlumberger Ltd.
|
547,807 | 40,247,380 | ||||||
|
Tenaris S.A.–ADR (Argentina)
|
980,600 | 31,192,886 | ||||||
|
Weatherford International
Ltd.(b)
|
5,685,674 | 88,127,947 | ||||||
| 317,309,378 | ||||||||
|
Oil & Gas Exploration & Production–4.59% |
||||||||
|
Apache Corp.
|
883,897 | 88,062,658 | ||||||
|
Devon Energy Corp.
|
991,111 | 64,372,659 | ||||||
|
Southwestern Energy
Co.(b)
|
1,447,607 | 60,857,398 | ||||||
|
Talisman Energy Inc. (Canada)
|
1,500,000 | 21,258,896 | ||||||
| 234,551,611 | ||||||||
|
Oil & Gas Refining & Marketing–0.59% |
||||||||
|
Valero Energy Corp.
|
1,222,565 | 30,075,099 | ||||||
|
Pharmaceuticals–4.32% |
||||||||
|
Merck & Co., Inc.
|
494,367 | 17,055,662 | ||||||
|
Roche Holding AG (Switzerland)
|
626,636 | 103,033,074 | ||||||
|
Teva Pharmaceutical Industries Ltd.–ADR (Israel)
|
2,474,371 | 101,078,055 | ||||||
| 221,166,791 | ||||||||
|
Property & Casualty Insurance–4.93% |
||||||||
|
Berkshire Hathaway,
Inc.–Class A(b)
|
967 | 113,090,650 | ||||||
|
Progressive Corp. (The)
|
7,322,467 | 139,200,098 | ||||||
| 252,290,748 | ||||||||
|
Railroads–0.96% |
||||||||
|
Union Pacific Corp.
|
491,520 | 48,940,646 | ||||||
|
Semiconductors–2.70% |
||||||||
|
Analog Devices, Inc.
|
1,522,891 | 55,692,124 | ||||||
|
Intel Corp.
|
1,063,232 | 26,091,713 | ||||||
|
Taiwan Semiconductor Manufacturing Co. Ltd. (Taiwan)
|
23,007,019 | 56,110,087 | ||||||
| 137,893,924 | ||||||||
|
Specialty Stores–0.45% |
||||||||
|
Staples, Inc.
|
1,530,960 | 22,903,162 | ||||||
|
Systems Software–5.99% |
||||||||
|
CA, Inc.
|
1,897,533 | 41,100,565 | ||||||
|
Microsoft Corp.
|
4,935,013 | 131,419,396 | ||||||
|
Symantec
Corp.(b)
|
7,854,225 | 133,600,367 | ||||||
| 306,120,328 | ||||||||
|
Wireless Telecommunication Services–1.76% |
||||||||
|
Vodafone Group PLC (United Kingdom)
|
32,542,567 | 90,249,732 | ||||||
|
Total Common Stocks & Other Equity Interests
(Cost $3,959,979,669)
|
4,332,458,552 | |||||||
|
Money Market Funds–14.85% |
||||||||
|
Liquid Assets Portfolio–Institutional
Class(c)
|
379,937,218 | 379,937,218 | ||||||
|
Premier Portfolio–Institutional
Class(c)
|
379,937,218 | 379,937,218 | ||||||
|
Total Money Market Funds (Cost $759,874,436)
|
759,874,436 | |||||||
|
TOTAL INVESTMENTS–99.56% (Cost $4,719,854,105)
|
5,092,332,988 | |||||||
|
OTHER ASSETS LESS LIABILITIES–0.44%
|
22,263,137 | |||||||
|
NET ASSETS–100.00%
|
$ | 5,114,596,125 | ||||||
|
ADR
|
– American Depositary Receipt |
| (a) | Industry and/or sector classifications used in this report are generally according to the Global Industry Classification Standard, which was developed by and is the exclusive property and a service mark of MSCI Inc. and Standard & Poor’s. | |
| (b) | Non-income producing security. | |
| (c) | The money market fund and the Fund are affiliated by having the same investment adviser. |
|
Assets: |
||||
|
Investments, at value (Cost $3,959,979,669)
|
$ | 4,332,458,552 | ||
|
Investments in affiliated money market funds, at value and cost
|
759,874,436 | |||
|
Total investments, at value (Cost $4,719,854,105)
|
5,092,332,988 | |||
|
Foreign currencies, at value (Cost $4,941,944)
|
4,909,465 | |||
|
Receivable for:
|
||||
|
Fund shares sold
|
13,929,607 | |||
|
Dividends
|
4,591,689 | |||
|
Foreign currency contracts closed
|
20,145,654 | |||
|
Investment for trustee deferred compensation and retirement plans
|
423,035 | |||
|
Other assets
|
62,680 | |||
|
Total assets
|
5,136,395,118 | |||
|
Liabilities: |
||||
|
Payable for:
|
||||
|
Investments purchased
|
7,668,872 | |||
|
Fund shares reacquired
|
8,954,915 | |||
|
Accrued fees to affiliates
|
3,167,728 | |||
|
Accrued other operating expenses
|
365,048 | |||
|
Trustee deferred compensation and retirement plans
|
1,642,430 | |||
|
Total liabilities
|
21,798,993 | |||
|
Net assets applicable to shares outstanding
|
$ | 5,114,596,125 | ||
|
Net assets consist of: |
||||
|
Shares of beneficial interest
|
$ | 4,916,093,196 | ||
|
Undistributed net investment income
|
29,321,282 | |||
|
Undistributed net realized gain (loss)
|
(203,443,025 | ) | ||
|
Unrealized appreciation
|
372,624,672 | |||
| $ | 5,114,596,125 | |||
|
Net Assets: |
||||
|
Class A
|
$ | 4,009,013,804 | ||
|
Class B
|
$ | 169,243,061 | ||
|
Class C
|
$ | 257,790,078 | ||
|
Class R
|
$ | 66,404,807 | ||
|
Class S
|
$ | 21,080,481 | ||
|
Class Y
|
$ | 186,623,354 | ||
|
Institutional Class
|
$ | 404,440,540 | ||
|
Shares outstanding, $0.001 par value per share, with an unlimited number of shares authorized: |
||||
|
Class A
|
244,819,220 | |||
|
Class B
|
10,798,251 | |||
|
Class C
|
16,405,909 | |||
|
Class R
|
4,087,140 | |||
|
Class S
|
1,286,261 | |||
|
Class Y
|
11,351,307 | |||
|
Institutional Class
|
23,977,375 | |||
|
Class A:
|
||||
|
Net asset value per share
|
$ | 16.38 | ||
|
Maximum offering price per share
(Net asset value of $16.38 divided by 94.50%) |
$ | 17.33 | ||
|
Class B:
|
||||
|
Net asset value and offering price per share
|
$ | 15.67 | ||
|
Class C:
|
||||
|
Net asset value and offering price per share
|
$ | 15.71 | ||
|
Class R:
|
||||
|
Net asset value and offering price per share
|
$ | 16.25 | ||
|
Class S:
|
||||
|
Net asset value and offering price per share
|
$ | 16.39 | ||
|
Class Y:
|
||||
|
Net asset value and offering price per share
|
$ | 16.44 | ||
|
Institutional Class:
|
||||
|
Net asset value and offering price per share
|
$ | 16.87 | ||
|
Investment income: |
||||
|
Dividends (net of foreign withholding taxes of $1,686,607)
|
$ | 89,903,686 | ||
|
Dividends from affiliated money market funds (includes
securities lending income of $193,568)
|
960,212 | |||
|
Interest
|
914,732 | |||
|
Total investment income
|
91,778,630 | |||
|
Expenses: |
||||
|
Advisory fees
|
32,889,070 | |||
|
Administrative services fees
|
668,670 | |||
|
Custodian fees
|
219,364 | |||
|
Distribution fees:
|
||||
|
Class A
|
10,386,446 | |||
|
Class B
|
1,964,319 | |||
|
Class C
|
2,568,655 | |||
|
Class R
|
312,337 | |||
|
Class S
|
32,103 | |||
|
Transfer agent fees — A, B, C, R and Y
|
10,801,614 | |||
|
Transfer agent fees — Institutional
|
425,998 | |||
|
Trustees’ and officers’ fees and benefits
|
184,425 | |||
|
Other
|
789,507 | |||
|
Total expenses
|
61,242,508 | |||
|
Less: Fees waived, expenses reimbursed and expense offset
arrangement(s)
|
(1,665,792 | ) | ||
|
Net expenses
|
59,576,716 | |||
|
Net investment income
|
32,201,914 | |||
|
Realized and unrealized gain from: |
||||
|
Net realized gain from:
|
||||
|
Investment securities (includes net gains (losses) from
securities sold to affiliates of $(4,262,028))
|
229,116,196 | |||
|
Foreign currencies
|
595,237 | |||
|
Foreign currency contracts
|
16,541,708 | |||
|
Option contracts written
|
206,890 | |||
| 246,460,031 | ||||
|
Change in net unrealized appreciation of:
|
||||
|
Investment securities
|
102,262,393 | |||
|
Foreign currencies
|
2,169 | |||
|
Foreign currency contracts
|
2,002,111 | |||
| 104,266,673 | ||||
|
Net realized and unrealized gain
|
350,726,704 | |||
|
Net increase in net assets resulting from operations
|
$ | 382,928,618 | ||
| 2011 | 2010 | |||||||
|
Operations: |
||||||||
|
Net investment income
|
$ | 32,201,914 | $ | 21,932,791 | ||||
|
Net realized gain
|
246,460,031 | 168,010,253 | ||||||
|
Change in net unrealized appreciation
|
104,266,673 | 226,876,614 | ||||||
|
Net increase in net assets resulting from operations
|
382,928,618 | 416,819,657 | ||||||
|
Distributions to shareholders from net investment income: |
||||||||
|
Class A
|
(16,996,643 | ) | (25,440,826 | ) | ||||
|
Class R
|
(119,814 | ) | (147,321 | ) | ||||
|
Class S
|
(108,864 | ) | (44,845 | ) | ||||
|
Class Y
|
(1,185,231 | ) | (541,375 | ) | ||||
|
Institutional Class
|
(5,169,364 | ) | (3,373,002 | ) | ||||
|
Total distributions from net investment income
|
(23,579,916 | ) | (29,547,369 | ) | ||||
|
Share transactions–net: |
||||||||
|
Class A
|
(296,875,399 | ) | (194,784,810 | ) | ||||
|
Class B
|
(55,866,676 | ) | (91,376,929 | ) | ||||
|
Class C
|
(2,314,895 | ) | 1,257,722 | |||||
|
Class R
|
5,464,706 | 29,187,922 | ||||||
|
Class S
|
(247,092 | ) | 18,011,782 | |||||
|
Class Y
|
8,202,887 | 91,078,950 | ||||||
|
Institutional Class
|
(202,986,610 | ) | 210,567,768 | |||||
|
Net increase (decrease) in net assets resulting from share
transactions
|
(544,623,079 | ) | 63,942,405 | |||||
|
Net increase (decrease) in net assets
|
(185,274,377 | ) | 451,214,693 | |||||
|
Net assets: |
||||||||
|
Beginning of year
|
5,299,870,502 | 4,848,655,809 | ||||||
|
End of year (includes undistributed net investment income of
$29,321,282 and $20,105,544, respectively)
|
$ | 5,114,596,125 | $ | 5,299,870,502 | ||||
| A. | Security Valuations — Securities, including restricted securities, are valued according to the following policy. | |
| A security listed or traded on an exchange (except convertible bonds) is valued at its last sales price or official closing price as of the close of the customary trading session on the exchange where the security is principally traded, or lacking any sales or official closing price on a particular day, the security may be valued at the closing bid price on that day. Securities traded in the over-the-counter market are valued based on prices furnished by independent pricing services or market makers. When such securities are valued by an independent pricing service they may be considered fair valued. Futures contracts are valued at the final settlement price set by an exchange on which they are principally traded. Listed options are valued at the mean between the last bid and ask prices from the exchange on which they are principally traded. Options not listed on an exchange are valued by an independent source at the mean between the last bid and ask prices. For purposes of determining net asset value per share, futures and option contracts generally are valued 15 minutes after the close of the customary trading session of the New York Stock Exchange (“NYSE”). | ||
| Investments in open-end and closed-end registered investment companies that do not trade on an exchange are valued at the end of day net asset value per share. Investments in open-end and closed-end registered investment companies that trade on an exchange are valued at the last sales price or official closing price as of the close of the customary trading session on the exchange where the security is principally traded. | ||
| Debt obligations (including convertible bonds) and unlisted equities are fair valued using an evaluated quote provided by an independent pricing service. Evaluated quotes provided by the pricing service may be determined without exclusive reliance on quoted prices, and may reflect appropriate factors such as institution-size trading in similar groups of securities, developments related to specific securities, dividend rate, yield, quality, type of issue, coupon rate, maturity, individual trading characteristics and other market data. Debt securities are subject to interest rate and credit risks. In addition, all debt securities involve some risk of default with respect to interest and/or principal payments. | ||
| Foreign securities (including foreign exchange contracts) are converted into U.S. dollar amounts using the applicable exchange rates as of the close of the NYSE. If market quotations are available and reliable for foreign exchange traded equity securities, the securities will be valued at the market quotations. Because trading hours for certain foreign securities end before the close of the NYSE, closing market quotations may become unreliable. If between the time trading ends on a particular security and the close of the customary trading session on the NYSE, events occur that are significant and make the closing price unreliable, the Fund may fair value the security. If the event is likely to have affected the closing price of the security, the security will be valued at fair value in good faith using procedures approved by the Board of Trustees. Adjustments to closing prices to reflect fair value may also be based on a screening process of an independent pricing service to indicate the degree of certainty, based on historical data, that the closing price in the principal market where a foreign security trade is not the current value as of the close of the NYSE. Foreign securities meeting the approved degree of certainty that the price is not reflective of current value will be priced at the indication of fair value from the independent pricing service. Multiple factors may be considered by the independent pricing service in determining adjustments to reflect fair value and may include information relating to sector indices, American Depositary Receipts and domestic and foreign index futures. Foreign securities may have additional risks including exchange rate changes, potential for sharply devalued currencies and high inflation, political and economical upheaval, the relative lack of issuer information, relatively low market liquidity and the potential lack of strict financial and accounting controls and standards. | ||
| Securities for which market prices are not provided by any of the above methods may be valued based upon quotes furnished by independent sources. The last bid price may be used to value equity securities. The mean between the last bid and asked prices is used to value debt obligations, including Corporate Loans. | ||
| Securities for which market quotations are not readily available or are unreliable are valued at fair value as determined in good faith by or under the supervision of the Trust’s officers following procedures approved by the Board of Trustees. Issuer specific events, market trends, bid/ask quotes of brokers and information providers and other market data may be reviewed in the course of making a good faith determination of a security’s fair value. | ||
| Valuations change in response to many factors including the historical and prospective earnings of the issuer, the value of the issuer’s assets, general economic conditions, interest rates, investor perceptions and market liquidity. Because of the inherent uncertainties of valuation, the values reflected in the financial statements may materially differ from the value received upon actual sale of those investments. | ||
| B. | Securities Transactions and Investment Income — Securities transactions are accounted for on a trade date basis. Realized gains or losses on sales are computed on the basis of specific identification of the securities sold. Interest income is recorded on the accrual basis from settlement date. Dividend income (net of withholding tax, if any) is recorded on the ex-dividend date. | |
| The Fund may periodically participate in litigation related to Fund investments. As such, the Fund may receive proceeds from litigation settlements. Any proceeds received are included in the Statement of Operations as realized gain (loss) for investments no longer held and as unrealized gain (loss) for investments still held. | ||
| Brokerage commissions and mark ups are considered transaction costs and are recorded as an increase to the cost basis of securities purchased and/or a reduction of proceeds on a sale of securities. Such transaction costs are included in the determination of net realized and unrealized gain (loss) from investment securities reported in the Statement of Operations and the Statement of Changes in Net Assets and the net realized and unrealized gains (losses) on securities per share in the Financial Highlights. Transaction costs are included in the calculation of the Fund’s net asset value and, accordingly, they reduce the Fund’s total returns. These transaction costs are not considered operating expenses and are not reflected in net investment income reported in the Statement of Operations and Statement of Changes in Net Assets, or the net investment income per share and ratios of expenses and net investment income reported in the Financial Highlights, nor are they limited by any expense limitation arrangements between the Fund and the investment adviser. | ||
| The Fund allocates income and realized and unrealized capital gains and losses to a class based on the relative net assets of each class. | ||
| C. | Country Determination — For the purposes of making investment selection decisions and presentation in the Schedule of Investments, the investment adviser may determine the country in which an issuer is located and/or credit risk exposure based on various factors. These factors include the laws of the country under which the issuer is organized, where the issuer maintains a principal office, the country in which the issuer derives 50% or more of its total revenues and the country that has the primary market for the issuer’s securities, as well as other criteria. Among the other criteria that may be evaluated for making this determination are the country in which the issuer maintains 50% or more of its assets, the type of security, financial guarantees |
| and enhancements, the nature of the collateral and the sponsor organization. Country of issuer and/or credit risk exposure has been determined to be the United States of America, unless otherwise noted. | ||
| D. | Distributions — Distributions from income and net realized capital gain, if any, are generally paid annually and recorded on ex-dividend date. The Fund may elect to treat a portion of the proceeds from redemptions as distributions for federal income tax purposes. | |
| E. | Federal Income Taxes — The Fund intends to comply with the requirements of Subchapter M of the Internal Revenue Code necessary to qualify as a regulated investment company and to distribute substantially all of the Fund’s taxable earnings to shareholders. As such, the Fund will not be subject to federal income taxes on otherwise taxable income (including net realized capital gain) that is distributed to shareholders. Therefore, no provision for federal income taxes is recorded in the financial statements. | |
| The Fund files tax returns in the U.S. Federal jurisdiction and certain other jurisdictions. Generally, the Fund is subject to examinations by such taxing authorities for up to three years after the filing of the return for the tax period. | ||
| F. | Expenses — Fees provided for under the Rule 12b-1 plan of a particular class of the Fund are charged to the operations of such class. Transfer agency fees and expenses and other shareholder recordkeeping fees and expenses attributable to the Institutional Class are charged to such class. Transfer agency fees and expenses and other shareholder recordkeeping fees and expenses relating to all other classes are allocated among those classes based on relative net assets. All other expenses are allocated among the classes based on relative net assets. | |
| G. | Accounting Estimates — The preparation of financial statements in conformity with accounting principles generally accepted in the United States of America (“GAAP”) requires management to make estimates and assumptions that affect the reported amounts of assets and liabilities at the date of the financial statements and the reported amounts of revenues and expenses during the reporting period including estimates and assumptions related to taxation. Actual results could differ from those estimates by a significant amount. In addition, the Fund monitors for material events or transactions that may occur or become known after the period-end date and before the date the financial statements are released to print. | |
| H. | Indemnifications — Under the Trust’s organizational documents, each Trustee, officer, employee or other agent of the Trust is indemnified against certain liabilities that may arise out of performance of their duties to the Fund. Additionally, in the normal course of business, the Fund enters into contracts, including the Fund’s servicing agreements that contain a variety of indemnification clauses. The Fund’s maximum exposure under these arrangements is unknown as this would involve future claims that may be made against the Fund that have not yet occurred. The risk of material loss as a result of such indemnification claims is considered remote. | |
| I. | Securities Lending — The Fund may lend portfolio securities having a market value up to one-third of the Fund’s total assets. Such loans are secured by collateral equal to no less than the market value of the loaned securities determined daily by the securities lending provider. Such collateral will be cash or debt securities issued or guaranteed by the U.S. Government or any of its sponsored agencies. Cash collateral received in connection with these loans is invested in short-term money market instruments or affiliated money market funds and is shown as such on the Schedule of Investments. It is the Fund’s policy to obtain additional collateral from or return excess collateral to the borrower by the end of the next business day, following the valuation date of the securities loaned. Therefore, the value of the collateral held may be temporarily less than the value of the securities on loan. Lending securities entails a risk of loss to the Fund if and to the extent that the market value of the securities loaned were to increase and the borrower did not increase the collateral accordingly, and the borrower fails to return the securities. Upon the failure of the borrower to return the securities, collateral may be liquidated and the securities may be purchased on the open market to replace the loaned securities. The Fund could experience delays and costs in gaining access to the collateral. The Fund bears the risk of any deficiency in the amount of the collateral available for return to the borrower due to any loss on the collateral invested. Dividends received on cash collateral investments for securities lending transactions, which are net of compensation to counterparties, is included in Dividends from affiliates on the Statement of Operations. The aggregate value of securities out on loan is shown as a footnote on the Statement of Assets and Liabilities, if any. | |
| J. | Foreign Currency Translations — Foreign currency is valued at the close of the NYSE based on quotations posted by banks and major currency dealers. Portfolio securities and other assets and liabilities denominated in foreign currencies are translated into U.S. dollar amounts at date of valuation. Purchases and sales of portfolio securities (net of foreign taxes withheld on disposition) and income items denominated in foreign currencies are translated into U.S. dollar amounts on the respective dates of such transactions. The Fund does not separately account for the portion of the results of operations resulting from changes in foreign exchange rates on investments and the fluctuations arising from changes in market prices of securities held. The combined results of changes in foreign exchange rates and the fluctuation of market prices on investments (net of estimated foreign tax withholding) are included with the net realized and unrealized gain or loss from investments in the Statement of Operations. Reported net realized foreign currency gains or losses arise from (1) sales of foreign currencies, (2) currency gains or losses realized between the trade and settlement dates on securities transactions, and (3) the difference between the amounts of dividends, interest, and foreign withholding taxes recorded on the Fund’s books and the U.S. dollar equivalent of the amounts actually received or paid. Net unrealized foreign currency gains and losses arise from changes in the fair values of assets and liabilities, other than investments in securities at fiscal period end, resulting from changes in exchange rates. | |
| The Fund may invest in foreign securities which may be subject to foreign taxes on income, gains on investments or currency repatriation, a portion of which may be recoverable. | ||
| K. | Foreign Currency Contracts — The Fund may enter into foreign currency contracts to manage or minimize currency or exchange rate risk. The Fund may also enter into foreign currency contracts for the purchase or sale of a security denominated in a foreign currency in order to “lock in” the U.S. dollar price of that security. A foreign currency contract is an obligation to purchase or sell a specific currency for an agreed-upon price at a future date. The use of foreign currency contracts does not eliminate fluctuations in the price of the underlying securities the Fund owns or intends to acquire but establishes a rate of exchange in advance. Fluctuations in the value of these contracts are measured by the difference in the contract date and reporting date exchange rates and are recorded as unrealized appreciation (depreciation) until the contracts are closed. When the contracts are closed, realized gains (losses) are recorded. Realized and unrealized gains (losses) on the contracts are included in the Statement of Operations. The primary risks associated with foreign currency contracts include failure of the counterparty to meet the terms of the contract and the value of the foreign currency changing unfavorably. These risks may be in excess of the amounts reflected in the Statement of Assets and Liabilities. |
| L. | Call Options Written — The Fund may write call options. A call option gives the purchaser of such option the right to buy, and the writer (the Fund) the obligation to sell, the underlying security at the stated exercise price during the option period. Written call options are recorded as a liability in the Statement of Assets and Liabilities. The amount of the liability is subsequently valued to reflect the current market value of the option written. If a written call option expires on the stipulated expiration date, or if the Fund enters into a closing purchase transaction, the Fund realizes a gain (or a loss if the closing purchase transaction exceeds the premium received when the option was written) without regard to any unrealized gain or loss on the underlying security, and the liability related to such option is extinguished. If a written option is exercised, the Fund realizes a gain or a loss from the sale of the underlying security and the proceeds of the sale are increased by the premium originally received. Realized gains and losses on these contracts are included in the Statement of Operations. A risk in writing a call option is that the Fund gives up the opportunity for profit if the market price of the security increases and the option is exercised. |
| Average Daily Net Assets | Rate | |||
|
First $250 million
|
0 | .695% | ||
|
Next $4.05 billion
|
0 | .615% | ||
|
Next $3.9 billion
|
0 | .57% | ||
|
Next $1.8 billion
|
0 | .545% | ||
|
Over $10 billion
|
0 | .52% | ||
| Average Daily Net Assets | Rate | |||
|
First $150 million
|
0 | .80% | ||
|
Over $150 million
|
0 | .625% | ||
| Average Daily Net Assets | Rate | |||
|
First $150 million
|
0 | .75% | ||
|
Next $4.85 billion
|
0 | .615% | ||
|
Next $2.5 billion
|
0 | .57% | ||
|
Next $2.5 billion
|
0 | .545% | ||
|
Over $10 billion
|
0 | .52% | ||
| Level 1 — | Prices are determined using quoted prices in an active market for identical assets. | |
| Level 2 — | Prices are determined using other significant observable inputs. Observable inputs are inputs that other market participants may use in pricing a security. These may include quoted prices for similar securities, interest rates, prepayment speeds, credit risk, yield curves, loss severities, default rates, discount rates, volatilities and others. | |
| Level 3 — | Prices are determined using significant unobservable inputs. In situations where quoted prices or observable inputs are unavailable (for example, when there is little or no market activity for an investment at the end of the period), unobservable inputs may be used. Unobservable inputs reflect the Fund’s own assumptions about the factors market participants would use in determining fair value of the securities or instruments and would be based on the best available information. |
| Level 1 | Level 2 | Level 3 | Total | |||||||||||||
|
Equity Securities
|
$ | 4,708,762,865 | $ | 383,570,123 | $ | — | $ | 5,092,332,988 | ||||||||
|
Location of Gain
on |
||||||||
| Statement of Operations | ||||||||
|
Foreign
Currency |
||||||||
| Contracts* | Options* | |||||||
|
Realized Gain
|
||||||||
|
Currency risk
|
$ | 16,541,708 | $ | — | ||||
|
Equity risk
|
— | 206,890 | ||||||
|
Change in Unrealized Appreciation
|
||||||||
|
Currency risk
|
2,002,111 | — | ||||||
|
Total
|
$ | 18,543,819 | $ | 206,890 | ||||
| * | The average notional value of foreign currency contracts and options outstanding during the period was $66,890,635 and $17,241, respectively. |
| Closed Foreign Currency Contracts | ||||||||||||||||||||||
|
Closed |
Contract to |
Notional |
Realized |
|||||||||||||||||||
| Date | Counterparty | Deliver | Receive | Value | Gain | |||||||||||||||||
|
09/22/2011
|
Deutsche Bank | CHF | 13,000,000 | USD | 17,104,588 | $ | 14,321,124 | $ | 2,783,464 | |||||||||||||
|
11/14/2011
|
Deutsche Bank | CHF | 65,000,000 | USD | 85,522,940 | 74,664,584 | 10,858,356 | |||||||||||||||
|
10/28/2011
|
Morgan Stanley | CHF | 27,105,978 | USD | 34,605,732 | 31,458,588 | 3,147,144 | |||||||||||||||
|
10/28/2011
|
Morgan Stanley | CHF | 29,894,022 | USD | 38,051,019 | 34,694,329 | 3,356,690 | |||||||||||||||
| $ | 20,145,654 | |||||||||||||||||||||
|
CHF — Swiss Franc
|
||
|
USD — U.S. Dollar
|
| Call Option Contracts-Transactions During the Period | ||||||||
|
Number of |
Premiums |
|||||||
| Contracts | Received | |||||||
|
Beginning of period
|
— | $ | — | |||||
|
Written
|
7,527 | 206,890 | ||||||
|
Expired
|
(7,527 | ) | (206,890 | ) | ||||
|
End of period
|
— | $ | — | |||||
| 2011 | 2010 | |||||||
|
Ordinary income
|
$ | 23,579,916 | $ | 29,547,369 | ||||
| 2011 | ||||
|
Undistributed ordinary income
|
$ | 30,963,671 | ||
|
Net unrealized appreciation — investments
|
352,579,359 | |||
|
Net unrealized appreciation — other investments
|
145,789 | |||
|
Temporary book/tax differences
|
(1,642,389 | ) | ||
|
Capital loss carryforward
|
(183,543,501 | ) | ||
|
Shares of beneficial interest
|
4,916,093,196 | |||
|
Total net assets
|
$ | 5,114,596,125 | ||
|
Capital Loss |
||||
| Expiration | Carryforward* | |||
|
10/17/2017
|
$ | 174,278,052 | ||
|
10/31/2018
|
9,265,449 | |||
|
Total capital loss carryforward
|
$ | 183,543,501 | ||
| * | Capital loss carryforward as of the date listed above is reduced for limitations, if any, to the extent required by the Internal Revenue Code. To the extent that unrealized gains as of May 23, 2011, the date of reorganization of Invesco Multi-Sector Fund into the Fund and realized on securities held in each fund at such date of reorganization, the capital loss carryforward may be further limited for up to five years from the date of the reorganization. |
| Unrealized Appreciation (Depreciation) of Investment Securities on a Tax Basis | ||||
|
Aggregate unrealized appreciation of investment securities
|
$ | 580,786,741 | ||
|
Aggregate unrealized (depreciation) of investment securities
|
(228,207,382 | ) | ||
|
Net unrealized appreciation of investment securities
|
$ | 352,579,359 | ||
| Cost of investments for tax purposes is $4,739,753,629. | ||||
| Summary of Share Activity | ||||||||||||||||
| Year ended October 31, | ||||||||||||||||
| 2011(a) | 2010 | |||||||||||||||
| Shares | Amount | Shares | Amount | |||||||||||||
|
Sold:
|
||||||||||||||||
|
Class A
|
18,544,083 | $ | 304,679,496 | 34,149,332 | $ | 510,485,029 | ||||||||||
|
Class B
|
468,572 | 7,320,112 | 1,399,875 | 20,212,011 | ||||||||||||
|
Class C
|
1,681,192 | 26,586,580 | 3,370,978 | 48,862,008 | ||||||||||||
|
Class R
|
2,025,310 | 32,998,196 | 3,155,344 | 46,578,314 | ||||||||||||
|
Class S
|
158,109 | 2,604,980 | 1,291,781 | 19,337,328 | ||||||||||||
|
Class Y
|
4,108,343 | 67,775,994 | 8,532,661 | 130,070,744 | ||||||||||||
|
Institutional Class
|
5,984,524 | 101,345,494 | 18,337,266 | 280,786,415 | ||||||||||||
|
Issued as reinvestment of dividends:
|
||||||||||||||||
|
Class A
|
968,264 | 15,376,037 | 1,577,828 | 23,399,187 | ||||||||||||
|
Class R
|
7,587 | 119,798 | 9,986 | 147,296 | ||||||||||||
|
Class S
|
6,796 | 107,848 | 2,997 | 44,419 | ||||||||||||
|
Class Y
|
65,011 | 1,033,677 | 32,273 | 479,572 | ||||||||||||
|
Institutional Class
|
300,029 | 4,890,481 | 206,179 | 3,138,052 | ||||||||||||
|
Issued in connection with
acquisitions:(b)
|
||||||||||||||||
|
Class A
|
8,168,481 | 142,299,641 | — | — | ||||||||||||
|
Class B
|
1,414,896 | 23,669,329 | — | — | ||||||||||||
|
Class C
|
2,068,782 | 34,699,917 | — | — | ||||||||||||
|
Class Y
|
152,044 | 2,656,493 | — | — | ||||||||||||
|
Institutional Class
|
70,262 | 1,258,544 | — | — | ||||||||||||
|
Automatic conversion of Class B shares to Class A
shares:
|
||||||||||||||||
|
Class A
|
3,192,150 | 53,048,338 | 4,792,275 | 71,964,159 | ||||||||||||
|
Class B
|
(3,323,957 | ) | (53,048,338 | ) | (4,974,156 | ) | (71,964,159 | ) | ||||||||
|
Reacquired:
|
||||||||||||||||
|
Class A
|
(49,333,203 | ) | (812,278,911 | ) | (53,706,198 | ) | (800,633,185 | ) | ||||||||
|
Class B
|
(2,131,936 | ) | (33,807,779 | ) | (2,758,135 | ) | (39,624,781 | ) | ||||||||
|
Class C
|
(4,031,156 | ) | (63,601,392 | ) | (3,299,244 | ) | (47,604,286 | ) | ||||||||
|
Class R
|
(1,700,231 | ) | (27,653,288 | ) | (1,193,942 | ) | (17,537,688 | ) | ||||||||
|
Class S
|
(179,453 | ) | (2,959,920 | ) | (92,140 | ) | (1,369,965 | ) | ||||||||
|
Class Y
|
(3,855,145 | ) | (63,263,277 | ) | (2,626,554 | ) | (39,471,366 | ) | ||||||||
|
Institutional Class
|
(18,630,462 | ) | (310,481,129 | ) | (4,800,560 | ) | (73,356,699 | ) | ||||||||
|
Net increase (decrease) in share activity
|
(33,801,108 | ) | $ | (544,623,079 | ) | 3,407,846 | $ | 63,942,405 | ||||||||
| (a) | There are entities that are record owners of more than 5% of the outstanding shares of the Fund and in the aggregate own 25% of the outstanding shares of the Fund. IDI has an agreement with these entities to sell Fund shares. The Fund, Invesco and/or Invesco affiliates may make payments to these entities, which are considered to be related to the Fund, for providing services to the Fund, Invesco and/or Invesco affiliates including but not limited to services such as securities brokerage, distribution, third party record keeping and account servicing. The Fund has no knowledge as to whether all or any portion of the shares owned of record by these entities are also owned beneficially. | |
| (b) | As of the opening of business on May 23, 2011, the Fund acquired all the net assets of Invesco Multi Sector Fund pursuant to a plan of reorganization approved by the Trustees of the Fund on November 10, 2010 and by the shareholders of Invesco Multi Sector Fund on April 14, 2011. The acquisition was accomplished by a tax-free exchange of 11,874,465 shares of the Fund for 8,680,800 shares outstanding of Invesco Multi Sector Fund as of the close of business on May 20, 2011. Each class of Invesco Multi Sector Fund was exchanged for the like class of shares of the Fund based on the relative net asset value of Invesco Mutli Sector Fund to the net asset value of the Fund on the close of business, May 20, 2011. Invesco Multi Sector Fund’s net assets at that date of $204,583,924, including $44,664,612 of unrealized appreciation, was combined with those of the Fund. The net assets of the Fund immediately before the acquisition were $5,424,709,924. The net assets of the Fund immediately following the acquisition were $5,629,293,848. |
|
Ratio of |
Ratio of |
|||||||||||||||||||||||||||||||||||||||||||||||
|
Net gains |
expenses |
expenses |
||||||||||||||||||||||||||||||||||||||||||||||
|
(loss) on |
to average |
to average net |
Ratio of net |
|||||||||||||||||||||||||||||||||||||||||||||
|
Net asset |
Net |
securities |
Dividends |
net assets |
assets without |
investment |
||||||||||||||||||||||||||||||||||||||||||
|
value, |
investment |
(both |
Total from |
from net |
Net asset |
Net assets, |
with fee
waivers |
fee waivers |
income (loss) |
|||||||||||||||||||||||||||||||||||||||
|
beginning |
income |
realized and |
investment |
investment |
value, end |
Total |
end of period |
and/or
expenses |
and/or
expenses |
to average |
Portfolio |
|||||||||||||||||||||||||||||||||||||
| of period | (loss)(a) | unrealized) | operations | income | of period | return(b) | (000s omitted) | absorbed | absorbed | net assets | turnover(c) | |||||||||||||||||||||||||||||||||||||
| Class A | ||||||||||||||||||||||||||||||||||||||||||||||||
| Year ended 10/31/11 | $ | 15.30 | $ | 0.10 | $ | 1.04 | $ | 1.14 | $ | (0.06 | ) | $ | 16.38 | 7.50 | % | $ | 4,009,014 | 1.10 | %(e) | 1.13 | %(e) | 0.64 | %(e) | 40 | % | |||||||||||||||||||||||
| Year ended 10/31/10 | 14.16 | 0.07 | 1.16 | (d) | 1.23 | (0.09 | ) | 15.30 | 8.72 | (d) | 4,027,296 | 1.14 | 1.18 | 0.45 | 48 | |||||||||||||||||||||||||||||||||
| Year ended 10/31/09 | 12.46 | 0.09 | 1.76 | (d) | 1.85 | (0.15 | ) | 14.16 | 15.19 | (d) | 3,915,161 | 1.26 | 1.29 | 0.76 | 32 | |||||||||||||||||||||||||||||||||
| Year ended 10/31/08 | 17.30 | 0.14 | (4.76 | ) | (4.62 | ) | (0.22 | ) | 12.46 | (27.00 | ) | 3,454,370 | 1.19 | 1.23 | 0.88 | 38 | ||||||||||||||||||||||||||||||||
| Year ended 10/31/07 | 14.96 | 0.20 | 2.25 | (d) | 2.45 | (0.11 | ) | 17.30 | 16.44 | (d) | 5,005,716 | 1.16 | 1.19 | 1.25 | 39 | |||||||||||||||||||||||||||||||||
| Class B | ||||||||||||||||||||||||||||||||||||||||||||||||
| Year ended 10/31/11 | 14.69 | (0.02 | ) | 1.00 | 0.98 | — | 15.67 | 6.67 | 169,243 | 1.85 | (e) | 1.88 | (e) | (0.11 | )(e) | 40 | ||||||||||||||||||||||||||||||||
| Year ended 10/31/10 | 13.62 | (0.04 | ) | 1.11 | (d) | 1.07 | — | 14.69 | 7.86 | (d) | 211,105 | 1.89 | 1.93 | (0.30 | ) | 48 | ||||||||||||||||||||||||||||||||
| Year ended 10/31/09 | 11.91 | 0.00 | 1.71 | (d) | 1.71 | — | 13.62 | 14.36 | (d) | 281,911 | 2.01 | 2.04 | 0.01 | 32 | ||||||||||||||||||||||||||||||||||
| Year ended 10/31/08 | 16.50 | 0.02 | (4.54 | ) | (4.52 | ) | (0.07 | ) | 11.91 | (27.51 | ) | 388,985 | 1.94 | 1.98 | 0.13 | 38 | ||||||||||||||||||||||||||||||||
| Year ended 10/31/07 | 14.30 | 0.08 | 2.14 | (d) | 2.22 | (0.02 | ) | 16.50 | 15.56 | (d) | 1,067,897 | 1.91 | 1.94 | 0.50 | 39 | |||||||||||||||||||||||||||||||||
| Class C | ||||||||||||||||||||||||||||||||||||||||||||||||
| Year ended 10/31/11 | 14.73 | (0.02 | ) | 1.00 | 0.98 | — | 15.71 | 6.65 | 257,790 | 1.85 | (e) | 1.88 | (e) | (0.11 | )(e) | 40 | ||||||||||||||||||||||||||||||||
| Year ended 10/31/10 | 13.65 | (0.04 | ) | 1.12 | 1.08 | — | 14.73 | 7.91 | (d) | 245,757 | 1.89 | 1.93 | (0.30 | ) | 48 | |||||||||||||||||||||||||||||||||
| Year ended 10/31/09 | 11.94 | 0.00 | 1.71 | (d) | 1.71 | — | 13.65 | 14.32 | (d) | 226,830 | 2.01 | 2.04 | 0.01 | 32 | ||||||||||||||||||||||||||||||||||
| Year ended 10/31/08 | 16.55 | 0.02 | (4.56 | ) | (4.54 | ) | (0.07 | ) | 11.94 | (27.55 | ) | 179,759 | 1.94 | 1.98 | 0.13 | 38 | ||||||||||||||||||||||||||||||||
| Year ended 10/31/07 | 14.34 | 0.08 | 2.15 | (d) | 2.23 | (0.02 | ) | 16.55 | 15.58 | (d) | 272,904 | 1.91 | 1.94 | 0.50 | 39 | |||||||||||||||||||||||||||||||||
| Class R | ||||||||||||||||||||||||||||||||||||||||||||||||
| Year ended 10/31/11 | 15.18 | 0.06 | 1.04 | 1.10 | (0.03 | ) | 16.25 | 7.26 | 66,405 | 1.35 | (e) | 1.38 | (e) | 0.39 | (e) | 40 | ||||||||||||||||||||||||||||||||
| Year ended 10/31/10 | 14.07 | 0.03 | 1.15 | (d) | 1.18 | (0.07 | ) | 15.18 | 8.43 | (d) | 57,003 | 1.39 | 1.43 | 0.20 | 48 | |||||||||||||||||||||||||||||||||
| Year ended 10/31/09 | 12.38 | 0.07 | 1.75 | (d) | 1.82 | (0.13 | ) | 14.07 | 14.93 | (d) | 25,096 | 1.51 | 1.54 | 0.51 | 32 | |||||||||||||||||||||||||||||||||
| Year ended 10/31/08 | 17.18 | 0.10 | (4.73 | ) | (4.63 | ) | (0.17 | ) | 12.38 | (27.19 | ) | 7,717 | 1.44 | 1.48 | 0.63 | 38 | ||||||||||||||||||||||||||||||||
| Year ended 10/31/07 | 14.87 | 0.16 | 2.23 | (e) | 2.39 | (0.08 | ) | 17.18 | 16.12 | (e) | 6,565 | 1.41 | 1.44 | 1.00 | 39 | |||||||||||||||||||||||||||||||||
| Class S | ||||||||||||||||||||||||||||||||||||||||||||||||
| Year ended 10/31/11 | 15.31 | 0.12 | 1.04 | 1.16 | (0.08 | ) | 16.39 | 7.62 | 21,080 | 1.00 | (e) | 1.03 | (e) | 0.74 | (e) | 40 | ||||||||||||||||||||||||||||||||
| Year ended 10/31/10 | 14.16 | 0.08 | 1.16 | (d) | 1.24 | (0.09 | ) | 15.31 | 8.80 | (d) | 19,916 | 1.04 | 1.08 | 0.55 | 48 | |||||||||||||||||||||||||||||||||
| Year ended 10/31/09(f) | 14.25 | 0.01 | (0.10 | ) | (0.09 | ) | — | 14.16 | (0.63 | ) | 1,390 | 1.09 | (g) | 1.12 | (g) | 0.93 | (g) | 32 | ||||||||||||||||||||||||||||||
| Class Y | ||||||||||||||||||||||||||||||||||||||||||||||||
| Year ended 10/31/11 | 15.36 | 0.15 | 1.04 | 1.19 | (0.11 | ) | 16.44 | 7.78 | 186,623 | 0.85 | (e) | 0.88 | (e) | 0.89 | (e) | 40 | ||||||||||||||||||||||||||||||||
| Year ended 10/31/10 | 14.20 | 0.11 | 1.15 | (d) | 1.26 | (0.10 | ) | 15.36 | 8.93 | (d) | 167,170 | 0.89 | 0.93 | 0.70 | 48 | |||||||||||||||||||||||||||||||||
| Year ended 10/31/09 | 12.46 | 0.13 | 1.77 | (d) | 1.90 | (0.16 | ) | 14.20 | 15.54 | (d) | 70,187 | 1.01 | 1.04 | 1.01 | 32 | |||||||||||||||||||||||||||||||||
| Year ended 10/31/08(f) | 13.94 | 0.01 | (1.49 | ) | (1.48 | ) | — | 12.46 | (10.62 | ) | 9,424 | 0.97 | (g) | 1.01 | (g) | 1.10 | (g) | 38 | ||||||||||||||||||||||||||||||
| Institutional Class | ||||||||||||||||||||||||||||||||||||||||||||||||
| Year ended 10/31/11 | 15.77 | 0.17 | 1.07 | 1.24 | (0.14 | ) | 16.87 | 7.92 | 404,441 | 0.73 | (e) | 0.76 | (e) | 1.01 | (e) | 40 | ||||||||||||||||||||||||||||||||
| Year ended 10/31/10 | 14.57 | 0.14 | 1.20 | (d) | 1.34 | (0.14 | ) | 15.77 | 9.20 | (d) | 571,624 | 0.71 | 0.75 | 0.88 | 48 | |||||||||||||||||||||||||||||||||
| Year ended 10/31/09 | 12.83 | 0.16 | 1.80 | (d) | 1.96 | (0.22 | ) | 14.57 | 15.74 | (d) | 328,081 | 0.75 | 0.78 | 1.27 | 32 | |||||||||||||||||||||||||||||||||
| Year ended 10/31/08 | 17.81 | 0.20 | (4.88 | ) | (4.68 | ) | (0.30 | ) | 12.83 | (26.68 | ) | 202,467 | 0.76 | 0.80 | 1.31 | 38 | ||||||||||||||||||||||||||||||||
| Year ended 10/31/07 | 15.38 | 0.28 | 2.31 | (d) | 2.59 | (0.16 | ) | 17.81 | 16.96 | (d) | 134,745 | 0.73 | 0.76 | 1.68 | 39 | |||||||||||||||||||||||||||||||||
| (a) | Calculated using average shares outstanding. | |
| (b) | Includes adjustments in accordance with accounting principles generally accepted in the United States of America and as such, the net asset value for financial reporting purposes and the returns based upon those net asset values may differ from the net asset value and returns for shareholder transactions. Does not include sales charges and is not annualized for periods less than one year, if applicable. | |
| (c) | Portfolio turnover is calculated at the fund level and is not annualized for periods less than one year, if applicable. For the period ending October 31, 2011, the portfolio turnover calculation excludes the value of securities purchased of $158,423,180 and sold of $177,461,241 in the effort to realign the Fund’s portfolio holdings after the reorganization of Invesco Multi Sector Fund into in the Fund. | |
| (d) | Includes litigation proceeds received during the period. Had the litigation proceeds not been received Net gains on securities (both realized and unrealized) per share for the year ended October 31, 2010 would have been $1.11, $1.06, $1.07, $1.10, $1.11, $1.10 and $1.15 for Class A, Class B, Class C, Class R, Class S, Class Y and Institutional Class, respectively and total return would have been lower. Net gains on securities (both realized and unrealized) per share for the year ended October 31, 2009 would have been $1.57, $1.52, $1.52, $1.56, $1.58 and $1.61 for Class A, Class B, Class C, Class R, Class Y and Institutional Class, respectively and total return would have been lower. Net gains on securities (both realized and unrealized) per share for the year ended October 31, 2007 would have been $2.12, $2.01, $2.02, $2.10 and $2.18 for Class A, Class B, Class C, Class R and Institutional Class, respectively and total return would have been lower. | |
| (e) | Ratios are based on average daily net assets (000’s) of $4,154,579, $196,432, $256,865, $62,467, $21,402, $171,257 and $425,998 for Class A, Class B, Class C, Class R, Class S, Class Y, and Institutional Class shares, respectively. | |
| (f) | Commencement date of September 25, 2009 and October 3, 2008 for Class S and Class Y shares, respectively. | |
| (g) | Annualized. |
|
HYPOTHETICAL |
||||||||||||||||||||||||||||||
| ACTUAL | (5% annual return before expenses) | |||||||||||||||||||||||||||||
|
Ending |
Expenses |
Ending |
Expenses |
Annualized |
||||||||||||||||||||||||||
|
Beginning |
Account Value |
Paid During |
Account Value |
Paid During |
Expense |
|||||||||||||||||||||||||
| Class | Account Value | (10/31/11)1 | Period2 | (10/31/11) | Period2 | Ratio | ||||||||||||||||||||||||
|
A
|
$ | 1,000.00 | $ | 930.70 | $ | 5.35 | $ | 1,019.66 | $ | 5.60 | 1.10 | % | ||||||||||||||||||
|
B
|
1,000.00 | 927.30 | 8.99 | 1,015.88 | 9.40 | 1.85 | ||||||||||||||||||||||||
|
C
|
1,000.00 | 926.90 | 8.99 | 1,015.88 | 9.40 | 1.85 | ||||||||||||||||||||||||
|
R
|
1,000.00 | 929.10 | 6.56 | 1,018.40 | 6.87 | 1.35 | ||||||||||||||||||||||||
|
Y
|
1,000.00 | 931.40 | 4.14 | 1,020.92 | 4.33 | 0.85 | ||||||||||||||||||||||||
|
S
|
1,000.00 | 930.70 | 4.87 | 1020.16 | 5.09 | 1.00 | ||||||||||||||||||||||||
|
Institutional
|
1,000.00 | 932.60 | 3.73 | 1,021.48 | 3.77 | 0.74 | ||||||||||||||||||||||||
| 1 | The actual ending account value is based on the actual total return of the Fund for the period May 1, 2011 through October 31, 2011, after actual expenses and will differ from the hypothetical ending account value which is based on the Fund’s expense ratio and a hypothetical annual return of 5% before expenses. |
| 2 | Expenses are equal to the Fund’s annualized expense ratio as indicated above multiplied by the average account value over the period, multiplied by184/365 to reflect the most recent fiscal half year. |
| Approval of Investment Advisory and Sub-Advisory Contracts |
| A. | Nature, Extent and Quality of Services Provided by Invesco Advisers and the Affiliated Sub-Advisers |
| B. | Fund Performance |
| C. | Advisory and Sub-Advisory Fees and Fee Waivers |
| D. | Economies of Scale and Breakpoints |
| E. | Profitability and Financial Resources |
| F. | Collateral Benefits to Invesco Advisers and its Affiliates |
|
Federal and State Income
Tax
|
||||
|
Qualified Dividend Income*
|
100% | |||
| Corporate Dividends Received Deduction* | 100% | |||
| * | The above percentages are based on ordinary income dividends paid to shareholders during the Fund’s fiscal year. |
|
Number of |
||||||||
|
Funds in |
||||||||
|
Fund Complex |
||||||||
|
Name, Year of
Birth and |
Trustee
and/ |
Principal
Occupation(s) |
Overseen by |
Other
Directorship(s) |
||||
| Position(s) Held with the Trust | or Officer Since | During Past 5 Years | Trustee | Held by Trustee | ||||
|
Interested
Persons
|
||||||||
|
Martin L.
Flanagan1 —
1960
Trustee |
2007 | Executive Director, Chief Executive Officer and President, Invesco Ltd. (ultimate parent of Invesco and a global investment management firm); Advisor to the Board, Invesco Advisers, Inc. (formerly known as Invesco Institutional (N.A.), Inc.); Trustee, The Invesco Funds; Vice Chair, Investment Company Institute; and Member of Executive Board, SMU Cox School of Business | 141 | None | ||||
| Formerly: Chairman, Invesco Advisers, Inc. (registered investment adviser); Director, Chairman, Chief Executive Officer and President, IVZ Inc. (holding company), INVESCO Group Services, Inc. (service provider) and Invesco North American Holdings, Inc. (holding company); Director, Chief Executive Officer and President, Invesco Holding Company Limited (parent of Invesco and a global investment management firm); Director, Invesco Ltd.; Chairman, Investment Company Institute and President, Co-Chief Executive Officer, Co-President, Chief Operating Officer and Chief Financial Officer, Franklin Resources, Inc. (global investment management organization) | ||||||||
|
Philip A.
Taylor2 —
1954
Trustee, President and Principal Executive Officer |
2006 | Head of North American Retail and Senior Managing Director, Invesco Ltd.; Director, Co-Chairman, Co-President and Co-Chief Executive Officer, Invesco Advisers, Inc. (formerly known as Invesco Institutional (N.A.), Inc.) (registered investment adviser); Director, Chairman, Chief Executive Officer and President, Invesco Management Group, Inc. (formerly Invesco Aim Management Group, Inc.) (financial services holding company); Director and President, INVESCO Funds Group, Inc. (registered investment adviser and registered transfer agent); Director and Chairman, Invesco Investment Services, Inc. (formerly known as Invesco Aim Investment Services, Inc.) (registered transfer agent) and IVZ Distributors, Inc. (formerly known as INVESCO Distributors, Inc.) (registered broker dealer); Director, President and Chairman, Invesco Inc. (holding company) and Invesco Canada Holdings Inc. (holding company); Chief Executive Officer, Invesco Corporate Class Inc. (corporate mutual fund company) and Invesco Canada Fund Inc. (corporate mutual fund company); Director, Chairman and Chief Executive Officer, Invesco Canada Ltd. (formerly known as Invesco Trimark Ltd./Invesco Trimark Ltèe) (registered investment adviser and registered transfer agent); Trustee, President and Principal Executive Officer, The Invesco Funds (other than AIM Treasurer’s Series Trust (Invesco Treasurer’s Series Trust) and Short-Term Investments Trust); Trustee and Executive Vice President, The Invesco Funds (AIM Treasurer’s Series Trust (Invesco Treasurer’s Series Trust) and Short-Term Investments Trust only); Director, Invesco Investment Advisers LLC (formerly known as Van Kampen Asset Management); Director, Chief Executive Officer and President, Van Kampen Exchange Corp. | 141 | None | ||||
| Formerly: Director and Chairman, Van Kampen Investor Services Inc.: | ||||||||
| Director, Chief Executive Officer and President, 1371 Preferred Inc. (holding company); and Van Kampen Investments Inc.; Director and President, AIM GP Canada Inc. (general partner for limited partnerships); and Van Kampen Advisors, Inc.; Director and Chief Executive Officer, Invesco Trimark Dealer Inc. (registered broker dealer); Director, Invesco Distributors, Inc. (formerly known as Invesco Aim Distributors, Inc.) (registered broker dealer); Manager, Invesco PowerShares Capital Management LLC; Director, Chief Executive Officer and President, Invesco Advisers, Inc.; Director, Chairman, Chief Executive Officer and President, Invesco Aim Capital Management, Inc.; President, Invesco Trimark Dealer Inc. and Invesco Trimark Ltd./Invesco Trimark Ltèe; Director and President, AIM Trimark Corporate Class Inc. and AIM Trimark Canada Fund Inc.; Senior Managing Director, Invesco Holding Company Limited; Trustee and Executive Vice President, Tax-Free Investments Trust; Director and Chairman, Fund Management Company (former registered broker dealer); President and Principal Executive Officer, The Invesco Funds (AIM Treasurer’s Series Trust (Invesco Treasurer’s Series Trust), Short-Term Investments Trust and Tax-Free Investments Trust only); President, AIM Trimark Global Fund Inc. and AIM Trimark Canada Fund Inc. | ||||||||
|
Wayne W.
Whalen3 —
1939
Trustee |
2010 | Of Counsel, and prior to 2010, partner in the law firm of Skadden, Arps, Slate, Meagher & Flom LLP, legal counsel to funds in the Fund Complex | 159 | Director of the Abraham Lincoln Presidential Library Foundation | ||||
|
Independent
Trustees
|
||||||||
|
Bruce L. Crockett — 1944
Trustee and Chair |
1993 | Chairman, Crockett Technology Associates (technology consulting company) | 141 | ACE Limited (insurance company); and Investment Company Institute | ||||
| Formerly: Director, Captaris (unified messaging provider); Director, President and Chief Executive Officer COMSAT Corporation; and Chairman, Board of Governors of INTELSAT (international communications company) | ||||||||
|
David C. Arch — 1945
Trustee |
2010 | Chairman and Chief Executive Officer of Blistex Inc., a consumer health care products manufacturer. | 159 | Member of the Heartland Alliance Advisory Board, a nonprofit organization serving human needs based in Chicago. Board member of the Illinois Manufacturers’ Association. Member of the Board of Visitors, Institute for the Humanities, University of Michigan | ||||
| 1 | Mr. Flanagan is considered an interested person of the Trust because he is an officer of the adviser to the Trust, and an officer and a director of Invesco Ltd., ultimate parent of the adviser to the Trust. |
| 2 | Mr. Taylor is considered an interested person of the Trust because he is an officer and a director of the adviser to, and a director of the principal underwriter of, the Trust. |
| 3 | Mr. Whalen has been deemed to be an interested person of the Trust because of his prior service as counsel to the predecessor funds of certain Invesco open-end funds and his affiliation with the law firm that served as counsel to such predecessor funds and continues to serve as counsel to the Invesco Van Kampen closed-end funds. |
|
Number of |
||||||||
|
Funds in |
||||||||
|
Fund Complex |
||||||||
|
Name, Year of
Birth and |
Trustee
and/ |
Principal
Occupation(s) |
Overseen by |
Other
Directorship(s) |
||||
| Position(s) Held with the Trust | or Officer Since | During Past 5 Years | Trustee | Held by Trustee | ||||
|
Independent
Trustees—(continued)
|
||||||||
|
Bob R. Baker — 1936
Trustee |
2003 | Retired | 141 | None | ||||
| Formerly: President and Chief Executive Officer, AMC Cancer Research Center; and Chairman and Chief Executive Officer, First Columbia Financial Corporation | ||||||||
|
Frank S. Bayley — 1939
Trustee |
2001 |
Retired Formerly: Director, Badgley Funds, Inc. (registered investment company) (2 portfolios) and Partner, law firm of Baker & McKenzie |
141 | Director and Chairman, C.D. Stimson Company (a real estate investment company) | ||||
|
James T. Bunch — 1942
Trustee |
2003 |
Founder, Green, Manning & Bunch Ltd. (investment banking firm)
Formerly: Executive Committee, United States Golf Association; and Director, Policy Studies, Inc. and Van Gilder Insurance Corporation |
141 | Vice Chairman, Board of Governors, Western Golf Association/Evans Scholars Foundation and Director, Denver Film Society | ||||
|
Rodney F. Dammeyer — 1940
Trustee |
2010 |
President of CAC, LLC, a private company offering capital investment and management advisory services.
Formerly: Prior to January 2004, Director of TeleTech Holdings Inc.; Prior to 2002, Director of Arris Group, Inc.; Prior to 2001, Managing Partner at Equity Group Corporate Investments. Prior to 1995, Vice Chairman of Anixter International. Prior to 1985, experience includes Senior Vice President and Chief Financial Officer of Household International, Inc, Executive Vice President and Chief Financial Officer of Northwest Industries, Inc. and Partner of Arthur Andersen & Co. |
159 | Director of Quidel Corporation and Stericycle, Inc. Prior to May 2008, Trustee of The Scripps Research Institute. Prior to February 2008, Director of Ventana Medical Systems, Inc. Prior to April 2007, Director of GATX Corporation. Prior to April 2004, Director of TheraSense, Inc. | ||||
|
Albert R. Dowden — 1941
Trustee |
2000 | Director of a number of public and private business corporations, including the Boss Group, Ltd. (private investment and management); Reich & Tang Funds (5 portfolios) (registered investment company); and Homeowners of America Holding Corporation/ Homeowners of America Insurance Company (property casualty company) | 141 | Board of Nature’s Sunshine Products, Inc. | ||||
| Formerly: Director, Continental Energy Services, LLC (oil and gas pipeline service); Director, CompuDyne Corporation (provider of product and services to the public security market) and Director, Annuity and Life Re (Holdings), Ltd. (reinsurance company); Director, President and Chief Executive Officer, Volvo Group North America, Inc.; Senior Vice President, AB Volvo; Director of various public and private corporations; Chairman, DHJ Media, Inc.; Director Magellan Insurance Company; and Director, The Hertz Corporation, Genmar Corporation (boat manufacturer), National Media Corporation; Advisory Board of Rotary Power International (designer, manufacturer, and seller of rotary power engines); and Chairman, Cortland Trust, Inc. (registered investment company) | ||||||||
|
Jack M. Fields — 1952
Trustee |
1997 | Chief Executive Officer, Twenty First Century Group, Inc. (government affairs company); and Owner and Chief Executive Officer, Dos Angelos Ranch, L.P. (cattle, hunting, corporate entertainment), Discovery Global Education Fund (non-profit) and Cross Timbers Quail Research Ranch (non-profit) | 141 | Administaff | ||||
| Formerly: Chief Executive Officer, Texana Timber LP (sustainable forestry company) and member of the U.S. House of Representatives | ||||||||
|
Carl Frischling — 1937
Trustee |
1988 | Partner, law firm of Kramer Levin Naftalis and Frankel LLP | 141 | Director, Reich & Tang Funds (6 portfolios) | ||||
|
Prema Mathai-Davis — 1950
Trustee |
1998 | Retired | 141 | None | ||||
| Formerly: Chief Executive Officer, YWCA of the U.S.A. | ||||||||
|
Larry Soll — 1942
Trustee |
2003 | Retired | 141 | None | ||||
| Formerly, Chairman, Chief Executive Officer and President, Synergen Corp. (a biotechnology company) | ||||||||
|
Number of |
||||||||
|
Funds in |
||||||||
|
Fund Complex |
||||||||
|
Name, Year of
Birth and |
Trustee
and/ |
Principal
Occupation(s) |
Overseen by |
Other
Directorship(s) |
||||
| Position(s) Held with the Trust | or Officer Since | During Past 5 Years | Trustee | Held by Trustee | ||||
|
Independent
Trustees—(continued)
|
||||||||
|
Hugo F. Sonnenschein — 1940
Trustee |
2010 | President Emeritus and Honorary Trustee of the University of Chicago and the Adam Smith Distinguished Service Professor in the Department of Economics at the University of Chicago. Prior to July 2000, President of the University of Chicago. | 159 | Trustee of the University of Rochester and a member of its investment committee. Member of the National Academy of Sciences, the American Philosophical Society and a fellow of the American Academy of Arts and Sciences | ||||
|
Raymond Stickel, Jr. — 1944
Trustee |
2005 | Retired | 141 | Director of Long Cove Club Owners’ Association (home owner’s association) | ||||
| Formerly: Director, Mainstay VP Series Funds, Inc. (25 portfolios) and Partner, Deloitte & Touche | ||||||||
|
Other
Officers
|
||||||||
|
Russell C. Burk — 1958
Senior Vice President and Senior Officer |
2005 | Senior Vice President and Senior Officer of Invesco Funds | N/A | N/A | ||||
|
John M. Zerr — 1962
Senior Vice President, Chief Legal Officer and Secretary |
2006 | Director, Senior Vice President, Secretary and General Counsel, Invesco Management Group, Inc. (formerly known as Invesco Aim Management Group, Inc.) and Van Kampen Exchange Corp.; Senior Vice President, Invesco Advisers, Inc. (formerly known as Invesco Institutional (N.A.), Inc.) (registered investment adviser); Senior Vice President and Secretary, Invesco Distributors, Inc. (formerly known as Invesco Aim Distributors, Inc.); Director, Vice President and Secretary, Invesco Investment Services, Inc. (formerly known as Invesco Aim Investment Services, Inc.) and IVZ Distributors, Inc. (formerly known as INVESCO Distributors, Inc.); Director and Vice President, INVESCO Funds Group, Inc.; Senior Vice President, Chief Legal Officer and Secretary, The Invesco Funds; Manager, Invesco PowerShares Capital Management LLC; Director, Secretary and General Counsel, Invesco Investment Advisers LLC (formerly known as Van Kampen Asset Management); Secretary and General Counsel, Van Kampen Funds Inc. and Chief Legal Officer, PowerShares Exchange-Traded Fund Trust, PowerShares Exchange-Traded Fund Trust II, PowerShares India Exchange-Traded Fund Trust and PowerShares Actively Managed Exchange-Traded Fund Trust | N/A | N/A | ||||
| Formerly: Director and Secretary, Van Kampen Advisors Inc.; Director Vice President, Secretary and General Counsel Van Kampen Investor Services Inc.; Director, Invesco Distributors, Inc. (formerly known as Invesco Aim Distributors, Inc.); Director, Senior Vice President, General Counsel and Secretary, Invesco Advisers, Inc.; and Van Kampen Investments Inc.; Director, Vice President and Secretary, Fund Management Company; Director, Senior Vice President, Secretary, General Counsel and Vice President, Invesco Aim Capital Management, Inc.; Chief Operating Officer and General Counsel, Liberty Ridge Capital, Inc. (an investment adviser); Vice President and Secretary, PBHG Funds (an investment company) and PBHG Insurance Series Fund (an investment company); Chief Operating Officer, General Counsel and Secretary, Old Mutual Investment Partners (a broker-dealer); General Counsel and Secretary, Old Mutual Fund Services (an administrator) and Old Mutual Shareholder Services (a shareholder servicing center); Executive Vice President, General Counsel and Secretary, Old Mutual Capital, Inc. (an investment adviser); and Vice President and Secretary, Old Mutual Advisors Funds (an investment company) | ||||||||
|
Lisa O. Brinkley — 1959
Vice President |
2004 |
Global Compliance Director, Invesco Ltd.; Chief Compliance Officer, Invesco Investment Services, Inc.(formerly known as Invesco Aim Investment Services, Inc.); and Vice President, The Invesco Funds
Formerly: Chief Compliance Officer, Invesco Distributors, Inc. (formerly known as Invesco Aim Distributors, Inc.) and Van Kampen Investor Services Inc.; Senior Vice President, Invesco Management Group, Inc.; Senior Vice President and Chief Compliance Officer, Invesco Advisers, Inc. and The Invesco Funds; Vice President and Chief Compliance Officer, Invesco Aim Capital Management, Inc. and Invesco Distributors, Inc.; Vice President, Invesco Investment Services, Inc. and Fund Management Company |
N/A | N/A | ||||
|
Sheri Morris — 1964
Vice President, Treasurer and Principal Financial Officer |
1999 | Vice President, Treasurer and Principal Financial Officer, The Invesco Funds; and Vice President, Invesco Advisers, Inc. (formerly known as Invesco Institutional (N.A.), Inc.) (registered investment adviser). | N/A | N/A | ||||
| Formerly: Treasurer, PowerShares Exchange-Traded Fund Trust, PowerShares Exchange-Traded Fund Trust II, PowerShares India Exchange-Traded Fund Trust and PowerShares Actively Managed Exchange-Traded Fund Trust; Vice President, Invesco Advisers, Inc., Invesco Aim Capital Management, Inc. and Invesco Aim Private Asset Management, Inc.; Assistant Vice President and Assistant Treasurer, The Invesco Funds and Assistant Vice President, Invesco Advisers, Inc., Invesco Aim Capital Management, Inc. and Invesco Aim Private Asset Management, Inc. | ||||||||
|
Karen Dunn Kelley — 1960
Vice President |
2004 | Head of Invesco’s World Wide Fixed Income and Cash Management Group; Senior Vice President, Invesco Advisers, Inc. (formerly known as Invesco Institutional (N.A.), Inc.) (registered investment adviser); Executive Vice President, Invesco Distributors, Inc. (formerly known as Invesco Aim Distributors, Inc.); Senior Vice President, Invesco Management Group, Inc. (formerly known as Invesco Aim Management Group, Inc.); and Director, Invesco Mortgage Capital Inc.; Vice President, The Invesco Funds (other than AIM Treasurer’s Series Trust (Invesco Treasurer’s Series Trust) and Short-Term Investments Trust); President and Principal Executive Officer, The Invesco Funds (AIM Treasurer’s Series Trust (Invesco Treasurer’s Series Trust) and Short-Term Investments Trust only). | N/A | N/A | ||||
| Formerly: Senior Vice President, Van Kampen Investments Inc.; Vice President, Invesco Advisers, Inc. (formerly known as Invesco Institutional (N.A.), Inc.); Director of Cash Management and Senior Vice President, Invesco Advisers, Inc. and Invesco Aim Capital Management, Inc.; President and Principal Executive Officer, Tax-Free Investments Trust; Director and President, Fund Management Company; Chief Cash Management Officer, Director of Cash Management, Senior Vice President, and Managing Director, Invesco Aim Capital Management, Inc.; Director of Cash Management, Senior Vice President, and Vice President, Invesco Advisers, Inc. and The Invesco Funds (AIM Treasurer’s Series Trust (Invesco Treasurer’s Series Trust), Short-Term Investments Trust and Tax-Free Investments Trust only) | ||||||||
|
Number of |
||||||||
|
Funds in |
||||||||
|
Fund Complex |
||||||||
|
Name, Year of
Birth and |
Trustee
and/ |
Principal
Occupation(s) |
Overseen by |
Other
Directorship(s) |
||||
| Position(s) Held with the Trust | or Officer Since | During Past 5 Years | Trustee | Held by Trustee | ||||
|
Other
Officers—(continued)
|
||||||||
|
Lance A. Rejsek — 1967
Anti-Money Laundering Compliance Officer |
2005 | Anti-Money Laundering Compliance Officer, Invesco Advisers, Inc. (formerly known as Invesco Institutional (N.A.), Inc.) (registered investment adviser); Invesco Distributors, Inc. (formerly known as Invesco Aim Distributors, Inc.), Invesco Investment Services, Inc. (formerly known as Invesco Aim Investment Services, Inc.), The Invesco Funds, PowerShares Exchange-Traded Fund Trust, PowerShares Exchange-Traded Fund Trust II, PowerShares India Exchange-Traded Fund Trust, PowerShares Actively Managed Exchange-Traded Fund Trust, Invesco Investment Advisers LLC (formerly known as Van Kampen Asset Management) and Van Kampen Funds Inc. | N/A | N/A | ||||
| Formerly: Anti-Money Laundering Compliance Officer, Van Kampen Investor Services Inc., Fund Management Company, Invesco Advisers, Inc., Invesco Aim Capital Management, Inc. and Invesco Aim Private Asset Management, Inc. | ||||||||
|
Todd L. Spillane — 1958
Chief Compliance Officer |
2006 | Senior Vice President, Invesco Management Group, Inc. (formerly known as Invesco Aim Management Group, Inc.) and Van Kampen Exchange Corp.; Senior Vice President and Chief Compliance Officer, Invesco Advisers, Inc. (registered investment adviser) (formerly known as Invesco Institutional (N.A.), Inc.); Chief Compliance Officer, The Invesco Funds, PowerShares Exchange-Traded Fund Trust, PowerShares Exchange-Traded Fund Trust II, PowerShares India Exchange-Traded Fund Trust, PowerShares Actively Managed Exchange-Traded Fund Trust, INVESCO Private Capital Investments, Inc. (holding company) and Invesco Private Capital, Inc. (registered investment adviser); Vice President, Invesco Distributors, Inc. (formerly known as Invesco Aim Distributors, Inc.) and Invesco Investment Services, Inc. (formerly known as Invesco Aim Investment Services, Inc.). | N/A | N/A | ||||
| Formerly: Chief Compliance Officer, Invesco Van Kampen Closed-End Funds; Senior Vice President, Van Kampen Investments Inc.; Senior Vice President and Chief Compliance Officer, Invesco Advisers, Inc. and Invesco Aim Capital Management, Inc.; Chief Compliance Officer, Invesco Global Asset Management (N.A.), Inc., Invesco Senior Secured Management, Inc. (registered investment adviser) and Van Kampen Investor Services Inc.; Vice President, Invesco Aim Capital Management, Inc. and Fund Management Company | ||||||||
|
Office of the Fund 11 Greenway Plaza, Suite 2500 Houston, TX 77046-1173 |
Investment Adviser Invesco Advisers, Inc. 1555 Peachtree Street, N.E. Atlanta, GA 30309 |
Distributor Invesco Distributors, Inc. 11 Greenway Plaza, Suite 2500 Houston, TX 77046-1173 |
Auditors PricewaterhouseCoopers LLP 1201 Louisiana Street, Suite 2900 Houston, TX 77002-5678 |
|||
|
Counsel to the Fund Stradley Ronon Stevens & Young, LLP 2600 One Commerce Square Philadelphia, PA 19103 |
Counsel to the Independent Trustees Kramer, Levin, Naftalis & Frankel LLP 1177 Avenue of the Americas New York, NY 10036-2714 |
Transfer Agent Invesco Investment Services, Inc. 11 Greenway Plaza, Suite 2500 Houston, TX 77046-1173 |
Custodian State Street Bank and Trust Company 225 Franklin Boston, MA 02110-2801 |


| CHT-AR-1 | Invesco Distributors, Inc. |
 |
A: CSTGX § B: CSTBX § C: CSTCX § R: CSTRX § Y: CSTYX § Institutional: CSITX
2 |
Letters to Shareholders | |
4 |
Performance Summary | |
4 |
Management Discussion | |
6 |
Long-Term Fund Performance | |
8 |
Supplemental Information | |
9 |
Schedule of Investments | |
12 |
Financial Statements | |
14 |
Notes to Financial Statements | |
21 |
Financial Highlights | |
22 |
Auditor’s Report | |
23 |
Fund Expenses | |
24 |
Approval of Investment Advisory and Sub-Advisory Agreements | |
T-1 |
Trustees and Officers |

Philip Taylor

Senior Managing Director, Invesco Ltd.

Bruce Crockett

Independent Chair
Invesco Funds Board of Trustees
Class A Shares |
2.52 | % | ||
Class B Shares |
1.78 | |||
Class C Shares |
1.78 | |||
Class R Shares |
2.27 | |||
Class Y Shares |
2.78 | |||
Institutional Class Shares |
3.09 | |||
S&P 500 Index▼ (Broad Market Index) |
8.07 | |||
Russell 1000 Growth Index▼ (Style-Specific Index) |
9.92 | |||
Lipper Multi-Cap Growth Funds Index▼ (Peer Group Index) |
7.28 | |||
| Source(s): ▼Lipper Inc. | ||
| n | The price target set at purchase has been reached. | |
| n | There is deterioration in fundamentals. | |
| n | The catalysts for growth are no longer present or are reflected in the stock price. | |
| n | There is a more attractive investment opportunity. |
Information Technology |
31.1 | % | ||
Consumer Discretionary |
18.3 | |||
Health Care |
11.3 | |||
Energy |
10.1 | |||
Industrials |
10.1 | |||
Consumer Staples |
8.0 | |||
Materials |
4.6 | |||
Financials |
3.0 | |||
Telecommunication Services |
2.2 | |||
Money Market Funds Plus Other Assets Less Liabilities |
1.3 | |||
| 1. | Apple Inc. |
6.4 | % | |||||
| 2. | Amazon.com, Inc. |
3.6 | ||||||
| 3. | Rovi Corp. |
3.6 | ||||||
| 4. | DIRECTV-Class A |
3.3 | ||||||
| 5. | Google Inc.-Class A |
3.2 | ||||||
| 6. | MasterCard, Inc.-Class A |
2.6 | ||||||
| 7. | Halliburton Co. |
2.6 | ||||||
| 8. | Procter & Gamble Co. (The) |
2.2 | ||||||
| 9. | Express Scripts, Inc. |
2.2 | ||||||
| 10. | Broadcom Corp.-Class A |
2.1 | ||||||
Total Net Assets |
$2.6 billion | |||
Total Number of Holdings* |
75 | |||


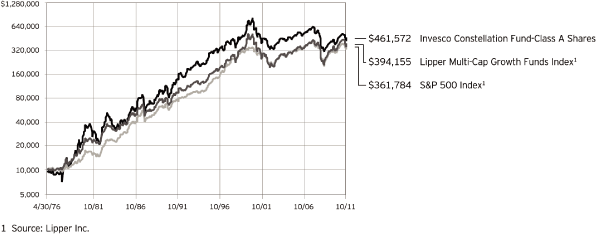
| Class A Shares | ||||||||
| Inception (4/30/76) | 11.40 | % | ||||||
| 10 | Years |
0.74 | ||||||
| 5 | Years |
-3.64 | ||||||
| 1 | Year |
-3.11 | ||||||
| Class B Shares | ||||||||
| Inception (11/3/97) | 0.46 | % | ||||||
| 10 | Years |
0.73 | ||||||
| 5 | Years |
-3.65 | ||||||
| 1 | Year |
-3.22 | ||||||
| Class C Shares | ||||||||
| Inception (8/4/97) | 0.07 | % | ||||||
| 10 | Years |
0.58 | ||||||
| 5 | Years |
-3.26 | ||||||
| 1 | Year |
0.78 | ||||||
| Class R Shares | ||||||||
| 10 | Years |
1.11 | % | |||||
| 5 | Years |
-2.78 | ||||||
| 1 | Year |
2.27 | ||||||
| Class Y Shares | ||||||||
| 10 | Years |
1.40 | % | |||||
| 5 | Years |
-2.38 | ||||||
| 1 | Year |
2.78 | ||||||
| Institutional Class Shares | ||||||||
| Inception (4/8/92) | 6.41 | % | ||||||
| 10 | Years |
1.85 | ||||||
| 5 | Years |
-2.01 | ||||||
| 1 | Year |
3.09 | ||||||
| Class A Shares | ||||||||
| Inception (4/30/76) | 11.08 | % | ||||||
| 10 | Years |
0.20 | ||||||
| 5 | Years |
-5.32 | ||||||
| 1 | Year |
-8.35 | ||||||
| Class B Shares | ||||||||
| Inception (11/3/97) | –0.32 | % | ||||||
| 10 | Years |
0.19 | ||||||
| 5 | Years |
-5.34 | ||||||
| 1 | Year |
-8.52 | ||||||
| Class C Shares | ||||||||
| Inception (8/4/97) | –0.69 | % | ||||||
| 10 | Years |
0.03 | ||||||
| 5 | Years |
-4.96 | ||||||
| 1 | Year |
-4.67 | ||||||
| Class R Shares | ||||||||
| 10 | Years |
0.57 | % | |||||
| 5 | Years |
-4.49 | ||||||
| 1 | Year |
-3.23 | ||||||
| Class Y Shares | ||||||||
| 10 | Years |
0.85 | % | |||||
| 5 | Years |
-4.09 | ||||||
| 1 | Year |
-2.70 | ||||||
| Institutional Class Shares | ||||||||
| Inception (4/8/92) | 5.85 | % | ||||||
| 10 | Years |
1.30 | ||||||
| 5 | Years |
-3.73 | ||||||
| 1 | Year |
-2.44 | ||||||
| 1 | Total annual Fund operating expenses after contractual advisory fee waivers by the adviser in effect through at least December 31, 2012. See current prospectus for more information. |
| n | Unless otherwise stated, information presented in this report is as of October 31, 2011, and is based on total net assets. | |
| n | Unless otherwise noted, all data provided by Invesco. | |
| n | To access your Fund’s reports/prospectus, visit invesco.com/fundreports. |
| n | Class B shares may not be purchased or acquired by exchange from share classes other than Class B shares. Please see the prospectus for more information. | |
| n | Class R shares are available only to certain retirement plans. Please see the prospectus for more information. | |
| n | Class Y shares are available to only certain investors. Please see the prospectus for more information. | |
| n | Institutional Class shares are offered exclusively to institutional investors, including defined contribution plans that meet certain criteria. Please see the prospectus for more information. |
| n | Active trading risk. The Fund engages in frequent trading of portfolio securities. Active trading results in added expenses and may result in a lower return. | |
| n | Foreign securities risk. The Fund’s foreign investments may be affected by changes in a foreign country’s exchange rates; political and social instability; changes in economic or taxation policies; difficulties when enforcing obligations; decreased liquidity; and increased volatility. Foreign companies may be subject to less regulation resulting in less publicly available information about the companies. | |
| n | Management risk. The investment techniques and risk analysis used by the Fund’s portfolio managers may not produce the desired results. | |
| n | Market risk. The prices of and the income generated by the Fund’s securities may decline in response to, among other things, investor sentiment; general economic and market conditions; regional or global instability; and currency and interest rate fluctuations. |
| n | The S&P 500® Index is an unmanaged index considered representative of the U.S. stock market. | |
| n | The Russell 1000® Growth Index is an unmanaged index considered representative of large-cap growth stocks. The Russell 1000 Growth Index is a trademark/service mark of the Frank Russell Co. Russell® is a trademark of the Frank Russell Co. | |
| n | The Lipper Multi-Cap Growth Funds Index is an unmanaged index considered representative of multi-cap growth funds tracked by Lipper. | |
| n | The Fund is not managed to track the performance of any particular index, including the index(es) defined here, and consequently, the performance of the Fund may deviate significantly from the performance of the index(es). | |
| n | A direct investment cannot be made in an index. Unless otherwise indicated, index results include reinvested dividends, and they do not reflect sales charges. Performance of the peer group, if applicable, reflects fund expenses; performance of a market index does not. |
| n | The Chartered Financial Analyst® (CFA®) designation is globally recognized and attests to a charterholder’s success in a rigorous and comprehensive study program in the field of investment management and research analysis. | |
| n | The returns shown in management’s discussion of Fund performance are based on net asset values calculated for shareholder transactions. Generally accepted accounting principles require adjustments to be made to the net assets of the Fund at period end for financial reporting purposes, and as such, the net asset values for shareholder transactions and the returns based on those net asset values may differ from the net asset values and returns reported in the Financial Highlights. | |
| n | Industry classifications used in this report are generally according to the Global Industry Classification Standard, which was developed by and is the exclusive property and a service mark of MSCI Inc. and Standard & Poor’s. |
Class A Shares
|
CSTGX | |
Class B Shares
|
CSTBX | |
Class C Shares
|
CSTCX | |
Class R Shares
|
CSTRX | |
Class Y Shares
|
CSTYX | |
Institutional Class Shares
|
CSITX |
| Shares | Value | |||||||
|
Common Stocks & Other Equity Interests–98.66% |
||||||||
|
Aerospace & Defense–1.74% |
||||||||
|
Precision Castparts Corp.
|
282,130 | $ | 46,029,509 | |||||
|
Apparel Retail–0.12% |
||||||||
|
Limited Brands, Inc.
|
76,066 | 3,248,779 | ||||||
|
Apparel, Accessories & Luxury Goods–1.17% |
||||||||
|
Coach, Inc.
|
203,858 | 13,265,040 | ||||||
|
Prada S.p.A.
(Italy)(b)
|
3,684,900 | 17,738,965 | ||||||
| 31,004,005 | ||||||||
|
Application Software–1.32% |
||||||||
|
Citrix Systems,
Inc.(b)
|
481,589 | 35,074,127 | ||||||
|
Asset Management & Custody Banks–1.01% |
||||||||
|
BlackRock, Inc.
|
170,423 | 26,891,045 | ||||||
|
Auto Parts & Equipment–0.78% |
||||||||
|
BorgWarner,
Inc.(b)
|
271,765 | 20,787,305 | ||||||
|
Automotive Retail–0.53% |
||||||||
|
AutoZone,
Inc.(b)
|
43,178 | 13,971,969 | ||||||
|
Biotechnology–2.09% |
||||||||
|
Celgene
Corp.(b)
|
195,573 | 12,678,998 | ||||||
|
Gilead Sciences,
Inc.(b)
|
1,026,191 | 42,751,117 | ||||||
| 55,430,115 | ||||||||
|
Cable & Satellite–5.03% |
||||||||
|
Comcast Corp.–Class A
|
1,960,907 | 45,983,269 | ||||||
|
DIRECTV–Class A(b)
|
1,918,337 | 87,207,600 | ||||||
| 133,190,869 | ||||||||
|
Casinos & Gaming–1.02% |
||||||||
|
Las Vegas Sands
Corp.(b)
|
573,036 | 26,904,040 | ||||||
|
Communications Equipment–1.91% |
||||||||
|
F5 Networks,
Inc.(b)
|
88,450 | 9,194,377 | ||||||
|
QUALCOMM, Inc.
|
799,863 | 41,272,931 | ||||||
| 50,467,308 | ||||||||
|
Computer Hardware–6.42% |
||||||||
|
Apple
Inc.(b)
|
420,399 | 170,169,107 | ||||||
|
Computer Storage & Peripherals–1.71% |
||||||||
|
EMC
Corp.(b)
|
1,458,665 | 35,751,879 | ||||||
|
SanDisk
Corp.(b)
|
188,657 | 9,559,250 | ||||||
| 45,311,129 | ||||||||
|
Construction & Engineering–1.38% |
||||||||
|
Foster Wheeler AG
(Switzerland)(b)
|
1,716,709 | 36,600,236 | ||||||
|
Construction & Farm Machinery & Heavy Trucks–0.88% |
||||||||
|
Cummins Inc.
|
144,996 | 14,416,952 | ||||||
|
Navistar International
Corp.(b)
|
213,447 | 8,979,716 | ||||||
| 23,396,668 | ||||||||
|
Data Processing & Outsourced Services–2.59% |
||||||||
|
MasterCard, Inc.–Class A
|
197,662 | 68,636,153 | ||||||
|
Department Stores–1.83% |
||||||||
|
Macy’s, Inc.
|
1,588,997 | 48,512,078 | ||||||
|
Diversified Metals & Mining–0.54% |
||||||||
|
Molycorp,
Inc.(b)
|
371,984 | 14,235,828 | ||||||
|
Drug Retail–1.49% |
||||||||
|
CVS Caremark Corp.
|
1,088,366 | 39,507,686 | ||||||
|
Fertilizers & Agricultural Chemicals–1.86% |
||||||||
|
Monsanto Co.
|
278,639 | 20,270,987 | ||||||
|
Mosaic Co. (The)
|
492,976 | 28,868,675 | ||||||
| 49,139,662 | ||||||||
|
Food Retail–0.99% |
||||||||
|
Kroger Co. (The)
|
1,134,970 | 26,308,605 | ||||||
|
Footwear–0.73% |
||||||||
|
NIKE, Inc.–Class B
|
199,830 | 19,253,621 | ||||||
|
General Merchandise Stores–0.47% |
||||||||
|
Dollar Tree,
Inc.(b)
|
156,637 | 12,524,695 | ||||||
|
Gold–2.16% |
||||||||
|
Barrick Gold Corp. (Canada)
|
321,179 | 15,898,360 | ||||||
|
Goldcorp, Inc. (Canada)
|
845,701 | 41,304,037 | ||||||
| 57,202,397 | ||||||||
|
Health Care Distributors–0.56% |
||||||||
|
Cardinal Health, Inc.
|
333,441 | 14,761,433 | ||||||
|
Health Care Equipment–0.74% |
||||||||
|
Baxter International Inc.
|
355,383 | 19,538,957 | ||||||
|
Health Care Services–2.15% |
||||||||
|
Express Scripts,
Inc.(b)
|
1,247,289 | 57,038,526 | ||||||
|
Health Care Technology–0.77% |
||||||||
|
Allscripts Healthcare Solutions,
Inc.(b)
|
1,061,913 | 20,335,634 | ||||||
|
Heavy Electrical Equipment–1.69% |
||||||||
|
ABB Ltd.
(Switzerland)(b)
|
654,657 | 12,343,499 | ||||||
|
ABB Ltd.–ADR
(Switzerland)(b)
|
1,717,225 | 32,301,002 | ||||||
| 44,644,501 | ||||||||
| Shares | Value | |||||||
|
Hotels, Resorts & Cruise Lines–0.41% |
||||||||
|
Starwood Hotels & Resorts Worldwide, Inc.
|
215,296 | $ | 10,788,483 | |||||
|
Household Products–2.24% |
||||||||
|
Procter & Gamble Co. (The)
|
927,700 | 59,363,523 | ||||||
|
Hypermarkets & Super Centers–0.72% |
||||||||
|
Costco Wholesale Corp.
|
228,865 | 19,053,011 | ||||||
|
Industrial Conglomerates–1.52% |
||||||||
|
Danaher Corp.
|
834,455 | 40,345,899 | ||||||
|
Industrial Machinery–0.69% |
||||||||
|
Ingersoll-Rand PLC (Ireland)
|
584,513 | 18,195,890 | ||||||
|
Internet Retail–4.31% |
||||||||
|
Amazon.com,
Inc.(b)
|
448,025 | 95,657,818 | ||||||
|
Priceline.com
Inc.(b)
|
36,211 | 18,385,049 | ||||||
| 114,042,867 | ||||||||
|
Internet Software & Services–5.70% |
||||||||
|
Baidu, Inc.–ADR
(China)(b)
|
297,961 | 41,768,173 | ||||||
|
eBay
Inc.(b)
|
744,695 | 23,703,642 | ||||||
|
Google
Inc.–Class A(b)
|
144,457 | 85,610,996 | ||||||
| 151,082,811 | ||||||||
|
IT Consulting & Other Services–3.61% |
||||||||
|
Accenture PLC–Class A (Ireland)
|
814,199 | 49,063,632 | ||||||
|
Cognizant Technology Solutions
Corp.–Class A(b)
|
639,356 | 46,513,149 | ||||||
| 95,576,781 | ||||||||
|
Life Sciences Tools & Services–1.45% |
||||||||
|
Agilent Technologies,
Inc.(b)
|
1,033,074 | 38,296,053 | ||||||
|
Managed Health Care–2.08% |
||||||||
|
UnitedHealth Group Inc.
|
1,145,884 | 54,990,973 | ||||||
|
Oil & Gas Drilling–1.58% |
||||||||
|
Ensco PLC–ADR (United Kingdom)
|
843,549 | 41,890,643 | ||||||
|
Oil & Gas Equipment & Services–6.33% |
||||||||
|
Cameron International
Corp.(b)
|
970,026 | 47,667,078 | ||||||
|
Halliburton Co.
|
1,807,834 | 67,540,678 | ||||||
|
National Oilwell Varco Inc.
|
259,767 | 18,529,180 | ||||||
|
Weatherford International
Ltd.(b)
|
2,181,849 | 33,818,659 | ||||||
| 167,555,595 | ||||||||
|
Oil & Gas Exploration & Production–2.19% |
||||||||
|
Anadarko Petroleum Corp.
|
529,948 | 41,600,918 | ||||||
|
EOG Resources, Inc.
|
184,723 | 16,519,778 | ||||||
| 58,120,696 | ||||||||
|
Other Diversified Financial Services–2.02% |
||||||||
|
JPMorgan Chase & Co.
|
1,539,387 | 53,509,092 | ||||||
|
Packaged Foods & Meats–1.09% |
||||||||
|
Mead Johnson Nutrition Co.
|
402,673 | 28,932,055 | ||||||
|
Pharmaceuticals–1.46% |
||||||||
|
Allergan, Inc.
|
459,935 | 38,689,732 | ||||||
|
Railroads–1.37% |
||||||||
|
Union Pacific Corp.
|
365,202 | 36,363,163 | ||||||
|
Restaurants–1.93% |
||||||||
|
Krispy Kreme Doughnuts Inc.–Wts.,
expiring 03/02/12(c)
|
19,296 | 3,666 | ||||||
|
Starbucks Corp.
|
1,206,184 | 51,069,831 | ||||||
| 51,073,497 | ||||||||
|
Semiconductors–3.45% |
||||||||
|
Atmel
Corp.(b)
|
2,680,990 | 28,311,254 | ||||||
|
Broadcom
Corp.–Class A(b)
|
1,543,174 | 55,693,150 | ||||||
|
Xilinx, Inc.
|
217,462 | 7,276,279 | ||||||
| 91,280,683 | ||||||||
|
Soft Drinks–1.40% |
||||||||
|
Coca-Cola
Co. (The)
|
358,113 | 24,466,280 | ||||||
|
Hansen Natural
Corp.(b)
|
141,129 | 12,573,183 | ||||||
| 37,039,463 | ||||||||
|
Systems Software–4.40% |
||||||||
|
Check Point Software Technologies Ltd.
(Israel)(b)
|
374,810 | 21,600,300 | ||||||
|
Rovi
Corp.(b)
|
1,915,370 | 94,887,430 | ||||||
| 116,487,730 | ||||||||
|
Trucking–0.80% |
||||||||
|
J.B. Hunt Transport Services, Inc.
|
499,133 | 21,118,317 | ||||||
|
Wireless Telecommunication Services–2.23% |
||||||||
|
America Movil S.A.B. de C.V.–ADR (Mexico)
|
795,064 | 20,210,527 | ||||||
|
American Tower
Corp.–Class A(b)
|
705,932 | 38,896,853 | ||||||
| 59,107,380 | ||||||||
|
Total Common Stocks & Other Equity Interests
(Cost $2,285,553,481) |
2,613,020,324 | |||||||
|
Money Market Funds–2.57% |
||||||||
|
Liquid Assets Portfolio–Institutional
Class(d)
|
34,012,195 | 34,012,195 | ||||||
|
Premier Portfolio–Institutional
Class(d)
|
34,012,195 | 34,012,195 | ||||||
|
Total Money Market Funds
(Cost $68,024,390) |
68,024,390 | |||||||
|
TOTAL INVESTMENTS–101.23% (Cost $2,353,577,871)
|
2,681,044,714 | |||||||
|
OTHER ASSETS LESS LIABILITIES–(1.23)%
|
(32,691,139 | ) | ||||||
|
NET ASSETS–100.00%
|
$ | 2,648,353,575 | ||||||
|
ADR
|
– American Depositary Receipts | |
|
Wts.
|
– Warrants |
| (a) | Industry and/or sector classifications used in this report are generally according to the Global Industry Classification Standard, which was developed by and is the exclusive property and a service mark of MSCI Inc. and Standard & Poor’s. | |
| (b) | Non-income producing security. | |
| (c) | Non-income producing security acquired through a corporate action. | |
| (d) | The money market fund and the Fund are affiliated by having the same investment adviser. |
|
Assets: |
||||
|
Investments, at value (Cost $2,285,553,481)
|
$ | 2,613,020,324 | ||
|
Investments in affiliated money market funds, at value and cost
|
68,024,390 | |||
|
Total investments, at value (Cost $2,353,577,871)
|
2,681,044,714 | |||
|
Receivable for:
|
||||
|
Investments sold
|
13,409,388 | |||
|
Fund shares sold
|
322,729 | |||
|
Dividends
|
1,438,758 | |||
|
Investment for trustee deferred compensation and retirement plans
|
591,132 | |||
|
Other assets
|
110,334 | |||
|
Total assets
|
2,696,917,055 | |||
|
Liabilities: |
||||
|
Payable for:
|
||||
|
Investments purchased
|
41,032,669 | |||
|
Fund shares reacquired
|
3,271,793 | |||
|
Accrued fees to affiliates
|
2,151,369 | |||
|
Accrued other operating expenses
|
270,279 | |||
|
Trustee deferred compensation and retirement plans
|
1,837,370 | |||
|
Total liabilities
|
48,563,480 | |||
|
Net assets applicable to shares outstanding
|
$ | 2,648,353,575 | ||
|
Net assets consist of: |
||||
|
Shares of beneficial interest
|
$ | 3,347,715,316 | ||
|
Undistributed net investment income (loss)
|
(1,762,488 | ) | ||
|
Undistributed net realized gain (loss)
|
(1,025,066,096 | ) | ||
|
Unrealized appreciation
|
327,466,843 | |||
| $ | 2,648,353,575 | |||
|
Net Assets: |
||||
|
Class A
|
$ | 2,417,873,372 | ||
|
Class B
|
$ | 97,318,222 | ||
|
Class C
|
$ | 90,151,716 | ||
|
Class R
|
$ | 8,580,904 | ||
|
Class Y
|
$ | 13,271,622 | ||
|
Institutional Class
|
$ | 21,157,739 | ||
|
Shares outstanding, $0.001 par value per share, with an unlimited number of shares authorized: |
||||
|
Class A
|
107,922,485 | |||
|
Class B
|
4,864,275 | |||
|
Class C
|
4,507,914 | |||
|
Class R
|
389,496 | |||
|
Class Y
|
589,147 | |||
|
Institutional Class
|
846,370 | |||
|
Class A:
|
||||
|
Net asset value per share
|
$ | 22.40 | ||
|
Maximum offering price per share
(Net asset value of $22.40 divided by 94.50%) |
$ | 23.70 | ||
|
Class B:
|
||||
|
Net asset value and offering price per share
|
$ | 20.01 | ||
|
Class C:
|
||||
|
Net asset value and offering price per share
|
$ | 20.00 | ||
|
Class R:
|
||||
|
Net asset value and offering price per share
|
$ | 22.03 | ||
|
Class Y:
|
||||
|
Net asset value and offering price per share
|
$ | 22.53 | ||
|
Institutional Class:
|
||||
|
Net asset value and offering price per share
|
$ | 25.00 | ||
|
Investment income: |
||||
|
Dividends (net of foreign withholding taxes of $155,723)
|
$ | 30,891,823 | ||
|
Dividends from affiliated money market funds (includes
securities lending income of $36,771)
|
122,162 | |||
|
Interest
|
273,016 | |||
|
Total investment income
|
31,287,001 | |||
|
Expenses: |
||||
|
Advisory fees
|
18,753,656 | |||
|
Administrative services fees
|
584,616 | |||
|
Custodian fees
|
86,902 | |||
|
Distribution fees:
|
||||
|
Class A
|
6,710,802 | |||
|
Class B
|
1,267,325 | |||
|
Class C
|
1,000,120 | |||
|
Class R
|
48,915 | |||
|
Transfer agent fees — A, B, C, R and Y
|
10,326,026 | |||
|
Transfer agent fees — Institutional
|
14,762 | |||
|
Trustees’ and officers’ fees and benefits
|
111,847 | |||
|
Other
|
803,762 | |||
|
Total expenses
|
39,708,733 | |||
|
Less: Fees waived, expenses reimbursed and expense offset
arrangement(s)
|
(531,087 | ) | ||
|
Net expenses
|
39,177,646 | |||
|
Net investment income (loss)
|
(7,890,645 | ) | ||
|
Realized and unrealized gain (loss) from: |
||||
|
Net realized gain from:
|
||||
|
Investment securities (includes net gains from securities sold
to affiliates of $2,450,044)
|
340,819,002 | |||
|
Foreign currencies
|
134,584 | |||
| 340,953,586 | ||||
|
Change in net unrealized appreciation (depreciation) of:
|
||||
|
Investment securities
|
(241,000,216 | ) | ||
|
Foreign currencies
|
(7,347 | ) | ||
| (241,007,563 | ) | |||
|
Net realized and unrealized gain
|
99,946,023 | |||
|
Net increase in net assets resulting from operations
|
$ | 92,055,378 | ||
| 2011 | 2010 | |||||||
|
Operations: |
||||||||
|
Net investment income (loss)
|
$ | (7,890,645 | ) | $ | (9,707,535 | ) | ||
|
Net realized gain
|
340,953,586 | 185,258,898 | ||||||
|
Change in net unrealized appreciation (depreciation)
|
(241,007,563 | ) | 312,124,429 | |||||
|
Net increase in net assets resulting from operations
|
92,055,378 | 487,675,792 | ||||||
|
Distributions to shareholders from net investment income: |
||||||||
|
Class A
|
— | (9,467,668 | ) | |||||
|
Class R
|
— | (11,753 | ) | |||||
|
Class Y
|
— | (78,583 | ) | |||||
|
Institutional Class
|
— | (348,963 | ) | |||||
|
Total distributions from net investment income
|
— | (9,906,967 | ) | |||||
|
Share transactions–net: |
||||||||
|
Class A
|
(377,299,829 | ) | (399,670,957 | ) | ||||
|
Class B
|
(53,726,486 | ) | (59,428,172 | ) | ||||
|
Class C
|
(12,749,263 | ) | (16,748,246 | ) | ||||
|
Class R
|
(1,913,624 | ) | (274,367 | ) | ||||
|
Class Y
|
(360,854 | ) | (1,801,677 | ) | ||||
|
Institutional Class
|
(4,350,409 | ) | (26,003,742 | ) | ||||
|
Net increase (decrease) in net assets resulting from share
transactions
|
(450,400,465 | ) | (503,927,161 | ) | ||||
|
Net increase (decrease) in net assets
|
(358,345,087 | ) | (26,158,336 | ) | ||||
|
Net assets: |
||||||||
|
Beginning of year
|
3,006,698,662 | 3,032,856,998 | ||||||
|
End of year (includes undistributed net investment income (loss)
of $(1,762,488) and $(1,750,621), respectively)
|
$ | 2,648,353,575 | $ | 3,006,698,662 | ||||
| A. | Security Valuations — Securities, including restricted securities, are valued according to the following policy. | |
| A security listed or traded on an exchange (except convertible bonds) is valued at its last sales price or official closing price as of the close of the customary trading session on the exchange where the security is principally traded, or lacking any sales or official closing price on a particular day, the security may be valued at the closing bid price on that day. Securities traded in the over-the-counter market are valued based on prices furnished by |
| independent pricing services or market makers. When such securities are valued by an independent pricing service they may be considered fair valued. Futures contracts are valued at the final settlement price set by an exchange on which they are principally traded. Listed options are valued at the mean between the last bid and ask prices from the exchange on which they are principally traded. Options not listed on an exchange are valued by an independent source at the mean between the last bid and ask prices. For purposes of determining net asset value per share, futures and option contracts generally are valued 15 minutes after the close of the customary trading session of the New York Stock Exchange (“NYSE”). | ||
| Investments in open-end and closed-end registered investment companies that do not trade on an exchange are valued at the end of day net asset value per share. Investments in open-end and closed-end registered investment companies that trade on an exchange are valued at the last sales price or official closing price as of the close of the customary trading session on the exchange where the security is principally traded. | ||
| Debt obligations (including convertible bonds) and unlisted equities are fair valued using an evaluated quote provided by an independent pricing service. Evaluated quotes provided by the pricing service may be determined without exclusive reliance on quoted prices, and may reflect appropriate factors such as institution-size trading in similar groups of securities, developments related to specific securities, dividend rate, yield, quality, type of issue, coupon rate, maturity, individual trading characteristics and other market data. Debt securities are subject to interest rate and credit risks. In addition, all debt securities involve some risk of default with respect to interest and/or principal payments. | ||
| Foreign securities (including foreign exchange contracts) are converted into U.S. dollar amounts using the applicable exchange rates as of the close of the NYSE. If market quotations are available and reliable for foreign exchange traded equity securities, the securities will be valued at the market quotations. Because trading hours for certain foreign securities end before the close of the NYSE, closing market quotations may become unreliable. If between the time trading ends on a particular security and the close of the customary trading session on the NYSE, events occur that are significant and make the closing price unreliable, the Fund may fair value the security. If the event is likely to have affected the closing price of the security, the security will be valued at fair value in good faith using procedures approved by the Board of Trustees. Adjustments to closing prices to reflect fair value may also be based on a screening process of an independent pricing service to indicate the degree of certainty, based on historical data, that the closing price in the principal market where a foreign security trade is not the current value as of the close of the NYSE. Foreign securities meeting the approved degree of certainty that the price is not reflective of current value will be priced at the indication of fair value from the independent pricing service. Multiple factors may be considered by the independent pricing service in determining adjustments to reflect fair value and may include information relating to sector indices, American Depositary Receipts and domestic and foreign index futures. Foreign securities may have additional risks including exchange rate changes, potential for sharply devalued currencies and high inflation, political and economical upheaval, the relative lack of issuer information, relatively low market liquidity and the potential lack of strict financial and accounting controls and standards. | ||
| Securities for which market prices are not provided by any of the above methods may be valued based upon quotes furnished by independent sources. The last bid price may be used to value equity securities. The mean between the last bid and asked prices is used to value debt obligations, including Corporate Loans. | ||
| Securities for which market quotations are not readily available or are unreliable are valued at fair value as determined in good faith by or under the supervision of the Trust’s officers following procedures approved by the Board of Trustees. Issuer specific events, market trends, bid/ask quotes of brokers and information providers and other market data may be reviewed in the course of making a good faith determination of a security’s fair value. | ||
| Valuations change in response to many factors including the historical and prospective earnings of the issuer, the value of the issuer’s assets, general economic conditions, interest rates, investor perceptions and market liquidity. Because of the inherent uncertainties of valuation, the values reflected in the financial statements may materially differ from the value received upon actual sale of those investments. | ||
| B. | Securities Transactions and Investment Income — Securities transactions are accounted for on a trade date basis. Realized gains or losses on sales are computed on the basis of specific identification of the securities sold. Interest income is recorded on the accrual basis from settlement date. Dividend income (net of withholding tax, if any) is recorded on the ex-dividend date. | |
| The Fund may periodically participate in litigation related to Fund investments. As such, the Fund may receive proceeds from litigation settlements. Any proceeds received are included in the Statement of Operations as realized gain (loss) for investments no longer held and as unrealized gain (loss) for investments still held. | ||
| Brokerage commissions and mark ups are considered transaction costs and are recorded as an increase to the cost basis of securities purchased and/or a reduction of proceeds on a sale of securities. Such transaction costs are included in the determination of net realized and unrealized gain (loss) from investment securities reported in the Statement of Operations and the Statement of Changes in Net Assets and the net realized and unrealized gains (losses) on securities per share in the Financial Highlights. Transaction costs are included in the calculation of the Fund’s net asset value and, accordingly, they reduce the Fund’s total returns. These transaction costs are not considered operating expenses and are not reflected in net investment income reported in the Statement of Operations and Statement of Changes in Net Assets, or the net investment income per share and ratios of expenses and net investment income reported in the Financial Highlights, nor are they limited by any expense limitation arrangements between the Fund and the investment adviser. | ||
| The Fund allocates income and realized and unrealized capital gains and losses to a class based on the relative net assets of each class. | ||
| C. | Country Determination — For the purposes of making investment selection decisions and presentation in the Schedule of Investments, the investment adviser may determine the country in which an issuer is located and/or credit risk exposure based on various factors. These factors include the laws of the country under which the issuer is organized, where the issuer maintains a principal office, the country in which the issuer derives 50% or more of its total revenues and the country that has the primary market for the issuer’s securities, as well as other criteria. Among the other criteria that may be evaluated for making this determination are the country in which the issuer maintains 50% or more of its assets, the type of security, financial guarantees and enhancements, the nature of the collateral and the sponsor organization. Country of issuer and/or credit risk exposure has been determined to be the United States of America, unless otherwise noted. | |
| D. | Distributions — Distributions from income and net realized capital gain, if any, are generally paid annually and recorded on ex-dividend date. The Fund may elect to treat a portion of the proceeds from redemptions as distributions for federal income tax purposes. |
| E. | Federal Income Taxes — The Fund intends to comply with the requirements of Subchapter M of the Internal Revenue Code necessary to qualify as a regulated investment company and to distribute substantially all of the Fund’s taxable earnings to shareholders. As such, the Fund will not be subject to federal income taxes on otherwise taxable income (including net realized capital gain) that is distributed to shareholders. Therefore, no provision for federal income taxes is recorded in the financial statements. | |
| The Fund files tax returns in the U.S. Federal jurisdiction and certain other jurisdictions. Generally, the Fund is subject to examinations by such taxing authorities for up to three years after the filing of the return for the tax period. | ||
| F. | Expenses — Fees provided for under the Rule 12b-1 plan of a particular class of the Fund are charged to the operations of such class. Transfer agency fees and expenses and other shareholder recordkeeping fees and expenses attributable to the Institutional Class are charged to such class. Transfer agency fees and expenses and other shareholder recordkeeping fees and expenses relating to all other classes are allocated among those classes based on relative net assets. All other expenses are allocated among the classes based on relative net assets. | |
| G. | Accounting Estimates — The preparation of financial statements in conformity with accounting principles generally accepted in the United States of America (“GAAP”) requires management to make estimates and assumptions that affect the reported amounts of assets and liabilities at the date of the financial statements and the reported amounts of revenues and expenses during the reporting period including estimates and assumptions related to taxation. Actual results could differ from those estimates by a significant amount. In addition, the Fund monitors for material events or transactions that may occur or become known after the period-end date and before the date the financial statements are released to print. | |
| H. | Indemnifications — Under the Trust’s organizational documents, each Trustee, officer, employee or other agent of the Trust is indemnified against certain liabilities that may arise out of performance of their duties to the Fund. Additionally, in the normal course of business, the Fund enters into contracts, including the Fund’s servicing agreements that contain a variety of indemnification clauses. The Fund’s maximum exposure under these arrangements is unknown as this would involve future claims that may be made against the Fund that have not yet occurred. The risk of material loss as a result of such indemnification claims is considered remote. | |
| I. | Securities Lending — The Fund may lend portfolio securities having a market value up to one-third of the Fund’s total assets. Such loans are secured by collateral equal to no less than the market value of the loaned securities determined daily by the securities lending provider. Such collateral will be cash or debt securities issued or guaranteed by the U.S. Government or any of its sponsored agencies. Cash collateral received in connection with these loans is invested in short-term money market instruments or affiliated money market funds and is shown as such on the Schedule of Investments. It is the Fund’s policy to obtain additional collateral from or return excess collateral to the borrower by the end of the next business day, following the valuation date of the securities loaned. Therefore, the value of the collateral held may be temporarily less than the value of the securities on loan. Lending securities entails a risk of loss to the Fund if and to the extent that the market value of the securities loaned were to increase and the borrower did not increase the collateral accordingly, and the borrower fails to return the securities. Upon the failure of the borrower to return the securities, collateral may be liquidated and the securities may be purchased on the open market to replace the loaned securities. The Fund could experience delays and costs in gaining access to the collateral. The Fund bears the risk of any deficiency in the amount of the collateral available for return to the borrower due to any loss on the collateral invested. Dividends received on cash collateral investments for securities lending transactions, which are net of compensation to counterparties, is included in Dividends from affiliates on the Statement of Operations. The aggregate value of securities out on loan is shown as a footnote on the Statement of Assets and Liabilities, if any. | |
| J. | Foreign Currency Translations — Foreign currency is valued at the close of the NYSE based on quotations posted by banks and major currency dealers. Portfolio securities and other assets and liabilities denominated in foreign currencies are translated into U.S. dollar amounts at date of valuation. Purchases and sales of portfolio securities (net of foreign taxes withheld on disposition) and income items denominated in foreign currencies are translated into U.S. dollar amounts on the respective dates of such transactions. The Fund does not separately account for the portion of the results of operations resulting from changes in foreign exchange rates on investments and the fluctuations arising from changes in market prices of securities held. The combined results of changes in foreign exchange rates and the fluctuation of market prices on investments (net of estimated foreign tax withholding) are included with the net realized and unrealized gain or loss from investments in the Statement of Operations. Reported net realized foreign currency gains or losses arise from (1) sales of foreign currencies, (2) currency gains or losses realized between the trade and settlement dates on securities transactions, and (3) the difference between the amounts of dividends, interest, and foreign withholding taxes recorded on the Fund’s books and the U.S. dollar equivalent of the amounts actually received or paid. Net unrealized foreign currency gains and losses arise from changes in the fair values of assets and liabilities, other than investments in securities at fiscal period end, resulting from changes in exchange rates. | |
| The Fund may invest in foreign securities which may be subject to foreign taxes on income, gains on investments or currency repatriation, a portion of which may be recoverable. | ||
| K. | Foreign Currency Contracts — The Fund may enter into foreign currency contracts to manage or minimize currency or exchange rate risk. The Fund may also enter into foreign currency contracts for the purchase or sale of a security denominated in a foreign currency in order to “lock in” the U.S. dollar price of that security. A foreign currency contract is an obligation to purchase or sell a specific currency for an agreed-upon price at a future date. The use of foreign currency contracts does not eliminate fluctuations in the price of the underlying securities the Fund owns or intends to acquire but establishes a rate of exchange in advance. Fluctuations in the value of these contracts are measured by the difference in the contract date and reporting date exchange rates and are recorded as unrealized appreciation (depreciation) until the contracts are closed. When the contracts are closed, realized gains (losses) are recorded. Realized and unrealized gains (losses) on the contracts are included in the Statement of Operations. The primary risks associated with foreign currency contracts include failure of the counterparty to meet the terms of the contract and the value of the foreign currency changing unfavorably. These risks may be in excess of the amounts reflected in the Statement of Assets and Liabilities. |
| Average Daily Net Assets | Rate | |||
|
First $150 million
|
0 | .80% | ||
|
Over $150 million
|
0 | .625% | ||
| Average Daily Net Assets | Rate | |||
|
First $250 million
|
0 | .695% | ||
|
Next $4 billion
|
0 | .615% | ||
|
Next $750 million
|
0 | .595% | ||
|
Next $2.5 billion
|
0 | .57% | ||
|
Next $2.5 billion
|
0 | .545% | ||
|
Over $10 billion
|
0 | .52% | ||
| Level 1 — | Prices are determined using quoted prices in an active market for identical assets. | |
| Level 2 — | Prices are determined using other significant observable inputs. Observable inputs are inputs that other market participants may use in pricing a security. These may include quoted prices for similar securities, interest rates, prepayment speeds, credit risk, yield curves, loss severities, default rates, discount rates, volatilities and others. | |
| Level 3 — | Prices are determined using significant unobservable inputs. In situations where quoted prices or observable inputs are unavailable (for example, when there is little or no market activity for an investment at the end of the period), unobservable inputs may be used. Unobservable inputs reflect the Fund’s own assumptions about the factors market participants would use in determining fair value of the securities or instruments and would be based on the best available information. |
| Level 1 | Level 2 | Level 3 | Total | |||||||||||||
|
Equity Securities
|
$ | 2,650,962,251 | $ | 30,082,463 | $ | — | $ | 2,681,044,714 | ||||||||
| 2011 | 2010 | |||||||
|
Ordinary income
|
$ | — | $ | 9,906,967 | ||||
| 2011 | ||||
|
Net unrealized appreciation — investments
|
$ | 316,662,629 | ||
|
Temporary book/tax differences
|
(1,762,488 | ) | ||
|
Capital loss carryforward
|
(1,014,261,882 | ) | ||
|
Shares of beneficial interest
|
3,347,715,316 | |||
|
Total net assets
|
$ | 2,648,353,575 | ||
|
Capital Loss |
||||
| Expiration | Carryforward* | |||
|
October 31, 2017
|
$ | 1,014,261,882 | ||
| * | Capital loss carryforward as of the date listed above is reduced for limitations, if any, to the extent required by the Internal Revenue Code. |
| Unrealized Appreciation (Depreciation) of Investment Securities on a Tax Basis | ||||
|
Aggregate unrealized appreciation of investment securities
|
$ | 419,752,516 | ||
|
Aggregate unrealized (depreciation) of investment securities
|
(103,089,887 | ) | ||
|
Net unrealized appreciation of investment securities
|
$ | 316,662,629 | ||
| Cost of investments for tax purposes is $2,364,382,085. | ||||
| Summary of Share Activity | ||||||||||||||||
| Year ended October 31, | ||||||||||||||||
| 2011(a) | 2010 | |||||||||||||||
| Shares | Amount | Shares | Amount | |||||||||||||
|
Sold:
|
||||||||||||||||
|
Class A
|
2,279,141 | $ | 52,916,559 | 2,637,390 | $ | 53,287,787 | ||||||||||
|
Class B
|
170,053 | 3,527,897 | 707,619 | 12,893,913 | ||||||||||||
|
Class C
|
307,295 | 6,415,823 | 304,237 | 5,544,532 | ||||||||||||
|
Class R
|
71,299 | 1,636,821 | 139,423 | 2,787,911 | ||||||||||||
|
Class Y
|
188,934 | 4,420,553 | 323,862 | 6,752,281 | ||||||||||||
|
Institutional Class
|
28,278 | 699,841 | 262,551 | 5,857,583 | ||||||||||||
|
Issued as reinvestment of dividends:
|
||||||||||||||||
|
Class A
|
— | — | 452,979 | 8,987,059 | ||||||||||||
|
Class R
|
— | — | 599 | 11,741 | ||||||||||||
|
Class Y
|
— | — | 3,760 | 74,635 | ||||||||||||
|
Institutional Class
|
— | — | 15,922 | 348,844 | ||||||||||||
|
Automatic conversion of Class B shares to Class A shares:
|
||||||||||||||||
|
Class A
|
1,397,763 | 32,832,637 | 2,085,484 | 42,317,107 | ||||||||||||
|
Class B
|
(1,559,185 | ) | (32,832,637 | ) | (2,309,704 | ) | (42,317,107 | ) | ||||||||
|
Reacquired:
|
||||||||||||||||
|
Class A
|
(19,852,294 | ) | (463,049,025 | ) | (24,956,936 | ) | (504,262,910 | ) | ||||||||
|
Class B
|
(1,161,713 | ) | (24,421,746 | ) | (1,647,055 | ) | (30,004,978 | ) | ||||||||
|
Class C
|
(917,021 | ) | (19,165,086 | ) | (1,221,475 | ) | (22,292,778 | ) | ||||||||
|
Class R
|
(153,082 | ) | (3,550,445 | ) | (157,228 | ) | (3,074,019 | ) | ||||||||
|
Class Y
|
(203,258 | ) | (4,781,407 | ) | (419,086 | ) | (8,628,593 | ) | ||||||||
|
Institutional Class
|
(193,330 | ) | (5,050,250 | ) | (1,451,611 | ) | (32,210,169 | ) | ||||||||
|
Net increase (decrease) in share activity
|
(19,597,120 | ) | $ | (450,400,465 | ) | (25,229,269 | ) | $ | (503,927,161 | ) | ||||||
| (a) | There are entities that are record owners of more than 5% of the outstanding shares of the Fund and in the aggregate own 22% of the outstanding shares of the Fund. IDI has an agreement with these entities to sell Fund shares. The Fund, Invesco and/or Invesco affiliates may make payments to these entities, which are considered to be related to the Fund, for providing services to the Fund, Invesco and/or Invesco affiliates including but not limited to services such as securities brokerage, distribution, third party record keeping and account servicing. The Fund has no knowledge as to whether all or any portion of the shares owned of record by these entities are also owned beneficially. |
|
Ratio of |
Ratio of |
|||||||||||||||||||||||||||||||||||||||||||||||
|
Net gains |
expenses |
expenses |
||||||||||||||||||||||||||||||||||||||||||||||
|
(losses) on |
to average |
to average net |
Ratio of net |
|||||||||||||||||||||||||||||||||||||||||||||
|
Net asset |
Net |
securities |
Dividends |
net assets |
assets without |
investment |
||||||||||||||||||||||||||||||||||||||||||
|
value, |
investment |
(both |
Total from |
from net |
Net asset |
Net assets, |
with fee
waivers |
fee waivers |
income (loss) |
|||||||||||||||||||||||||||||||||||||||
|
beginning |
income |
realized and |
investment |
investment |
value, end |
Total |
end of period |
and/or
expenses |
and/or
expenses |
to average |
Portfolio |
|||||||||||||||||||||||||||||||||||||
| of period | (loss)(a) | unrealized) | operations | income | of period | return(b) | (000s omitted) | absorbed | absorbed | net assets | turnover(c) | |||||||||||||||||||||||||||||||||||||
| Class A | ||||||||||||||||||||||||||||||||||||||||||||||||
| Year ended 10/31/11 | $ | 21.86 | $ | (0.05 | ) | $ | 0.59 | $ | 0.54 | $ | — | $ | 22.40 | 2.47 | % | $ | 2,417,873 | 1.27 | %(d) | 1.29 | %(d) | (0.21 | )%(d) | 126 | % | |||||||||||||||||||||||
| Year ended 10/31/10 | 18.66 | (0.05 | ) | 3.32 | (e) | 3.27 | (0.07 | ) | 21.86 | 17.55 | (e) | 2,712,368 | 1.32 | 1.34 | (0.26 | ) | 53 | |||||||||||||||||||||||||||||||
| Year ended 10/31/09 | 17.79 | 0.08 | 0.79 | (e) | 0.87 | — | 18.66 | 4.89 | (e) | 2,684,240 | 1.42 | 1.44 | 0.44 | 90 | ||||||||||||||||||||||||||||||||||
| Year ended 10/31/08 | 31.12 | (0.04 | ) | (13.29 | ) | (13.33 | ) | — | 17.79 | (42.83 | ) | 2,945,536 | 1.25 | 1.27 | (0.16 | ) | 96 | |||||||||||||||||||||||||||||||
| Year ended 10/31/07 | 25.56 | (0.07 | ) | 5.63 | 5.56 | — | 31.12 | 21.75 | 6,145,755 | 1.17 | 1.20 | (0.25 | ) | 68 | ||||||||||||||||||||||||||||||||||
| Class B | ||||||||||||||||||||||||||||||||||||||||||||||||
| Year ended 10/31/11 | 19.66 | (0.20 | ) | 0.55 | 0.35 | — | 20.01 | 1.78 | 97,318 | 2.02 | (d) | 2.04 | (d) | (0.96 | )(d) | 126 | ||||||||||||||||||||||||||||||||
| Year ended 10/31/10 | 16.85 | (0.18 | ) | 2.99 | (e) | 2.81 | — | 19.66 | 16.68 | (e) | 145,817 | 2.07 | 2.09 | (1.01 | ) | 53 | ||||||||||||||||||||||||||||||||
| Year ended 10/31/09 | 16.20 | (0.05 | ) | 0.70 | (e) | 0.65 | — | 16.85 | 4.01 | (e) | 179,737 | 2.17 | 2.19 | (0.31 | ) | 90 | ||||||||||||||||||||||||||||||||
| Year ended 10/31/08 | 28.54 | (0.21 | ) | (12.13 | ) | (12.34 | ) | — | 16.20 | (43.24 | ) | 281,592 | 2.00 | 2.02 | (0.91 | ) | 96 | |||||||||||||||||||||||||||||||
| Year ended 10/31/07 | 23.62 | (0.25 | ) | 5.17 | 4.92 | — | 28.54 | 20.83 | 844,018 | 1.92 | 1.95 | (1.00 | ) | 68 | ||||||||||||||||||||||||||||||||||
| Class C | ||||||||||||||||||||||||||||||||||||||||||||||||
| Year ended 10/31/11 | 19.66 | (0.20 | ) | 0.54 | 0.34 | — | 20.00 | 1.73 | 90,152 | 2.02 | (d) | 2.04 | (d) | (0.96 | )(d) | 126 | ||||||||||||||||||||||||||||||||
| Year ended 10/31/10 | 16.85 | (0.18 | ) | 2.99 | (e) | 2.81 | — | 19.66 | 16.68 | (e) | 100,596 | 2.07 | 2.09 | (1.01 | ) | 53 | ||||||||||||||||||||||||||||||||
| Year ended 10/31/09 | 16.19 | (0.05 | ) | 0.71 | (e) | 0.66 | — | 16.85 | 4.08 | (e) | 101,671 | 2.17 | 2.19 | (0.31 | ) | 90 | ||||||||||||||||||||||||||||||||
| Year ended 10/31/08 | 28.52 | (0.21 | ) | (12.12 | ) | (12.33 | ) | — | 16.19 | (43.23 | ) | 115,004 | 2.00 | 2.02 | (0.91 | ) | 96 | |||||||||||||||||||||||||||||||
| Year ended 10/31/07 | 23.61 | (0.25 | ) | 5.16 | 4.91 | — | 28.52 | 20.80 | 256,377 | 1.92 | 1.95 | (1.00 | ) | 68 | ||||||||||||||||||||||||||||||||||
| Class R | ||||||||||||||||||||||||||||||||||||||||||||||||
| Year ended 10/31/11 | 21.55 | (0.11 | ) | 0.59 | 0.48 | — | 22.03 | 2.23 | 8,581 | 1.52 | (d) | 1.54 | (d) | (0.46 | )(d) | 126 | ||||||||||||||||||||||||||||||||
| Year ended 10/31/10 | 18.40 | (0.10 | ) | 3.27 | (e) | 3.17 | (0.02 | ) | 21.55 | 17.26 | (e) | 10,155 | 1.57 | 1.59 | (0.51 | ) | 53 | |||||||||||||||||||||||||||||||
| Year ended 10/31/09 | 17.59 | 0.03 | 0.78 | (e) | 0.81 | — | 18.40 | 4.60 | (e) | 8,987 | 1.67 | 1.69 | 0.19 | 90 | ||||||||||||||||||||||||||||||||||
| Year ended 10/31/08 | 30.84 | (0.10 | ) | (13.15 | ) | (13.25 | ) | — | 17.59 | (42.96 | ) | 8,976 | 1.50 | 1.52 | (0.41 | ) | 96 | |||||||||||||||||||||||||||||||
| Year ended 10/31/07 | 25.41 | (0.14 | ) | 5.57 | 5.43 | — | 30.84 | 21.37 | 14,580 | 1.42 | 1.45 | (0.50 | ) | 68 | ||||||||||||||||||||||||||||||||||
| Class Y | ||||||||||||||||||||||||||||||||||||||||||||||||
| Year ended 10/31/11 | 21.92 | 0.01 | 0.60 | 0.61 | — | 22.53 | 2.78 | 13,272 | 1.02 | (d) | 1.04 | (d) | 0.04 | (d) | 126 | |||||||||||||||||||||||||||||||||
| Year ended 10/31/10 | 18.71 | 0.00 | 3.32 | (e) | 3.32 | (0.11 | ) | 21.92 | 17.83 | (e) | 13,229 | 1.07 | 1.09 | (0.01 | ) | 53 | ||||||||||||||||||||||||||||||||
| Year ended 10/31/09 | 17.80 | 0.12 | 0.79 | (e) | 0.91 | — | 18.71 | 5.11 | (e) | 13,003 | 1.17 | 1.19 | 0.69 | 90 | ||||||||||||||||||||||||||||||||||
| Year ended 10/31/08(f) | 19.99 | 0.00 | (2.19 | ) | (2.19 | ) | — | 17.80 | (10.96 | ) | 5,827 | 1.05 | (g) | 1.07 | (g) | 0.04 | (g) | 96 | ||||||||||||||||||||||||||||||
| Institutional Class | ||||||||||||||||||||||||||||||||||||||||||||||||
| Year ended 10/31/11 | 24.26 | 0.08 | 0.66 | 0.74 | — | 25.00 | 3.05 | 21,158 | 0.73 | (d) | 0.75 | (d) | 0.33 | (d) | 126 | |||||||||||||||||||||||||||||||||
| Year ended 10/31/10 | 20.70 | 0.07 | 3.68 | (e) | 3.75 | (0.19 | ) | 24.26 | 18.22 | (e) | 24,534 | 0.76 | 0.78 | 0.30 | 53 | |||||||||||||||||||||||||||||||||
| Year ended 10/31/09 | 19.61 | 0.21 | 0.88 | (e) | 1.09 | — | 20.70 | 5.56 | (e) | 45,219 | 0.75 | 0.77 | 1.11 | 90 | ||||||||||||||||||||||||||||||||||
| Year ended 10/31/08 | 34.14 | 0.09 | (14.62 | ) | (14.53 | ) | — | 19.61 | (42.56 | ) | 52,187 | 0.78 | 0.80 | 0.31 | 96 | |||||||||||||||||||||||||||||||||
| Year ended 10/31/07 | 27.92 | 0.06 | 6.16 | 6.22 | — | 34.14 | 22.28 | 115,443 | 0.71 | 0.74 | 0.21 | 68 | ||||||||||||||||||||||||||||||||||||
| (a) | Calculated using average shares outstanding. | |
| (b) | Includes adjustments in accordance with accounting principles generally accepted in the United States of America and as such, the net asset value for financial reporting purposes and the returns based upon those net asset values may differ from the net asset value and returns for shareholder transactions. Does not include sales charges and is not annualized for periods less than one year, if applicable. | |
| (c) | Portfolio turnover is calculated at the fund level and is not annualized for periods less than one year, if applicable. | |
| (d) | Ratios are based on average daily net assets (000’s) of $2,684,321, $126,733, $100,012, $9,783, $13,953 and $23,784 for Class A, Class B, Class C, Class R, Class Y and Institutional Class shares, respectively. | |
| (e) | Includes litigation proceeds received during the period. Had the litigation proceeds not been received, net gains on securities (both realized and unrealized) per share, for the year ended October 31, 2010, would have been $2.62, $2.29, $2.29, $2.57, $2.62 and $2.98 for Class A, Class B, Class C, Class R, Class Y and Institutional Class shares, respectively, and total returns would have been lower; net gains on securities (both realized and unrealized) per share, for the year ended October 31, 2009, would have been $0.61, $0.52, $0.53, $0.60, $0.61 and $0.70 for Class A, Class B, Class C, Class R, Class Y and Institutional Class shares, respectively, and total returns would have been lower. | |
| (f) | Commencement date of October 3, 2008. | |
| (g) | Annualized. |
|
HYPOTHETICAL |
||||||||||||||||||||||||||||||
|
(5% annual return
before |
||||||||||||||||||||||||||||||
| ACTUAL | expenses) | |||||||||||||||||||||||||||||
|
Beginning |
Ending |
Expenses |
Ending |
Expenses |
Annualized |
|||||||||||||||||||||||||
|
Account Value |
Account Value |
Paid During |
Account Value |
Paid During |
Expense |
|||||||||||||||||||||||||
| Class | (05/01/11) | (10/31/11)1 | Period2 | (10/31/11) | Period2 | Ratio | ||||||||||||||||||||||||
|
A
|
$ | 1,000.00 | $ | 900.00 | $ | 6.19 | $ | 1,018.69 | $ | 6.58 | 1.29 | % | ||||||||||||||||||
|
B
|
1,000.00 | 896.50 | 9.77 | 1,014.91 | 10.37 | 2.04 | ||||||||||||||||||||||||
|
C
|
1,000.00 | 896.50 | 9.77 | 1,014.91 | 10.37 | 2.04 | ||||||||||||||||||||||||
|
R
|
1,000.00 | 898.80 | 7.37 | 1,017.44 | 7.83 | 1.54 | ||||||||||||||||||||||||
|
Y
|
1,000.00 | 901.20 | 5.00 | 1,019.95 | 5.31 | 1.04 | ||||||||||||||||||||||||
|
Institutional
|
1,000.00 | 902.50 | 3.88 | 1,021.32 | 3.92 | 0.77 | ||||||||||||||||||||||||
| 1 | The actual ending account value is based on the actual total return of the Fund for the period May 1, 2011 through October 31, 2011, after actual expenses, and will differ from the hypothetical ending account value which is based on the Fund’s expense ratio and a hypothetical annual return of 5% before expenses. |
| 2 | Expenses are equal to the Fund’s annualized expense ratio as indicated above multiplied by the average account value over the period, multiplied by 184/365 to reflect the most recent fiscal half year. |
| Approval of Investment Advisory and Sub-Advisory Contracts |
| A. | Nature, Extent and Quality of Services Provided by Invesco Advisers and the Affiliated Sub-Advisers |
| B. | Fund Performance |
| C. | Advisory and Sub-Advisory Fees and Fee Waivers |
| D. | Economies of Scale and Breakpoints |
| E. | Profitability and Financial Resources |
| F. | Collateral Benefits to Invesco Advisers and its Affiliates |
|
Number of |
||||||||
|
Funds |
||||||||
|
in Fund
Complex |
||||||||
|
Name, Year of
Birth and |
Trustee
and/ |
Principal
Occupation(s) |
Overseen by |
Other
Directorship(s) |
||||
| Position(s) Held with the Trust | or Officer Since | During Past 5 Years | Trustee | Held by Trustee | ||||
|
Interested
Persons
|
||||||||
|
Martin L.
Flanagan1 —
1960
Trustee |
2007 | Executive Director, Chief Executive Officer and President, Invesco Ltd. (ultimate parent of Invesco and a global investment management firm); Advisor to the Board, Invesco Advisers, Inc. (formerly known as Invesco Institutional (N.A.), Inc.); Trustee, The Invesco Funds; Vice Chair, Investment Company Institute; and Member of Executive Board, SMU Cox School of Business | 141 | None | ||||
| Formerly: Chairman, Invesco Advisers, Inc. (registered investment adviser); Director, Chairman, Chief Executive Officer and President, IVZ Inc. (holding company), INVESCO Group Services, Inc. (service provider) and Invesco North American Holdings, Inc. (holding company); Director, Chief Executive Officer and President, Invesco Holding Company Limited (parent of Invesco and a global investment management firm); Director, Invesco Ltd.; Chairman, Investment Company Institute and President, Co-Chief Executive Officer, Co-President, Chief Operating Officer and Chief Financial Officer, Franklin Resources, Inc. (global investment management organization) | ||||||||
|
Philip A.
Taylor2 —
1954
Trustee, President and Principal Executive Officer |
2006 | Head of North American Retail and Senior Managing Director, Invesco Ltd.; Director, Co-Chairman, Co-President and Co-Chief Executive Officer, Invesco Advisers, Inc. (formerly known as Invesco Institutional (N.A.), Inc.) (registered investment adviser); Director, Chairman, Chief Executive Officer and President, Invesco Management Group, Inc. (formerly Invesco Aim Management Group, Inc.) (financial services holding company); Director and President, INVESCO Funds Group, Inc. (registered investment adviser and registered transfer agent); Director and Chairman, Invesco Investment Services, Inc. (formerly known as Invesco Aim Investment Services, Inc.) (registered transfer agent) and IVZ Distributors, Inc. (formerly known as INVESCO Distributors, Inc.) (registered broker dealer); Director, President and Chairman, Invesco Inc. (holding company) and Invesco Canada Holdings Inc. (holding company); Chief Executive Officer, Invesco Corporate Class Inc. (corporate mutual fund company) and Invesco Canada Fund Inc. (corporate mutual fund company); Director, Chairman and Chief Executive Officer, Invesco Canada Ltd. (formerly known as Invesco Trimark Ltd./Invesco Trimark Ltèe) (registered investment adviser and registered transfer agent); Trustee, President and Principal Executive Officer, The Invesco Funds (other than AIM Treasurer’s Series Trust (Invesco Treasurer’s Series Trust) and Short-Term Investments Trust); Trustee and Executive Vice President, The Invesco Funds (AIM Treasurer’s Series Trust (Invesco Treasurer’s Series Trust) and Short-Term Investments Trust only); Director, Invesco Investment Advisers LLC (formerly known as Van Kampen Asset Management); Director, Chief Executive Officer and President, Van Kampen Exchange Corp. | 141 | None | ||||
| Formerly: Director and Chairman, Van Kampen Investor Services Inc.: | ||||||||
| Director, Chief Executive Officer and President, 1371 Preferred Inc. (holding company); and Van Kampen Investments Inc.; Director and President, AIM GP Canada Inc. (general partner for limited partnerships); and Van Kampen Advisors, Inc.; Director and Chief Executive Officer, Invesco Trimark Dealer Inc. (registered broker dealer); Director, Invesco Distributors, Inc. (formerly known as Invesco Aim Distributors, Inc.) (registered broker dealer); Manager, Invesco PowerShares Capital Management LLC; Director, Chief Executive Officer and President, Invesco Advisers, Inc.; Director, Chairman, Chief Executive Officer and President, Invesco Aim Capital Management, Inc.; President, Invesco Trimark Dealer Inc. and Invesco Trimark Ltd./Invesco Trimark Ltèe; Director and President, AIM Trimark Corporate Class Inc. and AIM Trimark Canada Fund Inc.; Senior Managing Director, Invesco Holding Company Limited; Trustee and Executive Vice President, Tax-Free Investments Trust; Director and Chairman, Fund Management Company (former registered broker dealer); President and Principal Executive Officer, The Invesco Funds (AIM Treasurer’s Series Trust (Invesco Treasurer’s Series Trust), Short-Term Investments Trust and Tax-Free Investments Trust only); President, AIM Trimark Global Fund Inc. and AIM Trimark Canada Fund Inc. | ||||||||
|
Wayne W.
Whalen3 —
1939
Trustee |
2010 | Of Counsel, and prior to 2010, partner in the law firm of Skadden, Arps, Slate, Meagher & Flom LLP, legal counsel to funds in the Fund Complex | 159 | Director of the Abraham Lincoln Presidential Library Foundation | ||||
|
Independent
Trustees
|
||||||||
|
Bruce L. Crockett — 1944
Trustee and Chair |
1993 | Chairman, Crockett Technology Associates (technology consulting company) | 141 | ACE Limited (insurance company); and Investment Company Institute | ||||
| Formerly: Director, Captaris (unified messaging provider); Director, President and Chief Executive Officer COMSAT Corporation; and Chairman, Board of Governors of INTELSAT (international communications company) | ||||||||
|
David C. Arch — 1945
Trustee |
2010 | Chairman and Chief Executive Officer of Blistex Inc., a consumer health care products manufacturer. | 159 | Member of the Heartland Alliance Advisory Board, a nonprofit organization serving human needs based in Chicago. Board member of the Illinois Manufacturers’ Association. Member of the Board of Visitors, Institute for the Humanities, University of Michigan | ||||
| 1 | Mr. Flanagan is considered an interested person of the Trust because he is an officer of the adviser to the Trust, and an officer and a director of Invesco Ltd., ultimate parent of the adviser to the Trust. |
| 2 | Mr. Taylor is considered an interested person of the Trust because he is an officer and a director of the adviser to, and a director of the principal underwriter of, the Trust. |
| 3 | Mr. Whalen has been deemed to be an interested person of the Trust because of his prior service as counsel to the predecessor funds of certain Invesco open-end funds and his affiliation with the law firm that served as counsel to such predecessor funds and continues to serve as counsel to the Invesco Van Kampen closed-end funds. |
|
Number of |
||||||||
|
Funds in |
||||||||
|
Fund Complex |
||||||||
|
Name, Year of
Birth and |
Trustee
and/ |
Principal
Occupation(s) |
Overseen by |
Other
Directorship(s) |
||||
| Position(s) Held with the Trust | or Officer Since | During Past 5 Years | Trustee | Held by Trustee | ||||
|
Independent
Trustees—(continued)
|
||||||||
|
Bob R. Baker — 1936
Trustee |
2003 | Retired | 141 | None | ||||
| Formerly: President and Chief Executive Officer, AMC Cancer Research Center; and Chairman and Chief Executive Officer, First Columbia Financial Corporation | ||||||||
|
Frank S. Bayley — 1939
Trustee |
2001 |
Retired Formerly: Director, Badgley Funds, Inc. (registered investment company) (2 portfolios) and Partner, law firm of Baker & McKenzie |
141 | Director and Chairman, C.D. Stimson Company (a real estate investment company) | ||||
|
James T. Bunch — 1942
Trustee |
2003 |
Founder, Green, Manning & Bunch Ltd. (investment banking firm)
Formerly: Executive Committee, United States Golf Association; and Director, Policy Studies, Inc. and Van Gilder Insurance Corporation |
141 | Vice Chairman, Board of Governors, Western Golf Association/Evans Scholars Foundation and Director, Denver Film Society | ||||
|
Rodney F. Dammeyer — 1940
Trustee |
2010 |
President of CAC, LLC, a private company offering capital investment and management advisory services.
Formerly: Prior to January 2004, Director of TeleTech Holdings Inc.; Prior to 2002, Director of Arris Group, Inc.; Prior to 2001, Managing Partner at Equity Group Corporate Investments. Prior to 1995, Vice Chairman of Anixter International. Prior to 1985, experience includes Senior Vice President and Chief Financial Officer of Household International, Inc, Executive Vice President and Chief Financial Officer of Northwest Industries, Inc. and Partner of Arthur Andersen & Co. |
159 | Director of Quidel Corporation and Stericycle, Inc. Prior to May 2008, Trustee of The Scripps Research Institute. Prior to February 2008, Director of Ventana Medical Systems, Inc. Prior to April 2007, Director of GATX Corporation. Prior to April 2004, Director of TheraSense, Inc. | ||||
|
Albert R. Dowden — 1941
Trustee |
2000 | Director of a number of public and private business corporations, including the Boss Group, Ltd. (private investment and management); Reich & Tang Funds (5 portfolios) (registered investment company); and Homeowners of America Holding Corporation/ Homeowners of America Insurance Company (property casualty company) | 141 | Board of Nature’s Sunshine Products, Inc. | ||||
| Formerly: Director, Continental Energy Services, LLC (oil and gas pipeline service); Director, CompuDyne Corporation (provider of product and services to the public security market) and Director, Annuity and Life Re (Holdings), Ltd. (reinsurance company); Director, President and Chief Executive Officer, Volvo Group North America, Inc.; Senior Vice President, AB Volvo; Director of various public and private corporations; Chairman, DHJ Media, Inc.; Director Magellan Insurance Company; and Director, The Hertz Corporation, Genmar Corporation (boat manufacturer), National Media Corporation; Advisory Board of Rotary Power International (designer, manufacturer, and seller of rotary power engines); and Chairman, Cortland Trust, Inc. (registered investment company) | ||||||||
|
Jack M. Fields — 1952
Trustee |
1997 | Chief Executive Officer, Twenty First Century Group, Inc. (government affairs company); and Owner and Chief Executive Officer, Dos Angelos Ranch, L.P. (cattle, hunting, corporate entertainment), Discovery Global Education Fund (non-profit) and Cross Timbers Quail Research Ranch (non-profit) | 141 | Administaff | ||||
| Formerly: Chief Executive Officer, Texana Timber LP (sustainable forestry company) and member of the U.S. House of Representatives | ||||||||
|
Carl Frischling — 1937
Trustee |
1988 | Partner, law firm of Kramer Levin Naftalis and Frankel LLP | 141 | Director, Reich & Tang Funds (6 portfolios) | ||||
|
Prema Mathai-Davis — 1950
Trustee |
1998 | Retired | 141 | None | ||||
| Formerly: Chief Executive Officer, YWCA of the U.S.A. | ||||||||
|
Larry Soll — 1942
Trustee |
2003 | Retired | 141 | None | ||||
| Formerly, Chairman, Chief Executive Officer and President, Synergen Corp. (a biotechnology company) | ||||||||
|
Number of |
||||||||
|
Funds in |
||||||||
|
Fund Complex |
||||||||
|
Name, Year of
Birth and |
Trustee
and/ |
Principal
Occupation(s) |
Overseen by |
Other
Directorship(s) |
||||
| Position(s) Held with the Trust | or Officer Since | During Past 5 Years | Trustee | Held by Trustee | ||||
|
Independent
Trustees—(continued)
|
||||||||
|
Hugo F. Sonnenschein — 1940
Trustee |
2010 | President Emeritus and Honorary Trustee of the University of Chicago and the Adam Smith Distinguished Service Professor in the Department of Economics at the University of Chicago. Prior to July 2000, President of the University of Chicago. | 159 | Trustee of the University of Rochester and a member of its investment committee. Member of the National Academy of Sciences, the American Philosophical Society and a fellow of the American Academy of Arts and Sciences | ||||
|
Raymond Stickel, Jr. — 1944
Trustee |
2005 | Retired | 141 | Director of Long Cove Club Owners’ Association (home owner’s association) | ||||
| Formerly: Director, Mainstay VP Series Funds, Inc. (25 portfolios) and Partner, Deloitte & Touche | ||||||||
|
Other
Officers
|
||||||||
|
Russell C. Burk — 1958
Senior Vice President and Senior Officer |
2005 | Senior Vice President and Senior Officer of Invesco Funds | N/A | N/A | ||||
|
John M. Zerr — 1962
Senior Vice President, Chief Legal Officer and Secretary |
2006 | Director, Senior Vice President, Secretary and General Counsel, Invesco Management Group, Inc. (formerly known as Invesco Aim Management Group, Inc.) and Van Kampen Exchange Corp.; Senior Vice President, Invesco Advisers, Inc. (formerly known as Invesco Institutional (N.A.), Inc.) (registered investment adviser); Senior Vice President and Secretary, Invesco Distributors, Inc. (formerly known as Invesco Aim Distributors, Inc.); Director, Vice President and Secretary, Invesco Investment Services, Inc. (formerly known as Invesco Aim Investment Services, Inc.) and IVZ Distributors, Inc. (formerly known as INVESCO Distributors, Inc.); Director and Vice President, INVESCO Funds Group, Inc.; Senior Vice President, Chief Legal Officer and Secretary, The Invesco Funds; Manager, Invesco PowerShares Capital Management LLC; Director, Secretary and General Counsel, Invesco Investment Advisers LLC (formerly known as Van Kampen Asset Management); Secretary and General Counsel, Van Kampen Funds Inc. and Chief Legal Officer, PowerShares Exchange-Traded Fund Trust, PowerShares Exchange-Traded Fund Trust II, PowerShares India Exchange-Traded Fund Trust and PowerShares Actively Managed Exchange-Traded Fund Trust | N/A | N/A | ||||
| Formerly: Director and Secretary, Van Kampen Advisors Inc.; Director Vice President, Secretary and General Counsel Van Kampen Investor Services Inc.; Director, Invesco Distributors, Inc. (formerly known as Invesco Aim Distributors, Inc.); Director, Senior Vice President, General Counsel and Secretary, Invesco Advisers, Inc.; and Van Kampen Investments Inc.; Director, Vice President and Secretary, Fund Management Company; Director, Senior Vice President, Secretary, General Counsel and Vice President, Invesco Aim Capital Management, Inc.; Chief Operating Officer and General Counsel, Liberty Ridge Capital, Inc. (an investment adviser); Vice President and Secretary, PBHG Funds (an investment company) and PBHG Insurance Series Fund (an investment company); Chief Operating Officer, General Counsel and Secretary, Old Mutual Investment Partners (a broker-dealer); General Counsel and Secretary, Old Mutual Fund Services (an administrator) and Old Mutual Shareholder Services (a shareholder servicing center); Executive Vice President, General Counsel and Secretary, Old Mutual Capital, Inc. (an investment adviser); and Vice President and Secretary, Old Mutual Advisors Funds (an investment company) | ||||||||
|
Lisa O. Brinkley — 1959
Vice President |
2004 |
Global Compliance Director, Invesco Ltd.; Chief Compliance Officer, Invesco Investment Services, Inc.(formerly known as Invesco Aim Investment Services, Inc.); and Vice President, The Invesco Funds
Formerly: Chief Compliance Officer, Invesco Distributors, Inc. (formerly known as Invesco Aim Distributors, Inc.) and Van Kampen Investor Services Inc.; Senior Vice President, Invesco Management Group, Inc.; Senior Vice President and Chief Compliance Officer, Invesco Advisers, Inc. and The Invesco Funds; Vice President and Chief Compliance Officer, Invesco Aim Capital Management, Inc. and Invesco Distributors, Inc.; Vice President, Invesco Investment Services, Inc. and Fund Management Company |
N/A | N/A | ||||
|
Sheri Morris — 1964
Vice President, Treasurer and Principal Financial Officer |
1999 | Vice President, Treasurer and Principal Financial Officer, The Invesco Funds; and Vice President, Invesco Advisers, Inc. (formerly known as Invesco Institutional (N.A.), Inc.) (registered investment adviser). | N/A | N/A | ||||
| Formerly: Treasurer, PowerShares Exchange-Traded Fund Trust, PowerShares Exchange-Traded Fund Trust II, PowerShares India Exchange-Traded Fund Trust and PowerShares Actively Managed Exchange-Traded Fund Trust; Vice President, Invesco Advisers, Inc., Invesco Aim Capital Management, Inc. and Invesco Aim Private Asset Management, Inc.; Assistant Vice President and Assistant Treasurer, The Invesco Funds and Assistant Vice President, Invesco Advisers, Inc., Invesco Aim Capital Management, Inc. and Invesco Aim Private Asset Management, Inc. | ||||||||
|
Karen Dunn Kelley — 1960
Vice President |
2004 | Head of Invesco’s World Wide Fixed Income and Cash Management Group; Senior Vice President, Invesco Advisers, Inc. (formerly known as Invesco Institutional (N.A.), Inc.) (registered investment adviser); Executive Vice President, Invesco Distributors, Inc. (formerly known as Invesco Aim Distributors, Inc.); Senior Vice President, Invesco Management Group, Inc. (formerly known as Invesco Aim Management Group, Inc.); and Director, Invesco Mortgage Capital Inc.; Vice President, The Invesco Funds (other than AIM Treasurer’s Series Trust (Invesco Treasurer’s Series Trust) and Short-Term Investments Trust); President and Principal Executive Officer, The Invesco Funds (AIM Treasurer’s Series Trust (Invesco Treasurer’s Series Trust) and Short-Term Investments Trust only). | N/A | N/A | ||||
| Formerly: Senior Vice President, Van Kampen Investments Inc.; Vice President, Invesco Advisers, Inc. (formerly known as Invesco Institutional (N.A.), Inc.); Director of Cash Management and Senior Vice President, Invesco Advisers, Inc. and Invesco Aim Capital Management, Inc.; President and Principal Executive Officer, Tax-Free Investments Trust; Director and President, Fund Management Company; Chief Cash Management Officer, Director of Cash Management, Senior Vice President, and Managing Director, Invesco Aim Capital Management, Inc.; Director of Cash Management, Senior Vice President, and Vice President, Invesco Advisers, Inc. and The Invesco Funds (AIM Treasurer’s Series Trust (Invesco Treasurer’s Series Trust), Short-Term Investments Trust and Tax-Free Investments Trust only) | ||||||||
|
Number of |
||||||||
|
Funds in |
||||||||
|
Fund Complex |
||||||||
|
Name, Year of
Birth and |
Trustee
and/ |
Principal
Occupation(s) |
Overseen by |
Other
Directorship(s) |
||||
| Position(s) Held with the Trust | or Officer Since | During Past 5 Years | Trustee | Held by Trustee | ||||
|
Other
Officers—(continued)
|
||||||||
|
Lance A. Rejsek — 1967
Anti-Money Laundering Compliance Officer |
2005 | Anti-Money Laundering Compliance Officer, Invesco Advisers, Inc. (formerly known as Invesco Institutional (N.A.), Inc.) (registered investment adviser); Invesco Distributors, Inc. (formerly known as Invesco Aim Distributors, Inc.), Invesco Investment Services, Inc. (formerly known as Invesco Aim Investment Services, Inc.), The Invesco Funds, PowerShares Exchange-Traded Fund Trust, PowerShares Exchange-Traded Fund Trust II, PowerShares India Exchange-Traded Fund Trust, PowerShares Actively Managed Exchange-Traded Fund Trust, Invesco Investment Advisers LLC (formerly known as Van Kampen Asset Management) and Van Kampen Funds Inc. | N/A | N/A | ||||
| Formerly: Anti-Money Laundering Compliance Officer, Van Kampen Investor Services Inc., Fund Management Company, Invesco Advisers, Inc., Invesco Aim Capital Management, Inc. and Invesco Aim Private Asset Management, Inc. | ||||||||
|
Todd L. Spillane — 1958
Chief Compliance Officer |
2006 | Senior Vice President, Invesco Management Group, Inc. (formerly known as Invesco Aim Management Group, Inc.) and Van Kampen Exchange Corp.; Senior Vice President and Chief Compliance Officer, Invesco Advisers, Inc. (registered investment adviser) (formerly known as Invesco Institutional (N.A.), Inc.); Chief Compliance Officer, The Invesco Funds, PowerShares Exchange-Traded Fund Trust, PowerShares Exchange-Traded Fund Trust II, PowerShares India Exchange-Traded Fund Trust, PowerShares Actively Managed Exchange-Traded Fund Trust, INVESCO Private Capital Investments, Inc. (holding company) and Invesco Private Capital, Inc. (registered investment adviser); Vice President, Invesco Distributors, Inc. (formerly known as Invesco Aim Distributors, Inc.) and Invesco Investment Services, Inc. (formerly known as Invesco Aim Investment Services, Inc.). | N/A | N/A | ||||
| Formerly: Chief Compliance Officer, Invesco Van Kampen Closed-End Funds; Senior Vice President, Van Kampen Investments Inc.; Senior Vice President and Chief Compliance Officer, Invesco Advisers, Inc. and Invesco Aim Capital Management, Inc.; Chief Compliance Officer, Invesco Global Asset Management (N.A.), Inc., Invesco Senior Secured Management, Inc. (registered investment adviser) and Van Kampen Investor Services Inc.; Vice President, Invesco Aim Capital Management, Inc. and Fund Management Company | ||||||||
|
Office of the Fund 11 Greenway Plaza, Suite 2500 Houston, TX 77046-1173 |
Investment Adviser Invesco Advisers, Inc. 1555 Peachtree Street, N.E. Atlanta, GA 30309 |
Distributor Invesco Distributors, Inc. 11 Greenway Plaza, Suite 2500 Houston, TX 77046-1173 |
Auditors PricewaterhouseCoopers LLP 1201 Louisiana Street, Suite 2900 Houston, TX 77002-5678 |
|||
|
Counsel to the Fund Stradley Ronon Stevens & Young, LLP 2600 One Commerce Square Philadelphia, PA 19103 |
Counsel to the Independent Trustees Kramer, Levin, Naftalis & Frankel LLP 1177 Avenue of the Americas New York, NY 10036-2714 |
Transfer Agent Invesco Investment Services, Inc. 11 Greenway Plaza, Suite 2500 Houston, TX 77046-1173 |
Custodian State Street Bank and Trust Company 225 Franklin Boston, MA 02110-2801 |


Information regarding how the Fund voted proxies related to its portfolio securities during the 12 months ended June 30, 2011, is available at invesco.com/proxysearch. The information is also available on the SEC website, sec.gov.
Invesco Advisers, Inc. is an investment adviser; it provides investment advisory services to individual and institutional clients and does not sell securities. Invesco Distributors, Inc. is the U.S. distributor for Invesco Ltd.’s retail mutual funds, exchange-traded funds and institutional money market funds. Both are wholly owned, indirect subsidiaries of Invesco Ltd.
| CST-AR-1 | Invesco Distributors, Inc. |
 |
Nasdaq:
Y: AWEIX
2 |
Letters to Shareholders | |
4 |
Performance Summary | |
4 |
Management Discussion | |
6 |
Long-Term Fund Performance | |
7 |
Supplemental Information | |
8 |
Schedule of Investments | |
10 |
Financial Statements | |
12 |
Notes to Financial Statements | |
17 |
Financial Highlights | |
18 |
Auditor’s Report | |
19 |
Fund Expenses | |
20 |
Approval of Investment Advisory and Sub-Advisory Agreements | |
22 |
Tax Information | |
T-1 |
Trustees and Officers | |

Philip Taylor

Senior Managing Director, Invesco Ltd.

Bruce Crockett

Independent Chair
Invesco Funds Board of Trustees
Class Y Shares |
11.44 | % | ||
S&P 500 Index▼ (Broad Market Index) |
8.07 | |||
Source(s): ▼Lipper Inc. |
||||
Information Technology |
27.0 | % | ||
Consumer Discretionary |
13.5 | |||
Energy |
11.7 | |||
Health Care |
11.4 | |||
Consumer Staples |
9.4 | |||
Financials |
9.2 | |||
Industrials |
8.6 | |||
Materials |
3.6 | |||
Utilities |
1.5 | |||
Money Market Funds |
||||
Plus Other Assets Less Liabilities |
4.1 | |||
| 1. | Apple Inc. |
3.7 | % | |||||
| 2. | Oracle Corp. |
3.4 | ||||||
| 3. | Target Corp. |
2.9 | ||||||
| 4. | PepsiCo, Inc. |
2.8 | ||||||
| 5. | H.J. Heinz Co. |
2.5 | ||||||
| 6. | Automatic Data Processing, Inc. |
2.5 | ||||||
| 7. | McDonald’s Corp. |
2.5 | ||||||
| 8. | General Electric Co. |
2.4 | ||||||
| 9. | Apache Corp. |
2.4 | ||||||
| 10. | Cisco Systems, Inc. |
2.4 | ||||||
Total Net Assets |
$227.7 million | |||
Total Number of Holdings* |
57 | |||
| 1 | Source: Bloomberg L.P. | |
| 2 | Source: Lipper Inc. |

Chartered Financial Analyst, portfolio manager, is manager of Invesco Disciplined Equity Fund. Ms. Bannan has been affiliated with Invesco and/or its affiliates since 2007. She earned a B.S. in business administration with a concentration in economics from the Whittemore School of Business and Economics at the University of New Hampshire.

Chartered Financial Analyst, portfolio manager, is manager of Invesco Disciplined Equity Fund. Mr. McPheeters has been associated with Invesco and/or its affiliates since 1997. He has been responsible for the Fund since its inception on September 21, 2009, and was instrumental in creating the strategy for the Fund’s predecessor at its inception. Mr. McPheeters earned a B.S. in chemical engineering from the Colorado School of Mines.
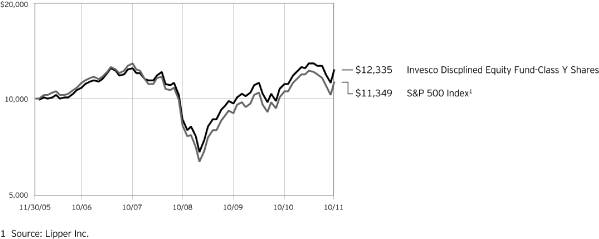
| Class Y Shares | ||||||||
| Inception (12/1/05) | 3.61 | % | ||||||
| 5 | Years |
2.58 | ||||||
| 1 | Year |
11.44 | ||||||
| Class Y Shares | ||||||||
| Inception (12/1/05) | 1.90 | % | ||||||
| 5 | Years |
1.07 | ||||||
| 1 | Year |
3.97 | ||||||
| n | Unless otherwise stated, information presented in this report is as of October 31, 2011, and is based on total net assets. | |
| n | Unless otherwise noted, all data provided by Invesco. | |
| n | To access your Fund’s reports/prospectus, visit invesco.com/fundreports. |
| n | Class Y shares are available to only certain investors. Please see the prospectus for more information. |
| n | Credit risk. The issuer of instruments in which the Fund invests may be unable to meet interest and/or princi- pal payments, thereby causing its instruments to decrease in value and lowering the issuer’s credit rating. | |
| n | Foreign securities risk. The Fund’s foreign investments may be affected by changes in a foreign country’s exchange rates; political and social instability; changes in economic or taxation policies; difficulties when enforcing obligations; decreased liquidity; and increased volatility. Foreign companies may be subject to less regulation resulting in less publicly available information about the companies. | |
| n | Interest rate risk. Interest rate risk refers to the risk that bond prices generally fall as interest rates rise; conversely, bond prices generally rise as interest rates fall. Specific bonds differ in their sensitivity to changes in interest rates depending on their individual characteristics, including duration. | |
| n | Management risk. The investment techniques and risk analysis used by the Fund’s portfolio managers may not produce the desired results. | |
| n | Market risk. The prices of and the income generated by the Fund’s securities may decline in response to, among other things, investor sentiment; general economic and market conditions; regional or global instability; and currency and interest rate fluctuations. |
| n | Value investing style risk. The Fund emphasizes a value style of investing, which focuses on undervalued compa- nies with characteristics for improved valuations. This style of investing is subject to the risk that the valuations never improve or that the returns on value equity securities are less than returns on other styles of investing or the overall stock market. Value stocks also may decline in price, even though in theory they are already underpriced. |
| n | The S&P 500® Index is an unmanaged index considered representative of the U.S. stock market. | |
| n | The Fund is not managed to track the performance of any particular index, including the index(es) defined here, and consequently, the performance of the Fund may deviate significantly from the performance of the index(es). | |
| n | A direct investment cannot be made in an index. Unless otherwise indicated, index results include reinvested dividends, and they do not reflect sales charges. Performance of the peer group, if applicable, reflects fund expenses; performance of a market index does not. |
| n | The Chartered Financial Analyst® (CFA®) designation is globally recognized and attests to a charterholder’s success in a rigorous and comprehensive study program in the field of investment management and research analysis. | |
| n | The returns shown in management’s discussion of Fund performance are based on net asset values calculated for shareholder transactions. Generally accepted accounting principles require adjustments to be made to the net assets of the Fund at period end for financial reporting purposes, and as such, the net asset values for shareholder transactions and the returns based on those net asset values may differ from the net asset values and returns reported in the Financial Highlights. | |
| n | Industry classifications used in this report are generally according to the Global Industry Classification Standard, which was developed by and is the exclusive property and a service mark of MSCI Inc. and Standard & Poor’s. |
NOT FDIC INSURED |
MAY LOSE VALUE | NO BANK GUARANTEE | ||||||
| Class Y Shares | AWEIX |
| Shares | Value | |||||||
|
Common Stocks–95.91% |
||||||||
|
Aerospace & Defense–1.97% |
||||||||
|
United Technologies Corp.
|
57,668 | $ | 4,496,951 | |||||
|
Apparel Retail–1.88% |
||||||||
|
TJX Cos., Inc. (The)
|
72,499 | 4,272,366 | ||||||
|
Apparel, Accessories & Luxury Goods–1.04% |
||||||||
|
VF Corp.
|
17,175 | 2,373,928 | ||||||
|
Asset Management & Custody Banks–1.52% |
||||||||
|
BlackRock, Inc.
|
21,885 | 3,453,234 | ||||||
|
Automobile Manufacturers–1.20% |
||||||||
|
Ford Motor
Co.(b)
|
233,905 | 2,732,010 | ||||||
|
Cable & Satellite–3.03% |
||||||||
|
Comcast Corp.–Class A
|
218,459 | 5,122,864 | ||||||
|
Liberty Global,
Inc.–Class A(b)
|
43,996 | 1,767,759 | ||||||
| 6,890,623 | ||||||||
|
Communications Equipment–2.35% |
||||||||
|
Cisco Systems, Inc.
|
289,026 | 5,355,652 | ||||||
|
Computer Hardware–3.65% |
||||||||
|
Apple
Inc.(b)
|
20,545 | 8,316,205 | ||||||
|
Data Processing & Outsourced Services–10.37% |
||||||||
|
Alliance Data Systems
Corp.(b)
|
35,340 | 3,620,230 | ||||||
|
Automatic Data Processing, Inc.
|
109,179 | 5,713,337 | ||||||
|
Fidelity National Information Services, Inc.
|
109,728 | 2,872,679 | ||||||
|
Fiserv,
Inc.(b)
|
61,488 | 3,619,799 | ||||||
|
Visa Inc.–Class A
|
53,782 | 5,015,709 | ||||||
|
Western Union Co. (The)
|
159,068 | 2,778,918 | ||||||
| 23,620,672 | ||||||||
|
Diversified Banks–2.18% |
||||||||
|
Wells Fargo & Co.
|
191,548 | 4,963,009 | ||||||
|
Diversified Metals & Mining–1.14% |
||||||||
|
Freeport-McMoRan Copper & Gold Inc.
|
64,575 | 2,599,789 | ||||||
|
Drug Retail–2.33% |
||||||||
|
CVS Caremark Corp.
|
51,771 | 1,879,287 | ||||||
|
Walgreen Co.
|
103,355 | 3,431,386 | ||||||
| 5,310,673 | ||||||||
|
Environmental & Facilities Services–0.90% |
||||||||
|
Republic Services, Inc.
|
72,425 | 2,061,215 | ||||||
|
Footwear–0.98% |
||||||||
|
NIKE, Inc.–Class B
|
23,066 | 2,222,409 | ||||||
|
General Merchandise Stores–2.90% |
||||||||
|
Target Corp.
|
120,701 | 6,608,380 | ||||||
|
Health Care Equipment–2.31% |
||||||||
|
Covidien PLC (Ireland)
|
34,200 | 1,608,768 | ||||||
|
Stryker Corp.
|
76,050 | 3,643,555 | ||||||
| 5,252,323 | ||||||||
|
Health Care Services–2.23% |
||||||||
|
Express Scripts,
Inc.(b)
|
87,381 | 3,995,933 | ||||||
|
Medco Health Solutions,
Inc.(b)
|
19,675 | 1,079,371 | ||||||
| 5,075,304 | ||||||||
|
Home Improvement Retail–0.00% |
||||||||
|
Lowe’s Cos., Inc.
|
1 | 21 | ||||||
|
Household Products–1.65% |
||||||||
|
Procter & Gamble Co. (The)
|
58,810 | 3,763,252 | ||||||
|
Industrial Conglomerates–4.03% |
||||||||
|
Danaher Corp.
|
75,172 | 3,634,566 | ||||||
|
General Electric Co.
|
331,539 | 5,540,017 | ||||||
| 9,174,583 | ||||||||
|
Industrial Gases–1.95% |
||||||||
|
Praxair, Inc.
|
43,658 | 4,438,709 | ||||||
|
Integrated Oil & Gas–1.51% |
||||||||
|
Exxon Mobil Corp.
|
44,156 | 3,448,142 | ||||||
|
Internet Software & Services–2.32% |
||||||||
|
Google
Inc.–Class A(b)
|
8,910 | 5,280,422 | ||||||
|
IT Consulting & Other Services–1.62% |
||||||||
|
Accenture PLC–Class A (Ireland)
|
61,092 | 3,681,404 | ||||||
|
Managed Health Care–3.67% |
||||||||
|
Aetna Inc.
|
77,794 | 3,093,090 | ||||||
|
UnitedHealth Group, Inc.
|
109,575 | 5,258,504 | ||||||
| 8,351,594 | ||||||||
|
Multi-Utilities–1.53% |
||||||||
|
PG&E Corp.
|
81,092 | 3,478,847 | ||||||
|
Oil & Gas Exploration & Production–7.02% |
||||||||
|
Anadarko Petroleum Corp.
|
44,634 | 3,503,769 | ||||||
|
Apache Corp.
|
55,151 | 5,494,694 | ||||||
|
EQT Corp.
|
40,168 | 2,550,668 | ||||||
|
QEP Resources Inc.
|
124,747 | 4,434,756 | ||||||
| 15,983,887 | ||||||||
| Shares | Value | |||||||
|
Oil & Gas Storage & Transportation–3.13% |
||||||||
|
Spectra Energy Corp.
|
72,086 | $ | 2,063,822 | |||||
|
Williams Cos., Inc. (The)
|
167,926 | 5,056,252 | ||||||
| 7,120,074 | ||||||||
|
Other Diversified Financial Services–4.03% |
||||||||
|
Citigroup Inc.
|
169,463 | 5,353,336 | ||||||
|
JPMorgan Chase & Co.
|
110,046 | 3,825,199 | ||||||
| 9,178,535 | ||||||||
|
Packaged Foods & Meats–2.54% |
||||||||
|
H.J. Heinz Co.
|
108,301 | 5,787,605 | ||||||
|
Pharmaceuticals–3.23% |
||||||||
|
Abbott Laboratories
|
63,236 | 3,406,523 | ||||||
|
Merck & Co., Inc.
|
114,207 | 3,940,142 | ||||||
| 7,346,665 | ||||||||
|
Railroads–1.25% |
||||||||
|
Norfolk Southern Corp.
|
38,428 | 2,843,288 | ||||||
|
Restaurants–2.47% |
||||||||
|
McDonald’s Corp.
|
60,560 | 5,622,996 | ||||||
|
Security & Alarm Services–0.46% |
||||||||
|
Corrections Corp. of
America(b)
|
47,400 | 1,053,702 | ||||||
|
Soft Drinks–2.84% |
||||||||
|
PepsiCo, Inc.
|
102,671 | 6,463,139 | ||||||
|
Specialized Finance–1.47% |
||||||||
|
CME Group Inc.
|
12,135 | 3,343,921 | ||||||
|
Specialty Chemicals–0.52% |
||||||||
|
Valspar Corp. (The)
|
34,070 | 1,188,021 | ||||||
|
Systems Software–6.69% |
||||||||
|
BMC Software,
Inc.(b)
|
72,354 | 2,515,025 | ||||||
|
Microsoft Corp.
|
190,918 | 5,084,146 | ||||||
|
Oracle Corp.
|
233,150 | 7,640,326 | ||||||
| 15,239,497 | ||||||||
|
Total Common Stock (Cost $186,158,780)
|
218,393,047 | |||||||
|
Money Market Funds–3.85% |
||||||||
|
Liquid Assets Portfolio–Institutional
Class(c)
|
4,388,190 | 4,388,190 | ||||||
|
Premier Portfolio–Institutional
Class(c)
|
4,388,189 | 4,388,189 | ||||||
|
Total Money Market Funds (Cost $8,776,379)
|
8,776,379 | |||||||
|
TOTAL INVESTMENTS–99.76% (Cost $194,935,159)
|
227,169,426 | |||||||
|
OTHER ASSETS LESS LIABILITIES–0.24%
|
542,096 | |||||||
|
NET ASSETS–100.00%
|
$ | 227,711,522 | ||||||
| (a) | Industry and/or sector classifications used in this report are generally according to the Global Industry Classification Standard, which was developed by and is the exclusive property and a service mark of MSCI Inc. and Standard & Poor’s. | |
| (b) | Non-income producing security. | |
| (c) | The money market fund and the Fund are affiliated by having the same investment adviser. |
|
Assets: |
||||
|
Investments, at value (Cost $186,158,780)
|
$ | 218,393,047 | ||
|
Investments in affiliated money market funds, at value and cost
|
8,776,379 | |||
|
Total investments, at value (Cost $194,935,159)
|
227,169,426 | |||
|
Receivable for:
|
||||
|
Fund shares sold
|
470,000 | |||
|
Dividends
|
154,456 | |||
|
Investment for trustee deferred compensation and retirement plans
|
3,731 | |||
|
Other assets
|
11,356 | |||
|
Total assets
|
227,808,969 | |||
|
Liabilities: |
||||
|
Payable for:
|
||||
|
Accrued fees to affiliates
|
31,543 | |||
|
Accrued other operating expenses
|
57,508 | |||
|
Trustee deferred compensation and retirement plans
|
8,396 | |||
|
Total liabilities
|
97,447 | |||
|
Net assets applicable to shares outstanding
|
$ | 227,711,522 | ||
|
Net assets consist of: |
||||
|
Shares of beneficial interest
|
$ | 192,244,520 | ||
|
Undistributed net investment income
|
1,443,728 | |||
|
Undistributed net realized gain
|
1,789,007 | |||
|
Unrealized appreciation
|
32,234,267 | |||
| $ | 227,711,522 | |||
|
Net Assets: |
||||
|
Class Y
|
$ | 227,711,522 | ||
|
Shares outstanding, $0.001 par value per share, with an unlimited number of shares authorized: |
||||
|
Class Y
|
21,470,879 | |||
|
Class Y:
|
||||
|
Net asset value and offering price per share
|
$ | 10.61 | ||
|
Investment income: |
||||
|
Dividends
|
$ | 3,592,030 | ||
|
Dividends from affiliated money market funds
|
7,921 | |||
|
Total investment income
|
3,599,951 | |||
|
Expenses: |
||||
|
Advisory fees
|
1,482,903 | |||
|
Administrative services fees
|
50,000 | |||
|
Custodian fees
|
10,875 | |||
|
Transfer agent fees
|
72,303 | |||
|
Trustees’ and officers’ fees and benefits
|
20,735 | |||
|
Other
|
88,697 | |||
|
Total expenses
|
1,725,513 | |||
|
Less: Fees waived
|
(11,301 | ) | ||
|
Net expenses
|
1,714,212 | |||
|
Net investment income
|
1,885,739 | |||
|
Realized and unrealized gain from: |
||||
|
Net realized gain from investment securities
|
11,170,432 | |||
|
Change in net unrealized appreciation of investment securities
|
9,291,231 | |||
|
Net realized and unrealized gain
|
20,461,663 | |||
|
Net increase in net assets resulting from operations
|
$ | 22,347,402 | ||
| 2011 | 2010 | |||||||
|
Operations: |
||||||||
|
Net investment income
|
$ | 1,885,739 | $ | 1,722,583 | ||||
|
Net realized gain
|
11,170,432 | 9,820,167 | ||||||
|
Change in net unrealized appreciation
|
9,291,231 | 12,658,677 | ||||||
|
Net increase in net assets resulting from operations
|
22,347,402 | 24,201,427 | ||||||
|
Distributions to shareholders from net investment
income — Class Y
|
(1,879,369 | ) | (1,637,777 | ) | ||||
|
Share transactions–net: |
||||||||
|
Class Y
|
18,524,386 | (742,805 | ) | |||||
|
Net increase in net assets
|
38,992,419 | 21,820,845 | ||||||
|
Net assets: |
||||||||
|
Beginning of year
|
188,719,103 | 166,898,258 | ||||||
|
End of year (includes undistributed net investment income of
$1,443,728 and $1,435,734, respectively)
|
$ | 227,711,522 | $ | 188,719,103 | ||||
| A. | Security Valuations — Securities, including restricted securities, are valued according to the following policy. | |
| A security listed or traded on an exchange (except convertible bonds) is valued at its last sales price or official closing price as of the close of the customary trading session on the exchange where the security is principally traded, or lacking any sales or official closing price on a particular day, the security may be valued at the closing bid price on that day. Securities traded in the over-the-counter market are valued based on prices furnished by independent pricing services or market makers. When such securities are valued by an independent pricing service they may be considered fair valued. Futures contracts are valued at the final settlement price set by an exchange on which they are principally traded. Listed options are valued at the mean between the last bid and ask prices from the exchange on which they are principally traded. Options not listed on an exchange are valued by an independent source at the mean between the last bid and ask prices. For purposes of determining net asset value per share, futures and option contracts generally are valued 15 minutes after the close of the customary trading session of the New York Stock Exchange (“NYSE”). | ||
| Investments in open-end and closed-end registered investment companies that do not trade on an exchange are valued at the end of day net asset value per share. Investments in open-end and closed-end registered investment companies that trade on an exchange are valued at the last sales price or official closing price as of the close of the customary trading session on the exchange where the security is principally traded. | ||
| Debt obligations (including convertible bonds) and unlisted equities are fair valued using an evaluated quote provided by an independent pricing service. Evaluated quotes provided by the pricing service may be determined without exclusive reliance on quoted prices, and may reflect appropriate factors such as institution-size trading in similar groups of securities, developments related to specific securities, dividend rate, yield, quality, type of issue, coupon rate, maturity, individual trading characteristics and other market data. Debt securities are subject to interest rate and credit risks. In addition, all debt securities involve some risk of default with respect to interest and/or principal payments. | ||
| Foreign securities (including foreign exchange contracts) are converted into U.S. dollar amounts using the applicable exchange rates as of the close of the NYSE. If market quotations are available and reliable for foreign exchange traded equity securities, the securities will be valued at the market quotations. Because trading hours for certain foreign securities end before the close of the NYSE, closing market quotations may become unreliable. If between the time trading ends on a particular security and the close of the customary trading session on the NYSE, events occur that are significant and make the closing price unreliable, the Fund may fair value the security. If the event is likely to have affected the closing price of the security, the security will be valued at fair value in good faith using procedures approved by the Board of Trustees. Adjustments to closing prices to reflect fair value may also be |
| based on a screening process of an independent pricing service to indicate the degree of certainty, based on historical data, that the closing price in the principal market where a foreign security trade is not the current value as of the close of the NYSE. Foreign securities meeting the approved degree of certainty that the price is not reflective of current value will be priced at the indication of fair value from the independent pricing service. Multiple factors may be considered by the independent pricing service in determining adjustments to reflect fair value and may include information relating to sector indices, American Depositary Receipts and domestic and foreign index futures. Foreign securities may have additional risks including exchange rate changes, potential for sharply devalued currencies and high inflation, political and economical upheaval, the relative lack of issuer information, relatively low market liquidity and the potential lack of strict financial and accounting controls and standards. | ||
| Securities for which market prices are not provided by any of the above methods may be valued based upon quotes furnished by independent sources. The last bid price may be used to value equity securities. The mean between the last bid and asked prices is used to value debt obligations, including Corporate Loans. | ||
| Securities for which market quotations are not readily available or are unreliable are valued at fair value as determined in good faith by or under the supervision of the Trust’s officers following procedures approved by the Board of Trustees. Issuer specific events, market trends, bid/ask quotes of brokers and information providers and other market data may be reviewed in the course of making a good faith determination of a security’s fair value. | ||
| Valuations change in response to many factors including the historical and prospective earnings of the issuer, the value of the issuer’s assets, general economic conditions, interest rates, investor perceptions and market liquidity. Because of the inherent uncertainties of valuation, the values reflected in the financial statements may materially differ from the value received upon actual sale of those investments. | ||
| B. | Securities Transactions and Investment Income — Securities transactions are accounted for on a trade date basis. Realized gains or losses on sales are computed on the basis of specific identification of the securities sold. Interest income is recorded on the accrual basis from settlement date. Dividend income (net of withholding tax, if any) is recorded on the ex-dividend date. | |
| The Fund may periodically participate in litigation related to Fund investments. As such, the Fund may receive proceeds from litigation settlements. Any proceeds received are included in the Statement of Operations as realized gain (loss) for investments no longer held and as unrealized gain (loss) for investments still held. | ||
| Brokerage commissions and mark ups are considered transaction costs and are recorded as an increase to the cost basis of securities purchased and/or a reduction of proceeds on a sale of securities. Such transaction costs are included in the determination of net realized and unrealized gain (loss) from investment securities reported in the Statement of Operations and the Statement of Changes in Net Assets and the net realized and unrealized gains (losses) on securities per share in the Financial Highlights. Transaction costs are included in the calculation of the Fund’s net asset value and, accordingly, they reduce the Fund’s total returns. These transaction costs are not considered operating expenses and are not reflected in net investment income reported in the Statement of Operations and Statement of Changes in Net Assets, or the net investment income per share and ratios of expenses and net investment income reported in the Financial Highlights, nor are they limited by any expense limitation arrangements between the Fund and the investment adviser. | ||
| The Fund allocates income and realized and unrealized capital gains and losses to a class based on the relative net assets of each class. | ||
| C. | Country Determination — For the purposes of making investment selection decisions and presentation in the Schedule of Investments, the investment adviser may determine the country in which an issuer is located and/or credit risk exposure based on various factors. These factors include the laws of the country under which the issuer is organized, where the issuer maintains a principal office, the country in which the issuer derives 50% or more of its total revenues and the country that has the primary market for the issuer’s securities, as well as other criteria. Among the other criteria that may be evaluated for making this determination are the country in which the issuer maintains 50% or more of its assets, the type of security, financial guarantees and enhancements, the nature of the collateral and the sponsor organization. Country of issuer and/or credit risk exposure has been determined to be the United States of America, unless otherwise noted. | |
| D. | Distributions — Distributions from income and net realized capital gain, if any, are generally paid annually and recorded on ex-dividend date. The Fund may elect to treat a portion of the proceeds from redemptions as distributions for federal income tax purposes. | |
| E. | Federal Income Taxes — The Fund intends to comply with the requirements of Subchapter M of the Internal Revenue Code necessary to qualify as a regulated investment company and to distribute substantially all of the Fund’s taxable earnings to shareholders. As such, the Fund will not be subject to federal income taxes on otherwise taxable income (including net realized capital gain) that is distributed to shareholders. Therefore, no provision for federal income taxes is recorded in the financial statements. | |
| The Fund files tax returns in the U.S. Federal jurisdiction and certain other jurisdictions. Generally, the Fund is subject to examinations by such taxing authorities for up to three years after the filing of the return for the tax period. | ||
| F. | Accounting Estimates — The preparation of financial statements in conformity with accounting principles generally accepted in the United States of America (“GAAP”) requires management to make estimates and assumptions that affect the reported amounts of assets and liabilities at the date of the financial statements and the reported amounts of revenues and expenses during the reporting period including estimates and assumptions related to taxation. Actual results could differ from those estimates by a significant amount. In addition, the Fund monitors for material events or transactions that may occur or become known after the period-end date and before the date the financial statements are released to print. | |
| G. | Indemnifications — Under the Trust’s organizational documents, each Trustee, officer, employee or other agent of the Trust is indemnified against certain liabilities that may arise out of performance of their duties to the Fund. Additionally, in the normal course of business, the Fund enters into contracts, including the Fund’s servicing agreements that contain a variety of indemnification clauses. The Fund’s maximum exposure under these arrangements is unknown as this would involve future claims that may be made against the Fund that have not yet occurred. The risk of material loss as a result of such indemnification claims is considered remote. |
| Average Daily Net Assets | Rate | |||
|
First $250 million
|
0 | .695% | ||
|
Next $250 million
|
0 | .67% | ||
|
Next $500 million
|
0 | .645% | ||
|
Next $1.5 billion
|
0 | .62% | ||
|
Next $2.5 billion
|
0 | .595% | ||
|
Next $2.5 billion
|
0 | .57% | ||
|
Next $2.5 billion
|
0 | .545% | ||
|
Over $10 billion
|
0 | .52% | ||
| Level 1 — | Prices are determined using quoted prices in an active market for identical assets. | |
| Level 2 — | Prices are determined using other significant observable inputs. Observable inputs are inputs that other market participants may use in pricing a security. These may include quoted prices for similar securities, interest rates, prepayment speeds, credit risk, yield curves, loss severities, default rates, discount rates, volatilities and others. |
| Level 3 — | Prices are determined using significant unobservable inputs. In situations where quoted prices or observable inputs are unavailable (for example, when there is little or no market activity for an investment at the end of the period), unobservable inputs may be used. Unobservable inputs reflect the Fund’s own assumptions about the factors market participants would use in determining fair value of the securities or instruments and would be based on the best available information. |
| Level 1 | Level 2 | Level 3 | Total | |||||||||||||
|
Equity Securities
|
$ | 227,169,426 | $ | — | $ | — | $ | 227,169,426 | ||||||||
| 2011 | 2010 | |||||||
|
Ordinary income
|
$ | 1,879,368 | $ | 1,637,777 | ||||
| 2011 | ||||
|
Undistributed ordinary income
|
$ | 1,451,652 | ||
|
Undistributed long-term gain
|
4,134,302 | |||
|
Net unrealized appreciation — investments
|
29,888,972 | |||
|
Temporary book/tax differences
|
(7,924 | ) | ||
|
Shares of beneficial interest
|
192,244,520 | |||
|
Total net assets
|
$ | 227,711,522 | ||
| Unrealized Appreciation (Depreciation) of Investment Securities on a Tax Basis | ||||
|
Aggregate unrealized appreciation of investment securities
|
$ | 35,482,072 | ||
|
Aggregate unrealized (depreciation) of investment securities
|
(5,593,100 | ) | ||
|
Net unrealized appreciation of investment securities
|
$ | 29,888,972 | ||
| Cost of investments for tax purposes is $197,280,454. | ||||
| Summary of Share Activity | ||||||||||||||||
|
Year ended |
Year ended |
|||||||||||||||
| October 31, 2011(a) | October 31, 2010 | |||||||||||||||
| Shares | Amount | Shares | Amount | |||||||||||||
|
Sold:
|
||||||||||||||||
|
Class Y
|
4,921,054 | $ | 51,082,933 | 5,029,723 | $ | 45,541,754 | ||||||||||
|
Issued as reinvestment of dividends:
|
||||||||||||||||
|
Class Y
|
104,509 | 1,049,274 | 85,251 | 761,292 | ||||||||||||
|
Reacquired:
|
||||||||||||||||
|
Class Y
|
(3,188,951 | ) | (33,607,821 | ) | (5,177,629 | ) | (47,045,851 | ) | ||||||||
|
Net increase (decrease) in share activity
|
1,836,612 | $ | 18,524,386 | (62,655 | ) | $ | (742,805 | ) | ||||||||
| (a) | There are entities that are record owners of more than 5% of the outstanding shares of the Fund and in the aggregate own 99% of the outstanding shares of the Fund. IDI has an agreement with these entities to sell Fund shares. The Fund, Invesco and/or Invesco affiliates may make payments to these entities, which are considered to be related to the Fund, for providing services to the Fund, Invesco and/or Invesco affiliates including but not limited to services such as securities brokerage, distribution, third party record keeping and account servicing. The Fund has no knowledge as to whether all or any portion of the shares owned of record by these entities are also owned beneficially. |
|
Ratio of |
Ratio of |
|||||||||||||||||||||||||||||||||||||||||||||||||||||||
|
Net gains |
expenses |
expenses |
||||||||||||||||||||||||||||||||||||||||||||||||||||||
|
(losses) on |
to average |
to average net |
Ratio of net |
|||||||||||||||||||||||||||||||||||||||||||||||||||||
|
Net asset |
securities |
Dividends |
Distributions |
net assets |
assets without |
investment |
||||||||||||||||||||||||||||||||||||||||||||||||||
|
value, |
Net |
(both |
Total from |
from net |
from net |
Net asset |
Net assets, |
with fee
waivers |
fee waivers |
income to |
||||||||||||||||||||||||||||||||||||||||||||||
|
beginning |
investment |
realized and |
investment |
investment |
realized |
Total |
value, end |
Total |
end of period |
and/or
expenses |
and/or
expenses |
average |
Portfolio |
|||||||||||||||||||||||||||||||||||||||||||
| of period | income | unrealized) | operations | income | gains | Distributions | of period | Return(a) | (000s omitted) | absorbed | absorbed | net assets | turnover(b) | |||||||||||||||||||||||||||||||||||||||||||
| Class Y* | ||||||||||||||||||||||||||||||||||||||||||||||||||||||||
| Year ended 10/31/11 | $ | 9.61 | $ | 0.09 | (c) | $ | 1.00 | $ | 1.09 | $ | (0.09 | ) | $ | — | $ | (0.09 | ) | $ | 10.61 | 11.44 | % | $ | 227,712 | 0.80 | %(d) | 0.81 | %(d) | 0.89 | %(d) | 38 | % | |||||||||||||||||||||||||
| Year ended 10/31/10 | 8.47 | 0.09 | (c) | 1.13 | 1.22 | (0.08 | ) | 0.00 | (0.08 | ) | 9.61 | 14.51 | 188,719 | 0.74 | 0.75 | 0.96 | 34 | |||||||||||||||||||||||||||||||||||||||
| Eleven months ended 10/31/09 | 7.08 | 0.08 | (c) | 1.43 | 1.51 | (0.12 | ) | 0.00 | (0.12 | ) | 8.47 | 21.80 | 166,898 | 1.12 | 1.33 | 1.16 | 44 | |||||||||||||||||||||||||||||||||||||||
| Year ended 11/30/08 | 11.89 | 0.10 | (3.71 | ) | (3.61 | ) | (0.13 | ) | (1.07 | ) | (1.20 | ) | 7.08 | (33.81 | ) | 171,200 | 1.04 | 1.04 | 0.95 | 45 | ||||||||||||||||||||||||||||||||||||
| Year ended 11/30/07 | 11.00 | 0.11 | 0.80 | 0.91 | (0.02 | ) | 0.00 | (0.02 | ) | 11.89 | 8.14 | 284,846 | 1.01 | 1.05 | 1.08 | 95 | ||||||||||||||||||||||||||||||||||||||||
| Year ended 11/30/06(e) | 10.00 | 0.08 | 0.99 | 1.07 | (0.07 | ) | 0.00 | (0.07 | ) | 11.00 | 10.87 | 49,201 | 1.10 | (f) | 1.64 | (f) | 1.32 | (f) | 43 | |||||||||||||||||||||||||||||||||||||
| * | Prior to September 21, 2009, the Fund operated as Atlantic Whitehall Equity Income Fund. On such date, holders of Institutional Class received Class Y shares of the Fund. | |
| (a) | Includes adjustments in accordance with accounting principles generally accepted in the United States of America and as such, the net asset value for financial reporting purposes and the returns based upon those net asset values may differ from the net asset value and returns for shareholder transactions. Does not include sales charges and is not annualized for periods less than one year, if applicable. | |
| (b) | Portfolio turnover is calculated at the fund level and is not annualized for periods less than one year, if applicable. | |
| (c) | Calculated using average shares outstanding. | |
| (d) | Ratios are based on average daily net assets (000’s omitted) of $213,367. | |
| (e) | Commencement date of December 1, 2005. | |
| (f) | Annualized. |
|
HYPOTHETICAL |
||||||||||||||||||||||||||||||
|
(5% annual return
before |
||||||||||||||||||||||||||||||
| ACTUAL | expenses) | |||||||||||||||||||||||||||||
|
Beginning |
Ending |
Expenses |
Ending |
Expenses |
Annualized |
|||||||||||||||||||||||||
|
Account Value |
Account Value |
Paid During |
Account Value |
Paid During |
Expense |
|||||||||||||||||||||||||
| Class | (05/01/11) | (10/31/11)1 | Period2 | (10/31/11) | Period2 | Ratio | ||||||||||||||||||||||||
|
Y
|
1,000.00 | $ | 955.00 | $ | 3.94 | $ | 1,021.17 | $ | 4.08 | 0.80 | % | |||||||||||||||||||
| 1 | The actual ending account value is based on the actual total return of the Fund for the period May 1, 2011 through October 31, 2011, after actual expenses and will differ from the hypothetical ending account value which is based on the Fund’s expense ratio and a hypothetical annual return of 5% before expenses. |
| 2 | Expenses are equal to the Fund’s annualized expense ratio as indicated above multiplied by the average account value over the period, multiplied by 184/365 to reflect the most recent fiscal half year. |
| Approval of Investment Advisory and Sub-Advisory Contracts |
| A. | Nature, Extent and Quality of Services Provided by Invesco Advisers and the Affiliated Sub-Advisers |
| B. | Fund Performance |
| C. | Advisory and Sub-Advisory Fees and Fee Waivers |
| D. | Economies of Scale and Breakpoints |
| E. | Profitability and Financial Resources |
| F. | Collateral Benefits to Invesco Advisers and its Affiliates |
|
Federal and State Income
Tax
|
||||
|
Qualified Dividend Income*
|
100% | |||
|
Corporate Dividends Received Deduction*
|
100% | |||
| * | The above percentages are based on ordinary income dividends paid to shareholders during the Fund’s fiscal year. |
|
Number of |
||||||||
|
Funds in |
||||||||
|
Fund Complex |
||||||||
|
Name, Year of
Birth and |
Trustee
and/ |
Principal
Occupation(s) |
Overseen by |
Other
Directorship(s) |
||||
| Position(s) Held with the Trust | or Officer Since | During Past 5 Years | Trustee | Held by Trustee | ||||
|
Interested
Persons
|
||||||||
|
Martin L.
Flanagan1 —
1960
Trustee |
2007 | Executive Director, Chief Executive Officer and President, Invesco Ltd. (ultimate parent of Invesco and a global investment management firm); Advisor to the Board, Invesco Advisers, Inc. (formerly known as Invesco Institutional (N.A.), Inc.); Trustee, The Invesco Funds; Vice Chair, Investment Company Institute; and Member of Executive Board, SMU Cox School of Business | 141 | None | ||||
| Formerly: Chairman, Invesco Advisers, Inc. (registered investment adviser); Director, Chairman, Chief Executive Officer and President, IVZ Inc. (holding company), INVESCO Group Services, Inc. (service provider) and Invesco North American Holdings, Inc. (holding company); Director, Chief Executive Officer and President, Invesco Holding Company Limited (parent of Invesco and a global investment management firm); Director, Invesco Ltd.; Chairman, Investment Company Institute and President, Co-Chief Executive Officer, Co-President, Chief Operating Officer and Chief Financial Officer, Franklin Resources, Inc. (global investment management organization) | ||||||||
|
Philip A.
Taylor2 —
1954
Trustee, President and Principal Executive Officer |
2006 | Head of North American Retail and Senior Managing Director, Invesco Ltd.; Director, Co-Chairman, Co-President and Co-Chief Executive Officer, Invesco Advisers, Inc. (formerly known as Invesco Institutional (N.A.), Inc.) (registered investment adviser); Director, Chairman, Chief Executive Officer and President, Invesco Management Group, Inc. (formerly Invesco Aim Management Group, Inc.) (financial services holding company); Director and President, INVESCO Funds Group, Inc. (registered investment adviser and registered transfer agent); Director and Chairman, Invesco Investment Services, Inc. (formerly known as Invesco Aim Investment Services, Inc.) (registered transfer agent) and IVZ Distributors, Inc. (formerly known as INVESCO Distributors, Inc.) (registered broker dealer); Director, President and Chairman, Invesco Inc. (holding company) and Invesco Canada Holdings Inc. (holding company); Chief Executive Officer, Invesco Corporate Class Inc. (corporate mutual fund company) and Invesco Canada Fund Inc. (corporate mutual fund company); Director, Chairman and Chief Executive Officer, Invesco Canada Ltd. (formerly known as Invesco Trimark Ltd./Invesco Trimark Ltèe) (registered investment adviser and registered transfer agent); Trustee, President and Principal Executive Officer, The Invesco Funds (other than AIM Treasurer’s Series Trust (Invesco Treasurer’s Series Trust) and Short-Term Investments Trust); Trustee and Executive Vice President, The Invesco Funds (AIM Treasurer’s Series Trust (Invesco Treasurer’s Series Trust) and Short-Term Investments Trust only); Director, Invesco Investment Advisers LLC (formerly known as Van Kampen Asset Management); Director, Chief Executive Officer and President, Van Kampen Exchange Corp. | 141 | None | ||||
| Formerly: Director and Chairman, Van Kampen Investor Services Inc.: | ||||||||
| Director, Chief Executive Officer and President, 1371 Preferred Inc. (holding company); and Van Kampen Investments Inc.; Director and President, AIM GP Canada Inc. (general partner for limited partnerships); and Van Kampen Advisors, Inc.; Director and Chief Executive Officer, Invesco Trimark Dealer Inc. (registered broker dealer); Director, Invesco Distributors, Inc. (formerly known as Invesco Aim Distributors, Inc.) (registered broker dealer); Manager, Invesco PowerShares Capital Management LLC; Director, Chief Executive Officer and President, Invesco Advisers, Inc.; Director, Chairman, Chief Executive Officer and President, Invesco Aim Capital Management, Inc.; President, Invesco Trimark Dealer Inc. and Invesco Trimark Ltd./Invesco Trimark Ltèe; Director and President, AIM Trimark Corporate Class Inc. and AIM Trimark Canada Fund Inc.; Senior Managing Director, Invesco Holding Company Limited; Trustee and Executive Vice President, Tax-Free Investments Trust; Director and Chairman, Fund Management Company (former registered broker dealer); President and Principal Executive Officer, The Invesco Funds (AIM Treasurer’s Series Trust (Invesco Treasurer’s Series Trust), Short-Term Investments Trust and Tax-Free Investments Trust only); President, AIM Trimark Global Fund Inc. and AIM Trimark Canada Fund Inc. | ||||||||
|
Wayne W.
Whalen3 —
1939
Trustee |
2010 | Of Counsel, and prior to 2010, partner in the law firm of Skadden, Arps, Slate, Meagher & Flom LLP, legal counsel to funds in the Fund Complex | 159 | Director of the Abraham Lincoln Presidential Library Foundation | ||||
|
Independent
Trustees
|
||||||||
|
Bruce L. Crockett — 1944
Trustee and Chair |
1993 | Chairman, Crockett Technology Associates (technology consulting company) | 141 | ACE Limited (insurance company); and Investment Company Institute | ||||
| Formerly: Director, Captaris (unified messaging provider); Director, President and Chief Executive Officer COMSAT Corporation; and Chairman, Board of Governors of INTELSAT (international communications company) | ||||||||
|
David C. Arch — 1945
Trustee |
2010 | Chairman and Chief Executive Officer of Blistex Inc., a consumer health care products manufacturer. | 159 | Member of the Heartland Alliance Advisory Board, a nonprofit organization serving human needs based in Chicago. Board member of the Illinois Manufacturers’ Association. Member of the Board of Visitors, Institute for the Humanities, University of Michigan | ||||
| 1 | Mr. Flanagan is considered an interested person of the Trust because he is an officer of the adviser to the Trust, and an officer and a director of Invesco Ltd., ultimate parent of the adviser to the Trust. |
| 2 | Mr. Taylor is considered an interested person of the Trust because he is an officer and a director of the adviser to, and a director of the principal underwriter of, the Trust. |
| 3 | Mr. Whalen has been deemed to be an interested person of the Trust because of his prior service as counsel to the predecessor funds of certain Invesco open-end funds and his affiliation with the law firm that served as counsel to such predecessor funds and continues to serve as counsel to the Invesco Van Kampen closed-end funds. |
|
Number of |
||||||||
|
Funds in |
||||||||
|
Fund Complex |
||||||||
|
Name, Year of
Birth and |
Trustee
and/ |
Principal
Occupation(s) |
Overseen by |
Other
Directorship(s) |
||||
| Position(s) Held with the Trust | or Officer Since | During Past 5 Years | Trustee | Held by Trustee | ||||
|
Independent
Trustees—(continued)
|
||||||||
|
Bob R. Baker — 1936
Trustee |
2003 | Retired | 141 | None | ||||
| Formerly: President and Chief Executive Officer, AMC Cancer Research Center; and Chairman and Chief Executive Officer, First Columbia Financial Corporation | ||||||||
|
Frank S. Bayley — 1939
Trustee |
2001 |
Retired Formerly: Director, Badgley Funds, Inc. (registered investment company) (2 portfolios) and Partner, law firm of Baker & McKenzie |
141 | Director and Chairman, C.D. Stimson Company (a real estate investment company) | ||||
|
James T. Bunch — 1942
Trustee |
2003 |
Founder, Green, Manning & Bunch Ltd. (investment banking firm)
Formerly: Executive Committee, United States Golf Association; and Director, Policy Studies, Inc. and Van Gilder Insurance Corporation |
141 | Vice Chairman, Board of Governors, Western Golf Association/Evans Scholars Foundation and Director, Denver Film Society | ||||
|
Rodney F. Dammeyer — 1940
Trustee |
2010 |
President of CAC, LLC, a private company offering capital investment and management advisory services.
Formerly: Prior to January 2004, Director of TeleTech Holdings Inc.; Prior to 2002, Director of Arris Group, Inc.; Prior to 2001, Managing Partner at Equity Group Corporate Investments. Prior to 1995, Vice Chairman of Anixter International. Prior to 1985, experience includes Senior Vice President and Chief Financial Officer of Household International, Inc, Executive Vice President and Chief Financial Officer of Northwest Industries, Inc. and Partner of Arthur Andersen & Co. |
159 | Director of Quidel Corporation and Stericycle, Inc. Prior to May 2008, Trustee of The Scripps Research Institute. Prior to February 2008, Director of Ventana Medical Systems, Inc. Prior to April 2007, Director of GATX Corporation. Prior to April 2004, Director of TheraSense, Inc. | ||||
|
Albert R. Dowden — 1941
Trustee |
2000 | Director of a number of public and private business corporations, including the Boss Group, Ltd. (private investment and management); Reich & Tang Funds (5 portfolios) (registered investment company); and Homeowners of America Holding Corporation/ Homeowners of America Insurance Company (property casualty company) | 141 | Board of Nature’s Sunshine Products, Inc. | ||||
| Formerly: Director, Continental Energy Services, LLC (oil and gas pipeline service); Director, CompuDyne Corporation (provider of product and services to the public security market) and Director, Annuity and Life Re (Holdings), Ltd. (reinsurance company); Director, President and Chief Executive Officer, Volvo Group North America, Inc.; Senior Vice President, AB Volvo; Director of various public and private corporations; Chairman, DHJ Media, Inc.; Director Magellan Insurance Company; and Director, The Hertz Corporation, Genmar Corporation (boat manufacturer), National Media Corporation; Advisory Board of Rotary Power International (designer, manufacturer, and seller of rotary power engines); and Chairman, Cortland Trust, Inc. (registered investment company) | ||||||||
|
Jack M. Fields — 1952
Trustee |
1997 | Chief Executive Officer, Twenty First Century Group, Inc. (government affairs company); and Owner and Chief Executive Officer, Dos Angelos Ranch, L.P. (cattle, hunting, corporate entertainment), Discovery Global Education Fund (non-profit) and Cross Timbers Quail Research Ranch (non-profit) | 141 | Administaff | ||||
| Formerly: Chief Executive Officer, Texana Timber LP (sustainable forestry company) and member of the U.S. House of Representatives | ||||||||
|
Carl Frischling — 1937
Trustee |
1988 | Partner, law firm of Kramer Levin Naftalis and Frankel LLP | 141 | Director, Reich & Tang Funds (6 portfolios) | ||||
|
Prema Mathai-Davis — 1950
Trustee |
1998 | Retired | 141 | None | ||||
| Formerly: Chief Executive Officer, YWCA of the U.S.A. | ||||||||
|
Larry Soll — 1942
Trustee |
2003 | Retired | 141 | None | ||||
| Formerly, Chairman, Chief Executive Officer and President, Synergen Corp. (a biotechnology company) | ||||||||
|
Number of |
||||||||
|
Funds in |
||||||||
|
Fund Complex |
||||||||
|
Name, Year of
Birth and |
Trustee
and/ |
Principal
Occupation(s) |
Overseen by |
Other
Directorship(s) |
||||
| Position(s) Held with the Trust | or Officer Since | During Past 5 Years | Trustee | Held by Trustee | ||||
|
Independent
Trustees—(continued)
|
||||||||
|
Hugo F. Sonnenschein — 1940
Trustee |
2010 | President Emeritus and Honorary Trustee of the University of Chicago and the Adam Smith Distinguished Service Professor in the Department of Economics at the University of Chicago. Prior to July 2000, President of the University of Chicago. | 159 | Trustee of the University of Rochester and a member of its investment committee. Member of the National Academy of Sciences, the American Philosophical Society and a fellow of the American Academy of Arts and Sciences | ||||
|
Raymond Stickel, Jr. — 1944
Trustee |
2005 | Retired | 141 | Director of Long Cove Club Owners’ Association (home owner’s association) | ||||
| Formerly: Director, Mainstay VP Series Funds, Inc. (25 portfolios) and Partner, Deloitte & Touche | ||||||||
|
Other
Officers
|
||||||||
|
Russell C. Burk — 1958
Senior Vice President and Senior Officer |
2005 | Senior Vice President and Senior Officer of Invesco Funds | N/A | N/A | ||||
|
John M. Zerr — 1962
Senior Vice President, Chief Legal Officer and Secretary |
2006 | Director, Senior Vice President, Secretary and General Counsel, Invesco Management Group, Inc. (formerly known as Invesco Aim Management Group, Inc.) and Van Kampen Exchange Corp.; Senior Vice President, Invesco Advisers, Inc. (formerly known as Invesco Institutional (N.A.), Inc.) (registered investment adviser); Senior Vice President and Secretary, Invesco Distributors, Inc. (formerly known as Invesco Aim Distributors, Inc.); Director, Vice President and Secretary, Invesco Investment Services, Inc. (formerly known as Invesco Aim Investment Services, Inc.) and IVZ Distributors, Inc. (formerly known as INVESCO Distributors, Inc.); Director and Vice President, INVESCO Funds Group, Inc.; Senior Vice President, Chief Legal Officer and Secretary, The Invesco Funds; Manager, Invesco PowerShares Capital Management LLC; Director, Secretary and General Counsel, Invesco Investment Advisers LLC (formerly known as Van Kampen Asset Management); Secretary and General Counsel, Van Kampen Funds Inc. and Chief Legal Officer, PowerShares Exchange-Traded Fund Trust, PowerShares Exchange-Traded Fund Trust II, PowerShares India Exchange-Traded Fund Trust and PowerShares Actively Managed Exchange-Traded Fund Trust | N/A | N/A | ||||
| Formerly: Director and Secretary, Van Kampen Advisors Inc.; Director Vice President, Secretary and General Counsel Van Kampen Investor Services Inc.; Director, Invesco Distributors, Inc. (formerly known as Invesco Aim Distributors, Inc.); Director, Senior Vice President, General Counsel and Secretary, Invesco Advisers, Inc.; and Van Kampen Investments Inc.; Director, Vice President and Secretary, Fund Management Company; Director, Senior Vice President, Secretary, General Counsel and Vice President, Invesco Aim Capital Management, Inc.; Chief Operating Officer and General Counsel, Liberty Ridge Capital, Inc. (an investment adviser); Vice President and Secretary, PBHG Funds (an investment company) and PBHG Insurance Series Fund (an investment company); Chief Operating Officer, General Counsel and Secretary, Old Mutual Investment Partners (a broker-dealer); General Counsel and Secretary, Old Mutual Fund Services (an administrator) and Old Mutual Shareholder Services (a shareholder servicing center); Executive Vice President, General Counsel and Secretary, Old Mutual Capital, Inc. (an investment adviser); and Vice President and Secretary, Old Mutual Advisors Funds (an investment company) | ||||||||
|
Lisa O. Brinkley — 1959
Vice President |
2004 |
Global Compliance Director, Invesco Ltd.; Chief Compliance Officer, Invesco Investment Services, Inc.(formerly known as Invesco Aim Investment Services, Inc.); and Vice President, The Invesco Funds
Formerly: Chief Compliance Officer, Invesco Distributors, Inc. (formerly known as Invesco Aim Distributors, Inc.) and Van Kampen Investor Services Inc.; Senior Vice President, Invesco Management Group, Inc.; Senior Vice President and Chief Compliance Officer, Invesco Advisers, Inc. and The Invesco Funds; Vice President and Chief Compliance Officer, Invesco Aim Capital Management, Inc. and Invesco Distributors, Inc.; Vice President, Invesco Investment Services, Inc. and Fund Management Company |
N/A | N/A | ||||
|
Sheri Morris — 1964
Vice President, Treasurer and Principal Financial Officer |
1999 | Vice President, Treasurer and Principal Financial Officer, The Invesco Funds; and Vice President, Invesco Advisers, Inc. (formerly known as Invesco Institutional (N.A.), Inc.) (registered investment adviser). | N/A | N/A | ||||
| Formerly: Treasurer, PowerShares Exchange-Traded Fund Trust, PowerShares Exchange-Traded Fund Trust II, PowerShares India Exchange-Traded Fund Trust and PowerShares Actively Managed Exchange-Traded Fund Trust; Vice President, Invesco Advisers, Inc., Invesco Aim Capital Management, Inc. and Invesco Aim Private Asset Management, Inc.; Assistant Vice President and Assistant Treasurer, The Invesco Funds and Assistant Vice President, Invesco Advisers, Inc., Invesco Aim Capital Management, Inc. and Invesco Aim Private Asset Management, Inc. | ||||||||
|
Karen Dunn Kelley — 1960
Vice President |
2004 | Head of Invesco’s World Wide Fixed Income and Cash Management Group; Senior Vice President, Invesco Advisers, Inc. (formerly known as Invesco Institutional (N.A.), Inc.) (registered investment adviser); Executive Vice President, Invesco Distributors, Inc. (formerly known as Invesco Aim Distributors, Inc.); Senior Vice President, Invesco Management Group, Inc. (formerly known as Invesco Aim Management Group, Inc.); and Director, Invesco Mortgage Capital Inc.; Vice President, The Invesco Funds (other than AIM Treasurer’s Series Trust (Invesco Treasurer’s Series Trust) and Short-Term Investments Trust); President and Principal Executive Officer, The Invesco Funds (AIM Treasurer’s Series Trust (Invesco Treasurer’s Series Trust) and Short-Term Investments Trust only). | N/A | N/A | ||||
| Formerly: Senior Vice President, Van Kampen Investments Inc.; Vice President, Invesco Advisers, Inc. (formerly known as Invesco Institutional (N.A.), Inc.); Director of Cash Management and Senior Vice President, Invesco Advisers, Inc. and Invesco Aim Capital Management, Inc.; President and Principal Executive Officer, Tax-Free Investments Trust; Director and President, Fund Management Company; Chief Cash Management Officer, Director of Cash Management, Senior Vice President, and Managing Director, Invesco Aim Capital Management, Inc.; Director of Cash Management, Senior Vice President, and Vice President, Invesco Advisers, Inc. and The Invesco Funds (AIM Treasurer’s Series Trust (Invesco Treasurer’s Series Trust), Short-Term Investments Trust and Tax-Free Investments Trust only) | ||||||||
|
Number of |
||||||||
|
Funds in |
||||||||
|
Fund Complex |
||||||||
|
Name, Year of
Birth and |
Trustee
and/ |
Principal
Occupation(s) |
Overseen by |
Other
Directorship(s) |
||||
| Position(s) Held with the Trust | or Officer Since | During Past 5 Years | Trustee | Held by Trustee | ||||
|
Other
Officers—(continued)
|
||||||||
|
Lance A. Rejsek — 1967
Anti-Money Laundering Compliance Officer |
2005 | Anti-Money Laundering Compliance Officer, Invesco Advisers, Inc. (formerly known as Invesco Institutional (N.A.), Inc.) (registered investment adviser); Invesco Distributors, Inc. (formerly known as Invesco Aim Distributors, Inc.), Invesco Investment Services, Inc. (formerly known as Invesco Aim Investment Services, Inc.), The Invesco Funds, PowerShares Exchange-Traded Fund Trust, PowerShares Exchange-Traded Fund Trust II, PowerShares India Exchange-Traded Fund Trust, PowerShares Actively Managed Exchange-Traded Fund Trust, Invesco Investment Advisers LLC (formerly known as Van Kampen Asset Management) and Van Kampen Funds Inc. | N/A | N/A | ||||
| Formerly: Anti-Money Laundering Compliance Officer, Van Kampen Investor Services Inc., Fund Management Company, Invesco Advisers, Inc., Invesco Aim Capital Management, Inc. and Invesco Aim Private Asset Management, Inc. | ||||||||
|
Todd L. Spillane — 1958
Chief Compliance Officer |
2006 | Senior Vice President, Invesco Management Group, Inc. (formerly known as Invesco Aim Management Group, Inc.) and Van Kampen Exchange Corp.; Senior Vice President and Chief Compliance Officer, Invesco Advisers, Inc. (registered investment adviser) (formerly known as Invesco Institutional (N.A.), Inc.); Chief Compliance Officer, The Invesco Funds, PowerShares Exchange-Traded Fund Trust, PowerShares Exchange-Traded Fund Trust II, PowerShares India Exchange-Traded Fund Trust, PowerShares Actively Managed Exchange-Traded Fund Trust, INVESCO Private Capital Investments, Inc. (holding company) and Invesco Private Capital, Inc. (registered investment adviser); Vice President, Invesco Distributors, Inc. (formerly known as Invesco Aim Distributors, Inc.) and Invesco Investment Services, Inc. (formerly known as Invesco Aim Investment Services, Inc.). | N/A | N/A | ||||
| Formerly: Chief Compliance Officer, Invesco Van Kampen Closed-End Funds; Senior Vice President, Van Kampen Investments Inc.; Senior Vice President and Chief Compliance Officer, Invesco Advisers, Inc. and Invesco Aim Capital Management, Inc.; Chief Compliance Officer, Invesco Global Asset Management (N.A.), Inc., Invesco Senior Secured Management, Inc. (registered investment adviser) and Van Kampen Investor Services Inc.; Vice President, Invesco Aim Capital Management, Inc. and Fund Management Company | ||||||||
|
Office of the Fund 11 Greenway Plaza, Suite 2500 Houston, TX 77046-1173 |
Investment Adviser Invesco Advisers, Inc. 1555 Peachtree Street, N.E. Atlanta, GA 30309 |
Distributor Invesco Distributors, Inc. 11 Greenway Plaza, Suite 2500 Houston, TX 77046-1173 |
Auditors PricewaterhouseCoopers LLP 1201 Louisiana Street, Suite 2900 Houston, TX 77002-5678 |
|||
|
Counsel to the Fund Stradley Ronon Stevens & Young, LLP 2600 One Commerce Square Philadelphia, PA 19103 |
Counsel to the Independent Trustees Kramer, Levin, Naftalis & Frankel LLP 1177 Avenue of the Americas New York, NY 10036-2714 |
Transfer Agent Invesco Investment Services, Inc. 11 Greenway Plaza, Suite 2500 Houston, TX 77046-1173 |
Custodian State Street Bank and Trust Company 225 Franklin Boston, MA 02110-2801 |


 |
| Annual Report to Shareholders | October 31, 2011 |
A: LCEAX § B: LCEDX § C: LCEVX § R: DDFRX § Y: LCEYX § Investor: LCEIX
Institutional: DDFIX
2 |
Letters to Shareholders | |
4 |
Performance Summary | |
4 |
Management Discussion | |
6 |
Long-Term Fund Performance | |
8 |
Supplemental Information | |
9 |
Schedule of Investments | |
11 |
Financial Statements | |
13 |
Notes to Financial Statements | |
21 |
Financial Highlights | |
22 |
Auditor’s Report | |
23 |
Fund Expenses | |
24 |
Approval of Investment Advisory and Sub-Advisory Agreements | |
26 |
Tax Information | |
T-1 |
Trustees and Officers | |

Philip Taylor
He or she can explain how your investments performed in the year just ended – how each performed individually, and more important, how they performed as a diversified portfolio. Of course, it’s important to remember that an investment’s long-term performance is more important than its short-term performance. Looking ahead to the new year and evaluating your individual situation, your financial adviser can provide valuable insight into whether your investments are still appropriate for your individual needs, goals and risk tolerance.

Senior Managing Director, Invesco Ltd.

Bruce Crockett

Independent Chair
Invesco Funds Board of Trustees
Class A Shares |
4.15 | % | ||
Class B Shares |
3.39 | |||
Class C Shares |
3.39 | |||
Class R Shares |
3.97 | |||
Class Y Shares |
4.50 | |||
Investor Class Shares |
4.32 | |||
Institutional Class Shares |
4.53 | |||
S&P 500 Index▼ (Broad Market Index) |
8.07 | |||
Russell 1000 Index▼ (Style-Specific Index) |
8.01 | |||
Lipper Large-Cap Core Funds Index▼ (Peer Group Index) |
5.83 | |||
| n | A stock reaches its fair valuation (target price). | |
| n | A company’s fundamental business prospects deteriorate. | |
| n | A more attractive investment opportunity presents itself. |
Consumer Staples |
22.8 | % | ||
Financials |
18.3 | |||
Consumer Discretionary |
12.5 | |||
Utilities |
10.2 | |||
Industrials |
9.9 | |||
Health Care |
7.4 | |||
Information Technology |
5.4 | |||
Materials |
4.1 | |||
Energy |
1.3 | |||
Telecommunication Services |
1.0 | |||
Money Market Funds Plus Other Assets Less Liabilities |
7.1 | |||
| 1. | General Mills, Inc. |
3.0 | % | |||||
| 2. | Kimberly-Clark Corp. |
2.9 | ||||||
| 3. | Sun Trust Banks, Inc. |
2.3 | ||||||
| 4. | Heineken N.V. |
2.3 | ||||||
| 5. | Procter & Gamble Co. (The) |
2.1 | ||||||
| 6. | General Dynamics Corp. |
2.1 | ||||||
| 7. | Automatic Data Processing, Inc. |
2.1 | ||||||
| 8. | Exelon Corp. |
2.1 | ||||||
| 9. | Target Corp. |
2.0 | ||||||
| 10. | Pentair, Inc. |
2.0 | ||||||
| 1. | Packaged Foods & Meats |
7.7 | % | |||||
| 2. | Regional Banks |
6.8 | ||||||
| 3. | Electric Utilities |
5.8 | ||||||
| 4. | Household Products |
5.0 | ||||||
| 5. | Pharmaceuticals |
4.7 | ||||||
Total Net Assets |
$4.1 billion | |||
Total Number of Holdings* |
75 | |||
*Excluding money market fund holdings.
| 1 | Lipper Inc. |

Chartered Financial Analyst, portfolio manager, is lead manager of Invesco Diversified Dividend Fund. Ms. Walsh joined Invesco in 1991. She began her investment career in 1987. Ms. Walsh earned a B.S. in finance from the University of Maryland and an M.B.A. from Loyola University Maryland.

Chartered Financial Analyst, portfolio manager, is manager of Invesco Diversified Dividend Fund. Mr. Harrington joined Invesco in 2001. He earned a B.A. in history and philosophy from Dartmouth College and an M.B.A. from the Kellogg Graduate School of Business Management at Northwestern University.
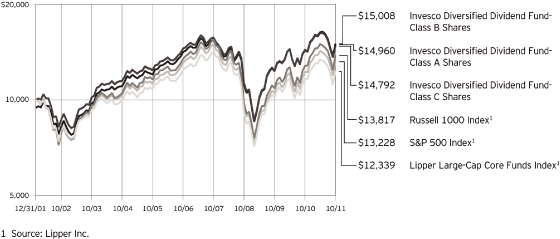
| Class A Shares | ||||||||
| Inception (12/31/01) | 4.18 | % | ||||||
| 5 | Years |
-0.01 | ||||||
| 1 | Year |
-1.58 | ||||||
| Class B Shares | ||||||||
| Inception (12/31/01) | 4.22 | % | ||||||
| 5 | Years |
0.06 | ||||||
| 1 | Year |
-1.61 | ||||||
| Class C Shares | ||||||||
| Inception (12/31/01) | 4.06 | % | ||||||
| 5 | Years |
0.42 | ||||||
| 1 | Year |
2.39 | ||||||
| Class R Shares | ||||||||
| Inception | 4.60 | % | ||||||
| 5 | Years |
0.95 | ||||||
| 1 | Year |
3.97 | ||||||
| Class Y Shares | ||||||||
| Inception | 4.88 | % | ||||||
| 5 | Years |
1.31 | ||||||
| 1 | Year |
4.50 | ||||||
| Investor Class Shares | ||||||||
| Inception | 4.84 | % | ||||||
| 5 | Years |
1.22 | ||||||
| 1 | Year |
4.32 | ||||||
| Institutional Class Shares | ||||||||
| Inception | 5.01 | % | ||||||
| 5 | Years |
1.50 | ||||||
| 1 | Year |
4.53 | ||||||
| Class A Shares | ||||||||
| Inception (12/31/01) | 3.32 | % | ||||||
| 5 | Years |
-1.02 | ||||||
| 1 | Year |
-6.88 | ||||||
| Class B Shares | ||||||||
| Inception (12/31/01) | 3.35 | % | ||||||
| 5 | Years |
-0.96 | ||||||
| 1 | Year |
-7.06 | ||||||
| Class C Shares | ||||||||
| Inception (12/31/01) | 3.20 | % | ||||||
| 5 | Years |
-0.63 | ||||||
| 1 | Year |
-3.20 | ||||||
| Class R Shares | ||||||||
| Inception | 3.72 | % | ||||||
| 5 | Years |
-0.11 | ||||||
| 1 | Year |
-1.70 | ||||||
| Class Y Shares | ||||||||
| Inception | 4.00 | % | ||||||
| 5 | Years |
0.27 | ||||||
| 1 | Year |
-1.20 | ||||||
| Investor Class Shares | ||||||||
| Inception | 3.97 | % | ||||||
| 5 | Years |
0.17 | ||||||
| 1 | Year |
-1.38 | ||||||
| Institutional Class Shares | ||||||||
| Inception | 4.14 | % | ||||||
| 5 | Years |
0.45 | ||||||
| 1 | Year |
-1.10 | ||||||
| n | Unless otherwise stated, information presented in this report is as of October 31, 2011, and is based on total net assets. | |
| n | Unless otherwise noted, all data provided by Invesco. | |
| n | To access your Fund’s reports/prospectus, visit invesco.com/fundreports. |
| n | Class B shares may not be purchased or acquired by exchange from share classes other than Class B shares. Please see the prospectus for more information. | |
| n | Class R shares are available only to certain retirement plans. Please see the prospectus for more information. | |
| n | Class Y shares are available to only certain investors. Please see the prospectus for more information. | |
| n | All Investor Class shares are closed to new investors. Contact your financial adviser about purchasing our other share classes. | |
| n | Institutional Class shares are offered exclusively to institutional investors, including defined contribution plans that meet certain criteria. Please see the prospectus for more information. |
| n | Convertible securities risk. The Fund may own convertible securities, the value of which may be affected by market interest rates, the risk that the issuer will default, the value of the underlying stock or the right of the issuer to buy back the convertible securities. | |
| n | Credit risk. The issuer of instruments in which the Fund invests may be unable to meet interest and/or principal payments, thereby causing its instruments to decrease in value and lowering the issuer’s credit rating. | |
| n | Foreign securities risk. The Fund’s foreign investments may be affected by changes in a foreign country’s exchange rates; political and social instability; changes in economic or taxation policies; difficulties when enforcing obligations; decreased liquidity; and increased volatility. Foreign companies may be subject to less regulation resulting in less publicly available information about the companies. | |
| n | Interest rate risk. Interest rate risk refers to the risk that bond prices generally fall as interest rates rise; |
| conversely, bond prices generally rise as interest rates fall. Specific bonds differ in their sensitivity to changes in interest rates depending on their individual characteristics, including duration. | ||
| n | Management risk. The investment techniques and risk analysis used by the Fund’s portfolio managers may not produce the desired results. | |
| n | Market risk. The prices of and the income generated by the Fund’s securities may decline in response to, among other things, investor sentiment; general economic and market conditions; regional or global instability; and currency and interest rate fluctuations. | |
| n | Master limited partnership (MLP) risk. An MLP is a public limited partnership. Although the characteristics of MLPs closely resemble a traditional limited partnership, a major difference is that MLPs may trade on a public exchange or in the over-the-counter market. The ability to trade on a public exchange or in the over-the-counter market provides a certain amount of liquidity not found in many limited partnership investments. However, MLP interests may be less liquid than conventional publicly traded securities. The risks of investing in an MLP are similar to those of investing in a partnership and include more flexible governance structures, which could result in less protection for the MLP investor in a corporation. Investors in an MLP would normally not be liable for the debts of the MLP beyond the amount that the investor has contributed but investors may not be shielded to the same extent that a shareholder of a corporation would be. MLPs are generally considered interest-rate sensitive investments. During periods of interest rate volatility, these investments may not provide attractive returns. |
| n | The S&P 500® Index is an unmanaged index considered representative of the U.S. stock market. |
| n | The Russell 1000® Index is an unmanaged index considered representative of large-cap stocks. The Russell 1000 Index is a trademark/service mark of the Frank Russell Co. Russell® is a trademark of the Frank Russell Co. | |
| n | The Lipper Large-Cap Core Funds Index is an unmanaged index considered representative of large-cap core funds tracked by Lipper. | |
| n | The Fund is not managed to track the performance of any particular index, including the index(es) defined here, and consequently, the performance of the Fund may deviate significantly from the performance of the index(es). | |
| n | A direct investment cannot be made in an index. Unless otherwise indicated, index results include reinvested dividends, and they do not reflect sales charges. Performance of the peer group, if applicable, reflects fund expenses; performance of a market index does not. |
| n | The Chartered Financial Analyst® (CFA®) designation is globally recognized and attests to a charterholder’s success in a rigorous and comprehensive study program in the field of investment management and research analysis. | |
| n | The returns shown in management’s discussion of Fund performance are based on net asset values calculated for shareholder transactions. Generally accepted accounting principles require adjustments to be made to the net assets of the Fund at period end for financial reporting purposes, and as such, the net asset values for shareholder transactions and the returns based on those net asset values may differ from the net asset values and returns reported in the Financial Highlights. | |
| n | Industry classifications used in this report are generally according to the Global Industry Classification Standard, which was developed by and is the exclusive property and a service mark of MSCI Inc. and Standard & Poor’s. |
Class A Shares
|
LCEAX | |
Class B Shares
|
LCEDX | |
Class C Shares
|
LCEVX | |
Class R Shares
|
DDFRX | |
Class Y Shares
|
LCEYX | |
Investor Class Shares
|
LCEIX | |
Institutional Class Shares
|
DDFIX |
| Shares | Value | |||||||
|
Common Stocks–92.87% |
||||||||
|
Aerospace & Defense–4.05% |
||||||||
|
General Dynamics Corp.
|
1,369,855 | $ | 87,930,992 | |||||
|
Raytheon Co.
|
1,791,924 | 79,185,122 | ||||||
| 167,116,114 | ||||||||
|
Apparel Retail–0.52% |
||||||||
|
TJX Cos., Inc. (The)
|
367,226 | 21,640,628 | ||||||
|
Asset Management & Custody Banks–2.31% |
||||||||
|
Federated Investors, Inc.–Class B
|
3,098,721 | 60,549,008 | ||||||
|
State Street Corp.
|
861,709 | 34,804,427 | ||||||
| 95,353,435 | ||||||||
|
Auto Parts & Equipment–1.64% |
||||||||
|
Johnson Controls, Inc.
|
2,053,898 | 67,634,861 | ||||||
|
Brewers–3.62% |
||||||||
|
Foster’s Group Ltd. (Australia)
|
10,052,543 | 56,315,677 | ||||||
|
Heineken N.V. (Netherlands)
|
1,924,799 | 93,220,888 | ||||||
| 149,536,565 | ||||||||
|
Building Products–1.80% |
||||||||
|
Masco Corp.
|
7,754,517 | 74,443,363 | ||||||
|
Casinos & Gaming–1.38% |
||||||||
|
International Game Technology
|
3,246,523 | 57,106,340 | ||||||
|
Consumer Finance–2.02% |
||||||||
|
Capital One Financial Corp.
|
1,823,286 | 83,251,239 | ||||||
|
Data Processing & Outsourced Services–2.07% |
||||||||
|
Automatic Data Processing, Inc.
|
1,632,966 | 85,453,111 | ||||||
|
Department Stores–0.15% |
||||||||
|
Nordstrom, Inc.
|
121,477 | 6,157,669 | ||||||
|
Distillers & Vintners–0.21% |
||||||||
|
Treasury Wine Estates (Australia)
|
2,248,986 | 8,780,205 | ||||||
|
Diversified Banks–0.13% |
||||||||
|
U.S. Bancorp
|
208,773 | 5,342,501 | ||||||
|
Diversified Chemicals–0.51% |
||||||||
|
E. I. du Pont de Nemours and Co.
|
436,641 | 20,989,333 | ||||||
|
Drug Retail–0.93% |
||||||||
|
Walgreen Co.
|
1,153,944 | 38,310,941 | ||||||
|
Electric Utilities–5.82% |
||||||||
|
American Electric Power Co., Inc.
|
1,960,358 | 77,002,862 | ||||||
|
Entergy Corp.
|
793,166 | 54,863,292 | ||||||
|
Exelon Corp.
|
1,920,783 | 85,263,558 | ||||||
|
PPL Corp.
|
790,149 | 23,206,676 | ||||||
| 240,336,388 | ||||||||
|
Electrical Components & Equipment–0.44% |
||||||||
|
Emerson Electric Co.
|
378,818 | 18,228,722 | ||||||
|
Food Distributors–1.81% |
||||||||
|
Sysco Corp.
|
2,688,640 | 74,529,101 | ||||||
|
Gas Utilities–1.23% |
||||||||
|
AGL Resources Inc.
|
1,209,076 | 50,708,647 | ||||||
|
General Merchandise Stores–2.04% |
||||||||
|
Target Corp.
|
1,534,211 | 83,998,052 | ||||||
|
Health Care Equipment–2.77% |
||||||||
|
Medtronic, Inc.
|
1,402,999 | 48,740,185 | ||||||
|
Stryker Corp.
|
1,369,006 | 65,589,078 | ||||||
| 114,329,263 | ||||||||
|
Hotels, Resorts & Cruise Lines–2.01% |
||||||||
|
Accor S.A. (France)
|
798,779 | 26,022,576 | ||||||
|
Marriott International Inc.–Class A
|
1,801,596 | 56,750,274 | ||||||
| 82,772,850 | ||||||||
|
Household Products–5.03% |
||||||||
|
Kimberly-Clark Corp.
|
1,697,939 | 118,363,327 | ||||||
|
Procter & Gamble Co. (The)
|
1,391,118 | 89,017,641 | ||||||
| 207,380,968 | ||||||||
|
Housewares & Specialties–0.80% |
||||||||
|
Newell Rubbermaid Inc.
|
2,228,136 | 32,976,413 | ||||||
|
Industrial Machinery–3.55% |
||||||||
|
Illinois Tool Works Inc.
|
635,941 | 30,925,811 | ||||||
|
Pentair, Inc.
|
2,335,174 | 83,949,505 | ||||||
|
Snap-On, Inc.
|
591,188 | 31,729,060 | ||||||
| 146,604,376 | ||||||||
|
Integrated Oil & Gas–1.34% |
||||||||
|
Exxon Mobil Corp.
|
368,338 | 28,763,514 | ||||||
|
Total S.A. (France)
|
508,000 | 26,580,905 | ||||||
| 55,344,419 | ||||||||
|
Integrated Telecommunication Services–0.96% |
||||||||
|
AT&T Inc.
|
1,344,967 | 39,420,983 | ||||||
|
Investment Banking & Brokerage–1.33% |
||||||||
|
Charles Schwab Corp. (The)
|
4,463,958 | 54,817,404 | ||||||
| Shares | Value | |||||||
|
Life & Health Insurance–2.78% |
||||||||
|
Lincoln National Corp.
|
1,487,216 | $ | 28,331,465 | |||||
|
Prudential Financial, Inc.
|
614,989 | 33,332,404 | ||||||
|
StanCorp Financial Group, Inc.
|
1,561,873 | 53,009,969 | ||||||
| 114,673,838 | ||||||||
|
Motorcycle Manufacturers–0.89% |
||||||||
|
Harley-Davidson, Inc.
|
939,261 | 36,537,253 | ||||||
|
Movies & Entertainment–1.85% |
||||||||
|
Time Warner Inc.
|
2,178,722 | 76,233,483 | ||||||
|
Multi-Utilities–2.64% |
||||||||
|
Dominion Resources, Inc.
|
1,056,120 | 54,485,231 | ||||||
|
Sempra Energy
|
1,010,829 | 54,311,842 | ||||||
| 108,797,073 | ||||||||
|
Oil & Gas Storage & Transportation–0.51% |
||||||||
|
Southern Union Co.
|
497,341 | 20,903,242 | ||||||
|
Packaged Foods & Meats–7.65% |
||||||||
|
Campbell Soup Co.
|
2,391,473 | 79,516,477 | ||||||
|
General Mills, Inc.
|
3,228,079 | 124,377,884 | ||||||
|
Kraft Foods Inc.–Class A
|
2,011,702 | 70,771,676 | ||||||
|
Mead Johnson Nutrition Co.
|
569,974 | 40,952,632 | ||||||
| 315,618,669 | ||||||||
|
Paper Products–1.62% |
||||||||
|
International Paper Co.
|
2,409,263 | 66,736,585 | ||||||
|
Personal Products–0.30% |
||||||||
|
L’Oreal S.A. (France)
|
112,354 | 12,407,600 | ||||||
|
Pharmaceuticals–4.67% |
||||||||
|
Bristol-Myers Squibb Co.
|
908,014 | 28,684,162 | ||||||
|
Eli Lilly & Co.
|
1,704,875 | 63,353,155 | ||||||
|
Johnson & Johnson
|
1,286,214 | 82,819,320 | ||||||
|
Novartis AG (Switzerland)
|
314,629 | 17,783,690 | ||||||
| 192,640,327 | ||||||||
|
Property & Casualty Insurance–1.36% |
||||||||
|
Travelers Cos., Inc. (The)
|
962,913 | 56,185,974 | ||||||
|
Regional Banks–6.79% |
||||||||
|
Fifth Third Bancorp
|
5,487,674 | 65,906,965 | ||||||
|
M&T Bank Corp.
|
610,225 | 46,444,225 | ||||||
|
SunTrust Banks, Inc.
|
4,785,647 | 94,420,815 | ||||||
|
Zions Bancorp.
|
4,236,503 | 73,545,692 | ||||||
| 280,317,697 | ||||||||
|
Reinsurance–0.09% |
||||||||
|
Transatlantic Holdings, Inc.
|
69,489 | 3,616,208 | ||||||
|
Restaurants–0.82% |
||||||||
|
Brinker International, Inc.
|
1,485,708 | 34,022,713 | ||||||
|
Semiconductors–1.54% |
||||||||
|
Linear Technology Corp.
|
190,693 | 6,161,291 | ||||||
|
Texas Instruments Inc.
|
1,873,265 | 57,565,433 | ||||||
| 63,726,724 | ||||||||
|
Soft Drinks–1.15% |
||||||||
|
Coca-Cola
Co. (The)
|
694,406 | 47,441,818 | ||||||
|
Specialized Consumer Services–0.40% |
||||||||
|
H&R Block, Inc.
|
1,090,801 | 16,678,347 | ||||||
|
Specialized REIT’s–1.51% |
||||||||
|
Weyerhaeuser Co.
|
3,462,208 | 62,250,500 | ||||||
|
Specialty Chemicals–0.48% |
||||||||
|
Ecolab Inc.
|
368,338 | 19,831,318 | ||||||
|
Systems Software–1.75% |
||||||||
|
Microsoft Corp.
|
2,715,439 | 72,312,141 | ||||||
|
Thrifts & Mortgage Finance–1.53% |
||||||||
|
Capitol Federal Financial Inc.
|
35,067 | 388,893 | ||||||
|
Hudson City Bancorp, Inc.
|
10,022,146 | 62,638,413 | ||||||
| 63,027,306 | ||||||||
|
Tobacco–2.07% |
||||||||
|
Altria Group, Inc.
|
1,986,080 | 54,716,504 | ||||||
|
Philip Morris International Inc.
|
442,094 | 30,889,108 | ||||||
| 85,605,612 | ||||||||
|
Total Common Stocks (Cost $3,715,132,161)
|
3,832,128,319 | |||||||
|
Money Market Funds–7.97% |
||||||||
|
Liquid Assets Portfolio–Institutional
Class(b)
|
164,445,627 | 164,445,627 | ||||||
|
Premier Portfolio–Institutional
Class(b)
|
164,445,627 | 164,445,627 | ||||||
|
Total Money Market Funds (Cost $328,891,254)
|
328,891,254 | |||||||
|
TOTAL INVESTMENTS–100.84% (Cost $4,044,023,415)
|
4,161,019,573 | |||||||
|
OTHER ASSETS LESS LIABILITIES–(0.84)%
|
(34,551,113 | ) | ||||||
|
NET ASSETS–100.00%
|
$ | 4,126,468,460 | ||||||
| (a) | Industry and/or sector classifications used in this report are generally according to the Global Industry Classification Standard, which was developed by and is the exclusive property and a service mark of MSCI Inc. and Standard & Poor’s. | |
| (b) | The money market fund and the Fund are affiliated by having the same investment adviser. |
|
Assets: |
||||
|
Investments, at value (Cost $3,715,132,161)
|
$ | 3,832,128,319 | ||
|
Investments in affiliated money market funds, at value and cost
|
328,891,254 | |||
|
Total investments, at value (Cost $4,044,023,415)
|
4,161,019,573 | |||
|
Foreign currencies, at value (Cost $2,237,709)
|
2,258,816 | |||
|
Receivable for:
|
||||
|
Investments sold
|
24,736,283 | |||
|
Fund shares sold
|
4,968,812 | |||
|
Dividends
|
5,962,264 | |||
|
Fund expenses absorbed
|
350,386 | |||
|
Investment for trustee deferred compensation and retirement plans
|
302,068 | |||
|
Other assets
|
43,693 | |||
|
Total assets
|
4,199,641,895 | |||
|
Liabilities: |
||||
|
Payable for:
|
||||
|
Investments purchased
|
64,321,724 | |||
|
Fund shares reacquired
|
5,007,656 | |||
|
Accrued fees to affiliates
|
1,966,122 | |||
|
Accrued other operating expenses
|
1,254,652 | |||
|
Trustee deferred compensation and retirement plans
|
623,281 | |||
|
Total liabilities
|
73,173,435 | |||
|
Net assets applicable to shares outstanding
|
$ | 4,126,468,460 | ||
|
Net assets consist of: |
||||
|
Shares of beneficial interest
|
$ | 4,015,841,444 | ||
|
Undistributed net investment income
|
4,198,949 | |||
|
Undistributed net realized gain (loss)
|
(11,026,536 | ) | ||
|
Unrealized appreciation
|
117,454,603 | |||
| $ | 4,126,468,460 | |||
|
Net Assets: |
||||
|
Class A
|
$ | 2,121,824,480 | ||
|
Class B
|
$ | 36,873,056 | ||
|
Class C
|
$ | 120,031,197 | ||
|
Class R
|
$ | 19,260,834 | ||
|
Class Y
|
$ | 131,364,715 | ||
|
Investor Class
|
$ | 1,253,533,190 | ||
|
Institutional Class
|
$ | 443,580,988 | ||
|
Shares outstanding, $0.001 par value per share, with an unlimited number of shares authorized: |
||||
|
Class A
|
177,931,951 | |||
|
Class B
|
3,123,784 | |||
|
Class C
|
10,180,030 | |||
|
Class R
|
1,610,545 | |||
|
Class Y
|
11,003,565 | |||
|
Investor Class
|
105,159,392 | |||
|
Institutional Class
|
37,198,141 | |||
|
Class A:
|
||||
|
Net asset value per share
|
$ | 11.92 | ||
|
Maximum offering price per share
(Net asset value of $11.92 divided by 94.50%) |
$ | 12.61 | ||
|
Class B:
|
||||
|
Net asset value and offering price per share
|
$ | 11.80 | ||
|
Class C:
|
||||
|
Net asset value and offering price per share
|
$ | 11.79 | ||
|
Class R:
|
||||
|
Net asset value and offering price per share
|
$ | 11.96 | ||
|
Class Y:
|
||||
|
Net asset value and offering price per share
|
$ | 11.94 | ||
|
Investor Class:
|
||||
|
Net asset value and offering price per share
|
$ | 11.92 | ||
|
Institutional Class:
|
||||
|
Net asset value and offering price per share
|
$ | 11.92 | ||
|
Investment income: |
||||
|
Dividends (net of foreign withholding taxes of $1,163,896)
|
$ | 70,892,004 | ||
|
Dividends from affiliated money market funds
|
214,898 | |||
|
Total investment income
|
71,106,902 | |||
|
Expenses: |
||||
|
Advisory fees
|
13,941,805 | |||
|
Administrative services fees
|
568,708 | |||
|
Custodian fees
|
142,832 | |||
|
Distribution fees:
|
||||
|
Class A
|
2,463,691 | |||
|
Class B
|
379,503 | |||
|
Class C
|
882,875 | |||
|
Class R
|
67,789 | |||
|
Investor Class
|
2,241,427 | |||
|
Transfer agent fees — A, B, C, R, Y and Investor
|
4,026,633 | |||
|
Transfer agent fees — Institutional
|
138,799 | |||
|
Trustees’ and officers’ fees and benefits
|
94,412 | |||
|
Other
|
464,872 | |||
|
Total expenses
|
25,413,346 | |||
|
Less: Fees waived, expenses reimbursed and expense offset
arrangement(s)
|
(672,890 | ) | ||
|
Net expenses
|
24,740,456 | |||
|
Net investment income
|
46,366,446 | |||
|
Realized and unrealized gain (loss) from: |
||||
|
Net realized gain (loss) from:
|
||||
|
Investment securities (includes net gains (losses) from
securities sold to affiliates of $(7,982))
|
104,356,002 | |||
|
Foreign currencies
|
(157,817 | ) | ||
| 104,198,185 | ||||
|
Change in net unrealized appreciation (depreciation) of:
|
||||
|
Investment securities
|
(166,779,209 | ) | ||
|
Foreign currencies
|
428,822 | |||
| (166,350,387 | ) | |||
|
Net realized and unrealized gain (loss)
|
(62,152,202 | ) | ||
|
Net increase (decrease) in net assets resulting from operations
|
$ | (15,785,756 | ) | |
| 2011 | 2010 | |||||||
|
Operations: |
||||||||
|
Net investment income
|
$ | 46,366,446 | $ | 34,156,270 | ||||
|
Net realized gain
|
104,198,185 | 25,430,366 | ||||||
|
Change in net unrealized appreciation (depreciation)
|
(166,350,387 | ) | 169,578,286 | |||||
|
Net increase (decrease) in net assets resulting from operations
|
(15,785,756 | ) | 229,164,922 | |||||
|
Distributions to shareholders from net investment income: |
||||||||
|
Class A
|
(16,512,966 | ) | (4,341,012 | ) | ||||
|
Class B
|
(446,683 | ) | (318,452 | ) | ||||
|
Class C
|
(924,157 | ) | (439,986 | ) | ||||
|
Class R
|
(204,682 | ) | (68,025 | ) | ||||
|
Class Y
|
(1,793,839 | ) | (259,982 | ) | ||||
|
Investor Class
|
(23,708,603 | ) | (19,200,186 | ) | ||||
|
Institutional Class
|
(7,530,265 | ) | (1,600,424 | ) | ||||
|
Total distributions from net investment income
|
(51,121,195 | ) | (26,228,067 | ) | ||||
|
Share transactions–net: |
||||||||
|
Class A
|
1,816,230,981 | 159,508,136 | ||||||
|
Class B
|
3,813,410 | (2,148,859 | ) | |||||
|
Class C
|
70,079,020 | 10,509,311 | ||||||
|
Class R
|
11,604,617 | 3,740,809 | ||||||
|
Class Y
|
107,001,695 | 23,973,176 | ||||||
|
Investor Class
|
150,949,067 | (38,092,722 | ) | |||||
|
Institutional Class
|
187,308,657 | 179,452,634 | ||||||
|
Net increase in net assets resulting from share transactions
|
2,346,987,447 | 336,942,485 | ||||||
|
Net increase in net assets
|
2,280,080,496 | 539,879,340 | ||||||
|
Net assets: |
||||||||
|
Beginning of year
|
1,846,387,964 | 1,306,508,624 | ||||||
|
End of year (includes undistributed net investment income of
$4,198,949 and $9,775,401, respectively)
|
$ | 4,126,468,460 | $ | 1,846,387,964 | ||||
| A. | Security Valuations — Securities, including restricted securities, are valued according to the following policy. | |
| A security listed or traded on an exchange (except convertible bonds) is valued at its last sales price or official closing price as of the close of the customary trading session on the exchange where the security is principally traded, or lacking any sales or official closing price on a particular day, the security may be valued at the closing bid price on that day. Securities traded in the over-the-counter market are valued based on prices furnished by independent pricing services or market makers. When such securities are valued by an independent pricing service they may be considered fair valued. Futures contracts are valued at the final settlement price set by an exchange on which they are principally traded. Listed options are valued at the mean between the last bid and ask prices from the exchange on which they are principally traded. Options not listed on an exchange are valued by an independent source at the mean between the last bid and ask prices. For purposes of determining net asset value per share, futures and option contracts generally are valued 15 minutes after the close of the customary trading session of the New York Stock Exchange (“NYSE”). | ||
| Investments in open-end and closed-end registered investment companies that do not trade on an exchange are valued at the end of day net asset value per share. Investments in open-end and closed-end registered investment companies that trade on an exchange are valued at the last sales price or official closing price as of the close of the customary trading session on the exchange where the security is principally traded. | ||
| Debt obligations (including convertible bonds) and unlisted equities are fair valued using an evaluated quote provided by an independent pricing service. Evaluated quotes provided by the pricing service may be determined without exclusive reliance on quoted prices, and may reflect appropriate factors such as institution-size trading in similar groups of securities, developments related to specific securities, dividend rate, yield, quality, type of issue, coupon rate, maturity, individual trading characteristics and other market data. Debt securities are subject to interest rate and credit risks. In addition, all debt securities involve some risk of default with respect to interest and/or principal payments. | ||
| Foreign securities (including foreign exchange contracts) are converted into U.S. dollar amounts using the applicable exchange rates as of the close of the NYSE. If market quotations are available and reliable for foreign exchange traded equity securities, the securities will be valued at the market quotations. Because trading hours for certain foreign securities end before the close of the NYSE, closing market quotations may become unreliable. If between the time trading ends on a particular security and the close of the customary trading session on the NYSE, events occur that are significant and make the closing price unreliable, the Fund may fair value the security. If the event is likely to have affected the closing price of the security, the security will be valued at fair value in good faith using procedures approved by the Board of Trustees. Adjustments to closing prices to reflect fair value may also be based on a screening process of an independent pricing service to indicate the degree of certainty, based on historical data, that the closing price in the principal market where a foreign security trade is not the current value as of the close of the NYSE. Foreign securities meeting the approved degree of certainty that the price is not reflective of current value will be priced at the indication of fair value from the independent pricing service. Multiple factors may be considered by the independent pricing service in determining adjustments to reflect fair value and may include information relating to sector indices, American Depositary Receipts and domestic and foreign index futures. Foreign securities may have additional risks including exchange rate changes, potential for sharply devalued currencies and high inflation, political and economical upheaval, the relative lack of issuer information, relatively low market liquidity and the potential lack of strict financial and accounting controls and standards. | ||
| Securities for which market prices are not provided by any of the above methods may be valued based upon quotes furnished by independent sources. The last bid price may be used to value equity securities. The mean between the last bid and asked prices is used to value debt obligations, including Corporate Loans. | ||
| Securities for which market quotations are not readily available or are unreliable are valued at fair value as determined in good faith by or under the supervision of the Trust’s officers following procedures approved by the Board of Trustees. Issuer specific events, market trends, bid/ask quotes of brokers and information providers and other market data may be reviewed in the course of making a good faith determination of a security’s fair value. | ||
| Valuations change in response to many factors including the historical and prospective earnings of the issuer, the value of the issuer’s assets, general economic conditions, interest rates, investor perceptions and market liquidity. Because of the inherent uncertainties of valuation, the values reflected in the financial statements may materially differ from the value received upon actual sale of those investments. | ||
| B. | Securities Transactions and Investment Income — Securities transactions are accounted for on a trade date basis. Realized gains or losses on sales are computed on the basis of specific identification of the securities sold. Interest income is recorded on the accrual basis from settlement date. Dividend income (net of withholding tax, if any) is recorded on the ex-dividend date. | |
| The Fund may periodically participate in litigation related to Fund investments. As such, the Fund may receive proceeds from litigation settlements. Any proceeds received are included in the Statement of Operations as realized gain (loss) for investments no longer held and as unrealized gain (loss) for investments still held. | ||
| Brokerage commissions and mark ups are considered transaction costs and are recorded as an increase to the cost basis of securities purchased and/or a reduction of proceeds on a sale of securities. Such transaction costs are included in the determination of net realized and unrealized gain (loss) from investment securities reported in the Statement of Operations and the Statement of Changes in Net Assets and the net realized and unrealized gains (losses) on securities per share in the Financial Highlights. Transaction costs are included in the calculation of the Fund’s net asset value and, accordingly, they reduce the Fund’s total returns. These transaction costs are not considered operating expenses and are not reflected in net investment income reported in the Statement of Operations and Statement of Changes in Net Assets, or the net investment income per share and ratios of expenses and net investment income reported in the Financial Highlights, nor are they limited by any expense limitation arrangements between the Fund and the investment adviser. | ||
| The Fund allocates income and realized and unrealized capital gains and losses to a class based on the relative net assets of each class. | ||
| C. | Country Determination — For the purposes of making investment selection decisions and presentation in the Schedule of Investments, the investment adviser may determine the country in which an issuer is located and/or credit risk exposure based on various factors. These factors include the laws of the country under which the issuer is organized, where the issuer maintains a principal office, the country in which the issuer derives 50% or more |
| of its total revenues and the country that has the primary market for the issuer’s securities, as well as other criteria. Among the other criteria that may be evaluated for making this determination are the country in which the issuer maintains 50% or more of its assets, the type of security, financial guarantees and enhancements, the nature of the collateral and the sponsor organization. Country of issuer and/or credit risk exposure has been determined to be the United States of America, unless otherwise noted. | ||
| D. | Distributions — Distributions from income are declared and paid quarterly and are recorded on ex-dividend date. Distributions from net realized capital gain, if any, are generally paid annually and recorded on ex-dividend date. The Fund may elect to treat a portion of the proceeds from redemptions as distributions for federal income tax purposes. | |
| E. | Federal Income Taxes — The Fund intends to comply with the requirements of Subchapter M of the Internal Revenue Code necessary to qualify as a regulated investment company and to distribute substantially all of the Fund’s taxable earnings to shareholders. As such, the Fund will not be subject to federal income taxes on otherwise taxable income (including net realized capital gain) that is distributed to shareholders. Therefore, no provision for federal income taxes is recorded in the financial statements. | |
| The Fund files tax returns in the U.S. Federal jurisdiction and certain other jurisdictions. Generally, the Fund is subject to examinations by such taxing authorities for up to three years after the filing of the return for the tax period. | ||
| F. | Expenses — Fees provided for under the Rule 12b-1 plan of a particular class of the Fund are charged to the operations of such class. Transfer agency fees and expenses and other shareholder recordkeeping fees and expenses attributable to the Institutional Class are charged to such class. Transfer agency fees and expenses and other shareholder recordkeeping fees and expenses relating to all other classes are allocated among those classes based on relative net assets. All other expenses are allocated among the classes based on relative net assets. | |
| G. | Accounting Estimates — The preparation of financial statements in conformity with accounting principles generally accepted in the United States of America (“GAAP”) requires management to make estimates and assumptions that affect the reported amounts of assets and liabilities at the date of the financial statements and the reported amounts of revenues and expenses during the reporting period including estimates and assumptions related to taxation. Actual results could differ from those estimates by a significant amount. In addition, the Fund monitors for material events or transactions that may occur or become known after the period-end date and before the date the financial statements are released to print. | |
| H. | Indemnifications — Under the Trust’s organizational documents, each Trustee, officer, employee or other agent of the Trust is indemnified against certain liabilities that may arise out of performance of their duties to the Fund. Additionally, in the normal course of business, the Fund enters into contracts, including the Fund’s servicing agreements that contain a variety of indemnification clauses. The Fund’s maximum exposure under these arrangements is unknown as this would involve future claims that may be made against the Fund that have not yet occurred. The risk of material loss as a result of such indemnification claims is considered remote. | |
| I. | Foreign Currency Translations — Foreign currency is valued at the close of the NYSE based on quotations posted by banks and major currency dealers. Portfolio securities and other assets and liabilities denominated in foreign currencies are translated into U.S. dollar amounts at date of valuation. Purchases and sales of portfolio securities (net of foreign taxes withheld on disposition) and income items denominated in foreign currencies are translated into U.S. dollar amounts on the respective dates of such transactions. The Fund does not separately account for the portion of the results of operations resulting from changes in foreign exchange rates on investments and the fluctuations arising from changes in market prices of securities held. The combined results of changes in foreign exchange rates and the fluctuation of market prices on investments (net of estimated foreign tax withholding) are included with the net realized and unrealized gain or loss from investments in the Statement of Operations. Reported net realized foreign currency gains or losses arise from (1) sales of foreign currencies, (2) currency gains or losses realized between the trade and settlement dates on securities transactions, and (3) the difference between the amounts of dividends, interest, and foreign withholding taxes recorded on the Fund’s books and the U.S. dollar equivalent of the amounts actually received or paid. Net unrealized foreign currency gains and losses arise from changes in the fair values of assets and liabilities, other than investments in securities at fiscal period end, resulting from changes in exchange rates. | |
| The Fund may invest in foreign securities which may be subject to foreign taxes on income, gains on investments or currency repatriation, a portion of which may be recoverable. | ||
| J. | Foreign Currency Contracts — The Fund may enter into foreign currency contracts to manage or minimize currency or exchange rate risk. The Fund may also enter into foreign currency contracts for the purchase or sale of a security denominated in a foreign currency in order to “lock in” the U.S. dollar price of that security. A foreign currency contract is an obligation to purchase or sell a specific currency for an agreed-upon price at a future date. The use of foreign currency contracts does not eliminate fluctuations in the price of the underlying securities the Fund owns or intends to acquire but establishes a rate of exchange in advance. Fluctuations in the value of these contracts are measured by the difference in the contract date and reporting date exchange rates and are recorded as unrealized appreciation (depreciation) until the contracts are closed. When the contracts are closed, realized gains (losses) are recorded. Realized and unrealized gains (losses) on the contracts are included in the Statement of Operations. The primary risks associated with foreign currency contracts include failure of the counterparty to meet the terms of the contract and the value of the foreign currency changing unfavorably. These risks may be in excess of the amounts reflected in the Statement of Assets and Liabilities. |
| Average Daily Net Assets | Rate | |||
|
First $350 million
|
0 | .60% | ||
|
Next $350 million
|
0 | .55% | ||
|
Next $1.3 billion
|
0 | .50% | ||
|
Next $2 billion
|
0 | .45% | ||
|
Next $2 billion
|
0 | .40% | ||
|
Next $2 billion
|
0 | .375% | ||
|
Over $8 billion
|
0 | .35% | ||
| Level 1 — | Prices are determined using quoted prices in an active market for identical assets. | |
| Level 2 — | Prices are determined using other significant observable inputs. Observable inputs are inputs that other market participants may use in pricing a security. These may include quoted prices for similar securities, interest rates, prepayment speeds, credit risk, yield curves, loss severities, default rates, discount rates, volatilities and others. | |
| Level 3 — | Prices are determined using significant unobservable inputs. In situations where quoted prices or observable inputs are unavailable (for example, when there is little or no market activity for an investment at the end of the period), unobservable inputs may be used. Unobservable inputs reflect the Fund’s own assumptions about the factors market participants would use in determining fair value of the securities or instruments and would be based on the best available information. |
| Level 1 | Level 2 | Level 3 | Total | |||||||||||||
|
Equity Securities
|
$ | 3,976,680,227 | $ | 184,339,346 | $ | — | $ | 4,161,019,573 | ||||||||
| 2011 | 2010 | |||||||
|
Ordinary income
|
$ | 51,121,195 | $ | 26,228,067 | ||||
| 2011 | ||||
|
Undistributed ordinary income
|
$ | 4,712,447 | ||
|
Undistributed long-term gain
|
48,180,959 | |||
|
Net unrealized appreciation — investments
|
116,925,805 | |||
|
Net unrealized appreciation — other investments
|
458,444 | |||
|
Temporary book/tax differences
|
(513,498 | ) | ||
|
Capital loss carryforward
|
(59,137,141 | ) | ||
|
Shares of beneficial interest
|
4,015,841,444 | |||
|
Total net assets
|
$ | 4,126,468,460 | ||
|
Capital Loss |
||||
| Expiration | Carryforward* | |||
|
October 31, 2015
|
$ | 5,528,334 | ||
|
October 31, 2016
|
15,714,878 | |||
|
October 31, 2017
|
28,049,390 | |||
|
Not subject to expiration
|
1,797,106 | |||
|
October 31, 2019
|
8,047,433 | |||
|
Total capital loss carryforward
|
$ | 59,137,141 | ||
| * | Capital loss carryforward as of the date listed above is reduced for limitations, if any, to the extent required by the Internal Revenue Code. To the extent that unrealized gains as of May 23, 2011, the date of reorganization of Invesco Financial Services Fund and Invesco Van Kampen Core Equity Fund and July 18, 2011, the date of reorganization of Invesco Dividend Growth Securities Fund into the Fund are realized on securities held in each fund at such date of reorganization, the capital loss carryforward may be further limited for up to five years from the dates of the reorganization. |
| Unrealized Appreciation (Depreciation) of Investment Securities on a Tax Basis | ||||
|
Aggregate unrealized appreciation of investment securities
|
$ | 388,026,150 | ||
|
Aggregate unrealized (depreciation) of investment securities
|
(271,100,345 | ) | ||
|
Net unrealized appreciation of investment securities
|
$ | 116,925,805 | ||
|
Cost of investments for tax purposes is $4,044,093,768.
|
||||
| Summary of Share Activity | ||||||||||||||||
| Years ended October 31, | ||||||||||||||||
| 2011(a) | 2010 | |||||||||||||||
| Shares | Amount | Shares | Amount | |||||||||||||
|
Sold:
|
||||||||||||||||
|
Class A
|
66,279,742 | $ | 795,496,855 | 17,741,473 | $ | 198,943,930 | ||||||||||
|
Class B
|
1,376,543 | 16,509,821 | 864,957 | 9,575,681 | ||||||||||||
|
Class C
|
4,304,566 | 52,743,160 | 1,725,781 | 19,125,381 | ||||||||||||
|
Class R
|
1,509,296 | 18,519,878 | 434,907 | 4,923,942 | ||||||||||||
|
Class Y
|
8,113,564 | 101,709,880 | 2,426,113 | 27,357,894 | ||||||||||||
|
Investor Class
|
13,526,306 | 165,192,266 | 5,779,832 | 64,451,706 | ||||||||||||
|
Institutional Class
|
20,650,313 | 251,144,633 | 17,487,738 | 195,592,288 | ||||||||||||
|
Issued as reinvestment of dividends:
|
||||||||||||||||
|
Class A
|
1,264,296 | 14,936,984 | 350,722 | 3,924,290 | ||||||||||||
|
Class B
|
35,319 | 419,795 | 27,124 | 300,406 | ||||||||||||
|
Class C
|
69,169 | 820,797 | 35,699 | 395,300 | ||||||||||||
|
Class R
|
15,979 | 192,901 | 6,061 | 68,025 | ||||||||||||
|
Class Y
|
123,916 | 1,488,712 | 21,472 | 240,666 | ||||||||||||
|
Investor Class
|
1,837,909 | 22,064,768 | 1,585,813 | 17,720,257 | ||||||||||||
|
Institutional Class
|
595,700 | 7,146,077 | 119,747 | 1,340,239 | ||||||||||||
|
Issued in connection with
acquisitions:(b)(c)
|
||||||||||||||||
|
Class A
|
94,252,169 | 1,199,686,878 | — | — | ||||||||||||
|
Class B
|
419,760 | 5,436,017 | — | — | ||||||||||||
|
Class C
|
2,743,934 | 34,897,627 | — | — | ||||||||||||
|
Class R
|
1,188 | 15,574 | — | — | ||||||||||||
|
Class Y
|
3,102,285 | 40,176,616 | — | — | ||||||||||||
|
Investor Class
|
9,786,544 | 128,003,179 | — | — | ||||||||||||
|
Automatic conversion of Class B shares to Class A shares:
|
||||||||||||||||
|
Class A
|
917,198 | 11,169,766 | 538,497 | 6,008,836 | ||||||||||||
|
Class B
|
(926,670 | ) | (11,169,766 | ) | (543,901 | ) | (6,008,836 | ) | ||||||||
|
Reacquired:
|
||||||||||||||||
|
Class A
|
(17,160,981 | ) | (205,059,502 | ) | (4,446,159 | ) | (49,368,920 | ) | ||||||||
|
Class B
|
(604,541 | ) | (7,382,457 | ) | (549,387 | ) | (6,016,110 | ) | ||||||||
|
Class C
|
(1,511,227 | ) | (18,382,564 | ) | (819,802 | ) | (9,011,370 | ) | ||||||||
|
Class R
|
(573,524 | ) | (7,123,736 | ) | (111,111 | ) | (1,251,158 | ) | ||||||||
|
Class Y
|
(3,035,288 | ) | (36,373,513 | ) | (326,604 | ) | (3,625,384 | ) | ||||||||
|
Investor Class
|
(13,417,784 | ) | (164,311,146 | ) | (10,833,530 | ) | (120,264,685 | ) | ||||||||
|
Institutional Class
|
(5,854,271 | ) | (70,982,053 | ) | (1,582,074 | ) | (17,479,893 | ) | ||||||||
|
Net increase in share activity
|
187,841,410 | $ | 2,346,987,447 | 29,933,368 | $ | 336,942,485 | ||||||||||
| (a) | There are entities that are record owners of more than 5% of the outstanding shares of the Fund and in the aggregate own 28% of the outstanding shares of the Fund. IDI has an agreement with these entities to sell Fund shares. The Fund, Invesco and/or Invesco affiliates may make payments to these entities, which are considered to be related to the Fund, for providing services to the Fund, Invesco and/or Invesco affiliates including but not limited to services such as securities brokerage, distribution, third party record keeping and account servicing. The Fund has no knowledge as to whether all or any portion of the shares owned of record by these entities are also owned beneficially. | |
| (b) | As of the open of business on May 23, 2011, the Fund acquired all the net assets of Invesco Financial Services Fund and Invesco Van Kampen Core Equity Fund pursuant to a plan of reorganization approved by the Trustees of the Fund on November 10, 2010 and by the shareholders of Invesco Financial Services Fund and Invesco Van Kampen Core Equity Fund on April 14, 2011. The acquisition was accomplished by a tax-free exchange of 16,822,719 shares of the Fund for 21,975,207 and 3,949,048 shares outstanding of Invesco Financial Services Fund and Invesco Van Kampen Core Equity Fund, respectively, as of the close of business on May 20, 2011 for Invesco Financial Services Fund and Invesco Van Kampen Core Equity Fund. Each class of Invesco Financial Services Fund and Invesco Van Kampen Core Equity Fund was exchanged for the like class of shares of the Fund based on the relative net asset value of Invesco Financial Services Fund and Invesco Van Kampen Core Equity Fund to the net asset value of the Fund on the close of business on May 20, 2011 for Invesco Financial Services Fund and Invesco Van Kampen Core Equity Fund. Invesco Financial Services Fund and Invesco Van Kampen Core Equity Fund net assets at that date of $187,141,787 and $32,737,235, respectively, including $(6,848,123) of unrealized appreciation (depreciation), was combined with those of the Fund. The net assets of the Fund immediately before the acquisition were $2,562,693,336. The net assets of the Fund immediately following the acquisition were $2,782,572,358. | |
| (c) | As of the open of business on July 18, 2011, the Fund acquired all the net assets of Invesco Dividend Growth Securities Fund pursuant to a plan of reorganization approved by the Trustees of the Fund on November 10, 2010 and by the shareholders of Invesco Dividend Growth Securities Fund on June 30, 2011. The acquisition was accomplished by a tax-free exchange of 93,483,161 shares of the Fund for 98,075,828 shares outstanding of Invesco Dividend Growth Securities Fund, as of the close of business on July 15, 2011 for Invesco Dividend Growth Securities Fund. Each class of Invesco Dividend Growth Securities Fund was exchanged for the like class of shares of the Fund based on the relative net asset value of Invesco Dividend Growth Securities Fund to the net asset value of the Fund on the close of business on July 15, 2011 for Invesco Dividend Growth Securities Fund. Invesco Dividend Growth Securities Fund net assets at that date of $1,188,336,869 including $153,543,395 of unrealized appreciation, was combined with those of the Fund. The net assets of the Fund immediately before the acquisition were $2,823,082,080. The net assets of the Fund immediately following the acquisition were $4,011,418,949. |
|
Ratio of |
Ratio of |
|||||||||||||||||||||||||||||||||||||||||||||||||||||||
|
Net gains |
expenses |
expenses |
||||||||||||||||||||||||||||||||||||||||||||||||||||||
|
(losses) on |
to average |
to average net |
Ratio of net |
|||||||||||||||||||||||||||||||||||||||||||||||||||||
|
Net asset |
securities |
Dividends |
Distributions |
net assets |
assets without |
investment |
||||||||||||||||||||||||||||||||||||||||||||||||||
|
value, |
Net |
(both |
Total from |
from net |
from net |
Net asset |
Net assets, |
with fee
waivers |
fee waivers |
income |
||||||||||||||||||||||||||||||||||||||||||||||
|
beginning |
investment |
realized and |
investment |
investment |
realized |
Total |
value, end |
Total |
end of period |
and/or
expenses |
and/or
expenses |
to average |
Portfolio |
|||||||||||||||||||||||||||||||||||||||||||
| of period | income | unrealized) | operations | income | gains | Distributions | of period | Return(a) | (000s omitted) | absorbed | absorbed | net assets | turnover(b) | |||||||||||||||||||||||||||||||||||||||||||
| Class A | ||||||||||||||||||||||||||||||||||||||||||||||||||||||||
| Year ended 10/31/11 | $ | 11.67 | $ | 0.19 | (c) | $ | 0.29 | $ | 0.48 | $ | (0.23 | ) | $ | — | $ | (0.23 | ) | $ | 11.92 | 4.15 | % | $ | 2,121,824 | 0.94 | %(d) | 0.97 | %(d) | 1.64 | %(d) | 20 | % | |||||||||||||||||||||||||
| Year ended 10/31/10 | 10.18 | 0.25 | (c) | 1.43 | 1.68 | (0.19 | ) | — | (0.19 | ) | 11.67 | 16.64 | 377,758 | 1.01 | 1.02 | 2.23 | 13 | |||||||||||||||||||||||||||||||||||||||
| Year ended 10/31/09 | 9.43 | 0.19 | (c) | 0.75 | 0.94 | (0.19 | ) | — | (0.19 | ) | 10.18 | 10.42 | 185,274 | 1.11 | 1.12 | 2.17 | 24 | |||||||||||||||||||||||||||||||||||||||
| Year ended 10/31/08 | 14.27 | 0.23 | (c) | (3.89 | ) | (3.66 | ) | (0.24 | ) | (0.94 | ) | (1.18 | ) | 9.43 | (27.56 | ) | 157,407 | 1.01 | 1.02 | 1.93 | 18 | |||||||||||||||||||||||||||||||||||
| Year ended 10/31/07 | 13.88 | 0.20 | 0.99 | 1.19 | (0.21 | ) | (0.59 | ) | (0.80 | ) | 14.27 | 8.86 | 237,467 | 1.00 | 1.00 | 1.45 | 17 | |||||||||||||||||||||||||||||||||||||||
| Class B | ||||||||||||||||||||||||||||||||||||||||||||||||||||||||
| Year ended 10/31/11 | 11.55 | 0.11 | (c) | 0.28 | 0.39 | (0.14 | ) | — | (0.14 | ) | 11.80 | 3.39 | 36,873 | 1.69 | (d) | 1.72 | (d) | 0.89 | (d) | 20 | ||||||||||||||||||||||||||||||||||||
| Year ended 10/31/10 | 10.08 | 0.16 | (c) | 1.42 | 1.58 | (0.11 | ) | — | (0.11 | ) | 11.55 | 15.75 | 32,600 | 1.76 | 1.77 | 1.48 | 13 | |||||||||||||||||||||||||||||||||||||||
| Year ended 10/31/09 | 9.34 | 0.13 | (c) | 0.74 | 0.87 | (0.13 | ) | — | (0.13 | ) | 10.08 | 9.58 | 30,490 | 1.86 | 1.87 | 1.42 | 24 | |||||||||||||||||||||||||||||||||||||||
| Year ended 10/31/08 | 14.14 | 0.15 | (c) | (3.86 | ) | (3.71 | ) | (0.15 | ) | (0.94 | ) | (1.09 | ) | 9.34 | (28.06 | ) | 36,934 | 1.69 | 1.76 | 1.25 | 18 | |||||||||||||||||||||||||||||||||||
| Year ended 10/31/07 | 13.76 | 0.11 | 0.98 | 1.09 | (0.12 | ) | (0.59 | ) | (0.71 | ) | 14.14 | 8.15 | 85,172 | 1.65 | 1.75 | 0.80 | 17 | |||||||||||||||||||||||||||||||||||||||
| Class C | ||||||||||||||||||||||||||||||||||||||||||||||||||||||||
| Year ended 10/31/11 | 11.53 | 0.11 | (c) | 0.29 | 0.40 | (0.14 | ) | — | (0.14 | ) | 11.79 | 3.48 | 120,031 | 1.69 | (d) | 1.72 | (d) | 0.89 | (d) | 20 | ||||||||||||||||||||||||||||||||||||
| Year ended 10/31/10 | 10.07 | 0.16 | (c) | 1.41 | 1.57 | (0.11 | ) | — | (0.11 | ) | 11.53 | 15.66 | 52,755 | 1.76 | 1.77 | 1.48 | 13 | |||||||||||||||||||||||||||||||||||||||
| Year ended 10/31/09 | 9.33 | 0.13 | (c) | 0.74 | 0.87 | (0.13 | ) | — | (0.13 | ) | 10.07 | 9.59 | 36,573 | 1.86 | 1.87 | 1.42 | 24 | |||||||||||||||||||||||||||||||||||||||
| Year ended 10/31/08 | 14.12 | 0.15 | (c) | (3.85 | ) | (3.70 | ) | (0.15 | ) | (0.94 | ) | (1.09 | ) | 9.33 | (28.02 | ) | 30,998 | 1.69 | 1.76 | 1.25 | 18 | |||||||||||||||||||||||||||||||||||
| Year ended 10/31/07 | 13.74 | 0.11 | 0.98 | 1.09 | (0.12 | ) | (0.59 | ) | (0.71 | ) | 14.12 | 8.16 | 52,524 | 1.65 | 1.75 | 0.80 | 17 | |||||||||||||||||||||||||||||||||||||||
| Class R | ||||||||||||||||||||||||||||||||||||||||||||||||||||||||
| Year ended 10/31/11 | 11.70 | 0.17 | (c) | 0.29 | 0.46 | (0.20 | ) | — | (0.20 | ) | 11.96 | 3.97 | 19,261 | 1.19 | (d) | 1.22 | (d) | 1.39 | (d) | 20 | ||||||||||||||||||||||||||||||||||||
| Year ended 10/31/10 | 10.19 | 0.22 | (c) | 1.46 | 1.68 | (0.17 | ) | — | (0.17 | ) | 11.70 | 16.55 | 7,693 | 1.26 | 1.27 | 1.98 | 13 | |||||||||||||||||||||||||||||||||||||||
| Year ended 10/31/09 | 9.44 | 0.18 | (c) | 0.74 | 0.92 | (0.17 | ) | — | (0.17 | ) | 10.19 | 10.14 | 3,341 | 1.36 | 1.37 | 1.92 | 24 | |||||||||||||||||||||||||||||||||||||||
| Year ended 10/31/08 | 14.28 | 0.20 | (c) | (3.89 | ) | (3.69 | ) | (0.21 | ) | (0.94 | ) | (1.15 | ) | 9.44 | (27.73 | ) | 902 | 1.26 | 1.27 | 1.68 | 18 | |||||||||||||||||||||||||||||||||||
| Year ended 10/31/07 | 13.88 | 0.17 | 1.00 | 1.17 | (0.18 | ) | (0.59 | ) | (0.77 | ) | 14.28 | 8.67 | 740 | 1.25 | 1.25 | 1.20 | 17 | |||||||||||||||||||||||||||||||||||||||
| Class Y | ||||||||||||||||||||||||||||||||||||||||||||||||||||||||
| Year ended 10/31/11 | 11.68 | 0.23 | (c) | 0.30 | 0.53 | (0.27 | ) | — | (0.27 | ) | 11.94 | 4.50 | 131,365 | 0.69 | (d) | 0.72 | (d) | 1.89 | (d) | 20 | ||||||||||||||||||||||||||||||||||||
| Year ended 10/31/10 | 10.19 | 0.28 | (c) | 1.43 | 1.71 | (0.22 | ) | — | (0.22 | ) | 11.68 | 16.91 | 31,529 | 0.76 | 0.77 | 2.48 | 13 | |||||||||||||||||||||||||||||||||||||||
| Year ended 10/31/09 | 9.43 | 0.22 | (c) | 0.76 | 0.98 | (0.22 | ) | — | (0.22 | ) | 10.19 | 10.79 | 5,893 | 0.86 | 0.88 | 2.42 | 24 | |||||||||||||||||||||||||||||||||||||||
| Year ended 10/31/08(e) | 10.84 | 0.01 | (c) | (1.42 | ) | (1.41 | ) | 0.00 | — | 0.00 | 9.43 | (13.01 | ) | 2,213 | 0.82 | (f) | 0.82 | (f) | 2.12 | (f) | 18 | |||||||||||||||||||||||||||||||||||
| Investor Class | ||||||||||||||||||||||||||||||||||||||||||||||||||||||||
| Year ended 10/31/11 | 11.66 | 0.21 | (c) | 0.29 | 0.50 | (0.24 | ) | — | (0.24 | ) | 11.92 | 4.32 | 1,253,533 | 0.87 | (d) | 0.90 | (d) | 1.71 | (d) | 20 | ||||||||||||||||||||||||||||||||||||
| Year ended 10/31/10 | 10.18 | 0.26 | (c) | 1.42 | 1.68 | (0.20 | ) | — | (0.20 | ) | 11.66 | 16.62 | 1,089,663 | 0.92 | 0.93 | 2.32 | 13 | |||||||||||||||||||||||||||||||||||||||
| Year ended 10/31/09 | 9.42 | 0.20 | (c) | 0.76 | 0.96 | (0.20 | ) | — | (0.20 | ) | 10.18 | 10.63 | 986,096 | 1.01 | 1.03 | 2.27 | 24 | |||||||||||||||||||||||||||||||||||||||
| Year ended 10/31/08 | 14.26 | 0.24 | (c) | (3.89 | ) | (3.65 | ) | (0.25 | ) | (0.94 | ) | (1.19 | ) | 9.42 | (27.50 | ) | 963,835 | 0.93 | 0.94 | 2.01 | 18 | |||||||||||||||||||||||||||||||||||
| Year ended 10/31/07 | 13.88 | 0.22 | 0.98 | 1.20 | (0.23 | ) | (0.59 | ) | (0.82 | ) | 14.26 | 8.91 | 1,472,311 | 0.91 | 0.91 | 1.54 | 17 | |||||||||||||||||||||||||||||||||||||||
| Institutional Class | ||||||||||||||||||||||||||||||||||||||||||||||||||||||||
| Year ended 10/31/11 | 11.67 | 0.24 | (c) | 0.29 | 0.53 | (0.28 | ) | — | (0.28 | ) | 11.92 | 4.53 | 443,581 | 0.58 | (d) | 0.59 | (d) | 2.00 | (d) | 20 | ||||||||||||||||||||||||||||||||||||
| Year ended 10/31/10 | 10.18 | 0.29 | (c) | 1.43 | 1.72 | (0.23 | ) | — | (0.23 | ) | 11.67 | 17.05 | 254,392 | 0.64 | 0.65 | 2.61 | 13 | |||||||||||||||||||||||||||||||||||||||
| Year ended 10/31/09 | 9.43 | 0.23 | (c) | 0.75 | 0.98 | (0.23 | ) | — | (0.23 | ) | 10.18 | 10.88 | 58,842 | 0.69 | 0.69 | 2.60 | 24 | |||||||||||||||||||||||||||||||||||||||
| Year ended 10/31/08 | 14.26 | 0.27 | (c) | (3.88 | ) | (3.61 | ) | (0.28 | ) | (0.94 | ) | (1.22 | ) | 9.43 | (27.25 | ) | 39,425 | 0.67 | 0.68 | 2.27 | 18 | |||||||||||||||||||||||||||||||||||
| Year ended 10/31/07 | 13.88 | 0.25 | 0.98 | 1.23 | (0.26 | ) | (0.59 | ) | (0.85 | ) | 14.26 | 9.17 | 53,464 | 0.66 | 0.66 | 1.79 | 17 | |||||||||||||||||||||||||||||||||||||||
| (a) | Includes adjustments in accordance with accounting principles generally accepted in the United States of America and as such, the net asset value for financial reporting purposes and the returns based upon those net asset values may differ from the net asset value and returns for shareholder transactions. Does not include sales charges and is not annualized for periods less than one year, if applicable. | |
| (b) | Portfolio turnover is calculated at the fund level and is not annualized for periods less than one year, if applicable. For the period ending October 31, 2011, the portfolio turnover calculation excludes the value of securities purchased of $1,261,900,843 and sold of $210,298,763 in the effort to realign the Fund’s portfolio holdings after the reorganization of Invesco Dividend Growth Fund, Invesco Financial Services Fund and Invesco Van Kampen Core Equity Fund into the Fund. | |
| (c) | Calculated using average shares outstanding. | |
| (d) | Ratios are based on average daily net assets (000’s) of $985,476, $37,950, $88,287, $13,558, $90,779, $1,198,323 and $344,916 for Class A, Class B, Class C, Class R, Class Y, Investor Class and Institutional Class shares, respectively. | |
| (e) | Commencement date of October 3, 2008. | |
| (f) | Annualized. |
|
HYPOTHETICAL |
||||||||||||||||||||||||||||||
|
(5% annual return
before |
||||||||||||||||||||||||||||||
| ACTUAL | expenses) | |||||||||||||||||||||||||||||
|
Beginning |
Ending |
Expenses |
Ending |
Expenses |
Annualized |
|||||||||||||||||||||||||
|
Account Value |
Account Value |
Paid During |
Account Value |
Paid During |
Expense |
|||||||||||||||||||||||||
| Class | (05/01/11) | (10/31/11)1 | Period2 | (10/31/11) | Period2 | Ratio | ||||||||||||||||||||||||
|
A
|
$ | 1,000.00 | $ | 915.80 | $ | 4.56 | $ | 1,020.44 | $ | 4.81 | 0.94 | % | ||||||||||||||||||
|
B
|
1,000.00 | 912.20 | 8.17 | 1,016.66 | 8.62 | 1.69 | ||||||||||||||||||||||||
|
C
|
1,000.00 | 912.80 | 8.17 | 1,016.66 | 8.62 | 1.69 | ||||||||||||||||||||||||
|
R
|
1,000.00 | 914.90 | 5.77 | 1,019.18 | 6.08 | 1.19 | ||||||||||||||||||||||||
|
Y
|
1,000.00 | 917.10 | 3.36 | 1,021.70 | 3.54 | 0.69 | ||||||||||||||||||||||||
|
Investor
|
1,000.00 | 916.10 | 4.35 | 1,020.67 | 4.58 | 0.90 | ||||||||||||||||||||||||
|
Institutional
|
1,000.00 | 917.40 | 2.85 | 1,022.23 | 3.01 | 0.59 | ||||||||||||||||||||||||
| 1 | The actual ending account value is based on the actual total return of the Fund for the period May 1, 2011 through October 31, 2011, after actual expenses and will differ from the hypothetical ending account value which is based on the Fund’s expense ratio and a hypothetical annual return of 5% before expenses. |
| 2 | Expenses are equal to the Fund’s annualized expense ratio as indicated above multiplied by the average account value over the period, multiplied by 184/365 to reflect the most recent fiscal half year. |
| Approval of Investment Advisory and Sub-Advisory Contracts |
| A. | Nature, Extent and Quality of Services Provided by Invesco Advisers and the Affiliated Sub-Advisers |
| B. | Fund Performance |
| C. | Advisory and Sub-Advisory Fees and Fee Waivers |
| D. | Economies of Scale and Breakpoints |
| E. | Profitability and Financial Resources |
| F. | Collateral Benefits to Invesco Advisers and its Affiliates |
|
Federal and State Income
Tax
|
||||
|
Qualified Dividend Income*
|
100% | |||
|
Corporate Dividends Received Deduction*
|
100% | |||
| * | The above percentages are based on ordinary income dividends paid to shareholders during the Fund’s fiscal year. |
|
Number of |
||||||||
|
Funds in |
||||||||
|
Fund Complex |
||||||||
|
Name, Year of
Birth and |
Trustee
and/ |
Principal
Occupation(s) |
Overseen by |
Other
Directorship(s) |
||||
| Position(s) Held with the Trust | or Officer Since | During Past 5 Years | Trustee | Held by Trustee | ||||
|
Interested
Persons
|
||||||||
|
Martin L.
Flanagan1 —
1960
Trustee |
2007 | Executive Director, Chief Executive Officer and President, Invesco Ltd. (ultimate parent of Invesco and a global investment management firm); Advisor to the Board, Invesco Advisers, Inc. (formerly known as Invesco Institutional (N.A.), Inc.); Trustee, The Invesco Funds; Vice Chair, Investment Company Institute; and Member of Executive Board, SMU Cox School of Business | 141 | None | ||||
| Formerly: Chairman, Invesco Advisers, Inc. (registered investment adviser); Director, Chairman, Chief Executive Officer and President, IVZ Inc. (holding company), INVESCO Group Services, Inc. (service provider) and Invesco North American Holdings, Inc. (holding company); Director, Chief Executive Officer and President, Invesco Holding Company Limited (parent of Invesco and a global investment management firm); Director, Invesco Ltd.; Chairman, Investment Company Institute and President, Co-Chief Executive Officer, Co-President, Chief Operating Officer and Chief Financial Officer, Franklin Resources, Inc. (global investment management organization) | ||||||||
|
Philip A.
Taylor2 —
1954
Trustee, President and Principal Executive Officer |
2006 | Head of North American Retail and Senior Managing Director, Invesco Ltd.; Director, Co-Chairman, Co-President and Co-Chief Executive Officer, Invesco Advisers, Inc. (formerly known as Invesco Institutional (N.A.), Inc.) (registered investment adviser); Director, Chairman, Chief Executive Officer and President, Invesco Management Group, Inc. (formerly Invesco Aim Management Group, Inc.) (financial services holding company); Director and President, INVESCO Funds Group, Inc. (registered investment adviser and registered transfer agent); Director and Chairman, Invesco Investment Services, Inc. (formerly known as Invesco Aim Investment Services, Inc.) (registered transfer agent) and IVZ Distributors, Inc. (formerly known as INVESCO Distributors, Inc.) (registered broker dealer); Director, President and Chairman, Invesco Inc. (holding company) and Invesco Canada Holdings Inc. (holding company); Chief Executive Officer, Invesco Corporate Class Inc. (corporate mutual fund company) and Invesco Canada Fund Inc. (corporate mutual fund company); Director, Chairman and Chief Executive Officer, Invesco Canada Ltd. (formerly known as Invesco Trimark Ltd./Invesco Trimark Ltèe) (registered investment adviser and registered transfer agent); Trustee, President and Principal Executive Officer, The Invesco Funds (other than AIM Treasurer’s Series Trust (Invesco Treasurer’s Series Trust) and Short-Term Investments Trust); Trustee and Executive Vice President, The Invesco Funds (AIM Treasurer’s Series Trust (Invesco Treasurer’s Series Trust) and Short-Term Investments Trust only); Director, Invesco Investment Advisers LLC (formerly known as Van Kampen Asset Management); Director, Chief Executive Officer and President, Van Kampen Exchange Corp. | 141 | None | ||||
| Formerly: Director and Chairman, Van Kampen Investor Services Inc.: | ||||||||
| Director, Chief Executive Officer and President, 1371 Preferred Inc. (holding company); and Van Kampen Investments Inc.; Director and President, AIM GP Canada Inc. (general partner for limited partnerships); and Van Kampen Advisors, Inc.; Director and Chief Executive Officer, Invesco Trimark Dealer Inc. (registered broker dealer); Director, Invesco Distributors, Inc. (formerly known as Invesco Aim Distributors, Inc.) (registered broker dealer); Manager, Invesco PowerShares Capital Management LLC; Director, Chief Executive Officer and President, Invesco Advisers, Inc.; Director, Chairman, Chief Executive Officer and President, Invesco Aim Capital Management, Inc.; President, Invesco Trimark Dealer Inc. and Invesco Trimark Ltd./Invesco Trimark Ltèe; Director and President, AIM Trimark Corporate Class Inc. and AIM Trimark Canada Fund Inc.; Senior Managing Director, Invesco Holding Company Limited; Trustee and Executive Vice President, Tax-Free Investments Trust; Director and Chairman, Fund Management Company (former registered broker dealer); President and Principal Executive Officer, The Invesco Funds (AIM Treasurer’s Series Trust (Invesco Treasurer’s Series Trust), Short-Term Investments Trust and Tax-Free Investments Trust only); President, AIM Trimark Global Fund Inc. and AIM Trimark Canada Fund Inc. | ||||||||
|
Wayne W.
Whalen3 —
1939
Trustee |
2010 | Of Counsel, and prior to 2010, partner in the law firm of Skadden, Arps, Slate, Meagher & Flom LLP, legal counsel to funds in the Fund Complex | 159 | Director of the Abraham Lincoln Presidential Library Foundation | ||||
|
Independent
Trustees
|
||||||||
|
Bruce L. Crockett — 1944
Trustee and Chair |
1993 | Chairman, Crockett Technology Associates (technology consulting company) | 141 | ACE Limited (insurance company); and Investment Company Institute | ||||
| Formerly: Director, Captaris (unified messaging provider); Director, President and Chief Executive Officer COMSAT Corporation; and Chairman, Board of Governors of INTELSAT (international communications company) | ||||||||
|
David C. Arch — 1945
Trustee |
2010 | Chairman and Chief Executive Officer of Blistex Inc., a consumer health care products manufacturer. | 159 | Member of the Heartland Alliance Advisory Board, a nonprofit organization serving human needs based in Chicago. Board member of the Illinois Manufacturers’ Association. Member of the Board of Visitors, Institute for the Humanities, University of Michigan | ||||
| 1 | Mr. Flanagan is considered an interested person of the Trust because he is an officer of the adviser to the Trust, and an officer and a director of Invesco Ltd., ultimate parent of the adviser to the Trust. |
| 2 | Mr. Taylor is considered an interested person of the Trust because he is an officer and a director of the adviser to, and a director of the principal underwriter of, the Trust. |
| 3 | Mr. Whalen has been deemed to be an interested person of the Trust because of his prior service as counsel to the predecessor funds of certain Invesco open-end funds and his affiliation with the law firm that served as counsel to such predecessor funds and continues to serve as counsel to the Invesco Van Kampen closed-end funds. |
|
Number of |
||||||||
|
Funds in |
||||||||
|
Fund Complex |
||||||||
|
Name, Year of
Birth and |
Trustee
and/ |
Principal
Occupation(s) |
Overseen by |
Other
Directorship(s) |
||||
| Position(s) Held with the Trust | or Officer Since | During Past 5 Years | Trustee | Held by Trustee | ||||
|
Independent
Trustees—(continued)
|
||||||||
|
Bob R. Baker — 1936
Trustee |
2003 | Retired | 141 | None | ||||
| Formerly: President and Chief Executive Officer, AMC Cancer Research Center; and Chairman and Chief Executive Officer, First Columbia Financial Corporation | ||||||||
|
Frank S. Bayley — 1939
Trustee |
2001 |
Retired Formerly: Director, Badgley Funds, Inc. (registered investment company) (2 portfolios) and Partner, law firm of Baker & McKenzie |
141 | Director and Chairman, C.D. Stimson Company (a real estate investment company) | ||||
|
James T. Bunch — 1942
Trustee |
2003 |
Founder, Green, Manning & Bunch Ltd. (investment banking firm)
Formerly: Executive Committee, United States Golf Association; and Director, Policy Studies, Inc. and Van Gilder Insurance Corporation |
141 | Vice Chairman, Board of Governors, Western Golf Association/Evans Scholars Foundation and Director, Denver Film Society | ||||
|
Rodney F. Dammeyer — 1940
Trustee |
2010 |
President of CAC, LLC, a private company offering capital investment and management advisory services.
Formerly: Prior to January 2004, Director of TeleTech Holdings Inc.; Prior to 2002, Director of Arris Group, Inc.; Prior to 2001, Managing Partner at Equity Group Corporate Investments. Prior to 1995, Vice Chairman of Anixter International. Prior to 1985, experience includes Senior Vice President and Chief Financial Officer of Household International, Inc, Executive Vice President and Chief Financial Officer of Northwest Industries, Inc. and Partner of Arthur Andersen & Co. |
159 | Director of Quidel Corporation and Stericycle, Inc. Prior to May 2008, Trustee of The Scripps Research Institute. Prior to February 2008, Director of Ventana Medical Systems, Inc. Prior to April 2007, Director of GATX Corporation. Prior to April 2004, Director of TheraSense, Inc. | ||||
|
Albert R. Dowden — 1941
Trustee |
2000 | Director of a number of public and private business corporations, including the Boss Group, Ltd. (private investment and management); Reich & Tang Funds (5 portfolios) (registered investment company); and Homeowners of America Holding Corporation/ Homeowners of America Insurance Company (property casualty company) | 141 | Board of Nature’s Sunshine Products, Inc. | ||||
| Formerly: Director, Continental Energy Services, LLC (oil and gas pipeline service); Director, CompuDyne Corporation (provider of product and services to the public security market) and Director, Annuity and Life Re (Holdings), Ltd. (reinsurance company); Director, President and Chief Executive Officer, Volvo Group North America, Inc.; Senior Vice President, AB Volvo; Director of various public and private corporations; Chairman, DHJ Media, Inc.; Director Magellan Insurance Company; and Director, The Hertz Corporation, Genmar Corporation (boat manufacturer), National Media Corporation; Advisory Board of Rotary Power International (designer, manufacturer, and seller of rotary power engines); and Chairman, Cortland Trust, Inc. (registered investment company) | ||||||||
|
Jack M. Fields — 1952
Trustee |
1997 | Chief Executive Officer, Twenty First Century Group, Inc. (government affairs company); and Owner and Chief Executive Officer, Dos Angelos Ranch, L.P. (cattle, hunting, corporate entertainment), Discovery Global Education Fund (non-profit) and Cross Timbers Quail Research Ranch (non-profit) | 141 | Administaff | ||||
| Formerly: Chief Executive Officer, Texana Timber LP (sustainable forestry company) and member of the U.S. House of Representatives | ||||||||
|
Carl Frischling — 1937
Trustee |
1988 | Partner, law firm of Kramer Levin Naftalis and Frankel LLP | 141 | Director, Reich & Tang Funds (6 portfolios) | ||||
|
Prema Mathai-Davis — 1950
Trustee |
1998 | Retired | 141 | None | ||||
| Formerly: Chief Executive Officer, YWCA of the U.S.A. | ||||||||
|
Larry Soll — 1942
Trustee |
2003 | Retired | 141 | None | ||||
| Formerly, Chairman, Chief Executive Officer and President, Synergen Corp. (a biotechnology company) | ||||||||
|
Number of |
||||||||
|
Funds in |
||||||||
|
Fund Complex |
||||||||
|
Name, Year of
Birth and |
Trustee
and/ |
Principal
Occupation(s) |
Overseen by |
Other
Directorship(s) |
||||
| Position(s) Held with the Trust | or Officer Since | During Past 5 Years | Trustee | Held by Trustee | ||||
|
Independent
Trustees—(continued)
|
||||||||
|
Hugo F. Sonnenschein — 1940
Trustee |
2010 | President Emeritus and Honorary Trustee of the University of Chicago and the Adam Smith Distinguished Service Professor in the Department of Economics at the University of Chicago. Prior to July 2000, President of the University of Chicago. | 159 | Trustee of the University of Rochester and a member of its investment committee. Member of the National Academy of Sciences, the American Philosophical Society and a fellow of the American Academy of Arts and Sciences | ||||
|
Raymond Stickel, Jr. — 1944
Trustee |
2005 | Retired | 141 | Director of Long Cove Club Owners’ Association (home owner’s association) | ||||
| Formerly: Director, Mainstay VP Series Funds, Inc. (25 portfolios) and Partner, Deloitte & Touche | ||||||||
|
Other
Officers
|
||||||||
|
Russell C. Burk — 1958
Senior Vice President and Senior Officer |
2005 | Senior Vice President and Senior Officer of Invesco Funds | N/A | N/A | ||||
|
John M. Zerr — 1962
Senior Vice President, Chief Legal Officer and Secretary |
2006 | Director, Senior Vice President, Secretary and General Counsel, Invesco Management Group, Inc. (formerly known as Invesco Aim Management Group, Inc.) and Van Kampen Exchange Corp.; Senior Vice President, Invesco Advisers, Inc. (formerly known as Invesco Institutional (N.A.), Inc.) (registered investment adviser); Senior Vice President and Secretary, Invesco Distributors, Inc. (formerly known as Invesco Aim Distributors, Inc.); Director, Vice President and Secretary, Invesco Investment Services, Inc. (formerly known as Invesco Aim Investment Services, Inc.) and IVZ Distributors, Inc. (formerly known as INVESCO Distributors, Inc.); Director and Vice President, INVESCO Funds Group, Inc.; Senior Vice President, Chief Legal Officer and Secretary, The Invesco Funds; Manager, Invesco PowerShares Capital Management LLC; Director, Secretary and General Counsel, Invesco Investment Advisers LLC (formerly known as Van Kampen Asset Management); Secretary and General Counsel, Van Kampen Funds Inc. and Chief Legal Officer, PowerShares Exchange-Traded Fund Trust, PowerShares Exchange-Traded Fund Trust II, PowerShares India Exchange-Traded Fund Trust and PowerShares Actively Managed Exchange-Traded Fund Trust | N/A | N/A | ||||
| Formerly: Director and Secretary, Van Kampen Advisors Inc.; Director Vice President, Secretary and General Counsel Van Kampen Investor Services Inc.; Director, Invesco Distributors, Inc. (formerly known as Invesco Aim Distributors, Inc.); Director, Senior Vice President, General Counsel and Secretary, Invesco Advisers, Inc.; and Van Kampen Investments Inc.; Director, Vice President and Secretary, Fund Management Company; Director, Senior Vice President, Secretary, General Counsel and Vice President, Invesco Aim Capital Management, Inc.; Chief Operating Officer and General Counsel, Liberty Ridge Capital, Inc. (an investment adviser); Vice President and Secretary, PBHG Funds (an investment company) and PBHG Insurance Series Fund (an investment company); Chief Operating Officer, General Counsel and Secretary, Old Mutual Investment Partners (a broker-dealer); General Counsel and Secretary, Old Mutual Fund Services (an administrator) and Old Mutual Shareholder Services (a shareholder servicing center); Executive Vice President, General Counsel and Secretary, Old Mutual Capital, Inc. (an investment adviser); and Vice President and Secretary, Old Mutual Advisors Funds (an investment company) | ||||||||
|
Lisa O. Brinkley — 1959
Vice President |
2004 |
Global Compliance Director, Invesco Ltd.; Chief Compliance Officer, Invesco Investment Services, Inc.(formerly known as Invesco Aim Investment Services, Inc.); and Vice President, The Invesco Funds
Formerly: Chief Compliance Officer, Invesco Distributors, Inc. (formerly known as Invesco Aim Distributors, Inc.) and Van Kampen Investor Services Inc.; Senior Vice President, Invesco Management Group, Inc.; Senior Vice President and Chief Compliance Officer, Invesco Advisers, Inc. and The Invesco Funds; Vice President and Chief Compliance Officer, Invesco Aim Capital Management, Inc. and Invesco Distributors, Inc.; Vice President, Invesco Investment Services, Inc. and Fund Management Company |
N/A | N/A | ||||
|
Sheri Morris — 1964
Vice President, Treasurer and Principal Financial Officer |
1999 | Vice President, Treasurer and Principal Financial Officer, The Invesco Funds; and Vice President, Invesco Advisers, Inc. (formerly known as Invesco Institutional (N.A.), Inc.) (registered investment adviser). | N/A | N/A | ||||
| Formerly: Treasurer, PowerShares Exchange-Traded Fund Trust, PowerShares Exchange-Traded Fund Trust II, PowerShares India Exchange-Traded Fund Trust and PowerShares Actively Managed Exchange-Traded Fund Trust; Vice President, Invesco Advisers, Inc., Invesco Aim Capital Management, Inc. and Invesco Aim Private Asset Management, Inc.; Assistant Vice President and Assistant Treasurer, The Invesco Funds and Assistant Vice President, Invesco Advisers, Inc., Invesco Aim Capital Management, Inc. and Invesco Aim Private Asset Management, Inc. | ||||||||
|
Karen Dunn Kelley — 1960
Vice President |
2004 | Head of Invesco’s World Wide Fixed Income and Cash Management Group; Senior Vice President, Invesco Advisers, Inc. (formerly known as Invesco Institutional (N.A.), Inc.) (registered investment adviser); Executive Vice President, Invesco Distributors, Inc. (formerly known as Invesco Aim Distributors, Inc.); Senior Vice President, Invesco Management Group, Inc. (formerly known as Invesco Aim Management Group, Inc.); and Director, Invesco Mortgage Capital Inc.; Vice President, The Invesco Funds (other than AIM Treasurer’s Series Trust (Invesco Treasurer’s Series Trust) and Short-Term Investments Trust); President and Principal Executive Officer, The Invesco Funds (AIM Treasurer’s Series Trust (Invesco Treasurer’s Series Trust) and Short-Term Investments Trust only). | N/A | N/A | ||||
| Formerly: Senior Vice President, Van Kampen Investments Inc.; Vice President, Invesco Advisers, Inc. (formerly known as Invesco Institutional (N.A.), Inc.); Director of Cash Management and Senior Vice President, Invesco Advisers, Inc. and Invesco Aim Capital Management, Inc.; President and Principal Executive Officer, Tax-Free Investments Trust; Director and President, Fund Management Company; Chief Cash Management Officer, Director of Cash Management, Senior Vice President, and Managing Director, Invesco Aim Capital Management, Inc.; Director of Cash Management, Senior Vice President, and Vice President, Invesco Advisers, Inc. and The Invesco Funds (AIM Treasurer’s Series Trust (Invesco Treasurer’s Series Trust), Short-Term Investments Trust and Tax-Free Investments Trust only) | ||||||||
|
Number of |
||||||||
|
Funds in |
||||||||
|
Fund Complex |
||||||||
|
Name, Year of
Birth and |
Trustee
and/ |
Principal
Occupation(s) |
Overseen by |
Other
Directorship(s) |
||||
| Position(s) Held with the Trust | or Officer Since | During Past 5 Years | Trustee | Held by Trustee | ||||
|
Other
Officers—(continued)
|
||||||||
|
Lance A. Rejsek — 1967
Anti-Money Laundering Compliance Officer |
2005 | Anti-Money Laundering Compliance Officer, Invesco Advisers, Inc. (formerly known as Invesco Institutional (N.A.), Inc.) (registered investment adviser); Invesco Distributors, Inc. (formerly known as Invesco Aim Distributors, Inc.), Invesco Investment Services, Inc. (formerly known as Invesco Aim Investment Services, Inc.), The Invesco Funds, PowerShares Exchange-Traded Fund Trust, PowerShares Exchange-Traded Fund Trust II, PowerShares India Exchange-Traded Fund Trust, PowerShares Actively Managed Exchange-Traded Fund Trust, Invesco Investment Advisers LLC (formerly known as Van Kampen Asset Management) and Van Kampen Funds Inc. | N/A | N/A | ||||
| Formerly: Anti-Money Laundering Compliance Officer, Van Kampen Investor Services Inc., Fund Management Company, Invesco Advisers, Inc., Invesco Aim Capital Management, Inc. and Invesco Aim Private Asset Management, Inc. | ||||||||
|
Todd L. Spillane — 1958
Chief Compliance Officer |
2006 | Senior Vice President, Invesco Management Group, Inc. (formerly known as Invesco Aim Management Group, Inc.) and Van Kampen Exchange Corp.; Senior Vice President and Chief Compliance Officer, Invesco Advisers, Inc. (registered investment adviser) (formerly known as Invesco Institutional (N.A.), Inc.); Chief Compliance Officer, The Invesco Funds, PowerShares Exchange-Traded Fund Trust, PowerShares Exchange-Traded Fund Trust II, PowerShares India Exchange-Traded Fund Trust, PowerShares Actively Managed Exchange-Traded Fund Trust, INVESCO Private Capital Investments, Inc. (holding company) and Invesco Private Capital, Inc. (registered investment adviser); Vice President, Invesco Distributors, Inc. (formerly known as Invesco Aim Distributors, Inc.) and Invesco Investment Services, Inc. (formerly known as Invesco Aim Investment Services, Inc.). | N/A | N/A | ||||
| Formerly: Chief Compliance Officer, Invesco Van Kampen Closed-End Funds; Senior Vice President, Van Kampen Investments Inc.; Senior Vice President and Chief Compliance Officer, Invesco Advisers, Inc. and Invesco Aim Capital Management, Inc.; Chief Compliance Officer, Invesco Global Asset Management (N.A.), Inc., Invesco Senior Secured Management, Inc. (registered investment adviser) and Van Kampen Investor Services Inc.; Vice President, Invesco Aim Capital Management, Inc. and Fund Management Company | ||||||||
|
Office of the Fund 11 Greenway Plaza, Suite 2500 Houston, TX 77046-1173 |
Investment Adviser Invesco Advisers, Inc. 1555 Peachtree Street, N.E. Atlanta, GA 30309 |
Distributor Invesco Distributors, Inc. 11 Greenway Plaza, Suite 2500 Houston, TX 77046-1173 |
Auditors PricewaterhouseCoopers LLP 1201 Louisiana Street, Suite 2900 Houston, TX 77002-5678 |
|||
|
Counsel to the Fund Stradley Ronon Stevens & Young, LLP 2600 One Commerce Square Philadelphia, PA 19103 |
Counsel to the Independent Trustees Kramer, Levin, Naftalis & Frankel LLP 1177 Avenue of the Americas New York, NY 10036-2714 |
Transfer Agent Invesco Investment Services, Inc. 11 Greenway Plaza, Suite 2500 Houston, TX 77046-1173 |
Custodian State Street Bank and Trust Company 225 Franklin Boston, MA 02110-2801 |


| DDI-AR-1 | Invesco Distributors, Inc. |
 |
| Annual Report to Shareholders | October 31, 2011 |
A: ASMMX § B: BSMMX § C: CSMMX § P: SMMIX § S: SMMSX § Y: ASMYX
Institutional: SMITX
2 |
Letters to Shareholders | |
4 |
Performance Summary | |
4 |
Management Discussion | |
6 |
Long-Term Fund Performance | |
8 |
Supplemental Information | |
9 |
Schedule of Investments | |
12 |
Financial Statements | |
14 |
Notes to Financial Statements | |
21 |
Financial Highlights | |
22 |
Auditor’s Report | |
23 |
Fund Expenses | |
24 |
Approval of Investment Advisory and Sub-Advisory Agreements | |
26 |
Tax Information | |
T-1 |
Trustees and Officers | |

Philip Taylor

Senior Managing Director, Invesco Ltd.

Bruce Crockett

Independent Chair
Invesco Funds Board of Trustees
Class A Shares |
4.25 | % | ||
Class B Shares |
3.40 | |||
Class C Shares |
3.50 | |||
Class P Shares |
4.46 | |||
Class S Shares |
4.36 | |||
Class Y Shares |
4.48 | |||
Institutional Class Shares |
4.54 | |||
S&P 500 Index▼ (Broad Market Index) |
8.07 | |||
Russell 1000 Growth Index▼ (Style-Specific Index) |
9.92 | |||
Lipper Multi-Cap Growth Funds Index▼ (Peer Group Index) |
7.28 | |||
| n | Deteriorating fundamental business prospects. | |
| n | Negative changes to the investment thesis. | |
| n | Finding a more attractive opportunity. |
Information Technology |
29.1 | % | ||
Consumer Discretionary |
18.0 | |||
Health Care |
13.0 | |||
Industrials |
13.0 | |||
Energy |
9.0 | |||
Consumer Staples |
6.5 | |||
Financials |
4.4 | |||
Materials |
4.1 | |||
Money Market Funds |
||||
Plus Other Assets Less Liabilities |
2.9 | |||
| 1. | Apple Inc. |
6.4 | % | |||||
| 2. | Google Inc.-Class A |
2.0 | ||||||
| 3. | Amazon.com, Inc. |
1.9 | ||||||
| 4. | Exxon Mobil Corp. |
1.9 | ||||||
| 5. | DIRECTV-Class A |
1.8 | ||||||
| 6. | Rovi Corp. |
1.8 | ||||||
| 7. | EMC Corp. |
1.8 | ||||||
| 8. | WellPoint, Inc. |
1.8 | ||||||
| 9. | Occidental Petroleum Corp. |
1.7 | ||||||
| 10. | Costco Wholesale Corp. |
1.7 | ||||||
| 1. | Computer Hardware |
6.4 | % | |||||
| 2. | Systems Software |
4.9 | ||||||
| 3. | Oil & Gas Equipment & Services |
4.3 | ||||||
| 4. | Integrated Oil & Gas |
3.6 | ||||||
| 5. | Data Processing & Outsourced Services |
3.3 | ||||||
Total Net Assets |
$1.6 billion | |||
Total Number of Holdings* |
96 | |||

Chartered Financial Analyst, portfolio manager, is manager of Invesco Summit Fund. He joined Invesco in 1996.
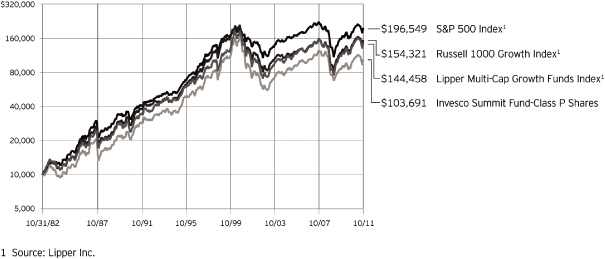
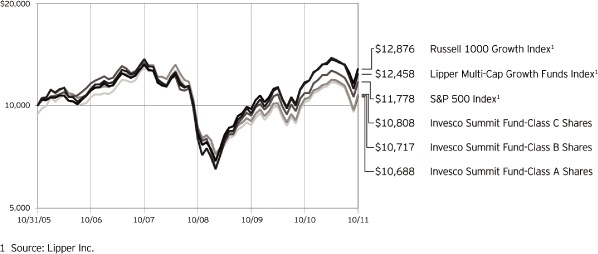
| Class A Shares | ||||||||
| Inception (10/31/05) | 1.11 | % | ||||||
| 5 | Years |
-0.97 | ||||||
| 1 | Year |
-1.52 | ||||||
| Class B Shares | ||||||||
| Inception (10/31/05) | 1.16 | % | ||||||
| 5 | Years |
-0.95 | ||||||
| 1 | Year |
-1.60 | ||||||
| Class C Shares | ||||||||
| Inception (10/31/05) | 1.30 | % | ||||||
| 5 | Years |
-0.59 | ||||||
| 1 | Year |
2.50 | ||||||
| Class P Shares | ||||||||
| Inception (11/1/82) | 8.40 | % | ||||||
| 10 | Years |
3.36 | ||||||
| 5 | Years |
0.31 | ||||||
| 1 | Year |
4.46 | ||||||
| Class S Shares | ||||||||
| Inception | 2.12 | % | ||||||
| 5 | Years |
0.21 | ||||||
| 1 | Year |
4.36 | ||||||
| Class Y Shares | ||||||||
| Inception | 2.19 | % | ||||||
| 5 | Years |
0.29 | ||||||
| 1 | Year |
4.48 | ||||||
| Institutional Class Shares | ||||||||
| Inception | 2.27 | % | ||||||
| 5 | Years |
0.39 | ||||||
| 1 | Year |
4.54 | ||||||
| Class A Shares | ||||||||
| Inception (10/31/05) | -0.73 | % | ||||||
| 5 | Years |
-2.34 | ||||||
| 1 | Year |
-7.24 | ||||||
| Class B Shares | ||||||||
| Inception (10/31/05) | -0.67 | % | ||||||
| 5 | Years |
-2.31 | ||||||
| 1 | Year |
-7.48 | ||||||
| Class C Shares | ||||||||
| Inception (10/31/05) | -0.53 | % | ||||||
| 5 | Years |
-1.97 | ||||||
| 1 | Year |
-3.58 | ||||||
| Class P Shares | ||||||||
| Inception (11/1/82) | 8.01 | % | ||||||
| 10 | Years |
2.78 | ||||||
| 5 | Years |
-1.07 | ||||||
| 1 | Year |
-1.65 | ||||||
| Class S Shares | ||||||||
| Inception | 0.28 | % | ||||||
| 5 | Years |
-1.17 | ||||||
| 1 | Year |
-1.77 | ||||||
| Class Y Shares | ||||||||
| Inception | 0.34 | % | ||||||
| 5 | Years |
-1.09 | ||||||
| 1 | Year |
-1.56 | ||||||
| Institutional Class Shares | ||||||||
| Inception | 0.42 | % | ||||||
| 5 | Years |
-1.01 | ||||||
| 1 | Year |
-1.60 | ||||||
| n | Unless otherwise stated, information presented in this report is as of October 31, 2011, and is based on total net assets. | |
| n | Unless otherwise noted, all data provided by Invesco. | |
| n | To access your Fund’s reports/prospectus, visit invesco.com/fundreports. |
| n | Class B shares may not be purchased or acquired by exchange from share classes other than Class B shares. Please see the prospectus for more information. | |
| n | Class P shares are closed to most investors. For more information on who may continue to invest in Class P shares, please see the Fund’s prospectus. | |
| n | Class S shares are closed to most investors. See the prospectus for more information. | |
| n | Class Y shares are available to only certain investors. Please see the prospectus for more information. | |
| n | Institutional Class shares are offered exclusively to institutional investors, including defined contribution plans that meet certain criteria. Please see the prospectus for more information. |
| n | Developing markets risk. Securities issued by foreign companies and governments located in developing countries may be affected more negatively by inflation, devaluation of their currencies, higher transaction costs, delays in settlement, adverse political developments, the introduction of capital controls, withholding taxes, nationalization of private assets, expropriation, social unrest, war or lack of timely information than those in developed countries. | |
| n | Foreign securities risk. The Fund’s foreign investments may be affected by changes in a foreign country’s exchange rates; political and social instability; changes in economic or taxation policies; difficulties when enforcing obligations; decreased liquidity; and increased volatility. Foreign companies may be subject to less regulation resulting in less publicly available information about the companies. |
| n | Growth investing risk. Growth stocks tend to be more expensive relative to their earnings or assets compared with other types of stock. As a result they tend to be more sensitive to changes in their earnings and can be more volatile. | |
| n | Management risk. The investment techniques and risk analysis used by the Fund’s portfolio managers may not produce the desired results. | |
| n | Market risk. The prices of and the income generated by the Fund’s securities may decline in response to, among other things, investor sentiment; general economic and market conditions; regional or global instability; and currency and interest rate fluctuations. |
| n | The S&P 500® Index is an unmanaged index considered representative of the U.S. stock market. | |
| n | The Russell 1000® Growth Index is an unmanaged index considered representative of large-cap growth stocks. The Russell 1000 Growth Index is a trademark/service mark of the Frank Russell Co. Russell® is a trademark of the Frank Russell Co. | |
| n | The Lipper Multi-Cap Growth Funds Index is an unmanaged index considered representative of multi-cap growth funds tracked by Lipper. | |
| n | The Fund is not managed to track the performance of any particular index, including the index(es) defined here, and consequently, the performance of the Fund may deviate significantly from the performance of the index(es). | |
| n | A direct investment cannot be made in an index. Unless otherwise indicated, index results include reinvested dividends, and they do not reflect sales charges. Performance of the peer group, if applicable, reflects fund expenses; performance of a market index does not. |
| n | The Chartered Financial Analyst® (CFA®) designation is globally recognized and attests to a charterholder’s success in a rigorous and comprehensive study program in the field of investment management and research analysis. | |
| n | The returns shown in management’s discussion of Fund performance are based on net asset values calculated for shareholder transactions. Generally accepted accounting principles require adjustments to be made to the net assets of the Fund at period end for financial reporting purposes, and as such, the net asset values for shareholder transactions and the returns based on those net asset values may differ from the net asset values and returns reported in the Financial Highlights. | |
| n | Industry classifications used in this report are generally according to the Global Industry Classification Standard, which was developed by and is the exclusive property and a service mark of MSCI Inc. and Standard & Poor’s. |
Class A Shares |
ASMMX | |||
Class B Shares |
BSMMX | |||
Class C Shares |
CSMMX | |||
Class P Shares |
SMMIX | |||
Class S Shares |
SMMSX | |||
Class Y Shares |
ASMYX | |||
Institutional Class Shares |
SMITX | |||
| Shares | Value | |||||||
|
Common Stocks & Other Equity Interests–97.10% |
||||||||
|
Aerospace & Defense–2.33% |
||||||||
|
Precision Castparts Corp.
|
130,803 | $ | 21,340,510 | |||||
|
Rockwell Collins, Inc.
|
272,869 | 15,234,276 | ||||||
| 36,574,786 | ||||||||
|
Apparel, Accessories & Luxury Goods–2.04% |
||||||||
|
Coach, Inc.
|
381,934 | 24,852,445 | ||||||
|
Prada S.p.A.
(Italy)(b)(c)
|
1,487,500 | 7,160,767 | ||||||
| 32,013,212 | ||||||||
|
Asset Management & Custody Banks–0.96% |
||||||||
|
Affiliated Managers Group,
Inc.(b)
|
89,325 | 8,272,388 | ||||||
|
Ameriprise Financial, Inc.
|
145,666 | 6,799,689 | ||||||
| 15,072,077 | ||||||||
|
Auto Parts & Equipment–1.33% |
||||||||
|
Autoliv, Inc. (Sweden)
|
81,446 | 4,705,135 | ||||||
|
Johnson Controls, Inc.
|
227,312 | 7,485,384 | ||||||
|
Tenneco
Inc.(b)
|
264,734 | 8,662,097 | ||||||
| 20,852,616 | ||||||||
|
Automobile Manufacturers–0.45% |
||||||||
|
Honda Motor Co., Ltd. (Japan)
|
236,600 | 7,131,502 | ||||||
|
Biotechnology–2.97% |
||||||||
|
Acorda Therapeutics
Inc.(b)
|
433,098 | 9,458,860 | ||||||
|
Amgen Inc.
|
226,832 | 12,990,669 | ||||||
|
Gilead Sciences,
Inc.(b)
|
580,912 | 24,200,794 | ||||||
| 46,650,323 | ||||||||
|
Broadcasting–1.27% |
||||||||
|
Scripps Networks Interactive, Inc.–Class A
|
468,537 | 19,903,452 | ||||||
|
Cable & Satellite–3.20% |
||||||||
|
Comcast Corp.–Class A
|
918,685 | 21,543,163 | ||||||
|
DIRECTV–Class A(b)
|
633,331 | 28,791,227 | ||||||
| 50,334,390 | ||||||||
|
Communications Equipment–2.58% |
||||||||
|
F5 Networks,
Inc.(b)
|
149,893 | 15,581,377 | ||||||
|
QUALCOMM, Inc.
|
482,275 | 24,885,390 | ||||||
| 40,466,767 | ||||||||
|
Computer Hardware–6.37% |
||||||||
|
Apple
Inc.(b)
|
247,337 | 100,117,071 | ||||||
|
Computer Storage & Peripherals–1.80% |
||||||||
|
EMC
Corp.(b)
|
1,152,238 | 28,241,353 | ||||||
|
Construction & Engineering–1.14% |
||||||||
|
Fluor Corp.
|
91,001 | 5,173,407 | ||||||
|
Foster Wheeler AG
(Switzerland)(b)
|
600,497 | 12,802,596 | ||||||
| 17,976,003 | ||||||||
|
Construction & Farm Machinery & Heavy Trucks–2.82% |
||||||||
|
AGCO
Corp.(b)
|
289,896 | 12,706,142 | ||||||
|
Cummins Inc.
|
107,649 | 10,703,540 | ||||||
|
Navistar International
Corp.(b)
|
414,448 | 17,435,827 | ||||||
|
Terex
Corp.(b)(d)
|
210,908 | 3,509,509 | ||||||
| 44,355,018 | ||||||||
|
Consumer Finance–0.55% |
||||||||
|
American Express Co.
|
172,103 | 8,711,854 | ||||||
|
Data Processing & Outsourced Services–3.26% |
||||||||
|
Genpact Ltd.
(Bermuda)(b)
|
794,944 | 12,838,346 | ||||||
|
MasterCard, Inc.–Class A
|
36,696 | 12,742,319 | ||||||
|
Visa Inc.–Class A
|
275,378 | 25,681,752 | ||||||
| 51,262,417 | ||||||||
|
Department Stores–2.06% |
||||||||
|
Kohl’s Corp.
|
324,485 | 17,200,950 | ||||||
|
Macy’s, Inc.
|
494,456 | 15,095,742 | ||||||
| 32,296,692 | ||||||||
|
Diversified Banks–0.88% |
||||||||
|
Banco Bradesco S.A.–ADR
(Brazil)(d)
|
533,233 | 9,704,841 | ||||||
|
Comerica Inc.
|
159,977 | 4,087,412 | ||||||
| 13,792,253 | ||||||||
|
Electrical Components & Equipment–0.97% |
||||||||
|
Cooper Industries PLC (Ireland)
|
290,302 | 15,229,243 | ||||||
|
Electronic Components–0.99% |
||||||||
|
Amphenol Corp.–Class A
|
328,947 | 15,621,693 | ||||||
|
Fertilizers & Agricultural Chemicals–2.10% |
||||||||
|
Monsanto Co.
|
247,404 | 17,998,641 | ||||||
|
Mosaic Co. (The)
|
256,704 | 15,032,586 | ||||||
| 33,031,227 | ||||||||
|
Food Retail–1.16% |
||||||||
|
Kroger Co. (The)
|
784,042 | 18,174,094 | ||||||
|
Footwear–1.42% |
||||||||
|
Deckers Outdoor
Corp.(b)
|
193,255 | 22,270,706 | ||||||
|
Gold–1.00% |
||||||||
|
Goldcorp, Inc. (Canada)
|
320,468 | 15,651,657 | ||||||
| Shares | Value | |||||||
|
Health Care Distributors–0.45% |
||||||||
|
Owens & Minor, Inc.
|
238,993 | $ | 7,150,671 | |||||
|
Health Care Services–1.85% |
||||||||
|
Express Scripts,
Inc.(b)
|
482,269 | 22,054,162 | ||||||
|
Medco Health Solutions,
Inc.(b)
|
128,691 | 7,059,988 | ||||||
| 29,114,150 | ||||||||
|
Health Care Technology–0.82% |
||||||||
|
Allscripts Healthcare Solutions,
Inc.(b)
|
677,128 | 12,967,001 | ||||||
|
Heavy Electrical Equipment–0.82% |
||||||||
|
ABB Ltd. (Switzerland)
|
680,007 | 12,821,471 | ||||||
|
Home Improvement Retail–1.11% |
||||||||
|
Home Depot, Inc. (The)
|
485,895 | 17,395,041 | ||||||
|
Homefurnishing Retail–1.65% |
||||||||
|
Bed Bath & Beyond
Inc.(b)
|
419,039 | 25,913,372 | ||||||
|
Hotels, Resorts & Cruise Lines–0.86% |
||||||||
|
Royal Caribbean Cruises Ltd.
|
456,760 | 13,574,907 | ||||||
|
Household Products–0.55% |
||||||||
|
Procter & Gamble Co. (The)
|
135,826 | 8,691,506 | ||||||
|
Human Resource & Employment Services–0.60% |
||||||||
|
Robert Half International, Inc.
|
354,644 | 9,373,241 | ||||||
|
Hypermarkets & Super Centers–1.70% |
||||||||
|
Costco Wholesale Corp.
|
320,088 | 26,647,326 | ||||||
|
Industrial Conglomerates–0.54% |
||||||||
|
Danaher Corp.
|
176,467 | 8,532,179 | ||||||
|
Industrial Gases–0.68% |
||||||||
|
Praxair, Inc.
|
105,435 | 10,719,576 | ||||||
|
Industrial Machinery–1.16% |
||||||||
|
Ingersoll-Rand PLC (Ireland)
|
586,474 | 18,256,936 | ||||||
|
Integrated Oil & Gas–3.57% |
||||||||
|
Exxon Mobil Corp.
|
372,440 | 29,083,839 | ||||||
|
Occidental Petroleum Corp.
|
291,122 | 27,056,879 | ||||||
| 56,140,718 | ||||||||
|
Internet Retail–1.91% |
||||||||
|
Amazon.com,
Inc.(b)
|
140,350 | 29,966,128 | ||||||
|
Internet Software & Services–3.09% |
||||||||
|
eBay
Inc.(b)
|
300,115 | 9,552,661 | ||||||
|
Google
Inc.–Class A(b)
|
52,321 | 31,007,517 | ||||||
|
VeriSign, Inc.
|
250,118 | 8,026,287 | ||||||
| 48,586,465 | ||||||||
|
Investment Banking & Brokerage–0.91% |
||||||||
|
Goldman Sachs Group, Inc. (The)
|
82,640 | 9,053,212 | ||||||
|
Jefferies Group, Inc.
|
400,000 | 5,304,000 | ||||||
| 14,357,212 | ||||||||
|
IT Consulting & Other Services–1.75% |
||||||||
|
Accenture PLC–Class A (Ireland)
|
310,023 | 18,681,986 | ||||||
|
Cognizant Technology Solutions
Corp.–Class A(b)
|
121,639 | 8,849,237 | ||||||
| 27,531,223 | ||||||||
|
Life Sciences Tools & Services–0.83% |
||||||||
|
Agilent Technologies,
Inc.(b)
|
352,547 | 13,068,917 | ||||||
|
Managed Health Care–3.06% |
||||||||
|
UnitedHealth Group Inc.
|
413,638 | 19,850,488 | ||||||
|
WellPoint, Inc.
|
409,324 | 28,202,423 | ||||||
| 48,052,911 | ||||||||
|
Oil & Gas Drilling–0.49% |
||||||||
|
Ensco PLC–ADR (United Kingdom)
|
154,360 | 7,665,518 | ||||||
|
Oil & Gas Equipment & Services–4.34% |
||||||||
|
Cameron International
Corp.(b)
|
357,304 | 17,557,918 | ||||||
|
Halliburton Co.
|
293,213 | 10,954,438 | ||||||
|
Schlumberger Ltd.
|
314,593 | 23,113,148 | ||||||
|
Superior Energy Services,
Inc.(b)
|
586,767 | 16,499,888 | ||||||
| 68,125,392 | ||||||||
|
Oil & Gas Exploration & Production–0.59% |
||||||||
|
Apache Corp.
|
93,812 | 9,346,490 | ||||||
|
Other Diversified Financial Services–1.09% |
||||||||
|
JPMorgan Chase & Co.
|
490,710 | 17,057,080 | ||||||
|
Packaged Foods & Meats–0.49% |
||||||||
|
Green Mountain Coffee Roasters,
Inc.(b)
|
117,641 | 7,649,018 | ||||||
|
Pharmaceuticals–3.02% |
||||||||
|
Abbott Laboratories
|
261,563 | 14,090,399 | ||||||
|
Medicis Pharmaceutical Corp.–Class A
|
228,000 | 8,730,120 | ||||||
|
Pfizer Inc.
|
953,162 | 18,357,900 | ||||||
|
Shire PLC (United Kingdom)
|
199,368 | 6,254,200 | ||||||
| 47,432,619 | ||||||||
|
Railroads–1.12% |
||||||||
|
Union Pacific Corp.
|
176,457 | 17,569,823 | ||||||
|
Semiconductor Equipment–1.04% |
||||||||
|
Novellus Systems,
Inc.(b)
|
472,126 | 16,311,953 | ||||||
|
Semiconductors–2.04% |
||||||||
|
Broadcom Corp.–Class A
|
466,470 | 16,834,902 | ||||||
|
Micron Technology,
Inc.(b)
|
1,386,823 | 7,752,341 | ||||||
|
Xilinx, Inc.
|
222,617 | 7,448,765 | ||||||
| 32,036,008 | ||||||||
| Shares | Value | |||||||
|
Soft Drinks–2.61% |
||||||||
|
Coca-Cola
Co. (The)
|
206,169 | $ | 14,085,466 | |||||
|
Hansen Natural
Corp.(b)
|
64,627 | 5,757,619 | ||||||
|
PepsiCo, Inc.
|
336,390 | 21,175,751 | ||||||
| 41,018,836 | ||||||||
|
Specialty Chemicals–0.29% |
||||||||
|
Rockwood Holdings
Inc.(b)
|
100,329 | 4,619,147 | ||||||
|
Specialty Stores–0.75% |
||||||||
|
Vitamin Shoppe,
Inc.(b)
|
311,740 | 11,755,715 | ||||||
|
Systems Software–4.93% |
||||||||
|
Check Point Software Technologies Ltd.
(Israel)(b)
|
447,775 | 25,805,273 | ||||||
|
Oracle Corp.
|
704,192 | 23,076,372 | ||||||
|
Rovi
Corp.(b)
|
576,919 | 28,580,567 | ||||||
| 77,462,212 | ||||||||
|
Technology Distributors–1.21% |
||||||||
|
Avnet,
Inc.(b)
|
625,706 | 18,965,149 | ||||||
|
Trading Companies & Distributors–0.48% |
||||||||
|
Air Lease
Corp.(b)(d)
|
334,584 | 7,471,261 | ||||||
|
Trucking–1.05% |
||||||||
|
J.B. Hunt Transport Services, Inc.
|
390,453 | 16,520,066 | ||||||
|
Total Common Stocks & Other Equity Interests
(Cost $1,300,298,557)
|
1,525,597,644 | |||||||
|
Money Market Funds–2.94% |
||||||||
|
Liquid Assets Portfolio–Institutional
Class(e)
|
23,077,781 | 23,077,781 | ||||||
|
Premier Portfolio–Institutional
Class(e)
|
23,077,781 | 23,077,781 | ||||||
|
Total Money Market Funds (Cost $46,155,562)
|
46,155,562 | |||||||
|
TOTAL INVESTMENTS (excluding investments purchased with cash
collateral from securities on loan)–100.04%
(Cost $1,346,454,119)
|
1,571,753,206 | |||||||
|
Investments Purchased with Cash Collateral from Securities on Loan |
||||||||
|
Money Market Funds–0.80% |
||||||||
|
Liquid Assets Portfolio–Institutional Class
(Cost $12,621,112)(e)(f)
|
12,621,112 | 12,621,112 | ||||||
|
TOTAL INVESTMENTS–100.84% (Cost $1,359,075,231)
|
1,584,374,318 | |||||||
|
OTHER ASSETS LESS LIABILITIES–(0.84)%
|
(13,211,633 | ) | ||||||
|
NET ASSETS–100.00%
|
$ | 1,571,162,685 | ||||||
|
ADR
|
– American Depositary Receipt |
| (a) | Industry and/or sector classifications used in this report are generally according to the Global Industry Classification Standard, which was developed by and is the exclusive property and a service mark of MSCI Inc. and Standard & Poor’s. | |
| (b) | Non-income producing security. | |
| (c) | Security purchased or received in a transaction exempt from registration under the Securities Act of 1933, as amended. The security may be resold pursuant to an exemption from registration under the 1933 Act, typically to qualified institutional buyers. The value of this security at October 31, 2011 represented less than 1% of the Fund’s Net Assets. | |
| (d) | All or a portion of this security was out on loan at October 31, 2011. | |
| (e) | The money market fund and the Fund are affiliated by having the same investment adviser. | |
| (f) | The security has been segregated to satisfy the commitment to return the cash collateral received in securities lending transactions upon the borrower’s return of the securities loaned. See Note 1I. |
|
Assets: |
||||
|
Investments, at value (Cost $1,300,298,557)*
|
$ | 1,525,597,644 | ||
|
Investments in affiliated money market funds, at value and cost
|
58,776,674 | |||
|
Total investments, at value (Cost $1,359,075,231)
|
1,584,374,318 | |||
|
Receivable for:
|
||||
|
Investments sold
|
2,169,746 | |||
|
Fund shares sold
|
23,849 | |||
|
Dividends
|
580,400 | |||
|
Investment for trustee deferred compensation and retirement plans
|
97,337 | |||
|
Other assets
|
49,703 | |||
|
Total assets
|
1,587,295,353 | |||
|
Liabilities: |
||||
|
Payable for:
|
||||
|
Investments purchased
|
1,862,836 | |||
|
Fund shares reacquired
|
800,091 | |||
|
Collateral upon return of securities loaned
|
12,621,112 | |||
|
Accrued fees to affiliates
|
387,435 | |||
|
Accrued other operating expenses
|
122,312 | |||
|
Trustee deferred compensation and retirement plans
|
338,882 | |||
|
Total liabilities
|
16,132,668 | |||
|
Net assets applicable to shares outstanding
|
$ | 1,571,162,685 | ||
|
Net assets consist of: |
||||
|
Shares of beneficial interest
|
$ | 1,558,828,110 | ||
|
Undistributed net investment income
|
2,041,670 | |||
|
Undistributed net realized gain (loss)
|
(215,005,413 | ) | ||
|
Unrealized appreciation
|
225,298,318 | |||
| $ | 1,571,162,685 | |||
|
Net Assets: |
||||
|
Class A
|
$ | 17,762,564 | ||
|
Class B
|
$ | 1,085,326 | ||
|
Class C
|
$ | 1,968,189 | ||
|
Class P
|
$ | 1,545,006,050 | ||
|
Class S
|
$ | 4,077,999 | ||
|
Class Y
|
$ | 1,186,011 | ||
|
Institutional Class
|
$ | 76,546 | ||
|
Shares outstanding, $0.001 par value per share, with an unlimited number of shares authorized: |
||||
|
Class A
|
1,537,107 | |||
|
Class B
|
96,537 | |||
|
Class C
|
175,303 | |||
|
Class P
|
132,891,122 | |||
|
Class S
|
352,181 | |||
|
Class Y
|
102,381 | |||
|
Institutional Class
|
6,598 | |||
|
Class A:
|
||||
|
Net asset value per share
|
$ | 11.56 | ||
|
Maximum offering price per share
|
||||
|
(Net asset value of $11.56 divided by 94.50%)
|
$ | 12.23 | ||
|
Class B:
|
||||
|
Net asset value and offering price per share
|
$ | 11.24 | ||
|
Class C:
|
||||
|
Net asset value and offering price per share
|
$ | 11.23 | ||
|
Class P:
|
||||
|
Net asset value and offering price per share
|
$ | 11.63 | ||
|
Class S:
|
||||
|
Net asset value and offering price per share
|
$ | 11.58 | ||
|
Class Y:
|
||||
|
Net asset value and offering price per share
|
$ | 11.58 | ||
|
Institutional Class:
|
||||
|
Net asset value and offering price per share
|
$ | 11.60 | ||
| * | At October 31, 2011, securities with an aggregate value of $11,875,577 were on loan to brokers. |
|
Investment income: |
||||
|
Dividends (net of foreign withholding taxes of $77,379)
|
$ | 17,883,231 | ||
|
Dividends from affiliated money market funds (includes
securities lending income of $56,303)
|
131,070 | |||
|
Total investment income
|
18,014,301 | |||
|
Expenses: |
||||
|
Advisory fees
|
10,861,013 | |||
|
Administrative services fees
|
431,489 | |||
|
Custodian fees
|
41,122 | |||
|
Distribution fees:
|
||||
|
Class A
|
51,286 | |||
|
Class B
|
13,664 | |||
|
Class C
|
22,609 | |||
|
Class P
|
1,673,879 | |||
|
Class S
|
6,565 | |||
|
Transfer agent fees — A, B, C, P, S and Y
|
2,326,236 | |||
|
Transfer agent fees — Institutional
|
14 | |||
|
Trustees’ and officers’ fees and benefits
|
70,271 | |||
|
Other
|
227,390 | |||
|
Total expenses
|
15,725,538 | |||
|
Less: Fees waived, expenses reimbursed and expense offset
arrangement(s)
|
(125,730 | ) | ||
|
Net expenses
|
15,599,808 | |||
|
Net investment income
|
2,414,493 | |||
|
Realized and unrealized gain (loss) from: |
||||
|
Net realized gain (loss) from:
|
||||
|
Investment securities (includes net gains from securities sold
to affiliates of $3,588,989)
|
168,304,452 | |||
|
Foreign currencies
|
(35,486 | ) | ||
| 168,268,966 | ||||
|
Change in net unrealized appreciation (depreciation) of:
|
||||
|
Investment securities
|
(90,415,441 | ) | ||
|
Foreign currencies
|
(4,584 | ) | ||
| (90,420,025 | ) | |||
|
Net realized and unrealized gain
|
77,848,941 | |||
|
Net increase in net assets resulting from operations
|
$ | 80,263,434 | ||
| 2011 | 2010 | |||||||
|
Operations: |
||||||||
|
Net investment income
|
$ | 2,414,493 | $ | 2,421,042 | ||||
|
Net realized gain
|
168,268,966 | 98,587,424 | ||||||
|
Change in net unrealized appreciation (depreciation)
|
(90,420,025 | ) | 159,755,416 | |||||
|
Net increase in net assets resulting from operations
|
80,263,434 | 260,763,882 | ||||||
|
Distributions to shareholders from net investment income: |
||||||||
|
Class A
|
(3,313 | ) | (169,408 | ) | ||||
|
Class P
|
(2,510,910 | ) | (11,744,584 | ) | ||||
|
Class S
|
(5,625 | ) | (12,656 | ) | ||||
|
Class Y
|
(3,614 | ) | (20,529 | ) | ||||
|
Institutional Class
|
(45 | ) | (117,708 | ) | ||||
|
Total distributions from net investment income
|
(2,523,507 | ) | (12,064,885 | ) | ||||
|
Share transactions–net: |
||||||||
|
Class A
|
(5,212,938 | ) | (6,314,941 | ) | ||||
|
Class B
|
(443,494 | ) | (755,275 | ) | ||||
|
Class C
|
(566,763 | ) | (1,127,062 | ) | ||||
|
Class P
|
(194,783,601 | ) | (152,187,927 | ) | ||||
|
Class S
|
(350,730 | ) | 3,565,301 | |||||
|
Class Y
|
(314,455 | ) | (1,026,239 | ) | ||||
|
Institutional Class
|
60,364 | (12,441,890 | ) | |||||
|
Net increase (decrease) in net assets resulting from share
transactions
|
(201,611,617 | ) | (170,288,033 | ) | ||||
|
Net increase (decrease) in net assets
|
(123,871,690 | ) | 78,410,964 | |||||
|
Net assets: |
||||||||
|
Beginning of year
|
1,695,034,375 | 1,616,623,411 | ||||||
|
End of year (includes undistributed net investment income of
$2,041,670 and $2,186,171, respectively)
|
$ | 1,571,162,685 | $ | 1,695,034,375 | ||||
| A. | Security Valuations — Securities, including restricted securities, are valued according to the following policy. | |
| A security listed or traded on an exchange (except convertible bonds) is valued at its last sales price or official closing price as of the close of the customary trading session on the exchange where the security is principally traded, or lacking any sales or official closing price on a particular day, the security may be valued at the closing bid price on that day. Securities traded in the over-the-counter market are valued based on prices furnished by independent pricing services or market makers. When such securities are valued by an independent pricing service they may be considered fair valued. Futures contracts are valued at the final settlement price set by an exchange on which they are principally traded. Listed options are valued at the mean between the last bid and ask prices from the exchange on which they are principally traded. Options not listed on an exchange are valued by an independent source at the mean between the last bid and ask prices. For purposes of determining net asset value per share, futures and option contracts generally are valued 15 minutes after the close of the customary trading session of the New York Stock Exchange (“NYSE”). | ||
| Investments in open-end and closed-end registered investment companies that do not trade on an exchange are valued at the end of day net asset value per share. Investments in open-end and closed-end registered investment companies that trade on an exchange are valued at the last sales price or official closing price as of the close of the customary trading session on the exchange where the security is principally traded. | ||
| Debt obligations (including convertible bonds) and unlisted equities are fair valued using an evaluated quote provided by an independent pricing service. Evaluated quotes provided by the pricing service may be determined without exclusive reliance on quoted prices, and may reflect appropriate factors such as institution-size trading in similar groups of securities, developments related to specific securities, dividend rate, yield, quality, type of issue, coupon rate, maturity, individual trading characteristics and other market data. Debt securities are subject to interest rate and credit risks. In addition, all debt securities involve some risk of default with respect to interest and/or principal payments. | ||
| Foreign securities (including foreign exchange contracts) are converted into U.S. dollar amounts using the applicable exchange rates as of the close of the NYSE. If market quotations are available and reliable for foreign exchange traded equity securities, the securities will be valued at the market quotations. Because trading hours for certain foreign securities end before the close of the NYSE, closing market quotations may become unreliable. If between the time trading ends on a particular security and the close of the customary trading session on the NYSE, events occur that are significant and make the closing price unreliable, the Fund may fair value the security. If the event is likely to have affected the closing price of the security, the security will be valued at fair value in good faith using procedures approved by the Board of Trustees. Adjustments to closing prices to reflect fair value may also be based on a screening process of an independent pricing service to indicate the degree of certainty, based on historical data, that the closing price in the principal market where a foreign security trade is not the current value as of the close of the NYSE. Foreign securities meeting the approved degree of certainty that the price is not reflective of current value will be priced at the indication of fair value from the independent pricing service. Multiple factors may be considered by the independent pricing service in determining adjustments to reflect fair value and may include information relating to sector indices, American Depositary Receipts and domestic and foreign index futures. Foreign securities may have additional risks including exchange rate changes, potential for sharply devalued currencies and high inflation, political and economical upheaval, the relative lack of issuer information, relatively low market liquidity and the potential lack of strict financial and accounting controls and standards. | ||
| Securities for which market prices are not provided by any of the above methods may be valued based upon quotes furnished by independent sources. The last bid price may be used to value equity securities. The mean between the last bid and asked prices is used to value debt obligations, including Corporate Loans. | ||
| Securities for which market quotations are not readily available or are unreliable are valued at fair value as determined in good faith by or under the supervision of the Trust’s officers following procedures approved by the Board of Trustees. Issuer specific events, market trends, bid/ask quotes of brokers and information providers and other market data may be reviewed in the course of making a good faith determination of a security’s fair value. | ||
| Valuations change in response to many factors including the historical and prospective earnings of the issuer, the value of the issuer’s assets, general economic conditions, interest rates, investor perceptions and market liquidity. Because of the inherent uncertainties of valuation, the values reflected in the financial statements may materially differ from the value received upon actual sale of those investments. | ||
| B. | Securities Transactions and Investment Income — Securities transactions are accounted for on a trade date basis. Realized gains or losses on sales are computed on the basis of specific identification of the securities sold. Interest income is recorded on the accrual basis from settlement date. Dividend income (net of withholding tax, if any) is recorded on the ex-dividend date. | |
| The Fund may periodically participate in litigation related to Fund investments. As such, the Fund may receive proceeds from litigation settlements. Any proceeds received are included in the Statement of Operations as realized gain (loss) for investments no longer held and as unrealized gain (loss) for investments still held. | ||
| Brokerage commissions and mark ups are considered transaction costs and are recorded as an increase to the cost basis of securities purchased and/or a reduction of proceeds on a sale of securities. Such transaction costs are included in the determination of net realized and unrealized gain (loss) from investment securities reported in the Statement of Operations and the Statement of Changes in Net Assets and the net realized and unrealized gains (losses) on securities per share in the Financial Highlights. Transaction costs are included in the calculation of the Fund’s net asset value and, accordingly, they reduce the Fund’s total returns. These transaction costs are not considered operating expenses and are not reflected in net investment income reported in the Statement of Operations and Statement of Changes in Net Assets, or the net investment income per share and ratios of expenses and net investment income reported in the Financial Highlights, nor are they limited by any expense limitation arrangements between the Fund and the investment adviser. | ||
| The Fund allocates income and realized and unrealized capital gains and losses to a class based on the relative net assets of each class. | ||
| C. | Country Determination — For the purposes of making investment selection decisions and presentation in the Schedule of Investments, the investment adviser may determine the country in which an issuer is located and/or credit risk exposure based on various factors. These factors include the laws of the country under which the issuer is organized, where the issuer maintains a principal office, the country in which the issuer derives 50% or more of its total revenues and the country that has the primary market for the issuer’s securities, as well as other criteria. Among the other criteria that may be evaluated for making this determination are the country in which the issuer maintains 50% or more of its assets, the type of security, financial guarantees |
| and enhancements, the nature of the collateral and the sponsor organization. Country of issuer and/or credit risk exposure has been determined to be the United States of America, unless otherwise noted. | ||
| D. | Distributions — Distributions from income and net realized capital gain, if any, are generally paid annually and recorded on ex-dividend date. The Fund may elect to treat a portion of the proceeds from redemptions as distributions for federal income tax purposes. | |
| E. | Federal Income Taxes — The Fund intends to comply with the requirements of Subchapter M of the Internal Revenue Code necessary to qualify as a regulated investment company and to distribute substantially all of the Fund’s taxable earnings to shareholders. As such, the Fund will not be subject to federal income taxes on otherwise taxable income (including net realized capital gain) that is distributed to shareholders. Therefore, no provision for federal income taxes is recorded in the financial statements. | |
| The Fund files tax returns in the U.S. Federal jurisdiction and certain other jurisdictions. Generally, the Fund is subject to examinations by such taxing authorities for up to three years after the filing of the return for the tax period. | ||
| F. | Expenses — Fees provided for under the Rule 12b-1 plan of a particular class of the Fund are charged to the operations of such class. Transfer agency fees and expenses and other shareholder recordkeeping fees and expenses attributable to the Institutional Class are charged to such class. Transfer agency fees and expenses and other shareholder recordkeeping fees and expenses relating to all other classes are allocated among those classes based on relative net assets. All other expenses are allocated among the classes based on relative net assets. | |
| G. | Accounting Estimates — The preparation of financial statements in conformity with accounting principles generally accepted in the United States of America (“GAAP”) requires management to make estimates and assumptions that affect the reported amounts of assets and liabilities at the date of the financial statements and the reported amounts of revenues and expenses during the reporting period including estimates and assumptions related to taxation. Actual results could differ from those estimates by a significant amount. In addition, the Fund monitors for material events or transactions that may occur or become known after the period-end date and before the date the financial statements are released to print. | |
| H. | Indemnifications — Under the Trust’s organizational documents, each Trustee, officer, employee or other agent of the Trust is indemnified against certain liabilities that may arise out of performance of their duties to the Fund. Additionally, in the normal course of business, the Fund enters into contracts, including the Fund’s servicing agreements that contain a variety of indemnification clauses. The Fund’s maximum exposure under these arrangements is unknown as this would involve future claims that may be made against the Fund that have not yet occurred. The risk of material loss as a result of such indemnification claims is considered remote. | |
| I. | Securities Lending — The Fund may lend portfolio securities having a market value up to one-third of the Fund’s total assets. Such loans are secured by collateral equal to no less than the market value of the loaned securities determined daily by the securities lending provider. Such collateral will be cash or debt securities issued or guaranteed by the U.S. Government or any of its sponsored agencies. Cash collateral received in connection with these loans is invested in short-term money market instruments or affiliated money market funds and is shown as such on the Schedule of Investments. It is the Fund’s policy to obtain additional collateral from or return excess collateral to the borrower by the end of the next business day, following the valuation date of the securities loaned. Therefore, the value of the collateral held may be temporarily less than the value of the securities on loan. Lending securities entails a risk of loss to the Fund if and to the extent that the market value of the securities loaned were to increase and the borrower did not increase the collateral accordingly, and the borrower fails to return the securities. Upon the failure of the borrower to return the securities, collateral may be liquidated and the securities may be purchased on the open market to replace the loaned securities. The Fund could experience delays and costs in gaining access to the collateral. The Fund bears the risk of any deficiency in the amount of the collateral available for return to the borrower due to any loss on the collateral invested. Dividends received on cash collateral investments for securities lending transactions, which are net of compensation to counterparties, is included in Dividends from affiliates on the Statement of Operations. The aggregate value of securities out on loan is shown as a footnote on the Statement of Assets and Liabilities, if any. | |
| J. | Foreign Currency Translations — Foreign currency is valued at the close of the NYSE based on quotations posted by banks and major currency dealers. Portfolio securities and other assets and liabilities denominated in foreign currencies are translated into U.S. dollar amounts at date of valuation. Purchases and sales of portfolio securities (net of foreign taxes withheld on disposition) and income items denominated in foreign currencies are translated into U.S. dollar amounts on the respective dates of such transactions. The Fund does not separately account for the portion of the results of operations resulting from changes in foreign exchange rates on investments and the fluctuations arising from changes in market prices of securities held. The combined results of changes in foreign exchange rates and the fluctuation of market prices on investments (net of estimated foreign tax withholding) are included with the net realized and unrealized gain or loss from investments in the Statement of Operations. Reported net realized foreign currency gains or losses arise from (1) sales of foreign currencies, (2) currency gains or losses realized between the trade and settlement dates on securities transactions, and (3) the difference between the amounts of dividends, interest, and foreign withholding taxes recorded on the Fund’s books and the U.S. dollar equivalent of the amounts actually received or paid. Net unrealized foreign currency gains and losses arise from changes in the fair values of assets and liabilities, other than investments in securities at fiscal period end, resulting from changes in exchange rates. | |
| The Fund may invest in foreign securities which may be subject to foreign taxes on income, gains on investments or currency repatriation, a portion of which may be recoverable. | ||
| K. | Foreign Currency Contracts — The Fund may enter into foreign currency contracts to manage or minimize currency or exchange rate risk. The Fund may also enter into foreign currency contracts for the purchase or sale of a security denominated in a foreign currency in order to “lock in” the U.S. dollar price of that security. A foreign currency contract is an obligation to purchase or sell a specific currency for an agreed-upon price at a future date. The use of foreign currency contracts does not eliminate fluctuations in the price of the underlying securities the Fund owns or intends to acquire but establishes a rate of exchange in advance. Fluctuations in the value of these contracts are measured by the difference in the contract date and reporting date exchange rates and are recorded as unrealized appreciation (depreciation) until the contracts are closed. When the contracts are closed, realized gains (losses) are recorded. Realized and unrealized gains (losses) on the contracts are included in the Statement of Operations. The primary risks associated with foreign currency contracts include failure of the counterparty to meet the terms of the contract and the value of the foreign currency changing unfavorably. These risks may be in excess of the amounts reflected in the Statement of Assets and Liabilities. |
| Average Daily Net Assets | Rate | |||
|
First $10 million
|
1 | .00% | ||
|
Next $140 million
|
0 | .75% | ||
|
Over $150 million
|
0 | .625% | ||
| Level 1 — | Prices are determined using quoted prices in an active market for identical assets. | |
| Level 2 — | Prices are determined using other significant observable inputs. Observable inputs are inputs that other market participants may use in pricing a security. These may include quoted prices for similar securities, interest rates, prepayment speeds, credit risk, yield curves, loss severities, default rates, discount rates, volatilities and others. | |
| Level 3 — | Prices are determined using significant unobservable inputs. In situations where quoted prices or observable inputs are unavailable (for example, when there is little or no market activity for an investment at the end of the period), unobservable inputs may be used. Unobservable inputs reflect the Fund’s own assumptions about the factors market participants would use in determining fair value of the securities or instruments and would be based on the best available information. |
| Level 1 | Level 2 | Level 3 | Total | |||||||||||||
|
Equity Securities
|
$ | 1,557,260,578 | $ | 27,113,740 | $ | — | $ | 1,584,374,318 | ||||||||
| 2011 | 2010 | |||||||
|
Ordinary income
|
$ | 2,523,507 | $ | 12,064,885 | ||||
| 2011 | ||||
|
Undistributed ordinary income
|
$ | 2,368,221 | ||
|
Net unrealized appreciation — investments
|
223,669,660 | |||
|
Net unrealized appreciation (depreciation) — other
investments
|
(769 | ) | ||
|
Temporary book/tax differences
|
(326,550 | ) | ||
|
Capital loss carryforward
|
(213,375,987 | ) | ||
|
Shares of beneficial interest
|
1,558,828,110 | |||
|
Total net assets
|
$ | 1,571,162,685 | ||
|
Capital Loss |
||||
| Expiration | Carryforward* | |||
|
October 31, 2017
|
$ | 213,375,987 | ||
| * | Capital loss carryforward as of the date listed above is reduced for limitations, if any, to the extent required by the Internal Revenue Code. |
| Unrealized Appreciation (Depreciation) of Investment Securities on a Tax Basis | ||||
|
Aggregate unrealized appreciation of investment securities
|
$ | 308,759,864 | ||
|
Aggregate unrealized (depreciation) of investment securities
|
(85,090,204 | ) | ||
|
Net unrealized appreciation of investment securities
|
$ | 223,669,660 | ||
| Cost of investments for tax purposes is $1,360,704,658. | ||||
| Summary of Share Activity | ||||||||||||||||
| Year ended October 31, | ||||||||||||||||
| 2011 | 2010 | |||||||||||||||
| Shares | Amount | Shares | Amount | |||||||||||||
|
Sold:
|
||||||||||||||||
|
Class A
|
508,790 | $ | 6,129,306 | 446,552 | $ | 4,589,624 | ||||||||||
|
Class B
|
17,167 | 207,420 | 27,714 | 279,942 | ||||||||||||
|
Class C
|
24,066 | 277,838 | 25,925 | 262,729 | ||||||||||||
|
Class P
|
6,476,302 | 76,780,988 | 8,626,855 | 88,625,316 | ||||||||||||
|
Class S
|
38,623 | 460,009 | 394,737 | 4,040,000 | ||||||||||||
|
Class Y
|
9,809 | 115,595 | 34,863 | 353,477 | ||||||||||||
|
Institutional Class
|
5,898 | 63,637 | — | — | ||||||||||||
|
Issued as reinvestment of dividends:
|
||||||||||||||||
|
Class A
|
279 | 3,254 | 16,035 | 162,592 | ||||||||||||
|
Class P
|
211,545 | 2,481,425 | 1,136,972 | 11,574,373 | ||||||||||||
|
Class S
|
481 | 5,625 | 1,247 | 12,656 | ||||||||||||
|
Class Y
|
307 | 3,586 | 1,998 | 20,260 | ||||||||||||
|
Institutional Class
|
— | — | 11,608 | 117,708 | ||||||||||||
|
Automatic conversion of Class B shares to Class A shares:
|
||||||||||||||||
|
Class A
|
21,541 | 256,625 | 33,603 | 348,633 | ||||||||||||
|
Class B
|
(22,065 | ) | (256,625 | ) | (34,189 | ) | (348,633 | ) | ||||||||
|
Reacquired:
|
||||||||||||||||
|
Class A
|
(975,621 | ) | (11,602,123 | ) | (1,115,490 | ) | (11,415,790 | ) | ||||||||
|
Class B
|
(34,532 | ) | (394,289 | ) | (68,424 | ) | (686,584 | ) | ||||||||
|
Class C
|
(73,184 | ) | (844,601 | ) | (137,599 | ) | (1,389,791 | ) | ||||||||
|
Class P
|
(22,958,368 | ) | (274,046,014 | ) | (24,447,256 | ) | (252,387,616 | ) | ||||||||
|
Class S
|
(69,011 | ) | (816,364 | ) | (46,539 | ) | (487,355 | ) | ||||||||
|
Class Y
|
(35,715 | ) | (433,636 | ) | (139,078 | ) | (1,399,976 | ) | ||||||||
|
Institutional Class
|
(293 | ) | (3,273 | ) | (1,195,995 | ) | (12,559,598 | ) | ||||||||
|
Net increase (decrease) in share activity
|
(16,853,981 | ) | $ | (201,611,617 | ) | (16,426,461 | ) | $ | (170,288,033 | ) | ||||||
|
Ratio of |
Ratio of |
|||||||||||||||||||||||||||||||||||||||||||||||||||||||
|
Net gains |
expenses |
expenses |
||||||||||||||||||||||||||||||||||||||||||||||||||||||
|
(losses) |
to average |
to average net |
Ratio of net |
|||||||||||||||||||||||||||||||||||||||||||||||||||||
|
Net asset |
Net |
on securities |
Dividends |
Distributions |
net assets |
assets without |
investment |
|||||||||||||||||||||||||||||||||||||||||||||||||
|
value, |
investment |
(both |
Total from |
from net |
from net |
Net asset |
Net assets, |
with fee
waivers |
fee waivers |
income (loss) |
||||||||||||||||||||||||||||||||||||||||||||||
|
beginning |
income |
realized and |
investment |
investment |
realized |
Total |
value, end |
Total |
end of period |
and/or
expense |
and/or
expense |
to average |
Portfolio |
|||||||||||||||||||||||||||||||||||||||||||
| of period | (loss)(a) | unrealized) | operations | income | gains | Distributions | of period | Return(b) | (000s omitted) | absorbed | absorbed | net assets | turnover(c) | |||||||||||||||||||||||||||||||||||||||||||
| Class A | ||||||||||||||||||||||||||||||||||||||||||||||||||||||||
| Year ended 10/31/11 | $ | 11.09 | $ | 0.00 | $ | 0.47 | $ | 0.47 | $ | (0.00 | ) | $ | — | $ | (0.00 | ) | $ | 11.56 | 4.25 | % | $ | 17,763 | 1.06 | %(d) | 1.07 | %(d) | 0.00 | %(d) | 59 | % | ||||||||||||||||||||||||||
| Year ended 10/31/10 | 9.55 | 0.00 | 1.61 | 1.61 | (0.07 | ) | — | (0.07 | ) | 11.09 | 16.89 | 21,981 | 1.09 | 1.10 | 0.00 | 53 | ||||||||||||||||||||||||||||||||||||||||
| Year ended 10/31/09 | 9.81 | 0.06 | 0.33 | 0.39 | (0.05 | ) | (0.60 | ) | (0.65 | ) | 9.55 | 4.99 | 24,855 | 1.12 | 1.13 | 0.70 | 89 | |||||||||||||||||||||||||||||||||||||||
| Year ended 10/31/08 | 15.42 | 0.05 | (5.40 | ) | (5.35 | ) | (0.06 | ) | (0.20 | ) | (0.26 | ) | 9.81 | (35.26 | ) | 25,529 | 1.06 | 1.07 | 0.34 | 79 | ||||||||||||||||||||||||||||||||||||
| Year ended 10/31/07 | 12.74 | 0.05 | 2.70 | 2.75 | (0.07 | ) | — | (0.07 | ) | 15.42 | 21.65 | 11,591 | 1.08 | 1.08 | 0.37 | 41 | ||||||||||||||||||||||||||||||||||||||||
| Class B | ||||||||||||||||||||||||||||||||||||||||||||||||||||||||
| Year ended 10/31/11 | 10.87 | (0.09 | ) | 0.46 | 0.37 | — | — | — | 11.24 | 3.40 | 1,085 | 1.81 | (d) | 1.82 | (d) | (0.75 | )(d) | 59 | ||||||||||||||||||||||||||||||||||||||
| Year ended 10/31/10 | 9.37 | (0.08 | ) | 1.58 | 1.50 | — | — | — | 10.87 | 16.01 | 1,477 | 1.84 | 1.85 | (0.75 | ) | 53 | ||||||||||||||||||||||||||||||||||||||||
| Year ended 10/31/09 | 9.64 | (0.00 | ) | 0.33 | 0.33 | — | (0.60 | ) | (0.60 | ) | 9.37 | 4.31 | 1,975 | 1.87 | 1.88 | (0.05 | ) | 89 | ||||||||||||||||||||||||||||||||||||||
| Year ended 10/31/08 | 15.20 | (0.05 | ) | (5.30 | ) | (5.35 | ) | (0.01 | ) | (0.20 | ) | (0.21 | ) | 9.64 | (35.70 | ) | 3,256 | 1.81 | 1.82 | (0.41 | ) | 79 | ||||||||||||||||||||||||||||||||||
| Year ended 10/31/07 | 12.64 | (0.05 | ) | 2.66 | 2.61 | (0.05 | ) | — | (0.05 | ) | 15.20 | 20.74 | 2,727 | 1.83 | 1.83 | (0.38 | ) | 41 | ||||||||||||||||||||||||||||||||||||||
| Class C | ||||||||||||||||||||||||||||||||||||||||||||||||||||||||
| Year ended 10/31/11 | 10.85 | (0.09 | ) | 0.47 | 0.38 | — | — | — | 11.23 | 3.50 | 1,968 | 1.81 | (d) | 1.82 | (d) | (0.75 | )(d) | 59 | ||||||||||||||||||||||||||||||||||||||
| Year ended 10/31/10 | 9.36 | (0.08 | ) | 1.57 | 1.49 | — | — | — | 10.85 | 15.92 | 2,435 | 1.84 | 1.85 | (0.75 | ) | 53 | ||||||||||||||||||||||||||||||||||||||||
| Year ended 10/31/09 | 9.63 | (0.00 | ) | 0.33 | 0.33 | — | (0.60 | ) | (0.60 | ) | 9.36 | 4.31 | 3,145 | 1.87 | 1.88 | (0.05 | ) | 89 | ||||||||||||||||||||||||||||||||||||||
| Year ended 10/31/08 | 15.20 | (0.05 | ) | (5.31 | ) | (5.36 | ) | (0.01 | ) | (0.20 | ) | (0.21 | ) | 9.63 | (35.77 | ) | 4,408 | 1.81 | 1.82 | (0.41 | ) | 79 | ||||||||||||||||||||||||||||||||||
| Year ended 10/31/07 | 12.64 | (0.05 | ) | 2.66 | 2.61 | (0.05 | ) | — | (0.05 | ) | 15.20 | 20.74 | 995 | 1.83 | 1.83 | (0.38 | ) | 41 | ||||||||||||||||||||||||||||||||||||||
| Class P | ||||||||||||||||||||||||||||||||||||||||||||||||||||||||
| Year ended 10/31/11 | 11.15 | 0.02 | 0.48 | 0.50 | (0.02 | ) | — | (0.02 | ) | 11.63 | 4.46 | 1,545,006 | 0.91 | (d) | 0.92 | (d) | 0.15 | (d) | 59 | |||||||||||||||||||||||||||||||||||||
| Year ended 10/31/10 | 9.60 | 0.02 | 1.60 | 1.62 | (0.07 | ) | — | (0.07 | ) | 11.15 | 16.97 | 1,663,462 | 0.94 | 0.95 | 0.15 | 53 | ||||||||||||||||||||||||||||||||||||||||
| Year ended 10/31/09 | 9.85 | 0.08 | 0.33 | 0.41 | (0.06 | ) | (0.60 | ) | (0.66 | ) | 9.60 | 5.22 | 1,572,776 | 0.97 | 0.98 | 0.85 | 89 | |||||||||||||||||||||||||||||||||||||||
| Year ended 10/31/08 | 15.47 | 0.07 | (5.42 | ) | (5.35 | ) | (0.07 | ) | (0.20 | ) | (0.27 | ) | 9.85 | (35.17 | ) | 1,554,240 | 0.91 | 0.92 | 0.49 | 79 | ||||||||||||||||||||||||||||||||||||
| Year ended 10/31/07 | 12.77 | 0.07 | 2.71 | 2.78 | (0.08 | ) | — | (0.08 | ) | 15.47 | 21.85 | 2,594,668 | 0.92 | 0.94 | 0.52 | 41 | ||||||||||||||||||||||||||||||||||||||||
| Class S | ||||||||||||||||||||||||||||||||||||||||||||||||||||||||
| Year ended 10/31/11 | 11.11 | 0.01 | 0.47 | 0.48 | (0.01 | ) | — | (0.01 | ) | 11.58 | 4.36 | 4,078 | 0.96 | (d) | 0.97 | (d) | 0.10 | (d) | 59 | |||||||||||||||||||||||||||||||||||||
| Year ended 10/31/10 | 9.56 | 0.01 | 1.61 | 1.62 | (0.07 | ) | — | (0.07 | ) | 11.11 | 16.99 | 4,246 | 0.99 | 1.00 | 0.10 | 53 | ||||||||||||||||||||||||||||||||||||||||
| Year ended 10/31/09(e) | 9.65 | 0.01 | (0.10 | ) | (0.09 | ) | — | — | — | 9.56 | (0.93 | ) | 312 | 0.95 | (f) | 0.96 | (f) | 0.87 | (f) | 89 | ||||||||||||||||||||||||||||||||||||
| Class Y | ||||||||||||||||||||||||||||||||||||||||||||||||||||||||
| Year ended 10/31/11 | 11.11 | 0.03 | 0.47 | 0.50 | (0.03 | ) | — | (0.03 | ) | 11.58 | 4.48 | 1,186 | 0.81 | (d) | 0.82 | (d) | 0.25 | (d) | 59 | |||||||||||||||||||||||||||||||||||||
| Year ended 10/31/10 | 9.56 | 0.03 | 1.60 | 1.63 | (0.08 | ) | — | (0.08 | ) | 11.11 | 17.14 | 1,422 | 0.84 | 0.85 | 0.25 | 53 | ||||||||||||||||||||||||||||||||||||||||
| Year ended 10/31/09 | 9.81 | 0.09 | 0.32 | 0.41 | (0.06 | ) | (0.60 | ) | (0.66 | ) | 9.56 | 5.26 | 2,201 | 0.87 | 0.88 | 0.95 | 89 | |||||||||||||||||||||||||||||||||||||||
| Year ended 10/31/08(e) | 10.98 | 0.00 | (1.17 | ) | (1.17 | ) | — | — | — | 9.81 | (10.66 | ) | 224 | 0.85 | (f) | 0.86 | (f) | 0.55 | (f) | 79 | ||||||||||||||||||||||||||||||||||||
| Institutional Class | ||||||||||||||||||||||||||||||||||||||||||||||||||||||||
| Year ended 10/31/11 | 11.14 | 0.04 | 0.47 | 0.51 | (0.05 | ) | — | (0.05 | ) | 11.60 | 4.54 | 77 | 0.74 | (d) | 0.75 | (d) | 0.32 | (d) | 59 | |||||||||||||||||||||||||||||||||||||
| Year ended 10/31/10 | 9.58 | 0.04 | 1.62 | 1.66 | (0.10 | ) | — | (0.10 | ) | 11.14 | 17.42 | 11 | 0.68 | 0.69 | 0.41 | 53 | ||||||||||||||||||||||||||||||||||||||||
| Year ended 10/31/09 | 9.81 | 0.10 | 0.33 | 0.43 | (0.06 | ) | (0.60 | ) | (0.66 | ) | 9.58 | 5.48 | 11,358 | 0.67 | 0.68 | 1.15 | 89 | |||||||||||||||||||||||||||||||||||||||
| Year ended 10/31/08(e) | 10.98 | 0.00 | (1.17 | ) | (1.17 | ) | — | — | — | 9.81 | (10.66 | ) | 10,762 | 0.80 | (f) | 0.81 | (f) | 0.60 | (f) | 79 | ||||||||||||||||||||||||||||||||||||
| (a) | Calculated using average shares outstanding. | |
| (b) | Includes adjustments in accordance with accounting principles generally accepted in the United States of America and as such, the net asset value for financial reporting purposes and the returns based upon those net asset values may differ from the net asset value and returns for shareholder transactions. Does not include sales charges and is not annualized for periods less than one year, if applicable. | |
| (c) | Portfolio turnover is calculated at the fund level and is not annualized for periods less than one year, if applicable. | |
| (d) | Ratios are based on average daily net assets (000’s omitted) of $20,515, $1,366, $2,261, $1,673,879, $4,377, $1,344 and $21 for Class A, Class B, Class C, Class P, Class S, Class Y and Institutional Class shares, respectively. | |
| (e) | Commencement date of September 25, 2009 for Class S shares and October 3, 2008 for Class Y and Institutional Class shares. | |
| (f) | Annualized. |
|
HYPOTHETICAL |
||||||||||||||||||||||||||||||
| ACTUAL | (5% annual return before expenses) | |||||||||||||||||||||||||||||
|
Beginning |
Ending |
Expenses |
Ending |
Expenses |
Annualized |
|||||||||||||||||||||||||
|
Account Value |
Account Value |
Paid During |
Account Value |
Paid During |
Expense |
|||||||||||||||||||||||||
| Class | (05/01/11) | (10/31/11)1 | Period2 | (10/31/11) | Period2 | Ratio | ||||||||||||||||||||||||
|
A
|
$ | 1,000.00 | $ | 911.00 | $ | 5.18 | $ | 1,019.79 | $ | 5.47 | 1.07 | % | ||||||||||||||||||
|
B
|
1,000.00 | 907.20 | 8.77 | 1,016.01 | 9.27 | 1.82 | ||||||||||||||||||||||||
|
C
|
1,000.00 | 907.10 | 8.77 | 1,016.01 | 9.27 | 1.82 | ||||||||||||||||||||||||
|
P
|
1,000.00 | 911.40 | 4.45 | 1,020.55 | 4.71 | 0.92 | ||||||||||||||||||||||||
|
S
|
1,000.00 | 911.10 | 4.69 | 1,020.29 | 4.96 | 0.97 | ||||||||||||||||||||||||
|
Y
|
1,000.00 | 911.10 | 3.97 | 1,021.05 | 4.20 | 0.82 | ||||||||||||||||||||||||
|
Institutional
|
1,000.00 | 911.90 | 3.61 | 1,021.42 | 3.82 | 0.75 | ||||||||||||||||||||||||
| 1 | The actual ending account value is based on the actual total return of the Fund for the period May 1, 2011 through October 31, 2011, after actual expenses and will differ from the hypothetical ending account value which is based on the Fund’s expense ratio and a hypothetical annual return of 5% before expenses. |
| 2 | Expenses are equal to the Fund’s annualized expense ratio as indicated above multiplied by the average account value over the period, multiplied by 184/365 to reflect the most recent fiscal half year. |
| Approval of Investment Advisory and Sub-Advisory Contracts |
| A. | Nature, Extent and Quality of Services Provided by Invesco Advisers and the Affiliated Sub-Advisers |
| B. | Fund Performance |
| C. | Advisory and Sub-Advisory Fees and Fee Waivers |
| D. | Economies of Scale and Breakpoints |
| E. | Profitability and Financial Resources |
| F. | Collateral Benefits to Invesco Advisers and its Affiliates |
|
Federal and State Income
Tax
|
||||
|
Qualified Dividend Income*
|
1.19% | |||
|
Corporate Dividends Received Deduction*
|
1.19% | |||
| * | The above percentages are based on ordinary income dividends paid to shareholders during the Fund’s fiscal year. |
|
Number of |
||||||||
|
Funds in |
||||||||
|
Fund Complex |
||||||||
|
Name, Year of
Birth and |
Trustee
and/ |
Principal
Occupation(s) |
Overseen by |
Other
Directorship(s) |
||||
| Position(s) Held with the Trust | or Officer Since | During Past 5 Years | Trustee | Held by Trustee | ||||
|
Interested
Persons
|
||||||||
|
Martin L.
Flanagan1 —
1960
Trustee |
2007 | Executive Director, Chief Executive Officer and President, Invesco Ltd. (ultimate parent of Invesco and a global investment management firm); Advisor to the Board, Invesco Advisers, Inc. (formerly known as Invesco Institutional (N.A.), Inc.); Trustee, The Invesco Funds; Vice Chair, Investment Company Institute; and Member of Executive Board, SMU Cox School of Business | 141 | None | ||||
| Formerly: Chairman, Invesco Advisers, Inc. (registered investment adviser); Director, Chairman, Chief Executive Officer and President, IVZ Inc. (holding company), INVESCO Group Services, Inc. (service provider) and Invesco North American Holdings, Inc. (holding company); Director, Chief Executive Officer and President, Invesco Holding Company Limited (parent of Invesco and a global investment management firm); Director, Invesco Ltd.; Chairman, Investment Company Institute and President, Co-Chief Executive Officer, Co-President, Chief Operating Officer and Chief Financial Officer, Franklin Resources, Inc. (global investment management organization) | ||||||||
|
Philip A.
Taylor2 —
1954
Trustee, President and Principal Executive Officer |
2006 | Head of North American Retail and Senior Managing Director, Invesco Ltd.; Director, Co-Chairman, Co-President and Co-Chief Executive Officer, Invesco Advisers, Inc. (formerly known as Invesco Institutional (N.A.), Inc.) (registered investment adviser); Director, Chairman, Chief Executive Officer and President, Invesco Management Group, Inc. (formerly Invesco Aim Management Group, Inc.) (financial services holding company); Director and President, INVESCO Funds Group, Inc. (registered investment adviser and registered transfer agent); Director and Chairman, Invesco Investment Services, Inc. (formerly known as Invesco Aim Investment Services, Inc.) (registered transfer agent) and IVZ Distributors, Inc. (formerly known as INVESCO Distributors, Inc.) (registered broker dealer); Director, President and Chairman, Invesco Inc. (holding company) and Invesco Canada Holdings Inc. (holding company); Chief Executive Officer, Invesco Corporate Class Inc. (corporate mutual fund company) and Invesco Canada Fund Inc. (corporate mutual fund company); Director, Chairman and Chief Executive Officer, Invesco Canada Ltd. (formerly known as Invesco Trimark Ltd./Invesco Trimark Ltèe) (registered investment adviser and registered transfer agent); Trustee, President and Principal Executive Officer, The Invesco Funds (other than AIM Treasurer’s Series Trust (Invesco Treasurer’s Series Trust) and Short-Term Investments Trust); Trustee and Executive Vice President, The Invesco Funds (AIM Treasurer’s Series Trust (Invesco Treasurer’s Series Trust) and Short-Term Investments Trust only); Director, Invesco Investment Advisers LLC (formerly known as Van Kampen Asset Management); Director, Chief Executive Officer and President, Van Kampen Exchange Corp. | 141 | None | ||||
| Formerly: Director and Chairman, Van Kampen Investor Services Inc.: | ||||||||
| Director, Chief Executive Officer and President, 1371 Preferred Inc. (holding company); and Van Kampen Investments Inc.; Director and President, AIM GP Canada Inc. (general partner for limited partnerships); and Van Kampen Advisors, Inc.; Director and Chief Executive Officer, Invesco Trimark Dealer Inc. (registered broker dealer); Director, Invesco Distributors, Inc. (formerly known as Invesco Aim Distributors, Inc.) (registered broker dealer); Manager, Invesco PowerShares Capital Management LLC; Director, Chief Executive Officer and President, Invesco Advisers, Inc.; Director, Chairman, Chief Executive Officer and President, Invesco Aim Capital Management, Inc.; President, Invesco Trimark Dealer Inc. and Invesco Trimark Ltd./Invesco Trimark Ltèe; Director and President, AIM Trimark Corporate Class Inc. and AIM Trimark Canada Fund Inc.; Senior Managing Director, Invesco Holding Company Limited; Trustee and Executive Vice President, Tax-Free Investments Trust; Director and Chairman, Fund Management Company (former registered broker dealer); President and Principal Executive Officer, The Invesco Funds (AIM Treasurer’s Series Trust (Invesco Treasurer’s Series Trust), Short-Term Investments Trust and Tax-Free Investments Trust only); President, AIM Trimark Global Fund Inc. and AIM Trimark Canada Fund Inc. | ||||||||
|
Wayne W.
Whalen3 —
1939
Trustee |
2010 | Of Counsel, and prior to 2010, partner in the law firm of Skadden, Arps, Slate, Meagher & Flom LLP, legal counsel to funds in the Fund Complex | 159 | Director of the Abraham Lincoln Presidential Library Foundation | ||||
|
Independent
Trustees
|
||||||||
|
Bruce L. Crockett — 1944
Trustee and Chair |
1993 | Chairman, Crockett Technology Associates (technology consulting company) | 141 | ACE Limited (insurance company); and Investment Company Institute | ||||
| Formerly: Director, Captaris (unified messaging provider); Director, President and Chief Executive Officer COMSAT Corporation; and Chairman, Board of Governors of INTELSAT (international communications company) | ||||||||
|
David C. Arch — 1945
Trustee |
2010 | Chairman and Chief Executive Officer of Blistex Inc., a consumer health care products manufacturer. | 159 | Member of the Heartland Alliance Advisory Board, a nonprofit organization serving human needs based in Chicago. Board member of the Illinois Manufacturers’ Association. Member of the Board of Visitors, Institute for the Humanities, University of Michigan | ||||
| 1 | Mr. Flanagan is considered an interested person of the Trust because he is an officer of the adviser to the Trust, and an officer and a director of Invesco Ltd., ultimate parent of the adviser to the Trust. |
| 2 | Mr. Taylor is considered an interested person of the Trust because he is an officer and a director of the adviser to, and a director of the principal underwriter of, the Trust. |
| 3 | Mr. Whalen has been deemed to be an interested person of the Trust because of his prior service as counsel to the predecessor funds of certain Invesco open-end funds and his affiliation with the law firm that served as counsel to such predecessor funds and continues to serve as counsel to the Invesco Van Kampen closed-end funds. |
|
Number of |
||||||||
|
Funds in |
||||||||
|
Fund Complex |
||||||||
|
Name, Year of
Birth and |
Trustee
and/ |
Principal
Occupation(s) |
Overseen by |
Other
Directorship(s) |
||||
| Position(s) Held with the Trust | or Officer Since | During Past 5 Years | Trustee | Held by Trustee | ||||
|
Independent
Trustees—(continued)
|
||||||||
|
Bob R. Baker — 1936
Trustee |
2003 | Retired | 141 | None | ||||
| Formerly: President and Chief Executive Officer, AMC Cancer Research Center; and Chairman and Chief Executive Officer, First Columbia Financial Corporation | ||||||||
|
Frank S. Bayley — 1939
Trustee |
2001 |
Retired Formerly: Director, Badgley Funds, Inc. (registered investment company) (2 portfolios) and Partner, law firm of Baker & McKenzie |
141 | Director and Chairman, C.D. Stimson Company (a real estate investment company) | ||||
|
James T. Bunch — 1942
Trustee |
2003 |
Founder, Green, Manning & Bunch Ltd. (investment banking firm)
Formerly: Executive Committee, United States Golf Association; and Director, Policy Studies, Inc. and Van Gilder Insurance Corporation |
141 | Vice Chairman, Board of Governors, Western Golf Association/Evans Scholars Foundation and Director, Denver Film Society | ||||
|
Rodney F. Dammeyer — 1940
Trustee |
2010 |
President of CAC, LLC, a private company offering capital investment and management advisory services.
Formerly: Prior to January 2004, Director of TeleTech Holdings Inc.; Prior to 2002, Director of Arris Group, Inc.; Prior to 2001, Managing Partner at Equity Group Corporate Investments. Prior to 1995, Vice Chairman of Anixter International. Prior to 1985, experience includes Senior Vice President and Chief Financial Officer of Household International, Inc, Executive Vice President and Chief Financial Officer of Northwest Industries, Inc. and Partner of Arthur Andersen & Co. |
159 | Director of Quidel Corporation and Stericycle, Inc. Prior to May 2008, Trustee of The Scripps Research Institute. Prior to February 2008, Director of Ventana Medical Systems, Inc. Prior to April 2007, Director of GATX Corporation. Prior to April 2004, Director of TheraSense, Inc. | ||||
|
Albert R. Dowden — 1941
Trustee |
2000 | Director of a number of public and private business corporations, including the Boss Group, Ltd. (private investment and management); Reich & Tang Funds (5 portfolios) (registered investment company); and Homeowners of America Holding Corporation/ Homeowners of America Insurance Company (property casualty company) | 141 | Board of Nature’s Sunshine Products, Inc. | ||||
| Formerly: Director, Continental Energy Services, LLC (oil and gas pipeline service); Director, CompuDyne Corporation (provider of product and services to the public security market) and Director, Annuity and Life Re (Holdings), Ltd. (reinsurance company); Director, President and Chief Executive Officer, Volvo Group North America, Inc.; Senior Vice President, AB Volvo; Director of various public and private corporations; Chairman, DHJ Media, Inc.; Director Magellan Insurance Company; and Director, The Hertz Corporation, Genmar Corporation (boat manufacturer), National Media Corporation; Advisory Board of Rotary Power International (designer, manufacturer, and seller of rotary power engines); and Chairman, Cortland Trust, Inc. (registered investment company) | ||||||||
|
Jack M. Fields — 1952
Trustee |
1997 | Chief Executive Officer, Twenty First Century Group, Inc. (government affairs company); and Owner and Chief Executive Officer, Dos Angelos Ranch, L.P. (cattle, hunting, corporate entertainment), Discovery Global Education Fund (non-profit) and Cross Timbers Quail Research Ranch (non-profit) | 141 | Administaff | ||||
| Formerly: Chief Executive Officer, Texana Timber LP (sustainable forestry company) and member of the U.S. House of Representatives | ||||||||
|
Carl Frischling — 1937
Trustee |
1988 | Partner, law firm of Kramer Levin Naftalis and Frankel LLP | 141 | Director, Reich & Tang Funds (6 portfolios) | ||||
|
Prema Mathai-Davis — 1950
Trustee |
1998 | Retired | 141 | None | ||||
| Formerly: Chief Executive Officer, YWCA of the U.S.A. | ||||||||
|
Larry Soll — 1942
Trustee |
2003 | Retired | 141 | None | ||||
| Formerly, Chairman, Chief Executive Officer and President, Synergen Corp. (a biotechnology company) | ||||||||
|
Number of |
||||||||
|
Funds in |
||||||||
|
Fund Complex |
||||||||
|
Name, Year of
Birth and |
Trustee
and/ |
Principal
Occupation(s) |
Overseen by |
Other
Directorship(s) |
||||
| Position(s) Held with the Trust | or Officer Since | During Past 5 Years | Trustee | Held by Trustee | ||||
|
Independent
Trustees—(continued)
|
||||||||
|
Hugo F. Sonnenschein — 1940
Trustee |
2010 | President Emeritus and Honorary Trustee of the University of Chicago and the Adam Smith Distinguished Service Professor in the Department of Economics at the University of Chicago. Prior to July 2000, President of the University of Chicago. | 159 | Trustee of the University of Rochester and a member of its investment committee. Member of the National Academy of Sciences, the American Philosophical Society and a fellow of the American Academy of Arts and Sciences | ||||
|
Raymond Stickel, Jr. — 1944
Trustee |
2005 | Retired | 141 | Director of Long Cove Club Owners’ Association (home owner’s association) | ||||
| Formerly: Director, Mainstay VP Series Funds, Inc. (25 portfolios) and Partner, Deloitte & Touche | ||||||||
|
Other
Officers
|
||||||||
|
Russell C. Burk — 1958
Senior Vice President and Senior Officer |
2005 | Senior Vice President and Senior Officer of Invesco Funds | N/A | N/A | ||||
|
John M. Zerr — 1962
Senior Vice President, Chief Legal Officer and Secretary |
2006 | Director, Senior Vice President, Secretary and General Counsel, Invesco Management Group, Inc. (formerly known as Invesco Aim Management Group, Inc.) and Van Kampen Exchange Corp.; Senior Vice President, Invesco Advisers, Inc. (formerly known as Invesco Institutional (N.A.), Inc.) (registered investment adviser); Senior Vice President and Secretary, Invesco Distributors, Inc. (formerly known as Invesco Aim Distributors, Inc.); Director, Vice President and Secretary, Invesco Investment Services, Inc. (formerly known as Invesco Aim Investment Services, Inc.) and IVZ Distributors, Inc. (formerly known as INVESCO Distributors, Inc.); Director and Vice President, INVESCO Funds Group, Inc.; Senior Vice President, Chief Legal Officer and Secretary, The Invesco Funds; Manager, Invesco PowerShares Capital Management LLC; Director, Secretary and General Counsel, Invesco Investment Advisers LLC (formerly known as Van Kampen Asset Management); Secretary and General Counsel, Van Kampen Funds Inc. and Chief Legal Officer, PowerShares Exchange-Traded Fund Trust, PowerShares Exchange-Traded Fund Trust II, PowerShares India Exchange-Traded Fund Trust and PowerShares Actively Managed Exchange-Traded Fund Trust | N/A | N/A | ||||
| Formerly: Director and Secretary, Van Kampen Advisors Inc.; Director Vice President, Secretary and General Counsel Van Kampen Investor Services Inc.; Director, Invesco Distributors, Inc. (formerly known as Invesco Aim Distributors, Inc.); Director, Senior Vice President, General Counsel and Secretary, Invesco Advisers, Inc.; and Van Kampen Investments Inc.; Director, Vice President and Secretary, Fund Management Company; Director, Senior Vice President, Secretary, General Counsel and Vice President, Invesco Aim Capital Management, Inc.; Chief Operating Officer and General Counsel, Liberty Ridge Capital, Inc. (an investment adviser); Vice President and Secretary, PBHG Funds (an investment company) and PBHG Insurance Series Fund (an investment company); Chief Operating Officer, General Counsel and Secretary, Old Mutual Investment Partners (a broker-dealer); General Counsel and Secretary, Old Mutual Fund Services (an administrator) and Old Mutual Shareholder Services (a shareholder servicing center); Executive Vice President, General Counsel and Secretary, Old Mutual Capital, Inc. (an investment adviser); and Vice President and Secretary, Old Mutual Advisors Funds (an investment company) | ||||||||
|
Lisa O. Brinkley — 1959
Vice President |
2004 |
Global Compliance Director, Invesco Ltd.; Chief Compliance Officer, Invesco Investment Services, Inc.(formerly known as Invesco Aim Investment Services, Inc.); and Vice President, The Invesco Funds
Formerly: Chief Compliance Officer, Invesco Distributors, Inc. (formerly known as Invesco Aim Distributors, Inc.) and Van Kampen Investor Services Inc.; Senior Vice President, Invesco Management Group, Inc.; Senior Vice President and Chief Compliance Officer, Invesco Advisers, Inc. and The Invesco Funds; Vice President and Chief Compliance Officer, Invesco Aim Capital Management, Inc. and Invesco Distributors, Inc.; Vice President, Invesco Investment Services, Inc. and Fund Management Company |
N/A | N/A | ||||
|
Sheri Morris — 1964
Vice President, Treasurer and Principal Financial Officer |
1999 | Vice President, Treasurer and Principal Financial Officer, The Invesco Funds; and Vice President, Invesco Advisers, Inc. (formerly known as Invesco Institutional (N.A.), Inc.) (registered investment adviser). | N/A | N/A | ||||
| Formerly: Treasurer, PowerShares Exchange-Traded Fund Trust, PowerShares Exchange-Traded Fund Trust II, PowerShares India Exchange-Traded Fund Trust and PowerShares Actively Managed Exchange-Traded Fund Trust; Vice President, Invesco Advisers, Inc., Invesco Aim Capital Management, Inc. and Invesco Aim Private Asset Management, Inc.; Assistant Vice President and Assistant Treasurer, The Invesco Funds and Assistant Vice President, Invesco Advisers, Inc., Invesco Aim Capital Management, Inc. and Invesco Aim Private Asset Management, Inc. | ||||||||
|
Karen Dunn Kelley — 1960
Vice President |
2004 | Head of Invesco’s World Wide Fixed Income and Cash Management Group; Senior Vice President, Invesco Advisers, Inc. (formerly known as Invesco Institutional (N.A.), Inc.) (registered investment adviser); Executive Vice President, Invesco Distributors, Inc. (formerly known as Invesco Aim Distributors, Inc.); Senior Vice President, Invesco Management Group, Inc. (formerly known as Invesco Aim Management Group, Inc.); and Director, Invesco Mortgage Capital Inc.; Vice President, The Invesco Funds (other than AIM Treasurer’s Series Trust (Invesco Treasurer’s Series Trust) and Short-Term Investments Trust); President and Principal Executive Officer, The Invesco Funds (AIM Treasurer’s Series Trust (Invesco Treasurer’s Series Trust) and Short-Term Investments Trust only). | N/A | N/A | ||||
| Formerly: Senior Vice President, Van Kampen Investments Inc.; Vice President, Invesco Advisers, Inc. (formerly known as Invesco Institutional (N.A.), Inc.); Director of Cash Management and Senior Vice President, Invesco Advisers, Inc. and Invesco Aim Capital Management, Inc.; President and Principal Executive Officer, Tax-Free Investments Trust; Director and President, Fund Management Company; Chief Cash Management Officer, Director of Cash Management, Senior Vice President, and Managing Director, Invesco Aim Capital Management, Inc.; Director of Cash Management, Senior Vice President, and Vice President, Invesco Advisers, Inc. and The Invesco Funds (AIM Treasurer’s Series Trust (Invesco Treasurer’s Series Trust), Short-Term Investments Trust and Tax-Free Investments Trust only) | ||||||||
|
Number of |
||||||||
|
Funds in |
||||||||
|
Fund Complex |
||||||||
|
Name, Year of
Birth and |
Trustee
and/ |
Principal
Occupation(s) |
Overseen by |
Other
Directorship(s) |
||||
| Position(s) Held with the Trust | or Officer Since | During Past 5 Years | Trustee | Held by Trustee | ||||
|
Other
Officers—(continued)
|
||||||||
|
Lance A. Rejsek — 1967
Anti-Money Laundering Compliance Officer |
2005 | Anti-Money Laundering Compliance Officer, Invesco Advisers, Inc. (formerly known as Invesco Institutional (N.A.), Inc.) (registered investment adviser); Invesco Distributors, Inc. (formerly known as Invesco Aim Distributors, Inc.), Invesco Investment Services, Inc. (formerly known as Invesco Aim Investment Services, Inc.), The Invesco Funds, PowerShares Exchange-Traded Fund Trust, PowerShares Exchange-Traded Fund Trust II, PowerShares India Exchange-Traded Fund Trust, PowerShares Actively Managed Exchange-Traded Fund Trust, Invesco Investment Advisers LLC (formerly known as Van Kampen Asset Management) and Van Kampen Funds Inc. | N/A | N/A | ||||
| Formerly: Anti-Money Laundering Compliance Officer, Van Kampen Investor Services Inc., Fund Management Company, Invesco Advisers, Inc., Invesco Aim Capital Management, Inc. and Invesco Aim Private Asset Management, Inc. | ||||||||
|
Todd L. Spillane — 1958
Chief Compliance Officer |
2006 | Senior Vice President, Invesco Management Group, Inc. (formerly known as Invesco Aim Management Group, Inc.) and Van Kampen Exchange Corp.; Senior Vice President and Chief Compliance Officer, Invesco Advisers, Inc. (registered investment adviser) (formerly known as Invesco Institutional (N.A.), Inc.); Chief Compliance Officer, The Invesco Funds, PowerShares Exchange-Traded Fund Trust, PowerShares Exchange-Traded Fund Trust II, PowerShares India Exchange-Traded Fund Trust, PowerShares Actively Managed Exchange-Traded Fund Trust, INVESCO Private Capital Investments, Inc. (holding company) and Invesco Private Capital, Inc. (registered investment adviser); Vice President, Invesco Distributors, Inc. (formerly known as Invesco Aim Distributors, Inc.) and Invesco Investment Services, Inc. (formerly known as Invesco Aim Investment Services, Inc.). | N/A | N/A | ||||
| Formerly: Chief Compliance Officer, Invesco Van Kampen Closed-End Funds; Senior Vice President, Van Kampen Investments Inc.; Senior Vice President and Chief Compliance Officer, Invesco Advisers, Inc. and Invesco Aim Capital Management, Inc.; Chief Compliance Officer, Invesco Global Asset Management (N.A.), Inc., Invesco Senior Secured Management, Inc. (registered investment adviser) and Van Kampen Investor Services Inc.; Vice President, Invesco Aim Capital Management, Inc. and Fund Management Company | ||||||||
|
Office of the Fund 11 Greenway Plaza, Suite 2500 Houston, TX 77046-1173 |
Investment Adviser Invesco Advisers, Inc. 1555 Peachtree Street, N.E. Atlanta, GA 30309 |
Distributor Invesco Distributors, Inc. 11 Greenway Plaza, Suite 2500 Houston, TX 77046-1173 |
Auditors PricewaterhouseCoopers LLP 1201 Louisiana Street, Suite 2900 Houston, TX 77002-5678 |
|||
|
Counsel to the Fund Stradley Ronon Stevens & Young, LLP 2600 One Commerce Square Philadelphia, PA 19103 |
Counsel to the Independent Trustees Kramer, Levin, Naftalis & Frankel LLP 1177 Avenue of the Americas New York, NY 10036-2714 |
Transfer Agent Invesco Investment Services, Inc. 11 Greenway Plaza, Suite 2500 Houston, TX 77046-1173 |
Custodian State Street Bank and Trust Company 225 Franklin Boston, MA 02110-2801 |


| ITEM 2. | CODE OF ETHICS. |
| The Registrant did not grant any waivers, including implicit waivers, from any provisions of the Code to the PEO or PFO during the period covered by this report. |
| ITEM 3. | AUDIT COMMITTEE FINANCIAL EXPERT. |
| The Board of Trustees has determined that the Registrant has at least one audit committee financial expert serving on its Audit Committee. The Audit Committee financial expert is Raymond Stickel, Jr. Mr. Stickel is “independent” within the meaning of that term as used in Form N-CSR. |
| ITEM 4. | PRINCIPAL ACCOUNTANT FEES AND SERVICES. |
| Percentage of Fees | Percentage of Fees | |||||||||||||||
| Billed Applicable to | Billed Applicable to | |||||||||||||||
| Non-Audit Services | Non-Audit Services | |||||||||||||||
| Fees Billed for | Provided for fiscal | Fees Billed for | Provided for fiscal | |||||||||||||
| Services Rendered to | year end 10/31/2011 | Services Rendered to | year end 10/31/2010 | |||||||||||||
| the Registrant for | Pursuant to Waiver of | the Registrant for | Pursuant to Waiver of | |||||||||||||
| fiscal year end | Pre-Approval | fiscal year end | Pre-Approval | |||||||||||||
| 10/31/2011 | Requirement(1) | 10/31/2010 | Requirement(1) | |||||||||||||
Audit Fees |
$ | 193,600 | N/A | $ | 240,900 | N/A | ||||||||||
Audit-Related Fees(2) |
$ | 12,750 | 0 | % | $ | 0 | 0 | % | ||||||||
Tax Fees(3) |
$ | 56,300 | 0 | % | $ | 44,200 | 0 | % | ||||||||
All Other Fees |
$ | 0 | 0 | % | $ | 0 | 0 | % | ||||||||
Total Fees |
$ | 262,650 | 0 | % | $ | 285,100 | 0 | % | ||||||||
| (1) | With respect to the provision of non-audit services, the pre-approval requirement is waived pursuant to a de minimis exception if (i) such services were not recognized as non-audit services by the Registrant at the time of engagement, (ii) the aggregate amount of all such services provided is no more than 5% of the aggregate audit and non-audit fees paid by the Registrant to PWC during a fiscal year; and (iii) such services are promptly brought to the attention of the Registrant’s Audit Committee and approved by the Registrant’s Audit Committee prior to the completion of the audit. | |
| (2) | Audit-Related fees for the fiscal year end October 31, 2011 includes fees billed for agreed upon procedures related to fund mergers. | |
| (3) | Tax fees for the fiscal year end October 31, 2011 includes fees billed for reviewing tax returns. Tax fees for the fiscal year end October 31, 2010 includes fees billed for reviewing tax returns. |
| Fees Billed for Non- | Fees Billed for Non- | |||||||||||||||
| Audit Services | Audit Services | |||||||||||||||
| Rendered to Invesco | Percentage of Fees | Rendered to Invesco | Percentage of Fees | |||||||||||||
| and Invesco Affiliates | Billed Applicable to | and Invesco Affiliates | Billed Applicable to | |||||||||||||
| for fiscal year end | Non-Audit Services | for fiscal year end | Non-Audit Services | |||||||||||||
| 10/31/2011 That Were | Provided for fiscal year | 10/31/2010 That Were | Provided for fiscal year | |||||||||||||
| Required | end 10/31/2011 | Required | end 10/31/2010 | |||||||||||||
| to be Pre-Approved | Pursuant to Waiver of | to be Pre-Approved | Pursuant to Waiver of | |||||||||||||
| by the Registrant’s | Pre-Approval | by the Registrant’s | Pre-Approval | |||||||||||||
| Audit Committee | Requirement(1) | Audit Committee | Requirement(1) | |||||||||||||
Audit-Related Fees |
$ | 0 | 0 | % | $ | 0 | 0 | % | ||||||||
Tax Fees |
$ | 0 | 0 | % | $ | 0 | 0 | % | ||||||||
All Other Fees |
$ | 0 | 0 | % | $ | 0 | 0 | % | ||||||||
Total Fees(2) |
$ | 0 | 0 | % | $ | 0 | 0 | % | ||||||||
| (1) | With respect to the provision of non-audit services, the pre-approval requirement is waived pursuant to a de minimis exception if (i) such services were not recognized as non-audit services by the Registrant at the time of engagement, (ii) the aggregate amount of all such services provided is no more than 5% of the aggregate audit and non-audit fees paid by the Registrant, Invesco and Invesco Affiliates to PWC during a fiscal year; and (iii) such services are promptly brought to the attention of the Registrant’s Audit Committee and approved by the Registrant’s Audit Committee prior to the completion of the audit. | |
| (2) | Including the fees for services not required to be pre-approved by the registrant’s audit committee, PWC billed Invesco and Invesco Affiliates aggregate non-audit fees of $0 for the fiscal year ended October 31, 2011, and $0 for the fiscal year ended October 31, 2010, for non-audit services rendered to Invesco and Invesco Affiliates. | |
| The Audit Committee also has considered whether the provision of non-audit services that were rendered to Invesco and Invesco Affiliates that were not required to be pre-approved pursuant to SEC regulations, if any, is compatible with maintaining PWC’s independence. To the extent that such services were provided, the Audit Committee determined that the provision of such services is compatible with PWC maintaining independence with respect to the Registrant. |
POLICIES AND PROCEDURES
As adopted by the Audit Committees of
the Invesco Funds (the “Funds”)
Last Amended May 4, 2010
| 1. | Describe in writing to the Audit Committees, which writing may be in the form of the proposed engagement letter: |
| a. | The scope of the service, the fee structure for the engagement, and any side letter or amendment to the engagement letter, or any other agreement between the Auditor and the Fund, relating to the service; and | ||
| b. | Any compensation arrangement or other agreement, such as a referral agreement, a referral fee or fee-sharing arrangement, between the Auditor and any person (other than the Fund) with respect to the promoting, marketing, or recommending of a transaction covered by the service; |
| 2. | Discuss with the Audit Committees the potential effects of the services on the independence of the Auditor; and | ||
| 3. | Document the substance of its discussion with the Audit Committees. |
| • | Bookkeeping or other services related to the accounting records or financial statements of the audit client | ||
| • | Financial information systems design and implementation | ||
| • | Appraisal or valuation services, fairness opinions, or contribution-in-kind reports | ||
| • | Actuarial services | ||
| • | Internal audit outsourcing services |
| • | Management functions | ||
| • | Human resources | ||
| • | Broker-dealer, investment adviser, or investment banking services | ||
| • | Legal services | ||
| • | Expert services unrelated to the audit | ||
| • | Any service or product provided for a contingent fee or a commission | ||
| • | Services related to marketing, planning, or opining in favor of the tax treatment of confidential transactions or aggressive tax position transactions, a significant purpose of which is tax avoidance | ||
| • | Tax services for persons in financial reporting oversight roles at the Fund | ||
| • | Any other service that the Public Company Oversight Board determines by regulation is impermissible. |
| ITEM 5. | AUDIT COMMITTEE OF LISTED REGISTRANTS. |
| Not applicable. |
| ITEM 6. | SCHEDULE OF INVESTMENTS. |
| Investments in securities of unaffiliated issuers is included as part of the reports to stockholders filed under Item 1 of this Form. |
| ITEM 7. | DISCLOSURE OF PROXY VOTING POLICIES AND PROCEDURES FOR CLOSED-END MANAGEMENT INVESTMENT COMPANIES. |
| Not applicable. |
| ITEM 8. | PORTFOLIO MANAGERS OF CLOSED-END MANAGEMENT COMPANIES. |
| Not applicable. |
| ITEM 9. | PURCHASES OF EQUITY SECURITIES BY CLOSED-END MANAGEMENT INVESTMENT COMPANY AND AFFILIATED PURCHASERS. |
| Not applicable. |
| ITEM 10. | SUBMISSION OF MATTERS TO A VOTE OF SECURITY HOLDERS. |
| None |
| ITEM 11. | CONTROLS AND PROCEDURES. |
| (a) | As of December 15, 2011, an evaluation was performed under the supervision and with the participation of the officers of the Registrant, including the PEO and PFO, to assess |
| the effectiveness of the Registrant’s disclosure controls and procedures, as that term is defined in Rule 30a-3(c) under the Investment Company Act of 1940 (the “Act”), as amended. Based on that evaluation, the Registrant’s officers, including the PEO and PFO, concluded that, as of December 15, 2011, the Registrant’s disclosure controls and procedures were reasonably designed to ensure: (1) that information required to be disclosed by the Registrant on Form N-CSR is recorded, processed, summarized and reported within the time periods specified by the rules and forms of the Securities and Exchange Commission; and (2) that material information relating to the Registrant is made known to the PEO and PFO as appropriate to allow timely decisions regarding required disclosure. | ||
| (b) | There have been no changes in the Registrant’s internal control over financial reporting (as defined in Rule 30a-3(d) under the Act) that occurred during the second fiscal quarter of the period covered by this report that have materially affected, or are reasonably likely to materially affect, the Registrant’s internal control over financial reporting. |
| ITEM 12. | EXHIBITS. |
| 12(a) (1) | Code of Ethics. | |
| 12(a) (2) | Certifications of principal executive officer and principal financial officer as required by Rule 30a-2(a) under the Investment Company Act of 1940. | |
| 12(a) (3) | Not applicable. | |
| 12(b) | Certifications of principal executive officer and principal financial officer as required by Rule 30a-2(b) under the Investment Company Act of 1940. |
| Registrant: | AIM Equity Funds (Invesco Equity Funds) |
By:
|
/s/ PHILIP A. TAYLOR | |||
| Principal Executive Officer | ||||
Date:
|
January 9, 2012 |
By:
|
/s/ PHILIP A. TAYLOR | |||
| Principal Executive Officer | ||||
Date:
|
January 9, 2012 | |||
By:
|
/s/ Sheri Morris | |||
| Principal Financial Officer | ||||
Date:
|
January 9, 2012 |
12(a)(1)
|
Code of Ethics. | |
12(a)(2)
|
Certifications of principal executive officer and principal Financial officer as required by Rule 30a-2(a) under the Investment Company Act of 1940. | |
12(a)(3)
|
Not applicable. | |
12(b)
|
Certifications of principal executive officer and principal financial officer as required by Rule 30a-2(b) under the Investment Company Act of 1940. |