![]()
Filed pursuant to Rule 433
Registration Statement No. 333-180300-03
July 25, 2013
The Commodity Evolution:
The Changing Face of Commodity Investing
Credit Suisse AG, Investor Solutions July 2013
* None of the indices or instruments discussed herein provides investors with the rights to any physical commodities
Executive Summary
§ Commodities are an asset class included in a client’s portfolio, traditionally, for its diversification and inflation hedging characteristics.
§ However, investing in commodities has become more challenging in recent years as the returns of individual commodities have diverged significantly.
§ Commodity strategies have evolved from passive beta towards more dynamic, systematic strategies that can focus on individual commodity supply/demand fundamentals.
§ Dynamic long-only commodity index strategies using a rules-based, transparent methodology seek to provide the traditional benefits of passive commodity beta with potential for enhanced performance.
Slide 2
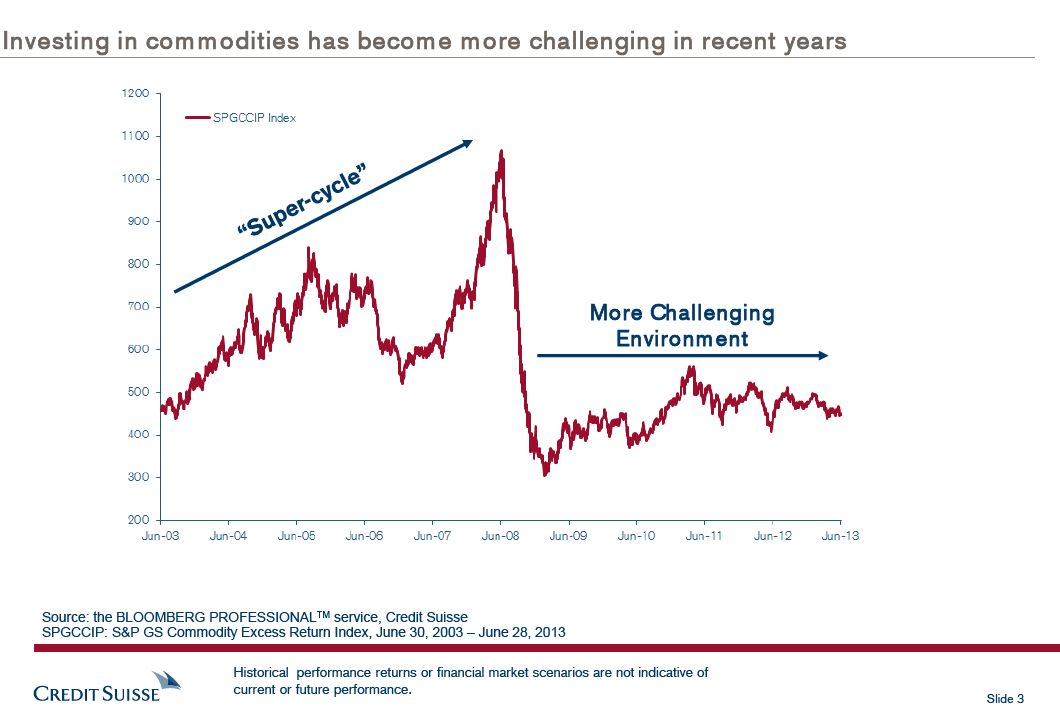
Investing in commodities has become m ore challenging in recent years
More Challenging Environment
Source: the BLOOMBERG PROFESSIONALTM service, Credit Suisse
SPGCCIP: S&P GS Commodity Excess Return Index, June 30, 2003 – June 28, 2013
Historical performance returns or financial market scenarios are not indicative of current or future performance.
Slide 3
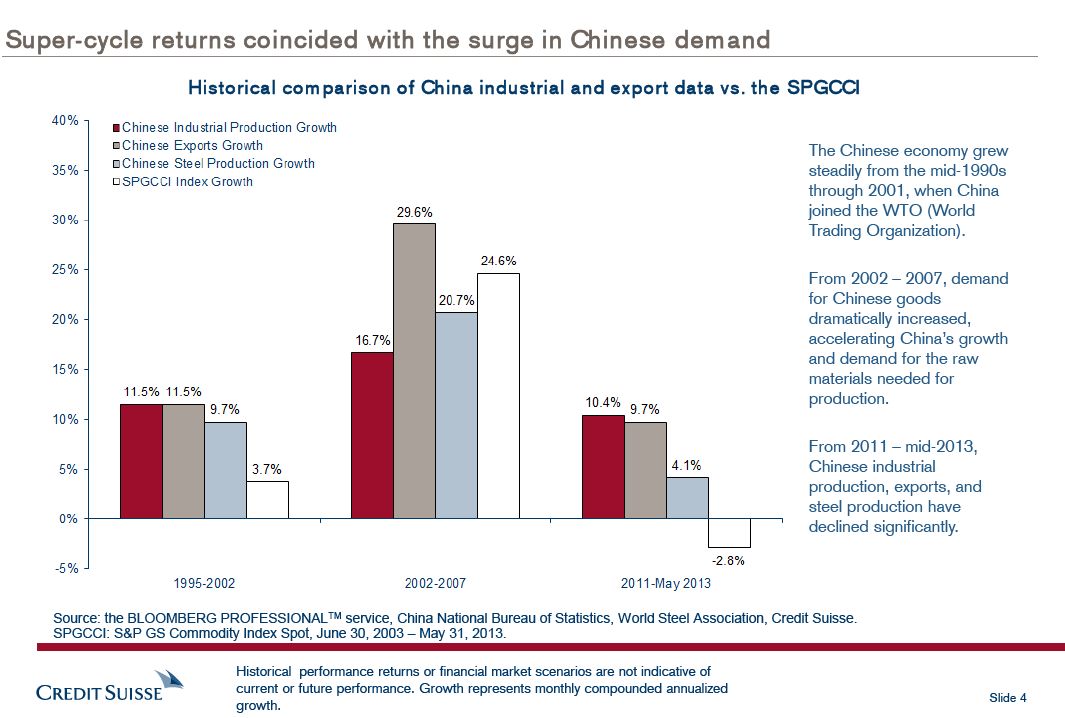
Super-cycle returns coincided with the surge in Chinese demand
Historical comparison of China industrial and export data vs. the SPGCCI
The Chinese economy grew steadily from the mid-1990s through 2001, when China joined the WTO (World Trading Organization).
From 2002 – 2007, demand for Chinese goods dramatically increased, accelerating China’s growth and demand for the raw materials needed for production.
From 2011 – mid-2013, Chinese industrial production, exports, and steel production have declined significantly.
Source: the BLOOMBERG PROFESSIONALTM service, China National Bureau of Statistics, World Steel Association, Credit Suisse. SPGCCI: S&P GS Commodity Index Spot, June 30, 2003 – May 31, 2013.
Historical performance returns or financial market scenarios are not indicative of current or future performance. Growth represents monthly compounded annualized
Slide 4 growth.
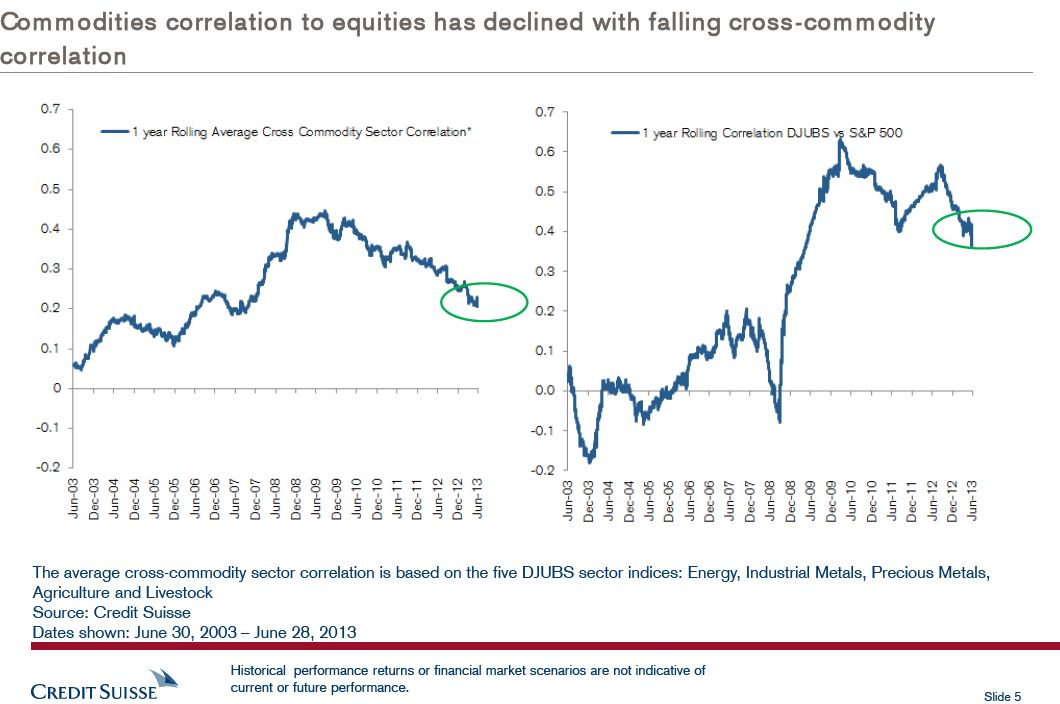
Commodities correlation to equities has declined with falling cross -commodity correlation
The average cross-commodity sector correlation is based on the five DJUBS sector indices: Energy, Industrial Metals, Precious Metals, Agriculture and Livestock Source: Credit Suisse Dates shown: June 30, 2003 – June 28, 2013
Historical performance returns or financial market scenarios are not indicative of current or future performance.
Slide 5
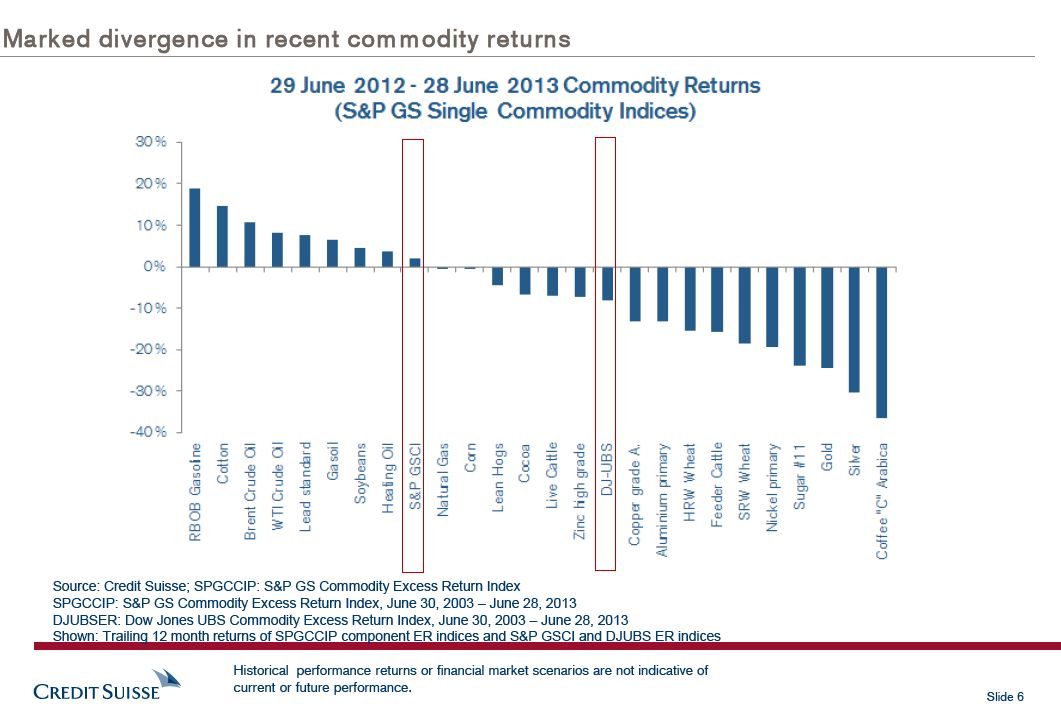
Marked divergence in recent com m odity returns
Source: Credit Suisse; SPGCCIP: S&P GS Commodity Excess Return Index
SPGCCIP: S&P GS Commodity Excess Return Index, June 30, 2003 – June 28, 2013 DJUBSER: Dow Jones UBS Commodity Excess Return Index, June 30, 2003 – June 28, 2013
Shown: Trailing 12 month returns of SPGCCIP component ER indices and S&P GSCI and DJUBS ER indices
Historical performance returns or financial market scenarios are not indicative of current or future performance.
Slide 6
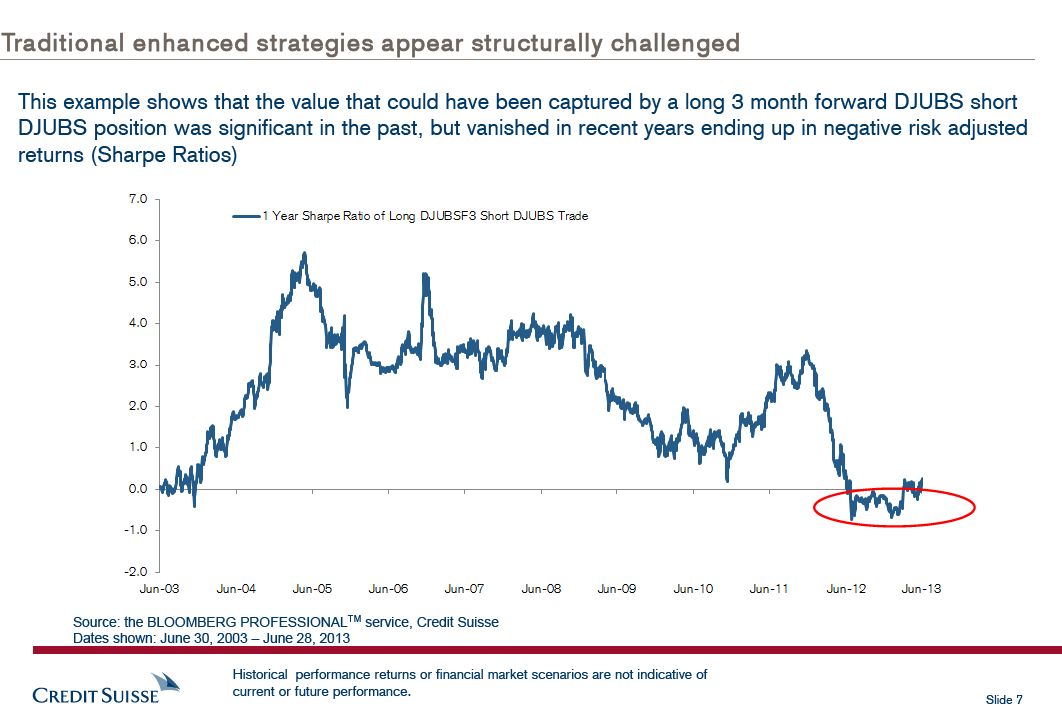
Traditional enhanced strategies appear structurally challenged
This example shows that the value that could have been captured by a long 3 month forward DJUBS short DJUBS position was significant in the past, but vanished in recent years ending up in negative risk adjusted returns (Sharpe Ratios)
Source: the BLOOMBERG PROFESSIONALTM service, Credit Suisse Dates shown: June 30, 2003 – June 28, 2013
Historical performance returns or financial market scenarios are not indicative of current or future performance.
Slide 7
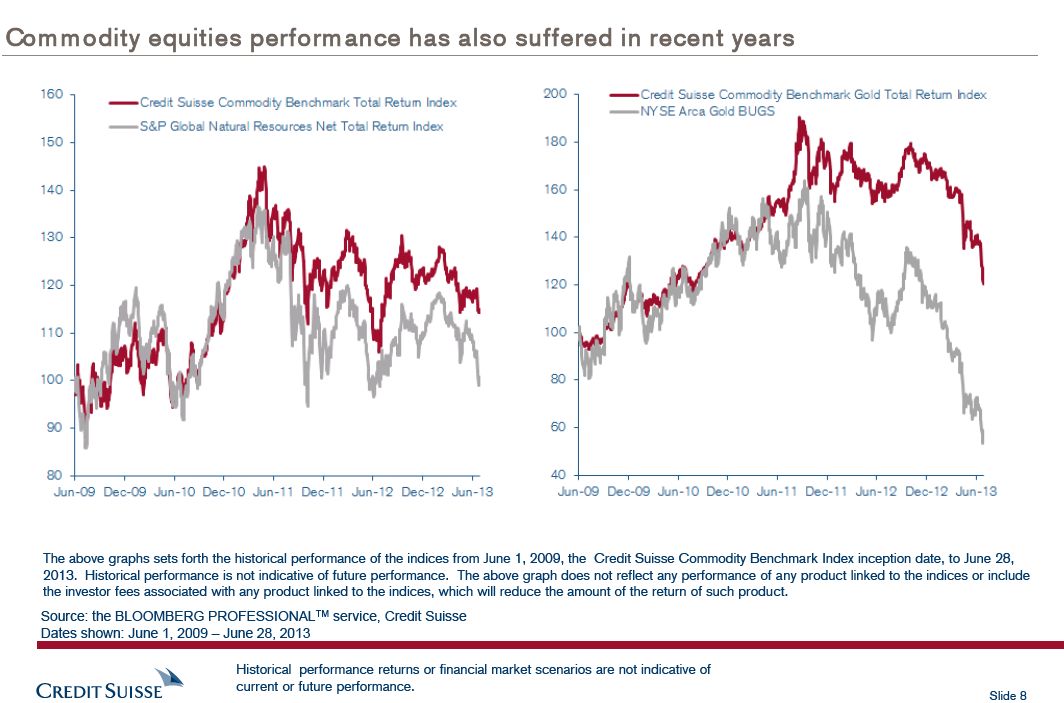
Com m odity equities performance has also suffered in recent years
The above graphs sets forth the historical performance of the indices from June 1, 2009, the Credit Suisse Commodity Benchmark Index inception date, to June 28, 2013. Historical performance is not indicative of future performance. The above graph does not reflect any performance of any product linked to the indices or include the investor fees associated with any product linked to the indices, which will reduce the amount of the return of such product.
Source: the BLOOMBERG PROFESSIONALTM service, Credit Suisse Dates shown: June 1, 2009 – June 28, 2013
Historical performance returns or financial market scenarios are not indicative of current or future performance.
Slide 8
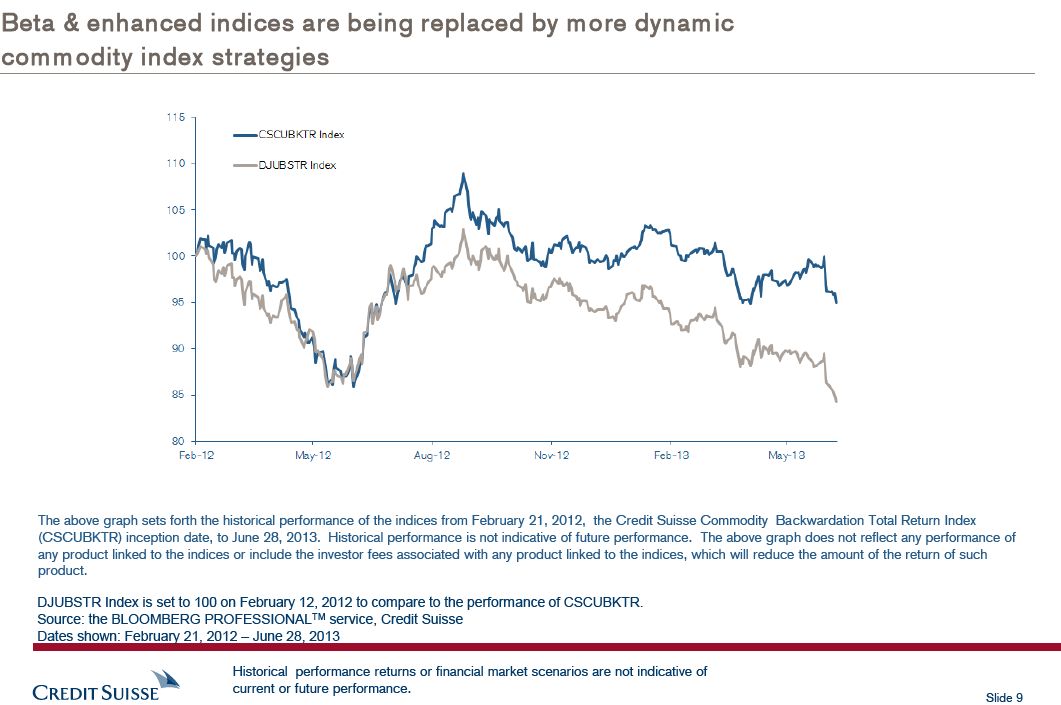
Beta & enhanced indices are being replaced by m ore dynamic com m odity index strategies
The above graph sets forth the historical performance of the indices from February 21, 2012, the Credit Suisse Commodity Backwardation Total Return Index (CSCUBKTR) inception date, to June 28, 2013. Historical performance is not indicative of future performance. The above graph does not reflect any performance of any product linked to the indices or include the investor fees associated with any product linked to the indices, which will reduce the amount of the return of such product.
DJUBSTR Index is set to 100 on February 12, 2012 to compare to the performance of CSCUBKTR. Source: the BLOOMBERG PROFESSIONALTM service, Credit Suisse Dates shown: February 21, 2012 – June 28, 2013
Historical performance returns or financial market scenarios are not indicative of current or future performance.
Slide 9
Evolution of com m odity investing
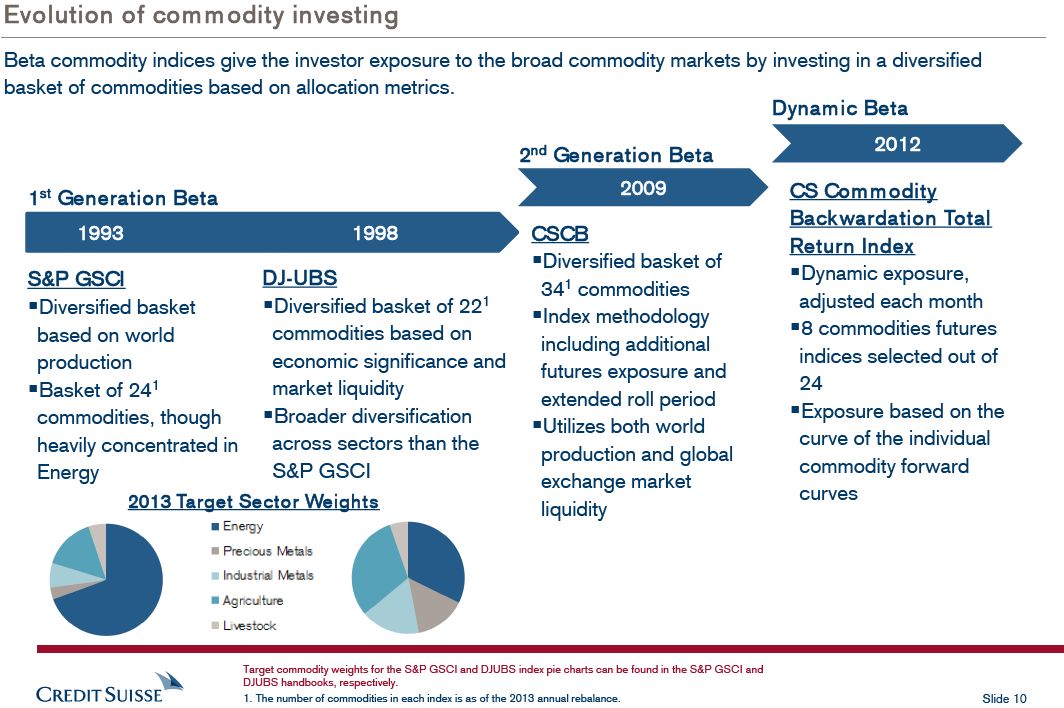
Beta commodity indices give the investor exposure to the broad commodity markets by investing in a diversified basket of commodities based on allocation metrics.
Dynamic Beta
2 2012nd Generation Beta
1 2009 CS Commodity st Generation Beta Backwardation Total 1993 1998 CSCB
Return Index§Diversified basket of S&P GSCI DJ-UBS§Dynamic exposure, 341 commodities§Diversified basket§Diversified basket of 221 adjusted each month§Index methodology based on world commodities based on§8 commodities futures including additional production economic significance and indices selected out of futures exposure and§Basket of 241 market liquidity 24 extended roll period commodities, though§Broader diversification§Exposure based on the§Utilizes both world heavily concentrated in across sectors than the curve of the individual production and global Energy S&P GSCI commodity forward exchange market 2013 Target Sector Weights curves liquidity
Target commodity weights for the S&P GSCI and DJUBS index pie charts can be found in the S&P GSCI and DJUBS handbooks, respectively.
1. The number of commodities in each index is as of the 2013 annual rebalance. Slide 10
![]()
Credit Suisse Commodity Benchmark Total Return Index
(the “Benchmark Index”)
Slide 11
Key features of the Benchmark Index
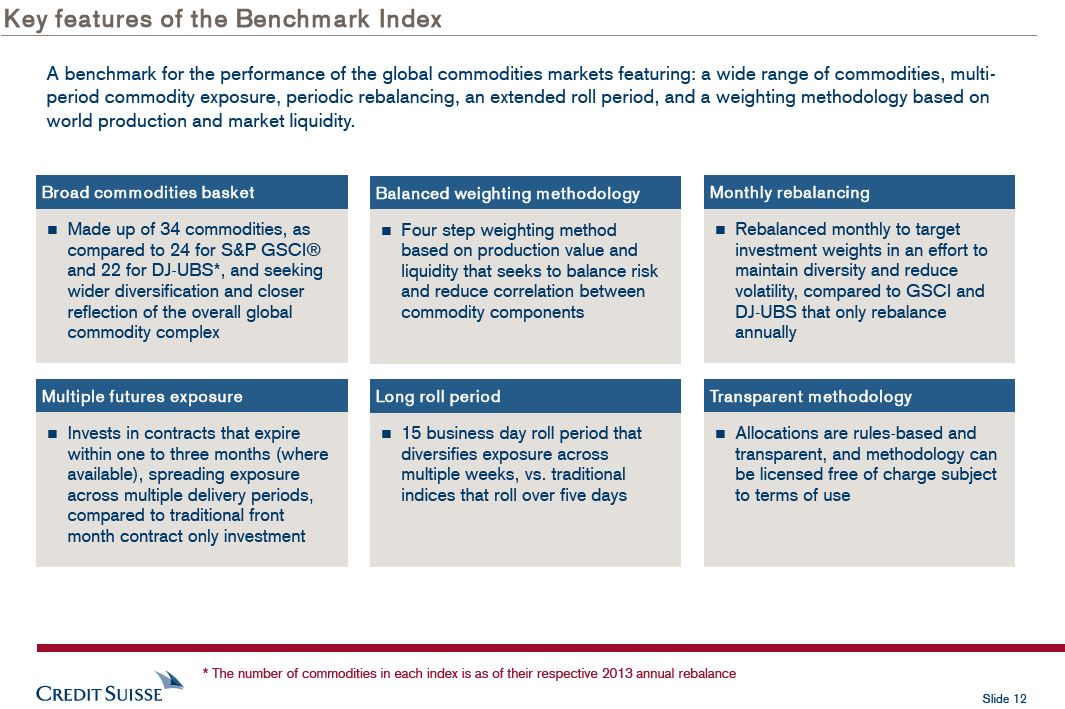
A benchmark for the performance of the global commodities markets featuring: a wide range of commodities, multi-period commodity exposure, periodic rebalancing, an extended roll period, and a weighting methodology based on world production and market liquidity.
Broad commodities basket Balanced weighting methodology Monthly rebalancing
n Made up of 34 commodities, asn Four step weighting methodn Rebalanced monthly to target compared to 24 for S&P GSCI® based on production value and investment weights in an effort to and 22 for DJ-UBS*, and seeking liquidity that seeks to balance risk maintain diversity and reduce wider diversification and closer and reduce correlation between volatility, compared to GSCI and reflection of the overall global commodity components DJ-UBS that only rebalance commodity complex annually
Multiple futures exposure Long roll period Transparent methodology
n Invests in contracts that expiren 15 business day roll period thatn Allocations are rules-based and within one to three months (where diversifies exposure across transparent, and methodology can available), spreading exposure multiple weeks, vs. traditional be licensed free of charge subject across multiple delivery periods, indices that roll over five days to terms of use compared to traditional front month contract only investment
* The number of commodities in each index is as of their respective 2013 annual rebalance
Slide 12
Benchm ark Index
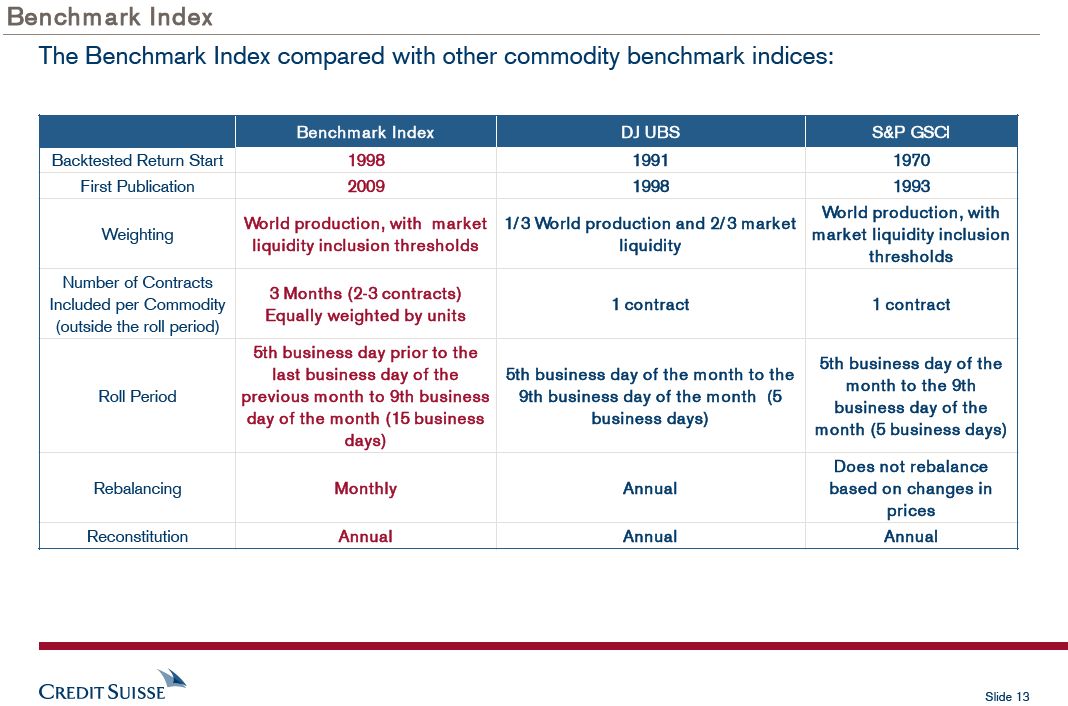
The Benchmark Index compared with other commodity benchmark indices:
Benchm ark Index DJ UBS S&P GSCI
Backtested Return Start 1998 1991 1970 First Publication 2009 1998 1993
World production, with World production, with market 1/ 3 World production and 2/ 3 market Weighting market liquidity inclusion liquidity inclusion thresholds liquidity thresholds Number of Contracts 3 Months (2-3 contracts) Included per Commodity 1 contract 1 contract Equally weighted by units (outside the roll period) 5th business day prior to the 5th business day of the last business day of the 5th business day of the month to the month to the 9th Roll Period previous m onth to 9th business 9th business day of the month (5 business day of the day of the m onth (15 business business days) m onth (5 business days) days) Does not rebalance Rebalancing Monthly Annual based on changes in prices Reconstitution Annual Annual Annual
Slide 13
Benchm ark Index futures contracts and roll period
106
Commodity Futures Contracts
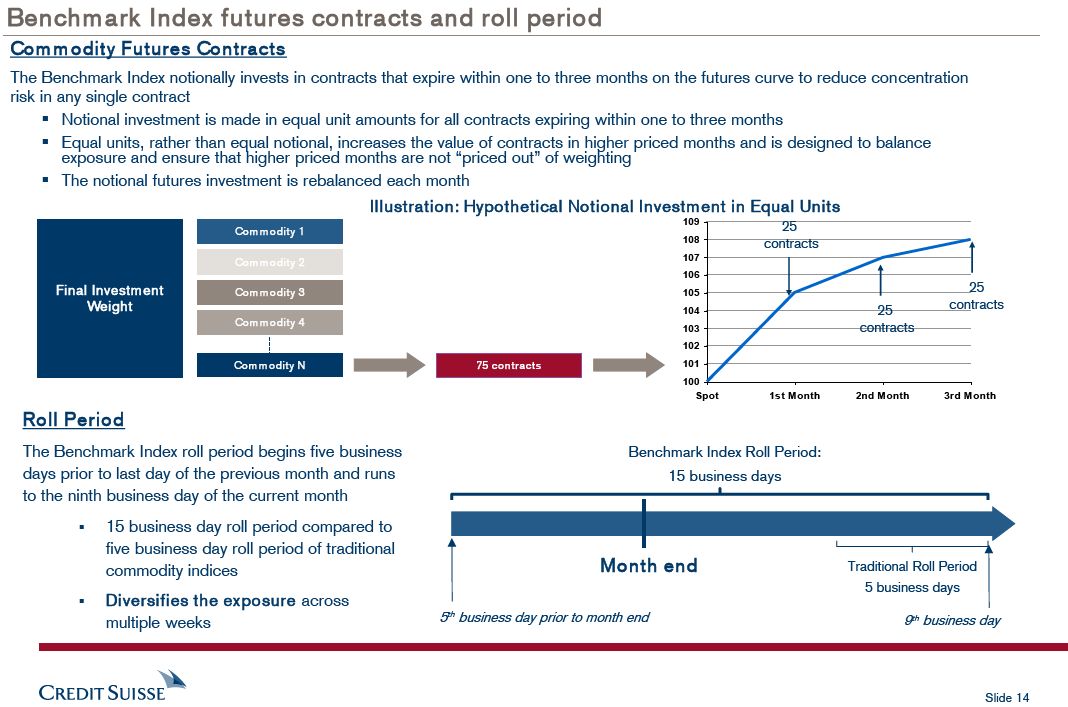
The Benchmark Index notionally invests in contracts that expire within one to three months on the futures 105to reduce concentration risk in any single contract§ Notional investment is made in equal unit amounts for all contracts expiring within one to three months 104§ Equal units, rather than equal notional, increases the value of contracts in higher priced months and is designed to balance exposure and ensure that higher priced months are not “priced out” of weighting
§ The notional futures investment is rebalanced each month 103 Illustration: Hypothetical Notional Investm ent in Equal Units
Com m odity 1 25 contracts Com m odity 2 101
Final Investm ent Com m odity 3 25 Weight contracts 25 Com m odity 4 100 contracts Com m odity N 75 contracts Spot
Roll Period
The Benchmark Index roll period begins five business Benchmark Index Roll Period: days prior to last day of the previous month and runs 15 business days to the ninth business day of the current month§ 15 business day roll period compared to five business day roll period of traditional
commodity indices Month end Traditional Roll Period 5 business days
§ Diversifies the exposure across
multiple weeks 5th business day prior to month end 9th business day
Slide 14
Benchmark Index commodity selection and weighting methodology
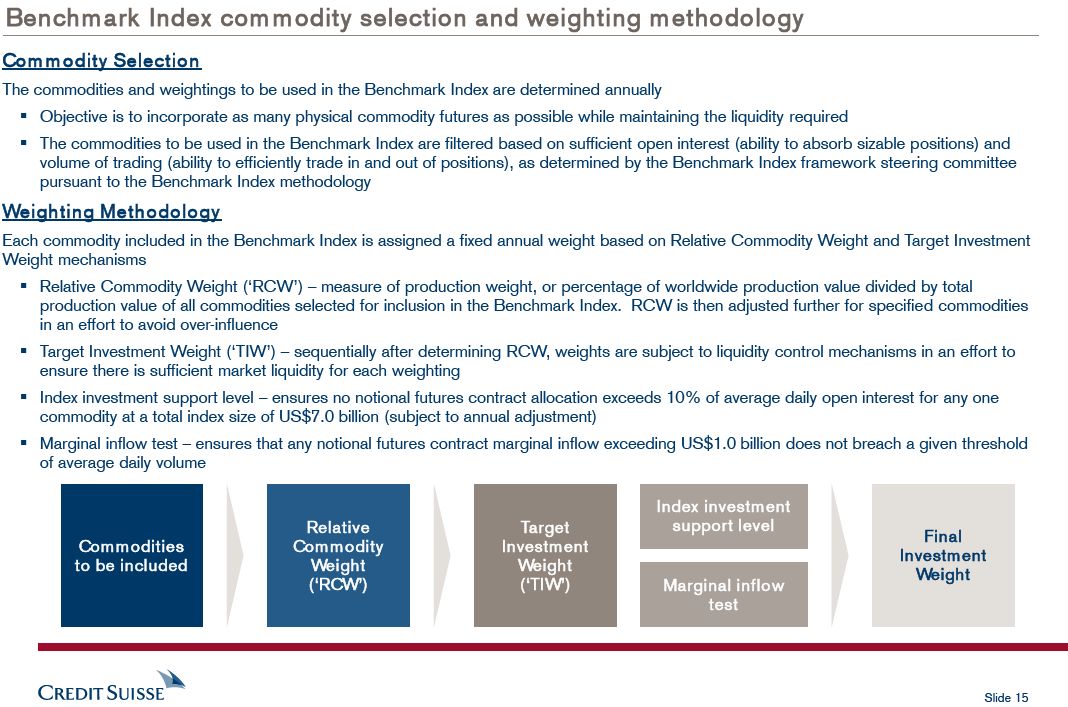
Commodity Selection
The commodities and weightings to be used in the Benchmark Index are determined annually
§ Objective is to incorporate as many physical commodity futures as possible while maintaining the liquidity required
§ The commodities to be used in the Benchmark Index are filtered based on sufficient open interest (ability to absorb sizable positions) and volume of trading (ability to efficiently trade in and out of positions), as determined by the Benchmark Index framework steering committee pursuant to the Benchmark Index methodology
Weighting Methodology
Each commodity included in the Benchmark Index is assigned a fixed annual weight based on Relative Commodity Weight and Target Investment Weight mechanisms§ Relative Commodity Weight (‘RCW’) – measure of production weight, or percentage of worldwide production value divided by total production value of all commodities selected for inclusion in the Benchmark Index. RCW is then adjusted further for specified commodities in an effort to avoid over-influence§ Target Investment Weight (‘TIW’) – sequentially after determining RCW, weights are subject to liquidity control mechanisms in an effort to ensure there is sufficient market liquidity for each weighting§ Index investment support level – ensures no notional futures contract allocation exceeds 10% of average daily open interest for any one commodity at a total index size of US$7.0 billion (subject to annual adjustment)§ Marginal inflow test – ensures that any notional futures contract marginal inflow exceeding US$1.0 billion does not breach a given threshold of average daily volume
Index investm ent Relative Target support level
Final Com m odities Com m odity Investm ent Investm ent to be included Weight Weight Weight
(‘RCW’) (‘TIW’) Marginal inflow test
Slide 15
Benchm ark Index monthly rebalancing
Rebalancing:
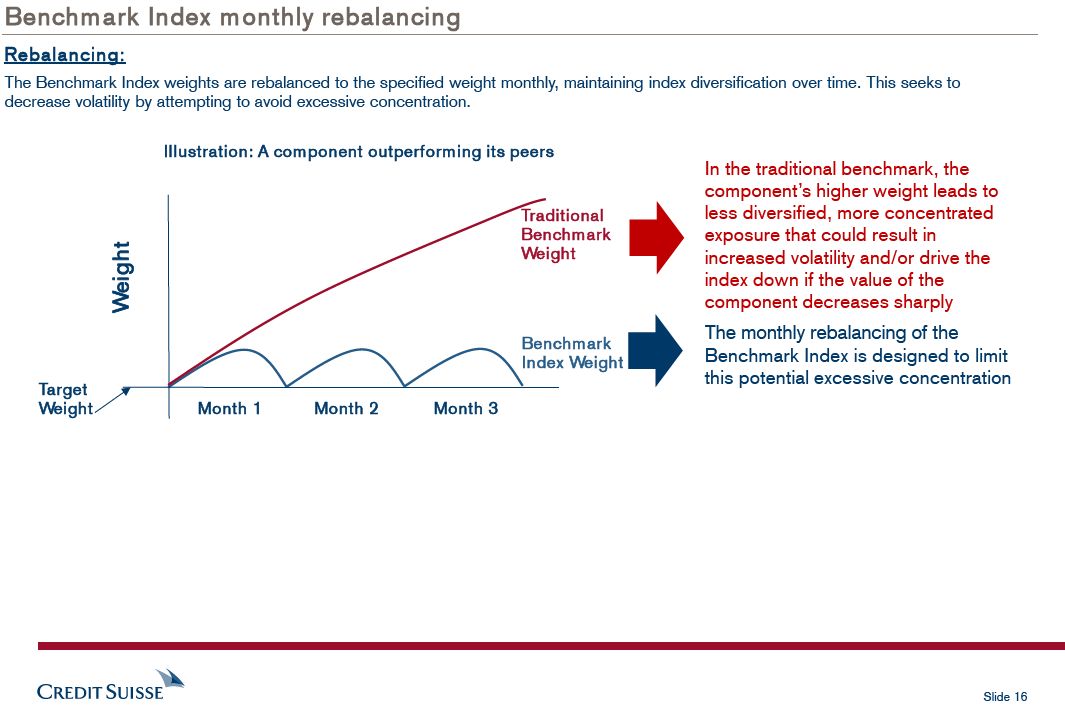
The Benchmark Index weights are rebalanced to the specified weight monthly, maintaining index diversification over time. This seeks to decrease volatility by attempting to avoid excessive concentration.
Illustration: A component outperforming its peers
In the traditional benchmark, the component’s higher weight leads to
Traditional less diversified, more concentrated Benchm ark exposure that could result in Weight Weight increased volatility and/or drive the index down if the value of the component decreases sharply The monthly rebalancing of the
Benchm ark
Index Weight Benchmark Index is designed to limit this potential excessive concentration
Target
Weight Month 1 Month 2 Month 3
Slide 16
Max
D
Benchmark index performance
Bes
Wo rs
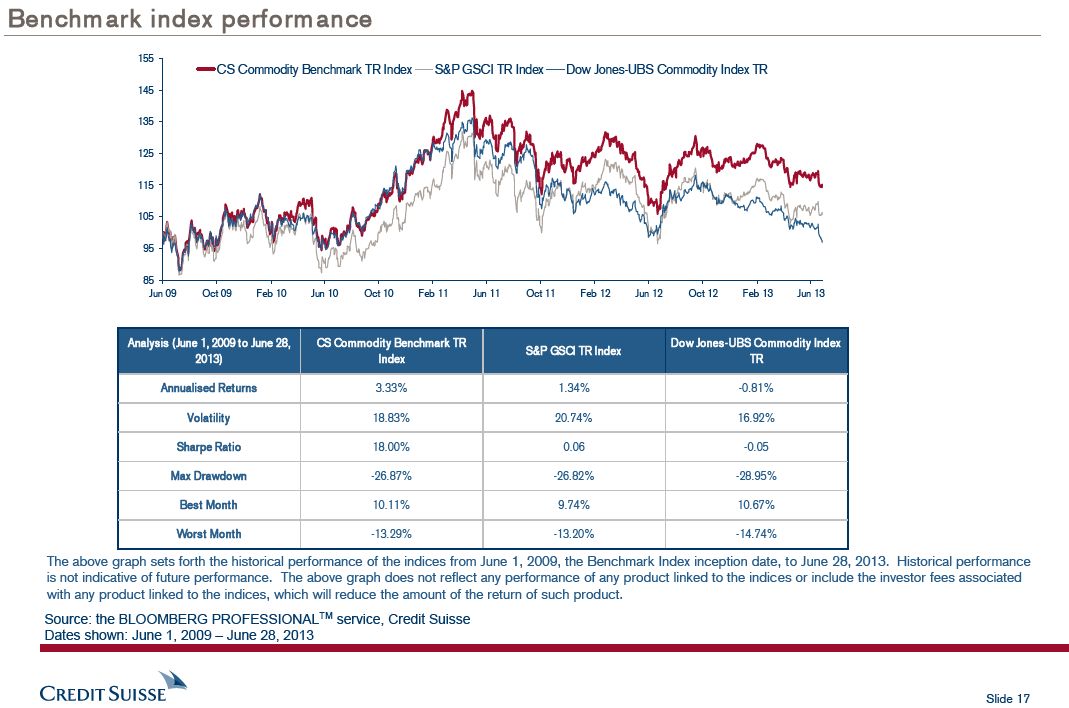
The above graph sets forth the historical performance of the indices from June 1, 2009, the Benchmark Index inception date, to June 28, 2013. Historical performance is not indicative of future performance. The above graph does not reflect any performance of any product linked to the indices or include the investor fees associated with any product linked to the indices, which will reduce the amount of the return of such product.
Source: the BLOOMBERG PROFESSIONALTM service, Credit Suisse Dates shown: June 1, 2009 – June 28, 2013
Slide 17
Selected risk considerations: Risks related to the Benchmark Index
Concentration risk – The Benchmark Index reflects a concentrated exposure to commodities and, therefore, could experience greater volatility than a more diversified investment and is exposed to significant market risks.
Commodity prices are characterized by high and unpredictable volatility, which could lead to high and unpredictable volatility in the Benchm ark Index – Market prices of the notional commodity futures contracts referenced in the Benchmark Index tend to be highly volatile. Commodity market prices are not related to the value of a future income or earnings stream, as tends to be the case with fixed-income and equity investments, but are subject to rapid fluctuations based on numerous factors, including changes in supply and demand relationships, governmental programs and policies, national and international monetary, trade, political and economic events, changes in interest and exchange rates, speculation and trading activities in commodities and related contracts, weather, and agricultural, trade, fiscal and exchange control policies.
The Benchm ark Index tracks prices of futures contracts with expiration dates approximately one to three months in the future, which m ay affect the level of the Benchm ark Index in various ways – A futures contract for a commodity typically specifies an expiration date, which is the date on which the contract will cease to trade, and a delivery date, which is the date on which the underlying physical commodity referenced by the futures contract is delivered. A
“front-month futures contract” refers to the futures contract that has the nearest expiration date. The Benchmark Index selects and rolls the underlying commodities futures contracts according to a rules-based strategy. As a result, the Benchmark Index provides exposure to futures contracts with varying maturities, and the performance of the Benchmark Index will differ from indices that track only front-month futures contracts.
The Benchm ark Index does not provide exposure to spot prices of com m odities – Price movements in futures contracts on commodities may not correlate with changes in the spot prices of commodities. A variety of factors can lead to a disparity between the price of a futures contract in a commodity and the spot price of that commodity, including storage costs, transportation costs, interest rates and expectations concerning supply and demand for the commodity. The Benchmark Index provides exposure to prices of futures contracts and not the spot prices of the commodities underlying the Benchmark Index.
You will not have any rights in any physical com m odities, or any rights in the com m odity futures contracts included in the Benchmark Index.
Potential conflicts – Credit Suisse and its affiliates play a variety of roles in connection with the Benchmark Index, including acting as calculation agent and index sponsor, and expects to hedge its obligations under any financial instrument linked to the Benchmark Index. In performing these roles, the economic interests of the calculation agent, index sponsor and other affiliates of Credit Suisse are potentially adverse to the interests of an investor seeking exposure to the Benchmark Index.
The Benchm ark Index has limited perform ance history and m ay perform in unexpected ways.
Past perform ance of the Benchm ark Index is not indicative of future perform ance – The actual performance of the Benchmark Index may bear little relation to the historical values of the Benchmark Index. We cannot predict the future performance of the Benchmark Index.
These risks are not exhaustive – The selected risk considerations herein are not intended as a complete description of all the risks associated with the
Benchmark Index. For further information regarding risks, please see the section entitled “Risk Factors” in the applicable pricing supplement.
Slide 18
Credit Suisse Commodity Backwardation Total Return Index
(the “Backwardation Index”)
Slide 19
Backwardation Index
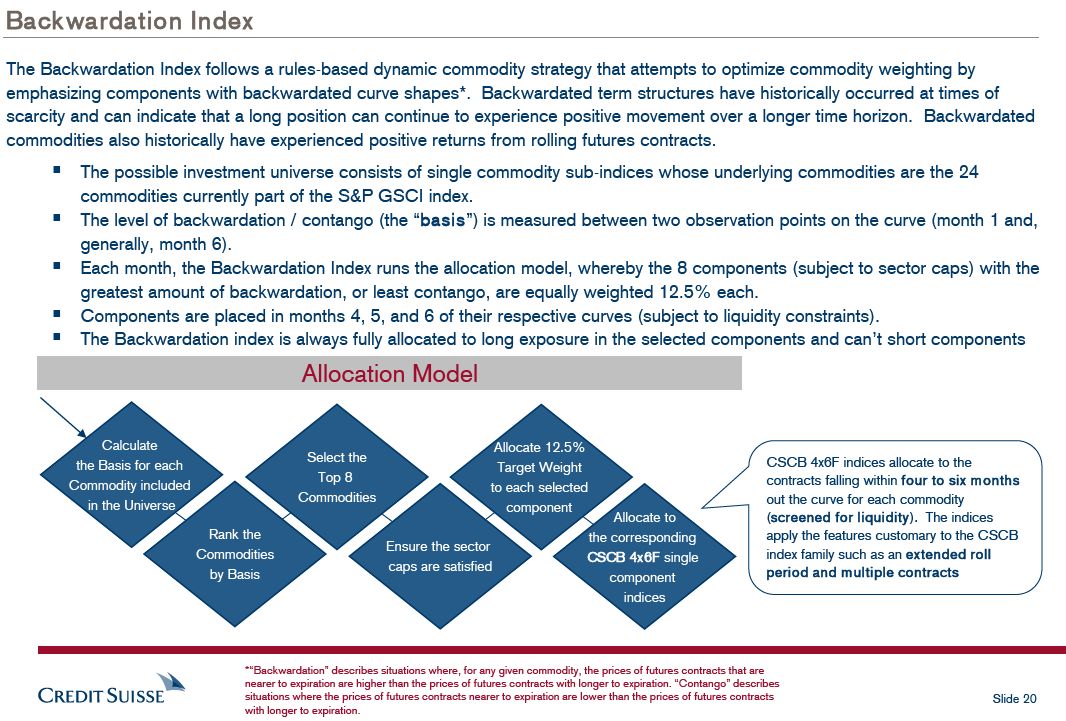
The Backwardation Index follows a rules-based dynamic commodity strategy that attempts to optimize commodity weighting by emphasizing components with backwardated curve shapes*. Backwardated term structures have historically occurred at times of scarcity and can indicate that a long position can continue to experience positive movement over a longer time horizon. Backwardated commodities also historically have experienced positive returns from rolling futures contracts.
§ The possible investment universe consists of single commodity sub-indices whose underlying commodities are the 24 commodities currently part of the S&P GSCI index.
§ The level of backwardation / contango (the “basis”) is measured between two observation points on the curve (month 1 and, generally, month 6).
§ Each month, the Backwardation Index runs the allocation model, whereby the 8 components (subject to sector caps) with the greatest amount of backwardation, or least contango, are equally weighted 12.5% each.
§ Components are placed in months 4, 5, and 6 of their respective curves (subject to liquidity constraints).
§ The Backwardation index is always fully allocated to long exposure in the selected components and can’t short components
Allocation Model
Calculate Allocate 12.5%
Select the CSCB 4x6F indices allocate to the the Basis for each Target Weight
Top 8 contracts falling within four to six months Commodity included to each selected Commodities out the curve for each commodity in the Universe component Allocate to (screened for liquidity). The indices Rank the the corresponding apply the features customary to the CSCB
Ensure the sector
Commodities CSCB 4x6F single index family such as an extended roll caps are satisfied period and multiple contracts by Basis component indices
*“Backwardation” describes situations where, for any given commodity, the prices of futures contracts that are nearer to expiration are higher than the prices of futures contracts with longer to expiration. “Contango” describes situations where the prices of futures contracts nearer to expiration are lower than the prices of futures contracts Slide 20 with longer to expiration.
![]()
Backwardation Index - background
Backwardation and contango describe shapes of the forward curves for a given commodity. In a “normal” market, prices further out on the term structure are higher than nearby prices. This upward sloping shape is referred to as contango. Backwardation describes commodity curves where nearby prices are higher than forward prices. Backwardation indicates a downward sloping curve.
Contango
(Forward prices higher than nearby prices)§ Theoretically, in a “normal” market, prices further out on the term structure are higher than nearby prices (referred to as “contango”) due to costs related to: o Storage o Insurance Price o Financing Time to expiration
Backwardation
(Forward prices lower than nearby prices)§ Market participants sometimes view backwardation as a signal that the underlying market for that commodity is “tight,” meaning in short supply and experiencing buying pressure for nearby deliveries: o When a commodity becomes scarce in the physical market, consumers in need of the commodity bid up its price Price o This behavior forces the front of the futures curve up, potentially bringing the term structure into backwardation§ The prices of com m odities in physically tighter markets, i.e. backwardation, Time to expiration historically tended to outperform those in less physically tight markets.
Slide 21
Backwardation LME Aluminum Prima
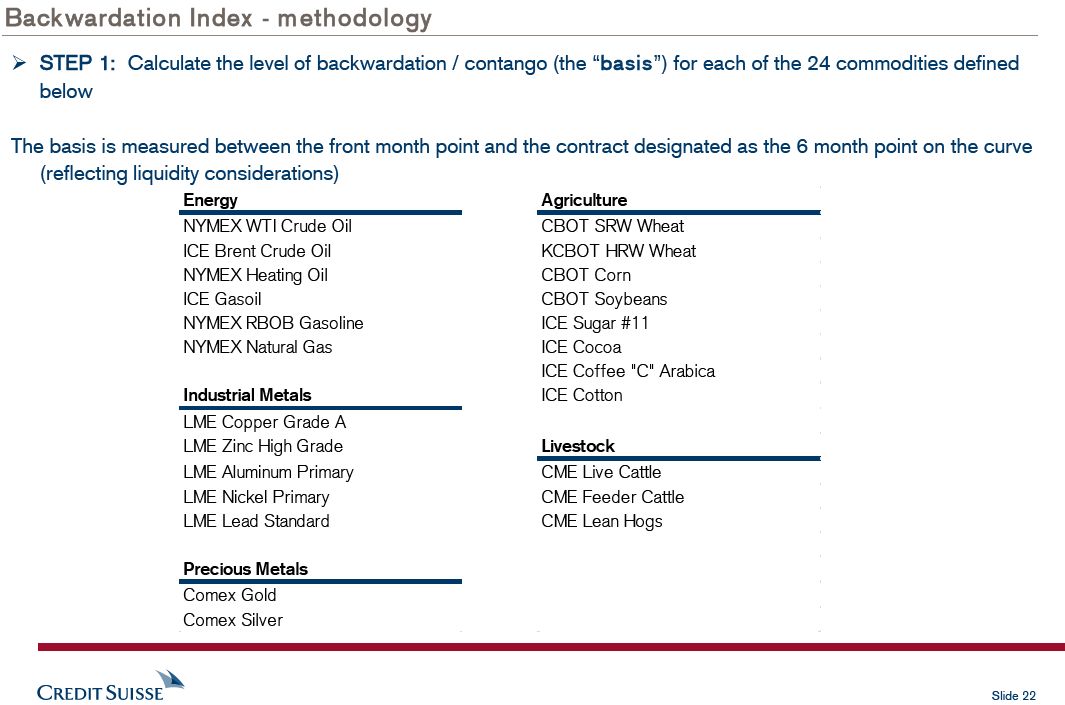
Ø STEP 1: Calcula
below LME Nickel Primary
The basis is measur
(reflecting liquidi LME Lead Standard
Precious Metals
Comex Gold Comex Silver
Slide 22
Backwardation Index - methodo
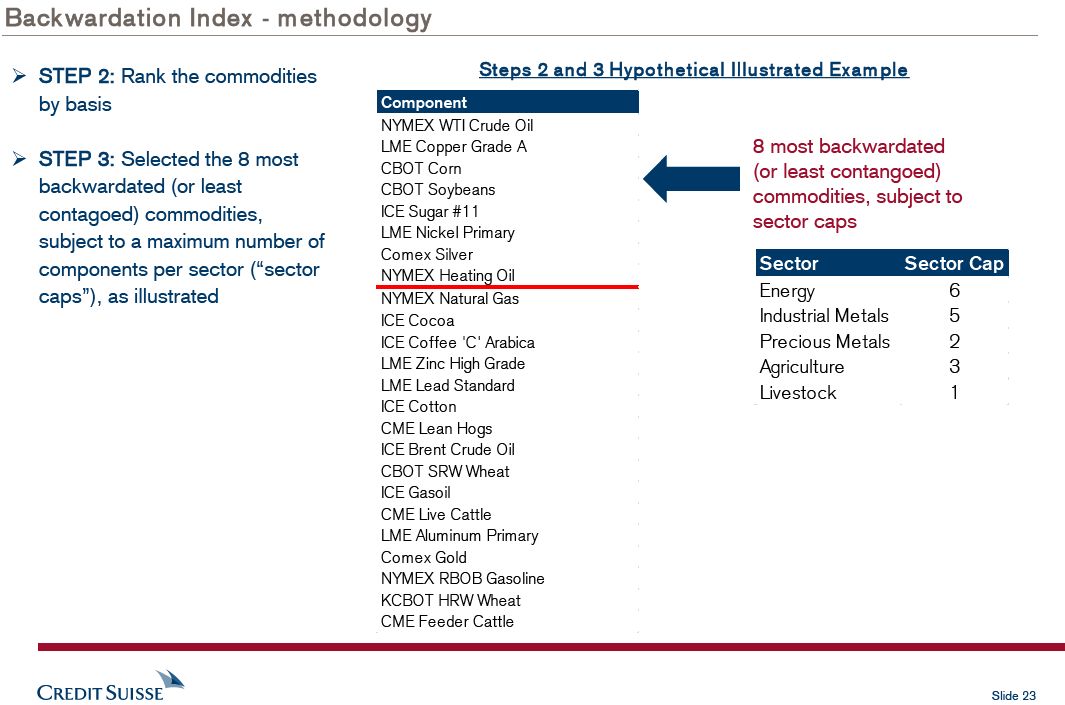
Ø STEP 2: Rank the commodities
by basis LME Aluminum Primary
Ø STEP 3: Selected the 8 most backwardated (or least contagoed) commodities, Comex Gold subject to a maximum number of components per sector (“sector caps”), as illustrated NYMEX RBOB Gasoline
KCBOT HRWWheat CME Feeder Cattle
Slide 23
Backwardation In
NYM EX WTI Light Crud
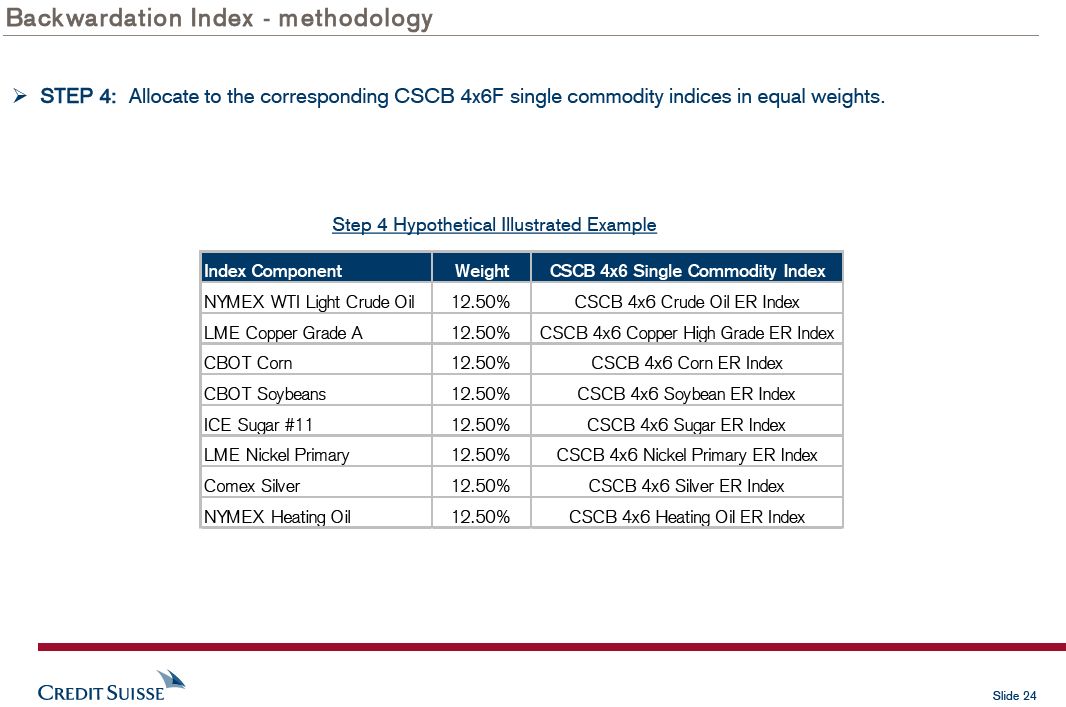
Ø STEP 4: Allocate to the corresponding CSCB 4x6F single commodity indices in equal weights.
LM E Copper Grade A
CBO T Corn
Step 4 Hypothetical Illustrated Example
CBO T Soybeans ICE Sugar #11
LME Nickel Primary Comex Silver NYM EX Heating O il
Slide 24
Max
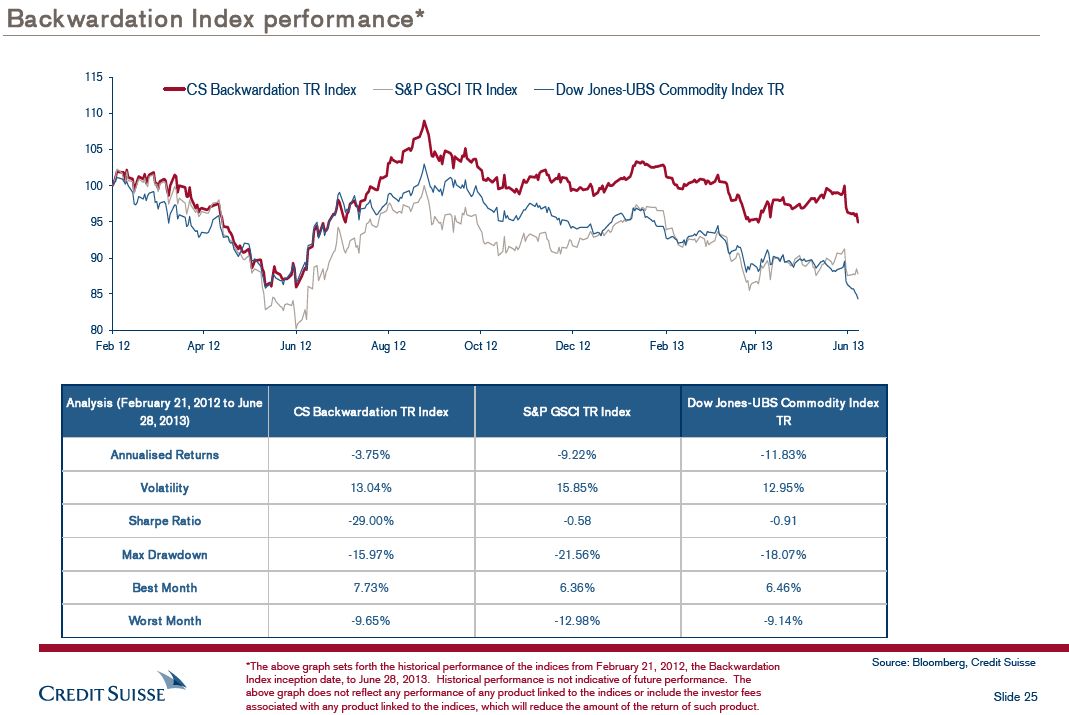
Backwardation Index perform ance*
Be
Wo r
*The above graph sets forth the historical performance of the indices from February 21, 2012, the Backwardation Source: Bloomberg, Credit Suisse Index inception date, to June 28, 2013. Historical performance is not indicative of future performance. The above graph does not reflect any performance of any product linked to the indices or include the investor fees Slide 25 associated with any product linked to the indices, which will reduce the amount of the return of such product.
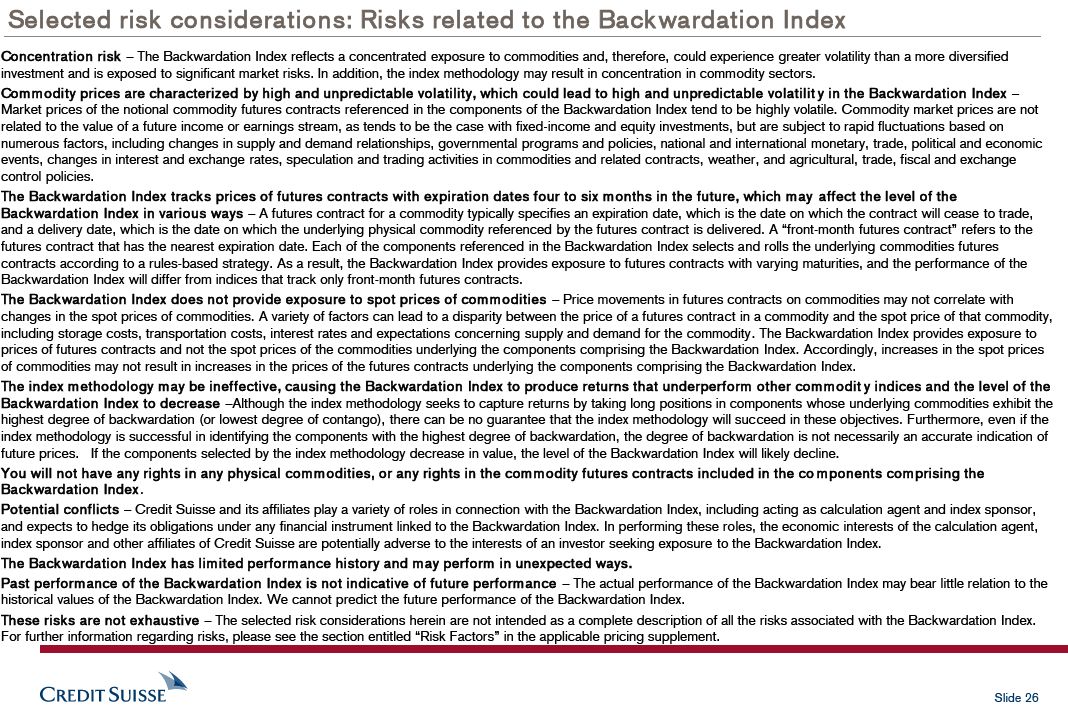
Selected risk considerations: Risks related to the Backwardation Index
Concentration risk – The Backwardation Index reflects a concentrated exposure to commodities and, therefore, could experience greater volatility than a more diversified investment and is exposed to significant market risks. In addition, the index methodology may result in concentration in commodity sectors.
Com m odity prices are characterized by high and unpredictable volatility, which could lead to high and unpredictable volatilit y in the Backwardation Index –Market prices of the notional commodity futures contracts referenced in the components of the Backwardation Index tend to be highly volatile. Commodity market prices are not related to the value of a future income or earnings stream, as tends to be the case with fixed-income and equity investments, but are subject to rapid fluctuations based on numerous factors, including changes in supply and demand relationships, governmental programs and policies, national and international monetary, trade, political and economic events, changes in interest and exchange rates, speculation and trading activities in commodities and related contracts, weather, and agricultural, trade, fiscal and exchange control policies.
The Backwardation Index tracks prices of futures contracts with expiration dates four to six m onths in the future, which m ay affect the level of the Backwardation Index in various ways – A futures contract for a commodity typically specifies an expiration date, which is the date on which the contract will cease to trade, and a delivery date, which is the date on which the underlying physical commodity referenced by the futures contract is delivered. A “front-month futures contract” refers to the futures contract that has the nearest expiration date. Each of the components referenced in the Backwardation Index selects and rolls the underlying commodities futures contracts according to a rules-based strategy. As a result, the Backwardation Index provides exposure to futures contracts with varying maturities, and the performance of the Backwardation Index will differ from indices that track only front-month futures contracts.
The Backwardation Index does not provide exposure to spot prices of com m odities – Price movements in futures contracts on commodities may not correlate with changes in the spot prices of commodities. A variety of factors can lead to a disparity between the price of a futures contract in a commodity and the spot price of that commodity, including storage costs, transportation costs, interest rates and expectations concerning supply and demand for the commodity. The Backwardation Index provides exposure to prices of futures contracts and not the spot prices of the commodities underlying the components comprising the Backwardation Index. Accordingly, increases in the spot prices of commodities may not result in increases in the prices of the futures contracts underlying the components comprising the Backwardation Index.
The index m ethodology m ay be ineffective, causing the Backwardation Index to produce returns that underperform other commodity indices and the level of the Backwardation Index to decrease –Although the index methodology seeks to capture returns by taking long positions in components whose underlying commodities exhibit the highest degree of backwardation (or lowest degree of contango), there can be no guarantee that the index methodology will succeed in these objectives. Furthermore, even if the index methodology is successful in identifying the components with the highest degree of backwardation, the degree of backwardation is not necessarily an accurate indication of future prices. If the components selected by the index methodology decrease in value, the level of the Backwardation Index will likely decline.
You will not have any rights in any physical com m odities, or any rights in the com m odity futures contracts included in the components comprising the Backwardation Index .
Potential conflicts – Credit Suisse and its affiliates play a variety of roles in connection with the Backwardation Index, including acting as calculation agent and index sponsor, and expects to hedge its obligations under any financial instrument linked to the Backwardation Index. In performing these roles, the economic interests of the calculation agent, index sponsor and other affiliates of Credit Suisse are potentially adverse to the interests of an investor seeking exposure to the Backwardation Index.
The Backwardation Index has lim ited perform ance history and m ay perform in unexpected ways.
Past perform ance of the Backwardation Index is not indicative of future perform ance – The actual performance of the Backwardation Index may bear little relation to the historical values of the Backwardation Index. We cannot predict the future performance of the Backwardation Index.
These risks are not exhaustive – The selected risk considerations herein are not intended as a complete description of all the risks associated with the Backwardation Index.
For further information regarding risks, please see the section entitled “Risk Factors” in the applicable pricing supplement.
Slide 26
Summary:
Credit Suisse Commodity Benchm ark ETN (CSCB) Credit Suisse Commodity Rotation ETN (CSCR)
Slide 27
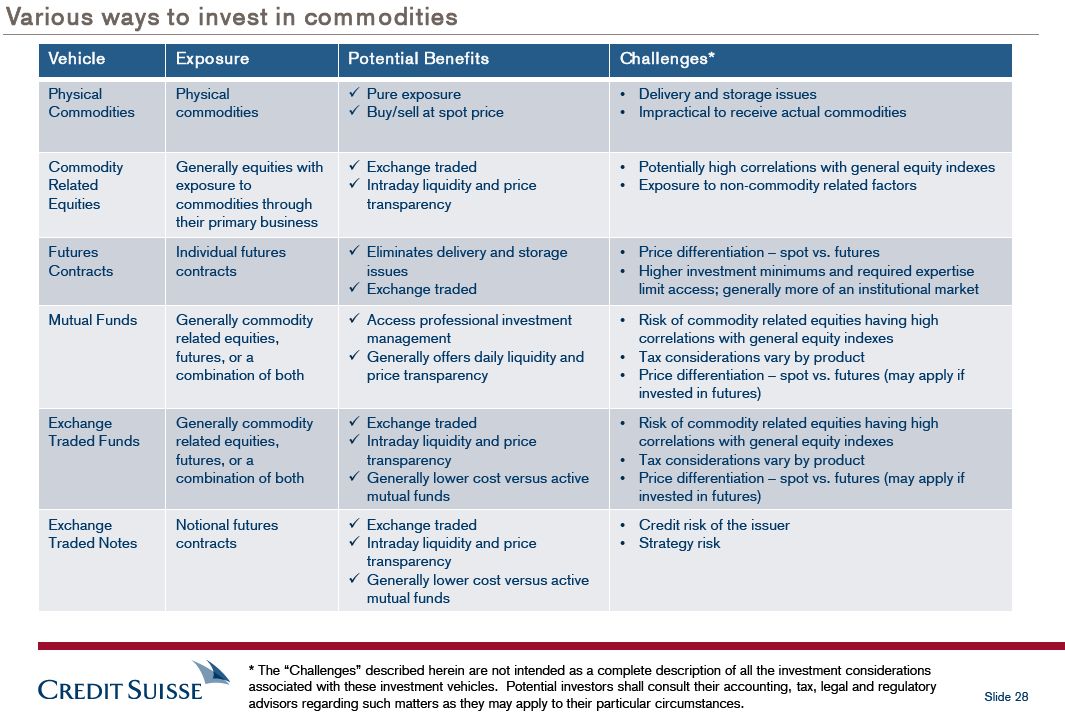
Various ways to invest in com m odities
Vehicle Exposure Potential Benefits Challenges*
Physical Physicalü Pure exposure • Delivery and storage issues
Commodities commoditiesü Buy/sell at spot price • Impractical to receive actual commodities
Commodity Generally equities withü Exchange traded • Potentially high correlations with general equity indexes Related exposure toü Intraday liquidity and price • Exposure to non-commodity related factors Equities commodities through transparency their primary business Futures Individual futuresü Eliminates delivery and storage • Price differentiation – spot vs. futures Contracts contracts issues • Higher investment minimums and required expertiseü Exchange traded limit access; generally more of an institutional market Mutual Funds Generally commodityü Access professional investment • Risk of commodity related equities having high related equities, management correlations with general equity indexes futures, or aü Generally offers daily liquidity and • Tax considerations vary by product combination of both price transparency • Price differentiation – spot vs. futures (may apply if invested in futures) Exchange Generally commodityü Exchange traded • Risk of commodity related equities having high Traded Funds related equities,ü Intraday liquidity and price correlations with general equity indexes futures, or a transparency • Tax considerations vary by product combination of bothü Generally lower cost versus active • Price differentiation – spot vs. futures (may apply if mutual funds invested in futures) Exchange Notional futuresü Exchange traded • Credit risk of the issuer Traded Notes contractsü Intraday liquidity and price • Strategy risk transparencyü Generally lower cost versus active mutual funds
* The “Challenges” described herein are not intended as a complete description of all the investment considerations associated with these investment vehicles. Potential investors shall consult their accounting, tax, legal and regulatory
Slide 28 advisors regarding such matters as they may apply to their particular circumstances.
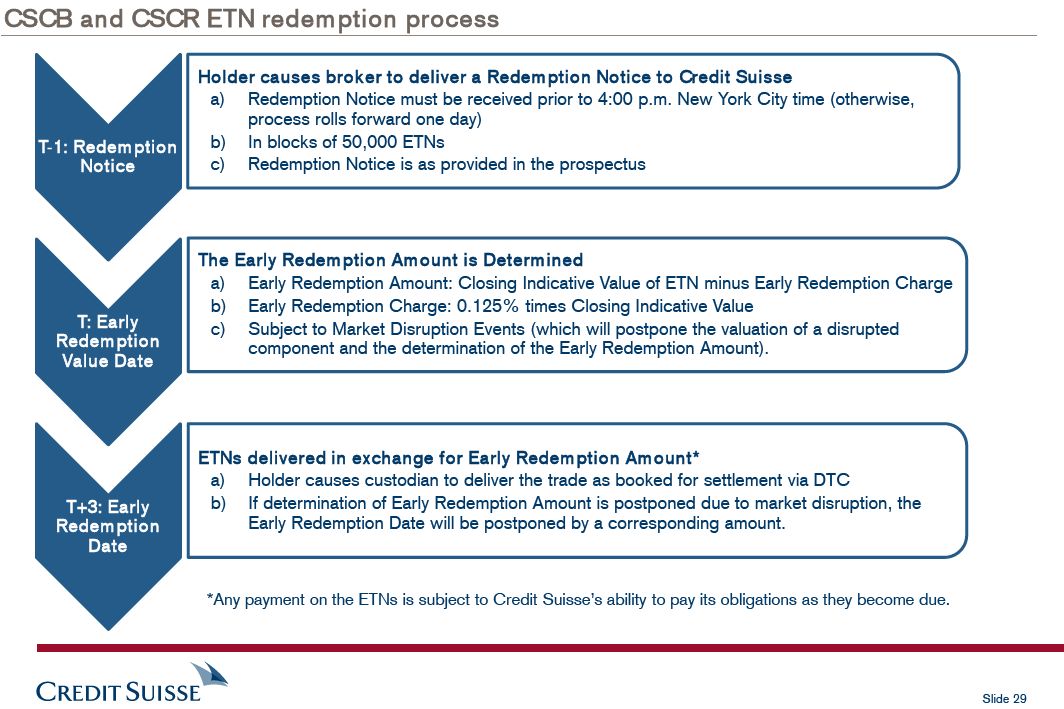
CSCB and CSCR ETN redemption process
Holder causes broker to deliver a Redem ption Notice to Credit Suisse a) Redemption Notice must be received prior to 4:00 p.m. New York City time (otherwise, process rolls forward one day) T-1: Redemption b) In blocks of 50,000 ETNs Notice c) Redemption Notice is as provided in the prospectus
The Early Redem ption Amount is Determined a) Early Redemption Amount: Closing Indicative Value of ETN minus Early Redemption Charge b) Early Redemption Charge: 0.125% times Closing Indicative Value T: Early c) Subject to Market Disruption Events (which will postpone the valuation of a disrupted Redem ption component and the determination of the Early Redemption Amount).
Value Date
ETNs delivered in exchange for Early Redem ption Am ount* a) Holder causes custodian to deliver the trade as booked for settlement via DTC
T+3: Early b) If determination of Early Redemption Amount is postponed due to market disruption, the Redem ption Early Redemption Date will be postponed by a corresponding amount.
Date
*Any payment on the ETNs is subject to Credit Suisse’s ability to pay its obligations as they become due.
Slide 29
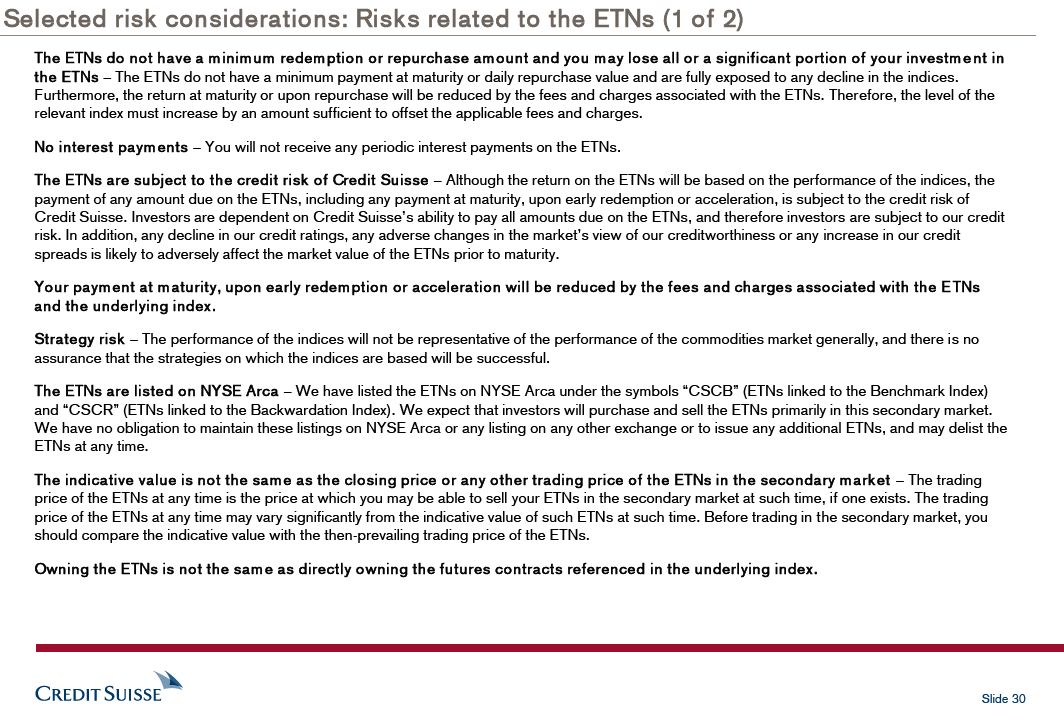
Selected risk considerations: Risks related to the ETNs (1 of 2)
The ETNs do not have a minimum redem ption or repurchase am ount and you m ay lose all or a significant portion of your investment in the ETNs – The ETNs do not have a minimum payment at maturity or daily repurchase value and are fully exposed to any decline in the indices. Furthermore, the return at maturity or upon repurchase will be reduced by the fees and charges associated with the ETNs. Therefore, the level of the relevant index must increase by an amount sufficient to offset the applicable fees and charges.
No interest payments – You will not receive any periodic interest payments on the ETNs.
The ETNs are subject to the credit risk of Credit Suisse – Although the return on the ETNs will be based on the performance of the indices, the payment of any amount due on the ETNs, including any payment at maturity, upon early redemption or acceleration, is subject to the credit risk of
Credit Suisse. Investors are dependent on Credit Suisse’s ability to pay all amounts due on the ETNs, and therefore investors are subject to our credit risk. In addition, any decline in our credit ratings, any adverse changes in the market’s view of our creditworthiness or any increase in our credit spreads is likely to adversely affect the market value of the ETNs prior to maturity.
Your paym ent at maturity, upon early redem ption or acceleration will be reduced by the fees and charges associated with the E TNs and the underlying index.
Strategy risk – The performance of the indices will not be representative of the performance of the commodities market generally, and there is no assurance that the strategies on which the indices are based will be successful.
The ETNs are listed on NYSE Arca – We have listed the ETNs on NYSE Arca under the symbols “CSCB” (ETNs linked to the Benchmark Index) and “CSCR” (ETNs linked to the Backwardation Index). We expect that investors will purchase and sell the ETNs primarily in this secondary market. We have no obligation to maintain these listings on NYSE Arca or any listing on any other exchange or to issue any additional ETNs, and may delist the ETNs at any time.
The indicative value is not the same as the closing price or any other trading price of the ETNs in the secondary m arket – The trading price of the ETNs at any time is the price at which you may be able to sell your ETNs in the secondary market at such time, if one exists. The trading price of the ETNs at any time may vary significantly from the indicative value of such ETNs at such time. Before trading in the secondary market, you should compare the indicative value with the then-prevailing trading price of the ETNs.
Owning the ETNs is not the sam e as directly owning the futures contracts referenced in the underlying index.
Slide 30
![]()
Selected risk considerations: Risks related to the ETNs (2 of 2)
We have the right to accelerate the ETNs in whole or in part at any tim e – We have the right to accelerate the ETNs in whole or in part at any time. The amount you may receive upon an acceleration by Credit Suisse may be less than the amount you would receive on your investment at maturity or if you had elected to have us repurchase your ETNs at a time of your choosing.
Investm ent and tax risk – The information contained in this presentation does not provide personal investment or tax advice. Potential investors should consult their accounting, tax, legal and regulatory advisors regarding such matters as they may apply to your particular circumstances.
The m arket value of the ETNs m ay be influenced by m any unpredictable factors.
An investm ent in the ETNs involves significant risks – An investment in the ETNs involves significant risks. The selected investment considerations herein are not intended as a complete description of all risks associated with the ETNs. For further information regarding risks, please see the section entitled “Risk Factors” in the applicable pricing supplement.
Credit Suisse AG (“Credit Suisse”) has filed a registration statement (including prospectus supplement and prospectus) with the Securities and Exchange Commission, or SEC, for the offering of securities to which this communication relates. Before you invest, you should read the applicable pricing supplement, the Prospectus Supplement dated March 23, 2012, and Prospectus dated March 23, 2012, to understand fully the terms of the ETNs and other considerations that are important in making a decision about investing in the ETNs. You may get these documents without cost by visiting EDGAR on the SEC website at www.sec.gov. Alternatively, Credit Suisse, any agent or dealer participating in an offering will arrange to send you the pricing supplement, prospectus supplement and prospectus if you so request by calling toll-free 1 (800) 221-1037.
You may access the applicable pricing supplements related to the ETNs discussed herein on the SEC website: CSCB: http://www.sec.gov/Archives/edgar/data/1053092/000089109213005275/e54086_424b2.htm CSCR: http://www.sec.gov/Archives/edgar/data/1053092/000089109213005273/e54087_424b2.htm
You may access the prospectus supplement and prospectus on the SEC website at www.sec.gov or by clicking on the hyperlinks to each of the respective documents incorporated by reference in the pricing supplement.
Slide 31
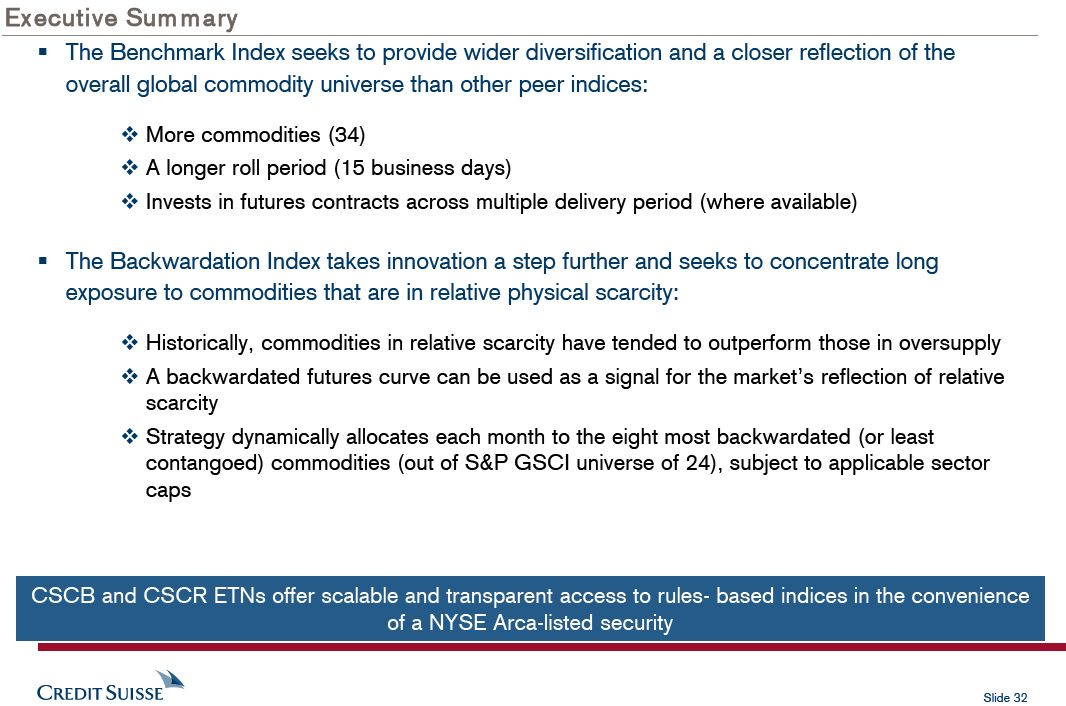
Executive Summary
§ The Benchmark Index seeks to provide wider diversification and a closer reflection of the overall global commodity universe than other peer indices:
v More commodities (34)v A longer roll period (15 business days)v Invests in futures contracts across multiple delivery period (where available)
§ The Backwardation Index takes innovation a step further and seeks to concentrate long exposure to commodities that are in relative physical scarcity:
v Historically, commodities in relative scarcity have tended to outperform those in oversupplyv A backwardated futures curve can be used as a signal for the market’s reflection of relative scarcityv Strategy dynamically allocates each month to the eight most backwardated (or least contangoed) commodities (out of S&P GSCI universe of 24), subject to applicable sector caps
CSCB and CSCR ETNs offer scalable and transparent access to rules- based indices in the convenience of a NYSE Arca-listed security
Slide 32
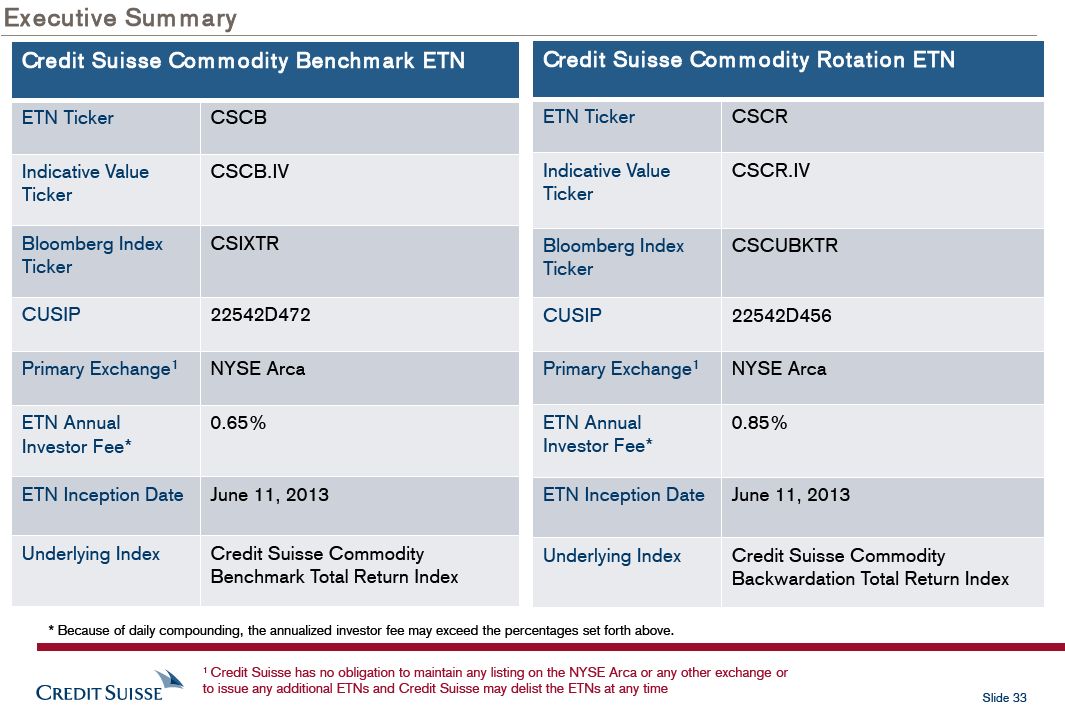
Executive Sum m ary
Credit Suisse Com m odity Benchm ark ETN Credit Suisse Com m odity Rotation ETN
ETN Ticker CSCB ETN Ticker CSCR
Indicative Value CSCB.IV Indicative Value CSCR.IV Ticker Ticker
Bloomberg Index CSIXTR Bloomberg Index CSCUBKTR Ticker Ticker
CUSIP 22542D472 CUSIP 22542D456
Primary Exchange1 NYSE Arca Primary Exchange1 NYSE Arca
ETN Annual 0.65% ETN Annual 0.85% Investor Fee* Investor Fee*
ETN Inception Date June 11, 2013 ETN Inception Date June 11, 2013
Underlying Index Credit Suisse Commodity Underlying Index Credit Suisse Commodity Benchmark Total Return Index Backwardation Total Return Index
* Because of daily compounding, the annualized investor fee may exceed the percentages set forth above.
1 Credit Suisse has no obligation to maintain any listing on the NYSE Arca or any other exchange or to issue any additional ETNs and Credit Suisse may delist the ETNs at any time
Slide 33