Exhibit 99.1
 | NEWS RELEASE January 26, 2022 | |||||||
| Contacts: Dan Schlanger, CFO | |||||
| Ben Lowe, SVP & Treasurer | |||||
| FOR IMMEDIATE RELEASE | Crown Castle International Corp. | ||||
713-570-3050 | |||||
CROWN CASTLE REPORTS FOURTH QUARTER AND FULL YEAR 2021 RESULTS, INCREASES OUTLOOK FOR FULL YEAR 2022
January 26, 2022 - HOUSTON, TEXAS - Crown Castle International Corp. (NYSE: CCI) ("Crown Castle") today reported results for the fourth quarter and full year ended December 31, 2021 and increased its full year 2022 outlook, as reflected in the table below.
| Full Year 2022 | Full Year 2021 | ||||||||||||||||||||||
| (dollars in millions, except per share amounts) | Current Outlook Midpoint(a) | Change to Midpoint from Previous Outlook(b) | Midpoint Growth Rate Compared to Previous Year Actual | Actual | Actual Growth Rate Compared to Previous Year Actual(c) | ||||||||||||||||||
| As Reported | As Adjusted(d) | ||||||||||||||||||||||
| Site rental revenues | $6,225 | +$250 | 9% | $5,719 | 8% | 8% | |||||||||||||||||
Income (loss) from continuing operations(e) | $1,674 | +$250 | 45% | $1,158(f) | 10% | 39% | |||||||||||||||||
Income (loss) from continuing operations per share—diluted(e)(g) | $3.85 | +$0.57 | 44% | $2.67(f) | 14% | 46% | |||||||||||||||||
Adjusted EBITDA(e) | $4,272 | +$250 | 12% | $3,816 | 3% | 12% | |||||||||||||||||
AFFO(e)(g) | $3,201 | $— | 6% | $3,013 | 5% | 16% | |||||||||||||||||
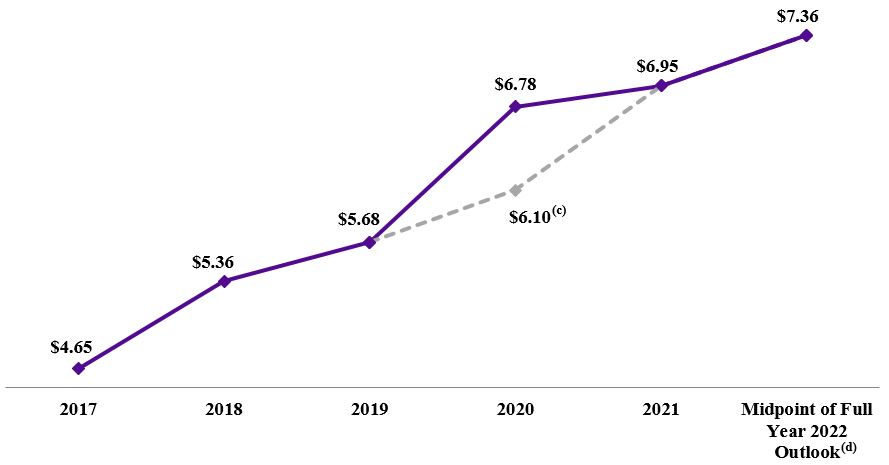
AFFO per share(e)(g) | $7.36 | $— | 6% | $6.95 | 3% | 14% | |||||||||||||||||
(a)As issued on January 26, 2022.
(b)As issued on October 20, 2021.
(c)See "Results for the Year" below for our full year 2020 actual results.
(d)As Adjusted growth rates exclude the impact of the cancellation of certain small cells previously contracted with Sprint Corporation and a reduction in staffing that occurred in fourth quarter 2020 (collectively, "Nontypical Items"), as further described in our press release dated January 27, 2021 and reconciled in "Non-GAAP Financial Measures, Segment Measures and Other Calculations" herein.
(e)See "Non-GAAP Financial Measures, Segment Measures and Other Calculations" for further information and reconciliation of non-GAAP financial measures to Income (loss) from continuing operations, as computed in accordance with GAAP.
(f)Does not reflect the impact related to the ATO Settlement (as defined in the Form 8-K filed with the Securities and Exchange Commission on April 26, 2021 ("April 8-K"), which is attributable to discontinued operations as discussed in the April 8-K.
(g)Attributable to CCIC common stockholders.
“We generated significant growth in 2021, including 14% AFFO per share growth and an 11% increase in our common stock dividend per share, as our customers began upgrading their existing cell sites as part of the first phase of the 5G build out in the U.S.,” stated Jay Brown, Crown Castle’s Chief Executive Officer. “We expect elevated levels of tower leasing to continue this year and believe we will once again lead the industry with the highest U.S. tower revenue growth in 2022. In addition, we secured commitments for more than 50,000 new small cell nodes during the last twelve months, which equates to approximately 70% of the total small cells we booked in our history prior to 2021. As a result, we now have approximately 55,000 small cell nodes on air and more than 60,000 committed or under construction in our backlog. Our customers are already planning for the next phase of the 5G build out that will require small cells at scale, and this inflection in our small cells business reflects how well
The pathway to possible.
CrownCastle.com
| News Release continued: | Page 2 | |||||||
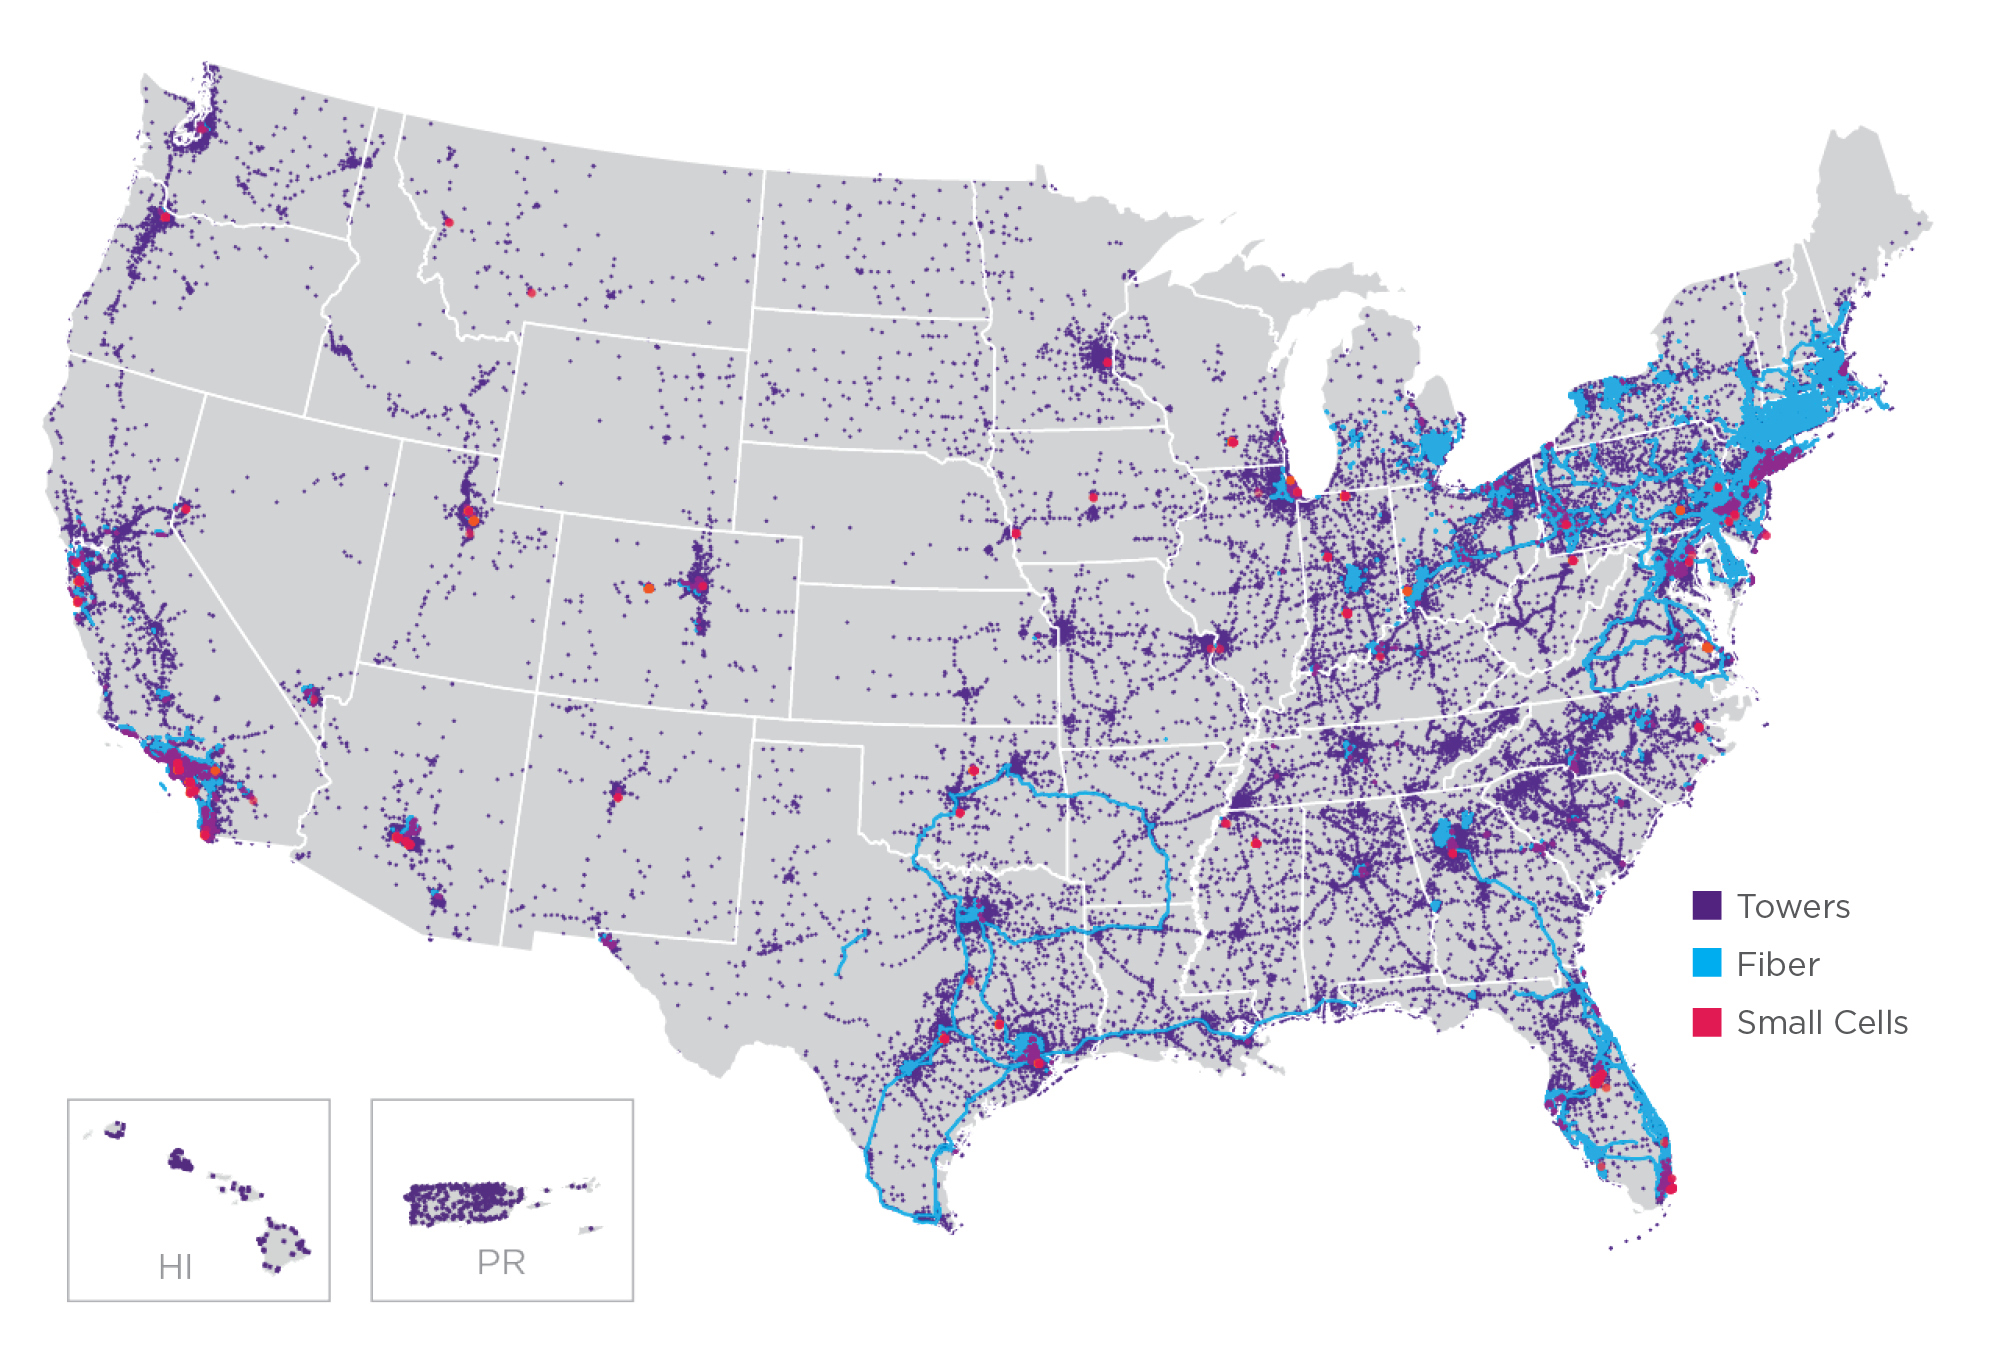
positioned we are to support their wireless network needs for years to come with our more than 80,000 route miles of fiber concentrated in the top U.S. markets. I believe 2022 will be an important transition year for our small cells and fiber business, as we prepare to accelerate our deployment of small cells from approximately 5,000 this year to what we expect will be more than 10,000 per year starting in 2023.
“We believe our ability to offer towers, small cells and fiber solutions, which are all integral components of communications networks and are shared among multiple tenants, provides us the best opportunity to generate significant growth while delivering high returns for our shareholders. We believe the U.S. represents the highest growth and lowest risk market in the world for communications infrastructure ownership, and we believe our comprehensive offering positions us to benefit from what we expect will be a decade-long investment cycle as our customers develop next-generation wireless networks. As a result, we expect the deployment of 5G in the U.S. to extend our opportunity to create long-term value for our shareholders while delivering dividend per share growth of 7% to 8% per year.”
RESULTS FOR THE YEAR
The table below sets forth select preliminary unaudited financial results for the year ended December 31, 2021.
| Full Year 2021 | Full Year 2020 | Full Year 2021 Growth | ||||||||||||||||||||||||||||||||||||
| (dollars in millions, except per share amounts) | Actual | Previous Outlook Midpoint(a) | Actual Compared to Previous Outlook Midpoint(a) | As Reported | As Adjusted(b) | As Reported | As Adjusted(b) | |||||||||||||||||||||||||||||||
| Site rental revenues | $5,719 | $5,700 | +$19 | $5,320 | $5,320 | $399 | 8% | $399 | 8% | |||||||||||||||||||||||||||||
Income (loss) from continuing operations(c) | $1,158(d) | $1,114(d) | +$44 | $1,056 | $833 | $102 | 10% | $325 | 39% | |||||||||||||||||||||||||||||
Income (loss) from continuing operations per share—diluted(c)(e) | $2.67(d) | $2.57(d) | +$0.10 | $2.35 | $1.83 | $0.32 | 14% | $0.84 | 46% | |||||||||||||||||||||||||||||
Adjusted EBITDA(c) | $3,816 | $3,787 | +$29 | $3,706 | $3,420 | $110 | 3% | $396 | 12% | |||||||||||||||||||||||||||||
AFFO(c)(e) | $3,013 | $2,966 | +$47 | $2,878 | $2,592 | $135 | 5% | $421 | 16% | |||||||||||||||||||||||||||||
AFFO per share(c)(e) | $6.95 | $6.83 | +$0.12 | $6.78 | $6.10 | $0.17 | 3% | $0.85 | 14% | |||||||||||||||||||||||||||||
(a)As issued on October 20, 2021.
(b)As Adjusted figures exclude the impact of the Nontypical Items, as further described in our press release dated January 27, 2021 and reconciled in "Non-GAAP Financial Measures, Segment Measures and Other Calculations" herein.
(c)See "Non-GAAP Financial Measures, Segment Measures and Other Calculations" for further information and reconciliation of non-GAAP financial measures to Income (loss) from continuing operations, as computed in accordance with GAAP.
(d)Does not reflect the impact related to the ATO Settlement (as defined in the April 8-K), which is attributable to discontinued operations as discussed in the April 8-K.
(e)Attributable to CCIC common stockholders.
HIGHLIGHTS FROM THE YEAR
References to full year 2021 growth herein are adjusted for the impact of Nontypical Items that occurred in fourth quarter 2020.
•Site rental revenues. Site rental revenues grew 8%, or $399 million, from full year 2020 to full year 2021, inclusive of approximately $307 million in Organic Contribution to Site Rental Revenues and an $89 million increase in straight-lined revenues. The $307 million in Organic Contribution to Site Rental Revenues represents approximately 5.8% growth, comprised of approximately 9.0% growth from new leasing activity and contracted tenant escalations, net of approximately 3.2% from tenant non-renewals. Fourth quarter 2021 site rental revenues benefited by approximately $10 million from items not expected to recur in 2022.
The pathway to possible.
CrownCastle.com
| News Release continued: | Page 3 | |||||||
•Income from continuing operations. Income from continuing operations for full year 2021 was $1.2 billion compared to $1.1 billion for full year 2020, or $833 million for full year 2020 as adjusted for the impact of Nontypical Items.
•Adjusted EBITDA. Full year 2021 Adjusted EBITDA was $3.8 billion compared to $3.4 billion in full year 2020, as adjusted for the impact of Nontypical Items, which represents growth of $396 million. The full year 2021 growth includes approximately $20 million of benefit from items in the fourth quarter 2021 not contemplated in the previous 2021 Outlook, including $10 million from site rental revenues that are not expected to recur in 2022 and $10 million from lower-than-expected operating expenses.
•AFFO and AFFO per share. Full year 2021 AFFO was $3.0 billion, representing 16% growth from full year 2020. The full year 2021 growth of $421 million includes the aforementioned $20 million of benefit included in Adjusted EBITDA from items recognized in the fourth quarter 2021 not contemplated in the previous 2021 Outlook, as well as lower sustaining capital expenditures than previously expected. AFFO per share for full year 2021 was $6.95, representing 14% growth when compared to full year 2020.
•Capital expenditures. Capital expenditures during the year were $1.2 billion, comprised of $87 million of sustaining capital expenditures and $1.1 billion of discretionary capital expenditures. Discretionary capital expenditures during the year primarily included approximately $907 million attributable to Fiber and approximately $202 million attributable to Towers.
•Common stock dividend. During 2021, Crown Castle paid common stock dividends of approximately $2.4 billion in the aggregate, or $5.46 per common share, an increase of approximately 11% on a per share basis compared to the same period a year ago.
“We delivered another year of significant growth with 14% AFFO per share growth in 2021, augmented by a high-quality dividend that we believe provides shareholders with a compelling total return opportunity,” stated Dan Schlanger, Crown Castle’s Chief Financial Officer. “Our customers are busy with the initial deployment of their 5G networks while also planning for the next phase that will require tens of thousands of new cell sites to increase the capacity of their networks. This activity is resulting in an elevated level of growth in our Towers business with core leasing activity for full year 2022 expected to be approximately 50% higher than the trailing five-year average. Looking beyond this year, our record backlog of more than 60,000 committed small cell nodes gives us confidence that growth for our Fiber business will accelerate beginning in 2023. As we expect to increase the pace of small cell deployments in 2023, we anticipate the level of our discretionary capital investment to also trend higher. Importantly, with a record level of collocation small cell nodes in our backlog we expect to be able to fund this higher level of investment with free cash flow and incremental debt capacity while maintaining our investment grade credit profile.”
OUTLOOK
This Outlook section contains forward-looking statements, and actual results may differ materially. Information regarding potential risks which could cause actual results to differ from the forward-looking statements herein is set forth below and in Crown Castle's filings with the SEC.
Crown Castle's current full year 2022 Outlook, set forth in the following table, is updated to reflect approximately $250 million of additional straight-lined site rental revenues for full year 2022 for its Towers segment resulting from the previously announced long-term tower and small cell agreement with T-Mobile. Except for changes resulting from this increase in straight-lined site rental revenues, full year 2022 Outlook is unchanged. The lower growth reflected in the charts below results from the higher-than-expected 2021 results and not from a
The pathway to possible.
CrownCastle.com
| News Release continued: | Page 4 | |||||||
reduction to the full year 2022 Outlook. The majority of the items that contributed to the higher-than-expected 2021 results are not expected to recur in 2022.
| (in millions, except per share amounts) | Full Year 2022 | Change to Midpoint from Previous Outlook | |||||||||||||||
| Site rental revenues | $6,202 | to | $6,247 | +$250 | |||||||||||||
Site rental cost of operations(a) | $1,548 | to | $1,593 | — | |||||||||||||
| Income (loss) from continuing operations | $1,634 | to | $1,714 | +$250 | |||||||||||||
Adjusted EBITDA(b) | $4,249 | to | $4,294 | +$250 | |||||||||||||
Interest expense and amortization of deferred financing costs(c) | $615 | to | $660 | — | |||||||||||||
FFO(b)(d) | $3,318 | to | $3,363 | +$250 | |||||||||||||
AFFO(b)(d) | $3,178 | to | $3,223 | — | |||||||||||||
AFFO per share(b)(d) | $7.31 | to | $7.41 | — | |||||||||||||
(a)Exclusive of depreciation, amortization and accretion.
(b)See "Non-GAAP Financial Measures, Segment Measures and Other Calculations" for further information and reconciliation of non-GAAP financial measures to Income (loss) from continuing operations, as computed in accordance with GAAP.
(c)See reconciliation of "Components of Current Outlook for Interest Expense and Amortization of Deferred Financing Costs" for a discussion of non-cash interest expense.
(d)Attributable to CCIC common stockholders.
The chart below reconciles the components of expected growth in site rental revenues from 2021 to 2022 of $495 million to $540 million, inclusive of Organic Contribution to Site Rental Revenues during 2022 of $235 million to $275 million, or approximately 5%.

The pathway to possible.
CrownCastle.com
| News Release continued: | Page 5 | |||||||
The chart below reconciles the components of expected growth in AFFO from 2021 to 2022 of $165 million to $210 million.
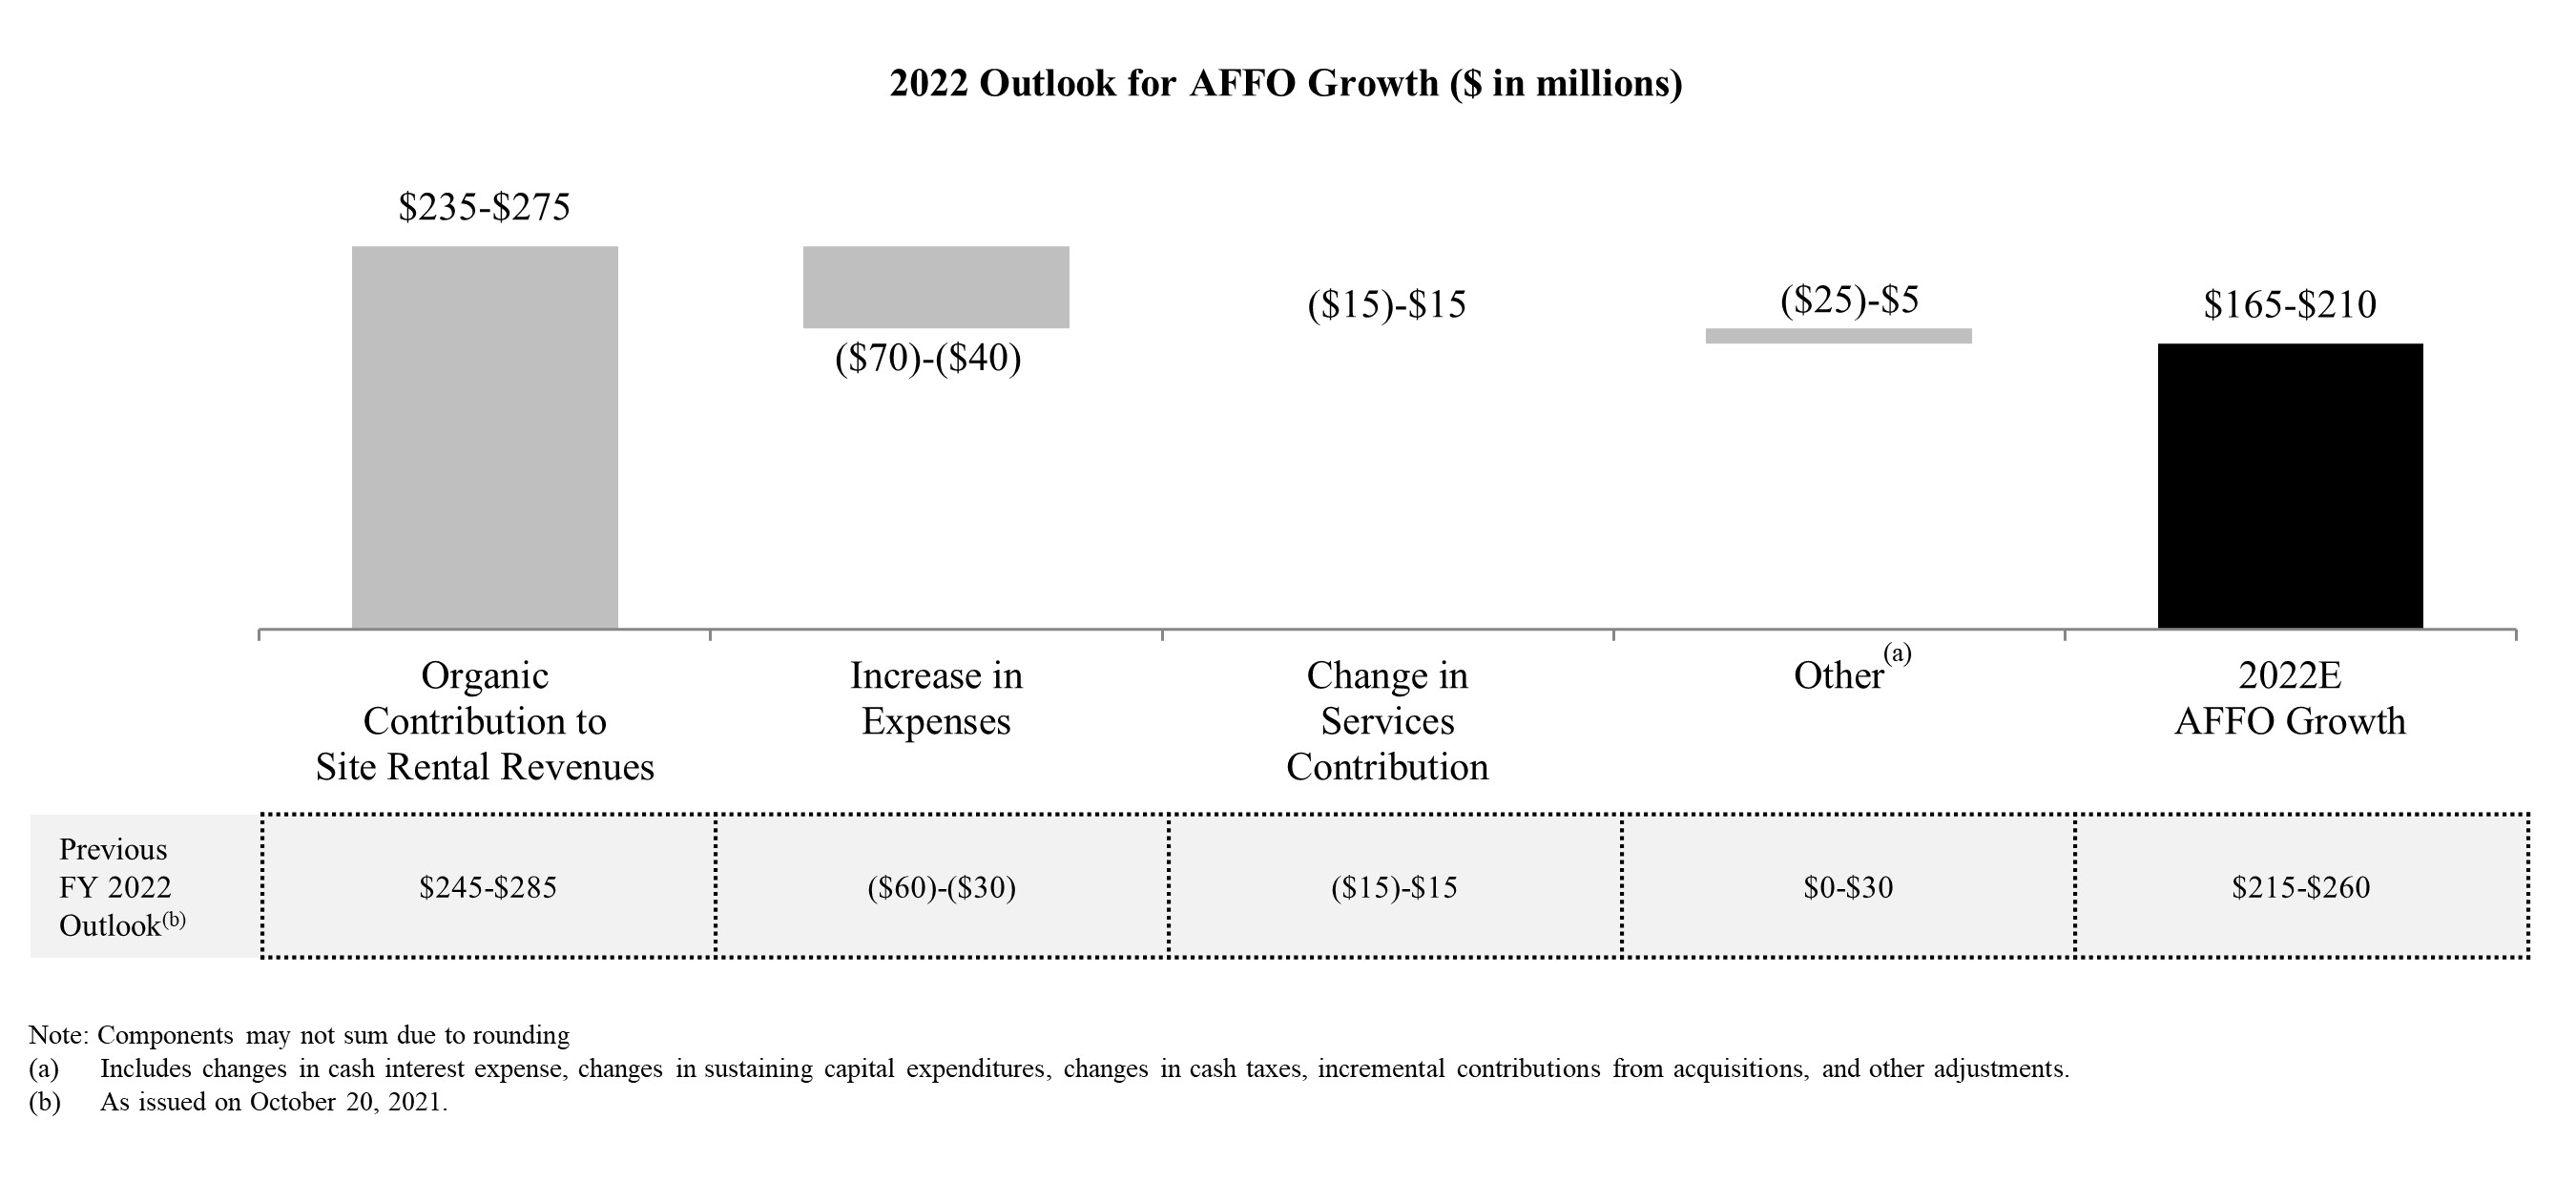
Additional information is available in Crown Castle's quarterly Supplemental Information Package posted in the Investors section of our website.
CONFERENCE CALL DETAILS
Crown Castle has scheduled a conference call for Thursday, January 27, 2022, at 10:30 a.m. Eastern time to discuss its fourth quarter and full year 2021 results. The conference call may be accessed by dialing 800-458-4121 and asking for the Crown Castle call (access code 6181398) at least 30 minutes prior to the start time. The conference call may also be accessed live over the Internet at investor.crowncastle.com. Supplemental materials for the call have been posted on the Crown Castle website at investor.crowncastle.com.
A telephonic replay of the conference call will be available from 1:30 p.m. Eastern time on Thursday, January 27, 2022, through 1:30 p.m. Eastern time on Wednesday, April 27, 2022, and may be accessed by dialing 888-203-1112 and using access code 6181398. An audio archive will also be available on Crown Castle's website at investor.crowncastle.com shortly after the call and will be accessible for approximately 90 days.
ABOUT CROWN CASTLE
Crown Castle owns, operates and leases more than 40,000 cell towers and more than 80,000 route miles of fiber supporting small cells and fiber solutions across every major U.S. market. This nationwide portfolio of communications infrastructure connects cities and communities to essential data, technology and wireless service - bringing information, ideas and innovations to the people and businesses that need them. For more information on Crown Castle, please visit www.crowncastle.com.
The pathway to possible.
CrownCastle.com
| News Release continued: | Page 6 | |||||||
Non-GAAP Financial Measures, Segment Measures and Other Calculations
This press release includes presentations of Income (loss) from continuing operations (as adjusted), including per share—diluted amounts, Adjusted EBITDA, Adjusted Funds from Operations ("AFFO"), including per share amounts, Funds from Operations ("FFO"), including per share amounts, and Organic Contribution to Site Rental Revenues, which are non-GAAP financial measures. These non-GAAP financial measures are not intended as alternative measures of operating results or cash flow from operations (as determined in accordance with Generally Accepted Accounting Principles ("GAAP")).
Our non-GAAP financial measures may not be comparable to similarly titled measures of other companies, including other companies in the communications infrastructure sector or other real estate investment trusts ("REITs").
In addition to the non-GAAP financial measures used herein, we also provide Segment Site Rental Gross Margin, Segment Services and Other Gross Margin and Segment Operating Profit, which are key measures used by management to evaluate our operating segments. These segment measures are provided pursuant to GAAP requirements related to segment reporting. In addition, we provide the components of certain GAAP measures, such as capital expenditures.
Our non-GAAP financial measures are presented as additional information because management believes these measures are useful indicators of the financial performance of our business. Among other things, management believes that:
•Income (loss) from continuing operations (as adjusted), including per share—diluted amounts, is useful to investors and other interested parties in evaluating our financial performance. Management believes that this measure is meaningful to investors as it adjusts Income (loss) from continuing operations to exclude the impact of the Nontypical Items (as defined in this press release and described further in our press release dated January 27, 2021), which management believes are unusual (including with respect to magnitude), infrequent and not reasonably likely to recur in the near term, to provide further insight into our results of operations and underlying trends and projections. Management also believes that identifying the impact of Nontypical Items as adjustments provides more transparency and comparability across periods. There can be no assurances that such items will not recur in future periods. Income (loss) from continuing operations (as adjusted), including per share—diluted amounts should be considered only as a supplement to net income computed in accordance with GAAP as a measure of our performance.
•Adjusted EBITDA is useful to investors or other interested parties in evaluating our financial performance. Adjusted EBITDA is the primary measure used by management (1) to evaluate the economic productivity of our operations and (2) for purposes of making decisions about allocating resources to, and assessing the performance of, our operations. Management believes that Adjusted EBITDA helps investors or other interested parties meaningfully evaluate and compare the results of our operations (1) from period to period and (2) to our competitors, by removing the impact of our capital structure (primarily interest charges from our outstanding debt) and asset base (primarily depreciation, amortization and accretion) from our financial results. Management also believes Adjusted EBITDA is frequently used by investors or other interested parties in the evaluation of the communications infrastructure sector and other REITs to measure financial performance without regard to items such as depreciation, amortization and accretion which can vary depending upon accounting methods and the book value of assets. In addition, Adjusted EBITDA is similar to the measure of current financial performance generally used in our debt covenant calculations. Separately, we are also disclosing Adjusted EBITDA as adjusted to exclude the impact of Nontypical Items, which management believes are unusual (including with respect to magnitude), infrequent and not reasonably likely to recur in the near term, to provide further insight into our results of operations and underlying trends and projections. Management also believes that identifying the impact of Nontypical Items as adjustments provides increased transparency and comparability across periods. There can be no assurances that such items will not recur in future periods. Adjusted EBITDA (including as further adjusted to exclude Nontypical Items) should be considered only as a supplement to net income computed in accordance with GAAP as a measure of our performance.
•AFFO, including per share amounts, is useful to investors or other interested parties in evaluating our financial performance. Management believes that AFFO helps investors or other interested parties meaningfully evaluate our financial performance as it includes (1) the impact of our capital structure (primarily interest expense on our outstanding debt and dividends on our preferred stock (in periods where applicable)) and (2) sustaining capital expenditures, and excludes the impact of our (a) asset base (primarily depreciation, amortization and accretion) and (b) certain non-cash items, including straight-lined revenues and expenses related to fixed escalations and rent free periods. GAAP requires rental revenues and expenses related to leases that contain specified rental increases over the life of the lease to be recognized evenly over the life of the lease. In accordance with GAAP, if payment terms call for fixed escalations, or rent free periods, the revenue or expense is recognized on a straight-lined basis over the fixed, non-cancelable term of the contract. Management notes that Crown Castle uses AFFO only as a performance measure.
The pathway to possible.
CrownCastle.com
| News Release continued: | Page 7 | |||||||
Separately, we are also disclosing AFFO as adjusted to exclude the impact of Nontypical Items, which management believes are unusual (including with respect to magnitude), infrequent and not reasonably likely to recur in the near term, to provide further insight into our results of operations and underlying trends and projections. Management also believes that identifying the impact of Nontypical Items as adjustments provides increased transparency and comparability across periods. There can be no assurances that such items will not recur in future periods. AFFO (including as further adjusted to exclude Nontypical Items) should be considered only as a supplement to net income computed in accordance with GAAP as a measure of our performance and should not be considered as an alternative to cash flows from operations or as residual cash flow available for discretionary investment.
•FFO, including per share amounts, is useful to investors or other interested parties in evaluating our financial performance. Management believes that FFO may be used by investors or other interested parties as a basis to compare our financial performance with that of other REITs. FFO helps investors or other interested parties meaningfully evaluate financial performance by excluding the impact of our asset base (primarily depreciation, amortization and accretion). FFO is not a key performance indicator used by Crown Castle. FFO should be considered only as a supplement to net income computed in accordance with GAAP as a measure of our performance and should not be considered as an alternative to cash flow from operations.
•Organic Contribution to Site Rental Revenues is useful to investors or other interested parties in understanding the components of the year-over-year changes in our site rental revenues computed in accordance with GAAP. Management uses the Organic Contribution to Site Rental Revenues to assess year-over-year growth rates for our rental activities, to evaluate current performance, to capture trends in rental rates, new leasing activities and tenant non-renewals in our core business, as well to forecast future results. Organic Contribution to Site Rental Revenues is not meant as an alternative measure of revenue and should be considered only as a supplement in understanding and assessing the performance of our site rental revenues computed in accordance with GAAP.
We define our non-GAAP financial measures, segment measures and other calculations as follows:
Non-GAAP Financial Measures
Income (loss) from continuing operations (as adjusted). We define Income (loss) from continuing operations (as adjusted) as Income (loss) from continuing operations less other operating income resulting from the Nontypical Items, plus incremental operating expenses and asset write-downs as a result of the Nontypical Items.
Income (loss) from continuing operations (as adjusted) per share—diluted. We define Income (loss) from continuing operations (as adjusted) per share—diluted as Income (loss) from continuing operations (as adjusted), divided by diluted weighted-average common shares outstanding.
Adjusted EBITDA. We define Adjusted EBITDA as Income (loss) from continuing operations plus restructuring charges (credits), asset write-down charges, acquisition and integration costs, depreciation, amortization and accretion, amortization of prepaid lease purchase price adjustments, interest expense and amortization of deferred financing costs, (gains) losses on retirement of long-term obligations, net (gain) loss on interest rate swaps, (gains) losses on foreign currency swaps, impairment of available-for-sale securities, interest income, other (income) expense, (benefit) provision for income taxes, cumulative effect of a change in accounting principle and stock-based compensation expense. Separately, Adjusted EBITDA, as adjusted to exclude the impact of Nontypical Items, reflects Adjusted EBITDA, less other operating income resulting from the Nontypical Items, plus incremental operating expenses as a result of the Nontypical Items.
Adjusted Funds from Operations. We define Adjusted Funds from Operations as FFO before straight-lined revenue, straight-lined expense, stock-based compensation expense, non-cash portion of tax provision, non-real estate related depreciation, amortization and accretion, amortization of non-cash interest expense, other (income) expense, (gains) losses on retirement of long-term obligations, net (gain) loss on interest rate swaps, (gains) losses on foreign currency swaps, impairment of available-for-sale securities, acquisition and integration costs, restructuring charges (credits), cumulative effect of a change in accounting principle and adjustments for noncontrolling interests, less sustaining capital expenditures. Separately, Adjusted Funds from Operations, as adjusted to exclude the impact of Nontypical Items, reflects Adjusted Funds from Operations, less other operating income resulting from the Nontypical Items, plus incremental operating expenses as a result of the Nontypical Items.
AFFO per share. We define AFFO per share as AFFO, including as adjusted to exclude the impact of Nontypical Items, divided by diluted weighted-average common shares outstanding.
Funds from Operations. We define Funds from Operations as Income (loss) from continuing operations plus real estate related depreciation, amortization and accretion and asset write-down charges, less noncontrolling interest and cash paid for preferred
The pathway to possible.
CrownCastle.com
| News Release continued: | Page 8 | |||||||
stock dividends (in periods where applicable), and is a measure of funds from operations attributable to CCIC common stockholders.
FFO per share. We define FFO per share as FFO divided by the diluted weighted-average common shares outstanding.
Organic Contribution to Site Rental Revenues. We define the Organic Contribution to Site Rental Revenues as the sum of the change in GAAP site rental revenues related to (1) new leasing activity, including revenues from the construction of small cells and the impact of prepaid rent, (2) escalators and less (3) non-renewals of tenant contracts.
Segment Measures
Segment Site Rental Gross Margin. We define Segment Site Rental Gross Margin as segment site rental revenues less segment site rental costs of operations, excluding stock-based compensation expense and prepaid lease purchase price adjustments recorded in consolidated site rental costs of operations.
Segment Services and Other Gross Margin. We define Segment Services and Other Gross Margin as segment services and other revenues less segment services and other costs of operations, excluding stock-based compensation expense recorded in consolidated services and other costs of operations.
Segment Operating Profit. We define Segment Operating Profit as segment site rental gross margin plus segment services and other gross margin, and segment other operating (income) expense, less selling, general and administrative expenses attributable to the respective segment.
All of these measurements of profit or loss are exclusive of depreciation, amortization and accretion, which are shown separately. Additionally, certain costs are shared across segments and are reflected in our segment measures through allocations that management believes to be reasonable.
Other Calculations
New leasing activity. We define new leasing activity as site rental revenues growth exclusive of the impact from straight-line accounting from (1) tenant additions across our entire portfolio, (2) renewals or extensions of tenant contracts and (3) year-over-year changes in prepaid rent amortization.
Core leasing activity. We define core leasing activity as site rental revenues growth from tenant additions across our entire portfolio and renewals or extensions of tenant contracts, exclusive of the impacts from both straight-line accounting and prepaid rent amortization.
Non-renewals. We define non-renewals of tenant contracts as the reduction in site rental revenues as a result of tenant churn, terminations and, in limited circumstances, reductions of existing lease rates.
Discretionary capital expenditures. We define discretionary capital expenditures as those capital expenditures made with respect to activities which we believe exhibit sufficient potential to enhance long-term stockholder value. They primarily consist of expansion or development of communications infrastructure (including capital expenditures related to (1) enhancing communications infrastructure in order to add new tenants for the first time or support subsequent tenant equipment augmentations or (2) modifying the structure of a communications infrastructure asset to accommodate additional tenants) and construction of new communications infrastructure. Discretionary capital expenditures also include purchases of land interests (which primarily relates to land assets under towers as we seek to manage our interests in the land beneath our towers), certain technology-related investments necessary to support and scale future customer demand for our communications infrastructure, and other capital projects.
Sustaining capital expenditures. We define sustaining capital expenditures as those capital expenditures not otherwise categorized as either discretionary or integration capital expenditures, such as (1) maintenance capital expenditures on our communications infrastructure assets that enable our tenants' ongoing quiet enjoyment of the communications infrastructure and (2) ordinary corporate capital expenditures.
The tables set forth on the following pages reconcile the non-GAAP financial measures used herein to comparable GAAP financial measures. The components in these tables may not sum to the total due to rounding.
The pathway to possible.
CrownCastle.com
| News Release continued: | Page 9 | |||||||
Reconciliations of Non-GAAP Financial Measures, Segment Measures and Other Calculations to Comparable GAAP Financial Measures:
Reconciliation of Historical Adjusted EBITDA:
| For the Three Months Ended | For the Twelve Months Ended | ||||||||||||||||||||||
| (in millions) | December 31, 2021 | December 31, 2020 | December 31, 2021 | December 31, 2020 | |||||||||||||||||||
| Income (loss) from continuing operations | $ | 353 | $ | 508 | $ | 1,158 | (a) | $ | 1,056 | ||||||||||||||
| Adjustments to increase (decrease) Income (loss) from continuing operations: | |||||||||||||||||||||||
| Asset write-down charges | 12 | 64 | 21 | 74 | |||||||||||||||||||
| Acquisition and integration costs | — | 1 | 1 | 10 | |||||||||||||||||||
| Depreciation, amortization and accretion | 415 | 401 | 1,644 | 1,608 | |||||||||||||||||||
| Amortization of prepaid lease purchase price adjustments | 4 | 5 | 18 | 18 | |||||||||||||||||||
Interest expense and amortization of deferred financing costs(b) | 164 | 167 | 657 | 689 | |||||||||||||||||||
| (Gains) losses on retirement of long-term obligations | — | — | 145 | 95 | |||||||||||||||||||
| Interest income | — | — | (1) | (2) | |||||||||||||||||||
| Other (income) expense | 4 | — | 21 | 5 | |||||||||||||||||||
| (Benefit) provision for income taxes | 1 | 5 | 21 | 20 | |||||||||||||||||||
| Stock-based compensation expense | 31 | 28 | 131 | 133 | |||||||||||||||||||
Adjusted EBITDA(c)(d) | $ | 984 | $ | 1,179 | $ | 3,816 | $ | 3,706 | |||||||||||||||
Reconciliation of Current Outlook for Adjusted EBITDA:
| Full Year 2022 | |||||||||||
| (in millions) | Outlook(f) | ||||||||||
| Income (loss) from continuing operations | $1,634 | to | $1,714 | ||||||||
| Adjustments to increase (decrease) Income (loss) from continuing operations: | |||||||||||
| Asset write-down charges | $15 | to | $25 | ||||||||
| Acquisition and integration costs | $0 | to | $8 | ||||||||
| Depreciation, amortization and accretion | $1,650 | to | $1,745 | ||||||||
| Amortization of prepaid lease purchase price adjustments | $16 | to | $18 | ||||||||
Interest expense and amortization of deferred financing costs(e) | $615 | to | $660 | ||||||||
| (Gains) losses on retirement of long-term obligations | $0 | to | $100 | ||||||||
| Interest income | $(1) | to | $0 | ||||||||
| Other (income) expense | $0 | to | $5 | ||||||||
| (Benefit) provision for income taxes | $25 | to | $33 | ||||||||
| Stock-based compensation expense | $135 | to | $139 | ||||||||
Adjusted EBITDA(c)(d) | $4,249 | to | $4,294 | ||||||||
(a)Does not reflect the impact related to the ATO Settlement (as defined in the April 8-K), which is attributable to discontinued operations as discussed in the April 8-K.
(b)See reconciliation of "Components of Historical Interest Expense and Amortization of Deferred Financing Costs" for a discussion of non-cash interest expense.
(c)See "Non-GAAP Financial Measures, Segment Measures and Other Calculations" for a discussion of our definition of Adjusted EBITDA.
(d)The above reconciliation excludes line items included in our definition which are not applicable for the periods shown.
(e)See reconciliation of "Components of Current Outlook for Interest Expense and Amortization of Deferred Financing Costs" for a discussion of non-cash interest expense.
(f)As issued on January 26, 2022.
The pathway to possible.
CrownCastle.com
| News Release continued: | Page 10 | |||||||
Reconciliation of Historical FFO and AFFO:
| For the Three Months Ended | For the Twelve Months Ended | ||||||||||||||||||||||
| (in millions, except per share amounts) | December 31, 2021 | December 31, 2020 | December 31, 2021 | December 31, 2020 | |||||||||||||||||||
| Income (loss) from continuing operations | $ | 353 | $ | 508 | $ | 1,158 | (a) | $ | 1,056 | ||||||||||||||
| Real estate related depreciation, amortization and accretion | 402 | 388 | 1,593 | 1,555 | |||||||||||||||||||
| Asset write-down charges | 12 | 64 | 21 | 74 | |||||||||||||||||||
| Dividends/distributions on preferred stock | — | — | — | (85) | |||||||||||||||||||
FFO(b)(c)(d)(e) | $ | 767 | $ | 960 | $ | 2,772 | $ | 2,600 | |||||||||||||||
| Weighted-average common shares outstanding—diluted | 434 | 433 | 434 | 425 | |||||||||||||||||||
FFO per share(b)(c)(d)(e) | $ | 1.77 | $ | 2.22 | $ | 6.39 | $ | 6.12 | |||||||||||||||
| FFO (from above) | $ | 767 | $ | 960 | $ | 2,772 | $ | 2,600 | |||||||||||||||
| Adjustments to increase (decrease) FFO: | |||||||||||||||||||||||
| Straight-lined revenue | (38) | 5 | (111) | (22) | |||||||||||||||||||
| Straight-lined expense | 18 | 22 | 76 | 83 | |||||||||||||||||||
| Stock-based compensation expense | 31 | 28 | 131 | 133 | |||||||||||||||||||
| Non-cash portion of tax provision | (1) | (1) | 1 | 1 | |||||||||||||||||||
| Non-real estate related depreciation, amortization and accretion | 13 | 13 | 51 | 53 | |||||||||||||||||||
| Amortization of non-cash interest expense | 4 | 1 | 13 | 6 | |||||||||||||||||||
| Other (income) expense | 4 | — | 21 | 5 | |||||||||||||||||||
| (Gains) losses on retirement of long-term obligations | — | — | 145 | 95 | |||||||||||||||||||
| Acquisition and integration costs | — | 1 | 1 | 10 | |||||||||||||||||||
| Sustaining capital expenditures | (30) | (21) | (87) | (86) | |||||||||||||||||||
AFFO(b)(c)(d)(e) | $ | 768 | $ | 1,008 | $ | 3,013 | $ | 2,878 | |||||||||||||||
| Weighted-average common shares outstanding—diluted | 434 | 433 | 434 | 425 | |||||||||||||||||||
AFFO per share(b)(c)(d)(e) | $ | 1.77 | $ | 2.33 | $ | 6.95 | $ | 6.78 | |||||||||||||||
(a)Does not reflect the impact related to the ATO Settlement (as defined in the April 8-K), which is attributable to discontinued operations as discussed in the April 8-K.
(b)See "Non-GAAP Financial Measures, Segment Measures and Other Calculations" for a discussion of our definitions of FFO and AFFO, including per share amounts.
(c)FFO and AFFO are reduced by cash paid for preferred stock dividends during the period in which they are paid.
(d)Attributable to CCIC common stockholders.
(e)The above reconciliation excludes line items included in our definition which are not applicable for the periods shown.
The pathway to possible.
CrownCastle.com
| News Release continued: | Page 11 | |||||||
For Comparative Purposes - Reconciliation of Previous Outlook for FFO and AFFO:
| Previously Issued | Previously Issued | ||||||||||||||||||||||
| Full Year 2021 | Full Year 2022 | ||||||||||||||||||||||
| (in millions, except per share amounts) | Outlook(a) | Outlook(a) | |||||||||||||||||||||
| Income (loss) from continuing operations | $1,074 | to | $1,154(b) | $1,384 | to | $1,464 | |||||||||||||||||
| Real estate related depreciation, amortization and accretion | $1,569 | to | $1,649 | $1,607 | to | $1,687 | |||||||||||||||||
| Asset write-down charges | $15 | to | $25 | $15 | to | $25 | |||||||||||||||||
FFO(c)(d)(e) | $2,720 | to | $2,765 | $3,068 | to | $3,113 | |||||||||||||||||
Weighted-average common shares outstanding—diluted(f) | 434 | 435 | |||||||||||||||||||||
FFO per share(c)(d)(e)(f) | $6.27 | to | $6.37 | $7.06 | to | $7.16 | |||||||||||||||||
| FFO (from above) | $2,720 | to | $2,765 | $3,068 | to | $3,113 | |||||||||||||||||
| Adjustments to increase (decrease) FFO: | |||||||||||||||||||||||
| Straight-lined revenue | $(117) | to | $(97) | $(129) | to | $(109) | |||||||||||||||||
| Straight-lined expense | $63 | to | $83 | $56 | to | $76 | |||||||||||||||||
| Stock-based compensation expense | $133 | to | $143 | $135 | to | $139 | |||||||||||||||||
| Non-cash portion of tax provision | $(7) | to | $8 | $0 | to | $15 | |||||||||||||||||
| Non-real estate related depreciation, amortization and accretion | $46 | to | $61 | $43 | to | $58 | |||||||||||||||||
| Amortization of non-cash interest expense | $4 | to | $14 | $5 | to | $15 | |||||||||||||||||
| Other (income) expense | $1 | to | $12 | $0 | to | $5 | |||||||||||||||||
| (Gains) losses on retirement of long-term obligations | $145 | to | $145 | $0 | to | $100 | |||||||||||||||||
| Acquisition and integration costs | $0 | to | $8 | $0 | to | $8 | |||||||||||||||||
| Sustaining capital expenditures | $(104) | to | $(94) | $(113) | to | $(93) | |||||||||||||||||
AFFO(c)(d)(e) | $2,943 | to | $2,988 | $3,178 | to | $3,223 | |||||||||||||||||
Weighted-average common shares outstanding—diluted(f) | 434 | 435 | |||||||||||||||||||||
AFFO per share(c)(d)(e)(f) | $6.78 | to | $6.89 | $7.31 | to | $7.41 | |||||||||||||||||
(a)As issued on October 20, 2021.
(b)Does not reflect the impact related to the ATO Settlement (as defined in the April 8-K), which is attributable to discontinued operations as discussed in the April 8-K.
(c)See "Non-GAAP Financial Measures, Segment Measures and Other Calculations" for a discussion of our definitions of FFO and AFFO, including per share amounts.
(d)Attributable to CCIC common stockholders.
(e)The above reconciliation excludes line items included in our definition which are not applicable for the periods shown.
(f)The assumption for diluted weighted-average common shares outstanding for full year 2022 Outlook is based on the diluted common shares outstanding as of December 31, 2021.
The pathway to possible.
CrownCastle.com
| News Release continued: | Page 12 | |||||||
Reconciliation of Current Outlook for FFO and AFFO:
| Full Year 2022 | |||||||||||
| (in millions, except per share amounts) | Outlook(e) | ||||||||||
| Income (loss) from continuing operations | $1,634 | to | $1,714 | ||||||||
| Real estate related depreciation, amortization and accretion | $1,607 | to | $1,687 | ||||||||
| Asset write-down charges | $15 | to | $25 | ||||||||
FFO(a)(b)(c) | $3,318 | to | $3,363 | ||||||||
Weighted-average common shares outstanding—diluted(d) | 435 | ||||||||||
FFO per share(a)(b)(c)(d) | $7.63 | to | $7.73 | ||||||||
| FFO (from above) | $3,318 | to | $3,363 | ||||||||
| Adjustments to increase (decrease) FFO: | |||||||||||
| Straight-lined revenue | $(379) | to | $(359) | ||||||||
| Straight-lined expense | $56 | to | $76 | ||||||||
| Stock-based compensation expense | $135 | to | $139 | ||||||||
| Non-cash portion of tax provision | $0 | to | $15 | ||||||||
| Non-real estate related depreciation, amortization and accretion | $43 | to | $58 | ||||||||
| Amortization of non-cash interest expense | $5 | to | $15 | ||||||||
| Other (income) expense | $0 | to | $5 | ||||||||
| (Gains) losses on retirement of long-term obligations | $0 | to | $100 | ||||||||
| Acquisition and integration costs | $0 | to | $8 | ||||||||
| Sustaining capital expenditures | $(113) | to | $(93) | ||||||||
AFFO(a)(b)(c) | $3,178 | to | $3,223 | ||||||||
Weighted-average common shares outstanding—diluted(d) | 435 | ||||||||||
AFFO per share(a)(b)(c)(d) | $7.31 | to | $7.41 | ||||||||
(a)See "Non-GAAP Financial Measures, Segment Measures and Other Calculations" for a discussion of our definitions of FFO and AFFO, including per share amounts.
(b)Attributable to CCIC common stockholders.
(c)The above reconciliation excludes line items included in our definition which are not applicable for the periods shown.
(d)The assumption for diluted weighted-average common shares outstanding for full year 2022 Outlook is based on the diluted common shares outstanding as of December 31, 2021.
(e)As issued on January 26, 2022.
The pathway to possible.
CrownCastle.com
| News Release continued: | Page 13 | |||||||
For Comparative Purposes - Reconciliation of Previous Outlook for Adjusted EBITDA:
| Previously Issued | Previously Issued | ||||||||||||||||||||||
| Full Year 2021 | Full Year 2022 | ||||||||||||||||||||||
| (in millions) | Outlook(a) | Outlook(a) | |||||||||||||||||||||
| Income (loss) from continuing operations | $1,074 | to | $1,154(b) | $1,384 | to | $1,464 | |||||||||||||||||
| Adjustments to increase (decrease) Income (loss) from continuing operations: | |||||||||||||||||||||||
| Asset write-down charges | $15 | to | $25 | $15 | to | $25 | |||||||||||||||||
| Acquisition and integration costs | $0 | to | $8 | $0 | to | $8 | |||||||||||||||||
| Depreciation, amortization and accretion | $1,615 | to | $1,710 | $1,650 | to | $1,745 | |||||||||||||||||
| Amortization of prepaid lease purchase price adjustments | $17 | to | $19 | $16 | to | $18 | |||||||||||||||||
| Interest expense and amortization of deferred financing costs | $633 | to | $678 | $615 | to | $660 | |||||||||||||||||
| (Gains) losses on retirement of long-term obligations | $145 | to | $145 | $0 | to | $100 | |||||||||||||||||
| Interest income | $(3) | to | $0 | $(1) | to | $0 | |||||||||||||||||
| Other (income) expense | $1 | to | $12 | $0 | to | $5 | |||||||||||||||||
| (Benefit) provision for income taxes | $18 | to | $26 | $25 | to | $33 | |||||||||||||||||
| Stock-based compensation expense | $133 | to | $143 | $135 | to | $139 | |||||||||||||||||
Adjusted EBITDA(c)(d) | $3,764 | to | $3,809 | $3,999 | to | $4,044 | |||||||||||||||||
(a)As issued on October 20, 2021.
(b)Does not reflect the impact related to the ATO Settlement (as defined in the April 8-K), which is attributable to discontinued operations as discussed in the April 8-K.
(c)See "Non-GAAP Financial Measures, Segment Measures and Other Calculations" for a discussion of our definition of Adjusted EBITDA.
(d)The above reconciliation excludes line items included in our definition which are not applicable for the periods shown.
The pathway to possible.
CrownCastle.com
| News Release continued: | Page 14 | |||||||
Reconciliation of Results Adjusted for Nontypical Items to As Reported Results:
Full Year 2021 | Full Year 2020 | Full Year 2021 Growth Rates | ||||||||||||||||||||||||||||||||||||||||||||||||
| (dollars in millions, except per share amounts) | As Reported | As Reported | Less: Impact from Nontypical Items | Exclusive of Impact from Nontypical Items | As Reported | Less: Impact from Nontypical Items | Exclusive of Impact from Nontypical Items | |||||||||||||||||||||||||||||||||||||||||||
| Site rental revenues | $ | 5,719 | $ | 5,320 | $ | — | $ | 5,320 | 8 | % | — | % | 8 | % | ||||||||||||||||||||||||||||||||||||
Income (loss) from continuing operations(a) | 1,158 | (c) | 1,056 | (223) | (d) | 833 | 10 | % | 29 | % | (d) | 39 | % | |||||||||||||||||||||||||||||||||||||
Income (loss) from continuing operations per share—diluted(a)(b) | 2.67 | (c) | 2.35 | (0.52) | (d) | 1.83 | 14 | % | 32 | % | (d) | 46 | % | |||||||||||||||||||||||||||||||||||||
Adjusted EBITDA(a) | 3,816 | 3,706 | (286) | (e) | 3,420 | 3 | % | 9 | % | (e) | 12 | % | ||||||||||||||||||||||||||||||||||||||
AFFO(a)(b) | 3,013 | 2,878 | (286) | (e) | 2,592 | 5 | % | 11 | % | (e) | 16 | % | ||||||||||||||||||||||||||||||||||||||
AFFO per share(a)(b) | $ | 6.95 | $ | 6.78 | $ | (0.68) | (e) | $ | 6.10 | 3 | % | 11 | % | (e) | 14 | % | ||||||||||||||||||||||||||||||||||
(a)See reconciliations herein for further information and reconciliation of non-GAAP financial measures to Income (loss) from continuing operations, as computed in accordance with GAAP.
(b)Attributable to CCIC common stockholders.
(c)Does not reflect the impact related to the ATO Settlement (as defined in the April 8-K), which is attributable to discontinued operations as discussed in the April 8-K.
(d)Impact from Nontypical Items on Income (loss) from continuing operations and Income (loss) from continuing operations per share—diluted included in the 2020 fourth quarter operating results is comprised of other operating income of $362 million, offset by incremental operating expenses of $76 million and associated asset write-downs of $63 million.
(e)Impact from Nontypical Items on Adjusted EBITDA, AFFO and AFFO per share included in the 2020 fourth quarter operating results is comprised of other operating income of $362 million, offset by incremental operating expenses of $76 million.
The pathway to possible.
CrownCastle.com
| News Release continued: | Page 15 | |||||||
Components of Changes in Site Rental Revenues for the Quarters ended December 31, 2021 and 2020:
| Three Months Ended December 31, | |||||||||||
| (dollars in millions) | 2021 | 2020 | |||||||||
Components of changes in site rental revenues:(a) | |||||||||||
Prior year site rental revenues exclusive of straight-lined revenues associated with fixed escalators(b)(c) | $ | 1,357 | $ | 1,282 | |||||||
New leasing activity(b)(c) | 98 | 90 | |||||||||
| Escalators | 24 | 23 | |||||||||
| Non-renewals | (43) | (39) | |||||||||
Organic Contribution to Site Rental Revenues(d) | 79 | 74 | |||||||||
| Impact from straight-lined revenues associated with fixed escalators | 38 | (5) | |||||||||
Acquisitions(e) | — | 1 | |||||||||
| Other | — | — | |||||||||
| Total GAAP site rental revenues | $ | 1,474 | $ | 1,352 | |||||||
| Year-over-year changes in revenue: | |||||||||||
| Reported GAAP site rental revenues | 9.0 | % | |||||||||
Organic Contribution to Site Rental Revenues(d)(f) | 5.8 | % | |||||||||
Components of the Changes in Site Rental Revenues for Full Year 2021 and 2022 Outlook:
| (dollars in millions) | Full Year 2021 | Current Full Year 2022 Outlook(g) | |||||||||||||||
Components of changes in site rental revenues:(a) | |||||||||||||||||
Prior year site rental revenues exclusive of straight-lined revenues associated with fixed escalators(b)(c) | $5,298 | $5,608 | |||||||||||||||
New leasing activity(b)(c) | 384 | $325 | to | $355 | |||||||||||||
| Escalators | 93 | $95 | to | $105 | |||||||||||||
| Non-renewals | (170) | $(195) | to | $(175) | |||||||||||||
Organic Contribution to Site Rental Revenues(d) | 307 | $235 | to | $275 | |||||||||||||
| Impact from full year straight-lined revenues associated with fixed escalators | 111 | $359 | to | $379 | |||||||||||||
Acquisitions(e) | 3 | — | |||||||||||||||
| Other | — | — | |||||||||||||||
| Total GAAP site rental revenues | $5,719 | $6,202 | to | $6,247 | |||||||||||||
| Year-over-year changes in revenue: | |||||||||||||||||
| Reported GAAP site rental revenues | 7.5% | 8.8%(h) | |||||||||||||||
Organic Contribution to Site Rental Revenues(d)(f) | 5.8% | 4.5%(h) | |||||||||||||||
(a)Additional information regarding Crown Castle's site rental revenues, including projected revenue from tenant licenses, straight-lined revenues and prepaid rent is available in Crown Castle's quarterly Supplemental Information Package posted in the Investors section of its website.
(b)Includes revenues from amortization of prepaid rent in accordance with GAAP.
(c)Includes revenues from the construction of new small cell nodes, exclusive of straight-lined revenues related to fixed escalators.
(d)See "Non-GAAP Financial Measures, Segment Measures and Other Calculations" herein.
(e)Represents the contribution from recent acquisitions. The financial impact of recent acquisitions is excluded from Organic Contribution to Site Rental Revenues until the one-year anniversary of the acquisition.
(f)Calculated as the percentage change from prior year site rental revenues, exclusive of straight-lined revenues associated with fixed escalations, compared to Organic Contribution to Site Rental Revenues for the current period.
(g)As issued on January 26, 2022.
(h)Calculated based on midpoint of full year 2022 Outlook.
The pathway to possible.
CrownCastle.com
| News Release continued: | Page 16 | |||||||
Components of Historical Interest Expense and Amortization of Deferred Financing Costs:
| For the Three Months Ended | |||||||||||
| (in millions) | December 31, 2021 | December 31, 2020 | |||||||||
| Interest expense on debt obligations | $ | 160 | $ | 166 | |||||||
| Amortization of deferred financing costs and adjustments on long-term debt, net | 6 | 6 | |||||||||
| Capitalized interest | (2) | (5) | |||||||||
| Interest expense and amortization of deferred financing costs | $ | 164 | $ | 167 | |||||||
Components of Current Outlook for Interest Expense and Amortization of Deferred Financing Costs:
| Full Year 2022 | |||||||||||
| (in millions) | Outlook(a) | ||||||||||
| Interest expense on debt obligations | $617 | to | $637 | ||||||||
| Amortization of deferred financing costs and adjustments on long-term debt, net | $25 | to | $30 | ||||||||
| Capitalized interest | $(20) | to | $(15) | ||||||||
| Interest expense and amortization of deferred financing costs | $615 | to | $660 | ||||||||
(a)As issued on January 26, 2022.
The pathway to possible.
CrownCastle.com
| News Release continued: | Page 17 | |||||||
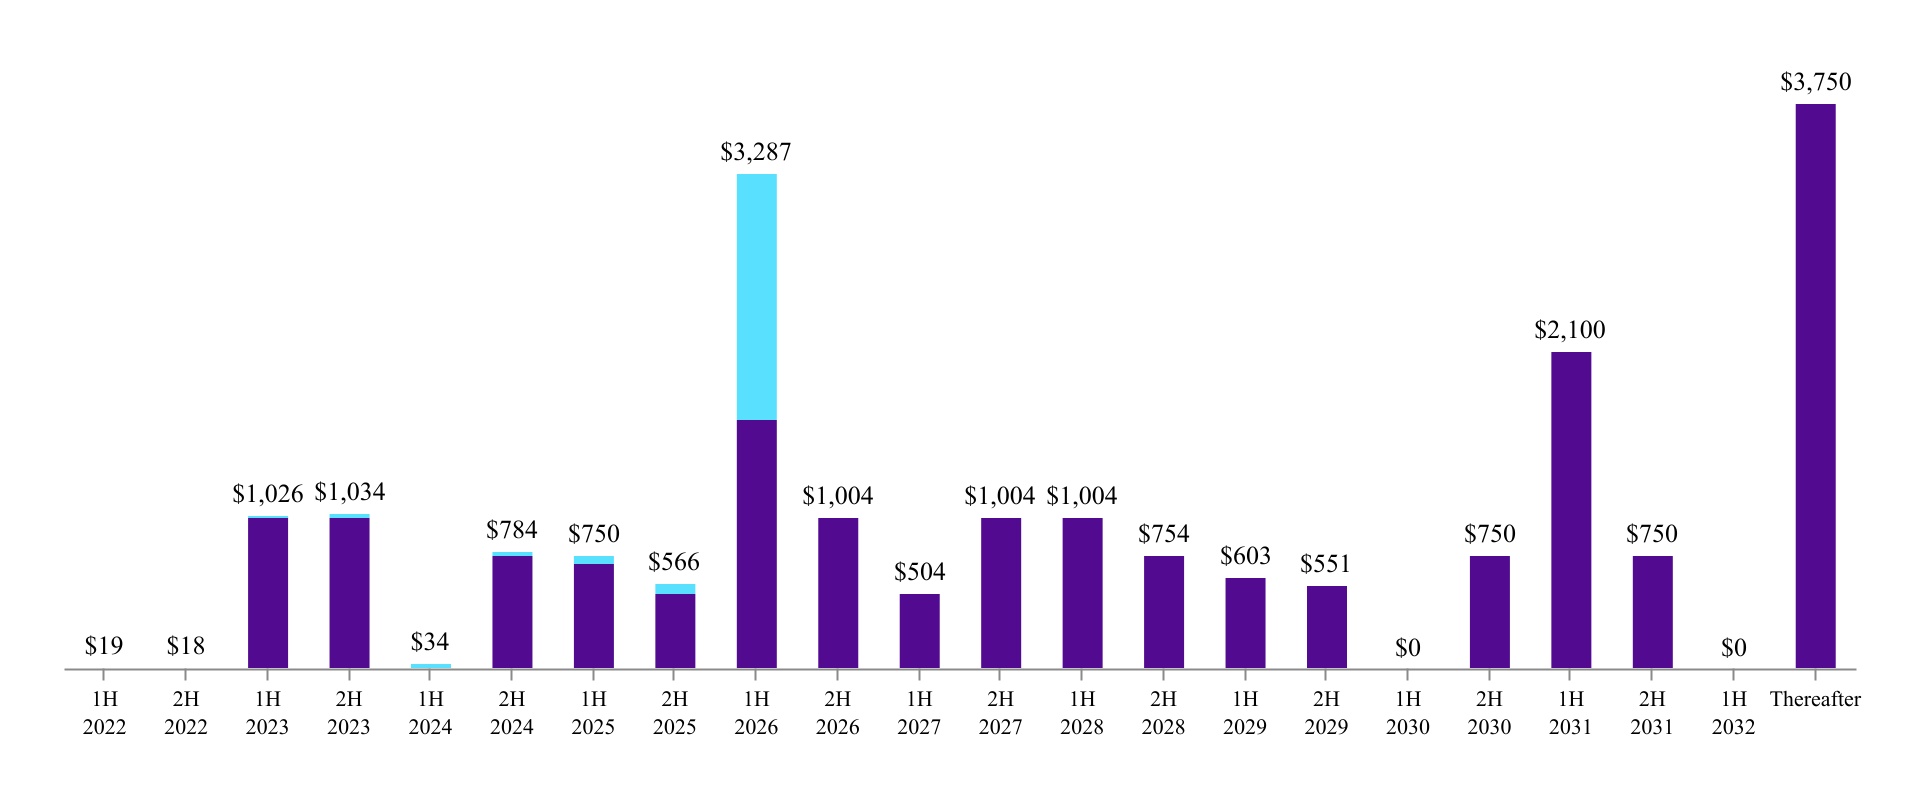
Debt Balances and Maturity Dates as of December 31, 2021:
| (in millions) | Face Value | Final Maturity | |||||||||
| Cash, cash equivalents and restricted cash | $ | 466 | |||||||||
3.849% Secured Notes | 1,000 | Apr. 2023 | |||||||||
Secured Notes, Series 2009-1, Class A-2(a) | 54 | Aug. 2029 | |||||||||
Tower Revenue Notes, Series 2018-1(b) | 250 | July 2043 | |||||||||
Tower Revenue Notes, Series 2015-2(b) | 700 | May 2045 | |||||||||
Tower Revenue Notes, Series 2018-2(b) | 750 | July 2048 | |||||||||
Finance leases and other obligations | 242 | Various | |||||||||
| Total secured debt | $ | 2,996 | |||||||||
2016 Revolver(c) | 665 | June 2026 | |||||||||
| 2016 Term Loan A | 1,223 | June 2026 | |||||||||
Commercial Paper Notes(d) | 265 | Jan. 2022 | |||||||||
3.150% Senior Notes | 750 | July 2023 | |||||||||
3.200% Senior Notes | 750 | Sept. 2024 | |||||||||
1.350% Senior Notes | 500 | July 2025 | |||||||||
4.450% Senior Notes | 900 | Feb. 2026 | |||||||||
3.700% Senior Notes | 750 | June 2026 | |||||||||
| 1.050% Senior Notes | 1,000 | July 2026 | |||||||||
4.000% Senior Notes | 500 | Mar. 2027 | |||||||||
3.650% Senior Notes | 1,000 | Sept. 2027 | |||||||||
3.800% Senior Notes | 1,000 | Feb. 2028 | |||||||||
4.300% Senior Notes | 600 | Feb. 2029 | |||||||||
| 3.100% Senior Notes | 550 | Nov. 2029 | |||||||||
3.300% Senior Notes | 750 | July 2030 | |||||||||
2.250% Senior Notes | 1,100 | Jan. 2031 | |||||||||
| 2.100% Senior Notes | 1,000 | Apr. 2031 | |||||||||
| 2.500% Senior Notes | 750 | July 2031 | |||||||||
| 2.900% Senior Notes | 1,250 | Apr. 2041 | |||||||||
4.750% Senior Notes | 350 | May 2047 | |||||||||
5.200% Senior Notes | 400 | Feb. 2049 | |||||||||
| 4.000% Senior Notes | 350 | Nov. 2049 | |||||||||
| 4.150% Senior Notes | 500 | July 2050 | |||||||||
| 3.250% Senior Notes | 900 | Jan. 2051 | |||||||||
| Total unsecured debt | $ | 17,803 | |||||||||
| Total net debt | $ | 20,333 | |||||||||
(a)The Senior Secured Notes, 2009-1, Class A-2 principal amortizes over a period ending in August 2029.
(b)If the respective series of such debt is not paid in full on or prior to an applicable anticipated repayment date, then the Excess Cash Flow (as defined in the indenture) of the issuers of such notes will be used to repay principal of the applicable series, and additional interest (of an additional approximately 5% per annum) will accrue on the respective series. The Senior Secured Tower Revenue Notes 2015-2 have an anticipated repayment date in 2025. The Senior Secured Tower Revenue Notes, 2018-1 and 2018-2 have anticipated repayment dates in 2023 and 2028, respectively. Notes are prepayable at par if voluntarily repaid within certain repayment windows (typically twelve to eighteen months or less prior to maturity); earlier prepayment may require additional consideration.
(c)As of December 31, 2021, the undrawn availability under the $5.0 billion 2016 Revolver was $4.3 billion.
(d)As of December 31, 2021, the Company had $735 million available for issuance under the $1.0 billion unsecured commercial paper program ("CP Program"). The maturities of the Commercial Paper Notes, when outstanding, may vary but may not exceed 397 days from the date of issue.
The pathway to possible.
CrownCastle.com
| News Release continued: | Page 18 | |||||||
Net Debt to Last Quarter Annualized Adjusted EBITDA Calculation:
| (dollars in millions) | For the Three Months Ended December 31, 2021 | ||||
| Total face value of debt | $ | 20,799 | |||
| Less: Ending cash, cash equivalents and restricted cash | 466 | ||||
| Total Net Debt | $ | 20,333 | |||
| Adjusted EBITDA for the three months ended December 31, 2021 | $ | 984 | |||
| Last quarter annualized Adjusted EBITDA | 3,936 | ||||
| Net Debt to Last Quarter Annualized Adjusted EBITDA | 5.2 | x | |||
Components of Capital Expenditures:(a)
| For the Three Months Ended | |||||||||||||||||||||||||||||
| (in millions) | December 31, 2021 | December 31, 2020 | |||||||||||||||||||||||||||
| Towers | Fiber | Other | Total | Towers | Fiber | Other | Total | ||||||||||||||||||||||
| Discretionary: | |||||||||||||||||||||||||||||
| Purchases of land interests | $ | 19 | $ | 2 | $ | — | $ | 21 | $ | 23 | $ | — | $ | — | $ | 23 | |||||||||||||
Communications infrastructure improvements and other capital projects | 34 | 239 | 13 | 286 | 38 | 292 | 12 | 342 | |||||||||||||||||||||
| Sustaining | 8 | 14 | 8 | 30 | 3 | 14 | 4 | 21 | |||||||||||||||||||||
| Total | $ | 61 | $ | 255 | $ | 21 | $ | 337 | $ | 64 | $ | 306 | $ | 16 | $ | 386 | |||||||||||||
| For the Twelve Months Ended | |||||||||||||||||||||||||||||
| (in millions) | December 31, 2021 | December 31, 2020 | |||||||||||||||||||||||||||
| Towers | Fiber | Other | Total | Towers | Fiber | Other | Total | ||||||||||||||||||||||
| Discretionary: | |||||||||||||||||||||||||||||
| Purchases of land interests | $ | 64 | $ | 2 | $ | — | $ | 66 | $ | 64 | $ | — | $ | — | $ | 64 | |||||||||||||
Communications infrastructure improvements and other capital projects | 138 | 905 | 33 | 1,076 | 257 | 1,179 | 38 | 1,474 | |||||||||||||||||||||
| Sustaining | 19 | 49 | 19 | 87 | 14 | 53 | 19 | 86 | |||||||||||||||||||||
| Total | $ | 221 | $ | 956 | $ | 52 | $ | 1,229 | $ | 335 | $ | 1,232 | $ | 57 | $ | 1,624 | |||||||||||||
(a)See "Non-GAAP Financial Measures, Segment Measures and Other Calculations" for further discussion of our components of capital expenditures.
The pathway to possible.
CrownCastle.com
| News Release continued: | Page 19 | |||||||
Cautionary Language Regarding Forward-Looking Statements
This news release contains forward-looking statements and information that are based on our management's current expectations as of the date of this news release. Statements that are not historical facts are hereby identified as forward-looking statements. In addition, words such as "estimate," "see," "anticipate," "project," "plan," "intend," "believe," "expect," "likely," "predicted," "gives confidence," "positioned," "continue," "target," "focus," and any variations of these words and similar expressions are intended to identify forward-looking statements. Such statements include our full year 2022 Outlook and plans, projections, and estimates regarding (1) potential benefits, growth, returns, capabilities, opportunities and shareholder value which may be derived from our business, strategy, risk profile, assets and customer solutions, investments, acquisitions and dividends, (2) our business, strategy, strategic position, business model and capabilities and the strength thereof, (3) 5G deployment in the United States and our customers' strategy and plans with respect thereto and demand for our assets and solutions created by such deployment and our customers' strategy and plans, (4) our long- and short-term prospects and the trends, events and industry activities impacting our business, (5) opportunities we see to deliver value to our shareholders, (6) our dividends (including timing of payment thereof), dividend targets, dividend payout ratio, and our long- and short-term dividend (including on a per share basis) growth rate, and its driving factors, (7) debt maturities, (8) cash flows, including growth thereof, (9) leasing environment (including with respect to tower application volumes) and the leasing activity we see in our business, and benefits and opportunities created thereby, (10) tenant non-renewals, including the impact and timing thereof, (11) capital expenditures, including sustaining and discretionary capital expenditures, the timing and funding thereof and any benefits that may result therefrom, (12) revenues and growth thereof (including with respect to our Towers business) and benefits derived therefrom, (13) the recurrence and impact of Nontypical Items and other nontypical items, (14) Income (loss) from continuing operations (including on a per share basis and as adjusted for Nontypical Items), (15) Adjusted EBITDA (including as adjusted for Nontypical Items), including components thereof and growth thereof, (16) costs and expenses, including interest expense and amortization of deferred financing costs, (17) FFO (including on a per share basis) and growth thereof, (18) AFFO (including on a per share basis and as adjusted for Nontypical Items) and its components and growth thereof and corresponding driving factors, (19) Organic Contribution to Site Rental Revenues and its components, including growth thereof and contributions therefrom, (20) our weighted-average common shares outstanding (including on a diluted basis) and growth thereof, (21) site rental revenues, and the growth thereof, (22) annual small cell deployment and the impacts therefrom, including any increase in run-rate, and its driving factors, (23) Fiber business growth, (24) prepaid rent, including the additions and the amortization and growth thereof, (25) the strength of the U.S. market for communications infrastructure ownership, (26) impact from T-Mobile and Sprint network consolidation, (27) strength of our balance sheet and our investment grade status and (28) the utility of certain financial measures, including non-GAAP financial measures. All future dividends are subject to declaration by our board of directors.
Such forward-looking statements are subject to certain risks, uncertainties and assumptions, including prevailing market conditions and the following:
•Our business depends on the demand for our communications infrastructure, driven primarily by demand for data, and we may be adversely affected by any slowdown in such demand. Additionally, a reduction in the amount or change in the mix of network investment by our tenants may materially and adversely affect our business (including reducing demand for our communications infrastructure or services).
•A substantial portion of our revenues is derived from a small number of tenants, and the loss, consolidation or financial instability of any of such tenants may materially decrease revenues or reduce demand for our communications infrastructure and services.
•The expansion or development of our business, including through acquisitions, increased product offerings or other strategic growth opportunities, may cause disruptions in our business, which may have an adverse effect on our business, operations or financial results.
•Our Fiber segment has expanded rapidly, and the Fiber business model contains certain differences from our Towers business model, resulting in different operational risks. If we do not successfully operate our Fiber business model or identify or manage the related operational risks, such operations may produce results that are lower than anticipated.
•Failure to timely, efficiently and safely execute on our construction projects could adversely affect our business.
•Our substantial level of indebtedness could adversely affect our ability to react to changes in our business, and the terms of our debt instruments limit our ability to take a number of actions that our management might otherwise believe to be in our best interests. In addition, if we fail to comply with our covenants, our debt could be accelerated.
•We have a substantial amount of indebtedness. In the event we do not repay or refinance such indebtedness, we could face substantial liquidity issues and might be required to issue equity securities or securities convertible into equity securities, or sell some of our assets to meet our debt payment obligations.
•Sales or issuances of a substantial number of shares of our common stock or securities convertible into shares of our common stock may adversely affect the market price of our common stock.
•As a result of competition in our industry, we may find it more difficult to negotiate favorable rates on our new or renewing tenant contracts.
•New technologies may reduce demand for our communications infrastructure or negatively impact our revenues.
The pathway to possible.
CrownCastle.com
| News Release continued: | Page 20 | |||||||
•If we fail to retain rights to our communications infrastructure, including the rights to land under our towers and the right-of-way and other agreements related to our small cells and fiber, our business may be adversely affected.
•Our services business has historically experienced significant volatility in demand, which reduces the predictability of our results.
•New wireless technologies may not deploy or be adopted by tenants as rapidly or in the manner projected.
•If we fail to comply with laws or regulations which regulate our business and which may change at any time, we may be fined or even lose our right to conduct some of our business.
•If radio frequency emissions from wireless handsets or equipment on our communications infrastructure are demonstrated to cause negative health effects, potential future claims could adversely affect our operations, costs or revenues.
•Certain provisions of our restated certificate of incorporation, amended and restated by-laws and operative agreements, and domestic and international competition laws may make it more difficult for a third party to acquire control of us or for us to acquire control of a third party, even if such a change in control would be beneficial to our stockholders.
•We may be vulnerable to security breaches or other unforeseen events that could adversely affect our operations, business, and reputation.
•Future dividend payments to our stockholders will reduce the availability of our cash on hand available to fund future discretionary investments, and may result in a need to incur indebtedness or issue equity securities to fund growth opportunities. In such event, the then current economic, credit market or equity market conditions will impact the availability or cost of such financing, which may hinder our ability to grow our per share results of operations.
•Remaining qualified to be taxed as a REIT involves highly technical and complex provisions of the U.S. Internal Revenue Code. Failure to remain qualified as a REIT would result in our inability to deduct dividends to stockholders when computing our taxable income, which would reduce our available cash.
•Complying with REIT requirements, including the 90% distribution requirement, may limit our flexibility or cause us to forgo otherwise attractive opportunities, including certain discretionary investments and potential financing alternatives.
•REIT related ownership limitations and transfer restrictions may prevent or restrict certain transfers of our capital stock.
•The impact of COVID-19 and related risks could materially affect our financial position, results of operations and cash flows.
Should one or more of these or other risks or uncertainties materialize, or should underlying assumptions prove incorrect, actual results may vary materially from those expected. More information about potential risk factors which could affect our results is included in our filings with the SEC. Our filings with the SEC are available through the SEC website at www.sec.gov or through our investor relations website at investor.crowncastle.com. We use our investor relations website to disclose information about us that may be deemed to be material. We encourage investors, the media and others interested in us to visit our investor relations website from time to time to review up-to-date information or to sign up for e-mail alerts to be notified when new or updated information is posted on the site.
As used in this release, the term "including," and any variation thereof, means "including without limitation."
The pathway to possible.
CrownCastle.com
| News Release continued: | Page 21 | |||||||
| CROWN CASTLE INTERNATIONAL CORP. CONDENSED CONSOLIDATED BALANCE SHEET (UNAUDITED) (Amounts in millions, except par values) | ||||
| December 31, 2021 | December 31, 2020 | ||||||||||
| ASSETS | |||||||||||
| Current assets: | |||||||||||
| Cash and cash equivalents | $ | 292 | $ | 232 | |||||||
| Restricted cash | 169 | 144 | |||||||||
| Receivables, net | 543 | 431 | |||||||||
| Prepaid expenses | 105 | 95 | |||||||||
| Other current assets | 145 | 202 | |||||||||
| Total current assets | 1,254 | 1,104 | |||||||||
| Deferred site rental receivables | 1,588 | 1,408 | |||||||||
| Property and equipment, net | 15,269 | 15,162 | |||||||||
| Operating lease right-of-use assets | 6,682 | 6,464 | |||||||||
| Goodwill | 10,078 | 10,078 | |||||||||
| Other intangible assets, net | 4,046 | 4,433 | |||||||||
| Other assets, net | 123 | 119 | |||||||||
| Total assets | $ | 39,040 | $ | 38,768 | |||||||
| LIABILITIES AND EQUITY | |||||||||||
| Current liabilities: | |||||||||||
| Accounts payable | $ | 246 | $ | 230 | |||||||
| Accrued interest | 182 | 199 | |||||||||
| Deferred revenues | 776 | 704 | |||||||||
| Other accrued liabilities | 401 | 378 | |||||||||
| Current maturities of debt and other obligations | 72 | 129 | |||||||||
| Current portion of operating lease liabilities | 349 | 329 | |||||||||
| Total current liabilities | 2,026 | 1,969 | |||||||||
| Debt and other long-term obligations | 20,557 | 19,151 | |||||||||
| Operating lease liabilities | 6,031 | 5,808 | |||||||||
| Other long-term liabilities | 2,168 | 2,379 | |||||||||
| Total liabilities | 30,782 | 29,307 | |||||||||
| Commitments and contingencies | |||||||||||
| CCIC stockholders' equity: | |||||||||||
| Common stock, $0.01 par value; 600 shares authorized; shares issued and outstanding: December 31, 2021—432 and December 31, 2020—431 | 4 | 4 | |||||||||
| Additional paid-in capital | 18,011 | 17,933 | |||||||||
| Accumulated other comprehensive income (loss) | (4) | (4) | |||||||||
| Dividends/distributions in excess of earnings | (9,753) | (8,472) | |||||||||
| Total equity | 8,258 | 9,461 | |||||||||
| Total liabilities and equity | $ | 39,040 | $ | 38,768 | |||||||
The pathway to possible.
CrownCastle.com
| News Release continued: | Page 22 | |||||||
| CROWN CASTLE INTERNATIONAL CORP. CONDENSED CONSOLIDATED STATEMENT OF OPERATIONS (UNAUDITED) (Amounts in millions, except per share amounts) | ||||
| Three Months Ended December 31, | Twelve Months Ended December 31, | ||||||||||||||||||||||
| 2021 | 2020 | 2021 | 2020 | ||||||||||||||||||||
| Net revenues: | |||||||||||||||||||||||
| Site rental | $ | 1,474 | $ | 1,352 | $ | 5,719 | $ | 5,320 | |||||||||||||||
| Services and other | 180 | 141 | 621 | 520 | |||||||||||||||||||
| Net revenues | 1,654 | 1,493 | 6,340 | 5,840 | |||||||||||||||||||
| Operating expenses: | |||||||||||||||||||||||
Costs of operations:(a) | |||||||||||||||||||||||
| Site rental | 387 | 401 | 1,554 | 1,521 | |||||||||||||||||||
| Services and other | 138 | 123 | 439 | 448 | |||||||||||||||||||
| Selling, general and administrative | 180 | 185 | 680 | 678 | |||||||||||||||||||
| Asset write-down charges | 12 | 64 | 21 | 74 | |||||||||||||||||||
| Acquisition and integration costs | — | 1 | 1 | 10 | |||||||||||||||||||
| Depreciation, amortization and accretion | 415 | 401 | 1,644 | 1,608 | |||||||||||||||||||
| Total operating expenses | 1,132 | 1,175 | 4,339 | 4,339 | |||||||||||||||||||
| Other operating (income) expense | — | (362) | — | (362) | |||||||||||||||||||
| Operating income (loss) | 522 | 680 | 2,001 | 1,863 | |||||||||||||||||||
| Interest expense and amortization of deferred financing costs | (164) | (167) | (657) | (689) | |||||||||||||||||||
| Gains (losses) on retirement of long-term obligations | — | — | (145) | (95) | |||||||||||||||||||
| Interest income | — | — | 1 | 2 | |||||||||||||||||||
| Other income (expense) | (4) | — | (21) | (5) | |||||||||||||||||||
| Income (loss) before income taxes | 354 | 513 | 1,179 | 1,076 | |||||||||||||||||||
| Benefit (provision) for income taxes | (1) | (5) | (21) | (20) | |||||||||||||||||||
| Income (loss) from continuing operations | 353 | 508 | 1,158 | 1,056 | |||||||||||||||||||
| Discontinued operations: | |||||||||||||||||||||||
| Net gain (loss) from disposal of discontinued operations, net of tax | — | — | (62) | — | |||||||||||||||||||
| Income (loss) from discontinued operations, net of tax | — | — | (62) | — | |||||||||||||||||||
| Net income (loss) | 353 | 508 | 1,096 | 1,056 | |||||||||||||||||||
| Dividends/distributions on preferred stock | — | — | — | (57) | |||||||||||||||||||
Net income (loss) attributable to CCIC common stockholders | $ | 353 | $ | 508 | $ | 1,096 | $ | 999 | |||||||||||||||
Net income (loss) attributable to CCIC common stockholders, per common share: | |||||||||||||||||||||||
| Income (loss) from continuing operations, basic | $ | 0.82 | $ | 1.17 | $ | 2.68 | $ | 2.36 | |||||||||||||||
| Income (loss) from discontinued operations, basic | — | — | (0.14) | — | |||||||||||||||||||
| Net income (loss) attributable to CCIC common stockholders, basic | $ | 0.82 | $ | 1.17 | $ | 2.54 | $ | 2.36 | |||||||||||||||
| Income (loss) from continuing operations, diluted | $ | 0.81 | $ | 1.17 | $ | 2.67 | $ | 2.35 | |||||||||||||||
| Income (loss) from discontinued operations, diluted | — | — | (0.14) | — | |||||||||||||||||||
| Net income (loss) attributable to CCIC common stockholders, diluted | $ | 0.81 | $ | 1.17 | $ | 2.53 | $ | 2.35 | |||||||||||||||
| Weighted-average common shares outstanding: | |||||||||||||||||||||||
| Basic | 432 | 431 | 432 | 423 | |||||||||||||||||||
| Diluted | 434 | 433 | 434 | 425 | |||||||||||||||||||
(a)Exclusive of depreciation, amortization and accretion shown separately.
The pathway to possible.
CrownCastle.com
| News Release continued: | Page 23 | |||||||
| CROWN CASTLE INTERNATIONAL CORP. CONDENSED CONSOLIDATED STATEMENT OF CASH FLOWS (UNAUDITED) (In millions of dollars) | ||||
| Twelve Months Ended December 31, | |||||||||||
| 2021 | 2020 | ||||||||||
| Cash flows from operating activities: | |||||||||||
| Income (loss) from continuing operations | $ | 1,158 | $ | 1,056 | |||||||
| Adjustments to reconcile Income (loss) from continuing operations to net cash provided by (used for) operating activities: | |||||||||||
| Depreciation, amortization and accretion | 1,644 | 1,608 | |||||||||
| (Gains) losses on retirement of long-term obligations | 145 | 95 | |||||||||
| Amortization of deferred financing costs and other non-cash interest, net | 13 | 6 | |||||||||
| Stock-based compensation expense | 129 | 138 | |||||||||
| Asset write-down charges | 21 | 74 | |||||||||
| Deferred income tax (benefit) provision | 4 | 3 | |||||||||
| Other non-cash adjustments, net | 21 | 5 | |||||||||
| Changes in assets and liabilities, excluding the effects of acquisitions: | |||||||||||
| Increase (decrease) in liabilities | (120) | (111) | |||||||||
| Decrease (increase) in assets | (226) | 181 | |||||||||
| Net cash provided by (used for) operating activities | 2,789 | 3,055 | |||||||||
| Cash flows from investing activities: | |||||||||||
| Capital expenditures | (1,229) | (1,624) | |||||||||
| Payments for acquisitions, net of cash acquired | (111) | (107) | |||||||||
| Other investing activities, net | 8 | (10) | |||||||||
| Net cash provided by (used for) investing activities | (1,332) | (1,741) | |||||||||
| Cash flows from financing activities: | |||||||||||
| Proceeds from issuance of long-term debt | 3,985 | 3,733 | |||||||||
| Principal payments on debt and other long-term obligations | (1,076) | (105) | |||||||||
| Purchases and redemptions of long-term debt | (2,089) | (2,490) | |||||||||
| Borrowings under revolving credit facility | 1,245 | 2,430 | |||||||||
| Payments under revolving credit facility | (870) | (2,665) | |||||||||
| Net borrowings (repayments) under commercial paper program | (20) | 130 | |||||||||
| Payments for financing costs | (42) | (38) | |||||||||
| Purchases of common stock | (70) | (76) | |||||||||
| Dividends/distributions paid on common stock | (2,373) | (2,105) | |||||||||
| Dividends/distributions paid on preferred stock | — | (85) | |||||||||
| Net cash provided by (used for) financing activities | (1,310) | (1,271) | |||||||||
| Net increase (decrease) in cash, cash equivalents, and restricted cash - continuing operations | 147 | 43 | |||||||||
| Discontinued operations: | |||||||||||
| Net cash provided by (used for) operating activities | (62) | — | |||||||||
| Net increase (decrease) in cash, cash equivalents and restricted cash - discontinued operations | (62) | — | |||||||||
| Effect of exchange rate changes on cash | — | — | |||||||||
| Cash, cash equivalents, and restricted cash at beginning of period | 381 | 338 | |||||||||
| Cash, cash equivalents, and restricted cash at end of period | $ | 466 | $ | 381 | |||||||
| Supplemental disclosure of cash flow information: | |||||||||||
| Interest paid | 661 | 653 | |||||||||
| Income taxes paid | 20 | 19 | |||||||||
The pathway to possible.
CrownCastle.com
| News Release continued: | Page 24 | |||||||
| CROWN CASTLE INTERNATIONAL CORP. SEGMENT OPERATING RESULTS (UNAUDITED) (In millions of dollars) | ||||
| SEGMENT OPERATING RESULTS | |||||||||||||||||||||||||||||||||||||||||||||||
| Three Months Ended December 31, 2021 | Three Months Ended December 31, 2020 | ||||||||||||||||||||||||||||||||||||||||||||||
| Towers | Fiber | Other | Consolidated Total | Towers | Fiber | Other | Consolidated Total | ||||||||||||||||||||||||||||||||||||||||
| Segment site rental revenues | $ | 985 | $ | 489 | $ | 1,474 | $ | 884 | $ | 468 | $ | 1,352 | |||||||||||||||||||||||||||||||||||
| Segment services and other revenues | 174 | 6 | 180 | 133 | 8 | 141 | |||||||||||||||||||||||||||||||||||||||||
| Segment revenues | 1,159 | 495 | 1,654 | 1,017 | 476 | 1,493 | |||||||||||||||||||||||||||||||||||||||||
| Segment site rental costs of operations | 231 | 148 | 379 | 218 | 173 | 391 | |||||||||||||||||||||||||||||||||||||||||
| Segment services and other costs of operations | 130 | 6 | 136 | 117 | 5 | 122 | |||||||||||||||||||||||||||||||||||||||||
Segment costs of operations(a)(b) | 361 | 154 | 515 | 335 | 178 | 513 | |||||||||||||||||||||||||||||||||||||||||
Segment site rental gross margin(c) | 754 | 341 | 1,095 | 666 | 295 | 961 | |||||||||||||||||||||||||||||||||||||||||
Segment services and other gross margin(c) | 44 | — | 44 | 16 | 3 | 19 | |||||||||||||||||||||||||||||||||||||||||
Segment selling, general and administrative expenses(b) | 29 | 41 | 70 | 30 | 49 | 79 | |||||||||||||||||||||||||||||||||||||||||
| Segment other operating (income) expense | — | — | — | — | (362) | (362) | |||||||||||||||||||||||||||||||||||||||||
Segment operating profit(c) | 769 | 300 | 1,069 | 652 | 611 | 1,263 | |||||||||||||||||||||||||||||||||||||||||
Other selling, general and administrative expenses(b) | $ | 85 | 85 | $ | 84 | 84 | |||||||||||||||||||||||||||||||||||||||||
| Stock-based compensation expense | 31 | 31 | 28 | 28 | |||||||||||||||||||||||||||||||||||||||||||
Depreciation, amortization and accretion | 415 | 415 | 401 | 401 | |||||||||||||||||||||||||||||||||||||||||||
Interest expense and amortization of deferred financing costs | 164 | 164 | 167 | 167 | |||||||||||||||||||||||||||||||||||||||||||
Other (income) expenses to reconcile to income (loss) before income taxes(d) | 20 | 20 | 70 | 70 | |||||||||||||||||||||||||||||||||||||||||||
Income (loss) before income taxes | $ | 354 | $ | 513 | |||||||||||||||||||||||||||||||||||||||||||
| FIBER SEGMENT SITE RENTAL REVENUES SUMMARY | |||||||||||||||||||||||||||||||||||
| Three Months Ended December 31, | |||||||||||||||||||||||||||||||||||
| 2021 | 2020 | ||||||||||||||||||||||||||||||||||
| Fiber Solutions | Small Cells | Total | Fiber Solutions | Small Cells | Total | ||||||||||||||||||||||||||||||
| Site rental revenues | $ | 331 | $ | 158 | $ | 489 | $ | 325 | $ | 143 | $ | 468 | |||||||||||||||||||||||
(a) Exclusive of depreciation, amortization and accretion shown separately.
(b) Segment costs of operations excludes (1) stock-based compensation expense of $6 million in each of the three months ended December 31, 2021 and 2020 (2) prepaid lease purchase price adjustments of $4 million and $5 million for the three months ended December 31, 2021 and 2020, respectively. Selling, general and administrative expenses exclude stock-based compensation expense of $25 million and $22 million for the three months ended December 31, 2021 and 2020, respectively.
(c) See "Non-GAAP Financial Measures, Segment Measures and Other Calculations" for a discussion of our definitions of segment site rental gross margin, segment services and other gross margin and segment operating profit.
(d) See condensed consolidated statement of operations for further information.
The pathway to possible.
CrownCastle.com
| News Release continued: | Page 25 | |||||||
| SEGMENT OPERATING RESULTS | |||||||||||||||||||||||||||||||||||||||||||||||
| Twelve Months Ended December 31, 2021 | Twelve Months Ended December 31, 2020 | ||||||||||||||||||||||||||||||||||||||||||||||
| Towers | Fiber | Other | Consolidated Total | Towers | Fiber | Other | Consolidated Total | ||||||||||||||||||||||||||||||||||||||||
| Segment site rental revenues | $ | 3,804 | $ | 1,915 | $ | 5,719 | $ | 3,497 | $ | 1,823 | $ | 5,320 | |||||||||||||||||||||||||||||||||||
| Segment services and other revenues | 601 | 20 | 621 | 500 | 20 | 520 | |||||||||||||||||||||||||||||||||||||||||
| Segment revenues | 4,405 | 1,935 | 6,340 | 3,997 | 1,843 | 5,840 | |||||||||||||||||||||||||||||||||||||||||
| Segment site rental costs of operations | 889 | 633 | 1,522 | 866 | 620 | 1,486 | |||||||||||||||||||||||||||||||||||||||||
| Segment services and other costs of operations | 414 | 17 | 431 | 429 | 12 | 441 | |||||||||||||||||||||||||||||||||||||||||
Segment costs of operations(a)(b) | 1,303 | 650 | 1,953 | 1,295 | 632 | 1,927 | |||||||||||||||||||||||||||||||||||||||||
Segment site rental gross margin(c) | 2,915 | 1,282 | 4,197 | 2,631 | 1,203 | 3,834 | |||||||||||||||||||||||||||||||||||||||||
Segment services and other gross margin(c) | 187 | 3 | 190 | 71 | 8 | 79 | |||||||||||||||||||||||||||||||||||||||||
Segment selling, general and administrative expenses(b) | 107 | 174 | 281 | 100 | 186 | 286 | |||||||||||||||||||||||||||||||||||||||||
| Segment other operating (income) expense | — | — | — | — | (362) | (362) | |||||||||||||||||||||||||||||||||||||||||
Segment operating profit(c) | 2,995 | 1,111 | 4,106 | 2,602 | 1,387 | 3,989 | |||||||||||||||||||||||||||||||||||||||||
Other selling, general and administrative expenses(b) | $ | 290 | 290 | $ | 283 | 283 | |||||||||||||||||||||||||||||||||||||||||
| Stock-based compensation expense | 131 | 131 | 133 | 133 | |||||||||||||||||||||||||||||||||||||||||||
Depreciation, amortization and accretion | 1,644 | 1,644 | 1,608 | 1,608 | |||||||||||||||||||||||||||||||||||||||||||
Interest expense and amortization of deferred financing costs | 657 | 657 | 689 | 689 | |||||||||||||||||||||||||||||||||||||||||||
Other (income) expenses to reconcile to income (loss) before income taxes(d) | 205 | 205 | 200 | 200 | |||||||||||||||||||||||||||||||||||||||||||
Income (loss) before income taxes | $ | 1,179 | $ | 1,076 | |||||||||||||||||||||||||||||||||||||||||||
| FIBER SEGMENT SITE RENTAL REVENUES SUMMARY | |||||||||||||||||||||||||||||||||||
| Twelve Months Ended December 31, | |||||||||||||||||||||||||||||||||||
| 2021 | 2020 | ||||||||||||||||||||||||||||||||||
| Fiber Solutions | Small Cells | Total | Fiber Solutions | Small Cells | Total | ||||||||||||||||||||||||||||||
| Site rental revenues | $ | 1,318 | $ | 597 | $ | 1,915 | $ | 1,275 | $ | 548 | $ | 1,823 | |||||||||||||||||||||||
(a) Exclusive of depreciation, amortization and accretion shown separately.
(b) Segment costs of operations excludes (1) stock-based compensation expense of $22 million and $24 million for the twelve months ended December 31, 2021 and 2020, respectively and (2) prepaid lease purchase price adjustments of $18 million in each of the twelve months ended December 31, 2021 and 2020. Selling, general and administrative expenses exclude stock-based compensation expense of $109 million in each of the twelve months ended December 31, 2021 and 2020.
(c) See "Non-GAAP Financial Measures, Segment Measures and Other Calculations" for a discussion of our definitions of segment site rental gross margin, segment services and other gross margin and segment operating profit.
(d) See condensed consolidated statement of operations for further information.
The pathway to possible.
CrownCastle.com