| 1 |
 | Technical Report Summary for Casa de Pedra Operations Exhibit 96.3 |
INDEX
| 1. | Introduction | 3 |
| 2. | Geology | 4 |
| 3. | Mineral Resources | 7 |
| 4. | Mineral Reserves | 11 |
| 2 |
 | Technical Report Summary for Casa de Pedra Operations Exhibit 96.3 |
Introduction
The Casa de Pedra (CdP) is an iron ore mining complex owned by CSN. The mining operations are located in the municipality of Congonhas, State of Minas Gerais, approximately 80 km south of the regional capital of Belo Horizonte and 360 km north of the city of Rio de Janeiro. The site is approximately 1,000 meters above sea level and accessible from the cities of Belo Horizonte or Congonhas through mostly paved roads.
The CdP mine consists of a hematite-rich banded iron ore deposit which is part of Quadrilátero Ferrífero (Iron Ore Quadrangle). The district a major iron ore producing regions in Brazil over the last 50 years. The mine has been operating since 1913.
CdP complex produces lump ore, sinter feed and pellet feed fines. CSN sells its iron ore products mainly in Asia, Europe and Brazil.
The CdP location is illustrated in Figure 1.
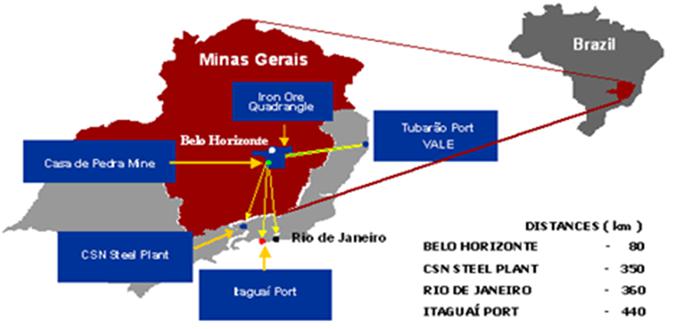
Figure 1 – Location of The Casa de Pedra Mining Complex
This document summarizes the assumptions and methodologies used to estimate the Mineral Resources and Mineral Reserves of the CdP mine.
| 3 |
 | Technical Report Summary for Casa de Pedra Operations Exhibit 96.3 |
Geology
Regional and Local Geology
The Casa de Pedra iron oxide deposit (CdP) is located within the Quadrilátero Ferrífero (QF), an area of approximately 7,000 square kilometers (km2) within the San Francisco Craton in the central part of Minas Gerais, Brazil. The QF name derives from the arrangement of the regional mountains and being composed primarily of iron-bearing formations that form a quadrilateral with the majority of Brazil's iron ore production located in the QF. The regional geology was originally mapped by a collaboration of American and Brazilian geologists during the mid-twentieth century in an agreement between the Brazilian government and the U.S. Geological Survey. The general geology of the QF is presented in Figure 2.
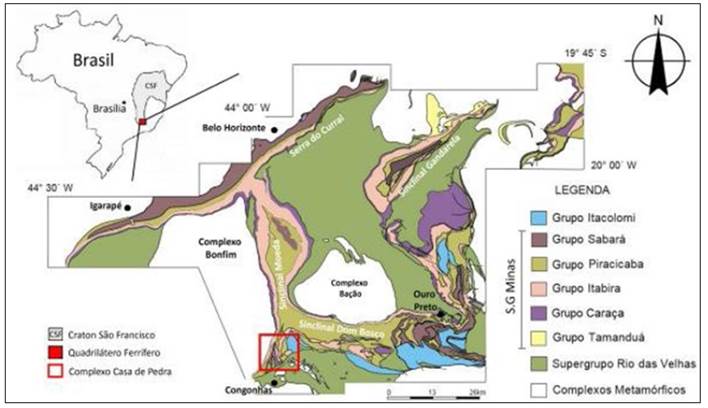
Figure 2 – Geological Map of the Quadrilátero Ferrífero and Casa de Pedra Mineral Deposit
The formations of economic interest in the mine area are hosted within the Minas Supergroup, Itabira Group, and Cauê Formation (Figure 3). The CdP is characterized by several occurrences of iron oxide, where the main hematitic bodies occur as lenses in the NW-SE direction. These lenses are present along a 50 km sinformal structure, having a normal flank in a North-South direction to the west and an inverted flank to the east of NW-SE, in the North portion, and which surrounds the Bação Metamorphic Complex in the South domain. The CdP mine is located on the western hinge of the Sinclinal Moeda.
The CdP mine area has undergone three deformational events which control deposit attributes between the Main and Western deposits within the CdP complex. These two deposits exhibit distinct differences in mineralogy and texture as a result of the individual structural domains. The Main body is composed of granular hematite and magnetite (itabirite) with porosity averaging 20% compared to the West body which is richer in specularite (specular hematite) and goethite with lower porosities averaging 17%.
Within the CdP mine, lithologies are defined from oldest to youngest as:
| 1. | Chlorite Schists (Nova Lima Group - Rio das Velhas Supergroup) |
| 2. | Quartzites (Caraça Group - Moeda Formation) |
| 3. | Carbonous Filites (Grupo Caraça - Batatal Formation) |
| 4. | Iron formations and manganese rocks (Grupo Itabira - Cauê Formation) |
| 4 |
 | Technical Report Summary for Casa de Pedra Operations Exhibit 96.3 |
| 5. | Dolomites and dolomitic phyllites (Grupo Itabira - Gandarela Formation) |
| 6. | Sericita Xistos - (Grupo Piracicaba - Cercadinho Formation) |
| 7. | Mafic (basic) intrusives, primarily metagabbro. |
| 8. | Tertiary deposits (stratified clays) |
| 9. | Quaternary covers |
Within the Cauê Formation at the CdP mine, the Formation is broken down into seven distinct units: hematites (> 64% Fe), rich itabirites (58% to 64% Fe), siliceous itabirites, goethitic itabirites, carbonate itabirites and manganese itabirites for mining purposes. These units form the base for Mineral Resource and estimation domains.
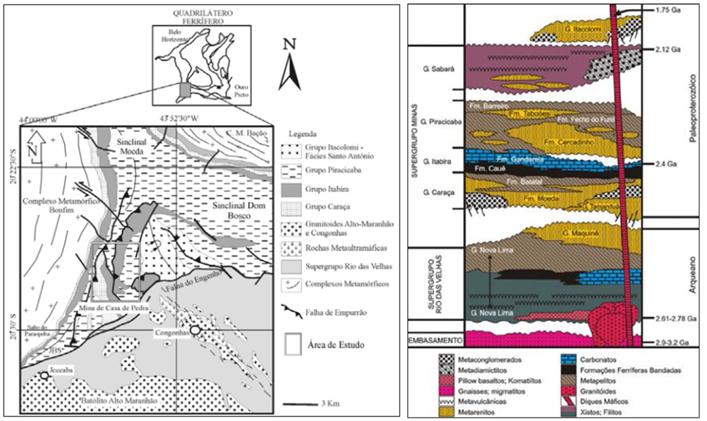
Figure 3 – Geological Map of the Casa de Pedra Mineral Deposit and Stratigraphic Column
Mineralization
The CdP iron deposit is considered a Lake Superior-type banded iron formation (BIF or itabirite) deposit that has been enriched in iron and depleted in silica from a combination of supergene and hydrothermal processes. Iron ore is hosted in the banded iron Cauê Formation of the Itabira Group of the Paleoproterzoic Supergroup Minas with an approximate 2.52 Ga age. Enriched iron oxide is present as compact or friable hematite, semi-compact to compact itabirites, composed of millimeter to centimeter bands of hematite and/or magnetite with interlayered quartz.
Iron oxide enrichment through supergene processes is controlled along NW-SE thrust faults that bound the Main and West deposits. Hypogene alteration is evident through the presence of martite. The Cauê Formation consists of BIF, amphibolitic BIF, and dolomitic BIF with subordinate manganese and phyllite-rich zones. Stratigraphically above the Cauê Fm lies the Gandarela Formation consisting of carbonates and phyllitic itabirite.
Figure 4 illustrates local geology and a representative cross section through the CdP deposit. The importance of in-pit thrust faults are clearly shown and their relationship to mineralization.
The geometry of deformation within the two host deposits varies slightly due to the influence of regional structure. The West deposit exhibits foliation and bedding in a N-S direction until truncated by the main thrust fault separating the deposits. The more deformed Main deposit exhibits a NW-SE foliation roughly perpendicular to the highly deformed bedding Figure 5.
| 5 |
 | Technical Report Summary for Casa de Pedra Operations Exhibit 96.3 |
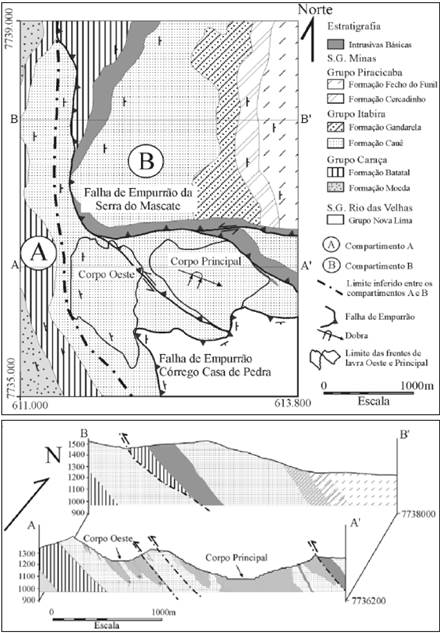
Figure 4 – Geological Map and Cross Sections through the Casa de Pedra Mineral Deposit
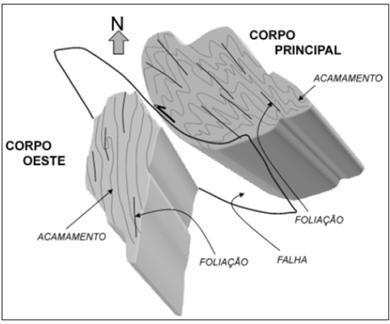
Figure 5 – 3D Views of the West (Corpo Oeste) and Main (Corpo Principal) Deposits
| 6 |
 | Technical Report Summary for Casa de Pedra Operations Exhibit 96.3 |
Mineral Resources
Exploration and Drilling
Geological mapping has occurred in the area of the CdP property since the mid-1950’s with some initial mapping performed by the U.S. Geological Survey (USGS) under an agreement with the Brazilian federal government. The QF has been well documented in enriched iron oxide and high-grade deposits even before detailed geological mapping was performed.
The drill holes completed over time is presented in Table 1.
Table 1 – Summary of Drilling Campaigns by Period
| Period | DH Count |
| 1962-1972 | 86 |
| 1973-1985 | 99 |
| 1986-1991 | 49 |
| 1993-2000 | 178 |
| 2001-2007 | 150 |
| 2008-2014 | 338 |
All drilling at CdP has been performed using diamond drilling methods. The drilling database for the CdP mine area includes the following data:
| - | 900 unique drillhole collars |
| - | 145,996 m of total drilling, all by diamond drill core |
| - | Drillholes completed between 1962 and 2014 |
| - | 56% of holes completed since 2000 including 29% since 2010 |
| - | Mean depth of drilling is 162 m |
| - | Nearly all drilling is angled from east to west |
| - | Drill spacing varies across the deposits with average distance between holes between 120 m and 200 m. |
| - | Core barrel diameter varied with documentation stating HQ2, NQ, and NQ2 are the dominant diameters. |
The drillhole database contains a collar, survey, and assay files with the majority of holes being angled from the east toward the west to provide a near perpendicular intercept with the regional stratigraphy and mineralization.
Geological logging is performed onsite using CSN geologists. The DHDB contains 37 unique logging codes based on the dominant lithology in the logged interval. Logging is recorded in the assay tab of the database with each sample interval containing a lithology descriptor called “LITO_REC”. No further details are provided in documentation.
Sampling
There has been a variety of sampling and analytical testing at CdP going back multiple decades. Both internal and external laboratories have been utilized with the most recent work (2012 to present) focused on use of SGS Laboratories for all preparation and analytical work.
Sampling is performed on all drill core by CSN geologists. Diamond drill core is cut at the site logging facility, bagged, then transported to the laboratory for preparation and analyses. All sampling is supervised or directly performed by CSN geologists.
Analytical testing and sample preparation were performed at SGS GEOSOL Laboratories, a reputable independent lab located in Minas Gerais, Brazil for the 2012 through 2014 drilling. No drilling has been completed since that time. Historic analyses were performed at the CSN in-house laboratory.
| 7 |
 | Technical Report Summary for Casa de Pedra Operations Exhibit 96.3 |
Current analyses include:
• Total Fe by titration
• Multi-element major oxide from X-Ray Fusion (XRF)
• C and S from LECO, and
• Loss-on-ignition (LOI) by calcination at 405° and 1,000°C.
Assays are performed on raw sample intervals and on grain size distributions to provide quality parameters for various crushed sizing.
QA/QC practices are performed that include use of matrix-matched certified reference materials, duplicates, and laboratory duplicates. CSN generated two matrix-matched certified reference material (CRM) standards for use as quality control (QC). The CRM’s are labeled 1CNIB (pale itabirite goethite bands) representing a very-low grade (15.90% Fe) standard and 1CNIB (powdery grey hematite) representing a high-grade (65.64% Fe) standard. CRM’s were created by SGS Geosol in 2013 using standard industry practices for certification.
Bulk density or specific gravity (SG) is measured using two methods at the CdP mine: 1) water immersion method, and 2) pycnometer or “sand bottle” method. SG testing was primarily conducted from 2012 to 2014 on various lithologies. The different methods were performed based on the hardness of the rock type with immersion conducted on competent material while pycnometer performed on soft and friable material. Based on CSN-provided data, 1,284 and 644 SG samples have been tested across all rock types for pycnometer and immersion, respectively.
Geological Model
CSN domains the drilling data into a series of lithology codes based on a combination of grain size (lump and fines) and chemical thresholds. These codes are based on the following criteria:
| - | HBA/HCP: Hematite with >64% Fe is hematite |
| - | IBR/ICR: Itabirite between 63.99% and 58% Fe is rich itabirite |
| - | IBS/IBC: Itabirite with <58% Fe is deemed silica itabirite and other itabirites, rocks below 20% are defined as sterile |
| - | IBM/ICM: Itabirite with <64% Fe and MnO >0.8% |
| - | ICC: Itabirite with >20% Fe and CaO and MgO contents above 1% |
| - | Hard or Soft material: based on the sum of the bands F1 (>12.5 mm) and F2 (6.3 mm) is >70% retained is considered hard (compact). For values less than 70%, it is coded as soft (brando) |
The domains used represent a combination of several attributes that are applicable for mining which is considered satisfactory for domaining of iron oxide deposits.
Topography is acquired using Light Detecting and Ranging (LiDAR) survey and updated by in-pit survey to generate a final pit surface.
Block Model
The model contains regularized blocks sized 25 m (X) by 25 m (Y) by 13 m (Z) and is not rotated. The model extents cover the main mineralized areas of the CdP deposit. It includes 5,486,250 blocks. The Z size was selected to correspond with bench height in the pit which is considered standard industry practice in bulk mining operations.
Compositing
Drill data is composited on 13 m length derived from bench heights and broken by changes in rock code/lithology. The resulting composited database has a mean length of 12.9 m with 9.8 m and 19.5 m the minimum and maximum length respectively. The compositing method results in approximately one sample per bench and block height with reasonable consistency in support size.
Spatial Continuity
Similar modeled domains are grouped based on analyses for estimation domains. The grouping represents geological and grade features along with zones of specific anisotropy that would lend well to estimation. While the focus on domaining and variography are based on Total Fe analytical values, variables such as silica, manganese oxide, and percent magnetic iron are also key contributors to rock types and final determination of domains.
| 8 |
 | Technical Report Summary for Casa de Pedra Operations Exhibit 96.3 |
Variography was calculated by domain for Total Fe only. Most domains exhibit a low to moderate nugget effect and are modeled using one or two structures. Bedding exhibits the primary or major direction of anisotropy.
Estimation Methodology
Ordinary Co-Kriging (COK) is applied to interpolate quality variables in the various granulometric fractions. COK is commonly utilized when data contains various counts across different variables thus it relies on high correlation coefficients of two or more variables to inform locations where one variable is absent.
It was used a multi-pass search neighborhood by hard domain with each pass utilizing an increasing search ellipsoid and changing number of min/max samples. Additional constraints on the neighborhoods include use of sectors. CSN states that a Kriging neighborhood analysis (KNA) was performed on the IBS domain with the resultant neighborhood applied to all domains and all variables.
Classification and Risk
A classification ranking system is used at CdP which accounts for a variety of geological, quality, and estimation inputs. Figure 6 and Figure 7 illustrate the spatial distribution of Mineral Resource classification and the alignment of higher classification with areas of increased drilling.
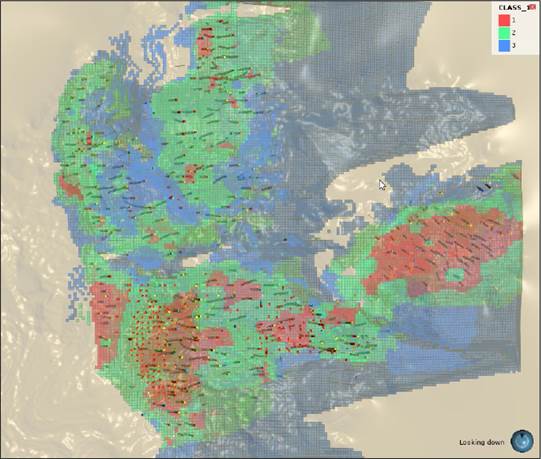
Figure 6 – Plan View of Mineral Resource Classification (1=Measured; 2=Indicated; 3=Inferred)
| 9 |
 | Technical Report Summary for Casa de Pedra Operations Exhibit 96.3 |
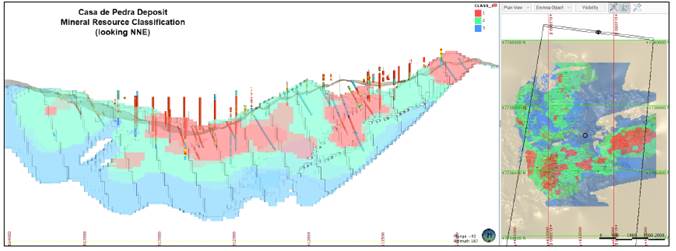
Figure 7 – Cross Section Showing Resource Classification
Mineral Resource Statement
The Mineral Resource estimate performed by CSN is summarized in Table 2 as at 1st November, 2017. In 2021, SRK performed an independent check on the reported CSN Mineral Resources using CSN-provided data. SRK was able to successfully calculate the Mineral Resource statement within 5% of stated quantity and quality. It was the SRK’s opinion that the Mineral Resources are considered validated compared to the reported values.
Table 2 - Mineral Resource as at 1st November, 2017
| Resource Classification | Tonnage | Fe | SiO2 |
| # | Mt | % | % |
| Measured | 1,123 | 41.97 | 36.63 |
| Indicated | 3,145 | 39.70 | 38.67 |
| M+I | 4,268 | 40.30 | 38.13 |
| Inferred | 1,734 | 37.56 | 39.82 |
Reasonable prospect of eventual economic extraction was verified by performing a pit optimization.
| 10 |
 | Technical Report Summary for Casa de Pedra Operations Exhibit 96.3 |
Mineral Reserves
To estimate the Mineral Reserves a number of activities were completed including detailed design of pit and waste dumps, mine scheduling, fleet and workforce calculations, along with other key aspects of the Mineral Reserve such as mineral processing, infrastructure, ESG, risk analysis, cost estimates, economic evaluation and sensitivity analysis.
All studies were developed at a level of accuracy in line with a Mineral Reserve estimate.
The Base Case for the Mineral Reserves considered the process of ore at the current processing plant at Casa de Pedra along with the greenfield project of P15 which is being developed and licensed.
Mining Method
The Casa de Pedra mine is based on a mining concept that uses conventional drill, blast, load and haul techniques for all mining areas and rock types. 100% of rock will be blasted and loaded with excavators and loaders into off-road trucks, and hauled to final destinations, i.e., primary crusher, stockpiles or waste dumps. Specifically, primary mining will be undertaken by large hydraulic excavators (26-m3 bucket capacity) coupled with 240st off-road trucks. Front-end loaders of 25-m3 bucket capacity will also operate at the pit and stockpiles.
The materials will be mined in 13-m high benches which are considered an appropriate balance between productivity and selectivity.
Grade control will be performed via drilling, sampling and assaying potential ore material within the pit boundaries.
The mine will operate 365 days, 24 hours in 3 shifts. The base case for the Project is an owner’s operation.
Physical Constraints
The pit boundaries were limited by a number of physical constraints such as mining rights, environmental licenses, land properties and infrastructure as illustrated in Figure 8.
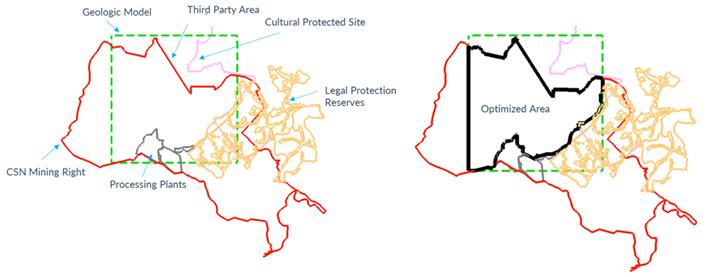
Figure 8 – Physical Constraints
Geotechnical Parameters
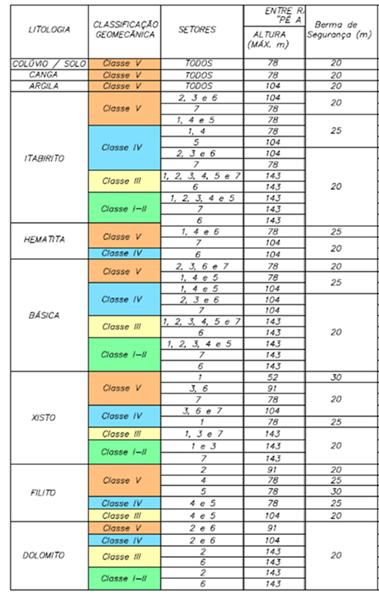
CSN completed a number of geotechnical studies based on geotechnical mapping, logging, sampling and testing which led to a rock mass characterization by sector and recommendations for pit slope design.
Geometrical parameters by rock type, class and sector are summarized in Table 3.
| 11 |
 | Technical Report Summary for Casa de Pedra Operations Exhibit 96.3 |
Table 3 – Geotechnical Design Parameters for Pit Design
Metallurgical Recovery
Various testworks have been performed in a pilot facility to derive the mass yield function, i.e. Mass Recovery = 1.1786 * Fe%.
Hematite, friable itabirites, compact itabirites and canga were considered amenable for processing.
Financial Parameters
A foreign exchange rate of R$5.40/US$ was assumed based on long range forecasts.
A discount rate of 9% was considered.
Dilution and Ore Loss
Planned dilution and ore loss factors were incorporated to the block model through a regularization procedure. The model contains regularized blocks sized 25 m (X) by 25 m (Y) by 13 m (Z) which reflects the selectivity mining unit (SMU) dimensions.
Additionally, a uniform 5% unplanned dilution factor and 95% mining recovery were applied to the pit optimization.
Economic Cut-off Grade
The economic mine cut-off to decide whether a block should be mined or left in-situ was calculated by the NPVS software of Datamine.
Revenue Assumptions
The long range prices assumed for mine planning purpose correspond to year 2025. The product pricing forecast is shown in Table 4.
| 12 |
 | Technical Report Summary for Casa de Pedra Operations Exhibit 96.3 |
Table 4 – Product Price Forecast
| Platts Iron Ore Index | Unit | Forecast by Year | Long Term Forecast | |||
| 2021 | 2022 | 2023 | 2024 | 2025 | ||
| Platts 62 | US$/dmt | 102.2 | 87.7 | 81.1 | 78.0 | 74.0 |
| Platts 65 | US$/dmt | 122.6 | 105.2 | 97.3 | 93.6 | 88.8 |
| Platts 58 | US$/dmt | 71.5 | 61.4 | 56.8 | 54.6 | 51.8 |
Applicable royalties are shown in Table 5.
Table 5 – Royalties
| Item | Unit | US$/t |
| CFEM | t product | 3.00 |
| TFRM | t RoM | 0.88 |
Cost Assumptions
The input costs used for pit optimization are based on a combination of historical data and forecasts.
The mining costs assumed for pit optimization are presented in Table 6.
Table 6 – Mining Costs
| Item | Unit | US$/t |
| Drill and Blast | t mined | 0.10 |
| Load | t mined | 0.14 |
| Haul | t mined | 0.33 |
| Ancillary | t mined | 0.42 |
| Total | t mined | 0.99 |
The cost of mineral processing, product handling and transportation, and others are shown in Table 7.
Table 7 – Processing, Handling, Transportation and Other Costs
| Item | Unit | US$/t |
| Processing | ||
| Central Plant | t RoM | 3.86 |
| P15 Plant | t RoM | 5.32 |
| Product Handling | ||
| Stockpiling | t product | 0.18 |
| Re-handling | t product | 0.32 |
| Others | ||
| Sustaining | t product | 6.43 |
| G&A | t product | 1.36 |
| Others | t product | 2.10 |
| Product Transportation | ||
| Rail | t product | 4.86 |
| Port | t product | 5.60 |
| Ocean Freight | t product | 25.64 |
| 13 |
 | Technical Report Summary for Casa de Pedra Operations Exhibit 96.3 |
Pit Optimization
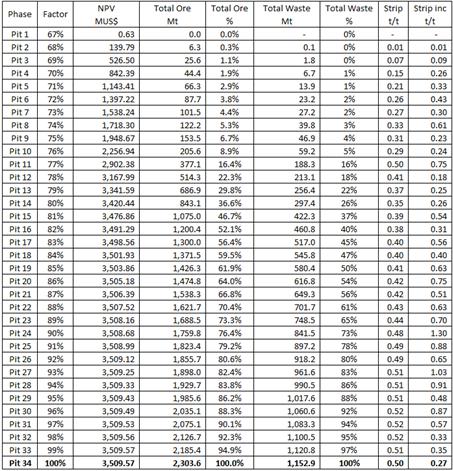
A number of nested pit shells were generated by NPVS software for a range of revenue factors on the product price. Preliminary cash flows are estimated by the optimizer based on a 9% discount rate.
The pit optimization results are presented in Table 8 and Figure 9. At this stage, no stockpile provision was considered. The cash flow figures presented do not include capital costs.
The ultimate pit shell was selected through marginal analysis. Usually, larger pit shells that have modest increases in NPV for large increases in rock tonnage were avoided. Given the fact that the CdP project is higlhy constrained by physical limits, such as mining rights, environmental licenses, land tenure and infrastructure limits, a 1.0 price factor (RF) pit shell was selected as the basis for detailed designing of the ultimate pit and intermediate phases.
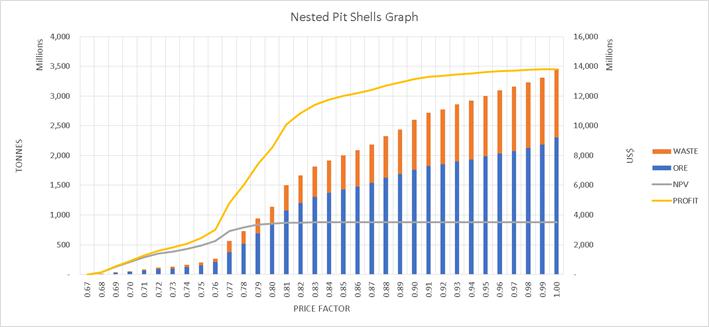
Figure 9 – Nested Pit Shells Graph
Table 8 – Optimized Nested Pit Shells
| 14 |
 | Technical Report Summary for Casa de Pedra Operations Exhibit 96.3 |
A comparison between the Resource pit shell the optimized pit (PF=1.0) is shown in Figure 10.
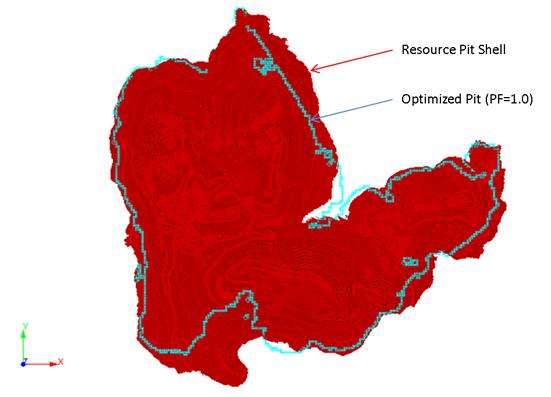
Figure 10 – Resource Pit Versus Optimized Pit (PF=1.0)
Pit Design
Detailed designing was performed on the selected ultimate pit including accesses and ramps.
The geometrical assumptions are listed below:
| - | Slope and bench geometric parameters: derived from the geotechnical recommendations. |
| - | Roads and ramps width: 35 m. |
| - | Maximum ramp gradient: 10%. |
Table 9, Figure 11 and Figure 12 show the ultimate designed pit.
Table 9 – Pit Design Evaluation
| Item | Unit | Value |
| Ore | Mt | 2,078 |
| Waste | Mt | 1,091 |
| Total Rock | Mt | 3,170 |
| Strip Ratio | t/t | 0.52 |
A comparison of tonnage and grades of the optimized pit shell and the designed pit is presented in Table 10 and Figure 13. The differences of tonnage and grades found are considered acceptable.
Table 10 – Comparison between the Optimized and Designed Pit Shells
| Item | Optimized | Designed | Difference (Mt) | Difference (%) |
| Ore (Mt) | 2,304 | 2,078 | -225 | -9.8% |
| Waste (Mt) | 1,153 | 1,091 | - 62 | -5.4% |
| Total (Mt) | 3,456 | 3,170 | -287 | -8.3% |
| Strip Ratio (t/t) | 0.50 | 0.52 | 0.02 | 4.9% |
| 15 |
 | Technical Report Summary for Casa de Pedra Operations Exhibit 96.3 |
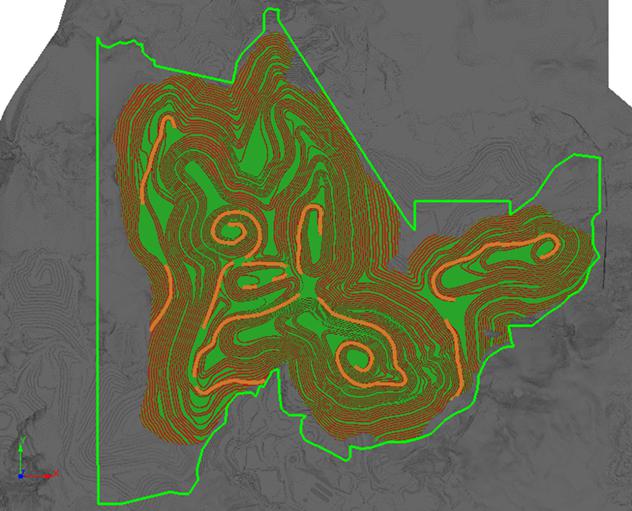
Figure 11 – Plan View of the Pit Design
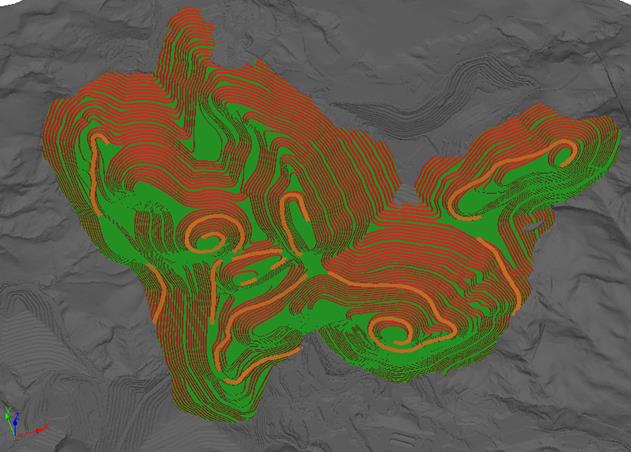
Figure 12 – 3D View of the Pit Design
| 16 |
 | Technical Report Summary for Casa de Pedra Operations Exhibit 96.3 |
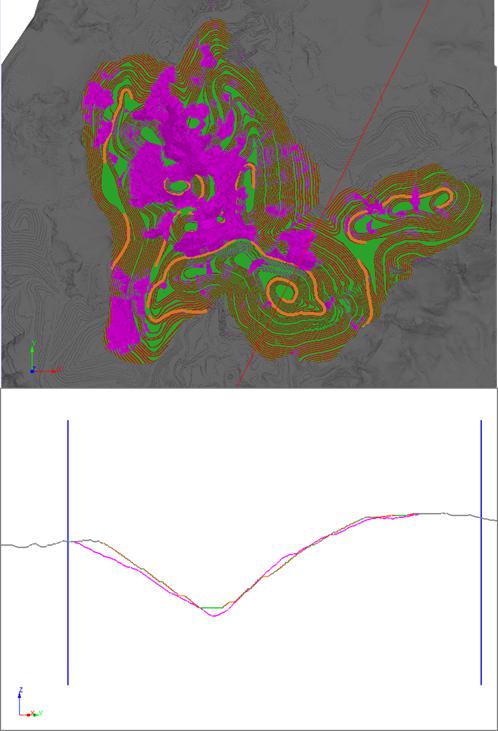
Figure 13 – Comparison between the Optimized and Designed Pit Shells
Mineral Reserve Statement
The 2022 Mineral Reserves estimate for the Casa de Pedra mine was developed in accordance with the SEC standards. This section provides a summary of the procedures and methods applied to derive the Mineral Reserves. The work has been undertaken under the supervision of a Qualified Person as defined in the SEC guidelines.
To convert Mineral Resources to Mineral Reserves, consideration was given to forecasts and estimates of product price, metallurgical recovery, mining dilution and ore loss factors, royalties and costs associated to mining, processing, overhead, and logistics. These parameters were used to derive economic cut-off grades and create a feasible pit design based on geotechnical assumptions, a production schedule and a financial model.
The estimates described herein are consistent with the quality of information available at the time of preparation, data supplied by outside sources, and the assumptions used.
The basis of the mine planning work was a Mineral Resource model estimated in compliance with the CRISCO standards. The Mineral Resources were internally developed by CSN in 2017 and further audited by SRK in 2021. No critical issues were reported.
| 17 |
 | Technical Report Summary for Casa de Pedra Operations Exhibit 96.3 |
The detailed breakdown of the Mineral Reserve is presented in Table 11. The Reserve classification reflects the level of accuracy of the modifying factors of the Reserve.
Table 11 - Mineral Reserve as at 31st December, 2021
| Mineral Reserve Category | Tonnage (Mt) | Fe (%) |
| Proved | 152.9 | 42.49 |
| Probable | 1,925.5 | 41.07 |
| Total | 2,078.4 | 41.17 |
| Notes: | - Tonnages are reported in wet basis. |
- Mineral Reserves are based on Measured and Indicated Mineral Resources only.
- The Mineral Reserve is included in the Mineral Resource
The mining inventory aforementioned is based on Measured and Indicated resources only. The estimate includes dilution and ore loss factors. Stockpiles within the current pit limits were considered waste as they are not classified as Mineral Resource.
Conclusions
The Casa de Pedra Reserves reached 2.80 Bt in 2020. Considering the material mined out in 2021 (depletion) the total Reserves amounted to 2.77 Bt. In 2022, the Mineral Reserve was updated at 2.1 Bt in accordance to SEC rules. The variation is due to a number of factors, illustrated in Figure 14, including:
| · | In the 2022 estimation the pit boundaries were more constrained. Specifically, CSN excluded the ore within adjacent areas to the northeast of the mine because of the proximity to mineral rights owned by third parties which would require the sign off of formal agreements for a joint operation. |
| · | Review of the pit design accordingly to the updated technical and economic parameters. |
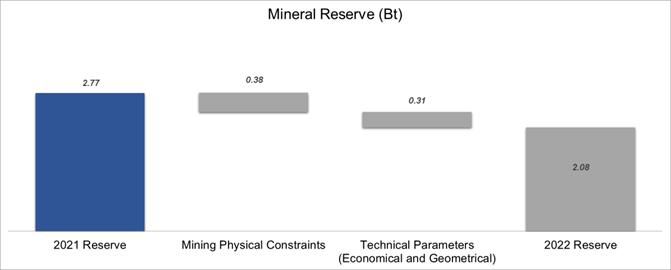
Figure 14 – Waterfall graph indicating the Mineral Reserve changes from 2021 to 2022
| By: |
|
|||
| Name: | Henrile Pinheiro Meireles | |||
| Title: | General Manager of Geological Exploration |
Date: May 17, 2022