As filed with the Securities and Exchange Commission on April 2, 2020.
UNITED STATES
SECURITIES AND EXCHANGE COMMISSION
Washington, D.C. 20549
________________________________________________
FORM 20-F
________________________________________________
|
¨ |
REGISTRATION STATEMENT PURSUANT TO SECTION 12(b) OR (g) OF THE SECURITIES EXCHANGE ACT OF 1934 |
|
|
|
OR | |
|
x |
ANNUAL REPORT PURSUANT TO SECTION 13 OR 15(d) OF THE SECURITIES EXCHANGE ACT OF 1934 |
|
|
|
OR | |
|
¨ |
TRANSITION REPORT PURSUANT TO SECTION 13 OR 15(d) OF THE SECURITIES EXCHANGE ACT OF 1934 |
|
|
|
OR | |
|
¨ |
SHELL COMPANY REPORT PURSUANT TO SECTION 13 OR 15(d) OF THE SECURITIES EXCHANGE ACT OF 1934
Commission File Number 1-14732 |
|
COMPANHIA SIDERÚRGICA NACIONAL
(Exact name of registrant as specified in its charter)
NATIONAL STEEL COMPANY
(Translation of registrant’s name into English)
_______________________________________________
THE FEDERATIVE REPUBLIC OF BRAZIL
(Jurisdiction of incorporation or organization)
Marcelo Cunha Ribeiro, Chief Financial and Investor Relations Officer
Phone: +55 11 3049-7454 Fax: +55 11 3049-7212
marcelo.ribeiro@csn.com.br
Av. Brigadeiro Faria Lima, 3400 – 20th floor
04538-132, São Paulo, SP, Brazil
(Address of principal executive offices)
________________________________________________
Securities registered or to be registered pursuant to Section 12(b) of the Act.
|
Title of each class |
Trading symbol |
Name of each exchange on which registered |
|
Common Shares without Par Value |
* |
New York Stock Exchange |
|
American Depositary Shares (as evidenced by American Depositary Receipts), each representing one share of Common Stock |
SID |
New York Stock Exchange |
____________________
40550.00004
1
None
Securities for which there is a reporting obligation pursuant to Section 15(d) of the Act:
None
Indicate the number of outstanding shares of each of the issuer’s classes of capital or common stock as of December 31, 2019:
1,387,524,047 Common Shares without Par Value
Indicate by check mark if the registrant is a well-known seasoned issuer, as defined in Rule 405 of the Securities Act.
Yes þ No
If this report is an annual or transition report, indicate by check mark if the registrant is not required to file reports pursuant to Section 13 or 15(d) of the Securities Exchange Act of 1934.
Yes þ No
Indicate by check mark whether the registrant (1) has filed all reports required to be filed by Section 13 or 15(d) of the Securities Exchange Act of 1934 during the preceding 12 months (or for such shorter period that the registrant was required to file such reports), and (2) has been subject to such filing requirements for the past 90 days.
þ Yes No
Indicate by check mark whether the registrant has submitted electronically and posted on its corporate Web site, if any, every Interactive Data File required to be submitted and posted pursuant to Rule 405 of Regulation S-T (§232.405 of this chapter) during the preceding 12 months (or for such shorter period that the registrant was required to submit and post such files).
þ Yes No
Indicate by check mark whether the registrant is a large accelerated filer, an accelerated filer, a non-accelerated filer or an emerging growth company. See definition of “large accelerated filer,” “accelerated filer” and “emerging growth company” in Rule 12b-2 of the Exchange Act.
|
Large accelerated filer þ |
Accelerated filer |
Non-accelerated filer |
Emerging growth company |
If an emerging growth company that prepares its financial statements in accordance with U.S. GAAP, indicate by check mark if the registrant has elected not to use the extended transition period for complying with any new or revised financial accounting standards† provided pursuant to Section 13(a) of the Exchange Act.
† The term “new or revised financial accounting standard” refers to any update issued by the Financial Accounting Standards Board to its Accounting Standards Codification after April 5, 2012.
Indicate by check mark which basis of accounting the registrant has used to prepare the financial statements included in this filing:
|
U.S. GAAP |
International Financial Reporting Standards as issued by the International Accounting Standards Board þ |
Other |
2
If “Other” has been checked in response to the previous question, indicate by check mark which financial statement item the registrant has elected to follow:
Item 17 Item 18
If this is an annual report, indicate by check mark whether the registrant is a shell company (as defined in Rule 12b-2 of the Exchange Act).
Yes þ No
3
TABLE OF CONTENTS
440550.00004
5
INTRODUCTION
Unless otherwise specified, all references in this annual report to:
· “we,” “us,” “our” or “CSN” are to Companhia Siderúrgica Nacional and its consolidated subsidiaries;
· “Brazil” are to the Federative Republic of Brazil;
· “Brazilian government” are to the federal government of Brazil;
· “real,” “reais” or “R$” are to Brazilian reais, the official currency of Brazil;
· “U.S. dollars” or “US$” are to United States dollars;
· “km” are to kilometers, “m” are to meters, “mt” or “tons” are to metric tons, “mtpy” are to metric tons per year and “MW” are to megawatts;
· “TEUs” are to twenty-foot equivalent units;
· “consolidated financial statements” are to our audited consolidated financial statements prepared in accordance with International Financial Reporting Standards, or IFRS, as issued by the International Accounting Standards Board, or IASB, as of December 31, 2019 and 2018 and for the years ended December 31, 2019, 2018 and 2017, together with the corresponding report of our independent registered public accounting firm; and
· “ADSs” are to the American depositary shares and “ADRs” are to the American depositary receipts representing our common shares.
FORWARD-LOOKING STATEMENTS
This annual report includes forward-looking statements, within the meaning of Section 27A of the U.S. Securities Act of 1933, as amended, or the Securities Act, and Section 21E of the U.S. Securities Exchange Act of 1934, as amended, or the Exchange Act, principally under the captions “Item 3. Key Information,” “Item 4. Information on the Company,” “Item 5. Operating and Financial Review and Prospects” and “Item 11. Quantitative and Qualitative Disclosures About Market Risk.” We have based these forward-looking statements largely on our current beliefs, expectations and projections about future events and financial trends affecting us. Although we believe these estimates and forward-looking statements are based on reasonable assumptions, these estimates and statements are subject to several risks and uncertainties and are made in light of the information currently available to us.
Many important factors, in addition to those discussed elsewhere in this annual report, could cause our actual results to differ substantially from those anticipated in our forward-looking statements, including, among others:
· general economic, political and business conditions in Brazil and abroad, especially in China, which is the largest world steel producer and main consumer of our iron ore;
· demand for and prices of steel and mining products;
· the effects of the global financial markets and economic slowdowns;
· changes in competitive conditions and the general level of demand and supply for our products;
· our liquidity position and leverage and our ability to obtain financing on satisfactory terms;
· management’s expectations and estimates concerning our future financial performance and financing plans;
· availability and price of raw materials;
· changes in international trade or international trade regulations;
· protectionist measures imposed by Brazil and other countries;
· our capital expenditure plans;
· inflation, interest rate levels and fluctuations in foreign exchange rates;
40550.00004
6
· our ability to develop and deliver our products on a timely basis;
· lack of infrastructure in Brazil;
· electricity and natural gas shortages and government responses to these;
· existing and future governmental regulation;
· threats or outbreaks of diseases or natural disasters affecting the global economy and international trade; and
· the risk factors discussed under the caption “Item 3D. Risk Factors.”
We caution you that the foregoing list of significant factors may not contain all of the material factors that are important to you. The words “believe,” “may,” “will,” “aim,” “estimate,” “plan,” “continue,” “anticipate,” “intend,” “expect” and similar words are intended to identify forward-looking statements. Forward-looking statements include information concerning our possible or assumed results of operations, business strategies, financing plans, competitive position, industry environment, potential growth opportunities, the effects of regulation and the effects of competition, among others.
Forward-looking statements speak only as of the date they were made, and we undertake no obligation to publicly update or to revise any forward-looking statements after we distribute this annual report because of new information, future events or other factors. In light of the risks and uncertainties described above, the forward-looking events and circumstances discussed in this annual report might not occur and are not an indication of future performance. As a result of various factors, including those risks described in “Item 3D. Risk Factors,” undue reliance should not be placed on these forward-looking statements.
PRESENTATION OF FINANCIAL AND OTHER INFORMATION
Our audited consolidated financial statements as of December 31, 2019 and 2018 and for the years ended December 31, 2019, 2018 and 2017 included elsewhere in this annual report have been presented in thousands of reais and prepared in accordance with IFRS as issued by the IASB. See note 2.a. to our audited consolidated financial statements.
We have translated some of the Brazilian real amounts contained in this annual report into U.S. dollars solely for the convenience of the reader at the rate of R$4.0307 to US$1.00, which was the U.S. dollar selling rate as of December 31, 2019, as reported by the Central Bank of Brazil, or the Central Bank. As a result of fluctuations in the real/U.S. dollar exchange rate, the U.S. dollar selling rate as of December 31, 2019 may not be indicative of current or future exchange rates. As of March 31, 2020, the U.S. dollar selling rate was R$5.199 to US$1.00, as reported by the Central Bank, representing a 29% depreciation of the real against the U.S. dollar in 2020 to date. The U.S. dollar equivalent information presented in this annual report should not be construed as implying that the real amounts represent, or could have been or could be converted into, U.S. dollars at such rates or at any other rate.
Certain figures included in this annual report have been subject to rounding adjustments. Accordingly, figures shown as totals in certain tables may not represent an arithmetic sum of the figures that precede them.
Certain Non-IFRS Financial Measures
This annual report includes certain references to the non-IFRS measures of EBITDA and Adjusted EBITDA.
We calculate EBITDA as net income (loss) for the period plus net financial income (expenses), income tax and social contribution, depreciation and amortization and results from discontinued operations. We calculate adjusted EBITDA as net income (loss) for the period plus net financial income (expenses), income tax and social contribution, depreciation and amortization and results of discontinued operations, plus other operating income (expenses), equity in results of affiliated companies and the proportionate EBITDA of joint ventures. EBITDA and adjusted EBITDA are not measures of financial performance recognized under Brazilian GAAP or IFRS and they should not be considered alternatives to net income (loss) as measures of operating performance, or as alternatives to operating cash flows, or as measures of liquidity. EBITDA and adjusted EBITDA are not calculated using a standard methodology and may not be comparable to the definition of EBITDA or adjusted EBITDA, or similarly titled measures, used by other companies.
40550.00004
7
PART I
Item 1. Identity of Directors, Senior Management and Advisors
Not applicable.
Item 2. Offer Statistics and Expected Timetable
Not applicable.
Item 3. Key Information
3A. Selected Financial Data
We present in this section summary consolidated financial data derived from, and that should be read in conjunction with, our audited consolidated financial statements included elsewhere in this annual report, and summary consolidated operating data.
Due to the adoption of IFRS 16 as of January 1, 2019, which we did not apply retroactively, financial information as of and for the year ended December 31, 2019 may not be comparable with financial information for prior periods. For further information on our adoption of IFRS 16, see note 13.a to our audited consolidated financial statements included elsewhere in this annual report.
Summary Financial and Operating Data
The following tables present summary consolidated financial and operating data for each of the periods indicated:
|
|
Year ended December 31, | |||||
|
Income Statement Data: |
2015(4) |
2016(4) |
2017 |
2018(1) |
2019(2) |
2019(3) |
|
|
(in million of R$, except per share data) |
(in million of US$, except per share data) | ||||
|
Net operating revenues |
15,262 |
16,126 |
18,525 |
22,969 |
25,436 |
6,311 |
|
Cost of products sold |
(11,740) |
(11,592) |
(13,596) |
(16,106) |
(17,263) |
(4,283) |
|
Gross profit |
3,522 |
4,534 |
4,929 |
6,863 |
8,173 |
2,028 |
|
Operating expenses |
|
|
|
|
|
|
|
Selling |
(1,430) |
(1,042) |
(1,815) |
(2,264) |
(2,343) |
(581) |
|
General and administrative |
(470) |
(438) |
(416) |
(494) |
(511) |
(127) |
|
Equity in results of affiliated companies |
1,160 |
331 |
109 |
136 |
126 |
31 |
|
Other expenses |
(1,341) |
(657) |
(647) |
(1,331) |
(2,407) |
(597) |
|
Other income |
3,610 |
90 |
824 |
4,036 |
504 |
125 |
|
Total |
1,529 |
(1,716) |
(1,945) |
83 |
(4,631) |
(1,149) |
|
|
|
|
|
|
|
|
|
Operating income |
5,051 |
2,818 |
2,984 |
6,946 |
3,542 |
879 |
|
Non-operating income (expenses), net |
|
|
|
|
|
|
|
Financial income |
488 |
172 |
295 |
1,311 |
379 |
94 |
|
Financial expenses |
(3,853) |
(3,253) |
(2,759) |
(2,806) |
(2,510) |
(623) |
|
|
|
|
|
|
|
|
|
Income (loss) before taxes |
1,686 |
(263) |
520 |
5,451 |
1,411 |
350 |
|
Income tax |
|
|
|
|
|
|
|
Current |
(136) |
(528) |
(359) |
(827) |
(1,564) |
(388) |
|
Deferred |
(2,768) |
679 |
(50) |
577 |
2,398 |
595 |
|
|
|
|
|
|
|
|
|
Net income (loss) for the period |
(1,218) |
(112) |
111 |
5,201 |
2,245 |
557 |
|
|
|
|
|
|
|
|
|
Net income (loss) attributable to noncontrolling interest |
(2) |
(7) |
101 |
126 |
455 |
113 |
|
Net income (loss) attributable to Companhia Siderúrgica Nacional |
(1,213) |
(105) |
10 |
5,075 |
1,789 |
444 |
|
Basic earnings per common share |
(0.89461) |
(0.07443) |
0.00757 |
3.69498 |
1.29632 |
0.32161 |
|
Diluted earnings per common share |
(0.89461) |
(0.07443) |
0.00757 |
3.69498 |
1.29632 |
0.32161 |
40550.00004
8
|
|
As of December 31, | |||||
|
Balance Sheet Data: |
2015 |
2016 |
2017 |
2018(2) |
2019(3) |
2019(1) |
|
|
(in million of R$) |
(in million of US$, except per share data) | ||||
|
Current assets |
16,431 |
12,445 |
11,881 |
12,014 |
12,726 |
3,157 |
|
Investments |
3,998 |
4,568 |
5,499 |
5,631 |
3,584 |
889 |
|
Property, plant and equipment |
17,826 |
18,136 |
17,965 |
18,047 |
19,701 |
4,888 |
|
Other assets |
9,084 |
9,005 |
9,865 |
11,636 |
14,858 |
3,686 |
|
Total assets |
47,339 |
44,154 |
45,210 |
47,328 |
50,869 |
12,620 |
|
Current liabilities |
5,082 |
5,497 |
10,670 |
11,439 |
11,620 |
2,883 |
|
Non -current liabilities |
35,166 |
31,272 |
26,252 |
25,876 |
27,887 |
6,919 |
|
Stockholders’ equity |
7,091 |
7,385 |
8,288 |
10,013 |
11,362 |
2,819 |
|
Total liabilities and stockholders’ equity |
47,339 |
44,154 |
45,210 |
47,328 |
50,869 |
12,620 |
|
Paid-in capital (in millions of reais ) |
4,540 |
4,540 |
4,540 |
4,540 |
4,540 |
1,126 |
|
Common shares (quantities) |
1,388 |
1,388 |
1,388 |
1,388 |
1,388 |
1,388 |
|
Dividends declared and interest on stockholders’ equity |
275 |
- |
- |
898 |
1,023 |
254 |
|
Dividends declared and interest on stockholders’ equity per common share (in reais )(4) |
0.20 |
- |
- |
0.65 |
0.74 |
0.18 |
_______________________
(1) Due to the adoption of IFRS 9 and IFRS 15 as of January 1, 2018, which we did not apply retroactively, financial information as of and for the year ended December 31, 2018 may not be comparable with financial information as of and for prior periods. For further information on our adoption of IFRS 9 and IFRS 15, see note 2.w and 2.q, respectively, to our audited consolidated financial statements included elsewhere in this annual report.
(2) Due to the adoption of IFRS 16 as of January 1, 2019, which we did not apply retroactively, financial information as of and for the year ended December 31, 2019 may not be comparable with financial information as of and for prior periods. For a description of the impact of IFRS 16 on our results of operations, see note 13.a to our audited consolidated financial statements included elsewhere in this annual report.
(3) Translated solely for the convenience of the reader at the rate of R$4.0307 to US$1.00, which was the U.S. dollar selling rate as of December 31, 2019, as reported by the Central Bank. As of March 31, 2020, the U.S. dollar selling rate was R$5.199 to US$1.00, as reported by the Central Bank.
(4) Due to the adoption of IFRS 9 and IFRS 15 as of January 1, 2018, which we did not apply retroactively, financial information as of and for the year ended December 31, 2018 is not comparable with financial information as of and for prior periods.
|
|
Year ended December 31, | |||
|
|
2017 |
2018 |
2019 |
2019(1) |
|
Reconciliation of Net Income (Loss) to EBITDA and Adjusted EBITDA |
(in millions of US$) |
(in millions of R$) | ||
|
Net income (loss) |
111.2 |
5,200.6 |
2,244.5 |
556.9 |
|
Depreciation/amortization/depletion |
1,408.8 |
1,175.1 |
1,421.7 |
352.7 |
|
Income tax and social contribution |
409.1 |
250.3 |
(833.8) |
(206.9) |
|
Financial income (expenses) |
2,463.6 |
1,495.6 |
2,131.2 |
528.7 |
|
EBITDA(2) |
4,392.7 |
8,121.7 |
4,963.6 |
1,231.5 |
|
Other operating income (expenses) |
(177.3) |
(2,705.3) |
1,903.1 |
472.1 |
|
Equity in results of affiliated companies |
(109.1) |
(135.7) |
(125.7) |
(31.2) |
|
Proportionate EBITDA of joint ventures |
538.2 |
568.0 |
510.1 |
126.5 |
|
Adjusted EBITDA(3) |
4,644.4 |
5,848.7 |
7,251.0 |
1,799.0 |
_______________________
(1) Translated solely for the convenience of the reader using the U.S. dollar selling rate as reported by the Central Bank of R$4.0307 to US$1.00 as of December 31, 2019. As of March 31, 2020, the U.S. dollar selling rate was R$5.199 to US$1.00, as reported by the Central Bank.
(2) We calculate EBITDA as net income (loss) for the period plus net financial income (expenses), income tax and social contribution, depreciation and amortization and results from discontinued operations.
(3) We calculate adjusted EBITDA as net income (loss) for the period plus net financial income (expenses), income tax and social contribution, depreciation and amortization and results of discontinued operations, plus other operating income (expenses), equity in results of affiliated companies and the proportionate EBITDA of joint ventures. EBITDA and adjusted EBITDA are not measures of financial performance recognized under Brazilian GAAP or IFRS and they should not be considered alternatives to net income (loss) as measures of operating performance, or as alternatives to operating cash flows, or as measures of liquidity. EBITDA and adjusted EBITDA are not calculated using a standard methodology and may not be comparable to the definition of EBITDA or adjusted EBITDA, or similarly titled measures, used by other companies.
3B. Capitalization and Indebtedness
Not applicable.
40550.00004
9
3C. Reasons for the Offer and Use of Proceeds
Not applicable.
3D. Risk Factors
An investment in the ADSs or our common shares involves a high degree of risk. You should carefully consider the risks described below before making an investment decision. Our business, financial condition and results of operations could be materially and adversely affected by any of these risks. The trading price of the ADSs could decline due to any of these risks or other factors, and you may lose all or part of your investment.
For purposes of this section, when we state that a risk, uncertainty or problem may, could or will have an “adverse effect” on us or “adversely affect” us, we mean that the risk, uncertainty or problem could have an adverse effect on our business, financial condition, results of operations, cash flow, prospects and/or the trading price of the ADSs, except as otherwise indicated. The risks described below are those that we currently believe may materially and adversely affect us.
The Brazilian government has exercised, and continues to exercise, significant influence over the Brazilian economy and such involvement, along with general political and economic conditions, could adversely affect us.
The Brazilian government has frequently intervened in the Brazilian economy and occasionally made changes in policy and regulations. The Brazilian government’s actions to control inflation and affect policies and regulations have often involved, among other measures, increases in interest rates, changes in tax and social security policies, price controls, currency exchange and remittance controls, devaluations, capital controls and limits on imports. We may be adversely affected by changes in policy or regulations at the federal, state or municipal level involving or affecting the following factors, among others:
· interest rates;
· exchange controls;
· currency fluctuations;
· inflation;
· price volatility of raw materials and our final products;
· lack of infrastructure in Brazil;
· energy and water supply shortages and rationing programs;
· liquidity of the domestic capital and lending markets;
· regulatory policy for the mining, steel, cement, logistics and energy industries;
· environmental policies and regulations;
· tax policies and regulations, including frequent changes that may result in uncertainties regarding future taxation; and
· other political, social and economic developments in or affecting Brazil.
Uncertainty over whether the Brazilian government will implement changes in policy or regulation affecting these or other factors may contribute to economic uncertainty in Brazil and to heightened volatility in the Brazilian securities markets and securities issued abroad by Brazilian companies.
According to the Brazilian Institute of Geography and Statistics (Instituto Brasileiro de Geografia e Estatística), or the IBGE, Brazil’s gross domestic product, or GDP, grew by 1.0% in 2017, 1.1% in 2018 and 1.1% in 2019, following an economic recession in 2015 and 2016.
These uncertainties, together with a slow economic recovery that Brazil is undergoing and other future developments in the Brazilian economy, may adversely affect us.
40550.00004
10
Political instability may adversely affect us.
The Brazilian economy has been affected by political events in Brazil, which have also affected the confidence of investors and the public in general.
Brazilian markets have been experiencing heightened volatility due to uncertainties derived from the ongoing Lava Jato investigation and other investigations, which are conducted by the Brazilian Federal Police and the Federal Prosecutor’s Office, and the impact of these investigations on the Brazilian economy and political environment. Numerous members of the Brazilian government and of the legislative branch, as well as senior officers of large state-owned and private companies have been convicted of political corruption related to bribes by means of kickbacks on contracts granted by the government to several infrastructure, oil and gas and construction companies, among others. Profits from these kickbacks allegedly financed the political campaigns of political parties that were unaccounted for or not publicly disclosed, and served to further the personal enrichment of the recipients of the bribery scheme. As a result, a number of politicians and officers of large state-owned and private companies in Brazil have resigned and/or have been arrested and others remain under investigation for unethical and illegal behavior.
The ultimate outcome of these investigations is uncertain, but they have already had an adverse impact on the image and reputation of the implicated companies, and on the general market perception of the Brazilian economy. The development of these unethical conduct cases has and may continue to adversely affect us. We cannot predict whether the investigations in course will result in heightened economic and political volatility in Brazil or whether new investigations against politicians or officers of private companies will occur in the future.
In addition, in October 2018, following a divisive presidential race, congressman Jair Bolsonaro became Brazil’s president on January 1, 2019. It is unclear if and for how long the political divisions in Brazil that arose prior to the elections will continue under Mr. Bolsonaro’s presidency and the effects that any such divisions will have on Mr. Bolsonaro’s ability to govern Brazil and implement reforms. Any continuation of such divisions could result in congressional deadlock, political unrest and massive demonstrations or strikes that could materially adversely affect our operations. Uncertainties in relation to the new government’s implementation of monetary, tax and pension fund policy changes may contribute to economic instability. These uncertainties and new measures may increase market volatility of securities issued by Brazilian companies.
The president of Brazil has the power to determine policies and issue governmental acts relating to the Brazilian economy that affect the operations and financial performance of companies in Brazil, including ours. We cannot predict which policies the newly elected president will adopt or if these policies or changes in current policies may have an adverse effect on the Brazilian economy or us.
Exchange rate instability may adversely affect us and the market price of our common shares and ADSs.
The Brazilian currency has, during the last decade, experienced frequent and substantial variations compared to the U.S. dollar and other foreign currencies. As of December 31, 2017, the U.S. dollar selling rate was R$3.308 per US$1.00. In 2018 and 2019, the real depreciated against the U.S. dollar and the U.S. dollar selling rate was R$3.8748 per US$1.00 as of December 31, 2018 and R$4.0307 per US$1.00 as of December 31, 2019, as reported by the Central Bank. As of March 31, 2020, the U.S. dollar selling rate was R$5.199 per US$1.00, as reported by the Central Bank, representing a 29% depreciation of the real against the U.S. dollar in 2020 to date.
Depreciation of the real against the U.S. dollar creates inflationary pressures in Brazil and causes increases in interest rates, which negatively affect the growth of the Brazilian economy as a whole, curtail access to foreign financial markets and may prompt government intervention, including recessionary governmental policies. Depreciation of the real against the U.S. dollar may also, in the context of an economic slowdown, lead to decreased consumer spending, deflationary pressures and reduced growth of the Brazilian economy.
On the other hand, appreciation of the real relative to the U.S. dollar and other foreign currencies could lead to a deterioration of the Brazilian foreign exchange current accounts, as well as dampen export-driven growth. Depending on the circumstances, either depreciation or appreciation of the real could materially affect our growth and that of the Brazilian economy, as well as impact the U.S. dollar value of distributions and dividends on and the U.S. dollar equivalent of the market price of our common shares and ADSs.
40550.00004
11
In the event the real depreciates in relation to the U.S. dollar, the cost in reais of our foreign currency-denominated borrowings and imports of raw materials, particularly coal and coke, will increase. On the other hand, if the real appreciates in relation to the U.S. dollar, it will cause real-denominated production costs to increase as a percentage of total production costs and cause our exports to be less competitive. We have a total U.S. dollar-denominated or -linked indebtedness of R$16,558 million, which represents 59% of our total indebtedness, as of December 31, 2019.
Government efforts to combat inflation may hinder the growth of the Brazilian economy and could harm us.
Historically, Brazil has experienced high inflation rates. Inflation and certain actions taken by the Central Bank to curb it have had significant negative effects on the Brazilian economy. Inflation as measured by the national broad consumer price index (Índice Nacional de Preços ao Consumidor Amplo), or IPCA, was 3.0%, 3.8% and 4.3% in 2017, 2018 and 2019, respectively, and (0.5)%, 7.5% and 7.3%, respectively, as measured by the general market price index (Índice Geral de Preços do Mercado), or IGP-M.
The base interest rate for the Brazilian banking system is the Central Bank’s Special System for Settlement and Custody (Sistema Especial de Liquidação e Custódia) rate, or SELIC rate. As of December 31, 2017, 2018 and 2019, the SELIC rate was 7.00%, 6.50% and 4.5%, respectively.
Inflation and the Brazilian government’s measures to fight it, principally the Central Bank’s monetary policy, have had and may have significant effects on the Brazilian economy and us. Tight monetary policies with high interest rates have restricted and may restrict Brazil’s growth and the availability of credit. Conversely, more lenient government and Central Bank policies and interest rate decreases have triggered and may trigger increases in inflation, and, consequently, growth volatility and the need for sudden and significant interest rate increases, which could negatively affect us and increase the payments on our indebtedness.
Developments and the perception of risk in other countries, especially other emerging market countries, may adversely affect the trading price of Brazilian securities, including our common shares and ADSs.
The market value of securities of Brazilian issuers is affected by economic and market conditions in other countries, especially other emerging market countries. Although economic conditions in these countries may differ significantly from economic conditions in Brazil, investors’ reactions to developments in these other countries may have an adverse effect on the market value of securities of Brazilian issuers. Crises in the United States, the European Union or emerging market countries may diminish investor interest in securities of Brazilian issuers, including ours. This could adversely affect the trading price of our common shares and/or ADSs, and could also make it more difficult for us to gain access to the capital markets and finance our operations on acceptable terms, or at all.
Further, crises in world financial markets, such as in 2008, as well as global economic challenges as of the date of this annual report deriving from the outbreak of the new coronavirus, or COVID-19, and government measures to contain it, could affect investors’ views of securities issued by companies that operate in emerging markets. These developments could adversely affect the trading price of our common shares and the ADSs, and could also make it more difficult for us to access the capital markets and finance our operations on acceptable terms, or at all.
Risks Relating to Us and the Industries in Which We Operate
We are exposed to substantial changes in the demand for steel and iron ore, which significantly affect the prices of our products and may adversely affect us.
The steel and mining industries are highly cyclical, both in Brazil and abroad. The demand for steel and mining products and, thus, the financial condition and results of operations of companies in these industries, including us, are generally affected by macroeconomic fluctuations in the world economy and the economies of steel-producing countries, including trends in the automotive, construction, home appliances and packaging industries, as well as other industries which rely on steel distributors. A worldwide recession, an extended period of below-trend growth in developed countries or a slowdown in the emerging markets that are large consumers of our products (such as the domestic Brazilian market for our steel products and the Chinese market for iron ore) could sharply reduce demand for our products. In addition, flat steel competes with other materials that may be used as substitutes, such as aluminum (particularly in the automotive and packaging industry), cement, composites, glass, plastic and wood. Government regulatory initiatives mandating the use of such materials in lieu of steel, whether for environmental or other reasons, as well as the development of other new substitutes for steel products, could also significantly reduce market prices and demand for steel products and thereby reduce our cash flow and profitability. In addition, public health epidemics such as the outbreak of COVID-19 could materially and adversely affect global macroeconomic conditions and, consequently, the demand for steel and iron ore. Any material decrease in demand or increase in supply for steel and iron ore in the domestic or export markets served by us could have a material adverse effect on us.
40550.00004
12
Prices charged for iron ore are subject to volatility. International iron ore prices may decrease significantly and have a material and adverse impact on us or require us to suspend certain of our projects and operations.
Our iron ore prices are based on a variety of pricing terms, which generally use market price indices as a basis for determining customer prices. Our prices for and revenues from iron ore are consequently volatile, which may adversely affect us. In 2019, average iron ore prices increased 34.5% to US$93.4/dmt, from US$69.5/dmt in 2018. In 2018, average iron ore prices decreased 2.6% to US$69.5/dmt, from US$71.3/dmt in 2017, according to the average Platts IODEX (62% Fe CFR China). On March 30, 2020, the index was US$82.55/dmt. A decrease in market prices for iron ore may require us to change the way we operate or, depending on the magnitude of price decreases, even to suspend certain of our projects and operations and impair certain assets, which could adversely affect us.
Adverse economic conditions in China and an increase in global iron ore production capacity could have a negative impact on us.
China has been the main driver of global demand for minerals and metals over the past years, effectively driving global prices for iron ore and steel. In 2019, China accounted for 71% of the global seaborne iron ore trade and 74% of our iron ore export sales were to the Asian market, mainly China. China is also the largest steel producer in the world, accounting for approximately 53% of the global steel production in 2019.
A contraction of China’s economic growth could result in lower global demand for iron ore and steel and increase the global steel industry’s over-capacity, which would materially and adversely affect companies in the industry, including us. Poor performance in the Chinese real estate sector and low investments in infrastructure, two of the largest markets for carbon steel in China, could also negatively affect us. China’s GDP increased 6.1% in 2019, as compared to 6.6% in 2018 and 6.8% in 2017.
In addition, the ramp-up of projects started in past years by major iron ore suppliers could affect seaborne iron ore prices and adversely affect us. Moreover, the recent upsurge in iron ore prices could also stimulate high cost producers to resume operations, expanding our supply base, which may adversely affect us.
We may not be able to adjust our mining production volume in a timely or cost-efficient manner in response to changes in demand.
Revenues from our mining business represented 23%, 25% and 39% of our total net revenues in 2017, 2018 and 2019, respectively. Operating at significant idle capacity during periods of weak demand may expose us to higher unit production costs since a significant portion of our cost structure is fixed in the short-term due to the high capital intensity of mining operations. In addition, efforts to reduce costs during periods of weak demand could be limited by labor regulations or labor or government agreements.
Conversely, our ability to rapidly increase production capacity is limited, which could render us unable to fully satisfy demand for our iron ore. When demand exceeds our production capacity, we may meet excess customer demand by purchasing iron ore from unrelated parties and reselling it, which would increase our costs and narrow our operating margins. If we are unable to satisfy excess customer demand in this way, we may lose customers. In addition, operating close to full capacity may expose us to higher costs, including demurrage fees due to capacity restraints in our logistics systems.
A decrease in the availability or an increase in the price of raw materials for steel production, particularly coal and coke, may adversely affect us.
In 2019, raw material costs accounted for 65% of our total steel production costs. Our main raw materials include iron ore, coal, coke, limestone, dolomite, manganese, zinc, tin and aluminum. We depend on third parties for some of our raw material requirements, including importing all of the coal required to produce coke. In addition, we require significant amounts of energy, in the form of natural gas and electricity, to power our plants and equipment.
40550.00004
13
Any prolonged interruption in the supply of raw materials, natural gas, or electricity, or substantial increases in their prices, could materially and adversely affect us. Interruptions and price increases could result from changes in laws or trade regulations, the availability and cost of transportation, suppliers’ allocations to other purchasers, interruptions in production by suppliers and/or accidents or similar events on suppliers’ premises or along the supply chain. In addition, public health epidemics such as the outbreak of COVID-19 could adversely affect global macroeconomic conditions and, consequently, the availability and price of raw materials for steel production.
Our inability to pass these cost increases onto our customers or to meet our customer demand because of unavailability of key raw materials could also have a material and adverse effect on us.
Our steel products face significant competition, including price competition, from other domestic or foreign producers, which may adversely affect our profitability and market share.
The global steel industry is highly competitive with respect to price, product quality, customer service and technological advances permitting reduced production costs. Several factors influence Brazil’s export of steel products, including protectionist policies of other countries, especially the United States, disputes regarding these policies before the World Trade Organization, the Brazilian government’s exchange rate policy and the growth rate of the world economy. Further, continuous advances in materials sciences and technology have given rise to improvements in products such as plastics, aluminum, ceramics and glass, permitting them to serve as substitutes for steel. Due to high start-up costs, the economics of operating a steelworks facility on a continuous basis may encourage mill operators to maintain high levels of output, even in times of low demand, which results in oversupply and increases the pressure on industry profit margins. In addition, downward pressure on steel prices by our competitors may affect our profitability.
The steel industry has historically suffered from structural over-capacity which has worsened due to a substantial increase in production capacity in the developing world, particularly China and India, as well as other emerging markets. China is the largest global steel producer and, in addition, Chinese and certain steel exporting countries have favorable conditions (excess steel capacity, undervalued currency or higher market prices for steel in non-domestic markets), which can have a significant impact on steel prices in other markets. If we are not able to remain competitive in relation to competitors in China or other steel-producing countries, we may be adversely affected.
Steel companies in Brazil face strong competition from imported products, mainly as a result of the global excess in steel production, reduction in demand for steel products in mature markets, exchange rate appreciation and tax incentives in some of the main exporting countries. Despite Brazilian import duties to protect domestic producers, a substantial volume of steel products is imported. If the Brazilian government does not implement measures against subsidized steel imports and there is an increase in imports, we may be materially and adversely affected. Apart from direct steel imports, the Brazilian industry also faces competition from imported finished goods, which adversely affects the whole steel supply and production chain.
Protectionist and other measures adopted by foreign governments could adversely affect our export sales.
In response to increased production and steel exports from many countries, anti-dumping and countervailing duty and safeguard measures were imposed in the late 1990s and early 2000s by foreign governments representing the main markets for our exports.
This scenario returned in 2015, when U.S. authorities initiated anti-dumping and countervailing duty investigations on hot-rolled and cold-rolled steel sheets and coils imported from Brazil and other countries. In 2016, the European Commission initiated an anti-dumping investigation of hot-rolled sheets and coils imported from Brazil and other countries.
In April 2017, the President of the United States, Donald Trump, requested an investigation under Section 232 of the Trade Expansion Act to determine if steel imports are harming national security. As a result of this investigation, in March 2018, U.S. government established the entry in force of Section 232, which imposes an ad valorem tariff of 25% on imported steel. In the same month, prompted by the United States’ adoption of Section 232 measures, the European Union initiated a safeguard investigation into imports of 26 categories of steel products. In February 2019, a definitive E.U. regulation imposed safeguard measures on imports of certain steel products and imposed quotas for the next three years. In the United States, Section 232 subjects us to a quota for exports of slabs, hot and cold-rolled steel sheets, pre-painted corrosion resistant, Al-Zn and tin mill products. In Europe, we are subject to a quota for exports of hot and cold-rolled steel sheets and tin mill products. Because we were already subject to an anti-dumping duty of $53.4 EUR/ton of hot-rolled sheets in Europe, these developments did not affect our hot-rolled sheets exports to Europe.
40550.00004
14
The imposition of these and other protectionist measures by foreign countries may materially and adversely affect our export sales.
Our activities depend on authorizations, concessions, licenses and permits and changes in applicable laws, regulations or government measures could adversely affect us.
Our activities and the activities of our subsidiaries and joint ventures are subject to governmental authorizations, concessions, licenses and permits, which include environmental licenses, as well as water grants, for our infrastructure projects and concessions, including for the port terminals we operate and the railways in which we have an equity interest. Although we believe that such authorizations, concessions, licenses and permits will be granted and/or renewed as and when requested, we cannot guarantee that we will be able to maintain, renew or obtain any required authorization, concession, license or permit, or that no additional requirement will be imposed on us in connection with our requests.
Authorizations, concessions, licenses or permits required for the development of our activities may require that we meet certain performance thresholds or completion milestones. In case we are unable to meet these thresholds or milestones, we may lose or not be able to obtain or renew such authorizations, concessions, licenses or permits, or we may not be able to do so under the terms of new concession laws, claims for amicable contractual termination and subsequent re-bidding for concessions. We also cannot guarantee that we, our controlled entities and our joint ventures that hold concessions will timely comply with our or their obligations under any relevant concession agreement or in conduct adjustment agreement (Termos de Ajustamento de Conduta), or TACs, entered into with governmental agencies. In addition, we are exposed to supervision, penalties and fiscalization from governmental entities, including the Brazilian court of audit (Tribunal de Contas da União), or TCU, and regulatory agencies. A material breach of those obligations may result in the loss or early termination of concessions, authorizations, permits and/or licenses, the restriction of access to public financing for the concession or the amortization of the public financing before a project begins to operate, the acceleration or an event of default under our indebtedness. Additionally, we would be subject to penalties, including fines or the closure of facilities. In case of a takeover or concession agreement termination due to government default, if we are entitled to any indemnification from granting authorities for our investments, this indemnification may be insufficient to cover our costs, expenses or losses and may be paid long after the events affecting our concessions, permits or licenses occur, if at all.
In addition, changes in applicable laws or regulations could require modifications to our technologies and operations and unexpected capital expenditures. Capital expenditures that we have already made may not generate the returns we expected, if any.
After accidents involving the breaking of upstream mining dams operated by other mining companies in the cities of Mariana and Brumadinho in the state of Minas Gerais, the Brazilian National Mining Agency (Agência Nacional de Mineração), or the ANM, and Brazilian environmental regulatory authorities are applying more stringent environmental licensing requirements for mining project operations, specifically for dams.
The amount and timing of these and other environmental and related expenditures may vary substantially from those currently anticipated and we may encounter delays in obtaining environmental or other operating licenses, or not be able to obtain and/or renew them, which could subject us to civil, administrative or criminal liability and closure orders. Any of the above events, among others, may adversely affect us and our ability to obtain expected returns from our projects, and may render certain projects economically or otherwise unfeasible.
Further new or more stringent environmental licensing requirements for our project operations, specifically for our dams, could be imposed on us. In addition, environmental agencies have intensified the frequency of inspections of tailings dams, including ours. For additional information on mining regulations in Brazil, see “Item 4.B.—Business Overview—Brazil—Mining Regulation.”
40550.00004
15
We have a high level of indebtedness that could make it more difficult or expensive to refinance our maturing debt and/or incur new debt.
As of December 31, 2019, our total debt outstanding was R$27,967 million, comprising R$5,126 million of short-term debt and R$22,841 million of long-term debt. We had R$1,089 million in cash and cash equivalents as of December 31, 2019. Our planned investments across our business segments will require a significant amount of cash over the course of 2020 and following years. See “Item 4D. Property, Plant and Equipment—Acquisitions and Dispositions.”
Our level of indebtedness could affect our credit rating and our ability to obtain any necessary financing in the future and may increase our cost of borrowing. In addition, our level of indebtedness could make it more difficult to refinance our existing indebtedness and could make us more vulnerable in the event of a downturn in our business. In these and other circumstances, servicing our indebtedness may use a substantial portion of our cash flow from operations, which could adversely affect us and make it more difficult for us to make payments of dividends and other distributions to our shareholders, including the holders of ADSs, as well as to fund our operations, working capital and capital expenditures necessary for the maintenance and expansion of our business activities.
Our ability to refinance our indebtedness maturing in 2020 and 2021 is subject to market conditions and creditor approvals. In the event conditions are not favorable or approvals are not obtained, we will be required to make significant payments in the next 24 months under our financings, which would adversely affect our financial and cash position and may result in downgrades in our credit ratings.
We cannot assure you that our credit ratings will not be lowered, suspended or withdrawn by the rating agencies.
Our credit ratings are limited in scope, and do not address all material risks relating to an investment in our common shares or ADSs, but rather reflect only the views of the rating agencies at the time the ratings are issued. These ratings may affect the cost and other terms upon which we are able to obtain funding and are subject to change due to factors specific to us, trends in the industries we operate or in the credit and capital markets generally. On December 31, 2019, our Fitch, Moody’s and S&P credit ratings were B, B2 and B, respectively. Credit rating agencies regularly evaluate us and their ratings are based on a number of factors, including our financial strength. We cannot assure that credit rating agencies will not downgrade our credit ratings or that credit ratings will remain in effect for any given period of time or not be withdrawn entirely by the rating agencies, if in their judgment circumstances so warrant.
Any lowering, suspension or withdrawal of our credit ratings may have an adverse effect on us and our ability to refinance our existing indebtedness.
Accidents or malfunctioning equipment on our premises, railways or ports may decrease or interrupt production, internal logistics or distribution of our products and adversely affect us.
The steel and iron ore production processes depend on certain critical equipment, such as blast furnaces, steel converters, continuous casting machines, rolling mills, drillers, reclaimers, conveyor belts, crushing and screening equipment and ship loaders, as well as on internal logistics and distribution channels, such as railways and seaports. This equipment and infrastructure may be affected in the case of malfunction or damage. Any significant interruptions in our production process, internal logistics or distribution channels (including our ports and railways) could materially and adversely affect us.
In addition, our operations involve the use, handling, storage, discharge and disposal of hazardous substances into the environment. Our mining, steel and cement businesses are generally subject to significant risks and hazards, including fire, explosions, toxic gas leaks, spilling of polluting substances or other hazardous materials, rockfall incidents in mining operations and incidents involving mobile equipment or machinery and accidents involving our tailings dams. Such events could occur by accident or by breach of operating and maintenance standards, and could result in a significant environmental impact, damage to or destruction of our mineral properties and/or production facilities, personal injury or death, delays or suspensions in production, monetary losses and exposure to civil responsibilities, administrative penalties, criminal sanctions and closure orders for non-compliance with these regulations. Failure to comply with our health, safety and environmental standards and risk management programs and procedures may be insufficient to prevent incidents or accidents that could adversely affect us.
40550.00004
16
Failures in or interruptions to our telecommunications, information technology systems or automated machinery could adversely affect us.
Our operations are heavily reliant on telecommunications, information technology systems and automated machinery. Disruptions to these systems, caused by obsolescence, technical failures or intentional acts, may adversely affect us. In addition, any failure in our systems related to confidential information, caused by external cyber‑attacks or internal actions, including negligence or misconduct of our employees, could have a negative impact on our reputation and our interactions with competitors and other third parties, including governmental and regulatory bodies, suppliers and others.
Our information technology systems are protected by security layers, including security solutions and monitoring processes; however, they may be vulnerable to external factors such as natural disasters, viruses, cyber‑attacks and other security breaches. Any damage or interruption to our information technology systems may adversely affect our results of our business and expose us to fines and litigation.
In 2018, Law No. 13,709/2018, or the Brazilian General Data Protection Law, was enacted to take effect in August 2020 and to change the personal data protection system in Brazil. This law sets forth a new legal framework for the treatment of personal data, including the rights of personal data holders, the legal basis applicable to personal data protection, the requirements to obtain consent, the obligations and requirements related to security incidents, personal data leaks and transfers and the creation of the Brazilian Data Protection Authority, among others. If we fail to adapt our processes to comply with this law, we may be subject to penalties, including mandatory disclosure of our non-compliance, temporary blocking and/or deletion of personal data and fines of up to 2% of our revenue in the last fiscal year, excluding taxes, up to an aggregate amount of R$50.0 million per infraction.
Our insurance policies may not be sufficient to cover all our losses.
We maintain several types of insurance policies as part of our risk management for each of our businesses and seek to follow industry practice regarding best coverage, which encompasses domestic and international (import and export) cargo transportation (road, rail, sea or air), life insurance, personal accidents, health, automobile, directors and officers, general liability, CAR (construction and erection risks), trade credit insurance, surety, named perils, ports and terminal liabilities.
We also have an insurance policy covering the operational risks, material damages and loss of profits of the following operations and subsidiaries: Presidente Vargas Steelworks, CSN Mineração S.A., or CSN Mineração, and the container terminal Sepetiba Tecon S.A., or TECON. This policy was renewed with domestic and foreign insurers and reinsurers and is valid until June 30, 2020, with a limited indemnity of US$600 million (for an insured value of US$10.2 billion) and a deductible of US$385 million for material damages and 45 days to loss of profits.
The coverage obtained in our insurance policies may not be sufficient to cover all risks or the extent of the risks we are exposed to, which could expose us to significant costs. Additionally, we may not be able to successfully contract or renew our insurance policies or to do so on terms satisfactory to us. The occurrence of one or more of these events may adversely affect us.
Our projects are subject to risks that, if materialized, may result in increased costs and/or delays or that could prevent their timely or successful implementation.
We are investing to further increase our steel, mining and cement production capacity, as well as our logistics capabilities. The success of these projects is subject to a number of risks that, if materialized, may adversely affect our growth prospects and profitability, including, among others:
· delays, availability issues or higher than expected costs in obtaining the necessary equipment, services and materials to build and operate a project;
· lack of infrastructure, including waste disposal areas and reliable power and water supply;
· environmental remediation costs;
· delays or higher than expected costs in obtaining or renewing required authorizations, concessions, licenses or permits and/or regulatory approvals to build or continue a project; and
40550.00004
17
· changes in market conditions, laws or regulations that render a project less profitable than expected or economically or otherwise unfeasible.
Any one or a combination of the factors described above may materially and adversely affect us.
We are subject to environmental, health and safety incidents. Additionally, current, new or more stringent environmental, health and safety regulations applicable to us may result in liability exposure and increased capital expenditures.
Our steel production, mining, cement, energy and logistics facilities are subject to a broad range of laws, regulations and permit requirements in the countries where we operate relating to the protection of the environment, health and safety.
Brazilian pollution standards are subject to change, including new effluent and air emission standards, water management and solid waste-handling regulations, wildlife maintenance regulations, restrictions on business expansions, native forest preservation requirements and the obligation to support the creation of an integral protection conservation unit, as privately owned conservation areas (Reserva Particular do Patrimônio Natural), or national parks, or areas of relevant ecological interest (ARIE), including the Cicuta Forest, as environmental compensation for industrial and mining expansion projects. The Brazilian government has adopted a decree under the national policy for climate change (Política Nacional de Mudanças Climáticas) that contemplates a reduction in carbon emissions for the industry (including steel making and cement sectors) and an action plan is being developed by a technical committee composed of representatives from the government, industry associations and academia. The target reduction for the mining sector is yet to be established.
In addition, the state of Rio de Janeiro, through the State Environment Institute (Instituto Estadual do Ambiente), or INEA, issued a law that requires steel making and cement facilities to present action plans to reduce greenhouse gas emissions when renewing or applying for operational licenses. At the federal level, the environmental national council, (Conselho Nacional do Meio Ambiente), or CONAMA, issued Resolution No. 436/2011 to address air emissions that obliged steel companies to comply with certain emission standards as of December 2018, including adjustments in the filters of plant chimneys. In September 2018, we entered into a TAC with the state of Rio de Janeiro relating to this resolution. Any failure to comply with these or other laws, resolutions and standards may expose us to civil, criminal and administrative liability. The Brazilian government has also established a national policy for solid waste (Política Nacional de Resíduos Sólidos), which provides for strict guidelines for solid waste management and industry targets for reverse logistics as part of the environmental licensing process. Finally, a new regulatory framework for mining operations was issued in June 2018, which may impose stricter regulations on our mining operations, including requests for environmental recovery of areas and investments for the granting of mining concessions.
Our operations involve the use, handling, storage, discharge and disposal of hazardous substances into the environment and the use of natural resources, and are subject to significant risks and hazards, including fire, explosion, toxic gas leaks, spilling of polluting substances or other hazardous materials, rockfalls, incidents involving dams, failure of operational structures and incidents involving mobile equipment, vehicles or machinery. This could occur by accident or by breach of operating and maintenance standards, and could result in significant environmental and social impacts, damage to or destruction of mineral properties or production facilities, personal injury, illness or death of employees, contractors or community members close to operations, environmental damage, delays in production, monetary losses and possible legal liability. Additionally, in remote localities, our employees may be exposed to tropical and contagious diseases that may affect their health and safety. Notwithstanding our standards, policies and controls, our operations remain subject to incidents or accidents that could adversely affect us and our stakeholders.
New or more stringent environmental, safety and health standards imposed on us could require increased capital expenditures, additional legal preservation areas within our properties or modifications to our operating practices or projects. For further information on environmental regulations and claims, see “Item 4.B.—Business Overview—Governmental Regulation and Other Legal Matters.”
In addition, in July 2018, the Federal Prosecutor’s Office and the State Public Prosecutor of Rio de Janeiro filed a public civil action against us, HARSCO and INEA, for immediate removal of slag piles in the city of Volta Redonda, in the state of Rio de Janeiro, that adjoin the Paraíba do Sul River. The amount and timing of these and other environmental and related expenditures may vary substantially from those currently anticipated. These additional costs may also have a negative impact on the profitability of the projects we intend to implement or may make such projects economically unfeasible. We could also be exposed to civil, administrative or criminal liability and closure orders for non-compliance with these regulations, as well as encounter delays in obtaining environmental or other operating licenses. Waste disposal, including our slag piles, and emission practices may result in the need for us to clean up or retrofit our facilities or our disposal locations at substantial costs and/or could result in substantial civil, criminal and administrative liability, including, among others, pursuant to public civil actions. Environmental legislation in foreign markets to which we export our products may also materially and adversely affect our export sales and us.
40550.00004
18
In addition, we may enter into TACs with Brazilian regulatory agencies that require us to minimize or eliminate the risk of environmental impacts in the areas where we operate. If we are unable to comply with a TAC or to remediate non-compliance in a timely manner, we may be exposed to penalties, such as fines, revocation of permits or closure of facilities.
Our governance and compliance procedures may fail to prevent regulatory penalties and reputational harm.
We operate in a global environment and our activities straddle multiple jurisdictions and complex regulatory frameworks subject to enforcement worldwide. Our governance and compliance procedures may not prevent breaches of law, accounting and/or governance standards applicable to us, and we may be unable to identify wrongdoing or improper activities by members of our management, employees or third parties. We may be subject to breaches of our Code of Ethics, business conduct protocols and to instances of fraudulent behavior, dishonesty and unlawful conduct by members of our management, employees, contractors or other agents, which could subject us to fines, loss of our operating licenses and reputational harm, as well as other penalties, which may materially and adversely affect us.
We may fail to maintain an effective system of internal controls, which could prevent us from timely and accurately reporting our financial results.
Our internal controls over financial reporting may not prevent or detect misstatements in a timely manner due to inherent limitations, including human error, circumvention or overriding of controls, or fraud. Even effective internal controls can provide only reasonable assurance with respect to the preparation and fair presentation of financial statements. If we fail to maintain the adequacy of our internal controls, including implementing new or improved required controls, we could fail to meet our financial reporting obligations, which could trigger a default under some of our agreements. In this regard, and in connection with management’s evaluation of the effectiveness of our internal control over financial reporting, we concluded that, as of December 31, 2019, our internal control over financial reporting is effective.
Some of our operations depend on joint ventures, jointly controlled entities, consortia and other forms of cooperation, and our business could be adversely affected if our partners fail to observe their commitments.
We currently operate parts of our business through joint ventures, strategic alliances and consortia with other companies. We have, among others: (i) established a strategic alliance with an Asian consortium at our controlled investee CSN Mineração to mine iron ore; (ii) a joint venture with other Brazilian steel and mining companies at MRS Logística S.A., or MRS, to explore railway transportation in the Southeastern region of Brazil; (iii) a joint venture with certain Brazilian governmental entities at Transnordestina Logística S.A., or TLSA, to explore railway transportation in the Northeastern region of Brazil; (iv) a joint venture with Engie Brasil Energia S.A. and Companhia de Cimento Itambé, or Itambé, at Itá Energética S.A., or ITASA, to produce electricity; and (v) a consortium with L.D.R.S.P.E Geração de Energia e Participações, Aliança Geração de Energia S.A. (union of Vale S.A., or Vale, and CEMIG Geração e Transmissão S.A.), or Aliança, and AngloGold Ashanti Córrego do Sítio Mineração S.A., or AngloGold, at Igarapava hydroelectric facility to produce electricity.
Our forecasts and plans for these strategic alliances, joint ventures and consortia assume that our partners will observe their obligations to make capital contributions, purchase products and, in some cases, provide managerial personnel or financing. In addition, many of the projects contemplated by our joint ventures or consortia rely on financing commitments, which contain certain preconditions for each disbursement. If any of our partners fails to observe their commitments or we fail to comply with all preconditions required under our financing commitments or other partnership arrangements, the affected joint venture, consortium or other project may not be able to operate in accordance with its business plans, or we may have to increase the level of our investment to implement these plans, which could adversely affect us.
40550.00004
19
Risks associated with drilling and production could render mining projects economically unfeasible.
Once mineral deposits are discovered, it can take a number of years from the initial phases of drilling until production is possible, during which time the economic feasibility of production may change. Substantial time and expenditures are required to:
· establish mineral reserves through drilling;
· determine appropriate mining and metallurgical processes for optimizing the recovery of metal contained in ore;
· obtain environmental and other licenses;
· construct mining, processing facilities and infrastructure required for greenfield properties; and
· obtain the ore or extract the minerals from the ore.
If a mining project proves not to be economically feasible by the time we are able to profit from it, we may incur substantial losses and be obliged to record write-offs. In addition, potential changes or complications involving metallurgical and other technological processes arising during the life of a project may result in delays and cost overruns that may render the project not economically feasible.
Our mineral reserve and mine life may prove inaccurate, market price fluctuations and cost changes may render certain ore reserves uneconomical to mine and we may face rising extraction costs or investment requirements over time as our reserves deplete.
Our reported ore reserves are estimated quantities of ore and minerals that we have determined can be economically mined and processed under present and anticipated conditions to extract their mineral content. There are numerous uncertainties inherent in estimating quantities of reserves and in projecting potential future rates of mineral production, including many factors beyond our control. Reserve engineering involves estimating deposits of minerals that cannot be measured in an exact manner, and the accuracy of any reserve estimate is a function of the quality of available data and engineering and geological interpretation and judgment. As a result, no assurance can be given that the indicated amount of ore will be recovered or that it will be recovered at the rates we anticipate. Estimates of different engineers may vary, and results of our mining production subsequent to the date of an estimate may lead to revision of estimates. Reserve estimates and estimates of mine life may require revision based on actual production experience and other factors. For example, fluctuations in the market prices of minerals and metals, reduced recovery rates or increased operating and capital costs due to inflation, exchange rates or other factors may render proven and probable reserves uneconomic to exploit and may ultimately result in a restatement of reserves.
In addition, reserves are gradually depleted in the ordinary course of our exploration activities. As mining progresses, distances to the primary crusher and to waste deposits becomes longer and pits become steeper. Also, for some types of reserves, mineralization grade decreases and hardness increases at increased depths. As a result, over time we may experience rising unit extraction costs with respect to each mine, or we may need to make additional investments, including adaptation or construction of processing plants and expansion or construction of tailings dams. Our exploration programs may also fail to result in the expansion or replacement of reserves depleted by current production. If we do not enhance existing reserves or develop new operations, we may not be able to sustain our current level of production beyond the remaining lives of our existing mines. See “Item 4B—Business Overview—Our Mining Segment—Mineral Reserves.”
Natural and other disasters, or extreme weather conditions, could disrupt our operations.
Because of our exposure to raw materials costs, extreme weather conditions, such as heavy rainfall or flooding, could reduce the available supply of our raw materials and increase our raw materials costs, which would have a material adverse impact on us. Additionally, we are subject to technical or physical risks including fire, power loss, water supply loss, reduction or rationing, leakages, accidents and failures in telecommunications and information technology systems, any of which could disrupt our operations.
We may not be able to consummate proposed acquisitions or integrate acquired businesses successfully.
From time to time, we may evaluate acquisition opportunities that would strategically fit our business objectives. If we are unable to complete acquisitions, or integrate acquisitions successfully and develop these businesses to realize revenue growth and cost savings, we could be adversely affected. Acquisitions also pose the risk that we may be exposed to successor liability involving an acquired company. Due diligence conducted in connection with an acquisition, and any contractual guarantees or indemnities that we receive, may not be sufficient to protect us from, or compensate us for, actual liabilities. A material liability associated with an acquisition, such as labor or environmental liabilities, could adversely affect us and reduce the expected and bargained-for benefits of the acquisition.
40550.00004
20
In addition, we may incur asset impairment charges related to acquisitions, which may reduce our profitability. Our acquisition activities may also present financial, managerial and operational risks, including diversion of management attention from existing core businesses, difficulties integrating or separating personnel, financial and other systems, failure to achieve the operational benefits that were anticipated at the time of the transaction, adverse effects on existing business relationships with suppliers and customers, inaccurate estimates of fair value made in the accounting for acquisitions and/or amortization of acquired intangible assets which would reduce future reported earnings, potential loss of customers or key employees of acquired businesses and indemnities and potential disputes with buyers or sellers. Finally, proposed acquisitions may also be subject to review from the competition authorities of the countries involved in the transaction, which may approve the transaction, do so subject to restrictions, including the divestment of assets, or reject it. Any of these developments or adverse regulatory decisions could negatively affect us.
We may not be able to maintain adequate liquidity and our cash flows from operations and available capital may not be sufficient to meet our obligations.
While our cash flows from operations and available capital have been sufficient to meet our current operating expenses, contractual obligations and debt service requirements to date, our liquidity, cash flows from operations and available capital may be negatively impacted by the pricing environment for our steel and iron ore products, the exchange rate environment and the effects of weak economic conditions in Brazil. These factors have materially and adversely affected our liquidity and we expect this to continue. Recent cost cutting measures implemented by us may not be sufficient to offset these effects or to improve our liquidity position.
We have announced certain measures to improve our liquidity and debt profile, including the potential sale of certain assets. In addition, we are negotiating the extension of certain of our credit facilities. If we are unable to successfully sell certain assets and/or extend our debt amortization profile, we may not be able to maintain adequate liquidity and our cash flows from operations and available capital may not be sufficient to meet our obligations.
We have experienced labor disputes in the past that have disrupted our operations, and such disputes may recur.
A substantial number of our employees and some of the employees of our subcontractors are represented by labor unions and are covered by collective bargaining or other labor agreements, which are subject to periodic renegotiation. Strikes and other labor disruptions at any of our facilities or labor disruptions involving third parties who may provide us with goods or services have in the past and may in the future materially and adversely affect the operations of our facilities and/or the timing of completion and the cost of our projects.
We are exposed to the risk of litigation.
We are currently and may in the future be a party to legal proceedings and judicial, administrative or arbitration claims. For some of these legal proceedings and claims, we have not established a provision on our balance sheet or have only established provisions for part of the amounts in question, based on our external or internal counsel’s judgment as to the likelihood of an outcome unfavorable to us.
Although we are contesting such proceedings and claims, the outcome of each specific proceeding and claim is uncertain and may result in obligations that could materially and adversely affect us.
Certain judicial or administrative proceedings may adversely affect our shareholders and holders of the ADSs, specifically their receipt of dividends. In August 2018, a federal court of tax enforcement blocked our distribution of an extraordinary dividend in the amount of R$890.0 million due to ongoing tax proceedings we are party to, which decision was reversed in December 2018 through an injunction filed by us. The case is pending final judgment.
40550.00004
21
The outbreak of communicable diseases such as the ongoing COVID-19 outbreak on a global scale may affect investment sentiment, cause operational disruptions and result in sporadic volatility in global markets.
The outbreak of communicable diseases such as the ongoing COVID-19 outbreak on a global scale may affect investment sentiment, cause operational disruptions and result in volatility in global markets, potentially affecting the global and local economy and outlook. The spread of this virus has caused certain business, market and travel disruption and has resulted in government measures shutting down certain operations and restricting travel.
In the event the spread of COVID-19 continues, its consequences are likely to materially and adversely affect the global economy and the financial markets, consequently affecting our clients, our suppliers and us. Quarantines and government measures may restrict certain economic activities in affected regions globally, including Brazil, resulting in reduced business volume, disrupted production and operations and temporary closures of our or other companies’ facilities.
There is uncertainty regarding the duration of disruptions deriving from the spread of COVID-19, the extent of government intervention or other measures and economic effects on the stock market, foreign exchange rates, unemployment rates, interest rates and otherwise. The extent to which the spread of COVID-19 will affect us depends on future developments that are highly uncertain and cannot be predicted as of the date of this annual report.
The effect of any discontinuation or replacement of the LIBOR may adversely affect us.
The U.K. Financial Conduct Authority announced in July 2017 that it intends to no longer compel banks to submit rates for the calculation of the London interbank offered rate, or LIBOR, after 2021. To mitigate any possible impact, various regulators have proposed alternative reference rates. As of December 31, 2019, we had R$2,564 million of LIBOR-indexed financings maturing after 2021. We cannot predict the effect of any discontinuation or replacement of the LIBOR at this time and, consequently, we cannot assure you that these changes will not have an adverse effect on us.
Risks Relating to our Common Shares and ADSs
Our controlling shareholder has the ability to direct our business and affairs and its interests could conflict with yours.
Our controlling shareholder has the power to, among other things, elect a majority of our directors and determine the outcome of any action requiring shareholder approval, including transactions with related parties, corporate reorganizations, acquisitions, dispositions, the destination and diversification of our investments and the timing and payment of any future dividends, subject to minimum dividend payment requirements imposed by Brazilian Corporate Law. Our controlling shareholder may have an interest in pursuing acquisitions, dispositions, financings or other transactions that could conflict with your interests as a holder of our common shares and ADSs. In addition, the interests of the members of our controlling family have not always been aligned and any conflicts that may arise may adversely affect us.
If you surrender ADSs and withdraw common shares, you risk forfeiting Brazilian tax advantages and losing the ability to timely remit foreign currency abroad.
As an ADS holder, you benefit from the electronic certificate of foreign capital registration obtained by the custodian for our common shares underlying the ADSs in Brazil, which allows the custodian to convert dividends and other distributions with respect to the common shares into non-Brazilian currency and remit the proceeds abroad. Pursuant to CMN Resolution No. 4,373, in order for an investor to surrender ADSs for the purpose of withdrawing the shares represented thereby and be entitled to trade the underlying shares directly on the B3, the investor is required to appoint a Brazilian financial institution duly authorized by the Central Bank and the CVM to act as its legal representative, who shall be responsible, among other things, for keeping and updating the investors’ certificates of registrations with the Central Bank. If you surrender ADSs and withdraw common shares you may be subject to a less favorable tax treatment on gains with respect to these investments. Moreover, if such representatives fail to obtain or update the relevant certificates of registration, investors may incur in additional expenses or be subject to operational delays which could affect their ability to receive dividends or distributions relating to the common shares or the return of their capital in a timely manner. The custodian’s certificate of registration or any foreign capital registration directly obtained by such holders may be affected by future legislative or regulatory changes, and we cannot assure such holders that additional restrictions applicable to them, the disposition of the underlying common shares or the repatriation of the proceeds from the process will not be imposed in the future. For a more complete description of Brazilian tax regulations, including any potential risks regarding the possibility that the sale or disposition of ADSs by a Non-Brazilian Holder may be subject to capital gains tax in Brazil, see “Item 10. Additional Information—E. Taxation—Brazilian Tax Considerations.”
40550.00004
22
Holders of ADSs may not be able to exercise their voting rights.
Holders of ADSs may only exercise their voting rights with respect to the underlying common shares in accordance with the provisions of the deposit agreement. Under the deposit agreement, ADS holders must vote by giving voting instructions to the depositary. Upon receipt of the voting instructions of the ADS holder, the depositary will vote the underlying common shares in accordance with these instructions. If we ask for voting instructions, the depositary will notify ADS holders of the upcoming vote and will arrange to deliver the proxy card. We cannot assure that ADS holders will receive the proxy card in time to ensure that they can instruct the depositary to vote. In addition, the depositary and its agents are not liable for failing to carry out voting instructions or for the manner in which they do so. Alternatively, ADS holders can exercise their right to vote by surrendering their ADSs for cancellation in exchange for our common shares. Pursuant to applicable Brazilian law, companies that issue ADSs must publish the first call for a shareholders’ meeting at least 30 days in advance of the meeting, and the second call must be published at least eight days in advance of the meeting. When a shareholders’ meeting is convened, holders of ADSs may not receive sufficient advance notice to surrender their ADSs in exchange for the underlying common shares in time to allow them to vote with respect to any specific matter. As a result, holders of ADSs may not be able to exercise their voting rights.
The relative volatility and illiquidity of the Brazilian securities markets may substantially limit your ability to sell the common shares underlying the ADSs at the price and time you desire.
Investing in securities that trade in emerging markets, such as Brazil, often involves greater risk than investing in securities of issuers in the United States, and such investments are generally considered to be more speculative in nature. The Brazilian securities market is substantially smaller, less liquid, more concentrated and can be more volatile than major securities markets in the United States. There is also significantly greater concentration in the Brazilian securities market than in major securities markets in the United States. The ten largest companies in terms of market capitalization represented 58.9% of the aggregate market capitalization of the B3 S.A. – Brasil, Bolsa, Balcão, or the B3, as of December 31, 2019.
Although you are entitled to withdraw the common shares underlying the ADSs from the depositary at any time, your ability to sell the common shares underlying the ADSs at the price and time you wish may be substantially limited.
Holders of ADSs may be unable to exercise preemptive rights with respect to our common shares.
We may not be able to offer our common shares to U.S. holders of ADSs pursuant to preemptive rights granted to holders of our common shares in connection with any future issuance of our common shares unless a registration statement under the Securities Act is effective with respect to such common shares and preemptive rights, or an exemption from the registration requirements of the Securities Act is available. We are not obligated to file a registration statement relating to preemptive rights with respect to our common shares or to undertake steps that may be needed to find available exemptions from registration, and we cannot assure you that we will file any such registration statement or take any such steps. If such a registration statement is not filed and an exemption from registration is not available, JP Morgan Chase Bank, N.A., as depositary, may attempt to sell the preemptive rights, and you will be entitled to receive the proceeds of such sale. However, these preemptive rights will expire if the depositary does not sell them, and U.S. holders of ADSs will not realize any value from the granting of such preemptive rights. For a more complete description of preemptive rights with respect to the underlying shares, see “Item 10B. Memorandum and Articles of Association—Description of Capital Stock––Preemptive Rights.”
A decrease in our market capitalization may increase volatility.
In recent years, our market capitalization has been volatile, resulting in increased volatility in the trading price of our common shares and ADSs. Any decreases in our market capitalization may further increase volatility. If the trading price of the ADSs drops below the levels required by the listing standards of the New York Stock Exchange, or NYSE, we may be required to do a reverse stock split or a ratio change of the number of common shares per ADS in order to regain compliance with NYSE’s listing standards.
40550.00004
23
The trading price of the ADSs increased in 2019 and, as of December 31, 2019, presented a variation of 55% as compared to their trading price as of December 31, 2018.
Item 4. Information on the Company
4A. History and Development of the Company
Companhia Siderúrgica Nacional is a Brazilian corporation (sociedade por ações) incorporated in 1941 pursuant to a decree of Brazilian president Getúlio Vargas. The Presidente Vargas Steelworks, located in the city of Volta Redonda, in the state of Rio de Janeiro, began its production of coke, pig iron and steel products in 1946, when we also incorporated the Casa de Pedra Mine, located in the city of Congonhas, state of Minas Gerais, and the Arcos Mine, located in the city of Arcos, state of Minas Gerais. The Casa de Pedra Mine assures us self-sufficiency in iron ore and the Arcos Mine provides limestone and dolomite.
We were privatized through a series of auctions held in 1993 and early 1994, through which the Brazilian government sold its 91% ownership interest.
Between 1993 and 2002, we implemented a capital improvement program aimed at increasing our annual production of crude steel, improving the quality of our products and enhancing our environmental protection and cleanup programs. As part of these investments, since February 1996, all our production involves continuous casting, which requires lower energy use and results in decreased metal loss as compared to ingot casting. From 1996 until 2002, we invested the equivalent of US$2.4 billion in our capital improvement program and on maintaining our operational capacity, culminating with the renovation of our Blast Furnace No. 3 at the President Vargas Steelworks, or Blast Furnace No.3, and Hot Strip Mill No. 2 in 2001.
In 2007, we started to sell iron ore in the seaborne market. Today, we, through our controlled company CSN Mineração, are an important exporter of iron ore, drawing from the high quality iron ore reserves in the Casa de Pedra and Engenho mines, located in the state of Minas Gerais. CSN Mineração holds the concession to operate the Terminal de Carvão, or TECAR, a solid bulks terminal located in Itaguaí Port in the state of Rio de Janeiro, through which CSN Mineração exports iron ore and imports coal and coke.
In 2009, we entered the cement market with our first grinding mill, next to the Presidente Vargas Steelworks in Volta Redonda, Rio de Janeiro, taking advantage of the synergies of the cement business with our steel business.
In order to diversify our product portfolio, we entered the long steel market in 2012, with the acquisition of Stahlwerk Thüringen Gmbh, or SWT, a long steel manufacturer located in Unterwellenborn, Germany.
In addition, we installed a new plant for production of long steel products at Volta Redonda, which began operations in December 2013. The plant consists of an electric arc steelmaking furnace, continuous casting for billets and a hot rolling mill for round section long products. This plant provides the domestic Brazilian market with rebar for civil construction and wire rod for industrial and civil construction.
In 2015, we inaugurated two new grinding mills, and in 2016, we concluded a new 6,500 tons per day kiln line, reaching an aggregate annual capacity of 4.7 million tons in our cement plants.
In June 2018, we sold Heartland Steel Processing, LLC (formerly Companhia Siderúrgica Nacional, LLC) to Steel Dynamics, Inc. for US$400.0 million. We continue our commercial import and distribution activities in the North American market through our U.S. subsidiary Companhia Siderúrgica Nacional, LLC.
In 2019, investments of approximately R$250 million in the maintenance of Blast Furnace No. 3 increased its steel production capacity by 500,000 tons per year.
General
We are one of the largest fully integrated steel producers in Brazil and Latin America in terms of crude steel production. We operate throughout the entire steel production chain, from the mining of iron ore to the production and sale of a diversified range of high value-added steel products. We divide our business into five segments: steel, mining, cement, logistics and energy.
40550.00004
24
Steel
Our steel segment comprises a portfolio of diverse products and provides us an international footprint by means of our international subsidiaries and our exports from Brazil. In our flat steel segment, we are an almost fully integrated steelmaker. Our main industrial facility, Presidente Vargas Steelworks produces a broad line of steel products, including slabs, hot and cold-rolled, galvanized and tin mill products for the distribution, packaging, automotive, home appliance and construction industries.
Our production process is based on the integrated steelworks concept. Our current annual crude steel capacity and rolled product capacity at Presidente Vargas Steelworks is 5.6 million and 5.1 million, respectively.
We currently obtain all of our iron ore (except for pellets), limestone and dolomite requirements and a portion of our tin requirements, from our own mines. Using imported coal, we produce approximately 55% of our coke requirements at current production levels in our own coke batteries at Volta Redonda. Imported coal is also pulverized and used directly in the pig iron production process. Zinc, manganese ore, aluminum and a portion of our tin requirements are purchased in local markets. Our steel production and distribution processes also require water, industrial gases, electricity, rail and road transportation and port facilities.
In addition to the production of flat steel, we entered into the long steel segment, with the acquisition of SWT in 2012 for €482.5 million. SWT is a long steel producer in Germany with annual production capacity of approximately 1.1 million tons of steel sections.
Since December 2013, we own and operate a plant in Volta Redonda for production of long steel products. The plant consists of an electric arc steelmaking furnace, continuous casting for billets and a hot rolling mill for round section long products – wire rod and rebar.
Mining Activities
We own a number of high quality iron ore mines, strategically located within Brazil’s “Iron Ore Quadrangle” (Quadrilátero Ferrífero) in the state of Minas Gerais, including the Casa de Pedra and Engenho mines, located in the city of Congonhas, pertaining to our controlled investee CSN Mineração, and the Fernandinho mines, located in the city of Itabirito and the Cayman and Pedras Pretas mining rights, located in the city of Rio Acima and Congonhas, respectively, pertaining to our wholly owned subsidiary Minérios Nacional S.A. (formerly Mineração Nacional S.A.), or Minérios Nacional.
Our mining assets also include (i) the solid bulks cargo terminal Itaguaí Port, or TECAR, in the state of Rio de Janeiro, which pertains to CSN Mineração; (ii) the Bocaina mines, located in the city of Arcos, in the state of Minas Gerais, which produce dolomite and limestone; and (iii) Estanho de Rondônia S.A., or ERSA, located in the city of Ariquemes, in the state of Rondônia, which mines and casts tin.
We sold 27.4 million tons, 29.6 million tons and 34.9 million tons of iron ore to third parties in 2017, 2018 and 2019, respectively.
Logistics
Our vertical integration strategy and the synergies among our business units are strongly dependent on the logistics needed to guarantee the transportation of inputs at low cost. A number of railways and port terminals comprise the logistics system that integrates our mining, steelmaking and cement units.
We operate a port terminal for containers, TECON at Itaguaí Port, in the state of Rio de Janeiro, and CSN Mineração operates TECAR.
We also have the following participation in three railways: (i) we share control in MRS, which operates in the Southeast region of the federal railway system, along the Rio de Janeiro - São Paulo - Belo Horizonte axis; (ii) we have an interest in joint venture TLSA, which has a concession to construct and operate the Northeastern Railway System II; and (iii) we control Ferrovia Transnordestina Logística S.A., or FTL, which operates the Northeastern Railway System I.
40550.00004
25
Cement
We entered the cement market in May 2009 in order to take advantage of the synergy potential with our steelmaking business. Our cement operations use as inputs slag generated by our blast furnaces at Volta Redonda and limestone from our limestone reserves in our Bocaina mines, which is used to produce clinker. Slag and clinker are the main inputs in cement production.
In 2015, we inaugurated two grinding mills, and in 2016, we concluded a new kiln line with a capacity of 6,500 tons per day, reaching an aggregate capacity of 4.7 million tons per year of cement production considering our Volta Redonda and Arcos plants. We plan to increase our market share in the cement segment in Brazil in order to diversify our product mix and markets, which will allow us to reduce our risk exposure.
Energy
Steelmaking requires significant amounts of electricity to power rolling mills, production lines, hot metal processing, coking plants and auxiliary units.
The main source of the electricity we use is our thermoelectric cogeneration power plant located at Presidente Vargas Steelworks, which is fueled by gas from the steel production process, and has an installed capacity of 235.2 MW. In addition, we hold a 29.5% equity interest in the Itá hydroelectric facility in the state of Santa Catarina, through a 48.75% equity interest in ITASA and a 17.9% equity interest in the Igarapava hydroelectric facility in the state of Minas Gerais. Through these equity interests, we have secured 188 MW in annual power supply for our operations. In 2014, we installed a new turbine generator at Presidente Vargas Steelworks, which added 21 MW to our installed capacity. This turbine uses gases from the iron-making process to generate energy.
Other Information
Our legal and commercial name is Companhia Siderúrgica Nacional. We are organized under the laws of the Federative Republic of Brazil with head offices located at Av. Brigadeiro Faria Lima, 3400, 19th and 20th floors, Itaim Bibi, São Paulo, Brazil, CEP 04538-132, and our telephone number is +55 (11) 3049-7100. Our agent for service of process in the United States is Cogency Global Inc., located at 10 E. 40th Street, 10th Floor, New York, New York 10016. Our website is www.csn.com.br. The U.S. Securities and Exchange Commission, or the SEC, maintains a website that contains reports, proxy and information statements, and other information regarding issuers that file electronically with the SEC, including our filings, at http://www.sec.gov.
4B. Business Overview
Competitive Strengths
We believe that we have the following competitive strengths:
Integrated business model. We are a highly integrated steelmaker and we believe this integration supports resilient and profitable operations. Our integrated business model comprises our captive sources of raw materials, principally iron ore, and our infrastructure, including railways and deep-water port facilities. In terms of raw materials, we own a number of high-quality iron ore mines, strategically located within Brazil’s “Iron Ore Quadrangle,” which distinguishes us from our main competitors in Brazil who are required to purchase all or a portion of their iron ore from mining companies.
Profitable mining business. We have invested significantly in our mining business, placing us in a prominent position among the world’s leading iron ore players. Further mining expansions will enable us to expand our product portfolio and total output, increasing our presence in seaborne markets.
We have high-quality iron ore reserves in Casa de Pedra, Engenho, Fernandinho and other mines, all located in the state of Minas Gerais. Our mining activities are an important contributor to our EBITDA. We sold 32.6 million tons in 2017, 34.8 million tons in 2018 and 38.5 million tons in 2019 of iron ore. Our mining business also includes TECAR, a solid bulks terminal at Itaguaí Port in the state of Rio de Janeiro, with a capacity to handle 42 million tons per year, and the Bocaina mine, located in the city of Arcos in the state of Minas Gerais, which produces dolomite and limestone, as well as our subsidiary ERSA, which mines and casts tin.
40550.00004
26
In 2015 and 2016, we implemented cost reduction measures, which, along with the depreciation of the real, reduced our production costs at the Casa de Pedra mine from US$15.75/ton in 2017 to US$14.58 in 2018 and US$14.68 in 2019.
Thoroughly developed transport infrastructure. We have a thoroughly developed transport infrastructure, connecting our iron ore mines to our steel mills and to the port terminals we operate. Our Presidente Vargas Steelworks facility is located next to railway and port systems, which facilitates its supply of raw materials, product shipments and access to our main clients. Our steelworks are close to the main steel consumer centers in Brazil, with easy access to port facilities and railways. The concession for the main railway we use and operate is owned by MRS, in which we hold, directly and indirectly, a total of 34.94% (or 37.27% before non-controlling interest) ownership interest. The railway connects our Casa de Pedra mine to the Presidente Vargas Steelworks and to our terminals at Itaguaí Port, which handle our iron ore exports and most of our steel exports, as well as our imports of coal and metallurgical coke. Since the construction of MRS’s railway in 1996, it has significantly improved its productivity and developed its business, with increased cash generation.
Energy generation. We generate power through our hydroelectric facilities of Itá and Igarapava, as well as our thermoelectric plant located inside Presidente Vargas Steelworks, which allow us to benefit from reduced energy tariffs. We sell excess energy we generate in the energy market on a spot basis. Our 256.2 MW thermoelectric cogeneration plant provides Presidente Vargas Steelworks with approximately 60% of its energy needs for its steel mills, and uses as its primary fuel the waste gases generated by our coke ovens, blast furnaces and steel processing facilities. We hold a 29.5% equity interest in the Itá hydroelectric facility in the state of Santa Catarina, through a 48.75% equity interest in ITASA, and a 17.9% equity interest in the Igarapava hydroelectric facility. Through these equity interests, we have secured 188 MW in annual power supply for our operations under power purchase agreements at a fixed price per MW hour, adjusted annually for inflation.
Low cost structure. As a result of our fully integrated business model, our thoroughly developed transportation infrastructure and our energy generation, we have been consistently generating high margins compared to peer companies in both the steel and mining segments. Other factors that lead to our low cost structure include the strategic location of our steelworks facility along with our low-cost, skilled workforce.
Diverse product portfolio and product mix. We have a diversified flat steel product mix that includes hot-rolled, cold-rolled, galvanized and steel tin mill products, in order to meet a wide range of customer needs across all steel-consuming industries. We focus on selling high-margin products, including tin-coated, pre-painted, galvalume and galvanized products. Our galvanized products provide material for exposed auto parts, using hot-dip galvanized steel and laser-welded blanks. Our CSN Paraná branch provides us with additional capacity to produce high-quality galvanized, galvalume and pre-painted steel products for the construction and home appliance industries. In addition, our distribution subsidiary, Prada, provides a strong sales channel in the domestic market, enabling us to meet demand from smaller customers and to establish an important presence in this market.
Strong presence in domestic market and strategic international exposure for steel products. We have a strong presence in the Brazilian market for steel products, with a market share of approximately 27% of the domestic flat steel market. In addition, through our international subsidiaries we sell our flat steel products in the United States and in Europe, which sales accounted for approximately 14% of our total flat steel sales in 2019. Direct exports accounted for 2% of our total sales in 2019. In 2012, we acquired SWT, a long steel producer in Germany with annual production capacity of approximately 1.1 million tons of steel profiles, strengthening our steel products mix and geographical diversification. In 2018, SWT accounted for 17% of our total sales, representing 791,000 tons.
Our Strategies
Our goal is to make the most of our high-quality product portfolio, low cost production and diverse consumer market to preserve our position as one of the world’s lowest-cost steel producers and as a global player in the mining of iron ore, increase our cement segment’s market share and optimize our infrastructure assets, including ports, railways and power generating plants, which support our high integration and low cost structure. To achieve these goals, we have developed specific strategies for each of our business segments, as described below.
Steel
The strategy for our steel business comprises:
40550.00004
27
· Focus on the domestic market, by increasing market share in the flat steel segment and long steel market;
· Emphasis on high-margin coated steel products, such as galvanized, galvalume, pre-painted and tin plate;
· Geographical diversification through our flat and long steel facilities abroad and our focus on diversifying our exports through, among others, coated steels;
· Constant pursuit of operational excellence by developing and implementing cost reduction projects, including energy efficiency, and process review programs, including internal logistic optimization, project development and implementation discipline;
· Exploring marketing and commercial synergies through our flat steel distribution network and product portfolio to accelerate our entrance into the domestic long steel market; and
· Increased customized services and distribution abilities through our expanding distribution network.
For information on planned investments relating to our steel activities, see “Item 4D. Property, Plant and Equipment—Acquisitions and Dispositions.”
Mining
In order to strengthen our position in the iron ore market, we plan to invest in our mining assets, including CSN Mineração, to generate low operational costs and long-term growth opportunities.
In the coming years, we expect to reach an annual shipment level of over 60 million tons per year of iron ore products, including third party products, by increasing mine capacities, including Casa de Pedra, and developing export services for third party producers. In the short term, considering downward pricing pressure expected by global iron ore market participants and likely volatility in global iron ore prices, our focus is on exporting quality iron ore at low cost in order to guarantee our participation in the seaborne market.
To sustain this growth, we plan to increase TECAR’s capacity from 42 million tons per year to 60 million tons per year.
To maximize the profitability of our product portfolio, we are focused on increasing our output of high quality pellet feed with Itabirito’s deposits and investing with strategic partners and clients in providing pellet feed to pellet producers.
For information on planned investments relating to our mining activities, see “Item 4D. Property, Plant and Equipment—Acquisitions and Dispositions.”
Logistics
We expect to expand our logistics capabilities, which comprise our integrated infrastructure operations of railways and ports, in order to increase the transportation efficiency of both our incoming raw materials and distributed products.
We will continue to improve our product delivery in the Brazilian market (mainly steel and cement) by implementing low-cost measures, increasing our use of rail transportation and providing more distribution centers to reach end-clients.
In addition to our bulk terminal TECAR, our TECON container terminal has a capacity of 440,000 containers per year.
In terms of railways, we are developing the Transnordestina Logística project, which focuses on iron ore, agricultural commodities, gypsum and fuel. We also plan to invest in increased efficiency and capacity in the South of Brazil through our participation in MRS.
40550.00004
28
Cement
Our cement business strategy involves the utilization of the limestone reserves in our Bocaina mines and the slag generated by our blast furnaces at Volta Redonda. Our first cement grinding mill was inaugurated in 2009, with a capacity to produce 2.4 million tons per year. In 2011, we began producing clinker in the Arcos plant, which provided lower production costs. In 2015, we inaugurated two grinding mills, and in 2016, we concluded a new kiln line with a capacity of 6,500 tons per day, reaching an aggregate capacity of 4.7 million tons per year. For information on planned investments relating to our cement activities, see “Item 4D. Property, Plant and Equipment—Acquisitions and Dispositions.”
Investments and Divestitures
In addition to our planned investments and capital expenditures, we continue to evaluate acquisition opportunities, as well as joint ventures and brownfield or greenfield projects, to improve our steel, cement and mining cost competitiveness and production, along with our logistics capabilities, logistics infrastructure and energy generation.
We also have a significant portfolio of non-core assets in each of our operating segments that are available for sale, including assets outside Brazil, that we are looking to divest in order to improve our liquidity position in the short- to medium-term, including in the form of streaming transactions related to our iron ore business and the sale of European assets and a portion of our investment in Usinas Siderúrgicas de Minas Gerais S.A., or Usiminas. These opportunities are in various stages, including, in some cases, exclusive negotiations.
Our Steel Segment
We produce carbon steel, which is the world’s most widely produced type of steel, representing the vast bulk of global consumption. From carbon steel, we sell a variety of products, both domestically and abroad, to manufacturers in several industries.
Flat Steel
Our Presidente Vargas Steelworks produces flat steel products, which comprise slabs, hot-rolled, cold-rolled, galvanized and tin mill products. For more information on our flat steel production process, see “—Production Output.”
Slabs
Slabs are semi-finished products used for processing hot-rolled, cold-rolled or coated coils and sheet products. We are able to produce continuously cast slabs with a standard thickness of 250 millimeters, widths ranging from 830 to 1,600 millimeters and lengths ranging from 5,250 to 10,500 millimeters. We produce high, medium and low carbon slabs, as well as micro-alloyed, ultra-low-carbon and interstitial free slabs. The slabs are then slitted and finished, generating blooms which are delivered to the long products plant.
Hot-Rolled Products
Hot-rolled products include heavy and light-gauge hot-rolled coils and sheets. A heavy gauge hot-rolled product, as defined by Brazilian standards, is a flat-rolled steel coil or sheet with a minimum thickness of 5.01 millimeters. We are able to provide coils of heavy gauge hot-rolled sheet with a maximum thickness of 12.70 millimeters used to manufacture automobile parts, pipes, structural beams and other construction products. We produce light gauge hot-rolled coils and sheets with a minimum thickness of 1.20 millimeters, which are used for welded pipe and tubing, automobile parts, gas containers, compressor bodies and light cold-formed shapes, channels and profiles for the construction industry.
Cold-Rolled Products
Cold-rolled products include cold-rolled coils and sheets. A cold-rolled product, as defined by Brazilian standards, is a flat cold-rolled steel coil or sheet with thickness ranging from 0.30 millimeters to 3.00 millimeters. Cold-rolled products have more uniform thickness and better surface quality when compared to hot-rolled products and their main applications are automotive parts, home appliances and construction. We supply cold-rolled coils with thickness ranging from 0.30 millimeters to 2.99 millimeters.
40550.00004
29
Galvanized Products
Galvanized products are comprised of flat-rolled steel coated on one or both sides with zinc or a zinc-based alloy applied by either a hot-dip or an electrolytic process. We use the hot-dip process, which is approximately 20% less expensive than the electrolytic process. Galvanizing is one of the most effective and low-cost processes used to protect steel against corrosion caused by exposure to water and the atmosphere. Galvanized products are highly versatile and can be used to manufacture a broad range of products, such as:
· automobiles, trucks and bus bodies;
· manufactured products for the construction industry, such as panels for roofing and siding, dry wall and roofing support frames, doors, windows, fences and light structural components;
· air ducts and parts for hot air, ventilation and cooling systems;
· culverts, garbage containers and other receptacles;
· storage tanks, grain bins and agricultural equipment;
· panels and sign panels; and
· pre-painted parts.
Galvanized sheets, both painted and bare, are also frequently used for gutters and downspouts, outdoor and indoor cabinets and home appliances, among others. We produce galvanized sheets and coils in continuous hot-dip processing lines, with thickness ranging from 0.30 millimeters to 3.00 millimeters. The continuous process allows for products with highly adherent and uniform zinc coatings capable of being processed in nearly all kinds of bending and forming machinery.
We produce Galvanew® in addition to standard galvanized products. Galvanew® is produced by an additional annealing cycle just after the zinc hot-dip coating process. This annealing process causes iron to diffuse from the base steel into the zinc coating. The resulting iron-zinc alloy coating allows better welding and paint performance. The combination of these qualities makes our Galvanew® product particularly well suited for manufacturing automobile and home appliance parts, including high gloss exposed parts.
At CSN Paraná, one of our branches, we produce Galvalume®, a continuous Al-Zn coated material. Although the production process is similar to hot-dip galvanized coating, Galvalume® has at least twice the corrosion resistance of standard galvanized steel. Galvalume® is primarily used in outdoor construction applications that may be exposed to severe acid corrosion, like marine uses.
The value added from the galvanizing process permits us to price our galvanized products with a higher margin. Our management believes that our expertise in value-added galvanized products presents one of our best opportunities for profitable growth because of the increase in Brazilian demand for these products.
Through CSN Paraná, we also produce pre-painted flat steel, which is manufactured in a continuous painting line. In this production line, a layer of resin-based paint in a choice of colors is deposited over either cold-rolled or galvanized base materials. Pre-painted material is a higher value-added product used primarily in the construction and home appliance markets.
Tin Mill Products
Tin mill products consist of flat-rolled low-carbon steel coils or sheets with, as defined by Brazilian standards, a maximum thickness of 0.45 millimeters, coated or uncoated. We apply coatings of tin or chromium by electrolytic process. Coating costs place tin mill products among our highest priced products. The added value from the coating process permits us to price our tin mill products at a higher margin. There are four types of tin mill products, all produced by us in coil and sheet forms:
· Tin plate – coated on one or both sides with a thin metallic tin layer plus a chromium oxide layer, covered with a protective oil film;
· Tin free steel – coated on both sides with a very thin metallic chromium layer plus a chromium oxide layer, covered with a protective oil film;
40550.00004
30
· Low tin coated steel – coated on both sides with a thin metallic tin layer plus a thicker chromium oxide layer, covered with a protective oil film; and
· Black plate – uncoated product used as the starting material for the coated tin mill products.
Tin mill products are primarily used to make cans and other containers. With six electrolytic coating lines, we are one of the largest producers of tin mill products in the world and the sole producer of coated tin mill products in Brazil.
Quality Management System
We maintain a quality management system that is certified to comply with the International Standardization Organization, or ISO, 9001:2015 standard and the automotive industry’s Technical Specification IATF 16949:2016. ISO 9001:2015 is for the design and manufacture of slabs, blooms, billets, hot-rolled flat, pickled and oiled, cold-rolled and galvanized steel, tin mill products and long steel products and IATF 16949:2016, third edition, is for the manufacture of hot-rolled flat, pickled and oiled steel products, cold-rolled and galvanized steel products. In 2019, we implemented the initial steps to obtain a Global Food Safety Initiative (GFSI) recognized certification, joining the GFSI Global Markets Program for the manufacture of tinplate and chromium (tin free steel) by means of electrolytic processes to supply material for production in the food and beverage packaging segments.
Production Output
The following table sets forth the annual production of crude steel in Brazil and by us and the percentage of Brazilian production attributable to us for the periods indicated:
|
Crude Steel Production |
Brazil |
CSN |
CSN % of Brazil | |||
|
|
|
(in millions of tons) |
|
| ||
|
2019 |
|
32.2 |
2.8 |
|
8.7% | |
|
2018 |
|
34.7 |
|
4.0 |
|
11.5% |
|
2017 |
|
34.3 |
|
4.2 |
|
12.2% |
|
Source: Brazilian Steel Institute (Instituto Aço Brasil), or IABr. | ||||||
The following table presents selected operating statistics for the periods indicated:
|
Certain Operating Statistics |
|
|
|
|
|
|
|
2017 |
2018(1) |
2019 |
| |
|
(in millions of tons) |
(in millions of tons) |
(in millions of tons) |
| ||
|
Production of: |
|
|
|
| |
|
Molten Steel |
4.3 |
4.1 |
2.9 |
| |
|
Crude Steel |
4.2 |
4.0 |
2.8 |
| |
|
Hot-Rolled Coils and Sheets |
3.9 |
4.0 |
3.4 |
| |
|
Cold-Rolled Coils and Sheets |
2.5 |
2.8 |
2.3 |
| |
|
Galvanized Products |
1.8 |
1.7 |
1.5 |
| |
|
Tin Mill Products |
0.5 |
0.5 |
0.4 |
| |
|
|
|
|
|
|
|
_______________________
(1) Considering production output of Heartland Steel Processing, LLC, through May 2018. In June 2018, we sold our entire interest in Heartland Steel Processing, LLC.
Raw Materials and Suppliers
The main raw materials we use in our integrated steel mill include iron ore, coke, coal (from which we make coke), limestone, dolomite, aluminum, tin and zinc. In addition, our production operations consume water, gases, electricity and ancillary materials.
40550.00004
31
Iron Ore
We are able to obtain the majority of our iron ore requirements from our Casa de Pedra and Engenho mines located in the state of Minas Gerais. The only iron ore product which we buy from third parties is pellet. For a description of our iron ore segment see “—Our Mining Segment.”
Coal
In 2019, our metallurgical coal consumption was 1.52 million tons. Metallurgical coal includes coking coal and PCI coal, which is a lower grade coal injected into blast furnaces, in pulverized form, to reduce coke consumption. The PCI system reduces our need for imported coke, thereby reducing production costs. Our total PCI coal consumption in 2019 was 0.23 million tons, all of which was imported. The sources of the hard coking coal consumed in our plants in 2019 were: United States (69.3%), Australia (19.8%), Mozambique (5.2%), Canada (5.2%), Russia (0.5%) and for PCI: Russia (100.0%).
Coke
In 2019, in addition to the approximately 0.926 million tons of coke we produced, we also consumed 0.751 million tons of coke bought from third parties in China, Australia, India and Colombia, which represented a decrease of 20.6% as compared to our consumption in 2018.
Limestone and Dolomite
Our Bocaina Mine is located in the city of Arcos, in the state of Minas Gerais, and has been supplying, since the early 1970s, limestone (calcium carbonate) and dolomite (dolomitic limestone) to our Presidente Vargas Steelworks in Volta Redonda. These products are used in the process of sintering and calcination. Arcos has one of the largest and highest quality reserves of limestone in the world, which is used in the production of various products, including clinker and cement.
The annual production of limestone and dolomite for our steelworks is approximately 4.4 million tons.
The main products obtained from limestone and dolomite that are transferred to our steelworks in Volta Redonda are:
· Limestone and dolomite calcination: with a granulometry between 32 and 76 mm, they are used in the lime plant in Volta Redonda to produce calcitic and dolomitic lime, for further use in the steelmaking process and sintering. At the steelworks, lime is used for chemical controlling of liquid slag, in order to preserve the refractory of the converters and assist in the stabilization of the chemical reactions that occur during the steel manufacturing process. During sintering, the purpose of lime is to increase the performance of this process and the final quality of the sinter that is produced.
· Limestone and dolomite fines for sintering: used in the production of “sinter” in our steelworks. The sintering process mixes and heats together with fine ores, solid fuel and flux, producing a highly reactive granulated burden. The sinter is used in blast furnaces as the main source of iron for the production of pig iron.
· The Bocaina Mine is also responsible for supplying limestone for cement manufacturing in Volta Redonda and Arcos.
Aluminum, Zinc and Tin
Aluminum is mostly used for steelmaking. Zinc and tin are important raw materials used in the production of certain higher-value steel products, such as galvanized and tin plate. We typically purchase aluminum and tin from third-party domestic suppliers and zinc from third-party domestic and international suppliers under one year contracts. We purchase part of our tin from our subsidiary ERSA. We maintain approximately 16, 20 and 17 days’ inventory of tin, aluminum and zinc, respectively, at the Presidente Vargas Steelworks.
Other Raw Materials
In our production of steel, we consume, on an annual basis, significant amounts of spare parts, refractory bricks and lubricants, which we generally purchase from domestic suppliers.
40550.00004
32
We also consume significant amounts of oxygen, nitrogen, hydrogen, argon and other gases at the Presidente Vargas Steelworks. These gases are supplied by a third-party under a long-term contract from gas production facilities located on the Presidente Vargas Steelworks site.
In 2019, we used 459,281 tons of oxygen to produce 2.9 million tons of crude steel.
Water
We require large quantities of water in the production of steel. Water serves as a solvent, a catalyst and a cleaning agent. It is also used to cool, carry waste, help produce and distribute heat and power and dilute liquids. Our source of water is the Paraíba do Sul River, which runs through the city of Volta Redonda. Over 92.9% of the water used in the steelmaking process is recirculated and the balance, after careful processing, is returned to the Paraíba do Sul River. Since March 2003, the Brazilian government has imposed a monthly tax for our use of water from the Paraíba do Sul River, based on an annual fee of approximately R$2.527 million.
Electricity
Steelmaking requires significant amounts of electricity to power rolling mills, production lines, hot metal processing, coking plants and auxiliary units. In 2019, our Presidente Vargas Steelworks consumed approximately 2.60 million MWh of electric energy.
Our main source of electricity is our thermoelectric co-generation power plant at the Presidente Vargas Steelworks, which is fueled by gases from the steel production process, with 235.2 MW of installed capacity. In addition, we hold a 29.5% equity interest in the Itá hydroelectric facility in the state of Santa Catarina, through a 48.75% equity interest in ITASA and a 17.9% equity interest in the Igarapava hydroelectric facility. Through these equity interests, we have secured 188 MW in annual power supply for our operations under power purchase agreements at a fixed price per MW hour, adjusted annually for inflation.
In 2014, we installed a new turbine generator at the Presidente Vargas Steelworks, which added 21 MW to our existing installed capacity. This turbine is located near our blast furnace and uses outlet gases from our iron production to generate energy.
Natural Gas
The market for natural gas is strongly correlated with the electricity market and we consume both natural gas and electricity, mainly in our hot strip mill. Companhia Estadual de Gás do Rio de Janeiro S.A., or CEG Rio, which was privatized in 1997, is currently our major source of natural gas. To secure natural gas supply, in 2007, we signed a five-year “take-or-pay” agreement with CEG Rio, pursuant to which we committed to acquire at least 70% of the gas volume it provides. If we do not acquire this minimum volume, we may compensate the difference in amount paid in future years up to one year after the contract’s termination. The agreement’s term is until June 30, 2020 and we are negotiating a new agreement. In 2019, the Presidente Vargas Steelworks consumed 453.5 million cubic meters of natural gas.
Diesel Oil
In January 2017, we entered into agreements with Companhia Brasileira de Petróleo Ipiranga, or Ipiranga, to receive diesel oil in order to supply our equipment in our mining plants in the state of Minas Gerais, which provide the iron ore, dolomite and limestone used in our steel plant in Volta Redonda.
In 2019, our diesel oil consumption was 64,920 kiloliters, used to produce 32,089 million tons of iron ore, for which we paid R$155.2 million.
Suppliers
We acquire our inputs in Brazil and abroad. Aluminum, zinc, tin, spare parts, refractory bricks, lubricants, oxygen, nitrogen, hydrogen and argon are the main inputs we acquire in Brazil. Coal and coke are the only inputs we acquire abroad.
In 2017, 2018 and 2019, we consumed 60,346 tons, 19,477 tons and 678,118 tons, respectively, of third party slabs.
40550.00004
33
Our main raw materials suppliers are set forth below:
|
|
|
|
|
Main Suppliers |
|
Raw Material |
|
|
|
|
|
Ternium |
|
Slabs |
|
BHP, Contura, Carbo One Limited, Vale, Warrior and Trafigura |
|
Coal |
|
CI Milpa, Sinochem, Noble and Trafigura |
|
Coke |
|
Ibrame, Latasa, and Nova Metais |
|
Aluminum |
|
Votorantim Metais, Reciclyn, Zinco Ligas, Latasa and Trafigura |
|
Zinc |
|
ERSA and Melt Metais |
|
Tin |
|
Sotreq, Minas Máquina, Komatsu, Inova and WLM |
|
Spare parts |
|
RHI Magnesita, Vesuvius and Saint Gobain |
|
Refractory bricks |
|
Ipiranga and Cosan |
|
Lubricants |
Flat Steel Mill
The Presidente Vargas Steelworks, located in the city of Volta Redonda, in the state of Rio de Janeiro, began operating in 1946. It is an integrated facility covering approximately four square km and containing five coke batteries, three of which are in operation, three sinter plants, two blast furnaces, a basic oxygen furnace steel shop, with three converters, three continuous casting units, one hot strip mill, three cold strip mills, two continuous pickling lines, one continuous annealing line, 28 batch annealing furnaces, three continuous galvanizing lines, four continuous annealing lines exclusively for tin mill products and six electrolytic tinning lines.
The annual production capacity of steel at the Presidente Vargas Steelworks is 5.2 million tons.
Downstream Facilities
CSN Paraná
Our CSN Paraná branch produces and supplies plain regular galvanized products, Galvalume® products and pre-painted steel products for the automotive, construction and home appliance industries. The plant has an annual capacity of 295,000 tons of galvanized products and Galvalume® products, 131,000 tons of pre-painted products, which can use cold-rolled or galvanized steel as substrate, service capacity of 150,000 tons of sheets and narrow strips, and 384,000 tons of pickled hot-rolled coils in excess of the coils required for the coating process.
CSN Porto Real
Our CSN Porto Real branch produces and supplies plain regular galvanized, Galvanew® and tailored blanks mainly for the automotive industry. The plant has an annual capacity of 350,000 tons of galvanized products, including Galvanew® products, and 354,000 tons of tailored blanks, sheets and narrow strips, which can use cold-rolled or galvanized steel as a substrate.
Prada
We have a 99.99% ownership interest in Companhia Metalúrgica Prada. Established in 1936, Companhia Metalúrgica Prada is the largest Brazilian steel can manufacturer and has an annual production capacity of over one billion cans in its five industrial facilities located in the states of São Paulo, Minas Gerais, Rio de Janeiro and Rio Grande do Sul and in the city of Brasília. We are the only Brazilian producer of tin plate, which is Companhia Metalúrgica Prada’s main raw material, making it one of our most important customers. Companhia Metalúrgica Prada has important clients in the food and chemical industries, including packages of vegetables, fish, dairy products, meat, aerosols, infant nutrition and other business activities.
Prada Distribuição is one of the leaders in the Brazilian distribution market for steel products with 600,000 tons per year of installed processing capacity. Prada Distribuição has two steel service centers and five distribution centers strategically located in the Southeast region of Brazil. The service centers are located in the city of Mogi das Cruzes, in the state of São Paulo, and in the city of Valença, in the state of Rio de Janeiro. Its product mix also includes sheets, slit coils, sections, tubes and roofing in standard or customized format, according to clients’ specifications. Prada Distribuição processes the entire range of products produced by us and services 4,000 customers annually from the civil construction, automotive and home appliances sectors, among others.
40550.00004
34
Lusosider, Aços Planos, S.A.
We own indirectly 99.99% of Lusosider Aços Planos S.A., or Lusosider, a flat steel processing facility located in Seixal, near Lisbon, Portugal. Lusosider has the capacity to produce approximately 105,000 tons of hot-rolled pickled coils, 36,000 tons of cold-rolled steel products and 276,000 tons of galvanized steel products per year. Its main customers include service centers and tube making industries.
CSN Distribuição
We have two service centers, one located in the city of Camaçari, in the state of Bahia and one in the city of Jaboatão dos Guararapes, in the state of Pernambuco, to support sales in the Northeastern and Northern regions of Brazil. We also have a distribution center in the city of Canoas, in the state of Rio Grande do Sul, to support sales in the Southern region of Brazil.
Long Steel Mills
SWT
In February 2012, we acquired SWT in Germany, which marked our entry into the long steel market. SWT specializes in the production of profiles, including IPE (European I Beams) and HE (European Wide Flange Beams) sections, channels and UPE (Channels with Parallel Flanges) sections and steel sleepers. In total, SWT produces more than 200 types of sections according to different German and international standards.
SWT’s Production Output
|
|
2017 |
2018 |
2019 |
|
|
|
|
|
|
Production of: |
|
|
|
|
Beam Blank (Crude Steel) |
862 |
871 |
844 |
|
Long Steel (Finished Products) |
801 |
818 |
789 |
Raw Materials and Suppliers
Raw Materials and Energy Requirements
The main raw material we use in our long steel production is scrap. In addition, we require electricity, natural and technical gases and ancillary materials like ferroalloys, lime, dolomite and foaming coal.
Scrap
Our scrap consumption in 2019 was 0.94 million tons, as compared to 0.98 million tons in 2018, and accounted for approximately 61% and 63% of our production costs in 2019 and 2018, respectively. We are able to obtain approximately 70% of our scrap needs from within a 250 km vicinity of our production facilities.
Ferroalloys, Lime and Foaming Coal
Because we do not own any sources of ferroalloys, lime or foaming coal, we must buy these raw materials from third party traders, most of which are located in Europe and source these raw materials from producers around the world.
Rolls
We consume different types of rolls in our rolling mill, usually cast rolls which come from Germany, Italy, Slovenia and China.
40550.00004
35
Graphite Electrodes
In the smelting shop, which is an electric arc furnace, we use graphite electrodes with a diameter of 750mm. In the ladle furnace, we use electrodes with a diameter of 400mm. We source these electrodes from Europe, Japan and China.
Other Raw Materials
In our production of steel we consume, on an annual basis, amounts of electrodes, rolls, refractory materials and materials for packaging and spare parts, which are mostly purchased from domestic suppliers.
Water
Large amounts of water are required in the production process. Our source of water is the Saale river, located 5 km from the plant. We use our own water station to pump water via pipelines to the plant.
Electricity and Natural Gas
Steelmaking also requires significant amounts of electricity and natural gas, for which we have supply contracts. Under normal conditions, we consume approximately 470 GWh of electric energy and 410 GWh of natural gas.
Suppliers
We acquire the inputs necessary for the production of our products in Germany and other countries.
Our main raw materials suppliers are set forth below:
|
Main Suppliers |
Raw Material |
|
|
|
|
Scholz, TSR |
Scrap |
|
RWE Supply & Trading GmbH |
Electric energy |
|
Total Energie Gas GmbH |
Natural gas |
|
Refractories Site Service GmbH |
Refractory |
|
Graftec, W.A.S., SHOWA DENKO |
Electrodes |
|
Siemens, Schneider, Voith |
Spare parts |
|
Irle, Walzengießerei Coswig |
Rolls |
Facilities - SWT
SWT possesses a 28 km internal railway system, as well as the logistics infrastructure to ensure supply of scrap and delivery of finished products. The main markets served by SWT include non-residential construction, equipment industries and engineering and transport, in Germany and in neighboring countries, including Poland and the Czech Republic.
|
Effective Capacity - SWT |
|
|
|
|
|
|
|
Tons per year |
Equipment in operation | |
|
Process: |
|
|||
|
EAF – Electric Arc Furnace |
1,100,000 |
1 furnace | ||
|
Ladle Furnace |
1,100,000 |
1 furnace | ||
|
Finished Products: |
||||
|
Section Mill |
1,000,000 |
1 mill |
Volta Redonda EAF Mill
Plant Characteristics
We completed a new plant mill for the production of long steel products in Volta Redonda and began assisted operations in December 2013. The Volta Redonda plant comprises a 50 ton electric arc steelmaking furnace, 50 ton ladle metallurgy, continuous casting machine for billets and a hot rolling mill for wire rod and reinforcing bar. We expect this plant to reach and output of up to 500,000 tons per year once fully operational, providing the Brazilian market with products for civil construction and high quality drawing and cold heading applications.
40550.00004
36
Steelmaking Shop
Designed for an output of 383,000 tons per year, this unit mainly consists of one 50 ton UHP, AC electric arc furnace, one 50 ton ladle furnace, one continuous casting machine for billets with three strands, mobile equipment and cranes, power supply, distribution facilities and auxiliary equipment.
Rolling Mill
Designed for an output of 500,000 tons per year, this unit has one walking-beam reheating furnace, or RHF, a four-stand blooming mill, a 250 ton hot shear, a six-stand roughing mill, a six-stand intermediate mill, a six-stand pre-finishing mill, internal water cooling, a double length flying shear, a stepping cooling bed, a 500 ton cold shear, transfer inspection stand, bundling machine, a water-cooling section before wire finishing mill, a 10-stand high-speed wire finishing mill, a water-cooling section after wire finishing mill, a laying head, a loose coil cooling line, reforming device, bundling machine, stripper and coil handling devices.
Production Output
|
Certain Operating Statistics |
|
|
|
|
(in thousands of tons) |
2017 |
2018 |
2019 |
|
Production of: |
|
|
|
|
Billets (Crude Steel) |
211 |
203 |
229 |
|
Long Steel (Finished Products) |
202 |
199 |
224 |
Raw Materials and Energy Suppliers
The main raw material we use in our long steel production in Volta Redonda is scrap, in addition to pig iron. We also use blooms, which we produce in our blast furnace. In addition, our production operations consume electricity, natural and technical gases and ancillary materials like ferroalloys, lime, dolomite and foaming coal. The supply sources for these materials are the same used for our flat steel operations. See “Item 4B. Business Overview—Raw Materials and Suppliers.”
Our Mining Segment
Our mining activities are among the largest in Brazil and are mainly driven by the exploration of one of our iron ore reserves, Casa de Pedra, in the state of Minas Gerais. We sell our iron ore products mainly in Asia, Europe and Brazil with sales and marketing from our principal hubs in Minas Gerais, Brazil and Austria.
Our Mines
Casa de Pedra Mine
Casa de Pedra is an open pit mine located in the city of Congonhas, in the state of Minas Gerais, approximately 80 km south of the city of Belo Horizonte and 360 km north of the city of Rio de Janeiro. The site is approximately 1,000 meters above sea level and accessible from the cities of Belo Horizonte or Congonhas through mostly paved roads.
Casa de Pedra mine is a hematite-rich iron deposit of an early proterozoic banded iron formation in Brazil’s Iron Ore Quadrangle (Quadrilátero Ferrífero), which is located in the central part of the state of Minas Gerais in the Southeastern region of Brazil and has been one of the most important iron producing regions in Brazil for the last 50 years. We incorporated the mine in 1941, but it has been operating since 1913.
Our iron ore at Casa de Pedra is currently excavated by a fleet of hydraulic shovels and wheel loaders and then hauled by a fleet of trucks with an installed annual run of mine capacity of approximately 120 million tons. The iron ore is then processed in our treatment facilities, which have an installed capacity of 33 million tons of products per year (a sum of the central plant, mobile plants and Pires treatment facilities). At Casa de Pedra mine and the Pires complex, we use electrical power provided by hydroelectric facilities.
40550.00004
37
Casa de Pedra mine supplies all of our iron ore needs, except pellets, and produces lump ore, sinter feed and pellet feed fines with high iron content. The following map illustrates the location of our Casa de Pedra mine:
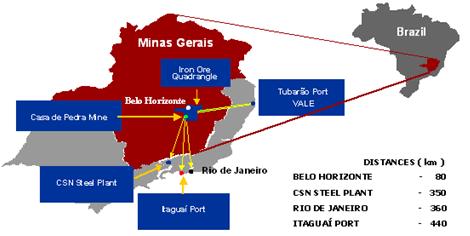
Engenho Mine
The Engenho mine is also an open pit mine located at the Southwestern region of the Iron Ore Quadrangle, 60 km south of the city of Belo Horizonte and is accessible from the cities of Belo Horizonte or Congonhas through mostly paved roads.
Engenho mine began operations in 1950. We mine its iron ore using the same fleet used as Casa de Pedra mine and, when necessary, a support fleet. We also have equipment operating in the dam and yard.
The ROM from our Engenho Mine can be processed in the Central Plant, Mobile Plants or in the Pires treatment facilities. We use electrical power provided by hydroelectric facilities at our Engenho mine and from the Pires Complex.
Fernandinho Mine
Fernandinho mine is located in the city of Itabirito, in the state of Minas Gerais. This city is located in the Mid-Eastern region of the state of Minas Gerais and approximately 40 km from the city of Belo Horizonte. Fernandinho mine is an open pit mine and is accessible from the cities of Belo Horizonte or Itabirito through mostly paved roads.
Fernandinho mine began operations in 1950. As of the date of this annual report, Fernandinho mine is inactive.
Limestone and Dolomite Mine
Our extraction and preparation of limestone and dolomite takes place at our Bocaina mining facility located in the city of Arcos, in the state of Minas Gerais. Our Bocaina mining facility is an open pit mine and it can be accessed from the cities of Belo Horizonte, located approximately 230 km away, and Volta Redonda (where the Presidente Vargas Steelworks is situated), located approximately 462 km away, through paved roads.
The ore in this mine is excavated by a fleet of wheel loaders, excavators and tire tractor, and is transported by a fleet of trucks, in support we have a fuel truck, water truck, as well as additional heavy equipment.
This mining facility has an installed annual production capacity of approximately 12.0 million tons and has sufficient limestone and dolomite reserves to adequately supply our steel production, at current levels, for approximately 37 years.
40550.00004
38
Tin Facility
We own a tin facility in Itapuã do Oeste, in the state of Rondônia, through our subsidiary ERSA. This facility has an installed annual production capacity of approximately 3,600 tons of tin, which we use substantially as a raw material to produce tin plate, a coated steel product. A small part of our tin production that is not used as raw material is sold to third parties; however, the results from these sales are insignificant to our consolidated results.
Mineral Rights and Ownership
We hold concessions to mine iron ore, limestone and dolomite. We purchase manganese in the local market. We own 87.52% of CSN Mineração mines and 100% of Bocaina and Santa Bárbara mines. In addition, each mine is an “open pit” mine. Iron ore extraction, crushing, screening and concentration are done in three different sites: Casa de Pedra mine and Pires beneficiation plant (all CSN Mineração’s property) and Fernandinho mine, a Minérios Nacional’s property.
Casa de Pedra
Our mining rights for Casa de Pedra include the mine, a beneficiation plant, roads, a loading yard and a railway branch and are duly registered with the ANM. The ANM has also granted us easements in 19 mine areas located in the surrounding region, which are not currently part of Casa de Pedra mine.
We believe we have obtained and are in compliance with all licenses and authorizations for our operations and projects at Casa de Pedra mine.
Exploration undertaken at the Casa de Pedra mine is subject to mining lease restrictions, which were reflected in our iron ore reserve calculations. Quality requirements (chemical and physical) are the key “modifying factors” in the definition of ore reserves at Casa de Pedra and were properly accounted for by us.
Mineral Reserves
The following table sets forth information on the type of mine, period of operation, projected exhaustion dates and percentage of our interest for each of our mines:
|
Mine |
|
Type |
|
Operating since |
|
Projected exhaustion date |
|
CSN % interest |
|
Iron: |
|
|
|
|
|
|
|
|
|
Casa de Pedra (Congonhas, Minas Gerais) |
|
Open pit |
|
1913 |
|
2040 |
|
87.52 |
|
Engenho (Congonhas, Minas Gerais) |
|
Open pit |
|
2007 |
|
2040 |
|
87.52 |
|
Fernandinho (Itabirito, Minas Gerais) |
|
Open pit |
|
2007 |
|
2039 |
|
100 |
|
| ||||||||
|
Limestone and Dolomite: |
|
|
|
|
|
|
|
|
|
Bocaina (Arcos, Minas Gerais) |
|
Open pit |
|
1946 |
|
2057 |
|
100 |
|
Tin: |
|
|
|
|
|
|
|
|
|
Santa Barbara (Itapuã do Oeste, Rondônia) |
|
Open pit |
|
1950 |
|
2054 |
|
100 |
We calculate our estimates of proven and probable reserves and other mineral deposits at our mines in accordance with the technical definitions contained in the SEC’s Industry Guide 7, and estimates of mine life described in this annual report are derived from these reserve estimates. The mineralized material disclosed refers to the entire mines, and not just to our proportional interest in the mines.
In the most recent reserve audit conducted in 2014, the losses for mine dilution and mining recovery considered were 5% each for both Casa de Pedra and Engenho mines.
In 2014, we audited resources and reserves for Casa de Pedra and Engenho mines and only resources for Fernandinho mine. We do not have audited resources or reserves studies for our Bocaina mine, thus the resources and reserves presented in the table below were not audited by any third parties for that mine. As for our Santa Barbara mine, we do not have reserve estimates and do not currently plan to begin campaigns to complete a study in connection with this property in light of its low materiality to our business.
40550.00004
39
The following table sets forth our estimates of proven and probable reserves and other mineral deposits at our mines reflecting the results of reserve studies:
|
Proven and Probable Reserves(1) | |||||||
|
Mine Name and Location |
Audited Reserves |
Ore Tonnage(2) |
Grade(3) |
Rock Type |
Recoverable Product(4) | ||
|
(in millions of tons) |
(in millions of tons) |
(in millions of tons) | |||||
|
|
Proven(5) |
Probable(6) |
Proven(5) |
Probable(6) |
|
|
|
|
Iron: |
|
|
|
|
|
|
|
|
Casa de Pedra (Congonhas, Minas Gerais) |
1,043 |
1,662 |
856 |
1,662 |
41.36% |
Hematite (7%) Itabirite (93%) |
1,390 |
|
Engenho (Congonhas, Minas Gerais) |
108 |
209 |
101 |
209 |
39.48% |
Hematite (3%) Itabirite (97%) |
160 |
|
Fernandinho (Itabirito, Minas Gerais) |
|
|
|
|
40.21% |
Itabirite (100%) |
|
|
Limestone and Dolomite: |
|
|
|
|
|
|
|
|
Bocaina (Arcos, Minas Gerais) |
271 |
0.2 |
271 |
0.2 |
50.59% CaO 16.82% MgO |
Limestone (94.74%) Dolomite (5.26%) |
280 |
_______________________
(1) Reserves means the part of a mineral deposit which could be economically and legally extracted or produced at the time of the reserve determination. We do not have reserve audits for the Fernandinho mine. The reserves for the Casa de Pedra and Engenho mines were audited in December 2014 and we have reduced the amount of proven reserves by our annual production since then.
(2) Represents run of mine material.
(3) Grade is the proportion of metal or mineral present in ore or any other host material.
(4) Represents total product tonnage after mining and processing losses.
(5) Means reserves for which: (i) quantity is computed from dimensions revealed in outcrops, trenches, workings or drill holes; grade and/or quality are computed from the results of detailed sampling; and (ii) the sites for inspection, sampling and measurement are spaced so closely and the geologic character is so well defined that size, shape, depth and mineral content of reserves are well- established.
(6) Means reserves for which quantity and grade and /or quality are computed from information similar to that used for proven (measure) reserves, but the sites for inspection, sampling and measurement are farther apart or are otherwise less adequately spaced. The degree of assurance, although lower than that for proven (measure) reserves, is high enough to assume continuity between points of observation.
The metallurgical recovery factor is the percentage of iron in the ore delivered to the processing plant that is recovered by the metallurgical process. In 2019, the metallurgical recovery factor obtained by Casa de Pedra’s concentration plant was 81.4%. In addition to the flotation plant, we have three magnetic separation plants that achieved metallurgical recovery factors of 66.3%, 55.6% and 22.9%. Since 2019, the Pires plant has operated through a dry process and its metallurgical recovery factor is 100%.
The cutoff grade is the minimum ore percentage that determines which material will be fed in the processing plant. The cutoff grade value for Casa de Pedra and Engenho mines considered in the most recent audit is 23.37%.
The prices used in the 2014 audit for the estimation of Casa de Pedra reserves are shown in the following table. As shown, the product price we assumed to estimate our reserves is based on expectations of an average long term price of US$90 per ton, considering that as a reasonable price for a sustainable development of the iron ore market.
|
|
Price for the three years prior to the audit |
|
Long term average |
| ||
|
|
(US$/t) |
|
(US$/t) |
| ||
|
|
2011 |
2012 |
2013 |
|
Assumption |
|
|
Platts 62Fe CFR N.China ($/dmt) |
169 |
130 |
135 |
|
90 |
|
40550.00004
40
Casa de Pedra Mine
In 2012, we started a multi-year study of our iron ore resources and reserves at Casa de Pedra in accordance with best practices in the iron ore market. We conducted extensive work throughout 2014 to document and classify all information related to both the current and future operations of the Casa de Pedra mine. In 2014, we hired Snowden Group, to undertake an independent analysis of the Casa de Pedra iron ore resources and reserves. Snowden carried out a full analysis of all available information and has independently validated our reported resources and reserves.
Snowden accepts as appropriate the estimates regarding proven and probable reserves made by us, totaling 2,704 million tons of iron ore, as of December 31, 2014, at a grade of 41.36% Fe and 36.46% SiO2. This new estimate of our iron ore reserves at Casa de Pedra is significantly larger than our estimate of 1,631 million tons, contained in an appraisal report prepared in 2006 by Golder Associates. Over the course of the Casa de Pedra mine’s operation, we have executed several drilling campaigns. The last drilling campaign was in 2014, and we had drilled more than 92,000 meters by November 2014.
Engenho and Fernandinho Mines
In 2012, we started the same process used at Casa de Pedra to identify iron ore resources and reserves at the Engenho in two stages.
We conducted extensive work throughout 2014 to document and classify all information related to both the current and future operations of the Engenho and Fernandinho mines. In 2014, we hired Snowden Group to conduct an independent analysis of the Engenho iron ore resources and reserves and Fernandinho resources. Snowden carried out a full analysis of all available information and has independently validated our reported resources and reserves.
Snowden accepts as appropriate the estimates regarding proven and probable reserves made by us, totaling 317 million tons of iron ore for Engenho (as of December 31, 2014) at a grade of 39.48% Fe and 40.01% SiO2.
After our last drilling campaign, we had drilled more than 9,000 meters by November 2014 in our Engenho mine.
Production
Casa de Pedra Mine
The Casa de Pedra facilities are located in the city of Congonhas, in the state of Minas Gerais. The Casa de Pedra mine is located 350 km from the Presidente Vargas Steelworks and supplies iron ore products to our steel mill, as well as for export through the Itaguaí Port. Casa de Pedra’s equipment fleet and treatment facilities have an installed annual ROM capacity of approximately 120 million tons and 40 million tons, respectively.
Pires and Fernandinho Beneficiation Plants
Pires plant is the beneficiation plant of Congonhas Minérios. The plant receives material from Engenho and Casa de Pedra Mines and generates final products such as: lump ore, sinter feed and concentrates.
Fernandinho plant receives material from the Fernandinho mine, located in the city of Itabirito, state of Minas Gerais, and generates sinter feed and fines as final products. In November 2017, we restarted operations in the Fernandinho plant, reclaiming the fine ore piles and producing pellet feed.
40550.00004
41
The following table sets forth the production volume of iron ore in each of our mines in the last three years:
|
|
Production(1) | ||
|
|
2017 |
2018 |
2019 |
|
Casa de Pedra(2) (Mt) |
26.05 |
23.40 |
27.63 |
|
Grade(3) (%) |
62.1% |
62.5% |
62.2% |
|
Pires(2) (Mt) |
3.87 |
4.48 |
4.46 |
|
Grade (%) |
60.4% |
61.2% |
60.3% |
|
Fernandinho(2) (Mt) |
0.03 |
0.65 |
0.61 |
|
Grade (%) |
61.6% |
62.1% |
64.7% |
_______________________
(1) In addition to its own production, CSN Mineração also purchased iron ore from third parties. Third party purchase volumes were 3.6 million tons, 7.4 million tons and 6.2 million tons in 2017, 2018 and 2019, respectively.
(2) Production information considers 100% of the mines.
(3) Grade is the proportion of metal or mineral present in ore or any other host material.
The following table sets forth our consolidated sales in the periods presented:
|
|
|||
|
|
2017 |
2018 |
2019 |
|
Consolidated Sales (Mt) |
27.36 |
29.59 |
34.89 |
Dams
The following table sets forth certain information on the dams we operate:
|
Name of the Dam/Dike |
Company / Entrepreneur |
Main Use |
Substance |
Height (m) |
Capacity (m³) |
Construction Method |
Last Certification |
Risk |
Impact |
Status |
|
Casa de Pedra(1) |
CSN Mineração |
Containment of mining tailings |
Iron ore |
84.00 |
65,374,575 |
Downstream |
Sep/19 |
Low |
High |
Active |
|
B4 |
CSN Mineração |
Containment of mining tailings |
Iron ore |
65.00 |
13,001,821 |
Upstream |
Sep/19 |
Low |
High |
Inactive |
|
B5 |
CSN Mineração |
Containment of mining tailings |
Iron ore |
41.00 |
5,393,580 |
Single stage |
Sep/19 |
Low |
Medium |
Inactive |
|
Pilha da Vila II dike |
CSN Mineração |
Containment of mining tailings |
Gravel |
28.00 |
18,556 |
Single stage |
Sep/19 |
Low |
Medium |
Active |
|
Bichento IIIA dike |
CSN Mineração |
Containment of mining tailings |
Gravel |
18.60 |
17,299 |
Single stage |
Sep/19 |
Low |
Low |
Active |
|
Esmeril IV dike |
CSN Mineração |
Containment of mining tailings |
Gravel |
38.55 |
282,079 |
Single stage |
Sep/19 |
Low |
High |
Active |
|
Lagarto dam |
CSN Mineração |
Containment of mining tailings |
Gravel |
14.00 |
210,000 |
Single stage |
Sep/19 |
Low |
High |
Active |
|
Poço Fundo dam |
CSN Mineração |
Containment of mining tailings |
Gravel |
5.45 |
12,000 |
Single stage |
Sep/19 |
Low |
High |
Active |
|
Vigia auxiliary dam |
CSN Mineração |
Containment of mining tailings |
Iron ore |
35.00 |
3,140,693 |
Upstream |
Sep/19 |
Low |
High |
Inactive |
|
B2 dam |
Minérios Nacional |
Containment of mining tailings |
Iron ore |
40.00 |
2,616,466 |
Upstream |
Sep/19 |
Low |
High |
Inactive |
|
B2 auxiliary dam(2) |
Minérios Nacional |
Containment of mining tailings |
Iron ore |
33.00 |
8,228,000 |
Upstream |
Sep/19 |
Low |
High |
Inactive |
|
Engenho dike |
Minérios Nacional |
Containment of mining tailings |
Gravel |
13.00 |
8,821 |
Single stage |
Sep/19 |
Low |
Medium |
Active |
|
Vigia dam |
Minérios Nacional |
Containment of mining tailings |
Iron ore |
30.00 |
812,901 |
Upstream |
Sep/19 |
Low |
High |
Inactive |
|
Ecológica 1 dam |
Minérios Nacional |
Containment of mining tailings |
Gravel |
15.00 |
41,000 |
Single stage |
Sep/19 |
Low |
High |
Active |
|
Ecológica 2 dam |
Minérios Nacional |
Containment of mining tailings |
Gravel |
6.50 |
104,000 |
Single stage |
Sep/19 |
Low |
High |
Active |
|
B2 dam |
Companhia Siderúrgica Nacional |
Water storage and catchment |
Dolomite |
11.00 |
398,200 |
Center line |
Sep/19 |
Low |
Low |
Inactive |
|
B3 dam |
Companhia Siderúrgica Nacional |
Containment of limestone |
Limestone |
11.00 |
1,065,560 |
Single stage |
Sep/19 |
Low |
Alto |
Inactive |
|
PIT-01 |
Estanho de Rondônia |
Containment of mining tailings |
Deposit of tin |
14.30 |
4,100,000 |
Natural dam |
Sep/19 |
Low |
High |
Active |
|
Taboquinha 01 - Crente |
Estanho de Rondônia |
Containment of mining tailings |
Deposit of tin |
18.00 |
2,941,251 |
Upstream |
Sep/19 |
Low |
Medium |
Inactive |
|
Taboquinha 02 - Serra Azul |
Estanho de Rondônia |
Containment of mining tailings |
Deposit of tin |
19.00 |
1,983,201 |
Upstream |
Sep/19 |
Low |
Medium |
Inactive |
|
Taboquinha 03 |
Estanho de Rondônia |
Containment of mining tailings |
Deposit of tin |
16.00 |
1,708,100 |
Single stage |
Sep/19 |
Medium |
Medium |
Inactive |
|
Taboquinha 04 |
Estanho de Rondônia |
Containment of mining tailings |
Deposit of tin |
16.00 |
2,253,100 |
Single stage |
Sep/19 |
Medium |
Medium |
Inactive |
|
Igarapava |
Aliança Geração de Energia S.A. |
Hydroelectric |
Water |
42.10 |
241,840,000 |
Soil – concrete face rockfill |
Jan/20 |
Low |
High |
Active |
|
Itá (dam) |
Engie Brasil |
Hydroelectric |
Water |
125.00 |
5,100,000,000 |
Concrete face rockfill |
Jan/20 |
Low |
High |
Active |
|
Itá (dike 1) |
Engie Brasil |
Hydroelectric |
Water |
22.00 |
Compressed soil, upstream protection with riprap rock and downstream protection with grass |
Jan/20 | ||||
|
Itá (dike 2) |
Engie Brasil |
Hydroelectric |
Water |
22.00 |
Compressed soil, upstream protection with riprap rock and downstream protection with grass |
Jan/20 | ||||
|
Itá (dike 3)(3) |
Engie Brasil |
Hydroelectric |
Water |
29.00 |
Compressed soil, upstream protection with riprap rock and downstream protection with grass |
Jan/20 |
40550.00004
42
________________
* All tailings dams were last certificated in January 2020.
(1) The Casa de Pedra dam comprises B2, B3 and B6 underwater dams, flooded by its reservoir.
(2) In regard to B2 auxiliary dam, which stability was not assured and declared in the last report, dated September 2019, Minérios Nacional clarifies that it has been meeting the works schedule regarding the structure’s stabilization, as determined by the designer and independent external audits, and has been carrying out the measures issued by the Prosecutor’s Office of the state of Minas Gerais, as confirmed by an expert report issued by the analyst of the Prosecutor’s Office.
(3) The dam and dikes (1, 2 and 3) comprise the reservoir of Itá hydroelectric.
Since the accident in 2015 in the city of Mariana, in the state of Minas Gerais, involving the breaking of an upstream mining dam operated by another mining company, we changed our processes to reduce tailings deposits. Moreover, we have invested R$400 million in our dams and operations, and today we have concomitant operations of tailing dams and dry stacking.
In addition, following another accident involving the breaking of an upstream mining dam operated by another mining company in January 2019 in the city of Brumadinho, in the state of Minas Gerais, we have continued to execute our plan for the decommissioning or decharacterization of our six inactive tailings dams.
Our only active tailings dam, Casa de Pedra, was constructed in the downstream method, which provides for enhanced resilience and safety. We do not operate any active upstream tailings dams.
40550.00004
43
Distribution
Transportation costs are a significant component of our steel and iron ore production costs and are a factor in our price competitiveness in the export market. Railway is the main means of transport by which we convey raw materials from our mines to the Presidente Vargas Steelworks and steel and iron ore products to ports for shipment overseas. Iron ore, limestone and dolomite from our two mines located in the state of Minas Gerais are transported by railroad to the Presidente Vargas Steelworks for processing into steel. The distances from our mines to the Presidente Vargas Steelworks are 328 km and 455 km. The distances from our mines to the ports are 440 km and 160 km. Imported coal and coke bought from foreign suppliers are unloaded at the port of Itaguaí, 90 km west of the city of Rio de Janeiro, and shipped 109 km by train to the Presidente Vargas Steelworks. Our finished steel products are transported by train, truck and ships to our customers throughout Brazil and abroad. Our most important local markets are the cities of São Paulo (335 km from the Presidente Vargas Steelworks), Rio de Janeiro (120 km) and Belo Horizonte (429 km).
Until recently, Brazil’s railway system (including railcars and tracks) was principally government-owned and in need of repair, but it has now been largely privatized. In an attempt to increase the reliability of our rail transportation, we hold interests in companies that hold concessions for the main railway systems we use. For further information on our railway concessions, see “—Our Logistics Segment—Railways.”
We export iron ore and import coal and coke through the Itaguaí Port, in the state of Rio de Janeiro. We have operated the coal and container terminals since August 1997 and 1998, respectively.
Our Logistics Segment
Our logistics segment is comprises railway and port facilities.
Railways
Southeastern Railway System
MRS has a 30-year concession to operate, through the year 2026 and renewable for an equal period of 30 years, Brazil’s Southeastern railway system. As of December 31, 2019, we held 34.94% (or 37.27% before non-controlling interest) of MRS’s total capital. For more information, see “Item 5E. Off-Balance Sheet Arrangements.” The Brazilian Southeastern railway system, with 1,643 km of track, serves the São Paulo - Rio de Janeiro - Belo Horizonte industrial triangle in Southeast Brazil, and links our mines located in the state of Minas Gerais to the ports located in the states of São Paulo and Rio de Janeiro and to the steel mills of CSN, Companhia Siderúrgica Paulista or Cosipa, and Gerdau Açominas. In addition to serving other customers, the railway transports iron ore from our mines at Casa de Pedra in the state of Minas Gerais and coke and coal from Itaguaí Port in the state of Rio de Janeiro to the Presidente Vargas Steelworks and transports our exports to the ports of Itaguaí and Rio de Janeiro. The railway system connects the Presidente Vargas Steelworks to the container terminal at Itaguaí Port, which handles most of our steel exports. Our transport volumes represent approximately 21% of the Brazilian Southeastern railway system’s total volume.
Northeastern Railway System
We hold interest in companies that have concessions to operate the Northeastern railway system, which operates in the states of Maranhão, Piauí, Ceará, Paraíba, Pernambuco, Alagoas and Rio Grande do Norte and connects with the region’s leading ports, offering an important competitive advantage through opportunities for intermodal transportation solutions and made-to-measure logistics projects.
In 1997, we were awarded a concession granting the exclusive right to operate cargo transportation at the railway that belonged to Rede Ferroviária Federal S.A., or RFFSA, which we currently call Northeastern Railway System I, effective January 1, 1998, and the preference to operate cargo railway transportation in any new tracks of the Northeastern Railway System that the Brazilian government elected to build.
In 2005, we executed a letter of intent with the Brazilian government (the grantor of this concession) to enable the development of new tracks and certain other improvements of the Northeastern Railway System, in a project called “Nova Transnordestina.” The Nova Transnordestina project discussions resulted in the execution, in 2013 and 2014, of a Term of Adjustment of Conduct (Termo de Ajustamento de Conduta), or TAC, which settled all claims of non-compliance by us with the original concession agreement until 2012, and multiple agreements, including an investment agreement (discussed below) and a new concession, pursuant to which we were granted the right to develop and operate new tracks and the Northeastern Railway System management was divided in two sub-railway systems:
40550.00004
44
· Northeastern Railway System I, which is in operation by our subsidiary FTL, encompasses the RFFSA network, covering the stretches between the cities of São Luís – Altos, Altos – Fortaleza, Fortaleza – Souza, Souza – Recife/Jorge Lins, Recife/Jorge Lins – Salgueiro, Jorge Lins – Propriá, Paula Cavalcanti – Cabedelo and Itabaiana – Macau, with 4,238 km of railways, of which 1,191 km are operational and we are negotiating with the National Agency for Ground Transportation (Agência Nacional de Transportes Terrestres), or ANTT, to return the remainder. As of December 31, 2019, we held 92.38% of the capital stock of FTL and its concession extends until 2027, renewable for an additional 30 years. As of December 31, 2019, R$79 million in concession payments were outstanding over the remaining eight years of the concession.
· Northeastern Railway System II, which is under construction by our jointly controlled investee TLSA, will encompass the new network, covering the stretches between the cities of Eliseu Martins – Trindade, Trindade – Salgueiro, Salgueiro – Porto Suape, Salgueiro – Missão Velha and Missão Velha – Porto de Pecém, with an expected extension of 1,753 km that will connect the interior of Northeast Brazil to Pecém and Suape Ports. As of December 31, 2019, we held 47.26% of the capital stock of TLSA and its concession extends until the earlier of 2057 or the date when TLSA reaches a rate of annual return of 6.75% of its invested capital.
In September 2013, we entered into an investment agreement, or the TLSA Investment Agreement, with Valec Engenharia, Construções e Ferrovias S.A., or Valec, and the Northeast National Development Fund (Fundo Nacional de Desenvolvimento do Nordeste), or FDNE, two Brazilian government entities focused on infrastructure and the development of the northeastern region and our partners in TLSA. Under the TLSA Investment Agreement, we and our partners agreed on a budget of R$7.5 billion to complete the construction of the Northeastern Railway System II. A revised budget of approximately R$13.2 billion is under review by the partners of TLSA and subject to revision of the TLSA Investment Agreement, which, as of the date of this annual report, has not been formalized.
The TLSA Investment Agreement also provides for indicative terms and conditions, including amounts, under which Banco Nacional de Desenvolvimento Econômico e Social, or BNDES, agreed to provide long-term financing for the completion of Northeastern Railway System II. Although we have received indicative terms, the financing is subject to several conditions, including the satisfactory completion of internal and credit approval processes by lenders. If any of the conditions are not met, including final credit approval by the lenders in terms and costs reasonable to us, we may not be able to obtain the financing. The other long-term financing from FDNE and Fundo Constitucional de Financiamento do Nordeste, or FNE, has been already taken by TLSA.
In 2016, the Federal Court of Accounts (Tribunal de Contas da União), or TCU, initiated a proceeding questioning the legality of certain aspects of the concession contract for the Northeastern Railway System II, which has contributed to a slow pace of construction of the new tracks, and the ANTT has initiated a proceeding claiming TLSA did not comply with the terms of the concession contract for the Northeastern Railway System I.
Valec’s non-compliance with material obligations under the TLSA Investment Agreement has also contributed to a slow pace of construction of the new tracks and caused revision of the budget.
In the end of 2019, ANTT recommended the expiry of the Concession Contract for the Northeastern Railway System I, and, in first half of 2020, ANTT recommended the expiry of the Concession Contract for the Northeastern Railway System II. Both decisions were subject of requests to amend the decision by the Concessionaires and awaits a final decision by ANTT.
The ANTTs’ decisions does not take immediate effect and will only take effect once they have been considered and decreed by the Presidency of Republic, as well as decided in all final instances.
40550.00004
45
Port Facilities
Solid Bulks Terminal
We operate an integrated and modern logistics structure. Part of this structure includes the operation of TECAR through a concession renewed in 2015 and expiring in 2047.
TECAR is connected to road and rail systems across Southeastern Brazil and is one of the four port terminals that make up the Port of Itaguaí facilities. With a strategic location and a total area of 740,761 m², the terminal consists of a concrete molded berthing pier superposed on jacketed stilts connected to the mainland by an access bridge perpendicular to the berthing pier. Its backyard includes conveyor belts, an internal road system, bulk storage yards, a railway looping, as well as industrial and administrative facilities.
Our imports of coal and coke and exports of iron ore occur through this terminal. Under the terms of the concession, we have the obligation to unload at least 3.0 million tons of coal and coke annually and, as of 2020, to ship 38.5 million tons of iron ore annually.
Container Terminal
We indirectly own 100% of TECON, which has a concession to operate the container terminal at Itaguaí Port for a 25-year term expiring in 2026, which is renewable for an additional 25 years. As of December 31, 2019, approximately R$210 million of the cost of the concession was outstanding and payable over the remaining five years of the concession.
The Itaguaí Port is located in Brazil’s Southeast region, with all major exporting and importing areas in the states of São Paulo, Minas Gerais and Rio de Janeiro within 500 km. In 2017, this area represented more than 53% of the Brazilian GDP, according to the Brazilian Geography and Statistics Institute (Instituto Brasileiro de Geografia e Estatística), or the IBGE.
Favorable natural conditions, like natural deep waters and a low urbanization rate around the Port of Itaguaí, allow large vessels to operate and also allow for highly competitive prices for services rendered. After TECON’s investments in infrastructure and equipment, which increased our capacity to 440,000 containers (660,000 TEUs) per year, new improvements were achieved in 2018 and 2019, which increased the terminal’s service level and productivity, including maritime access and berths achieving certification for 15.4 meters in depth, including tides, which is the deepest in the East coast of South America. In 2019, we continued to invest in updating our operating facilities and complying with regulatory requirements.
In 2020, TECON is bidding for acquisition of two new quay cranes, nine RTGs (Rubber Tyred Gantry Cranes), two high capacity fork-lifts and a new IT system, which is to be delivered in the first half of 2020. TECON will invest in its expansion in order to increase its capacity by approximately 40%, which would make it one of the largest port terminals in Brazil, with a nominal capacity of 1,000,000 TEUs/year. This expansion project, which is under discussion with regulatory agencies, includes a 273m quay extension, with a total resulting length of 1,083 meters, acquisition of two new gantry cranes (ship-to-shore) for ultra large container carriers, acquisition of 10 RTGs, dredging of an access channel, turning basin/berth and construction of an overpass connecting its two areas.
In 2019, TECON moved 161,000 containers, 423,000 tons of steel products, 205,000 tons of general cargo, 626,000 tons of solid bulk and 1,700 vehicles, as compared to 247,000 containers, 778,000 tons of steel products and 15,000 tons of general cargo in 2018 and 188,000 containers, 989,000 tons of steel products and 9,000 tons of general cargo in 2017. The decrease in volume of containers in 2019 is mainly due to changes in the Asia export route implemented by shipowners that have decided to depart directly from the port of Santos in the state of São Paulo instead of TECON in the state of Rio de Janeiro. In order to mitigate the effects of this decrease in volume of containers, in 2019, TECON (i) began providing operations for another maritime import line from Pacific International Lines, (ii) provides operations for diversified cargo, including solid bulk, limestone, clay, pellet, gypsum, dolomite and large general cargo projects, and (iii) resumed operations for transportation of vehicles.
40550.00004
46
Our Cement Segment
Our cement segment is comprised of cement plant in Volta Redonda, in the state of Rio de Janeiro, and in Arcos, in the state of Minas Gerais.
In 2015, two new grinding facilities were delivered in Arcos, increasing its annual capacity by 2.3 million tons of cement. In 2016, a new clinker kiln line was delivered allowing CSN to achieve self-sufficiency in the production of this raw material.
Production
Our cement production takes place at Volta Redonda and Arcos and begins with the influx of raw materials comprising clinker, limestone, gypsum and slag. The clinker is produced in our plant in Arcos, where limestone, clay and other correctives such as iron ore and bauxite are ground in a raw mill and calcined inside the kiln. The clinker and limestone are stored in silos and warehouses and come in part from Arcos to Volta Redonda by rail. Slag is a by-product of iron and steel, produced in the blast furnace, and is also stored in the warehouse, arriving at the plant by road. CSN uses natural gypsum, which arrives at the plant by truck and is stored in the warehouse.
All transportation of raw materials within the plant is carried out by conveyor belts, placing inputs in scales according to a predefined formula and delivering them to the mills. There are two grinding lines in each of Volta Redonda and Arcos, resulting in an annual plant capacity of 2.4 million tons of cement in Volta Redonda and 2.3 million tons in Arcos. The mill has a hydraulic roller system, which uses pressure to grind the layer of material on the turntable. In Volta Redonda, a hot gas, derived from the combustion of natural gas or petroleum coke, is used in the mills to dry materials.
The types of cement we produce are: CP III-40 RS, CP II-E-32,CP II-E-40 and CP II-F 32 in bagged and bulk forms. Our Volta Redonda plant has four silos, two of them with 10,000 tons of capacity and two with 5,000 tons of capacity. Our Arcos plant has a silo with 7 chambers and 28,000 tons of total capacity. Cement can be shipped in bagged and bulk forms.
Our Energy Segment
Our energy segment comprises our generation plants, which support reduction of our production costs and exposure to fluctuations or availability of certain energy sources. The following are our energy segment related assets.
Thermoelectric Co-Generation Power Plant
We completed the construction of a 235.2 MW thermoelectric co-generation power plant at the Presidente Vargas Steelworks in December 1999. Aside from operational improvements, the power plant supplies our strip mills with electric energy, processed steam and forced air from the blast furnaces, benefiting the surrounding environment through the elimination of flares that burn steel-processing gases into the atmosphere. In addition, we installed a new turbine generator in 2014, which added 21 MW to our existing installed capacity. This turbine is located near our Blast Furnace No. 3, and uses the outlet gases from the iron making process to generate electricity.
Itá Hydroelectric Facility
We and ENGIE each own 48.75% of ITASA, a special-purpose company formed to own and operate, under a 30-year concession granted in 2000, 60.5% of the Itá hydroelectric facility on the Uruguay river in Southern Brazil. Itambé owns the remaining 2.5% of ITASA. ENGIE directly owns the remaining 39.5% of the Itá hydroelectric facility.
Itá has an installed capacity of 1,450 MW, and became fully operational in March 2001.
Igarapava Hydroelectric Facility
We own 17.9% of a consortium that built and has the right to operate for 30 years the Igarapava hydroelectric facility. Other consortium members are Aliança, L.D.R.S.P.E. Geracão de Energia e Participações Ltda. and AngloGold. The facility has an installed capacity of 210 MW.
40550.00004
47
Marketing, Organization and Strategy
Flat Steel
Our steel products are sold both domestically and abroad as a raw material for several manufacturing industries, including the automotive, home appliance, packaging, construction and steel processing industries.
Our sales approach involves establishing brand loyalty and achieving a reputation for quality products by developing relationships with our clients, focusing on their specific needs and providing tailor-made solutions.
Our commercial area is responsible for sales of all our products. This area is divided into two major teams, one focused on sales in international markets and the other on sales in the domestic market. The domestic market sales team covers seven market divisions: packaging, distribution network, automotive industry (automakers and auto parts), home appliances, general industry, construction and pipes. We also have a team responsible for selling all process residues, which include blast furnace slag, pitch and ammonia, which are widely used as inputs in chemical and cement industries.
The distribution network division is responsible for supplying large steel processors and distributors. In addition to independent distributors, we count with our own distributor, Prada Distribuição. The pipes division supplies oil and gas pipe manufacturers as well as industries that produce small diameter pipe and light profiles. The packaging division acts in an integrated way with suppliers, representatives of the canning industry and distributors to respond to customer needs for finished products. We supply the automotive division from a specialized mill, CSN Porto Real, and also by a portion of the galvanized material produced at Presidente Vargas Steelworks, thereby benefitting from a combined sales strategy.
Historically, our sales in international markets were primarily through international brokers. However, as part of our strategy to establish direct, longer-term relationships with end-users, we have decreased our reliance on these brokers and have instead focused on direct sales to more profitable international markets.
All of our sales are on an order basis and have an average delivery time of 45 days. As a result, our production levels closely reflect our order log book status. We forecast sales trends in both the domestic and international markets based on historical data and general economic outlooks. We have our own data systems to remain informed of worldwide and Brazilian market developments. Our management believes that a key to our success is maintaining our presence in international markets, which provide us flexibility to shift between domestic and international markets depending on how favorable conditions are.
Unlike other commodity products, steel is not traded on an exchange, nor is there uniform pricing, due to wide differences in size, quality and specifications. In general, we price exports based on international spot prices of steel at the time of sale in U.S. dollars or euros, depending on the destination. Sales are normally paid up front, or within 14 or 28 days, and, in the case of exports, usually backed by a letter of credit and an insurance policy. Sales are made primarily on cost and freight terms.
Sales by Geographic Region
In 2019, we sold steel products to customers in Brazil and in 22 other countries. The fluctuations in the portion of total sales assigned to domestic and international markets, which are presented in the table below, reflect our ability to adjust our sales in light of variations in the domestic and international markets, as well as domestic and international steel demand and prices.
The two main export markets for our products are Europe and North America, representing approximately 82% and 15%, respectively, of our export sales volume in 2019.
40550.00004
48
|
Sales of All Steel Products by Destination | ||||||||||||
|
(in thousands of tons and millions of R$) | ||||||||||||
|
2017 |
2018 |
2019 | ||||||||||
|
|
Tons |
% of Total |
Net Operating Revenues |
% of Total |
Tons |
% of Total |
Net Operating Revenues |
% of Total |
Tons |
% of Total |
Net Operating Revenues |
% of Total |
|
Brazil |
2,841 |
58% |
7,819 |
60% |
3,327 |
66% |
10,143 |
66% |
3,151 |
70% |
10,028 |
73% |
|
Export |
2,081 |
42% |
5,140 |
40% |
1,742 |
34% |
5,195 |
34% |
1,374 |
30% |
3,921 |
29% |
|
Total |
4,922 |
100% |
12,959 |
100% |
5,069 |
100% |
15,338 |
100% |
4,525 |
100% |
13,686 |
100% |
|
Exports by Region |
||||||||||||
|
Asia |
13 |
1% |
23 |
1% |
13 |
1% |
41 |
1% |
1 |
0% |
47 |
1% |
|
North America(1) |
651 |
38% |
1,931 |
44% |
393 |
23% |
1,472 |
28% |
205 |
15% |
561 |
14% |
|
Latin America |
180 |
19% |
507 |
22% |
113 |
6% |
370 |
7% |
44 |
3% |
332 |
8% |
|
Europe |
1,223 |
41% |
2,567 |
32% |
1,206 |
69% |
3,244 |
63% |
1,124 |
82% |
2,979 |
76% |
|
All Others |
14 |
1% |
36 |
2% |
16 |
1% |
58 |
1% |
0 |
0% |
2 |
0% |
_______________________
(1) Sales to Mexico are included in North America.
Sales by Product
The following table sets forth our sales breakdown by product in Brazil in the periods indicated:
|
CSN Domestic Sales Breakdown |
2017 |
2018 |
2019 |
|
Hot-Rolled Products |
34% |
34% |
35% |
|
Cold-Rolled Products |
18% |
19% |
18% |
|
Galvanized Products |
29% |
33% |
31% |
|
Tin Plates Products |
10% |
8% |
9% |
|
Long Steel |
8% |
6% |
7% |
Sales by Industry
We sell our steel products to manufacturers in several industries. The following table sets forth our breakdown by market segment of domestic volume shipped in the periods indicated:
|
Sales Breakdown |
2017 |
2018 |
2019 |
|
|
(in percentages of total domestic volume shipped) | ||
|
DistributionNetwork |
41% |
36% |
37% |
|
Industrial |
8% |
13% |
11% |
|
Packaging |
11% |
9% |
10% |
|
Automotive |
18% |
17% |
16% |
|
Home Appliances |
9% |
10% |
9% |
|
Construction |
13% |
14% |
17% |
We believe we have a particularly strong domestic and export position in the sale of tin plates products used for packaging in Latin America. Our customers for these products include some of the world’s most important food processing companies, as well as many small and medium-sized entities. We also maintain a strong position in the sale of galvanized products for use in the automobile manufacturing, construction and home appliance industries in Brazil and abroad, supplied by CSN Porto Real and CSN Paraná. No single customer accounts for more than 10% of our net operating revenues.
For further information on steel sales, see “Item 5A. Operating Results—Steel Markets and Product Mix” and “Item 5A. Operating Results—Results of Operations—Year 2019 Compared to Year 2018—Net Operating Revenues.”
Seasonality
Steel demand is stronger in the second quarter of each year and weaker in the last quarter. Nevertheless, our production is continuous throughout the year.
40550.00004
49
Long Steel – SWT
Our long steel products are sold both in Germany (about 30%) and other countries, mainly in Europe (60%), for industrial, infrastructure, civil construction and engineering industries.
Our sales approach is to establish brand loyalty and to maintain our reputation of high quality products and excellent delivery performance by developing long term relationships with our clients. SWT focuses on meeting specific customer needs, developing solutions for both low temperature and high temperature resistant applications, as well as optimized section shapes for special applications.
Our commercial area is responsible for sales of all of our products worldwide. This area is divided into the direct sales team which is organized in 13 agencies located in Germany and in our core markets in Europe, the commercial back office department (order management from entry via tracking to the final delivery and invoicing), logistics contracting (truck, rail, vessel, maritime, inventory worldwide) and a rail logistics department.
SWT does not possess its own distribution network, instead cooperating with the big steel distributors and traders in Europe and other countries. All of our sales are on an order-by-order basis. The delivery time is related to the logistics chain and varies between two to six weeks depending on Incoterm and section type. As a result, our production levels closely reflect our order log book status. We forecast sales trends in both the European and export markets based on the historical data available from the last two years and the general economic outlook for the near future. We believe that our presence in the export market outside of Europe gives us more flexibility to optimize production and maximize our profitability.
Sections are not sold based on uniform pricing in Europe, as wide differences exist in terms of size, quality and specifications. In general, exports are priced based on international spot prices of steel at the time of sale in U.S. dollars or euros, depending on the destination. Sales are normally paid within 30 days, and, in the case of exports, usually backed by a letter of credit and an insurance policy. All SWT businesses are 100% covered by Euler Hermes risk insurance, a bank guarantee or a letter of credit. Sales are made primarily on cost and freight terms.
Long Steel – Volta Redonda
In 2013, CSN started the production of long steel in Volta Redonda. This plant has production capacity of 500 kt/year when fully operational, providing the domestic market with products for civil and industrial construction.
Divided in wire rod, rebar CSN 50 and rebar CSN 25, the products were developed using high technology and in accordance with the highest quality and sustainability standards, with all tradition and reliability of our products.
The commercial team is comprised of its own sales force ready to meet all the needs of the market, not only the needs of small clients, but also the needs of large wholesales. Following the model already successfully deployed by us, in which we seek a diversified and pulverized service to our customers, we will be able to count on a real partner to boost our business.
In order to optimize the process, the product’s outflow will be made in operational synergy with the flat steel units, using the same distribution centers, strategically located so as to deliver to all national territory.
This is another addition for the products from our portfolio, which is already comprised of cement, structural section products derived by flat steel, such as tile, tube, among others, so as to offer a portfolio that thoroughly covers the civil construction segment.
Iron Ore
Iron ore products are commercialized by our commercial team located in Brazil, Portugal and Hong Kong. These three marketing units allow us to maintain close relations with our customers worldwide, understand the environment where they operate, monitor their requirements and provide all necessary assistance in a short period of time. Market intelligence analysis, planning and administration of sales are handled from Brazil by the staff in our São Paulo office, while our domestic sales team is located at Casa de Pedra mine, in the state of Minas Gerais.
40550.00004
50
We supply our iron ore to the steel industry, and our main destinations are Brazil, Europe and Asia. Prevailing and expected levels of demand for steel products directly affect demand for iron ore. Demand for steel products is correlated to many factors, such as GDP, global manufacturing production, urbanization, construction and infrastructure spending.
We believe our competitiveness has been improved by our customer service and market intelligence. It is paramount for us to have a clear understanding of our customers’ businesses in order to address their needs, surpass their expectations and build long-term relationships. We have a customer-oriented marketing policy and specialized local personnel in direct contact with our clients in order to help determine the mix that best suits each particular client.
The first step to our entry into the international iron ore market was taken in February 2007, with the completion of the first phase of the expansion of our coal seaport terminal in Itaguaí, in the state of Rio de Janeiro, which enabled us to also handle and export iron ore and to load from our own facilities the first shipment of our iron ore products.
In 2019, our iron ore sales reached 38.5 million tons, of which 34.9 million tons were sales to third parties and 3.6 million tons were sales to our steel mills, which represents an increase of 21% compared to 2018. Total mining net revenue increased 68% in 2019, mainly due to higher volumes sold. The share of mining segment revenue in our total net revenue increased from 25% in 2018 to 39% in 2019.
In 2019, 74% of our iron ore export sales went to the Asian market, mainly China, and 26% were sold in the European market. Of our total sales volume to third parties, 83% were sinter feed, 7% pellet feed and 10% lump ore.
As global iron ore markets are highly competitive, we focus on our flexibility, reliability and efficient manner of supplying iron ore to the world market.
Through our marketing offices, we have long-term relationships with most players in the steel industry in China, Japan, Taiwan, South Korea, Europe and Brazil.
Cement
We have a diverse client base of approximately 20,000 clients, including construction material stores, home centers, concrete producers, construction companies, mortar industries and cement artifact producers.
The focus of our sales strategy is on retail. In this segment, we have a strong presence in sales points, where we reinforce the quality of the product to final customers. The retail segment operates with a low level of inventory, and a significant percentage of repurchase in the month, which highlights the competitive advantage of CSN’s distribution centers.
Insurance
We and our subsidiaries maintain several types of insurance policies. These insurances are contracted in line with the risk management of our business and attempt to follow the market practices for similar activities. Coverage in such policies encompasses domestic and international (import and export) cargo transportation (by road, rail, sea or air), life insurance, personal accidents, health, auto insurance, D&O, general liability, CAR (construction and erection risks), trade credit insurance, surety, named perils, ports and terminal liabilities. These policies may not be sufficient to cover all risks we are exposed to.
We also have an insurance policy covering the operational risks, material damages and loss of profits of our following branches and subsidiaries: Presidente Vargas Steelworks, CSN Mineração and TECON. This policy was renewed with domestic and foreign insurers and reinsurers and is valid until June 30, 2020, with a limited indemnity of US$600 million (for an insured value of US$10.2 billion) with a deductible of US$385 million for material damages and 45 days to loss of profits.
40550.00004
51
Intellectual Property
We maintain a special unit for managing our intellectual property rights, which include trademarks, patents and industrial designs, ensuring adequate protection for us and the possibility of commercialization through technology transfer agreements. We also maintain cooperation agreements with universities and research institutes for the exchange of technical cooperation and developments related to new processes and/or products.
Competition in the Steel Industry
Both the worldwide and the Brazilian steel markets are intensely competitive. The primary competitive factors in these markets include quality, price, payment terms and customer service. Further, continuous advances in materials, sciences and resulting technologies have given rise to improvements in products such as plastics, aluminum, ceramics, glass and concrete, permitting them to serve as substitutes for steel for certain purposes.
Competition in the Brazilian Steel Industry
The primary competitive factors in the domestic market include quality, price, payment terms and customer service.
The following table sets forth the production of crude steel by Brazilian companies in the periods indicated:
|
|
2016 |
|
2017 |
|
2018 |
|
|
|
|
|
|
|
|
|
|
Production |
||||||
|
|
|
(in million tons) |
|
| ||
|
Gerdau |
6.8 |
|
6.9 |
|
6.6 |
|
|
Usiminas |
3.1 |
|
3.0 |
|
3.0 |
|
|
ArcelorMittal Tubarão |
7.0 |
|
7.1 |
|
7.0 |
|
|
CSN |
3.1 |
|
4.4 |
|
4.1 |
|
|
ArcelorMittal Aços Longos |
3.1 |
|
2.9 |
|
3.1 |
|
|
CSA |
4.2 |
|
4.5 |
|
4.6 |
|
|
Others |
4.3 |
|
5.9 |
|
7.0 |
|
|
Total |
31.6 |
|
34.7 |
|
35.4 |
|
|
Source: IABr |
|
|
|
|
|
|
_______________________
* 2019 data was not available as of the date of this annual report.
Competitive Position — Global
During 2019, Brazil maintained its place as the largest producer of crude steel in South America, with a production output of 32.2 million tons and a 2% share of total world production, according to data from the World Steel Association, or WSA. In 2019, Brazil maintained the ninth position in the global steel production ranking, accounting for 78% of total production in South America, approximately two thirds more than Mexico’s or 36% of the United States’ steel production.
We compete on a global basis with the world’s leading steel manufacturers. We have positioned ourselves in the world market with a product mix characterized by high margin and strong demand, such as tin plate and galvanized products. We have relatively low-cost and sufficient availability of labor and energy, and own high-grade iron ore reserves. These global market advantages are partially offset by costs of transporting steel throughout the world, usually by ship. Shipping costs, while helping to protect our domestic market, put pressure on our export price. To maintain our position in the world steel market in light of the highly competitive international environment with respect to price, our product quality and customer service must be maintained at a high level. See “Item 4B. Business Overview—Government Regulation and Other Legal Matters—Proceedings Related to Protectionist Measures” for a description of protectionist measures being taken by steel-importing countries that could negatively impact our competitive position.
Competitive Advantages of the Brazilian Steel Industry
Brazil’s principal competitive advantages are its abundant supply of low-cost, high-grade iron ore and energy resources. Brazil also benefits from a vast internal market with a large growth potential, a privatized industry making investments in plant and equipment and deep-water ports allowing the operation of large ships, which facilitates access to export markets.
40550.00004
52
Following an economic recession in 2015 and 2016, in 2017, Brazilian GDP increased by 1.0% leading to a recovery of volumes in the domestic market and, in parallel, price readjustments accompanying the strength of the international market. In 2018, the real’s depreciation against the U.S. dollar, flat steel production and increased household consumption were mainly responsible for the 1.1% increase in the Brazilian GDP. In 2019, exports of flat steel in Brazil decreased by 21% compared to 2018, mainly due to the economic crisis in Argentina, which is Brazil’s third largest export market, according to the Brazilian Ministry of Foreign Affairs (Ministério das Relações Exteriores).
Government Regulation and Other Legal Matters
Environmental Regulation
We are subject to Brazilian federal, state and municipal environmental laws and regulations governing air emissions, waste water discharges, solid and hazardous waste handling and disposal, wildlife management, forest maintenance, dangerous products transportation and preservation of traditional communities. We are committed to controlling the substantial environmental impact caused by our steelmaking, mining, cement and logistics operations, in accordance with international standards and in compliance with environmental laws and regulations in Brazil. We believe currently we are largely in compliance with applicable environmental requirements. While the Brazilian government has authority to promulgate environmental regulations setting forth minimum standards of environmental protection, state and local governments have the power to enact more stringent environmental regulations.
We are subject to regulation and supervision by the Brazilian Ministry of Environment, CONAMA, which is the federal body responsible for enacting technical regulations and environmental protection standards, and by the Brazilian Institute of Environment and Renewable Natural Resources (Instituto Brasileiro do Meio Ambiente e dos Recursos Naturais Renováveis – IBAMA), which is responsible for enforcing environmental laws at the federal level. The environmental regulations of the state of Rio de Janeiro, in which the Presidente Vargas Steelworks is located, are enforced by the INEA and Volta Redonda’s Environment Municipal Secretary. In the state of Minas Gerais, where our main mining operations are located, we are subject to regulations and supervision by the Environmental Policy Council (Conselho Estadual de Política Ambiental – COPAM), by the Regional Superintendent of Environment and Sustainable Development (Superintendência Regional de Meio Ambiente – SUPRAM), the Water Management Institute of Minas Gerais (Instituto Mineiro de Gestão das Águas – IGAM), the State Forestry Institute (Instituto Estadual de Florestas – IEF), and the State Environmental Foundation (Fundação Estadual do Meio Ambiente), or FEAM, which are the competent bodies of the Secretary of State for the Environment and Sustainable Development of Minas Gerais (Secretaria de Estado de Meio Ambiente e Desenvolvimento Sustentável), or SEMAD, the Superintendency of Priority Projects (Superintendência de Projetos Prioritários – SUPPRI) and the Municipal Secretariats of the Environment of Congonhas and Belo Vale. Specific goals and standards are established in operating permits or environmental accords issued to each company or plant. These specific operational conditions complement the standards and regulations of general applicability and are required to be observed throughout the duration of the permit or accord. The terms of such operating permits are subject to change and are likely to become stricter. All of our facilities currently have or are in the process of obtaining/renewing their operating permits.
Considering the current mining environment in Brazil following recent accidents of other mining companies in the cities of Mariana and Brumadinho, in the state of Minas Gerais, involving the breaking of upstream mining dams, which we also operate (but all of which are inactive), changes in applicable laws or regulations could require us to modify our technologies and operations and to make unexpected capital expenditures. Capital expenditures that we have already made may not generate the returns we expected, if any. In addition, new or more stringent environmental licensing requirements for our project operations, specifically for our dams, could be imposed on us and we may encounter delays in obtaining environmental or other operating licenses, or not be able to obtain or renew them. These events and additional costs may have a negative impact on us and the return from our projects and may render certain projects economically or otherwise unfeasible. For more information, see “Item 3D. Risk Factors—Risks Relating to Us and the Industries in Which We Operate—Our activities depend on authorizations, concessions, licenses and permits and changes in applicable laws, regulations or government measures could adversely affect us” and “Item 3D. Risk Factors—Risks Relating to Us and the Industries in Which We Operate—We are subject to environmental, health and safety incidents. Additionally, current, new or more stringent environmental, health and safety regulations applicable to us may result in liability exposure and increased capital expenditures.”
40550.00004
53
Environmental Expenditures and Claims
Promoting responsible environmental and social management is part of our business. We prioritize processes and equipment that offer modern and reliable technologies on monitoring and control of environmental risks. All environmental controls are audited to comply with Sarbanes-Oxley (SOX) guidelines, helping to mitigate the environmental risks of our operations.
We have an Environmental Management System, or EMS, certified by ISO 14001:2015 in Casa de Pedra Mine (Congonhas, MG), Presidente Vargas Steelworks (Volta Redonda, RJ), Porto Real (Porto Real, RJ), Bocaina Mine (Arcos, MG), CSN Paraná (Araucária, PR), TECON (Sepetiba, RJ) and Prada Distribution (Mogi das Cruzes, SP). The other sites are in process of implementing the EMS and have been following a corporate program for their progressive advancement following the guidelines of ISO 14001:2015.
In addition, we have established an internal committee for environmental management composed of professionals from different departments of CSN’s units, whose goal is to regularly discuss any problems that may arise and to identify risks and aspects of the operations in which the group can act pro-actively in order to prevent possible environmental harm. The environmental controls implemented since 2006 also contribute to mitigate environmental risks of CSN’s operations.
To further understand our potential social and environmental risks, we use mapping criteria in accordance with the Global Reporting Initiative (G4), or GRI, and the International Integrated Reporting Council (IIRC) methodology for all of our operations. Resulting data and indicators in environmental, social and economic categories allow us to track our performance, structure and monitor action plans, in an effort to improve and enhance our results.
Since 2010, we have been conducting a survey of greenhouse gas emissions at our main sites following the guidelines of the GHG Protocol. Additionally, in response to a law enacted by the state of Rio de Janeiro in 2012 and in effect since 2013, which requires steel making and cement industries to present action plans to reduce greenhouse gas emissions when renewing or applying for operational licenses, we are conducting such survey under the supervision of INEA. CSN intends to use this information in the development of a corporate carbon management program and related strategies to reduce emissions, as well as to identify current risks and opportunities for improvement.
We are adopting other strategies in order to improve our environmental commitment. We have received the Gold Standard of the GHG Protocol in each of the last five years, which confirms that we are in compliance with the standards imposed by the GHG Protocol and ensures that our GHG inventory was duly verified by a third party. We report the guidelines followed by our management with respect to climate change, supply chain and water resources to the Carbon Disclosure Project – CDP, and actively participates in the network NICOLE Brazil, a Brazilian leading organization that develops and promotes solutions for the management of contaminated areas. We also develop environmental education projects and promote understanding of the historical and natural patrimony, especially in the Arcos and CSN Mineração plants in Minas Gerais. To reaffirm our commitment to the transformation of values and attitudes through new habits and knowledge, we started the Environmental Education Program (PEA), an initiative managed by the CSN Foundation that uses art as a dialogue between students, teachers and employees.
In relation to our expenditures for environmental programs, we have continued with various actions aimed at increasing the efficiency of water usage in our production processes, with an emphasis on accomplishing a water reuse rate of, at least, 93% in the Presidente Vargas Steelworks.
Since our privatization, we have invested heavily in environmental protection and remediation programs. We had environmental expenditures (capitalized and expensed) of R$405 million in 2019, of which R$4 million relates to capital expenditures and R$400 million relate to operational expenditures (OPEX). Our total environmental expenditures were R$354 million in 2018. Our investments in environmental projects during 2019 were mainly related to: (i) operation, maintenance and retrofitting of environmental control equipment; (ii) development of environmental studies for permit applications; and (iii) human resources (environmental team), Environmental Management System, sustainability projects and compliance programs.
Our environmental guidelines also comprehend monitoring of our tailings dams, which are used to contain the waste of the beneficiation process of iron ore and to contain sediments from the waste dumps and mining activities. In addition, new regulations enacted in 2019 require decharacterization or decommissioning of dams constructed using the upstream method. On an annual basis, all our tailings dams are audited by independent audit companies, in accordance with technical standards and relevant legislation. For more information on the dams we operate, see “4B. Business Overview—Our Mining Segment—Dams.”
40550.00004
54
Since the accident in 2015 in the city of Mariana, in the state of Minas Gerais, involving the breaking of an upstream mining dam operated by another mining company, we changed our processes to reduce tailings deposits. Moreover, we have invested R$400 million in our dams and operations, and today we have concomitant operations of tailing dams and dry stacking.
In addition, following another accident involving the breaking of an upstream mining dam operated by another mining company in January 2019 in the city of Brumadinho, in the state of Minas Gerais, we have continued to execute our plan for the decommissioning or decharacterization of our six inactive tailings dams.
All of our upstream dams are inactive. Our only active tailings dam, Casa de Pedra, was constructed in the downstream method, which provides for enhanced resilience and safety. We do not operate any active upstream tailings dams.
Other Environmental Proceedings and Liabilities
Our main environmental issues as of December 31, 2019 were associated with recovery services at former coal mines decommissioned in 1989 in the state of Santa Catarina, due to previous operations in the Presidente Vargas Steelworks.
We record a provision for remediation costs and environmental claims when a loss is probable, the amount can be reasonably estimated and we may incur a legal obligation. This provision is included in our statements of income in “Other Operating (Expenses) Income.” We do not include in our reserves environmental liabilities related to ERSA, as these are contractually supported by its former owner.
As of December 31, 2019, we had provisions for environmental liabilities in the total amount of R$192.3 million, which we believe are sufficient to cover all probable losses. Such amount compares to R$198.4 million, as of December 31, 2018 and R$255.5 million as of December 31, 2017. The decrease in our provisions for environmental liabilities in 2019 as compared to 2018 is mainly due to the critical review of the remediation strategy and environmental management for external landfill areas, especially the areas of (i) the Southern Region of Santa Catarina State (environmental recovery of a former coal mine) under agreements with the Public Prosecutor’s Office seeking the recovery of environmental liabilities caused by coal mining in the Southern Region of Santa Catarina until the 1990s, and (ii) Estação Ecológica de Corumbá (management of a nature conservation area in the state of Minas Gerais), under our 2011 TAC, which we have observed and which are accompanied by the Public Prosecutor’s Office and by the competent environmental agency in compliance with the obligations in 2017.
Following the collapse of the Brumadinho dam, the Public Ministry of Minas Gerais filed a public civil action in April 2019 in the amount of R$524.4 million demanding that we design and implement a process for relocating all residents living downstream of our Casa de Pedra dam, including relocation of a child care center and school, as a result of alleged psychological disorders of the residents. We have responded that the Casa de Pedra dam does not present any non-compliance with applicable regulations and its stability and integrity have been confirmed by independent audits, including in September 2019 and, most recently, in January 2020. We have presented alternatives to the Public Ministry of Minas Gerais, including construction of a nursery and school, adherence to an integrated municipal dam safety plan, provision of psychological support services to the community and donation of two buses for transportation of children, among others. As of the date of this annual report, this lawsuit is in the procedural instruction phase.
On April 10, 2019, CSN Mineração, Minérios Nacional and the Federal Public Ministry signed a Preliminary Agreement Term to ensure compliance with the terms of the new legislation related to Tailings Dams, especially upstream structures, intensifying the independent audits structures.
For more information regarding environmental legal proceedings, please see “Item 8A. Consolidated Statements and Other Financial Information—Legal Proceedings—Other Legal Proceedings.”
40550.00004
55
The following table sets forth our provisions for environmental liabilities as of the dates indicated:
|
|
Amounts (in millions of R$) |
|
December 31, 2017 |
255.5 |
|
Term of Undertaking (TAC)(1) |
8.2 |
|
Decommissioned Coal Mines (Santa Catarina) |
(50.8) |
|
Landfills and other(2) |
(14.5) |
|
December 31, 2018 |
198.4 |
|
Term of Undertaking (TAC)(1) |
(16.2) |
|
Decommissioned Coal Mines (Santa Catarina) |
(8.5) |
|
Landfills and other(2) |
18.6 |
|
December 31, 2019 |
192.3 |
_______________________
(1) Refers to environmental compensation agreed in the TAC but not related to investments in equipment.
(2) Refers to an estimate calculation of recovery costs related to landfills remediation obligations.
Brazil – Mining Regulation
Under the Brazilian Federal Constitution of 1988, or the Brazilian Constitution, all mineral resources in Brazil belong to the federal government. The Brazilian Constitution, the Brazilian Mining Code enacted through Decree Law 227/1967, or the Mining Code, and mining regulations enacted through Decree 9,406/2018 impose various regulatory restrictions on mining companies relating to, among other things:
· the manner in which mineral deposits must be exploited;
· the health and safety of workers and the safety of residential areas located near mining operations;
· the protection and restoration of the environment;
· the prevention of pollution; and
· the support of local communities where mines are located.
Mining companies in Brazil can only prospect and mine pursuant to prospecting authorizations or mining concessions granted by the ANM, the regulatory agency under the Ministry of Mines and Energy of the Brazilian government. The ANM grants prospecting authorizations to a requesting party for an initial period of one to three years. These authorizations are renewable at the ANM’s discretion, provided that the requesting party is able to show that the renewal is necessary for proper conclusion of prospecting activities. Upon completion of prospecting activities and geological exploration at the site, the holder of the prospecting authorization must submit a final report to the ANM. If the geological exploration reveals the existence of a mineral deposit that is technically and economically exploitable, the grantee has one year (which the ANM may extend) from approval of the report by the ANM to apply for a mining concession by submitting an economic exploitation plan or to transfer its right to apply for a mining concession to an unrelated party. When a mining concession is granted, the holder of such mining concession must begin on-site mining activities within six months. The ANM grants mining concessions for an indeterminate period of time lasting until the exhaustion of the mineral deposit. After extraction, the mineral products that are specified in the concession belong to the holder of the concession. With the prior approval of the ANM, the holder of a mining concession can transfer it to an unrelated party that is qualified to own concessions. Under certain circumstances, mining concessions may be challenged by unrelated parties.
Following accidents involving the breaking of upstream mining dams operated by other mining companies in the cities of Mariana and Brumadinho, in the state of Minas Gerais, the ANM and Brazilian environmental regulatory authorities are applying more stringent environmental licensing requirements for mining project operations, specifically for dams. The ANM initially determined that all upstream dams in Brazil should be decommissioned or adapted to other methods by 2021 for inactive dams and by 2023 for active dams; however, in 2019, the ANM extended these deadlines as follows: (i) large upstream dams will have until 2025 for inactive dams, or 2027 for active dams, to completely shut down and (ii) small dams will have until 2022 to completely shut down. In addition, the ANM determined that all upstream dams in operation must be deactivated by 2021. For more information, see “Item 3D. Risk Factors—Risks Relating to Us and the Industries in Which We Operate—Our activities depend on authorizations, concessions, licenses and permits and changes in applicable laws, regulations or government measures could adversely affect us” and “Item 3D. Risk Factors—Risks Relating to Us and the Industries in Which We Operate—We are subject to environmental, health and safety incidents. Additionally, current, new or more stringent environmental, health and safety regulations applicable to us may result in liability exposure and increased capital expenditures.”
40550.00004
56
Mining Concessions
We operate our iron ore mining activities at Casa de Pedra mine under a mining concession known as Manifesto de Mina under Brazilian regulations, which gives us full ownership over the iron ore deposits existing within our property limits. Our iron ore mining activities at Engenho and Fernandinho mines are based on a concession by the Ministry of Mines and Energy, which grants us the right to exploit mineral resources from the mine for an indeterminate period of time lasting until the exhaustion of the mineral deposit. Our limestone and dolomite mining activities at the Bocaina mine and our tin mining activities at Ariquemes (ERSA mine) are based on concessions under similar conditions. See “Item 4D. Property, Plant and Equipment” for further information.
The Manifesto de Mina for Casa de Pedra mine and the Engenho mining concession are held by CSN Mineração, while the Fernandinho mining concession and the mining rights of Cayman and Pedras Pretas are held by Minérios Nacional. For further information, see “Item 4D. Property, Plant and Equipment.”
Mineral Rights and Ownership
The Mining Code, mining regulations and the Brazilian Constitution impose requirements on mining companies relating to, among other things, the manner in which mineral deposits are exploited, the health and safety of workers, the protection and restoration of the environment, the prevention of pollution and the promotion of the health and safety of local communities where the mines are located. The Mining Code also imposes certain notifications and reporting requirements.
Our mineral rights for Casa de Pedra mine include the mining concession (manifesto de mina), a beneficiation plant, roads, a loading yard and a railway branch, and are duly registered with ANM. We have also been granted by ANM easements in 19 mine areas located in the surrounding region. These areas are needed to expand our operations and as operating support areas.
In addition, we have obtained and are in compliance with all environmental licenses and authorizations for our operations and projects at Casa de Pedra mine.
Quality requirements (chemical and physical) are the key “modifying factors” in the definition of ore reserves at Casa de Pedra and were properly accounted for by our mine planning department.
The Brazilian government charges us a royalty known as CFEM, which calculation considers the gross revenue, excluding taxes over the selling. ANM is responsible for auditing the mining companies and to enact regulations to ensure the proper payment of CFEM.
The current CFEM rates vary between 1% and 3.5%, as follows:
· 1%: rocks, sand, gravel, clay and other minerals used in civil construction; ornamental rocks and mineral and thermal water;
· 1.5%: gold;
· 2%: diamond and other minerals;
· 3%: bauxite, manganese, niobium and rock salt;
· 3.5%: iron ore.
The Mining Code and ancillary mining laws and regulations also impose other financial obligations. For example, mining companies must compensate landowners for the damages and loss of income caused by the use and occupation of the land (either for exploitation or exploration) and must also share with the landowners the results of the exploration (in a rate of 50% of the CFEM). Mining companies must also enter into agreements with the Brazilian government to use public lands and eventually compensate the government for damages caused to such public lands. A substantial majority of our mines and mining concessions are on lands owned by us or on public lands for which we hold mining concessions.
40550.00004
57
Antitrust Regulation
We are subject to various laws in Brazil which seek to maintain a competitive commercial environment. The competition law and practice in Brazil are governed by Law No. 12,529, dated November 30, 2011, which came into force on May 30, 2012, and provided for significant changes in the Brazilian Antitrust System’s structure, including the creation of the Brazilian antitrust authority, Conselho Administrativo de Defesa Econômica, or CADE. Referred law introduced a mandatory pre-merger notification system, as opposed to the post-merger review system previously in force. The new CADE is now formed by an Administrative Tribunal of Economic Defense (Tribunal Administrativo de Defesa Econômica), a General-Superintendence (Superintendência-Geral) and a Department of Economic Studies (Departamento de Estudos Econômicos).
CADE is responsible for the control of anti-competitive practices in Brazil. If CADE determines that certain companies have acted collusively to raise prices, it has the authority to impose fines on the offending companies, prohibit them from receiving loans from Brazilian government sources and bar them from bidding on public projects. In addition, CADE has the authority to prevent or impose certain conditions to mergers and acquisitions and/or to impose certain restrictions or conditions on M&A transactions (for instance, require a company to divest assets or take other anti-dumping measures) should it determine that the industry in which it operates is insufficiently competitive or that the transaction creates a market concentration which can affect competition.
For further antitrust-related information, see “Item 8A. Consolidated Statements and Other Financial Information—Legal Proceedings.”
Proceedings Related to Protectionist Measures
Over the past several years, exports of steel products from various countries and companies, including Brazil and us, have been the subject of anti-dumping, countervailing duty and other trade related investigations from importing countries. These investigations resulted in duties that limit our access to certain markets.
In Brazil, we are subject to regulation and supervision by the Special Secretary of Foreign Trade and International Business (Secretaria de Comercio Exterior e Negócios Internacionais – SECINT), the Secretary of Foreign Trade (Secretaria de Comércio Exterior – SECEX) and the Subsecretary of Trade Defense and Public Interest (Subsecretaria de Defesa Comercial e Interesse Público - SDCOM). Worldwide, our exports are subject to the protectionist measures summarized below.
United States
Anti-dumping (AD) and Countervailing Duties (CVD). In the U.S., we are subject to regulation and supervision by the U.S. Department of Commerce, or DOC, the International Trade Commission, or ITC, the International Trade Administration, or ITA, and the Import Administration, or IA.
On July 28, 2015, AK Steel Corporation, ArcelorMittal USA LLC, Nucor Corporation, Steel Dynamics, Inc. and United States Steel Corporation filed antidumping and countervailing duty, or AD/CVD, petitions with respect to certain cold-rolled flat steel products from Brazil, China, India, Japan, Korea, Russia, and the United Kingdom at the ITC and the DOC. On August 24, 2015, the DOC initiated both AD/CVD investigations with respect to cold-rolled steel from Brazil. On September 10, 2015, the ITC announced affirmative preliminary injury determinations with respect to cold-rolled imports from Brazil.
On August 11, 2015, AK Steel Corporation, ArcelorMittal USA LLC, Nucor Corporation, SSAB Enterprises, LLC, Steel Dynamics, Inc., and United States Steel Corporation filed AD/CVD petitions with respect to certain hot-rolled steel products from Australia, Brazil, Japan, the Republic of Korea, the Netherlands, Turkey, and the United Kingdom. On September 9, 2015, the DOC initiated both AD/CVD investigations with respect to hot-rolled steel from Brazil. On September 24, 2015, the ITC announced affirmative preliminary injury determinations with respect to hot-rolled steel imports from Brazil.
In December 2015 and January 2016, the DOC reached preliminary determinations on the CVD investigation, these determinations imposed a rate of 7.42% for the exports of both hot-rolled and cold products. In February 2016, the DOC issued its preliminary determination on the anti-dumping investigation of cold-rolled products, which was reviewed in April 2016, in which the rate imposed on exports to the U.S. was 20.84% as of March 7, 2016. In March 2016, the DOC issued the preliminary determination on the AD investigation of hot-rolled products, in which the rate imposed was 33.91%. The final determination for AD and CVD of cold-rolled was issued in July 2016, imposing a rate of 11.31% for CVD and a rate of 19.56% for AD with a cash deposit of 15.49%. The final determination for hot-rolled products was issued in August 2016 and the rates imposed were 11.31% for CVD and 33.14% for AD with a cash deposit of 29.07%.
40550.00004
58
In addition to the AD and CVD measures, in March 2018, the U.S. government implemented Section 232 for U.S. national security purposes, which imposes an ad valorem tariff of 25% on imported steel. Brazil obtained a temporary suspension of the measure until the end of April 2018, which was extended to the end of May 2018. After the suspension, Brazil entered into an agreement with the U.S., which established quotas for semi-finished steel products based on average exports between 2015 and 2017 and quotas for finished steel products based on average exports between 2015 and 2017 with a reduction of 30%.
European Union
Anti-dumping. In the European Union, we are subject to regulation and supervision by the European Commission.
On July 7, 2016, the European Commission initiated an anti-dumping investigation concerning imports of certain hot-rolled flat steel products originating from Brazil, Iran, Russia, Serbia and Ukraine.
On July 29, 2016, the European Commission decided to limit its investigation to a reasonable number of exporting producers by using a sample in accordance with Article 17(1) of Regulation (EU) 2016/1036 of the European Parliament. The criteria used to select the sample was the volume of the product concerned exported to the European Union during the investigation period. As a result, three companies, Arcelor Mittal, CSN and Usiminas, collectively responsible for 97% of total steel exports from Brazil to the European Union, were chosen to represent Brazil in the investigation.
In January 2017, the European Commission issued a regulation establishing that imports of hot–rolled flat steel products originating from Brazil and Russia be subject to customs registration, meaning that all imports cleared after January 7, 2017 would be exposed to the risk of retroactive collection of duties against Brazil at the end of the investigation.
The preliminary determination was issued in April 2017 by the European Commission, which opted not to impose provisional duties on the imports of hot-rolled products from Brazil into the European Union.
In October 2017, the European Commission issued a final determination imposing definitive anti-dumping duties for the exports of hot rolled steel into the European Union from Brazil. The duties imposed were a tariff rate of 53.4 euros/ton for us, 54.5 euros/ton for Arcelor Mittal, 55.8 euros/ton for Gerdau and 63 euros/ton for Usiminas.
More recently, in response to the imposition of the U.S. Section 232, the European Union initiated, on April 26, 2018, an investigation into safeguards for 26 categories of steel products. In February 2019, a definitive E.U. regulation imposed safeguard measures on imports of certain steel products and imposed quotas for the next three years. The quota system is divided into specific quotas for countries which participation in exports is above 5% on all European Union imports, and global quotas for the countries which participation is below 5% of European Union imports. For more information, see “Item 3D. Risk Factors—Risks Relating to Us and the Industries in Which We Operate—Protectionist and other measures adopted by foreign governments could adversely affect our export sales.”
Canada
In Canada, we are subject to regulation and supervision by the Canadian International Trade Tribunal, the Canada Border Services Agency and the Anti-dumping and Countervailing Directorate.
Since 2001, Canada has had an anti-dumping order in place relating to hot-rolled sheets and coils from Brazil. However, we are not currently affected by this anti-dumping order since we do not export hot-rolled sheets or coils to Canada.
40550.00004
59
Overview of Steel Industry
World Steel Industry
The worldwide steel industry comprises hundreds of steelmaking facilities divided into two major categories, integrated steelworks and non-integrated steelworks, depending on the method used for producing steel. Integrated plants, which accounted for approximately 2/3 of worldwide crude steel production in 2013, typically produce steel by smelting in blast furnaces the iron oxide found in ore and refining the iron into steel, mainly through the use of basic oxygen furnaces or, more rarely, in electric arc furnaces. Non-integrated plants (sometimes referred to as mini-mills), which accounted for approximately 1/3 of worldwide crude steel production in 2013, produce steel by melting scrap metal, occasionally complemented with other metallic materials, such as direct reduction iron or hot-briquette iron, in electric arc furnaces. Industry experts expect that a lack of a reliable and continuous supply of quality scrap metal, as well as the high cost of electricity, may restrict the growth of mini-mills.
Steel continues to be the material of choice in the automotive, construction, machinery and other industries. Notwithstanding potential threats from substitute materials such as plastics, aluminum, glass and ceramics, especially for the automotive industry, steel continues to demonstrate its economic advantage.
In 2017, all the major steel producing countries increased their production levels. Consequently, global steel production reached 1.67 billion tons in 2017, a 5.3% increase compared to 2016. In addition, in 2018, nearly all top 10 steel producing countries increased their production levels and global steel production increased 5.8% as compared to 2017.
In 2019, global crude steel production was 1,869.9 mt, which represents an increase of 3.4mt, or 0.2%, compared to 2018, due to an increase in crude steel production in Asia and the Middle East, while crude steel production decreased in all other countries.
Brazilian Steel Industry
Since the 1940s, steel has been of vital importance to the Brazilian economy. During the 1970s, strong government investments were made to provide Brazil with a steel industry able to support the country’s industrialization boom. After a decade of investment scarcity in the sector in the 1980s, the government selected the steel sector as the first for privatization commencing in 1991, resulting in a more efficient group of companies operating today.
A Privatized Industry
During almost 50 years of state control, the Brazilian flat steel sector was coordinated on a national basis under the auspices of Siderbrás, the national steel monopoly. The state had far less involvement in the non-flat steel sector, which has traditionally been made up of smaller private sector companies. The larger integrated flat steel producers operated as semi-autonomous companies under the control of Siderbrás and were each individually privatized between 1991 and 1993. We believe that the privatization of the steel sector in Brazil has resulted in improved financial performance, as a result of increased efficiencies, higher levels of productivity, lower operating costs, a decline in the labor force and an increase in investment.
Domestic Demand
Historically, the Brazilian steel industry has been affected by substantial fluctuations in domestic demand for steel. Although national per capita consumption varies with GDP, fluctuations in steel consumption tend to be more pronounced than changes in economic activity. Crude steel consumption per capita in Brazil has decreased from 147 kilograms in 2010 to 92 kilograms in 2017. It is considered low when compared to the levels of some developed countries, such as the United States and Germany.
From 2010 to 2017, the Brazilian GDP grew on average 1.6% per year. In 2010, with the recovery of the global economy, domestic demand rose by 38.8% to 26.6 million tons. On the other hand, in 2011, domestic steel demand decreased 1.2% to 26.2 million tons, mainly due to high levels of inventory held by distributors and increased indirect imports. In 2012, the slowdown of the Brazilian economy led to another decrease in steel consumption of 17.6% to 21.6 million tons.
The Brazilian flat steel sector is shifting production to the higher value-added consumer durable sector. This sector is highly dependent on domestic consumer confidence, which, in turn, is affected by economic policies and certain expectations of the current government administration. Over the past years, automobile manufacturers made significant investments in Brazil. In 2009 and 2010, vehicle production recovered from the 2008 financial crisis in response to government incentives such as tax cuts. In 2012, the Brazilian market reached a record 3.8 million vehicles sold, reflecting a specific government measure, which reduced the industrialized products tax. On the other hand, exports decreased by 20.1%. In 2013, with the postponement of the reduction in industrialized products tax, the Brazilian market maintained the level of vehicles sales, but had an increase of 13.5% in exports, according to the Auto Manufacturers’ Association (Associação Nacional dos Fabricantes de Veículos Automotores), or ANFAVEA, data.
40550.00004
60
In 2014, the decrease in the family consumption and the employment level, allied with the end of government incentives resulted in a reduction of 7.1% in vehicles sales, respectively, according to the ANFAVEA data. In 2015 and 2016, vehicles sales decreased 26.6% and 20.2%, respectively, due to the economic recession, a large number of vehicles in stock and by the return of the industrialized products tax. In 2017, selling and automotive production increased 29.3% and 9.4% respectively, giving hope to the automotive market and steel companies. In 2018, although the Brazilian GDP increased 1.1% as compared to 2017, driven by increased household consumption, investments and services, it remained below expectations. In 2019, according to the Brazilian Steel Institute (Instituto Aço Brasil), or IABr, the apparent consumption of steel in Brazil decreased 2.7% as compared to 2018.
Market Participants
According to IABr, the Brazilian steel industry is composed of 32 mills managed by 12 corporate groups, with an installed annual capacity of approximately 51.5 million tons, producing a full range of flat, long, carbon, stainless and specialty steel.
Capacity Utilization
Installed capacity in Brazil in each of 2019 and 2018 was estimated at 51.5 and 50.4 million tons, respectively.
Exports/Imports
Brazil has been playing an important role in the export market, primarily as an exporter of semi-finished products. The Brazilian steel industry has taken several steps towards expanding its capacity to produce value-added products.
In 2017, 15.4 million tons of steel was exported from Brazil for US$8.0 billion. The Brazilian steel industry has experienced periods of overcapacity, cyclicality and intense competition during the past several years. Demand for finished steel products, as measured by domestic apparent consumption, has consistently fallen short of total supply (defined as total production plus imports). In 2017, steel imports increased by 23.9% as compared to 2016. In 2018, steel imports reached 2.4 million tons, which represented an increase of 3.3% as compared to 2017. In 2019, steel imports reached 2.3 million tons, which represented a decrease of 2.0% as compared to 2018. Steel exports decreased 12.8 million tons, or 8.0%, in 2019 as compared to 2018.
For information on the production by the largest Brazilian steel companies, see “Item 4B. Business Overview—Competition in the Steel Industry—Competition in the Brazilian Steel Industry.”
4C. Organizational Structure
We conduct our business directly and through subsidiaries. For more information on our organizational structure, see note 2.b. to our audited consolidated financial statements included elsewhere in this annual report.
4D. Property, Plant and Equipment
Our principal executive offices are located in the city of São Paulo, state of São Paulo, and our main production operations are located in the city of Volta Redonda, state of Rio de Janeiro. Presidente Vargas Steelworks, our steel mill, is an integrated facility covering approximately far square km and is located in the city of Volta Redonda, state of Rio de Janeiro. Our iron ore, limestone and dolomite mines are located in the state of Minas Gerais, which borders the state of Rio de Janeiro to the north. Each of these mines lies within 500 km of, and is connected by rail and paved road to, the city of Volta Redonda.
40550.00004
61
The table below sets forth certain material information regarding our properties as of December 31, 2019. For more information, see note 9 to our audited consolidated financial statements included elsewhere in this annual report.
|
Description |
Activity |
Country |
State |
City |
Title | |
|
Companhia Siderúrgica Nacional |
Presidente Vargas Steelworks |
Steel Mill |
Brazil |
Rio de Janeiro |
Volta Redonda |
Owned |
|
Companhia Siderúrgica Nacional |
CSN Paraná |
Galvanized and Pre-Painted Products |
Brazil |
Paraná |
Araucária |
Owned |
|
Companhia Siderúrgica Nacional |
CSN Porto Real |
Galvanized Steel Producer |
Brazil |
Rio de Janeiro |
Porto Real |
Owned |
|
Companhia Siderúrgica Nacional |
Service Center and Cement Distributor |
Distributor |
Brazil |
São Paulo |
Mogi das Cruzes |
Owned |
|
Companhia Siderúrgica Nacional |
Service Center |
Distributor |
Brazil |
Bahia |
Camaçari |
Owned |
|
Companhia Metalúrgica Prada |
Service Center |
Distributor |
Brazil |
São Paulo |
Mogi das Cruzes |
Owned |
|
Companhia Metalúrgica Prada |
Service Center |
Distributor |
Brazil |
São Paulo |
Bebedouro |
Owned |
|
Companhia Metalúrgica Prada |
Steel Can Manufacturer |
Packaging |
Brazil |
São Paulo |
São Paulo |
Owned |
|
Companhia Metalúrgica Prada |
Steel Can Manufacturer |
Packaging |
Brazil |
Minas Gerais |
Uberlândia |
Owned |
|
Companhia Siderúrgica Nacional |
Distribution Center |
Cement Distributor |
Brazil |
Minas Gerais |
Uberlândia |
Owned |
|
CSN Mineração |
Iron Ore Mine |
Iron Ore Mine |
Brazil |
Minas Gerais |
Congonhas |
Owned and Third Parties |
|
Companhia Siderúrgica Nacional |
Arcos Mine |
Limestone Mine |
Brazil |
Minas Gerais |
Arcos |
Owned |
|
CSN Mineração |
Ouro Preto Mine |
Iron Ore Mine |
Brazil |
Minas Gerais |
Ouro Preto |
Owned |
|
Minérios Nacional |
Fernandinho Mine |
Iron Ore Mine |
Brazil |
Minas Gerais |
Rio Acima |
Third Parties |
|
Estanho de Rondônia S.A. (ERSA) |
ERSA Office |
Tin Mine |
Brazil |
Rondônia |
Ariquemes |
Owned |
|
Estanho de Rondônia S.A. (ERSA) |
ERSA Mine |
Tin Mine |
Brazil |
Rondônia |
Itapuã do Oeste |
Owned |
|
Companhia Siderúrgica Nacional, LLC |
CSN LLC Office |
Office |
USA |
Illinois |
Chicago |
Third Parties |
|
Lusosider Aços Planos S.A. |
Lusosider |
Flat Steel Producer |
Portugal |
Seixal |
Seixal |
Owned |
|
Stahlwerk Thüringen Gmbh |
SWT |
Steel Profile |
Germany |
Saalfeld-Rudolstadt |
Unterwellenborn |
Owned |
|
Companhia Siderúrgica Nacional |
Thermoelectric Plant |
Energy |
Brazil |
Rio de Janeiro |
Volta Redonda |
Owned |
|
Companhia Metalúrgica Prada |
Metallic Packaging Plant |
Packaging |
Brazil |
Rio de Janeiro |
Resende |
Third Parties |
|
Companhia Metalúrgica Prada |
Metallic Packaging Plant |
Packaging |
Brazil |
Goiás |
Luziânia |
Third Parties |
|
Companhia Metalúrgica Prada |
Metallic Packaging Plant |
Packaging |
Brazil |
Rio Grande do Sul |
Pelotas |
Third Parties |
|
Companhia Metalúrgica Prada |
Metallic Packaging Plant |
Packaging |
Brazil |
Rio de Janeiro |
Barão de Juparanã |
Owned |
|
Companhia Metalúrgica Prada |
Distribution Center |
Steel Roll |
Brazi |
São Paulo |
Salto |
Third Parties |
|
Consórcio Usina Hidrelétrica de Igarapava |
Hydroelectric Facility |
Energy |
Brazil |
São Paulo |
Igarapava |
Owned |
|
Itá Energética S.A. |
Hydroelectric Facility |
Energy |
Brazil |
Rio Grande do Sul |
Aratiba |
Owned |
|
Companhia Siderúrgica Nacional |
Service Center |
Distributor |
Brazil |
Pernambuco |
Jaboatão dos Guararapes |
Third Parties |
|
Companhia Siderúrgica Nacional |
Distribution Center |
Distributor |
Brazil |
Rio Grande do Sul |
Canoas |
Third Parties |
|
Companhia Metalúrgica Prada |
Distribution Center |
Distributor |
Brazil |
São Paulo |
Piracicaba |
Third Parties |
|
Companhia Metalúrgica Prada |
Distribution Center |
Distributor |
Brazil |
Minas Gerais |
Contagem |
Third Parties |
|
Companhia Siderúrgica Nacional |
Steel Distribution Center |
Distributor |
Brazil |
Minas Gerais |
Contagem |
Third Parties |
|
Companhia Siderúrgica Nacional |
Distribution Center |
Cement Distributor |
Brazil |
Minas Gerais |
Contagem |
Third Parties |
|
Companhia Siderúrgica Nacional |
Distribution Center |
Cement Distributor |
Brazil |
Minas Gerais |
Juiz de Fora |
Third Parties |
|
Companhia Siderúrgica Nacional |
Companhia Siderúrgica Nacional |
Cement Distributor |
Brazil |
São Paulo |
Mauá |
Third Parties |
|
Companhia Siderúrgica Nacional |
Distribution Center |
Cement Distributor |
Brazil |
São Paulo |
Ribeirão Preto |
Third Parties |
|
Companhia Siderúrgica Nacional |
Distribution Center |
Cement Distributor |
Brazil |
São Paulo |
Guarulhos |
Third Parties |
|
Companhia Sideurgica Nacional |
Distribution Center |
Steel Distributor |
Brazil |
Rio Grande do Sul |
Caxias do Sul |
Third Parties |
|
CSN Mineração |
TECAR - Terminal de Carvão |
Iron Ore Shipment |
Brazil |
Rio de Janeiro |
Itaguaí |
Third Parties |
|
TECON |
TECON - Terminal de Conteiners |
Logistics |
Brazil |
Rio de Janeiro |
Itaguaí |
Third Parties |
|
Companhia Siderúrgica Nacional |
Cement Plant |
Cement Manufacturer |
Brazil |
Rio de Janeiro |
Volta Redonda |
Owned |
|
Companhia Siderúrgica Nacional |
Clinker and Cement Plant |
Cement Manufacturer |
Brazil |
Minas Gerais |
Arcos |
Owned |
|
Companhia Siderúrgica Nacional |
Long Steel Plant |
Long steel Manufacturer |
Brazil |
Rio de Janeiro |
Volta Redonda |
Owned |
|
MRS |
Railway |
Railway Logistics |
Brazil |
Several |
Several |
Third Parties |
|
FTL |
Railway |
Railway Logistics |
Brazil |
Several |
Several |
Third Parties |
|
TLSA |
Railway |
Railway Logistics |
Brazil |
Several |
Several |
Third Parties |
|
Companhia Siderúrgica Nacional |
Distribution Center |
Cement Distributor |
Brazil |
Rio de Janeiro |
Rio de Janeiro (Arará) |
Third Parties |
|
Companhia Siderúrgica Nacional |
Distribution Center |
Cement Distributor |
Brazil |
Rio de Janeiro |
Rio de Janeiro (Campo Grande) |
Third Parties |
|
Companhia Siderúrgica Nacional |
Distribution Center |
Cement Distributor |
Brazil |
São Paulo |
Americana |
Third Parties |
|
Companhia Siderurgina Nacional |
Distribution Center |
Cement Distributor |
Brazil |
Rio de Janeiro |
Queimados |
Third Parties |
|
Companhia Siderúrgica Nacional |
Distribution Center |
Cement Distributor |
Brazil |
São Paulo |
São José dos Campos |
Third Parties |
|
Companhia Siderúrgica Nacional |
Distribution Center |
Cement Distributor |
Brazil |
São Paulo |
Osasco |
Third Parties |
|
Companhia Siderúrgica Nacional |
Distribution Center |
Cement Distributor |
Brazil |
Rio de Janeiro |
Itaboraí |
Third Parties |
|
Companhia Siderurgica Nacional |
Distribution Center |
Cement Distributor |
Brazil |
Rio de Janeiro |
Barra Mansa |
Third Parties |
|
Companhia Siderúrgica Nacional |
Distribution Center |
Steel |
Brazil |
São Paulo |
Jacareí |
Third Parties |
40550.00004
62
For information on environmental issues with respect to some of the facilities described above, see “Item 4B. Business Overview—Government Regulation and Other Legal Matters—Environmental Expenditures and Claims.” In addition, for information on our plans to construct, expand and improve our facilities, see “—Acquisitions and Dispositions” and note 9 to our audited consolidated financial statements included elsewhere in this annual report.
Acquisitions and Dispositions
Usiminas
As of December 31, 2019, we owned, directly and indirectly, 20.3% of the preferred shares and 15.2% of the common shares of Usiminas resulting from various acquisitions in the market since mid-2010. For more information on the value of these assets, see “Item 5A. Operating Results—Critical Accounting Estimates—Impairment of Long-Lived Assets, Intangible Assets and Goodwill.” We are assessing strategic alternatives in relation to our investment in Usiminas. For more information on antitrust matters regarding our investment in Usiminas, see “Item 8A. Consolidated Statements and Other Financial Information—Legal Proceedings—Antitrust.”
40550.00004
63
In 2014, we entered into an agreement with CADE limiting our ability to exercise our voting rights in Usiminas. In March 2016, we applied for and were granted an exception to this agreement, pursuant to which we appointed, for a two-year term, two fixed and two alternate members on Usiminas’ board of directors and, for a one-year term, one fixed and one alternate member on Usiminas’ fiscal committee. CADE’s ruling granting us this exception is currently under litigation. Although the 2016 appointments are currently under litigation, there has been no judicial order overturning or otherwise suspending their effects. Since 2016, however, we have been unable to appoint new members to Usiminas’ fiscal committee as our request in 2017 for another exception was denied by CADE. Most recently, in April 2018, our latest request for exception was denied as well by CADE.
Companhia Siderúrgica Nacional, LLC
On June 5, 2018, Companhia Siderúrgica Nacional, LLC, our subsidiary organized in the United States with operations in stripping, cold rolling and galvanizing of flat steel, changed its corporate name to Heartland Steel Nacional, LLC and a new company was established under the name of Companhia Siderúrgica Nacional, LLC, or CSN LLC, as a wholly-owned subsidiary of Heartland Steel Processing, LLC. On June 28, 2018, CSN LLC, became an indirectly wholly owned subsidiary of ours.
On June 29, 2018, we sold Heartland Steel Processing, LLC to Steel Dynamics, Inc. for US$400.0 million. We continue our commercial import and distribution activities in the North American market through CSN LLC. This sale was part of our ongoing divestiture and deleverage plan.
CBSI – Companhia Brasileira de Serviços de Infraestrutura
In November 2019, we acquired from CKTR Brasil Serviços Ltda. 1,876,146 common shares of CBSI – Companhia Brasileira de Serviços de Infraestrutura, corresponding to 50% of its outstanding shares, for R$24.0 million, and we now hold the entirety of its share capital.
4E. Unresolved Staff Comments
None.
Item 5. Operating and Financial Review and Prospects
The following discussion should be read in conjunction with our audited consolidated financial statements as of December 31, 2019 and 2018, and for the years ended December 31, 2019, 2018 and 2017, included elsewhere in this annual report. Due to the adoption of IFRS 9 and IFRS 15 as of January 1, 2018, which we did not apply retroactively, financial information as of and for the year ended December 31, 2018 may not be comparable with financial information as of and for the year ended December 31, 2017. In addition, due to the adoption of IFRS 16 as of January 1, 2019, which we did not apply retroactively, financial information as of and for the year ended December 31, 2019 may not be comparable with financial information as of and for the years ended December 31, 2018 and 2017.
5A. Operating Results
Overview
Brazilian Macroeconomic Scenario
As a company with the vast majority of its operations and a large portion of its sales in Brazil, we are affected by the general economic conditions in Brazil. The rate of growth in Brazil is important in determining our own growth capacity and results of operations.
The following table sets forth select Brazilian economic indicators for the periods indicated:
40550.00004
64
|
Year ended December 31, | |||||
|
|
2017 |
|
2018 |
|
2019 |
|
|
| ||||
|
GDP growth (contraction) rate |
1.0% |
|
1.1% |
|
1.1% |
|
Inflation (IPCA)(1) |
3.0% |
3.7% |
4.3% | ||
|
Inflation (IGP-M)(2) |
(0.5)% |
|
7.5% |
|
7.3% |
|
CDI(3) |
6.9% |
6.4% |
6.0% | ||
|
Appreciation (depreciation) of the real against the U.S. dollar (end of period) |
1.5% |
|
17.1% |
|
(4.0)% |
|
Exchange rate at the end of period (US$1.00) |
R$3.308 |
R$3.875 |
R$4.030 | ||
|
Average exchange rate (US$1.00) |
R$3.193 |
|
R$3.656 |
|
R$3.945 |
|
Unemployment rate(4) |
12.7% |
12.3% |
11.0% | ||
|
Sources: IBGE, Fundação Getúlio Vargas, Central Bank and CETIP. | |||||
_______________________
(1) The IPCA is measured by the IBGE.
(2) The IGP-M is measured by the Fundação Getúlio Vargas.
(3) The Interbank Deposit Rate, or CDI, represents the average interbank deposit rate performed during a given day in Brazil (accrued as of the last month of the period, annualized).
(4) The unemployment rate (Pesquisa Nacional por Amostra de Domicílios) is measured by the IBGE.
Effects of Exchange Rate Fluctuations
Our export revenues are substantially denominated in U.S. dollars and our domestic revenues are denominated in Brazilian reais.
A significant portion of our cost of products sold is commoditized raw materials, the prices of which are denominated in U.S. dollars. The balance of our cost of products sold and our cash operating expenses (i.e., operating expenses apart from depreciation and amortization) are denominated in reais.
The depreciation of the real against the U.S. dollar has the following effects our results of operations:
· domestic revenues tend to be lower (in comparison with prior years), partially offset by an increase in foreign market sales;
· the impact of real denominated costs of products sold and operating costs tends to be lower; and
· financial expenses increase to the extent our exposure to U.S. dollar-denominated debt is not protected.
However, to the extent our future export transactions are hedged by our U.S. dollar denominated debt, we recognize our foreign exchange variation generated from debt used as a hedge instrument directly in net equity as other comprehensive income, which we charge against income at the time the future export transactions occur.
The appreciation of the real against the U.S. dollar has the following effects on our results of operations:
· foreign revenues tend to be lower (in comparison with prior years), partially offset by an increase in domestic market sales;
· the impact of real denominated costs of products sold and operating costs tends to be higher; and
· financial expenses decrease to the extent our exposure to U.S. dollar-denominated debt is not protected. However, to the extent our future export transactions are hedged by our U.S. dollar denominated debt, we recognize our foreign exchange variation generated from debt used as a hedge instrument directly in net equity as other comprehensive income, which we charge against income at the time the future export transactions occur.
The impact of fluctuations in the exchange rate of the real against other currencies on our results of operations can be seen in the “foreign exchange and monetary gain (loss), net” line in our income statement, although that amount is partially offset by the net financial income (expenses) attributable to the profit (or loss) on the derivative transactions of our foreign currency-denominated debt. In order to minimize the effects of exchange rate fluctuations, we may use derivative transactions, including currency swap and foreign currency option agreements. For a discussion on the possible impact of exchange rate fluctuations on our principal financial instruments and positions, see “Item 11. Quantitative and Qualitative Disclosures About Market Risk.”
40550.00004
65
Effects of Inflation and Interest Rates
Inflation measured by the IPCA index was 3.0%, 3.7% and 4.3% in 2017, 2018 and 2019, respectively, and (0.5)%, 7.5% and 7.3% as measured by the IGP-M index.
Inflation affects our financial performance by increasing our costs and expenses denominated in reais that are not linked to the U.S. dollar. Our cash costs and operating expenses are substantially denominated in reais and have tended to follow the Brazilian inflation ratio, because our suppliers and service providers generally increase or decrease prices to reflect Brazilian inflation. In addition, some of our real-denominated debt is indexed to take into account the effects of inflation. Under this debt, the principal amount is generally adjusted with reference to inflation indices. A significant portion of our real-denominated debt bears interest based on the CDI rate, which is partially adjusted for inflation. The CDI rate as of December 31, 2017, 2018 and 2019 was 9.9%, 6.4% and 4.4%, respectively.
Steel Market
For the years ended December 31, 2017, 2018 and 2019, our steel segment represented 70%, 68% and 55% of our net revenues, respectively, and 47%, 49% and 44% of our gross profit, respectively. In 2019, 72% of our steel revenues were in Brazil and 28% were abroad. In 2018, 66% of our steel revenues were in Brazil and 34% were abroad, as compared to 60% and 40%, respectively, in 2017.
According to the WSA, global crude steel production was 1.9 billion tons in 2019, or a 3.4% increase over 2018, and 1.8 billion tons in 2018, or a 4.4% increase over 2017. In 2019, China was responsible for 996.3 million tons, or about 53% of the global output, representing an increase of 8.3% as compared to 2018. Japan’s crude steel production reached 99 million tons, representing a decrease of 5% as compared to 2018. In the European Union, production reached 159 million tons in 2019, representing a decrease of 4.9% compared to 2018. In the U.S., crude steel production was 88 million tons in 2019, up by 1.5% on 2018. According to the global energy and mining consultancy company Wood Mackenzie, global capacity usage increased by 2.5% in 2019 to 75%.
According to IABr, domestic crude steel production was 32.2 million tons in 2019, or a 7.2% decrease over 2018, while rolled steel output was 22.2 million tons in 2019, or a 6.3% increase over 2018.
Domestic steel product consumption in Brazil was 20.6 million tons in 2019, or a 2.7% decrease over 2018, while domestic sales decreased 2.2% to 18.5 million tons. Annual imports to Brazil were 2.4 million tons, or a 1.9% decrease over 2018, and exports decreased 12.8 million tons, or 8.0%, in 2019 as compared to 2018.
Mining Market
For the years ended December 31, 2017, 2018 and 2019, our mining segment represented 25%, 26% and 39% of our net revenues, respectively, and 32%, 35% and 69% of our gross profit, respectively. In 2019, 91% of our mining revenues came from exports and 9% from the domestic market, as compared to 84% and 16%, respectively, in 2018, and 82% and 18%, respectively, in 2017. Following a stable market with an average iron ore price of US$71.32/dmt in 2017 and US$69.46/dmt (Platts, Fe 62%) in 2018, the seaborne iron ore supply faced several disruptions in 2019 from key players in the industry, including the Brumadinho accident in Brazil and adverse weather conditions in Australia. This scenario, coupled with significant investments in infrastructure and construction in China, resulted in iron ore prices surpassing US$126/dmt for the first time since 2014 and average iron ore prices increased 34.5% from 2018 to US$93.4/dmt in 2019.
Logistics, Port Logistics, Cement and Energy
The performance of our logistics, cement and energy segments is directly related to the performance of our steel and mining segments. For the years ended December 31, 2017, 2018 and 2019, these segments represented an aggregate of 14%, 12% and 10% of our net revenues, respectively, and an aggregate of 12%, 10% and 5% of our gross profit, respectively. A material portion of the revenues in these segments is derived from our steel and mining operations, which utilize our logistics network and energy output.
40550.00004
66
Steel Markets and Product Mix
Supply and Demand for Steel
Prices of steel are sensitive to changes in worldwide and local demand, which in turn are affected by worldwide and country-specific economic cycles, and to available production capacity. While the export price of steel (which is denominated in U.S. dollars or euros, depending on the export destination) is the spot price, there is no exchange trading of steel or uniform pricing. Unlike other commodity products, steel is not completely fungible due to wide differences in terms of size, chemical composition, quality and specifications, all of which impact prices. Many companies (including us) discount their list prices for regular customers, making actual transaction prices difficult to determine.
Historically, export prices and margins have been lower than domestic prices and margins because of the logistics costs, taxes and tariffs involved in exports – not all of which we can pass onto customers. The portion of our production that we export depends on domestic demand, exchange rate fluctuations and how favorable the prices that can be charged in the international markets are.
Product Mix and Prices
We forecast sales trends in both domestic and foreign markets monthly based on data from preceding months. We rely on our own information system to keep up with market developments in order to respond swiftly to fluctuations in demand.
We consider our flexibility in shifting between domestic and foreign markets, and our ability to monitor and optimize inventory levels in light of changing demand, as key to our success.
We have a strategy of increasing the portion of our sales attributable to higher value-added coated products, particularly galvanized flat steel and tin plate products. Galvanized products are directed at the automotive, construction and home appliance industries. Tin plate products are used by the steel packaging market.
40550.00004
67
|
Sales Volumes | |||||||||||
|
Tons |
% of Sales Volumes | ||||||||||
|
|
|
|
In Market* |
|
Total | ||||||
|
|
2017 |
2018 |
2019 |
|
2017 |
2018 |
2019 |
|
2017 |
2018 |
2019 |
|
Domestic Sales |
|
|
|
|
|
|
|
|
|
|
|
|
Slabs |
2 |
- |
- |
|
0% |
0% |
0% |
|
0% |
0% |
0% |
|
Hot-Rolled |
973 |
1,133 |
1,097 |
|
34% |
34% |
35% |
|
20% |
22% |
24% |
|
Cold-Rolled |
520 |
630 |
562 |
|
18% |
19% |
18% |
|
11% |
12% |
12% |
|
Galvanized |
818 |
1,091 |
963 |
|
29% |
33% |
31% |
|
17% |
22% |
21% |
|
Tin Plate |
295 |
281 |
303 |
|
10% |
8% |
10% |
|
6% |
6% |
7% |
|
Long Steel |
233 |
192 |
227 |
|
8% |
6% |
7% |
|
5% |
4% |
5% |
|
|
|
|
|
|
|
|
|
|
|
|
|
|
Subtotal |
2,841 |
3,327 |
3,151 |
|
100% |
100% |
100% |
|
58% |
66% |
70% |
|
|
|
|
|
|
|
|
|
|
|
|
|
|
Sales Abroad |
|
|
|
|
|
|
|
|
|
|
|
|
Slabs |
- |
- |
- |
|
0% |
0% |
0% |
|
0% |
0% |
0% |
|
Hot-Rolled |
74 |
140 |
1,097 |
|
4% |
8% |
35% |
|
1% |
3% |
24% |
|
Cold-Rolled |
77 |
57 |
562 |
|
4% |
3% |
18% |
|
2% |
1% |
12% |
|
Galvanized |
925 |
549 |
963 |
|
44% |
32% |
31% |
|
19% |
11% |
21% |
|
Tin Plate |
197 |
189 |
303 |
|
9% |
11% |
10% |
|
4% |
4% |
7% |
|
Long Steel |
808 |
806 |
227 |
|
39% |
46% |
7% |
|
16% |
16% |
5% |
|
|
|
|
|
|
|
|
|
|
|
|
|
|
Subtotal |
2081 |
1,742 |
3,151 |
|
100% |
100% |
100% |
|
42% |
34% |
70% |
|
|
|
|
|
|
|
|
|
|
|
|
|
|
Total Sales |
|
|
|
|
|
|
|
|
|
|
|
|
Slabs |
2 |
- |
2 |
|
|
|
|
|
|
|
|
|
Hot-Rolled |
1,047 |
1,273 |
1,152 |
|
|
|
|
|
|
|
|
|
Cold-Rolled |
597 |
688 |
587 |
|
|
|
|
|
|
|
|
|
Galvanized |
1,742 |
1,640 |
1,386 |
|
|
|
|
|
|
|
|
|
Tin Plate |
493 |
470 |
381 |
|
|
|
|
|
|
|
|
|
Long Steel |
1,042 |
999 |
1,018 |
|
|
|
|
|
|
|
|
|
|
|
|
|
|
|
|
|
|
|
|
|
|
Total |
4,922 |
5,069 |
4,525 |
|
|
|
|
|
|
|
|
*% of sales volume in the market means the participation of each product line in domestic sales and sales abroad.
40550.00004
68
|
Net Operating Revenues | |||||||||||
|
(in millions of R$) |
% of Net Operating Revenues | ||||||||||
|
|
|
|
In Market* |
|
Total | ||||||
|
|
2017 |
2018 |
2019 |
|
2017 |
2018 |
2019 |
|
2017 |
2018 |
2019 |
|
Domestic Sales |
|
|
|
|
|
|
|
|
|
|
|
|
Slabs |
2 |
- |
0 |
|
0% |
0% |
0% |
|
0% |
0% |
0% |
|
Hot-Rolled |
2,133 |
2,830 |
2,770 |
|
28% |
28% |
28% |
|
17% |
18% |
20% |
|
Cold-Rolled |
1,269 |
1,705 |
1,538 |
|
17% |
17% |
16% |
|
10% |
11% |
11% |
|
Galvanized |
2,466 |
3,792 |
3,446 |
|
32% |
37% |
35% |
|
19% |
25% |
25% |
|
Tin Plate |
1,348 |
1,349 |
1,545 |
|
18% |
13% |
16% |
|
11% |
9% |
11% |
|
Long Steel |
426 |
466 |
543 |
|
6% |
5% |
6% |
|
3% |
3% |
4% |
|
|
|
|
|
|
|
|
|
|
|
|
|
|
Subtotal |
7,643 |
10,143 |
9,843 |
|
100% |
100% |
100% |
|
60% |
66% |
72% |
|
|
|
|
|
|
|
|
|
|
|
|
|
|
Sales Abroad |
|
|
|
|
|
|
|
|
|
|
|
|
Slabs |
0 |
3 |
3 |
|
0% |
0% |
0% |
|
0% |
0% |
0% |
|
Hot-Rolled |
145 |
422 |
130 |
|
3% |
8% |
3% |
|
1% |
3% |
1% |
|
Cold-Rolled |
191 |
169 |
62 |
|
4% |
3% |
2% |
|
2% |
1% |
0% |
|
Galvanized |
2,662 |
1,894 |
1,364 |
|
53% |
36% |
35% |
|
21% |
12% |
10% |
|
Tin Plate |
523 |
655 |
303 |
|
10% |
13% |
8% |
|
4% |
4% |
2% |
|
Long Steel |
1,520 |
2,051 |
1,980 |
|
30% |
39% |
52% |
|
12% |
13% |
14% |
|
|
|
|
|
|
|
|
|
|
|
|
|
|
Subtotal |
5,040 |
5,195 |
3,843 |
|
100% |
100% |
100% |
|
40% |
34% |
28% |
|
|
|
|
|
|
|
|
|
|
|
|
|
|
Total Sales |
|
|
|
|
|
|
|
|
|
|
|
|
Slabs |
2 |
3 |
3 |
|
|
|
|
|
|
|
|
|
Hot-Rolled |
2,278 |
3,253 |
2,900 |
|
|
|
|
|
|
|
|
|
Cold-Rolled |
1,460 |
1,874 |
1,600 |
|
|
|
|
|
|
|
|
|
Galvanized |
5,128 |
5,687 |
4,810 |
|
|
|
|
|
|
|
|
|
Tin Plate |
1,871 |
2,004 |
1,849 |
|
|
|
|
|
|
|
|
|
Long Steel |
1,945 |
2,518 |
2,524 |
|
|
|
|
|
|
|
|
|
|
|
|
|
|
|
|
|
|
|
|
|
|
Total |
12,683 |
15,338 |
13,686 |
|
|
|
|
|
|
|
|
*% of net operating revenues in the market means the participation of each product line in domestic sales and sales abroad and considers only revenues from products, excluding other revenues.
Accounting for Mining Production Utilized by Our Steel Production
We are currently self-sufficient for the iron ore used in our steel production, except for pellets. We extract iron ore from our CSN Mineração mines, which in 2019 provided approximately 3.6 million tons of iron ore. We sell the remainder of our iron ore production to third parties in Brazil and abroad.
We record the cost of iron ore for our steel production on our income statement in cost of products sold at its extraction cost plus transport cost from the mine. In 2017, 2018 and 2019, these costs were R$835 million, R$880 million and R$834 million, respectively.
Critical Accounting Estimates
We prepare our consolidated financial statements in accordance with IFRS, as issued by the IASB.
In preparing our consolidated financial statements, we make estimates concerning a variety of matters, some of which are highly uncertain, and our estimates involve judgments we make based on the information available to us. In the discussion below, we have identified several of these matters for which our financial presentation would be materially affected if either (i) we used different estimates that we reasonably could have or (ii) in the future we change our estimates in response to changes that are reasonably likely to occur.
40550.00004
69
This discussion addresses only those estimates that we consider most important based on the degree of uncertainty and the likelihood of a material impact if we used a different estimate. There are many other uncertain matters for which we use estimates, but the reasonably likely effect of changed or different estimates is not material to our financial presentation.
Impairment of Long-Lived Assets, Intangible Assets and Goodwill
In accordance with IAS 36 Impairment of assets, we assess long-lived assets for impairment whenever events or changes in circumstances indicate that the carrying amount of an asset may not be recoverable. We measure recoverability of assets to be held and used by a comparison of the carrying amount of an asset to the estimated discounted future cash flows expected to be generated by the asset, or cash generating unit.
If the carrying amount of a cash generating unit exceeds its estimated future cash flows, an impairment loss is recognized in the amount by which the carrying amount of the asset exceeds the greater of the value in use or fair value of the cash generating unit.
A determination of the value in use or fair value of a cash generating unit requires management to make certain assumptions and estimates with respect to projected cash inflows and outflows related to future revenues and expenditures. These assumptions and estimates can be influenced by different external and internal factors, such as economic and industry trends, interest rates and changes in the marketplace. A change in the assumptions and estimates that we use could change our estimate of the expected future net cash flows and lead to the recognition of an impairment charge in our results of operations relating to our property, plant and equipment.
Assets that have an indefinite useful life, such as goodwill, are not subject to amortization and are assessed annually for impairment in accordance with IAS 36 Impairment of assets. We review assets subject to amortization for impairment whenever events or changes in circumstances indicate that their carrying amount may not be recoverable. We allocate goodwill to cash-generating units, for impairment testing purposes, that are expected to benefit from the business combination from which the goodwill arose, and the unit is not greater than the operating segment.
We assess financial assets for impairment at the end of each reporting period and we assess whether there is objective evidence that a financial asset or a group of financial assets is impaired.
Estimated Losses for Impairment of Accounts Receivable
In accordance with IFRS 9 – Financial Instruments, as of January 1, 2018, we implemented a new model of estimating the expected credit losses of accounts receivable, considering all possible loss events over the life of the receivables. We estimate these expected credit losses according to the loss rate by maturity range adopted by us since the initial recognition date of the account receivable. For the years ended December 31, 2016 and 2017, we did not use the expected losses model to estimate impairment of accounts receivable.
We consider customers’ history, default rate, financial condition and the opinion of our legal advisors in estimating expected losses for impairment of accounts receivable.
For further information on our estimates of expected losses for impairment of accounts receivable, as of January 1, 2018, see note 5 to our audited consolidated financial statements included elsewhere in this annual report.
Depreciation and Amortization
The basis for calculation of depreciation is the cost of the asset less the estimated residual value upon sale. While no specific depreciation method is recommended, the method chosen should be applied consistently for all significant components of assets and allocation of the depreciation should be on a systematic basis for each one of the accounting periods that best represents the realization of the economic benefits during the useful lives of assets.
40550.00004
70
We review the useful lives of assets every fiscal year for all of our units. See further details in note 9 to our audited consolidated financial statements included elsewhere in this annual report.
Fair Value of Business Combinations
We use the acquisition method to account for each business combination that we conduct. We measure the payment obligation transferred by acquiring an entity by the fair value of the assets transferred, liabilities incurred and equity instruments issued. The consideration transferred includes the fair value of any asset or liability resulting from a contingent consideration arrangement, where applicable. We recognize acquisition-related costs in profit or loss, as incurred. We initially measure identifiable assets acquired and liabilities assumed in a business combination at their fair values at the acquisition date.
Derivatives
IFRS 9 – Financial Instruments requires that, as of January 1, 2018, we recognize all derivative financial instruments as either assets or liabilities on our balance sheet and measure these instruments at fair value. We record changes in the fair value of derivatives in each period in our income statement in other comprehensive income, depending on whether we designate a transaction as an effective hedge. Our derivative instruments do not qualify for hedge accounting. We immediately record changes in the fair value of any of these derivative instruments in our income statement as financial income or financial expenses. We use derivatives for hedging purposes. We apply hedge accounting on our cash flow hedge in order to protect ourselves against exposure to changes in cash flows due to foreign currency risk associated with our debt and with highly probable forecast transactions that may affect our net results. Our hedging instrument are non-derivative monetary items. Therefore, we account for the effective portion of the foreign exchange gains and losses in other comprehensive income. We account for the ineffective portion of the gain or loss on the hedging instrument, if any, in income (loss). With respect to the fair value measurement, we must make assumptions as to future foreign currency exchange and interest rates.
Pension Plans
We sponsor certain pension plans for some of our retirees. We account for these benefits in accordance with IAS 19, Employee Benefits. The determination of the amount of our obligations for pension benefits depends on certain actuarial assumptions. These assumptions are described in note 26 to our audited consolidated financial statements and include, among others, the expected long-term rate of return on plan assets and increases in salaries. We calculate our net obligation regarding pension plans individually for each plan by estimating the value of the future benefit that the employees accrue in return for services provided in the current period and in prior periods; we then discount this benefit to its present value. The discount rate is the yield presented at the end of the reporting period for top line debt securities whose maturity dates approximate the terms and conditions of our obligations and which are denominated in the same currency as the one in which we expect the benefits will be paid. A qualified actuary calculation annually by using the projected unit credit method.
We recognize all the actuarial gains and losses resulting from pension plans immediately in other comprehensive income and then transfer them within equity. If the plan is extinguished, we recognize actuarial gains and losses in profit or loss.
Some of our entities offered a postretirement healthcare benefit to their employees as well. The expected costs of these benefits were accumulated during the employment period, and we calculate them using the same accounting method used for the pension plans.
Deferred Taxes
We compute and pay income taxes based on results of operations determined under Brazilian Corporate Law. We recognize a deferred income tax liability for all temporary tax differences, while we recognize a deferred income tax asset only to the extent that it is probable that future taxable profit will be available against which the deductible temporary difference can be utilized. We classify deferred tax assets and liabilities as long-term. We offset tax assets and liabilities if the entity has a legally enforceable right to offset them and they are related to taxes levied by the same taxing authority. If the criterion for offset of current tax assets and liabilities is met, deferred tax assets and liabilities will also be offset. We recognize the income tax related to items recognized directly in equity in the current period or in a prior period directly in the same account.
40550.00004
71
We regularly review deferred income tax assets for recoverability and only recognize these if we believe it is probable that the deferred income tax assets will be realized, based on historical taxable income, projected future taxable income and the expected timing of the reversals of existing temporary differences. If we operate at a loss or are unable to generate sufficient future taxable income, or if there is a material change in the actual effective tax rates or discount rates, the time period over which the underlying temporary differences become taxable or deductible, or any change in its future projections, we reduce the carrying amount of deferred income tax assets to the extent that it is no longer probable that sufficient taxable profit will be available to allow the benefit of part or all of that deferred income tax asset to be realized.
We annually perform a technical study to demonstrate if we will generate future taxable income and, if we have deferred tax assets recognized in our balance sheet, we assess if the future taxable income will support the realization of the tax credits. Even if we do not have deferred tax assets recognized in our balance sheet, we perform the study to have an estimate of the timeframe we will be able to recognize the tax credits and if any valuation allowance will continue to be applicable. This study is prepared at entity level, in accordance with the Brazilian tax legislation, and considers our projections for the parent company since the major part of our recent tax losses as well as the major part of temporary differences are generated in that entity and our subsidiaries do not have significant tax credits for purposes of this study.
Deferred tax assets on tax losses and temporary differences refer mainly to the following:
|
Nature |
Description |
|
Tax losses |
We incur tax losses at the parent company level because (i) of financial expenses over our leverage because we hold substantially all loans and financings at the parent company level and (ii) we presented a taxable income in 2018 at the parent company level. |
|
Temporary differences – foreign exchange differences |
We usually opt for taxation of foreign exchange differences on a cash basis. As a result, taxes are due and expenses are deductible when we settle the underlying asset or liability. |
|
Temporary differences – losses on Usiminas shares |
While we recognize changes in investments in Usiminas’ shares on an accrual basis, only upon divestment will we generate a tax or deductibility event. |
|
Temporary differences – other provisions |
We recognize various accounting provisions on an accrual basis, but their taxation occurs only at the time of their realization. This includes provisions for contingencies, impairment losses and environmental liabilities. |
We prepared the study based on our long-term business plan, which covers a period for which our management can reasonably make estimates. It considered several scenarios, which varied according to different macroeconomic and operating assumptions.
The model for projection of taxable income considers two main indicators:
· Pre-tax income, reflecting our projected EBITDA plus depreciation, other income and expenses and financial income (expenses); and
· Taxable income, which is our pretax income plus (less) expenses and income items that are taxable or deductible in fiscal years other than the current year (temporary differences).
In addition, we perform a sensitivity analysis of tax credits utilization considering changes in macroeconomic assumptions, operational performance and liquidity events.
On the other hand, as a negative factor, we have experienced income tax losses in most of the last five years resulting from the deterioration of the Brazilian political and macroeconomic environment, as well as due to our financial leverage, which has unbalanced the relationship between operating and financial results.
40550.00004
72
In this context, we follow a business plan to rebalance our financial and operating results, which main measures are:
· expansion of divestment efforts;
· reduction in financial leverage;
· increase in sales volume resulting in improved operating results, higher product sales prices and efficiency in controlling production costs; and
· reprofiling of our indebtedness through negotiations to extend the amortization periods and decentralization of debt by redirecting financing agreements to our subsidiaries according to the nature and application of resources.
With these measures in place, our management expects improved profitability and considers that gradual recognition of tax credits, using an initial projection period of less than 10 years, better reflects the expectation of utilization of the credits recognized in our tax books.
See further details in note 14.b. to our audited consolidated financial statements included elsewhere in this annual report.
Provision for Risks, Contingencies and Disputed Taxes
We record provisions for risks relating to legal proceedings with respect to which we deem the likelihood of an unfavorable outcome to be probable and the loss can be reasonably estimated. This determination is made based on the opinion of our internal and external legal counsel. We believe we properly recognize these contingencies in our financial statements in accordance with IAS 37 Provisions, Contingent Liabilities and Contingent Assets. We are also involved in judicial and administrative proceedings that are aimed at obtaining or defending our legal rights with respect to taxes that we believe to be unconstitutional or otherwise not required to be paid by us. We believe that these proceedings will ultimately result in the realization of contingent tax credits or benefits that can be used to settle direct and indirect tax obligations owed to Brazilian federal or state governments or to settle municipal tax obligations owed to the corresponding municipality. We do not recognize these contingent tax credits or benefits in our financial statements until realization of such gain contingencies has been resolved. This occurs when a final irrevocable decision is rendered by the courts in Brazil and the amounts recoverable can be measured at reasonable precision. Our accounting for contingent tax credits is in accordance with accounting for contingent assets under IAS 37. Our accruals include interest on the tax obligations that we may offset with contingent tax credits or benefits at the interest rate defined in applicable tax law. The recorded accruals for these disputed taxes and other contingencies may change in the future due to new developments in each matter, such as changes in legislation, irrevocable, final judicial decisions specific to us or changes in approach, such as a change in settlement strategy. For further information on the judicial and administrative proceedings in which we are involved, see “Item 8A. Consolidated Statements and Other Financial Information—Legal Proceedings.”
Mineral Reserves and Useful Life of Mines
We periodically evaluate and update our estimates of probable and proven reserves. We determine these reserves using generally accepted geological valuation techniques. The method of calculation requires the use of different assumptions by internal specialists and changes in some of these assumptions may have a significant impact on probable and proven iron ore reserves recorded and on the useful life of mines.
We depreciate tangible assets that are mine-specific over the shorter of the normal useful lives of such assets or the useful life of the mine.
We recognize exploration expenditures as expenses until we can establish the feasibility of mining activities, after which we capitalize subsequent development costs. Exploration and valuation expenditures include:
· Research and analysis of historical data related to area exploration;
· Topographic, geological, geochemical and geophysical studies;
· Determination of the mineral asset’s volume and quality/grade;
40550.00004
73
· Examination and testing of extraction processes and methods;
· Topographic surveys of transportation and infrastructure needs; and
· Market and financial studies.
We capitalize the development costs of new mineral deposits or capacity expansion in mine operations and amortize using the produced (extracted) units method based on the probable and proven ore quantities.
The development stage includes:
· Drillings to define the ore body;
· Access and draining plans; and
· Advance removal of overburden (top soil and waste material removed prior to initial mining of the ore body) and waste material (non-economic material that is intermingled with the ore body).
We capitalize stripping costs (the costs associated with the removal of overburden and other waste materials) incurred during the development of a mine, before production commences, as part of the depreciable cost of developing the property. We subsequently amortize these costs over the useful life of the mine based on proven and probable reserves.
We include stripping costs in the production phase in the cost of inventory, except when we undergo a specific extraction campaign to access deeper deposits than of the ore body. In these cases, we capitalize costs in noncurrent assets when the mineral ore deposit is extracted and we amortize these costs over the useful life of the ore body.
Additionally, we account for asset retirement obligations as the estimated cost for decommissioning, retirement or restoration of areas upon the termination of activities related to mining resources. We recognize the initial liability as discounted to the present value, and subsequently as an increase in expenses. We capitalize asset retirement obligations equivalent to the initial liability as part of the carrying amount of the asset, which we depreciate over the useful life of the asset.
Property, Plant and Equipment
In accordance with our accounting policy, we capitalize the cost of maintenance in operating assets when it does not occur annually and results in an increase in the useful life of the asset. We recognize depreciation on an accrual basis until the next maintenance event of the relevant asset. We charge expenditures for maintenance and repairs in operating assets, that are necessary to maintain assets under normal conditions of use, to operating costs and expenses, as incurred.
As of December 31, 2017, 2018 and 2019, we capitalized borrowing costs of R$91.9 million, R$71.6 million and R$117.2 million, respectively. These costs are basically estimated for our mining projects related mainly to the Casa de Pedra expansion and TECAR.
Leases
We adopted IFRS 16 – Leases as of January 1, 2019. According to IFRS 16, we determine, in initial recognition, the lease term or non-cancellable term which will be used in the measurement of the right-of-use and lease liabilities. We reassess the lease term when a material event or material change occurs in circumstances that are in our control as lessee and affect the non-cancellable term. As provided in IFRS 16, we adopt the exemption from recognition for lease agreements with a term of less than 12 months, or which underlying asset is of immaterial value.
At the initial date of the lease, we recognize the right to use the asset and the lease liability at present value. According to IFRS 16, we measure the asset right-of-use at cost, which includes the lease liability, initial costs, advance payments and estimated costs to dismantle, remove or restore. We measure the lease liability at the initial date of the lease considering the present value of the lease payments that are set on that date. We discount lease payments at the interest rate in the lease, or if the interest rate cannot be determined, an incremental borrowing rate, that is the rate of interest that a lessee would have pay to borrow the funds necessary to obtain a right to use an asset of similar value, as provided under IFRS 16.
40550.00004
74
In lease agreements for which we set the interest rate, this rate is considered implied in the agreements’ terms and is applied to discount the flow of future lease payments. In lease agreements with no defined interest rate, we apply the incremental borrowing rate, which we calculate based on consultations with banks that we have a relationship with and adjust it for expected inflation.
For further information on the impact of our adoption of IFRS 16, see note 13.a to our audited consolidated financial statements included elsewhere in this annual report.
Recently Issued Accounting Pronouncements Not Adopted by Us
The standards, amendments to standards and IFRS interpretations issued by the IASB that are not yet effective and were not early adopted by us for the year ended December 31, 2019 are described in note 2.a.a to our audited consolidated financial statements included elsewhere in this annual report.
Results of Operations
The following table presents certain financial information with respect to our results of operations for each of the years ended December 31, 2017, 2018 and 2019:
|
|
|
Year ended December 31, |
| ||||
|
Income Statement Data: |
|
2017 |
2018(1) |
2019(2) |
2019(3) | ||
|
|
|
(in millions of R$, except per share data) |
(in millions of US$, except per share data) | ||||
|
Net operating revenues |
|
18,525 |
22,969 |
25,436 |
6,311 | ||
|
Cost of products sold |
|
(13,596) |
(16,106) |
(17,263) |
(4,283) | ||
|
Gross profit |
|
4,929 |
6,863 |
8,173 |
2,028 | ||
|
Operating expenses |
|
|
|
|
| ||
|
Selling |
|
(1,815) |
(2,264) |
(2,343) |
(581) | ||
|
General and administrative |
|
(416) |
(494) |
(511) |
(127) | ||
|
Equity in results of affiliated companies |
|
109 |
136 |
126 |
31 | ||
|
Other expenses |
|
(647) |
(1,331) |
(2,407) |
(597) | ||
|
Other income |
|
824 |
4,036 |
504 |
125 | ||
|
Total |
|
(1,945) |
83 |
(4,631) |
(1,149) | ||
|
|
|
|
|
|
| ||
|
Operating income |
|
2,984 |
6,946 |
3,542 |
879 | ||
|
Non-operating income (expenses), net |
|
|
|
|
| ||
|
Financial income |
|
295 |
1,311 |
379 |
94 | ||
|
Financial expenses |
|
(2,759) |
(2,806) |
(2,510) |
(623) | ||
|
|
|
|
|
|
| ||
|
(Loss) income before taxes |
|
520 |
5,451 |
1,411 |
350 | ||
|
Income tax |
|
|
|
|
| ||
|
Current |
|
(359) |
(827) |
(1,564) |
(388) | ||
|
Deferred |
|
(50) |
577 |
2,398 |
595 | ||
|
|
|
|
|
|
| ||
|
Net income (loss) for the period |
|
111 |
5,201 |
2,245 |
557 | ||
|
|
|
|
|
|
| ||
|
Net income (loss) attributable to noncontrolling interest |
|
101 |
126 |
455 |
113 | ||
|
Net income (loss) attributable to Companhia Siderúrgica Nacional |
|
10 |
5,075 |
1,789 |
444 | ||
|
|
|
|
|
|
| ||
|
Basic earnings per common share |
|
0.00757 |
3.69498 |
1.29632 |
0.32161 | ||
|
Diluted earnings per common share |
|
0.00757 |
3.69498 |
1.29632 |
0.32161 | ||
_______________________
40550.00004
75
(1) Due to the adoption of IFRS 9 and IFRS 15 as of January 1, 2018, which we did not apply retroactively, financial information as of and for the year ended December 31, 2018 may not be comparable with financial information as of and for the year ended December 31, 2017.
(2) Due to the adoption of IFRS 16 as of January 1, 2019, which we did not apply retroactively, financial information as of and for the year ended December 31, 2019 may not be comparable with financial information as of and for the years ended December 31, 2017 and 2018. For a description of the impact of IFRS 16 on our results of operations, see note 13.a to our audited consolidated financial statements included elsewhere in this annual report.
(3) Translated solely for the convenience of the reader at the rate of R$4.0307 to US$1.00, which was the U.S. dollar selling rate as of December 31, 2019, as reported by the Central Bank. As of March 31, 2020, the U.S. dollar selling rate was R$5.199 to US$1.00, as reported by the Central Bank.
Year 2019 Compared to Year 2018
We maintain integrated operations in five business segments: steel, mining, logistics, cement and energy. We manage and control the performance of our various business segments considering our proportional interest in our jointly controlled entities, MRS and CBSI – Companhia Brasileira de Serviços de Infraestrutura (in which we acquired the remaining stake in November 2019), reflected in the figures presented below.
Our consolidated results for the years ended December 31, 2018 and 2019, by business segment are presented below:
|
R$ million |
Year ended | |||||||
|
Consolidated Results |
Steel |
Mining |
Port |
Railway |
Energy |
Cement |
Corporate Expenses/ Elimination |
Consolidated |
|
Net revenue |
|
|
|
|
|
|
|
|
|
Domestic market |
10,328 |
972 |
266 |
1,506 |
411 |
588 |
(2,719) |
11,353 |
|
Foreign market |
5,306 |
5,012 |
|
|
|
|
1,297 |
11,615 |
|
Total net revenue |
15,634 |
5,985 |
266 |
1,506 |
411 |
588 |
(1,421) |
22,969 |
|
Cost of sales and services |
(12,613) |
(3,586) |
(190) |
(1,049) |
(287) |
(544) |
2,163 |
(16,106) |
|
Gross profit |
3,021 |
2,399 |
76 |
457 |
124 |
44 |
742 |
6,863 |
|
General and administrative expenses |
(985) |
(145) |
(35) |
(106) |
(28) |
(96) |
(1,362) |
(2,758) |
|
Depreciation |
609 |
367 |
20 |
259 |
17 |
115 |
(213) |
1,175 |
|
Proportional EBITDA of joint venture |
|
|
|
|
|
|
568 |
568 |
|
Adjusted EBITDA* |
2,645 |
2,621 |
61 |
610 |
113 |
63 |
(265) |
5,849 |
40550.00004
76
|
R$ million |
Year ended | |||||||
|
Consolidated Results |
Steel |
Mining |
Port |
Railway |
Energy |
Cement |
Corporate Expenses/ Elimination |
Consolidated |
|
Net revenue |
|
|
|
|
|
|
|
|
|
Domestic market |
10,028 |
927 |
240 |
1,321 |
325 |
571 |
(2,462) |
10,950 |
|
Foreign market |
3,921 |
9,101 |
- |
- |
- |
- |
1,464 |
14,486 |
|
Total net revenue |
13,949 |
10,028 |
240 |
1,321 |
325 |
571 |
(998) |
25,436 |
|
Cost of sales and services |
(12,963) |
(4,396) |
(173) |
(1,030) |
(267) |
(608) |
2,174 |
(17,263) |
|
Gross profit |
986 |
5,631 |
67 |
291 |
59 |
(37) |
1,176 |
8,173 |
|
General and administrative expenses |
(835) |
(186) |
(35) |
(110) |
(29) |
(91) |
(1,568) |
(2,854) |
|
Depreciation |
700 |
476 |
31 |
388 |
17 |
140 |
(330) |
1,422 |
|
Proportional EBITDA of joint venture |
- |
- |
- |
- |
- |
- |
510 |
510 |
|
Adjusted EBITDA* |
851 |
5,922 |
63 |
569 |
47 |
11 |
(212) |
7,251 |
* We calculate EBITDA as net income (loss) for the period plus net financial income (expenses), income tax and social contribution, depreciation and amortization and results from discontinued operations. We calculate adjusted EBITDA as net income (loss) for the period plus net financial income (expenses), income tax and social contribution, depreciation and amortization and results of discontinued operations, plus other operating income (expenses), equity in results of affiliated companies and the proportionate EBITDA of joint ventures. EBITDA and adjusted EBITDA are not measures of financial performance recognized under Brazilian GAAP or IFRS and they should not be considered alternatives to net income (loss) as measures of operating performance, or as alternatives to operating cash flows, or as measures of liquidity. EBITDA and adjusted EBITDA are not calculated using a standard methodology and may not be comparable to the definition of EBITDA or adjusted EBITDA, or similarly titled measures, used by other companies.
Net Operating Revenues
Net operating revenues increased R$2,468 million, or 11%, from R$22,969 million in 2018 to R$25,436 million in 2019, mainly due to increased sales volume and iron ore prices in the mining markets.
Net domestic revenues decreased R$403 or 4%, from R$11,353 million in 2018 to R$10,951 million in 2019, while net revenues of exports and sales abroad increased 25%, from R$11,615 million in 2018 to R$14,486 million in 2019, driven by increased sales volume and realized iron ore prices.
Steel
Steel net operating revenues decreased R$1,685 million, or 11%, from R$15,634 million in 2018 to R$13,949 million in 2019 and sales volume decreased 11% from 5.1 million tons in 2018 to 4.5 million tons in 2019, mainly due to (i) our sale of our Heartland Steel Processing, LLC in 2018, and (ii) the slowdown of the global economy in 2019.
Mining
Mining net operating revenues increased R$4,043 million, or 68%, from R$5,985 million in 2018 to R$10,028 million in 2019, due to higher prices and record levels of iron ore production and sales. Sales volume increased 11%, from 34.8 million tons in 2018 to 38.5 million tons in 2019.
Logistics
In 2019, net operating revenues from railway logistics were R$1,321 million and net operating revenues from port logistics were R$240 million, while in 2018, net operating revenues from railway logistics were R$1,506 million and net operating revenues from port logistics were R$266 million. In 2019, TECON moved 161,000 containers, 423,000 tons of steel products, 205,000 tons of general cargo, 626,000 tons of solid bulk and 1,700 vehicles, as compared to 247,000 containers, 778,000 tons of steel products and 15,000 tons of general cargo in 2018.
40550.00004
77
Energy
Our net operating revenues from the energy segment decreased R$85 million, or 21%, from R$411 million in 2018 to R$325 million in 2019, mainly due to a decrease in energy available for sale as a result of an increase in our proprietary consumption and a decrease in market prices.
Cement
Cement net revenue decreased R$17 million, or 3%, from R$588 million in 2018 to R$571 million in 2019, mainly due to lower sales volume as a result of stoppages for scheduled maintenance in 2019.
Consolidated cost of products sold increased R$1,158 million, or 7%, from R$16,106 million in 2018 to R$17,263 million in 2019, mainly due to the 18.5% appreciation of the U.S. dollar against the real in 2019 that resulted in higher raw materials prices, as well as an increase in iron ore volume sold and maintenance of our Blast Furnace No. 3.
Steel
Consolidated steel costs of products sold were R$12,963 million in 2019, representing a 3% increase as compared to R$12,613 million in 2018, mainly due to lower proprietary production in 2019 of materials used in steel production as a result of maintenance of our Blast Furnace No. 3, which resulted in purchases of these materials from third parties at higher prices.
The following table sets forth a breakdown of our steel production costs in the periods presented. Except for coal and coke, which we import, and certain metals (such as aluminum, zinc and tin) with domestic prices linked to international prices, our production costs are mostly denominated in reais.
|
Steel Production Cost |
2019 |
2018 |
Variation 2019 v. 2018 | |||
|
R$ million |
R$/ton |
R$ million |
R$/ton |
R$ million |
R$/ton | |
|
Raw materials |
6,664 |
1,795 |
5,414 |
1,364 |
1,250 |
430.7 |
|
Iron ore |
834 |
225 |
881 |
222 |
(46) |
2.9 |
|
Coal |
1,226 |
330 |
1,508 |
380 |
(282) |
(49.8) |
|
Coke |
1,168 |
315 |
1,291 |
325 |
(123) |
(10.7) |
|
Coils |
557 |
150 |
0 |
0 |
557 |
150.2 |
|
Metals |
583 |
157 |
788 |
199 |
(74) |
(8.5) |
|
Outsourced slabs |
1,253 |
338 |
30 |
8 |
1,222 |
329.8 |
|
Pellets |
558 |
150 |
467 |
118 |
91 |
32.6 |
|
Scrap |
178 |
48 |
225 |
57 |
(48) |
(8.9) |
|
Other |
306 |
83 |
223 |
56 |
(48) |
(6.8) |
|
Labor |
990 |
267 |
912 |
230 |
78 |
36.9 |
|
Other production costs |
2,623 |
707 |
2,618 |
659 |
4 |
46.5 |
|
Energy / fuel |
1,114 |
300 |
1,179 |
297 |
196 |
68.8 |
|
Services and maintenance |
423 |
114 |
638 |
161 |
(320) |
(73.2) |
|
Tools and supplies |
364 |
98 |
354 |
89 |
10 |
9.0 |
|
Depreciation |
443 |
119 |
390 |
98 |
53 |
21.0 |
|
Other |
277 |
75 |
57 |
14 |
64 |
20.9 |
|
Total |
10,277 |
2,768.9 |
8,944 |
2,253 |
1,331 |
514.1 |
40550.00004
78
Mining
Our mining costs of products sold increased R$811 million, or 23%, from R$3,586 million in 2018 to R$4,396 million in 2019, mainly due to an increase in sales volume.
Logistics
Cost of services attributable to our logistics segment decreased R$36 million, or 3%, from R$1,239 million in 2018 to R$1,204 million in 2019, mainly due to adjustments in fuel prices.
Energy
Cost of products sold attributable to our energy segment decreased R$20 million, or 7%, from R$287 million in 2018 to R$267 million in 2019, mainly due to a decrease in energy available for sale as a result of an increase in our proprietary consumption.
Cement
Cost of products sold attributable to our cement segment increased R$63 million, or 12%, from R$544 million in 2018 to R$608 million in 2019, mainly due to an increase in the volume of slag purchased upon resuming operations of our Blast Furnace No. 3.
Gross profit increased R$1,310 million, or 19%, from R$6,863 million in 2018 to R$8,173 million in 2019, due to an increase of R$2,468 million in net revenues, which was partially offset by an increase of R$1,158 million in cost of products sold, as discussed above.
Steel
Gross profit in the steel segment decreased R$2,035 million, or 67%, from R$3,021 million in 2018 to R$986 million in 2019, due to the reasons discussed above.
Mining
Our gross profit in the mining segment increased R$3,232 million, or 135%, from R$2,399 million in 2017 to R$5,631 million in 2019, due to the reasons discussed above.
Logistics
Gross profit in the logistics segment decreased R$175 million, or 33%, from R$533 million in 2018 to R$358 million in 2019, due to the reasons discussed above.
Energy
Gross profit in the energy segment decreased R$65 million, or 53%, from R$124 million in 2018 to R$59 million in 2019, due to the reasons discussed above.
Cement
Gross profit (loss) in the cement segment decreased R$81 million, or 184%, from gross profit of R$44 million in 2018 to gross loss of R$37 million in 2019, due to the reasons discussed above.
Selling, General and Administrative Expenses
Selling, general and administrative expenses increased R$96 million, or 4%, from R$2,758 million in 2018 to R$2,854 million in 2019. Selling expenses increased R$79 million, or 4%, from R$2,264 million in 2018 to R$2,343 million in 2019, mainly due to an increase in average freight rates. General and administrative expenses increased R$17 million, or 3%, from R$494 million in 2018 to R$511 million in 2019.
40550.00004
79
Other Operating Income (Expenses)
Other operating income (expenses) decreased R$4,608 million from other operating income of R$2,705 million in 2018 to other operating expense of R$1,903 million in 2019.
Other operating income decreased R$3,532 million from R$4,036 million in 2018 to R$504 million in 2019, mainly due to the following events in 2018: (i) from other comprehensive income of the accumulated gain of R$1,656 million generated from Usiminas’ shares which we measured at fair value through profit or loss upon adoption of IFRS 9 as of January 1, 2018, (ii) R$1,164 million recognized from the sale of Heartland Steel Processing, LLC in June 2018 and (iii) the recognition of tax credits from the PIS and COFINS calculation basis of prior years in the amount of R$1,102 million in 2018 as compared to R$124 million in 2019, which tax credits we recognized as other operating income with a corresponding monetary correction as financial income.
Other operating expenses increased R$1,076 million from R$1,331 million in 2018 to R$2,407 million in 2019, mainly due to the realization of our cash flow hedge accounting in the amount of R$790 million in 2019 and the classification of operating idleness in the amount of R$547 million in 2019 due to maintenance of our Blast Furnace No. 3.
Equity in Results of Affiliated Companies
Equity in results of affiliated companies decreased R$10 million, or 7%, from R$136 million in 2018 to R$126 million in 2019, mainly due to a decrease in the results of TLSA and MRS.
Operating Income
Operating income decreased R$3,405 million, or 49%, from R$6,947 million in 2018 to R$3,542 million in 2019, due to the reasons discussed above.
Financial Income (Expenses), Net
Financial income (expenses) generated net financial expenses of R$2,131 million in 2019, as compared to net financial expenses of R$1,496 million in 2018, representing an increase in net financial expenses of R$635 million, mainly due to (i) recognition of monetary adjustment applicable on tax credits of PIS and COFINS of R$1,134 million in 2018 as compared to R$206 million in 2019, because we had overpaid PIS and COFINS since 2001 due to the inclusion of value-added tax in their bases of calculation for which we filed a tax claim and obtained a favorable judgment in 2018; (ii) R$120 million in interest incurred in 2019 on prepayments for sales of iron ore to be delivered over the course of five years; (iii) R$72 million in premiums paid in our repurchases of outstanding notes in 2019; and (iv) financial income of R$72 million in 2018 related to present value adjustments on accrued environmental liabilities, which we did not have in 2019. These effects were partially offet by fluctuation of the U.S. dollar/real exchange rate, which generated a foreign exchange gain of R$53 million in 2019 as compared to a foreign exchange loss of R$534 million in 2018.
Income tax expense in Brazil refers to federal income tax and social contribution. The statutory rates for these taxes applicable to the periods presented in this annual report were 25% for federal income tax and 9% for social contribution. Adjustments are made to income in order to reach the effective tax expense or benefit for each fiscal year. As a result, our effective tax rate between fiscal years is volatile.
At statutory rates, we had a tax expense of R$480 million in 2019 and R$1,853 million in 2018, which represents 34% of our income before taxes. After adjustments to meet the effective rates, we recorded income for income tax and social contribution of R$834 million in 2019, as compared to an expense of R$250 million in 2018. Expressed as a percentage of pretax income, our effective income tax rate was 5% in 2018 and (59)% in 2019. In 2019, adjustments to meet the effective income tax rate amounted to income of R$1,313 million, mainly due to a positive impact of R$1,530 million related to deferred income tax credits recognized in the year, which was partially offset by R$236 million in tax on the results of subsidiaries at different rates or not taxed.
40550.00004
80
For further information, see note 14.a. to our audited consolidated financial statements included elsewhere in this annual report.
It is not possible to predict future adjustments to federal income tax and social contribution statutory rates, as they depend on interest on shareholders’ equity, tax incentives and non-taxable factors, including income from offshore operations and tax losses from offshore operations.
Net Income (Loss) for the Year
In 2019, we recorded net income of R$2,245 million, as compared to R$5,201 million in 2018. The decrease of R$2,956 million was due to the reasons discussed above.
Year 2018 Compared to Year 2017
We maintain integrated operations in five business segments: steel, mining, logistics, cement and energy. We manage and control the performance of our various business segments considering our proportional interest in our jointly controlled entities, MRS and CBSI – Companhia Brasileira de Serviços de Infraestrutura, reflected in the figures presented below.
Our consolidated results for the years ended December 31, 2018 and 2017, by business segment are presented below:
|
R$ million |
Year ended December 31, 2017 | |||||||
|
Consolidated Results |
Steel |
Mining |
Port |
Railway |
Energy |
Cement |
Corporate Expenses/ Elimination |
Consolidated |
|
Net Revenue |
||||||||
|
Domestic Market |
7,819 |
829 |
238 |
1,417 |
408 |
487 |
(2,491) |
8,706 |
|
Foreign Market |
5,140 |
3,792 |
886 |
9,818 | ||||
|
Total net revenue |
12,959 |
4,621 |
238 |
1,417 |
408 |
487 |
(1,605) |
18,525 |
|
Cost of sales and services |
(10,538) |
(3,006) |
(157) |
(1,025) |
(285) |
(513) |
1,927 |
(13,597) |
|
Gross Profit |
2,421 |
1,615 |
81 |
392 |
123 |
(26) |
322 |
4,928 |
|
General and administrative expenses |
(964) |
(159) |
(28) |
(95) |
(27) |
(81) |
(877) |
(2,231) |
|
Depreciation |
659 |
491 |
16 |
295 |
17 |
122 |
(190) |
1,409 |
|
Proportional EBITDA of joint venture |
538 |
538 | ||||||
|
Adjusted EBITDA* |
2,116 |
1,947 |
69 |
592 |
113 |
15 |
(207) |
4,644 |
|
R$ million |
Year ended | |||||||
|
Consolidated Results |
Steel |
Mining |
Port |
Railway |
Energy |
Cement |
Corporate Expenses/ Elimination |
Consolidated |
|
Net revenue |
|
|
|
|
|
|
|
|
|
Domestic market |
10,328 |
972 |
266 |
1,506 |
411 |
588 |
(2,719) |
11,353 |
|
Foreign market |
5,306 |
5,012 |
|
|
|
|
1,297 |
11,615 |
|
Total net revenue |
15,634 |
5,985 |
266 |
1,506 |
411 |
588 |
(1,421) |
22,969 |
|
Cost of sales and services |
(12,613) |
(3,586) |
(190) |
(1,049) |
(287) |
(544) |
2,163 |
(16,106) |
|
Gross profit |
3,021 |
2,399 |
76 |
457 |
124 |
44 |
742 |
6,863 |
|
General and administrative expenses |
(985) |
(145) |
(35) |
(106) |
(28) |
(96) |
(1,362) |
(2,758) |
|
Depreciation |
609 |
367 |
20 |
259 |
17 |
115 |
(213) |
1,175 |
|
Proportional EBITDA of joint venture |
|
|
|
|
|
|
568 |
568 |
|
Adjusted EBITDA* |
2,645 |
2,621 |
61 |
610 |
113 |
63 |
(265) |
5,849 |
* We calculate EBITDA as net income (loss) for the period plus net financial income (expenses), income tax and social contribution, depreciation and amortization and results from discontinued operations. We calculate adjusted EBITDA as net income (loss) for the period plus net financial income (expenses), income tax and social contribution, depreciation and amortization and results of discontinued operations, plus other operating income (expenses), equity in results of affiliated companies and the proportionate EBITDA of joint ventures. EBITDA and adjusted EBITDA are not measures of financial performance recognized under Brazilian GAAP or IFRS and they should not be considered alternatives to net income (loss) as measures of operating performance, or as alternatives to operating cash flows, or as measures of liquidity. EBITDA and adjusted EBITDA are not calculated using a standard methodology and may not be comparable to the definition of EBITDA or adjusted EBITDA, or similarly titled measures, used by other companies.
40550.00004
81
Net Operating Revenues
Net operating revenues increased R$4,444 million, or 24%, from R$18,525 million in 2017 to R$22,969 million in 2018, mainly due to increased sales volume and prices in the steel and mining markets.
Net domestic revenues increased R$2,647 or 30%, from R$8,706 million in 2017 to R$11,353 million in 2018, while net revenues of exports and sales abroad increased 18%, from R$9,818 million in 2017 to R$11,615 million in 2018, driven by higher realized iron ore and steel prices and sales volume.
Steel
Steel net operating revenues increased R$2,675 million, or 21%, from R$12,959 million in 2017 to R$15,634 million in 2018, due to increases in steel prices across the chain throughout the year and, in the domestic market, average steel prices increased 13% as compared to 2017. Sales volume increased 3% from 4.9 million tons in 2017 to 5.1 million tons in 2018. Steel net domestic revenues increased R$2,510 million, or 32%, from R$7,819 million in 2017 to R$10,328 million in 2018.
Mining
Mining net operating revenues increased R$1,364 million, or 30%, from R$4,621 million in 2017 to R$5,985 million in 2018, due to an increase in prices and an increase of 7% in sales volume from 32.5 million tons in 2017 to 34.8 million tons in 2018.
Logistics
In 2018, net operating revenues from railway logistics were R$1,506 million and net operating revenues from port logistics were R$266 million, while in 2017, net operating revenues from railway logistics were R$1,417 million and net operating revenues from port logistics were R$238 million. Port logistics handled 584,000 tons of steel products, 210,000 tons of general cargo and 247,000 containers.
Energy
Our net operating revenues from the energy segment increased R$3 million, or 1%, from R$408 million in 2017 to R$411 million in 2018, mainly due to increased availability and energy sales in the free market.
Cost of Products Sold
Consolidated cost of products sold increased R$2,510 million, or 18%, from R$13,596 million in 2017 to R$16,106 million in 2018, due to higher raw materials prices, mainly due to the 18.5% appreciation of the U.S. dollar against the real in 2018, as well as an increase in volume sold.
Steel
Consolidated steel costs of products sold were R$12,613 million in 2018, representing a 20% increase as compared to R$10,538 million in 2017, mainly due to an increase in volume sold and in the price of raw materials and general maintenance.
|
Steel Production Cost |
2018 |
2017 |
Variation 2018 Vs 2017 | |||
|
R$ million |
R$/ton |
R$ million |
R$/ton |
R$ million |
R$/ton | |
|
Raw Materials |
5,414 |
1,364 |
4,524 |
1,072 |
890 |
292 |
|
Iron Ore |
881 |
222 |
835 |
198 |
46 |
24 |
|
Coal |
1,508 |
380 |
1,302 |
308 |
206 |
72 |
|
Coke |
1,291 |
325 |
935 |
221 |
356 |
104 |
|
Coils |
0 |
0 |
0 |
0 |
0 |
0 |
|
Metals |
788 |
199 |
690 |
163 |
98 |
36 |
|
Outsourced Slabs |
30 |
8 |
78 |
18 |
-48 |
-10 |
|
Pellets |
467 |
118 |
390 |
92 |
77 |
26 |
|
Scrap |
225 |
57 |
93 |
22 |
132 |
35 |
|
Other (1) |
223 |
56 |
201 |
48 |
22 |
8 |
|
Labor |
912 |
230 |
866 |
205 |
46 |
25 |
|
Other Production Costs |
2,618 |
659 |
2,416 |
572 |
202 |
87 |
|
Energy / Fuel |
1,179 |
297 |
982 |
233 |
197 |
64 |
|
Services and Maintenance |
638 |
161 |
628 |
149 |
10 |
12 |
|
Tools and Supplies |
354 |
89 |
316 |
75 |
38 |
14 |
|
Depreciation |
390 |
98 |
432 |
102 |
-42 |
-4 |
|
Other |
57 |
14 |
58 |
14 |
-1 |
0 |
|
Total |
8,944 |
2,253 |
7,806 |
1,849 |
1,138 |
404 |
40550.00004
82
Mining
Our mining costs of products sold increased R$580 million, or 19%, from R$3,006 million in 2017 to R$3,586 million in 2018, mainly due to an increase in sales volume and an increased share of ore bought from third parties.
Logistics
Cost of services attributable to our logistics segment increased R$57 million, or 5%, from R$1,182 million in 2017 to R$1,239 million in 2018, mainly due to adjustments in fuel prices.
Energy
Cost of products sold attributable to our energy segment remained stable and was R$287 million in 2018.
Gross Profit
Gross profit increased R$1,935 million, or 39%, from R$4,928 million in 2017 to R$6,863 million in 2018, due to an increase of R$4,444 million in net revenues, which was partially offset by an increase of R$2,510 million in cost of products sold, as discussed above.
Steel
Gross profit in the steel segment increased R$599 million, or 25%, from R$2,421 million in 2017 to R$3,021 million in 2018, due to the reasons discussed above.
Mining
Our gross profit in the mining segment increased R$784 million, or 49%, from R$1,615 million in 2017 to R$2,399 million in 2018, due to the reasons discussed above.
Logistics
Gross profit in the logistics segment increased R$60 million, from R$473 million in 2017 to R$533 million in 2018, due to the reasons discussed above.
Cement
Gross profit in the cement segment increased R$70 million, or 272%, from a loss of R$26 million in 2017 to a gain of R$44 million in 2018, due to the reasons discussed above.
40550.00004
83
Energy
Gross profit in the energy segment increased R$1 million, or 1%, from R$123 million in 2017 to R$124 million in 2018, due to the reasons discussed above.
Selling, General and Administrative Expenses
Selling, general and administrative expenses increased R$527 million, or 24%, from R$2,231 million in 2017 to R$2,758 million in 2018. Selling expenses increased R$449 million, or 25%, from R$1,815 million in 2017 to R$2,264 million in 2018, mainly due to an increase in average freight rates. General and administrative expenses increased R$78 million, or 19%, from R$416 million in 2017 to R$494 million in 2018, due to a change in the allocation of indirect expenses.
Other Operating Income (Expenses)
Other operating income (expenses) increased R$2,528 million from a net operating expense of R$177 million in 2017 to a net operating income of R$2,705 million in 2018.
Other operating income increased R$3,212 million from R$824 million in 2017 to R$4,036 million in 2018, mainly due to recognition of tax credits from the PIS and COFINS calculation basis of prior years in the amount of R$1,102 million, a gain generated from Usiminas’ shares measured at fair value through profit or loss in the amount of R$1,656 million and R$1,164 million recognized from the sale of Heartland Steel Processing, LLC.
Other operating expenses increased R$684 million, from R$647 million in 2017 to R$1,331million in 2018, mainly due to the revision of the annual transportation plan with MRS, which we recognized as operating expenses of R$104 million and cash flow hedge accounting realized in the amount of R$370 million.
Equity in Results of Affiliated Companies
Equity in results of affiliated companies increased R27 million, or 24%, from income of R$109 million in 2017 to R$136 million in 2018, mainly due to better results in MRS.
Operating Income
Operating income increased R$3,963 million, or 133%, from R$2,984 million in 2017 to R$6,947 million in 2018, due to the reasons discussed above.
Financial Income (Expenses), Net
Financial income (expenses) generated net financial expenses of R$1,496 million in 2018, as compared to net financial expenses of R$2,464 million in 2017, representing a decrease of R$968 million. This was mainly due to recognition of monetary adjustment applicable on tax credits of PIS and COFINS that had been over-collected since 2001. These overpayments were due to the Brazilian government’s calculation methodology for these taxes, which included the state value-added tax embedded in local sales invoices in the basis of taxable revenues. Along with other Brazilian companies, we disputed the inclusion of the state value-added tax in the basis of taxable revenues and, in 2018, we received a final favorable decision. Accordingly, we recognized these tax credits as other operating income and the corresponding monetary correction as financial income.
Income Taxes
Income tax expense in Brazil refers to federal income tax and social contribution. The statutory rates for these taxes applicable to the periods presented herein were 25% for federal income tax and 9% for social contribution. Adjustments are made to income in order to reach the effective tax expense or benefit for each fiscal year. As a result, our effective tax rate between fiscal years is volatile.
At statutory rates, we had a tax expense of R$1,853 million in 2018 and R$177 million in 2017, which represents 34% of our income before taxes. After adjustments to meet the effective rates, we recorded an expense for income tax and social contribution of R$250 million in 2018, as compared to an expense of R$409 million in 2017. Expressed as a percentage of pretax income, our effective income tax rate was 79% in 2017 and 5% in 2018. For the year ended December 31, 2018, adjustments to meet the effective income tax rate amounted to income of R$1,603 million, mainly due to recognition of R$972 million related to deferred income tax and social contribution on temporary differences, a positive impact of R$836 million related to reversal of tax credits previously recognized, which was partially offset by other minor items that comprise our reconciliation of our statutory income tax rate to our effective income tax rate, including adjustments related to equity results, results of subsidiaries taxed at different rates or not taxed, transfer price adjustments and tax incentives, among others, which net tax result was an expense of R$205 million.
40550.00004
84
For further information, see note 14 to our audited consolidated financial statements included elsewhere herein.
It is not possible to predict future adjustments to federal income tax and social contribution statutory rates, as they depend on interest on shareholders’ equity, tax incentives and non-taxable factors, including income from offshore operations and tax losses from offshore operations.
Net Income (Loss) for the Year
In 2018, we recorded net income of R$5,201 million, as compared to R$111 million in 2017. The increase of R$5,090 million was due to the reasons discussed above.
Hedge Accounting
We regularly export a large portion of our iron ore production, as well as finished steel products. Our revenue in reais from these exports is affected by the exchange rate fluctuations. We raise funds in foreign currencies through borrowings and financings. Our expenses in foreign currencies include imports of metallurgical coal and coke, which we use in our steelmaking process, among other production inputs. These foreign currency liabilities act as a natural hedge for oscillations in export revenues.
In order to better reflect the effect of exchange rate fluctuations on our financial statements, we designate part of our U.S. dollar-denominated liabilities as a hedge for future exports. As a result, we temporarily record the exchange rate variation arising from these liabilities directly in net equity as “other comprehensive income,” which amounted to R$1,256 million as of December 31, 2019. This amount is transferred to our income statement when exports occur, thus allowing impacts from the exchange rate fluctuations on liabilities and on export revenues to be recorded simultaneously. For more information, see note 12.b. to our audited consolidated financial statements included elsewhere in this annual report.
5B. Liquidity and Capital Resources
Overview
Our main uses of funds are capital expenditures and debt repayments. We have historically met these requirements with cash generated by our operating activities and through the issuance of short and long-term debt instruments. In 2019, we met our cash needs primarily through a combination of operating cash flow, cash and cash equivalents on hand and newly issued long-term debt instruments in order to repay the portion of our total debt maturing in 2019.
In addition, we periodically review acquisition and investment opportunities and, if a suitable opportunity arises, we conduct selected acquisitions and investments to implement our business strategy. We generally make our investments directly or through subsidiaries, jointly controlled entities or affiliated companies, and fund these investments through internally generated funds, the issuance of debt or a combination of these.
Sources of Funds and Working Capital
Cash Flows
Cash and cash equivalents decreased by R$1,159 million in 2019, compared to a decrease of R$1,164 million in 2018 and a decrease of R$1,460 million in 2017.
Operating Activities
Cash provided by operating activities was R$2,208 million in 2018 and R$4,872 million in 2019. The increase of R$2,664 million in cash provided by operating activities was mainly due to R$2,525 million in prepayments for sales of iron ore over the course of five years.
40550.00004
85
Investing Activities
Cash used in investing activities was R$98 million in 2018 and R$2,236 million in 2019. The increase of R$2,138 million in cash used in investing activities was mainly due to (i) an increase of R$899 million in capital expenditures from R$1,317 million in 2018 to R$2,216 million in 2019; and (ii) our receipt in 2018 of R$1,670 million from the sale of our U.S. subsidiary Heartland Steel Processing, LLC.
Financing Activities
Cash used in financing activities was R$3,257 million in 2018 and R$3,789 million in 2019. The increase of R$532 million in cash used in financing activities was mainly due to (i) an increase of R$6,755 million in payments on our outstanding debt from R$5,020 million in 2018 to R$11,775 million in 2019, (ii) amortization payments of R$95 million on our rights of use pursuant to IFRS 16, which we adopted as of January 1, 2019, (iii) R$1,920 million in dividends paid in 2019 as compared to R$502 million in 2018 and (iv) our receipt of R$213 million from our sale of shares held in treasury in 2018, which did not occur in 2019. These effects were partially offset by an increase of R$7,925 million in new borrowings, from R$2,144 million in 2018 to R$10,069 million in 2019.
Trade Accounts Receivable Turnover Ratio
Our trade accounts receivable turnover ratio, which is the ratio between our trade accounts receivable and our net operating revenues, measured in days of sales, decreased by one day to 34 days as of December 31, 2017, as compared to 27 days as of December 31, 2018 and 25 days as of December 31, 2019.
Inventory Turnover Ratio
Our inventory turnover ratio, which we measure by dividing our inventories by our annualized cost of products sold, measured in days of cost of products sold, was 95 days, 99 days and 92 days as of December 31, 2017, 2018 and 2019, respectively.
Trade Accounts Payable Turnover Ratio
Our trade accounts payable turnover ratio, which we measure by dividing our trade accounts payable by our annualized cost of products sold, measured in days of cost of products sold, was 62 days, 78 days and 84 days as of December 31, 2017, 2018 and 2019, respectively. This extension in payment terms reflects our renegotiation of commercial terms with our suppliers and contractors.
Liquidity Management
Given the capital intensive and cyclical nature of our industry and the generally volatile Brazilian macroeconomic environment, we retain cash on hand to run our operations and to meet our short-term financial obligations. As of December 31, 2019, cash and cash equivalents were R$1,089 million, as compared to R$2,248 million as of December 31, 2018 and R$3,412 million as of December 31, 2017.
As of December 31, 2019, our short-term and long-term indebtedness accounted for 18% and 82%, respectively, of our total debt, and the average life of our existing debt was equivalent to approximately eight years, considering a 40-year term for the perpetual bonds issued in September 2010.
Capital Expenditures and Investments
In 2019, we had capital expenditures and investments of R$2,216 million, mainly in:
· R$1,343 million in steel: major repairs on our Blast Furnace No.3; sintering modernization project to increase sinter production; sustaining investments in coke plants at Presidente Vargas Steelworks and its technological modernization projects; maintenance investments and spare parts in all our steel facilities;
· R$647 million in mining: projects in iron ore beneficiation to increase iron ore quality, reduce reliance on dams and turn part of waste into product; maintenance and safety measures on our tailings dams; maintenance investments and spare parts in all our mining facilities and ports; and
· R$87 million in cement: sustaining projects in the Volta Redonda and Arcos plants.
40550.00004
86
Additionally, in 2019, we focused and prioritized our investments in implementing sustaining projects to maintain our operational capability and to comply with environmental and safety requirements, and we invested R$540 million, mainly in:
· extraction of 1.3 Mtpy of pellet feed from plant tailings in our Casa de Pedra mine; and
· maintenance of our Blast Furnace No. 3 at Presidente Vargas Steelworks.
Of our total investments in 2019, R$842 million were for spare parts and R$834 million were for maintenance investments.
In 2018, we had capital expenditures and investments of R$1,229 million, mainly in:
· R$579 million in steel: sustaining investments in coke plants at Presidente Vargas Steelworks and its technological modernization projects, as well as maintenance projects in all our steel plants;
· R$480 million in mining: projects in iron ore beneficiation to increase iron ore quality, maintenance of tailings dams and sustaining investments in all our mining facilities; and
· R$72 million in cement: sustaining projects in the Volta Redonda and Arcos plants.
We expect to meet our liquidity requirements from cash generated from operations, and, if needed, the issuance of debt securities. For details on our Planned Investments see “Item 4D. Property, Plant and Equipment—Acquisitions and Dispositions.”
Debt and Derivative Instruments
As of December 31, 2019 and 2018, our total debt (composed of current and non-current portions of borrowings and financings) was R$27,967 million and R$28,827 million (including transactions costs), respectively, which represents 246% and 288% of shareholders’ equity as of December 31, 2019 and 2018, respectively. As of December 31, 2019, our short-term debt (composed of current borrowings and financings, which includes current portion of long-term debt) was R$5,126 million and our long-term debt (composed of non-current borrowings and financings) was R$22,841 million.
As of December 31, 2019, approximately 40% of our debt was denominated in reais and substantially all of the remaining balance was denominated in U.S. dollars.
Our policy is to protect ourselves against foreign exchange losses and interest rate losses on our debt, which we do through hedge accounting.
The following table sets forth our borrowings, financing and debentures, which we record at amortized cost:
|
Consolidated | ||||||||
|
Current liabilities |
Non-current liabilities | |||||||
|
As of December 31, 2019 | ||||||||
|
|
||||||||
|
Debt agreements in the international market |
|
|
|
|
| |||
|
Variable interest: |
||||||||
|
US$ |
|
|
|
|
|
|
|
|
|
Prepayment |
|
1,769,975 |
|
2,563,928 | ||||
|
Fixed interest: |
|
|
|
|
|
| ||
|
US$ |
|
|
| |||||
|
Bonds, Perpetual Bonds and ACC(1) |
|
|
|
2,047,032 |
10,177,517 | |||
|
EUR |
|
|
|
|
|
|
| |
|
Others |
|
223,204 |
147,241 | |||||
|
|
|
|
|
|
|
4,040,211 |
12,888,686 | |
|
|
||||||||
|
Debt agreements in Brazil |
|
|
|
|
|
| ||
|
Securities with variable interest in: |
|
|||||||
|
R$ |
|
|
|
|
|
|
|
|
|
BNDES/FINAME, Debentures, NCE and CCB |
|
1,086,985 |
10,049,783 | |||||
|
Securities with fixed interest in: |
|
|
|
|
| |||
|
R$ |
|
| ||||||
|
Intercompany |
|
|
|
|
|
25,038 |
|
- |
|
1,112,023 |
10,049,783 | |||||||
|
Total borrowings and financing |
|
|
|
5,152,234 |
22,938,469 | |||
|
Transaction costs and issue premiums |
(26,391) |
(97,276) | ||||||
|
Total borrowings and financing + transaction costs |
5,125,843 |
22,841,193 | ||||||
40550.00004
87
(1) In January 2020, we issued US$1,000 million in aggregate principal amount of 6.750% senior notes due 2028, part of the proceeds of which we used to repurchase US$433.6 million in aggregate principal amount of our outstanding 6.50% senior notes due 2020.
See further details in notes 11 and 12 to our audited consolidated financial statements included elsewhere in this annual report.
Maturity Profile
In February 2018 and August 2018, we renegotiated the amortization schedules of our debt with Banco do Brasil and Caixa Econômica Federal, our principal creditors, which debt represented approximately 24% and 25%, respectively, of our aggregate consolidated indebtedness as of December 31, 2017, so as to soften the amortization profiles and extend the maturities of these debts, the duration of which we increased from 26 months to 49 months and from 20 months to 38 months, respectively. As part of these renegotiations, we granted certain collateral, including in the form of pledges over a portion of shares we hold in Usiminas. We have agreed with these creditors to sell the pledged shares by the agreed deadline, and to use the proceeds from these sales for amortization payments under the amended financings.
In April 2019, we issued US$600 million in aggregate principal amount of 7.625% senior notes due 2026 and US$400 million in aggregate principal amount of additional 7.625% notes due 2023. We used the proceeds from these issuances to repurchase US$1,000 million in aggregate principal amount of our outstanding 6.875% senior notes due 2019 and 6.50% senior notes due 2020 issued by our subsidiaries CSN Islands XI Corp. and CSN Resources S.A., respectively.
In January 2019, we issued R$1,950 million in aggregate principal amount of our 10th series of non-convertible debentures with a five year maturity. We used all proceeds from this issuance to pay part of our outstanding debt with Caixa Econômica Federal.
In February 2019, CSN Mineração entered into an export prepayment agreement for the supply of approximately 22 million tons of iron ore over five years with Glencore International AG in an aggregate principal amount of US$500 million. In July 2019, CSN Mineração entered into an additional export prepayment agreement for the supply of approximately 11 million tons of iron ore in an aggregate principal amount of US$250 million.
In March 2019, we renegotiated our pre-export finance agreement entered into with Caterpillar Financial Services Corporation in an aggregate principal amount of US$148 million, which is secured by a pledge over certain equipment.
In September 2019, we entered into agreements for US$150 million in aggregate principal amount of pre-export finance and ACC (Adiantamento sobre Contrato de Câmbio) with Bank of China, maturing in 2024.
In September 2019, we issued R$278 million in aggregate principal amount of NCE (Nota de Crédito à Exportação) with Bradesco, maturing in 2023. We also entered into a swap agreement with Bradesco for the same notional amount and maturity of the NCE.
In November 2019, CSN Mineração entered into an agreement for US$50 million in aggregate principal amount of pre-export finance with J.P. Morgan, maturing in 2021.
40550.00004
88
The following chart sets forth our debt maturity profile as of December 31, 2019:
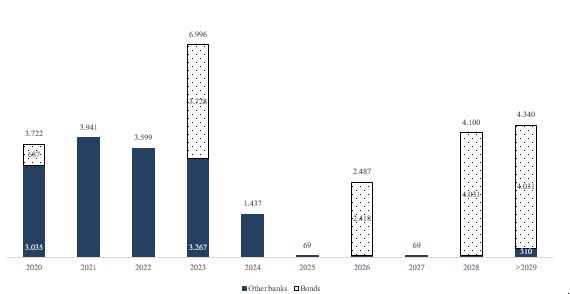
The table below sets forth the maturity profile of our long-term debt as of December 31, 2019, gross of transaction costs and premiums on issuance.
|
Maturity |
|
Principal Amount |
|
|
|
(in thousands of R$) |
|
2021 |
|
3,576,306 |
|
2022 |
|
3,311,843 |
|
2023 |
|
7,378,252 |
|
2024 |
|
1,640,183 |
|
2025 |
|
68,595 |
|
After 2025 |
|
2,932,590 |
|
Perpetual bonds |
|
4,030,700 |
|
Total |
|
22,938,469 |
In January 2020, we issued US$1,000 million in aggregate principal amount of 6.750% senior notes due 2028, part of the proceeds of which we used to repurchase US$433.6 million in aggregate principal amount of our outstanding 6.50% senior notes due 2020.
5C. Research and Development and Innovation
We have over 60 years of experience in research, development and innovation and were the first Brazilian steelmaker to produce coated and pre-painted steel.
We aim to provide an innovative approach to our operations in each of our business segments and CSN Inova and our Research and Development Center, or R&D Center, are entirely dedicated to providing innovative solutions.
Established in 2018, CSN Inova is responsible for leading and disseminating our innovation strategy and processes throughout our business segments by presenting new methodologies to address the challenges we face, leading our digital developments and searching for new business development opportunities.
Our R&D Center, located in Volta Redonda, counts with our product development management team to develop new products to increase our competitiveness. This team seeks to optimize our product mix and to expand our product portfolio in order to gain market share across our different business segments, as well as to implement new technologies for our production processes.
40550.00004
89
Our R&D Center comprises 15 laboratories that conduct analysis related to the physical, chemical, mechanical and metallurgical characteristics of our steel and other alloys, with advanced equipment such as optical and scanning electron microscopy. We also have a laboratory dedicated to environmental monitoring, which is certified by INEA.
5D. Trend Information
Given the global macroeconomic situation as of the date of this annual report resulting from the spread of COVID-19 and government measures to address it, while we cannot foresee the impacts on our markets for 2020, we generally expect an adverse impact on the demand environment as compared to 2019 and, consequently, a decrease in global steel prices and iron ore prices. For more information, see “Item 3D. Risk Factors—Risks Relating to Us and the Industries in Which We Operate—The outbreak of communicable diseases such as the ongoing COVID-19 outbreak on a global scale may affect investment sentiment, cause operational disruptions and result in sporadic volatility in global markets.
Steel
The WSA estimates that global steel demand, including China, reached 1.87 billion tons in 2019, which would represent an increase of 3.4% as compared to 2018. Crude steel production increased in 2019 in Asia and the Middle East and decreased in all other countries.
Mining
Following a stable market with an average iron ore price of US$71.32/dmt in 2017 and US$69.46/dmt (Platts, Fe 62%) in 2018, the seaborne iron ore supply faced several disruptions in 2019 from key players in the industry, including the Brumadinho accident in Brazil and adverse weather conditions in Australia. This scenario, coupled with significant investments in infrastructure and construction in China, resulted in iron ore prices surpassing US$126/dmt for the first time since 2014 and average iron ore prices increased 34.5% from 2018 to US$93.4/dmt in 2019.
Chinese annual iron ore imports remained stable at 1.048 billion tons in 2019, as compared to 1.050 billion tons in 2018, and the global seaborne iron ore market was stable at 1.479 billion tons in 2019, as compared to 1.499 billion tons in 2018. Following the accident of another mining company at Córrego do Feijão dam in Brumadinho, in the state of Minas Gerais, in January 2019, supply constraints maintained seaborne iron ore prices at high levels, reaching an average of US$92.44/dmt (Platts, Fe62%, N. China) in January 2020.
5E. Off-Balance Sheet Arrangements
In addition to the debt that is reflected on our balance sheet, we are contingently liable for off-balance concession payments and “take-or-pay” contractual obligations. The following table summarizes our off-balance sheet obligations:
Contingent Liability with Respect to Consolidated and Non-Consolidated Entities as of December 31, 2019
|
|
Aggregate Amount |
|
Maturity |
|
|
(in millions of R$) | ||
|
Guarantees of Debt: |
|
|
|
|
Transnordestina |
2,474 |
|
September 2056 and indefinite |
|
Concession |
Type of service |
|
|
2020 |
|
2021 |
|
2022 |
|
After 2022 |
|
Total |
|
|
|
|
|
|
|
|
|
|
|
|
|
|
|
FTL |
30-year concession granted on December 31, 1997, renewable for another 30 years, to develop public service and operating the railway system in northeastern Brazil. The northeastern railway system covers 4,238 km of railway network and operates in Maranhão, Piauí, Ceará, Paraíba, Pernambuco, Alagoas and Rio Grande do Norte. |
|
|
12,238 |
|
9,790 |
|
9,790 |
|
48,950 |
|
80,768 |
|
CSN Mineração |
Concession to operate TECAR, a solid bulk terminal, one of the four terminals that make up the Port of Itaguaí, located in Rio de Janeiro. The concession was renewable and the agreement expires in 2047. |
|
|
186,577 |
|
186,577 |
|
185,577 |
|
4,586,673 |
|
5,146,403 |
|
TECON |
25-year concession started in July 2001. On May 10, 2017, Decree No. 9,048 was approved, which changes the concession extension period for port operations. The requested extension period, added to the initial period, cannot exceed 70 years. |
|
|
35,456 |
|
36,925 |
|
38,448 |
|
146,780 |
|
257,609 |
|
|
|
|
|
234,270 |
|
233,292 |
|
234,814 |
|
4,782,403 |
|
5,484,780 |
40550.00004
90
“Take-or-Pay” Contractual Obligations
|
|
Payments Period |
|
|
|
|
|
|
|
|
|||||
|
Type of service |
2018 |
|
2019 |
2020 |
|
2021 |
|
2022 |
|
After 2022 |
|
Total | ||
|
Transportation of iron ore, coal, coke, steel products, cement and mining products. |
|
406,920 |
1,555,398 |
1,184,627 |
|
1,106,047 |
|
1,136,469 |
4,441,842 |
|
7,869,985 | |||
|
Supply of power, natural gas, oxygen, nitrogen, argon, iron ore pellets, coal and clinker. |
658,166 |
966,405 |
391,750 |
|
33,317 |
|
24,940 |
200,121 |
|
650,128 | ||||
|
Processing of furnace sludge and slag generated during pig iron and steel production. |
|
9,467 |
56,024 |
21,164 |
|
11,571 |
|
11,571 |
3,599 |
|
47,905 | |||
|
Manufacturing, repair, recovery and production of ingot casting machine units. |
21,533 |
5,930 |
1,896 |
|
|
|
|
|
|
1,896 | ||||
|
|
1,096,086 |
2,583,757 |
1,599,437 |
|
1,150,935 |
|
1,172,980 |
|
4,645,562 |
|
8,568,914 | |||
Guarantees of Debt
We guarantee 100% of the loans granted by BNDES and Banco do Nordeste/FNE to TLSA and 50.97% of the debentures held by FDNE and issued by TLSA. The aggregate principal amount of debt outstanding under the debentures guaranteed by us as of December 31, 2019 was R$2,474 million.
Under the TLSA Investment Agreement we and our partners, Valec and FDNE, agreed on a budget of R$7.5 billion to complete the construction of the Northeastern Railway System II. A revised budget of approximately R$13.2 billion is under review and up for approval by ANTT. If the construction of Northeastern Railway System II requires funds in addition to the budget, they will be provided by us or third parties under trackage right agreements.
Contingent Liability for Concession Payments
FTL
As of December 31, 2019, we held 92.38% of the capital stock of FTL, which has a concession to operate the Northeastern Railway System I until 2027, renewable for an additional 30 years. As of December 31, 2019, FTL had R$81 million in concession payments outstanding over the remaining eight years of the concession
40550.00004
91
CSN Mineração
We hold the concession to operate TECAR, a solid bulks terminal, one of four terminals that form the Itaguaí Port, located in the state of Rio de Janeiro. In 2015, we achieved the anticipated contract renewal for 25 more years and, accordingly, the expiration date was extended from 2022 to 2047. Itaguaí Port, in turn, is connected to the Presidente Vargas Steelworks and CSN Mineração by the Southeastern railway system. Our imports of coal and coke and exports of iron ore occur through this terminal. Under the terms of the concession, we must unload at least 3.0 million tons of coal and coke annually and, as of 2020, we must ship 38.5 million tons of iron ore annually.
As of December 31, 2019, R$5,146 million was outstanding over the remaining 28 years of the concession.
TECON
We indirectly own 100% of TECON, which has a concession to operate the container terminal at Itaguaí Port for a 25-year term expiring in 2026, renewable for another 25 years. As of December 31, 2019, approximately R$258 million of the cost of the concession was outstanding and payable over the remaining six years of the concession. For more information, see “Item 4D. Property, Plant and Equipment—Acquisitions and Dispositions.”
Transportation of Iron Ore, Coal, Coke, Steel Products, Cement and Mining Products
MRS
Transportation of Iron Ore, Coal and Coke to Volta Redonda
In 2019, the volume set for iron ore and pellets was 6.4 mkt and the volume set for coal, coke and other smelter products was 3.0 mkt with a guarantee of payment of at least 85% of forecast annual revenue.
Transportation of Iron Ore for Export from Itaguaí
In 2019, the volume set for iron ore was 41.5 mkt, with a guarantee of payment of at least 85%. We may increase by up to 10% or decrease by up to 15% the volume set in the agreement every year, considering the volume informed in the previous year.
Transportation of Steel Products
In 2019, the volume set for steel products was 1.8 mkt, with a guarantee of payment of at least 80%. The agreement covers the transportation of steel products from the Presidente Vargas Steelworks to third party terminals and customers.
Cement Transportation
This agreement covers transportation of bagged cement from the cement plant at Presidente Vargas to our terminals. In 2019, the volume set was 633.6 kt, with a guarantee of payment of at least 80%.
Ferrovia Centro Atlântica
Transportation of Limestone
This agreement covers transportation of limestone from the city of Arcos to the city of Volta Redonda. In 2019, the volume set for limestone was 1.8 mkt, with 70% of performance volume guarantee.
Transportation of Clinker
This agreement covers transportation of clinker products from the city of Arcos to the city of Volta Redonda. In 2019, the volume set was 660 kt, with a guarantee of payment of at least 90%.
40550.00004
92
The calculation of “take-or-pay” contracts considers the total volume performed in clinker and limestone contracts, regardless of the percentage transported of each.
Supply of Power, Natural Gas, Oxygen, Nitrogen, Argon and Iron Ore Pellets
We also consume significant amounts of oxygen, nitrogen, hydrogen, argon and other gases at the Presidente Vargas Steelworks. These gases are supplied by a third party under a long-term contract from its gas production facilities located on the Presidente Vargas Steelworks site. To secure gas supply (oxygen, nitrogen and argon), in 1994, we signed a 22-year “take-or-pay” agreement with White Martins under which we are committed to acquire at least 90% of the gas volume guaranteed in the contract. Under the terms of the agreement, we are not required to advance funds raised against future processing charges if White Martins is unable to meet its financial obligations. The original term of the contract ended in November 2016; however, White Martins continues to supply gas while we negotiate a new contract.
5F. Tabular Disclosure of Contractual Obligations
The following table presents our long-term contractual obligations as of December 31, 2019:
|
|
|
Payment due by period | ||||
|
|
|
(in millions of R$) | ||||
|
|
|
|
|
|
|
|
|
Contractual Obligations |
|
|
Less than |
|
|
More than |
|
|
|
Total |
1 year |
1-3 years |
3-5 years |
5 years |
|
|
|
|
|
|
| |
|
Long-term accrued finance charges(1) |
|
13,232 |
1,595 |
2,509 |
1,360 |
7,768 |
|
Taxes payable in installments |
|
87 |
19 |
19 |
18 |
31 |
|
Long-term debt(2) |
|
22,841 |
0 |
6,843 |
8,978 |
7,020 |
|
“Take-or-pay” contracts |
|
8,569 |
1,599 |
2,324 |
2,326 |
2,320 |
|
Derivatives swap agreements(3) |
|
0 |
0 |
0 |
4 |
0 |
|
Concession agreements(4) |
|
5,485 |
234 |
468 |
471 |
4,312 |
|
| ||||||
|
Purchase Obligations |
|
|
|
|
|
|
|
Raw materials(5) |
|
6,436 |
3,434 |
1,531 |
1,471 |
0 |
|
Maintenance(6) |
|
744 |
592 |
150 |
2 |
0 |
|
Utilities/Fuel(7) |
|
2,167 |
2,018 |
144 |
5 |
0 |
|
Total |
|
9,347 |
6,045 |
1,824 |
1,477 |
0 |
_______________________
(1) These accrued finance charges refer to the cash outflow related to the contractual interest expense of our long-term debt and were calculated using the contractual interest rates taken forward to the maturity dates of each contract.
(2) These amounts were presented net of transaction costs and issue premiums.
(3) Derivative swap agreements were calculated based on market prices as of December 31, 2019.
(4) Refers to TECON, TECAR and FTL concessions agreements.
(5) Refers mainly to purchases of coal, tin, aluminum and zinc, which comprise part of the raw materials for steel manufacturing and take-or-pay contracts.
(6) We have outstanding contracts with several contractors in order to maintain our plants in good operating conditions; due to the strong demand for specialized maintenance service, the term of some of these contracts is for more than one year.
(7) Refers mainly to natural gas, power supply and cryogenics, which are provided by limited suppliers; and with some of which we maintain long-term contracts.
5G. Safe Harbor
See “Forward-Looking Statements.”
Item 6. Directors, Senior Management and Employees
6A. Directors and Senior Management
General
We are managed by our board of directors (conselho de administração), which consists of up to eleven members, and our board of executive officers (diretoria executiva), which consists of two to nine executive officers (one of whom is the chief executive officer). In accordance with our bylaws (estatuto social), each director is elected for a term of two years by our shareholders at an annual shareholders’ meeting. Our bylaws require our employees to be represented by one director on the board of directors. The members of the board of executive officers are appointed by the board of directors for a two-year term.
40550.00004
93
Our board of directors is responsible for setting general guidelines and policies for our business and our board of executive officers is responsible for the implementation of such guidelines and policies and for our day-to-day operations. As of the date of this annual report, our board of directors comprised one chairman and four members, and our board of executive officers was comprised of our chief executive officer and four executive officers.
Our board of directors holds at least six ordinary meetings per year and extraordinary meetings whenever necessary.
Our directors and executive officers as of the date of this annual report are:
|
Name |
Position |
Age(1) |
|
First Elected on |
|
Last Elected on |
|
Board of Directors |
|
|
|
|
|
|
|
Benjamin Steinbruch |
Chairman |
66 |
|
April 23, 1993 |
|
April 26, 2019 |
|
Fabiam Franklin |
Member |
52 |
|
April 28, 2016 |
|
April 26, 2019 |
|
Yoshiaki Nakano |
Member |
75 |
|
April 29, 2004 |
|
April 26, 2019 |
|
Antonio Bernardo Vieira Maia |
Member |
60 |
|
April 30, 2013 |
|
April 26, 2019 |
|
Miguel Ethel Sobrinho |
Member |
73 |
|
April 26, 2019 |
|
April 26, 2019 |
|
|
|
|
|
|
|
|
|
Board of Executive Officers |
|
|
|
|
|
|
|
Benjamin Steinbruch |
Chief Executive Officer |
66 |
|
April 30, 2002 |
|
September 25, 2019 |
|
David Moise Salama |
Executive Officer |
53 |
|
August 2, 2011 |
|
September 25, 2019 |
|
Luis Fernando Barbosa Martinez |
Executive Officer |
56 |
|
August 2, 2011 |
|
September 25, 2019 |
|
Pedro Gutemberg Quariguasi Netto |
Executive Officer |
54 |
|
May 11, 2016 |
|
September 25, 2019 |
|
Marcelo Cunha Ribeiro |
Chief Financial and Investor Relations Officer |
42 |
|
29 September, 2017 |
|
September 25, 2019 |
_______________________
(1) Age as of the date of this annual report.
The next election for our board of directors is expected to take place in April 2021. The next election for our board of executive officers is expected to take place in September 2021.
Following is a brief biography of the members of our board of directors.
Benjamin Steinbruch. Mr. Steinbruch has been a member of our board of directors since April 1993, and has held the positions of chairman since April 1995 and chief executive officer since April 2002. He is in charge of our mining, railways and institutional strategy. He has been chairman of the board of directors of the Jockey Club of São Paulo since 2017, a member of the Board of Economic and Social Development since 2014, a member of the Administrative Board of the Portuguese Chamber, member of the Interinstitutional Advisory Board of the Superior Court of the state of São Paulo, chairman of the board of directors of CSN Mineração (controlled by us), and chairman of the deliberative council of the CSN Foundation. Currently he also holds the position of chairman of the board of directors of Textília S.A., or Textília, Fibra Cia. Securitizadora de Créditos Imobiliários, Elizabeth S.A. – Indústria Têxtil, Vicunha Steel S.A., or Vicunha Steel, and Banco Fibra S.A., or Banco Fibra, vice chairman of the board of directors of Vicunha Aços S.A., or Vicunha Aços; member of the board of directors of, Vicunha Participações S.A. and, Officer of Rio Purus Participações S.A., Rio Iaco Participações S.A., or Rio Iaco Participações, and Administrator of Fazenda Alvorada de Bragança Agro-Pastoril Ltda. (all these companies belong to our controlling group). Over the past five years, he also served as First Vice-President of the Federation of Industries of the state of São Paulo (Federação das Indústrias do Estado de São Paulo), or FIESP, since September 2004, member of FIESP’s Superior Strategic Board, advisor to the Robert Simonsen Institute, chairman of the board of directors of Companhia Metalúrgica Prada, TLSA and FTL and as administrator of Haras Phillipson Ltda. (dissolved in November 2017). Mr. Steinbruch graduated from the Fundação Getúlio Vargas – FGV/SP Business School and specialized in marketing and finance also at Fundação Getúlio Vargas – FGV/SP.
Fabiam Franklin. Mr. Franklin has been a member of our board of directors since April 2016. Since April 4, 2016 he has been serving as chairman of the Advisory Council of CSN’s Stock Investment Fund (CSN Invest Fundo de Investimentos em Ações), as manager of the CSN Financial Education Program since 2008 and as general manager of steel metallurgy at CSN since November 2002. He also served as a member of the board of directors of the Brazilian Association of Metallurgy and Mining (Associação Brasileira de Metalurgia, Materiais e Mineração) from 2015 until 2017. Mr. Franklin graduated in metallurgical engineering from Universidade Federal Fluminense – UFF/RJ and holds a graduate degree in reduction metallurgy, from the – Mc Master University, Hamilton, Canada, and a master’s in business management from Fundação Dom Cabral – Belo Horizonte/MG. Mr. Franklin has a master’s degree in economics from IBMEC.
40550.00004
94
Yoshiaki Nakano. Mr. Nakano has been a member of our board of directors since April 2004, and a member of our audit committee since June 2005, serving as chairman of the audit committee since October 30, 2017. He also serves as a member of the board of directors of TLSA (company joint controlled by us) and, over the past five years, Mr. Nakano has been a professor and Officer at the School of Economics of Fundação Getúlio Vargas – FGV/SP, a member of the Economy Superior Council (Conselho Superior de Economia - COSEC) of FIESP/Instituto Roberto Simonsen, and a board member of the Fundação de Amparo à Pesquisa do Estado de São Paulo – FAPESP, until 2015. Previously, Mr. Nakano served as Special Secretary for Economic Affairs in the Ministry of Finance and as Finance Secretary of the state of São Paulo. Mr. Nakano graduated in business administration from Fundação Getúlio Vargas and has a master’s in business administration and a Ph.D. from Cornell University.
Antonio Bernardo Vieira Maia. Mr. Maia was elected member of our board of directors on April 2013 and has been a member of our audit committee since August 2013, and has served as chairman of the audit committee since May 2014 to October 2017. He was also a member of our Financial Committee from October 2014 to December 2016, member of the board of directors of TLSA (company joint controlled by us) and of FTL and CSN Mineração (controlled by us). He has also been chief executive officer of BRG Capital Ltda. Since July 2005. From April 1995 to May 2005 he was Officer of Credit Suisse/Banco Garantia de Investimentos S.A. He began his career in Citibank Brazil, as a trainee, in 1982 and moved to New York in 1986, where he first worked as an Institutional Investment Analyst of Citigroup for Latin America, until become an Officer of Citibank New York. Prior to that, he worked as an associate at Banco Bozano Simonsen de Investimentos in Rio from August 1979 to December 1981, and he served as a member of the board of directors of Banque Bénédict Hentsch & Cie SA, Geneva, Switzerland, from April to December 2006. He graduated in 1981 with a degree in business and public administration from Fundação Getúlio Vargas.
Miguel Ethel Sobrinho. Mr. Sobrinho has been a member of our board of directors since April 2019 and a member of our audit committee since May 2019. In addition, since 2016, he has been a member of the board of directors of CSN Mineração and an officer and shareholder of Participa – Empreendimentos Imobiliários e Participações Ltda., developing activities focused on interests in shopping malls, gas and hydroelectric energy and fast food chains. He graduated in production engineering from the Polytechnical School of the University of São Paulo and holds a master’s in business administration from the School of Economics and Administration of the University of São Paulo. He was a professor of project and investment analysis at the School of Economics and Administration of the University of São Paulo and a member of the Curator Board and founder of the Administration Institute Foundation of the University of São Paulo.
Board of Executive Officers
Following is a brief biography of the members of our board of executive offers.
Benjamin Steinbruch. See “—Board of Directors.”
David Moise Salama. Mr. Salama was elected as an executive officer in August 2011, is in charge of the real estate, insurance and credit areas. He has been serving at CSN since 2006, having acted as investor relations officer. He is also currently serving as officer of Estanho de Rondônia S.A. and Companhia Florestal do Brasil and is a member of the board of directors of CSN Mineração, CBSI – Companhia Brasileira de Serviços de Infraestrutura, Itá Energética S.A.. He is also a deputy member of the Deliberative Council of Caixa Beneficente dos Empregados of CSN, or CBS and deputy member of the board of directors of Transnordestina Logística S.A. (a company jointly controlled by us) and FTL (controlled by us). Prior to joining CSN, Mr. Salama acted as Financial Officer at Tecnisa Engenharia e Comércio, Birmann Comércio e Empreendimentos and Goldfarb Comércio e Construções, was the head of consolidated financial information of Unilever Brasil and acted as senior auditor at PwC. Mr. Salama graduated in Accounting and has a master’s in business administration in Finance, both from the School of Economics, Business and Accounting of the Universidade de São Paulo / FEA-USP. He complemented his academic education by attending the Oxford Advanced Management and Leadership Program of Saïd Business School at Oxford University, England, and the Harvard Law School Program on Negotiation at Harvard University, United States.
40550.00004
95
Luis Fernando Barbosa Martinez. Mr. Martinez was elected as an executive officer in August 2011, and is in charge of the commercial and logistic areas of the steel, cement and special sales segment. He has been serving CSN since 2002, having previously acted as sales officer. He is a member of the board of directors of Lusosider – Aços Planos S.A., Lusosider Projectos Siderúrgicos S.A., Lusosider Ibérica S.A., CSN Mineração and MRS, and a member of the Deliberative Council of Caixa Beneficente dos Empregados da Companhia Siderúrgica Nacional, or CBS. Mr. Martinez is also a member of the board of directors of Associação Brasileira de Metalurgia, Materiais e Mineração, or ABM, and deputy member of the board of directors of FTL (controlled by us) and Transnordestina Logística S.A. (a company jointly controlled by us). He is also currently serving as an officer of Estanho de Rondônia S.A., CSN Energia, S.A., Companhia Metalúrgica Prada, CSN Equipamentos and SWT. Since March 2017 he is also member of the board of officers of Câmara de Comércio e Indústria Brasil – Alemanha. Prior to joining CSN, Mr. Martinez was a sales officer at Alcan Alumínio do Brasil S.A., having worked at that company for 14 years in different departments (processing, quality, product/market development and sales). He also acted as Executive Officer of the Brazilian Center of Steel Construction - CBCA and of the Brazilian Association of Metallic Construction, and he was president of the Brazilian Association of Steel Packaging - ABEAÇO. Recently, Mr. Martinez received the prize Prêmio Barão de Mauá – Instituto Mauá de Tecnologia as Professional and Market Highlight in 2016. Mr. Martinez graduated with a degree in Metallurgical Engineering from Instituto Mauá de Tecnologia, or IMT, has a graduate degree in industrial management from the School of Production Engineering of the Universidade de São Paulo, and also graduated from the Corporate Management Development Program at Alcan Aluminum Limited in Montreal, Canada.
Pedro Gutemberg Quariguasi Netto. Mr. Quariguasi was elected as an executive officer in May 2016, and is in charge of the steel operational area. Prior to joining us, Mr. Quariguasi acted as chief executive officer of Vale in Mozambique and as Global Officer of Coal of Vale at Mozambique and Australia from March 2014 until April 2016, and as partner and commercial and marketing officer at B&A Mineração from May 2012 until September 2013. Previously, he was the Global Marketing Officer at Vale and chief executive officer in Manganês, he also acted in Rio Tinto and McKinsey & Co. He is also member of the board of directors of MRS and CSN Mineração and chairman of the board of directors of Lusosider – Aços Planos S.A., Lusosider Projectos Siderúrgicos S.A. and Lusosider Ibérica S.A. Mr. Guariguasi has a degree in Metallurgical Engineering from Universidade Federal Fluminense, a master’s degree in Metallurgical Engineering from Pontifícia Universidade Católica do Rio de Janeiro, a PhD in Metallurgical Engineering from McGill University, Canada, and a master’s in business administration in Finance, Corporate Strategy and Economics from McKinsey & Company.
Marcelo Cunha Ribeiro. was elected as an executive officer in September 2017, and is in charge of the treasury, controller, tax and accounting areas and is our chief financial officer and, since March 2018, our chief investor relations officer. He is also member of the board of directors of FTL (controlled by us) and Transnordestina Logística S.A. (a company jointly controlled by us) and a member of the Deliberative Council of Caixa Beneficente dos Empregados da Companhia Siderúrgica Nacional, or CBS. He is also currently serving as an officer of Minérios Nacional and CSN Equipamentos S.A. Prior to joining us, Mr. Ribeiro acted as chief financial officer of St. Marche Group, Vice President of Finance and Investor Relations of Restoque Comércio e Confecções de Roupas S.A., chief financial officer of Grupo SBF (GP Investimentos Ltd), Managing Director of the Private Equity area of GP Investimentos Ltd and chief financial officer of San Antonio International Ltd. He was also a member of the board of directors of Hopi Hari SA, Telemar Norte Leste SA (Oi S.A.), Contax Participações S.A., Estácio Participações S.A., Magnesita Refratários S.A., BR Towers SPE1 SA. Mr. Ribeiro graduated in production engineering from the University of São Paulo and has a master’s in business administration from Harvard Business School.
Indemnification of Officers and Directors
There is no provision for or prohibition against the indemnification of officers and directors under Brazilian law or our bylaws. Officers are generally not individually liable for acts performed within the course of their duties. Subject to the terms of the indemnity agreements entered into by us and our directors and officers, we may indemnify, or maintain liability insurance covering, our directors, officers and certain key employees against liabilities incurred in connection with their respective positions with us.
40550.00004
96
For the year ended December 31, 2019, the aggregate compensation paid by us to all members of our board of directors and board of executive officers for services in all capacities was R$37.5 million, which includes salaries, bonuses, profit sharing arrangements and benefits, such as medical assistance, pension plan contributions and life insurance, among others. For the year ended December 31, 2019, the aggregate compensation paid by us to all members of our fiscal committee for services was R$0.7 million.
See “Item 6D. Employees” for a brief description of our profit sharing arrangements.
6C. Board Practices
Fiscal Committee
Under Brazilian Corporate Law, shareholders may request the appointment of a fiscal committee (conselho fiscal), which is a corporate body independent of management and our external auditors. The primary responsibility of the fiscal committee is to monitor management’s activities, review the financial statements, and report its findings to shareholders. As of the date of this annual report, we have a fiscal committee in place, which was elected by our annual shareholders’ meeting in April 2019 with a term until our next annual shareholders’ meeting. Our fiscal committee comprises three effective members and three alternate members, of which one effective member and the respective alternate were appointed by our minority shareholders.
The members of our fiscal committee as of the date of this annual report are:
|
Name |
Position |
Age(1) |
|
First Elected on |
|
Last Elected on |
|
Tufi Daher Filho |
Chairman |
60 |
|
June 29, 2018 |
|
April 26, 2019 |
|
Patrícia Valente Stierli |
Member |
63 |
|
April 26, 2019 |
|
April 26, 2019 |
|
André Coji |
Member |
56 |
|
June 29, 2018 |
|
April 26, 2019 |
_______________________
(1) Age as of the date of this annual report.
Following is a brief biography of the members of our fiscal committee.
Tufi Daher Filho. Mr. Daher has been a member of our fiscal committee since July 2018. He owns TDF Consultoria Empresarial Ltda., is partner of Empreendimentos e Construtora Ltda. and owner of the Loungerie, Osklen and Richards franchises in Urberlândia, Minas Gerais. For the last five years, Mr. Daher was member of the board of directors of CPTM – Companhia Paulista de Trens Metropolitanos (until January 2019), technical advisor of Hidrovias do Brasil S.A. (until 2018), officer of Metalic, president of the board of directors and chief executive officer of MRS. He was also a member of the board of directors of the National Association of Railroad Companies (Associação Nacional dos Transportadores Ferroviários – ANTF). Mr. Daher graduated in civil engineering from Universidade Católica de Minas Gerais. He has participated in a vocational course taught by the Japan International Cooperation Agency related to transportation planning. Mr. Daher also holds a master’s degree in business administration from Fundação Dom Cabral and has participated in an advanced management program in partnership with INSEAD in France.
Patrícia Valente Stierli. Mrs. Stierli has been a member of our fiscal committee since April 2019. She is also member of the fiscal committee of the Ladies Charitable Society of the Hospital Sírio-Libanês since 2018 and Eletrobras – Centrais Elétricas S.A. (from 2017 to 2019 and as financial expert since 2019). She was a member of the board of directors of PPE Fios Esmaltados S.A. (from 2018 to July 2019) and alternate member of the fiscal committee of the Council on International Educational Exchange – CIEE and Petróleo Brasileiro S.A. – Petrobras. Over the last five years, she has been a member of the fiscal committee of Bardella S.A. Indústrias Mecânicas (2015-2018); member of the board of directors of Pettenati S.A. Indústria Têxtil (2015) and alternate member of the fiscal committee of Dohler S.A. (2017-2018). She was the representative of the fund management department of Banco Fator with the Central Bank and the CVM until mid-2015 and a member of ANBIMA’s Action Committee. She is a management and tax advisor certified by IBGC, manager of third-party funds with the CVM and ANBIMA (through December 2017) and member of the IBGC’s Council of Finance. She has bachelor’s and master’s degrees in business administration from Fundação Getúlio Vargas, with a specialization in controllership.
André Coji. Mr. Coji has been a member of our fiscal committee since July 2018, and works with structured financial operations for renowned companies in the Brazilian real estate market. For the last five years, he was treasury director for a non-profit organization, Unibes, and a member of the advisory board of several Brazilian families, responsible for asset management, fiscal planning, tax and succession planning. He is a member of the board of directors of Via Varejo and a director of FISESP – Federação Israelita do Estado de São Paulo. Mr. Coji graduated in business administration from Fundação Getúlio Vargas (FGV) and in law from Universidade de São Paulo. He has also a board of directors certificate from the IBGC.
40550.00004
97
Audit Committee
In June 2005, we appointed an audit committee (comitê de auditoria), which comprises independent members of our board of directors. Our audit committee is responsible for recommending to our board of directors the appointment of independent auditors, reporting on our auditing policies and our annual audit plan prepared by our internal auditing team, as well as monitoring and evaluating the activities of our independent auditors. Our audit committee has also been tasked with identifying, prioritizing and submitting actions to be implemented by our executive officers, analyzing our annual report and financial statements and making recommendations to our board of directors.
Our audit committee comprises Mr. Yoshiaki Nakano, Mr. Antonio Bernardo Vieira Maia and Mr. Miguel Ethel Sobrinho. Our audit committee may also be assisted by an external consultant, whenever necessary. All members of our audit committee satisfy the audit committee membership independence requirements set forth by the SEC and the NYSE. All members of our audit committee have been determined by our board of directors to qualify as an “audit committee financial expert” within the meaning of the rules adopted by the SEC relating to the disclosure of financial experts on audit committees in periodic filings pursuant to the Exchange Act.
Our audit committee holds at least one ordinary meeting every three months and extraordinary meetings whenever necessary.
For information on the date of election and term of office of the members of our board of directors and board of executive officers, see “Item 6A. Directors and Senior Management.”
We permit our directors to continue to participate in our employee pension plan after ceasing to be a director.
6D. Employees
As of December 31, 2017, 2018 and 2019, we had 25,189, 24,857 and 24,869 employees, respectively. As of December 31, 2019, approximately 4,020 of our employees were members of the Steelworkers’ Union of Volta Redonda and region, which is affiliated with the Força Sindical since 2012, which is a national union. We believe we have a good relationship with Força Sindical. We have collective bargaining agreements, renewable annually on May 1 of every year. Moreover, we have members affiliated with other unions, such as the Engineers’ Union with 31 members, the Accountants’ Union with one member and the Workers’ Unions from Arcos, Camaçari, Recife and Araucária, with a total of 44 members. At all other companies controlled by CSN, including ERSA, CSN Mineração, FTL and TLSA, we have a total of 984 employees that are members of unions.
In March 1997, we established an employee profit sharing plan. All employees participate in this plan and earn bonuses based on our consolidated results, the results of our business units, employees’ individual results and employees’ competence assessments.
We are also the main sponsor of a non-profit entity, Caixa Beneficente dos Empregados da CSN, established in July 1960, which is primarily engaged in the payment of benefits that supplement the government’s social security benefits to our former employees. In its capacity as sponsor, CSN carries out transactions involving the payment of contributions and recognition of actuarial liabilities calculated in defined benefit plans. See further details in note 26 to our audited consolidated financial statements included elsewhere in this annual report.
40550.00004
98
6E. Share Ownership
The Steinbruch family, which includes Mr. Benjamin Steinbruch, our chairman and chief executive officer, holds an indirect majority ownership interest in Vicunha Aços and Rio Iaco Participações, our controlling shareholders.
Our executive officers and the members of our board of directors directly held an aggregate of 1,502 shares of our outstanding common shares as of December 31, 2019.
Item 7. Major Shareholders and Related Party Transactions
7A. Major Shareholders
As of December 31, 2019, our capital stock comprised 1,387,524,047 common shares, each of which entitles its holder to one vote at our shareholders’ meetings.
The following table sets forth, as of December 31, 2019, the number of our common shares owned by our major shareholders:
|
|
|
Common Shares | ||
|
|
|
|
|
Percent of |
|
|
|
Shares Owned |
|
Outstanding |
|
Name of Person or Group |
|
|
|
Shares |
|
| ||||
|
Vicunha Aços S.A.(1) |
|
679,522,254 |
|
48.97% |
|
Rio Iaco Participações S.A.(2) |
|
58,193,503 |
|
4.19% |
_______________________
(1) Owned indirectly by the Steinbruch family, which includes Mr. Benjamin Steinbruch, the chairman of our board of directors
and our chief executive officer.
(2) Owned indirectly by the Steinbruch family, which includes Mr. Benjamin Steinbruch, the chairman of our board of directors
and our chief executive officer.
Our major shareholders do not have different voting rights from our other shareholders.
For more information, see “Item 3D. Risk Factors—Risks Relating to our Common Shares and ADSs—Our controlling shareholder has the ability to direct our business and affairs and its interests could conflict with yours.”
7B. Related Party Transactions
Our transactions with related parties consist of (i) transactions with our holding companies; (ii) transactions with subsidiaries, jointly controlled entities, associates, exclusive funds and other related parties; and (iii) other unconsolidated related parties, which are detailed in note 18 to our audited consolidated financial statements included elsewhere in this annual report.
i. Vicunha Aços and Rio Iaco Participações are holding companies and, as of December 31, 2019, they held 49.24% and 4.22% of our common shares, respectively.
ii. Our commercial and financial transactions with our subsidiaries, jointly controlled entities, associates, exclusive funds and other related parties are carried out at market prices and under market conditions, based on common terms and rates applicable to third parties. For further details on these transactions, see note 18 to our audited consolidated financial statements.
iii. We maintain relations with other unconsolidated related parties, which include CBS Previdência, Fundação CSN, Banco Fibra, Ibis Agrária Ltda., Ibis Participações e Serviços Ltda., Partifib Projetos Imobiliários Ltda., Vicunha Imóveis Ltda.,Vicunha Serviços Ltda. and Jockey Club de São Paulo.
7C. Interests of Experts and Counsel
Not applicable.
99
Item 8. Financial Information
8A. Consolidated Statements and Other Financial Information
See “Item 3A. Selected Financial Data” and our audited consolidated financial statements included elsewhere in this annual report.
In the ordinary course of our business, we are party to several administrative, judicial and arbitration proceedings, which we believe are incidental and arise out of our regular course of business. We believe that the outcome of the proceedings to which we are currently a party will not have a material adverse effect on our financial position, results of operations and cash flows. We have established provisions for all amounts in dispute that represent a probable loss based on the legal opinion of our internal and external legal counsel
Labor Contingencies
As of December 31, 2019, we and our subsidiaries were defendants in 7,590 labor claims, for which we recorded a provision of R$305.0 million. Most of these claims relate to alleged subsidiary and/or joint liability with respect to our independent contractors, salary equalization, health hazard premiums and hazardous duty premiums, overtime pay, health plan, indemnity claims resulting from other alleged occupational diseases or on-the-job accidents, breaks between working hours, and differences in profit sharing from 1997 to 1999 and from 2001 to 2003.
Changes in 2018 to our provisions for labor contingencies were due to the closing of certain lawsuits and our constant revision of accounting estimates in setting these provisions, which consider, among other factors, the nature of the claims involved.
Civil Contingencies
These are mainly indemnity claims resulting from contractual disputes and collections, claims for damages and compensation related to our commercial and industrial activities, real estate disputes and disputes for restoring health insurance. As of December 31, 2019, we had recorded a provision of R$139.4 million for these civil contingencies.
We also classify as civil contingencies the administrative and judicial proceedings filed against us for alleged violations of environmental statutes, mainly as a result of our industrial activities, claims for regularization, indemnification or imposition of fines. As of December 31, 2019, the amount relating to probable losses for civil contingencies relating to environmental issues was R$43,498 million.
Tax Contingencies
Our main tax contingency relates to a tax assessment notice involving R$12.3 billion (as of December 31, 2019) issued against us for an alleged failure to submit to taxation a capital gain resulting from the alleged sale of 40% of our shares in former subsidiary Namisa (merged into our subsidiary CSN Mineração as of December 31, 2015) to the Asian Consortium. In May 2017, the São Paulo regional judgment office (Delegacia Regional de Julgamento), which is a lower administrative court, issued a decision cancelling the tax assessment notice. This decision was reversed and the tax assessment was upheld by the second level administrative court – the Administrative Board of Tax Appeals (Conselho Administrativo de Recursos Fiscais), or CARF. There remains a pending issue under review by the Superior Chamber of CARF regarding the qualified penalty. We have challenged the merits of the tax assessment at the judicial level before and obtained an injunction against any immediate assessment. In April 2018, a federal court of tax enforcement set aside a portion of our assets, including buildings, equipment, land, vehicles and fixtures and furniture, as collateral for our potential liability under this proceeding. At the end of 2019, the court issued a decision favorable to us and cancelled the CARF judgment at the administrative level due to legal nullities. The case is pending final judgment. Our assessment remains that our risk of loss is possible.
This same tax assessment notice resulted in another contingency issued against Namisa (merged into our subsidiary CSN Mineração as of December 31, 2015) involving R$2.8 billion, as of December 31, 2019. This tax assessment is for income tax and social contribution not paid due to allegedly improper goodwill amortization from 2008 to 2011. In May 2013, the São Paulo regional judgment office issued a decision favorable to us and cancelled the tax assessment notice, which decision was confirmed by CARF. After an appeal filed by the Federal Prosecutor’s Office, the Superior Chamber of CARF reversed the decision and reinstated the tax assessment, but there remains a pending issue to be decided by the lower administrative authorities regarding the qualified penalty. We have challenged the formal requirements of the Federal Prosecutor’s Office appeal at the judicial level and obtained an injunction against any immediate assessment. In December 2018, another contingency related to allegedly improper goodwill amortization from 2013 to 2014 was issued against Namisa. This tax assessment demands the payment of income tax and social contribution involving approximately R$1.03 billion, as of December 31, 2019. In June 2019, we filed our appeal to CARF, which issued a decision favorable to us in December 2019. This decision is subject to appeal to the Superior Chamber of CARF and the case is pending final judgment.
40550.00004
100
In addition, we received tax assessment notices in December 2015 and December 2016 for R$1.4 billion and R$840 million as of December 31, 2019, respectively, for an allegedly improper deduction of interest expenses in pre-payment contracts between us and Namisa. With regards to the December 2015 tax assessment, in August 2019, CARF issued a favorable decision to us cancelling the tax assessment. The Federal Prosecutor’s Office filed an appeal and the Superior Chamber of CARF issued an administrative decision unfavorable to us. We subsequently filed a lawsuit to contest the merits of the tax assessment at the judicial level and the court decided against us. As of the date of this annual report, we are preparing our appeal.
Antitrust
In October 1999, we received a fine from CADE claiming that certain practices adopted by us and other Brazilian steel companies before 1997 allegedly comprised a cartel. We challenged the cartel allegation and the imposition of the fine judicially and, in June 2003, obtained a partially favorable judgment by a federal trial court. CADE appealed the trial court decision and, in June 2010, a federal appellate court in Brasília reversed the trial court’s decision and confirmed the cartel allegation, as well as the fine imposed by CADE in the amount of R$65 million. We appealed the decision of the appellate court to the Brazilian Superior Court of Justice. We have not yet recorded any provision in connection with this fine, as the risk of loss is classified as possible.
In April and July 2012, CADE issued certain injunctive orders limiting our ability to, among other things, increase our equity stake in Usiminas or exercise our voting rights with respect to the shares already owned. In April 2014, CADE issued its decision and a Performance Commitment Agreement (Termo de Compromisso de Desempenho), or TCD, was executed between CADE and us. Under the terms of CADE’s decision and the TCD, we must reduce our equity stake in Usiminas within a specified timeframe. The timeframe and reduction percentages are confidential. Furthermore, our political rights in Usiminas would continue suspended until we reach the thresholds established in the TCD.
In March 2016, we applied to CADE to partially suspend the TCD so as to exercise certain rights, namely appointing independent directors and members of the fiscal committee, which request CADE granted and following which, at Usiminas’ annual general shareholders’ meeting in April 2016, we appointed two independent directors and one independent member of Usiminas’ fiscal committee, as well as their respective alternates. The 2016 appointments are under litigation and, although there has been no judicial order overturning or otherwise suspending their effects, since 2016 we have been unable to appoint new members to Usiminas’ fiscal committee. CADE denied our request for exception in April 2018. On March 20, 2019, CADE approved an amendment to the TCD, in order to establish a new timeframe for us to reduce our equity stake in Usiminas. The new timeframe and reduction percentages remain confidential.
Northeastern Railway System Proceedings
The TCU initiated proceedings in April 2016 questioning the legality of the governmental authorizations for the segregation of the Northeastern Railway System into two sub-railway systems – Northeastern Railway System I (in operation by FTL) and Northeastern Railway System II (under construction by TLSA). According to the claim, the Brazilian federal government should have undergone a new bidding process to grant the concession for the construction of the new tracks of the Northeastern Railway System (Northeastern Railway System II).
We are unable to anticipate the outcome of this proceeding. The consequences of an unfavorable decision may include the loss by TLSA of the concession for Northeastern Railway System II, the imposition of additional investments in developing this sub-railway system and the acceleration of loans granted to TLSA, for which we are guarantors. See “Item 5E. Off-Balance Sheet Arrangements—Guarantees of Debt.” In addition, even if we are entitled to any indemnification in connection with a termination of the TLSA concession agreement for our investments in developing Northeastern Railway System II, this indemnification may be insufficient to cover our costs, expenses or losses and may be paid long after a decision terminating the concession, if at all.
40550.00004
101
In the course of this proceeding, the TCU suspended further disbursements by government agencies, including the state-owned railway company Valec and FDNE, for the development of Northeastern Railway System II, which has adversely affected the pace of construction of the new tracks.
In July 2019, we revised the engineering project for the development of Northeastern Railway System II and delivered an update regarding the completed and ongoing project phases in order to validate our budget and revise our schedule. As of the date of this annual report, we are awaiting the conclusion of regulatory analysis of the information we have submitted, which we expect in the first half of 2020.
Additionally, in 2013, ANTT initiated proceedings claiming that FTL did not meet certain transportation targets for the Northeastern Railway System I in 2013 and seeking to terminate the TAC executed by FTL that year, which had settled all claims of non-compliance by us with the original concession agreement of the Northeastern Railway System until 2012.
This proceeding resulted in the reopening of the administrative proceeding which began in 2012 for ANTT to evaluate the occurrence of any relevant breach to FTL’s concession agreement.
Following a valuation conducted by ANTT, ANTT concluded that FTL did not comply with the TAC regarding its failure to meet 2013 production targets. ANTT recommended that the Brazilian federal government terminate the FTL concession agreement and initiate an administrative proceeding before the Superintendence of Infrastructure and Railroad Cargo Transport Services (Superintendência de Infraestrutura e Serviços de Transporte Ferroviário de Cargas). FTL has appealed this conclusion and recommendation and, as of the date of this annual report, is awaiting ANTT’s response.
Furthermore, in May 2017, ANTT also initiated proceedings claiming that TLSA did not comply with certain of its obligations arising from its concession agreement. ANTT’s technical area and board, in a unilateral opinion, concluded that TLSA breached its contractual obligations under the concession agreement and recommended that the Brazilian federal government terminate TLSA’s concession to operate the Northeastern Railway System II. TLSA has appealed this conclusion and recommendation and, as of the date of this annual report, is awaiting ANTT’s response.
Environmental Proceedings
Environmental Proceedings Related to Presidente Vargas Steelworks
In 2010, we signed a TAC with the state of Rio de Janeiro, with the commitment to carry out new studies and investments to upgrade the environmental control equipment of the power plant at Presidente Vargas Steelworks (TAC 26/2010). TAC 026/2010 initially estimated an investment in the amount of R$216 million, which was later updated to R$260 million, after obtaining more precise cost data for the project. In 2013, we signed an amendment to this TAC to, among others, include new obligations imposed by INEA, resulting in an additional investment of R$165 million, which we made. Due to the final deadline of TAC 026/2010, which would end in 2015, we, the state of Rio de Janeiro and INEA entered into a new TAC in April 2016 for new investments in the amount of R$178.5 million related to adjustments to the power plant at Presidente Vargas Steelworks, payment of environmental fines in the amount of R$16 million and R$6.1 million in compensation to be allocated to environmental programs in the region of Volta Redonda (TAC 03/2016).During the validity of TAC 03/2016, the power plant at Presidente Vargas Steelworks has an environmental authorization to operate (Autorização Ambiental de Funcionamento), or AAF.
Prior to the end of the AAF, we obtained an environmental authorization (Autorização Ambiental), which provisionally maintained the full operation of Presidente Vargas Steelworks until September 20, 2018.
During this period, we held discussions with environmental authorities of the state of Rio de Janeiro to reach a consensual solution to the environmental issues, and in September 2018, we signed a new TAC (TAC 07/2018) with the state of Rio de Janeiro through the Secretary of State for the Environment and Sustainability (Secretaria de Estado do Ambiente e Sustentabilidade – SEAS), INEA and the State Environmental Control Commission (Comissão Estadual de Controle Ambiental – CECA), thereby maintaining the full operation of Presidente Vargas Steelworks. In parallel, INEA issued an AAF valid until October 2024, which authorizes the regular operations of Presidente Vargas Steelworks during its compliance with TAC 07/2018.
40550.00004
102
This new TAC 07/2018 contemplates investments of approximately R$303 million in environmental projects and actions in the region until August 2024 and represents our commitment to the sustainability of our activities and to the communities of Volta Redonda and the surrounding region.
Environmental Proceedings Related to Volta Redonda
In July 2012, the Environmental Public Prosecutor of the state of Rio de Janeiro (Ministério Público Estadual do Rio de Janeiro) filed a judicial proceeding against us claiming that we must (i) remove all waste disposed in two areas used as an industrial landfill in the city of Volta Redonda and (ii) relocate 750 residences located in the adjacent neighborhood Volta Grande IV Residential. In August 2013, the Federal Environmental Public Prosecutor filed a judicial civil proceeding against us based on the same claims brought up by the State Environmental Public Prosecutor of Rio de Janeiro. In both cases, the court denied these requests but ordered that we present a timetable to investigate the area and, if necessary, to remediate the potential issues raised by the Environmental Public Prosecutor. We presented a timetable considering the conclusion of all studies related to our investigation, including a risk assessment and intervention plan, which were concluded in April 2014. We presented the studies resulting from our research to INEA and the Environmental Public Prosecutor claimed inconsistencies in the studies, which we rejected. In January 2019, the Superior Court of Justice decided that the lawsuit should be moved to federal court. We have also received notices for lawsuits brought by certain home owners at Volta Grande IV claiming indemnification for alleged moral and material damages.
Additionally, we are defendants in two criminal lawsuits related to alleged water and soil pollution in Volta Redonda. In the first lawsuit, Vazamento ETE, after the course of the appeal, the case was referred to ground court for filing. The second lawsuit is awaiting the court’s decision. We are also subject to ongoing police inquiries related to alleged inappropriate air emissions, irregular effluents discharge, water and soil pollution and inadequate transportation, storage and disposal of waste.
In April 2013, INEA fined us R$35 million in relation to Volta Grande IV Residential, in response to which we filed an annulment action in January 2014 to the Tenth Public Treasury Court of the Capital District (RJ). INEA, in response, filed a fiscal execution action in May 2014 for enforcement of the fine. The fiscal execution action is suspended until judgment is rendered in the annulment action.
In 2015, the Federal Prosecutor’s Office filed a public civil action against us for the regularization of certain emissions and the stoppage of our sintering plants. According to a CONAMA resolution, the deadline to comply with the emissions standards was December 2018, however, TAC 07/2018 established new deadlines, which we expect the court will accept.
Concerning other allegedly contaminated areas in Volta Redonda, the Federal Prosecutor’s Office filed three public civil actions for the environmental remediation and indemnification of certain areas. These actions are in an early stage and we are conducting environmental studies to determine possible environmental damage related to soil contamination and to ensure our compliance with all applicable laws. Once we complete these environmental studies, we will present them in the context of these actions.
In July 2018, the Federal Prosecutor’s Office and the State Public Prosecutor of Rio de Janeiro filed a public civil action against us, HARSCO and INEA, for immediate removal of slag piles in the city of Volta Redonda, in the state of Rio de Janeiro, that adjoin the Paraíba do Sul River. Relief sought includes cleaning of the entire effluent collection chute, presentation of the volume of slag stored in the area, presentation of a project to control atmospheric emissions of slag piles and partial embargo of the activity, material damages and collective moral damages.
A preliminary injunction was granted to require us, HARSCO and INEA to immediately limit the amount of slag received monthly, as well as the height of the piles at four meters. Any non-compliance with the preliminary injunction as of March 28, 2019 may result in fines of approximately US$600,000 per month. In December 2019, the fine was calculated at R$900,000. We filed an appeal against this preliminary injunction and, in November 2019, the Superior Court of Justice suspended the injunction until further judgment on the merits. Our appeal is pending judgment and the case is in its earlier phase in the lower court.
40550.00004
103
Other Environmental Proceedings
In 2016, the Federal Prosecutor’s Office and the State Public Prosecutor of Rio de Janeiro filed a judicial proceeding against us regarding alleged irregular deposit of residues and claiming that we must recover degraded areas, repair damage to flora and fauna and compensate damage to human health. We have filed our defense and this proceeding remains in its initial phase.
In 2004, the Federal Prosecutor’s Office filed a public civil action against us for alleged environmental contamination and pollution of the Paraíba do Sul River, allegedly caused by our industrial activity in the area. The court ruled against us and demanded that we compensate the environmental damage caused. We appealed this decision to the Superior Court of Justice, which upheld our appeal and returned the proceeding to its initial stage in order to carry out expert investigation, which are still ongoing.
In 1995, the Municipality of Volta Redonda filed a public civil action against us regarding the requirements of an environmental compensatory program. We entered into a TAC with the Municipality of Volta Redonda and, in May 2008, despite reporting our compliance with the TAC, the Municipality of Volta Redonda requested the payment of R$16 million in outstanding obligations. After initial discussions, the Municipality of Volta Redonda filed a petition for R$172 million, which we contested. The lower level court appointed an expert team to determine our outstanding obligations and the respective amounts involved. In December 2018, we signed a new agreement with the Municipality of Volta Redonda to end the legal dispute through reciprocal concessions. The agreement was ratified by the court with which the case is pending and the State Public Prosecutor’s Office appealed for the agreement to be annulled. As of the date of this annual report, this appeal is pending judgment.
We are subject to a civil investigation regarding our activities in Arcos to verify (i) the environmental requirements of our cement plant in the city of Arcos; (ii) the monitoring and mitigation of the environmental impacts of the cement plant’s activities; (iii) our compliance with the conditions of our environmental permits, including the creation of a museum within the Corumbá ecological station and the creation of a private natural reserve (Reserva Particular de Patrimônio Natural); and (iv) our actions for the preservation of cultural heritage and compensatory measures. In February 2011, we signed a TAC to fulfill the Public Prosecutor’s Office’s requirements. In 2019, the Public Prosecutor’s Office declared that we had complied with our obligations under the TAC and closed the TAC.
In 2009 and 2010, we signed agreements with the Public Prosecutor’s Office regarding environmental liabilities caused by coal mining in the Southern Region of Santa Catarina until the 1990s. The environmental liabilities covered by the agreements include restoration of certain areas. Our compliance with the agreement was questioned in 2015 by the Public Prosecutor’s Office, who may seek to impose fines, freeze our bank accounts or initiate a criminal investigation. In June 2018, we settled a judicial agreement in order to extend the deadlines for this restoration. We expect to enter into a new agreement with government authorities and other parties involved in this claim in order to set cost-effective and functional standards for restoration.
In December 2019, the Public Prosecutor’s Office filed a public civil action against TECON and INEA to suspend the environmental licensing process of TECON’s container terminal until completion of the study on the environmental support capacity of the Sepetiba Bay. In December 2019, the court rejected the preliminary injunction requested by the Public Prosecutor’s Office to suspend the licensing process. As of the date of this annual report, TECON has not yet received service of process for this public civil action.
In June 2019, we filed a lawsuit to contest a notification from INEA regarding suspension of the solid bulk operations at TECON due to these operations allegedly not being within the scope of permitted activities under TECON’s operating license. We also requested a preliminary injunction, which was granted, to suspend the effects of the notification and to continue solid bulk operations pending final judgment of the lawsuit. As of the date of this annual report, the proceeding is in its earlier stage in the lower court.
As a result of an accident involving a Brazilian mining company in November 2015, the state of Minas Gerais filed judicial proceedings against several mining companies, including us, based on a State Dam Inventory disclosed in 2014. The state seeks to investigate structures that do not provide technical stability guaranteed by an external auditor or which stability has not been attested to.
In March 2016, a public civil action was filed against us by the state of Minas Gerais and the State Environmental Foundation questioning the stability of a small structure installed inside an industrial area and used for collection and filtration of iron ore. After showing the action was based on outdated information, the state of Minas Gerais dismissed it. In August 2016, we were notified of a similar public civil action regarding another structure of ours, Dique do Engenho. We presented documents to the state authorities proving the stability and security of Dique do Engenho and expect that this action will also be dismissed.
40550.00004
104
In February 2018, the Public Prosecutor’s Office of the state of Minas Gerais filed a public civil action to compel our mining entity (Minérios Nacional) to take security measures at the Fernandinho dam complex. In March 2018, the injunction was partially granted to determine the adoption of security and control measures. We complied with the injunction and filed a counterclaim. The Public Prosecutor’s Office of the state of Minas Gerais is expected to file another counterclaim. In December 2018, FEAM and the state of Minas Gerais filed a public civil action pleading an injunction for us to present an emergency plan in relation to the Fernandinho dam complex and evidence of adoption of preventive structural measures, as well as definitive implementation of an emergency plan and a monthly security audit report.
In May 2017, CSN Mineração signed a TAC with SEMAD, aiming to promote environmental adaptations in its mining treatment unit. This TAC has been complied with and the respective environmental license duly issued.
In June 2017, CSN Mineração signed an additional TAC with SEMAD to formalize its application for a corrective installation license, promote environmental adaptations in its reutilization of mineral goods disposed in dams, infrastructure works and temporary disposal of materials. This TAC has been complied with and the respective environmental license duly issued.
In October 2017, CSN Mineração entered into an agreement with the Public Prosecutor’s Office of the state of Minas Gerais, agreeing to adopt certain measures, including some specified in the technical report prepared by the Public Prosecutor’s Office regarding the Casa de Pedra dam complex in order to adopt measures in compliance with the emergency plan for mining dams, as well as general recommendations on the location, works, types of dams and audits of the Casa de Pedra dam complex. We fulfilled the commitments listed in the agreement.
Other Legal Proceedings
We are defendants in other administrative and judicial proceedings involving claims in the aggregate amount of R$35,785 million as of December 31, 2019, as compared to R$31,612 million as of December 31, 2018, of which (i) R$32,110 million relate to tax contingencies as of December 31, 2019 (R$28,832 million as of December 31, 2018), (ii) R$1,814 million relate to civil contingencies as of December 31, 2019 (R$1,024 million as of December 31, 2018), (iii) R$1,560 million relate to labor contingencies and social security contingencies as of December 31, 2019 (R$1,537 million as of December 31, 2018) and (iv) R$300 million relate to environmental contingencies as of December 31, 2019 (R$220 million as of December 31, 2018). Our legal counsel has assessed these contingencies as entailing a risk of possible loss and, therefore, no provision has been recorded for these contingencies.
Independent Investigation
Following media reports about statements made as part of a plea bargain testimony in a criminal proceeding not involving us that irregular election funding of R$16.5 million was allegedly arranged by our chairman and chief executive officer and made by us in connection with the construction of the Long Steel Plant in Volta Redonda in the 2010-2014 period, in May 2017, our audit committee decided to engage external forensic specialists and legal advisors to conduct an independent investigation regarding these allegations.
The independent investigation was conducted over a seven-month period, as directed by our independent audit committee, and the specialists and advisors involved were provided access to members of our senior management, including our chairman and chief executive officer, and information and documents related to the contracts, parties and periods implicated in the allegations. In November 2017, the investigation, based on the data reviewed, concluded with no findings of misconduct by us involving the contracts and periods alleged, or any evidence of any misconduct involving the parties mentioned in the allegations. As a result, we have not recorded any contingencies in this regard.
In October 2017, we were informed that the Public Prosecutor’s Office opened an investigation into our chairman and chief executive officer regarding the same allegations. In February 2018, Brazil’s Supreme Court ruled that, because the case relates to alleged violations of an electoral nature, it did not belong in federal court. As a result, the Supreme Court ordered the withdrawal of the case from federal court and referred it to electoral court. We have not been the subject of any investigation by any governmental or enforcement agencies with respect to these allegations. Additionally, since the case’s referral to electoral court, no evidence or testimony has been requested to date and no new documents have been filed. We cannot assure that there will not be further facts or developments related to the inquiry, or further formal or informal allegations or related investigations against us, our affiliates or any of our officers, directors or shareholders, which could materially and adversely affect our reputation or the trading price of our common shares or ADSs.
40550.00004
105
Dividend Policy
General
Subject to certain exceptions set forth in Brazilian Corporate Law, our bylaws require that we pay a yearly minimum dividend equal to 25% of our adjusted net profits, calculated in accordance with Brazilian Corporate Law. Proposals to declare and pay dividends in excess of the statutory minimum dividend requirement are generally made at the recommendation of our board of directors and approved by the vote of our shareholders. Any such proposal will be dependent upon our results of operations, financial condition, cash requirements for our business, future prospects and other factors deemed relevant by our board of directors. We have a policy of paying dividends equal to all legally available net profits, after taking into consideration the following priorities: (i) our business strategy; (ii) the performance of our obligations; (iii) the accomplishment of our required investments; and (iv) the maintenance of our good financial status.
Brazilian companies are also permitted to pay limited amounts of interest on shareholders’ equity to holders of equity securities and to treat these payments as an expense for Brazilian income tax purposes. These payments, net of withholding income tax, may be included in determining whether the statutory minimum dividend requirement has been met, subject to shareholder approval.
For dividends declared during the past five years, see “Item 3A. Selected Financial Data.”
Amounts Available for Distribution
At each annual shareholders’ meeting, our board of directors is required to recommend how our earnings for the preceding fiscal year are to be allocated. For purposes of Brazilian Corporate Law, a company’s income, net of income tax and social contribution for any one fiscal year, any accumulated losses from prior fiscal years and amounts allocated to employees’ and management’s participation in earnings, represents its “net profits” for that fiscal year.
In accordance with Brazilian Corporate Law, shareholders are entitled to receive as a mandatory dividend for each fiscal year, either (i) the portion of the profits as may be stated in our bylaws or, in the event the latter is silent in this regard, (ii) an amount equal to 50% of the net profits as increased or reduced by: (a) amounts allocated to the legal reserve; (b) amounts allocated to the contingency reserve and the tax incentive reserve, if any; and (c) any reversion of contingency reserves constituted in prior years. The payment of dividends may be limited to the amount of net profits realized during the fiscal year, provided that the difference is recorded as a reserve for unrealized profits. Profits recorded in the reserve for unrealized profits, when realized and not absorbed by losses in subsequent years, have to be added to the first dividend declared after their realization. Under our bylaws, we are required to distribute to shareholders as dividends in respect of each fiscal year ending on December 31, to the extent profits are available for distribution, an amount equal to at least 25% of our adjusted net profits, which amount shall include any interest paid on capital during that year. See “––Mandatory Dividend” below.
Legal Reserve. Under Brazilian Corporate Law, we are required to maintain a “legal reserve” to which we must allocate 5% of our “net profits” for each fiscal year until the amount of the reserve equals 20% of our paid-in capital. However, we are not required to make any allocations to our legal reserve in a year in which the legal reserve, when added to our other established capital reserves, exceeds 30% of our capital stock. The amounts allocated to such reserve must be approved by our shareholders in our annual shareholders’ meeting, and may be used to increase our capital stock or to offset losses and, therefore, are not available for the payment of dividends.
Discretionary (or Statutory) Reserves. Under Brazilian Corporate Law, any corporation may provide in its bylaws for the creation of additional reserves, provided that the maximum amount that may be allocated to such reserves, the purpose of such reserves and the allocation criteria of such reserves are specified. There cannot be any allocation to such reserves if it affects payment of the mandatory dividend (as defined below). Our bylaws currently provide that our board of directors may propose to our shareholders the deduction of at least 1% from our net profits to be allocated to a working capital and investments reserve. Constitution of such reserve will not affect payment of the mandatory dividend. Our bylaws do not provide for any other discretionary reserve.
40550.00004
106
Contingency Reserve. Under Brazilian Corporate Law, a percentage of our “net profits” may be allocated to a contingency reserve for estimable losses that are considered probable in future years. Any amount so allocated in a prior year must either be reserved in the fiscal year in which the loss had been anticipated if the loss does not occur as projected or be written off in the event that the anticipated loss occurs.
Tax Incentive Reserve. Our shareholders in a shareholders’ meeting may, following a management’s proposal, allocate to a tax incentive reserve the portion of our “net profits” resulting from donations or governmental grants for investments, which may be excluded from the taxable basis of the mandatory dividend.
Unrealized Profits Reserve. Under Brazilian Corporate Law, we may allocate the amount by which the mandatory dividend exceeds our realized net profits in a given fiscal year to an unrealized profits reserve. Brazilian Corporate Law defines “realized net profits” for the period as the amount by which our “net profits” exceeds the sum of (i) positive equity net results and (ii) the net profits, gains or returns that will be realized after the end of the subsequent fiscal year. “Net profits” allocated to the unrealized profits reserve must be added to the next mandatory dividend distribution after those profits have been realized, if they have not been used to absorb losses in subsequent periods.
Retained Earnings Reserve. Under Brazilian Corporate Law, our shareholders may decide at a general shareholders’ meeting to retain a portion of our net profits as provided for in a previously approved capital expenditure budget. No allocation of net profits may be made to the retained earnings reserve in case such allocation affects payment of the mandatory dividend.
The balance of our profit reserves, except those for contingencies, tax incentives and unrealized profits, shall not be greater than our capital stock. If such reserves reach this limit, the manner in which we use this surplus will be decided at a shareholders’ meeting.
For purposes of determining reserve amounts, the calculation of “net profits” and allocations to reserves for any fiscal year are determined on the basis of financial statements prepared in accordance with Brazilian Corporate Law. Our audited consolidated financial statements included elsewhere in this annual report have been prepared in accordance with IFRS and, although our allocations to reserves and dividends are reflected in the financial statements, investors will not be able to calculate the allocations or required dividend amounts from these financial statements.
Capital Reserve. Under Brazilian Corporate Law, the capital reserve consists of premiums from the issuance of shares, goodwill reserves from mergers, sales of founders’ shares and sales of warrants. We do not consider amounts allocated to our capital reserve for purposes of determining mandatory dividends. Our capital stock is not currently represented by founders’ shares. In our case, any amounts allocated to the capital reserve may only be used to increase our capital stock, to absorb losses that surpass accumulated profits and profit reserves, or to redeem, reimburse or purchase shares.
Mandatory Dividend
Under our bylaws, we are required to distribute to shareholders as dividends in respect of each fiscal year ending on December 31, to the extent profits are available for distribution, an amount equal to at least 25% of our adjusted profits, or the mandatory dividend, in any particular year, which amount shall include any interest paid on capital during that year. See “––Additional Payments on Shareholders’ Equity” below. In addition to the mandatory dividend, our board of directors may recommend that shareholders receive an additional payment of dividends from other funds legally available. Any payment of interim dividends may be netted against the amount of the mandatory dividend for that fiscal year. Under Brazilian Corporate Law, if the board of directors determines prior to the annual shareholders’ meeting that payment of the mandatory dividend for the preceding fiscal year would be inadvisable in view of our financial condition, the mandatory dividend does not need to be paid. That type of determination must be reviewed by the fiscal committee, if one exists, and reported, together with the appropriate explanations, to our shareholders and to the CVM. Mandatory dividends not distributed as described above shall be registered as a special reserve and, if not absorbed by losses in subsequent fiscal years, shall be paid as a dividend as soon as our financial condition permits.
40550.00004
107
Payment of Dividends
We are required to hold annual shareholders’ meetings within the first four months after the end of our fiscal year at which an annual dividend may be declared. Additionally, our board of directors may declare interim dividends. Under Brazilian Corporate Law, dividends are generally required to be paid to the holder of record on a dividend declaration date within 60 days following the date the dividend was declared, unless a shareholders’ resolution sets forth another date of payment, which, in either case, must occur prior to the end of the fiscal year in which the dividend was declared. A shareholder has a three-year period from the dividend payment date to claim dividends (or interest on shareholders’ equity as described under “––Additional Payments on Shareholders’ Equity” below) in respect of its shares, after which we will no longer be liable for the dividend payments.
Our payments of cash distributions on common shares underlying the ADSs will be made in Brazilian currency to our ADR custodian on behalf of our ADR depositary. Our ADR custodian will then convert the proceeds into U.S. dollars and will cause the U.S. dollars to be delivered to our ADR depositary for distribution to holders of ADSs.
Additional Payments on Shareholders’ Equity
Brazilian companies are permitted to pay interest on shareholders’ equity to holders of equity securities and to treat those payments as a deductible expense for Brazilian income tax purposes. The amount of interest payable on shareholders’ equity is calculated based on the TJLP as determined by the Central Bank on a quarterly basis and applied to each shareholder’s portion of net equity.
The TJLP is based on the annual profitability average of Brazilian public internal and external debt. The TJLP for 2019 was 5.57%.
Interest on shareholders’ equity is deductible up to the greater of the following amounts: (i) 50% of our net income (before taking into account the amounts attributable to shareholders as interest on shareholders’ equity and the provision of corporate income tax but after the deduction of the provision of the social contribution on net profits) related to the period in respect of which the payment is made; or (ii) 50% of the sum of retained profits and profit reserves as of the date of the beginning of the fiscal year in respect of which the payment is made.
8B. Significant Changes
None.
Item 9. The Offer and Listing
9A. Offer and Listing Details
Our capital stock comprises common shares without par value (ações ordinárias) and each ADS represents one common share. Our common shares are traded on the B3 under the symbol “CSNA3.” The ADSs, which are issued under a deposit agreement with JPMorgan Bank, N.A., as depositary, and substantially all of which are held of record by the Depository Trust Company, are traded on the NYSE under the symbol “SID.” There were no significant trading suspensions of our common shares or the ADSs in the last three years.
9B. Plan of Distribution
9C. Regulation of Securities Markets
Trading on the B3 and NYSE
The B3 is the only Brazilian stock exchange on which private equity and private debt may be traded.
40550.00004
108
In May 2008, the São Paulo Stock Exchange and the Brazilian Mercantile and Futures Exchange merged, adopting the corporate name BM&FBOVESPA – Securities, Commodities and Futures Exchange (BM&FBOVESPA S.A. – Bolsa de Valores, Mercadorias e Futuros), or BM&FBOVESPA. In March 2017, BM&FBOVESPA and Cetip S.A. – Mercados Organizados merged, creating B3. The B3 is one of the largest exchanges worldwide in terms of market value, the second largest in the Americas and the leading exchange in Latin America.
When shareholders trade in common and preferred shares on the B3, the trade is settled in three business days after the trade date without adjustment of the purchase price for inflation. The seller is ordinarily required to deliver the shares to the exchange on the second business day following the trade date. The B3 equities clearing is responsible for the registration, settlement and risk management of trades with shares through the PUMA Trading System.
In order to better control volatility, the B3 has adopted a “circuit breaker” mechanism pursuant to which trading sessions may be suspended for a period of 30 minutes or one hour whenever the index of the stock exchange falls 10% or 15%, respectively, compared to the previous day’s closing index. If the market falls more than 20% compared to the previous day, the B3 may determine the suspension of trading in all markets for a defined period, at its sole discretion, and such decision must be disclosed to the market through the News Agency (ABO – Operações). The “circuit breaker” is not allowed to be started during the last 30 minutes of the trading session.
The B3 is significantly less liquid than the NYSE or other major exchanges in the world. As of December 31, 2019, the aggregate market capitalization of the B3 was equivalent to R$87.9 trillion and the 10 largest companies listed on the B3 represented approximately 58.9% of the total market capitalization of all listed companies. In contrast, as of December 31, 2019, the aggregate market capitalization of the NYSE was US$29.5 trillion. Although any of the outstanding shares of a listed company may trade on the B3, in most cases fewer than half of the listed shares are actually available for trading by the public, the remainder being held by small groups of controlling persons, by government entities or by one principal shareholder. See “Item 3D. Risk Factors—Risks Relating to Our Common Shares and ADSs—The relative volatility and illiquidity of the Brazilian securities markets may substantially limit your ability to sell the common shares underlying the ADSs at the price and time you desire.”
As of December 31, 2019, we accounted for approximately 5.9% of the market capitalization of all listed companies on the B3.
Regulation of the Brazilian Securities Markets
Brazilian securities markets are regulated by the CVM, which has regulatory authority over the stock exchanges and securities markets, as well as by the Central Bank, which has, among other powers, licensing authority over brokerage firms and regulates foreign investment and foreign exchange transactions. The Brazilian securities markets are governed by Law No. 6,385 dated December 7, 1976, as amended and supplemented, or the Brazilian Securities Law, the principal law governing the Brazilian securities markets, through Brazilian corporation law and regulations issued by the CVM, the Brazilian National Monetary Council (Conselho Monetário Nacional), or the CMN and the Central Bank. These laws and regulations, among others, provide for disclosure requirements applicable to issuers of traded securities, criminal sanctions for insider trading and price manipulation, and protection of minority shareholders. They also provide for licensing and oversight of brokerage firms and governance of Brazilian stock exchanges. However, the Brazilian securities markets are not as highly regulated and supervised as U.S. securities markets.
Under Brazilian Corporate Law, a company is either publicly held, (companhia aberta) or privately held (companhia fechada). All listed companies are registered with the CVM and are subject to reporting and regulatory requirements. A company registered with the CVM may trade its securities either on the B3 or in the Brazilian over-the-counter market. Shares of companies listed on the B3 may not simultaneously trade on the Brazilian over-the-counter market. The shares of a listed company may also be traded privately, subject to several limitations. To be listed on the B3, a company must be registered as a publicly held company with the CVM and apply for registration with the B3.
The trading of securities on the B3 may be halted at the request of a company in anticipation of a material announcement. Trading may also be suspended on the initiative of the B3 or the CVM, among other reasons, based on or due to a belief that a company has provided inadequate information regarding a significant event or has provided inadequate responses to inquiries by the CVM or the B3.
40550.00004
109
According to Law No. 6,385, dated December 7, 1976, a publicly held company must submit to the CVM and the B3 certain periodic information, including annual and quarterly reports prepared by management and independent auditors. This law also requires companies to file with the CVM shareholder agreements, notices of shareholders’ meetings and copies of the related minutes.
Pursuant to CVM Resolution No. 358, as amended, the CVM revised and consolidated its requirements regarding the disclosure and use of information related to material facts and acts of publicly held companies, including the disclosure of trading and acquisition of securities issued by publicly held companies.
Such requirements include provisions that:
· Establish the concept of a material fact that gives rise to reporting requirements. Material facts include decisions made by the controlling shareholders, shareholder and management resolutions or any other facts related to a company’s business (whether occurring within the company or otherwise related thereto) that may influence the price of its publicly traded securities, or the decision of investors to trade such securities or to exercise any of such securities’ underlying rights;
· Specify examples of facts that are considered material, which include, among others, the execution of agreements providing for a transfer of control, the entry or withdrawal of shareholders that provide any managing, financial, technological or administrative function to the company and any corporate restructuring undertaken among related companies;
· Oblige the investor relations officer, controlling shareholders, other officers, directors, members of the audit committee and other advisory boards to disclose material facts;
· Require simultaneous disclosure of material facts to all markets in which the company’s securities are admitted for trading;
· Require the acquirer of a controlling stake in a corporation to disclose material facts, including its intentions as to whether or not to de-list the corporation’s shares within one year from the acquisition of its controlling stake;
· Establish rules regarding disclosure requirements in the acquisition and disposal of a material ownership interest; and
· Forbid trading on the basis of material non-public information.
· Pursuant to CVM Rule No. 480, dated December 7, 2009, as amended, or CVM Rule No. 480, the CVM expanded the quantity and improved the quality of information required to be reported by issuers in Brazil. This rule provides the market with greater transparency and requires issuers to file annually a comprehensive reference form (Formulário de Referência) and a governance report (Informe de Governança). The reference form is in line with the shelf registration system recommended by the International Organization of Securities of Commissions (IOSCO) through which information is consolidated and subject to periodic update. Through the governance report we disclose information regarding governance practices set forth in the Brazilian Code of Corporate Governance, by the method of “practice or explain.” Each of our reference form and governance report are available on our investor relations website (www.ri.csn.com.br) or on the CVM’s website (http://www.cvm.gov.br).
The CVM also enacted Rule No. 481, dated December 17, 2009, as amended, to regulate two key issues involving general meetings of shareholders in publicly held companies: (i) the extent of information and documents to be provided in support of call notices (subject to prior disclosure to shareholders); and (ii) proxy solicitation for the exercise of voting rights. The rule aims to (i) improve the quality of information disclosed by publicly held companies to shareholders and to the market in general, favoring the use of the Internet; (ii) make the exercise of voting rights less costly and foster the participation of shareholders in general meetings, especially for companies with widely dispersed capital; and (iii) facilitate shareholder oversight of companies.
9D. Selling Shareholders
Not applicable.
40550.00004
110
9E. Dilution
Not applicable.
9F. Expenses of the Issue
Item 10. Additional Information
10A. Share Capital
Not applicable.
10B. Memorandum and Articles of Association
Registration and Corporate Purpose
We are registered with the Brazilian Department of Trade Registration under number 15,910. Our corporate purpose, as set forth in Article 2 of our bylaws, is to manufacture, transform, market, import and export steel products and steel derived by-products, as well as to explore other activities directly or indirectly related to this purpose, including: mining, cement and carbochemical business activities, the manufacture and assembly of metallic structures, construction, transportation, navigation and port activities; the generation, management and commercialization of energy; and the participation in the capital of other national or international companies.
Directors’ Powers
Pursuant to our bylaws, a director may not vote on a proposal, arrangement or contract in which the director’s interests conflict with our interests. In addition, our shareholders must approve the compensation of our management and, in case an aggregate amount is fixed, our board of directors is responsible for the allocation. There is no mandatory retirement age for our directors. A detailed description of the general duties and powers of our board of directors may be found in “Item 6A. Directors and Senior Management.”
Description of Capital Stock
Set forth below is certain information concerning our capital stock and a brief summary of certain significant provisions of our bylaws and Brazilian Corporate Law applicable to our capital stock. This description does not purport to be complete and is qualified by reference to our bylaws and to Brazilian law. For further information, see our bylaws incorporated in this annual report by reference.
Capital Stock
As of December 31, 2019, our capital stock comprised 1,387,524,047 common shares. Our bylaws authorize our board of directors to increase our capital stock to up to 2,400,000,000 common shares without an amendment to our bylaws. There are currently no classes or series of preferred shares issued or outstanding. We may purchase our own shares for purposes of cancellation or to hold them in treasury subject to certain limits and conditions established by the CVM and Brazilian Corporate Law. See “Item 16E. Purchases of Equity Securities by the Issuer and Affiliated Purchasers.”
Liability for Further Capital Calls
Pursuant to Brazilian Corporate Law, a shareholder’s liability is generally limited to the issue price of the subscribed or purchased shares. There is no obligation of a shareholder to participate in additional capital calls.
Voting Rights
Each common share entitles its holder to one vote at our shareholders’ meetings. According to CVM regulations, shareholders that represent at least 5% of our common shares may request cumulative voting in an election of our board of directors. Pursuant to Brazilian Corporate Law, shareholders holding at least 15% of our common shares have the right to appoint a member of our board of directors.
40550.00004
111
Shareholders’ Meetings
Pursuant to Brazilian Corporate Law, the shareholders present at an annual or extraordinary shareholders’ meeting, convened and held in accordance with Brazilian Corporate Law and our bylaws, are empowered to decide all matters relating to our corporate purpose and to pass any resolutions they deem necessary for our protection and well-being.
In order to participate in a shareholders’ meeting, a shareholder must be a record owner of the share on the day the meeting is held, and may be represented by a proxy.
Shareholders’ meetings are called, convened and presided over by the chairman of our board of directors or, in his absence, by whom he appoints. Brazilian Corporate Law requires that our shareholders’ meeting be convened by publication of a notice in the Diário Oficial do Estado de São Paulo, the official government publication of the state of São Paulo, and in a newspaper of general circulation in Brazil and in the city in which our principal place of business is located, currently the Jornal Folha de São Paulo – Edição Regional, at least 15 days prior to the scheduled meeting date and no fewer than three times (in accordance with CVM Instruction No. 599/2015, our shareholders’ meeting must be convened 30 days prior to the scheduled meeting). Both notices must contain the agenda for the meeting and, in the case of an amendment to our bylaws, an indication of the subject matter.
In order for a shareholders’ meeting to be held, shareholders representing a quorum of at least one-fourth of the voting capital must be present, except for meetings convened to amend our bylaws, where shareholders representing at least two-thirds of the voting capital must be present. A shareholder may be represented at a shareholders’ meeting by means of a proxy, appointed not more than one year before the meeting, who must be either a shareholder, a company officer or a lawyer. For public companies, such as us, the proxy may also be a financial institution. If no quorum is present, notice must be given in the manner described above, no fewer than eight days prior to the scheduled meeting date. On second notice, the meeting may be convened without a specific quorum requirement, subject to the minimum quorum and voting requirements for certain matters, as described below. A holder of shares with no voting rights may attend a shareholders’ meeting and take part in the discussion of matters submitted for consideration.
Except as otherwise provided by law, resolutions passed at a shareholders’ meeting require a simple majority vote, abstentions not considered. Pursuant to Brazilian Corporate Law, the approval of shareholders representing at least one-half of our issued and outstanding voting shares is required for the following actions: (i) to create a new class of preferred shares or disproportionately increase an existing class of preferred shares relative to the other classes of preferred shares, to change a priority, preference, right, privilege or condition of redemption or amortization of any class of preferred shares or to create any class of non-voting preferred shares that has a priority, preference, right, condition or redemption or amortization superior to an existing class of shares (in these cases, a majority of the issued and outstanding shares of the affected class is also required); (ii) to reduce the mandatory dividend; (iii) to change our corporate purpose; (iv) to merge into or consolidate with another company or to spin-off our assets; (v) to dissolve or liquidate our company; (vi) to cancel any liquidation procedure; (vii) to authorize the issuance of founders’ shares; and (viii) to participate in a centralized group of companies as defined under Brazilian Corporate Law.
Pursuant to Brazilian Corporate Law, shareholders voting at a shareholders’ meeting have the power to: (i) amend our bylaws; (ii) elect or dismiss members of our board of directors (and members of the Fiscal committee) at any time; (iii) receive and approve the annual management accounts, including the allocation of net profits and payment of the mandatory dividends and allocation to the various reserve accounts; (iv) authorize the issuance of debentures in general; (v) suspend the rights of a shareholder who has violated Brazilian Corporate Law or our bylaws; (vi) accept or reject the valuation of assets contributed by a shareholder in consideration of the subscription of shares in our capital stock; (vii) authorize the issuance of founders’ shares; (viii) pass resolutions authorizing reorganization of our legal form, a merger, consolidation or split of the company, dissolution and liquidation of the company, election and dismissal of our liquidators and to examine their accounts; and (ix) authorize management to declare the company insolvent and to request a recuperação judicial or recuperação extrajudicial (a procedure involving protection from creditors similar in nature to a reorganization under the U.S. Bankruptcy Code), among others.
40550.00004
112
Redemption Rights
Our common shares are not redeemable, except that a dissenting and adversely affected shareholder is entitled, under Brazilian Corporate Law, to obtain redemption upon a decision made at a shareholders’ meeting by shareholders representing at least one-half of the issued and outstanding voting shares to: (i) create a new class of preferred shares or to disproportionately increase an existing class of preferred shares relative to the other classes of preferred shares (unless these actions are provided for or authorized by our bylaws); (ii) modify a preference, privilege or condition of redemption or amortization conferred on one or more classes of preferred shares, or to create a new class with greater privileges than an existing class of preferred shares; (iii) reduce the mandatory distribution of dividends; (iv) change our corporate purpose; (v) merge us with another company or consolidate us; (vi) transfer all of our shares to another company in order to make us a wholly-owned subsidiary of that company (incorporação); (vii) approve the acquisition of control of another company at a price that exceeds certain limits set forth under Brazilian Corporate Law; (viii) approve our participation in a centralized group of companies as defined under Brazilian Corporate Law; (ix) conduct a spin-off that results in (a) a change of corporate purpose, (b) a reduction of the mandatory dividend or (c) any participation in a group of companies as defined under Brazilian Corporate Law; or (x) in the event that the entity resulting from (a) a merger or consolidation, (b) an incorporação as described above or (c) a spin-off of a listed company fails to become a listed company within 120 days of the shareholders’ meeting at which the decision was taken. The right of redemption lapses 30 days after publication of the minutes of the relevant shareholders’ meeting. We would be entitled to reconsider any action giving rise to redemption rights within 10 days following the expiration of those rights, if the redemption of shares of dissenting shareholders would jeopardize our financial stability. Law No. 9,457, dated May 5, 1997, which amended Brazilian Corporate Law, contains provisions which, among others, restrict redemption rights in certain cases and allow companies to redeem their shares at their market value, subject to certain requirements. According to Brazilian Corporate Law, the reimbursement value of the common shares must equal the book value, which is determined by dividing our net assets by the total number of shares issued by us, excluding treasury shares (if any).
Preemptive Rights
Except as provided for in Brazilian Corporate Law (such as in the case of mergers and public offerings), our bylaws allow each of our shareholders a general preemptive right to subscribe to shares in any capital increase, in proportion to his or her ownership interest. A minimum period of 30 days following the publication of notice of a capital increase is allowed for the exercise of the right and the right is transferable. In the event of a capital increase that would maintain or increase the proportion of capital represented by common shares, holders of ADSs will have preemptive rights to subscribe only to newly issued common shares. In the event of a capital increase that would reduce the proportion of capital represented by common shares, holders of ADSs will have preemptive rights to subscribe for common shares, in proportion to their ownership interest, only to the extent necessary to prevent dilution of their interest in us.
Form and Transfer
As our common shares are in registered form, the transfer of shares is governed by the rules of Article 31, paragraph 3, of Brazilian Corporate Law, which provides that a transfer of shares is effected by a transfer recorded in a company’s share transfer records upon presentation of valid share transfer instructions to the company by a transferor or its representative. When common shares are acquired or sold on a Brazilian stock exchange, the transfer is effected in our records by a representative of a brokerage firm or the stock exchange’s clearing system. Transfers of shares by a non-Brazilian shareholder are made in the same way and are executed by such shareholders’ local agent.
The B3 operates a central clearing system. A holder of our common shares may choose, at its discretion, to participate in this system and, in that case, all shares elected to be put into this system will be deposited in the custody of the B3 (through a Brazilian institution duly authorized to operate by the Central Bank and having a clearing account with the B3). The fact that those common shares are held in the custody of the B3 will be reflected in our register of shareholders. Each participating shareholder will, in turn, be registered in our register of beneficial shareholders maintained by the B3 and will be treated in the same way as registered shareholders.
Limitations on Ownership and Voting Rights by Non-Brazilians Shareholders
There are no restrictions on ownership or voting of our common shares by individuals or legal entities domiciled outside Brazil. However, the right to convert dividend payments and proceeds from the sale of common shares into foreign currency and to remit those amounts outside Brazil is subject to exchange control restrictions and foreign investment legislation which generally require, among other things, obtaining a certificate of registration under the Brazilian National Monetary Council’s Resolution No. 4,373 or its direct foreign investment regulations. See “Item 10D. Exchange Controls.”
40550.00004
113
Share Ownership Disclosure
There are no provisions in our bylaws governing the ownership threshold above which shareholder ownership must be disclosed. CVM regulations require the disclosure of (i) any direct or indirect acquisition or disposition of shares that exceeds 5%, 10%, 15%, and so on, of any class of capital stock of a listed company, (ii) acquisition of control of a listed company and (iii) the ownership of shares of capital stock of a listed company by members of such company’s board of executive officers, board of directors, audit committee, fiscal committee (if any) and any other consulting or technical body (if any) and certain relatives of those persons.
10C. Material Contracts
None.
10D. Exchange Controls
There are no restrictions on ownership or voting of our common shares by individuals or legal entities headquartered or domiciled outside Brazil. However, the right to convert dividend payments and proceeds from the sale of common shares into foreign currency and to remit those amounts outside Brazil is subject to exchange control restrictions and foreign investment legislation which generally require, among other things, obtaining a certificate of registration under the CMN.
According to Resolution No. 4,373, dated September 29, 2014, of the CMN, or Resolution 4,373, foreign investors may participate in almost all financial assets and engage in almost all transactions available in the Brazilian market, provided that certain requirements are fulfilled. Resolution 4,373 defines foreign investors as individuals and legal entities, mutual funds and others collective investment entities headquartered or domiciled outside Brazil. In accordance with Resolution 4,373 the foreign investor must:
· indicate at least one representative in Brazil, with powers to practice all the actions relating to its investments;
· complete the foreign investor registration form;
· register as a foreign investor before the CVM, and register its foreign investment before the Central Bank; and
· appoint a custodian, duly licensed by the Central Bank, if the Brazilian representative is not a financial institution.
Resolution 4,373, specifies the manner of custody and the permitted means for trading securities held by foreign investors. The offshore transfer or assignment of securities or other financial assets held by foreign investors pursuant to Resolution 4,373 is prohibited, except for transfers resulting from a corporate reorganization, or occurring upon the death of an investor by operation of law or will.
Resolution 4,373 also provides for the issuance of depositary receipts in foreign markets in respect of shares of Brazilian issuers. It provides that (i) proceeds from the sale of ADSs by holders of ADRs outside Brazil are not subject to Brazilian foreign investment controls and (ii) holders of ADSs who are not residents of a low-tax jurisdiction (país com tributação favorecida), as defined by Brazilian law, will be entitled to favorable tax treatment.
A certificate of registration has been issued in the name of JP Morgan Chase Bank, N.A., as our ADR depositary, and is maintained by Banco Bradesco S.A., our ADR custodian, on behalf of our ADR depositary. Pursuant to the certificate, our ADR custodian and our ADR depositary are able to convert dividends and other distributions with respect to the common shares represented by ADSs into foreign currency and remit the proceeds outside Brazil. Pursuant to CMN Resolution No. 4,373, in order for an investor to surrender ADSs for the purpose of withdrawing the shares represented thereby, the investor is required to appoint a Brazilian financial institution duly authorized by the Central Bank and the CVM to act as its legal representative, who shall be responsible, among other things, for keeping and updating the investors’ certificates of registrations with the Central Bank, which entitles registered foreign investors to trade the underlying shares directly on the B3.
40550.00004
114
A non-Brazilian holder of common shares may experience delays in obtaining a certificate of registration, which may delay remittances abroad. This kind of delay may adversely affect the amount, in U.S. dollars, received by the non-Brazilian holder.
Under current Brazilian legislation, the Brazilian government may impose temporary restrictions on remittances of foreign capital abroad in the event of a serious imbalance or an anticipated serious imbalance of Brazil’s balance of payments. See “Item 3D. Risk Factors—Risks Relating to our Common Shares and ADSs— If you surrender ADSs and withdraw common shares, you risk forfeiting Brazilian tax advantages and losing the ability to timely remit foreign currency abroad.”
10E. Taxation
The following is a summary of certain Brazilian and U.S. federal income tax consequences of the acquisition, ownership and disposition of our common shares or ADSs by an investor that holds such common shares or ADSs. This summary does not purport to address all material tax consequences of the acquisition, ownership and disposition of our common shares or ADSs, does not take into account the specific circumstances of any particular investor and does not address certain investors that may be subject to special tax rules.
This summary is based on the tax laws of the United States (including the Internal Revenue Code of 1986, as amended, or the Code, its legislative history, existing and proposed Treasury regulations thereunder, published rulings and court decisions) and Brazil, as in effect on the date hereof, which are subject to change (or changes in interpretation), possibly with retroactive effect. In addition, this summary is based in part upon the representations of the ADS depositary and the assumption that each obligation in our deposit agreement and any related agreement will be performed in accordance with its terms.
Although there is, at present, no income tax treaty between Brazil and the United States, the tax authorities of the two countries have had discussions that may result in such a treaty. Both countries have been accepting the offset of income taxes paid in one country against the income tax due in the other based on reciprocity. No assurance can be given, however, as to whether or when an income tax treaty will enter into force or how it will affect the U.S. Holders, as defined below, of our common shares or ADSs. Additionally, no assurance can be given that the countries will continue to accept this offset.
This discussion does not address any aspects of U.S. taxation (such as estate tax, gift tax and Medicare tax on net investment income) other than federal income taxation or any aspects of Brazilian taxation other than income, gift, inheritance and capital taxation. Prospective investors are urged to consult their own tax advisors regarding the Brazilian and U.S. federal, state and local tax consequences of the acquisition, ownership and disposition of our common shares and ADSs.
Brazilian Tax Considerations
The following discussion summarizes the principal Brazilian tax consequences of the acquisition, ownership and disposition of common shares or ADSs by a holder that is not domiciled in Brazil for purposes of Brazilian taxation (“Non-Resident Holder”). It is based on Brazilian law as currently in effect. Any change in such law may change the consequences described below, possibly with retroactive effect. This discussion does not specifically address all of the Brazilian tax considerations applicable to any particular Non-Resident Holder. Each Non-Resident Holder of common shares or ADSs should consult their own tax advisor concerning the Brazilian tax consequences of an investment in our common shares or ADSs.
A Non-Resident Holder of ADSs may withdraw them in exchange for common shares in Brazil. Pursuant to Brazilian law, the Non-Resident Holder may invest in common shares under Resolution 4,373, of September 2014, of the National Monetary Council (a “4,373 Holder”).
Taxation of Dividends and Interest on Shareholders’ Equity
Dividends, including stock dividends and other dividends, paid by us (i) to the ADS depositary in respect of the common shares underlying the ADSs or (ii) to a Non-Resident Holder in respect of common shares, are currently not subject to Brazilian withholding income tax, as far as such amounts are related to profits generated on or after January 1, 1996. Dividends relating to profits generated prior to January 1, 1996 may be subject to Brazilian withholding income tax at varying rates, depending on the year such profits have been generated, but CSN does not have any profits generated prior to January 1, 1996.
40550.00004
115
As of January 1, 2008, Brazil adopted new GAAP, following IFRS standards. Brazilian income taxes were then calculated under a temporary regime called Transitional Tax Regime (RTT, in the Portuguese acronym) meant to neutralize the impacts on the calculation of the corporate income tax in Brazil that could derive from the adoption of the new GAAP. Law 12,973 was then enacted in 2014, with the goal to adapt Brazilian tax legislation, based on the new GAAP, eliminating the RTT. With the introduction of the new rules, the law determined that, for fiscal year 2014, any dividends paid out of accounting profits which, for any reason, would be higher than the “tax profits” calculated according to the RTT, would be subject to withholding income tax in Brazil. Nonetheless, CSN does not have relevant accounting adjustments which could result in a lower “tax profit” as compared to the group’s accounting profit, reason why no withholding income tax shall be levied on any future distribution of dividends paid out of profits generated in 2014. As from fiscal year 2015, since there is no “tax profit” under the RTT, no potential exposure should exist, and the exemption for dividends is normally applicable again.
Since 1996, Brazilian companies have been permitted to pay limited amounts of interest on shareholders' equity to holders of equity securities and to treat those payments as a deductible expense for purposes of its Brazilian income tax and social contribution on net profits tax basis. For tax purposes, this interest is limited to the daily pro rata variation of the TJLP, as determined by the Central Bank from time to time, multiplied by the sum of determined net equity accounts of the Brazilian company, and the amount of the deduction may not exceed the greater of (i) 50% of the net income (before taking into account the amounts attributable to shareholders as interest on shareholders' equity and the provision of corporate income tax but after the deduction of the provision of the social contribution on net profits) related to the period in respect of which the payment is made; or (ii) 50% of the sum of retained profits and profits reserves as of the date of the beginning of the fiscal year in respect of which the payment is made. Payments of interest on shareholders’ equity are decided by the shareholders on the basis of the recommendations of our board of directors.
Payment of interest on shareholders’ equity to a Non-Resident Holder is subject to withholding income tax at the rate of 15%, or 25% if the Non-Resident Holder is domiciled in a tax haven. If the Non-Resident Holder is domiciled in Japan, due to a tax treaty signed with Brazil, the tax rate is 12.5%.
For this purpose, a “tax haven” or “low-tax regime” is a country or location (i) that does not impose income tax, (ii) where the income tax rate is lower than 20% or (iii) where the local legislation imposes restrictions on disclosing the shareholding composition or ownership of the investment (“Tax Haven Jurisdiction”). Ordinance No. 488, dated November 28, 2014, reduced to 17% the maximum income tax rate that may be imposed by a given jurisdiction for characterization of a Tax Haven Jurisdiction, as long as the jurisdiction complies with international tax transparency standards. Subsequently, tax authorities provided that compliance with such standards requires: (a) signature of or conclusion of negotiation to sign a treaty or agreement allowing the exchange of information related to identification of income beneficiaries, corporate structure, ownership of goods or rights or economic transactions and (b) commitment to the criteria defined in international anti-tax evasion forums of which Brazil is a member. Tax authorities regularly issue a list of jurisdictions which are considered Tax Haven Jurisdictions. This list is currently set forth in Normative Instruction No. 1,037/10, as amended.
These payments of interest on shareholders’ equity may be included as part of any mandatory dividend. To the extent payment of interest on shareholders’ equity is included, the company may be required to distribute to shareholders an additional amount to ensure that the net amount received by them, after payment of the applicable withholding income tax, plus the amount of declared dividends, is at least equal to the mandatory dividend.
No assurance can be given that our board of directors will not recommend that future distributions of income should be made by means of interest on shareholders’ equity instead of dividends.
Taxation of Gains
Capital gains realized by Non-Resident Holders on the disposition of common shares sold on the Brazilian stock exchange (which includes the transactions carried out on the organized over-the-counter market):
40550.00004
116
· are exempt, when realized by a Non-Resident Holder that (i) is a 4,373 Holder and (ii) is not resident or domiciled in a Tax Haven Jurisdiction;
· are subject to income tax at a rate of 15% in case of gains realized by (i) a Non-Resident Holder that (x) is not a 4,373 Holder and (y) is not resident or domiciled in a Tax Haven Jurisdiction; or (ii) a Non-Resident Holder that (x) is a 4,373 Holder and (y) is resident or domiciled in a Tax Haven Jurisdiction; and
· are subject to income tax at a rate of 25% in case of gains realized by a Non-Resident Holder that (i) is not a 4,373 Holder and (ii) is resident or domiciled in a Tax Haven Jurisdiction.
As a general rule, capital gains realized as a result of a disposition transaction are the positive difference between the amount realized on the disposition of the common shares and the respective acquisition cost.
According to Law No. 10,833/03, the gains recognized on a disposition of assets located in Brazil, such as our common shares, by a Non-Resident Holder, are subject to withholding income tax in Brazil. This rule is applicable regardless of whether the disposition is conducted in Brazil or abroad and/or if the disposition is or is not made to an individual or entity resident or domiciled in Brazil.
A withholding income tax of 0.005% will apply and can be offset against any income tax due on the capital gain. Such withholding does not apply to a 4,373 Holder that is not resident or domiciled in a Tax Haven Jurisdiction.
Any other gains realized on the disposition of common shares that are not carried out on the Brazilian stock exchange:
· are subject to income tax at rates varying from 15% to 22.5%, depending on the total amount of gains within two consecutive fiscal years (see table below) when realized by any Non-Resident Holder that is not resident or domiciled in a Tax Haven Jurisdiction, whether or not such holder is a 4,373 Holder; and
· are subject to income tax at a rate of 25% when realized by a Non-Resident Holder that is resident or domiciled in a Tax Haven Jurisdiction, whether or not such holder is a 4,373 Holder.
The capital gains rates described above, varying from 15% to 22.5%, shall be determined according to the following table:
|
Capital Gains Tax Rate |
Threshold (total gains on the sale of the same rights within two fiscal years) |
|
15% |
Total gains below R$5 million |
|
17.5% |
Total gains above R$5 million, but below R$10 million |
|
20% |
Total gains above R$10 million, but below R$30 million |
|
22.5% |
Total gains above R$30 million |
In the cases described above, if the gains are related to transactions conducted on the Brazilian non-organized over-the-counter market with intermediation, the withholding income tax of 0.005% will also apply and can be offset against any income tax due on the capital gain.
The statutory definition of a Tax Haven Jurisdiction for the purpose of income taxation on gains should differ depending on whether or not a holder is a 4,373 Holder. In the case of a 4,373 Holder, the definition of Tax Haven Jurisdiction should not comprise jurisdictions where the local legislation imposes restrictions on disclosing the shareholding composition or ownership of the investment. However, the list provided for in Normative Instruction No. 1,037/10 does not seem to differ from the Tax Haven Jurisdiction definition for the purposes of 4,373 Holders.
Any exercise of preemptive rights relating to common shares will not be subject to Brazilian withholding income tax. Gains realized by a Non-Resident Holder on the disposition of preemptive rights will be subject to Brazilian income tax according to the same rules applicable to disposition of common shares.
In the case of a redemption of common shares or a capital reduction, the positive difference between the amount received by the Non-Resident Holder and the acquisition cost of the common shares redeemed in reais is treated as capital gain derived from the sale or exchange of shares not carried out on a Brazilian stock exchange market and is therefore subject to income tax at rates of up to 25%.
40550.00004
117
Sale of ADSs by U.S. Holders to Other Non-Residents in Brazil
As discussed above, pursuant to Law No. 10,833, the sale of assets located in Brazil involving Non-Resident Holders is subject to Brazilian withholding income tax, regardless if the purchaser is a Brazilian resident or not. We believe that the ADSs do not fall within the definition of assets located in Brazil for the purposes of Law No. 10,833, and, thus, should not be subject to Brazilian withholding tax. However, due to the lack of any administrative or judicial guidance, there is no assurance that this interpretation would prevail. If the ADSs are deemed to be assets located in Brazil, gains recognized by a Non-Brazilian Holder from the sale or other disposition to either a non-resident or a resident in Brazil may be subject to income tax in Brazil according to the rules described in “––Taxation of Gains” above.
Gains on the Exchange of ADSs for Common Shares
The withdrawal of ADSs in exchange for common shares is not subject to Brazilian income tax, assuming compliance with applicable regulation regarding the registration of the investment with Central Bank.
Gains on the Exchange of Common Shares for ADSs
The deposit of common shares in exchange for the ADSs may be subject to Brazilian withholding income tax on capital gains if the amount previously registered with the Central Bank as a foreign investment in common shares or, in the case of other market investors under Resolution No. 4,373, the acquisition cost of the common shares, as the case may be, is lower than:
· the average price per common share on the Brazilian stock exchange on which the greatest number of such common shares were sold on the day of deposit; or
· if no common shares were sold on that day, the average price on the Brazilian stock exchange on which the greatest number of common shares were sold during the 15 preceding trading sessions.
The difference between the amount previously registered, or the acquisition cost, as the case may be, and the average price of the common shares, calculated as set forth above, is considered a capital gain subject to income tax at rates up to 25%. In some circumstances, there may be arguments that this tax treatment is not applicable in the case of 4,373 Holders that are not located in a Tax Haven Jurisdiction.
Tax on Financial Transactions
The Tax on Financial Transactions (Imposto sobre Operações de Crédito, Câmbio e Seguro ou relativas a Títulos ou Valores Mobiliários), or “IOF,” is imposed on foreign exchange, securities, credit and insurance transactions.
IOF on Foreign Exchange Transactions
Tax on foreign exchange transactions, or “IOF/Exchange,” may be levied on foreign exchange transactions (conversion of foreign currency in reais and conversion of reais into foreign currency), affecting either or both the inflow or outflow of investments. Currently, the general IOF/Exchange rate applicable to foreign currency exchange transactions is 0.38%.
The Brazilian Government may increase the rate of the IOF/Exchange to a maximum rate of 25% of the amount of the foreign exchange transactions at any time, but such an increase will only apply in respect to future foreign exchange transactions.
Currently, for most foreign exchange transactions related to this type of investment, the IOF/Exchange rate is zero.
40550.00004
118
IOF on Bonds and Securities Transactions
IOF may also be levied on transactions involving bonds and securities (“IOF/Securities”), including those carried out on a Brazilian stock, futures or commodities exchanges. The rate of the IOF/Securities applicable to most transactions involving common shares is currently zero percent. The Brazilian Government may increase the rate of the IOF/Exchange up to 1.5% per day at any time, but such an increase will only apply in respect of future transactions.
Other Brazilian Taxes
There are no Brazilian inheritance, gift or succession taxes applicable to the ownership, transfer or disposition of common shares or ADSs by a non-Brazilian holder, except for gift and inheritance taxes which are levied by some states of Brazil on gifts made or inheritances bestowed by individuals or entities not resident or domiciled in Brazil to individuals or entities resident or domiciled within that state in Brazil. There are no Brazilian stamp, issue, registration or similar taxes or duties payable by holders of common shares or ADSs.
U.S. Federal Income Tax Considerations
The summary discussion below is applicable to you only if you are a “U.S. Holder” or a “Non-U.S. Holder” (both as defined below) that holds the common shares or ADSs as “capital assets” (generally property held for investment) within the meaning of Section 1221 of the Internal Revenue Code of 1986, as amended (the “Code”). This summary is based upon the Code, its legislative history, Treasury regulations, administrative pronouncements of the U.S. Internal Revenue Service (the “IRS”) and judicial decisions, all as in effect on the date hereof, and all of which are subject to change (possibly with retroactive effect) and to differing interpretations. This summary does not describe any implications under state, local or non-U.S. tax law, or any aspect of U.S. federal tax law (such as the estate tax, gift tax, the alternative minimum tax or the Medicare tax on net investment income) other than U.S. federal income taxation.
This summary does not purport to address all the material U.S. federal income tax consequences that may be relevant to the holders of the common shares or ADSs, and does not take into account the specific circumstances of any particular investors, some of which (such as tax-exempt entities, banks or other financial institutions, insurance companies, dealers in securities or currencies, traders in securities that elect to use a mark-to-market method of accounting for their securities holdings, regulated investment companies, real estate investment trusts, partnerships and other pass-through entities, U.S. expatriates, investors that own, have owned or are treated as owning, directly, indirectly or constructively 10% or more of our stock by vote or value, “controlled foreign corporations”, certain investors who file applicable financial statements required to recognize income when the associated revenue is reflected on such financial statements, investors that hold the common shares or ADSs as part of a straddle, hedge, conversion or constructive sale transaction or other integrated transaction and persons whose functional currency is not the U.S. dollar) may be subject to special tax rules.
For purposes of this discussion, a U.S. Holder is any beneficial owner of common shares or ADSs that is (i) an individual who is a citizen or resident of the United States, (ii) a corporation (or other entity taxable as a corporation for U.S. federal income tax purposes) organized under the laws of the United States, any state thereof or the District of Columbia, (iii) an estate the income of which is subject to U.S. federal income tax without regard to its source, or (iv) a trust if a U.S. court is able to exercise primary supervision over administration of the trust and one or more U.S. persons have authority to control all substantial decisions of the trust or if the trust validly elects under applicable Treasury regulations to be taxed as a U.S. person. A “Non-U.S. Holder” is any beneficial owner of common shares or ADSs that is an individual, corporation, estate or trust who is neither a U.S. Holder nor a partnership for U.S. federal income tax purposes.
If a partnership (or any other entity taxable as a partnership for U.S. federal income tax purposes) holds our common shares or ADSs, the U.S. federal tax treatment of a partner will generally depend upon the status of the partner and upon the activities of the partnership. A prospective investor who is a partner of a partnership holding our shares should consult its own tax advisor.
In general, for U.S. federal income tax purposes, holders of American Depositary Receipts evidencing ADSs will be treated as the owners of the common shares represented by those ADSs, and exchanges of common shares for ADSs, and ADSs for common shares, will not be subject to U.S. federal income tax.
40550.00004
119
Taxation of Dividends
U.S. Holders
Under the U.S. federal income tax laws, and subject to the passive foreign investment company (“PFIC”) rules discussed below, U.S. Holders will include in gross income, as dividend income, the gross amount of any distribution paid by us (including (i) payments considered “interest” in respect of Shareholders’ equity under Brazilian law and (ii) amounts withheld in respect of Brazilian taxes and (iii) any additional amounts payable in respect of such withholding taxes as described above under “––Brazilian Tax Considerations—Taxation of Dividends and Interest on Shareholders’ Equity”) out of our current or accumulated earnings and profits (as determined for U.S. federal income tax purposes) when the distribution is actually or constructively received by the U.S. Holder, in the case of common shares, or by the ADS depositary, in the case of ADSs. Distributions in excess of current and accumulated earnings and profits, as determined under U.S. federal income tax principles, will be treated as a non-taxable return of capital to the extent of the U.S. Holder’s adjusted tax basis in the common shares or ADSs and thereafter as capital gain, which will be either long-term or short-term capital gain depending on whether the U.S. holder held the common shares or ADSs for more than one year. We do not intend to maintain calculations of our earnings and profits under U.S. federal income tax principles and, unless and until such calculations are made, U.S. Holders should assume all distributions are made out of earnings and profits and constitute dividend income.
The dividend income will not be eligible for the dividends-received deduction generally allowed to U.S. corporations in respect of dividends received from other U.S. corporations. Subject to certain exceptions for short-term and hedged positions certain non-corporate U.S. Holders (including individuals) may qualify for a maximum 20% rate of tax in respect of “qualified dividend income” received. Dividend income with respect to the ADSs will be qualified dividend income, provided that, in the year that a non-corporate U.S. Holder receives the dividend, the ADSs are readily tradable on an established securities market in the United States, and we were not in the year prior to the year in which the dividend was paid, and are not in the year in which the dividend is paid, a PFIC. Based on existing IRS guidance, it is not entirely clear whether dividends received with respect to the common shares not held through ADSs will be treated as qualified dividend income, because the common shares are not themselves listed on a U.S. exchange.
The amount of the dividend distribution includible in gross income of a U.S. Holder will be the U.S. dollar value of the real payments made, determined at the spot real/U.S. dollar rate on the date such dividend distribution is includible in the gross income of the U.S. Holder, regardless of whether the payment is in fact converted into U.S. dollars. A U.S. Holder should not recognize any foreign currency gain or loss in respect of such dividend if such reais are converted into U.S. dollars on the date received by the U.S. Holder. If the reais are not converted into U.S. dollars on the date of receipt, however, gain or loss, may be recognized upon a subsequent sale or other disposition of the reais. Such foreign currency gain or loss, if any, will be treated as ordinary income or loss from sources within the United States and will not be eligible for the special tax rate applicable to qualified dividend income. U.S. Holders should consult with their own tax advisors regarding the treatment of any foreign currency gain or loss if any reais received as a dividend on our common shares or ADSs is not converted into U.S. dollars on the date of receipt.
Dividends received by most U.S. holders will constitute foreign source “passive income” for foreign tax credit purposes. For purposes of the U.S. foreign tax credit limitation, foreign source income is separated into different “baskets,” and the credit for foreign taxes on income in any basket is limited to the U.S. federal income tax allocable to such income. Subject to limitations under U.S. federal income tax law concerning credits or deductions for foreign income taxes and certain exceptions for short-term and hedged positions, any Brazilian income tax withheld from dividends paid by us would be treated as a foreign income tax eligible for credit against a U.S. Holder’s U.S. federal income tax liability (or at a U.S. Holder’s election, may be deducted in computing taxable income if the U.S. Holder has elected to deduct all foreign income taxes paid or accrued for the relevant taxable year). The rules with respect to foreign tax credits are complex and U.S. Holders are urged to consult their own tax advisors regarding the availability of the foreign tax credit under their particular circumstances.
The U.S. Treasury Department has expressed concern that intermediaries in connection with depositary arrangements may be taking actions that are inconsistent with the claiming of foreign tax credits by U.S. persons who are holders of depositary shares. Accordingly, investors should be aware that the discussion above regarding the availability of foreign tax credits for Brazilian income tax withheld from dividends paid with respect to common shares represented by ADSs could be affected by future action taken by the U.S. Treasury Department.
40550.00004
120
Distributions of additional common shares to U.S. Holders with respect to their common shares or ADSs that are made as part of a pro rata distribution to all our Shareholders generally will not be subject to U.S. federal income tax.
Non-U.S. Holders
Dividends paid to a Non-U.S. Holder in respect of common shares or ADSs will not be subject to U.S. federal income tax unless those dividends are effectively connected with the conduct of a trade or business within the United States by the Non-U.S. Holder (or are attributable to a permanent establishment maintained in the United States by the Non-U.S. Holder, if an applicable income tax treaty so requires as a condition for the Non-U.S. Holder to be subject to U.S. taxation on a net income basis in respect of income from common shares or ADSs), in which case the Non-U.S. Holder generally will be subject to U.S. federal income tax in respect of the dividends in the same manner as a U.S. Holder. Any such effectively connected dividends received by a corporate Non-U.S. Holder may also, under certain circumstances, be subject to an additional “branch profits tax” (at a 30% rate or at a reduced rate as may be specified by an applicable income tax treaty).
Taxation of Capital Gains
U.S. Holders
Subject to the PFIC rules discussed below, upon a sale, redemption or other taxable disposition of common shares or ADSs, a U.S. Holder will recognize gain or loss for U.S. federal income tax purposes in an amount equal to the difference between the U.S. dollar value of the amount realized (before deduction of any Brazilian tax) and the U.S. Holder’s adjusted tax basis (determined in U.S. dollars) in the common shares or ADSs. Generally, a non-corporate U.S. Holder’s gain or loss may be subject to preferential rates where the property is held for more than one year. The deductibility of capital losses is subject to limitations under the Code.
Capital gain or loss, if any realized by a U.S. Holder on the sale, exchange or other taxable disposition of common shares or ADSs generally will be treated as U.S. source gain or loss for U.S. foreign tax credit purposes. Consequently, in the case of a gain from the disposition of a share or ADS that is subject to Brazilian income tax (see “—Brazilian Tax Considerations—Taxation of Gains”), the U.S. Holder may not be able to benefit from the foreign tax credit for that Brazilian income tax (i.e., because the gain from the disposition would be U.S. source income), unless the U.S. Holder can apply the credit against U.S. federal income tax payable on other income from foreign sources from the relevant foreign tax basket. Alternatively, the U.S. Holder may be able to take a deduction for the Brazilian income tax if it does not elect to claim a foreign income tax credit for any foreign taxes paid or accrued during the taxable year.
Non-U.S. Holders
A Non-U.S. Holder will not be subject to U.S. federal income tax in respect of gain recognized on a sale, exchange or other taxable disposition of common shares or ADSs unless:
· the gain is effectively connected with a trade or business of the Non-U.S. Holder in the United States (or is attributable to a permanent establishment maintained in the United States by that Non-U.S. Holder, if an applicable income tax treaty so requires as a condition for that Non-U.S. Holder to be subject to U.S. taxation on a net income basis in respect of gain from the sale or other disposition of the common shares or ADSs); or
· in the case of a Non-U.S. Holder who is an individual, that Non-U.S. Holder is present in the United States for 183 or more days in the taxable year of the sale and certain other conditions apply.
Effectively connected gains realized by a corporate Non-U.S. Holder may also, under certain circumstances, be subject to an additional branch profits tax (at a 30% rate or at a reduced rate as may be specified by an applicable income tax treaty).
40550.00004
121
Passive Foreign Investment Companies
Based on current estimates of our gross income, gross assets and the nature of our business, we believe that our common shares and ADSs should not be treated as stock of a PFIC for U.S. federal income tax purposes. There can be no assurances in this regard, however, because the application of the relevant rules is complex and involves some uncertainty. The PFIC determination is made annually and is based on the portion of our assets and income that is characterized as passive under the PFIC rules. Moreover, our business plans may change, which may affect the PFIC determination in future years.
In general, we will be a PFIC with respect to a U.S. Holder if, for any taxable year in which the U.S. Holder held ADSs or common shares, either (i) at least 75% of our gross income for the taxable year is passive income or (ii) at least 50% of the value (determined on the basis of a quarterly average) of our assets is attributable to assets that produce or are held for the production of passive income. For this purpose, passive income generally includes, among other things, dividends, interest, royalties, rents (other than certain rents and royalties derived in the active conduct of a trade or business), annuities and gains from assets that produce passive income. If a non-U.S. corporation owns at least 25% by value of the stock of another corporation, the non-U.S. corporation is treated for purposes of the PFIC tests as owning its proportionate share of the assets of the other corporation, and as receiving directly its proportionate share of the other corporation’s income.
If we are treated as a PFIC, a U.S. Holder that did not make a “mark-to-market election” or “QEF election,” each as described below, would be subject to special rules with respect to (a) any gain realized on the sale or other disposition of common shares or ADSs and (b) any “excess distribution” by CSN to the U.S. Holder (generally, any distributions to the U.S. Holder in respect of the common shares or ADSs during a single taxable year that are greater than 125% of the average annual distributions received by the U.S. Holder with respect to the common shares or ADSs during the three preceding taxable years or, if shorter, the U.S. Holder’s holding period for the common shares or ADSs). Under these rules, (i) the gain or excess distribution would be allocated ratably over the U.S. Holder’s holding period for the common shares or ADSs, (ii) the amount allocated to the taxable year in which the gain or excess distribution was realized would be taxable as ordinary income, (iii) the amount allocated to each prior year, with certain exceptions, would be subject to tax at the highest tax rate in effect for that year and (iv) the interest charge generally applicable to underpayments of tax would be imposed in respect of the tax attributable to each such prior year.
If we are treated as a PFIC and, at any time, we invest in non-U.S. corporations that are classified as PFICs (each, a “Subsidiary PFIC”), U.S. Holders generally will be deemed to own, and also would be subject to the PFIC rules with respect to, their indirect ownership interest in that Subsidiary PFIC. If we are treated as a PFIC, a U.S. Holder could incur liability for the deferred tax and interest charge described above if either (1) we receive a distribution from, or dispose of all or part of our interest in, the Subsidiary PFIC or (2) the U.S. Holder disposes of all or part of its common shares or ADSs.
The special PFIC tax rules described above will not apply to a U.S. Holder if the U.S. Holder makes an election (i) to “mark-to-market” with respect to the common shares or ADSs (a “mark-to-market election”) or (ii) to have us treated as a “qualified electing fund” (a “QEF election”). The QEF election is not available to holders unless we agree to comply with certain reporting requirements and provide the required annual information statements. The QEF and mark-to-market elections only apply to taxable years in which the U.S. Holder’s common shares or ADSs are treated as stock of a PFIC. Our ADR Depositary has agreed to distribute the necessary information to registered holders of ADSs.
A U.S. Holder may make a mark-to-market election, if the common shares or ADSs are “regularly traded” on a “qualified exchange.” Under applicable U.S. Treasury regulations, a “qualified exchange” includes a national securities exchange, such as the NYSE, that is registered with the SEC or the national market system established under the Exchange Act. Also, under applicable Treasury Regulations, PFIC securities traded on a qualified exchange are regularly traded on such exchange for any calendar year during which such stock is traded, other than in de minimis quantities, on at least 15 days during each calendar quarter. We cannot assure you that the ADSs will be eligible for a mark-to-market election.
A U.S. Holder that makes a mark-to-market election with respect to its ADSs must include for each taxable year in which the U.S. Holder’s common shares or ADSs are treated as shares of a PFIC, as ordinary income, an amount equal to the excess of the fair market value of the common shares or ADSs at the close of the taxable year over the U.S. Holder’s adjusted tax basis in the common shares or ADSs, and is allowed an ordinary loss for the excess, if any, of the adjusted tax basis over the fair market value of the common shares or ADSs at the close of the taxable year, but only to the extent of the amount of previously included mark-to-market inclusions (not offset by prior mark-to-market losses). These amounts of ordinary income, and any gain recognized on the sale, redemption or other taxable disposition of an ADS with respect to which such an election is in place, will not be eligible for the favorable tax rates applicable to qualified dividend income or long-term capital gains. A U.S. Holder’s tax basis in the common shares or ADSs will be adjusted to reflect any income or loss amounts on its annual inclusions. Although a U.S. Holder may be eligible to make a mark-to-market election with respect to its common shares or ADSs, no such election may be made with respect to the stock of any Subsidiary PFIC that such U.S. Holder is treated as owning, because such Subsidiary PFIC stock is not marketable. Thus, the mark-to-market election will not be effective to avoid all of the adverse tax consequences described above with respect to any Subsidiary PFICs. U.S. Holders should consult their own tax advisors regarding the availability and advisability of making a mark-to-market election with respect to their common shares of ADSs based on their particular circumstances.
40550.00004
122
A U.S. Holder that makes a QEF election will be currently taxable on its pro rata share of our ordinary earnings and net capital gain (at ordinary income and long-term capital gain rates, respectively) for each of our taxable years, regardless of whether we distributed the income and gain. The U.S. Holder’s basis in the common shares or ADSs will be increased to reflect taxed but undistributed income. Distributions of income that had previously been taxed will result in a corresponding reduction of tax basis in the common shares or ADSs and will not be taxed again as a distribution to the U.S. Holder.
In addition, notwithstanding any election that a U.S. Holder makes with regard to the common shares or ADSs, dividends that a non-corporate U.S. Holder receives from us will not constitute qualified dividend income if we are a PFIC either in the taxable year of the distribution or the preceding taxable year.
Special rules apply with respect to the calculation of the amount of the foreign tax credit with respect to excess distributions by a PFIC or, in certain cases, QEF inclusions.
A U.S. Holder who owns common shares or ADSs during any taxable year that we are a PFIC in excess of certain de minimis amounts and fails to qualify for certain other exemptions would be required to file IRS Form 8621. In addition, under certain circumstances, the temporary regulations also require a “United States person” (as such term is defined in the Code) that owns an interest in a PFIC as an indirect shareholder through one or more United States persons to file Form 8621 for any taxable year during which such indirect shareholder is treated as receiving an excess distribution in connection with the ownership or disposition of such interest, or reports income pursuant to a mark-to-market or QEF election, among other circumstances. U.S. holders should consult their own tax advisors regarding the application of the PFIC rules to the common shares or ADSs.
Backup Withholding and Information Reporting
U.S. Holders
Dividends paid on, and proceeds from the sale, redemption or other taxable disposition of common shares or ADSs received by a U.S. Holder generally will be subject to information reporting and backup withholding, unless, in the case of backup withholding, the U.S. Holder provides an accurate taxpayer identification number or in either case otherwise establishes an exemption. Backup withholding is not an additional tax. The amount of any backup withholding collected from a payment to a U.S. Holder will be allowed as a credit against the U.S. Holder’s U.S. federal income tax liability and may entitle the U.S. Holder to a refund, provided that certain required information is timely furnished to the IRS.
Non-U.S. Holders
If common shares are held by a Non-U.S. Holder through the non-U.S. office of a non-U.S. related broker or financial institution, backup withholding and information reporting generally would not be required. Information reporting, and possibly backup withholding, may apply if the common shares are held by a Non-U.S. Holder through a U.S., or U.S.-related, broker or financial institution, or the U.S. office of a non-U.S. broker or financial institution and the Non-U.S. Holder fails to provide appropriate information. Information reporting and backup withholding generally will apply with respect to ADSs if the Non-U.S. Holder fails to timely provide appropriate information. Non-U.S. Holders should consult their tax advisors regarding the application of these rules.
40550.00004
123
“Specified Foreign Financial Asset” Reporting
Owners of “specified foreign financial assets” with an aggregate value in excess of US$50,000 (and in some circumstances, a higher threshold), may be required to file an information report with respect to such assets with their U.S. federal income tax returns. “Specified foreign financial assets” generally include any financial accounts maintained by non-U.S. financial institutions as well as any of the following, but only if they are not held in accounts maintained by financial institutions: (i) stocks and securities issued by non-U.S. persons, (ii) financial instruments and contracts held for investment that have non-U.S. issuers or counterparties and (iii) interests in non-U.S. entities.
Prospective purchasers should consult their own tax advisors regarding the application of the U.S. federal income tax laws to their particular situations as well as any additional tax consequences resulting from purchasing, holding or disposing of common shares or ADSs, including the applicability and effect of the tax laws of any state, local or foreign jurisdiction, including estate, gift, and inheritance laws.
10F. Dividends and Paying Agents
Not applicable.
10G. Statement by Experts
10H. Documents on Display
We are subject to the information requirements of the Exchange Act and, accordingly, file reports and other information with the SEC. Reports and other information filed by us with the SEC may be inspected and copied at the public reference facilities maintained by the SEC at 100 F Street, N.E., Washington, D.C. 20549. You can obtain further information about the operation of the Public Reference Room by calling the SEC at +1 (800) SEC-0330. Our SEC filings are also available to the public from the SEC’s website at http://www.sec.gov. You may also inspect our reports and other information at the offices of the NYSE, 11 Wall Street, New York, New York 10005, on which the ADSs are listed. For further information on obtaining copies of our public filings at the NYSE, you should call (212) 656-5060. We also file financial statements and other periodic reports with the CVM.
10I. Subsidiary Information
Not applicable.
Item 11. Quantitative and Qualitative Disclosures About Market Risk
We are exposed to a number of different market risks arising from our normal business activities. Market risk is the possibility that changes in interest rates, currency exchange rates or commodities prices could adversely affect the value of our financial assets, liabilities, expected future cash flows or earnings. We maintain policies aimed at managing our exposure to these market risks. We may use financial instruments, such as derivatives, in order to achieve the main goals established by our board of directors to minimize our cost of capital and maximize our returns on financial assets, while observing credit and risk parameters, as determined by our board of directors. Derivatives are contracts whose value derives from one or more underlying financial instruments, indexes or prices defined in the contract. We only use well-understood and conventional derivative instruments for these purposes. These include futures and options traded on regulated exchanges and “over-the-counter” swaps, options and forward contracts.
Market Risk Exposures and Market Risk Management
Our treasury department is responsible for managing our market risk exposures. We use internal controls in order to:
· understand market risks;
· reduce our probability of financial losses; and
40550.00004
124
· reduce the volatility of our financial results.
The principal tools used by our treasury department are:
· Sensitivity Analysis. This measures the impact that movements in the price of different market variables such as interest rates and exchange rates will have in our earnings and cash flows; and
· Stress Testing. This measures the worst possible loss from a set of consistent scenarios to which probabilities are not assigned. The scenarios are deliberately chosen to include extreme changes in interest and currency exchange rates.
Following is a discussion of the primary market risk exposures that we face together with an analysis of our exposure to each one.
Interest Rate Risk
We are exposed to interest rate risk on short- and long-term instruments as a result of refinancing of fixed-rate instruments included in our consolidated debt. Consequently, in addition to managing the currency and maturity of our debt, we manage interest costs through a balance between floating rate debt, which has inherently higher risk, and fixed-rate debt. We may use derivatives to achieve the desired ratio between floating-rate debt and fixed-rate debt, which ratio varies according to market conditions.
We are exposed to the following floating interest rates:
· U.S. dollar LIBOR, due to our floating rate U.S. dollar-denominated debt (usually trade finance related) and our cash position held offshore in U.S. dollars, which is invested in short-term instrument;
· TJLP, due to real-denominated debt indexed to this interest rate; and
· CDI (benchmark Brazilian real overnight rate), due to our cash held in Brazil (onshore cash) and to our CDI indexed debt.
|
|
|
|
|
Maturities | ||||||||||
|
Exposure as of December 31, 2018* (amortization) |
|
Notional amount |
|
2019 |
|
2020 |
|
2021 |
|
2022 |
|
2023 |
|
Thereafter |
|
|
|
|
|
|
|
|
|
|
|
|
|
|
|
|
|
U.S. dollar LIBOR |
4,334 |
1,770 |
1,073 |
480 |
608 |
403 |
- | |||||||
|
|
||||||||||||||
|
U.S. dollar fixed rate |
12,126 |
1,949 |
- |
- |
3,728 |
- |
6,449 | |||||||
|
|
||||||||||||||
|
CDI |
10,037 |
955 |
2,363 |
2,619 |
2,928 |
1,172 |
- | |||||||
|
|
||||||||||||||
|
Euro fixed rate |
111 |
111 |
- |
- |
- |
- |
- | |||||||
|
|
||||||||||||||
|
TJLP |
881 |
69 |
56 |
55 |
54 |
65 |
583 | |||||||
|
|
||||||||||||||
|
Other |
602 |
299 |
84 |
159 |
60 |
- |
- | |||||||
|
|
|
|
|
|
|
|
|
|
|
|
|
|
|
|
|
|
|
|
|
Maturities | ||||||||||
|
Exposure as of December 31, 2018* (amortization) |
|
Notional amount |
|
2019 |
|
2020 |
|
2021 |
|
2022 |
|
2023 |
|
Thereafter |
|
|
|
|
|
|
|
|
|
|
|
|
|
|
|
|
|
U.S. dollar LIBOR |
4,800 |
969 |
2,348 |
1,021 |
462 |
- |
- | |||||||
|
|
||||||||||||||
|
U.S. dollar fixed rate |
10,449 |
1,835 |
3,383 |
- |
- |
1,356 |
3,875 | |||||||
|
|
||||||||||||||
|
CDI |
11,667 |
1,857 |
845 |
2,356 |
2,663 |
2,669 |
1,275 | |||||||
|
|
||||||||||||||
|
Euro fixed rate |
213 |
107 |
106 |
- |
- |
- |
- | |||||||
|
|
||||||||||||||
|
TJLP |
968 |
76 |
66 |
59 |
58 |
57 |
652 | |||||||
|
|
||||||||||||||
|
Other |
555 |
547 |
5 |
3 |
- |
- |
- | |||||||
|
|
|
|
|
|
|
|
|
|
|
|
|
|
|
|
40550.00004
125
*All figures in millions of reais.
Our cash and cash equivalents were as follows:
|
|
|
December 31, 2019 |
|
December 31, 2018 |
|
Exposure |
|
Cash in reais: |
|
397 |
|
778 |
|
CDI |
|
Cash in U.S. dollars: |
|
392 |
|
379 |
|
LIBOR |
The following table sets forth the average interest rate of our borrowings and financing:
|
|
|
|
Consolidated | |
|
|
|
|
As of December 31, 2019 | |
|
Average interest rate(*) |
Total Debt (in thousands of R$) | |||
|
US$ |
|
6.66% |
|
16,558,452 |
|
R$ |
5.71% |
11,161,806 | ||
|
EUR |
|
2.20% |
|
370,445 |
|
|
28,090,703 |
_______________________
(*) In order to determine the average interest rates for our borrowings and financing agreements with floating rates, we used rates as of December 31, 2019.
We may conduct U.S. dollar futures operations on the B3 to ensure the forward purchase or sale of U.S. dollars, which are settled by the difference in contracted R$/US$ buy or sell parity against the R$/US$ sell or buy parity, defined by the future U.S. dollar contracts traded on the B3 with daily adjustments and exchange swap agreements. The main purpose of these operations is to hedge liabilities indexed to the U.S. dollar from Brazilian real fluctuations, which are affected by market, economic, political, regulatory and geopolitical conditions, among others. The gains and losses from these contracts are directly related to U.S. dollar exchange and CDI fluctuations. The following tables set forth the duration of our U.S. dollar and fixed-rate derivatives:
|
December 31, 2019 |
|
|
|
|
|
|
|
|
|
(in millions, unless otherwise indicated) |
|
Functional Currency |
|
Notional Amount |
|
Average Interest |
|
Average Maturity (days) |
|
DI future |
Real |
- |
- |
- | ||||
|
|
|
|
|
|
|
|
|
|
|
Hedge accounting of export |
U.S. dollar |
2,531 |
- |
|||||
|
|
|
|
|
|
|
|
|
|
|
Hedge accounting net investment |
Euro |
24 |
- |
|||||
|
|
|
|
|
|
|
|
|
|
|
CDI-to-U.S. dollar swap |
U.S. dollar |
67 |
- |
|||||
|
|
|
|
|
|
|
|
|
|
|
Fixed rate-to-CDI interest rate swap |
|
Real |
|
|
- |
|
||
|
|
|
|
|
|
|
|
|
|
|
December 31, 2018 |
|
|
|
|
|
|
|
|
|
(in millions, unless otherwise indicated) |
|
Functional Currency |
|
Notional Amount |
|
Average Interest |
|
Average Maturity (days) |
|
DI future |
Real |
- |
- |
- | ||||
|
|
|
|
|
|
|
|
|
|
|
Hedge accounting of export |
U.S. dollar |
2,076 |
- |
|||||
|
|
|
|
|
|
|
|
|
|
|
Hedge accounting net investment |
Euro |
48 |
- |
|||||
|
|
|
|
|
|
|
|
|
|
|
CDI-to-fixed rate interest rate swap |
Real |
- |
- |
- | ||||
|
|
|
|
|
|
|
|
|
|
|
Fixed rate-to-CDI interest rate swap |
|
Real |
|
- |
|
- |
|
- |
40550.00004
126
Foreign Currency Exchange Rate Risk
Fluctuations in exchange rates can have significant effects on our operating results. They affect the value of our real-denominated assets, the carrying and repayment costs of our real-denominated financial liabilities, our real-denominated production costs, the cost of real-denominated capital items and the prices we receive in the Brazilian market for our finished steel products. We contract derivatives to manage certain of our net foreign exchange rate exposures, trying to balance our non-real denominated assets with our non-real denominated liabilities and using derivative instruments to match them. However, at any given time we may have significant foreign currency exchange rate risk exposure.
Our exposure to the U.S. dollar is due to the following contract categories:
· U.S. dollar-denominated debt;
· offshore cash;
· currency derivatives;
· U.S. dollar indexed accounts payable and receivable (usually related to international trade, i.e., imports and exports); and
· offshore investments, which comprise assets purchased offshore and denominated in U.S. dollars on our balance sheet.
|
|
|
December 31, 2018 |
December 31, 2019 |
|
U.S. dollar liabilities |
|
|
|
|
Loans and financing |
|
4,117 |
4,097 |
|
Trade accounts payable |
|
175 |
69 |
|
Intercompany loans |
|
- |
- |
|
Others |
|
4 |
3 |
|
Total liabilities |
|
4,296 |
4,169 |
|
|
|
|
|
|
U.S. dollar assets |
|
|
|
|
Offshore cash and cash equivalents |
|
377 |
105 |
|
Guarantee margin |
|
- |
- |
|
Trade accounts receivable |
|
358 |
346 |
|
Advances to suppliers |
|
- |
- |
|
Intercompany loans |
|
- |
- |
|
Other |
|
9 |
4 |
|
Total assets |
|
744 |
455 |
|
|
|
|
|
|
Total U.S. dollar exposure |
|
(3,552) |
(3,714) |
|
|
|
|
|
|
Cash flow – hedge accounting |
|
2,076 |
2,531 |
|
Total U.S. dollar net exposure |
|
(1,476) |
(1,116) |
|
Perpetual bonds |
|
1,000 |
1,000 |
|
Total U.S. dollar net exposure, excluding perpetual bonds |
|
(476) |
(116) |
Our exposure to the euro is due to the following contract categories:
· euro-denominated debt;
· offshore cash;
· euro indexed accounts payable and receivable (usually related to international trade, i.e., imports and exports); and
· offshore investments: assets that we bought offshore and that are denominated in euros on our balance sheet.
|
|
|
December 31, 2018 |
December 31, 2019 |
|
Euro liabilities |
|
|
|
|
Loans and financing |
|
49 |
24 |
|
Trade accounts payable |
|
8 |
10 |
|
Others |
|
1 |
1 |
|
Total liabilities |
|
58 |
35 |
|
|
|
|
|
|
Euro assets |
|
|
|
|
Offshore cash and cash equivalents |
|
3 |
11 |
|
Trade accounts receivable |
|
1 |
1 |
|
Intercompany loans |
|
- |
- |
|
Advances to suppliers |
|
- |
- |
|
Other |
|
5 |
6 |
|
Total assets |
|
9 |
18 |
|
|
|
|
|
|
Total euro exposure |
|
(49) |
(18) |
|
|
|
|
|
|
Derivative notional |
|
- |
- |
|
Investment – hedge accounting |
|
48 |
24 |
|
Perpetual bonds |
|
- |
- |
|
Total euro net exposure, excluding perpetual bonds |
|
(1) |
6 |
40550.00004
127
Offshore Investments
We have capitalized our offshore subsidiaries domiciled in U.S. dollar-based countries with equity investments, and those investments are accounted as U.S. dollar investments. The result is that they work as assets indexed to the U.S. dollar from an earnings perspective.
Commodity Price Risk
Fluctuations in the price of steel, iron ore and some of the commodities used in producing steel, such as zinc, aluminum, tin, coal, coke and energy, can have an impact on our earnings. We do not currently hedge our exposure to commodity price fluctuations.
Sensitivity Analysis
In the Brazilian macroeconomic environment, exchange rate variation is the most significant market risk we face.
The U.S. dollar/real exchange had an annual volatility of approximately 14% from 2017 to 2019.
Sensitivity Analysis of Derivative Financial Instruments and Foreign Exchange Exposure
Scenarios 1 and 2 represent 25% and 50% appreciation of the foreign currency, using the respective closing selling rate as of December 31, 2019, as reported by the Central Bank, as a benchmark.
The currencies used in the sensitivity analysis and the respective scenarios are as follows:
|
December 31, 2019 | ||||||||
|
Currency |
Exchange rate |
Probable scenario |
Scenario 1 |
Scenario 2 | ||||
|
U.S. dollar to real |
|
4.0307 |
|
4.4946 |
|
5.0384 |
|
6.0461 |
|
Euro to real |
4.5305 |
|
5.0038 |
|
5.6631 |
|
6.7958 | |
|
U.S. dollar to euro |
|
1.1234 |
|
1.1122 |
|
1.4043 |
|
1.6851 |
|
|
|
|
|
|
|
|
|
|
|
December 31, 2018 | ||||||||
|
Currency |
Exchange rate |
Probable scenario |
Scenario 1 |
Scenario 2 | ||||
|
U.S. dollar to real |
|
3.8748 |
3.7626 |
4.8435 |
5.8122 | |||
|
Euro to real |
4.4390 |
4.2833 |
5.5488 |
6.6585 | ||||
|
U.S. dollar to euro |
|
1.1456 |
|
1.1346 |
|
1.4320 |
|
1.7184 |
|
|
|
|
|
|
|
|
|
|
Set forth below are the effects on our income statement of scenarios 1 and 2:
40550.00004
128
|
Instruments |
Notional amount |
Risk |
Probable scenario (*) |
Scenario 1 |
Scenario 2 |
|
|
|
|
|
|
|
|
Hedge accounting of exports |
2,530,713 |
U.S. dollar |
1,173,998 |
2,550,136 |
5,100,272 |
|
|
|
|
|
|
|
|
Swap CDI x U.S. dollar |
67,000 |
U.S. dollar |
31,081 |
67,514 |
135,028 |
|
|
|
|
|
|
|
|
|
|
|
| ||
|
Exchange position functional currency (not including exchange derivatives above) |
(3,713,598) |
U.S. dollar |
(1,722,738) |
(3,742,100) |
(7,484,200) |
|
|
|
|
|
|
|
|
Consolidated exchange position (including exchange derivatives above) |
(1,115,885) |
U.S. dollar |
(517,659) |
(1,124,450) |
(2,248,900) |
|
|
|
|
|
|
|
|
Hedge accounting net investment |
24,000 |
Euro |
11,359 |
27,183 |
54,366 |
|
|
|
|
|
| |
|
Exchange position functional currency (not including exchange derivatives above) |
(17,915) |
Euro |
(8,479) |
(20,291) |
(40,582) |
|
|
|
|
|
| |
|
Consolidated exchange position (including exchange derivatives above) |
6,085 |
Euro |
2,880 |
6,892 |
13,784 |
|
|
|
|
|
|
|
|
Foreign exchange swap U.S. dollar to euro |
12,875 |
U.S. dollar |
(1,887) |
9,021 |
15,944 |
|
|
|
|
|
|
|
_______________________
(*) We calculated the probable scenario considering the following variations: 11.15% depreciation of the real against the U.S. dollar, 10.45% depreciation of the real against the euro and 1.0% appreciation of the euro against the U.S. dollar.
Source: Central Bank as of March 2, 2020.
Sensitivity Analysis of Changes in Interest Rates
Scenarios 1 and 2 represent 25% and 50%, respectively, interest volatility growth as of December 31, 2019.
|
(in thousands of RS) |
|
|
|
|
|
|
|
Impact on profit or loss | ||||
|
Changes in interest rates |
|
% p.a. |
|
Assets |
|
Liabilities |
|
Probable scenario (*) |
|
Scenario 1 |
|
Scenario 2 |
|
TJLP |
|
5.57 |
|
|
|
(870,637) |
|
(2,481) |
|
(12,124) |
|
(24,248) |
|
Libor |
|
1.91 |
|
|
|
(4,275,363) |
|
(57,620) |
|
(20,438) |
|
(40,876) |
|
CDI |
|
4.40 |
|
462,831 |
|
(10,148,220) |
|
(28,594) |
|
(106,539) |
|
(213,078) |
_______________________
(*) This sensitivity analysis assumes a probable scenario of interest rates as of December 31, 2019, as recorded in our assets and liabilities
Market Price Risk of Our Common Shares
We are exposed to the risk of changes in the market price of our common shares due to investments made and investments recorded at fair value through profit or loss.
Item 12. Description of Securities Other Than Equity Securities
American Depositary Shares
JP Morgan Chase Bank, N.A. serves as the depositary for the ADSs. ADR holders are required to pay various fees to the depositary, and the depositary may refuse to provide any service for which a fee is assessed until the applicable fee has been paid.
ADR holders are required to pay the depositary amounts in respect of expenses incurred by the depositary or its agents on behalf of ADR holders, including expenses arising from compliance with applicable law, taxes or other governmental charges, facsimile transmission or conversion of foreign currency into U.S. dollars.
40550.00004
129
ADR holders are also required to pay additional fees for certain services provided by the depositary, as set forth in the table below.
|
|
Fee payable by ADR holders | |
|
Issuance and delivery of ADRs, including in connection with share distributions or stock splits |
|
US$5.00 for each 100 ADSs (or portion thereof) |
|
Deposit of securities, including in respect of share, rights and other distributions |
|
US$5.00 for each 100 ADSs (or portion thereof) |
|
Withdrawal of deposited securities |
|
US$5.00 for each 100 ADSs (or portion thereof) |
Direct and Indirect Payments by the Depositary
The depositary reimburses us for certain expenses we incur in connection with the ADR program, subject to a ceiling agreed between us and the depositary from time to time. These reimbursable expenses currently include legal and accounting fees, listing fees, investor relations expenses and fees payable to service providers for the distribution of material to ADR holders. For the year ended December 31, 2019, these reimbursements were US$1.2 million.
Item 13. Defaults, Dividend Arrearages and Delinquencies
None.
Item 14. Material Modification to the Rights of Security Holders and Use of Proceeds
None.
Item 15. Controls and Procedures
Disclosure Controls and Procedures
We carried out an evaluation, under the supervision of our chief executive officer and chief financial officer, of the effectiveness of the design and operation of our disclosure controls and procedures, as defined in Rules 13a-15(e) and 15d-15(e) under the Exchange Act. Based on this evaluation, our chief executive officer and chief financial officer have concluded that, as of December 31, 2019, CSN’s disclosure controls and procedures are effective.
Management’s Report on Internal Control over Financial Reporting
Management is responsible for establishing and maintaining adequate internal control over financial reporting and for its assessment of the effectiveness of internal control over financial reporting.
Our internal control over financial reporting is a process designed under the supervision of our chief executive officer and chief financial officer and our audit committee and effected by our board of directors, management and other personnel to provide reasonable assurance regarding the reliability of financial reporting and the preparation of our consolidated financial statements for external purposes in accordance with IFRS.
Internal control over financial reporting includes those policies and procedures that (i) pertain to the maintenance of records that, in reasonable detail, accurately and fairly reflect the transactions and dispositions of our assets; (ii) provide reasonable assurance that transactions are recorded as necessary to permit preparation of financial statements in accordance with IFRS and that our receipts and expenditures are being made only in accordance with the authorization of our management and directors; and (iii) provide reasonable assurance regarding prevention or timely detection of unauthorized acquisition, use or disposition of our assets that could have a material effect on our financial statements.
Because of its inherent limitations, internal control over financial reporting may not prevent or detect material misstatements on a timely basis. Also, projections of any evaluation of effectiveness to future periods are subject to the risk that controls may become inadequate because of changes in conditions, or that the degree of compliance with the policies or procedures may deteriorate.
40550.00004
130
Management assessed the effectiveness of our internal control over financial reporting based on the criteria for effective internal control over financial reporting established in “Internal Control – Integrated Framework,” issued by the Committee of Sponsoring Organizations (COSO) of the Treadway Commission (2013). Based on this assessment, we concluded that our internal control over financial reporting is effective as of December 31, 2019.
Attestation Report of the Independent Registered Public Accounting Firm
Grant Thornton Auditores Independentes, our independent registered public accounting firm, audited, as of December 31, 2019, our internal control over financial reporting. For Grant Thornton Auditores Independentes’ report dated April 2, 2020, see our audited consolidated financial statements included elsewhere in this annual report.
Item 16. Reserved
16A. Audit Committee Financial Expert
Our audit committee comprises three members and each of them satisfies the audit committee membership independence requirements set forth by the SEC, the NYSE and the Brazilian Corporate Law. After reviewing the qualifications of the members of our audit committee, our board of directors has determined that each member of our audit committee qualifies as an “audit committee financial expert,” as defined by the SEC.
Our audit committee may be assisted by an external consultant, whenever necessary, that renders financial and consulting services, among others.
16B. Code of Ethics
We adopted a Code of Ethics in 1998, reinforcing our ethical standards and the values that apply to all of our employees, including executive officers and directors.
Our Code of Ethics was updated in 2015 and in February 2016 copies were distributed to each employee of the organization, to the members of our board of directors and our audit committee, each of who signed a commitment letter, reinforcing their dedication to our established values. Since 2017, our Code of Ethics is available on our intranet to be consulted and accepted by employees electronically. In our governance structure, the compliance area is responsible for our integrity program, which aims to ensure compliance with ethical standards of conduct and transparency. This program includes continuous training for our employees and employees of our third parties, and also monitoring of compliance with laws, regulations, policies and internal standards.
There was no amendment to or waiver from any provision of our Code of Ethics in 2019. Our Code of Ethics is in compliance with the SEC requirements for codes of ethics for senior financial officers. A copy of our Code of Ethics is available on our website at www.csn.com.br.
16C. Principal Accountant Fees and Services
Our interaction with our independent auditors with respect to the contracting of services unrelated to the external audit is based on principles that preserve the independence of the auditors and are otherwise permissible under applicable rules and regulations. For the fiscal years ended December 31, 2019 and 2018, Grant Thornton Auditores Independentes acted as our independent auditor.
The following table sets forth the services rendered and the related fees:
|
|
|
Year ended December 31, | ||
|
|
|
2018 |
|
2019 |
|
|
|
(in thousands of R$) | ||
|
Audit fees |
|
4,969 |
|
4,703 |
|
Audit – related fees |
|
259 |
|
1.535 |
|
Tax fees |
|
- |
|
- |
|
Total |
|
5,228 |
|
6,238 |
40550.00004
131
Audit Fees
Audit fees in 2019 and 2018 comprised the aggregate fees billed and billable by our independent auditors in connection with the audit of our consolidated financial statements, reviews of interim financial statements and attestation services that are provided in connection with statutory and regulatory filings or engagements.
Audit-Related Fees
In 2019 and 2018, audit-related fees in the above table are fees billed and billable by our independent auditors for services that are reasonably related to the performance of the audit or review of our financial statements.
Services additional to the examination of the financial statements are submitted for prior approval to our audit committee in order to ensure that they do not represent a conflict of interest or affect the auditors’ independence.
Tax Fees
In 2019 and 2018, there were no fees for tax services provided by our independent auditors.
16D. Exemptions from the Listing Standards for Audit Committees
Not applicable. For a discussion on our audit committee, see “Item 6C. Board Practices—Audit Committee.”
16E. Purchases of Equity Securities by the Issuer and Affiliated Purchasers
In 2014, in accordance with the limits and provisions of CVM Instruction No. 10/80, our board of directors approved various share buyback programs with the purpose of holding shares in treasury for subsequent disposal or cancellation. In 2018, we maintained 7,409,500 shares in treasury.
|
Program |
Board’s Authorization |
Authorized Quantity |
Program Period |
Number Bought Back |
Shares Cancellation |
Shares Sold |
Balance in Treasury |
|
1st |
03/13/2014 |
70,205,661 |
03/14/2014 04/14/2014 |
2,350,000 |
|
2,350,000 | |
|
2nd |
04/15/2014 |
67,855,661 |
04/16/2014 05/23/2014 |
9,529,500 |
|
11,879,500 | |
|
3rd |
05/23/2014 |
58,326,161 |
05/26/2014 06/25/2014 |
31,544,500 |
|
43,424,000 | |
|
4th |
06/26/2014 |
26,781,661 |
06/26/2014 07/17/2014 |
26,781,661 |
|
70,205,661 | |
|
5th |
07/18/2014 |
60,000,000 |
|
10,205,661 | |||
|
5th |
07/18/2014 |
64,205,661 |
07/18/2014 08/18/2014 |
240,400 |
|
10,446,061 | |
|
08/19/2014 |
10,446,061 |
|
|||||
|
6th |
08/19/2014 |
63,161,055 |
08/19/2014 09/25/2014 |
6,791,300 |
|
6,791,300 | |
|
7th |
09/29/2014 |
56,369,755 |
09/29/2014 12/29/2014 |
21,758,600 |
|
28,549,900 | |
|
8th |
12/30/2014 |
34,611,155 |
12/31/2014 03/31/2015 |
1,841,100 |
|
30,391,000 | |
|
9th |
03/31/2015 |
32,770,055 |
04/01/2015 06/30/2015 |
0 |
|
30,391,000 | |
|
|
04/20/2018 |
30,391,000 |
04/20/2018 04/30/2018 |
|
|
22,981,500 |
7,409,500 |
In April 2018 we sold 22,981,500 shares that we held in treasury at an average price of R$7.86 per share, equivalent to R$181million. We sold these shares at an average price of R$9.29 per share, totaling cash inflows in the amount of R$213 million. We recognized the surplus of R$32 million between the sale price of the shares and their purchase price in our capital reserve.
16F. Change in Registrant’s Certifying Accountant
Not applicable.
40550.00004
132
16G. Corporate Governance
Significant Differences between our Corporate Governance Practice and NYSE Corporate Governance Standards
We are subject to the NYSE corporate governance listing standards. As a foreign private issuer, the standards applicable to us are considerably different than the standards applied to U.S. listed companies. Under the NYSE rules, we are required only to: (i) have an audit committee or audit board, pursuant to an applicable exemption available to foreign private issuers, that meets certain requirements, as discussed below, (ii) provide prompt certification by our chief executive officer of any material non-compliance with any corporate governance rules and (iii) provide a brief description of the significant differences between our corporate governance practices and the NYSE corporate governance practices required to be followed by U.S. listed companies. The discussion of the significant differences between our corporate governance practices and those required of U.S. listed companies follows below.
Majority of Independent Directors
The NYSE rules require that a majority of the board of directors consist of independent directors. Independence is defined by various criteria, including the absence of a material relationship between the director and the listed company. Brazilian law does not have a similar requirement. Under Brazilian law, neither our board of directors nor our management is required to test the independence of directors before their election to the board. However, both Brazilian Corporate Law and the CVM have established rules that require directors to meet certain qualification requirements and that address the compensation and duties and responsibilities of, as well as the restrictions applicable to, a company’s executive officers and directors. While our directors meet the qualification requirements of Brazilian Corporate Law and the CVM, we do not believe that a majority of our directors would be considered independent under the NYSE test for director independence. Brazilian Corporate Law requires that our directors be elected by our shareholders at an annual shareholders’ meeting.
Executive Sessions
NYSE rules require that the non-management directors meet at regularly scheduled executive sessions without management present. Brazilian Corporate Law does not have a similar provision. According to Brazilian Corporate Law, up to one-third of the members of our board of directors can be elected from management. Mr. Benjamin Steinbruch, our chief executive officer, is also the chairman of our board of directors. There is no requirement that non-management directors meet regularly without management. As a result, the non-management directors on our board of directors do not typically meet in executive sessions without management present.
Nominating and Corporate Governance Committee
NYSE rules require that listed companies have a nominating and corporate governance committee composed entirely of independent directors and governed by a written charter addressing the committee’s required purpose and detailing its required responsibilities, which include, among others, identifying and selecting qualified board member nominees and developing a set of corporate governance principles applicable to the company. We are not required under Brazilian Corporate Law to have, and currently we do not have, a nominating and a corporate governance committee.
Compensation Committee
NYSE rules require that listed companies have a compensation committee composed entirely of independent directors and governed by a written charter addressing the committee’s required purpose and detailing its required responsibilities, which include, among others, reviewing corporate goals relevant to the chief executive officer’s compensation, evaluating the chief executive officer’s performance, approving the chief executive officer’s compensation levels and recommending to the board non-chief executive officer compensation, incentive compensation and equity-based plans. We are not required under applicable Brazilian law to have, and currently do not have, a compensation committee. Under Brazilian Corporate Law, the total amount available for compensation of our directors and executive officers and for profit-sharing payments to our executive officers is established by our shareholders at the annual shareholders’ meeting. The board of directors is then responsible for determining the individual compensation and profit-sharing of each executive officer, as well as the compensation of our board and committee members.
40550.00004
133
Audit Committee
NYSE rules require that listed companies have an audit committee that (i) is composed of a minimum of three independent directors who are all financially literate, (ii) meets the SEC rules regarding audit committees for listed companies, (iii) has at least one member who has accounting or financial management expertise and (iv) is governed by a written charter addressing the committee’s required purpose and detailing its required responsibilities. However, as a foreign private issuer, we need only to comply with the requirement that the audit committee meet the SEC rules regarding audit committees for listed companies to the extent compatible with Brazilian Corporate Law.
We have established an audit committee, which provides assistance to our board of directors in matters involving our accounting, internal controls, financial reporting and compliance. Our audit committee recommends the appointment of our independent auditors to our board of directors and reviews the compensation of, and coordinates with, our independent auditors. It also reports on our auditing policies and our annual audit plan prepared by our internal auditing team. Our audit committee evaluates the effectiveness of our internal financial and legal compliance controls and is comprised of up to three independent directors elected by our board of directors for two-year terms.
As of the date of this annual report, our audit committee comprises Mr. Yoshiaki Nakano, Mr. Antonio Bernardo Vieira Maia and Mr. Miguel Ethel Sobrinho. Our audit committee may be assisted by an external consultant, whenever necessary, that renders financial and consulting services, among others. Each of the members of our audit committee satisfies the audit committee membership independence requirements set forth by the SEC and the NYSE. Each of the members of our audit committee has been determined by our board of directors to qualify as an “audit committee financial expert” within the meaning of the rules adopted by the SEC relating to the disclosure of financial experts on audit committees in periodic filings pursuant to the Exchange Act. For further information on our audit committee, see “Item 6C. Board Practices—Fiscal Committee” and “Item 6C. Board Practices—Audit Committee.”
Code of Business Conduct and Ethics
NYSE rules require that listed companies adopt and disclose a code of business conduct and ethics for directors, officers and employees, and promptly disclose any waivers of the code for directors or executive officers. We have adopted a Code of Ethics applicable to all our employees, including our executive officers and directors, and it was updated in the beginning of 2016. We believe this code addresses the matters required to be addressed pursuant to the NYSE rules. For a further discussion of our Code of Ethics, see “Item 16B. Code of Ethics.”
Shareholder Approval of Equity Compensation Plans
NYSE rules require that shareholders be given the opportunity to vote on all equity compensation plans and material revisions thereto, with limited exceptions. We currently do not have any such plan and, pursuant to our bylaws, we would require shareholder approval to adopt an equity compensation plan.
Corporate Governance Guidelines
NYSE rules require that listed companies adopt and disclose corporate governance guidelines. We have adopted the following corporate governance guidelines, either based on Brazilian law or our Code of Ethics, institutional handbook or policies and procedures:
· insider trading policy for securities issued by us;
· disclosure of material facts;
· disclosure of annual financial reports;
· confidential policies and procedures; and
· Sarbanes-Oxley disclosure committee’s duties and activities.
40550.00004
134
16H. Mine Safety Disclosure
Not applicable as none of our mines are located in the United States and as such are not subject to the Federal Mine Safety and Health Act of 1977 or the Mine Safety and Health Administration.
Item 17. Financial Statements
See “Item 18. Financial Statements.”
PART III
Item 18. Financial Statements
Our following consolidated financial statements, together with the report of Grant Thornton Auditores Independentes thereon, are filed as part of this annual report.
|
|
|
| |
|
|
|
Page | |
|
Report of Independent Registered Public Accounting Firm |
|
FS-R1 | |
|
Report of Independent Registered Public Accounting Firm |
|
FS-R2 | |
|
|
|
| |
|
Consolidated financial statements: |
|
||
|
Balance sheets as of December 31, 2019 and 2018 |
|
FS- 1 | |
|
Statements of income for the years ended December 31, 2019, 2018 and 2017 |
FS- 3 | ||
|
Statements of comprehensive income the years ended December 31, 2019, 2018 and 2017 |
FS- 4 | ||
|
Statements of cash flows for the years ended December 31, 2019, 2018 and 2017 |
FS- 5 | ||
|
Statements of changes in shareholders’ equity for the years ended December 31, 2019, 2018 and 2017 |
FS- 7 | ||
|
Notes to consolidated financial statements |
FS- 9 | ||
|
|
|
|
|
Item 19. Exhibits
|
Exhibit |
|
Description |
|
Number |
|
|
|
2.1 |
|
Form of Amended and Restated Deposit Agreement dated November 1, 1997, as amended and restated as of November 13, 1997, among Companhia Siderúrgica Nacional, JP Morgan Chase Bank, N.A. (as successor to Morgan Guaranty Trust Company of New York), as successor depositary, and all holders from time to time of American Depositary Receipts issued thereunder, incorporated in this annual report by reference from our Registration Statement on Form F-6 filed with the SEC. |
|
|
||
|
|
||
|
2.4 |
Description of the registrant’s securities registered under Section 12 of the Exchange Act. | |
|
|
||
|
8.1 |
+ |
List of Subsidiaries. |
|
101.INS |
+ |
XBRL Instance Document. |
|
101.SCH |
+ |
XBRL Taxonomy Extension Schema. |
|
101.CAL |
+ |
XBRL Taxonomy Extension Scheme Calculation Linkbase. |
|
101.DEF |
+ |
XBRL Taxonomy Extension Scheme Definition Linkbase. |
|
101.LAB |
+ |
XBRL Taxonomy Extension Scheme Label Linkbase. |
|
101.PRE |
+ |
XBRL Instance Document. |
|
|
|
|
|
* Certain portions of the exhibit have been omitted from the public filing and were filed separately with the SEC with a request for confidential treatment. + Filed herewith. | ||
40550.00004
135
SIGNATURES
The registrant hereby certifies that it meets all the requirements for filing on Form 20-F and that it has duly caused and authorized the undersigned to sign this annual report on its behalf.
COMPANHIA SIDERÚRGICA NACIONAL
By: /s/ Benjamin Steinbruch
Name: Benjamin Steinbruch
Title: Chief Executive Officer
By: /s/ Marcelo Cunha Ribeiro
Name: Marcelo Cunha Ribeiro
Title: Chief Financial Officer and Investor Relations Officer
Dated: April 2, 2020
40550.00004
136
Report of Independent Registered Public Accounting Firm
Board of Directors and Shareholders
Companhia Siderúrgica Nacional
Opinion on internal control over financial reporting
We have audited the internal control over financial reporting of Companhia Siderúrgica Nacional and subsidiaries (the “Company”) as of December 31, 2019, based on criteria established in the 2013 Internal Control – Integrated Framework issued by the Committee of Sponsoring Organizations of the Treadway Commission (“COSO”). In our opinion, the Company maintained, in all material respects, effective internal control over financial reporting as of December 31, 2019, based on criteria established in the 2013 Internal Control – Integrated Framework issued by COSO.
We also have audited, in accordance with the standards of the Public Company Accounting Oversight Board (United States) (“PCAOB”), the consolidated financial statements of the Company as of and for the year ended December 31, 2019, and our report dated April 2nd, 2020 expressed an unqualified opinion on those financial statements.
Basis for opinion
The Company’s management is responsible for maintaining effective internal control over financial reporting and for its assessment of the effectiveness of internal control over financial reporting, included in the accompanying Management’s Report on Internal Control over Financial Reporting. Our responsibility is to express an opinion on the Company’s internal control over financial reporting based on our audit. We are a public accounting firm registered with the PCAOB and are required to be independent with respect to the Company in accordance with the U.S. federal securities laws and the applicable rules and regulations of the Securities and Exchange Commission and the PCAOB.
We conducted our audit in accordance with the standards of the PCAOB. Those standards require that we plan and perform the audit to obtain reasonable assurance about whether effective internal control over financial reporting was maintained in all material respects. Our audit included obtaining an understanding of internal control over financial reporting, assessing the risk that a material weakness exists, testing and evaluating the design and operating effectiveness of internal control based on the assessed risk, and performing such other procedures as we considered necessary in the circumstances. We believe that our audit provides a reasonable basis for our opinion.
FS - R1
Definition and limitations of internal control over financial reporting
A company’s internal control over financial reporting is a process designed to provide reasonable assurance regarding the reliability of financial reporting and the preparation of financial statements for external purposes in accordance with generally accepted accounting principles. A company’s internal control over financial reporting includes those policies and procedures that (1) pertain to the maintenance of records that, in reasonable detail, accurately and fairly reflect the transactions and dispositions of the assets of the company; (2) provide reasonable assurance that transactions are recorded as necessary to permit preparation of financial statements in accordance with generally accepted accounting principles, and that receipts and expenditures of the company are being made only in accordance with authorizations of management and directors of the company; and (3) provide reasonable assurance regarding prevention or timely detection of unauthorized acquisition, use, or disposition of the company’s assets that could have a material effect on the financial statements.
Because of its inherent limitations, internal control over financial reporting may not prevent or detect misstatements. Also, projections of any evaluation of effectiveness to future periods are subject to the risk that controls may become inadequate because of changes in conditions, or that the degree of compliance with the policies or procedures may deteriorate.
/s/ Grant Thornton Auditores Independentes
São Paulo, Brazil
April 02, 2020
Report of Independent Registered Public Accounting Firm
Board of Directors and Shareholders
Companhia Siderúrgica Nacional
Opinion on the consolidated financial statements
We have audited the accompanying consolidated balance sheets of Companhia Siderúrgica Nacional and subsidiaries (the “Company”) as of December 31, 2019 and 2018, and the related consolidated statements of income, comprehensive income, changes in shareholders’ equity and cash flows for each of the years in the three-year period ended December 31, 2019, and the related notes (collectively referred to as the “financial statements”). In our opinion, the financial statements present fairly, in all material respects, the financial position of the Company as of December 31, 2019 and 2018, and the results of its operations and its cash flows for each of the three years in the period ended December 31, 2019, in conformity with International Financial Reporting Standards (“IFRS”) as issued by the International Accounting Standards Board (“IASB”).
We also have audited, in accordance with the standards of the Public Company Accounting Oversight Board (United States) (“PCAOB”), the Company’s internal control over financial reporting as of December 31, 2019, based on criteria established in the 2013 Internal Control – Integrated Framework issued by the Committee of Sponsoring Organizations of the Treadway Commission (“COSO”), and our report dated April 2nd, 2020 expressed an unqualified opinion.
Change in accounting principle
As discussed in Note 13.a) to the financial statements, the Company has changed its method of accounting for lease arrangements as of January 1st, 2019 due to the adoption of IFRS 16 “Leases”.
Basis for opinion
These financial statements are the responsibility of the Company’s management. Our responsibility is to express an opinion on the Company’s financial statements based on our audit. We are a public accounting firm registered with the PCAOB and required to be independent with respect to the Company in accordance with the U.S. federal securities laws and the applicable rules and regulations of the Securities and Exchange Commission and the PCAOB.
We conducted our audits in accordance with the standards of the PCAOB. Those standards require that we plan and perform the audit to obtain reasonable assurance about whether the financial statements are
FS - R2
free of material misstatement, whether due to error or fraud. Our audits included performing procedures to assess the risks of material misstatement of the financial statements, whether due to error or fraud, and performing procedures that respond to those risks. Such procedures included examining, on a test basis, evidence supporting the amounts and disclosures in the financial statements. Our audits also included evaluating the accounting principles used and significant estimates made by management, as well as evaluating the overall presentation of the financial statements. We believe that our audits provide a reasonable basis for our opinion.
Critical Audit Matters
The critical audit matters communicated below are matters arising from the current period audit of the consolidated financial statements that were communicated or required to be communicated to the audit committee and that: (1) relate to accounts or disclosures that are material to the consolidated financial statements and (2) involved our especially challenging, subjective, or complex judgments. The communication of critical audit matters does not alter in any way our opinion on the consolidated financial statements, taken as a whole, and we are not, by communicating the critical audit matters below, providing separate opinions on the critical audit matters or on the accounts or disclosures to which they relate.
1. Recoverable value of the investment in jointly controlled subsidiary (Note 8)
The Company has an investment in jointly controlled subsidiary Transnordestina Logística S.A. (“TLSA”) as of December 31, 2019, including gain on loss of control, in the amount of R$1,460 million, whose recoverable value should be tested for impairment annually, as required by International Accounting Standard 36 “IAS 36” – Impairment of assets. The Company, as an investor, conducts its evaluation of fair value in accordance with IAS 36, under a method that considers the investee’s capacity to distribute dividends, named Dividend Discount Model, which considers the flow of dividends discounted at present value using the equity capital in addition to other metrics and risks factors that increase the discount rate used. Accordingly, this matter was considered a critical audit matter due to the uncertainty inherent in the process of determining the estimates and judgments involved in preparing future cash flows discounted to present value, such as projections of market demand, operating margins and discount rates that may significantly change the expected realization of the asset.
The primary procedures we performed to address this critical audit matter included:
· Evaluating and testing the design and operating effectiveness of the internal control framework implemented by Management related to impairment testing;
· Utilizing an internal specialist to evaluate the reasonableness of the model and certain significant assumptions used in Management’s assessment;
· Evaluating the assumptions used by Management to identify assumptions that are not consistent and/or reasonable;
2. Realization of deferred tax assets (Notes 2.s, 14.b and 14.c)
The Company and its subsidiaries have balances of deferred income tax and social contribution assets substantially related to tax losses, social contribution, and temporary differences arising from temporary provisions recognized. These balances of deferred taxes were recognized based on the utilization of future taxable income. As of December 31, 2019, the amount of deferred tax assets recognized in noncurrent assets was R$3,297 million.
The annual evaluation for the recoverability of these assets involves, significant judgment in relation to assumptions such as future taxable income, cash flow projections and future economic events.
The use of different assumptions may significantly change the expected realization of these assets and may require the additional recognition of impairment on such assets, which would consequently impact the financial statements. Due to these aspects, this issue was considered a critical audit matter.
The primary procedures we performed to address this critical audit matter included:
· Utilizing an internal valuation specialist to evaluate the reasonableness of the model and certain significant assumptions used in Management’s assessment;
· Evaluating the assumptions used by Management for reasonableness;
· Evaluating and testing the design and operating effectiveness of the internal control framework implemented by Management related to the analysis of the impairment of deferred tax assets;
· Utilizing an internal valuation specialist to evaluate the reasonableness of the cash flow model and certain significant assumptions used in Management’s assessment;
· Utilizing internal tax specialists to examine the calculation of permanent and temporary differences
Ability of the jointly-controlled subsidiary to obtain the necessary funds
As discussed in Note No 8.d) and 27.b) to the consolidated financial statements, the new railroad network of the joint-controlled entity Transnordestina Logística S.A. (“TLSA”) is currently under construction, and certain terms in the concession agreement are still under discussion with relevant government agencies. The completion of the project and consequent commencement of operations depend on the continuing contribution of funds by its shareholders and third parties. Those events or conditions, along with other matters described in such note, indicate that a material uncertainty exists. TLSA Management plans in regard to these matters are also described in Note No 8.d) and 27.b). The financial statements do not include any adjustments that might result from the outcome of this uncertainty.
/s/ Grant Thornton Auditores Independentes
We have served as the Company’s auditor since 2017.
São Paulo, Brazil
April 02, 2020
|
Companhia Siderúrgica Nacional and Subsidiaries |
| ||
|
Consolidated Balance Sheets as of December 31 |
|||
|
Thousands of Brazilian Reais |
|
|
|
|
|
| ||
|
Assets |
Note |
2019 |
2018 |
|
CURRENT ASSETS |
|||
|
Cash and cash equivalents |
3 |
1,088,955 |
2,248,004 |
|
Financial Investments |
4 |
2,633,173 |
895,713 |
|
Trade receivables |
5 |
2,047,931 |
2,078,182 |
|
Inventories |
6 |
5,282,750 |
5,039,560 |
|
Other current assets |
7 |
1,672,996 |
1,753,024 |
|
Total current assets |
12,725,805 |
12,014,483 | |
|
|
| ||
|
|
| ||
|
NON-CURRENT ASSETS |
|
| |
|
Financial Investments |
4 |
95,719 |
7,772 |
|
Deferred income taxes |
14.b |
2,473,304 |
89,394 |
|
Other non-current assets |
7 |
5,057,554 |
4,285,223 |
|
7,626,577 |
4,382,389 | ||
|
|
| ||
|
Investments in associates and joint controlled entities |
8.b |
3,584,169 |
5,630,613 |
|
Property, plant and equipment |
9 |
19,700,944 |
18,046,864 |
|
Intangible assets |
10 |
7,231,781 |
7,253,175 |
|
Total non-current assets |
38,143,471 |
35,313,041 | |
|
|
| ||
|
TOTAL ASSETS |
50,869,276 |
47,327,524 | |
|
The accompanying notes are an integral part of these consolidated financial statements. | |||
FS-1
|
Companhia Siderúrgica Nacional and Subsidiaries |
|||
|
Consolidated Balance Sheets as of December 31 |
|||
|
Thousands of Brazilian Reais |
|
|
|
|
|
|||
|
|
|||
|
|
| ||
|
Liabilities and shareholders’ equity |
Note |
2019 |
2018 |
|
|
|||
|
CURRENT LIABILITIES |
|||
|
Payroll and related taxes |
317,510 |
248,185 | |
|
Trade payables |
3,012,654 |
3,408,056 | |
|
Taxes payable |
541,027 |
251,746 | |
|
Borrowings and financing |
11 |
5,125,843 |
5,653,439 |
|
Other payables |
13 |
2,526,444 |
1,770,623 |
|
Provisions for tax, social security, labor and civil risks |
16 |
96,479 |
106,503 |
|
Total current liabilities |
11,619,957 |
11,438,552 | |
|
|
| ||
|
NON-CURRENT LIABILITIES |
|
| |
|
Borrowings and financing |
11 |
22,841,193 |
23,173,635 |
|
Other payables |
13 |
2,493,702 |
227,328 |
|
Deferred income taxes |
14.b |
589,539 |
601,731 |
|
Provisions for tax, social security, labor and civil risks |
16 |
526,768 |
685,953 |
|
Pension and healthcare plan |
26.c |
912,184 |
905,119 |
|
Provision for environmental liabilities and decommissioning of assets |
17 |
524,001 |
281,766 |
|
Total non-current liabilities |
27,887,387 |
25,875,532 | |
|
|
| ||
|
Shareholders’ Equity |
19 |
|
|
|
Issued capital |
4,540,000 |
4,540,000 | |
|
Capital reserves |
32,720 |
32,720 | |
|
Legal reserves |
|
278,576 |
189,122 |
|
Earnings reserves |
4,210,888 |
2,933,969 | |
|
Treasury Shares |
|
(58,264) |
(58,264) |
|
Other comprehensive income |
1,170,624 |
1,065,188 | |
|
Total equity attributable to owners of the Company |
10,174,544 |
8,702,735 | |
|
|
| ||
|
Non-controlling interests |
1,187,388 |
1,310,705 | |
|
|
| ||
|
Total equity |
11,361,932 |
10,013,440 | |
|
|
| ||
|
TOTAL LIABILITIES AND SHAREHOLDERS' EQUITY |
50,869,276 |
47,327,524 | |
|
| |||
|
The accompanying notes are an integral part of these consolidated financial statements. |
|||
FS-2
|
Companhia Siderúrgica Nacional and Subsidiaries |
| |||
|
Consolidated Statements of Income for the years ended December 31 |
||||
|
Thousands of Brazilian Reais, except for the earnings (loss) per common share |
| |||
|
|
|
| ||
|
Note |
2019 |
2018 |
2017 | |
|
Net Revenue from sales and/or services |
21 |
25,436,417 |
22,968,885 |
18,524,601 |
|
Cost of sales and/or services |
22 |
(17,263,264) |
(16,105,657) |
(13,596,141) |
|
|
|
|
| |
|
Gross profit |
8,173,153 |
6,863,228 |
4,928,460 | |
|
|
|
|
| |
|
Operating income (expenses) |
(4,631,236) |
83,332 |
(1,944,495) | |
|
Selling expenses |
22 |
(2,342,805) |
(2,263,688) |
(1,815,107) |
|
General and administrative expenses |
22 |
(511,065) |
(494,023) |
(415,841) |
|
Other operating income |
23 |
503,770 |
4,036,043 |
824,286 |
|
Other operating expenses |
23 |
(2,406,851) |
(1,330,706) |
(646,944) |
|
Equity in results of affiliated companies |
8.b |
125,715 |
135,706 |
109,111 |
|
|
|
| ||
|
Profit before financial income (expenses) and taxes |
3,541,917 |
6,946,560 |
2,983,965 | |
|
Financial income |
24 |
379,042 |
1,310,514 |
295,074 |
|
Financial expenses |
24 |
(2,510,226) |
(2,806,157) |
(2,758,701) |
|
|
|
| ||
|
Profit (Loss) before income taxes |
1,410,733 |
5,450,917 |
520,338 | |
|
|
|
| ||
|
Income tax and social contribution |
14.a |
833,778 |
(250,334) |
(409,109) |
|
|
|
| ||
|
Profit (Loss) from continued operations |
|
2,244,511 |
5,200,583 |
111,229 |
|
|
|
|
|
|
|
Net income (loss) for the year |
2,244,511 |
5,200,583 |
111,229 | |
|
|
|
| ||
|
Profit (Loss) for the year attributed to: |
|
|
| |
|
Controlling interests |
1,789,067 |
5,074,136 |
10,272 | |
|
Non-controlling interests |
455,444 |
126,447 |
100,957 | |
|
|
|
| ||
|
Earnings (loss) per common share - (reais/share) |
|
|
| |
|
Basic |
19.g |
1.29632 |
3.69498 |
0.00757 |
|
Diluted |
19.g |
1.29632 |
3,69498 |
0.00757 |
The accompanying notes are an integral part of these consolidated financial statements.
FS-3
|
Companhia Siderúrgica Nacional and Subsidiaries |
|
| ||
|
Consolidated Statements of Comprehensive Income for the years ended December 31 |
|
|||
|
Thousands of Brazilian Reais |
|
|
|
|
|
|
||||
|
Note |
2019 |
2018 |
2017 | |
|
Consolidated profit (loss) for the year |
|
2,244,511 |
5,200,583 |
111,229 |
|
|
|
|
|
|
|
Items that will not be subsequently reclassified to the statement of income |
|
|
|
|
|
Actuarial (losses)/gains on defined benefit plan from investments in subsidiaries |
|
424 |
903 |
(12) |
|
Actuarial (losses)/gains on defined benefit pension plan |
|
(113,518) |
413 |
(203,022) |
|
Income tax and social contribution on actuarial (losses) gains on defined benefit pension plan |
|
|
|
(1,073) |
|
|
|
(113,094) |
1,316 |
(204.107) |
|
Items that could be subsequently reclassified to the statement of income |
|
|
|
|
|
Cumulative translation adjustments for the year |
|
32,922 |
(87,101) |
170,342 |
|
Fair Value through other comprehensive income |
|
|
(1,559,680) |
847,849 |
|
(Loss)/Gain on change in percentage of investments |
|
(2,288) |
(105) |
2,814 |
|
(Loss) gain on cash flow hedge accounting |
12.b |
(604,828) |
(1,415,962) |
(50,987) |
|
Cash Flow hedge reclassified to income statement |
12.b |
790,353 |
370,191 |
92,140 |
|
(Loss) /gain on hedge of net investments in foreign subsidiaries |
12.b |
2,472 |
(21,852) |
(39,893) |
|
(Loss) / gain on business combination |
|
|
(651) |
4,415 |
|
|
|
218,631 |
(2,715,160) |
1,026,680 |
|
|
|
|
|
|
|
Other comprehensive income |
|
105,537 |
(2,713,844) |
822,573 |
|
|
|
|
|
|
|
Comprehensive income (loss) for the year |
|
2,350,048 |
2,486,739 |
933,802 |
|
Attributable to: |
|
|
|
|
|
Attributed to owners of the Company |
|
1,894,503 |
2,360,292 |
832,845 |
|
Attributed to non-controlling interests |
|
455,545 |
126,447 |
100,957 |
The accompanying notes are an integral part of these consolidated financial statements.
FS-4
|
Companhia Siderúrgica Nacional and Subsidiaries | ||||||||||||||||||
|
Consolidated Statements of Cash Flows for the years ended December 31 | ||||||||||||||||||
|
Thousands of Brazilian Reais |
|
Note |
2019 |
2018 |
2017 | |
|
Profit (Loss) for the year |
|
2,244,511 |
5,200,583 |
111,229 |
|
Adjustments to reconcile net income (loss) to net cash provided by operations: | ||||
|
Accrued charges on borrowings and financing |
1,879,116 |
1,938,077 |
2,346,598 | |
|
Charges on loans and financing granted |
|
(58,728) |
(50,239) |
(54,777) |
|
Depreciation/ depletion / amortization |
9 and 10 |
1,519,331 |
1,273,021 |
1,453,335 |
|
Equity in results of affiliated companies |
8.b |
(125,715) |
(135,706) |
(109,111) |
|
Charges on lease liabilities. |
|
52,607 |
|
|
|
Deferred income tax and social contribution |
(2,398,400) |
(576,895) |
50,128 | |
|
Provision for tax, social security, labor and civil risks |
|
(164,223) |
(34,279) |
10,166 |
|
Monetary variations and exchange differences |
853,449 |
1,002,137 |
250,660 | |
|
Gain/(Loss) of derivative financial instruments |
12.b |
|
|
(28,503) |
|
Contractual agremeent |
|
(131,817) |
|
|
|
Eletrobrás's compulsory loan |
23 |
|
|
(755,151) |
|
Proceeds from disposal of fixed and intangible assets |
9 and10 |
114,603 |
38,245 |
28,127 |
|
|
|
|
|
|
|
Provision (Reversal) for consumption and services |
|
(130,339) |
55,726 |
(44,921) |
|
Provision for actuarial liabilities |
(20,194) |
(20,984) |
(36,953) | |
|
PIS and COFINS credits |
|
(160,609) |
(2,208,462) |
|
|
Net gain on sale of a foreign subsidiary |
23 |
|
(1,164,294) |
|
|
Provision for environmental liabilities and decommissioning of assets |
17 |
17,110 |
(55,247) |
(10,051) |
|
Updated shares – Fair value through profit or loss (VJR) |
23 |
118,780 |
(1,655,813) |
|
|
Other provisions |
104,869 |
(21,877) |
82,682 | |
|
|
3,714,351 |
3,583,993 |
3,293,458 | |
|
Changes in assets and liabilities | ||||
|
Trade receivables - third parties |
|
49,338 |
99,223 |
(300,449) |
|
Trade receivables - related parties |
(77,271) |
22,071 |
14,449 | |
|
Inventories |
|
(218,242) |
(800,050) |
(442,109) |
|
Receivables from related parties/Dividends |
99,276 |
113,800 |
68,224 | |
|
Recoverable taxes |
|
14,051 |
238,181 |
(100,470) |
|
Judicial deposits |
19,312 |
(7,496) |
(6,720) | |
|
Trade payables |
(354,288) |
925,176 |
711,953 | |
|
Trade payables – Drawee risk |
|
1,055,546 |
65,766 |
|
|
Payroll and related taxes |
|
36,271 |
(1,100) |
(3,658) |
|
Taxes in installments - REFIS |
280,413 |
(23,806) |
23,775 | |
|
Payables to related parties |
|
1,956 |
129,031 |
46,081 |
|
Advance from customer |
|
2,524,826 |
|
|
|
Interest paid |
(2,039,112) |
(2,141,710) |
(2,634,931) | |
|
Other |
|
(234,548) |
5,026 |
(97,752) |
FS-5
|
Increase (Decrease) in assets and liabilities |
1,157,528 |
(1,375,888) |
(2,721,607) | |
|
Net cash generated by operating activities |
|
4,871,879 |
2,208,105 |
571,851 |
|
|
|
|
|
|
|
Investments / acquisition of shares |
|
(209,832) |
(218,840) |
|
|
Purchase of property, plant and equipment |
9 |
(2,214,456) |
(1,317,102) |
(1,059,481) |
|
Receipt/(Payment) in derivative transactions |
(230) |
(372) |
30,453 | |
|
Purchase of intangible assets |
10 |
(1,427) |
(2,200) |
(622) |
|
Loans granted to related parties |
(101,913) |
(101,908) |
(49,072) | |
|
Loans received from related parties |
23,623 |
|
4,819 | |
|
Financial investment, net of redeemed amount |
|
289,213 |
(167,773) |
24,679 |
|
Cash received by disposal of Usiminas’ shares |
|
|
39,377 |
|
|
Net cash received from the sale of a foreign subsidiary |
|
|
1,670,359 |
|
|
Cash used to acquire interest in CBSI |
|
(21,345) |
|
|
|
Net cash used in investing activities |
|
(2,236,367) |
(98,459) |
(1,049,224) |
|
Borrowings and financing raised |
11.b |
10,068,627 |
2,143,679 |
534,506 |
|
Cost of borrowing |
|
(67,362) |
(92,287) |
(238) |
|
Payment of borrowings |
11.b |
(11,775,093) |
(5,019,978) |
(1,528,023) |
|
Amortization of leases |
|
(94,727) |
|
|
|
Payment of dividends and interests on shareholder’s equity |
(1,920,309) |
(502,002) |
| |
|
Treasury shares |
|
213,402 |
| |
|
Net cash used in financing activities |
|
(3,788,864) |
(3,257,186) |
(993,755) |
|
|
|
|
| |
|
Exchange rate changes on cash and cash equivalents of foreign subsidiaries |
|
(5,697) |
(16,028) |
11,538 |
|
|
|
|
|
|
|
Increase (Decrease) in cash and cash equivalents |
(1,159,049) |
(1,163,568) |
(1,459,590) | |
|
Cash and cash equivalents at the beginning of the year |
|
2,248,004 |
3,411,572 |
4,871,162 |
|
Cash and cash equivalents at the end of the year |
3 |
1,088,955 |
2,248,004 |
3,411,572 |
The accompanying notes are an integral part of these consolidated financial statements.
FS-6
|
Companhia Siderúrgica Nacional and Subsidiaries |
|
Consolidated Statement of Changes in Shareholders´ Equity |
|
Thousands of Brazilian reais |
|
Paid-in Capital |
Capital Reserve |
Earnings Reserve |
Retained earnings/ (accumulated losses) |
Other comprehensive income |
Shareholders´Equity |
Non-Controlling interests |
Consolidated Equity | |
|
Balances at December 31, 2016 |
4,540,000 |
30 |
|
(1,301,961) |
2,956,459 |
6,194,528 |
1,189,993 |
7,384,521 |
|
|
|
|
|
|
|
|
|
|
|
Total comprehensive income |
|
|
|
10,272 |
822,573 |
832,845 |
100,957 |
933,802 |
|
Profit (loss) for the year |
|
|
|
10,272 |
|
10,272 |
100,957 |
111,229 |
|
Other comprehensive income |
|
|
|
|
822,573 |
822,573 |
|
822,573 |
|
Cumulative translation adjustments for the period |
|
|
|
|
170,342 |
170,342 |
|
170,342 |
|
Actuarial gain/(loss) on defined benefit pension plan, net of taxes. |
|
|
|
|
(204,107) |
(204,107) |
|
(204,107) |
|
Gain/(Loss) on available-for-sale assets, net of taxes |
|
|
|
|
847,849 |
847,849 |
|
847,849 |
|
Gain/(loss) on percentage change in investments |
|
|
|
|
2,814 |
2,814 |
|
2,814 |
|
Gain/(loss) on cash flow hedge accounting, net of taxes |
|
|
|
|
41,153 |
41,153 |
|
41,153 |
|
Gain/(loss) on hedge of net investments in foreign subsidiaries |
|
|
|
|
(39,893) |
(39,893) |
|
(39,893) |
|
Gain/(loss) on business combination |
|
|
|
|
4,415 |
4,415 |
|
4,415 |
|
Non-controlling interests in subsidiaries |
|
|
|
|
|
|
(30,094) |
(30,094) |
|
Balances at December 31, 2017 |
4,540,000 |
30 |
|
(1,291,689) |
3,779,032 |
7,027,373 |
1,260,856 |
8,288,229 |
|
|
|
|
|
|
| |||
|
Capital transactions with shareholders |
|
32,690 |
180,712 |
(898,332) |
|
(684,930) |
|
(684,930) |
|
Sales of treasury shares |
|
|
180,712 |
|
|
180,712 |
|
180,712 |
|
Dividends |
|
|
|
(898,332) |
|
(898,332) |
|
(898,332) |
|
Profit on disposal of shares |
|
32,690 |
|
|
|
32,690 |
|
32,690 |
|
Total comprehensive income |
|
|
|
5,074,136 |
(2,713,844) |
2,360,292 |
126,447 |
2,486,739 |
|
Profit/(loss) for the year |
|
|
|
5,074,136 |
|
5,074,136 |
126,447 |
5,200,583 |
|
Other comprehensive income |
|
|
|
|
(2,713,844) |
(2,713,844) |
|
(2,713,844) |
|
Cumulative translation adjustments for the period |
|
|
|
|
(87,101) |
(87,101) |
|
(87,101) |
|
Actuarial gain/(loss) on defined benefit pension plan, net of taxes |
|
|
|
|
1,316 |
1,316 |
|
1,316 |
|
Gain/(Loss) on available-for-sale assets, net of taxes |
|
|
|
|
(1,559,680) |
(1,559,680) |
|
(1,559,680) |
FS-7
|
Gain/(loss) on percentage change in investments |
|
|
|
|
(105) |
(105) |
|
(105) |
|
Gain/(loss) on cash flow hedge accounting, net of taxes |
|
|
|
|
(1,045,771) |
(1,045,771) |
|
(1,045,771) |
|
Gain/(loss) on hedge of net investments in foreign subsidiaries |
|
|
|
|
(21,852) |
(21,852) |
|
(21,852) |
|
Gain/(loss) on business combination |
|
|
|
|
(651) |
(651) |
|
(651) |
|
|
|
|
|
|
|
|
|
|
|
Constitution of reserves |
|
|
2,884,115 |
(2,884,115) |
|
|
|
|
|
Non-controlling interests in subsidiaries |
|
|
|
|
|
|
(76,598) |
(76,598) |
|
Balances at December 31, 2018 |
4,540,000 |
32,720 |
3,064,827 |
|
1,065,188 |
8,702,735 |
1,310,705 |
10,013,440 |
|
Capital transactions with shareholders |
|
|
|
(422,694) |
|
(422,694) |
(578,862) |
(1,001,556) |
|
Dividends |
|
|
|
(424,903) |
|
(424,903) |
(513,842) |
(938,745) |
|
Interest on equity |
|
|
|
|
|
|
(65,020) |
(65,020) |
|
Reversal by prescription of dividends and interest on shareholder’s equity |
|
|
|
2,209 |
|
2,209 |
|
2,209 |
|
Total comprehensive income |
|
|
|
1,789,067 |
105,436 |
1,894,503 |
455,545 |
2,350,048 |
|
Profit/(loss) for the year |
|
|
|
1,789,067 |
|
1,789,067 |
455,444 |
2,244,511 |
|
Other comprehensive income |
|
|
|
|
105,436 |
105,436 |
101 |
105,537 |
|
Cumulative translation adjustments for the period |
|
|
|
|
32,922 |
32,922 |
|
32,922 |
|
Actuarial gain/(loss) on defined benefit pension plan, net of taxes |
|
|
|
|
(113,195) |
(113,195) |
(193) |
(113,388) |
|
(Loss) / gain on the percentage change in investments |
|
|
|
|
(2,288) |
(2,288) |
294 |
(1,994) |
|
|
|
|
|
|
|
|
|
|
|
Gain/(loss) on cash flow hedge accounting, net of taxes |
|
|
|
|
185,525 |
185,525 |
|
185,525 |
|
Gain/(loss) on hedge of net investments in foreign subsidiaries |
|
|
|
|
2,472 |
2,472 |
|
2,472 |
|
Constitution of reserves |
|
|
1,366,373 |
(1,366,373) |
|
|
|
|
|
|
|
|
|
|
|
|
|
|
|
Balances at December 31, 2019 |
4,540,000 |
32,720 |
4,431,200 |
|
1,170,624 |
10,174,544 |
1,187,388 |
11,361,932 |
FS-8
|
| |
|
(Expressed in thousands of reais – R$, unless otherwise stated) | |
1. DESCRIPTION OF BUSINESS
Companhia Siderúrgica Nacional “CSN”, also referred to as the “Company”, is a publicly-held company incorporated on April 9, 1941, under the laws of the Federative Republic of Brazil (Companhia Siderúrgica Nacional, its subsidiaries, joint ventures, joint operations and associates are collectively referred to herein as the "Group”). The Company’s registered office is located in São Paulo, SP, Brazil.
CSN is listed on the São Paulo Stock Exchange (B3 S.A.- Brasil, Bolsa, Balcão) and on the New York Stock Exchange (NYSE).
The Group's main operating activities are divided into five (5) segments as follows:
· Steel:
The Company’s main industrial facility is the Presidente Vargas steelworks (“UPV”), located in the city of Volta Redonda, State of Rio de Janeiro. This segment consolidates all operations related to the production, distribution and sale of flat steel, long steel, metallic containers and galvanized steel. In addition to the facilities in Brazil, CSN has commercial operations in the United States and operations in Portugal and Germany to achieve markets and providing excellent services for final consumers. Its steel is used in home appliances, civil construction and automobile industries.
· Mining:
The production of iron ore is developed in the cities of Congonhas, Ouro Preto and Belo Vale, State of Minas Gerais – by subsidiary CSN Mineração.
Iron ore is sold basically in the international market, especially in Europe and Asia. The prices charged in these markets are historically cyclical and subject to significant fluctuations over short periods of time, driven by several factors related to global demand, strategies adopted by the major steel producers, and the foreign exchange rate. All these factors are beyond the Company’s control. The ore transportation is carried out through Terminal de Carvão e Minérios do Porto de Itaguai – (“TECAR”), a solid bulk terminal, one of the four terminals that comprise the Port of Itaguai, located in the State of Rio de Janeiro. Imports of coal and coke are also carried out through this terminal by provision of services by CSN Mineração to CSN. The Company´s mining activities also comprises tin exploitation, which is based in the State of Rondônia, to supply the needs of UPV. The excess of raw material is sold to subsidiaries and third parties.
The Company's mining activities utilize tailings dams for which all appropriate measures are taken to mitigate the risks inherent to the handling and disposal of the tailings and to comply with current environmental legislation. It is important to reiterate that operating without dependence on these dams is a priority in our mining activities, for which investments of around R$ 250 million in two tailing filtration plants, which are already in an operational ramp up phase, adapting its operations, identifying and implementing various optimizations of process. In this context, CSN Mineração will now process the tailings in the dry process in full, discarding the use of dams in its iron ore process. As a consequence of these measures, decommissioning of dams is the natural way of processing dry tailings.
All of our mining dams are positively certified and comply with the environmental legislation in force.
· Cement:
CSN entered in the cement market boosted by the synergy between this activity and its existing businesses. Next to the President Vargas Steelworks in Volta Redonda (RJ) is installed the new business unit, which produces CP-III type of cement using slag produced by the UPV blast furnaces in Volta Redonda. It also explores limestone and dolomite at the Arcos unit, located in the State of Minas Gerais, to satisfy the needs of UPV as of the cement plant. Additionally, the operation of its clinker production line is located in Arcos/MG. As a result, the Company is self-sufficient in cement production, with an installed capacity of 4.7 million tons per year.
FS-9
|
|
· Logistics
Railroads:
CSN has interests in three railroad companies: MRS Logística S.A., which manages the former Southeast Railway System of Rede Ferroviária Federal S.A (“RFFSA”)., Transnordestina Logística S.A. (“TLSA”) and FTL - Ferrovia Transnordestina Logística S.A. (“FTL”), which the the latter two hold the concession to operate the former Northeast Railway System of RFFSA, in the States of Maranhão, Piauí, Ceará, Rio Grande do Norte, Paraíba, Pernambuco, Alagoas and Sergipe, with TLSA being responsible for the rail links of Eliseu Martins – Trindade, Trindade – Salgueiro, Salgueiro – Porto Suape, Salgueiro – Missão Velha and Missão Velha - Pecém (Railway System II), under construction, and FTL being responsible for the rail links of São Luis - Altos, Altos - Fortaleza, Fortaleza – Souza, Souza - Recife/Jorge Lins, Recife/Jorge Lins – Salgueiro, Jorge Lins – Propriá, Paula Cavalcanti – Cabedelo, Itabaiana - Macau (Railway System I).
Ports:
The Company operates in the State of Rio de Janeiro, by means of its subsidiary Sepetiba Tecon S.A., operates the Container Terminal (“TECON”) and by means of its subsidiary CSN Mineração, the TECAR, both located at the Itaguaí Port. Established in the harbor of Sepetiba, the mentioned port has a privileged highway, railroad and maritime access.
(“TECON”) is responsible for the shipments of CSN´s steel products, movement and storage of containers, vehicles, general cargo, among other products; and TECAR performs the operational activities of loading and unloading of solid bulk ships, storage and distribution (road and rail) of coal, coke, zinc concentrate, sulfur, iron ore and other bulk, intended for the seaborne market, for our own operation and for third parties.
· Energy:
Since the energy supply is fundamental in CSN´s production process, the Company owns and operates facilities to generate electric power for guaranteeing its self-sufficiency.
The note 25 - “Segment Information” details the financial information per each of CSN´s business segment.
· Going Concern
In 2019, the Company amortized principal and interest in the approximate amount of R$13.8 billion of its loans and financing. In 2020, loans and interest to be incurred next year, are expected to be paid in the approximate amount of R$6.5 billion. The financial leverage may adversely affect the Company’s businesses, financial conditions and operating results, which the following main impacts are considered by management:
· Allocation of a substantial part of the cash generated from operations for repayment of the borrowings.
· Exposure to (i) fluctuations in interest rates due to the renegotiation of debts and new borrowings taken, and (ii) fluctuations in exchange rates since a significant part of the borrowings is denominated in foreign currency.
· Increase in the economic and financial vulnerability due to adverse conditions of the industry and segment, limiting the funds available in the short term, considering the high financial leverage and the expected cash disbursements;
· Limitation of the Company’s ability to enter into new businesses (acquisitions) until the financial leverage is reduced;
· Limitation of the Company’s ability to obtain new credit lines under more favorable interest conditions due to the risks associated to the current financial leverage.
The Company’s ability to continue operating depends, therefore, on the achievement of operating targets defined by management, in addition to refinancing of contracted debts, and/or actions related to financial deleveraging.
In addition to the continuous focus on improvement in operating income, management has various actions in progress to increase the Company’s liquidity through an extension of borrowing payment terms.
This plan was started in 2015, with the renegotiation of R$ 2.5 billion with Caixa Econômica Federal and R$ 2.2 billion with Banco do Brasil S.A, postponing the maturities from 2016 and 2017 to 2018 through 2022. In 2016, the Company extended the installments of certain NCE contracts amounting to R$ 100 million and prepayments of US$ 66 million with Bradesco, postponing the maturities from 2016 to 2019, which are settled during that year. Always committed to the plan to extend it debt payment term, mainly those of short term, the company’s management concluded, in February 2018, the reprofile of its debts at R$ 4.98 billion with Banco do Brasil, extending the maturity dates from 2018 to 2022 for maturities up to 2024. Still in February 2018, the company issued debt instruments (“Notes”) in the amount of US$350 million through our wholly-owned subsidiary CSN Resources S.A., with maturity date in 2023 and, in conjunction, made a repurchase offer (“Tender Offer”) of the Notes previously issued by CSN Islands XI Corp and CSN Resources S.A, having been repurchased US$350 million in Notes with maturities scheduled for 2019 and 2020. In April 2019, the Company issued debt securities in the foreign market (“Notes”), in the amount of US$ 1 billion through its subsidiary CSN Resources S.A., being: US$400 million due in 2023 and US$600 million with maturity in 2026. Promoted a repurchase offer (“Tender Offer”) of Notes issued by CSN Islands XI Corp and CSN Resources S.A., and US$1 billion in securities were repurchased, with maturities scheduled for September 2019 and July 2020, respectively. In July 2019, the Company issued debt securities on the foreign market (“Notes”), in the amount of US$ 175 million through its subsidiary CSN Resources S.A., due in 2023 and promoted the final payment of the debt in the foreign market (“Notes”) issued by the company CSN Islands XI Corp in September 2019, in US$142 million.
FS-10
|
|
Additionally, Management studies alternatives to financial deleverage from the disposal of non-strategic assets. However, it is not possible to affirm that the sale of assets will occur within a 12-month period. Thus, the Company did not segregate and did not reclassify any assets in the financial statements as discontinued operations in accordance with IFRS 5.
Based on management’s cash flow projections that covered the operational period until February 2021, which depend on factors such as the achievement of production targets, sales volumes and prices, as well as on renegotiations of borrowings, management believes that the Company has appropriate resources to continue its operations in a reasonably estimable period of time. Accordingly, the Company’s financial statements for the year ended December 31, 2019 were prepared based on the assumption of going concern.
2. SUMMARY OF SIGNIFICANT ACCOUNTING POLICIES
2.a) Basis of preparation and declaration of conformity
The consolidated financial statements have been prepared and are being presented in accordance with International Financial Reporting Standards (“IFRS”) issued by the International Accounting Standards Board (IASB) and includes all of the relevant information of the financial statements, and only this information, which correspond to those used by the Company’s management in its activities.
The preparation of financial statements in conformity with IFRS requires the use of certain critical accounting estimates and also requires management to exercise its judgment in the process of applying the Company’s accounting policies.
Information on uncertainties related to assumptions and estimates, which have a significant risk of resulting in a material adjustment to the accounting balances of assets and liabilities in the year, are included in the following notes:
• Note 5 - Recognition of the provision for expected losses (impairment) of accounts receivable from customers;
• Note 14 - Deferred income and social contribution taxes: availability of future taxable income against which deductible temporary differences and tax losses can be used;
• Note 10.a - Goodwill impairment test;
• Note 12 - Derivative financial instruments and hedge accounting (“Hedge accounting”).
• Note 16 - Provision for tax, social security, labor, civil, environmental and judicial deposits: main assumptions about the probability and magnitude of resource outflows;
• Note 26 - Retirement benefit;
The financial statements are presented in thousands of Brazilian reais (R$). Depending on the applicable IFRS standard, the measurement criteria used in preparing the financial statements considers the historical cost, net realizable value, fair value or recoverable amount. When the IFRS allows us an option between acquisition cost and other measurement criteria, the acquisition cost was the criteria used.
FS-11
|
|
The consolidated financial statements were approved by the Board of Directors on March 4, 2020.
2.b) Basis of presentation
The accounting policies have been consistently applied to all consolidated companies. The consolidated financial statements for the years ended December 31, 2019 and 2018 include the following direct and indirect subsidiaries, joint ventures and joint operations, as well as the exclusive funds, as follows:
|
Equity interests (%) |
||||||
|
Companies |
Number of shares held by CSN (in units) |
12/31/2019 |
|
12/31/2018 |
|
Core business |
|
Direct interest in subsidiaries: full consolidation |
|
|
|
|
|
|
|
CSN Islands VII Corp. |
20,001,000 |
100.00 |
100.00 |
Financial transactions | ||
|
CSN Islands XI Corp. |
50,000 |
100.00 |
|
100.00 |
|
Financial transactions |
|
CSN Islands XII Corp. |
1,540 |
100.00 |
100.00 |
Financial transactions | ||
|
CSN Steel S.L.U. |
22,042,688 |
100.00 |
|
100.00 |
|
Equity interests and Financial transactions |
|
TdBB S.A (*) |
100.00 |
100.00 |
Equity interests | |||
|
Sepetiba Tecon S.A. |
254,015,052 |
99.99 |
|
99.99 |
|
Port services |
|
Minérios Nacional S.A. |
141,719,295 |
99.99 |
99.99 |
Mining and Equity interests | ||
|
Companhia Florestal do Brasil |
42,551,519 |
99.99 |
|
99.99 |
|
Reforestation |
|
Estanho de Rondônia S.A. |
195,454,162 |
99.99 |
99.99 |
Tin Mining | ||
|
Companhia Metalúrgica Prada |
445,921,292 |
99.99 |
|
99.99 |
|
Manufacture of packages and distribution of steel products |
|
CSN Gestão de Recursos Financeiros Ltda. (1) |
99.99 |
Management of funds and securities portfolio | ||||
|
CSN Mineração S.A. |
158,419,480 |
87.52 |
|
87.52 |
|
Mining and Equity interests |
|
CSN Energia S.A. |
43,149 |
99.99 |
99.99 |
Sale of electric power | ||
|
FTL - Ferrovia Transnordestina Logística S.A. |
486,592,830 |
92.38 |
|
91.69 |
|
Railroad logistics |
|
Nordeste Logística S.A. |
99,999 |
99.99 |
99.99 |
Port services | ||
|
Aceros México CSN (2) |
|
|
|
0.08 |
|
Commercial representation, steel sales and related activities |
|
CSN Inova Ltd. |
100.00 |
100.00 |
Advisory and implementation of new development projects | |||
|
CSN Equipamentos S.A (3) |
999 |
99.99 |
|
|
|
Rental of commercial and industrial machinery and equipment |
|
CBSI - Companhia Brasileira de Serviços de Infraestrutura (4) |
3,752,292 |
100.00 |
Provision of services | |||
|
|
|
|
|
|
|
|
|
Indirect interest in subsidiaries: full consolidation |
|
|
|
|
|
|
|
Lusosider Projectos Siderúrgicos S.A. |
|
100.00 |
|
100.00 |
|
Equity interests and product sales |
|
Lusosider Aços Planos, S. A. |
|
99.99 |
|
99.99 |
|
Steel and Equity interests |
|
CSN Resources S.A. |
|
100.00 |
|
100.00 |
|
Financial transactions and Equity interests |
|
Companhia Brasileira de Latas |
|
99.99 |
|
99.99 |
|
Sale of cans and packages in general and Equity interests |
|
Companhia de Embalagens Metálicas MMSA |
|
99.67 |
|
99.67 |
|
Production and sale of cans and related activities |
|
Companhia de Embalagens Metálicas - MTM |
|
99.67 |
|
99.67 |
|
Production and sale of cans and related activities |
|
CSN Steel Holdings 1, S.L.U. |
|
100.00 |
|
100.00 |
|
Financial transactions, product sales and Equity interests |
|
CSN Productos Siderúrgicos S.L. |
|
100.00 |
|
100.00 |
|
Financial transactions, product sales and Equity interests |
|
Stalhwerk Thüringen GmbH |
|
100.00 |
|
100.00 |
|
Production and sale of long steel and related activities |
|
CSN Steel Sections UK Limited (*) |
|
100.00 |
|
100.00 |
|
Sale of long steel |
|
CSN Steel Sections Polska Sp.Z.o.o |
|
100.00 |
|
100.00 |
|
Financial transactions, product sales and Equity interests |
|
CSN Asia limited (5) |
|
|
|
100.00 |
|
Commercial representation |
|
CSN Mining Holding, S.L |
|
87.52 |
|
87.52 |
|
Financial transactions, product sales and Equity interests |
|
CSN Mining GmbH |
|
87.52 |
|
87.52 |
|
Financial transactions, product sales and Equity interests |
|
CSN Mining Asia Limited |
|
87.52 |
|
87.52 |
|
Commercial representation |
|
Aceros México CSN (2) |
|
|
|
99.92 |
|
Commercial representation, steel sales and related activities |
|
Lusosider Ibérica S.A. |
|
100.00 |
|
100.00 |
|
Steel, commercial and industrial activities and equity interests |
|
CSN Mining Portugal, Unipessoal Lda. |
|
87.52 |
|
87.52 |
|
Commercial and representation of products |
|
Companhia Siderúrgica Nacional, LLC |
|
100.00 |
|
100.00 |
|
Import and distribution/resale of products |
|
|
|
|
|
|
|
|
|
Direct interest in joint operations: proportionate consolidation |
|
|
|
|
|
|
|
Itá Energética S.A. |
253,606,846 |
48.75 |
|
48.75 |
|
Electric power generation |
|
Consórcio da Usina Hidrelétrica de Igarapava |
|
17.92 |
|
17.92 |
|
Electric power consortium |
|
|
|
|
|
|
|
|
|
Direct interest in joint ventures: equity method |
|
|
|
|
|
|
|
MRS Logística S.A. (6) |
63,377,198 |
18.64 |
|
18.64 |
|
Railroad transportation |
|
Aceros Del Orinoco S.A. |
|
31.82 |
|
31.82 |
|
Dormant company |
|
CBSI - Companhia Brasileira de Serviços de Infraestrutura |
|
|
|
50.00 |
|
Provision of services |
|
Transnordestina Logística S.A. (7) |
24,670,093 |
47.26 |
|
46.30 |
|
Railroad logistics |
|
|
|
|
|
|
|
|
|
Indirect interest in joint ventures: equity method |
|
|
|
|
|
|
|
MRS Logística S.A. |
|
16.30 |
|
16.30 |
|
Railroad transportation |
|
|
|
|
|
|
|
|
|
Direct interest in associates: equity method |
|
|
|
|
|
|
|
Arvedi Metalfer do Brasil S.A. |
46,994,971 |
20.00 |
|
20.00 |
|
Metallurgical and Equity interests |
(*) They are dormant Companies therefore they do not appear in the note 8.a, where is disclosed business information under the equity method and fair value through profit or loss and comprehensive income.
(1) CSN Gestão de Recursos Financeiros was liquidated on June 13, 2019;
(2) On February 1, 2019, the Federal Taxpayers' Registry was canceled and, therefore, the settlement process of Aceros Mexico CSN was terminated, however, before third parties and for the purposes of commercial law, the settlement was retroactive to September 18, 2018;
(3) Company incorporated on August 22, 2019.
(4) On November 29, 2019, a purchase and sale agreement for share was signed, whereby Companhia Siderúrgica Nacional acquired the entire participation that CKTR Brasil Serviços Ltda held in CBSI - Companhia Brasileira de Serviços de Infraestrutura. As a result, as of the date mentioned, CSN now holds 100% of CBSI's share capital.
(5) On August 6, 2019 CSN Asia Limited was liquidated;
(6) On December 31, 2019 and 2018, the Company directly owned 26,611,282 common shares, 2,673,312 preferred shares class A and 34,092,604 preferred shares class B, totaling 36,765,916 preferred shares of MRS Logística S.A.
(7) On May 10, 2019, 501,789 shares of shareholder FINOR, all class B preferred shares, were transferred to shareholder CSN. On December 31,2019, the Company had 24,168,304 ordinary shares, 501,789 preferred shares Class B (as of December 31,2018 had 24,168,304 ordinary shares and no preferred shares).
FS-12
|
|
· Exclusive funds
|
Equity interests (%) |
||||||
|
Exclusive funds |
12/31/2019 |
|
12/31/2018 |
|
Core business | |
|
Direct interest: full consolidation |
|
|
|
|
|
|
|
Diplic II - Private credit balanced mutual fund |
100.00 |
100.00 |
Investment fund | |||
|
Caixa Vértice - Private credit balanced mutual fund |
|
100.00 |
|
100.00 |
|
Investment fund |
|
VR1 - Private credit balanced mutual fund |
100.00 |
100.00 |
Investment fund | |||
In preparing the consolidated financial statements, we have adopted the following consolidation procedures:
· Transactions between subsidiaries, associates, joint ventures and joint operations
Unrealized gains on transactions with subsidiaries, joint ventures and associates are eliminated to the extent of CSN’s equity interests in the related entity by the consolidation process. Unrealized losses are eliminated in the same manner as unrealized gains, although only to the extent that there are not indications of impairment. The Company eliminates the effect on profit or loss of transactions carried out with joint ventures and, as a result, reclassifies part of the equity in results of joint ventures to financial expenses, cost of sales and income tax and social contribution.
The base date to the financial statements of the subsidiaries and joint ventures is the same as of the Company, and their accounting policies are also in line with the policies adopted by the CSN.
Subsidiaries
Subsidiaries are all entities which financial and operating policies can be conducted by the Company and when it is exposed to, or has rights to, variable returns from its involvement with the entity and has the ability to use its power to affect its returns. The existence and effect of potential voting rights that are actually exercisable or convertible are taken into consideration when assessing whether the Company controls another entity. Subsidiaries are fully consolidated from the date when the control is transferred to the Company and are deconsolidated from the date when such control ceases.
FS-13
|
|
Joint ventures and joint operations
Joint arrangements are all entities over which the Company has joint control with one or more other parties. The investments in joint arrangements are classified as joint operations or joint ventures depending on the contractual rights and obligations of each investor.
Joint operations are accounted for in the financial statements in order to represent the Company's contractual rights and obligations. Therefore, the assets, liabilities, revenues and expenses related to its interests in joint operations are accounted for individually in the financial statements.
Joint ventures are accounted for under the equity method and are not consolidated.
The Company eliminates the effect on profit or loss of transactions carried out with joint ventures and, as a result, eliminates part of the equity in results of joint ventures to financial expenses, cost of sales, net sales and income tax and social contribution.
Associates
Associates are all entities over which the Company has significant influence but not control, generally through a shareholding percentage from 20% up to 50% of the voting rights. Investments in associates are accounted for under the equity method and are initially recognized at cost.
· Transactions and non-controlling interests
The Company treats transactions with non-controlling interests as transactions with owners of the Company. For purchases from non-controlling interests, the difference between any consideration paid and the relevant share acquired of the carrying value of subsidiary net assets is recorded in shareholders' equity. Gains and losses on disposals to non-controlling interests are also recognized directly in shareholders' equity.
When the Company no longer holds control, any retained interest in the entity is remeasured to its fair value, with the change in the carrying amount recognized in profit or loss. The fair value is the initial carrying amount for the purposes of subsequently accounting for the retained interest in an associate, joint venture or financial asset. In addition, any amounts previously recognized in other comprehensive income in respect of that entity are accounted for as if the Company had disposed of the related assets or liabilities. This may mean that amounts previously recognized in other comprehensive income are reclassified to profit or loss.
2.c) Foreign currencies
i. Functional and presentation currency
Items included in the financial statements are related to each one of the Company's subsidiaries are measured using the currency of the primary economic environment in which the subsidiary operates (“functional currency”). The consolidated financial statements are presented in Brazilian reais (R$), which is the Company’s functional currency and the Group’s presentation currency.
ii. Transactions and balances
The transactions in foreign currencies are translated into the functional currency using the exchange rates in effect at the dates of the transactions or valuations when their values are remeasured. Foreign exchange gains and losses resulting from the settlement of those transactions and from the translation at exchange rates in effect as of December 31, 2019 related to monetary assets and liabilities denominated in foreign currencies are recognized in the income statement as financial result, except when they are recognized in shareholders' equity as a result of foreign operation characterized as foreign investment.
According to IAS 21 and IFRIC 22 – foreign currency transactions and advance consideration, the transactions in which the Company recognizes a non-monetary asset or non-monetary liability involving prepayments or receipts in foreign currency are recorded at the exchange rate of the date the entity initially recognized (transaction date) the non-monetary asset or non-current liability monetary.
The balances of assets and liabilities are translated by exchange rates prevailing at the end of the reporting period. As of December 31, 2019, US$1 is equal to R$4.0307 (R$3.8748 at December 31, 2018) and €1 is equal to R$4.5305 (R$4.4390 at December 31, 2018), according to the rates obtained from Central Bank of Brazil website.
All other foreign exchange gains and losses, including foreign exchange gains and losses related to borrowings and cash and cash equivalents, are presented in the income statement as financial income or expenses.
FS-14
|
|
iii. Group companies
The results and financial position of all the Group’s entities (none of which has the currency of a hyper-inflationary economy) that have a functional currency different from the presentation currency are translated into the presentation currency as follows:
· The assets and liabilities of each balance sheet presented are translated by exchange rate at the end of the reporting period;
· The income and expenses of each income statement are translated at average exchange rates (unless this average is not a reasonable approximation of the cumulative effect of the rates at the transaction dates, in which case income and expenses are translated at the rate in effect at the transaction dates);
· All resulting exchange differences are recognized as a separate component in other comprehensive income; and
· Gains and losses accumulated in shareholders' equity are included in the income statement when the foreign operation is partially disposed or sold.
2.d) Cash and cash equivalents
Cash and cash equivalents include cash on hand, in bank accounts and other short-term highly liquid investments redeemable within 90 days from the end of the reporting period, readily convertible into a known amount of cash and subject to an insignificant risk of change in value. Bank certificates of deposit and government securities that do not meet the above criteria are not considered cash equivalents and are classified as financial investments, according to note 4.
2.e) Trade receivables
Trade receivables are initially recognized at fair value, including the related taxes and expenses, being foreign currency-denominated trade receivables are adjusted at the exchange rate in effect at the end of the reporting period.
With the adoption of the new IFRS 9 - Financial instruments, the Company started to apply the new model of expected losses, where it considers all possible loss events over the life of its receivables. These expected credit losses are estimated according to the loss rate by maturity range adopted by the Company since the initial (recognition) date of the asset.
The Company considers customer history, default rate, financial situation and the position of its legal advisors to estimate the expected credit losses.
FS-15
|
|
2.f) Inventories
Inventories are carried at the lower of cost and net realizable value. Cost is determined using the weighted average cost method on the acquisition of raw materials. The costs of finished goods and work in process comprise raw materials, labor and other direct costs (based on the normal production capacity). Net realizable value represents the estimated selling price in the normal course of business, less estimated costs of completion and costs necessary to make the sale. The allowance for estimated losses on slow-moving or obsolete inventories are recognized when considered necessary.
Stockpiled ore inventories are accounted for as processed when removed from the mine. The cost of finished goods comprises all direct costs necessary to transform stockpiled inventories into finished goods.
2.g) Investments
Investments in subsidiaries, joint ventures and associates are accounted for under the equity method of accounting and are initially recognized at cost. The gains or losses are recognized in profit or loss as operating income (or expenses). In the case of foreign exchange differences arising on translating foreign investments that have a functional currency different from the Company’s, changes in investments due exclusively to foreign exchange differences, as well as adjustments to pension plans and investments that impact the subsidiaries’ shareholders' equity, are recognized in line item “Cumulative translation adjustments”, in the Company’s shareholders' equity, and are only recognized in profit or loss when the investment is disposed or written off due to impairment loss. Other investments are recognized at cost or fair value.
When necessary, the accounting policies of subsidiaries, joint ventures and associates are changed to ensure consistency with the policies adopted by the Company.
2.h) Investment Property
The Company's investment properties consist of land and buildings maintained to earn rental income and capital appreciation. The measurement method used is the acquisition or construction cost less accumulated depreciation and impairment, when applicable. Accumulated depreciation is calculated by linear method based on the estimated useful life of the properties subject to depreciation, see note 8.g. Land is not depreciated as they have an indefinite useful life.
2.i) Business combination
The acquisition method is used to account for on each business combination conducted by the Company. The consideration transferred by acquiring an entity is measured by the fair value of the assets transferred, liabilities incurred, and equity instruments issued by the Company. The consideration transferred includes the fair value of any asset or liability resulting from a contingent consideration arrangement, where applicable. Acquisition-related costs are recognized in profit or loss for the year, as incurred. Identifiable assets acquired, and liabilities assumed in a business combination are initially measured at their fair values at the acquisition date.
2.j) Property, plant and equipment
Property, plant and equipment are carried at cost of acquisition, formation or construction, less accumulated depreciation or depletion and any impairment loss. Depreciation is calculated under the straight-line method based on the remaining economic useful economic lives of assets, as mentioned in note 9. The depletion of mines is calculated based on the quantity of ore mined. Land is not depreciated since their useful life is considered indefinite. However, if the tangible assets are mine-specific, that is, used in the mining activity, they are depreciated over the shorter between the normal useful lives of such assets and the useful life of the mine. The Company recognizes in the carrying amount of property, plant and equipment the cost of replacement, and consequently reducing the carrying amount of the part that is replaced if it is probable that future economic benefits embodied therein will revert to the Company, and if the cost of the asset can be reliably measured. All other disbursements are expensed as incurred. Borrowing costs related to funds obtained for construction in progress are capitalized until these projects are completed.
If some components of property, plant and equipment have different useful lives, these components are accounted for in separate line items of property, plant and equipment.
FS-16
|
|
Gains and losses on disposal are determined by comparing the sale value less the residual value and are recognized in ‘Other operating income (expenses)’.
Exploration expenditures are recognized as expenses until the viability of mining activities is established; after this period the subsequent development costs are capitalized. Exploration and valuation expenditures include:
· Research and analysis of historical data related to area exploration;
· Topographic, geological, geochemical and geophysical studies;
· Determine the mineral asset’s volume and quality/grade;
· Examine and test the extraction processes and methods;
· Topographic surveys of transportation and infrastructure needs;
· Market and financial studies;
The development costs from new mineral deposits or from capacity expansion in mine operations are capitalized and amortized using the produced (extracted) units’ method based on the probable and proven ore quantities.
The development stage includes:
· Drillings to define the ore body;
· Access and draining plans;
· Advance removal of overburden (top soil and waste material removed prior to initial mining of the ore body) and waste material (non-economic material that is intermingled with the ore body).
Stripping costs (the costs associated with the removal of overburden and other waste materials) incurred during the development of a mine, before production commences, they are capitalized as part of the depreciable cost of developing the property. Such costs are subsequently amortized over the useful life of the mine based on proven and probable reserves.
Stripping costs in the production phase are included in the cost of the inventory produced, except when a specific extraction campaign is made to access deeper deposits where ore body is located. In these cases, costs are capitalized and taken to noncurrent assets when the mineral ore deposit is extracted and are amortized over the useful life of the ore body.
The Company holds spare parts that will be used to replace parts of property, plant and equipment and that used to increase the asset’s useful life when it exceeds 12 months. These spare parts are classified in property, plant and equipment and not in inventories.
2.k) Leases
As of January 1, 2019, IFRS 16 was adopted by the Company.
When entering into a contract, the Company assesses whether the contract is, or contains, a lease. The lease is characterized by a lease or transmission of the right of use for a fixed period in exchange for monthly payments. A leased asset must be clearly specified.
The Company determines in the initial recognition, the lease term or non-cancellable term, which will be used in the measurement of the right-to-use assets and lease liabilities. The lease term will be reassessed by the Company when a significant event or significant change occurs in the circumstances that are in the control of the lessee and affect the non-cancellable term. The Company adopts exemption from recognition, as provided for in the standard, for the lessee contracts with terms of less than 12 (twelve) months, or whose underlying asset object of the contract is of low value.
On the start date, the Company recognizes the right to use asset and the lease liability at present value. The asset right of use must be measured at cost. The cost includes the lease liability, initial costs, advance payments, estimated costs to dismantle, remove or restore. The lease liability is measured on the start date by the Company at the present value of the lease payments that are made on that date. The payments are discounted at the interest rate implicit in the lease, or if the rate cannot be determined, an incremental borrowing rate will be used on the Company's loan.
FS-17
|
|
For contracts that the Company determines the business rate, it is understood that this rate is the rate implied in terms and which is applied to discount the flow of future payments. In contracts with no rate definition, the Company applied the incremental borrowing rate, obtaining it through consultations with banks where it has a relationship, adjusted for the expected inflation for the coming years.
For the subsequent measurement, it is used the cost method to the right-of-use assets and for depreciation as determined in IAS 16 - Property, Plant and Equipment. However, for the purpose of depreciation, the Company determines the use of the straight-line method based on the remaining useful life of the assets or the term of the contract, whichever is shorter.
The effects of PIS and COFINS recoverable generated after the effective payment of the obligations will be recorded as a reduction of depreciation expenses for the right to use and financial expenses recognized monthly.
IAS 36 - Impairment of Assets will also be applied in order to determine whether the right-of-use asset has impairment indicators and to account for any impairment loss identified.
2.l) Intangible assets
Intangible assets comprise assets acquired from third parties, including through business combinations.
These assets are recognized at cost of acquisition or formation, less amortization calculated on a straight-line basis on the exploration or recovery periods estimated.
Mineral rights acquired are classified as rights and licenses in intangible assets.
Intangible assets with indefinite useful lives and goodwill based on expected future profitability are not amortized.
· Goodwill
Goodwill represents the positive difference between the amount paid and/or payable for the acquisition of a business and the net fair values of the acquiree´s assets and liabilities. Goodwill on acquisitions from business combinations is recognized as intangible assets in the consolidated financial statements. The negative goodwill on purchase is recognized as a gain in the statement of income at the acquisition date. Goodwill is annually tested for impairment or at any time when circumstances indicate a possible loss. Impairment losses on goodwill are not reversed. Gains and losses on the disposal of a Cash-Generating Unit (CGU) include the carrying amount of goodwill related to the CGU sold.
Goodwill is allocated to CGUs for impairment testing purposes. The allocation is made to CGUs or group of CGUs that are expected to benefit from the business combination in which the goodwill arose, and if that unit is not greater than the operating segment.
· Software
Software licenses purchased are capitalized based on the costs incurred to purchase the software and make it ready for use. These costs are amortized on a straight-line basis over the estimated useful lives in up to 10 years.
2.m) Impairment of non-financial assets
Assets with infinite useful lives, such as goodwill, are not subject to amortization and are annually tested for impairment. Assets subject to amortization and/or depreciation, such as property, plant and equipment, are tested for impairment whenever events or changes in circumstances indicate that their carrying amounts may not be recoverable. An impairment loss is recognized at the amount at which the carrying amount of the asset exceeds its recoverable amount. The recoverable amount is the higher of the fair value of an asset less costs to sell and its value in use. For impairment testing purposes, assets are grouped at their lowest levels for which there are separately identifiable cash flows (Cash Generating Units, or CGUs). Non-financial assets, except for goodwill, which have suffered impairment, are subsequently reviewed for possible reversal of the impairment at the reporting date.
FS-18
|
|
2.n) Employee benefits
i. Employee benefits
Defined contribution plans
A defined contribution plan is as a post-employment benefit plan whereby an entity pays fixed contributions to a separate entity (pension fund) and will not have any legal or constructive obligation to pay additional amounts. Obligations for contributions to defined contribution pension plans are recognized as employee benefit expenses in the periods during which services are provided by employees. Contributions paid in advance are recognized for an asset since it is agreed that either cash reimbursement or future reduction on payables will flow back to CSN. Contributions to a defined contribution plan that is expected to mature twelve (12) months after the end of the period in which the employee provides services are discounted to their present values.
Defined benefit plans
A defined benefit plan is a post-employment benefit plan other than a defined contribution plan. The Company’s net obligation regarding defined pension benefit plans is calculated individually for each plan by estimating the value of the future benefit that the employees accrue as return for services provided in the current period and in prior periods; such benefit is discounted to its present value. The discount rate is the yield presented at the end of the reporting period for top line debt securities whose maturity dates approximate the terms and conditions of the Company’s obligations and which are denominated in the same currency as the one in which it is expected that the benefits will be paid. The calculation is made annually by a qualified actuary using the projected unit credit method. When the calculation results in a benefit for the Company, the asset to be recognized is limited to the total amount of any unrecognized costs of past services and the present value of the economic benefits available in the form of future plan reimbursements or reduction in future contributions to the plan. The present value of economic benefits is calculated taking into account the funding requirements applicable to the Company’s plans. An economic benefit is available to the Company if it is realizable during the life of the plan or upon settlement of the plan’s liabilities.
The Company and some of its subsidiaries offered a postretirement healthcare benefit to its employees. The right to these benefits is usually contingent to their remaining in employment until the retirement age and the completion of the minimum length of service. The expected costs of these benefits are accumulated during the employment period and are calculated using the same accounting method used for defined benefit pension plans. These obligations are annually valued by qualified independent actuaries.
When the benefits of a plan are increased, the portion of the increased benefit related to past services of employees is recognized in profit or loss until the benefits become vested. When benefits became vesting rights, expenses are immediately recognized in profit or loss.
The Company recognizes all actuarial gains or losses resulting from defined benefit plans immediately in other comprehensive income. If the plan is extinguished, actuarial gains and losses are recognized in profit or loss.
ii. Profit sharing and bonus
Employee profit sharing and executives’ variable compensation are linked to the achievement of operating and financial targets. The Company recognizes a liability and an expense substantially allocated to production cost and, where applicable, to general and administrative expenses when such goals are met.
2.o) Provisions
Provisions are recognized when the Company has a present obligation (legal or constructive) as a result of a past event, it is probable that the Company will be required to settle the obligation and it has reliable cost estimation.
The amount recognized as a provision is the best value estimation required to settle the present obligation at the end of the reporting period, taking into account the risks and uncertainties surrounding the obligation. When a provision is measured using the cash flows estimated to settle the present obligation, it carrying amount is the present value of those cash flows (when the effect of the time value of money is material). Success fees are accrued to the extent that they make it probable that disbursements will occur. When some or all of the economic benefits required to settle a provision are expected to be recovered from a third party, a receivable is recognized as an asset if it is probable that reimbursement will be received and that the amount of the receivable can be measured reliably.
FS-19
|
|
2.p) Share capital
Common shares are classified in shareholders' equity.
Incremental costs directly attributable to the issue of new shares or options are shown in shareholders' equity as a deduction to the amount received, net of taxes.
When any Company of the Group buys Company shares (treasury shares), the amount paid, including any directly additional costs (net of income tax), is deducted from shareholders' equity attributable to owners of the Company until the shares are canceled or sold. When these shares are subsequently sold, any amount received, net of any directly attributable additional transaction costs and the related income tax and social contribution effects, is included in shareholders' equity attributable to owners of the Company.
2.q) Revenue recognition
As of January 1, 2018, IFRS 15 was adopted by the Company, all assets are recorded according to the respective practice.
Operating revenue from the sale of goods in the normal course of business is measured at the fair value of the consideration that the entity expects to receive in exchange for the delivery of the good or service promised to the client.
Revenue recognition occurs when or as the entity satisfies a performance obligation by transferring the good or service to the customer, understanding that performance obligation is an enforceable promise in a contract with a customer for the transfer of a good / service or a series of goods or services.
The transfer is considered effected when or as the customer obtains control of that asset.
If it is probable that discounts will be granted and the value thereof can be reliably measured, then the discount is recognized as a reduction of the operating revenue as sales are recognized.
Freight export services under the CFR (Cost and Freight) and CIF (Cost, Insurance and Freight) modalities, where the Company is responsible for the freight service, are considered separate services and therefore a separate obligation, with their allocation apart of the price of the transaction and with recognition of the service over time. Such revenue allocated to freight does not significantly affect the results of the Company's fiscal year and, therefore, it is not presented separately in the financial statements. For other services rendered, revenue is recognized based on its realization.
2.r) Financial income and financial expenses
Financial income includes interest income from funds invested, dividend income not accounted for under the equity method, changes in the fair value of financial assets measured at fair value through profit or loss, and gains on derivative instruments that are recognized in profit or loss. Interest income is recognized in profit or loss under the effective interest method. Dividend income is recognized in profit or loss when the Company’s right to receive payment has been established. Distributions received from investees accounted for under the equity method reduce the investment value.
Financial expenses comprise interest expenses on borrowings, dividends on preferred shares classified as liabilities, losses on the fair value of financial instruments measured at fair value through profit or loss, impairment losses recognized in financial assets, and losses on derivative instruments that are recognized in profit or loss. Borrowing costs that are not directly attributable to the acquisition, construction or production of a qualifying asset are measured through profit or loss under the effective interest method.
FS-20
|
|
Foreign exchange gains and losses are reported on a net basis.
2.s) Income tax and social contribution
Current income tax and social contribution are calculated based on the tax laws enacted by the end of the reporting period, including in the countries where the Group entities operate and generate taxable profit. Management periodically assesses the positions taken in the tax calculations with respect to situations where applicable tax regulations are open to interpretations. The Group recognizes provisions where appropriate, based on the estimated payments to tax authorities. The income tax and social contribution expense comprises current and deferred taxes. Current and deferred taxes are recognized in profit or loss unless they are related to business combinations or items recognized directly in shareholders' equity.
Current tax is the expected tax payable or receivable on taxable profit or loss for the year at tax rates that have been enacted by the end of the reporting period and any adjustment to taxes payable in relation to prior years.
Deferred tax is recognized on temporary differences between the carrying amounts of assets and liabilities in the financial statements and the corresponding tax bases used in the computation of taxable profit. Deferred tax is not recognized for the following temporary differences: initial recognition of assets and liabilities in a transaction that is not a business combination and does not affect either the accounting or taxable profit or loss, and differences associated with investments in subsidiaries and joint ventures when it is probable that they will not reverse in the foreseeable future.
Moreover, a deferred tax liability is not recognized for taxable temporary differences resulting from the initial recognition of goodwill. The deferred tax is measured at the rates that are expected to be applied on temporary differences when they reverse, based on the laws enacted by the end of the reporting period.
Current income tax and social contribution are carried at their net amounts by the taxpayer, in liabilities when there are amounts payable or in assets when prepaid amounts exceed the total amount due at the end of the reporting period.
Deferred tax assets and liabilities are offset when there is a legally enforceable right to set off current tax assets against current tax liabilities and when they relate to income taxes levied by the same taxation authority on the same entity subject to taxation.
A deferred income tax and social contribution asset is recognized for all tax losses, tax credits, and deductible temporary differences to the extent that it is probable that taxable profits will be available against which those tax losses, tax credits, and deductible temporary differences can be utilized. Annually, the Company reviews and verifies the existence of future taxable income and a provision for loss is recognized when the realization of these credits is not likely.
2.t) Earnings/(Loss) per share
Basic earnings/loss per share are calculated by means of the profit/loss for the year attributable to owners of the Group and the weighted average number of common shares outstanding in the related period. Diluted earnings/loss per share are calculated by means of the average number of shares outstanding, adjusted by instruments potentially convertible into shares, with diluting effect, in the reported periods. The Group does not have any instruments potentially convertible into shares and, accordingly, diluted earnings/loss per share are equal to basic earnings/loss per share.
2.u) Environmental and restoration costs
The Company recognizes a provision for the recovery costs and fines when a loss is probable and the amounts of the related costs can be reliably measured. Generally, the period when the provision for recovery is recognized coincides with the end of a feasibility study or the commitment to adopt a formal action plan.
Expenses related to compliance with environmental regulations are charged to profit or loss or capitalized, as appropriate. Capitalization is considered appropriate when the expenses refer to items that will continue to benefit the Group and that are basically related to the acquisition and installation of equipment to control and/or prevent pollution.
Asset retirement obligation (A.R.O) asset retirement obligations consist of cost estimates by deactivation, demobilization or restoration of areas at the end of exploration and resource extraction activities minerals. The initial measurement is recognized as a liability discounted to present value and, subsequently, by the increase expenditure over time. The asset deactivation cost equivalent to the initial liability is capitalized as part of the book value of the asset being depreciated over the useful life of the asset.
FS-21
|
|
2.v) Research and development
Research expenditures are recognized as expenses when incurred. Expenditures on project developments (related to the design and testing stages of new or improved products) are recognized as intangible assets when it is probable that projects will be successful, based on their commercial and technological feasibility, and only when the cost can be reliably measured. When capitalized, development expenditures are amortized from the start of a product commercial production, on a straight-line basis and over the period of the expected benefit.
2.w) Financial instruments
As of January 1, 2018, IFRS 9 was adopted by the Company, all assets and liabilities are recorded according to the respective practice.
i) Financial assets
Assets are classified according to the definition of the business plan adopted by the Company and the characteristics of the cash flow of the financial asset.
· Recognition and measurement
The Company classifies, at initial recognition, its financial assets into three categories: i) assets measured at amortized cost ii) fair value through profit or loss and iii) fair value through other comprehensive income.
· Amortized cost
Assets measured at amortized cost must be measured if both of the following conditions are met: i) the financial asset is maintained within the business plan whose objective is to maintain financial assets for the purpose of receiving contractual cash flows ii) the contractual terms of the financial asset give rise, on specific dates, to cash flows that exclusively constitute payments of principal and interest on the principal amount outstanding, the Company shall recognize its interest income, exchange gains and losses and impairment directly in the income statement
· Fair value through profit or loss
Financial assets should be measured at fair value through profit or loss only if they are not measured as assets measured at amortized cost or fair value through other comprehensive income.
· Fair value through other comprehensive income.
Financial assets shall be measured at fair value through comprehensive income only when the following conditions are met: i) the financial asset is maintained within a business plan whose objective is achieved by the receipt of contractual cash flow and by the sale of financial assets, ii) the contractual terms of the financial asset give rise, in specific dates and interest on the value of the outstanding principal.
FS-22
|
|
The assets measured at fair value through other comprehensive income are classified into two categories: i) debt instruments in which the interest income calculated using the effective interest method, the foreign exchange gains and losses and the impairment are recognized in the statement of income. Other net income is recognized directly in the Company's equity, in "other comprehensive income". In derecognition of the asset, the accumulated result in other comprehensive income is reclassified to income, and ii) equity instrument in which these assets are measured subsequent to the fair value. The dividends are recognized as a gain in profit or loss, unless the dividend represents a clear recovery of part of the cost of the investment. Other net income is recognized directly in the Company's equity in "other comprehensive income" and is never reclassified to income.
The fair values of publicly quoted investments are based on current purchase prices. If the market for a financial asset (and for instruments not listed on a stock exchange) is not active, the Company establishes the fair value by using valuation techniques. These techniques include the use of recent transactions contracted with third parties, reference to other instruments that are substantially similar, analysis of discounted cash flows, and option pricing models that make maximum use of market inputs and relies as little as possible on entity-specific inputs.
Regular purchases and sales of financial assets are recognized at the trading date on which the Company undertakes to buy or sell the asset.
· Derecognition of financial assets
Financial assets are derecognized when the rights to receive cash flows from the investments have expired or have been transferred, in the latter case, provided that the Company has transferred significantly all risks and rewards of ownership.
If the company holds substantially all the risks and rewards of ownership of the financial asset, it must continue to recognize the financial asset.
ii) Financial liabilities
Financial liabilities are classified under the following categories: financial liability at amortized cost, fair value through profit or loss. Management determines the classification of its financial liabilities at the time of initial recognition.
· Financial liabilities measured at amortized cost
The Company shall classify all its financial liabilities as amortized cost, except financial liabilities classified at fair value through profit or loss, derivative liabilities and collateral agreement.
Other financial liabilities are measured at amortized cost using the effective interest method. The interest expenses, gains and losses are recognized in the income statement.
The Company holds the following non-derivative financial liabilities: borrowings, financing, dividends, leases, forfeit, debentures and trade payables.
· Financial liabilities at fair value through profit or loss
Financial liabilities classified in category fair value through profit or loss are financial liabilities held for trading or those designated at the time of initial recognition.
FS-23
|
|
Derivatives are also classified as trading securities, and thereby are classified so, unless they have been designated as effective hedging instruments.
Gains and losses on financial liabilities classified at fair value through profit or loss are recognized in profit or loss
· Derecognition of financial liabilities
Financial liabilities are written off only when they are extinguished, that is, when the obligation specified in the agreement is settled, canceled or expires. The Company also derecognizes a financial liability when the terms are modified and the cash flows of the modified liability are substantially different, in which case a new financial liability based on the modified terms is recognized at fair value.
iii) Offsetting of financial instruments
Financial assets and financial liabilities are offset and the net amount is reported in the balance sheet when there is a legally enforceable right to set off the recognized amounts as well as the intention to either settle them on a net basis or to realize the asset and settle the liability simultaneously.
iv) Derivative instruments and hedging activities
· Derivatives measured at fair value through profit or loss
Derivatives are initially recognized at fair value on the date when a derivative contract is entered, thereafter they are subsequently measured at their fair value and any changes are recognized as “Financial income (expenses)” in the income statement.
· Cash flow Hedge
The Company adopts hedge accounting and designates certain financial liabilities as a hedging instrument of a foreign exchange risk associated to the cash flows from forecast, highly probable exports (cash flow hedges).
At the inception of the transaction, the Company documents the relationships between the hedging instruments and the hedged items, as well as its risk management objectives and strategy for undertaking hedging transactions. The Company also documents its assessment, both at the inception of the hedge and on an ongoing basis, of whether the hedging transactions are highly effective in offsetting changes in the cash flows of the hedged items.
The effective portion of the changes in the fair value of financial liabilities designated and qualifying as cash flow hedge is recognized on equity, in line item "Hedge accounting”. Any gain or loss related to the ineffective portion is recognized immediately in other operational income/ expenses, if applicable.
The amounts accumulated in equity are realized in operational result in the periods when the forecast exports affect the result.
When a hedging instrument expires, is settled in advance or the hedging relationship no longer meets the hedge accounting criteria, or even when Management decides to discontinue hedge accounting, all cumulative gains or losses recorded in equity at the time remain recognized in equity and, from that moment, the exchange variations are recorded in the financial income/expenses. When the forecast transaction is completed, the gain or loss is reclassified to operational result. When a forecast transaction is no longer expected to take place, the cumulative gain or loss previously recognized in shareholders’ equity is immediately transferred to the income statement, in line item “Other operating”.
The movements of the hedge amounts denominated as export cash flow hedges are shown in note 12 – Financial Instruments.
FS-24
|
|
· Net investment hedge
For net investment hedge, the Company designates part of its financial liabilities as hedging instruments of its overseas investments with functional currencies other than the Group’s functional currency, according to IAS39. Such relationship occurs since the financial liabilities are related to the investments in the amounts required for the effective relationship.
At the inception of the hedge relationship, the Company documents the relationship between the hedging instrument and the hedged item, along with its risk management objectives and its strategy for undertaking hedge transactions. Furthermore, at the inception of the hedge and on an ongoing basis, the Company documents whether the hedging instrument is highly effective in offsetting changes in fair values of the hedged item.
The effective portion of changes in the fair value of financial liabilities that are designated and qualify as a net investment hedge is recognized in equity in line item “Hedge Accounting”. The gain or loss relating to the ineffective portion is recognized in other operating, when applicable. If at some point of the hedging relationship the balance of the debt is higher than the balance of the investment, the exchange variation on the excess debt will be reclassified to the statement of profit or loss as other operating income / expenses (ineffectiveness of the hedge).
The amounts accumulated in equity will be realized in the statement of profit or loss upon disposal or partial disposal of the foreign operation.
The changes in the amounts of hedge denominated as Net investment hedge are shown in note 12 – Financial Instruments.
2.x) Segment information
An operating segment is a component of the Group committed to the business activities from which it can obtain revenues and incur expenses, including revenues and expenses related to transactions with any other components of the Group. All the operating results of operating segments are reviewed regularly by the Executive Officers of CSN to enable decisions regarding resources to be allocated to the segment and assessment of its performance. The Company maintains distinct financial information for the distinct segments.
2.y) Government grants
Government grants are recognized when there is reasonable assurance that:
- the Company will comply to the conditions attaching to them;
- assurance that the grants will be received.
Government grants will be recognized as revenue on a systematic basis over the periods in which the Company recognizes the related costs that the grants are intended to compensate.
The Company has state tax incentives in the South, North and Northeast regions, which are recognized in profit or loss as a reduction of the corresponding costs, expenses and taxes.
2.z) Noncurrent assets held for sale and discontinued operations
Noncurrent assets and groups of assets are classified as held for sale if their carrying amount is recovered mainly through a sale transaction and not through continued use.
The criteria for classification of items held for sale are considered to be met only when the sale is highly probable and the asset or group of assets is available for immediate sale.
Assets and liabilities classified as held for sale are presented separately as current items in the balance sheet.
Classification as a discontinued operation occurs through disposal, or when the transaction meets the criteria to be classified as held for sale if this occurs earlier. A discontinued operation is a component of a Group business which comprises operations and cash flows that may be clearly distinct from the rest of the Group and represent a separate business line or geographical area of operations.
FS-25
|
|
The result of discontinued operations is presented in a single amount in the income statement, including the total income after income tax of these operations, less any impairment loss.
2.a.a) New standard and interpretation not yet adopted
The following standard and interpretation has been issued and will be mandatory for subsequent accounting periods, that is, as of January 1, 2020 and 2021 and were not early adopted by the Group for the year ended December 31, 2019:
|
Standard |
Main items introduced by the standard |
Effective date |
|
The Conceptual framework for financial reporting |
Review of the Conceptual Framework by establishing a comprehensive set of concepts for guidance on financial performance reporting; better definitions and guidelines, highlighting the definition of a liability; and clarification in relevant areas. |
January 1, 2020 |
The Conceptual Framework for Financial Reporting
The Conceptual Framework for Financial Reporting defines the fundamental concepts to financial reporting that guide regulatory bodies in developing their standards accounting.
The proposed changes aim to bring accounting information and better understanding of the scope of application of the standard. The Company estimates that it will not have significant impacts by the revision of Conceptual Framework for Financial Reporting, since the concepts established by the standard are already applied.
2.a.b) New standard and interpretation already adopted
The following standards and interpretations have been issued and were applied by the Company as of January 1, 2019:
| Standard | Main items introduced by the standard | Effective date |
| IFRS16 – Leases |
This new standard defines the principles for recognition, measurement, presentation and disclosure of leases and introduces a single model for the accounting of leases in the balance sheet for the lessees. A lessee recognizes a right of use asset that represents his right to use the leased asset and a lease liability that represents his obligation to make lease payments. Optional exemptions are available for short-term leases and low-value items. For lessors, accounting treatment remains practically the same, with the classification of leases as operating leases or financial leases. IFRS 16 replaces existing lease standards, including IAS 17 - Leasing operations and IFRIC 4, SIC 5 and SIC 27 - Complementary aspects of leasing operations |
January 1, 2019 |
| IFRIC 23 – Uncertainty over Income Tax Treatments | Can be unclear how tax law applies to a particular transaction or circumstance. This interpretation complements IAS 12 – Income Tax, to clarify how to reflect the effects of uncertainty over income tax treatments. | January 1, 2019 |
The effects of IFRS 16 are further detailed in Note 13.
IFRIC 23 did not bring any impact in the Company’s financial statements as of and for the year ended December 31, 2019.
3 CASH AND CASH EQUIVALENTS
|
|
|
Consolidated | |
|
|
12/31/2019 |
|
12/31/2018 |
|
Current |
|
|
|
|
Cash and cash equivalents |
|||
|
Cash and banks |
496,769 |
1,124,714 | |
|
|
| ||
|
Short-term investments |
|
| |
|
In Brazil: |
|
| |
|
Government securities |
69,093 |
10,247 | |
|
Private securities |
462,831 |
609,480 | |
|
|
531.924 |
619,727 | |
|
Abroad: |
|
| |
|
Private securities |
60,262 |
503,563 | |
|
Total short-term investments |
592,186 |
1,123,290 | |
|
Cash and cash equivalents |
1,088,955 |
2,248,004 |
The funds available established in Brazil, are basically invested in repurchase agreements and Bank Certificate of Deposit (“CDBs”) and yield interest based on the floating of Certificates of Interbank Deposits (“CDI”) and government securities are basically repurchase agreements backed by National Treasury Notes. The Company invests part of the resources through the exclusive investment funds, whose financial statements have been consolidated in the Company. The funds are managed by BNY Mellon Serviços Financeiros DTVM S.A. and Caixa Econômica Federal (CEF).
FS-26
|
|
The funds available abroad are invested in private securities, in banks considered by management as top rated banks and the returns are based on fixed interest rates
4 FINANCIAL INVESTMENTS
|
Consolidated | |||||||
|
Current |
Non Current | ||||||
|
12/31/2019 |
12/31/2018 |
12/31/2019 |
12/31/2018 | ||||
|
CDB - Certificate of bank deposit (1) |
481,409 |
|
882,376 |
|
|
|
|
|
Government securities (2) |
37,144 |
|
13,337 |
|
|
|
|
|
Time Deposit (3) |
|
|
|
|
|
|
7,772 |
|
Usiminas shares(4) |
2,114,620 |
|
|
|
|
|
|
|
Bonds(5) |
|
|
|
|
95,719 |
|
|
|
2,633,173 |
|
895,713 |
|
95,719 |
|
7,772 | |
(1) Financial investment with restricted modality and linked to Bank Certificate of Deposit to secure a letter of guarantee from financial institutions.
(2) Investments in National Treasury Bills (LFT) managed by its exclusive funds.
(3) As of December 31, 2019, the investments in Time Deposit in custody to cover additional expenses of the sale of LLC was fully redeemed.
(4) In December 2019, the Company opted to reclassify Usiminas' investment to current assets (see notes 8.f and 12.II), and part of the shares guarantees a portion of the Company's debt.
(5) Bonds with Fibra Bank due in February 2028.
5 TRADE RECEIVABLES
|
Consolidated | |||
|
12/31/2019 |
|
12/31/2018 | |
|
Trade receivables |
|||
|
Third parties |
|||
|
Domestic market |
1,118,632 |
1,369,396 | |
|
Foreign market |
1,003,905 |
852,821 | |
|
|
2,122,537 |
2,222,217 | |
|
Allowance for doubtful debts |
(245,194) |
(237,352) | |
|
|
1,877,343 |
1,984,865 | |
|
Related Parties (note 18 b) |
170,588 |
93,317 | |
|
|
2,047,931 |
2,078,182 |
The Company performs operations relating to assignment of receivables without co-obligation in which, after assigning the customer’s trade notes/bills and receiving the amounts from each transaction closed, CSN settles the trade receivables and becomes entirely free of the credit risk on the transaction. In the consolidated, this transaction totals R$51,161 as of December 31, 2019 (R$46,210 as of December 31, 2018).
The breakdown of gross trade receivables from third parties is as follows:
|
Consolidated | |||
|
12/31/2019 |
|
12/31/2018 | |
|
Current |
1,739,746 |
1,514,847 | |
|
Past-due up to 30 days |
132,845 |
177,287 | |
|
Past-due up to 180 days |
23,877 |
47,684 | |
|
Past-due over 180 days |
226,069 |
482,399 | |
|
|
2,122,537 |
2,222,217 |
FS-27
|
|
The movements in the Group’s allowance for doubtful debts are as follows
|
Consolidated | |||
|
12/31/2019 |
|
12/31/2018 | |
|
Opening balance |
(237,352) |
(191,979) | |
|
Expected credit losses |
(43,313) |
(53,706) | |
|
Recovery of receivables |
35,471 |
8,333 | |
|
Closing balance |
(245,194) |
(237,352) | |
6 INVENTORIES
|
Consolidated | |||
|
12/31/2019 |
12/31/2018 | ||
|
Finished goods |
1,691,842 |
|
1,501,969 |
|
Work in progress |
1,294,369 |
|
1,217,611 |
|
Raw materials |
1,493,129 |
|
1,584,140 |
|
Spare parts |
902,135 |
|
857,402 |
|
Advances to suppliers |
35,828 |
|
36,192 |
|
(-) Provision for losses |
(134,553) |
|
(157,754) |
|
5,282,750 |
|
5,039,560 | |
The movements in the provision for inventory losses are as follows:
|
Consolidated | |||
|
12/31/2019 |
|
12/31/2018 | |
|
Opening balance |
(157,754) |
(135,840) | |
|
(Estimated losses) / Reversal of inventories with low turnover and obsolescence |
23,201 |
|
(21,914) |
|
Closing balance |
(134,553) |
(157,754) | |
FS-28
|
|
7 OTHER CURRENT AND NON-CURRENT ASSETS
The group of other current and non-current assets is comprised as follows:
|
|
|
|
|
Consolidated | |||
|
Current |
Non-current | ||||||
|
12/31/2019 |
12/31/2018 |
|
12/31/2019 |
12/31/2018 | |||
|
Judicial deposits (note 16) |
|
|
328,371 |
347,950 | |||
|
Credits with the PGFN (1) |
|
|
46,774 |
46,774 | |||
|
Recoverable taxes (2) |
1,282,415 |
1,412,335 |
2,119,940 |
1,822,388 | |||
|
Prepaid expenses |
107,428 |
49,830 |
126,213 |
49,808 | |||
|
Freight expenses(3) |
96,305 |
|
117,156 |
|
|
|
|
|
Actuarial assets - related parties (Note 18 b) |
|
|
13,714 |
99,894 | |||
|
Derivative financial instruments (note 12 I) |
1,364 |
351 |
4,203 |
| |||
|
Securities held for trading (note 12 I) |
4,034 |
4,503 |
|
| |||
|
Iron ore inventory (4) |
|
|
144,499 |
144,499 | |||
|
Northeast Investment Fund – FINOR |
|
|
199 |
26,598 | |||
|
Loans with related parties (notes 18 b and 12 I) |
|
2,675 |
846,300 |
706,605 | |||
|
Other receivables from related parties (Note 18 b) |
1,830 |
3,649 |
428,672 |
218,840 | |||
|
Other receivables (note 12 I) |
|
|
7,059 |
7,451 | |||
|
Eletrobrás' compulsory loan (Note 12 I) (5) |
|
|
845,284 |
813,428 | |||
|
Dividends receivable (note 18 b) |
44,554 |
46,171 |
|
| |||
|
Employee debt |
33,045 |
31,645 |
|
| |||
|
Others |
102,021 |
84,709 |
146,326 |
988 | |||
|
|
1,672,996 |
1,753,024 |
5,057,554 |
4,285,223 | |||
|
| |||||||
(1) Refers to the excess of judicial deposit originated by the 2009 REFIS (Tax Debt Refinancing Program).
(2) Refers mainly to PIS / COFINS, ICMS recoverable and income and social contribution taxes to be offset. On September 20, 2018, res judicata the writ of mandamus and special appeal filed in 2006, in which CSN and Federal Union were parties, related to the discussion about the non-inclusion of ICMS in the calculation base of PIS and COFINS, confirmed the CSN's right to offset the amounts over-collected from 2001 to 2014.
(3) Refers a payment of freight expenses and maritime insurance over revenues didn’t recognized.
(4) Long-term iron ore inventories that will be used after the construction of the processing plant, which will produce pellet feed, expected to start operating from the second half of 2021.
(5) This is a certain and due amount, arising from the res judicata favorable decision to the Company, which is irreversible and irrevocable, in order to apply the STJ's consolidated position on the subject, which culminated in the conviction of Eletrobrás to the payment of the correct interest and monetary adjustment of the Compulsory Loan. The res judicata decision, as well as the certainty about the amounts involved in the liquidation of the sentence (judicial procedure to request the satisfaction of the right), allowed the conclusion that the entry of this value is certain. In addition to this amount already recorded, the Company continues to seek alternatives for the recovery of additional credits and the estimate can reach an amount greater than R$350 million.
FS-29
|
|
8 INVESTMENTS
· Reduction of financial leverage
With the primary objective of reducing the Company’s financial leverage, Management is committed to a plan to dispose of a set of assets, however, it is not possible to confirm that the sale within a period of 12 months is highly probable for any of the assets contemplated in the plan. The Company considers several sales scenarios that vary according to different macroeconomic and operational assumptions. In this context, the Company did not segregate and did not reclassify such assets in the financial statements as discontinued operations in accordance with IFRS 5.
8.a) Investments in joint ventures, joint operations, associates and other investments
|
|
12/31/2019 |
12/31/2018 | ||||||||||||||||||
|
Companies |
Participation in |
Participation in | ||||||||||||||||||
|
Assets |
Liabilities |
Shareholders’ equity |
Fair Value |
Profit / (Loss) for the period |
Assets |
Liabilities |
Shareholders’ equity |
Fair Value |
Profit / (Loss) for the period | |||||||||||
|
Joint-venture and Joint-operation |
|
|
|
|
|
|
|
|
|
|
|
|
|
|
|
|
|
|
|
|
|
MRS Logística S.A. |
4,145,205 |
2,616,218 |
1,528,987 |
433,635 |
187,597 |
3,125,912 |
1,693,200 |
1,432,712 |
445,383 |
194,403 | ||||||||||
|
MRS - fair value amortization (Note 8.b) |
|
|
|
|
|
|
|
|
|
(11,747) |
|
|
|
|
|
|
|
|
|
(11,746) |
|
CBSI - Companhia Brasileira de Serviços de Infraestrutura |
6,695 |
25,941 |
19,997 |
5,944 |
4,501 | |||||||||||||||
|
Transnordestina Logística S.A. (*) |
|
4,398,434 |
|
3,209,378 |
|
1,189,056 |
|
271,116 |
|
(17,100) |
|
4,065,604 |
|
2,883,851 |
|
1,181,753 |
|
271,116 |
|
(20,429) |
|
8,543,639 |
5,825,596 |
2,718,043 |
704,751 |
165,445 |
7,217,457 |
4,597,048 |
2,620,409 |
716,499 |
166,729 | |||||||||||
|
Associates |
|
|
|
|
|
|
|
|
|
|
|
|
|
|
|
|
|
|
|
|
|
Arvedi Metalfer do Brasil |
44,435 |
31,712 |
12,723 |
(1,682) |
40,712 |
26,308 |
14,404 |
(5,087) | ||||||||||||
|
|
|
44,435 |
|
31,712 |
|
12,723 |
|
|
|
(1,682) |
|
40,712 |
|
26,308 |
|
14,404 |
|
|
|
(5,087) |
|
Classified at fair value through profit or loss (note 12 I) |
||||||||||||||||||||
|
Usiminas |
|
|
|
|
|
|
|
|
|
|
|
|
|
|
|
2,250,623 |
|
|
|
|
|
Panatlântica |
47,300 |
28,566 |
||||||||||||||||||
|
|
|
|
|
|
|
47,300 |
|
|
|
|
|
|
|
|
|
2,279,189 |
|
|
|
|
|
Eliminations (Note 8.b) |
|
|
|
|
|
|
|
|
|
(38,219) |
|
|
|
|
|
|
|
|
|
(28,252) |
|
Other Investiments |
|
|
|
|
|
|
|
|
|
|
|
|
|
|
|
|
|
|
|
|
|
Others |
157 |
171 |
112 |
2,316 | ||||||||||||||||
|
|
|
|
|
|
|
157 |
|
|
|
171 |
|
|
|
|
|
112 |
|
|
|
2,316 |
|
Total Investiments in affiliated companies |
|
|
|
|
|
3,482,974 |
|
|
|
|
|
|
|
|
|
5,630,613 |
|
|
|
|
| Total Equity in results of affiliated companies (Note 8.b) |
|
|
|
|
|
|
|
|
|
125,715 |
|
|
|
|
|
|
|
|
|
135,706 |
| Investment properties |
|
|
|
|
|
101,195 |
|
|
|
|
|
|
|
|
|
|
|
|
|
|
| Total Investments |
|
|
|
|
|
3,584,169 |
|
|
|
|
|
|
|
|
|
5,630,613 |
|
|
|
|
(*) As of December 31, 2019, and 2018, the Fair Value generated in the loss of control of Transnordestina Logística S.A. is R$ 659,105 and impairment of R$ 387,989.
The number of shares, the carrying amounts of assets, liabilities and shareholders’ equity, and the amounts of profit or loss for the year refer to the equity interests held by CSN in those companies.
FS-30
|
|
8.b) Changes of investments balances in joint ventures, joint operations, associates and other investments
|
Consolidated | |||
|
12/31/2019 |
|
12/31/2018 | |
|
Opening balance of investments |
5,630,613 |
|
5,499,995 |
|
Capital increase |
27,909 |
|
|
|
Dividends (1) |
(94,603) |
|
(87,846) |
|
Comprehensive income (2) |
(2,592) |
|
272 |
|
Equity in results of affiliated companies (3) |
175,524 |
|
173,145 |
|
Receipt arising from the sale of Usiminas’ shares |
|
|
(39,377) |
|
Update of shares classified at fair value through profit or loss (Note 12 II) |
(118,780) |
|
96,133 |
|
Reclassification of Usiminas shares |
(2,114,620) |
|
|
|
Consolidation CBSI (Note 8d) |
(8,775) |
|
|
|
Amortization of fair value - investment MRS |
(11,747) |
|
(11,746) |
|
Others |
45 |
|
37 |
|
Closing balance of investments |
3,482,974 |
|
5,630,613 |
(1) In 2019, refers to the allocation of dividends of Itá Energética, CSN Energia, CSN Mineração, Sepetiba Tecon, CBSI – Companhia Brasileira de Serviços de Infraestrutura and joint venture MRS Logística.
(2) Refers to translation to the reporting currency of the foreign investments of which functional currency is not the Brazilian Reais, actuarial gain/loss and gain/loss on investment hedge from investments accounted for under the equity method.
(3) The table below shows the reconciliation of the equity in results of affiliated companies classified as joint venture and associates and the amount disclosed in the income statement and it is due to the elimination of the results of the CSN´s transactions with these companies.
|
Consolidated | |||
|
12/31/2019 |
|
12/31/2018 | |
|
Equity in results of affiliated companies |
|
|
|
|
MRS Logística S.A. |
187,597 |
194,403 | |
|
CBSI - Companhia Brasileira de Serviços de Infraestrutura (1) |
6,695 |
4,501 | |
|
Transnordestina Logística S.A. |
(17,100) |
(20,429) | |
|
Arvedi Metalfer do Brasil S.A. |
(1,682) |
(5,087) | |
|
Others |
14 |
(243) | |
|
|
175,524 |
173,145 | |
|
Eliminations |
|
| |
|
To cost of sales |
(57,908) |
(42,806) | |
|
To taxes |
19,689 |
14,554 | |
|
Others |
|
|
|
|
Amortization of fair value – investment in MRS |
(11,747) |
(11,746) | |
|
Others |
157 |
2,559 | |
|
Equity in results adjusted |
125,715 |
135,706 |
(1) Refers to the equity in results of affiliated companies until November 30, 2019.
8.c) Additional information about the main operating subsidiaries
· SEPETIBA TECON S.A. (“Tecon”)
FS-31
|
|
The Container Terminal was created to exploit the terminal no 1 in Itaguaí Port, located in the State of Rio de Janeiro. The terminal is connected to the UPV by the Southeast railroad network. The Southeast railroad network is the contract object of the concession that has been granted to MRS Logística S. A. The range of services includes the move operation of cargo, storage of containers and steel products, general cargo, cleaning and maintenance.
Tecon won a bidding procedure and entered into the lease agreement in October 23, 1998 for operation of the port terminal for a period of 25 years, extendable for an equal period.
Upon termination of the lease, it will return to the Union as well as all the rights and benefits transferred to Tecon, along with the ownership of assets and those resulting from investments, declared reversible by the Federal Government for being necessary to the continuity of terminal´s operation. The reversible assets will be indemnified by the Federal Government at the residual value of cost, based on the accounting records of Tecon after deducting depreciation.
· ESTANHO DE RONDÔNIA S.A. (“ERSA”)
Headquartered in the state of Rondônia, the subsidiary operates two units, which are based in the cities of Itapuã do Oeste/RO and Ariquemes/RO. In Itapuã do Oeste is extracted the cassiterite (tin ore) and in Ariquemes is located the casting operation, where the metallic tin is made, which is the raw material used in UPV for the production of tin plates.
· COMPANHIA METALÚRGICA PRADA (“Prada”)
Prada operates in the area of two segments: steel metal packaging, production and processing and distribution of flat steel.
Metal packaging
In the steel metal packaging segment, Prada produces its supply chain includes the chemical and food segments, providing packaging and printing services to leading companies in the market.
Distribution
Prada is a player in the market of processing and distribution regarding flat steel products, with a diversified product line. It provides coils, rolls, strips, blanks, metal sheets, profiles, tubes and tiles, among other products, to the most different industry segments - from automotive to construction. It is also specialized in providing service steel processing, meeting the demand of all national companies.
· CSN ENERGIA S.A.
Its main objective is the distribution of the excess electric power generated by CSN and Companies, consortiums or other entities in which CSN holds an interest.
· FTL - FERROVIA TRANSNORDESTINA LOGÍSTICA S.A. (“FTL”)
FTL was created on the purpose of incorporating the spun-off portion of Transnordestina Logística S.A, the Company holds the concession to operate the railway cargo transportation, the public service is provided in northeastern Brazil, which includes the railway between the towns of Sao Luis to Altos, Altos to Fortaleza, Fortaleza to Souza, Souza to Recife/Jorge Lins, Recife/Jorge Lins, Recife/Jorge Lins to Salgueiro, Jorge Lins to Propriá, Paula Cavalcante to Cabedelo (Cabedelo Branch) and Itabaiana to Macau (Macau Branch) ("Network I").
As of May 13, 2019, the CSN subscribed shares by capitalization of advances for future capital increase amounting R$27,670, therefore its participation in the share capital of the company increased from 91.69% to 92.38%. As a result of the operations described above that caused a change in the shareholder’s participation, the Company recorded a loss in the amount of R$293, recorded in shareholders' equity in other comprehensive income.
FS-32
|
|
· CSN MINERAÇÃO S.A. (“CSN Mineração”)
Headquartered in Congonhas, Minas Gerais, it is primarily engaged in the production, purchase and sale of iron ore and commercializes its products mainly in the overseas market. From November 30,2015, the CSN Mineração S.A. has centralized mining operations of CSN, including the establishments of the mine Casa de Pedra, the port TECAR and the participation of 18.63% in MRS. The participation of the CSN in this subsidiary is 87.52%.
· MINÉRIOS NACIONAL S.A. (“Minérios Nacional”)
Headquartered in Congonhas, Minas Gerais, Mineração Nacional is mainly engaged in the production and commercialization of iron ore. This subsidiary concentrates the mining rights assets related to the Fernandinho, Cayman and Casa de Pedra mines transferred to this subsidiary in the business combination process that took place in 2015.
8.d) Joint ventures and joint operations financial information
The balances of the balance sheets and income statements of joint venture and joint operation are presented as follows and refer to 100% of the companies´ results:
|
12/31/2019 |
12/31/2018 | |||||||||||||
|
|
Joint-Venture |
|
Joint-Operation |
Joint-Venture |
|
Joint-Operation | ||||||||
|
Equity interest (%) |
MRS Logística |
Transnordestina Logística |
Itá Energética |
MRS Logística |
CBSI |
Transnordestina Logística |
Itá Energética | |||||||
|
34.94% |
47.26% |
48.75% |
34.94% |
50.00% |
46.30% |
48.75% | ||||||||
|
Balance sheet |
|
|
|
|
|
|
|
|
|
|
|
|
|
|
|
Current assets |
||||||||||||||
|
Cash and cash equivalents |
|
670,296 |
|
17,166 |
|
65,793 |
|
345,962 |
|
2,091 |
|
19,234 |
|
29,870 |
|
Advances to suppliers |
20,100 |
3,240 |
363 |
17,750 |
73 |
1,734 |
937 | |||||||
|
Other current assets |
|
1,326,281 |
|
59,405 |
|
15,955 |
|
736,768 |
|
41,284 |
|
108,851 |
|
16,718 |
|
Total current assets |
2,016,677 |
79,811 |
82,111 |
1,100,480 |
43,448 |
129,819 |
47,525 | |||||||
|
Non-current assets |
|
|
|
|
|
|
|
|
|
|
|
|
|
|
|
Other non-current assets |
789,562 |
258,391 |
24,361 |
804,570 |
2,111 |
222,630 |
25,840 | |||||||
|
Investments, PP&E and intangible assets |
|
8,316,033 |
|
8,968,447 |
|
426,403 |
|
6,482,292 |
|
6,324 |
|
8,428,567 |
|
457,578 |
|
Total non-current assets |
9,105,595 |
9,226,838 |
450,764 |
7,286,862 |
8,435 |
8,651,197 |
483,418 | |||||||
|
Total Assets |
|
11,122,272 |
|
9,306,649 |
|
532,875 |
|
8,387,342 |
|
51,883 |
|
8,781,016 |
|
530,943 |
|
Current liabilities |
|
|
|
|
|
|
|
|
|
|
|
|
|
|
|
Borrowings and financing |
653,784 |
103,877 |
422,793 |
4,350 |
75,906 |
|||||||||
|
Leases |
|
256,034 |
|
|
|
|
|
|
|
|
|
|
|
|
|
Other current liabilities |
|
1,561,684 |
171,821 |
16,793 |
1,368,290 |
33,844 |
179,816 |
18,298 | ||||||
|
Total current liabilities |
|
2,471,502 |
|
275,698 |
|
16,793 |
|
1,791,083 |
|
38,194 |
|
255,722 |
|
18,298 |
|
Non-current liabilities |
|
|||||||||||||
|
Borrowings and financing |
|
2,369,615 |
|
6,084,424 |
|
|
|
2,111,518 |
|
1,262 |
|
5,754,073 |
|
|
|
Leases |
|
1,650,758 |
||||||||||||
|
Other non-current liabilities |
|
527,871 |
|
430,603 |
|
16,550 |
|
640,535 |
|
539 |
|
218,839 |
|
15,113 |
|
Total non-current liabilities |
|
4,548,244 |
6,515,027 |
16,550 |
2,752,053 |
1,801 |
5,972,912 |
15,113 | ||||||
|
Shareholders’ equity |
|
4,102,526 |
|
2,515,924 |
|
499,532 |
|
3,844,206 |
|
11,888 |
|
2,552,382 |
|
497,532 |
|
Total liabilities and shareholders’ |
|
11,122,272 |
9,306,649 |
532,875 |
8,387,342 |
51,883 |
8,781,016 |
530,943 | ||||||
|
01/01/2019 a 11/30/2019 |
01/01/2019 a 12/31/2019 |
01/01/2018 a 12/31/2018 | ||||||||||||||
|
|
|
Joint-Venture |
|
Joint-Operation |
Joint-Venture |
|
Joint-Operation | |||||||||
|
Participação (%) |
CBSI |
MRS Logística |
Transnordestina Logística |
Itá Energética |
MRS Logística |
CBSI |
|
Transnordestina Logística |
Itá Energética | |||||||
|
50.00% |
34.94% |
47.26% |
48.75% |
34.94% |
50.00% |
46.30% |
48.75% | |||||||||
|
Statements of Income |
|
|
|
|
|
|
|
|
|
|
|
|
|
|
|
|
|
Net revenue |
267,436 |
3,200,809 |
163,048 |
3,726,448 |
166,080 |
166,358 | ||||||||||
|
Cost of sales and services |
|
(233,830) |
|
(2,382,828) |
|
|
|
(83,129) |
|
(2,476,628) |
|
(142,254) |
|
|
|
(77,829) |
|
Gross profit |
33,606 |
817,981 |
79,919 |
1,249,820 |
23,826 |
- |
88,529 | |||||||||
|
Operating (expenses) income |
|
(12,328) |
|
207,840 |
|
(18,077) |
|
(62,660) |
|
(313,606) |
|
(10,884) |
|
(18,020) |
|
(60,104) |
|
Financial income (expenses), net |
(1,460) |
(268,089) |
(18,386) |
1,183 |
(151,839) |
(179) |
(26,103) |
(126) | ||||||||
|
Income before income tax and social |
|
19,818 |
|
757,732 |
|
(36,463) |
|
18,442 |
|
784,375 |
|
12,763 |
|
(44,123) |
|
28,299 |
|
Current and deferred income tax |
(6,428) |
(254,378) |
(6,147) |
(262,760) |
(3,761) |
(9,452) | ||||||||||
|
(Loss) profit for the year, net |
|
13,390 |
|
503,354 |
|
(36,463) |
|
12,295 |
|
521,615 |
|
9,002 |
|
(44,123) |
|
18,847 |
FS-33
|
|
· ITÁ ENERGÉTICA S.A. - (“ITASA”)
ITASA is a corporation established in July 1996 that was engaged to operate under a concession, the Itá Hydropower Plant (“UHE Itá”), with 1,450 MW of installed power, located on the Uruguay River, on the Santa Catarina and Rio Grande do Sul state border. The UHE Itá concession is shared with ENGIE Brasil Energia S.A., with CSN holding 48.75%.
· MRS LOGÍSTICA S.A. (“MRS”)
With registered offices in the City of Rio de Janeiro-RJ, this subsidiary is engaged in public railroad transportation, on the basis of an onerous concession, on the domain routes of the Southeast Grid of the federal railroad network (Rede Ferroviária Federal S.A. – RFFSA), located in the Southeast (Rio de Janeiro, São Paulo and Belo Horizonte. The concession has a 30-year term as from December 1, 1996, extendable for an equal term by exclusive decision of the concession grantor.
MRS may further engage in services involving transportation modes related to railroad transportation and participate in projects aimed at expanding the railroad service concessions granted.
For performance of the services covered by the concession, MRS leased from RFFSA for the same concession period, the assets required for operation and maintenance of the freight railroad transportation activities. At the end of the concession, all the leased assets are to be transferred to the ownership of the railroad transportation operator designated at that time.
The Company had a direct equity interest of 18.64% in the capital stock of MRS and an indirect equity interest of 18.63% through its subsidiary CSN Mineração S.A., consequently the total participation is 34.94%.
· CONSÓRCIO DA USINA HIDRELÉTRICA DE IGARAPAVA
The Igarapava Hydroelectric Power Plant is located on the Grande River, in the city of Conquista, MG, and has installed capacity of 210 MW. It consists of 5 bulb-type generating units.
CSN holds a 17.92% investment in the consortium, whose specific purpose is the distribution of electric power, which is made according to the percentage equity interest of each company.
The balance of property, plant and equipment less depreciation as of December 31, 2019 is R$22,441 (R$23,596 as of December 31, 2018) and the expense in 2019 amounted to R$6,497 (R$5,827 in 2018).
· CBSI - COMPANHIA BRASILEIRA DE SERVIÇOS DE INFRAESTRUTURA (“CBSI”)
CBSI is the result of a joint venture between CSN and CKTR Brasil Ltda, which CSN held 50% interest. Based in the city of Araucária, PR, CBSI is primarily engaged in providing services to CSN and other third-party entities, and can operate activities related to the refurbishment and maintenance of industrial machinery and equipment, construction maintenance, industrial cleaning, logistic preparation of products, among other activities.
- Business Combination: Acquisition of control of the company CBSI – Companhia Brasileira de Serviços de Infraestrutura (“CBSI”)
On November 29, 2019, the Company acquired 50% of the capital of the company CBSI, of which it already held another 50%, becoming the holder of 100% of the shares. The value of the transaction was R$24,000 (twenty-four million reais) for 1,875,146 (one million eight hundred seventy-five thousand one hundred forty-six) common, nominative shares with no par value.
FS-34
|
|
The parties involved recognize that the price has been established considering the liabilities, contingencies, assets and results, past and future, of CBSI, and that no additional claim will be accepted from any of the parties at any time in relation to the value of the transaction.
The market values of the assets acquired, and liabilities assumed do not differ from the book values on the acquisition date.
Determination of the purchase price:
|
Description |
|
R$ |
|
Reference |
|
Fair value of the interest held by the acquirer in the acquiree immediately before the combination |
|
8,775 |
|
(i) |
|
Amount paid on the acquisition of CBSI |
24,000 |
(ii) | ||
|
Purchase price considered for the business combination |
|
32,775 |
|
|
i. 50% of the stake held prior to the acquisition;
ii. Total amount paid for another 50% of the CBSI company.
In accordance with IFRS 3 - Business Combination, the interest held by the Company is part of the consideration transferred.
Below are the values resulting from the business combination:
|
Assumptions |
|
R$ |
|
Consideration paid for the acquisition of the remaining 50% interest in CBSI |
|
24,000 |
|
Fair value of the stake previously held by CSN |
8,775 | |
|
Total consideration paid for the acquisition of CBSI |
|
32,775 |
|
Fair value of CBSI's shareholders' equity on the acquisition date |
(17,550) | |
|
Goodwill |
|
15,225 |
Goodwill is an asset that represents future economic benefits resulting from other assets acquired in a business combination, which are not individually identified and separately recognized. It is allocated to a separate account in the individual financial statements in the investment group and in the intangible group in the consolidated financial statements.
FS-35
|
|
The balance sheet of the assets acquired, and liabilities assumed on November 29, 2019 is shown below:
|
ASSETS |
|
|
|
Cash and cash equivalents |
2,656 | |
|
Accounts receivable |
|
67,340 |
|
Deferred taxes |
476 | |
|
Other assets |
|
11,301 |
|
Inventory |
16,939 | |
|
Fixed assets |
|
9,123 |
|
Intangible assets |
348 | |
|
Total assets acquired |
|
108,183 |
|
LIABILITIES |
||
|
Borrowings and financing |
|
19,781 |
|
Trade payables |
15,564 | |
|
Payroll and related taxes |
|
32,855 |
|
Tax payables |
1,950 | |
|
Provisions |
|
5,369 |
|
Other liabilities |
15,114 | |
|
Total liabilities assumed |
|
90,633 |
|
Equity acquired |
17,550 |
· TRANSNORDESTINA LOGÍSTICA S.A. (“TLSA”)
TLSA is primarily engaged in the public service operation and development of a railroad network in the Northeast of Brazil network, comprising the rail segments Eliseu Martins to Trindade, Trindade to Salgueiro, Salgueiro to Porto Suape, Salgueiro to Missão Velha and Missão Velha to Pecém (“Railway System II”).
It is in pre-operational phase and will remain so until the completion of Rail Network II. The approved schedule, which considered the completion of the work by January 2017, is currently under discussion with the responsible agencies, according described in the item 27.b. The Management understands that new deadlines for project completion will not have material adverse effects on the expected return on investment.
During the year 2017, the other shareholders of TLSA subscribed 2,912,997 shares in amounting to R$153,253, diluting CSN on TLSA share capital to 46.30%. Therefore, due to the transactions described above and the participation change of the shareholders in the share capital of TLSA on 2017, the Company recognized a gain of R$2,814, recorded in equity in other comprehensive income. In May 2019, the Northeast Investment Fund - FINOR transferred to CSN, BNDES and BNDESPAR, 1,677,816 (one million six hundred seventy-seven thousand, eight hundred and sixteen) class “B preferred shares, of which 501,789 (five hundred and one thousand, seven hundred and eighty-nine) shares were transferred specifically to CSN. On 12/31/2019, the Company's interest in the capital of TLSA is 47.26% of the total capital and 92.60% of the voting capital.
The Management receives funds from its shareholders and third parties for completion of the works, according described in the item 27.b, which are expected to be available, based on agreements previously entered into and recent discussions between the involved parties. After analyzing this matter, Management concluded as adequate the use of the accounting base of the project’s going concern in the preparation of the financial statements for the year ended December 31, 2019.
TLSA performed an impairment test of its own long-live assets using the discount cash flow method and considered the main assumptions, as follows:
Measurement of recoverable value:
|
Cash Flow Projection |
Until 2057 |
|
Gross Margin |
Based on market studies to capture operations costs and loads, based on studies of market trends. |
|
Estimated Costs |
Costs based on studies and market trends. |
|
Growth rate in perpetuity |
Growth rate was not considered due to the projection model until the end of the concession. |
|
Discount rate |
Between 5.09% to 6.98% in real terms. |
FS-36
|
|
In addition, CSN, as an investor, performed an impairment test of its stake in TLSA, through TLSA ability to distribute dividends, methodology known as Dividend Discount Model, or DDM, to remunerate the capital invested by shareholders. In order to perform this test, some aspects were taken into account, such as:
· The flow of dividends was obtained from the TLSA nominal cash flow;
· The flow of dividends was calculated considering the annual percentages of participation, considering the dilutions of the CSN’s stakes due to the amortization of debts;
· This flow of dividends was discounts at present value using cost of equity (Ke) embedded in the WACC rate of TLSA; and
· This Ke obtained was the one calculated in the “rolling WACC” of TLSA.
Due to the sharing of investors risks, and by the fact that the asset that is being tested represents the cash-generating unit itself, which is equal to the legal entity, the risk determined by CSN Management is the same applied by TLSA when the evaluation of their own investments, not applying an additional risk factor to the model.
As a result, it was not necessary to recognize an impairment in the surplus-value of the investments in the year ended on December 31, 2019.
8.e) Additional information on indirect participation in abroad operations
· STAHLWERK THÜRINGEN GMBH (“SWT”)
SWT was formed from the former industrial steel complex of Maxhütte, located in the Germany city of Unterwellenborn, which produces steel shapes used for construction in accordance with international quality standards. Its main raw material is steel scrap; the Company has an installed production capacity of 1.1 million metric tons’ steel/year. The SWT is a wholly owned indirect subsidiary of CSN Steel S.L.U, a subsidiary of CSN.
· COMPANHIA SIDERURGICA NACIONAL – LLC (“CSN LLC”)
Incorporated in 2001 with the assets and liabilities from the extinct Heartland Steel Inc., CSN LLC has an industrial plant in Terre Haute, Indiana State - USA, where the cold rolled and galvanized steel production lines are located, its installed production capacity is 800 thousand tons/year. CSN LLC is a wholly owned indirect subsidiary through CSN Steel S.L.U. after Merger, previously named CSN Americas S.L.U, a subsidiary of CSN.
On June 5, 2018 CSN LLC had its corporate name changed to "Heartland Steel Processing, LLC". On the same date, a new company was incorporated under the name "Companhia Siderúrgica Nacional, LLC", a wholly owned subsidiary of Heartland Steel Processing, LLC. On June 28, 2018, Companhia Siderúrgica Nacional, LLC., became a wholly-owned subsidiary of CSN Steel and, on June 29, 2018, Heartland Steel Processing, LLC was sold to Steel Dynamics, Inc for the base transaction price of R$400 million.
The new "Companhia Siderúrgica Nacional, LLC" imports and comercializes steel products and maintains its activities in the United States.
· LUSOSIDER AÇOS PLANOS S.A. (‘Lusosider’’)
Incorporated in 1996 in succession to Siderurgia Nacional (a company privatized by the Portuguese government that year), Lusosider is the only Portuguese company of the steel industry to produce cold rolled and galvanized anti-corrosion steel. Based in Paio Pires, The Lusosider has an installed capacity of about 550,000 tons / year to produce four large groups of steel products: galvanized sheet, cold rolled sheet, pickled and oiled plate. The products are manufactured by Lusosider and may be used in the packaging industry, construction (pipes and metallic structures) and in home appliance components.
FS-37
|
|
8.f) Other investments
· PANATLÂNTICA S. A. (“Panatlântica”)
Panatlântica is a publicly-held company, headquartered in the city of Gravataí, State of Rio Grande do Sul, engaged in the manufacturing, trade, import, export and processing of steel and ferrous or non-ferrous metals, coated or not. This investment is classified as fair value through profit or loss.
The Company currently holds 11.31% (11.33% as of December 31, 2018) of Panatlântica’s total share capital.
· USINAS SIDERURGICAS DE MINAS GERAIS S.A. – USIMINAS (“USIMINAS”)
Usiminas, headquartered in Belo Horizonte, State of Minas Gerais, is engaged in steel and related operations. Usiminas produces flat rolled steel in the Intendente Câmara and José Bonifácio de Andrada e Silva plants, located in Ipatinga, Minas Gerais, and Cubatão, São Paulo, respectively, the final product is sold in the domestic and foreign market. Usiminas also exploits iron ore mines located in Itaúna, Minas Gerais, to meet its verticalization and production cost optimization strategies. Usiminas also has service and distribution centers located in several regions of Brazil, and the Cubatão, São Paulo, and Praia Mole in Espírito Santo, all centers are located in strategic locations for the shipment of its production.
On April 9, 2014, the Administrative Council for Economic Defense (CADE - Conselho Administrativo de Defesa Econômica) issued its decision on the matter about the Usiminas shares held by CSN signing a Performance Commitment Agreement), also called TCD, between CADE and CSN. Under the terms of the decision of CADE and TCD, CSN must reduce its interest in USIMINAS, within a specified period. The deadline and percentage reduction are confidential. In addition, the political rights in Usiminas will continue suspended until the Company reaches the limits established in the TCD.
In February 2018, were sold 3,136,100 of preferred shares (USIM5) in the amount of R$39,377, by the exclusive fund “VR1 - Multi-Credit Private Investment Fund.
As of December 31, 2019, and 2018, the Company’s interest in Usiminas’s capital was 15.19% in common shares and 20.29% in preferred shares.
In December 2019, the Company opted to reclassify the investment measured at fair value through profit or loss to current assets through a new management decision regarding the maintenance of shares in line with its asset sale strategy.
FS-38
|
|
USIMINAS is listed on the São Paulo Stock Exchange (“B3 S.A.”: USIM3 and USIM5).
• ARVEDI METALFER DO BRASIL S.A. (“Arvedi”)
Arvedi, headquartered in Salto, State of São Paulo, is engaged in pipe production. As of December 31, 2019 and 2018 CSN held 20.00% of Arvedi’s share capital.
8.g) Investment Property
The Company maintains several properties for the purpose of using them in its operations, whether for industrial expansions, or for the benefit of its employees and the communities adjacent to its industrial plants.
During the year of 2019, the Company started technical studies for the exploration of real estate activities aiming at earning income and capital appreciation. Already with a view to implementing these activities, during 2019 some land and buildings that were classified as fixed assets were reclassified to investment properties as shown below:
|
|
|
|
|
|
Consolidated |
|
|
Land |
|
Buildings |
|
Total |
|
Cost |
68,877 |
53,816 |
122,693 | ||
|
Accumulated depreciation |
(21,498) |
(21,498) | |||
|
Balance at December 31,2019 |
68,877 |
32,318 |
101,195 |
On December 31, 2019, the Company's management estimated the fair value of investment properties in R$1,7 billion.
9 PROPERTY, PLANT AND EQUIPMENT
|
|
|
|
|
|
|
|
|
|
|
|
|
|
|
|
Consolidated |
|
|
Land |
|
Buildings and Infrastructure |
|
Machinery, equipment and facilities |
|
Furniture and fixtures |
|
Construction |
|
Right of use (i) |
|
Other (*) |
|
Total |
|
Balance at December 31, 2018 |
287,854 |
|
2,678,638 |
|
11,687,271 |
|
30,530 |
|
3,282,436 |
|
|
|
80,135 |
|
18,046,864 |
|
Cost |
287,854 |
3,751,429 |
22,426,782 |
165,331 |
3,282,436 |
355,768 |
30,269,600 | ||||||||
|
Accumulated depreciation |
|
|
(1,072,791) |
|
(10,739,511) |
|
(134,801) |
|
|
|
|
|
(275,633) |
|
(12,222,736) |
|
Balance at December 31, 2018 |
287,854 |
2,678,638 |
11,687,271 |
30,530 |
3,282,436 |
|
80,135 |
18,046,864 | |||||||
|
Effect of foreign exchange differences |
1,499 |
|
2,978 |
|
8,033 |
|
106 |
|
2,464 |
|
|
|
56 |
|
15,136 |
|
Acquisitions |
6,125 |
16,116 |
459,460 |
1,763 |
1,924,520 |
43,111 |
41,574 |
2,492,669 | |||||||
|
Capitalized interest (notes 24 and 29) |
|
|
13 |
|
|
|
|
|
117,176 |
|
|
|
|
117,189 | |
|
Write-off (note 23) |
(2,143) |
(130) |
(80,426) |
(1) |
(30,400) |
(1,354) |
(149) |
(114,603) | |||||||
|
Depreciation (note 22) |
|
|
(135,313) |
|
(1,241,026) |
|
(5,999) |
|
|
|
(58,843) |
|
(25,038) |
|
(1,466,219) |
|
Transfers to other asset categories |
790 |
294,872 |
1,766,047 |
2,629 |
(2,053,290) |
|
(11,048) |
| |||||||
|
Transfer to intangible assets |
|
|
(31) |
|
|
|
|
|
(11,865) |
|
|
|
|
(11,896) | |
|
Right of use- Initial recognition |
|
|
|
|
640,989 |
640,989 | |||||||||
|
Right of use - Remesurement |
|
|
|
|
|
|
|
|
|
(151,558) |
|
|
(151,558) | ||
|
ARO Update |
|
225,125 |
|
|
|
|
225,125 | ||||||||
|
Transfer to Investment Property |
(67,176) |
|
(20,030) |
|
|
|
|
|
(13,989) |
|
|
|
|
(101,195) | |
|
Consolidation CBSI |
|
4,940 |
(573) |
|
|
4,756 |
9,123 | ||||||||
|
Others |
|
|
|
(680) |
|
|
|
|
|
|
|
|
(680) | ||
|
Balance at December 31, 2019 |
226,949 |
3,062,238 |
12,603,619 |
28,455 |
3,217,052 |
472,345 |
90,286 |
19,700,944 | |||||||
|
Cost |
226,949 |
|
4,250,471 |
|
24,372,514 |
|
170,229 |
|
3,217,052 |
|
531,044 |
|
386,144 |
|
33,154,403 |
|
Accumulated depreciation |
(1,188,233) |
(11,768,895) |
(141,774) |
(58,699) |
(295,858) |
(13,453,459) | |||||||||
|
Balance at December 31, 2019 |
226,949 |
|
3,062,238 |
|
12,603,619 |
|
28,455 |
|
3,217,052 |
|
472,345 |
|
90,286 |
|
19,700,944 |
(*) Refer basically to railway assets such as courtyards, tracks, mines and dormant and in the group leasehold improvements, vehicles, hardware.
FS-39
|
|
(i) Right of use
The movement of the rights of use as of December 31, 2019 is as follows
Consolidated
|
|
Land |
|
Buildings and Infrastructure |
|
Machinery, equipment and facilities |
|
Other |
|
Total |
|
Initial recognition – Rights of use |
556,133 |
|
54,513 |
|
9,783 |
|
20,560 |
|
640,989 |
|
Addition |
|
|
6,719 |
|
34,197 |
|
2,195 |
|
43,111 |
|
Remeasurement |
(152,915) |
|
12,112 |
|
(4,525) |
|
(6,230) |
|
(151,558) |
|
Depreciation |
(21,314) |
|
(9,190) |
|
(15,311) |
|
(13,028) |
|
(58,843) |
|
Write-off |
(1,338) |
|
|
|
|
|
(16) |
|
(1,354) |
|
Balance at December 31, 2019 |
380,566 |
|
64,154 |
|
24,144 |
|
3,481 |
|
472,345 |
|
Cost |
401,746 |
|
73,344 |
|
39,455 |
|
16,499 |
|
531,044 |
|
Accumulated depreciation |
(21,180) |
|
(9,190) |
|
(15,311) |
|
(13,018) |
|
(58,699) |
|
Balance at December 31, 2019 |
380,566 |
|
64,154 |
|
24,144 |
|
3,481 |
|
472,345 |
(ii) Construction in progress
The breakdown of the projects comprising construction in progress is as follows:
|
|
|
|
|
|
|
|
|
Consolidated | ||
|
|
|
Project description |
|
Start date |
|
Completion date |
|
12/31/2019 |
|
12/31/2018 |
|
Logistics |
|
|
|
|
|
|
|
|
|
|
|
|
|
Current investments for maintenance of current operations. |
|
|
|
|
|
81,944 |
|
89,595 |
|
|
|
|
|
|
|
|
|
81,944 |
|
89,595 |
|
Mining |
|
|
|
|
|
|
|
|
|
|
|
|
|
Expansion of Casa de Pedra Mine capacity production. |
|
2007 |
|
2020 |
(1) |
883,742 |
|
844,194 |
|
|
|
Expansion of TECAR export capacity. |
|
2009 |
|
2022 |
(2) |
303,965 |
|
289,298 |
|
|
|
Current investments for maintenance of current operations. |
|
|
|
|
|
389,510 |
|
725,616 |
|
|
|
|
|
|
|
|
|
1,577,217 |
|
1,859,108 |
|
Steel |
|
|
|
|
|
|
|
|
|
|
|
|
|
Supply of 16 torpedo’s cars for operation in the steel industry |
|
2008 |
|
2020 |
|
75,582 |
|
94,920 |
|
|
|
Current investments for maintenance of current operations. |
|
|
|
|
(3) |
811,049 |
|
558,922 |
|
|
|
|
|
|
|
|
|
886,631 |
|
653,842 |
|
Cement |
|
|
|
|
|
|
|
|
|
|
|
|
|
Construction of cement plants. |
|
2011 |
|
2023 |
(4) |
577,712 |
|
585,163 |
|
|
|
Current investments for maintenance of current operations. |
|
|
|
|
|
93,548 |
|
94,728 |
|
|
|
|
|
|
|
|
|
671,260 |
|
679,891 |
|
Construction in progress |
|
|
|
|
|
3,217,052 |
|
3,282,436 | ||
(1) Estimated completion date of the Central Plant Step 1;
(2) Estimated completion date of phase 60 Mtpa;
(3) Refers substantially to the technological modernization of the continuous running machines; increased efficiency in zinc plating lines and contractual agreement signed for the supply of new equipment;
(4) Refers substantially to the acquisition of new Integrated Cement Plants.
FS-40
|
|
The average estimated useful lives are as follows, in years:
|
Consolidated | |||
|
12/31/2019 |
|
12/31/2018 | |
|
Buildings |
38 |
38 | |
|
Machinery, equipment and facilities |
21 |
22 | |
|
Furniture and fixtures |
12 |
11 | |
|
Others |
14 |
15 |
9.a) Capitalized Interest
As of December 31, 2019, the Company capitalized borrowing costs amounting to R$117,189 in consolidated (as of December 31, 2018, R$71,611 in consolidated). These costs are basically estimated for the mining projects, mainly relating to the expansion of Casa de Pedra (MG) and TECAR (RJ), see notes 24 and 29. The rates for non-specific projects in the year ended December 31, 2019 are 6.58% (6.31% as of December 31, 2018).
10 INTANGIBLE ASSETS
|
Consolidated | |||||||||||||
|
Goodwill |
|
Customer relationships |
|
Software |
|
Trademarks |
|
Rights and licenses (*) |
|
Others |
|
Total | |
|
Balance at December 31, 2018 |
3,590,931 |
|
288,773 |
|
54,972 |
|
150,009 |
|
3,166,999 |
|
1,491 |
|
7,253,175 |
|
Cost |
3,831,338 |
573,614 |
161,067 |
150,009 |
3,185,701 |
1,491 |
7,903,220 | ||||||
|
Accumulated depreciation |
(131,077) |
|
(284,841) |
|
(106,095) |
|
|
|
(18,702) |
|
|
|
(540,715) |
|
Adjustment for accumulated recoverable value |
(109,330) |
(109,330) | |||||||||||
|
Balance at December 31, 2018 |
3,590,931 |
|
288,773 |
|
54,972 |
|
150,009 |
|
3,166,999 |
|
1,491 |
|
7,253,175 |
|
Effect of foreign exchange differences |
4,711 |
3 |
3,092 |
33 |
7,839 | ||||||||
|
Acquisitions and expeditures |
|
|
|
|
1,387 |
|
|
|
|
|
40 |
|
1,427 |
|
Transfer to property, plant and equipment |
7,808 |
4,088 |
11,896 | ||||||||||
|
Amortization (note 22) |
|
|
(47,345) |
|
(10,657) |
|
|
|
(127) |
|
|
|
(58,129) |
|
Goodwill - Acquisition 50% CBSI (Note 8d) |
15,225 |
15,225 | |||||||||||
|
Consolidation CBSI on November 30, 2019. |
|
|
|
|
346 |
|
2 |
|
|
|
|
|
348 |
|
Balance at December 31, 2019 |
3,606,156 |
246,139 |
53,859 |
153,103 |
3,170,960 |
1,564 |
7,231,781 | ||||||
|
Cost |
3,846,563 |
|
585,407 |
|
171,152 |
|
153,103 |
|
3,189,789 |
|
1,564 |
|
7,947,578 |
|
Accumulated depreciation |
(131,077) |
(339,268) |
(117,293) |
(18,829) |
(606,467) | ||||||||
|
Adjustment for accumulated recoverable value |
(109,330) |
|
|
|
|
|
|
|
|
|
|
|
(109,330) |
|
Balance at December 31, 2019 |
3,606,156 |
246,139 |
53,859 |
153,103 |
3,170,960 |
1,564 |
7,231,781 | ||||||
(*) Composed mainly by mineral rights. Amortization is recorded based on production volumes.
The average useful lives by nature are as follows, in years:
|
Consolidated | |||
|
12/31/2019 |
|
12/31/2018 | |
|
Software |
9 |
|
7 |
|
Customer relationships |
13 |
13 |
FS-41
|
|
10.a) Impairment testing
The goodwill arising from expectations for future profitability of the companies acquired and the intangible assets with indefinite useful lives (trademarks) have been allocated to the operational divisions (cash-generating units) of CSN, which represent the lowest level of assets or group of assets. According to IAS36, when a CGU has an intangible asset with indefinite useful life allocated, the Company performs an impairment test. The CGU with intangible assets in this situation are as follows:
|
|
Consolidated | ||||||||||||
|
|
|
|
Goodwill |
Trademarks |
Total | ||||||||
|
Cash generating unity |
Segment |
12/31/2019 |
|
12/31/2018 |
|
12/31/2019 |
|
12/31/2018 |
|
12/31/2019 |
|
12/31/2018 | |
|
Packaging (1) |
Steel |
158,748 |
158,748 |
|
|
158,748 |
158,748 | ||||||
|
Long Stel (2) |
Steel |
|
235,595 |
|
235,595 |
|
153,103 |
|
150,009 |
|
388,698 |
|
385,604 |
|
Minning (3) |
Mining |
3,196,588 |
3,196,588 |
|
|
3,196,588 |
3,196,588 | ||||||
|
Other Steel (4) |
Steel |
|
15,225 |
|
|
|
|
|
|
|
15,225 |
|
|
|
|
|
|
3,606,156 |
|
3,590,931 |
|
153,103 |
|
150,009 |
|
3,759,259 |
|
3,740,940 |
(1) The goodwill of the Packaging cash-generating unit is shown net of impairment loss in the amount of R$109,330, recognized in 2011.
(2) The goodwill and trademark that are recorded in line item intangible assets at long steel segment, those transactions are derived from the business combination of Stahlwerk Thuringen GmbH ("SWT") and Gallardo Sections CSN. The assets mentioned are considered to have indefinite useful lives as they are expected to contribute indefinitely to the Company's cash flows.
(3) Refers to the goodwill based on expectations for future profitability, resulting from the acquisition of Namisa by CSN Mineração concluded in December 2015, tested annually for the purpose of analyzing recoverability.
(4) On November 29, 2019, CSN acquired the entire stake held by CKTR Brasil Serviços Ltda., corresponding to 50% of CBSI's shares, and now holds 100% of CBSI's share capital.
The impairment testing of the goodwill and the trademark include the balance of property, plant and equipment of the cash-generating units and also the intangible assets. The test is based on the comparison between the actual balances and the value in use of those units, determining based on the projections of discounted cash flows and use of such assumptions and judgements as: growth rate, costs and expenses, discount rate, working capital, future Capex investment and macroeconomic assumptions observable in the market.
FS-42
|
|
The main assumptions used in calculations of value in use at December 31, 2019 are as follows:
|
|
Metal packaging |
Mining |
Other Steel |
Flat steel (*) |
Logistic (**) |
|
Measurement of recoverable value |
Discounted Cash Flow |
Discounted Cash Flow |
Discounted Cash Flow |
Discounted Cash Flow |
Discounted Cash Flow |
|
Cash flow projection |
Until 2029 + perpetuity |
Until 2054 |
Until 2029 + perpetuity |
Until 2029 + perpetuity |
Until 2027 |
|
Gross Margin |
Gross margin updated based on historical data, impacts of business restructuring and market trends |
Reflects projection of costs due to the progress of the mining plan as well as startup and ramp up of projects. Price and exchange rate projected according industry reports. |
Gross margin updated based on historical data and market trends |
Gross margin updated based on historical data and market trends. |
Estimated based on market studies for cargo captures and operational costs according market trends. |
|
Cost atualization |
Cost based on historical data of each product and impacts of business restructuring |
Updated costs based on historical data, progress of mining plan as well as startup and ramp up of projects |
Updated costs based on historical data and market trends |
Updated costs based on historical data and market trends |
Costs based on historical data and market trends |
|
Perpetual growth rate |
Without growth |
Without perpetuity |
Without growth |
Growth of 1.4% p.a in real terms updated by long term inflation of 1.7% p.a. of the Euro zone |
Without perpetuity |
|
Discount rate |
For metal packaging, the cash flow considered a discount rate around 8% p.a. in real terms. For mining, flat steel and other steel (CBSI), cash flows considered a discount rate between 10% and 12% p.a. in nominal terms. For the logistic segment, cash flow was discounted using a discount rate between 5.09% and 5.41% p.a. in real terms. The discount rate was based on the weighted average cost of capital ("WACC") that reflects the specific risk of each segment. | ||||
(*) Refer to assets of subsidiary Lusosider, located in Portugal. The discount rate was applied on the discounted cash flow prepared in Euros, the functional currency of this subsidiary.
(**) Refer to assets of subsidiary FTL – Ferrovia Transnordestina Logística S.A.
For the subsidiary SWT – long steel, the measurement of recoverable value was based on fair value and classified as Level 3, based on unobservable inputs that reflect the assumptions that market participants would use for pricing, including risk assumptions and discount rate.
Based on the analyses conducted by Management, it was not necessary to record losses by impairment to those assets for the year ended on December 31, 2019.
FS-43
|
|
11 BORROWINGS, FINANCING AND DEBENTURES
The balances of borrowings, financing and debentures, which are carried at amortized cost, are as follows:
|
|
|
|
Consolidated | ||||||
|
Current liabilities |
Non-current liabilities | ||||||||
|
12/31/2019 |
12/31/2018 |
12/31/2019 |
12/31/2018 | ||||||
|
Debt agreements in the international market |
|
|
|
|
|
|
|
|
|
|
Variable interest in: |
|||||||||
|
US$ |
|
|
|
|
|
|
|
|
|
|
Prepayment |
1,769,975 |
1,016,737 |
2,563,928 |
3,830,240 | |||||
|
Fixed interest in: |
|
|
|
|
|||||
|
US$ |
|
|
|||||||
|
Bonds, Perpetual Bonds and ACC |
(1) |
|
2,047,032 |
2,490,178 |
10,177,517 |
8,613,491 | |||
|
EUR |
|
|
|
|
|||||
|
Others |
223,204 |
181,056 |
147,241 |
106,535 | |||||
|
|
|
|
4,040,211 |
3,687,971 |
12,888,686 |
12,550,266 | |||
|
Debt agreements in Brazil |
|
|
|||||||
|
Securities with variable interest in: |
|||||||||
|
R$ |
|
|
|||||||
|
BNDES/FINAME, Debentures, NCE and CCB |
(2) |
1,086,985 |
1,890,450 |
10,049,783 |
10,710,678 | ||||
|
Securities with fixed interest in: |
|
|
|
|
|||||
|
R$ |
|
|
|||||||
|
Intercompany |
|
|
25,038 |
|
|
|
|
|
|
|
Prepayment |
|
|
|
103,376 |
|
||||
|
1,112,023 |
1,993,826 |
10,049,783 |
10,710,678 | ||||||
|
Total Borrowings and Financing |
|
|
5,152,234 |
5,681,797 |
22,938,469 |
23,260,944 | |||
|
Transaction Costs and Issue Premiums |
(26,391) |
(28,358) |
(97,276) |
(87,309) | |||||
|
Total Borrowings and Financing + Transaction Costs |
|
|
5,125,843 |
5,653,439 |
22,841,193 |
23,173,635 | |||
(1) In April 2019, the Company issued debt securities in the foreign market ("Bonds"), through its subsidiary CSN Resources S.A., in the amount of US$ 1 billion, being US$ 400 million with maturity in February 2023 and US$600 million with maturity in April 2026, both with interest of 7.625% per annum. Between April and May 2019, a tender offer ("Tender Offer") of the Notes was issued by CSN Islands XI Corp. and CSN Resources S.A., subsidiaries of the Company, having repurchased US$ 1 billion in bonds with maturity in 2019 and 2020. In July 2019, the Company issued thought to its subsidiary CSN Resources, debt securities in the foreign market (“Bonds”), in the amount of US$ 175million, with maturity in February 2023 and interest of 7.625% per annum and made the final payment of the debt in the foreign market (“Notes”), issued by the company CSN Islands XI Corp in September 2019 in the amount of US$ 142 million.
(2) In January 2019, the Company issued debt securities in the domestic market (“Debentures”), in the amount of R$ 1,950 million, with maturity in 2023 and interest of 126,8% of CDI.
FS-44
|
|
The following table shows the average interest rate:
|
|
|
Consolidated | ||
|
|
|
|
|
12/31/2019 |
|
|
Average interest rate (*) |
Total debt | ||
|
US$ |
6.66% |
16,558,452 | ||
|
R$ |
5.71% |
11,161,806 | ||
|
EUR |
2.20% |
370,445 | ||
|
28,090,703 | ||||
(*) In order to determine the average interest rates for debt contracts with floating rates, the Company used the rates applied as of December 31, 2019.
FS-45
|
|
11.a) Maturities of borrowings, financing and debentures presented in non-current liabilities
As of December 31, 2019, the breakdown of principal plus interest of long-term liabilities as borrowings, financing and debentures by maturity date is presented as follows:
|
|
Consolidated | |||||||
|
|
|
|
|
|
|
|
|
12/31/2019 |
|
|
|
|
|
Principal | ||||
|
|
Bank loans |
Capital markets |
Development agencies |
Total | ||||
|
2021 |
|
2,884,003 |
|
636,667 |
|
55,636 |
|
3,576,306 |
|
2022 |
2,700,341 |
|
556,666 |
|
54,836 |
|
3,311,843 | |
|
2023 |
|
2,945,897 |
|
4,378,398 |
|
53,957 |
|
7,378,252 |
|
2024 |
1,575,437 |
|
|
|
64,746 |
|
1,640,183 | |
|
2025 |
|
|
|
|
|
68,595 |
|
68,595 |
|
After 2025 |
|
|
2,418,420 |
|
514,170 |
|
2,932,590 | |
|
Perpetual bonds |
|
|
|
4,030,700 |
|
|
|
4,030,700 |
|
|
10,105,678 |
|
12,020,851 |
|
811,940 |
|
22,938,469 |
11.b) Amortization and borrowings raised, financing and debentures
The table below presents the funding raised and amortizations during the year:
|
Consolidated | ||||
|
12/31/2019 |
12/31/2018 | |||
|
Opening balance |
28,827,074 |
|
29,510,844 | |
|
Raised (1) |
10,149,381 |
|
2,154,471 | |
|
Payment of principal |
(11,775,093) |
|
(5,019,978) | |
|
Payment of charges |
(2,039,112) |
|
(2,141,710) | |
|
Provision of charges (Note 24) |
1,996,305 |
|
2,009,688 | |
|
Consolidation of CBSI as of November 30, 2019 |
|
19,722 |
|
|
|
Disposal of LLC |
|
|
|
(10,544) |
|
Others (2) |
788,759 |
|
2,324,303 | |
|
Closing balance |
27,967,036 |
|
28,827,074 | |
(1) Of the funding raised in the consolidated in 2019, R$100,661 (R$ 10,792 on December 31,2018) was raised to purchase fixed assets – see note 29.
(2) Includes unrealized exchange and monetary variations.
FS-46
|
|
In 2019, the Group obtained and amortized loans as shown below:
· Funding raised and amortizations:
Consolidated
12/31/2019
|
Nature |
Raised |
Amortization of principal |
Amortization of charges | |||
|
Prepayment |
|
805,288 |
(1,596,711) |
(319,257) | ||
|
Bonds, Perpetual bonds, ACC and Facility |
6,616,544 |
(5,959,029) |
(882,007) | |||
|
BNDES/FINAME, Debentures, NCE and CCB |
|
2,727,549 |
(4,219,353) |
(837,848) | ||
|
|
|
10,149,381 |
(11,775,093) |
(2,039,112) |
· Covenants
The Company's loan agreements establish the fulfillment of certain non-financial obligations, as well as maintenance of certain parameters and performance indicators, such as disclosure of its audited financial statements according to regulatory deadlines or payment of commission on risk assumption, if the certain financial indicators reaches the levels in those agreements. The Company is in compliance with the financial and non-financial obligations (covenants) of its current contracts. On December 31, 2019, the Company has provisioned R$10,531 in the Consolidated (R$ 38,134 as of December 31, 2018) for risk assumption.
12 FINANCIAL INSTRUMENTS
I - Identification and measurement of financial instruments
The Company can operate with various financial instruments, mainly cash and cash equivalents, including short-term investments, marketable securities, trade receivables, trade payables, and borrowings and financing. The Company also can operate into derivative transactions, currency swap, interest rate swap and commodity swap operations.
Considering the nature of the instruments, the fair value is basically determined using quotations in the open capital market of Brazil and the Commodities and Futures Exchange. The amounts recorded in current assets and liabilities have immediate liquidity or maturity, mostly in short time maturity. Considering the term and the characteristics of these instruments, the carrying amounts approximate the fair values
FS-47
|
|
· Classification of financial instruments
|
Consolidated | ||||||||||||||
|
|
|
|
|
12/31/2019 |
|
|
|
12/31/2018 | ||||||
|
Notes |
Fair value through profit or loss |
Measured at amortized cost |
|
Balances |
Fair value through profit or loss |
Measured at amortized cost |
|
Balances | ||||||
|
Assets |
|
|
|
|
|
|
|
|
|
|
|
|
|
|
|
Current |
||||||||||||||
|
Cash and cash equivalents |
|
3 |
|
|
|
1,088,955 |
|
1,088,955 |
|
|
|
2,248,004 |
|
2,248,004 |
|
Financial investments |
4 |
2,633,173 |
2,633,173 |
895,713 |
895,713 | |||||||||
|
Trade receivables |
|
5 |
|
|
|
2,047,931 |
|
2,047,931 |
|
|
|
2,078,182 |
|
2,078,182 |
|
Dividends receivable |
7 |
44,554 |
44,554 |
46,171 |
46,171 | |||||||||
|
Derivative financial instruments |
|
7 |
|
1,364 |
|
|
|
1,364 |
|
351 |
|
|
|
351 |
|
Trading securities |
7 |
4,034 |
4,034 |
4,503 |
4,503 | |||||||||
|
Loans - related parties |
|
7 |
|
|
|
|
|
|
|
|
|
2,675 |
|
2,675 |
|
Total |
5,398 |
5,814,613 |
5,820,011 |
4,854 |
5,270,745 |
5,275,599 | ||||||||
|
|
|
|
|
|
|
|
|
|
|
|
|
|
|
|
|
Non current |
||||||||||||||
|
Financial investments |
|
4 |
|
|
|
95,719 |
|
95,719 |
|
|
|
7,772 |
|
7,772 |
|
Other trade receivables |
7 |
7,059 |
7,059 |
7,451 |
7,451 | |||||||||
|
Compulsory loan - Eletrobrás |
|
7 |
|
|
|
845,284 |
|
845,284 |
|
|
|
813,428 |
|
813,428 |
|
Loans - related parties |
7 |
846,300 |
846,300 |
706,605 |
706,605 | |||||||||
|
Investments |
|
8 |
|
47,300 |
|
|
|
47,300 |
|
2,279,189 |
|
|
|
2,279,189 |
|
Derivative financial instruments |
7 |
4,203 |
4,203 |
|||||||||||
|
Total |
|
|
|
51,503 |
|
1,794,362 |
|
1,845,865 |
|
2,279,189 |
|
1,535,256 |
|
3,814,445 |
|
Total Assets |
56,901 |
7,608,975 |
7,665,876 |
2,284,043 |
6,806,001 |
9,090,044 | ||||||||
|
|
|
|
|
|
|
|
|
|
|
|
|
|
|
|
|
Liabilities |
||||||||||||||
|
Current |
|
|
|
|
|
|
|
|
|
|
|
|
|
|
|
Borrowings and financing |
11 |
5,152,234 |
5,152,234 |
5,681,797 |
5,681,797 | |||||||||
|
Leases |
|
13.a |
|
|
|
35,040 |
|
35,040 |
|
|
|
|
|
|
|
Trade payables |
3,012,654 |
3,012,654 |
3,408,056 |
3,408,056 | ||||||||||
|
Trade payables - Drawee risk |
|
13 |
|
|
|
1,121,312 |
|
1,121,312 |
|
|
|
65,766 |
|
65,766 |
|
Dividends and interest on equity |
13 |
13,252 |
13,252 |
932,005 |
932,005 | |||||||||
|
Total |
|
|
|
|
|
9,334,492 |
|
9,334,492 |
|
|
|
10,087,624 |
|
10,087,624 |
|
|
|
|
|
|
|
|
|
|
|
|
|
|
|
|
|
Non current |
|
|
|
|
|
|
|
|
|
|
|
|
|
|
|
Borrowings and financing |
|
11 |
|
|
|
22,938,469 |
|
22,938,469 |
|
|
|
23,260,944 |
|
23,260,944 |
|
Leases |
|
13.a |
|
|
|
439,350 |
|
439,350 |
|
|
|
|
|
|
|
Total |
|
|
|
|
|
23,377,819 |
|
23,377,819 |
|
|
|
23,260,944 |
|
23,260,944 |
|
|
|
|
|
|
|
|
|
|
|
|
|
|
|
|
|
Total Liabilities |
|
|
|
|
|
32,712,311 |
|
32,712,311 |
|
|
|
33,348,568 |
|
33,348,568 |
FS-48
|
|
· Fair value measurement
The following table shows the financial instruments recognized at fair value through profit or loss using a valuation method:
|
Consolidated |
|
12/31/2019 |
12/31/2018 | |||||||||
|
Level 1 |
|
Level 2 |
|
Balances |
Level 1 |
|
Level 2 |
|
Balances | |||
|
Assets |
|
|
|
|
|
|
|
|
|
|
|
|
|
Current |
||||||||||||
|
Financial assets at fair value through profit or loss |
|
|
||||||||||
|
Derivative financial instruments |
|
|
1,364 |
|
1,364 |
|
|
|
351 |
|
351 | |
|
Trading securities |
|
4,034 |
|
|
|
4,034 |
|
4,503 |
|
|
|
4,503 |
|
Non-current |
|
|
|
|
|
|
|
|
|
|
| |
|
Financial assets at fair value through profit or loss |
|
|
|
|
|
|
|
|
|
|
|
|
|
Investments |
47,300 |
|
|
|
47,300 |
|
2,279,189 |
|
|
|
2,279,189 | |
|
Financial derivative instruments |
|
|
|
4,203 |
|
4,203 |
|
|
|
|
|
|
|
Total Assets |
|
51,334 |
|
5,567 |
|
56,901 |
|
2,283,692 |
|
351 |
|
2,284,043 |
Level 1 - quoted prices in active markets for identical assets or liabilities.
Level 2 - Includes observable inputs in market such as interest rates, exchange etc., but not prices traded in active markets.
There are no assets and liabilities classified as level 3.
II – Investments in financial instruments measured at fair value through profit or loss.
The Company has common shares (USIM3), preferred shares (USIM5) of Usiminas (“Ações Usiminas”) and shares of Panatlântica S.A (PATI 3), which are designated as fair value through profit or loss.
Usiminas assets are classified as current asset recognized as financial investment and shares of Panatlântica as noncurrent assets recognizes as investments. Both are recorded at fair value, based on the market price quotation on the stock exchange (B3 S.A.).
In accordance with the Company's policy, gains and losses arising from changes in the share price are recorded directly in the statement of income under Other Operating Income and Expenses.
|
Class of shares |
|
12/31/2019 |
12/31/2018 |
12/31/2019 | ||||||||||||||
|
Quantity |
|
Interest (%) |
|
Share price |
|
Closing Balance |
Quantity |
|
Interest (%) |
|
Share price |
|
Closing Balance |
Fair value | ||||
|
USIM3 |
|
107,156,651 |
15.19% |
9.87 |
1,057,636 |
107,156,651 |
15.19% |
11.44 |
1,225,872 |
(168,236) | ||||||||
|
USIM5 |
111,144,456 |
29.29% |
9.51 |
1,056,984 |
111,144,456 |
29.29% |
9.22 |
1,024,751 |
32,232 | |||||||||
|
|
|
2,114,620 |
2,250,623 |
(136,004) | ||||||||||||||
|
PATI3 |
2,065,529 |
11.31% |
22.90 |
47,300 |
1,997,642 |
11.33% |
14.30 |
28,566 |
17,224 | |||||||||
|
|
|
2,161,920 |
2,279,189 |
(118,780) | ||||||||||||||
· Share market price risks
The Company is exposed to the risk of changes in the price of the shares due to the investments, valued at fair value through profit or loss that have their prices based on the market price on the stock exchange (B3).
III - Financial risk management
The Company follows strategies of managing its risks, with guidelines regarding the risks incurred by the company. The nature and general position of financial risks are regularly monitored and managed in order to assess the results and the financial impact on cash flow. The quality of counterparties’ hedging instruments and the credit limit are also periodically reviewed.
The market risks are hedged when it is considered necessary to support the corporate strategy or when it is necessary to maintain a level of financial flexibility.
Under the terms of the risk management policy, the Company can manage some risks by using derivative instruments not associate to any speculative deals or short sales.
FS-49
|
|
12.a) Foreign exchange and interest rate risks
· Exchange rate risk
The exchange rate risk arises from the existence of assets and liabilities denominated in US dollars or Euros since the Company's functional currency is substantially the Real that is called natural currency exposure. Net exposure is the result of offsetting the natural currency exposure by hedging instruments adopted by CSN.
The consolidated net exposure as of December 31, 2019 is as follows:
|
|
|
12/31/2019 | ||
|
Foreign Exchange Exposure |
|
(Amounts in US$’000) |
(Amounts in €’000) | |
|
Cash and cash equivalents overseas |
|
105,485 |
|
10,937 |
|
Trade receivables |
346,264 |
|
1,179 | |
|
Other assets |
|
3,516 |
|
5,815 |
|
Total Assets |
455,265 |
|
17,931 | |
|
Borrowings and financing |
|
(4,096,899) |
|
(24,395) |
|
Trade payables |
(69,284) |
|
(10,488) | |
|
Other liabilities |
|
(2,680) |
|
(963) |
|
Total Liabilities |
(4,168,863) |
|
(35,846) | |
|
Foreign exchange exposure |
|
(3,713,598) |
|
(17,915) |
|
Cash flow hedge accounting |
2,530,713 |
|
| |
|
Swap CDI x U.S.Dollar |
|
67,000 |
|
|
|
Net Investment hedge accounting |
|
|
|
24,000 |
|
Net foreign exchange exposure |
(1,115,885) |
|
6,085 | |
|
Perpetual Bonds |
|
1,000,000 |
|
|
|
Net foreign exchange exposure excluding perpetual bonds |
(115,885) |
|
6,085 |
CSN uses as strategy the hedge accounting, as well as derivative instruments with the purpose of hedging CSN's future cash flows.
· Interest rate risk
Risk arises from short- and long-term liabilities with fixed or post fixed interest rates and inflation rates.
Item 12.b) shows the derivatives and hedging strategies to protect exchange and interest rates risks.
12.b) Hedging instruments: Derivative and cash flows hedge accounting and foreign investment hedge accounting
CSN uses instruments for protection of foreign currency risk and interest rate risk, as shown in the following topics:
· Portfolio of derivative financial instruments
Dollar x Euro swap
The subsidiary Lusosider has derivative transactions to protect its dollar exposure versus euro.
Exchange rate swap CDI x Dollar
The company has derivative operations with Bradesco Bank to hedge its NCE debt raised in September 2019 with maturity in October 2023 in the amount of US$ 67million (equivalent to R$ 278milhões), at a cost consistent with that usually praticed by the Company.
|
Consolidated | ||||||||||||||
|
12/31/2019 | ||||||||||||||
|
Appreciation (R$) |
Fair value |
Impact on financial income (expenses) in 2019 | ||||||||||||
|
Counterparties |
Maturity |
Functional Currency |
Notional amount |
Asset |
Liability |
Amounts receivable / (payable) |
||||||||
|
BCP |
|
02/07/2020 |
|
Dollar |
12,875 |
|
51,923 |
|
(50,559) |
|
1,364 |
|
783 | |
|
Total Dollar-to-Euro swap |
12,875 |
|
51,923 |
|
(50,559) |
|
1,364 |
|
783 | |||||
|
|
|
|
|
|
|
|
|
| ||||||
|
Bradesco |
|
10/02/2023 |
|
Dollar |
67,000 |
|
298,385 |
|
(294,182) |
|
4,203 |
|
4,203 | |
|
Total Swap CDI x dollar |
67,000 |
|
298,385 |
|
(294,182) |
|
4,203 |
|
4,203 | |||||
|
|
|
|
|
|
|
|
|
| ||||||
|
|
|
350,308 |
|
(344,741) |
|
5,567 |
|
4,986 | ||||||
FS-50
|
|
· Classification of the derivatives in the balance sheet and statement of income
|
|
|
|
|
|
|
12/31/2019 | ||
|
Instruments |
Assets |
|
Finance income (expenses), net (note 24) | |||||
|
Current |
Non current |
Total |
||||||
|
Dollar to euro swap |
|
1,364 |
|
|
|
1,364 |
|
783 |
|
Swap CDI x dollar |
|
|
4,203 |
|
4,203 |
|
4,203 | |
|
|
|
1,364 |
|
4,203 |
|
5,567 |
|
4,986 |
· Cash flow hedge accounting
The Company formally designated cash flow hedging relationships to protect highly probable future cash flows against US dollar fluctuations relating to sales made in U.S. dollars.
In order to better reflect the accounting impacts of this foreign exchange hedging strategy on its profit, CSN designated part of its US dollar-denominated liabilities as a hedging instrument of its future exports. As a result, foreign exchange differences arising on translating the designated liabilities will be temporarily recognized in shareholders’ equity and allocated to profit or loss when such exports are carried out, which will allow recognizing the US dollar impact on liabilities and exports concurrently. Note that adopting hedge accounting does not entail contracting any financial instrument. As of December 31, 2019 the Company designated for hedge accounting US$2,530,713 in exports to be carried out between October 2019 to April 2026.
To support these designated amounts, the Company prepared formal documentation indicating how hedging is aligned with the goal and strategy of CSN’s Risk Management by identifying the hedging instruments used, the hedging purpose, the nature of the hedged risk, and showing the expected high effectiveness of the designated relationships. The designated debt instruments total an amount equivalent to the portion of future exports. Thus, the exchange differences on translating the instrument and the hedged item are similar. According to the Company’s accounting policy, continuous assessments of the prospective and retrospective effectiveness must be carried out by comparing the designated amounts with the expected amounts, approved in Management’s budgets, and the actual export amounts.
Through hedge accounting, the exchange gains and losses of the debt instruments do not immediately affect the Company’s profit or loss except to the extent that exports are carried out.
The table below shows a summary of the hedging relationships as of December 31, 2019:
FS-51
|
|
|
12/31/2019 | ||||||||||||||||||
|
Designation Date |
|
Hedging Instrument |
|
Hedged item |
|
Type of hedged risk |
|
Hedged period |
|
Exchange rate on designation |
|
Designated amounts (US$’000) |
|
Amortizated part (USD'000) |
|
Effect on Result |
|
Impact on |
|
3/11/2014 |
|
Export prepayments in US$ to third parties |
|
Part of the highly probable future monthly iron ore exports |
|
Foreign exchange - R$ vs. US$ spot rate |
|
October 2016 - |
|
2.4442 |
|
500,000 |
|
(500,000) |
|
(384,346) |
|
|
|
1/12/2014 |
Export prepayments in US$ to third parties |
Part of the highly probable future monthly iron ore exports |
Foreign exchange - R$ vs. US$ spot rate |
October 2015 - |
2.5601 |
175,000 |
(175,000) |
(23,184) |
||||||||||
|
12/18/2014 |
|
Export prepayments in US$ to third parties |
|
Part of the highly probable future monthly iron ore exports |
|
Foreign exchange - R$ vs. US$ spot rate |
|
May 2020 |
|
2.6805 |
|
30,000 |
|
|
|
|
|
(40,506) |
|
12/18/2014 |
|
Export prepayments in US$ to third parties |
|
Part of the highly probable future monthly iron ore exports |
|
Foreign exchange - R$ vs. US$ spot rate |
|
May 2020 |
|
2.6780 |
|
35,000 |
|
|
|
|
|
(47,345) |
|
12/18/2014 |
|
Export prepayments in US$ to third parties |
|
Part of the highly probable future monthly iron ore exports |
|
Foreign exchange - R$ vs. US$ spot rate |
|
May 2020 |
|
2.6760 |
|
35,000 |
|
|
|
|
|
(47,409) |
|
07/21/2015 |
Export prepayments in US$ to third parties |
Part of the highly probable future monthly iron ore exports |
Foreign exchange - R$ vs. US$ spot rate |
July 2019 - March |
3.1813 |
60,000 |
(15,000) |
(11,254) |
(38,223) | |||||||||
|
07/23/2015 |
|
Export prepayments in US$ to third parties |
|
Part of the highly probable future monthly iron ore exports |
|
Foreign exchange - R$ vs. US$ spot rate |
|
July 2019 - March |
|
3.2850 |
|
100,000 |
|
(25,000) |
|
(14,676) |
|
(55,928) |
|
07/23/2015 |
Export prepayments in US$ to third parties |
Part of the highly probable future monthly iron ore exports |
Foreign exchange - R$ vs. US$ spot rate |
October 2018 - |
3.2850 |
30,000 |
(12,000) |
(4,315) |
(13,423) | |||||||||
|
07/24/2015 |
|
Export prepayments in US$ to third parties |
|
Part of the highly probable future monthly iron ore exports |
|
Foreign exchange - R$ vs. US$ spot rate |
|
October 2018 - |
|
3.3254 |
|
100,000 |
|
(40,000) |
|
(13,574) |
|
(42,318) |
|
07/27/2015 |
Export prepayments in US$ to third parties |
Part of the highly probable future monthly iron ore exports |
Foreign exchange - R$ vs. US$ spot rate |
October 2018 - |
3.3557 |
25,000 |
(10,000) |
(3,242) |
(10,125) | |||||||||
|
07/27/2015 |
|
Export prepayments in US$ to third parties |
|
Part of the highly probable future monthly iron ore exports |
|
Foreign exchange - R$ vs. US$ spot rate |
|
October 2018 - |
|
3.3557 |
|
70,000 |
|
(28,000) |
|
(9,077) |
|
(28,350) |
|
07/27/2015 |
Export prepayments in US$ to third parties |
Part of the highly probable future monthly iron ore exports |
Foreign exchange - R$ vs. US$ spot rate |
October 2018 - |
3.3557 |
30,000 |
(12,000) |
(3,890) |
(12,150) | |||||||||
|
07/28/2015 |
|
Export prepayments in US$ to third parties |
|
Part of the highly probable future monthly iron ore exports |
|
Foreign exchange - R$ vs. US$ spot rate |
|
October 2018 - |
|
3.3815 |
|
30,000 |
|
(12,000) |
|
(4,004) |
|
(11,686) |
|
3/8/2015 |
Export prepayments in US$ to third parties |
Part of the highly probable future monthly iron ore exports |
Foreign exchange - R$ vs. US$ spot rate |
Outubro de 2018 a Outubro de 2022 |
3.3940 |
355,000 |
(84,091) |
(12,990) |
(172,488) | |||||||||
|
4/2/2018 |
|
Bonds |
|
Part of the highly probable future monthly iron ore exports |
|
Foreign exchange - R$ vs. US$ spot rate |
|
July 2018 - February 2023 |
|
3.3104 |
|
1,170,045 |
|
(644,000) |
|
(305,801) |
|
(378,915) |
|
7/31/2019 |
Bonds and Export prepayments in US$ |
Part of the highly probable future monthly iron ore exports |
Foreign exchange - R$ vs. US$ spot rate |
January 2020 - April 2026 |
3.7649 |
1,342,759 |
(356,904) | |||||||||||
|
Total |
|
|
|
|
|
|
|
|
|
|
|
4,087,804 |
|
(1,557,091) |
|
(790,353) |
|
(1,255,770) |
(*) In 2019, was recognized in other operating, the amount of (R$790,353). On December 31,2018 was (R$370,191).
In the hedging relationships described above, the amounts of the debt instruments were fully designated for equivalent iron ore export portions.
The movements in the hedge accounting amounts recognized in shareholders’ equity as of December 31, 2019 are as follows:
|
12/31/2018 |
|
Movement |
|
Realization |
|
12/31/2019 | |
|
Cash flow hedge accounting |
1,441,295 |
|
604,828 |
|
(790,353) |
|
1,255,770 |
|
Fair value of cash flow hedge, net of taxes |
1,441,295 |
|
604,828 |
|
(790,353) |
|
1,255,770 |
As of December 31, 2019, the hedging relationships established by the Company were effective, according to the prospective tests conducted. Thus, no reversal for hedge accounting ineffectiveness was recognized.
· Net investment hedge in foreign subsidiaries
CSN has a natural foreign exchange exposure in Euros substantially arising from a loan made by a foreign subsidiary with functional currency in Reais, for the acquisition of investments abroad whose functional currency is Euro. Such exposure arises from converting the balance sheets of these subsidiaries for consolidation in CSN, and the exchange rate of the loans affected the income statement in the financial result item and the exchange variation of the net assets of the foreign operation directly affected the equity in other comprehensive income.
As from September 1st, 2015 CSN began to adopt hedge of net investment to eliminate exposure and cover future fluctuations of the Euro on such loans. Non-derivative financial liabilities have been designated represented by loan agreements with financial institutions in the amount of € 120 million. The carrying amounts on December 31, 2019 are:
|
12/31/2019 | |||||||||||||
|
Designation Date |
|
Hedging Instrument |
|
Hedged item |
|
Type of hedged risk |
|
Exchange rate on designation |
|
Designated amounts (EUR'000) |
|
Amortized part (USD’000) |
Impact on shareholders' equity |
|
09/30/2015 |
|
Non-derivative financial liabilities in EUR – Debt contract |
|
Investments in subsidiaries which EUR is the functional currency |
|
Foreign exchange - R$ vs. EUR spot rate |
|
4.0825 |
120,000 |
(96,000) |
1,469 | ||
|
Total |
|
|
|
|
120,000 |
(96,000) |
1,469 | ||||||
FS-52
|
|
The changes in the amounts related to net investment hedge recognized in shareholders’ equity as of December 31, 2019 are presented below:
|
12/31/2018 |
|
Movement |
|
12/31/2019 | |
|
Net Investment hedge accounting |
3,941 |
|
(2,472) |
|
1,469 |
|
Fair value of net investment hedge in foreign operations |
3,941 |
|
(2,472) |
|
1,469 |
On December 31, 2019 hedge relationships established by the Company found to be effective, according to prospective tests. Therefore, no reversal by ineffectiveness of the hedge was recorded.
12.c) Sensitivity analysis
We present below the sensitivity analysis for currency risk and interest rate.
· Sensitivity analysis of Derivative Financial Instruments and consolidated Foreign Exchange Exposure
The Company considered scenarios 1 and 2 as 25% and 50% of deterioration for volatility of the currency, using as reference the closing exchange rate as of December 31, 2019.
The currencies used in the sensitivity analysis and its scenarios are shown below:
|
|
|
|
|
|
|
12/31/2019 | ||
|
Currency |
Exchange rate |
Probable scenario |
Scenario 1 |
Scenario 2 | ||||
|
USD |
|
4.0307 |
|
4.4946 |
|
5.0384 |
|
6.0461 |
|
EUR |
4.5305 |
|
5.0038 |
|
5.6631 |
|
6.7958 | |
|
USD x EUR |
|
1.1234 |
|
1.1122 |
|
1.4043 |
|
1.6851 |
|
|
||||||||
|
|
|
|
|
12/31/2019 |
||||
|
Interest |
Interest rate |
Scenario 1 |
Scenario 2 |
|||||
|
CDI |
|
4.40% |
|
5.50% |
|
6.60% |
||
|
TJLP |
5.57% |
|
6.96% |
|
8.36% |
|||
|
Libor |
|
1.91% |
|
2.39% |
|
2.87% |
The effects on income statement, considering scenarios 1 and 2 are shown below:
|
|
|
|
|
|
|
|
|
12/31/2019 | ||
|
Instruments |
Notional |
Risk |
Probable scenario (*) |
Scenario 1 |
Scenario 2 | |||||
|
|
|
|
|
|
|
|
|
|
|
|
|
Hedge accounting of exports |
2,530,713 |
|
Dollar |
|
1,173,998
|
|
2,550,136 |
|
5,100,272 | |
|
|
|
|
|
|
|
|
|
|
|
|
|
Swap CDI x Dollar |
67,000 |
|
Dollar |
|
31,081
|
|
67,514 |
|
135,028 | |
|
Currency position |
|
|
|
|
|
|
|
|
|
|
|
(not including exchange derivatives above) |
|
(3,713,598) |
|
Dollar |
|
(1,722,738)
|
|
(3,742,100) |
|
(7,484,200) |
|
|
|
|
|
|
|
|
|
| ||
|
Consolidated exchange position |
|
(1,115,885) |
|
Dollar |
|
(517,659)
|
|
(1,124,450)
|
|
(2,248,900) |
|
(including exchange derivatives above) |
|
|
|
|
|
|
|
|
| |
|
|
|
|
|
|
|
|
|
|
|
|
|
Net Investment hedge accounting |
24,000 |
|
Euro |
|
11,359 |
|
27,183 |
|
54,366 | |
|
|
|
|
|
|
|
|
|
|
|
|
|
Currency position |
|
(17,915) |
|
Euro |
|
(1,637) |
|
(20,291) |
|
(40,582) |
|
|
|
|
|
|
|
|
|
|
|
|
|
Consolidated exchange position |
6,085 |
|
Euro |
|
557 |
|
6,892 |
|
13,784 | |
|
(including exchange derivatives above) |
|
|
|
|
|
|
|
|
|
|
|
|
|
|
|
|
|
|
|
|
|
|
|
Dollar-to-euro swap |
|
12,875 |
|
Dólar |
|
(2,463) |
|
9,021 |
|
15,944 |
(*) The probable scenarios were calculated considering the following variations for the risks: Real x Dollar – depreciation of Real by 11.51% / Real x Euro – depreciation of Real by 10.45%. Euro x Dollar – appreciation of Euro by 1.0%. Source: quotations from Central Bank of Brazil and Central Bank of Europe on 02/03/2020.
FS-53
|
|
· Sensitivity analysis of changes in interest rates
The Company considered the scenarios 1, and 2 as 25% and 50% of evolution for volatility of the interest as of December 31, 2019.
|
Consolidated | ||||||||||||
|
|
|
Impact on profit or loss | ||||||||||
|
Changes in interest rates |
% p.a |
Assets |
Liabilities |
Probable scenario (*) |
Scenario 1 |
|
Scenario 2 | |||||
|
TJLP |
|
5.57 |
|
|
|
(870,637) |
|
(2,481) |
|
(12,124) |
|
(24,248) |
|
Libor |
1.91 |
|
|
|
(4,275,363) |
|
(57,620) |
|
(20,438) |
|
(40,876) | |
|
CDI |
|
4.40 |
|
462,831 |
|
(10,148,220) |
|
(28,594) |
|
(106,539) |
|
(213,078) |
(*) The sensitivity analysis is based on the assumption of maintaining as probable scenario the market rates at December 31, 2019 recorded in the Company´s assets and liabilities.
12.d) Liquidity risk
It is the risk that the Company may not have sufficient net funds to honor its financial commitments as a result of mismatching of terms or volumes between scheduled receipts and payments.
To manage cash liquidity in domestic and foreign currency, assumptions of future disbursements and receipts are established and daily monitored by the treasury area. The payment schedules for the long-term portions of borrowings, financing and debentures are shown in note 11.
The following table shows the contractual maturities of financial liabilities and lease liabilities, including accrued interest.
|
|
|
|
|
|
|
|
|
Consolidated | |
|
At December 31, 2019 |
Less than one year |
From one to two years |
From two to five years |
Over five years |
|
Total | |||
|
Borrowings, financing and debentures (note 11) |
5,152,234 |
|
6,888,149 |
|
9,087,030 |
|
6,963,290 |
|
28,090,703 |
|
Lease (Note 13a) |
35,040 |
|
44,873 |
|
44,872 |
|
349,605 |
|
474,390 |
|
Trade payables (note 12I) |
3,012,654 |
|
|
|
|
|
|
|
3,012,654 |
|
Trade payables – Drawee risk (note 12I) |
1,121,312 |
|
|
|
|
|
|
|
1,121,312 |
|
Dividends and interest on equity (note 13) |
13,252 |
|
|
|
|
|
|
|
13,252 |
FS-54
|
|
IV - Fair values of assets and liabilities as compared to their carrying amounts
Financial assets and liabilities at fair value through profit or loss are recognized in current and non-current assets and liabilities, and any gains and losses are recognized as financial income or financial expenses, respectively.
The amounts are recognized in the financial statements at their carrying amounts, which are substantially similar to those that would be obtained if they were traded in the market. The fair values of other long-term assets and liabilities do not differ significantly from their carrying amounts, except the amounts below.
The estimated fair values for certain consolidated long-term borrowings and financing were calculated at prevailing market rates, taking into consideration the nature, terms and risks similar to those of the recorded contracts, as below:
|
|
|
12/31/2019 |
|
|
12/31/2018 | ||
|
Carrying amount |
Fair value |
Carrying amount |
Fair value | ||||
|
Perpetual bonds |
4,036,186 |
|
3,706,553 |
|
3,880,074 |
|
2,850,615 |
|
Fixed Rate Notes |
8,090,297 |
|
8,345,471 |
|
6,745,132 |
|
7,595,765 |
(*) Source: Bloomberg
· Credit risks
The exposure to credit risks of financial institutions complies with the parameters established by financial policy. The Company performs detailed analyses of the financial condition of its clients and suppliers, and permanently monitors the credit limits established and the outstanding balance thereof.
With regard to financial investments, the Company only made investments in institutions with low credit risk rated by rating agencies. Since part of the funds is invested in repurchase agreements that are backed by Brazilian Government Bonds, there is also exposure to the credit risk of the Brazilian State.
Regarding the exposure to credit risk in accounts receivable and other receivables, the company has a credit risk committee, in which each new customer is analyzed individually regarding their financial condition, prior to the granting of the credit limit and payment terms and periodically revised, according to the periodicity procedures of each business area.
· Capital Management
The Company seeks to optimize its capital structure in order to reduce its financial costs and maximize the return to its shareholders. The table below shows the evolution of the capital structure of the Company with financing by equity and third-party capital.
|
Thousands of reais |
12/31/2019 |
12/31/2018 | ||
|
Shareholder's equity (equity) |
|
11,361,932 |
|
10,013,440 |
|
Borrowings and Financing (Third-party capital) |
27,967,036 |
|
28,827,074 | |
|
Gross Debit/Shareholder's equity |
|
2.46 |
|
2.88 |
FS-55
|
|
13 OTHER PAYABLES
The group of other payables classified in current and non-current liabilities is comprised as follows:
|
|
|
|
|
|
|
|
Consolidated |
|
|
Current |
Non-current | |||||
|
12/31/2019 |
12/31/2018 |
12/31/2019 |
12/31/2018 | ||||
|
Payables to related parties (note 18 b) |
46,063 |
|
35,499 |
|
88,021 |
|
96,629 |
|
Dividends and interest on capital payable (Note 12 I) |
13,252 |
932,005 |
|||||
|
Advances from customers (1) |
787,604 |
|
137,418 |
|
1,845,248 |
|
|
|
Taxes in installments |
19,498 |
20,179 |
67,727 |
73,934 | |||
|
Profit sharing - employees |
162,866 |
|
113,219 |
|
|
|
|
|
Taxes payable |
8,805 |
8,631 | |||||
|
Provision from consumption and services |
204,299 |
|
334,638 |
|
|
|
|
|
Third party materials in our possession |
78,820 |
45,915 |
|||||
|
Trade payables - drawee risk (2) |
1,121,312 |
|
65,766 |
|
|
|
|
|
Lease Liabilities (note 13a) |
35,040 |
|
|
|
439,350 |
|
|
|
Other payables |
57,690 |
|
85,984 |
|
44,551 |
|
48,134 |
|
2,526,444 |
1,770,623 |
2,493,702 |
227,328 | ||||
(1) Glencore Advance: On March 29, 2019, the Company received in advance through its subsidiary CSN Mineração the amount of US$ 496 million (R$ 1,951 billion) related to a supply contract of approximately 22 million tons of ore to the Swiss trader Glencore International AG ("Glencore"), to be executed within 5 years. On July 11, 2019, CSN Mineração entered into an amendment to the contract with Glencore and received in advance on August 5, 2019 US$ 250million (R$ 956million) for the additional supply of approximately 11 million tons of iron ore.
(2) Trade Payables – Drawee risk: The Company negotiated with financial institutions to anticipate payments from its suppliers, with the objective of extending the terms of its own obligations. The effective prepayment of receivables depends on acceptance by its suppliers, given that their participation is not mandatory. The Company is not reimbursed and / or benefited by the financial institution from discounts for payment executed before the maturity date agreed with the supplier, there is no change in the degree of subordination of the security in the event of judicial execution, nor changes in the existing commercial conditions between Company and its suppliers.
13.a) LEASES
The lease liabilities are presented in financial statement as follows:
|
| |||
|
12/31/2019 |
|
First adoption | |
|
Leases |
1,501,960 |
1,533,556 | |
|
Present value adjustment - Leases |
(1,027,570) |
(892,567) | |
|
|
474,390 |
640,989 | |
|
Classified: |
|
||
|
Current |
35,040 |
39,243 | |
|
Non-current |
439,350 |
601,746 | |
|
|
474,390 |
640,989 |
The Company adopted IFRS 16 as of January 1, 2019, using the modified retrospective approach that does not require the presentation of comparative balances. As a result of adopting IFRS 16, the Company changed the accounting policy for lease agreements.
The reconciliation between the amount of lease liabilities recognized on transition to IFRS 16 and the amount of operating lease commitments disclosed in the notes to the consolidated financial statements for the year ended December 31, 2018 is as follows:
|
Operating lease commitment at December 31,2018 |
4,217,333 |
|
Renewal options not included in commitments |
833,083 |
|
Effect timing differences between inception and commencement |
(26,580) |
|
Variable lease payments not included in commitments |
(3,661,675) |
|
Lease liabilities before discounting |
1,362,161 |
|
Discount to presente value |
(990,827) |
|
Lease liabilities at January 01, 2019 |
371,334 |
FS-56
|
|
The Company has lease agreements for port terminals in Itaguaí, the Cargo Terminal - TECAR, used for the loading and unloading of iron ores and the Container Terminal - TECON, the agreements have a remaining term of 28 and 32 years respectively and contract lease for railway operation using the Northeast network with a remaining term of 8 years.
Additionally, the Company has property lease agreements, used as operational facilities and administrative and sales offices, in several locations where the Company operates, with remaining terms of 2, 5 and 16 years.
CSN also has lease agreements for operating equipment, used in mining and steel operations, with terms of 2 to 5 years.
The present value of future obligations was measured using the implicit rate observed in the contracts, for contracts that did not have a rate, the Company applied the incremental borrowing loans - “IBR”, both in nominal terms.
The IBR was acquired through consultation with the Company's relationship banks according to the average term of the contracts.
The average rates used to measure the lease and rights to use:
|
12/31/2019 | ||||
|
Contract term (in years) |
Incremental - IBR (a.a) |
Implicit (a.a) | ||
|
BRL |
EURO |
|
BRL | |
|
1 |
7.78% |
0.52% |
|
|
|
2 |
8.16% |
|||
|
3 |
8.53% |
|
|
|
|
4 |
8.90% |
1.11% |
||
|
5 |
9.27% |
|
|
|
|
6 |
1.24% |
|||
|
9 |
|
|
|
6.75% |
|
16 |
12.25% |
|||
|
29 |
|
|
|
8.30% |
|
32 |
15.22% | |||
Changes in lease liabilities for the period ended December 31, 2019 are shown in the table below.
|
12/31/2019 | |
|
Consolidated | |
|
Opening balance |
640,989 |
|
New leases (note 9) |
106,584 |
|
Present Value Adjustments - New leases (note 9) |
(54,080) |
|
Contract review |
(175,609) |
|
Write off |
(1,374) |
|
Payments |
(94,727) |
|
Interest appropriated |
52,607 |
|
Net balance |
474,390 |
The minimum future payments estimated to leasing agreements include variable payments, essentially fixed when based on minimum performance and contractually fixed rates.
As of December 31,2019 are as follows:
|
|
|
|
Consolidated | ||||
|
Less than one year |
Between one and five years |
Over five years |
Total | ||||
|
Leases |
86,062 |
|
319,162 |
|
1,096,736 |
|
1,501,960 |
|
Present value adjustment - Leases |
(51,022) |
|
(229,417) |
|
(747,131) |
|
(1,027,570) |
|
|
35,040 |
|
89,745 |
|
349,605 |
|
474,390 |
FS-57
|
|
• PIS and COFINS recoverable
Lease liabilities were measured at the amount of consideration with suppliers, that is, without considering the tax credits incurred after payment. We show below the potential right of PIS and COFINS embedded in the lease liability.
|
12/31/2019 | |
|
Consolidated | |
|
Leases |
1,489,789 |
|
Present value adjustment - Leases |
(1,026,919) |
|
Potencial PIS and COFINS credit |
137,805 |
|
Present value adjustment – Potential PIS and COFINS credit |
(96,461) |
· Payments of leases not recognized as liabilities:
The Company chose not to recognize lease liabilities in contracts with a maturity of less than twelve months and for assets with low value. The realized payments to these contracts are recognized as expenses, when incurred.
The Company has lease agreements for the use of ports (TECAR) and railways (FTL) which, even if they establish minimum performance, cannot determine their cash flow since these payments are fully variable and will only be known when they occur. In such cases, payments will be recognized as expenses when incurred
Expenses related to payments not included in the measurement of a lease liability during the actual exercise are:
|
Consolidated | |
|
12/31/2019 | |
|
Contract less than 12 months |
10,819 |
|
Lower Assets value |
3,853 |
|
Variable lease payments |
177,460 |
|
192,132 |
In accordance with the guidelines of IFRS 16, the Company uses the discounted cash flow technique to measure and remeasure liabilities and right to use, without considering the projected inflation in the flows to be discounted.
Considering Official Letter / CVM / SNC / SEP No. 02/2019, the Company discloses below the comparative balances of lease liabilities, right of use, financial expenses and depreciation expenses with the use of rates in real terms to discount a present value of flows also in real terms.
|
|
12/31/2019 | ||
|
Consolidated | |||
|
Rate in nominal terms and actual flow |
|
Rate and actual flow in termos nominais | |
|
Lease Liability |
474,390 |
579,390 | |
|
Right of net use |
472,345 |
567,905 | |
|
Financial expenses |
(49,118) |
(57,556) | |
|
Depreciation |
(53,826) |
(57,356) | |
To measure the balances using the rate in real terms, the inflation projection (IPCA) released by the Central Bank of Brazil was used.
14 INCOME TAX AND SOCIAL CONTRIBUTION
14.a) Income tax and social contribution recognized in profit or loss:
The income tax and social contribution recognized in profit or loss for the year are as follows:
|
Consolidated | ||||
|
12/31/2019 |
|
12/31/2018 |
12/31/2017 | |
|
Income tax and social contribution income (expense) |
|
|
|
|
|
Current |
(1,564,622) |
(827,229) |
(358,981) | |
|
Deferred |
2,398,400 |
576,895 |
(50,128) | |
|
|
833,778 |
(250,334) |
(409,109) | |
FS-58
|
|
The reconciliation of consolidated income tax and social contribution expenses and income and the result from applying the effective rate to profit before income tax and social contribution are as follows:
|
Consolidated | |||||
|
12/31/2019 |
|
12/31/2018 |
|
12/31/2017 | |
|
|
|
| |||
|
Profit/(Loss) before income tax and social contribution |
1,410,733 |
|
5,450,917 |
|
520,338 |
|
Tax rate |
34% |
34% |
|
34% | |
|
Income tax and social contribution at combined statutory rate |
(479,649) |
|
(1,853,312) |
|
(176,915) |
|
Adjustment to reflect the effective rate: |
|
|
|
| |
|
Equity in results of affiliated companies |
46,737 |
50,134 |
|
42,431 | |
|
Profit with differentiated rates or untaxed |
(236,404) |
(46,006) |
|
37,605 | |
|
Transfer pricing adjustment |
(18,494) |
(74,836) |
|
(34,746) | |
|
Tax loss carryforwards without recognizing deferred taxes |
(21,095) |
(27,683) |
|
(368,612) | |
|
Indebtdness limit |
(20,393) |
(38,486) |
|
(39,378) | |
|
Unrecorded deferred taxes on temporary differences |
(2,835) |
(11,964) |
|
541,655 | |
|
(Losses)/Reversal for deferred income and social contribution tax credits |
1,530,185 |
1,807,909 |
|
(403,080) | |
|
Income taxes and social contribution on foreign profit |
(14,424) |
(30,219) |
|
(29,964) | |
|
Tax incentives |
39,042 |
36,710 |
|
14,358 | |
|
Deferred taxes on exchange variation in equity |
|
(43,667) |
|
| |
|
Interest on equity |
22,107 |
|
|
|
|
|
Other permanent deductions (additions) |
(10,999) |
(18,914) |
|
7,537 | |
|
Income tax and social contribution in profit for the period |
833,778 |
(250,334) |
|
(409,109) | |
|
Effective tax rate |
-59% |
5% |
|
79% | |
14.b) Deferred income tax and social contribution:
Deferred income tax and social contribution are calculated on income tax and social contribution losses and the corresponding temporary differences between the tax bases of assets and liabilities and their carrying amounts in the financial statements:
|
|
|
|
|
|
Consolidated | ||||||||||||
|
12/31/2017 |
|
Movement |
12/31/2018 |
|
Movement |
|
12/31/2019 | ||||||||||
|
Shareholders' |
|
P&L |
|
Others |
Shareholders' |
|
P&L |
|
Others |
|
|||||||
|
Deferred |
|
|
|
|
|
|
|
|
|
|
|
|
|
|
|
|
|
|
Income tax losses |
1,137,234 |
|
(177,378) |
(616) |
959,240 |
|
651,561 |
|
1,610,801 | ||||||||
|
Social contribution tax losses |
406,884 |
|
|
|
(39,303) |
|
(223) |
367,358 |
|
|
|
242,688 |
|
|
|
|
610,046 |
|
Temporary differences |
(2,654,558) |
21,208 |
793,576 |
839 |
(1,838,935) |
(2,357) |
1,504,151 |
59 |
(337,082) | ||||||||
|
- Provision for tax. social security, labor, civil and environmental risks |
356,750 |
|
|
|
(25,554) |
|
3,184 |
334,380 |
|
|
|
(70,367) |
|
|
|
|
264,013 |
|
- Asset impairment losses |
181,463 |
53 |
181,516 |
915 |
182,431 | ||||||||||||
|
- (Gains)/losses on financial instruments |
416,747 |
|
530,292 |
|
(587,263) |
|
|
359,776 |
|
|
|
54,719 |
|
|
|
|
414,495 |
|
- Actuarial liability (pension and healthcare plan) |
273,058 |
(48) |
3,022 |
276,032 |
38,569 |
314,601 | |||||||||||
|
- Accrued supplies and services |
67,716 |
|
|
|
27,928 |
|
|
95,644 |
|
|
|
36,767 |
|
|
|
|
132,411 |
|
- Goodwill on merger |
608 |
(608) |
|||||||||||||||
|
- Unrealized ex change differences (1) |
1,511,152 |
|
|
|
(500,620) |
|
|
1,010,532 |
|
|
|
170,969 |
|
|
|
|
1,181,501 |
|
- (Gain) on loss of control over Transnordestina |
(92,180) |
(92,180) |
(92,180) | ||||||||||||||
|
- Cash flow hedge accounting |
134,479 |
|
355,563 |
|
|
|
|
490,042 |
|
(63,080) |
|
|
|
|
|
|
426,961 |
|
- Aquisition Fair Value SWT/CBL |
(193,311) |
(16,683) |
37,880 |
(172,114) |
(52,071) |
39,672 |
(184,513) | ||||||||||
|
- Deferred taxes non computed |
(212,236) |
|
|
|
(38,359) |
|
(2,345) |
(252,940) |
|
|
|
(39,021) |
|
|
|
|
(291,961) |
|
- (Losses) estimated/ reversals to deferred taxes credits |
(4,130,928) |
(885,069) |
1,929,424 |
(3,086,573) |
25,159 |
1,435,415 |
(1,625,998) | ||||||||||
|
- Business Combination |
(1,040,536) |
|
|
|
9,724 |
|
|
(1,030,812) |
|
|
|
7,471 |
|
|
|
|
(1,023,341) |
|
- Consolidation CBSI |
(12) |
62 |
50 | ||||||||||||||
|
- Other |
72,660 |
|
37,153 |
|
(62,051) |
|
|
47,762 |
|
49,066 |
|
(132,377) |
|
(3) |
|
|
(35,552) |
|
Total |
(1,110,440) |
21,208 |
576,895 |
- |
(512,337) |
(2,357) |
2,398,400 |
59 |
1,883,765 | ||||||||
|
Total Deferred Assets |
63,119 |
|
|
|
|
|
|
89,394 |
|
|
|
|
|
|
|
|
2,473,304 |
|
Total Deferred Liabilities |
(1,173,559) |
(601,731) |
(589,539) | ||||||||||||||
|
Total Deferred |
(1,110,440) |
|
|
|
|
|
|
(512,337) |
|
|
|
|
|
|
|
|
1,883,765 |
(1) The Company taxes exchange differences on a cash basis to calculate income tax and social contribution on net income.
FS-59
|
|
The Company has foreign subsidiaries in its corporate structure, for which profits are taxed at income tax in the countries where they are domiciled by lower rates than those prevailing in Brazil. From 2014 up to 2019 such foreign subsidiaries generated profits amounting to R$ 1,406,562. If for some reason tax authorities understand that these profits are subject to additional taxation in Brazil in respect of income tax and social contribution, which if due, would total R$ 453,927.The Company, based on its legal counsel’s opinion, assessed the likelihood of loss in a potential claiming by tax authorities which resulted in a possible risk of loss and, therefore, no provision was recognized in the financial statements.
In addition, management evaluated the precepts of IFRIC 23 - “Uncertainties Over Income Tax Treatments” and considers that there are no reasons for the tax authorities to differ from the tax positions adopted by the Company. Accordingly, no additional provisions for income tax and social contribution were recognized as a result of the assessment of the application of IFRIC 23 in the financial statements at December 31, 2019.
A sensitivity analysis of tax credit was performed considering a variation of macroeconomic assumptions, operating performance and liquidity events. In this way, considering the results of studies performed, which indicates that it is probable that there will be taxable income to use the deferred income and social contribution taxes balance.
The estimated recovery of deferred tax assets of IRPJ and CSLL are presented by net when referring to a single jurisdiction as shown in the table below:
|
In millions of reais |
|
Consolidated |
|
2020 |
|
230 |
|
2021 |
|
713 |
|
2022 |
|
938 |
|
2023 |
985 | |
|
2024 |
|
431 |
|
Deferred Asset |
|
3,297 |
|
Deferred liabilities - Parent Company |
|
(823) |
|
Net Deferred Asset |
|
2,474 |
|
Deferred liabilities - Subsidiaries |
|
(590) |
|
Net Deferred Asset |
|
1,884 |
14.c) Income statement and social contribution recognized in the shareholders’ equity
The income statement and social contribution recognized directly in the shareholder’s equity are demonstrated below:
|
Consolidated | |||
|
12/31/2019 |
|
12/31/2018 | |
|
Income tax and social contribution |
|
|
|
|
Actuarial gains on defined benefit pension plan |
215,306 |
|
176,700 |
|
Estimated losses for deferred income and social contribution tax credits - actuarial gains |
(217,969) |
|
(180,048) |
|
Exchange differences on translating foreign operations |
(325,350) |
|
(325,350) |
|
Cash flow hedge accounting |
426,961 |
|
490,041 |
|
Estimated losses for deferred income and social contribution tax credits - cash flow hedge |
(426,961) |
|
(490,041) |
|
|
(328,013) |
|
(328,698) |
FS-60
|
|
Income tax and social contribution Impairment test – deferred tax assets
The Company's management constantly evaluates the ability to use its tax credits. In this direction, CSN periodically updates a technical study to demonstrate if the generation of future taxable profits support the realization of tax credits and, consequently support the accounting recognition of tax credits, the maintenance on the balance sheet or the constitution of a provision for loss in the realization of these credits.
This study is prepared at Entity level, in accordance with the Brazilian tax legislation, and is performed considering the Company’s projections, which is the entity that generates a significant amount of tax credits, mainly, temporary differences. The Company covers the following businesses:
• Steel Brazil (Steel); and
• Cement;
The deferred tax assets on tax losses and temporary differences refers mainly to the following:
|
|
Nature |
Description |
|
|
Tax losses |
The Company incur tax losses at the parent company level, because of financial expenses over its leverage, since it holds substantially all loans and financings of CSN group. In 2018 the parent company presented taxable income. |
|
Temporary differences |
Foreign exchange differences |
The Company usually opts for the taxation of exchange differences on a cash basis. As a result, taxes are due and expenses are deductible when the underlying asset or liabilities is settled. |
|
Losses on Usiminas shares |
Changes in investments in Usiminas’ shares are recognized on an accrual basis, but the event that generates taxation or deductibility will only occur at the time of divestment. | |
|
Other provisions |
Other provisions are recognized on an accrual basis, but their taxation occurs only at the time of their realization. This includes provisions for contingencies, impairment losses, environmental liabilities, etc. |
The study prepared is based on the Company business plan of on a long-term basis, reasonably estimated by management and considered several scenarios which vary according to different macroeconomic and operating assumptions.
The model for projection of taxable profit considers two main indicators:
· Pre-Tax Profit, reflecting our projected EBITDA plus depreciation, other income and expenses and financial income (expenses); and
· Taxable Profit, which is our pre-tax profit plus (minus) expenses and income items that are taxable at a time different from the time obtained on an accrual basis (temporary differences).
FS-61
|
|
In addition, a sensitivity analysis of tax credits utilization considering a variation in macroeconomic assumptions, operational performance and liquidity events took place.
A significant aspect to be considered in the analysis is the fact that CSN has presented recent tax losses mainly due to the deterioration of the Brazilian political and macroeconomic environment, as well as the growth of its financial leverage. These two aspects combined led to an imbalance between the financial and operating results of the Company.
Within this context, the Company works with a business plan to rebalance between the financial and operating results of the Company, whose main measures are:
· Expansion of disinvestment efforts;
· Reduction of financial leverage;
· Improvement in operating results due to increased sales volume, better prices of its products and efficiency in controlling production costs and
· Reprofiling of the Company's indebtedness, with negotiations to extend the amortization periods and decentralization of debt through redirection of contracts to subsidiaries according to the nature and application of resources.
With the aforementioned measures already in execution, the Company's management expects to retake high profitability rates. Accordingly, management considers that the gradual recognition of tax credits, using at first a time period of projections of less than 10 years, better reflects the expectation of utilization of the credits recognized in the Company's tax books. As a result of the study, the Company reversed during 2019, R$2,361,362 of the loss recorded in previous years, with a balance of deferred fixed assets recognized in the amount of R$3,258,542 in the Parent Company, as of December 31, 2019.
The tax losses and negative social contribution base and temporary differences maintained in the Company's tax books for future use are respectively, R$1,465,808 and R$549,683 (R$834,141 and R$322,283 on December 31, 2018).
15 Taxes in installments
The position of the Refis debts and other tax installment payment plans, recorded in taxes in installments in current and non-current liabilities, as mentioned in note 13, is as follows:
|
|
|
|
|
|
Consolidated | ||
|
|
Current |
|
Non-current | ||||
|
12/31/2019 |
12/31/2018 |
12/31/2019 |
12/31/2018 | ||||
|
Federal REFIS Law 11.941/09 |
12,172 |
|
12,100 |
|
17,436 |
|
18,895 |
|
Federal REFIS Law 12.865/13 |
6,481 |
|
6,240 |
|
48,306 |
|
52,661 |
|
Other taxes in installments |
845 |
|
1,839 |
|
1,985 |
|
2,378 |
|
19,498 |
|
20,179 |
|
67,727 |
|
73,934 | |
16 PROVISION FOR TAX, SOCIAL SECURITY, LABOR, CIVIL AND ENVIRONMENTAL RISKS AND JUDICIAL DEPOSITS
Claims of different nature are being challenged at the appropriate courts. Details of the accrued amounts and related judicial deposits are as follows:
|
|
|
|
|
Consolidated | |||
|
|
Accrued liabilities |
|
Judicial deposits | ||||
|
|
12/31/2019 |
|
12/31/2018 |
12/31/2019 |
|
12/31/2018 | |
|
Tax |
128,411 |
|
118,490 |
|
31,060 |
|
46,321 |
|
Social security |
7,039 |
|
70,084 |
|
|
|
50,898 |
|
Labor |
305,309 |
|
362,228 |
|
227,213 |
|
214,625 |
|
Civil |
138,990 |
|
210,264 |
|
53,771 |
|
22,024 |
|
Environmental |
43,498 |
|
31,390 |
|
3,731 |
|
1,900 |
|
Deposit of a guarantee |
|
|
|
|
12,596 |
|
12,182 |
|
|
623,247 |
|
792,456 |
|
328,371 |
|
347,950 |
FS-62
|
|
|
Classification |
|
|
|
|
| |||
|
Current |
|
96,479 |
|
106,503 |
|
|
|
|
|
Non-current |
|
526,768 |
|
685,953 |
|
328,371 |
|
347,950 |
|
|
|
623,247 |
|
792,456 |
|
328,371 |
|
347,950 |
The changes in the provision for tax, social security, labor, civil and environmental risks in the year ended December 31, 2019 were as follows:
|
Consolidated | ||||||||||
|
|
|
|
|
|
|
|
|
|
|
Current + Non-current |
|
Nature |
12/31/2018 |
Additions |
Accrued charges |
Net utilization of reversal |
12/31/2019 | |||||
|
Tax |
|
118,490 |
|
25,019 |
|
4,188 |
|
(19,286) |
|
128,411 |
|
Social security |
70,084 |
|
4,386 |
|
91 |
|
(67,522) |
|
7,039 | |
|
Labor |
|
362,228 |
|
36,133 |
|
59,502 |
|
(152,554) |
|
305,309 |
|
Civil |
210,264 |
|
65,817 |
|
12,465 |
|
(149,556) |
|
138,990 | |
|
Environmental |
|
31,390 |
|
9,629 |
|
4,091 |
|
(1,612) |
|
43,498 |
|
792,456 |
|
140,984 |
|
80,337 |
|
(390,530) |
|
623,247 |
The provision for tax, social security, labor, civil and environmental liabilities was estimated by management and is mainly based on the legal counsel’s assessment and only proceedings for which the risk is classified as probable loss are accrued. Additionally, this provision includes tax liabilities resulting from lawsuits filed by the Company, subject to SELIC (Central Bank’s policy rate).
Tax lawsuits
The main lawsuits that are considered by the external legal advisors as probable loss, which CSN or its subsidiaries are parties are as follows: (i) ISS tax assessments notices; (ii) Differences between calculated and paid ICMS; (iii) Consignment action for payment of social security contributions; (iv) requests for compensation not approved due to the lack of credit rights.
Labor lawsuits
As of December 31, 2019, the Group is a defendant in 7,590 labor lawsuits. Most of the claims relate to subsidiary and/or joint liability, salary equalization, health hazard premiums and hazardous duty premiums, overtime pay, health care plan, indemnity claims resulting from alleged occupational diseases or on-the-job accidents, breaks between working hours, and differences in profit sharing from 1997 to 1999 and from 2000 to 2003.
During the year ended December 31, 2019 there were addition or write-off movements in labor lawsuits arising from the definite conclusion and the constant revision of the Company’s accounting estimates related to the provision for contingencies that take into consideration the different nature of the claims made, as required by the Company’s accounting policies.
FS-63
|
|
Civil lawsuits
Among the civil lawsuits in which the Company is a defendant are claims for compensation. Generally, these lawsuits result from work accidents, occupational diseases and contractual litigation related to the industrial activities of the Group, real estate actions, healthcare plan.
Environmental lawsuits
Among the environmental administrative / judicial proceedings in which the Company is a defendant include mainly administrative proceedings for alleged environmental irregularities and the regularization of environmental licenses; at the judicial level, the Company is a party to actions collecting the fines imposed for such alleged environmental irregularities and public civil actions claiming regularization with compensation, in most cases claiming environmental recovery. In general, these proceedings arise from alleged impacts to the environment related to the Company’s industrial activities.
The environmental processes are highly complex to estimate the value at risk, because they should be taken into consideration, among various aspects, procedural development, the extent of any damage and projected repair costs.
There are other environmental processes for which it is not yet possible to assess the risk and contingency amount due to the aforementioned complexity of estimation, the peculiarities of the matters involving them and also their procedural stages. The main environmental judicial and administrative procedures are listed below:
· In 2018, the Company celebrated TAC 07/2018, which aims to adopt environmental improvements within the scope of the UPV. The obligations of TAC 07/2018 are linked to the Environmental Operating Authorization (“AAF”) nº IN 002019, valid until October 2024, whose purpose is to authorize the regular operation of the UPV during compliance with TAC 07/2018.
· In July 2012, the Public Ministry of the State of Rio de Janeiro, (“Ministério Público do Estado do Rio de Janeiro” or “MPE/RJ”) and the Public Federal Ministry (“Ministério Público Federal” or “MPF”) filed a separate public civil action in the state and Federal Courts alleging, in existence of supposed contaminated area in the Condominium Volta Grande IV. In view of the conflict of jurisdiction to judge actions, the Superior Court of Justice (“Superior Tribunal de Justiça” or “STJ”) declared the jurisdiction of the Federal Court to prosecute and judge such actions. In brief, the MPF maintains that the company should (i) remove wastings left in industrial landfill areas in the city of Volta Redonda and (ii) transfer 750 residences of the Volta Grande IV condominium, also in the city of Volta Redonda. These requirements were denied by the Court, which determined the presentation of a schedule to investigate the area and, if necessary, to remediate the potential issues raised by the MPF. The aforementioned schedule was presented and all the surveys performed during the investigation including the risk assessment and intervention plan were concluded in April 30, 2014. Also, there are actions initiated by owners of the residential condominium mentioned above to be reimbursed for material and moral damages, not yet judged.
· In January 2014, it was distributed an Annulment Action with the purpose of declaring the nullity of an Assessment Notice issued by INEA for the alleged contamination of the soil and groundwater in the Volta Grande IV Condominium. The penalty was a simple fine, in the amount of R$35 million. The request for the preliminary suspension of the chargeability of the debt was not assessed, which is why INEA filed a Tax Enforcement Action. Declared connection between actions. An application for suspension of the procedure was filed until the conclusion of the investigation in the ACP Volta Grande IV.
· With regards to other supposedly contaminated areas in Volta Redonda, the Public Ministry initiated three public civil actions claiming for environmental remediation and indemnification related to certain areas denominated Marcia I, II, III and IV, Wandir I and II and Reciclam. Regarding to Marcia I, the phase of producing evidence has ended and is being analyzed for judgment. The other claims are at initial stage and CSN are currently performing environmental studies that will determine the extent of possible environmental damages related to soil contamination, as well as the action plan to fulfill with the legislation in force. As soon as the studies are concluded, they will be presented and added to the pleadings.
· In 2015, the Public Federal Ministry initiated a public civil action against CSN claiming for the adequacy and regularization for the emission of particles from the UPV and the stoppage of its operations. According to CONAMA Resolution n. º 436/2011, the companies have to adjust the emission of particles to match to the new legal standards required by December 2018, which should be compatible with INEA the schedule of actions and measures foreseen in TAC 07/2018.
FS-64
|
|
· In 2016, CSN were mentioned in public civil action proposed by the Public Federal Ministry and the Public Ministry of the State of Rio de Janeiro in relation to a supposedly irregular waste deposit in the landfill area named "Aterro Panco". The claimings are for the recovery of degraded areas, compensation for damages to fauna and flora and to human health, as well as indemnification for material and moral damages caused to the environment.
· In 1988, the Public Federal Ministry initiated a public civil action against CSN for a supposedly environmental contamination and pollution of the Paraiba do Sul river supposedly caused by our industrial activities of UPV. In 1995, the court determined the meeting of cases No. 15,497; 17,563; No. 7,304; and, No. 7,624, in view of the connection characterized and determined the joining of the four actions.
· The Federal Regional Court of the Second Region maintained the first instance conviction, reiterating the Company's obligation to compensate for possible environmental damage caused to the ecosystem. The Company appealed to the Superior Court of Justice (STJ), which accepted the appeal and annulled the previous decisions, determining the return of the records to the 1st Instance to resume the process.
· In 2010, a civil investigation was launched to verify (i) the environmental requirements for the CSN project in the city of Arcos (cement plant); (ii) monitoring and mitigation of the environmental impacts of our productive activities; (iii) conformity of the conditions our environmental licenses, including the creation of a museum within the Corumbá ecological station and the creation of a Private Reserve of Natural Heritage; and (iv) measures for preservation of cultural heritage and adoption of compensatory measures. In February 2, 2011 a Term of Undertaking was signed (“TAC”) to assure the fulfillment of the obligations raised by the Public Ministry. In December 2019, the TAC's final filing and settlement of obligations, without the payment of fines by CSN, was ratified by the Council of the Public Ministry.
· In 2009 and 2010, we signed Judicial Agreements (“TAJ”) with the Public Federal Ministry to recover environmental liabilities caused by our coal mining activities in the Southeast of Santa Catarina until the 90’s. The environmental liabilities reached by the TAJ include the restoration of certain degraded areas. In March 2018, the parties renegotiated a new agreement, with the extension of the construction schedule until 2030, which was legally approved on 06/06/18.
The Company is currently negotiating with the Public Federal Ministry the suspension of the TAJ terms for trading and adjusting the obligations and planned compensatory measures.
· In July 2018, the Company and Harsco Metals ("Harsco"), a contracted company, were named in a new public civil action jointly filed by the Federal Public Ministry and the Public Prosecutor's Office of the State of Rio de Janeiro, due to the irregular deposit of waste (steel slag) in the area called "Slag Processing Yard". The decision issued established a certain limitation in the monthly dispatch of the slag to the said yard, reduction of the height of the piles, removal of the excess of the stored material, which finally had its effects suspended by preliminary decision. The Company and Harsco have been looking for alternatives to solve this problem and are working on a plan of action with a feasible schedule, due to the concern with the impacts that can be generated by the abrupt removal of the yard material within the deadline established in the preliminary decision.
· In January 1995, in the Municipality of Volta Redonda/RJ (“MVR”), the ACP was filed claimed to CSN to comply with 26 items of Compensatory Environmental Programs. After the dispute, the parties entered into Transaction (1995), establishing CSN's effective obligations, as well as environmental compensation, ratified in court by judgment. The Municipality of Volta Redonda disagreed about the approved agreement and in 2015 the process of liquidation of unfulfilled obligations was initiated. On December 27, 2018, a new agreement was signed between CSN and the MRV, to put an end to the legal dispute, through reciprocal concessions from the parties, with the MVR expressly waiving the right on which the lawsuit is based and to CSN an additional investment in the amount of R$21 million, with 30% of this amount being allocated to services of environmental interest, preservation works, improvement and recovery of the quality of the environment of Volta Redonda. In 2019, the agreement signed between CSN and MVR was approved with the effective disbursement by CSN of R$ 25MM, following the appellate prosecutor's office, which is awaiting judgment.
· In August 2017, CSN initiated an annulment action against the tax assessment notice that imposed a fine on CSN (R$25 million – updated until December/19), for alleged water pollution in the Paraíba do Sul River, with discharge of effluent from the ETE (Effluent Treatment Station) of Blast Furnace # 2, due to accident occurred on 11/27/2010. The enforceability of the fine is suspended by virtue of an injunction granted in a writ of mandamus until final decision of the appeal phase that discusses the guarantee offered to the court (suitable guarantee) for the grant of guardianship.
· In December 2019, a Public Civil Action was initiated against Sepetiba TECON and INEA aiming at suspending the environmental licensing processes of the Sepetiba TECON container terminal until the study of the environmental support capacity of Sepetiba Bay is carried out, and the INEA to refrain from licensing new ventures or potentially polluting activities on the site, which may harm the socio-environmental balance of the Bay and the preservation of marine fauna. Sepetiba TECON became aware of the action through news published on the MPF website. On 12/19/19, the court rejected the request for urgent relief requested by the MPF, as well as the Federal Union and IBAMA's decision was determined. Citation is awaited.
FS-65
|
|
· In June 2019, CSN filed a lawsuit against the INEA Notification, which determined the suspension of operations for handling solid bulk in TECON due to the alleged lack of activity forecast in the object of the respective Operation License. A preliminary injunction was granted to suspend the effects of the Notification and allow the continuation of the solid bulk handling operation until the final judgment of the action. Decision confirmed on appeal.
· In relation to mining issues, with the occurrence of the accident involving a Brazilian company in November 2015, the State of Minas Gerais initiated several civil inquiries aimed at investigating companies in the mining segment, based on the State Dam Inventory released in 2014. These procedures are intended to investigate structures that do not have technical stability guaranteed by an external auditor, or whose stability has not been attested due to the lack of documents or technical data. In August 2016, the Company was cited in a similar public civil action, in relation to the structure of Dique do Engenho Dam. Documents were submitted to the state authorities that prove the stability and safety of the said dam. It is expected that this case will also be closed, for the same reasons as the previous one.
· Other administrative and judicial proceedings
The table below shows a summary of the carrying amounts of the main legal matters with possible risk of loss and the amounts on December 31, 2019 and 2018.
|
Consolidated | ||||
|
|
12/31/2019 |
12/31/2018 | ||
|
Assessment Notice and imposition of fine (AIIM) - Income tax and social contribution - Capital gain on sale of Namisa's shares |
12,412,964 |
|
11,812,071 | |
|
Assessment Notice and Imposition of fine (AIIM) - Income tax and Social contribution - Disallowance of deductions of goodwill generated in the reverse incorporation of Big Jump by Namisa. |
3,867,663 |
|
3,722,888 | |
|
Assessment Notice and Imposition of fine (AIIM) - Income tax and Social contribution - Disallowance of interest on prepayment arising from supply contracts of iron ore and port services |
2,249,708 |
|
2,165,088 | |
|
Assessment Notice and imposition of fine (AIIM) - Income tax and social contribution due to profits from foreign subsidiaries for years 2008, 2010, 2011 and 2014(1) |
2,946,288 |
|
1,891,149 | |
|
Tax foreclosures - ICMS - Electricity credits |
1,022,371 |
|
974,479 | |
|
Offset of taxes that were not approved by the Federal Revenue Service - IRPJ/CSLL, PIS/COFINS and IPI |
1,100,564 |
|
1,481,382 | |
|
Disallowance of the ICMS credits - Transfer of iron ore |
567,534 |
|
529,607 | |
|
ICMS - Refers to the transfer of imported raw material at an amount lower than the price disclosed in the import documentation |
310,349 |
|
294,527 | |
|
Disallowance of the tax loss and negative basis of social contribution arising from the adjustments in the SAPLI |
538,268 |
|
516,583 | |
|
Assessment Notice- IRRF- Capital Gain of CFM vendors located abroad |
254,850 |
|
243,007 | |
|
CFEM – difference of understanding between CSN and DNPM on the calculation basis (2) |
1,020,266 |
|
311,582 | |
|
Assessment Notice- ICMS- questions about sales for incentive area |
1,015,812 |
|
976,438 | |
|
Other tax lawsuits (federal, state, and municipal) |
4,478,014 |
|
3,625,167 | |
|
Social security lawsuits |
|
325,492 |
|
287,823 |
|
Enforcement action applied by Brazilian antitrust authorities (CADE) |
|
93,212 |
|
101,683 |
|
Other civil lawsuits |
1,721,753 |
|
922,171 | |
|
Labor and social security lawsuits |
1,565,237 |
|
1,537,078 | |
|
Tax foreclosures – Fine – Volta Redonda IV (3) |
84,599 |
|
75,530 | |
|
Other environmental lawsuits |
215,691 |
|
144,235
| |
|
35,790,635 |
|
31,612,488 | ||
(1) On October 15, 2019, CSN received a new tax assessment requesting the payment of IRPJ / CSLL referring to profits earned by a foreign contractor, in the total amount of R$1 Billion;
(2) On December 23, 2019, CSN Mineração received 03 (three) new Notifications of Launches demanding payment of differences in the payment of CFEM, in the total amount of R$689 million;
(3) On April 8, 2013, INEA imposed on CSN a fine of R$ 35 million in respect of the aspects involving the Volta Grande IV condominium, determining that the actions already considered and discussed in the civil suit filed in July 2012. In connection with the application of this fine, an annulment action was distributed, in January 2014, to the 10th Civil Court of the State of Rio de Janeiro, seeking the annulment of the fine and its effects. In parallel, INEA filed a tax enforcement action in order to enforce the amount of the fine imposed. The aforementioned Tax Enforcement action was distributed in May 2014 to the 4th Volta Redonda Active Debt Registry in the State of Rio de Janeiro. Currently, said enforcement action is suspended until the judgment of the annulment action, in order to avoid conflicting decisions.
FS-66
|
|
The assessments made by the legal counsel define these administrative and judicial proceedings as entailing risk of possible loss and, therefore, no provision was recorded in conformity with Management’s judgment and accounting practices adopted in Brazil.
17 PROVISION FOR ENVIRONMENTAL LIABILITIES AND ASSET RETIREMENT OBLIGATIONS
The carrying amount of the provision for environmental liabilities and asset retirement obligation (ARO) are as follows:
|
|
|
|
Consolidated |
|
12/31/2019 |
|
12/31/2018 | |
|
Environmental liabilities |
192,270 |
198,386 | |
|
Asset retirement obligations |
331,731 |
83,380 | |
|
|
524,001 |
281,766 |
17.a) Environmental liabilities
As of December 31, 2019, there is a provision recognized for expenditures relating to environmental investigation and recovery services for potentially contaminated areas surrounding establishments in the States of Rio de Janeiro, Minas Gerais and Santa Catarina. Estimated expenditures will be reviewed periodically and the amounts already recognized will be adjusted whenever necessary. These are Management’s best estimates based on the environmental remediation studies and projects. This provision is recognized as other operating expenses.
The provision is measured at the present value of the expenditures required to settle the obligation, using a pretax rate that reflects current market assessments of the time value of money and the specific risks of the obligation. The increase in the obligation due to passage of time is recognized as other operating expenses.
Some contingent environmental liabilities are monitored by environmental department were not recorded in provisions due to its characteristics, they do not meet the recognition criteria present in IAS 37.
17.b) Asset retirement
In 2019, the Company decided to anticipate the discontinuity of the dams used in its mining activities and, consequently, the flow of expenses for deactivating the dams was anticipated in relation to the initial planning considering the last study. As a result, the balance of the provision for deactivating assets was R$331,731 on December 31, 2019 (R$83,380 on December 31, 2018).
FS-67
|
|
18 RELATED-PARTY BALANCES AND TRANSACTIONS
18.a) Transactions with holding companies
Vicunha Siderurgia S.A. is the Company’s main shareholder, with 49,24% of the voting shares.
The Company’s also control Rio Iaco Participações S.A, holding a 4,22% interest in the voting capital of the Company.
The corporate structure of Vicunha Aços S.A is as follows:
Vicunha Steel S.A. – holds 67.93% of Vicunha Aços S.A.
CFL Participações S.A. – holds 12.82% of Vicunha Aços S.A. and 40% of Vicunha Steel S.A.
Rio Purus Participações S.A. – holds 19.25% of Vicunha Aços S.A. and 60% of Vicunha Steel S.A.
· Liabilities
At the Annual General Meeting (AGM), held on April 26, 2019, the distribution of the mandatory minimum dividend for the year of 2018 was approved. Vicunha Aços S.A and Rio Iaco Participações S.A received, respectively, R$442,308 and R$37,879.
On December 31, 2019, it was proposed to distribute, as mandatory minimum dividends, the amount of R$204,574 to the shareholder Vicunha Aços S.A and R$17,519 to Rio Iaco Participações S.A. Since the meeting of the board of directors was held on 09/18/2019, the distribution of interim dividends to the profit account recorded in the balance sheet as of June 30, 2019 was approved and Vicunha Aços S.A and Rio Iaco Participações S.A received R$203,179 and R$17,400, respectively. The remaining balance of the proposed dividends of R$1,394 for Vicunha Aços S.A and R$ 119 for Rio Iaco Participações S.A will be deliberated at the 2020 Annual General Meeting (AGM)
18.b) Transactions with subsidiaries, joint ventures, associates, exclusive funds and other related parties
· By transaction
|
Current |
Non-current |
Total | ||||||||||
|
12/31/2019 |
|
12/31/2018 |
|
12/31/2019 |
|
12/31/2018 |
|
12/31/2019 |
|
12/31/2018 | ||
|
Assets |
|
|
|
|
|
|
|
|
|
|
|
|
|
Trade receivables (note 5) |
170,588 |
|
93,317 |
|
|
|
|
|
170,588 |
|
93,317 | |
|
Dividends receivable (note 7) |
|
44,554 |
|
46,171 |
|
|
|
|
|
44,554 |
|
46,171 |
|
Actuarial asset (note 7) |
|
|
|
|
13,714 |
|
99,894 |
|
13,714 |
|
99,894 | |
|
Financial investments |
|
2,116,560 |
|
92,332 |
|
95,719 |
|
|
|
2,212,279 |
|
92,332 |
|
Loans (note 7) |
|
|
2,675 |
|
846,300 |
|
706,605 |
|
846,300 |
|
709,280 | |
|
Other receivables (note 7) |
|
1,830 |
|
3,649 |
|
428,672 |
|
218,840 |
|
430,502 |
|
222,489 |
|
2,333,532 |
|
238,144 |
|
1,384,405 |
|
1,025,339 |
|
3,717,937 |
|
1,263,483 | ||
|
Liabilities |
|
|
|
|
||||||||
|
Borrowings and Financing |
|
|
|
|
|
|
|
|
|
|
|
|
|
Borrowings and Financing (Note 11) |
|
25,038 |
|
|
|
|
|
|
|
25,038 |
|
|
|
Other payables (Note 13) |
|
|
|
|
|
|
|
|
|
|
| |
|
Accounts payable |
|
23,566 |
|
29,286 |
|
88,021 |
|
96,629 |
|
111,587 |
|
125,915 |
|
Provision for consumption and services |
|
22,497 |
|
6,213 |
|
|
|
|
|
22,497 |
|
6,213 |
|
Trade payables |
240,984 |
|
135,801 |
|
|
|
|
|
240,984 |
|
135,801 | |
|
Actuarial liabilities |
|
|
|
|
|
19,788 |
|
7,982 |
|
19,788 |
|
7,982 |
|
312,085 |
|
171,300 |
|
107,809 |
|
104,611 |
|
419,894 |
|
275,911 | ||
FS-68
|
|
|
12/31/2019 |
12/31/2018 |
|
12/31/2017 | ||
|
P&L |
|
|
|
|
|
|
Revenues |
|
|
|
|
|
|
Sales |
1,122,303 |
|
1,278,751 |
|
880,145 |
|
Interest (note 24) |
79,228 |
|
64,888 |
|
61,549 |
|
Expenses |
|
|
|
|
|
|
Purchases |
(1,958,958) |
|
(1,418,282) |
|
(1,176,930) |
|
Interest (Note 24) |
|
|
(16,092) |
|
|
|
Foreing exchange and monetary variations, net |
3,586 |
|
13,611 |
|
|
|
Other expenses |
(150,943) |
|
|
|
|
|
(904,253) |
|
(77,124) |
|
(235,236) |
· By company - Assets and Liabilities
|
Assets |
Liabilities | |||||||||||
|
Current |
Non-current |
Total |
Current |
Non-current |
Total | |||||||
|
Joint-venture and Joint-operation |
|
|
|
|
|
|
|
|
|
|
|
|
|
Itá Energética S.A. |
|
|
|
|
|
|
2,231 |
|
|
|
2,231 | |
|
MRS Logística S.A. |
|
44,554 |
|
|
|
44,554 |
|
142,310 |
|
88,021 |
|
230,331 |
|
CBSI - Companhia Brasileira de Serviços e Infraestrutura |
|
|
|
|
|
|
|
|
|
|
| |
|
Transnordestina Logística S.A (1) |
|
797 |
|
1,273,098 |
|
1,273,895 |
|
19 |
|
|
|
19 |
|
45,351 |
|
1,273,098 |
|
1,318,449 |
|
144,560 |
|
88,021 |
|
232,581 | ||
|
Other related parties |
|
|
|
|
|
|
|
|
|
|
|
|
|
CBS Previdência |
|
|
13,714 |
|
13,714 |
|
|
|
19,788 |
|
19,788 | |
|
Banco Fibra (2) |
|
1,940 |
|
95,719 |
|
97,659 |
|
25,038 |
|
|
|
25,038 |
|
Usiminas |
|
2,116,063 |
|
|
|
2,116,063 |
|
129,824 |
|
|
|
129,824 |
|
Panatlântica (3) |
|
128,573 |
|
|
|
128,573 |
|
11,621 |
|
|
|
11,621 |
|
Ibis Participações e Serviços |
|
230 |
|
|
|
230 |
|
|
|
|
|
|
|
Other related parties |
|
1,940 |
|
|
|
1,940 |
|
1,042 |
|
|
|
1,042 |
|
|
|
2,248,746 |
|
109,433 |
|
2,358,179 |
|
167,525 |
|
19,788 |
|
187,313 |
|
Associates |
|
|
|
|
|
|
|
|
|
|
|
|
|
Arvedi Metalfer do Brasil S.A. |
|
39,435 |
|
1,874 |
|
41,309 |
|
|
|
|
|
|
|
Total at 12/31/2019 |
|
2,333,532 |
|
1,384,405 |
|
3,717,937 |
|
312,085 |
|
107,809 |
|
419,894 |
|
Total at 12/31/2018 |
|
238,144 |
1,025,339 |
1,263,483 |
171,300 |
104,611 |
275,911 | |||||
FS-69
|
|
· By company - Statement of income
|
|
12/31/2019 | |||||||||
|
| ||||||||||
|
Sales |
Purchases |
Financial income (expenses), net |
Exchange rate variations, net |
Total | ||||||
|
Joint-venture and Joint-operation |
|
|
|
|
|
|
|
|
|
|
|
Itá Energética S.A. |
(57,285) |
(57,285) | ||||||||
|
MRS Logística S.A. |
|
(1,068,563) |
(14,939) |
(1,083,502) | ||||||
|
CBSI - Companhia Brasileira de Serviços e Infraestrutura |
(231,141) |
(231,141) | ||||||||
|
Transnordestina Logística S.A (1) |
|
(7,294) |
58,250 |
50,956 | ||||||
|
(1,364,283) |
58,250 |
(14,939) |
(1,320,972) | |||||||
|
Other related parties |
|
|||||||||
|
Banco Fibra (2) |
|
20,499 |
3,586 |
24,085 | ||||||
|
Usiminas |
(479,868) |
(136,004) |
(630,538) | |||||||
|
Panatlântica (3) |
|
1,043,382 |
(100,482) |
942,900 | ||||||
|
Vicunha Aços S.A |
202 |
(321) |
(119) | |||||||
|
Outras related parties |
|
3,620 |
(14,004) |
(10,384) | ||||||
|
1,047,204 |
(594,675) |
20,499 |
(132,418) |
340,610 | ||||||
|
Associates |
|
|||||||||
|
Arvedi Metalfer do Brasil S.A. |
75,630 |
479 |
76,109 | |||||||
|
Total |
|
1,122,834 |
(1,958,958) |
79,228 |
(147,357) |
(904,253) | ||||
FS-70
|
|
|
|
12/31/2018 | ||||||||
|
P&L | |||||||||
|
Sales |
Purchases |
Financial income (expenses), net |
Exchange rate variations, net |
Total | |||||
|
Joint-venture and Joint-operation |
|||||||||
|
MRS Logística S.A. |
(1,111,695) |
(16,092) |
(1,127,787) | ||||||
|
CBSI - Companhia Brasileira de Serviços e Infraestrutura |
47 |
(180,332) |
(180,285) | ||||||
|
Transnordestina Logística S.A (1) |
367 |
(15,667) |
50,003 |
34,703 | |||||
|
|
414 |
(1,307,694) |
33,911 |
(1,273,369) | |||||
|
Other related parties |
|||||||||
|
Banco Fibra (2) |
14,651 |
13,611 |
28,262 | ||||||
|
Usiminas |
(382) |
(382) | |||||||
|
Panatlântica (3) |
1,174,984 |
(94,515) |
1,080,469 | ||||||
|
Ibis Participações e Serviços |
(4,501) |
(4,501) | |||||||
|
Other related parties |
2,745 |
(11,190) |
(8,445) | ||||||
|
|
1,177,729 |
(110,588) |
14,651 |
13,611 |
1,095,403 | ||||
|
Associates |
|||||||||
|
Arvedi Metalfer do Brasil S.A. |
100,608 |
234 |
100,842 | ||||||
|
TOTAL |
1,278,751 |
(1,418,282) |
48,796 |
13,611 |
(77,124) | ||||
FS-71
|
|
|
|
|
|
|
|
|
12/31/2017 | ||
|
Sales |
Purchases |
Financial income(expenses), net |
Total | |||||
|
Joint ventures and Joint Operation |
|
|||||||
|
Itá Energética S.A |
|
(32,275) |
(32,275) | |||||
|
MRS Logística S.A. |
|
(934,279) |
(934,279) | |||||
|
CBSI - Companhia Brasileira de Serviços e Infraestrutura |
|
55 |
(150,758) |
(150,703) | ||||
|
Transnordestina Logística S.A (1) |
|
2,549 |
(7,916) |
53,261 |
47,894 | |||
|
|
|
2,604 |
(1,125,228) |
53,261 |
(1,069,363) | |||
|
Other related parties |
|
|||||||
|
Fundação CSN |
|
13 |
(1,118) |
(1,105) | ||||
|
Banco Fibra (2) |
|
6,290 |
6,290 | |||||
|
Usiminas |
|
(427) |
(427) | |||||
|
Panatlântica (3) |
|
872,047 |
(43,949) |
828,098 | ||||
|
Ibis Participações e Serviços |
|
(5,915) |
(5,915) | |||||
|
Partfib Projetos Imobiliários |
|
2,821 |
2,821 | |||||
|
Vicunha Imóveis Ltda. |
|
(232) |
(232) | |||||
|
Vicunha Serviços Ltda. |
|
(61) |
(61) | |||||
|
|
|
874,881 |
(51,702) |
6,290 |
829,469 | |||
|
Associates |
|
|||||||
|
Arvedi Metalfer do Brasil S,A, |
|
2,660 |
1,998 |
4,658 | ||||
|
Total |
|
880,145 |
(1,176,930) |
61,549 |
(235,236) |
(1) Transnordestina Logística S.A: Assets: Refers mainly to loan agreements in R$: average rate interest from 125% to 130% of the CDI. As of December 31, 2019, the loans amounted to R$844,426 (R$706,605 as of December 31, 2018).
(2) Banco Fibra S.A: Assets: Refers mainly to Eurobond from Fibra Bank with maturity in February 2028.
(3) Panatlântica: Receivables from the sale of steel products.
FS-72
|
|
18.c) Other unconsolidated related parties
· CBS Previdência
The Company is its main sponsor, being a non-profit civil society established in July 1960, primarily engaged in the payment of benefits that supplement the official government Social Security benefits to participants. In its capacity as sponsor, CSN carries out transactions involving the payment of contributions and recognition of actuarial liabilities calculated in defined benefit plans.
· Banco Fibra
Banco Fibra is under the control structure of Vicunha Aços S.A., direct controller of the Company and the financial transactions carried out with this bank are limited to movements in checking accounts and financial investments in fixed-income securities.
· Fundação CSN
Nowadays, the Company develops socially responsible policies concentrated in Fundação CSN, of which it is the founder. The transactions between the parties are related to the operational and financial support for Fundação CSN to conduct the social projects, developed mainly in the localities where the Company operates.
· Partfib Projetos Imobiliários Ltda, Vicunha Imóveis Ltda, Vicunha Serviços Ltda, Jockey Club de São Paulo, Ibis Participações e Serviços Ltda e Ibis Agrária Ltda.
They are companies and non-profit entities under the control of a member of the management who have maintained transactions with the Company.
18.d) Key management personnel
The key management personnel with authority and responsibility for planning, directing and controlling the Company’s activities, include the members of the Board of Directors and statutory directors. The following is information on the compensation of such personnel and the related balances as of December 31, 2019.
|
|
| |||||
|
12/31/2019 |
12/31/2018 |
|
12/31/2017 | |||
|
P&L | ||||||
|
Short-term benefits for employees and officers |
|
37,452 |
32,848 |
|
39,721 | |
|
Post-employment benefits |
109 |
105 |
|
110 | ||
|
|
|
37,561 |
32,953 |
|
39,831 | |
18.e) GUARANTEES
The Company is liable for guarantees of its subsidiaries and joint ventures as follows:
FS-73
|
|
|
Currency |
Maturities |
Borrowings |
Tax foreclosure |
Others |
Total | ||||||||||||||
|
12/31/2019 |
|
12/31/2018 |
12/31/2019 |
|
12/31/2018 |
12/31/2019 |
|
12/31/2018 |
12/31/2019 |
|
12/31/2018 | ||||||||
|
Transnordestina Logísitca |
R$ |
|
Up to 09/19/2056 and indefinite |
|
2,428,194 |
|
2,108,917 |
|
37,406 |
|
35,336 |
|
8,702 |
|
8,231 |
|
2,474,302 |
|
2,152,484 |
|
FTL - Ferrovia Transnordestina |
R$ |
Up to 04/01/2021 |
43,118 |
62,407 |
43,118 |
62,407 | |||||||||||||
|
Cia Metalurgica Prada |
R$ |
|
Indefinite |
|
|
|
|
|
457 |
|
333 |
|
235 |
|
11,942 |
|
692 |
|
12,275 |
|
|
|
|
|
|
|
|
|
|
|
|
|
|
|
|
|
|
|
|
|
|
CSN Energia |
R$ |
Up to 11/26/2023 and indefinite |
3,141 |
2,829 |
1,920 |
1,920 |
5,061 |
4,749 | |||||||||||
|
|
|
|
|
|
|
|
|
|
|
|
|
|
|
|
|
|
|
|
|
|
CSN Mineração |
R$ |
|
Up to 12/21/2024 |
|
1,184,048 |
|
1,407,363 |
|
|
|
|
|
|
|
|
|
1,184,048 |
|
1,407,363 |
|
|
|
|
|
|
|
|
|
|
|
|
|
|
|
|
|
|
|
|
|
|
Estanho de Rondônia |
R$ |
7/15/2022 |
1,902 |
3,153 |
1,902 |
3,153 | |||||||||||||
|
Minérios Nacional S.A. |
R$ |
|
Up to 09/10/2021 |
|
4,544 |
|
7,305 |
|
|
|
|
|
|
|
|
|
4,544 |
|
7,305 |
|
|
|
|
|
|
|
|
|
|
|
|
|
|
|
|
|
|
|
|
|
|
Total in R$ |
3,661,806 |
3,589,145 |
41,004 |
38,498 |
10,857 |
22,093 |
3,713,667 |
3,649,736 | |||||||||||
|
|
|
|
|
|
|
|
|
|
|
|
|
|
|
|
|
|
|
|
|
|
CSN Islands XI |
US$ |
9/21/2019 |
547,094 |
547,094 | |||||||||||||||
|
CSN Islands XII |
US$ |
|
Perpetual |
|
1,000,000 |
|
1,000,000 |
|
|
|
|
|
|
|
|
|
1,000,000 |
|
1,000,000 |
|
CSN Resources |
US$ |
Up to 04/17/2026 |
1,958,603 |
1,402,906 |
1,958,603 |
1,402,906 | |||||||||||||
|
Total in US$ |
|
|
|
|
2,958,603 |
|
2,950,000 |
|
|
|
|
|
|
|
|
|
2,958,603 |
|
2,950,000 |
|
CSN Steel S.L. |
EUR |
|
1/31/2020 |
|
24,000 |
|
48,000 |
|
|
|
|
|
|
|
|
|
24,000 |
|
48,000 |
|
Lusosider Aços Planos |
EUR |
Indefinite |
75,000 |
75,000 | |||||||||||||||
|
Total in EUR |
|
|
|
|
24,000 |
|
123,000 |
|
|
|
|
|
|
|
|
|
24,000 |
|
123,000 |
|
Total in R$ |
12,033,973 |
11,976,657 |
12,429,826 |
11,976,657 | |||||||||||||||
|
|
|
|
|
|
15,695,779 |
|
15,565,802 |
|
41,004 |
|
38,498 |
|
10,857 |
|
22,093 |
|
16,143,493 |
|
15,626,393 |
19 SHAREHOLDERS' EQUITY
19.a) Paid-in capital
Fully subscribed and paid-in capital as of December 31, 2019 and December 31, 2018 is R$4,540,000 comprising 1,387,524,047 book-entry common shares without par value. Each common share entitles its holder to one vote in Shareholders’ Meetings.
19.b) Authorized capital
The Company’s bylaws in effect as of December 31, 2019 determine that the capital can be raised to up to 2,400,000,000 shares by decision of the Board of Directors.
19.c) Legal reserve
This reserve is recognized at the rate of 5% of the profit for each period, as provided for by Article 193 of Law 6,404/76, up to the ceiling of 20% of share capital.
19.d) Ownership structure
As of December 31, 2019, the Company’s ownership structure was as follows:
|
|
|
|
|
12/31/2019 |
|
|
|
|
12/31/2018 | |||
|
Number of common shares |
% of total shares |
% of voting capital |
Number of common shares |
% of total shares |
% of voting capital | |||||||
|
Vicunha Aços S.A. (*) |
|
679,522,254 |
|
48.97% |
|
49.24% |
|
679,522,254 |
|
48.97% |
|
49.24% |
|
Rio Iaco Participações S.A. (*) |
|
58,193,503 |
|
4.19% |
|
4.22% |
|
58,193,503 |
|
4.19% |
|
4.22% |
|
NYSE (ADRs) |
|
262,206,103 |
|
18.90% |
|
19.00% |
|
284,152,319 |
|
20.48% |
|
20.59% |
|
Other shareholders |
|
380,192,687 |
|
27.40% |
|
27.55% |
|
358,246,471 |
|
25.83% |
|
25.95% |
|
Outstanding shares |
|
1,380,114,547 |
|
99.47% |
|
100.00% |
|
1,380,114,547 |
|
99.47% |
|
100.00% |
|
Treasury shares |
|
7,409,500 |
|
0.53% |
|
|
|
7,409,500 |
|
0.53% |
|
|
|
Total shares |
|
1,387,524,047 |
|
100.00% |
|
|
|
1,387,524,047 |
|
100.00% |
|
|
FS-74
|
|
(*) Controlling group companies.
19.e) Treasury shares
On April 2018, the Board of Directors authorized the sale of up to 30,391,000 common shares held in treasury and until the end of the program, 22,981,500 shares were sold for R$213,494. The Company recognized a profit on the sale of the shares in the amount of R$32,690 directly in equity.
|
Program |
Board’s Authorization |
Authorized quantity |
Program period |
Average buyback price |
Minimum and maximum buyback price |
Number bought back |
Share cancelation |
Sale of shares |
|
Balance in treasury | ||||||||
|
9º (*) |
03/31/2015 |
32,770,055 |
From 4/01/2015 to 6/30/2015 |
30,391,000 | ||||||||||||||
|
04/20/2018 |
30,391,000 |
From 4/20/2018 to 4/30/2018 |
Not applicable |
Not applicable |
|
|
|
22,981,500 |
7,409,500 |
(*) There was no share buyback in this program.
As of December 31, 2019, the position of the treasury shares was as follows:
|
Quantity purchased (Units) |
Amount paid for the shares |
Share price |
Market value of shares in 12/31/2019 (*) | |||||||
|
Minimum |
|
Maximum |
|
Average |
||||||
|
7,409,500 |
|
R$ 58,264 |
|
R$ 4.48 |
|
R$ 10.07 |
|
R$ 7.86 |
|
R$ 104,548 |
(*) The average quotation as of December 31, 2019 in the amount R$ 14.11 per share was used.
19.f) Policy on investments and payment of interest on capital and dividends
The Company adopts a profit distribution policy which, after compliance with the provisions in Law 6,404/76, as amended by Law 9,457/97, will entail the allocation of all the profit to the Company’s shareholders, provided that the following priorities are observed, irrespective of their order: (i) carrying out the business strategy; (ii) fulfilling its obligations; (iii) making the required investments; and (iv) maintaining a healthy financial situation of the Company.
19.g) Earnings/(loss) per share:
Basic earnings per share were calculated based on the profit/loss attributable to the owners of CSN divided by the weighted average number of common shares outstanding during the year, excluding the common shares purchased and held as treasury shares, as follows:
|
12/31/2019 |
|
12/31/2018 |
|
12/31/2017 | |
|
Common Shares | |||||
|
|
| ||||
|
(Loss) profit for the year |
1,789,067 |
|
5,074,136 |
|
10,272 |
|
Weighted average number of shares |
1,380,114,547 |
1,373,250,595 |
|
1,357,133,047 | |
|
Basic and diluted EPS |
1,29632 |
3.69498 |
|
0.00757 | |
FS-75
|
|
The Company does not hold potential dilutable outstanding ordinary shares that could result in dilution of earnings per share.
20 PAYMENT TO SHAREHOLDERS
The Company's Bylaws provide the distribution of 25% minimum dividends of adjusted net income under the law, to the shareholders. The dividends are calculated in accordance with the Company’s Bylaws and in accordance with the Brazilian Corporate Law. The following is the calculation of dividends for 2019:
|
Allocation of profits |
||
|
12/31/2019 | ||
|
Profit for the year |
|
1,789,067 |
|
Dividends and interest on equity prescribed |
2,209 | |
|
Allocation of profits |
|
1,791,276 |
|
Proposed destination: |
|
|
|
Legal reserve |
5% |
(89,454) |
|
Mandatory minimum dividends: |
25% |
(424,903) |
|
Interim dividends approved by RCA on 09/18/2019 |
(412,659) | |
|
- Proposed dividends |
|
(12,244) |
|
Intended for statutory reserve of working capital |
(1,276,919) | |
|
|
|
(1,791,276) |
|
Weighted average number of shares |
|
1,380,114,547 |
|
Dividends per share |
0.307875 | |
|
|
|
|
|
In current liabilities |
||
|
Dividends to be paid on December 31, 2018 |
|
900,541 |
|
Interim dividends approved on 09/18/2019 |
412,659 | |
|
Proposed dividends |
|
12,244 |
|
Dividends and interest on equity prescribed |
(2,209) | |
|
Dividends paid in the exercise |
|
(1,309,983) |
|
Dividends to be paid on December 31, 2019 |
13,252 |
At the Annual General Meeting held on April 26, 2019, the payment of the minimum mandatory dividend for the year 2018 was approved, amounting to R$898,332, corresponding to R$ 0.650910577222 per share. Dividends were paid as of May 29, 2019, without monetary adjustment, according Notice to Shareholders disclosed on May 27, 2019.
The Board of Directors' Meeting held on September 18, 2019 approved the distribution of interim dividends based on the profits earned on the balance sheet as of June 30, 2019 in the amount of R$ 412,659, corresponding to R$ 0.299003394462 per share. Dividends were paid as of September 30, 2019, without monetary adjustment, according Notice to Shareholders disclosed on the date of approval.
In accordance with the Company's Bylaws on December 31, 2019, the Company reverted to the retained earning accounts, the amount of R$ 1,874 and R$ 335, related to dividends and interest on equity prescribed, respectively, which will be submitted to the resolution of the Annual General Meeting.
FS-76
|
|
In 2019, the distributions of dividends and interest on equity were approved as follows:
|
Consolidated | |
|
Dividend |
1,856,297 |
|
Interest on equity |
65,020 |
|
|
1,921,317 |
In 2019, dividends and interest on equity were paid as follows:
|
Dividend |
|
Interest on equity |
|
TOTAL | |
|
Controlling shareholders |
1,309,983 |
|
|
|
1,309,983 |
|
Non-controlling shareholders (*) |
545,306 |
|
65,020 |
|
610,326 |
|
|
1,855,289 |
|
65,020 |
|
1,920,309 |
(*) Refers to dividends and interest on equity distributed to minority shareholders of CSN Mineração.
21 NET SALES REVENUE
Net sales revenue is comprised as follows:
|
Consolidated | |||||
|
12/31/2019 |
|
12/31/2018 |
12/31/2017 | ||
|
|
|
|
| ||
|
Gross revenue |
|
|
|
|
|
|
Domestic market |
|
14,220,420 |
14,752,901 |
11,487,011 | |
|
Foreign market |
|
14,663,297 |
11,817,559 |
9,980,572 | |
|
|
|
28,883,717 |
26,570,460 |
21,467,583 | |
|
Deductions |
|
|
|
| |
|
Canceled sales, discounts and rebates |
|
(325,794) |
(234,851) |
(262,989) | |
|
Taxes on sales |
|
(3,121,506) |
(3,366,724) |
(2,679,993) | |
|
|
|
(3,447,300) |
(3,601,575) |
(2,942,982) | |
|
Net revenue |
|
25,436,417 |
22,968,885 |
18,524,601 | |
22 EXPENSES BY NATURE
|
|
Consolidated | ||||
|
12/31/2019 |
12/31/2018 |
12/31/2017 | |||
|
Raw materials and inputs |
|
(7,287,933) |
(6,759,275) |
(5,404,801) | |
|
Labor cost |
(2,807,280) |
(2,743,460) |
(2,400,579) | ||
|
Supplies |
|
(1,981,547) |
(1,782,576) |
(1,451,437) | |
|
Maintenance cost (services and materials) |
(1,340,135) |
(1,326,894) |
(1,145,974) | ||
|
Outsourcing services |
|
(2,392,626) |
(2,368,387) |
(2,040,057) | |
|
Freights |
|
(334,509) |
(109,756) |
(106,026) | |
|
Distribution Freights |
|
(1,787,979) |
|
(1,692,785) |
(1,278,356) |
|
Depreciation, Amortization and depletion (Note 10 and 11) (Note 26) |
(1,421,704) |
|
(1.175.107) |
(1,408,765) | |
|
Others |
|
(763,421) |
(905,128) |
(591,094) | |
|
(20,117,134) |
(18,863,368) |
(15,827,089) | |||
|
Classified as: |
|
|
|
| |
|
Cost of sales |
(17,263,264) |
(16,105,657) |
(13,596,141) | ||
|
Selling expenses |
|
(2,342,805) |
(2,263,688) |
(1,815,107) | |
|
General and administrative expenses |
(511,065) |
(494,023) |
(415,841) | ||
|
|
|
(20,117,134) |
(18,863,368) |
(15,827,089) | |
FS-77
|
|
The depreciation, amortization and depletion additions for the year were distributed as follows:
|
|
ConsColi Consolidated | ||||
|
|
12/31/2019 |
|
12/31/2018 |
|
12/31/2017 |
|
|
|
|
|
|
|
|
Production costs (1) |
1,385,306 |
|
1,145,793 |
|
1,376,862 |
|
Sales expenses |
11,539 |
|
5,850 |
|
8,851 |
|
General and Administrative Expenses |
24,859 |
|
23,464 |
|
23,052 |
|
|
1,421,704 |
|
1,175,107 |
|
1,408,765 |
|
Other operating expenses (2) |
97,627 |
|
97,914 |
|
44,570 |
|
|
1,519,331 |
|
1,273,021 |
|
1,453,335 |
(1) The Production Cost includes depreciation related to PIS and COFINS credits on Lease contracts, in line with the guidelines set out in Circular Letter CVM / SNC / SEP 02/2019;
(2) Refers mainly to depreciation and amortization of paralyzed assets as described in note 23.
23 OTHER OPERATING INCOME (EXPENSES)
|
Consolidated | ||||||
|
12/31/2019 |
|
12/31/2018 |
12/31/2017 | |||
|
Other operating income |
|
|
|
|
|
|
|
Indemnities |
56,180 |
|
46,256 |
|
6,106 | |
|
Rentals and leases |
|
9,462 |
|
5,430 |
|
1,841 |
|
Dividends received |
32,747 |
|
9,188 |
|
3,248 | |
|
PIS and COFINS to compensate (1) |
|
123,677 |
|
1,102,365 |
|
|
|
Contractual fines |
|
4,486 |
|
3,965 |
|
2,970 |
|
Actuarial pension plan |
|
47,151 |
|
20,983 |
|
36,952 |
|
Updated shares – Fair Value through profit or loss (VJR) (Note 12II) |
|
|
|
1,655,813 |
|
|
|
Contractual agreement (2) |
|
131,817 |
|
|
|
|
|
Eletrobrás's compulsory loan (4) |
|
|
|
|
755,151 | |
|
Gain on sale of LLC |
|
|
|
1,164,294 |
|
|
|
Other revenues |
98,250 |
|
27,749 |
|
18,018 | |
|
|
|
503,770 |
|
4,036,043 |
|
824,286 |
|
|
|
|
|
| ||
|
Other operating expenses |
|
|
|
|
| |
|
Taxes and fees |
|
(95,873) |
|
(26,197) |
|
(136,348) |
|
Write-off/(Provision) of judicial deposits |
(19,685) |
|
(113,549) |
|
(134,002) | |
|
Expenses with environmental liabilities, net |
|
(82,669) |
(60,311) |
|
(7,156) | |
|
Contractual fines |
(106,926) |
|
(104,086) |
| ||
|
Depreciation of equipment paralyzed and amortization of intangible assets (note 22) |
(97,627) |
|
(97,914) |
|
(44,570) | |
|
Write- off of PP&E and intangible assets (note 9) |
|
(114,603) |
|
(27,260) |
|
(28,127) |
|
Estimated (Loss)/reversal in inventories |
(136,827) |
|
(149,704) |
|
(15,775) | |
|
Idleness in stocks and paralyzed equipment (3) |
|
(546,968) |
|
|
|
|
|
Studies and project engineering expenses |
(26,171) |
|
(33,738) |
|
(32,956) | |
|
Research and development expenses |
|
(1,741) |
|
(2,688) |
|
(3,944) |
|
Advisory expenses |
|
|
(508) |
|
(3,419) | |
|
Healthcare plan expenses |
|
(119,560) |
|
(108,369) |
|
(97,837) |
|
Reversal/(Provision) industrial reestructuring |
|
|
(17,490) |
|
5,807 | |
|
Cash flow hedge realized (Note 12 b) |
|
(790,353) |
|
(370,191) |
|
(92,140) |
|
Updated shares – Fair value through profit or loss (Note 12II) |
|
(118,780) |
|
|
|
|
|
Other expenses |
(149,068) |
|
(218,701) |
|
(56,477) | |
|
|
(2,406,851) |
|
(1,330,706) |
|
(646,944) | |
|
Other operating income (expenses), net |
|
(1,903,081) |
|
2,705,337 |
|
177,342 |
(1) Refers to non-inclusion of ICMS in the PIS and COFINS calculation basis.
(2) Referring to the contractual agreement signed for the supply of new equipment;
(3) Idleness in stocks: Due to the reforms in blast furnace 3, there was unused capacity in which the volume of production was below normal.
(4) This is a net amount, certain and due, arising from the final judicial decision favorable to the Company, which is irreversible and irrevocable, in order to apply the STJ's consolidated position on the subject, which culminated in sentencing the Eletrobrás to the payment of the correct interest and monetary correction of the Compulsory Loan. The final judicial decision, as well as the certainty about the amounts involved in the settlement of the judgment (judicial procedure to request the satisfaction of the right), allowed the conclusion that the right to receive this value is certain. Thus, in line with our legal and accounting advisors, we recognize the credits in noncurrent assets against the result of Other Operating Revenues. The monetary adjustment 2018 is presented in the note 25 - Financial Income (Expenses).
FS-78
|
|
24 FINANCIAL INCOME (EXPENSES)
|
|
|
Consolidated | ||||
|
12/31/2019 |
12/31/2018 |
|
12/31/2017 | |||
|
|
| |||||
|
Financial income |
|
|
|
|
|
|
|
Related parties (note 18 b) |
79,228 |
64,888 |
|
61,549 | ||
|
Income from financial investments |
|
93,471 |
111,235 |
|
162,292 | |
|
Gain from derivative |
|
|
|
28,503 | ||
|
Other income (1) |
|
206,343 |
1,134,391 |
|
42,730 | |
|
|
|
379,042 |
1,310,514 |
|
295,074 | |
|
Financial expenses |
|
|
| |||
|
Borrowings and financing - foreign currency |
|
(1,128,520) |
(988,821) |
|
(827,841) | |
|
Borrowings and financing - local currency |
|
(867,785) |
(1,020,867) |
|
(1,610,714) | |
|
Related parties |
|
|
(16,092) |
|
| |
|
Leases |
|
(49,118) |
|
|
|
|
|
Capitalized interest (notes 9 and 29) |
|
117,189 |
71,611 |
|
91,957 | |
|
Interest, fines and late payment charges |
|
(104,357) |
(71,100) |
|
(72,343) | |
|
Commission and bank fees |
|
(217,784) |
(182,179) |
|
(159,088) | |
|
PIS/COFINS over financial income |
|
(25,176) |
(84,404) |
|
(21,926) | |
|
Insuranre garantee |
|
(29,191) |
|
|
|
|
|
Other financial expenses |
|
(258,049) |
19,614 |
|
(142,296) | |
|
|
|
(2,562,791) |
(2,272,238) |
|
(2,742,251) | |
|
Inflation adjustment and exchange differences, net |
|
|
| |||
|
Inflation adjustments, net |
|
85,451 |
(1,035) |
|
(10,556) | |
|
Exchange rates, net |
|
(37,872) |
(532,883) |
|
(5,665) | |
|
Exchange gain (losses) on derivatives |
|
4,986 |
(1) |
|
(229) | |
|
|
|
52,565 |
(533,919) |
|
(16,450) | |
|
|
|
|
|
|
| |
|
Financial income (expenses), net |
|
(2,131,184) |
(1,495,643) |
|
(2,463,627) | |
|
|
|
|
| |||
|
Statement of gains and (losses) on derivative transactions |
|
|
| |||
|
Dollar - to - euro swap |
|
783 |
|
(1) |
|
(229) |
|
CDI x Dollar swap (note 12) |
|
4,203 |
|
|
|
|
|
|
|
4,203 |
(1) |
|
(229) | |
|
Future DI |
|
|
|
|
28,503 | |
|
|
|
|
|
|
28,503 | |
|
|
|
4,986 |
(1) |
|
28,274 | |
FS-79
|
|
25 SEGMENT INFORMATION
According to the Group´s structure, the businesses are distributed and managed in five operating segments as follows:
· Steel
The Steel Segment consolidates all the operations related to the production, distribution and sale of flat steel, long steel, metallic containers and galvanized steel, with operations in Brazil, United States, Portugal and Germany. The Segment supplies the following markets: construction, steel containers for the Brazilian chemical and food industries, home appliances, automobile and OEM (motors and compressors). The Company’s steel units produce hot and cold rolled steel, galvanized and pre-painted steel of great durability. They also produce tinplate, a raw material used to produce metallic containers.
Overseas, Lusosider, which is based in Portugal, produces cold rolled steel and galvanized steel. CSN LLC in the U.S.A. meets local market needs, import and export of steel products. In January 2012, CSN acquired Stahlwerk Thüringen (SWT), a manufacturer of long steel located in Unterwellenborn, Germany. SWT is specialized in the production of shapes used for construction.
In January 2014 the production of long steel products started in Brazil and consolidates the company as a source of complete construction solutions, complementing its portfolio of products with high value added in the steel chain.
· Mining
This segment encompasses the activities of iron ore and tin mining.
The high-quality iron ore operations are located in the Iron Quadrilateral in Minas Gerais, which has its own mines and sells third party iron ore.
FS-80
|
|
At the end of 2015, CSN and the Asian Consortium formalized a shareholders' agreement for the combination of assets linked to iron ore operations and the related logistics structure, forming a new company that has focused in mining of the Group activities from December 2015. In this context, the new company, currently named CSN Mineração S.A., holds the TECAR arraignment, the Casa de Pedra mine and all the shares of Namisa, which was incorporated on December 31, 2015. CSN still owns 100% of Minérios Nacional which includes the mines of Fernandinho (operational), Cayman and Pedras Pretas (mineral resources), all located in Minas Gerais.
Moreover, CSN controls the Estanho de Rondônia S.A., company with mining units and tin casting, in the state of Rondonia.
· Logistics
i. Railroad
CSN has equity interests in three railroad companies: MRS Logística, which manages the former Southeast Network of Rede Ferroviária Federal S.A. (RFFSA), Transnordestina Logística S.A. and FTL - Ferrovia Transnordestina Logística S.A., which has the concession to operate the former Northeast Network of the RFFSA in the states of Maranhão, Piauí, Ceará, Rio Grande do Norte, Paraíba, Pernambuco and Alagoas.
a) MRS
The railroad transportation services provided by MRS are fundamental to the supply of raw materials and the shipment of final products. The total amount of iron ore, coal and coke consumed by the Presidente Vargas Mill as well as part of the steel produced by CSN for the domestic market and for export are carried by MRS.
The Southeast Brazilian railroad system, encompassing 1,674 kilometers of tracks, serves the tri-state industrial area of São Paulo-Rio de Janeiro-Minas Gerais, in the southeast region, linking the mines located in Minas Gerais to the ports located in São Paulo and Rio de Janeiro, and the steel mills of CSN, Companhia Siderúrgica Paulista, or Cosipa, and Gerdau Açominas. Besides serving other customers, the railroad system carries iron ore from the Company’s mines in Casa de Pedra, Minas Gerais, and coke and coal from the Itaguaí Port, in Rio de Janeiro, to Volta Redonda, and carries CSN’s export products to the ports of Itaguaí and Rio de Janeiro.
b) TLSA and FTL
TLSA and FTL hold the concession of the former RFFSA’s Northeast Network. The Northeast Network totals 4,238 km, divided into two sections: i) Network I, which comprises the São Luiz–Mucuripe, Arrojado–Recife, Itabaiana–Cabedelo, Paula Cavalcante–Macau and Propriá–Jorge Lins (Network I); and ii) Network II, which comprises the sections of Missão Velha–Salgueiro, Salgueiro, Salgueiro –Trindade, Trindade– Eliseu Martins, Salgueiro–Porto de Suape and Missão Velha–Porto de Pecém.
In addition, it connects to the main ports in the region, thereby offering an important competitive advantage through opportunities for combined transport solutions and logistics projects tailored to customer needs.
II. Port Logistics
The Port Logistics Segment consolidates the operation of the terminal built in the privatization period after the law of modernization of the ports (law 8.630/1993) that permits to transfer the port logistics activities to the private sector. The Sepetiba terminal features complete infrastructure to meet all the needs of exporters, importers and ship owners. Its installed capacity exceeds that of most other Brazilian terminals. It has mooring berths and a huge storage area, as well as the most modern and appropriate equipment, systems and intermodal connections.
The Company’s constant investment in projects in the terminals consolidates the Itaguaí Port Complex as one of the most modern in Brazil.
FS-81
|
|
· Energy
CSN is one of the largest industrial consumers of electric power in Brazil. As energy is fundamental in its production process, the Company invests in assets for generation of electric power to guarantee its self-sufficiency. These assets are as follows: Itá hydroelectric power plant, in the State of Santa Catarina, with rated capacity of 1,450 MW, where CSN has a share of 29.5%; Igarapava hydroelectric power plant, Minas Gerais, with rated capacity of 210 MW, in which CSN holds 17.9% of the capital; and a thermoelectric co-generation Central unit with rated capacity of 238 MW, which has been operating at the UPV since 1999, that uses the residual gases produced by the steel mill itself.
· Cement
The cement division consolidates the cement production, distribution and sale operations, which use the slag produced by the Volta Redonda plant’s blast furnaces.
The Company produces clinker in Arcos/MG, using limestone from own mine and also two cement mills in additions to the mills that already operate in Volta Redonda/RJ.
The information presented to Management regarding the performance of each business segment is generally derived directly from the accounting records, combined with some intercompany allocations.
· Sales by geographic area
Sales by geographic area are determined based on the customers’ location. On a consolidated basis, domestic sales are represented by revenues from customers located in Brazil and export sales are represented by revenues from customers located abroad.
· Result by segment
Beginning 2013, the Company no longer proportionately consolidates joint ventures MRS and CBSI. For segment information preparation and presentation purposes, Management decided to maintain the proportionate consolidation of the joint ventures, as historically presented. For consolidated profit reconciliation purposes, the amounts of these companies were eliminated in the column “Corporate expenses/elimination”.
|
|
|
|
|
|
|
|
|
|
|
|
|
|
|
|
|
12/31/2019 |
|
P&L |
Steel |
Mining |
Logistics |
|
Energy |
Cement |
Corporate expenses/elimination |
Consolidated | ||||||||
|
Port |
|
Railroads |
||||||||||||||
|
Metric tons (thou.) (*) |
|
4,524,805 |
|
38,545,067 |
|
|
|
|
|
|
|
|
|
(3,258,923) |
|
|
|
Net revenues |
||||||||||||||||
|
Domestic market |
|
10,027,999 |
|
926,836 |
|
240,451 |
|
1,321,355 |
|
325,343 |
|
570,805 |
|
(2,462,088) |
|
10,950,701 |
|
Foreign market |
3,921,033 |
9,100,813 |
1,463,870 |
14,485,716 | ||||||||||||
|
Total net revenue (note 21) |
|
13,949,032 |
|
10,027,649 |
|
240,451 |
|
1,321,355 |
|
325,343 |
|
570,805 |
|
(998,218) |
|
25,436,417 |
|
Cost of sales and services |
(12,962,861) |
(4,396,247) |
(173,344) |
(1,030,210) |
(266,754) |
(607,719) |
2,173,871 |
(17,263,264) | ||||||||
|
Gross profit |
|
986,171 |
|
5,631,402 |
|
67,107 |
|
291,145 |
|
58,589 |
|
(36,914) |
|
1,175,653 |
|
8,173,153 |
|
General and administrative expenses |
(834,977) |
(186,189) |
(34,560) |
(109,770) |
(29,034) |
(91,466) |
(1,567,874) |
(2,853,870) | ||||||||
|
Depreciation (note 22) |
|
700,074 |
|
476,374 |
|
30,568 |
|
387,565 |
|
17,471 |
|
139,667 |
|
(330,015) |
|
1,421,704 |
|
Proportionate EBITDA of joint ventures |
510,072 |
510,072 | ||||||||||||||
|
Adjusted EBITDA |
|
851,268 |
|
5,921,587 |
|
63,115 |
|
568,940 |
|
47,026 |
|
11,287 |
|
(212,164) |
|
7,251,059 |
|
Sales by geographic area |
|
|
|
|
|
|
|
| ||||||||
|
Asia |
|
2,980 |
|
6,742,946 |
|
|
|
|
|
|
|
|
|
1,463,870 |
|
8,209,796 |
|
North America |
767,977 |
767,977 | ||||||||||||||
|
Latin America |
|
169,036 |
|
|
|
|
|
|
|
|
|
|
|
|
|
169,036 |
|
Europe |
2,978,994 |
2,357,867 |
5,336,861 | |||||||||||||
|
Others |
|
2,046 |
|
|
|
|
|
|
|
|
|
|
|
|
|
2,046 |
|
Foreign market |
3,921,033 |
9,100,813 |
|
|
|
|
1,463,870 |
14,485,716 | ||||||||
|
Domestic market |
|
10,027,999 |
|
926,836 |
|
240,451 |
|
1,321,355 |
|
325,343 |
|
570,805 |
|
(2,462,088) |
|
10,950,701 |
|
Total |
13,949,032 |
10,027,649 |
240,451 |
1,321,355 |
325,343 |
570,805 |
(998,218) |
25,436,417 |
FS-82
|
|
|
|
|
|
|
|
|
|
|
|
|
|
|
|
|
12/31/2018 | ||
|
P&L |
Steel |
Mining |
Logistics |
|
Energy |
Cement |
Corporate expenses/elimination |
Consolidated | ||||||||
|
Port |
|
Railroads |
||||||||||||||
|
Metric tons (thou.) (*) |
|
5,068,758 |
|
34,780,756 |
|
|
|
|
|
|
|
|
|
(4,961,345) |
|
|
|
Net revenues |
| |||||||||||||||
|
Domestic market |
|
10,328,372 |
|
972,360 |
|
266,378 |
|
1,506,114 |
|
410,606 |
|
588,230 |
|
(2,718,623) |
|
11,353,437 |
|
Foreign market |
5,305,771 |
5,012,421 |
1,297,256 |
11,615,448 | ||||||||||||
|
Total net revenue (note 21) |
|
15,634,143 |
|
5,984,781 |
|
266,378 |
|
1,506,114 |
|
410,606 |
|
588,230 |
|
(1,421,367) |
|
22,968,885 |
|
Cost of sales and services |
(12,613,216) |
(3,585,691) |
(189,999) |
(1,049,071) |
(286,734) |
(544,266) |
2,163,320 |
(16,105,657) | ||||||||
|
Gross profit |
|
3,020,927 |
|
2,399,090 |
|
76,379 |
|
457,043 |
|
123,872 |
|
43,964 |
|
741,953 |
|
6,863,228 |
|
General and administrative expenses |
(984,980) |
(144,754) |
(35,423) |
(106,412) |
(27,948) |
(95,893) |
(1,362,301) |
(2,757,711) | ||||||||
|
Depreciation (note 22) |
|
609,274 |
|
366,547 |
|
20,368 |
|
258,985 |
|
17,285 |
|
115,411 |
|
(212,763) |
|
1,175,107 |
|
Proportionate EBITDA of joint ventures |
568,045 |
568,045 | ||||||||||||||
|
Adjusted EBITDA |
|
2,645,221 |
|
2,620,883 |
|
61,324 |
|
609,616 |
|
113,209 |
|
63,482 |
|
(265,066) |
|
5,848,669 |
|
Sales by geographic area |
|
|
|
|
|
|
|
| ||||||||
|
Asia |
|
40,681 |
|
4,422,377 |
|
|
|
|
|
|
|
|
|
1,297,256 |
|
5,760,314 |
|
North America |
1,506,041 |
1,506,041 | ||||||||||||||
|
Latin America |
|
369,830 |
|
|
|
|
|
|
|
|
|
|
|
|
|
369,830 |
|
Europe |
3,330,991 |
590,044 |
3,921,035 | |||||||||||||
|
Others |
|
58,228 |
|
|
|
|
|
|
|
|
|
|
|
|
|
58,228 |
|
Foreign market |
5,305,771 |
5,012,421 |
|
|
|
|
1,297,256 |
11,615,448 | ||||||||
|
Domestic market |
|
10,328,372 |
|
972,360 |
|
266,378 |
|
1,506,114 |
|
410,606 |
|
588,230 |
|
(2,718,623) |
|
11,353,437 |
|
Total |
15,634,143 |
5,984,781 |
266,378 |
1,506,114 |
410,606 |
588,230 |
(1,421,367) |
22,968,885 |
|
|
|
|
|
|
|
|
|
|
|
|
|
|
|
12/31/2017 | ||
|
Steel |
Mining |
Logistics |
|
Energy |
Cement |
Corporate expenses/elimination |
Consolidated | |||||||||
|
Port |
|
Railroads |
||||||||||||||
|
Metric tons (thou.) (*) |
|
4,921,719 |
|
32,576,843 |
|
|
|
|
|
|
|
(5,359,571) |
|
|||
|
Net revenues |
|
|
|
|
|
|
|
| ||||||||
|
Domestic market |
|
7,818,552 |
|
829,268 |
|
238,240 |
|
1,416,612 |
|
407,671 |
|
487,129 |
|
(2,491,006) |
|
8,706,466 |
|
Foreign market |
5,140,471 |
3,791,703 |
|
|
885,961 |
9,818,135 | ||||||||||
|
Total net revenue (note 21) |
|
12,959,023 |
|
4,620,971 |
|
238,240 |
|
1,416,612 |
|
407,671 |
|
487,129 |
|
(1,605,045) |
|
18,524,601 |
|
Cost of sales and services |
(10,537,547) |
(3,005,840) |
(156,997) |
(1,024,696) |
(285,085) |
(512,762) |
1,926,786 |
(13,596,141) | ||||||||
|
Gross profit |
|
2,421,476 |
|
1,615,131 |
|
81,243 |
|
391,916 |
|
122,586 |
|
(25,633) |
|
321,741 |
|
4,928,460 |
|
General and administrative expenses |
(963,822) |
(158,958) |
(27,943) |
(94,921) |
(27,098) |
(80,823) |
(877,383) |
(2,230,948) | ||||||||
|
Depreciation (note 22) |
|
658,587 |
|
490,805 |
|
15,752 |
|
294,571 |
|
17,265 |
|
121,801 |
|
(190,016) |
|
1,408,765 |
|
Proportionate EBITDA of joint ventures |
|
|
538,170 |
538,170 | ||||||||||||
|
Adjusted EBITDA |
|
2,116,241 |
|
1,946,978 |
|
69,052 |
|
591,566 |
|
112,753 |
|
15,345 |
|
(207,488) |
|
4,644,447 |
|
Sales by geographic area |
|
|
|
|
|
|
|
| ||||||||
|
Asia |
|
23,364 |
|
3,592,226 |
|
|
|
|
|
|
|
885,961 |
|
4,501,551 | ||
|
North America |
2,009,337 |
|
|
|
2,009,337 | |||||||||||
|
Latin America |
|
506,951 |
|
|
|
|
|
|
|
|
|
|
506,951 | |||
|
Europe |
2,564,823 |
197,701 |
|
|
|
2,762,524 | ||||||||||
|
Others |
|
35,996 |
|
1,776 |
|
|
|
|
|
|
|
|
|
37,772 | ||
|
Foreign market |
5,140,471 |
3,791,703 |
|
|
|
|
885,961 |
9,818,135 | ||||||||
|
Domestic market |
|
7,818,552 |
|
829,268 |
|
238,240 |
|
1,416,612 |
|
407,671 |
|
487,129 |
|
(2,491,006) |
|
8,706,466 |
|
Total |
12,959,023 |
4,620,971 |
238,240 |
1,416,612 |
407,671 |
487,129 |
(1,605,045) |
18,524,601 |
(*) The ore sales volumes presented in this note take into consideration Company sales and the interest in its subsidiaries and joint ventures.
· Adjusted EBITDA
Adjusted EBITDA is the main measurement based on which the chief operating decision maker assesses the segment performance and the capacity to generate recurring operating cash, consisting of profit for the year less net financial income (expenses), income tax and social contribution, depreciation and amortization, equity in results of affiliated companies, results of discontinued operations and other operating income (expenses), plus the proportionate EBITDA of joint ventures.
Even though it is an indicator used in segment performance measurement, EBITDA is not a measurement recognized by accounting practices adopted in Brazil or IFRS, it does not have a standard definition, and may not be comparable with measurements using similar names provided by other entities.
As required by IFRS 8, the table below shows the reconciliation of the measurement used by the chief operating decision maker with the results determined using the accounting practices:
|
12/31/2019 |
|
12/31/2018 |
|
12/31/2017 | ||
|
|
|
| ||||
|
Net income / (loss) for the year |
|
2,244,511 |
5,200,583 |
|
111,229 | |
|
Depreciation / amortization / depletion (note 22) |
1,421,704 |
1,175,107 |
|
1,408,765 | ||
|
Income tax and social contribution (note 14) |
|
(833,778) |
250,334 |
|
409,109 | |
|
Financial income / (expenses) (note 24) |
2,131,184 |
1,495,643 |
|
2,463,627 | ||
|
EBITDA |
|
4,963,621 |
8,121,667 |
|
4,392,730 | |
|
Other operating (income) / expenses (note 23) |
1,903,081 |
(2,705,337) |
|
(177,342) | ||
|
Equity in results of affiliated companies (note 8b) |
|
(125,715) |
(135,706) |
|
(109,111) | |
|
Proportionate EBITDA of joint ventures |
510,072 |
568,045 |
|
538,170 | ||
|
Adjusted EBITDA (*) |
|
7,251,059 |
5,848,669 |
|
4,644,447 |
FS-83
|
|
26 EMPLOYEE BENEFITS
The pension plans granted by the Company cover substantially all employees. The plans are administered by Caixa Beneficente dos Empregados da CSN (‘CBS”), a private non-profit pension fund established in July 1960 which has as members the employees (and former employees) of the Company and some subsidiaries who joined the fund through an agreement, and the employees of CBS itself. The Executive Officers of CBS is formed by a CEO and two other executive officers, all appointed by CSN, which is the main sponsor of CBS. The Decision-Making Board is the higher decision-making and guideline-setting body of CBS, composed by the president and ten members, six chosen by CSN, and four elected by the fund’s participants.
Until December 1995, CBS Previdência administered two defined benefit plans based on years of service, salary and Social Security benefits. On December 27, 1995 the then Private Pension Secretariat (“SPC”) approved the implementation of a new benefit plan, effective beginning that date, called Mixed Supplementary Benefit Plan (‘Mixed Plan”), structured in the form of a variable contribution plan that was discontinued on September 16, 2013. As of that date, all new employees must join the CBSPrev Plan, structured in the defined contribution modality, created also in September 2013.
As of December 31, 2019, CBS had 35,547 participants (34,985 as of December 31, 2018), of whom 22,091 were active contributors (20,872 as of December 31, 2018), 13,139 were retired employees (13,454 as of December 31, 2018), and 317 were related beneficiaries (659 as of December 31, 2018). Out of the total participants as of December 31, 2019, 10,616 (11,063 as of December 31,2018) belonged to the defined benefit plan, 11,111 (11.845 as of December 31,2018) to the mixed plan, 841 (1,028 as of December 31, 2018) to the CBSPrev Namisa plan, and 12,979 (11,049 as of December 31, 2018) to the CBSPrev plan.
The plan assets of CBS are primarily invested in repurchase agreements (backed by federal government securities), federal government securities indexed to inflation, shares, loans and real estate. As of December 31, 2019, CBS held 1,870,652 common shares of CSN (37,084,031 as of December 31,2018). The total plan assets of the entity amounted to R$5.5 billion as of December 31, 2019 (R$5.3 billion as of December 31, 2018). The administrators of the CBS to match plan assets with benefit obligations payable on a long-term basis. Pension funds in Brazil are subject to certain restrictions regarding their capacity for investment in foreign assets and, therefore, these funds invest mainly in Brazilian securities.
Plan Assets are all available assets and the benefit plans’ investments, not including the amounts of debts to sponsors.
For the defined benefit plans, called “35% of the average salary” and “average salary supplementation plan”, the Company holds a financial guarantee with CBS Previdência, the entity that administers said plans, to ensure their financial and actuarial balance, in the event of any future actuarial loss or actuarial gain.
As provided for in the prevailing law that governs the pension fund market, for the last 4 years ended (2016, 2017, 2018 and 2019), CSN did not have to pay the installments because the defined benefit plans posted actuarial gains for the period.
FS-84
|
|
26.a) Description of the pension plans
Plan covering 35% of the average salary
This plan began on February 1, 1966 and is a defined benefit plan aimed at paying pensions (for length of service, special situations, disability or old age) on a lifetime basis, equivalent to 35% of the adjusted average of the participant’s salary for the last 12 months. The plan also guarantees the payment of sickness benefit to the participants licenced by the Official Social Security and guarantees the payments of savings fund, funeral allowance and pecuniary aid. This plan was discontinued on October 31, 1977 when took effect the average salary supplementation plan.
Average salary supplementation plan
This plan began on November 1, 1977 and is a defined benefit plan aimed at complementing the difference between the adjusted average of the participant’s salary for the last 12 months and the Official Social Security benefit for retirement, also on a lifetime basis. As in the 35% plan, there is coverage for the payment of sickness benefit, death and pension. This plan was discontinued on December 26, 1995 with the creation of the mixed supplementary benefit plan.
Mixed supplementary benefit plan
This plan began on December 27, 1995 and is a variable contribution plan. Besides the scheduled retirement benefit, it also covers the payment of risk benefits (pension paid while the participant is still working, disability compensation and sick/accident pay). Under this plan, the retirement benefit is calculated based on the amount accumulated by the monthly contributions of the participants and sponsors, as well as on each participant’s option for the manner in which they receive them, which can be lifetime (with or without continuity of pension for death) or through a percentage applied to the balance of the benefit-generating fund (loss for indefinite period). After retirement is granted, the plan takes on the characteristics of a defined benefit plan if the participant has chosen to receive his benefit in the form of monthly income for life. This plan was discontinued on September 16, 2013 when the CBS Prev plan became effective.
CBS Prev Plan
The new CBS Prev Plan, which is a defined contribution plan, started on September 16, 2013. Under this plan, the retirement benefit is determined based on the accumulated amount by monthly contributions of participants and sponsors. To receive the benefit, each participant can opt for: (a) receiving part in cash (up to 25%) and the remaining balance through a monthly income through a percentage applied to the benefit-generating fund, not being applicable to death pension benefits, or (b) receive only a monthly income through a percentage applied to the benefit-generating fund.
With the creation of the CBS Prev Plan, the mixed supplementary benefit plan was discontinued for the entry of new participants as from September 16, 2013.
CBSPREV Namisa Plan
It is a Defined Contribution plan with benefits of risks during the activity (projection of the balances in case of disability or death and sickness / accident allowanced). It has been in operation since January 6, 2012, when it was created exclusively for the employees of Nacional Minérios S.A. After the corporate reorganization, which took place in 2016, other Sponsors joined this Plan, among them CSN Mineração S.A.
Under this plan, all the benefits offered are calculated based on the accumulated amount from the monthly contributions of participants and sponsors and are paid through a percentage applied to the balance of the benefit generating fund. The CBSPREV Namisa Plan has been closed to new participants since July 2017 and is in the process of being extinguished due to the total withdrawal of sponsorship.
26.b) Investment policy
The investment policy establishes the principles and guidelines that will govern the investments of funds entrusted to the entity, in order to foster the security, liquidity and profitability required to ensure equilibrium between the plan’s assets and liabilities based on an ALM (Asset Liability Management) study that takes into consideration the benefits of participants and beneficiaries for each plan.
FS-85
|
|
The investment plan is reviewed annually and approved by the Decision-Making Board considering a five-year horizon, as established by resolution CGPC 7 of December 4, 2003. The investment limits and criteria established in the policy are based on Resolution 3,792/09 published by the National Monetary Council (“CMN”).
26.c) Employee benefits
The actuarial calculations are updated at the end of each annual reporting period by outside actuaries and presented in the financial statements pursuant to IAS19 - Employee Benefits.
|
Consolidated | |||||||
|
12/31/2019 |
12/31/2018 |
12/31/2019 |
12/31/2018 | ||||
|
Actuarial asset |
Actuarial liabilities | ||||||
|
Benefits of pension plans |
(13,714) |
(99,894) |
19,788 |
7,982 | |||
|
Post-employment healthcare benefits |
892,396 |
897,137 | |||||
|
(13,714) |
(99,894) |
912,184 |
905,119 | ||||
The reconciliation of employee benefits’ assets and liabilities is as follows:
|
12/31/2019 |
12/31/2018 | ||
|
Present value of defined benefit obligation |
3,581,460 |
3,087,433 | |
|
Fair value of plan assets |
(3,894,488) |
(3,403,906) | |
|
Deficit(Surplus) |
(313,028) |
(316,473) | |
|
Restriction to actuarial assets due to recovery limitation |
319,102 |
224,561 | |
|
Liabilities (Assets), net |
6,074 |
(91,912) | |
|
Liabilities |
19,788 |
7,982 | |
|
Assets |
(13,714) |
(99,894) | |
|
Net (assets) recognized in the balance sheet |
6,074 |
(91,912) |
The movement in the present value of the defined benefit obligation during 2019 is as follows:
|
12/31/2019 |
12/31/2018 | ||
|
Present value of obligations at the beginning of the year |
3,087,433 |
3,077,849 | |
|
Cost of service |
1,093 |
1,169 | |
|
Interest cost |
283,487 |
304,132 | |
|
Participant contributions made in the period |
2,126 |
|
|
|
Benefits paid |
(269,995) |
(280,493) | |
|
Actuarial loss/(gain) |
477,316 |
(15,224) | |
|
Present value of obligations at the end of the year |
3,581,460 |
3,087,433 |
FS-86
|
|
The movement in the fair value of the plan assets during 2019 is as follows:
|
12/31/2019 |
12/31/2018 | ||
|
Fair value of plan assets at the beginning of the year |
(3,403,906) |
(3,305,356) | |
|
Interest income |
(314,102) |
(327,830) | |
|
Benefits Paid |
269,995 |
280,493 | |
|
Participant contributions made in the period |
(2,127) |
|
|
|
Return on plan assets (less interest income) |
(444,348) |
(51,213) | |
|
Fair value of plan assets at the end of the year |
(3,894,488) |
(3,403,906) |
The amounts recognized in the income statement for the year ended December 31, 2019, 2018 and 2017 are comprised as follows:
|
12/31/2019 |
12/31/2018 |
|
12/31/2017 | ||
|
Cost of current service |
1,093 |
1,169 |
|
1,285 | |
|
Interest cost |
283,487 |
304,132 |
|
322,359 | |
|
Expected return on plan assets |
(314,102) |
(327,830) |
|
(360,013) | |
|
Interest on the asset ceiling effect |
21,502 |
16,340 |
|
26,843 | |
|
otal costs / (income), net |
(8,020) |
(6,189) |
|
(9,526) |
The cost/(income) is recognized in the income statement in other operating expenses.
The movement in the actuarial gains and losses in 2019, 2018 and 2017 are as follows:
|
12/31/2019 |
12/31/2018 |
|
12/31/2017 | ||
|
Actuarial losses and (gains) |
477,316 |
(15,224) |
|
166,540 | |
|
Return on plan assets (less interest income) |
(444,348) |
(51,213) |
|
(36,627) | |
|
Change in the asset’s limit (excluding interest income) |
73,039 |
50,058 |
|
(97,882) | |
|
Total cost of actuarial losses and (gains) |
106,007 |
(16,379) |
|
32,031 | |
|
Actuarial losses and (gains) recognized in other comprehensive income |
|
|
|
|
32,037 |
|
Unrecognized actuarial (gains) |
|
|
|
|
(6) |
|
Total cost of actuarial losses and (gains) |
106,007 |
|
(16,379) |
|
32,031 |
Breakdown of actuarial gains or losses, according paragraph 141 of IAS19:
|
12/31/2019 | |
|
Loss due to change in financial assumptions |
472,715 |
|
Loss due to experience adjustments |
4,601 |
|
Return on plan assets (less interest income) |
(444,348) |
|
Change in asset limit (excluding interest income) |
73,039 |
|
Actuarial losses and (gains) |
106,007 |
Actuarial (gain)/ loss results from the fluctuation in the investments comprised in the CBS’s asset portfolio.
FS-87
|
|
The main actuarial assumptions used were as follows:
|
12/31/2019 |
12/31/2018 | ||
|
Actuarial financing method |
Projected unit credit |
|
Projected unit credit |
|
Functional currency |
Real (R$) |
Real (R$) | |
|
Recognition of plan assets |
Fair value |
|
Fair value |
|
Nominal discount rate |
Millennium Plan: 6.98% Plan 35%: 6.75% Supplementation: 6.81% |
Millennium Plan: 9.69% Supplementation: 9.59% | |
|
Inflation rate |
3.61% |
|
4.75% |
|
Nominal salary increase rate |
4.65% |
5.80% | |
|
Nominal benefit increase rate |
3.61% |
|
4.75% |
|
Rate of return on investments |
Millennium Plan: 6.98% Plan 35%: 6.75% Supplementation: 6.81% |
Millennium Plan: 9.69% Plan 35%: 9.60% Supplementation: 9.59% | |
|
|
| ||
|
General mortality table |
Millennium Plan: AT-2000 smoothed down by 10% segregated by gender. Plans 35%: AT-2000 Male aggravated by 15%. Supplementation: AT-2000 aggravated by 10% segregated by gender. |
|
Millennium Plan: AT-2000 smoothed down by 10% segregated by gender. Plans 35%: AT-2000 Male aggravated by 15%. Supplementation: AT-2000 aggravated by 10% segregated by gender. |
|
Disability table |
35% Plan and Supplementation: Light Medium. Millenium Plan: Prudential (Ferr. Retirement) |
35% Plan and Supplementation: Light Medium. Millenium Plan: Prudential (Ferr. Retirement) | |
|
Disability mortality table |
Winklevoss - 1% |
|
Winklevoss - 1% |
|
Turnover table |
Millenium plan 5% per annum, zero for plans 35% and Supplementation. |
Millenium plan 5% per annum, zero for plans 35% and Supplementation. | |
|
Retirement age |
100% on the first date he/she becomes eligible for programmed retirement benefit under the plan |
|
100% on the first date he/she becomes eligible for programmed retirement benefit under the plan |
|
Household composition of active participants |
95% will be married at the time of retirement, with the wife being 4 years younger than the husband |
95% will be married at the time of retirement, with the wife being 4 years younger than the husband | |
The assumptions related to the mortality table are based on published statistics and mortality tables. These tables represent an average life expectancy in years of employees who retire at the age of 65, as shown below:
|
Plan covering 35% of the average salary |
Average salary supplementation plan |
Mixed supplementary benefit plan (Milênio Plan) | |||||||||
|
12/31/2019 |
|
12/31/2018 |
12/31/2019 |
|
12/31/2018 |
|
12/31/2019 |
|
12/31/2018 | ||
|
|
|
|
|
|
|
| |||||
|
Longevity at age of 65 for current participants |
|
|
|
|
|
|
|
|
|
|
|
|
Male |
18.38 |
18.00 |
18.75 |
18.74 |
20.45 |
21.00 | |||||
|
Female |
18.38 |
18.00 |
21.41 |
22.23 |
23.02 |
23.00 | |||||
|
|
|
|
|||||||||
|
Longevity for current participants who are 40 |
|
|
|
||||||||
|
Male |
40.15 |
40.00 |
40.60 |
40.60 |
42.70 |
43.00 | |||||
|
Female |
40.15 |
40.00 |
44.41 |
45.37 |
46.28 |
47.00 | |||||
FS-88
|
|
Allocation of plan assets:
|
|
|
12/31/2019 |
|
|
12/31/2018 | ||
|
Variable income |
25,236 |
|
0.65% |
|
141,705 |
|
4,16% |
|
Fixed income |
3,607,398 |
|
92.63% |
3,050,099 |
89,61% | ||
|
Real estate |
183,098 |
|
4.70% |
|
52,091 |
|
1,53% |
|
Others |
78,756 |
|
2.02% |
160,011 |
4,70% | ||
|
Total |
3,894,488 |
|
100.00% |
|
3,403,906 |
|
100,00% |
Variable-income assets comprise mainly CSN shares.
Fixed-income assets comprise mostly debentures, Interbank Deposit Certificates (“CDI”) and National Treasury Notes (“NTN-B”).
Real estate refers to buildings appraised by a specialized asset appraisal firm. There are no assets in use by CSN and its subsidiaries.
For the pension plan, the expense as of December 31, 2019 was R$40,644 (R$40,199 as of December 31, 2018).
26.d) Expected contributions
No contributions are expected to be paid to the defined benefit plans in 2020.
For the mixed supplementary benefit plan, contributions in the amount of R$24,000 are forecasted to be paid in 2020 for the portion of defined contribution and R$1,965 for the portion of defined benefit (risk benefit).
26.e) Sensitivity analysis
The quantitative sensitivity analysis regarding the significant assumptions for the pension plans as of December 31, 2019 is as follows:
|
12/31/2019 | |||||||||
|
|
|
Plan covering 35% of the average salary |
|
Average salary supplementation plan |
|
Mixed supplementary benefit plan (Milênio Plan) | |||
|
Assumption: Discount rate |
|
|
|
|
|
|
|
|
|
|
Sensitivity level |
0.5% |
-0.5% |
0.5% |
-0.5% |
0.5% |
-0.5% | |||
|
Effect on current service cost and on interest on actuarial obligations |
|
986 |
(918) |
|
3,847 |
(3,773) |
|
897 |
(1,126) |
|
Effect on present value of obligations |
(16,683) |
18,012 |
|
(83,364) |
98,252 |
|
(66,416) |
73,565 | |
|
|
|
|
|
|
|
|
|
|
|
|
Assumption: Salary growth |
|||||||||
|
Sensitivity level |
|
0.5% |
-0.5% |
|
0.5% |
-0.5% |
|
0.5% |
-0.5% |
|
Effect on current service cost and on interest on actuarial obligations |
|
|
|
|
|
212 |
(200) | ||
|
Effect on present value of obligations |
|
|
|
|
|
|
|
1,122 |
(1,063) |
|
Assumption: Benefit adjustment |
|
|
|
|
|
|
|
|
|
|
Sensitivity level |
0.5% |
-0.5% |
0.5% |
-0.5% |
0.5% |
-0.5% | |||
|
Effect on current service cost and on interest on actuarial obligations |
|
142 |
(125) |
|
927 |
(405) |
|
387 |
(387) |
|
Effect on present value of obligations |
2,100 |
(1,846) |
|
13,609 |
(5,945) |
|
5,543 |
(5,543) | |
|
|
|
|
|
|
|
|
|
|
|
|
Assumption: Mortality table |
|||||||||
|
Sensitivity level |
|
+1 year |
-1 year |
+1 year |
-1 year |
+1 year |
-1 year | ||
|
Effect on current service cost and on interest on actuarial obligations |
1,561 |
(649) |
|
4,715 |
(4,180) |
|
1,543 |
(1,532) | |
|
Effect on present value of obligations |
|
13,515 |
(9,603) |
|
69,216 |
(61,372) |
|
22,116 |
(22,214) |
FS-89
|
|
The forecast benefit payments of the defined benefit plans for future years are as follows:
|
Payments |
2019 |
|
Year 1 |
267,764 |
|
Year 2 |
261,355 |
|
Year 3 |
255,518 |
|
Year 4 |
249,398 |
|
Year 5 |
243,000 |
|
Next 5 years |
1,109,647 |
|
Total forecast payments |
2,386,682 |
26.f) Post-employment health care plan
Refers to a healthcare plan created on December 1, 1996 exclusively for former retired employees, pensioners, those who received an amnesty, war veterans, widows of employees who died as a result of on-the-job accidents and former employees who retired on or before March 20, 1997 and their dependents. Since then, the healthcare plan does not allow the inclusion of new beneficiaries. The plan is sponsored by CSN.
The amounts recognized in the balance sheet were determined as follows:
|
12/31/2019 |
12/31/2018 | ||
|
Present value of obligations |
892,396 |
|
897,137 |
|
Liabilities |
892,396 |
897,137 |
The reconciliation of the healthcare liabilities is as follows:
|
12/31/2019 |
12/31/2018 | ||
|
Actuarial liability at the beginning of the year |
897,137 |
|
866,784 |
|
Expenses recognized in income for the year |
69,907 |
85,748 | |
|
Sponsor’s contributions transferred in prior year |
(82,081) |
|
(71,632) |
|
Recognition of actuarial loss/(gain) |
7,433 |
16,237 | |
|
Actuarial liability at the end of the year |
892,396 |
|
897,137 |
The actuarial gains and losses recognized in shareholders' equity are as follows:
|
12/31/2019 |
12/31/2018 |
|
12/31/2017 | ||
|
Actuarial gain /(loss) on obligation |
7,433 |
|
16,237 |
|
170,445 |
|
Gain/(loss) recognized in shareholders' equity |
7,433 |
16,237 |
|
170,445 |
FS-90
|
|
The weighted average life expectancy based on the mortality table used to determined actuarial obligations is as follows:
|
12/31/2019 |
12/31/2018 | ||
|
Longevity at age of 65 for current participants |
|
|
|
|
Male |
20.24 |
|
19.55 |
|
Female |
20.24 |
|
22.17 |
|
|
|
| |
|
Longevity for current participants who are 40 |
|
|
|
|
Male |
42.74 |
|
41.59 |
|
Female |
42.74 |
|
45.30 |
The actuarial assumptions used for calculating post-employment healthcare were:
|
|
12/31/2019 |
12/31/2018 | |
|
Biometric and Demographic |
|
|
|
|
General mortality table |
AT 2000 segregated by gender |
AT 2000 segregated by gender | |
|
|
|
| |
|
Financial |
|
|
|
|
Actuarial nominal discount rate |
6.78% |
9.62% | |
|
Inflation |
3.61% |
|
4.75% |
|
Real increase in medical costs based on age (Aging Factor) |
0,5% - 3,00% real a.a. |
0.5% - 3.00% real a.a. | |
|
Nominal increase medical costs growth rate |
6.98% |
8.15% | |
|
Average medical cost (Claim cost) |
1,319.36 |
1,054.65 |
26.g) Sensitivity analysis
The quantitative sensitivity analysis regarding the significant assumptions for the post-employment healthcare plans as of December 31, 2019 is as follows:
|
12/31/2019 | ||
|
|
Healthcare Plan | |
|
|
Assumption: Discount rate | |
|
Sensitivity level |
0.5% |
-0.5% |
|
Effect on current service cost and on interest on actuarial obligations |
1,824 |
(2,006) |
|
Effect on present value of obligations |
(35,490) |
38,444 |
|
|
|
|
|
Assumption: Medical Inflation | ||
|
Sensitivity level |
1.0% |
-1.0% |
|
Effect on current service cost and on interest on actuarial obligations |
5,646 |
(4,900) |
|
Effect on present value of obligations |
83,270 |
(72,264) |
|
|
Assumption: Mortality table | |
|
Sensitivity level |
+1 year |
-1 year |
|
Effect on current service cost and on interest on actuarial obligations |
4,093 |
(3,851) |
|
Effect on present value of obligations |
60,367 |
(56,802) |
FS-91
|
|
The forecast benefit payments of the postemployment healthcare plans for future years are as follows:
|
Forecast benefit payments |
2019 |
|
Year 1 |
83,290 |
|
Year 2 |
80,574 |
|
Year 3 |
77,649 |
|
Year 4 |
74,529 |
|
Year 5 |
71,218 |
|
Next 5 years |
301,853 |
|
Total forecast payments |
689,113 |
27 COMMITMENTS
27.a) Take-or-pay contracts
As of December 31,2019 and 2018, the Company was a party to take-or-pay contracts as shown in the following table:
|
Payments in the period |
|
|
|
|
|
|
|
|
|
| |||||
|
Type of service |
2018 |
2019 |
2020 |
2021 |
2022 |
After 2022 |
Total | ||||||||
|
Transportation of iron ore, coal, coke, steel products, cement and mining products. |
|
406,920 |
1,555,398 |
1,184,627 |
1,106,047 |
1,136,469 |
4,441,842 |
7,868,985 | |||||||
|
Supply of power, natural gas, oxygen, nitrogen, argon, iron ore pellets, coal and clinquer. |
658,166 |
966,405 |
391,750 |
33,317 |
24,940 |
200,121 |
650,128 | ||||||||
|
Processing of furnace sludge and slag resulting from the production process of pig iron and steel |
|
9,467 |
56,024 |
21,164 |
11,571 |
11,571 |
3,599 |
47,905 | |||||||
|
Manufacturing, repair, recovery and production of ingot casting machine units. |
21,533 |
5,930 |
1,896 |
1,896 | |||||||||||
|
|
|
1,096,086 |
2,583,757 |
1,599,437 |
1,150,935 |
1,172,980 |
4,645,562 |
8,568,914 | |||||||
FS-92
|
|
27.b) Projects and other commitments
· Transnordestina project
The Transnordestina project which corresponds to rail network II of the Northeast Railway System, includes building 1,753 km of new, next-generation, wide-gauge tracks. The project posts an evolution of 52% progress which was expected to completion for 2017, completion period currently under discussion with the responsible agencies.
The Company expects that the investments will permit Transnordestina Logística S.A., the concessionaire that holds the Transnordestina project, to transport of several products, such as iron ore, limestone, soy, cotton, sugarcane, fertilizers, oil, and fuel. The concession will expire in 2057 and can be terminated before this date if the minimum return agreed with the Government is reached. Transnordestina obtained the environmental authorizationsrequired and implementation is advanced in certain regions.
The sources of financing for the project are: (i) financing granted by Banco do Nordeste/ FNE and the BNDES, (ii) debentures issued by FDNE, (iii) Permanent Track Use contracts, and (iv) contribution of capital by CSN and public shareholders. The approved construction investment is R$7,542,000 and the balance of disbursable funds will be adjusted using the IPCA as from April 2012. Should additional funds be required, they will be provided by CSN and/or third parties under Permanent Track Use contracts.
Currently, the approved budget is composed as follows: Missão Velha-Salgueiro: R$0.4 billion, Salgueiro-Trindade: R$0.7 billion, Trindade-Eliseu Martins: R$2.4 billion, Missão Velha-Porto de Pecém: R$3 billion, Salgueiro-Porto de Suape: R$4.7 billion, amounting R$ 11.2 billion. The project is currently in the process of budged adjustment and the proposed amount is R$13.2 Billion.
The Company guarantees 100% of TLSA’s financing granted by Banco do Nordeste/FNE and the BNDES, and 50.97% of the debentures issued by FDNE (includes the corporate guarantee of 48.47%, a collateral letter of 1.25% issued to BNB and the corporate guarantee of 1.25% pledged to BNB). Under the FDNE charter, approved by Federal Decree nº 6,952/2009, and the Investment Agreement entered into with the public shareholders/ financiers, up to 50% of the debentures may be converted into TLSA shares.
The Court of Auditors of the Union - TCU through a protective order issued in May 2016, regarding the case TC 012.179/2016, suspended new transfers of public resources to TLSA from Valec Engenharia, Construções e Ferrovias S.A., Fundo de Investimento do Nordeste – FINOR, Fundo Constitucional de Financiamento do Nordeste – FNE, Fundo de Desenvolvimento do Nordeste – FDNE, Banco Nacional de Desenvolvimento Econômico e Social – BNDES and BNDES Participações S.A.– BNDESPar. After filing an appeal against the protective order and providing the necessary explanations, in June 2016 the order issued by TCU was withdrawn unanimously by the members of this court, with the continuity of planned investments having been restored.
By means of another protective order issued in January 2017, relating to the case TC 012.179/2016, the Court of Auditors of the Union suspended new transfers of public resources to TLSA by Valec Engenharia, Construções e Ferrovias S.A., Fundo de Investimento do Nordeste – FINOR, Fundo Constitucional de Financiamento do Nordeste – FNE, Fundo de Desenvolvimento do Nordeste – FDNE, Banco Nacional de Desenvolvimento Econômico e Social – BNDES and BNDES Participações S.A.– BNDESPar. The Company has provided the required clarifications to the TCU and has acted firmly in order that the decision can be repealed soon and the flow of investments planned can be restored.
The Company concluded in December / 2019, according to the scheduled schedule, the engineering deliveries referring to the revision of the projects of the sections to be executed, as well as the survey of the services already executed in the sections in progress and completed (“as built”), in a way to allow the validation of the regulatory budget and the preparation of a revisited schedule. The Company awaits the analysis to be carried out by the regulatory agency, whose management's expectation is that it will be carried out during the first half of 2020.
FS-93
|
|
There is an administrative procedure with the ANTT (National Land Transportation Agency) which evaluates the regular compliance with the obligations of the Concession Agreement corresponding to System II by Concessionaire TLSA. ANTT’s technical area, in a unilateral opinion, understood that non-compliance with the contractual obligations by the Concessionaire is evidenced. The technical area’s opinion is under evaluation and, if the irregularity is proven, ANTT may open new process to apply the applicable penalties, among them, forfeiture. The procedure is in fact finding phase and until the moment there is no final decision on the merit.
· FTL – Ferrovia Transnordestina Logística S.A. (Operational rail network)
In relation to the rail network I, operates by Ferrovia Transnordestina Logística S.A.(“FTL”) - there is an administrative procedure before the National Agency for Land Transportation (“ANTT”) that analyzes the regular fulfillment of the obligations of the Concession Agreement by the Concessionaire FTL. In view of a unilateral analysis, ANTT informed that FTL would have failed to comply with the TAC (Conduct Adjustment Agreement) signed in 2013 as a result of the non-compliance with the production target for 2013. In this context, the agency proposed to the Union the declaration of the expiry of the FTL Concession Contract and the initiation of an administrative proceeding within the scope of the Superintendence of Infrastructure and Railroad Cargo Transport Services - SUFER. The Company continues to rely on ANTT's positioning.
28 INSURANCE
Aiming to properly mitigate risk and in view of the nature of its operations, the Company and its subsidiaries have taken out several different types of insurance policies. Such policies are contracted in line with the CSN Risk Management policy and are similar to the insurance taken out by other companies operating in the same lines of business as CSN and its subsidiaries. The risks covered under such policies include the following: Domestic Transportation, International Transportation, Life and Casualty, Health Coverage, Fleet Vehicles, D&O (Civil Liability Insurance for Directors and Officers), General Civil Liability, Engineering Risks, naming Risks, Export Credit, warranty and Port Operator’s Civil Liability.
In 2019, after negotiation with insurers and reinsurers in Brazil and abroad, an insurance policy was issued for the contracting of a policy of Operational Risk of Property Damages and Loss of Profits, with effect from March 31, 2019 to June 30, 2020. Under the insurance policy, the maximum limit of indemnity is US$600 million and deductibles in the amount of US$385 million for material damages and 45 days for loss of profits and covers the following Company’s units and subsidiaries: Presidente Vargas Steelworks, CSN Mineração and Sepetiba Tecon.
In view of their nature, the risk assumptions adopted are not part of the scope of an audit of the financial statements and, accordingly, were not audited by our independent auditors.
29 ADDITIONAL INFORMATION TO CASH FLOWS
The following table provides additional information on transactions related to the statement of cash flows:
|
Consolidated | |||||
|
|
12/31/2019 |
|
12/31/2018 |
12/31/2017 | |
|
Income tax and social contribution paid (1) |
1,167,419 |
336,962 |
|
268,847 | |
|
Addition to PP&E with interest capitalization (note 10 and 25) |
117,189 |
71,611 |
|
91,957 | |
|
Initial adoption IFRS 16 – Right of use (note 9a) |
640,989 |
|
|
|
|
|
Remeasurement – Right of use (note 9a) |
(151,558) |
|
|
|
|
|
Acquisition of fixed assets through a loan, net of taxes (2) |
78,098 |
10,792 |
|
4,265 | |
|
Acquisition of fixed assets by auction |
200,115 |
|
|
|
|
|
Non-monetary transaction with joint venture |
|
|
|
20,264 | |
|
2,052,252 |
419,365 |
|
385,333 | ||
(1) For calendar year 2019, the Company opted for taxation based on the quarterly actual profit, according art. 9,430/96, with income tax and social contribution due being paid in a single installment, until the last business day of the month following the end of each quarter.
(2) In 2019, fixed assets were acquired through a loan in the amount of R$100,661, net of recoverable taxes of R$22,563.
FS-94
|
|
30 EVENTS AFTER THE REPORTING PERIOD
· In January 2020, the Company issued debt securities in the foreign market (“Notes”), through its subsidiary CSN Islands XI Corp, in the amount of US$1 billion, with maturity in 2028 and interest rate of 6.75% per year. Part of the funds raised, in the amount of US$263 million, were used in the repurchase offer (“Tender Offer”) of the Notes issued by CSN Resources SA with maturity in 2020, as communicated to the market on January 17, 2020. The Notes are guaranteed, unconditionally and irrevocably, by the Company.
· USIMINAS shares classified as financial investments (see note 4) are exposed to changes in share prices since the securities are valued at fair value through profit or loss according to quotations on the Stock Exchange. On April 2, 2020, common and preferred shares depreciated in the global amount of R$999.9 million since the balance sheet date.
· During March 2020, the pandemic of Covid-19 spread significantly on a global scale. The pandemic has the potential to cause significant operational disruptions globally, and is expected to result in volatility in the global markets, affecting global and regional economies. In the event that the disruptions resulting from the pandemic continues to increase worldwide, they can materially affect the global economy and the financial markets such as interest rates and exchange rates applicable to our indebtedness as well as affect our clients and suppliers. These consequences could affect the Company’s financial condition and results of operations. We created a special Committee that is in charge of monitoring the pandemic, its effects on the global economy and is focused on minimizing the effects to our employees, transactions and financial results. Note that the timeframe and overall effects of the pandemic is currently unpredictable. We are not able to predict the outcome on the global economy and the consequences to Company’s transactions and financial results.
FS-95