UNITED STATES
SECURITIES AND EXCHANGE COMMISSION
Washington, D.C. 20549
__________________________________________________________________________________________
Form 10-K
(Mark One)
ANNUAL REPORT PURSUANT TO SECTION 13 OR 15(d) OF THE SECURITIES EXCHANGE ACT OF 1934 | |
FOR THE FISCAL YEAR ENDED December 31, 2019 OR
TRANSITION REPORT PURSUANT TO SECTION 13 OR 15(d) OF THE SECURITIES EXCHANGE ACT OF 1934 | |
FOR THE TRANSITION PERIOD FROM TO
Commission file number 001-03701
__________________________________________________________________________________________
(Exact name of Registrant as specified in its charter) |
(State or other jurisdiction of incorporation or organization) | (I.R.S. Employer Identification No.) | |||
(Address of principal executive offices, including zip code)
Registrant’s telephone number, including area code: 509 -489-0500
Web site: http://www.avistacorp.com
Securities registered pursuant to Section 12(b) of the Act:
Title of Each Class | Trading Symbol(s) | Name of Each Exchange on Which Registered |
Securities registered pursuant to Section 12(g) of the Act:
Title of Class
Preferred Stock, Cumulative, Without Par Value
__________________________________________________________________________________________
Indicate by check mark if the registrant is a well-known seasoned issuer, as defined in Rule 405 of the Securities Act. Yes ☒ No ☐
Indicate by check mark if the registrant is not required to file reports pursuant to Section 13 or 15(d) of the Act. Yes ☐ No ☒
Indicate by check mark whether the registrant (1) has filed all reports required to be filed by Section 13 or 15(d) of the Securities Exchange Act of 1934 during the preceding 12 months (or for such shorter period that the Registrant was required to file such reports), and (2) has been subject to such filing requirements for the past 90 days: Yes ☒ No ☐
Indicate by check mark whether the registrant has submitted electronically every Interactive Data File required to be submitted pursuant to Rule 405 of Regulation S-T (§232.405 of this chapter) during the preceding 12 months (or for such shorter period that the registrant was required to submit such files). Yes ☒ No ☐
Indicate by check mark whether the registrant is a large accelerated filer, an accelerated filer, a non-accelerated filer, a smaller reporting company, or an emerging growth company. See the definitions of “large accelerated filer,” “accelerated filer,” “smaller reporting company,” and "emerging growth company" in Rule 12b-2 of the Exchange Act. (Check one):
☒ | Accelerated Filer | ☐ | |
Non-accelerated Filer | ☐ | Smaller reporting company | |
Emerging growth company | |||
If an emerging growth company, indicate by check mark if the registrant has elected not to use the extended transition period for complying with any new or revised financial accounting standards provided pursuant to Section 13(a) of the Exchange Act. ☐
Indicate by check mark whether the Registrant is a shell company (as defined in Rule 12b-2 of the Exchange Act): Yes ☐ No ☒
The aggregate market value of the Registrant’s outstanding Common Stock, no par value (the only class of voting stock), held by non-affiliates is $2,948,564,738 based on the last reported sale price thereof on the consolidated tape on June 30, 2019.
As of January 31, 2020, 67,208,604 shares of Registrant’s Common Stock, no par value (the only class of common stock), were outstanding.
__________________________________________________________________________________________
Documents Incorporated By Reference
Document | Part of Form 10-K into Which Document is Incorporated | |
Proxy Statement to be filed in connection with the annual meeting of shareholders to be held on May 11, 2020. Prior to such filing, the Proxy Statement filed in connection with the annual meeting of shareholders held on May 9, 2019. | Part III, Items 10, 11, 12, 13 and 14 | |
INDEX
Item No. | Page No. | |||
Part I | ||||
1 | ||||
1A. | ||||
1B. | ||||
2 | ||||
3 | ||||
4 | * | |||
Part II | ||||
5 | ||||
6 | ||||
7 | ||||
i
7A. | ||||
8. | ||||
9. | * | |||
9A. | ||||
ii
9B. | ||||
Part III | ||||
10. | ||||
11. | ||||
12. | ||||
13. | ||||
14. | ||||
Part IV | ||||
15. | ||||
* = not an applicable item in the 2019 calendar year for Avista Corp.
iii
ACRONYMS AND TERMS
(The following acronyms and terms are found in multiple locations within the document)
Acronym/Term | Meaning | |
aMW | - | Average Megawatt - a measure of the average rate at which a particular generating source produces energy over a period of time |
AEL&P | - | Alaska Electric Light and Power Company, the primary operating subsidiary of AERC, which provides electric services in Juneau, Alaska |
AERC | - | Alaska Energy and Resources Company, the Company's wholly-owned subsidiary based in Juneau, Alaska |
AFUDC | - | Allowance for Funds Used During Construction; represents the cost of both the debt and equity funds used to finance utility plant additions during the construction period |
AM&D | - | Advanced Manufacturing and Development, doing business as METALfx |
ARAM | - | Average Rate Assumption Method |
ASC | - | Accounting Standards Codification |
ASU | - | Accounting Standards Update |
Avista Capital | - | Parent company to the Company’s non-utility businesses, with the exception of AJT Mining Properties, Inc., which is a subsidiary of AERC. |
Avista Corp. | - | Avista Corporation, the Company |
Avista Utilities | - | Operating division of Avista Corp. (not a subsidiary) comprising the regulated utility operations in the Pacific Northwest |
BPA | - | Bonneville Power Administration |
Capacity | - | The rate at which a particular generating source is capable of producing energy, measured in KW or MW |
Cabinet Gorge | - | The Cabinet Gorge Hydroelectric Generating Project, located on the Clark Fork River in Idaho |
CETA | - | Clean Energy Transformation Act |
Colstrip | - | The coal-fired Colstrip Generating Plant in southeastern Montana |
Cooling degree days | - | The measure of the warmness of weather experienced, based on the extent to which the average of high and low temperatures for a day exceeds 65 degrees Fahrenheit (annual degree days above historic indicate warmer than average temperatures) |
Coyote Springs 2 | - | The natural gas-fired combined-cycle Coyote Springs 2 Generating Plant located near Boardman, Oregon |
CT | - | Combustion turbine |
Deadband or ERM deadband | - | The first $4.0 million in annual power supply costs above or below the amount included in base retail rates in Washington under the ERM in the state of Washington |
Ecology | - | The State of Washington’s Department of Ecology |
EIM | - | Energy Imbalance Market |
Energy | - | The amount of electricity produced or consumed over a period of time, measured in KWh or MWh. Also, refers to natural gas consumed and is measured in dekatherms. |
EPA | - | Environmental Protection Agency |
ERM | - | The Energy Recovery Mechanism, a mechanism for accounting and rate recovery of certain power supply costs accepted by the utility commission in the state of Washington |
FASB | - | Financial Accounting Standards Board |
FCA | - | Fixed Cost Adjustment, the electric and natural gas decoupling mechanism in Idaho. |
FERC | - | Federal Energy Regulatory Commission |
GAAP | - | Generally Accepted Accounting Principles |
GHG | - | Greenhouse gas |
GS | - | Generating station |
Heating degree days | - | The measure of the coldness of weather experienced, based on the extent to which the average of high and low temperatures for a day falls below 65 degrees Fahrenheit (annual degree days above historic indicate warmer than average temperatures) |
Hydro One | - | Hydro One Limited, based in Toronto, Ontario, Canada. |
iv
IPUC | - | Idaho Public Utilities Commission |
IRP | - | Integrated Resource Plan |
Jackson Prairie | - | Jackson Prairie Natural Gas Storage Project, an underground natural gas storage field located near Chehalis, Washington |
Juneau | - | The City and Borough of Juneau, Alaska |
kV | - | Kilovolt (1000 volts): a measure of capacity on transmission lines |
KW, KWh | - | Kilowatt (1000 watts): a measure of generating output or capability. Kilowatt-hour (1000 watt hours): a measure of energy produced |
Lancaster Plant | - | A natural gas-fired combined cycle combustion turbine plant located in Idaho |
LNG | - | Liquefied Natural Gas |
MPSC | - | Public Service Commission of the State of Montana |
MW, MWh | - | Megawatt: 1000 KW. Megawatt-hour: 1000 KWh |
NERC | - | North American Electricity Reliability Corporation |
Noxon Rapids | - | The Noxon Rapids Hydroelectric Generating Project, located on the Clark Fork River in Montana |
OPUC | - | The Public Utility Commission of Oregon |
PCA | - | The Power Cost Adjustment mechanism, a procedure for accounting and rate recovery of certain power supply costs accepted by the utility commission in the state of Idaho |
PGA | - | Purchased Gas Adjustment |
PPA | - | Power Purchase Agreement |
PSE | - | Puget Sound Energy |
PUD | - | Public Utility District |
RCA | - | The Regulatory Commission of Alaska |
REC | - | Renewable energy credit |
ROE | - | Return on equity |
ROR | - | Rate of return on rate base |
SEC | - | U.S. Securities and Exchange Commission |
TCJA | - | The "Tax Cuts and Jobs Act," signed into law on December 22, 2017. |
Therm | - | Unit of measurement for natural gas; a therm is equal to approximately one hundred cubic feet (volume) or 100,000 BTUs (energy) |
Watt | - | Unit of measurement of electric power or capability; a watt is equal to the rate of work represented by a current of one ampere under a pressure of one volt |
WUTC | - | Washington Utilities and Transportation Commission |
v
Forward-Looking Statements
From time to time, we make forward-looking statements such as statements regarding projected or future:
• | financial performance; |
• | cash flows; |
• | capital expenditures; |
• | dividends; |
• | capital structure; |
• | other financial items; |
• | strategic goals and objectives; |
• | business environment; and |
• | plans for operations. |
These statements are based upon underlying assumptions (many of which are based, in turn, upon further assumptions). Such statements are made both in our reports filed under the Securities Exchange Act of 1934, as amended (including this Annual Report on Form 10-K), and elsewhere. Forward-looking statements are all statements except those of historical fact including, without limitation, those that are identified by the use of words that include “will,” “may,” “could,” “should,” “intends,” “plans,” “seeks,” “anticipates,” “estimates,” “expects,” “forecasts,” “projects,” “predicts,” and similar expressions.
Forward-looking statements (including those made in this Annual Report on Form 10-K) are subject to a variety of risks, uncertainties and other factors. Most of these factors are beyond our control and may have a significant effect on our operations, results of operations, financial condition or cash flows, which could cause actual results to differ materially from those anticipated in our statements. Such risks, uncertainties and other factors include, among others:
Utility Regulatory Risk
• | state and federal regulatory decisions or related judicial decisions that affect our ability to recover costs and earn a reasonable return including, but not limited to, disallowance or delay in the recovery of capital investments, operating costs, commodity costs, interest rate swap derivatives, the ordering of refunds to customers and discretion over allowed return on investment; |
• | the loss of regulatory accounting treatment, which could require the write-off of regulatory assets and the loss of regulatory deferral and recovery mechanisms; |
Operational Risk
• | wildfires ignited, or allegedly ignited, by Avista Corp. equipment or facilities could cause significant loss of life and property, thereby causing serious operational and financial harm to Avista Corp. and our customers; |
• | severe weather or natural disasters, including, but not limited to, avalanches, wind storms, wildfires, earthquakes, snow and ice storms, that can disrupt energy generation, transmission and distribution, as well as the availability and costs of fuel, materials, equipment, supplies and support services; |
• | explosions, fires, accidents, mechanical breakdowns or other incidents that could impair assets and may disrupt operations of any of our generation facilities, transmission, and electric and natural gas distribution systems or other operations and may require us to purchase replacement power or incur costs to repair our facilities; |
• | explosions, fires, accidents or other incidents arising from or allegedly arising from our operations that could cause injuries to the public or property damage; |
• | blackouts or disruptions of interconnected transmission systems (the regional power grid); |
• | terrorist attacks, cyberattacks or other malicious acts that could disrupt or cause damage to our utility assets or to the national or regional economy in general, including any effects of terrorism, cyberattacks, ransomware, or vandalism that damage or disrupt information technology systems; |
• | work-force issues, including changes in collective bargaining unit agreements, strikes, work stoppages, the loss of key executives, availability of workers in a variety of skill areas, and our ability to recruit and retain employees; |
• | increasing costs of insurance, more restrictive coverage terms and our ability to obtain insurance; |
1
• | delays or changes in construction costs, and/or our ability to obtain required permits and materials for present or prospective facilities; |
• | increasing health care costs and cost of health insurance provided to our employees and retirees; |
• | third party construction of buildings, billboard signs, towers or other structures within our rights of way, or placement of fuel containers within close proximity to our transformers or other equipment, including overbuild atop natural gas distribution lines; |
• | the loss of key suppliers for materials or services or other disruptions to the supply chain; |
• | adverse impacts to our Alaska electric utility that could result from an extended outage of its hydroelectric generating resources or their inability to deliver energy, due to their lack of interconnectivity to any other electrical grids and the availability or cost of replacement power (diesel); |
• | changing river regulation or operations at hydroelectric facilities not owned by us, which could impact our hydroelectric facilities downstream; |
• | change in the use, availability or abundancy of water resources and/or rights needed for operation of our hydroelectric facilities; |
Cyber and Technology Risk
• | cyberattacks on the operating systems that are used in the operation of our electric generation, transmission and distribution facilities and our natural gas distribution facilities, and cyberattacks on such systems of other energy companies with which we are interconnected, which could damage or destroy facilities or systems or disrupt operations for extended periods of time and result in the incurrence of liabilities and costs; |
• | cyberattacks on the administrative systems that are used in the administration of our business, including customer billing and customer service, accounting, communications, compliance and other administrative functions, and cyberattacks on such systems of our vendors and other companies with which we do business, which could result in the disruption of business operations, the release of private information and the incurrence of liabilities and costs; |
• | changes in costs that impede our ability to effectively implement new information technology systems or to operate and maintain current production technology; |
• | changes in technologies, possibly making some of the current technology we utilize obsolete or introducing new cyber security risks; |
• | insufficient technology skills, which could lead to the inability to develop, modify or maintain our information systems; |
Strategic Risk
• | growth or decline of our customer base due to new uses for our services or decline in existing services, including, but not limited to, the effect of the trend toward distributed generation at customer sites; |
• | the potential effects of negative publicity regarding our business practices, whether true or not, which could hurt our reputation and result in litigation or a decline in our common stock price; |
• | changes in our strategic business plans, which could be affected by any or all of the foregoing, including the entry into new businesses and/or the exit from existing businesses and the extent of our business development efforts where potential future business is uncertain; |
• | wholesale and retail competition including alternative energy sources, growth in customer-owned power resource technologies that displace utility-supplied energy or that may be sold back to the utility, and alternative energy suppliers and delivery arrangements; |
• | entering into or growth of non-regulated activities may increase earnings volatility; |
• | the risk of municipalization or other form of service territory reduction; |
External Mandates Risk
• | changes in environmental laws, regulations, decisions and policies, including present and potential environmental remediation costs and our compliance with these matters; |
2
• | the potential effects of initiatives, legislation or administrative rulemaking at the federal, state or local levels, including possible effects on our generating resources, prohibitions or restrictions on new or existing services, or restrictions on greenhouse gas emissions to mitigate concerns over global climate changes; |
• | political pressures or regulatory practices that could constrain or place additional cost burdens on our distribution systems through accelerated adoption of distributed generation or electric-powered transportation or on our energy supply sources, such as campaigns to halt fossil fuel fired power generation and opposition to other thermal generation, wind turbines or hydroelectric facilities; |
• | failure to identify changes in legislation, taxation and regulatory issues that could be detrimental or beneficial to our overall business; |
• | policy and/or legislative changes in various regulated areas, including, but not limited to, environmental regulation, healthcare regulations and import/export regulations; |
Financial Risk
• | weather conditions, which affect both energy demand and electric generating capability, including the impact of precipitation and temperature on hydroelectric resources, the impact of wind patterns on wind-generated power, weather-sensitive customer demand, and similar impacts on supply and demand in the wholesale energy markets; |
• | our ability to obtain financing through the issuance of debt and/or equity securities, which could be affected by various factors including our credit ratings, interest rates, other capital market conditions and global economic conditions; |
• | changes in interest rates that affect borrowing costs, our ability to effectively hedge interest rates for anticipated debt issuances, variable interest rate borrowing and the extent to which we recover interest costs through retail rates collected from customers; |
• | changes in actuarial assumptions, interest rates and the actual return on plan assets for our pension and other postretirement benefit plans, which could affect future funding obligations, pension and other postretirement benefit expense and the related liabilities; |
• | the outcome of legal proceedings and other contingencies; |
• | economic conditions in our service areas, including the economy's effects on customer demand for utility services; |
• | declining energy demand related to customer energy efficiency, conservation measures and/or increased distributed generation; |
• | changes in the long-term climate and weather could materially affect, among other things, customer demand, the volume and timing of streamflows required for hydroelectric generation, costs of generation, transmission and distribution. Increased or new risks may arise from severe weather or natural disasters, including wildfires; |
• | industry and geographic concentrations which could increase our exposure to credit risks due to counterparties, suppliers and customers being similarly affected by changing conditions; |
• | deterioration in the creditworthiness of our customers; |
Energy Commodity Risk
• | volatility and illiquidity in wholesale energy markets, including exchanges, the availability of willing buyers and sellers, changes in wholesale energy prices that could affect operating income, cash requirements to purchase electricity and natural gas, value received for wholesale sales, collateral required of us by individual counterparties and/or exchanges in wholesale energy transactions and credit risk to us from such transactions, and the market value of derivative assets and liabilities; |
• | default or nonperformance on the part of any parties from whom we purchase and/or sell capacity or energy; |
• | potential environmental regulations or lawsuits affecting our ability to utilize or resulting in the obsolescence of our power supply resources; |
• | explosions, fires, accidents, pipeline ruptures or other incidents that could limit energy supply to our facilities or our surrounding territory, which could result in a shortage of commodities in the market that could increase the cost of replacement commodities from other sources; |
3
Compliance Risk
• | changes in laws, regulations, decisions and policies at the federal, state or local levels, which could materially impact both our electric and gas operations and costs of operations; and |
• | the ability to comply with the terms of the licenses and permits for our hydroelectric or thermal generating facilities at cost-effective levels. |
Our expectations, beliefs and projections are expressed in good faith. We believe they are reasonable based on, without limitation, an examination of historical operating trends, our records and other information available from third parties. There can be no assurance that our expectations, beliefs or projections will be achieved or accomplished. Furthermore, any forward-looking statement speaks only as of the date on which such statement is made. We undertake no obligation to update any forward-looking statement or statements to reflect events or circumstances that occur after the date on which such statement is made or to reflect the occurrence of unanticipated events. New risks, uncertainties and other factors emerge from time to time, and it is not possible for us to predict all such factors, nor can we assess the effect of each such factor on our business or the extent that any such factor or combination of factors may cause actual results to differ materially from those contained in any forward-looking statement.
Available Information
We file annual, quarterly and current reports and proxy statements with the SEC. The SEC maintains a website that contains these documents at www.sec.gov. We make annual, quarterly and current reports and proxy statements available on our website, www.avistacorp.com, as soon as practicable after electronically filing these documents with the SEC. Except for SEC filings or portions thereof that are specifically referred to in this report, information contained on these websites is not part of this report.
PART I
ITEM 1. BUSINESS
COMPANY OVERVIEW
Avista Corp., incorporated in the territory of Washington in 1889, is primarily an electric and natural gas utility with certain other business ventures. As of December 31, 2019, we employed 1,796 people in our Pacific Northwest utility operations (Avista Utilities) and 124 people in our subsidiary businesses (including our Juneau, Alaska utility operations). Our corporate headquarters are in Spokane, Washington, the second-largest city in Washington. Spokane serves as the business, transportation, medical, industrial and cultural hub of the Inland Northwest region (eastern Washington and northern Idaho). Regional services include government and higher education, medical services, retail trade and finance. Through our subsidiary AEL&P, we also provide electric utility services in Juneau, Alaska.
As of December 31, 2019, we have two reportable business segments as follows:
• | Avista Utilities – an operating division of Avista Corp., comprising the regulated utility operations in the Pacific Northwest. Avista Utilities provides electric distribution and transmission, and natural gas distribution services in parts of eastern Washington and northern Idaho. Avista Utilities also provides natural gas distribution service in parts of northeastern and southwestern Oregon. Avista Utilities has electric generating facilities in Washington, Idaho, Oregon and Montana. Avista Utilities also supplies electricity to a small number of customers in Montana, most of whom are employees who operate Avista Utilities' Noxon Rapids generating facility. Avista Utilities also engages in wholesale purchases and sales of electricity and natural gas as an integral part of energy resource management and its load-serving obligation. |
• | AEL&P - a utility providing electric services in Juneau, Alaska that is a wholly-owned subsidiary and the primary operating subsidiary of AERC. |
We have other businesses, including venture fund investments, real estate investments, as well as certain other investments made by Avista Capital, which is a direct, wholly owned subsidiary of Avista Corp. These activities do not represent a reportable business segment and are conducted by various direct and indirect subsidiaries of Avista Corp. In April 2019, we sold our investment in METALfx, a custom sheet metal fabricator. See "Note 25 of the Notes to Consolidated Financial Statements" for further discussion of the sale.
Total Avista Corp. shareholders’ equity was $1,939.3 million as of December 31, 2019, which includes a $103.3 million investment in Avista Capital and a $103.8 million investment in AERC.
4
See “Item 6. Selected Financial Data” and “Note 23 of the Notes to Consolidated Financial Statements” for information with respect to the operating performance of each business segment (and other subsidiaries).
AVISTA UTILITIES
General
At the end of 2019, Avista Utilities supplied retail electric service to approximately 393,000 customers and retail natural gas service to approximately 361,000 customers across its service territory. Avista Utilities' service territory covers 30,000 square miles with a population of 1.7 million. See “Item 2. Properties” for further information on our utility assets. See “Item 7. Management’s Discussion and Analysis of Financial Condition and Results of Operations – Economic Conditions and Utility Load Growth” for information on economic conditions in our service territory.
Electric Operations
General Avista Utilities generates, transmits and distributes electricity, serving electric customers in eastern Washington and northern Idaho and a small number of customers in Montana, most of whom are employees who operate Avista Utilities' Noxon Rapids generating facility.
Avista Utilities generates electricity from facilities that we own and purchases capacity, energy and fuel for generation under long-term and short-term contracts to meet customer load obligations. We also sell electric capacity and energy, as well as surplus fuel in the wholesale market in connection with our resource optimization activities as described below.
As part of Avista Utilities' resource procurement and management operations in the electric business, we engage in an ongoing process of resource optimization, which involves the selection from available energy resources to serve our load obligations and the use of these resources to capture economic value through wholesale market transactions. These include sales and purchases of electric capacity and energy, fuel for electric generation, and derivative contracts related to capacity, energy, fuel and fuel transportation. Such transactions are part of the process of matching available resources with load obligations and hedging a portion of the related financial risks. In order to implement this process, we make continuing projections of:
• | electric loads at various points in time (ranging from intra-hour to multiple years) based on, among other things, estimates of customer usage and weather, historical data and contract terms, and |
• | resource availability at these points in time based on, among other things, fuel choices and fuel markets, estimates of streamflows, availability of generating units, historic and forward market information, contract terms and experience. |
On the basis of these projections, we make purchases and sales of electric capacity and energy, fuel for electric generation, and related derivative contracts to match expected resources to expected electric load requirements and reduce our exposure to electricity (or fuel) market price changes. The process of resource optimization involves scheduling and dispatching available resources as well as the following:
• | purchasing fuel for generation, |
• | when economical, selling fuel and substituting wholesale electric purchases, and |
• | other wholesale transactions to capture the value of generating resources, transmission contract rights and fuel delivery (transport) capacity contracts. |
This optimization process includes entering into hedging transactions to manage risks. Transactions include both physical energy contracts and related derivative instruments, and the terms range from intra-hour up to multiple years.
Avista Utilities' generation assets are interconnected through the regional transmission system and are operated on a coordinated basis to enhance load-serving capability and reliability. We acquire both long-term and short-term transmission capacity to facilitate all of our energy and capacity transactions. We provide transmission and ancillary services in eastern Washington, northern Idaho and western Montana.
Electric Requirements
Avista Utilities' peak electric native load requirement for 2019 was 1,656 MW, which occurred on August 7, 2019. In 2018, our peak electric native load was 1,716 MW, which occurred during the summer, and in 2017, it was 1,681 MW, which occurred during the winter.
Electric Resources
Avista Utilities has a diverse electric resource mix of Company-owned and contracted hydroelectric, thermal and wind generation facilities, and other contracts for power purchases and exchanges. As of December 31, 2019, Avista Utilities' electric
5
generation resource mix (including contracts for power purchases) was approximately 51 percent hydroelectric, 45 percent thermal and 4 percent wind. See “Item 2. Properties” for detailed information on Company-owned generating facilities.
Hydroelectric Resources Avista Utilities owns and operates Noxon Rapids and Cabinet Gorge on the Clark Fork River and six smaller hydroelectric projects on the Spokane River. Hydroelectric generation is typically our lowest cost source per MWh of electric energy and the availability of hydroelectric generation has a significant effect on total power supply costs. Under normal streamflow and operating conditions, we estimate that we would be able to meet approximately one-half of our total average electric requirements (both retail and long-term wholesale) with the combination of our hydroelectric generation and long-term hydroelectric purchase contracts with certain PUDs in the state of Washington. Our estimate of normal annual hydroelectric generation for 2020 (including resources purchased under long-term hydroelectric contracts with certain PUDs) will be 586 aMW (or 5.2 million MWhs).
The following graph shows Avista Utilities' hydroelectric generation (in thousands of MWhs) during the year ended December 31:
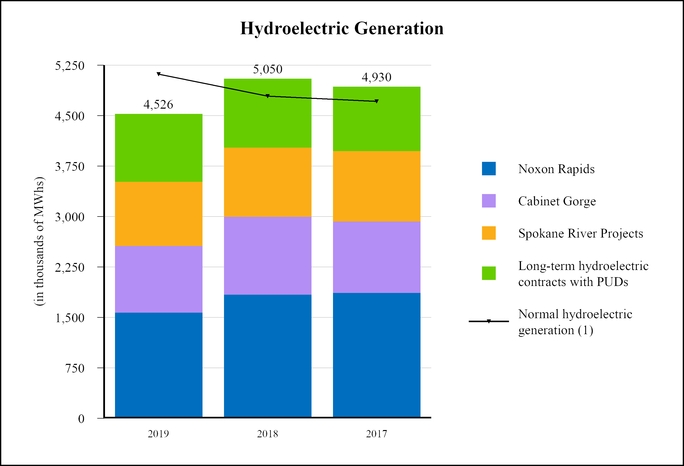
(1) | "Normal" hydroelectric generation is determined by reference to the effect of upstream dam regulation on median natural water flow. Natural water flow is the flow of the rivers without the influence of dams, whereas regulated water flow takes into account any water flow changes from upstream dams due to releasing or holding back water. The calculation of "normal" varies annually due to the timing of upstream dam regulation throughout the year, as well as changes in PUD contracts. |
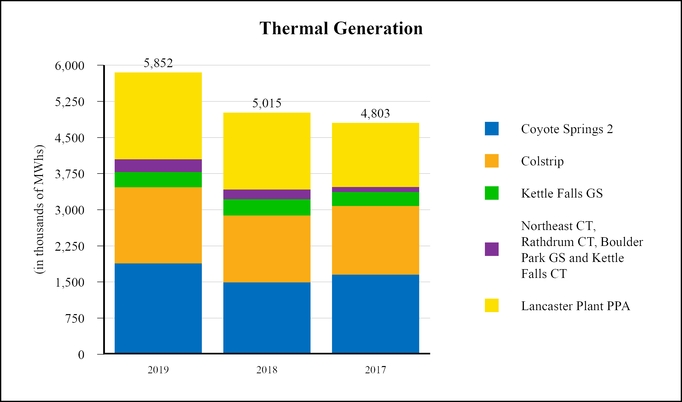
Thermal Resources Avista Utilities owns the following thermal generating resources:
• | the combined cycle natural gas-fired CT, known as Coyote Springs 2, located near Boardman, Oregon, |
• | a 15 percent interest in units 3 & 4 of the Colstrip GS, a coal-fired boiler generating facility located in southeastern Montana, |
• | a wood waste-fired boiler generating facility known as the Kettle Falls GS in northeastern Washington, |
• | a two-unit natural gas-fired CT generating facility, located in northeastern Spokane (Northeast CT), |
6
• | a two-unit natural gas-fired CT generating facility in northern Idaho (Rathdrum CT), and |
• | two small natural gas-fired generating facilities (Boulder Park GS and Kettle Falls CT). |
Coyote Springs 2, which is operated by Portland General Electric Company, is supplied with natural gas under a combination of term contracts and spot market purchases, including transportation agreements with bilateral renewal rights.
Colstrip, which is operated by Talen Montana, is supplied with fuel from adjacent coal reserves under coal supply and transportation agreements. A new contract for coal supply was negotiated with the coal mine operator that extends through December 31, 2025. See “Item 7. Management's Discussion and Analysis – Environmental Issues and Contingencies" for discussion regarding environmental and other issues surrounding Colstrip.
The primary fuel for the Kettle Falls GS is wood waste generated as a by-product and delivered by trucks from forest industry operations within 100 miles of the plant. A combination of long-term contracts and spot purchases has provided, and is expected to meet, fuel requirements for the Kettle Falls GS.
The Northeast CT, Rathdrum CT, Boulder Park GS and Kettle Falls CT generating units are primarily used to meet peaking electric requirements. We also operate these facilities when marginal costs are below prevailing wholesale electric prices. These generating facilities have access to natural gas supplies that are adequate to meet their respective operating needs.
See "Item 2. Properties - Avista Utilities - Generation Properties" for the nameplate rating and present generating capabilities of the above thermal resources.
We have the exclusive rights to all the capacity of the Lancaster Plant, a 270 MW natural gas-fired combined cycle combustion turbine plant located in northern Idaho, owned by an unrelated third-party. All of the output from the Lancaster Plant is contracted to us through 2026 under a PPA. Under the terms of the PPA, we make the dispatch decisions, provide all natural gas fuel and receive all of the electric energy output from the Lancaster Plant; therefore, we consider this plant in our baseload resources. See "Note 6 of the Notes to Consolidated Financial Statements" for further discussion of this PPA.
The following graph shows Avista Utilities' thermal generation (in thousands of MWhs) during the year ended December 31:
Wind Resources We have exclusive rights to all the capacity of Palouse Wind, a wind generation project developed, owned and managed by an unrelated third-party and located in Whitman County, Washington. The PPA expires in 2042 and requires us to acquire all of the power and renewable attributes produced by the project at a fixed price per MWh with a fixed escalation of
7
the price over the term of the agreement. The project has a nameplate capacity of 105 MW. Generation from Palouse Wind was 302,136 MWhs in 2019, 327,172 MWhs in 2018 and 300,380 MWhs in 2017. We have an annual option to purchase the wind project beginning in December 2022. The purchase price is a fixed price per KW of in-service capacity with a fixed decline in the price per KW over the remaining 20-year term of the PPA. Under the terms of the PPA, we do not have any input into the day-to-day operation of the project, including maintenance decisions. All such rights are held by the owner.
In March 2019, we signed a PPA with Clearway Energy Group (Clearway) to purchase all of the power generated from the Rattlesnake Flat Wind project in Adams County, Washington. The facility has a nameplate capacity of 144 MW and is expected to generate approximately 50 aMW annually. The PPA is a 20-year agreement with deliveries expected to begin in 2020. The PPA provides Avista Corp. with additional renewable energy, capacity and environmental attributes. Under the terms of the PPA, we do not have any input into the day-to-day operation of the project, including maintenance decisions. All such rights are held by the owner.
Solar Resources We have exclusive rights to all the capacity of the Lind Solar Farm, a solar generation project developed, owned and managed by an unrelated third-party and located in Lind, Washington. The PPA expires in 2038 and requires us to acquire all the power and renewable attributes produced by the project at a fixed price per MWh. The project has a nameplate capacity of 28 MW. The facility became operational in the fourth quarter of 2018 and generated 42,346 and 584 MWhs in 2019 and 2018, respectively. Under the terms of the PPA, we do not have any input into the day-to-day operation of the project, including maintenance decisions. All such rights are held by the owner. In addition to the Lind Solar Farm, we also own a community solar array located in Spokane Valley, Washington with a nameplate capacity of 0.4 MW. The community solar array generated 561 and 538 MWhs during 2019 and 2018, respectively.
Other Purchases, Exchanges and Sales In addition to the resources described above, we purchase and sell power under various long-term contracts, and we also enter into short-term purchases and sales. Further, pursuant to The Public Utility Regulatory Policies Act of 1978, as amended, we are required to purchase generation from qualifying facilities. This includes, among other resources, hydroelectric projects, cogeneration projects and wind generation projects at rates approved by the WUTC and the IPUC.
See “Avista Utilities Electric Operating Statistics – Electric Operations” below for annual quantities of purchased power, wholesale power sales and power from exchanges in 2019, 2018 and 2017. See “Electric Operations” above for additional information with respect to the use of wholesale purchases and sales as part of our resource optimization process and also see "Future Resource Needs" below for the magnitude of these power purchase and sales contracts in future periods.
Hydroelectric Licenses
Avista Corp. is a licensee under the Federal Power Act (FPA) as administered by the FERC, which includes regulation of hydroelectric generation resources. Excluding the Little Falls Hydroelectric Generating Project (Little Falls), our other seven hydroelectric plants are regulated by the FERC through two project licenses. The licensed projects are subject to the provisions of Part I of the FPA. These provisions include payment for headwater benefits, condemnation of licensed projects upon payment of just compensation, and take-over by the federal government of such projects after the expiration of the license upon payment of the lesser of “net investment” or “fair value” of the project, in either case, plus severance damages. In the unlikely event that a take-over occurs, it could lead to either the decommissioning of the hydroelectric project or offering the project to another party (likely through sale and transfer of the license).
Cabinet Gorge and Noxon Rapids are under one 45-year FERC license issued in 2001. See “Item 7. Management's Discussion and Analysis – Environmental Issues and Contingencies" for discussion of dissolved atmospheric gas levels that exceed state of Idaho and federal numeric water quality standards downstream of Cabinet Gorge during periods when we must divert excess river flows over the spillway, as well as our mitigation plans and efforts.
Five of our six hydroelectric projects on the Spokane River (Long Lake, Nine Mile, Upper Falls, Monroe Street and Post Falls) are under one 50-year FERC license issued in 2009 and are referred to collectively as the Spokane River Project. The sixth, Little Falls, is operated under separate Congressional authority and is not licensed by the FERC.
Future Resource Needs
Avista Utilities has operational strategies to provide sufficient resources to meet our energy requirements under a range of operating conditions. These operational strategies consider the amount of energy needed, which varies widely because of the factors that influence demand over intra-hour, hourly, daily, monthly and annual durations. Our average hourly load was 1,081 aMW in 2019, 1,034 aMW in 2018 and 1,070 aMW in 2017.
8
The following graph shows our forecast of our average annual energy requirements and our available resources for 2020 through 2023:
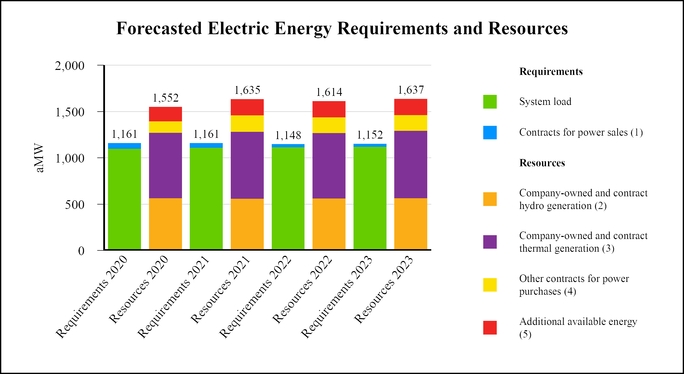
(1) | The contracts for power sales decrease due to certain contracts expiring in each of these years. We are evaluating the future plan for the additional resources made available due to the expiration of these contracts. |
(2) | The forecast assumes near normal hydroelectric generation. |
(3) | Includes the Lancaster Plant PPA. Excludes Boulder Park GS, Kettle Falls CT, Northeast CT and Rathdrum CT, as these are considered peaking facilities and are generally not used to meet our base load requirements. |
(4) | Other contracts for power purchases includes power purchase agreements for solar and wind energy. |
(5) | The combined maximum capacity of Boulder Park GS, Kettle Falls CT, Northeast CT and Rathdrum CT is 278 MW, with estimated available energy production as indicated for each year. |
In August 2017, we filed our 2017 Electric IRP with the WUTC and the IPUC. The WUTC and IPUC review the IRPs and give the public the opportunity to comment. The WUTC and IPUC do not approve or disapprove of the content in the IRPs; rather they acknowledge that the IRPs were prepared in accordance with applicable standards if that is the case. The IRP details projected growth in demand for energy and the new resources needed to serve customers over the next 20 years. We regard the IRP as a tool for resource evaluation, rather than an acquisition plan for a particular project.
We are required to file an electric IRP every two years. We filed petitions with the WUTC and IPUC in January 2019 to extend the current electric IRP from August 31, 2019 to February 28, 2020 because of the uncertainty created by new clean energy laws in Washington. The WUTC and IPUC approved our petitions. Subsequent to these approvals, the WUTC issued an order extending the deadline to file the IRP until April 2021. We will file an IRP in Idaho on February 28, 2020. Our resource strategy includes additional clean energy resources and potential for existing resource retirements. This plan is subject to change in the 2021 IRP due to rulemaking in Washington State to implement the Clean Energy Transformation Act.
Highlights of the 2020 IRP include the following expectations and/or assumptions:
• | Models the clean energy requirements of CETA in Washington State. |
• | Optimizing a resource portfolio for 25 years instead of 20 years. |
• | Assumes Colstrip exits the portfolio in 2025, and then studies the cost impacts of extending the project to 2035 for servicing loads outside of Washington. |
• | Assumes the Northeast CT retires in 2035. |
• | A cap and trade greenhouse gas emissions cap applies in modeling Oregon. |
9
• | Uses a full demand response (DR) potential assessment for potential DR programs for both residential and commercial/industrial customers. |
• | Includes social cost of carbon costs, using the 2.5 percent discount rate proscribed in CETA, for Washington's share of resource emissions and market purchases for new resource acquisitions, DR programs, and energy efficiency. |
• | Includes cost of upstream greenhouse gas emissions from the natural gas-fired projects at the social cost of carbon for Washington share of resources. |
• | Modeled wind, solar, pumped hydro storage, nuclear, and geothermal as purchase power agreements; whereas previous IRPs assumed these resources would be modeled as an owned resource. |
• | Modeled several energy storage options in this IRP including pumped hydro storage, lithium-ion, vanadium flow, zinc bromide flow, liquid air, and hydrogen all with varying energy durations. The previous IRP modeled storage generically. |
We are subject to the Washington State Energy Independence Act, which requires us to obtain a portion of our electricity from qualifying renewable resources or through purchase of RECs and acquiring all cost effective conservation measures. Future generation resource decisions will be affected by legislation for restrictions on greenhouse gas emissions and renewable energy requirements.
See “Item 7. Management’s Discussion and Analysis of Financial Condition – Environmental Issues and Contingencies” for information related to existing laws, as well as potential legislation that could influence our future electric resource mix.
Natural Gas Operations
General Avista Utilities provides natural gas distribution services to retail customers in parts of eastern Washington, northern Idaho, and northeastern and southwestern Oregon.
Market prices for natural gas, like other commodities, can be volatile. Our natural gas procurement strategy is to provide a reliable supply to our customers with some level of price certainty. We procure natural gas from various supply basins and over varying time periods. The resulting portfolio is a diversified mix of forward fixed price purchases, index and spot market purchases, and utilizing physical and financial derivative instruments. We also use natural gas storage to support high demand periods and to procure natural gas when prices may be lower. Securing prices throughout the year and even into subsequent years provides a level of price certainty and can mitigate price volatility to customers between years.
Weather is a key component of our natural gas customer load. This load is highly variable and daily natural gas loads can differ significantly from the monthly forecasted load projections. We make continuing projections of our natural gas loads and assess available natural gas resources. On the basis of these projections, we plan and execute a series of transactions to hedge a portion of our customers' projected natural gas requirements through forward market transactions and derivative instruments. These transactions may extend for multiple years into the future. We also leave a portion of our natural gas supply requirements unhedged for purchase in the short-term spot markets.
Our purchase of natural gas supply is governed by our procurement plan and is reviewed and approved annually by the Risk Management Committee (RMC), which is comprised of certain officers and other management personnel. Once approval is received, the plan is implemented and monitored by our gas supply and risk management groups.
The plan’s progress is also presented to the WUTC and IPUC staff in semi-annual meetings, and updates are given to the OPUC staff quarterly. The RMC is provided with an update on plan results and changes in their monthly meetings. These activities provide transparency for the natural gas supply procurement plan. Any material changes to the plan are documented and communicated to RMC members.
As part of the process of balancing natural gas retail load requirements with resources, we engage in the wholesale purchase and sale of natural gas. We plan for sufficient natural gas delivery capacity to serve our retail customers for a theoretical peak day event. We generally have more pipeline and storage capacity than what is needed during periods other than a peak day. We optimize our natural gas resources by using market opportunities to generate economic value that helps mitigate fixed costs. Wholesale sales are delivered through wholesale market facilities outside of our natural gas distribution system. Natural gas resource optimization activities include, but are not limited to:
• | wholesale market sales of surplus natural gas supplies, |
• | purchases and sales of natural gas to optimize use of pipeline and storage capacity, and |
• | participation in the transportation capacity release market. |
10
We also provide distribution transportation service to qualified, large commercial and industrial natural gas customers who purchase natural gas through third-party marketers. For these customers, we receive their purchased natural gas from such third-party marketers into our distribution system and deliver it to the customers’ premise.
Optimization transactions that we engage in throughout the year are included in our annual purchased gas cost adjustment filings with the various commissions and are subject to review for prudence during this process.
Natural Gas Supply Avista Utilities purchases all of its natural gas in wholesale markets. We are connected to multiple supply basins in the western United States and Canada through firm capacity transportation rights on six different pipeline networks. Access to this diverse portfolio of natural gas resources allows us to make natural gas procurement decisions that benefit our natural gas customers. These interstate pipeline transportation rights provide the capacity to serve approximately 25 percent of peak natural gas customer demands from domestic sources and 75 percent from Canadian sourced supply. Natural gas prices in the Pacific Northwest are affected by global energy markets, as well as supply and demand factors in other regions of the United States and Canada. Future prices and delivery constraints may cause our resource mix to vary.
Natural Gas Storage Avista Utilities owns a one-third interest in Jackson Prairie, an underground aquifer natural gas storage field located near Chehalis, Washington. Jackson Prairie has a total peak day deliverability of 12 million therms, with a total working natural gas capacity of 256 million therms. As an owner, our share is one-third of the peak day deliverability and total working capacity. We also contract for additional storage capacity and delivery at Jackson Prairie from Northwest Pipeline for a portion of their one-third share of the storage project.
We optimize our natural gas storage capacity throughout the year by executing transactions that capture favorable market price spreads. Natural gas buyers identify opportunities to purchase lower cost natural gas in the immediate term to inject into storage, and then sell the gas in a forward market to be withdrawn at a later time. The reverse of this type of transaction also occurs. These transactions lock in incremental value for customers. Jackson Prairie is also used as a variable peaking resource, and to protect from extreme daily price volatility during cold weather or other events affecting the market.
Future Resource Needs In August 2018, we filed our 2018 Natural Gas IRP with the WUTC, the IPUC and the OPUC. The IRP details projected growth in demand for energy and the new resources needed to serve customers over the next 20 years. We regard the IRP as a tool for resource evaluation, rather than an acquisition plan for a particular project.
Highlights of the 2018 natural gas IRP include the following expectations and/or assumptions:
• | We will need no additional natural gas transportation resources during the 20-year planning horizon in Washington, Idaho, or Oregon. |
• | Due to expected carbon legislation at the state levels through a cap and trade mechanism (Oregon) or a fee mechanism (Washington), we expect natural gas prices to include a carbon price adder in Oregon and Washington, but not in Idaho. |
• | North American supplies of natural gas will continue to be abundant led by shale gas development. |
• | Customer growth in our service territory will increase slightly compared to the 2016 IRP. There will be increasing interest from customers to utilize natural gas for heating due to its abundant supply and consequent low cost. |
• | We anticipate that any increased demand for natural gas regionally will primarily come from power generation as natural gas is increasingly being used to back up solar and wind technology, and also to replace retired coal plants. There is also potential for increased usage in other markets, such as LNG exports or exports to Mexico. |
• | Slightly higher customer growth will continue to be offset by lower use per customer and an increased amount of demand side management (DSM). The combination of low-priced natural gas in addition to carbon fees or other programs has led to a higher potential for DSM measures as compared to the previous three IRPs. |
• | The availability of natural gas in North America will continue to change global LNG dynamics. Existing and new LNG facilities will look to export low cost North American natural gas to the higher-priced foreign markets. This could alter the price of natural gas and/or transportation in U.S. markets, constrain existing pipeline networks, stimulate development of new pipeline resources and change flows of natural gas across North America. |
We will monitor these assumptions on an on-going basis and adjust our resource requirements accordingly.
11
We are required to file a natural gas IRP every two years, with the next IRP expected to be filed during the third quarter of 2020. Our resource strategy in our 2020 IRP may change from the 2018 IRP based on market, legislative and regulatory developments.
Regulatory Issues
General As a public utility, Avista Corp. is subject to regulation by state utility commissions for prices, accounting, the issuance of securities and other matters. The retail electric and natural gas operations are subject to the jurisdiction of the WUTC, IPUC, OPUC and MPSC. Approval of the issuance of securities is not required from the MPSC. We are also subject to the jurisdiction of the FERC for licensing of hydroelectric generation resources, and for electric transmission services and wholesale sales.
Since Avista Corp. is a “holding company” (in addition to being itself an operating utility), we are also subject to the jurisdiction of the FERC under the Public Utility Holding Company Act of 2005, which imposes certain reporting and other requirements. We, and all of our subsidiaries (whether or not engaged in any energy related business), are required to maintain books, accounts and other records in accordance with the FERC regulations and to make them available to the FERC and the state utility commissions. In addition, upon the request of any jurisdictional state utility commission, the FERC would have the authority to review assignment of costs of non-power goods and administrative services among us and our subsidiaries. The FERC has the authority generally to require that rates subject to its jurisdiction be just and reasonable and in this context would continue to be able to, among other things, review transactions of any affiliated company.
Our rates for retail electric and natural gas services (other than specially negotiated retail rates for industrial or large commercial customers, which are subject to regulatory review and approval) are generally determined on a “cost of service” basis.
Rates are designed to provide an opportunity for us to recover allowable operating expenses and earn a return of and a reasonable return on “rate base.” Rate base is generally determined by reference to the original cost (net of accumulated depreciation) of utility plant in service, subject to various adjustments for deferred income taxes and other items. Over time, rate base is increased by additions to utility plant in service and reduced by depreciation and retirement of utility plant and write-offs as authorized by the utility commissions. Our operating expenses and rate base are allocated or directly assigned to five regulatory jurisdictions: electric in Washington and Idaho, and natural gas in Washington, Idaho and Oregon. In general, requests for new retail rates are made on the basis of revenues, operating expenses and net investment for a test year that ended prior to the date of the request, subject to possible adjustments, which differ among the various jurisdictions, designed to reflect the expected revenues, operating expenses and net investment during the period new retail rates will be in effect. The retail rates approved by the state commissions in a rate proceeding may not provide sufficient revenues to provide recovery of costs and a reasonable return on investment for a number of reasons, including, but not limited to, ongoing capital expenditures and unexpected changes in revenues and expenses following the time new retail rates are requested in the rate proceeding, the denial by the commission of recovery, or timely recovery, of certain expenses or investment and the limitation by the commission of the authorized return on investment.
Our rates for wholesale electric and natural gas transmission services are based on either “cost of service” principles or market-based rates as set forth by the FERC. See “Notes 1, 12 and 22 of the Notes to Consolidated Financial Statements” for additional information about regulation, depreciation and deferred income taxes.
General Rate Cases Avista Utilities regularly reviews the need for electric and natural gas rate changes in each state in which we provide service. See “Item 7. Management’s Discussion and Analysis – Regulatory Matters – General Rate Cases” for information on general rate case activity.
Power Cost Deferrals Avista Utilities defers the recognition in the income statement of certain power supply costs that vary from the level currently recovered from our retail customers as authorized by the WUTC and the IPUC. See “Item 7. Management’s Discussion and Analysis – Regulatory Matters – Power Cost Deferrals and Recovery Mechanisms” and “Note 22 of the Notes to Consolidated Financial Statements” for information on power cost deferrals and recovery mechanisms in Washington and Idaho.
Purchased Gas Adjustments (PGA) Under established regulatory practices in each state, Avista Utilities defers the recognition in the income statement of the natural gas costs that vary from the level currently recovered from our retail customers as authorized by each of our jurisdictions. See “Item 7. Management’s Discussion and Analysis – Regulatory Matters – Purchased Gas Adjustments” and “Note 22 of the Notes to Consolidated Financial Statements” for information on natural gas cost deferrals and recovery mechanisms in Washington, Idaho and Oregon.
12
Decoupling Mechanisms Decoupling (also known as FCA in Idaho) is a mechanism designed to sever the link between a utility's revenues and consumers' energy usage. In each of its jurisdictions, Avista Utilities' electric and natural gas revenues are adjusted so as to be based on the number of customers in certain customer rate classes and assumed "normal" usage, rather than being based on actual usage. The difference between revenues based on the number of customers and "normal" sales and revenues based on actual usage is deferred and either surcharged or rebated to customers beginning in the following year. See “Item 7. Management’s Discussion and Analysis – Regulatory Matters – Decoupling and Earnings Sharing Mechanisms” for further discussion of these mechanisms.
Federal Laws Related to Wholesale Competition
Federal law promotes practices that foster competition in the electric wholesale energy market. The FERC requires electric utilities to transmit power and energy to or for wholesale purchasers and sellers, and requires electric utilities to enhance or construct transmission facilities to create additional transmission capacity for the purpose of providing these services. Public utilities (through subsidiaries or affiliates) and other entities may participate in the development of independent electric generating plants for sales to wholesale customers.
Public utilities operating under the FPA are required to provide open and non-discriminatory access to their transmission systems to third parties and establish an Open Access Same-Time Information System to provide an electronic means by which transmission customers can obtain information about available transmission capacity and purchase transmission access. The FERC also requires each public utility subject to the rules to operate its transmission and wholesale power merchant operating functions separately and to comply with standards of conduct designed to ensure that all wholesale users, including the public utility’s power merchant operations, have equal access to the public utility’s transmission system. Our compliance with these standards has not had any substantive impact on the operation, maintenance and marketing of our transmission system or our ability to provide service to customers.
See “Item 7. Management’s Discussion and Analysis – Competition” for further information.
Regional Transmission Planning
Beginning with FERC Order No. 888 and continuing with subsequent rulemakings and policies, the FERC has encouraged better coordination and operational consistency aimed to capture efficiencies that might otherwise be gained through the formation of a Regional Transmission Organization or an independent system operator (ISO).
The Company currently meets its FERC requirements to coordinate transmission planning activities with other regional entities through ColumbiaGrid. ColumbiaGrid is a Washington nonprofit membership corporation with an independent board formed to improve the operational efficiency, reliability, and planned expansion of the transmission grid in the Pacific Northwest. We became a member of ColumbiaGrid in 2006 during its formation. ColumbiaGrid is not an ISO, but fills the role of facilitating the regional transmission planning requirements of FERC Order Nos. 890 and 1000, and their follow-on orders, for its members. ColumbiaGrid and its members also work with other western organizations, including WestConnect and the Northern Tier Transmission Group (NTTG), to address broader interregional planning.
Certain ColumbiaGrid members, including Avista Corp. and BPA (ColumbiaGrid’s largest funding member), and the members of NTTG have been working to develop a combined single regional planning organization for the Pacific Northwest region, NorthernGrid. These parties have attained FERC acceptance of the NorthernGrid Funding Agreement and continue to work toward FERC acceptance of the NorthernGrid structure and transitioning coordinated transmission planning activities from ColumbiaGrid and NTTG to NorthernGrid by December 31, 2020. Neither the costs nor requirements of participating in either of these regional transmission planning organizations are expected to materially impact the Company’s operations or financial performance.
Regional Energy Markets
The California Independent System Operator (CAISO) operates the Western Energy Imbalance Market (EIM) in the western United States. Most investor-owned utilities in the Pacific Northwest are either participants in the Western EIM or plan to integrate into the market in the near future. The Company has announced its decision to participate in the Western EIM and is slated to commence EIM operations by April 2022. The decision to join the Western EIM is based on a number of factors, including the amount of expected variable generating resources the Company will need to integrate within its balancing authority area in the foreseeable future, and the expected costs and benefits associated with joining the Western EIM.
Reliability Standards
Among its other provisions, the U.S. Energy Policy Act provides for the implementation of mandatory reliability standards and authorizes the FERC to assess penalties for non-compliance with these standards and other FERC regulations.
13
The FERC certified the NERC as the single Electric Reliability Organization authorized to establish and enforce reliability standards and delegate authority to regional entities for the purpose of establishing and enforcing reliability standards. The FERC approves NERC Reliability Standards, including western region standards that make up the set of legally enforceable standards for the United States bulk electric system. The first of these reliability standards became effective in 2007. From time to time new standards are developed or existing standards are updated, revised, consolidated or eliminated pursuant to an industry-involved process. We are required to self-certify our compliance with these standards on an annual basis and undergo regularly scheduled periodic reviews by the NERC and its regional entity, the Western Electricity Coordinating Council (WECC). Failure to comply with NERC reliability standards could result in financial penalties of up to approximately $1.3 million per day per violation. We have a robust internal compliance program in place to manage compliance activities and mitigate the risk of potential noncompliance with these standards. We do not expect the costs associated with compliance with these standards to have a material impact on our financial results.
As both a balancing authority and transmission operator, the Company must operate under the oversight of a reliability coordinator per NERC reliability standards. The California ISO’s RC West is the reliability coordinator of record for 41 balancing authorities and transmission operators in the Western Interconnection, including Avista Corp. RC West oversees grid compliance with federal and regional grid standards, and can determine measures to prevent or mitigate system emergencies in day-ahead or real-time operations.
Vulnerability to Cyberattack
The energy sector, particularly electric and natural gas utility companies in the United States and abroad, have become the subject of cyberattacks and ransomware attacks with increased frequency. The Company’s administrative and operating networks are targeted by hackers on a regular basis.
A successful attack on the Company’s administrative networks could compromise the security and privacy of data, including operating, financial and personal information. A successful attack on the Company’s operating networks could impair the operation of the Company’s electric and/or natural gas utility facilities, possibly resulting in the inability to provide electric and/or natural gas service for extended periods of time.
The Company continually reinforces and updates its defensive systems and is in compliance with NERC’s reliability standards. See “Reliability Standards," "Item 1A. Risk Factors – Cyber and Technology Risk Factors” and “Item 7. Management’s Discussion and Analysis of Financial Condition and Results of Operations – Enterprise Risk Management – Cyber and Technology Risks” for further information.
14
AVISTA UTILITIES ELECTRIC OPERATING STATISTICS
Years Ended December 31, | |||||||||||
2019 | 2018 | 2017 | |||||||||
ELECTRIC OPERATIONS | |||||||||||
OPERATING REVENUES (Dollars in Thousands): | |||||||||||
Residential | $ | 369,102 | $ | 368,753 | $ | 381,682 | |||||
Commercial | 317,589 | 314,532 | 311,593 | ||||||||
Industrial | 105,802 | 109,846 | 110,982 | ||||||||
Public street and highway lighting | 7,448 | 7,539 | 7,484 | ||||||||
Total retail | 799,941 | 800,670 | 811,741 | ||||||||
Wholesale | 73,232 | 84,956 | 81,512 | ||||||||
Sales of fuel | 48,040 | 62,219 | 64,925 | ||||||||
Other | 28,995 | 29,301 | 31,614 | ||||||||
Alternative revenue programs | 8,699 | 4,870 | (8,220 | ) | |||||||
Deferrals and amortizations for rate refunds to customers | 3,141 | (11,477 | ) | (1,182 | ) | ||||||
Total electric operating revenues | $ | 962,048 | $ | 970,539 | $ | 980,390 | |||||
ENERGY SALES (Thousands of MWhs): | |||||||||||
Residential | 3,766 | 3,627 | 3,840 | ||||||||
Commercial | 3,170 | 3,156 | 3,222 | ||||||||
Industrial | 1,691 | 1,772 | 1,815 | ||||||||
Public street and highway lighting | 18 | 18 | 20 | ||||||||
Total retail | 8,645 | 8,573 | 8,897 | ||||||||
Wholesale | 2,787 | 3,632 | 2,881 | ||||||||
Total electric energy sales | 11,432 | 12,205 | 11,778 | ||||||||
ENERGY RESOURCES (Thousands of MWhs): | |||||||||||
Hydro generation (from Company facilities) | 3,520 | 4,029 | 3,978 | ||||||||
Thermal generation (from Company facilities) | 4,054 | 3,424 | 3,476 | ||||||||
Purchased power | 4,833 | 5,349 | 4,809 | ||||||||
Power exchanges | (504 | ) | (109 | ) | (6 | ) | |||||
Total power resources | 11,903 | 12,693 | 12,257 | ||||||||
Energy losses and Company use | (471 | ) | (488 | ) | (479 | ) | |||||
Total energy resources (net of losses) | 11,432 | 12,205 | 11,778 | ||||||||
NUMBER OF RETAIL CUSTOMERS (Average for Period): | |||||||||||
Residential | 345,064 | 340,308 | 334,848 | ||||||||
Commercial | 42,930 | 42,618 | 42,154 | ||||||||
Industrial | 1,305 | 1,318 | 1,328 | ||||||||
Public street and highway lighting | 612 | 594 | 569 | ||||||||
Total electric retail customers | 389,911 | 384,838 | 378,899 | ||||||||
RESIDENTIAL SERVICE AVERAGES: | |||||||||||
Annual use per customer (KWh) | 10,914 | 10,658 | 11,469 | ||||||||
Revenue per KWh (in cents) | 9.80 | 10.17 | 9.94 | ||||||||
Annual revenue per customer | $ | 1,069.66 | $ | 1,083.58 | $ | 1,139.87 | |||||
AVERAGE HOURLY LOAD (aMW) | 1,081 | 1,034 | 1,070 | ||||||||
15
AVISTA UTILITIES ELECTRIC OPERATING STATISTICS
Years Ended December 31, | ||||||||
2019 | 2018 | 2017 | ||||||
RETAIL NATIVE LOAD at time of system peak (MW): | ||||||||
Winter | 1,577 | 1,555 | 1,681 | |||||
Summer | 1,656 | 1,716 | 1,596 | |||||
COOLING DEGREE DAYS: (1) | ||||||||
Spokane, WA | ||||||||
Actual | 488 | 517 | 743 | |||||
Historical average | 531 | 544 | 529 | |||||
% of average | 92 | % | 95 | % | 140 | % | ||
HEATING DEGREE DAYS: (2) | ||||||||
Spokane, WA | ||||||||
Actual | 6,817 | 6,159 | 6,783 | |||||
Historical average | 6,613 | 6,593 | 6,578 | |||||
% of average | 103 | % | 93 | % | 103 | % | ||
(1) | Cooling degree days are the measure of the warmness of weather experienced, based on the extent to which the average of high and low temperatures for a day exceeds 65 degrees Fahrenheit (annual degree days above historical average indicate warmer than average temperatures). |
(2) | Heating degree days are the measure of the coldness of weather experienced, based on the extent to which the average of high and low temperatures for a day falls below 65 degrees Fahrenheit (annual degree days below historical averages indicate warmer than average temperatures). |
16
AVISTA UTILITIES NATURAL GAS OPERATING STATISTICS
Years Ended December 31, | |||||||||||
2019 | 2018 | 2017 | |||||||||
NATURAL GAS OPERATIONS | |||||||||||
OPERATING REVENUES (Dollars in Thousands): | |||||||||||
Residential | $ | 196,430 | $ | 194,340 | $ | 220,176 | |||||
Commercial | 92,168 | 89,341 | 104,240 | ||||||||
Interruptible | 2,257 | 1,886 | 1,901 | ||||||||
Industrial | 3,006 | 2,867 | 3,756 | ||||||||
Total retail | 293,861 | 288,434 | 330,073 | ||||||||
Wholesale | 135,039 | 137,070 | 142,722 | ||||||||
Transportation | 8,674 | 9,103 | 9,208 | ||||||||
Other | 7,375 | 6,824 | 6,411 | ||||||||
Alternative revenue programs | 915 | (3,962 | ) | (11,374 | ) | ||||||
Deferrals and amortizations for rate refunds to customers | 1,368 | (6,764 | ) | (2,392 | ) | ||||||
Total natural gas operating revenues | $ | 447,232 | $ | 430,705 | $ | 474,648 | |||||
THERMS DELIVERED (Thousands of Therms): | |||||||||||
Residential | 231,238 | 208,344 | 221,982 | ||||||||
Commercial | 140,578 | 124,670 | 133,343 | ||||||||
Interruptible | 9,138 | 5,750 | 5,465 | ||||||||
Industrial | 6,212 | 5,801 | 6,340 | ||||||||
Total retail | 387,166 | 344,565 | 367,130 | ||||||||
Wholesale | 590,802 | 503,913 | 545,348 | ||||||||
Transportation | 187,514 | 176,439 | 186,222 | ||||||||
Interdepartmental and Company use | 421 | 412 | 441 | ||||||||
Total therms delivered | 1,165,903 | 1,025,329 | 1,099,141 | ||||||||
NUMBER OF RETAIL CUSTOMERS (Average for Period): | |||||||||||
Residential | 321,343 | 314,800 | 307,375 | ||||||||
Commercial | 35,804 | 35,488 | 35,192 | ||||||||
Interruptible | 45 | 39 | 37 | ||||||||
Industrial | 241 | 246 | 251 | ||||||||
Total natural gas retail customers | 357,433 | 350,573 | 342,855 | ||||||||
RESIDENTIAL SERVICE AVERAGES: | |||||||||||
Annual use per customer (therms) | 720 | 662 | 722 | ||||||||
Revenue per therm (in dollars) | $ | 0.85 | $ | 0.93 | $ | 0.99 | |||||
Annual revenue per customer | $ | 611.28 | $ | 617.35 | $ | 716.31 | |||||
HEATING DEGREE DAYS: (1) | |||||||||||
Spokane, WA | |||||||||||
Actual | 6,817 | 6,159 | 6,783 | ||||||||
Historical average | 6,613 | 6,593 | 6,578 | ||||||||
% of average | 103 | % | 93 | % | 103 | % | |||||
Medford, OR | |||||||||||
Actual | 4,439 | 4,155 | 4,254 | ||||||||
Historical average | 4,291 | 4,297 | 4,305 | ||||||||
% of average | 103 | % | 97 | % | 99 | % | |||||
(1) | Heating degree days are the measure of the coldness of weather experienced, based on the extent to which the average of high and low temperatures for a day falls below 65 degrees Fahrenheit (annual degree days below historic indicate warmer than average temperatures). |
17
ALASKA ELECTRIC LIGHT AND POWER COMPANY
AEL&P is the primary operating subsidiary of AERC. AEL&P is the sole utility providing electrical energy in Juneau, Alaska. Juneau is a geographically isolated community with no electric interconnections with the transmission facilities of other utilities and no pipeline access to natural gas or other fuels. Juneau’s economy is primarily driven by government activities, tourism, commercial fishing, and mining, as well as activities as the commercial hub of southeast Alaska.
AEL&P owns and operates electric generation, transmission and distribution facilities located in Juneau. AEL&P operates five hydroelectric generation facilities with 102.7 MW of hydroelectric generation capacity as of December 31, 2019. AEL&P owns four of these generation facilities (totaling 24.5 MW of capacity) and has a PPA for the entire output of the Snettisham hydroelectric project (totaling 78.2 MW of capacity).
The Snettisham hydroelectric project is owned by the Alaska Industrial Development and Export Authority (AIDEA), a public corporation of the State of Alaska. AIDEA issued revenue bonds in 1998 (which were refinanced in 2015) to finance its acquisition of the project. These bonds were outstanding in the amount of $54.6 million at December 31, 2019 and mature in January 2034. AEL&P has a PPA and operating and maintenance agreement with the AIDEA to operate and maintain the facility. This PPA is a take-or-pay obligation, expiring in December 2038, to purchase all of the output of the project. AIDEA's bonds are payable solely out of the revenues received under the PPA. Amounts payable by AEL&P under the PPA are equal to the required debt service on the bonds plus operating and maintenance costs.
This PPA is a finance lease and, as of December 31, 2019, the finance lease obligation was $54.6 million. Snettisham Electric Company, a non-operating subsidiary of AERC, has the option to purchase the Snettisham project at any time for a price equal to the principal amount of the bonds outstanding at that time. See "Note 5 of the Notes to Consolidated Financial Statements" for further discussion of the Snettisham finance lease obligation.
As of December 31, 2019, AEL&P also had 107.5 MW of diesel generating capacity from four facilities to provide back-up service to firm customers when necessary.
The following graph shows AEL&P's hydroelectric generation (in thousands of MWhs) during the time periods indicated below:

Normal hydroelectric generation is defined as the energy output of the plant during a year with average inflows to the reservoir. Normal annual hydroelectric generation for AEL&P is approximately 430,000 MWhs.
As of December 31, 2019, AEL&P served approximately 17,000 customers. Its primary customers include city, state and federal governmental entities located in Juneau, as well as a mine located in the Juneau area. Most of AEL&P’s customers are served on a firm basis while certain of its customers, including its largest customer, are served on an interruptible sales basis. AEL&P maintains separate rate tariffs for each of its customer classes, as well as seasonal rates.
18
AEL&P’s operations are subject to regulation by the RCA with respect to rates, standard of service, facilities, accounting and certain other matters, but not with respect to the issuance of securities. Rate adjustments for AEL&P’s customers require approval by the RCA pursuant to RCA regulations. See "Item 7. Management's Discussion and Analysis – Regulatory Matters" for further discussion of AEL&P's latest general rate case filing, including its capital structure.
AEL&P is also subject to the jurisdiction of the FERC with respect to permits and licenses necessary to operate certain of its hydroelectric facilities. One of these licenses (for the Salmon Creek and Annex Creek hydroelectric projects) was renewed for 40 years, effective September 1, 2018. Since AEL&P has no electric interconnection with other utilities and makes no wholesale sales, it is not subject to general FERC jurisdiction, other than the reporting and other requirements of the Public Utility Holding Company Act of 2005 as an Avista Corp. subsidiary.
The Snettisham hydroelectric project is subject to regulation by the State of Alaska with respect to dam safety and certain aspects of its operations. In addition, AEL&P is subject to regulation with respect to air and water quality, land use and other environmental matters under both federal and state laws.
AEL&P ELECTRIC OPERATING STATISTICS
Years Ended December 31, | |||||||||||
2019 | 2018 | 2017 | |||||||||
ELECTRIC OPERATIONS | |||||||||||
OPERATING REVENUES (Dollars in Thousands): | |||||||||||
Residential | $ | 17,134 | $ | 18,506 | $ | 20,504 | |||||
Commercial and government | 19,391 | 25,989 | 31,726 | ||||||||
Public street and highway lighting | 254 | 263 | 279 | ||||||||
Total retail | 36,779 | 44,758 | 52,509 | ||||||||
Other | 486 | (1,159 | ) | 518 | |||||||
Total electric operating revenues | $ | 37,265 | $ | 43,599 | $ | 53,027 | |||||
ENERGY SALES (Thousands of MWhs): | |||||||||||
Residential | 143 | 149 | 151 | ||||||||
Commercial and government | 193 | 241 | 262 | ||||||||
Public street and highway lighting | 1 | 1 | 1 | ||||||||
Total electric energy sales | 337 | 391 | 414 | ||||||||
NUMBER OF RETAIL CUSTOMERS (Average for Period): | |||||||||||
Residential | 14,755 | 14,677 | 14,575 | ||||||||
Commercial and government | 2,280 | 2,234 | 2,210 | ||||||||
Public street and highway lighting | 228 | 224 | 217 | ||||||||
Total electric retail customers | 17,263 | 17,135 | 17,002 | ||||||||
RESIDENTIAL SERVICE AVERAGES: | |||||||||||
Annual use per customer (KWh) | 9,692 | 10,152 | 10,360 | ||||||||
Revenue per KWh (in cents) | 11.98 | 12.42 | 13.58 | ||||||||
Annual revenue per customer | $ | 1,161.23 | $ | 1,260.88 | $ | 1,406.79 | |||||
HEATING DEGREE DAYS: (1) | |||||||||||
Juneau, AK | |||||||||||
Actual | 7,476 | 7,973 | 8,515 | ||||||||
Historical average | 8,041 | 8,351 | 8,351 | ||||||||
% of average | 93 | % | 95 | % | 102 | % | |||||
(1) | Heating degree days are the measure of the coldness of weather experienced, based on the extent to which the average of high and low temperatures for a day falls below 65 degrees Fahrenheit (annual heating degree days below historical average indicate warmer than average temperatures). |
19
OTHER BUSINESSES
The following table shows our assets related to our other businesses, including intercompany amounts as of December 31, 2019 and 2018 (dollars in thousands):
Entity and Asset Type | 2019 | 2018 | ||||||
Avista Capital | ||||||||
Unconsolidated equity investments | 51,259 | 29,257 | ||||||
Note receivable - parent | 14,722 | — | ||||||
Real estate investments | 16,374 | 18,573 | ||||||
Notes receivable - third parties | 17,591 | 13,505 | ||||||
Other assets | 3,919 | 2,937 | ||||||
METALfx - wholly-owned subsidiary | — | 13,497 | ||||||
Alaska companies (AERC and AJT Mining) | 9,525 | 9,281 | ||||||
Total | $ | 113,390 | $ | 87,050 | ||||
Avista Capital
• | Unconsolidated equity investments are primarily in emerging technology venture capital funds and companies, including an investment in a joint venture focused on local real estate development and economic growth. |
• | Real estate consists of mixed use commercial, retail office space, and land. |
• | Other assets that consist of income tax receivables, cash and other deferred charges. |
• | AM&D, doing business as METALfx, performed custom sheet metal fabrication of electronic enclosures, parts and systems for the computer, construction, telecom, renewable energy and medical industries. METALfx was sold in April 2019. See "Note 25 of the Notes to Consolidated Financial Statements" for further discussion of the sale. |
Alaska companies
• | Includes AERC and AJT Mining, which is a wholly-owned subsidiary of AERC and is an inactive mining company holding certain real estate. |
As opportunities arise, we dispose of investments and phase out operations that do not fit with our overall corporate strategy. However, we may invest incremental funds to protect our existing investments and invest in new businesses that we believe fit with our overall corporate strategy.
ITEM 1A. RISK FACTORS
RISK FACTORS
The following factors could have a significant impact on our operations, results of operations, financial condition or cash flows. These factors could cause future results or outcomes to differ materially from those discussed in our reports filed with the SEC (including this Annual Report on Form 10-K), and elsewhere. Please also see “Forward-Looking Statements” for additional factors which could have a significant impact on our operations, results of operations, financial condition or cash flows and could cause actual results to differ materially from those anticipated in such statements.
Utility Regulatory Risk Factors
Regulators may not grant rates that provide timely or sufficient recovery of our costs or allow a reasonable rate of return for our shareholders.
Avista Utilities' annual operating expenses and the costs associated with incremental investments in utility assets continue to grow at a faster rate than revenue. Our ability to recover these expenses and capital costs depends on the adequacy and timeliness of retail rate increases allowed by regulatory agencies. We expect to periodically file for rate increases with regulatory agencies to recover our expenses and capital costs and provide an opportunity to earn a reasonable rate of return for shareholders. If regulators do not grant rate increases or grant substantially lower rate increases than our requests in the future or if recovery of deferred expenses is disallowed, it could have a negative effect on our financial condition, results of operations or cash flows. See further discussion of regulatory matters in "Item 7. Management's Discussion and Analysis – Regulatory Matters."
20
In the future, we may no longer meet the criteria for continued application of regulatory accounting principles for all or a portion of our regulated operations.
If we could no longer apply regulatory accounting principles, we could be:
• | required to write off our regulatory assets, and |
• | precluded from the future deferral of costs or decoupled revenues not recovered through rates at the time such amounts are incurred, even if we are expected to recover these amounts from customers in the future. |
See further discussion at "Note 1 of the Notes to Consolidated Financial Statements – Regulatory Deferred Charges and Credits."
Operational Risk Factors
Wildfires ignited, or allegedly ignited, by Avista Corp. equipment or facilities, could cause significant loss of life and property, thereby causing serious operational and financial harm to Avista Corp. and our customers.
Our equipment may be the ignition, or alleged cause of ignition, source for wildfires and in the event of a fire caused by our equipment, we could be held liable for resulting damages to life and property. Also, wildfires could lead to extended operational outages of our equipment while we wait for the wildfire to be extinguished before restoring power, and the cost to implement rapid response or any repair to such facilities could be significant. Any wildfires caused by our equipment could cause significant damage to our reputation, which could erode shareholder, customer and community satisfaction with our Company.
We are subject to various operational and event risks.
Our operations are subject to operational and event risks that include:
• | severe weather or natural disasters, including, but not limited to, avalanches, wind storms, wildfires, earthquakes, snow and ice storms, which could disrupt energy generation, transmission and distribution, as well as the availability and costs of materials, equipment, supplies support services and general business operations, |
• | blackouts or disruptions of interconnected transmission systems (the regional power grid), |
• | unplanned outages at generating plants, |
• | fuel cost and availability, including delivery constraints, |
• | explosions, fires, accidents, or mechanical breakdowns that could occur while operating and maintaining our generation, transmission and distribution systems, |
• | property damage or injuries to third parties caused by our generation, transmission and distribution systems, |
• | natural disasters that can disrupt energy generation, transmission and distribution, and general business operations, |
• | terrorist attacks or other malicious acts that may disrupt or cause damage to our utility assets or the vendors we utilize, and |
• | work-force issues, including changes in collective bargaining unit agreements, strikes, work stoppages, the loss of key executives, availability of workers in a variety of skill areas, and our ability to recruit and retain employees. |
Disasters could affect the general economy, financial and capital markets, specific industries, or our ability to conduct business. As protection against operational and event risks, we maintain business continuity and disaster recovery plans, maintain insurance coverage against some, but not all, potential losses and we seek to negotiate indemnification arrangements with contractors for certain event risks. However, insurance or indemnification agreements may not be adequate to protect us against liability, extra expenses and operating disruptions from all of the operational and event risks described above. In addition, we are subject to the risk that insurers and/or other parties will dispute or be unable to perform on their obligations to us. If insurance or indemnification agreements are unable to adequately protect us or reimburse us for out-of-pocket costs, it could have a material adverse effect on our results of operations, financial condition and cash flows.
Damage to facilities could be caused by severe weather or natural disasters, such as snow, ice, wind storms, wildfires, earthquakes or avalanches. The cost to implement rapid or any repair to such facilities can be significant. Overhead electric lines are most susceptible to damage caused by severe weather and are not covered by insurance.
21
Adverse impacts to AEL&P could result from an extended outage of its hydroelectric generating resources or its inability to deliver energy, due to its lack of interconnectivity to any other electrical grids and the cost of replacement power (diesel).
AEL&P operates several hydroelectric power generation facilities and has diesel generating capacity from multiple facilities to provide backup service to firm customers when necessary; however, a single hydroelectric power generation facility, the Snettisham hydroelectric project, provides approximately two-thirds of AEL&P’s hydroelectric power generation. Any issues that negatively affect AEL&P's ability to generate or transmit power or any decrease in the demand for the power generated by AEL&P could negatively affect our results of operations, financial condition and cash flows.
Cyber and Technology Risk Factors
Cyberattacks, ransomware, terrorism or other malicious acts could disrupt our businesses and have a negative impact on our results of operations and cash flows.
In the course of our operations, we rely on interconnected technology systems for operation of our generating plants, electric transmission and distribution systems, natural gas distribution systems, customer billing and customer service, accounting and other administrative processes and compliance with various regulations. In addition, in the ordinary course of business, we collect and retain sensitive information including personal information about our customers and employees.
Cyberattacks, ransomware, terrorism or other malicious acts could damage, destroy or disrupt these systems for an extended period of time. The energy sector, particularly electric and natural gas utility companies have become the subject of cyberattacks with increased frequency. Our administrative and operating networks are targeted by hackers on a regular basis. Additionally, the facilities and systems of clients, suppliers and third party service providers could be vulnerable to the same cyber or terrorism risks as our facilities and systems and such third party systems may be interconnected to our systems both physically and technologically. Therefore, an event caused by cyberattacks, ransomware or other malicious act at an interconnected third party could impact our business and facilities similarly. Any failure, unexpected, or unauthorized use of technology systems could result in the unavailability of such systems, and could result in a loss of operating revenues, an increase in operating expenses and costs to repair or replace damaged assets. Any of the above could also result in the loss or release of confidential customer and/or employee information or other proprietary data that could adversely affect our reputation and competitiveness, could result in costly litigation and negatively impact our results of operations. These cyberattacks have become more common and sophisticated and, as such, we could be required to incur costs to strengthen our systems and respond to emerging concerns.
Terrorist attacks could also be directed at our physical electric and natural gas facilities, as well as technology systems or at an interconnected third party, which could result in disruption to our systems.
There are various risks associated with technology systems such as hardware or software failure, communications failure, data distortion or destruction, unauthorized access to data, misuse of proprietary or confidential data, unauthorized control through electronic means, programming mistakes and other deliberate or inadvertent human errors.
Our technology may become obsolete or we may not have sufficient resources to manage our technology.
Our technology may become obsolete before the end of its useful life or it may not be sufficiently monitored for replacement or upgrade before it becomes obsolete. In addition, custom technology that is heavily relied upon by us may not be maintained and updated appropriately due to resource restraints, lack of appropriate expertise or other factors, which could cause technology failures or give rise to additional operational or security risks. Technology failures could result in significant adverse effects on our physical operations, results of operations, financial condition and cash flows.
We may be adversely affected by our inability to successfully implement certain technology projects.
We are in the process of replacing all of our electric meter infrastructure in Washington State with two-way communication advanced metering infrastructure (AMI). There are inherent risks associated with replacing and changing these types of systems, such as incorrect or nonfunctioning metering and/or delayed or inaccurate customer bills or unplanned outages, which could have a material adverse effect on our results of operations, financial condition and cash flows. Finally, there is the risk that we ultimately do not complete the project and will incur contract cancellation or other costs, which could be significant.
Strategic Risk Factors
Our strategic business plans, which may be affected by any or all of the foregoing, may change, including the entry into new businesses and/or the exit from existing businesses and/or the curtailment of our business development efforts where potential future business is uncertain.
22
Our strategic business plans could be affected by or result in any of the following:
• | disruptive innovations in the marketplace may outpace our ability to compete or manage our risk, |
• | customers may have a choice in the future over the sources from which to receive their energy and we may not be able to compete, |
• | potential difficulties in integrating acquired operations and in realizing expected opportunities, diversions of management resources and losses of key employees, challenges with respect to operating new businesses and other unanticipated risks and liabilities, |
• | market or other conditions that could adversely affect our operations or require changes to our business strategy and could result in a non-cash goodwill impairment charge that would reduce assets and net income, and |
• | potential reputational risk arising from repeated general rate case filings, degradation in the quality of service, or from failed strategic investments and opportunities, which could erode shareholder, customer and community satisfaction with the Company; |
• | the risk of municipalization or other form of service territory reduction. |
External Mandates Risk Factors
External mandate risk involves forces outside the Company, which may include significant changes in customer expectations, disruptive technologies that result in obsolescence of our business model and government action that could impact the Company.
Actions or limitations to address concerns over long-term climate change, both globally and within our utilities' service areas, may affect our operations and financial performance.
Legislative, regulatory and advocacy efforts at the state, national and international levels concerning climate change and other environmental issues could have significant impacts on our operations. The electric and natural gas utility industries are frequently affected by proposals to curb greenhouse gas and other air emissions. Various regulatory and legislative proposals have been made to limit or further restrict byproducts of combustion, including that resulting from the use of natural gas by our customers. In addition, regionally, there are a number of regulatory and legislative initiatives that have been passed which are designed to limit greenhouse gas emissions and increase the use of renewable sources of energy. Such legislation could restrict the operation and raise the costs of our power generation resources as well as the distribution of natural gas to our customers.
We expect continuing activity in the future and we are evaluating the extent to which potential changes to environmental laws and regulations may:
• | increase the operating costs of generating plants, |
• | increase the lead time and capital costs for the construction of new generating plants, |
• | require modification of our existing generating plants, |
• | require existing generating plant operations to be curtailed or shut down, |
• | reduce the amount of energy available from our generating plants, |
• | restrict the types of generating plants that can be built or contracted with, |
• | require construction of specific types of generation plants at higher cost, and |
• | increase the cost or limit the ability of distributing natural gas to customers. |
See “Item 7. Management's Discussion and Analysis – Environmental Issues and Contingencies" for discussion regarding environmental and other issues which may affect our operations, including the Clean Energy Transformation Act that was recently passed in Washington State.
We have contingent liabilities, including certain matters related to potential environmental liabilities, and cannot predict the outcome of these matters.
In the normal course of our business, we have matters that are the subject of ongoing litigation, mediation, investigation and/or negotiation. We cannot predict the ultimate outcome or potential impact of any particular issue, including the extent, if any, of insurance coverage or that amounts payable by us may be recoverable through the ratemaking process. We are subject to environmental regulation by federal, state and local authorities related to our past, present and future operations. See “Note 20 of the Notes to Consolidated Financial Statements” for further details of these matters.
23
Import tariffs could lead to increased prices on raw materials that are critical to our business.
Tariffs and other restrictions on trade with foreign countries could significantly increase the prices of raw materials that are critical to our business, such as steel poles or wires. In addition, tariffs and trade restrictions could have a similar impact on our suppliers and certain customers, which could have a negative impact on our financial condition, results of operations and cash flows.
See "Item 7. Management's Discussion and Analysis – Environmental Issues and Contingencies" and "Forward-Looking Statements" for discussion of or reference to additional external mandates which could have a material adverse effect on our results of operations, financial condition and cash flows.
Financial Risk Factors
Weather (temperatures, precipitation levels, wind patterns and storms) has a significant effect on our results of operations, financial condition and cash flows.
Weather impacts are described in the following subtopics:
• | certain retail electricity and natural gas sales, |
• | the cost of natural gas supply, and |
• | the cost of power supply. |
Certain retail electricity and natural gas sales volumes vary directly with changes in temperatures. We normally have our highest retail (electric and natural gas) energy sales during the winter heating season in the first and fourth quarters of the year. We also have high electricity demand for air conditioning during the summer (third quarter) in the Pacific Northwest. In general, warmer weather in the heating season and cooler weather in the cooling season will reduce our customers’ energy demand and our retail operating revenues. The revenue and earnings impact of weather fluctuations is somewhat mitigated by our decoupling mechanisms; however, we could experience liquidity constraints during the period between when decoupling revenue is earned and when it is subsequently collected from customers through retail rates.
The cost of natural gas supply tends to increase with higher demand during periods of cold weather. Inter-regional natural gas pipelines and competition for supply can allow demand-driven price volatility in other regions of North America to affect prices in the Pacific Northwest, even though there may be less extreme weather conditions in the Pacific Northwest. Increased costs adversely affect cash flows when we purchase natural gas for retail supply at prices above the amount than allowed for recovery in retail rates. We defer differences between actual natural gas supply costs and the amount currently recovered in retail rates and we are generally allowed to recover substantially all of these differences after regulatory review. However, these deferred costs require cash outflows from the time of natural gas purchases until the costs are later recovered through retail sales.
The cost of power supply can be significantly affected by weather. Precipitation (consisting of snowpack, its water content and melting pattern plus rainfall) and other streamflow conditions (such as regional water storage operations) significantly affect hydroelectric generation capability. Variations in hydroelectric generation inversely affect our reliance on market purchases and thermal generation. To the extent that hydroelectric generation is less than normal, significantly more costly power supply resources must be acquired and the ability to realize net benefits from surplus hydroelectric wholesale sales is reduced. Wholesale prices also vary based on wind patterns as wind generation capacity is material in the Pacific Northwest but its contribution to supply is inconsistent.
The price of power in the wholesale energy markets tends to be higher during periods of high regional demand, such as occurs with temperature extremes. We may need to purchase power in the wholesale market during peak price periods. The price of natural gas as fuel for natural gas-fired electric generation also tends to increase during periods of high demand which are often related to temperature extremes. We may need to purchase natural gas fuel in these periods of high prices to meet electric demands. The cost of power supply during peak usage periods may be higher than the retail sales price or the amount allowed in retail rates by our regulators. To the extent that power supply costs are above the amount allowed currently in retail rates, the difference is partially absorbed by the Company in current expense and is partially deferred or shared with customers through regulatory mechanisms.
The price of power tends to be lower during periods with excess supply, such as the spring when hydroelectric conditions are usually at their maximum and various facilities are required to operate to meet environmental mandates. Oversupply can be exacerbated when intermittent resources such as wind generation are producing output that may be supported by price subsidies. In extreme situations, we may be required to sell excess energy at negative prices.
As a result of these combined factors, our net cost of power supply – the difference between our costs of generation and market purchases, reduced by our revenue from wholesale sales – varies significantly because of weather.
24
We rely on regular access to financial markets but we cannot assure favorable or reasonable financing terms will be available when we need them.
Access to capital markets is critical to our operations and our capital structure. We have significant capital requirements that we expect to fund, in part, by accessing capital markets. As such, the state of financial markets and credit availability in the global, United States and regional economies impacts our financial condition. We could experience increased borrowing costs or limited access to capital on reasonable terms.
We access long-term capital markets to finance capital expenditures, repay maturing long-term debt and obtain additional working capital from time-to-time. Our ability to access capital on reasonable terms is subject to numerous factors and market conditions, many of which are beyond our control. If we are unable to obtain capital on reasonable terms, it may limit or prohibit our ability to finance capital expenditures and repay maturing long-term debt. Our liquidity needs could exceed our short-term credit availability and lead to defaults on various financing arrangements. We would also likely be prohibited from paying dividends on our common stock.
Performance of the financial markets could also result in significant declines in the market values of assets held by our pension plan and/or a significant increase in the pension liability (which impacts the funded status of the plan) and could increase future funding obligations and pension expense.
We rely on credit from financial institutions for short-term borrowings. We need adequate levels of credit with financial institutions for short-term liquidity. We have a $400.0 million committed line of credit that expires in April 2021. Our subsidiary AEL&P has a $25.0 million committed line of credit that expires in November 2024. There is no assurance that we will have access to credit beyond these expiration dates. The committed line of credit agreements contain customary covenants and default provisions.
Any default on the lines of credit or other financing arrangements of Avista Corp. or any of our “significant subsidiaries,” if any, could result in cross-defaults to other agreements of such entity, and/or to the line of credit or other financing arrangements of any other of such entities. Any defaults could also induce vendors and other counterparties to demand collateral. In the event of any such default, it would be difficult for us to obtain financing on reasonable terms to pay creditors or fund operations. We would also likely be prohibited from paying dividends on our common stock.
We hedge a portion of our interest rate risk with financial derivative instruments. If market interest rates decrease below the interest rates we have locked in, this will result in a liability related to our interest rate swap derivatives, which can be significant. As of December 31, 2019, we had a net interest rate swap derivative liability of $32.5 million, reflecting a decline in interest rates since the time we entered into the agreements. We may be required to post cash or letters of credit as collateral depending on fluctuations in the fair value of the derivative instruments. Settlement of interest rate swap derivative instruments in a liability position could require a significant amount of cash, which could negatively impact our liquidity and short-term credit availability and increase interest expense over the term of the associated debt.
Downgrades in our credit ratings could impede our ability to obtain financing, adversely affect the terms of financing and impact our ability to transact for or hedge energy resources. If we do not maintain our investment grade credit rating with the major credit rating agencies, we could expect increased debt service costs, limitations on our ability to access capital markets or obtain other financing on reasonable terms, and requirements to provide collateral (in the form of cash or letters of credit) to lenders and counterparties. In addition, credit rating downgrades could reduce the number of counterparties willing to do business with us or result in the termination of outstanding regulatory authorizations for certain financing activities.
Credit risk may be affected by industry concentration and geographic concentration.
We have concentrations of suppliers and customers in the electric and natural gas industries including:
• | electric and natural gas utilities, |
• | electric generators and transmission providers, |
• | oil and natural gas producers and pipelines, |
• | financial institutions including commodity clearing exchanges and related parties, and |
• | energy marketing and trading companies. |
We have concentrations of credit risk related to our geographic location in the western United States and western Canada energy markets. These concentrations of counterparties and concentrations of geographic location may affect our overall exposure to credit risk because the counterparties may be similarly affected by changes in conditions.
25
Energy Commodity Risk Factors
Energy commodity price changes affect our cash flows and results of operations.
Energy commodity prices can be volatile. We rely on energy markets and other counterparties for energy supply, surplus and optimization transactions and commodity price hedging. A combination of factors exposes our operations to commodity price risks, including:
• | our obligation to serve our retail customers at rates set through the regulatory process - we cannot decline to serve our customers and we cannot change retail rates to reflect current energy prices unless and until we receive regulatory approval, |
• | customer demand, which is beyond our control because of weather, customer choices, prevailing economic conditions and other factors, |
• | some of our energy supply cost is fixed by the nature of the energy-producing assets or through contractual arrangements (however, a significant portion of our energy resource costs are not fixed), and |
• | the potential non-performance by commodity counterparties, which could lead to replacement of the scheduled energy or natural gas at higher prices. |
Because we must supply the amount of energy demanded by our customers and we must sell it at fixed rates and only a portion of our energy supply costs are fixed, we are subject to the risk of buying energy at higher prices in wholesale energy markets (and the risk of selling energy at lower prices if we are in a surplus position). Electricity and natural gas in wholesale markets are commodities with historically high price volatility. Changes in wholesale energy prices affect, among other things, the cash requirements to purchase electricity and natural gas for retail customers or wholesale obligations and the market value of derivative assets and liabilities.
When we enter into fixed price energy commodity transactions for future delivery, we are subject to credit terms that may require us to provide collateral to wholesale counterparties related to the difference between current prices and the agreed upon fixed prices. These collateral requirements can place significant demands on our cash flows or borrowing arrangements. Price volatility can cause collateral requirements to change quickly and significantly.
Cash flow deferrals related to energy commodities can be significant. We are permitted to collect from customers only amounts approved by regulatory commissions. However, our costs to provide energy service can be much higher or lower than the amounts currently billed to customers. We are permitted to defer income statement recognition and recovery from customers for some of these differences, which are recorded as deferred charges with the opportunity for future recovery through retail rates. These deferred costs are subject to review for prudence and potential disallowance by regulators, who have discretion as to the extent and timing of future recovery or refund to customers.
Power and natural gas costs higher than those recovered in retail rates reduce cash flows. Amounts that are not allowed for deferral or which are not approved to become part of customer rates affect our results of operations.
Even if our regulators ultimately allow us to recover deferred power and natural gas costs, our operating cash flows can be negatively affected until these costs are recovered from customers.
Fluctuating energy commodity prices and volumes in relation to our energy risk management process can cause volatility in our cash flows and results of operations. We engage in active hedging and resource optimization practices to reduce energy cost volatility and economic exposure related to commodity price fluctuations. We routinely enter into contracts to hedge a portion of our purchase and sale commitments for electricity and natural gas, as well as forecasted excess or deficit energy positions and inventories of natural gas. We use physical energy contracts and derivative instruments, such as forwards, futures, swaps and options traded in the over-the-counter markets or on exchanges. If market prices decrease compared to the prices we have locked in with our energy commodity derivatives, this will result in a liability related to these derivatives, which can be significant. As of December 31, 2019, we had a gross energy commodity derivative liability of $48.1 million (exclusive of amounts posted as collateral and derivative assets eligible for net balance sheet presentation). As a result of price fluctuations, we may be required to post significant amounts of cash or letters of credit as collateral depending on fluctuations in the fair value of the derivative instruments. As of December 31, 2019, we had $7.8 million posted as cash collateral and $17.4 million of letters of credit posted as collateral.
We do not attempt to fully hedge our energy resource assets or our forecasted net positions for various time horizons. To the extent we have positions that are not hedged, or if hedging positions do not fully match the corresponding purchase or sale, fluctuating commodity prices could have a material effect on our operating revenues, resource costs, derivative assets and liabilities, and operating cash flows. In addition, actual loads and resources typically vary from forecasts, sometimes to a significant degree, which require additional transactions or dispatch decisions that impact cash flows.
26
The hedges we enter into are reviewed for prudence by our various regulators and any deferred costs (including those as a result of our hedging transactions) are subject to review for prudence and potential disallowance by regulators.
Generation plants may become obsolete. We rely on a variety of generation and energy commodity market sources to fulfill our obligation to serve customers and meet the demands of our counterparty agreements. There is the potential that some of our generation sources, such as coal, may become obsolete or be prematurely retired through regulatory action or legislation. This could result in higher commodity costs to replace the lost generation, as well as higher costs to retire the generation source before the end of its expected life. See “Item 7. Management's Discussion and Analysis – Environmental Issues and Contingencies" for discussion regarding environmental and other issues surrounding Colstrip, including the requirement that we cannot serve Washington electricity customers after 2025 with Colstrip.
Compliance Risk Factors
There have been numerous changes in legislation, related administrative rulemakings, and Executive Orders, including periodic audits of compliance with such rules, which may adversely affect our operational and financial performance.
We expect to continue to be affected by legislation at the national, state and local level, as well as by administrative rules and requirements published by government agencies, including but not limited to the FERC, the EPA and state regulators. We are also subject to NERC and WECC reliability standards. The FERC, the NERC and the WECC perform periodic audits of the Company. Failure to comply with the FERC, the NERC, or the WECC requirements can result in financial penalties of up to approximately $1.3 million per day per violation.
Future legislation, administrative rules or Executive Orders could have a material adverse effect on our operations, results of operations, financial condition and cash flows.
ITEM 1B. UNRESOLVED STAFF COMMENTS
As of the filing date of this Annual Report on Form 10-K, we have no unresolved comments from the staff of the SEC.
27
ITEM 2. PROPERTIES
AVISTA UTILITIES
Substantially all of Avista Utilities' properties are subject to the lien of Avista Corp.'s mortgage indenture.
Avista Utilities' electric properties, located in the states of Washington, Idaho, Montana and Oregon, include the following:
Generation Properties
No. of Units | Nameplate Rating (MW) (1) | Present Capability (MW) (2) | |||||
Hydroelectric Generating Stations (River) | |||||||
Washington: | |||||||
Long Lake (Spokane) | 4 | 71.1 | 88.0 | ||||
Little Falls (Spokane) | 4 | 43.2 | 48 | ||||
Nine Mile (Spokane) | 4 | 37.6 | 40.6 | ||||
Upper Falls (Spokane) | 1 | 10.0 | 10.2 | ||||
Monroe Street (Spokane) | 1 | 14.8 | 15.0 | ||||
Idaho: | |||||||
Cabinet Gorge (Clark Fork) (3) | 4 | 265.0 | 273.0 | ||||
Post Falls (Spokane) | 6 | 14.8 | 11.9 | ||||
Montana: | |||||||
Noxon Rapids (Clark Fork) | 5 | 487.8 | 562.4 | ||||
Total Hydroelectric | 944.3 | 1,049.1 | |||||
Thermal Generating Stations (cycle, fuel source) | |||||||
Washington: | |||||||
Kettle Falls GS (combined-cycle, wood waste) (4) | 1 | 50.7 | 53.5 | ||||
Kettle Falls CT (combined-cycle, natural gas) (4) | 1 | 7.2 | 6.9 | ||||
Northeast CT (simple-cycle, natural gas) | 2 | 61.8 | 64.8 | ||||
Boulder Park GS (simple-cycle, natural gas) | 6 | 24.6 | 24.6 | ||||
Idaho: | |||||||
Rathdrum CT (simple-cycle, natural gas) | 2 | 166.5 | 166.5 | ||||
Montana: | |||||||
Colstrip Units 3 & 4 (simple-cycle, coal) (5) | 2 | 233.4 | 222.0 | ||||
Oregon: | |||||||
Coyote Springs 2 (combined-cycle, natural gas) | 1 | 295.0 | 295.0 | ||||
Total Thermal | 839.2 | 833.3 | |||||
Total Generation Properties | 1,783.5 | 1,882.4 | |||||
(1) | Nameplate rating, also referred to as “installed capacity,” is the manufacturer’s assigned power capability under specified conditions. |
(2) | Present capability is the maximum capacity of the plant under standard test conditions without exceeding specified limits of temperature, stress and environmental conditions. Information is provided as of December 31, 2019. |
(3) | For Cabinet Gorge, we have water rights permitting generation up to 265 MW. However, if natural stream flows will allow for generation above our water rights, we are able to generate above our water rights. If natural stream flows only allow for generation at or below 265 MW, we are limited to generation of 265 MW. The present capability disclosed above represents the capability based on maximum stream flow conditions when we are allowed to generate above our water rights. |
(4) | These generating stations can operate as separate single-cycle plants or combined-cycle with the natural gas plant providing exhaust heat to the wood boiler to increase efficiency. |
(5) | Jointly owned; data refers to our 15 percent interest. |
28
Electric Distribution and Transmission Plant
Avista Utilities owns and operates approximately 19,100 miles of primary and secondary electric distribution lines providing service to retail customers. We have an electric transmission system of approximately 700 miles of 230 kV line and approximately 1,570 miles of 115 kV line. We also own an 11 percent interest in approximately 500 miles of a 500 kV line between Colstrip, Montana and Townsend, Montana. Our transmission and distribution systems also include numerous substations with transformers, switches, monitoring and metering devices, and other equipment.
The 230 kV lines are the backbone of our transmission grid and are used to transmit power from generation resources, including Noxon Rapids, Cabinet Gorge and the Mid-Columbia hydroelectric projects, to the major load centers in our service area, as well as to transfer power between points of interconnection with adjoining electric transmission systems. These lines interconnect at various locations with the BPA, Grant County PUD, PacifiCorp, NorthWestern Energy and Idaho Power Company and serve as points of delivery for power from generating facilities outside of our service area, including Colstrip, Coyote Springs 2 and the Lancaster Plant.
These lines also provide a means for us to optimize resources by entering into short-term purchases and sales of power with entities within and outside of the Pacific Northwest.
The 115 kV lines provide for transmission of energy and the integration of smaller generation facilities with our service-area load centers, including the Spokane River hydroelectric projects, the Kettle Falls projects, Rathdrum CT, Boulder Park GS and the Northeast CT. These lines interconnect with the BPA, Chelan County PUD, the Grand Coulee Project Hydroelectric Authority, Grant County PUD, NorthWestern Energy, PacifiCorp and Pend Oreille County PUD. Both the 115 kV and 230 kV interconnections with the BPA are used to transfer energy to facilitate service to each other’s customers that are connected through the other’s transmission system. We hold a long-term transmission agreement with the BPA that allows us to serve our native load customers that are connected through the BPA’s transmission system.
Natural Gas Plant
Avista Utilities has natural gas distribution mains of approximately 3,500 miles in Washington, 2,100 miles in Idaho and 2,400 miles in Oregon. We have natural gas transmission mains of approximately 75 miles in Washington and 15 miles in Oregon. Our natural gas system includes numerous regulator stations, service distribution lines, monitoring and metering devices, and other equipment.
We own a one-third interest in Jackson Prairie, an underground natural gas storage field located near Chehalis, Washington. See "Part 1 – Item 1. Business – Avista Utilities – Natural Gas Operations" for further discussion of Jackson Prairie.
29
ALASKA ELECTRIC LIGHT AND POWER COMPANY
Substantially all of AEL&P's utility properties are subject to the lien of the AEL&P mortgage indenture.
AEL&P's utility electric properties, located in Alaska include the following:
Generation Properties and Transmission and Distribution Lines
No. of Units | Nameplate Rating (MW) (1) | Present Capability (MW) (2) | |||||
Hydroelectric Generating Stations | |||||||
Snettisham (3) | 3 | 78.2 | 78.2 | ||||
Lake Dorothy | 1 | 14.3 | 14.3 | ||||
Salmon Creek | 1 | 8.4 | 5.0 | ||||
Annex Creek | 2 | 4.1 | 3.6 | ||||
Gold Creek | 3 | 1.6 | 1.6 | ||||
Total Hydroelectric | 106.6 | 102.7 | |||||
Diesel Generating Stations | |||||||
Lemon Creek | 11 | 61.4 | 51.8 | ||||
Auke Bay | 3 | 28.4 | 25.2 | ||||
Gold Creek | 5 | 8.2 | 7.0 | ||||
Industrial Blvd. Plant | 1 | 23.5 | 23.5 | ||||
Total Diesel | 121.5 | 107.5 | |||||
Total Generation Properties | 228.1 | 210.2 | |||||
(1) | Nameplate rating, also referred to as “installed capacity,” is the manufacturer’s assigned power capability under specified conditions. |
(2) | Present capability is the maximum capacity of the plant under standard test conditions without exceeding specified limits of temperature, stress and environmental conditions. Information is provided as of December 31, 2019. |
(3) | AEL&P does not own this generating facility but has a PPA under which it has the right to purchase, and the obligation to pay for (whether or not energy is received), all of the capacity and energy of this facility. See further information at "Part 1. Item 1. Business – Alaska Electric Light and Power Company." |
In addition to the generation properties above, AEL&P owns approximately 61 miles of transmission lines, which are primarily comprised of 69 kV line, and approximately 184 miles of distribution lines.
ITEM 3. LEGAL PROCEEDINGS
See “Note 21 of Notes to Consolidated Financial Statements” for information with respect to legal proceedings.
ITEM 4. MINE SAFETY DISCLOSURES
Not applicable.
PART II
ITEM 5. MARKET FOR REGISTRANT'S COMMON EQUITY, RELATED STOCKHOLDER MATTERS AND ISSUER PURCHASES OF EQUITY SECURITIES
Avista Corp. Market Information and Dividend Policy
Avista Corp.'s common stock is listed on the New York Stock Exchange under the ticker symbol “AVA.” As of January 31, 2020, there were 7,060 registered shareholders of our common stock.
Avista Corp.'s Board of Directors considers the level of dividends on our common stock on a recurring basis, taking into account numerous factors including, without limitation:
• | our results of operations, cash flows and financial condition, |
• | the success of our business strategies, and |
• | general economic and competitive conditions. |
30
Avista Corp.'s net income available for dividends is generally derived from our regulated utility operations (Avista Utilities and AEL&P).
The payment of dividends on common stock could be limited by:
• | certain covenants applicable to preferred stock (when outstanding) contained in the Company’s Restated Articles of Incorporation, as amended (currently there are no preferred shares outstanding), |
• | certain covenants applicable to the Company's outstanding long-term debt and committed line of credit agreements (see "Item 7. Management's Discussion and Analysis - Capital Resources" for compliance with these covenants), |
• | the hydroelectric licensing requirements of section 10(d) of the FPA (see “Note 1 of Notes to Consolidated Financial Statements”), and |
• | certain requirements under the OPUC approval of the AERC acquisition in 2014. The OPUC's AERC acquisition order requires Avista Utilities to maintain a capital structure of no less than 35 percent common equity (inclusive of short-term debt). This limitation may be revised upon request by the Company with approval from the OPUC. |
For additional information, see “Notes 1 and 18 of Notes to Consolidated Financial Statements.”
For information with respect to securities authorized for issuance under equity compensation plans, see “Item 12. Security Ownership of Certain Beneficial Owners and Management and Related Stockholder Matters.”
ITEM 6. SELECTED FINANCIAL DATA
(in thousands, except per share data and ratios) | Years Ended December 31, | ||||||||||||||||||
2019 | 2018 | 2017 | 2016 | 2015 | |||||||||||||||
Operating Revenues: | |||||||||||||||||||
Avista Utilities | $ | 1,295,873 | $ | 1,325,966 | $ | 1,370,359 | $ | 1,372,638 | $ | 1,411,863 | |||||||||
AEL&P | 37,265 | 43,599 | 53,027 | 46,276 | 44,778 | ||||||||||||||
Other | 12,484 | 27,328 | 22,543 | 23,569 | 28,685 | ||||||||||||||
Intersegment eliminations | — | — | — | — | (550 | ) | |||||||||||||
Total | $ | 1,345,622 | $ | 1,396,893 | $ | 1,445,929 | $ | 1,442,483 | $ | 1,484,776 | |||||||||
Income (Loss) from Operations (pre-tax): | |||||||||||||||||||
Avista Utilities | $ | 200,994 | $ | 248,000 | $ | 278,079 | $ | 287,128 | $ | 249,586 | |||||||||
AEL&P | 16,423 | 14,665 | 17,947 | 15,434 | 14,072 | ||||||||||||||
Other | (7,028 | ) | (1,552 | ) | (3,847 | ) | (2,701 | ) | (2,086 | ) | |||||||||
Total | $ | 210,389 | $ | 261,113 | $ | 292,179 | $ | 299,861 | $ | 261,572 | |||||||||
Net income from continuing operations | $ | 196,763 | $ | 136,598 | $ | 115,932 | $ | 137,316 | $ | 118,170 | |||||||||
Net income from discontinued operations | — | — | — | — | 5,147 | ||||||||||||||
Net income | 196,763 | 136,598 | 115,932 | 137,316 | 123,317 | ||||||||||||||
Net (income) loss attributable to noncontrolling interests | 216 | (169 | ) | (16 | ) | (88 | ) | (90 | ) | ||||||||||
Net income attributable to Avista Corp. shareholders | $ | 196,979 | $ | 136,429 | $ | 115,916 | $ | 137,228 | $ | 123,227 | |||||||||
Net Income (Loss) attributable to Avista Corporation shareholders: | |||||||||||||||||||
Avista Utilities | $ | 183,977 | $ | 134,874 | $ | 114,716 | $ | 132,490 | $ | 113,360 | |||||||||
AEL&P | 7,458 | 8,292 | 9,054 | 7,968 | 6,641 | ||||||||||||||
Discontinued operations | — | — | — | — | 5,147 | ||||||||||||||
Other | 5,544 | (6,737 | ) | (7,854 | ) | (3,230 | ) | (1,921 | ) | ||||||||||
Net income attributable to Avista Corp. shareholders | $ | 196,979 | $ | 136,429 | $ | 115,916 | $ | 137,228 | $ | 123,227 | |||||||||
31
(in thousands, except per share data and ratios) | Years Ended December 31, | ||||||||||||||||||
2019 | 2018 | 2017 | 2016 | 2015 | |||||||||||||||
Average common shares outstanding, basic | 66,205 | 65,673 | 64,496 | 63,508 | 62,301 | ||||||||||||||
Average common shares outstanding, diluted | 66,329 | 65,946 | 64,806 | 63,920 | 62,708 | ||||||||||||||
Common shares outstanding at year-end | 67,177 | 65,688 | 65,494 | 64,188 | 62,313 | ||||||||||||||
Earnings per common share attributable to Avista Corp. shareholders, basic: | |||||||||||||||||||
Earnings per common share from continuing operations | $ | 2.98 | $ | 2.08 | $ | 1.80 | $ | 2.16 | $ | 1.90 | |||||||||
Earnings per common share from discontinued operations | — | — | — | — | 0.08 | ||||||||||||||
Total earnings per common share attributable to Avista Corp. shareholders, basic | $ | 2.98 | $ | 2.08 | $ | 1.80 | $ | 2.16 | $ | 1.98 | |||||||||
Earnings per common share attributable to Avista Corp. shareholders, diluted: | |||||||||||||||||||
Earnings per common share from continuing operations | $ | 2.97 | $ | 2.07 | $ | 1.79 | $ | 2.15 | $ | 1.89 | |||||||||
Earnings per common share from discontinued operations | — | — | — | — | 0.08 | ||||||||||||||
Total earnings per common share attributable to Avista Corp. shareholders, diluted | $ | 2.97 | $ | 2.07 | $ | 1.79 | $ | 2.15 | $ | 1.97 | |||||||||
Dividends declared per common share | $ | 1.55 | $ | 1.49 | $ | 1.43 | $ | 1.37 | $ | 1.32 | |||||||||
Book value per common share | $ | 28.87 | $ | 26.99 | $ | 26.41 | $ | 25.69 | $ | 24.53 | |||||||||
Total Assets at Year-End: | |||||||||||||||||||
Avista Utilities | $ | 5,713,268 | $ | 5,458,104 | $ | 5,177,878 | $ | 4,975,555 | $ | 4,601,708 | |||||||||
AEL&P | 271,393 | 272,950 | 278,688 | 273,770 | 265,735 | ||||||||||||||
Other | 113,390 | 87,050 | 73,241 | 60,430 | 39,206 | ||||||||||||||
Intersegment eliminations | (15,595 | ) | (35,528 | ) | (15,075 | ) | — | — | |||||||||||
Total | $ | 6,082,456 | $ | 5,782,576 | $ | 5,514,732 | $ | 5,309,755 | $ | 4,906,649 | |||||||||
Long-Term Debt and Leases (including current portion) (1) | $ | 2,020,011 | $ | 1,863,174 | $ | 1,769,237 | $ | 1,682,004 | $ | 1,573,278 | |||||||||
Long-Term Debt to Affiliated Trusts | $ | 51,547 | $ | 51,547 | $ | 51,547 | $ | 51,547 | $ | 51,547 | |||||||||
Total Avista Corp. Shareholders’ Equity | $ | 1,939,284 | $ | 1,773,220 | $ | 1,729,828 | $ | 1,648,727 | $ | 1,528,626 | |||||||||
(1) | Effective, January 1, 2019, we adopted ASC 842 which resulted in the reclassification of the Snettisham lease from long-term debt, to lease liabilities in 2019. The Snettisham lease amount is included here to maintain comparability to prior years and be consistent with our credit facility covenant calculations. In addition, other operating leases were recorded on the Consolidated Balance Sheet as of January 1, 2019 and are included here. See "Note 5 of the Notes to Consolidated Financial Statements" for further discussion and for the amounts recorded in 2019. |
ITEM 7. MANAGEMENT'S DISCUSSION AND ANALYSIS OF FINANCIAL CONDITION AND RESULTS OF OPERATIONS
This section of this Annual Report on Form 10-K generally discusses 2019 and 2018 financial statement items and year-to-year comparisons between 2019 and 2018. Discussion of 2017 financial statement items and year-to-year comparisons between 2018 and 2017 that are not included in this Form 10-K can be found in "Management's Discussion and Analysis of Financial Conditions and Results of Operations" in Part II, Item 7 of the Company's Annual Report on Form 10-K for the year ended December 31, 2018.
Business Segments
As of December 31, 2019, we have two reportable business segments, Avista Utilities and AEL&P. We also have other businesses which do not represent a reportable business segment and are conducted by various direct and indirect subsidiaries of Avista Corp. See "Part I, Item 1. Business – Company Overview" for further discussion of our business segments.
32
The following table presents net income (loss) attributable to Avista Corp. shareholders for each of our business segments (and the other businesses) for the year ended December 31 (dollars in thousands):
2019 | 2018 | 2017 | |||||||||
Avista Utilities | $ | 183,977 | $ | 134,874 | $ | 114,716 | |||||
AEL&P | 7,458 | 8,292 | 9,054 | ||||||||
Other | 5,544 | (6,737 | ) | (7,854 | ) | ||||||
Net income attributable to Avista Corporation shareholders | $ | 196,979 | $ | 136,429 | $ | 115,916 | |||||
Executive Level Summary
Overall Results
Net income attributable to Avista Corp. shareholders was $197.0 million for 2019, an increase from $136.4 million for 2018.
Avista Utilities' net income increased due to the receipt of a $103 million termination fee from Hydro One (see "Note 24 of the Notes to Consolidated Financial Statements"), as well as the positive impact of general rate increases and customer growth. These increases were partially offset by final transaction costs for the Hydro One transaction, taxes associated with the termination fee, increased transmission and distribution operating and maintenance costs, a $7 million donation to the Avista Foundation to support the local community (other operating expenses) and increased depreciation and amortization.
AEL&P net income decreased primarily due to a decrease in operating revenues.
The increase in net income at our other businesses was primarily due to the sale of METALfx and net investment gains from our other investments.
More detailed explanations of the fluctuations are provided in the results of operations and business segment discussions (Avista Utilities, AEL&P, and the other businesses).
General Rate Cases and Regulatory Lag
We experienced regulatory lag during 2019 and we expect this to continue through the end of 2021 due to our continued investment in utility infrastructure and because we did not file general rate cases during 2018 due to the terminated Hydro One transaction. In April 2019, we filed general rates cases in Washington (partial settlement agreement in November 2019, refer to "Regulatory Matters"). We completed an electric only general rate case in Idaho, with new rates effective on December 1, 2019 and we also filed a natural gas general rate case in Oregon in March (with new rates effective on January 15, 2020). We expect these cases to provide rate relief in 2020 and start reducing the regulatory lag that we have been experiencing. Going forward, we will continue to strive to reduce the regulatory timing lag and more closely align our earned returns with those authorized by 2022. This will require adequate and timely rate relief in our jurisdictions. See "Regulatory Matters" for additional discussion of the 2019 general rate cases.
Regulatory Matters
General Rate Cases
We regularly review the need for electric and natural gas rate changes in each state in which we provide service. We will continue to file for rate adjustments to:
• | seek recovery of operating costs and capital investments, and |
• | seek the opportunity to earn reasonable returns as allowed by regulators. |
With regards to the timing and plans for future filings, the assessment of our need for rate relief and the development of rate case plans takes into consideration short-term and long-term needs, as well as specific factors that can affect the timing of rate filings. Such factors include, but are not limited to, in-service dates of major capital investments and the timing of changes in major revenue and expense items.
Avista Utilities
Washington General Rate Cases and Other Proceedings
2015 General Rate Cases
In January 2016 we received an order which was reaffirmed by the WUTC in February 2016 that concluded our electric and natural gas general rate cases that were originally filed with the WUTC in February 2015. New electric and natural gas rates were effective on January 11, 2016.
33
In March 2016, the Public Counsel Unit of the Washington State Office of the Attorney General (Public Counsel) filed in Thurston County Superior Court a Petition for Judicial Review of the WUTC's orders that concluded our 2015 electric and natural gas general rate cases. In April 2016, this matter was certified for review directly by the Court of Appeals, an intermediate appellate court in the State of Washington.
On August 7, 2018, the Court of Appeals issued an Opinion which concluded that the WUTC's use of an attrition allowance to calculate Avista Corp.'s rate base violated Washington law. The Court struck all portions of the attrition allowance attributable to Avista Corp.’s rate base and reversed and remanded the case for the WUTC to recalculate Avista Corp.’s rates without including an attrition allowance in the calculation of rate base. On April 17, 2019, the Thurston County Superior Court issued a Remand Order, granting a Joint Motion of Avista Corp., Public Counsel and the WUTC to remand the case back to the WUTC.
On June 20, 2019, we filed testimony with the WUTC in the remand case. In our testimony we asserted that the potential amount to return to customers is limited to revenues collected on the basis of rates approved in the 2015 general rate cases, and we also asserted that no refund is due to customers. Subsequent to our filing, other parties in the case filed testimony and based on the testimonies filed (including our testimony), we believe the range is $3.6 million to $77.0 million as a refund to customers. While we do not agree as a legal matter with the positions of the other parties to the case, as a practical matter we believe it is probable that ultimately we will refund some amount to customers. As such, as of December 31, 2019 we have recorded a refund liability of $3.6 million, which represents the low-end of the range, as we cannot predict an outcome of this case. See "Note 21 of the Notes to Consolidated Financial Statements" for further discussion of this matter.
2017 General Rate Cases
On April 26, 2018, the WUTC issued a final order in our electric and natural gas general rate cases that were originally filed on May 26, 2017. In the order, the WUTC approved new electric rates, effective on May 1, 2018, that increased base rates by 2.2 percent (designed to increase electric revenues by $10.8 million). The net increase in electric base rates was made up of an increase in our base revenue requirement of $23.2 million, an increase of $14.5 million in power supply costs and a decrease of $26.9 million for the impacts of the TCJA, which reflects the federal income tax rate change from 35 percent to 21 percent and the amortization of the regulatory liability for plant excess deferred income taxes that was recorded as of December 31, 2017.
While the WUTC authorized an increase in the ERM baseline to reflect increased power supply costs, it directed the parties to examine the functionality and rationale of the Company's power cost modeling and adjust the baseline only in extraordinary circumstances if necessary to more closely match the baseline to actual conditions.
For natural gas, the WUTC approved new natural gas base rates, effective on May 1, 2018, that decreased base rates by 2.4 percent (designed to decrease natural gas revenues by $2.1 million). The net decrease in natural gas base rates was made up of an increase in base revenues of $3.4 million that was offset by a decrease of $5.5 million for the impacts from the TCJA, which reflects the federal income tax rate change and the amortization of the regulatory liability for plant-related excess deferred income taxes that was recorded as of December 31, 2017.
In addition to the above, the WUTC also ordered, effective June 1, 2018, a one-year temporary reduction of $7.9 million in our revenue requirements for electric and $3.2 million for natural gas, reflecting reductions for the return of tax benefits associated with the non-plant excess deferred income taxes and the customer refund liability that was established in 2018 related to the change in federal income tax expense for the period January 1, 2018 to April 30, 2018.
The new rates are based on a ROR of 7.50 percent with a common equity ratio of 48.5 percent and a 9.5 percent ROE.
In our original filings, we requested three-year rate plans for electric and natural gas; however, in the final order the WUTC only provided for new rates effective on May 1, 2018.
TCJA Proceedings
In February 2019, we filed an all-party settlement agreement with the WUTC related to the electric tax benefits associated with the TCJA that were set aside for Colstrip in the 2017 general rate case order (effective May 1, 2018). In the settlement agreement, the parties agreed to utilize $10.9 million of the electric tax benefits to offset costs associated with accelerating the depreciation of Colstrip Units 3 & 4, to reflect a remaining useful life of those units through December 31, 2027. That portion of the settlement agreement was denied. The WUTC has indicated that it will review the TCJA and Colstrip in our 2019 general rate case (discussed below).
2019 General Rate Cases
On November 21, 2019, we reached a partial settlement agreement on our electric and natural gas general rate cases, which has been submitted to the WUTC for its consideration. If approved, new rates would take effect April 1, 2020. A second year rate increase was not agreed to in the partial settlement agreement, as was contemplated in our original general rate case filings.
34
The partial settlement agreement includes, among other things, agreement among all parties on the electric revenue increase and cost of capital as well as electric and natural gas rate spread and rate design. All parties, with the exception of the Public Counsel, agree on the natural gas base rate increase. The partial settlement agreement also includes agreement among all parties to accelerate the depreciation of Colstrip Units 3 & 4, to reflect a remaining useful life of those units through December 31, 2025.
The other remaining issues to be resolved in the case include the ERM-contested issues and the extension of the electric and natural gas decoupling mechanisms. See "Decoupling and Earnings Sharing Mechanisms" section below. As it relates to ERM-contested issues, the primary issue is related to the cost of replacement power incurred in July and August 2018 due to a forced outage at Colstrip Units 3 & 4. That outage occurred due to the plant exceeding certain air quality standards. In testimony filed by WUTC Staff and Public Counsel on January 10, 2020, the parties recommend the WUTC disallow $3.3 million in replacement power costs. Avista Corp. filed testimony on January 23, 2020, and provided support for no disallowance, but if the WUTC believes a disallowance is appropriate, the level of disallowance would be $2.4 million. The parties have agreed that the final ERM rebate determined by the WUTC, after it resolves the remaining ERM contested issues, should be returned to customers over a two-year period. The ERM rebate is approximately $37.0 to $38.0 million with interest.
The proposed rates under the partial settlement agreement are designed to increase annual base electric revenues by $28.5 million, or 5.7 percent, and annual natural gas base revenues by $8.0 million, or 8.5 percent, effective April 1, 2020. The partial settlement revenue increases are based on a 9.4 percent ROE with a common equity ratio of 48.5 percent and a rate of return ROR of 7.21 percent.
In addition to Avista Corp., the parties to the electric and natural gas rate cases include the Staff of the WUTC, the Public Counsel, the Alliance of Western Energy Consumers, the NW Energy Coalition, The Energy Project, and Sierra Club. The recommendation to the Commission by the parties to approve the partial settlement is not binding on the WUTC itself.
We originally filed our general rates cases on April 30, 2019, which were two-year rate plans, and requested the following electric and natural gas base rate changes each year, which were designed to result in the following increases in annual revenues (dollars in millions):
Electric | Natural Gas | |||||||||||||
Effective Date | Revenue Increase | Base Rate Increase | Revenue Increase | Base Rate Increase | ||||||||||
April 1, 2020 | $ | 45.8 | 9.1 | % | $ | 12.9 | 13.8 | % | ||||||
April 1, 2021 | $ | 18.9 | 3.5 | % | $ | 6.5 | 6.1 | % | ||||||
Our original requests were based on a proposed ROR of 7.52 percent with a common equity ratio of 50 percent and a 9.9 percent ROE. The WUTC has up to 11 months to review our request and issue a decision.
2020 General Rate Cases
We expect to file electric and natural gas general rate cases with the WUTC in the second or third quarter of 2020.
Idaho General Rate Cases and Other Proceedings
2017 General Rate Cases
On December 28, 2017, the IPUC approved a settlement agreement between us and other parties to our electric and natural gas general rate cases. New rates were effective on January 1, 2018 and January 1, 2019.
The settlement agreement was a two-year rate plan and had the following electric and natural gas base rate changes each year, which were designed to result in the following increases in annual revenues (dollars in millions):
Electric | Natural Gas | |||||||||||||
Effective Date | Revenue Increase | Base Rate Increase | Revenue Increase | Base Rate Increase | ||||||||||
January 1, 2018 | $ | 12.9 | 5.2 | % | $ | 1.2 | 2.9 | % | ||||||
January 1, 2019 | $ | 4.5 | 1.8 | % | $ | 1.1 | 2.7 | % | ||||||
35
The settlement agreement was based on a ROR of 7.61 percent with a common equity ratio of 50.0 percent and a 9.5 percent ROE.
TCJA Proceedings
On May 31, 2018, the IPUC approved an all-party settlement agreement related to the income tax benefits associated with the TCJA. Effective June 1, 2018, current customer rates were reduced to reflect the reduction of the federal income tax rate to 21 percent, and the amortization of the regulatory liability for plant-related excess deferred income taxes. This reduction reduces annual electric rates by $13.7 million (or 5.3 percent reduction to base rates) and natural gas rates by $2.6 million (or 6.1 percent reduction to base rates).
In March 2019, the IPUC approved an all-party settlement agreement related to the electric tax benefits that were set aside for Colstrip in the 2017 general rate case order. In the approved settlement agreement, the parties agreed to utilize approximately $6.4 million ($5.1 million when tax-effected) of the electric tax benefits to offset costs associated with accelerating the depreciation of Colstrip Units 3 & 4, to reflect a remaining useful life of those units through December 31, 2027. The remaining tax benefits of approximately $5.8 million will be returned to customers through a temporary rate reduction over a period of one year beginning on April 1, 2019. The tax benefits being utilized are related to non-plant excess deferred income taxes, and the customer refund liability that was established in 2018 related to the change in federal income tax expense for the period January 1, 2018 to May 31, 2018.
2019 General Rate Case
On October 11, 2019, Avista Corp. and all parties to our electric general rate case reached a settlement agreement that was approved by the IPUC. New rates went into effect on December 1, 2019.
The rates that went into effect are designed to decrease annual base electric revenues by $7.2 million (or 2.8 percent), effective December 1, 2019. The settlement revenue decreases are based on a 9.5 percent ROE with a common equity ratio of 50 percent and a rate of return ROR on rate base of 7.35 percent, which is a continuation of current levels. This outcome is in line with our expectations.
The primary element of the difference in the agreed upon base revenues in the settlement agreement from our original request is that the settlement includes the continued recovery of costs for our wind generation power purchase agreements, which will include Palouse Wind and Rattlesnake Flat, through the PCA mechanism rather than through base rates.
Our original request included an increase of annual electric base revenues of $5.3 million or 2.1 percent, effective January 1, 2020.
The electric request was based on a proposed ROR on rate base of 7.55 percent with a common equity ratio of 50 percent and a 9.9 percent ROE, as well as the inclusion of wind power purchase costs in base rates rather than receiving recovery through the PCA.
2020 General Rate Cases
We expect to file electric and natural gas general rate cases with the IPUC in the second half of 2020.
Oregon General Rate Cases and Other Proceedings
2019 General Rate Case
On October 9, 2019, the OPUC approved the all-party settlement agreements filed in the third quarter of 2019. New rates went into effect on January 15, 2020.
OPUC approved rates that are designed to increase annual natural gas billed revenues by $3.6 million, or 4.2 percent.
The OPUC’s decision reflects a ROR on rate base of 7.24 percent, with a common equity ratio of 50 percent and a 9.4 percent ROE, both of which represent a continuation of existing authorized levels.
In addition, the approved settlement agreements included agreement among the parties to a future independent review of our interest rate hedging practices, with any recommendations based on the results and findings in the final report to be applicable only on a prospective basis and do not apply to any prior interest rate hedging activity.
TCJA Proceedings
In February 2019, the OPUC approved the deferral amount of $3.8 million related to 2018 income tax benefits associated with the TCJA. The 2018 deferred benefits will be returned to customers through a temporary rate reduction over a period of one year beginning March 1, 2019. We continued the deferral of the TCJA benefits during 2019 for later return to customers, until such time as these changes can be reflected in base rates.
36
Petition for Judicial Review of the Deferral of Capital Projects
In February 2019 and October 2018, the OPUC issued orders which concluded that, contrary to the OPUC's past practice, Oregon statutes that authorize the deferral of expense for later recovery from customers do not authorize the OPUC to allow deferrals of any costs related to capital investments (utility plant). In April 2019, Avista Corp. and other petitioners filed a Petition for Judicial Review with the Oregon Court of Appeals seeking review of the above OPUC orders. The Company cannot predict the outcome of this matter at this time, including whether or not any decision of the court would have retroactive effect.
2020 General Rate Case
We expect to file a natural gas general rate case with the OPUC in the first quarter of 2020.
AMI Project
In March 2016, the WUTC granted our Petition for an Accounting Order to defer and include in a regulatory asset the undepreciated value of our existing Washington electric meters for the opportunity for later recovery. This accounting treatment is related to our plans to replace our existing electric meters with new two-way digital meters and the related software and support services through our AMI project in Washington State. As of December 31, 2019, the estimated future undepreciated value for the existing electric meters was $21.2 million. In September 2017, the WUTC also approved our request to defer the undepreciated net book value of existing natural gas encoder receiver transmitters (ERT) (consistent with the accounting treatment we obtained on our existing electric meters) that will be retired as part of the AMI project. As of December 31, 2019, the estimated future undepreciated value for the existing natural gas ERTs was $4.4 million. Replacement of the electric meters and natural gas ERTs began during the second half of 2018 and is ongoing.
In September 2017, the WUTC approved a Petition to defer the depreciation expense associated with the AMI project, along with a carrying charge, and to seek recovery of the deferral and carrying charge in a future general rate case. Cost savings, such as reduced meter reading costs, will occur during the implementation period, and will offset a portion of the AMI costs not being deferred.
In May 2017, we filed Petitions with the IPUC and the OPUC requesting a depreciable life of 12.5 years for the meter data management system (MDM) related to the AMI project. Both the IPUC and the OPUC approved our request. In addition, in connection with the 2017 Idaho electric general rate case (discussed above), the settling parties agreed to cost recovery of Idaho's share of the MDM system, effective January 1, 2019. In connection with the approval of the Oregon general rate case settlement in 2017, the OPUC approved cost recovery of Oregon's share of the MDM system, effective November 1, 2017.
Alaska Electric Light and Power Company
Alaska General Rate Case
In November 2017, the RCA approved an all-party settlement agreement related to AEL&P's electric general rate case, which was originally filed in September 2016. The settlement agreement was designed to increase base electric revenue by 3.86 percent or $1.3 million, making permanent the interim rate increase approved by the RCA in 2016.
The agreement reflects an 8.91 percent ROR with a common equity ratio of 58.18 percent and an 11.95 percent ROE.
TCJA Proceedings
The RCA approved a settlement agreement between AEL&P and the Attorney General filed on June 15, 2018 (Order 3). Per Order 3, effective August 1, 2018, AEL&P reduced firm customer base rates by 6.7 percent ($2.4 million annually), to reflect income tax expense reductions associated with the TCJA. The RCA also approved AEL&P's proposal to refund to customers a one-time credit equal to the 6.7 percent rate reduction for bills between January 1 and July 31, 2018. AEL&P completed all one-time credits during the third quarter of 2018. The impact of the TCJA on AEL&P’s deferred income taxes will be addressed in AEL&P’s next general rate case, due to be filed by August 30, 2021.
Avista Utilities
Purchased Gas Adjustments
PGAs are designed to pass through changes in natural gas costs to Avista Utilities' customers with no change in utility margin (operating revenues less resource costs) or net income. In Oregon, we absorb (cost or benefit) 10 percent of the difference between actual and projected natural gas costs included in base retail rates for supply that is not hedged. Total net deferred natural gas costs among all jurisdictions were a net liability of $3.2 million as of December 31, 2019 and a liability of $40.7 million as of December 31, 2018. These deferred natural gas cost balances represent amounts due to customers.
37
The following PGAs went into effect in our various jurisdictions during 2018 through 2019:
Jurisdiction | PGA Effective Date | Percentage Increase / (Decrease) in Billed Rates | ||
Washington | January 26, 2018 (1) | (7.1)% | ||
November 1, 2018 | (0.1)% | |||
November 1, 2019 | 10.4% | |||
Idaho | January 26, 2018 (1) | (7.4)% | ||
November 1, 2018 | (1.0)% | |||
November 1, 2019 | 5.6% | |||
Oregon | January 26, 2018 (1) | (3.5)% | ||
November 1, 2018 | (2.9)% | |||
November 1, 2019 | 4.7% | |||
(1) | Due to declining wholesale natural gas prices that occurred since the 2017 PGAs were filed and went into effect, we filed, and the respective commissions approved, out of cycle PGAs to reduce customer rates and pass through expected lower costs during the winter heating months, rather than waiting until the next scheduled PGA. |
Power Cost Deferrals and Recovery Mechanisms
Deferred power supply costs are recorded as a deferred charge or liability on the Consolidated Balance Sheets for future prudence review and recovery or rebate through retail rates. The power supply costs deferred include certain differences between actual net power supply costs incurred by Avista Utilities and the costs included in base retail rates. These differences primarily result from changes in:
• | short-term wholesale market prices and sales and purchase volumes, |
• | the level, availability and optimization of hydroelectric generation, |
• | the level and availability of thermal generation (including changes in fuel prices), |
• | retail loads, and |
• | sales of surplus transmission capacity. |
For our Washington customers, the ERM is an accounting method used to track certain differences between Avista Utilities' actual power supply costs, net of wholesale sales and sales of fuel, and the amount included in base retail rates. Total net deferred power costs under the ERM were a liability of $37.0 million as of December 31, 2019 and a liability $34.4 million as of December 31, 2018. These deferred power cost balances represent amounts due to customers. Pursuant to WUTC requirements, should the cumulative deferral balance exceed $30 million in the rebate or surcharge direction, we must make a filing with the WUTC to adjust customer rates to either return the balance to customers or recover the balance from customers.
Under the ERM, Avista Utilities absorbs the cost or receives the benefit from the initial amount of power supply costs in excess of or below the level in retail rates, which is referred to as the deadband. The annual (calendar year) deadband amount is $4.0 million.
The following is a summary of the ERM:
Annual Power Supply Cost Variability | Deferred for Future Surcharge or Rebate to Customers | Expense or Benefit to the Company | ||
within +/- $0 to $4 million (deadband) | 0% | 100% | ||
higher by $4 million to $10 million | 50% | 50% | ||
lower by $4 million to $10 million | 75% | 25% | ||
higher or lower by over $10 million | 90% | 10% | ||
Under the ERM, Avista Utilities makes an annual filing on or before April 1 of each year to provide the opportunity for the WUTC staff and other interested parties to review the prudence of and audit the ERM deferred power cost transactions for the prior calendar year.
38
The cumulative rebate balance exceeds $30 million and as a result, our 2019 filing contained a proposed rate refund, effective July 1, 2019 over a three-year period. During the second quarter of 2019 we filed a motion to consolidate this ERM filing with our 2019 Washington general rate case (which was filed on April 30, 2019). In our motion, we requested that the WUTC withhold the refund associated with the ERM for use in the 2019 general rate case rather than passing it back to customers over the three-year period that was proposed in the ERM filing. Our motion was approved by the WUTC and the ERM refund was consolidated with the 2019 Washington general rate case. However, in late 2019, the WUTC Staff granted a motion to remove the ERM from the 2019 general rate case and it is now being considered in a separate docket.
In the 2019 Washington general rate case proposed settlement, new authorized power supply rates were not agreed to as it relates to the ERM, and as such, our authorized power supply rates are still based on a 2017 test year. We are currently participating in workshops with the WUTC to determine an appropriate methodology for updating the authorized power supply rates prospectively. New authorized rates will not be determined until the completion of the workshops sometime in 2020.
Avista Utilities has a PCA mechanism in Idaho that allows us to modify electric rates on October 1 of each year with IPUC approval. Under the PCA mechanism, we defer 90 percent of the difference between certain actual net power supply expenses and the amount included in base retail rates for our Idaho customers. The October 1 rate adjustments recover or rebate power supply costs deferred during the preceding July-June twelve-month period. Total net power supply costs deferred under the PCA mechanism were an asset of $0.3 million as of December 31, 2019 and a liability of $7.6 million as of December 31, 2018. Deferred power cost assets represent amounts due from customers and liabilities represent amounts due to customers.
Decoupling and Earnings Sharing Mechanisms
Decoupling (also known as a FCA in Idaho) is a mechanism designed to sever the link between a utility's revenues and consumers' energy usage. In each of our jurisdictions, Avista Utilities' electric and natural gas revenues are adjusted so as to be based on the number of customers in certain customer rate classes and assumed "normal" kilowatt hour and therm sales, rather than being based on actual kilowatt hour and therm sales. The difference between revenues based on the number of customers and "normal" sales and revenues based on actual usage is deferred and either surcharged or rebated to customers beginning in the following year. Only residential and certain commercial customer classes are included in our decoupling mechanisms.
Washington Decoupling and Earnings Sharing
In Washington, the WUTC approved our decoupling mechanisms for electric and natural gas for a five-year period beginning January 1, 2015. In February 2019, the WUTC approved an all-party agreement that extends the life of the mechanisms through the end of our next general rate case, or April 1, 2020, whichever comes first. In our 2019 Washington general rate cases we have requested an extension of the mechanisms for an additional five-year term. The extension is contested by Public Counsel. Electric and natural gas decoupling surcharge rate adjustments to customers are limited to a 3 percent increase on an annual basis, with any remaining surcharge balance carried forward for recovery in a future period. There is no limit on the level of rebate rate adjustments.
The decoupling mechanisms each include an after-the-fact earnings test. At the end of each calendar year, separate electric and natural gas earnings calculations are made for the calendar year just ended. These earnings tests reflect actual decoupled revenues, normalized power supply costs and other normalizing adjustments. If we earn more than our authorized ROR in Washington, 50 percent of excess earnings are rebated to customers through adjustments to existing decoupling surcharge or rebate balances.
Idaho FCA Mechanism
In Idaho, the IPUC approved the implementation of FCAs for electric and natural gas (similar in operation and effect to the Washington decoupling mechanisms) for an initial term of three years, beginning January 1, 2016. During the first quarter of 2018, the FCA in Idaho was extended for a one-year term through December 31, 2019. On December 13, 2019, the IPUC approved an extension of the FCAs through March 31, 2025.
Oregon Decoupling Mechanism
In February 2016, the OPUC approved the implementation of a decoupling mechanism for natural gas, similar to the Washington and Idaho mechanisms described above. The decoupling mechanism became effective on March 1, 2016. There was an opportunity for interested parties to review the mechanism and recommend changes, if any, by September 2019. Changes related to deferral interest rates were recommended by the parties in our 2019 general rate case and were implemented effective January 15, 2020. In Oregon, an earnings review is conducted on an annual basis. In the annual earnings review, if we earn more than 100 basis points above our allowed return on equity, one-third of the earnings above the 100 basis points would be deferred and later rebated to customers.
39
Cumulative Decoupling and Earnings Sharing Balances
Total net cumulative decoupling deferrals among all jurisdictions were regulatory assets of $24.3 million as of December 31, 2019 and $13.9 million as of December 31, 2018. These decoupling assets represent amounts due from customers. Total net earnings sharing balances among all jurisdictions were regulatory liabilities of $0.7 million as of December 31, 2019 and $1.5 million as of December 31, 2018. These earnings sharing liabilities represent amounts due to customers.
See "Results of Operations - Avista Utilities" for further discussion of the amounts recorded to operating revenues in 2018 and 2019 related to the decoupling and earnings sharing mechanisms.
Results of Operations - Overall
The following provides an overview of changes in our Consolidated Statements of Income. More detailed explanations are provided, particularly for operating revenues and operating expenses, in the business segment discussions (Avista Utilities, AEL&P and the other businesses) that follow this section.
The balances included below for utility operations reconcile to the Consolidated Statements of Income.
2019 compared to 2018
The following graph shows the total change in net income attributable to Avista Corp. shareholders for 2019 to 2018, as well as the various factors that caused such change (dollars in millions):
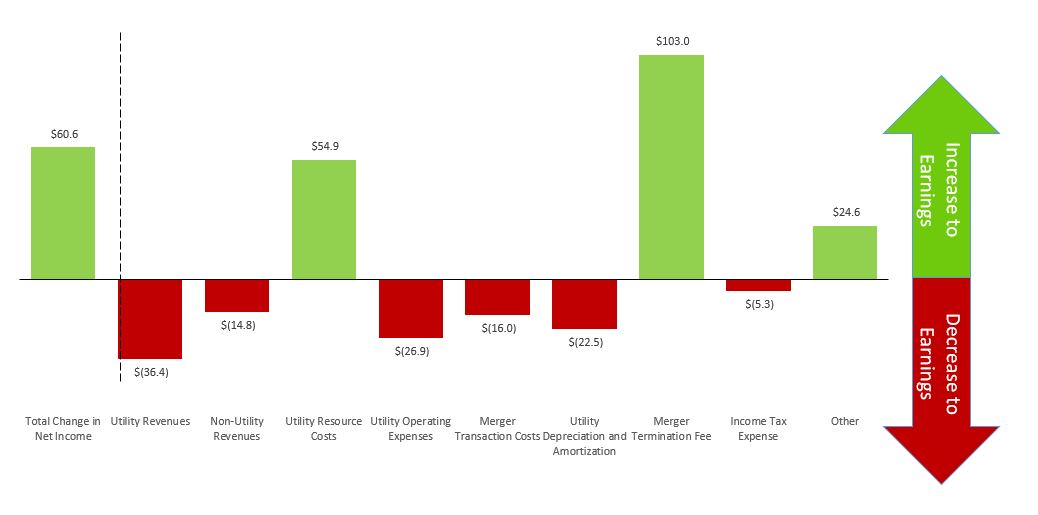
Utility revenues decreased at both Avista Utilities and AEL&P. Avista Utilities' revenues decreased primarily from a decrease in decoupling rates and PGA rates, which are included in rates billed to retail customers as well as a provision for customer rate refunds related to the 2015 Washington general rate cases. These decreases were partially offset by general rate increases and customer growth. AEL&P's revenues decreased from a reduction in sales volumes due to weather that was warmer than normal and warmer than the prior year.
Non-utility revenues decreased due to the sale of METALfx, which occurred in April 2019. See "Note 25 of the Notes to Consolidated Financial Statements" for further discussion.
Utility resource costs decreased at both Avista Utilities and AEL&P. While there was a decrease in gross resource costs at Avista Utilities, there was an increase in power purchase prices and thermal fuel costs. The decrease at AEL&P was due to a decrease in deferred power supply expenses, as well as the adoption of the new lease standard on January 1, 2019, which resulted in the reclassification of Snettisham power purchase costs from resource costs to depreciation and amortization and interest expense in 2019. See "Notes 2 and 5 of the Notes to Consolidated Financial Statements" for further information regarding the adoption of the new lease standard.
The increase in utility operating expenses was due to an increase at Avista Utilities primarily related to increases in generation and distribution operating and maintenance costs, as well as a $7 million donation to the Avista Foundation to support the local
40
community, and increases in pensions and other benefits.
The merger transaction costs are related to the terminated acquisition by Hydro One. These costs increased for 2019 because they included financial advisers' fees, legal fees, consulting fees and employee time, whereas 2018 costs consisted primarily of employee time incurred directly related to the transaction. None of the acquisition costs are being passed through to customers.
Utility depreciation and amortization increased due to additions to utility plant and amortization of the Snettisham finance lease, which was reclassed from utility resource costs to depreciation and amortization, effective January 1, 2019. See "Notes 2 and 5 of the Notes to Consolidated Financial Statements" for further information regarding the Snettisham lease and the adoption of the new lease standard. Also, a March 2019 settlement in Idaho allowed us to utilize approximately $6.4 million ($5.1 million when tax-effected) of the electric tax benefits to offset costs associated with accelerating the depreciation of Colstrip Units 3 & 4 to reflect a remaining useful life of those units through December 31, 2027. This amount was recorded as a one-time charge to depreciation expense in the second quarter of 2019, with an offsetting amount included in income tax expense.
Merger termination fee relates to the amount received from the terminated acquisition by Hydro One. See "Note 24 of the Notes to Consolidated Financial Statements" for further information.
Income taxes increased primarily due to increased income. This was partially offset by the Idaho settlement related to the accelerated depreciation of Colstrip Units 3 & 4 discussed above and by our effective tax rate decreasing to 13.8 percent for 2019 compared to 16.0 percent for 2018.
The increase in other was primarily related to a decrease in non-utility other operating expenses due to the sale of METALfx during the second quarter of 2019 and also due to lower property taxes.
Non-GAAP Financial Measures
The following discussion for Avista Utilities includes two financial measures that are considered “non-GAAP financial measures,” electric utility margin and natural gas utility margin. In the AEL&P section, we include a discussion of utility margin, which is also a non-GAAP financial measure.
Generally, a non-GAAP financial measure is a numerical measure of a company's financial performance, financial position or cash flows that excludes (or includes) amounts that are included (excluded) in the most directly comparable measure calculated and presented in accordance with GAAP. Electric utility margin is electric operating revenues less electric resource costs, while natural gas utility margin is natural gas operating revenues less natural gas resource costs. The most directly comparable GAAP financial measure to electric and natural gas utility margin is utility operating revenues as presented in "Note 23 of the Notes to Consolidated Financial Statements."
The presentation of electric utility margin and natural gas utility margin is intended to enhance understanding of our operating performance. We use these measures internally and believe they provide useful information to investors in their analysis of how changes in loads (due to weather, economic or other conditions), rates, supply costs and other factors impact our results of operations. Changes in loads, as well as power and natural gas supply costs, are generally deferred and recovered from customers through regulatory accounting mechanisms. Accordingly, the analysis of utility margin generally excludes most of the change in revenue resulting from these regulatory mechanisms. We present electric and natural gas utility margin separately below for Avista Utilities since each business has different cost sources, cost recovery mechanisms and jurisdictions, so we believe that separate analysis is beneficial. These measures are not intended to replace utility operating revenues as determined in accordance with GAAP as an indicator of operating performance. Reconciliations of operating revenues to utility margin are set forth below.
41
Results of Operations - Avista Utilities
2019 compared to 2018
Utility Operating Revenues
The following graphs present Avista Utilities' electric operating revenues and megawatt-hour (MWh) sales for the years ended December 31 (dollars in millions and MWhs in thousands):

(1) | This balance includes public street and highway lighting, which is considered part of retail electric revenues, and deferrals/amortizations to customers related to federal income tax law changes. |
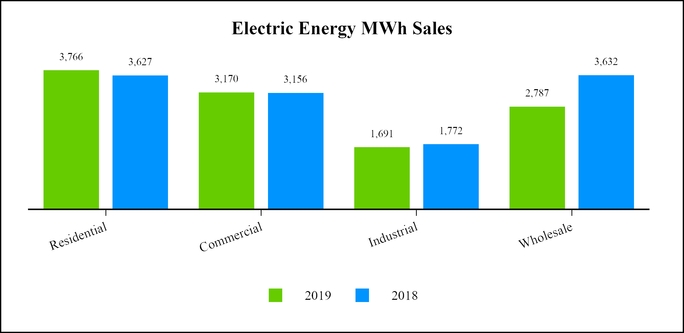
42
The following table presents the current year deferrals and the amortization of prior year decoupling balances that are reflected in utility electric operating revenues for the years ended December 31 (dollars in thousands):
Electric Operating Revenues | |||||||
2019 | 2018 | ||||||
Current year decoupling deferrals (a) | $ | 9,744 | $ | 17,060 | |||
Amortization of prior year decoupling deferrals (b) | (1,045 | ) | (12,190 | ) | |||
Total electric decoupling revenue | $ | 8,699 | $ | 4,870 | |||
(a) | Positive amounts are increases in decoupling revenue in the current year and will be surcharged to customers in future years. Negative amounts are decreases in decoupling revenue in the current year and will be rebated to customers in future years. |
(b) | Negative amounts are decreases in decoupling revenue in the current year and are related to the amortization of surcharge balances that resulted in prior years and are being surcharged to customers (causing a corresponding increase in retail revenue from customers) in the current year. Positive amounts are increases in decoupling revenue in the current year and are related to the amortization of rebate balances that resulted in prior years and are being refunded to customers (causing a corresponding decrease in retail revenue from customers) in the current year. |
Total electric revenues decreased $8.5 million for 2019 as compared to 2018, primarily reflecting the following:
• | a $0.7 million decrease in retail electric revenues due to a decrease in revenue per MWh (decreased revenues $7.3 million), partially offset by an increase in total MWhs sold (increased revenues $6.6 million). |
◦ | The decrease in revenue per MWh was primarily due to a decrease in decoupling rates (as our decoupling surcharges were larger in prior years, which resulted in higher surcharge rates in 2018 as compared to rebates in 2019) and decreases associated with the lower corporate tax rate. There was also a general rate decrease in Idaho (effective December 1, 2019). These decreases were partially offset by general rate increases in Washington (effective May 1, 2018) and Idaho (effective January 1, 2019). |
◦ | The increase in total retail MWhs sold was the result of weather that was cooler than the prior year during the first and fourth quarter heating seasons (which increased electric heating loads), and residential and commercial customer growth. Compared to 2018, residential electric use per customer increased 2 percent and commercial use per customer was consistent between years. Heating degree days in Spokane were 3 percent above normal and 11 percent above 2018. Cooling degree days in Spokane were 8 percent below normal and 6 percent below the prior year. |
• | an $11.8 million decrease in wholesale electric revenues due to a decrease in sales volumes (decreased revenues $22.2 million), partially offset by an increase in sales prices (increased revenues $10.4 million). The fluctuation in volumes and prices was primarily the result of our optimization activities. |
• | a $14.2 million decrease in sales of fuel due to a decrease in sales of natural gas fuel as part of thermal generation resource optimization activities. For 2019, $48.0 million of these sales were made to our natural gas operations and are included as intracompany revenues and resource costs. For 2018, $30.6 million of these sales were made to our natural gas operations. |
• | a $3.8 million increase in electric revenue due to decoupling and was primarily the result of lower amortizations of prior year decoupling surcharge balances. |
• | a $14.3 million increase in other electric revenues primarily related to federal income tax law changes that lowered the corporate tax rate from 35 percent to 21 percent. During the first quarter of 2018, our customers' rates had the 35 percent corporate tax rate built in from prior general rate cases and we were collecting this amount through retail revenues. At the same time, we were deferring the difference between the 35 percent and the 21 percent through other revenues. Effective May 1, 2018 in Washington and June 1, 2018 in Idaho, base rates reflect the lower 21 percent corporate tax. At that time, we began returning the deferred amounts to customers through other revenue. The tax amounts included in other revenue was partially offset by the accrual for customer refunds associated with the 2015 Washington general rate case. |
43
The following graphs present Avista Utilities' natural gas operating revenues and therms delivered for the years ended December 31 (dollars in millions and therms in thousands):

(1) | This balance includes interruptible and industrial revenues, which are considered part of retail natural gas revenues, and deferrals/amortizations to customers related to federal income tax law changes. |
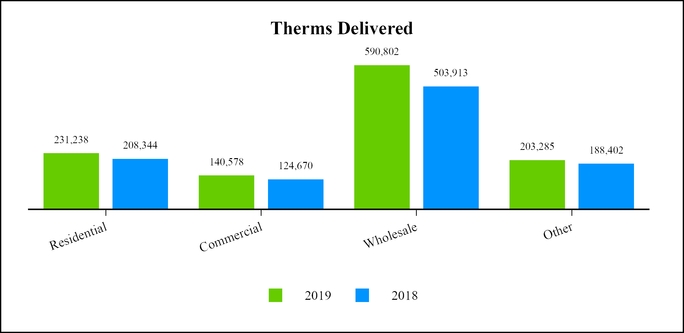
The following table presents the current year deferrals and the amortization of prior year decoupling balances that are reflected in natural gas operating revenues for the years ended December 31 (dollars in thousands):
Natural Gas Operating Revenues | |||||||
2019 | 2018 | ||||||
Current year decoupling deferrals (a) | $ | (3,270 | ) | $ | 3,168 | ||
Amortization of prior year decoupling deferrals (b) | 4,184 | (7,130 | ) | ||||
Total natural gas decoupling revenue | $ | 914 | $ | (3,962 | ) | ||
44
(a) | Positive amounts are increases in decoupling revenue in the current year and will be surcharged to customers in future years. Negative amounts are decreases in decoupling revenue in the current year and will be rebated to customers in future years. |
(b) | Positive amounts are increases in decoupling revenue in the current year and are related to the amortization of rebate balances that resulted in prior years and are being refunded to customers (causing a corresponding decrease in retail revenue from customers) in the current year. Negative amounts are decreases in decoupling revenue in the current year and are related to the amortization of surcharge balances that resulted in prior years and are being surcharged to customers (causing a corresponding increase in retail revenue from customers) in the current year. |
Total natural gas revenues increased $16.5 million for 2019 as compared to 2018, primarily reflecting the following:
• | a $5.4 million increase in retail natural gas revenues due to an increase in volumes (increased revenues $32.3 million), partially offset by lower retail rates (decreased revenues $26.9 million). |
◦ | Retail natural gas sales increased in 2019 as compared to 2018 due to cooler weather during the heating season, and residential and commercial customer growth. Compared to 2018, residential use per customer increased 9 percent and commercial use per customer increased 12 percent. Heating degree days in Spokane were 3 percent above normal for 2019, and 11 percent above 2018. Heating degree days in Medford were 3 percent above normal for 2019, and 7 percent above 2018. |
◦ | Lower retail rates were due to PGAs and rate decreases associated with the lower corporate tax rate and decoupling rate decreases (as our decoupling surcharges were larger in prior years, which resulted in higher surcharge rates in 2018 as compared to rebates in 2019), partially offset by general rate increases in Washington (effective May 1, 2018) and Idaho (effective January 1, 2019). |
• | a $2.1 million decrease in wholesale natural gas revenues due to a decrease in prices (decreased revenues $21.9 million), partially offset by an increase in volumes (increased revenues $19.8 million). In 2019, $65.4 million of these sales were made to our electric generation operations and are included as intracompany revenues and resource costs. In 2018, $44.7 million of these sales were made to our electric generation operations. Differences between revenues and costs from sales of resources in excess of retail load requirements and from resource optimization are accounted for through the PGA mechanisms. |
• | a $4.9 million increase in natural gas revenue due to decoupling primarily related to amortizations of prior year decoupling balances. |
• | an $8.8 million increase in other natural gas revenues primarily related to federal income tax law changes that lowered the corporate tax rate from 35 percent to 21 percent. During the first quarter of 2018, our customers' rates had the 35 percent corporate tax rate built in from prior general rate cases and we were collecting this amount through retail revenues. At the same time, we were deferring the difference between the 35 percent and the 21 percent through other revenues. Effective May 1, 2018 in Washington and June 1, 2018 in Idaho, base rates reflect the lower 21 percent corporate tax. At that time, we began returning the deferred amounts to customers through other revenue. |
The following table presents Avista Utilities' average number of electric and natural gas retail customers for the years ended December 31:
Electric Customers | Natural Gas Customers | ||||||||||
2019 | 2018 | 2019 | 2018 | ||||||||
Residential | 345,064 | 340,308 | 321,343 | 314,800 | |||||||
Commercial | 42,930 | 42,618 | 35,804 | 35,488 | |||||||
Interruptible | — | — | 45 | 39 | |||||||
Industrial | 1,305 | 1,318 | 241 | 246 | |||||||
Public street and highway lighting | 612 | 594 | — | — | |||||||
Total retail customers | 389,911 | 384,838 | 357,433 | 350,573 | |||||||
45
Utility Resource Costs
The following graphs present Avista Utilities' resource costs for the years ended December 31 (dollars in millions):
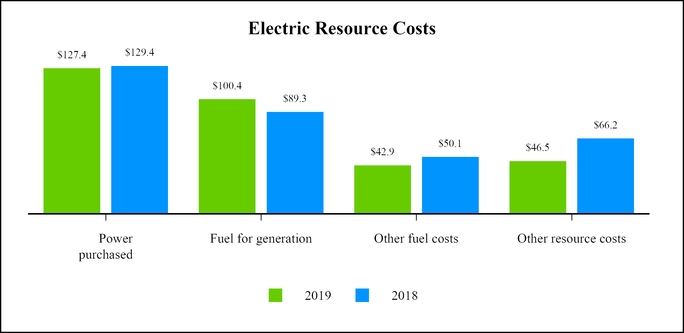
Total electric resource costs in the graph above include intracompany resource costs of $65.4 million and $44.7 million for 2019 and 2018, respectively.
Total electric resource costs decreased $17.8 million for 2019 as compared to 2018 primarily due to the following:
• | a $2.0 million decrease in power purchased due to a decrease in the volume of power purchases (decreased costs $26.8 million), partially offset by an increase in wholesale prices (increased costs $24.8 million). The fluctuation in volumes and prices was primarily the result of our optimization activities. |
• | an $11.1 million increase in fuel for generation primarily due to an increase in thermal generation resulting from lower hydroelectric generation, as well as an increase in natural gas fuel prices. |
• | a $7.2 million decrease in other fuel costs. |
• | a $19.6 million decrease from amortizations and deferrals of power costs (included in other resource costs in the graph above). This change was primarily the result of higher net power supply costs. |
• | a $1.8 million decrease in other regulatory amortizations (included in other resource costs in the graph above). |
46
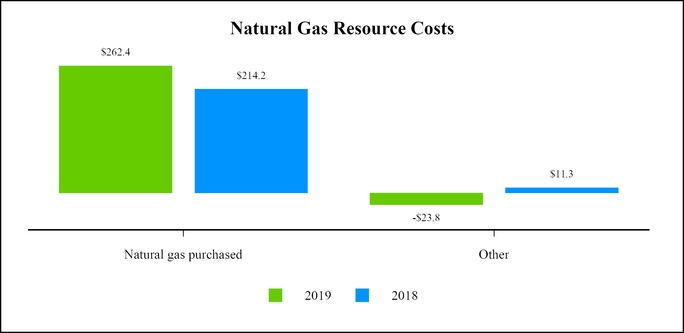
Total natural gas resource costs in the graph above include intracompany resource costs of $48.0 million and $30.6 million for 2019 and 2018, respectively.
Total natural gas resource costs increased $13.2 million for 2019 as compared to 2018 primarily reflecting the following:
• | a $48.2 million increase in natural gas purchased due to an increase in total therms purchased (increased costs $34.7 million) and an increase in the price of natural gas (increased costs $13.5 million). |
• | a $38.6 million decrease from amortizations and deferrals of natural gas costs (included in other resource costs in the graph above). |
• | a $3.5 million increase in other regulatory amortizations (included in other resource costs in the graph above). |
Utility Margin
The following table reconciles Avista Utilities' operating revenues, as presented in "Note 23 of the Notes to Consolidated Financial Statements" to the Non-GAAP financial measure utility margin for the years ended December 31 (dollars in millions):
Electric | Natural Gas | Intracompany | Total | ||||||||||||||||||||||||||||
2019 | 2018 | 2019 | 2018 | 2019 | 2018 | 2019 | 2018 | ||||||||||||||||||||||||
Operating revenues | $ | 962,048 | $ | 970,538 | $ | 447,232 | $ | 430,705 | $ | (113,407 | ) | $ | (75,277 | ) | $ | 1,295,873 | $ | 1,325,966 | |||||||||||||
Resource costs | 317,229 | 335,035 | 238,649 | 225,473 | (113,407 | ) | (75,277 | ) | 442,471 | 485,231 | |||||||||||||||||||||
Utility margin | $ | 644,819 | $ | 635,503 | $ | 208,583 | $ | 205,232 | $ | — | $ | — | $ | 853,402 | $ | 840,735 | |||||||||||||||
Electric utility margin increased $9.3 million and natural gas utility margin increased $3.4 million.
Electric utility margin was positively impacted during 2019 by general rate increases in Idaho (effective January 1, 2019) and Washington (effective May 1, 2018), as well as customer growth. This was partially offset by a general rate decrease in Idaho (effective December 1, 2019) and higher net power supply costs for 2019 as compared to 2018 due to higher than authorized power purchase prices, higher thermal fuel costs and lower hydroelectric generation. For 2019, we recognized a pre-tax benefit of $4.4 million under the ERM in Washington compared to a benefit of $6.1 million for 2018. In addition, electric utility margin was negatively affected by the accrual for customer refunds of $3.6 million related to the 2015 Washington general rate case.
Natural gas utility margin was positively affected by general rate increases in Washington (effective May 1, 2018) and Idaho (effective January 1, 2019), and customer growth.
Intracompany revenues and resource costs represent purchases and sales of natural gas between our natural gas distribution operations and our electric generation operations (as fuel for our generation plants). These transactions are eliminated in the
47
presentation of total results for Avista Utilities and in the consolidated financial statements but are included in the separate results for electric and natural gas presented above.
Results of Operations - Alaska Electric Light and Power Company
2019 compared to 2018
Net income for AEL&P was $7.5 million for the year ended December 31, 2019, compared to $8.3 million for 2018.
The following table presents AEL&P's operating revenues, resource costs and resulting utility margin for the years ended December 31 (dollars in millions):
Electric | |||||||
2019 | 2018 | ||||||
Operating revenues | $ | 37,265 | $ | 43,599 | |||
Resource costs (benefits) | (2,654 | ) | 9,505 | ||||
Utility margin | $ | 39,919 | $ | 34,094 | |||
Electric revenues decreased for 2019 primarily due to lower sales volumes to residential and commercial customers for 2019 as compared to 2018. This resulted from weather that was warmer than normal and warmer than the prior year, as well as lower hydroelectric generation, which prevented AEL&P from making sales to an interruptible customer (discussed further below).
Resource costs decreased from the prior year due to the adoption of the new lease standard on January 1, 2019, which resulted in the reclassification of Snettisham power purchase costs from resource costs to depreciation and amortization and interest expense in 2019. See "Note 2 and 5 of the Notes to Consolidated Financial Statements" for further information regarding the adoption of the new lease standard. In addition, AEL&P had low hydroelectric generation during 2019, which limited energy provided to their interruptible customers. A portion of the sales to interruptible customers is used to reduce the overall cost of power to AEL&P's firm customers. When interruptible sales are below a certain threshold, AEL&P recognizes a regulatory asset and records a reduction to deferred power supply costs (resource costs) to reflect a future billable amount to its firm customers when the cost of power rates are reset.
Results of Operations - Other Businesses
2019 compared to 2018
The net income from these operations was $5.5 million for 2019 compared to a net loss of $6.7 million for 2018. In 2019, we had net investment gains associated with our equity investments compared to net investment losses during 2018. During the second quarter of 2019, we sold METALfx, which resulted in a net gain after-tax of approximately $3.3 million. See "Note 25 of the Notes to Consolidated Financial Statements" for further discussion of the sale of METALfx.
Accounting Standards to be Adopted in 2020
At this time, we are not expecting the adoption of accounting standards to have a material impact on our financial condition, results of operations and cash flows in 2020. For information on accounting standards adopted in 2019 and accounting standards expected to be adopted in future periods, see “Note 2 of the Notes to Consolidated Financial Statements.”
Critical Accounting Policies and Estimates
The preparation of our consolidated financial statements in conformity with GAAP requires us to make estimates and assumptions that affect amounts reported in the consolidated financial statements. Changes in these estimates and assumptions are considered reasonably possible and may have a material effect on our consolidated financial statements and thus actual results could differ from the amounts reported and disclosed herein. The following accounting policies represent those that our management believes are particularly important to the consolidated financial statements and require the use of estimates and assumptions:
• | Regulatory accounting, in accordance with Financial Accounting Standards Board Accounting Standards Codification Topic 980, Regulated Operations, among other things, requires that costs and/or obligations that are probable of recovery through rates charged to our customers, but are not yet reflected in rates, not be reflected in our Consolidated Statements of Income until the period in which they are reflected in rates and matching revenues are recognized. Meanwhile, these costs and/or obligations are deferred and reflected on our Consolidated Balance Sheets as regulatory assets or liabilities. The provisions of the accounting guidance may result in recognition of revenues and expenses in time periods that are different than non-rate-regulated enterprises. In addition, regulatory accounting requires that decoupling revenue, unlike deferred costs, be recognized in the Consolidated Statements of Income during the period in which it occurs (i.e. during the period of revenue shortfall or excess due to fluctuations in customer usage), subject |
48
to certain limitations, and a regulatory asset or liability is established which will be surcharged or rebated to customers in future periods. GAAP requires that for any alternative revenue program, like decoupling, the revenue must be expected to be collected from customers within 24 months of the deferral to qualify for recognition in the current period. Accordingly, we make estimates of the amount of this revenue that will be collected within 24 months. Any amounts included in the Company's decoupling program that are not expected to be collected from customers within 24 months are not recorded in the financial statements until the period in which revenue recognition criteria are met. Finally, with respect to all of our regulatory assets, we review regulatory precedents and, based on those precedents, we make the assumption that we will be allowed recovery of these costs via retail rates in future periods. If we were no longer allowed to apply regulatory accounting or no longer allowed recovery of these costs, we could be required to recognize significant write-offs of regulatory assets and liabilities in the Consolidated Statements of Income. See "Notes 1 and 22 of the Notes to Consolidated Financial Statements" for further discussion of our regulatory accounting policy and mechanisms.
• | Interest rate swap derivative asset and liability accounting, where we estimate the fair value of outstanding interest rate swap derivatives and offset the derivative asset or liability with a regulatory asset or liability. Upon settlement of interest rate swap derivatives, the regulatory asset or liability is amortized as a component of interest expense over the term of the associated debt. We record this offset because, based on the prior practice of the regulatory commissions, we assume that we will be allowed recovery through the ratemaking process. If we concluded that recovery of interest rate swap related payments were no longer probable, we would be required to derecognize the related regulatory assets and liabilities and we could be required to recognize significant changes in fair value or settlements of these interest rate swap derivatives on a regular basis in the Consolidated Statements of Income, which could lead to significant fluctuations in net income. |
• | Pension Plans and Other Postretirement Benefit Plans, discussed in further detail below. |
• | Contingencies, related to unresolved regulatory, legal and tax issues as to which there is inherent uncertainty for the ultimate outcome of the respective matter. We accrue a loss contingency if it is probable that an asset is impaired or a liability has been incurred and the amount of the loss or impairment can be reasonably estimated. We also disclose losses that do not meet these conditions for accrual, if there is a reasonable possibility that a potential loss may be incurred. For all material contingencies, we have made a judgment as to the probability of a loss occurring and as to whether or not the amount of the loss can be reasonably estimated. However, no assurance can be given as to the ultimate outcome of any particular contingency. See "Notes 1 and 21 of the Notes to Consolidated Financial Statements" for further discussion of our commitments and contingencies. |
Pension Plans and Other Postretirement Benefit Plans - Avista Utilities
We have a defined benefit pension plan covering substantially all regular full-time employees at Avista Utilities that were hired prior to January 1, 2014. For substantially all regular non-union full-time employees at Avista Utilities who were hired on or after January 1, 2014, a defined contribution 401(k) plan replaced the defined benefit pension plan. Union employees hired on or after January 1, 2014 are still covered under the defined benefit pension plan.
The Finance Committee of the Board of Directors approves investment policies, objectives and strategies that seek an appropriate return for the pension plan and it reviews and approves changes to the investment and funding policies.
We have contracted with an independent investment consultant who is responsible for monitoring the individual investment managers. The investment managers’ performance and related individual fund performance is reviewed at least quarterly by an internal benefits committee and by the Finance Committee to monitor compliance with our established investment policy objectives and strategies.
Our pension plan assets are invested in debt securities and mutual funds, trusts and partnerships that hold marketable debt and equity securities, real estate and absolute return funds. In seeking to obtain a return that aligns with the funded status of the pension plan, the investment consultant recommends allocation percentages by asset classes. These recommendations are reviewed by the internal benefits committee, which then recommends their adoption by the Finance Committee. The Finance Committee has established target investment allocation percentages by asset classes and also investment ranges for each asset class. The target investment allocation percentages are typically the midpoint of the established range. See “Note 10 of the Notes to Consolidated Financial Statements” for the target investment allocation percentages.
We also have a Supplemental Executive Retirement Plan (SERP) that provides additional pension benefits to certain executive officers and others whose benefits under the pension plan are reduced due to the application of Section 415 of the Internal Revenue Code of 1986 and the deferral of salary under deferred compensation plans.
49
Pension costs (including the SERP) were $26.9 million for 2019, $22.8 million for 2018 and $26.5 million for 2017. Of our pension costs (excluding the SERP), approximately 60 percent are expensed and 40 percent are capitalized consistent with labor charges. The costs related to the SERP are expensed. Our costs for the pension plan are determined in part by actuarial formulas that are dependent upon numerous factors resulting from actual plan experience and assumptions of future experience.
Pension costs are affected by among other things:
• | employee demographics (including age, compensation and length of service by employees), |
• | the amount of cash contributions we make to the pension plan, |
• | the actual return on pension plan assets, |
• | expected return on pension plan assets, |
• | discount rate used in determining the projected benefit obligation and pension costs, |
• | assumed rate of increase in employee compensation, |
• | life expectancy of participants and other beneficiaries, and |
• | expected method of payment (lump sum or annuity) of pension benefits. |
In accordance with accounting standards, changes in pension plan obligations associated with these factors may not be immediately recognized as pension costs in our Consolidated Statement of Income, but we generally recognize the change in future years over the remaining average service period of pension plan participants. As such, our costs recorded in any period may not reflect the actual level of cash benefits provided to pension plan participants.
We revise the key assumption of the discount rate each year. In selecting a discount rate, we consider yield rates at the end of the year for highly rated corporate bond portfolios with cash flows from interest and maturities similar to that of the expected payout of pension benefits.
The expected long-term rate of return on plan assets is reset or confirmed annually based on past performance and economic forecasts for the types of investments held by our plan.
The following chart reflects the assumptions used each year for the pension discount rate (exclusive of the SERP), the expected long-term return on plan assets and the actual return on plan assets and their impacts to the pension plan associated with the change in assumption (dollars in millions):
2019 | 2018 | 2017 | |||||||||
Discount rate (exclusive of SERP) | |||||||||||
Pension discount rate | 3.85 | % | 4.31 | % | 3.71 | % | |||||
Increase/(decrease) to projected benefit obligation | $ | 41.7 | $ | (54.7 | ) | $ | 49.2 | ||||
Return on plan assets (a) | |||||||||||
Expected long-term return on plan assets | 5.90 | % | 5.50 | % | 5.87 | % | |||||
Increase/(decrease) to pension costs | $ | (2.2 | ) | $ | 2.2 | $ | (2.5 | ) | |||
Actual return on plan assets, net of fees | 20.40 | % | (7.00 | )% | 15.60 | % | |||||
Actual gain/(loss) on plan assets | $ | 109.9 | $ | (41.0 | ) | $ | 43.2 | ||||
(a) | The SERP has no plan assets. The plan assets in this disclosure are for the pension plan only. |
The following chart reflects the sensitivities associated with a change in certain actuarial assumptions by the indicated percentage (dollars in millions):
50
Actuarial Assumption | Change in Assumption | Effect on Projected Benefit Obligation | Effect on Pension Cost | |||||||
Expected long-term return on plan assets | (0.5 | )% | $ | — | * | $ | 2.7 | |||
Expected long-term return on plan assets | 0.5 | % | — | * | (2.7 | ) | ||||
Discount rate | (0.5 | )% | 50.7 | 4.2 | ||||||
Discount rate | 0.5 | % | (45.1 | ) | (3.7 | ) | ||||
* | Changes in the expected return on plan assets would not affect our projected benefit obligation. |
We provide certain health care and life insurance benefits for substantially all of our retired employees. We accrue the estimated cost of postretirement benefit obligations during the years that employees provide service. Assumed health care cost trend rates have a significant effect on the amounts reported for our postretirement plans. A one-percentage-point increase in the assumed health care cost trend rate for each year would increase our accumulated postretirement benefit obligation as of December 31, 2019 by $13.9 million and the service and interest cost by $0.8 million. A one-percentage-point decrease in the assumed health care cost trend rate for each year would decrease our accumulated postretirement benefit obligation as of December 31, 2019 by $10.7 million and the service and interest cost by $0.6 million.
Liquidity and Capital Resources
Overall Liquidity
Avista Corp.'s consolidated operating cash flows are primarily derived from the operations of Avista Utilities. The primary source of operating cash flows for Avista Utilities is revenues from sales of electricity and natural gas. Significant uses of cash flows from Avista Utilities include the purchase of power, fuel and natural gas, and payment of other operating expenses, taxes and interest, with any excess being available for other corporate uses such as capital expenditures and dividends.
We design operating and capital budgets to control operating costs and to direct capital expenditures to choices that support immediate and long-term strategies, particularly for our regulated utility operations. In addition to operating expenses, we have continuing commitments for capital expenditures for construction and improvement of utility facilities.
Our annual net cash flows from operating activities usually do not fully support the amount required for annual utility capital expenditures. As such, from time-to-time, we need to access long-term capital markets in order to fund these needs as well as fund maturing debt. See further discussion at “Capital Resources.”
We periodically file for rate adjustments for recovery of operating costs and capital investments and to seek the opportunity to earn reasonable returns as allowed by regulators.
Avista Utilities has regulatory mechanisms in place that provide for the deferral and recovery of the majority of power and natural gas supply costs. However, when power and natural gas costs exceed the levels currently recovered from retail customers, net cash flows are negatively affected. Factors that could cause purchased power and natural gas costs to exceed the levels currently recovered from our customers include, but are not limited to, higher prices in wholesale markets when we buy energy or an increased need to purchase power in the wholesale markets, and a lack of regulatory approval for higher authorized net power supply costs through general rate case decisions. Factors beyond our control that could result in an increased need to purchase power in the wholesale markets include, but are not limited to:
• | increases in demand (due to either weather or customer growth), |
• | lower streamflows for hydroelectric generation, |
• | unplanned outages at generating facilities, and |
• | failure of third parties to deliver on energy or capacity contracts. |
In addition to the above, Avista Utilities enters into derivative instruments to hedge our exposure to certain risks, including fluctuations in commodity market prices, foreign exchange rates and interest rates (for purposes of issuing long-term debt in the future). These derivative instruments often require collateral (in the form of cash or letters of credit) or other credit enhancements, or reductions or terminations of a portion of the contract through cash settlement, in the event of a downgrade in the Company's credit ratings or changes in market prices. In periods of price volatility, the level of exposure can change significantly. As a result, sudden and significant demands may be made against the Company's credit facilities and cash. See “Enterprise Risk Management – Credit Risk Liquidity Considerations” below.
51
We monitor the potential liquidity impacts of changes to energy commodity prices and other increased operating costs for our utility operations. We believe that we have adequate liquidity to meet such potential needs through our committed lines of credit.
As of December 31, 2019, we had $196.2 million of available liquidity under the Avista Corp. committed line of credit and $21.5 million under the AEL&P committed line of credit. With our $400.0 million credit facility that expires in April 2021 and AEL&P's $25.0 million credit facility that expires in November 2024, we believe that we have adequate liquidity to meet our needs for the next 12 months.
Review of Consolidated Cash Flow Statement
2019 compared to 2018
Consolidated Operating Activities
Net cash provided by operating activities was $398.2 million for 2019 compared to $361.9 million for 2018. The increase in net cash provided by operations was primarily the result of increased net income that included the receipt of the $103.0 million merger termination fee from Hydro One that is reflected in net income for 2019. The termination fee was used for reimbursing our transaction costs incurred from 2017 to 2019, which totaled approximately $51.0 million, including income taxes. The balance of the termination fee was used for general corporate purposes and reduced our need for external financing. Our total transaction costs were $19.7 million (pre-tax) for 2019 and we also incurred approximately $15.7 million in taxes in 2019 (net of $1.8 million in tax benefits recaptured from 2017 and 2018). For further information, see "Notes 21 and 24 of the Notes to Consolidated Financial Statements.” In addition, the settlement of interest rate swaps increased operating cash flows as we paid a net amount of $13.3 million during 2019 compared to $26.6 million paid during 2018. Also, collateral posted for derivative instruments decreased by $64.0 million in 2019 compared to an increase of $4.1 million due to fluctuations in market prices of our outstanding energy commodity derivatives.
The increases above, were partially offset by power and natural gas deferrals which increased during 2019 due to higher natural gas prices during the year (which decreased cash flows by $45.9 million) as compared to an increase to operating cash flows of $10.3 million in 2018.
Consolidated Investing Activities
Net cash used in investing activities was $445.5 million for 2019, an increase compared to $440.4 million for 2018. During 2019, we paid $442.5 million for utility capital expenditures, compared to $424.4 million for 2018. The increase in utility capital expenditures was partially offset by $16.5 million of proceeds related to the sale of METALfx. For further information, see "Note 25 of the Notes to Consolidated Financial Statements."
Consolidated Financing Activities
Net cash provided by financing activities was $42.5 million for 2019 compared to $77.0 million for 2018. The decrease in financing cash flows was primarily the result of changes in short-term borrowings. In 2018, because we issued an insignificant amount of common stock due to the now terminated Hydro One transaction, we had to increase short-term borrowings to finance capital expenditures and for other corporate purposes. The decrease in short-term borrowings was partially offset by the net issuance of $64.6 million of common stock.
52
Capital Resources
Capital Structure
Our consolidated capital structure, including the current portion of long-term debt and short-term borrowings, and excluding noncontrolling interests, consisted of the following as of December 31, 2019 and 2018 (dollars in thousands):
December 31, 2019 | December 31, 2018 | ||||||||||||
Amount | Percent of total | Amount | Percent of total | ||||||||||
Current portion of long-term debt and leases (1) | $ | 58,928 | 1.4 | % | $ | 107,645 | 2.8 | % | |||||
Short-term borrowings | 185,800 | 4.5 | % | 190,000 | 4.9 | % | |||||||
Long-term debt to affiliated trusts | 51,547 | 1.2 | % | 51,547 | 1.3 | % | |||||||
Long-term debt and leases (1) | 1,961,083 | 46.7 | % | 1,755,529 | 45.3 | % | |||||||
Total debt | 2,257,358 | 53.8 | % | 2,104,721 | 54.3 | % | |||||||
Total Avista Corporation shareholders’ equity | 1,939,284 | 46.2 | % | 1,773,220 | 45.7 | % | |||||||
Total | $ | 4,196,642 | 100.0 | % | $ | 3,877,941 | 100.0 | % | |||||
(1) | Effective, January 1, 2019, we adopted ASC 842 which resulted in the reclassification of the Snettisham lease from long-term debt, to lease liabilities in 2019. The Snettisham lease amount is included here for this calculation. In addition, other operating leases were recorded on the Consolidated Balance Sheet as of January 1, 2019 and are included here for this calculation. See "Note 5 of the Notes to Consolidated Financial Statements" for further discussion and for the amounts recorded in 2019. |
Our shareholders’ equity increased $166.1 million during 2019 primarily due to net income and the issuance of common stock, partially offset by dividends.
We need to finance capital expenditures and acquire additional funds for operations from time to time. The cash requirements needed to service our indebtedness, both short-term and long-term, reduce the amount of cash flow available to fund capital expenditures, purchased power, fuel and natural gas costs, dividends and other requirements.
Committed Lines of Credit
Avista Corp. has a committed line of credit with various financial institutions in the total amount of $400.0 million that expires in April 2021. As of December 31, 2019, there was $196.2 million of available liquidity under this line of credit. We expect to renew or replace this committed line of credit during 2020.
The Avista Corp. credit facility contains customary covenants and default provisions, including a covenant which does not permit our ratio of “consolidated total debt” to “consolidated total capitalization” to be greater than 65 percent at any time. As of December 31, 2019, we were in compliance with this covenant with a ratio of 53.8 percent.
Balances outstanding and interest rates of borrowings (excluding letters of credit) under Avista Corp.'s committed line of credit were as follows as of and for the year ended December 31 (dollars in thousands):
2019 | 2018 | ||||||
Balance outstanding at end of year | $ | 182,300 | $ | 190,000 | |||
Letters of credit outstanding at end of year | $ | 21,473 | $ | 10,503 | |||
Maximum balance outstanding during the year | $ | 221,000 | $ | 200,000 | |||
Average balance outstanding during the year | $ | 148,616 | $ | 58,199 | |||
Average interest rate during the year | 3.05 | % | 2.80 | % | |||
Average interest rate at end of year | 2.64 | % | 3.18 | % | |||
In November of 2019, AEL&P renewed its $25.0 million committed line of credit with a new expiration date in November 2024. As of December 31, 2019, there was $21.5 million of available liquidity under this line of credit.
The AEL&P credit facility contains customary covenants and default provisions including a covenant which does not permit the ratio of “consolidated total debt at AEL&P” to “consolidated total capitalization at AEL&P,” (including the impact of the Snettisham obligation) to be greater than 67.5 percent at any time. As of December 31, 2019, AEL&P was in compliance with this covenant with a ratio of 54.6 percent.
As of December 31, 2019, Avista Corp. and its subsidiaries were in compliance with all of the covenants of their financing agreements, and none of Avista Corp.'s subsidiaries constituted a “significant subsidiary” as defined in Avista Corp.'s committed line of credit.
53
Long-Term Debt
In November 2019, we issued and sold $180.0 million of 3.43 percent first mortgage bonds due in 2049 pursuant to a bond purchase agreement with institutional investors in the private placement market. The total net proceeds from the sale of the bonds were used to repay maturing long-term debt of $90.0 million, repay a portion of the outstanding balance under our $400.0 million committed line of credit and for other general corporate purposes. In connection with the issuance and sale of the first mortgage bonds, we cash-settled six interest rate swap derivatives (notional aggregate amount of $70.0 million) and paid a net amount of $13.3 million. The effective interest rate of the first mortgage bonds is 3.89 percent, including the effects of the settled interest rate swap derivatives and issuance costs.
Equity Issuances
We issued equity in 2019 for total net proceeds of $64.6 million. Most of these issuances came through our four separate sales agency agreements under which the sales agents may offer and sell new shares of our common stock from time to time. These agreements provide for the offering of a maximum of 4.6 million shares, of which approximately 3.2 million remain unissued as of December 31, 2019. In 2019, 1.4 million shares were issued under these agreements resulting in total net proceeds of $63.6 million. Subject to the satisfaction of customary conditions (including any required regulatory approvals), we have the right to increase the maximum number of shares that may be offered under these agreements. These agreements expire on February 29, 2020. We expect to negotiate and enter into new sales agency agreements in the second quarter of 2020.
Hydro One Termination Fee
In January 2019, we received a $103 million termination fee from Hydro One in connection with the termination of the proposed acquisition. The termination fee, after income taxes, was used for reimbursing our transaction costs incurred from 2017 to 2019. These costs and income taxes totaled approximately $51 million. The balance of the termination fee was used for general corporate purposes and reduced our need for external financing.
2020 Liquidity Expectations
During 2020, we expect to issue approximately $160.0 million of long-term debt and up to $60.0 million of equity in order to refinance maturing long-term debt, fund planned capital expenditures and maintain an appropriate capital structure.
After considering the expected issuances of long-term debt and equity during 2020, we expect net cash flows from operating activities, together with cash available under our committed line of credit agreements, to provide adequate resources to fund capital expenditures, dividends, and other contractual commitments.
Limitations on Issuances of Preferred Stock and First Mortgage Bonds
We are restricted under our Restated Articles of Incorporation, as amended, as to the additional preferred stock we can issue. As of December 31, 2019, we could issue $2.8 billion of additional preferred stock at an assumed dividend rate of 4.8 percent. We are not planning to issue preferred stock.
Under the Avista Corp. and the AEL&P Mortgages and Deeds of Trust securing Avista Corp.'s and AEL&P's first mortgage bonds (including Secured Medium-Term Notes), respectively, each entity may issue additional first mortgage bonds in an aggregate principal amount equal to the sum of:
• | 66-2/3 percent of the cost or fair value (whichever is lower) of property additions of that entity which have not previously been made the basis of any application under that entity's Mortgage, or |
• | an equal principal amount of retired first mortgage bonds of that entity which have not previously been made the basis of any application under that entity's Mortgage, or |
• | deposit of cash. |
However, Avista Corp. and AEL&P may not individually issue any additional first mortgage bonds (with certain exceptions in the case of bonds issued on the basis of retired bonds) unless the particular entity issuing the bonds has “net earnings” (as defined in the respective Mortgages) for any period of 12 consecutive calendar months out of the preceding 18 calendar months that were at least twice the annual interest requirements on that entity's mortgage securities at the time outstanding, including the first mortgage bonds to be issued, and on all indebtedness of prior rank. As of December 31, 2019, property additions and retired bonds would have allowed, and the net earnings test would not have prohibited, the issuance of $1.5 billion in aggregate principal amount of additional first mortgage bonds at Avista Corp. and $30.4 million at AEL&P. We believe that we have adequate capacity to issue first mortgage bonds to meet our financing needs over the next several years.
54
Utility Capital Expenditures
We are making capital investments at our utilities to enhance service and system reliability for our customers and replace aging infrastructure. The following table summarizes our actual and expected capital expenditures as of and for the year ended December 31, 2019 (in thousands):
Avista Utilities | AEL&P | ||||||
2019 Actual capital expenditures | |||||||
Capital expenditures (per the Consolidated Statement of Cash Flows) | $ | 434,077 | $ | 8,433 | |||
Expected total annual capital expenditures (by year) | |||||||
2020 | $ | 405,000 | $ | 9,000 | |||
2021 | 405,000 | 9,000 | |||||
2022 | 405,000 | 15,000 | |||||
The following graph shows Avista Utilities' capital budget for 2020:
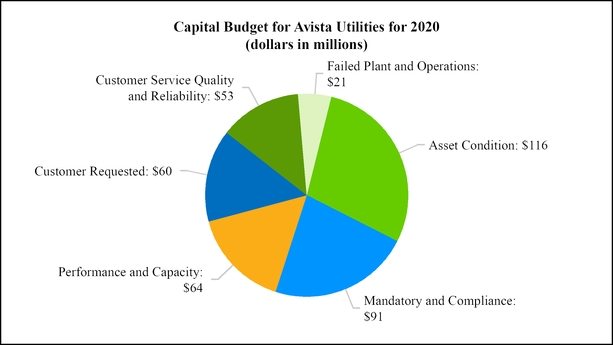
These estimates of capital expenditures are subject to continuing review and adjustment. Actual expenditures may vary from our estimates due to factors such as changes in business conditions, construction schedules and environmental requirements.
55
Non-Regulated Investments and Capital Expenditures
We are making investments and capital expenditures at our other businesses including those related to economic development projects in our service territory that will demonstrate the latest energy and environmental building innovations and house several local college degree programs. In addition, we are making investments in emerging technology companies and venture capital funds. The following table summarizes our actual and expected investments and capital expenditures at our other businesses as of and for the year ended December 31, 2019 (in thousands):
Other | |||
2019 Actual investments and capital expenditures | |||
Investments and capital expenditures (per the Consolidated Statement of Cash Flows) | $ | 14,343 | |
Expected total annual investments and capital expenditures (by year) | |||
2020 | $ | 15,000 | |
2021 | 15,000 | ||
2022 | 12,000 | ||
These estimates of investments and capital expenditures are subject to continuing review and adjustment. Actual expenditures may vary from our estimates due to factors such as changes in business conditions or strategic plans.
Off-Balance Sheet Arrangements
As of December 31, 2019, we had $21.5 million in letters of credit outstanding under our $400.0 million committed line of credit, compared to $10.5 million as of December 31, 2018.
Pension Plan
We contributed $22.0 million to the pension plan in 2019. We expect to contribute a total of $110.0 million to the pension plan in the period 2020 through 2024, with an annual contribution of $22.0 million over that period.
The final determination of pension plan contributions for future periods is subject to multiple variables, most of which are beyond our control, including changes to the fair value of pension plan assets, changes in actuarial assumptions (in particular the discount rate used in determining the benefit obligation), or changes in federal legislation. We may change our pension plan contributions in the future depending on changes to any variables, including those listed above.
See "Note 11 of the Notes to Consolidated Financial Statements" for additional information regarding the pension plan.
Credit Ratings
Our access to capital markets and our cost of capital are directly affected by our credit ratings. In addition, many of our contracts for the purchase and sale of energy commodities contain terms dependent upon our credit ratings. See “Enterprise Risk Management – Credit Risk Liquidity Considerations” and “Note 7 of the Notes to Consolidated Financial Statements.”
The following table summarizes our credit ratings as of February 25, 2020:
Standard & Poor’s (1) | Moody’s (2) | ||
Corporate/Issuer rating | BBB | Baa2 | |
Senior secured debt | A- | A3 | |
Senior unsecured debt | BBB | Baa2 | |
(1) | Standard & Poor’s lowest “investment grade” credit rating is BBB-. |
(2) | Moody’s lowest “investment grade” credit rating is Baa3. |
A security rating is not a recommendation to buy, sell or hold securities. Each security rating is subject to revision or withdrawal at any time by the assigning rating organization. Each security rating agency has its own methodology for assigning ratings, and, accordingly, each rating should be considered in the context of the applicable methodology, independent of all other ratings. The rating agencies provide ratings at the request of Avista Corp. and charge fees for their services.
56
On December 20, 2018, Moody's downgraded our issuer rating from Baa1 to Baa2 and our senior secured and first mortgage bond ratings from A2 to A3. Moody's made these downgrades because of the impacts of the TCJA, which results in less operating cash flow from deferred income taxes due to the loss of bonus depreciation and lower tax rates. Moody's also expressed less predictability with regulatory outcomes in Washington as a contributing factor for the downgrade.
See "Note 12 of the Notes to Consolidated Financial Statements" for additional information regarding the TCJA and its impacts to Avista Corp.
Dividends
See "Item 5. Market for Registrant’s Common Equity, Related Stockholder Matters and Issuer Purchases of Equity Securities" for a detailed discussion of our dividend policy and the factors which could limit the payment of dividends.
Contractual Obligations
The following table provides a summary of our future contractual obligations as of December 31, 2019 (dollars in millions):
2020 | 2021 | 2022 | 2023 | 2024 | Thereafter | ||||||||||||||||||
Avista Utilities: | |||||||||||||||||||||||
Long-term debt maturities | $ | 52 | $ | — | $ | 250 | $ | 14 | $ | — | $ | 1,505 | |||||||||||
Long-term debt to affiliated trusts | — | — | — | — | — | 52 | |||||||||||||||||
Interest payments on long-term debt (1) | 85 | 83 | 73 | 69 | 69 | 1,325 | |||||||||||||||||
Short-term borrowings | 182 | — | — | — | — | — | |||||||||||||||||
Energy purchase contracts (2) | 247 | 230 | 223 | 219 | 194 | 1,446 | |||||||||||||||||
Lease obligations (3) | 4 | 4 | 4 | 4 | 4 | 92 | |||||||||||||||||
Other obligations (4) | 33 | 34 | 25 | 25 | 29 | 192 | |||||||||||||||||
Information technology contracts (5) | 1 | — | — | — | — | — | |||||||||||||||||
Pension and other postretirement funding (6) | 30 | 31 | 31 | 31 | 31 | 159 | |||||||||||||||||
Unsettled interest rate swap derivatives (7) | 9 | 12 | 12 | — | — | — | |||||||||||||||||
AEL&P total contractual obligations (8) | 16 | 16 | 16 | 16 | 16 | 253 | |||||||||||||||||
Other businesses (consolidated) total contractual obligations (9) | 18 | 13 | 6 | 6 | 20 | — | |||||||||||||||||
Total contractual obligations | $ | 677 | $ | 423 | $ | 640 | $ | 384 | $ | 363 | $ | 5,024 | |||||||||||
(1) | Represents our estimate of interest payments on long-term debt, which is calculated based on the assumption that all debt is outstanding until maturity. Interest on variable rate debt is calculated using the rate in effect at December 31, 2019. |
(2) | Energy purchase contracts were entered into as part of the obligation to serve our retail electric and natural gas customers’ energy requirements. As a result, costs are generally recovered either through base retail rates or adjustments to retail rates as part of the power and natural gas cost deferral and recovery mechanisms. |
(3) | Primarily relates to an operating lease with the State of Montana for about $4.0 million annually and expires in 2046. See "Note 5 of the Notes to Consolidated Financial Statements" for further discussion of this and our other leases. |
(4) | Represents operating agreements, settlements and other contractual obligations for our generation, transmission and distribution facilities. These costs are generally recovered through base retail rates. |
(5) | Includes information service contracts which are recorded to other operating expenses in the Consolidated Statements of Income. |
(6) | Represents our estimated cash contributions to pension plans and other postretirement benefit plans through 2024. We have only included pension and other postretirement funding through 2029 as we cannot reasonable estimate the amounts beyond that time period. This is consistent with the time period presented in "Note 11 of the Notes to Consolidated Financial Statements." This amount is above our contractually obligated amount. |
(7) | Represents the net mark-to-market fair value of outstanding unsettled interest rate swap derivatives as of December 31, 2019. The values in the table above will change each period depending on fluctuations in market interest rates and could become either assets or liabilities. Also, the amounts in the table above are not reflective of cash collateral of $6.8 million that is already posted with counterparties against the outstanding interest rate swap derivatives. |
(8) | Primarily relates to long-term debt and finance lease maturities and the related interest. AEL&P contractual commitments also include contractually required capital project funding and operating and maintenance costs associated with the Snettisham hydroelectric project. These costs are generally recovered through base retail rates. |
57
(9) | Primarily relates to venture fund commitments, and a commitment to fund a limited liability company in exchange for equity ownership, made by a subsidiary of Avista Capital. Also, there is a long-term debt maturity and the related interest associated with AERC. |
The above contractual obligations do not include income tax payments. Also, asset retirement obligations are not included above and payments associated with these have historically been less than $1 million per year. There are approximately $20.3 million remaining asset retirement obligations as of December 31, 2019.
In addition to the contractual obligations disclosed above, we will incur additional operating costs and capital expenditures in future periods for which we are not contractually obligated as part of our normal business operations.
Competition
Our utility electric and natural gas distribution business has historically been recognized as a natural monopoly. In each regulatory jurisdiction, our rates for retail electric and natural gas services (other than specially negotiated retail rates for industrial or large commercial customers, which are subject to regulatory review and approval) are generally determined on a “cost of service” basis. Rates are designed to provide, after recovery of allowable operating expenses and capital investments, an opportunity for us to earn a reasonable return on investment as allowed by our regulators.
In retail markets, we compete with various rural electric cooperatives and public utility districts in and adjacent to our service territories in the provision of service to new electric customers. Alternative energy technologies, including customer-sited solar, wind or geothermal generation, or energy storage may also compete with us for sales to existing customers. Advances in power generation, energy efficiency, energy storage and other alternative energy technologies could lead to more wide-spread usage of these technologies, thereby reducing customer demand for the energy supplied by us. This reduction in usage and demand would reduce our revenue and negatively impact our financial condition including possibly leading to our inability to fully recover our investments in generation, transmission and distribution assets. Similarly, our natural gas distribution operations compete with other energy sources including heating oil, propane and other fuels.
Certain natural gas customers could bypass our natural gas system, reducing both revenues and recovery of fixed costs. To reduce the potential for such bypass, we price natural gas services, including transportation contracts, competitively and have varying degrees of flexibility to price transportation and delivery rates by means of individual contracts. These individual contracts are subject to state regulatory review and approval. We have long-term transportation contracts with several of our largest industrial customers under which the customer acquires its own commodity while using our infrastructure for delivery. Such contracts reduce the risk of these customers bypassing our system in the foreseeable future and minimizes the impact on our earnings.
Also, non-utility businesses are developing new technologies and services to help energy consumers manage energy in new ways that may improve productivity and could alter demand for the energy we sell.
In wholesale markets, competition for available electric supply is influenced by the:
• | localized and system-wide demand for energy, |
• | type, capacity, location and availability of generation resources, and |
• | variety and circumstances of market participants. |
These wholesale markets are regulated by the FERC, which requires electric utilities to:
• | transmit power and energy to or for wholesale purchasers and sellers, |
• | enlarge or construct additional transmission capacity for the purpose of providing these services, and |
• | transparently price and offer transmission services without favor to any party, including the merchant functions of the utility. |
Participants in the wholesale energy markets include:
• | other utilities, |
• | federal power marketing agencies, |
• | energy marketing and trading companies, |
• | independent power producers, |
• | financial institutions, and |
58
• | commodity brokers. |
Economic Conditions and Utility Load Growth
The general economic data, on both national and local levels, contained in this section is based, in part, on independent government and industry publications, reports by market research firms or other independent sources. While we believe that these publications and other sources are reliable, we have not independently verified such data and can make no representation as to its accuracy.
Avista Utilities
We track multiple economic indicators affecting the three largest metropolitan statistical areas in our Avista Utilities service area: Spokane, Washington, Coeur d'Alene, Idaho, and Medford, Oregon. The key indicators are employment change and unemployment rates. On an annual basis, 2019 showed positive job growth with mixed changes in the unemployment rates in all three metropolitan areas. However, the unemployment rates in Spokane and Medford are still above the national average. Other leading indicators, such as initial unemployment claims and residential building permits, signal continued growth over the next 12 months. Considering all relevant indicators, we expect economic growth in our service area in 2020 to be in-line with the U.S. as a whole.
Nonfarm employment (seasonally adjusted) in our eastern Washington, northern Idaho, and southwestern Oregon metropolitan service areas exhibited moderate growth in 2019. In Spokane, Washington employment growth was 1.9 percent with gains in all major sectors except trade, transportation, and utilities. Employment increased by 2.5 percent in Coeur d'Alene, Idaho, reflecting gains in all major sectors except; information; financial services; and government. In Medford, Oregon, employment growth was 0.8 percent, with gains in all major sectors except mining, logging, and construction; financial activities; professional and business services; and leisure and hospitality. U.S. nonfarm sector jobs grew by 1.6 percent over the same period.
Changes in the unemployment rate in 2019 were mixed. In Spokane the average rate was 5.4 percent in 2018 and increased to 5.6 percent in 2019; in Coeur d'Alene the average rate stayed at 3.5 in 2018 and 2019; and in Medford the average rate declined from 4.8 percent to 4.5 percent. The U.S. unemployment rate declined from 3.9 percent to 3.7 percent in 2019.
Alaska Electric Light and Power Company
Our AEL&P service area is centered in Juneau. Although Juneau is Alaska’s state capital, it is not a metropolitan statistical area. This means breadth and frequency of economic data is more limited. Therefore, the dates of Juneau's economic data may significantly lag the period of this filing.
The Quarterly Census of Employment and Wages for Juneau shows employment increased 1.1 percent between the first half of 2018 and first half of 2019. The employment increase was centered in natural resources and mining; manufacturing; trade, transportation, and utilities; financial activities; and professional and business services; education and health services. Government (including active duty military personnel) accounts for approximately 37 percent of total employment. Between 2018 and 2019, the unemployment rate increased from 4.4 percent to 4.6 percent.
Forecasted Customer and Load Growth
Based on our forecast for 2019 through 2023 for Avista Utilities' service area, we expect annual electric customer growth to average 1.1 percent, within a forecast range of 0.7 percent to 1.5 percent. We expect annual natural gas customer growth to average 1.6 percent, within a forecast range of 1 percent to 2.2 percent. We anticipate retail electric load growth to average 0.5 percent, within a forecast range of 0.2 percent and 0.8 percent. We expect natural gas load growth to average 1.1 percent, within a forecast range of 0.6 percent and 1.6 percent. The forecast ranges reflect (1) the inherent uncertainty associated with the economic assumptions on which forecasts are based and (2) the historic variability of natural gas customer and load growth.
In AEL&P's service area, we expect no significant growth in residential, commercial and government customers for the period 2019 through 2023. We anticipate average annual total load growth will be in a narrow range around 0.3 percent, with residential load growth averaging 0.6 percent and commercial and government growth near 0 percent.
The forward-looking statements set forth above regarding retail load growth are based, in part, upon purchased economic forecasts and publicly available population and demographic studies. The expectations regarding retail load growth are also based upon various assumptions, including:
• | assumptions relating to weather and economic and competitive conditions, |
• | internal analysis of company-specific data, such as energy consumption patterns, |
• | internal business plans, |
59
• | an assumption that we will incur no material loss of retail customers due to self-generation or retail wheeling, and |
• | an assumption that demand for electricity and natural gas as a fuel for mobility will for now be immaterial. |
Changes in actual experience can vary significantly from our projections.
See also "Competition" above for a discussion of competitive factors that could affect our results of operations in the future.
Environmental Issues and Contingencies
We are subject to environmental regulation by federal, state and local authorities. The generation, transmission, distribution, service and storage facilities in which we have ownership interests are subject to environmental laws relating to site conditions, air emissions, wastewater and stormwater discharges, waste handling, and other similar activities. We conduct periodic reviews and audits of pertinent facilities and operations to enhance compliance and to respond to or anticipate emerging environmental issues. The Company's Board of Directors has established a committee to oversee environmental issues and to assess and manage environmental risk.
We monitor legislative and regulatory developments at different levels of government for environmental issues, particularly those with the potential to impact the operation and productivity of our generating plants and other assets.
Environmental laws and regulations may restrict or impact our business activities in many ways, including, but not limited to:
• | increase the operating costs of generating plants; |
• | increase the lead time and capital costs for the construction of new generating plants; |
• | require modification of our existing generating plants; |
• | require existing generating plant operations to be curtailed or shut down; |
• | reduce the amount of energy available from our generating plants; |
• | restrict the types of generating plants that can be built or contracted with; |
• | require construction of specific types of generation plants at higher cost; and |
• | increase costs of distributing, or limit our ability to distribute, electricity and/or natural gas. |
Compliance with environmental laws and regulations could result in increases to capital expenditures and operating expenses. We intend to seek recovery of any such costs through the ratemaking process.
Clean Energy Commitment
In April 2019, we announced a goal to serve our customers with 100 percent clean electricity by 2045 and to have a carbon-neutral supply of electricity by the end of 2027. To help achieve our goals and add to our clean electricity portfolio, in the last three years, we have implemented three renewable energy projects on behalf of our customers: the Community Solar project (0.4 MW) in Spokane Valley, Washington (owned by Avista Corp.), the Solar Select project (28 MW) in Lind, Washington (PPA), and the Rattlesnake Flat Wind project (144 MW) in Adams County, Washington (PPA).
To achieve our clean energy goals, we expect that energy storage and other technologies, which are either not currently available or are not cost-effective under a lowest reasonable cost regulatory standard, will advance such that it will allow us to meet our goals while also maintaining reliability and affordability for our customers. If the required technology is not available or not affordable in the future, we may not meet our predetermined goals in the timeframe we have forecasted. Meeting our clean energy goals may also require accommodation from economic regulatory agencies insofar as the Company may need to acquire emission offsets to meet its goals.
Climate Change
Legal and policy changes responding to concerns about long-term global climate changes, and the potential impacts of such changes, could have a significant effect on our business. Our operations could be affected by changes in laws and regulations intended to mitigate the risk of, or alter, global climate changes, including restrictions on the operation of our power generation resources and obligations or limitations imposed on the sale of natural gas. Changing temperatures and precipitation, including snowpack conditions, affect the availability and timing of streamflows, which impact hydroelectric generation. Extreme weather events could increase fire risks, service interruptions, outages and maintenance costs. Changing temperatures could also increase or decrease customer demand.
60
Our Clean Energy Council is an interdisciplinary team of management and other employees of the Company which regularly meets to discuss, assess and manage potential risks associated with long-term global climate change. Among other things, the Clean Energy Council:
• | facilitates internal and external communications regarding climate change and related issues, |
• | analyzes policy effects, anticipates opportunities and evaluates strategies for the Company, |
• | develops recommendations on climate-related policy positions and action plans, and |
• | provides direction and oversight with respect to the Company’s clean energy goals. |
In addition to the Clean Energy Council, issues concerning climate-related risk and the Company’s clean energy goals are reviewed and regularly discussed by the Board of Directors. The Board’s Environmental, Technology and Operations Committee regularly reviews and discusses environmental and climate related risks, and advises the full Board on any critical or emerging risks and/or related policies. Likewise, the Audit Committee provides oversight of climate-related disclosures in the Company’s financial statements.
Federal Regulatory Actions
The EPA released the final version of the Affordable Clean Energy (ACE) rule, the replacement for the Clean Power Plan (CPP), in June 2019. EPA’s final rule does not contain any final action on the proposed modifications to the new source review (NSR) program that would provide coal-fired power plants more latitude to make efficiency improvements without triggering pre-construction permit requirements. The final ACE rule combines three distinct EPA actions.
First, EPA finalizes the repeal of the CPP.
Second, the EPA finalizes the ACE rule, which comprises EPA’s determination of the Best System of Emissions Reduction (BSER) for existing coal-fired power plants and establishment of the procedures that will govern States’ promulgation of standards of performance for existing electric utility generating units within their borders. EPA sets the final BSER as heat rate efficiency improvements based on a range of “candidate technologies” that can be applied to a plant's operating units and requires that each State determine which apply to each coal-fired unit based on consideration of remaining useful plant life.
Lastly, the EPA finalizes a number of changes to the implementing regulations for the timing of State plans for current and future Section 111(d) rulemakings. These regulatory actions have been challenged in federal court. With respect to the Colstrip Generation Station, the Montana Department of Environmental Protection (MDEQ) would initiate the BSER evaluation process. We cannot reasonably predict the timing or outcome of MDEQ’s efforts, or estimate the extent to which Colstrip may be impacted at this time.
Washington Legislation and Regulatory Actions
Energy Independence Act (EIA)
The EIA in Washington requires electric utilities with over 25,000 customers to acquire qualified renewable energy resources and/or renewable energy credits equal to 15 percent of the utility's total retail load in Washington in 2020. The EIA also requires these utilities to meet biennial energy conservation targets. The renewable energy standard increased from three percent in 2012 to nine percent in 2016 and to 15 percent in 2020. Failure to comply with renewable energy and efficiency standards could result in penalties of $50 per MWh or greater assessed against a utility for each MWh it is deficient in meeting a standard. We meet the requirements of the EIA through a variety of renewable energy generating means, including, but not limited to, some combination of qualifying hydroelectric upgrades, wind, biomass and renewable energy credits.
Clean Air Rule
In September 2016, Ecology adopted the Clean Air Rule (CAR) to cap and reduce greenhouse gas (GHG) emissions across the State of Washington in pursuit of the State’s GHG goals, which were enacted in 2008 by the Washington State Legislature. The CAR applies to sources of annual GHG emissions in excess of 100,000 tons for the first compliance period of 2017 through 2019; this threshold incrementally decreases to 70,000 metric tons beginning in 2035. The rule affects stationary sources and transportation fuel suppliers, as well as natural gas distribution companies. Ecology originally identified approximately 30 entities that would be regulated under the CAR. Parties covered by the regulation will be required to reduce emissions by 1.7 percent annually until 2035. Compliance can be demonstrated by achieving emission reductions and/or surrendering Emission Reduction Units (ERU), which are generated by parties that achieve reductions greater than required by the rule. Allowable ERUs can also take the form of renewable energy credits from renewable resources located in Washington, carbon emission offsets, and allowances
61
acquired from an organized cap and trade market, such as the one operating in California. In addition to the CAR's applicability to our burning of fuel as an electric utility, the CAR would apply to us as a natural gas distribution company, for the emissions associated with the use of the natural gas we provide our customers who are not already covered under the regulation.
In September 2016, Avista Corp., Cascade Natural Gas Corp., NW Natural and Puget Sound Energy (PSE) (collectively, Petitioners) jointly filed an action in the U.S. District Court for the Eastern District of Washington challenging Ecology’s promulgated CAR. The four companies also filed litigation in Thurston County Superior Court.
The case in the U.S. District Court has been stayed while the state court case proceeded. On December 15, 2017, the Thurston County Superior Court issued a ruling invalidating the CAR. Ecology subsequently appealed the ruling, and the Washington State Supreme Court accepted review. On January 16, 2020, the Washington State Supreme Court issued a decision holding that the CAR was invalid as to non-emitters, such as natural gas distributors, but could be enforced against direct emitters, such as natural gas generation plants. The Court has remanded the matter to Thurston County Superior Court, where claims previously raised before, but not addressed by, that court may be revised with respect to, among other issues, alleged procedural infirmities. At this time, we are evaluating the potential impact of the surviving portion of the rule, if any, to our generation facilities, should their emissions exceed the rule’s compliance threshold. The rule is not intended to apply to the Kettle Falls Generating Station. We plan to seek recovery of any costs related to compliance with the surviving portion of the CAR through the ratemaking process.
Clean Energy Transformation Act
In 2019, the Washington State Legislature passed the Clean Energy Transformation Act (CETA), which requires Washington utilities to no longer allocate coal-fired resources to Washington retail customers by the end of 2025, and to achieve carbon neutrality by 2030 while meeting a minimum 80 percent of load through delivery of renewable or non-emitting resources to customers. The law has direct, specific impacts on Colstrip. The legislation sets-forth alternative compliance measures that can be pursued by an electric utility to offset emissions from fossil fuel generation. The CETA also requires utilities to meet 100 percent of load with renewable and non-emitting resources by 2045, although no penalties for failing to meet that standard were established. Our hydroelectric and biomass generation facilities are considered resources that can be used to comply with the CETA’s clean energy standards. CETA also effectuated changes to laws governing the WUTC to acknowledge that it has the discretion to employ flexible regulatory mechanisms, which may be used to address issues associated with regulatory lag. The law requires additional rulemaking by several Washington agencies for its measures to be enacted, which have not been issued to date. We intend to seek recovery of any costs associated with the clean energy legislation through the regulatory process.
Washington Policy Statement
In conjunction with the CETA, on January 31, 2020, the WUTC issued a policy statement concerning the treatment of used and useful plant in the context of rate filings, including in multi-year rate plans. This guidance should prove helpful in future filings. The policy statement intends to achieve four goals:
•ensure general consistency with longstanding ratemaking practices, principles, and standards;
•maintain flexibility in ratemaking;
•avoid overly prescriptive guidance; and
•support steamlined processes.
Emissions Performance Standard
Washington also applies a GHG emissions performance standard to electric generation facilities used to serve retail loads in their jurisdictions, whether the facilities are located within its state or elsewhere. The emissions performance standard prevents utilities from constructing or purchasing generation facilities, or entering into power purchase agreements of five years or longer duration to purchase energy produced by plants that, in any case, have emission levels higher than 1,100 pounds of GHG per MWh. The Washington State Department of Commerce reviews the standard every five years. In September 2018, it adopted a new standard of 925 pounds of GHG per MWh. We intend to seek recovery of costs related to ongoing and new requirements through the ratemaking process.
GHG Reduction Targets
The State of Washington has adopted non-binding targets to reduce GHG emissions. The State enacted its targets with an expectation of reaching the targets through a combination of renewable energy standards, eventual carbon pricing mechanisms, such as cap and trade regulation or a carbon tax, and assorted “complementary policies.” However, no
62
specific reductions are mandated as yet. The State’s targets, originally enacted in 2008, have been the evaluated by state institutions against the aims of the Paris Climate Accord of 2016, which include limiting the increase in the global average temperatures to at least below 2 degrees Celsius above pre-industrial levels and pursuing efforts to restrict the temperature increase to 1.5 degrees Celsius above pre-industrial levels. We cannot reasonably predict how the state legislature may revise the State's targets in the future. We intend to seek recovery of any new costs associated with these reduction targets, or any new reduction targets, through the regulatory process.
Oregon Legislation and Regulatory Actions
GHG Reduction Targets
The State of Oregon has adopted non-binding targets to reduce GHG emissions. The State enacted its targets with an expectation of reaching the targets through a combination of renewable energy standards, eventual carbon pricing mechanisms, such as cap and trade regulation or a carbon tax, and assorted “complementary policies.” However, no specific reductions are mandated as yet. The State’s targets have been the evaluated by state institutions against the aims of the Paris Climate Accord of 2016, which include limiting the increase in the global average temperatures to at least below 2 degrees Celsius above pre-industrial levels and pursuing efforts to restrict the temperature increase to 1.5 degrees Celsius above pre-industrial levels. We cannot reasonably predict how the state legislature may revise the State's targets in the future. We intend to seek recovery of any new costs associated with these reduction targets, or any new reduction targets, through the regulatory process.
Emissions Performance Standard
Like Washington, Oregon applies a GHG emissions performance standard to electric generation facilities, requiring that any new baseload natural gas plant, non-base load natural gas plant, and non-generating facility reduce its net carbon dioxide emissions 17% below the most efficient combustion-turbine plant in the United States. The Oregon Energy Facility Siting Council issues rules periodically to update the standard, as more efficient power plants are built in other states. The standard can be met by any combination of efficiency, cogeneration, and offsets from carbon dioxide mitigation measures. We intend to seek recovery of costs related to ongoing and new requirements through the ratemaking process.
Clean Electricity and Coal Transition Act
In Oregon, legislation was enacted in 2016 which requires Portland General Electric and PacifiCorp to remove coal-fired generation from their Oregon rate base by 2030. This legislation does not directly relate to Avista Corp. because Avista Corp. is not an electric utility in Oregon. However, because these two utilities, along with Avista Corp., hold minority interests in Colstrip, the legislation could indirectly impact Avista Corp., though specific impacts cannot be reasonably predicted at this time. While the legislation requires Portland General Electric and PacifiCorp to eliminate Colstrip from their rates, they would be permitted to sell the output of their shares of Colstrip into the wholesale market or, as is the case with PacifiCorp, reallocate generation from Colstrip to other states. We cannot predict the eventual outcome of actions arising from this legislation at this time or estimate the effect thereof on Avista Corp.; however, we intend to continue to seek recovery, through the ratemaking process, of all operating and capitalized costs related to our generation assets.
Colstrip-Specific Issues
Depreciation of Colstrip Assets
Colstrip Units 1 & 2, which we have no ownership in, were scheduled to close by 2022, but were closed in January 2020. We are still evaluating these closures for any financial impact applicable to us as joint owners of Units 3 & 4. We have received an order from the IPUC allowing us to accelerate the depreciation of our 15 percent ownership interest in Colstrip Units 3 & 4 to 2027. Similarly, in our 2019 Washington general rate case proposed settlement, the parties have agreed to accelerate the depreciation of our 15 percent ownership in Colstrip Units 3 & 4 to December 31, 2025. The proposed settlement in Washington is subject to WUTC approval. Our remaining investment in Colstrip Units 3 & 4 as of December 31, 2019 was $119.2 million.
Hazardous Air Pollutants (HAPs)
In April 2016, the Mercury Air Toxic Standards (MATS), an EPA rule for coal-and oil-fired sources, became effective for all Colstrip units. Colstrip has already implemented applicable MATS control measures to comply with the MATS rule, and continues to monitor potential changes in the rule to determine additional compliance obligations, if any. Colstrip performs compliance assurance stack testing on a quarterly basis to meet the MATS site-wide limitation for Particulate Matter (PM) emissions (0.03 lbs./MMBtu). In June 2018, the Montana Department of Environmental Quality (MDEQ) was
63
notified of a PM emission deviation by Talen, the plant operator, for the testing performed on June 21, 2018. As a result, Unit 3 was promptly removed from service. For similar reasons, Unit 4 was removed from service on June 29, 2018.
Talen proposed, and the MDEQ acknowledged, that limited operation of Units 3 & 4 for the evaluation of a corrective action and/or data gathering related to potential corrective action was a prudent approach to solving the issue. An extensive inspection was conducted including: the coal supply, coal mills, boiler, combustion, ductwork, air preheater, scrubbers, and the stack. Talen implemented cleaning, adjustments, troubleshooting, testing, and other corrective actions. As a part of the corrective action, new flow balancing plates were installed in all Unit 3 & 4 scrubber vessels to further enhance PM removal efficiency.
PM testing in September 2018 on Units 3 & 4 demonstrated compliance with the MATS. Both of these compliance tests were witnessed by the MDEQ. With the passing of the PM testing with MATS compliance, Talen, the Colstrip Operator returned both Units 3 & 4 to service in September 2018.
Due to the June 2018 failure to meet the MATS standard, Colstrip Units 3 & 4 were subject to potential MDEQ enforcement action. In lieu of such an action, in December 2019, Talen and MDEQ entered a Stipulated Consent Decree providing for a cash penalty, partially offset by an agreement by Talen to fund specified Supplemental Environmental Projects, as well as additional monitoring activities. The total amount of the cash penalty allocable to Avista is not material. However, PacifiCorp, PSE, and Avista Corp. are all engaged in a consolidated proceeding before the WUTC to determine the recoverability of replacement power costs incurred during the period that Units 3 & 4 were out of service. These proceedings are discussed in Note 21 of the Notes to Consolidated Financial Statements.
Coal Ash Management/Disposal
In 2015, the EPA issued a final rule regarding coal combustion residuals (CCRs), also termed coal combustion byproducts or coal ash. The CCR rule has been the subject of ongoing litigation. In August 2018, the D.C. Circuit struck down provisions of the rule. Colstrip, of which we are a 15 percent owner of Units 3 & 4, produces this byproduct. On December 2, 2019, a proposed revision to the rule was published in the Federal Register to address the D.C. Circuit's decision. The rule includes technical requirements for CCR landfills and surface impoundments under Subtitle D of the Resource Conservation and Recovery Act, the nation's primary law for regulating solid waste. The Colstrip owners developed a multi-year compliance plan to address the CCR requirements and existing state obligations (expressed largely through a 2012 Administrative Order on Consent). These requirements continue despite the 2018 federal court ruling.
Based on available information from Talen, we review and update our asset retirement obligations (AROs) periodically. See "Note 10 of the Notes to Consolidated Financial Statements" for additional information regarding AROs. In addition, under a 2012 Administrative Order on Consent with MDEQ, the owners of Colstrip are required to provide financial assurance, primarily in the form of surety bonds, to secure each owner’s pro rata share of various anticipated closure and remediation obligations. The amount of financial assurance required of each owner may, like the AROs, vary substantially due to the uncertainty and evolving nature of anticipated closure and remediation activities, and as those activities are completed over time.
In addition to an increase to our AROs, it is expected that there will be significant compliance costs at Colstrip in the future. That will impact both operating and capital costs, due to a series of incremental infrastructure improvements which are separate from the AROs. We cannot reasonably estimate the future compliance costs; however, we will update our AROs and compliance cost estimates as appropriate.
The actual asset retirement costs and future compliance costs related to the CCR rule requirements may vary substantially from the estimates used to record the AROs due to uncertainty about the compliance strategies that will be used and the nature of available data used to estimate costs, such as the quantity of coal ash present at certain sites and the volume of fill that will be needed to cap and cover certain impoundments. We intend to coordinate with the plant operator and continue to gather additional data in future periods to make decisions about compliance strategies and the timing of closure activities. As additional information becomes available, we intend to update the AROs and future nonretirement compliance costs for these changes in estimates, which could be material. We expect to seek recovery of increased costs related to complying with the CCR rule and related requirements through the ratemaking process.
Colstrip Coal Contract
Colstrip, which is operated by Talen Montana, is supplied with fuel from adjacent coal reserves under coal supply and transportation agreements. The contract for coal supply extended through 2019. Several of the co-owners of Colstrip, including the Company, have since negotiated an extension to the coal contract that runs through December 31, 2025. In January 2020, the Staff of the WUTC submitted a Petition to Initiate Joint Investigation to the Commission to investigate the contract. In their petition, the WUTC Staff is proposing one proceeding involving the three joint owners of Colstrip
64
Units 3 & 4 and the focus of their proposed investigation is to review the overall prudency of the new contract and any production tax credits associated with the contract.
PSE Sale of Colstrip Unit 4
On December 10, 2019, PSE announced that it had entered into an agreement to sell its share of Colstrip Unit 4 to NorthWestern Energy, along with certain related transmission rights and assets. On February 20, 2020, PSE filed its application with the WUTC for an order authorizing the sale of all its interests in Colstrip Unit 4.The transaction is subject to approval from both the MPSC and the WUTC, as well as a right of first refusal held by the Co-Owners of Colstrip Units 3 & 4. If the transaction is successfully completed, PSE would continue to own an interest in Colstrip Unit 3 and would purchase energy generated by Colstrip Unit 4 from NorthWestern Energy until 2025. As a 15 percent owner in Colstrip Units 3 & 4, we are still evaluating the proposed transaction and what actions, if any, we might take. We cannot reasonably estimate the effect of the transaction, should it occur, on the future ownership, operation and operating costs of our share of Colstrip Units 3 & 4.
Clean Air Act (CAA)
The CAA creates a number of requirements for our thermal generating plants. Colstrip, Kettle Falls GS, Coyote Springs and Rathdrum CT all require CAA Title V operating permits. The Boulder Park GS, Northeast CT and a number of other operations require minor source permits or simple source registration permits. We have secured these permits and certify our compliance with Title V permits on an annual basis. These requirements can change over time as the CAA or applicable implementing regulations are amended and new permits are issued. We actively monitor legislative, regulatory and other program developments of the CAA that may impact our facilities.
Threatened and Endangered Species and Wildlife
A number of species of fish in the Northwest are listed as threatened or endangered under the Federal Endangered Species Act (ESA). Efforts to protect these and other species have not significantly impacted generation levels at our hydroelectric facilities, nor operations of our thermal plants or electrical distribution and transmission system. We are implementing fish protection measures at our hydroelectric project on the Clark Fork River under a 45-year FERC operating license for Cabinet Gorge and Noxon Rapids (issued March 2001) that incorporates a comprehensive settlement agreement. The restoration of native salmonid fish, including bull trout, is a key part of the agreement. The result is a collaborative native salmonid restoration program with the U.S. Fish and Wildlife Service, Native American tribes and the states of Idaho and Montana on the lower Clark Fork River, consistent with requirements of the FERC license. The U.S. Fish & Wildlife Service issued an updated Critical Habitat Designation for bull trout in 2010 that includes the lower Clark Fork River, as well as portions of the Coeur d'Alene basin within our Spokane River Project area, and issued a final Bull Trout Recovery Plan under the ESA. Issues related to these activities are expected to be resolved through the ongoing collaborative effort of our Clark Fork and Spokane River FERC licenses.
Various statutory authorities, including the Migratory Bird Treaty Act, have established penalties for the unauthorized take of migratory birds. Because we operate facilities that can pose risks to a variety of such birds, we have developed and follow an avian protection plan.
We are also aware of other threatened and endangered species and issues related to them that could be impacted by our operations and we make every effort to comply with all laws and regulations relating to these threatened and endangered species. We expect costs associated with these compliance efforts to be recovered through the ratemaking process.
Cabinet Gorge Total Dissolved Gas Abatement Plan
Dissolved atmospheric gas levels (referred to as "Total Dissolved Gas" or "TDG") in the Clark Fork River exceed state of Idaho and federal water quality numeric standards downstream of Cabinet Gorge particularly during periods when excess river flows must be diverted over the spillway. Under the terms of the Clark Fork Settlement Agreement as incorporated in Avista Corp.’s FERC license for the Clark Fork Project, Avista Corp. works in consultation with agencies, tribes and other stakeholders to address this issue through structural modifications to the spillgates, monitoring and analysis. The Company intends to continue to work with stakeholders to determine the degree to which TDG abatement reduces future mitigation obligations. The Company has sought, and intends to continue to seek recovery, through the ratemaking process, of all operating and capitalized costs related to this issue.
Other
For other environmental issues and other contingencies see “Note 21 of the Notes to Consolidated Financial Statements.”
65
Enterprise Risk Management
The material risks to our businesses are discussed in "Item 1A. Risk Factors," "Forward-Looking Statements," as well as "Environmental Issues and Contingencies." The following discussion focuses on our mitigation processes and procedures to address these risks.
We consider the management of these risks an integral part of managing our core businesses and a key element of our approach to corporate governance.
Risk management includes identifying and measuring various forms of risk that may affect the Company. We have an enterprise risk management process for managing risks throughout our organization. Our Board of Directors and its Committees take an active role in the oversight of risk affecting the Company. Our risk management department facilitates the collection of risk information across the Company, providing senior management with a consolidated view of the Company’s major risks and risk mitigation measures. Each area identifies risks and implements the related mitigation measures. The enterprise risk process supports management in identifying, assessing, quantifying, managing and mitigating the risks. Despite all risk mitigation measures, however, risks are not eliminated.
Our primary identified categories of risk exposure are:
• Utility regulatory | • External mandates |
• Operational | • Financial |
• Cyber and Technology | • Energy commodity |
• Strategic | • Compliance |
Our primary categories of risks are described in "Item 1A. Risk Factors."
Utility Regulatory Risk
Regulatory risk is mitigated through a separate regulatory group which communicates with commission regulators and staff regarding the Company’s business plans and concerns. The regulatory group also considers the regulator’s priorities and rate policies and makes recommendations to senior management on regulatory strategy for the Company. Oversight of our regulatory strategies and policies is performed by senior management and our Board of Directors. See “Regulatory Matters” for further discussion of regulatory matters affecting our Company.
Operational Risk
To manage operational and event risks, we maintain emergency operating plans, business continuity and disaster recovery plans, maintain insurance coverage against some, but not all, potential losses and seek to negotiate indemnification arrangements with contractors for certain event risks. In addition, we design and follow detailed vegetation management and asset management inspection plans, which help mitigate wildfire and storm event risks, as well as identify utility assets which may be failing and in need of repair or replacement. We also have an Emergency Operating Center, which is a team of employees that plan for and train to deal with potential emergencies or unplanned outages at our facilities, resulting from natural disasters or other events. To prevent unauthorized access to our facilities, we have both physical and cyber security in place.
To address the risk related to fuel cost, availability and delivery restraints, we have an energy resources risk policy, which includes our wholesale energy markets credit policy and control procedures to manage energy commodity price and credit risks. Development of the energy resources risk policy includes planning for sufficient capacity to meet our customer and wholesale energy delivery obligations. See further discussion of the energy resources risk policy below.
Oversight of the operational risk management process is performed by the Environmental, Technology and Operations Committee of our Board of Directors and from senior management with input from each operating department.
Cyber and Technology Risk
We mitigate cyber and technology risk through trainings and exercises at all levels of the Company. The Environmental, Technology and Operations Committee of our Board of Directors along with senior management are regularly briefed on security policy, programs and incidents. Annual cyber and physical training and testing of employees are included in our enterprise security program. Our enterprise business continuity program facilitates business impact analysis of core functions for development of emergency operating plans, and coordinates annual testing and training exercises.
Technology governance is led by senior management, which includes new technology strategy, risk planning and major project planning and approval. The technology project management office and enterprise capital planning group provide project cost,
66
timeline and schedule oversight. In addition, there are independent third party audits of our critical infrastructure security program and our business risk security controls.
We have a Technology department dedicated to securing, maintaining, evaluating and developing our information technology systems. There are regular training sessions for the technology and security team. This group also evaluates the Company's technology for obsolescence and makes recommendations for upgrading or replacing systems as necessary. Additionally, this group monitors for intrusion and security events that may include a data breach or attack on our operations.
Strategic Risk
Oversight of our strategic risk is performed by the Board of Directors and senior management. We have a Chief Strategy Officer who leads strategic initiatives, to search for and evaluate opportunities for the Company and makes recommendations to senior management. We not only focus on whether opportunities are financially viable, but also consider whether these opportunities fall within our core policies and our core business strategies. We mitigate our reputational risk primarily through a focus on adherence to our core policies, including our Code of Conduct, maintaining an appropriate Company culture and tone at the top, and through communication and engagement of our external stakeholders.
External Mandates Risk
Oversight of our external mandate risk mitigation strategies is performed by the Environmental, Technology and Operations Committee of our Board of Directors and senior management. We have a Clean Energy Council which meets internally to assess the potential impacts of climate policy to our business and to identify strategies to plan for change. We also have employees dedicated to actively engage and monitor federal, state and local government positions and legislative actions that may affect us or our customers.
To prevent the threat of municipalization, we work to build strong relationships with the communities we serve through, among other things:
• | communication and involvement with local business leaders and community organizations, |
• | providing customers with a multitude of limited income initiatives, including energy fairs, senior outreach and low income workshops, mobile outreach strategy and a Low Income Rate Assistance Plan, |
• | tailoring our internal company initiatives to focus on choices for our customers, to increase their overall satisfaction with the Company, and |
• | engaging in the legislative process in a manner that fosters the interests of our customers and the communities we serve. |
Financial Risk
Our Regulatory department is critical in mitigation of financial risk as they have regular communications with state commission regulators and staff and they monitor and develop rate strategies for the Company. Rate strategies, such as decoupling, help mitigate the impacts of revenue fluctuations due to weather, conservation or the economy. We also have a Treasury department that monitors our daily cash position and future cash flow needs, as well as monitoring market conditions to determine the appropriate course of action for capital financing and/or hedging strategies. Oversight of our financial risk mitigation strategies is performed by senior management and the Finance Committee of our Board of Directors.
Weather Risk
To partially mitigate the risk of financial under-performance due to weather-related factors, we developed decoupling rate mechanisms that were approved by the Washington, Idaho and Oregon commissions. Decoupling mechanisms are designed to break the link between a utility's revenues and consumers' energy usage and instead provide revenue based on the number of customers, thus mitigating a large portion of the risk associated with lower customer loads. See "Regulatory Matters" for further discussion of our decoupling mechanisms.
Access to Capital Markets
Our capital requirements rely to a significant degree on regular access to capital markets. We actively engage with rating agencies, banks, investors and state public utility commissions to understand and address the factors that support access to capital markets on reasonable terms. We manage our capital structure to maintain a financial risk profile that we believe these parties will deem prudent. We forecast cash requirements to determine liquidity needs, including sources and variability of cash flows that may arise from our spending plans or from external forces, such as changes in energy prices or interest rates. Our financial and operating forecasts consider various metrics that affect credit ratings. Our regulatory strategies include working with state public utility commissions and filing for rate changes as appropriate to meet financial performance expectations.
67
Interest Rate Risk
Uncertainty about future interest rates causes risk related to a portion of our existing debt, our future borrowing requirements, and our pension and other post-retirement benefit obligations. We manage debt interest rate exposure by limiting our variable rate debt to a percentage of total capitalization of the Company. We hedge a portion of our interest rate risk on forecasted debt issuances with financial derivative instruments. The Finance Committee of our Board of Directors periodically reviews and discusses interest rate risk management processes and the steps management has undertaken to control interest rate risk. Our RMC also reviews our interest rate risk management plan. Additionally, interest rate risk is managed by monitoring market conditions when timing the issuance of long-term debt and optional debt redemptions and establishing fixed rate long-term debt with varying maturities.
Our interest rate swap derivatives are considered economic hedges against the future forecasted interest rate payments of our long-term debt. Interest rates on our long-term debt are generally set based on underlying U.S. Treasury rates plus credit spreads, which are based on our credit ratings and prevailing market prices for debt. The interest rate swap derivatives hedge against changes in the U.S. Treasury rates but do not hedge the credit spread.
Even though we work to manage our exposure to interest rate risk by locking in certain long-term interest rates through interest rate swap derivatives, if market interest rates decrease below the interest rates we have locked in, this will result in a liability related to our interest rate swap derivatives, which can be significant. However, through our regulatory accounting practices similar to our energy commodity derivatives, any interim mark-to-market gains or losses are offset by regulatory assets and liabilities. Upon settlement of interest rate swap derivatives, the cash payments made or received are recorded as a regulatory asset or liability and are subsequently amortized as a component of interest expense over the life of the associated debt. The settled interest rate swap derivatives are also included as a part of Avista Corp.'s cost of debt calculation for ratemaking purposes.
The following table summarizes our interest rate swap derivatives outstanding as of December 31, 2019 and December 31, 2018 (dollars in thousands):
December 31, | December 31, | ||||||
2019 | 2018 | ||||||
Number of agreements | 20 | 21 | |||||
Notional amount | $ | 215,000 | $ | 235,000 | |||
Mandatory cash settlement dates | 2020 to 2023 | 2019 to 2022 | |||||
Short-term derivative assets (1) | $ | 589 | $ | 5,283 | |||
Long-term derivative assets (1) | — | 4,843 | |||||
Short-term derivative liability (1) (2) | (7,825 | ) | — | ||||
Long-term derivative liability (1) (2) | (18,498 | ) | (6,861 | ) | |||
(1) | There are offsetting regulatory assets and liabilities for these items on the Consolidated Balance Sheets in accordance with regulatory accounting practices. |
(2) | The balance as of December 31, 2019 and December 31, 2018 reflects the offsetting of $6.8 million and $0.5 million, respectively, of cash collateral against the net derivative positions where a legal right of offset exists. |
We estimate that a 10-basis-point increase in forward LIBOR interest rates as of December 31, 2019 would increase the interest rate swap derivative net liability by $5.1 million, while a 10-basis-point decrease would decrease the interest rate swap derivative net liability by $5.4 million.
We estimated that a 10-basis-point increase in forward LIBOR interest rates as of December 31, 2018 would have increased the interest rate swap derivative net liability by $4.3 million, while a 10-basis-point decrease would decrease the interest rate swap derivative net liability by $4.4 million.
The interest rate on $51.5 million of long-term debt to affiliated trusts is adjusted quarterly, reflecting current market rates. Amounts borrowed under our committed line of credit agreements have variable interest rates.
68
The following table shows our long-term debt (including current portion) and related weighted-average interest rates, by expected maturity dates as of December 31, 2019 (dollars in thousands):
2020 | 2021 | 2022 | 2023 | 2024 | Thereafter | Total | Fair Value | ||||||||||||||||||||||||
Fixed rate long-term debt (1) | $ | 52,000 | $ | — | $ | 250,000 | $ | 13,500 | $ | 15,000 | $ | 1,580,000 | $ | 1,910,500 | $ | 2,173,089 | |||||||||||||||
Weighted-average interest rate | 3.89 | % | — | 5.13 | % | 7.35 | % | 3.44 | % | 4.50 | % | 4.58 | % | ||||||||||||||||||
Variable rate long-term debt to affiliated trusts | — | — | — | — | — | $ | 51,547 | $ | 51,547 | $ | 41,238 | ||||||||||||||||||||
Weighted-average interest rate | — | — | — | — | — | 2.79 | % | 2.79 | % | ||||||||||||||||||||||
(1) | These balances include the fixed rate long-term debt of Avista Corp., AEL&P and AERC. |
Our pension plan is exposed to interest rate risk because the value of pension obligations and other post-retirement obligations varies directly with changes in the discount rates, which are derived from end-of-year market interest rates. In addition, the value of pension investments and potential income on pension investments is partially affected by interest rates because a portion of pension investments are in fixed income securities. Oversight of our pension plan investment strategies is performed by the Finance Committee of the Board of Directors, which approves investment and funding policies, objectives and strategies that seek an appropriate return for the pension plan. We manage interest rate risk associated with our pension and other post-retirement benefit plans by investing a targeted amount of pension plan assets in fixed income investments that have maturities with similar profiles to future projected benefit obligations. See "Note 11 of the Notes to Consolidated Financial Statements" for further discussion of our investment policy associated with the pension assets.
Credit Risk
Counterparty Non-Performance Risk
Counterparty non-performance risk relates to potential losses that we would incur as a result of non-performance of contractual obligations by counterparties to deliver energy or make financial settlements.
Changes in market prices may dramatically alter the size of credit risk with counterparties, even when we establish conservative credit limits. Should a counterparty fail to perform, we may be required to honor the underlying commitment or to replace existing contracts with contracts at then-current market prices.
We enter into bilateral transactions with various counterparties. We also trade energy and related derivative instruments through clearinghouse exchanges.
We seek to mitigate credit risk by:
• | transacting through clearinghouse exchanges, |
• | entering into bilateral contracts that specify credit terms and protections against default, |
• | applying credit limits and duration criteria to existing and prospective counterparties, |
• | actively monitoring current credit exposures, |
• | asserting our collateral rights with counterparties, and |
• | carrying out transaction settlements timely and effectively. |
The extent of transactions conducted through exchanges has increased, as many market participants have shown a preference toward exchange trading and have reduced bilateral transactions. We actively monitor the collateral required by such exchanges to effectively manage our capital requirements.
Counterparties’ credit exposure to us is dynamic in normal markets and may change significantly in more volatile markets. The amount of potential default risk to us from each counterparty depends on the extent of forward contracts, unsettled transactions, interest rates and market prices. There is a risk that we do not obtain sufficient additional collateral from counterparties that are unable or unwilling to provide it.
69
Credit Risk Liquidity Considerations
To address the impact on our operations of energy market price volatility, our hedging practices for electricity (including fuel for generation) and natural gas extend beyond the current operating year. Executing this extended hedging program may increase credit risk and demands for collateral. Our credit risk management process is designed to mitigate such credit risks through limit setting, contract protections and counterparty diversification, among other practices.
Credit risk affects demands on our capital. We are subject to limits and credit terms that counterparties may assert to allow us to enter into transactions with them and maintain acceptable credit exposures. Many of our counterparties allow unsecured credit at limits prescribed by agreements or their discretion. Capital requirements for certain transaction types involve a combination of initial margin and market value margins without any unsecured credit threshold. Counterparties may seek assurances of performance from us in the form of letters of credit, prepayment or cash deposits.
Credit exposure can change significantly in periods of commodity price and interest rate volatility. As a result, sudden and significant demands may be made against our credit facilities and cash. We actively monitor the exposure to possible collateral calls and take steps to minimize capital requirements.
As of December 31, 2019, we had cash deposited as collateral of $7.8 million and letters of credit of $17.4 million outstanding related to our energy derivative contracts. Price movements and/or a downgrade in our credit ratings could impact further the amount of collateral required. See “Credit Ratings” for further information. For example, in addition to limiting our ability to conduct transactions, if our credit ratings were lowered to below “investment grade” based on our positions outstanding at December 31, 2019 (including contracts that are considered derivatives and those that are considered non-derivatives), we would potentially be required to post the following additional collateral (in thousands):
December 31, 2019 | |||
Additional collateral taking into account contractual thresholds | $ | 5,888 | |
Additional collateral without contractual thresholds | 7,089 | ||
Under the terms of interest rate swap derivatives that we enter into periodically, we may be required to post cash or letters of credit as collateral depending on fluctuations in the fair value of the instrument. As of December 31, 2019, we had interest rate swap agreements outstanding with a notional amount totaling $215.0 million and we had deposited cash in the amount of $6.8 million as collateral for these interest rate swap derivatives. If our credit ratings were lowered to below “investment grade” based on our interest rate swap derivatives outstanding at December 31, 2019, we would potentially be required to post the following additional collateral (in thousands):
December 31, 2019 | |||
Additional collateral taking into account contractual thresholds | $ | 7,000 | |
Additional collateral without contractual thresholds | 26,912 | ||
Foreign Currency Risk
A significant portion of our utility natural gas supply (including fuel for electric generation) is obtained from Canadian sources. Most of those transactions are executed in U.S. dollars, which avoids foreign currency risk. A portion of our short-term natural gas transactions and long-term Canadian transportation contracts are committed based on Canadian currency prices. The short-term natural gas transactions are typically settled within sixty days with U.S. dollars. We hedge a portion of the foreign currency risk by purchasing Canadian currency exchange derivatives when such commodity transactions are initiated. This risk has not had a material effect on our financial condition, results of operations or cash flows and these differences in cost related to currency fluctuations are included with natural gas supply costs for ratemaking.
Further information for derivatives and fair values is disclosed at “Note 7 of the Notes to Consolidated Financial Statements” and “Note 17 of the Notes to Consolidated Financial Statements.”
Energy Commodity Risk
We mitigate energy commodity risk primarily through our energy resources risk policy, which includes oversight from the RMC and oversight from the Audit Committee and the Environmental, Technology and Operations Committee of our Board of Directors. In conjunction with the oversight committees, our management team develops hedging strategies, detailed resource procurement plans, resource optimization strategies and long-term integrated resource planning to mitigate some of the risk
70
associated with energy commodities. The various plans and strategies are monitored daily and developed with quantitative methods.
Our energy resources risk policy includes our wholesale energy markets credit policy and control procedures to manage energy commodity price and credit risks. Nonetheless, adverse changes in commodity prices, generating capacity, customer loads, regulation and other factors may result in losses of earnings, cash flows and/or fair values.
We measure the volume of monthly, quarterly and annual energy imbalances between projected power loads and resources. The measurement process is based on expected loads at fixed prices (including those subject to retail rates) and expected resources to the extent that costs are essentially fixed by virtue of known fuel supply costs or projected hydroelectric conditions. To the extent that expected costs are not fixed, either because of volume mismatches between loads and resources or because fuel cost is not locked in through fixed price contracts or derivative instruments, our risk policy guides the process to manage this open forward position over a period of time. Normal operations result in seasonal mismatches between power loads and available resources. We are able to vary the operation of generating resources to match parts of intra-hour, hourly, daily and weekly load fluctuations. We use the wholesale power markets, including the natural gas market as it relates to power generation fuel, to sell projected resource surpluses and obtain resources when deficits are projected. We buy and sell fuel for thermal generation facilities based on comparative power market prices and marginal costs of fueling and operating available generating facilities and the relative economics of substitute market purchases for generating plant operation.
To address the impact on our operations of energy market price volatility, our hedging practices for electricity (including fuel for generation) and natural gas extend beyond the current operating year. Executing this extended hedging program may increase our credit risks. Our credit risk management process is designed to mitigate such credit risks through limit setting, contract protections and counterparty diversification, among other practices.
Our projected retail natural gas loads and resources are regularly reviewed by operating management and the RMC. To manage the impacts of volatile natural gas prices, we seek to procure natural gas through a diversified mix of spot market purchases and forward fixed price purchases from various supply basins and time periods. We have an active hedging program that extends into future years with the goal of reducing price volatility in our natural gas supply costs. We use natural gas storage capacity to support high demand periods and to procure natural gas when price spreads are favorable. Securing prices throughout the year and even into subsequent years mitigates potential adverse impacts of significant purchase requirements in a volatile price environment.
The following table presents energy commodity derivative fair values as a net asset or (liability) as of December 31, 2019 that are expected to settle in each respective year (dollars in thousands). There are no expected deliveries of energy commodity derivatives after 2022:
Purchases | Sales | ||||||||||||||||||||||||||||||
Electric Derivatives | Gas Derivatives | Electric Derivatives | Gas Derivatives | ||||||||||||||||||||||||||||
Year | Physical (1) | Financial (1) | Physical (1) | Financial (1) | Physical (1) | Financial (1) | Physical (1) | Financial (1) | |||||||||||||||||||||||
2020 | $ | 19 | $ | 2,063 | $ | (895 | ) | $ | 10,929 | $ | (422 | ) | $ | (7,448 | ) | $ | (1,634 | ) | $ | (8,922 | ) | ||||||||||
2021 | — | — | 15 | 2,666 | — | (26 | ) | (1,187 | ) | (1,941 | ) | ||||||||||||||||||||
2022 | — | — | 35 | 180 | — | — | — | (5 | ) | ||||||||||||||||||||||
The following table presents energy commodity derivative fair values as a net asset or (liability) as of December 31, 2018 that were expected to settle in each respective year (dollars in thousands). There were no expected deliveries of energy commodity derivatives after 2021:
Purchases | Sales | ||||||||||||||||||||||||||||||
Electric Derivatives | Gas Derivatives | Electric Derivatives | Gas Derivatives | ||||||||||||||||||||||||||||
Year | Physical (1) | Financial (1) | Physical (1) | Financial (1) | Physical (1) | Financial (1) | Physical (1) | Financial (1) | |||||||||||||||||||||||
2019 | $ | (2,238 | ) | $ | 7,289 | $ | (991 | ) | $ | (32,285 | ) | $ | 34 | $ | (19,047 | ) | $ | (443 | ) | $ | 6,252 | ||||||||||
2020 | — | — | (1,266 | ) | (7,797 | ) | (28 | ) | (4,044 | ) | (1,517 | ) | (240 | ) | |||||||||||||||||
2021 | — | — | — | (1,393 | ) | — | — | (629 | ) | 47 | |||||||||||||||||||||
(1) | Physical transactions represent commodity transactions where we will take or make delivery of either electricity or natural gas; financial transactions represent derivative instruments with delivery of cash in the amount of the benefit or cost but with no physical delivery of the commodity, such as futures, swap derivatives, options, or forward contracts. |
71
The above electric and natural gas derivative contracts will be included in either power supply costs or natural gas supply costs during the period they are delivered and will be included in the various deferral and recovery mechanisms (ERM, PCA, and PGAs), or in the general rate case process, and are expected to eventually be collected through retail rates from customers.
See "Item 1. Business – Electric Operations" and "Item 1. Business – Natural Gas Operations," for additional discussion of the risks associated with Energy Commodities.
Compliance Risk
Compliance risk is mitigated through separate Regulatory and Environmental Compliance departments that monitor legislation, regulatory orders and actions to determine the overall potential impact to our Company and develop strategies for complying with the various rules and regulations. We also engage outside attorneys and consultants, when necessary, to help ensure compliance with laws and regulations. Oversight of our compliance risk strategy is performed by senior management, including our Chief Compliance Officer, and the Environmental, Technology and Operations Committee and the Audit Committee of our Board of Directors.
See "Item 1. Business, Regulatory Issues" through "Item 1. Business, Reliability Standards" and “Environmental Issues and Contingencies” for further discussion of compliance issues that impact our Company.
ITEM 7A. QUANTITATIVE AND QUALITATIVE DISCLOSURES ABOUT MARKET RISK
The information required by this item is set forth in the Enterprise Risk Management section of "Item 7. Management’s Discussion and Analysis" and is incorporated herein by reference.
ITEM 8. FINANCIAL STATEMENTS AND SUPPLEMENTARY DATA
The Report of Independent Registered Public Accounting Firm and Financial Statements begin on the next page.
72
REPORT OF INDEPENDENT REGISTERED PUBLIC ACCOUNTING FIRM
To the shareholders and the Board of Directors of Avista Corporation
Opinion on the Financial Statements
We have audited the accompanying consolidated balance sheets of Avista Corporation and subsidiaries (the "Company") as of December 31, 2019 and 2018, the related consolidated statements of income, comprehensive income, equity, and cash flows, for each of the three years in the period ended December 31, 2019, and the related notes (collectively referred to as the "financial statements"). In our opinion, the financial statements present fairly, in all material respects, the financial position of the Company as of December 31, 2019 and 2018, and the results of its operations and its cash flows for each of the three years in the period ended December 31, 2019, in conformity with accounting principles generally accepted in the United States of America.
We have also audited, in accordance with the standards of the Public Company Accounting Oversight Board (United States) (PCAOB), the Company's internal control over financial reporting as of December 31, 2019, based on criteria established in Internal Control - Integrated Framework (2013) issued by the Committee of Sponsoring Organizations of the Treadway Commission and our report dated February 25, 2020, expressed an unqualified opinion on the Company's internal control over financial reporting.
Basis for Opinion
These financial statements are the responsibility of the Company's management. Our responsibility is to express an opinion on the Company's financial statements based on our audits. We are a public accounting firm registered with the PCAOB and are required to be independent with respect to the Company in accordance with the U.S. federal securities laws and the applicable rules and regulations of the Securities and Exchange Commission and the PCAOB.
We conducted our audits in accordance with the standards of the PCAOB. Those standards require that we plan and perform the audit to obtain reasonable assurance about whether the financial statements are free of material misstatement, whether due to error or fraud. Our audits included performing procedures to assess the risks of material misstatement of the financial statements, whether due to error or fraud, and performing procedures that respond to those risks. Such procedures included examining, on a test basis, evidence regarding the amounts and disclosures in the financial statements. Our audits also included evaluating the accounting principles used and significant estimates made by management, as well as evaluating the overall presentation of the financial statements. We believe that our audits provide a reasonable basis for our opinion.
Critical Audit Matter
The critical audit matter communicated below is a matter arising from the current-period audit of the financial statements that was communicated or required to be communicated to the audit committee and that (1) relates to accounts or disclosures that are material to the financial statements and (2) involved our especially challenging, subjective, or complex judgments. The communication of critical audit matters does not alter in any way our opinion on the financial statements, taken as a whole, and we are not, by communicating the critical audit matter below, providing a separate opinion on the critical audit matter or on the accounts or disclosures to which it relates.
Regulatory Matters - Refer to Notes 1, 21, and 22 to the financial statements
Critical Audit Matter Description
The Company accounts for its regulated operations in accordance with Financial Accounting Standards Board Accounting Standards Codification Topic 980, Regulated Operations (“ASC 980”). The provisions of this accounting guidance require, among other things, that financial statements of a rate-regulated enterprise reflect the actions of regulators, where appropriate. These actions may result in the recognition of revenues and expenses in time periods that are different than non-rate-regulated enterprises. When this occurs, costs are deferred as assets in the balance sheet (regulatory assets) and recorded as expenses when those amounts are reflected in rates. Also, regulators can impose liabilities upon a regulated company for amounts previously collected from customers and for recovery of costs that are expected to be incurred in the future (regulatory liabilities).
The Company is subject to regulation by the Washington Utilities and Transportation Commission (the “WUTC”), the Idaho Public Utility Commission (the “IPUC”), the Public Utility Commission of Oregon (the “OPUC”), the Public Service Commission of the State of Montana (the “MPSC”) and the Regulatory Commission of Alaska (the “RCA”) (collectively, the “Commissions”), which have jurisdiction with respect to, among other things, the rates of electric and natural gas distribution
73
companies in Washington, Idaho, Oregon, Montana, and Alaska, respectively. Accounting for the economics of rate regulation has an impact on multiple financial statement line items and disclosures, such as property, plant, and equipment, regulatory assets and liabilities, operating revenues, operation and maintenance expense, and depreciation expense.
The Company’s rates are subject to the rate-setting processes of the Commissions and, in certain jurisdictions, annual earnings oversight. Rates are determined and approved in regulatory proceedings based on analyses of the Company’s costs to provide utility service and are designed to recover the Company’s prudently incurred investments in the utility business and provide a return thereon. Decisions to be made by the Commissions in the future will impact the accounting for regulated operations under ASC 980 as described above. While the Company has indicated that it expects to recover costs from customers through regulated rates, there is a risk that the Commissions will not approve (1) full recovery of the costs of providing utility service or (2) full recovery of all amounts invested in the utility business and a reasonable return on that investment.
We identified the impact of rate regulation as a critical audit matter due to the significant judgments made by management to support its assertions about affected account balances and disclosures and the high degree of subjectivity involved in assessing the impact of future regulatory orders on the financial statements. Management judgments include assessing the likelihood of (1) recovery in future rates of incurred costs, (2) a disallowance of part of the cost of recently completed plant or plant under construction and (3) refunds to customers. Given that management’s accounting judgements are based on assumptions about the outcome of future decisions by the Commission, auditing these judgments required specialized knowledge of accounting for rate regulation and the rate setting process due to its inherent complexities.
How the Critical Audit Matter Was Addressed in the Audit
Our audit procedures related to the uncertainty of future decisions by the Commissions included the following procedures, among others:
• | We tested the effectiveness of management’s controls over the evaluation of the likelihood of (1) the recovery in future rates of costs incurred as property, plant, and equipment and deferred as regulatory assets and (2) a refund or a future reduction in rates that should be reported as regulatory liabilities. We also tested the effectiveness of management’s controls over the initial recognition of amounts as property, plant and equipment; regulatory assets or liabilities; and the monitoring and evaluation of regulatory developments that may affect the likelihood of recovering costs in future rates or of a future reduction in rates. |
• | We evaluated the Company’s disclosures related to the impacts of rate regulation, including the balances recorded and regulatory developments. |
• | We read relevant regulatory orders issued by the Commissions for the Company and other public utilities in the Company’s jurisdictions, regulatory statutes, interpretations, procedural memorandums, filings made by interveners, and other publicly available information to assess the likelihood of recovery in future rates or of a future reduction in rates based on the precedents of the Commissions’ treatment of similar costs under similar circumstances. We evaluated the external information and compared it to management’s recorded regulatory asset and liability balances for completeness. |
• | We inspected the Company’s filings with the Commissions and the filings with the Commissions by intervenors that may impact the Company’s future rates, evaluating the evidence in relation to management’s assertions, as applicable. |
• | We inquired of management about property, plant, and equipment that may be abandoned. We inspected the capital-projects budget and construction-work-in-process listings and inquired of management to identify projects that are designed to replace assets that may be retired prior to the end of their useful life. We inspected minutes of the Board of Directors and regulatory orders and other filings with the Commissions, evaluating the evidence in relation to management’s assertions, as applicable, regarding probability of an abandonment. |
• | We obtained an analysis from management regarding probability of recovery for regulatory assets or probability of either refund or future reduction in rates for regulatory liabilities not yet addressed in a regulatory order in order to assess management’s assertion that amounts are probable of recovery and/or that a future refund or reduction in rates is not probable. |
/s/ Deloitte & Touche LLP
Seattle, Washington
February 25, 2020
We have served as the Company's auditor since 1933.
74
CONSOLIDATED STATEMENTS OF INCOME
Avista Corporation |
For the Years Ended December 31
Dollars in thousands, except per share amounts
2019 | 2018 | 2017 | |||||||||
Operating Revenues: | |||||||||||
Utility revenues: | |||||||||||
Utility revenues, exclusive of alternative revenue programs | $ | $ | $ | ||||||||
Alternative revenue programs | ( | ) | |||||||||
Total utility revenues | |||||||||||
Non-utility revenues | |||||||||||
Total operating revenues | |||||||||||
Operating Expenses: | |||||||||||
Utility operating expenses: | |||||||||||
Resource costs | |||||||||||
Other operating expenses | |||||||||||
Merger transaction costs | |||||||||||
Depreciation and amortization | |||||||||||
Taxes other than income taxes | |||||||||||
Non-utility operating expenses: | |||||||||||
Other operating expenses | |||||||||||
Depreciation and amortization | |||||||||||
Total operating expenses | |||||||||||
Income from operations | |||||||||||
Interest expense | |||||||||||
Interest expense to affiliated trusts | |||||||||||
Capitalized interest | ( | ) | ( | ) | ( | ) | |||||
Merger termination fee | ( | ) | |||||||||
Other expense (income)-net | ( | ) | |||||||||
Income before income taxes | |||||||||||
Income tax expense | |||||||||||
Net income | |||||||||||
Net loss (income) attributable to noncontrolling interests | ( | ) | ( | ) | |||||||
Net income attributable to Avista Corp. shareholders | $ | $ | $ | ||||||||
Weighted-average common shares outstanding (thousands), basic | |||||||||||
Weighted-average common shares outstanding (thousands), diluted | |||||||||||
Earnings per common share attributable to Avista Corp. shareholders: | |||||||||||
Basic | $ | $ | $ | ||||||||
Diluted | $ | $ | $ | ||||||||
The Accompanying Notes are an Integral Part of These Statements.
75
CONSOLIDATED STATEMENTS OF COMPREHENSIVE INCOME
Avista Corporation |
For the Years Ended December 31
Dollars in thousands
2019 | 2018 | 2017 | |||||||||
Net income | $ | $ | $ | ||||||||
Other Comprehensive Income (Loss): | |||||||||||
Change in unfunded benefit obligation for pension and other postretirement benefit plans - net of taxes of $(636), $523 and $(281), respectively | ( | ) | ( | ) | |||||||
Total other comprehensive income (loss) | ( | ) | ( | ) | |||||||
Comprehensive income | |||||||||||
Comprehensive loss (income) attributable to noncontrolling interests | ( | ) | ( | ) | |||||||
Comprehensive income attributable to Avista Corporation shareholders | $ | $ | $ | ||||||||
The Accompanying Notes are an Integral Part of These Statements.
76
CONSOLIDATED BALANCE SHEETS
Avista Corporation |
As of December 31
Dollars in thousands
2019 | 2018 | ||||||
Assets: | |||||||
Current Assets: | |||||||
Cash and cash equivalents | $ | $ | |||||
Accounts and notes receivable-less allowances of $2,419 and $5,233, respectively | |||||||
Materials and supplies, fuel stock and stored natural gas | |||||||
Regulatory assets | |||||||
Other current assets | |||||||
Total current assets | |||||||
Net utility property | |||||||
Goodwill | |||||||
Non-current regulatory assets | |||||||
Other property and investments-net and other non-current assets | |||||||
Total assets | $ | $ | |||||
Liabilities and Equity: | |||||||
Current Liabilities: | |||||||
Accounts payable | $ | $ | |||||
Current portion of long-term debt and capital leases | |||||||
Short-term borrowings | |||||||
Regulatory liabilities | |||||||
Other current liabilities | |||||||
Total current liabilities | |||||||
Long-term debt and capital leases | |||||||
Long-term debt to affiliated trusts | |||||||
Pensions and other postretirement benefits | |||||||
Deferred income taxes | |||||||
Non-current regulatory liabilities | |||||||
Other non-current liabilities and deferred credits | |||||||
Total liabilities | |||||||
Commitments and Contingencies (See Notes to Consolidated Financial Statements) | |||||||
Equity: | |||||||
Avista Corporation Shareholders’ Equity: | |||||||
Common stock, no par value; 200,000,000 shares authorized; 67,176,996 and 65,688,356 shares issued and outstanding, respectively | |||||||
Accumulated other comprehensive loss | ( | ) | ( | ) | |||
Retained earnings | |||||||
Total Avista Corporation shareholders’ equity | |||||||
Noncontrolling Interests | |||||||
Total equity | |||||||
Total liabilities and equity | $ | $ | |||||
The Accompanying Notes are an Integral Part of These Statements.
77
CONSOLIDATED STATEMENTS OF CASH FLOWS
Avista Corporation |
For the Years Ended December 31
Dollars in thousands
2019 | 2018 | 2017 | |||||||||
Operating Activities: | |||||||||||
Net income | $ | $ | $ | ||||||||
Non-cash items included in net income: | |||||||||||
Depreciation and amortization | |||||||||||
Provision for deferred income taxes | |||||||||||
Power and natural gas cost amortizations (deferrals), net | ( | ) | |||||||||
Amortization of debt expense | |||||||||||
Amortization of investment in exchange power | |||||||||||
Stock-based compensation expense | |||||||||||
Equity-related AFUDC | ( | ) | ( | ) | ( | ) | |||||
Pension and other postretirement benefit expense | |||||||||||
Other regulatory assets and liabilities and deferred debits and credits | ( | ) | |||||||||
Change in decoupling regulatory deferral | ( | ) | ( | ) | |||||||
Gain on sale of METALfx | ( | ) | |||||||||
Other | ( | ) | |||||||||
Contributions to defined benefit pension plan | ( | ) | ( | ) | ( | ) | |||||
Cash paid on settlement of interest rate swap agreements | ( | ) | ( | ) | ( | ) | |||||
Cash received on settlement of interest rate swap agreements | |||||||||||
Changes in certain current assets and liabilities: | |||||||||||
Accounts and notes receivable | ( | ) | ( | ) | |||||||
Materials and supplies, fuel stock and stored natural gas | ( | ) | ( | ) | ( | ) | |||||
Collateral posted for derivative instruments | ( | ) | ( | ) | |||||||
Income taxes receivable | ( | ) | |||||||||
Other current assets | ( | ) | ( | ) | ( | ) | |||||
Accounts payable | ( | ) | ( | ) | |||||||
Other current liabilities | ( | ) | ( | ) | |||||||
Net cash provided by operating activities | |||||||||||
Investing Activities: | |||||||||||
Utility property capital expenditures (excluding equity-related AFUDC) | ( | ) | ( | ) | ( | ) | |||||
Issuance of notes receivable at subsidiaries | ( | ) | ( | ) | ( | ) | |||||
Equity and property investments made by subsidiaries | ( | ) | ( | ) | ( | ) | |||||
Proceeds from sale of METALfx (net of cash sold) | |||||||||||
Other | ( | ) | |||||||||
Net cash used in investing activities | $ | ( | ) | $ | ( | ) | $ | ( | ) | ||
The Accompanying Notes are an Integral Part of These Statements.
78
CONSOLIDATED STATEMENTS OF CASH FLOWS (continued)
Avista Corporation |
For the Years Ended December 31
Dollars in thousands
2019 | 2018 | 2017 | |||||||||
Financing Activities: | |||||||||||
Net increase (decrease) in short-term borrowings | $ | ( | ) | $ | $ | ( | ) | ||||
Proceeds from issuance of long-term debt | |||||||||||
Maturity of long-term debt and capital leases | ( | ) | ( | ) | ( | ) | |||||
Issuance of common stock, net of issuance costs | |||||||||||
Cash dividends paid | ( | ) | ( | ) | ( | ) | |||||
Other | ( | ) | ( | ) | ( | ) | |||||
Net cash provided by financing activities | |||||||||||
Net increase (decrease) in cash and cash equivalents | ( | ) | ( | ) | |||||||
Cash and cash equivalents at beginning of year | |||||||||||
Cash and cash equivalents at end of year | $ | $ | $ | ||||||||
Supplemental Cash Flow Information: | |||||||||||
Cash paid (received) during the year: | |||||||||||
Interest | $ | $ | $ | ||||||||
Income taxes paid | |||||||||||
Income tax refunds | ( | ) | ( | ) | ( | ) | |||||
Non-cash financing and investing activities: | |||||||||||
Accounts payable for capital expenditures | |||||||||||
The Accompanying Notes are an Integral Part of These Statements.
79
CONSOLIDATED STATEMENTS OF EQUITY
Avista Corporation |
For the Years Ended December 31
Dollars in thousands, except per share amounts
2019 | 2018 | 2017 | |||||||||
Common Stock, Shares: | |||||||||||
Shares outstanding at beginning of year | |||||||||||
Shares issued through equity compensation plans | |||||||||||
Shares issued through Employee Investment Plan (401-K) | |||||||||||
Shares issued through sales agency agreements | |||||||||||
Shares outstanding at end of year | |||||||||||
Common Stock, Amount: | |||||||||||
Balance at beginning of year | $ | $ | $ | ||||||||
Equity compensation expense | |||||||||||
Issuance of common stock through equity compensation plans | |||||||||||
Issuance of common stock through Employee Investment Plan (401-K) | |||||||||||
Issuance of common stock through sales agency agreements, net of issuance costs | |||||||||||
Payment of minimum tax withholdings for share-based payment awards | ( | ) | ( | ) | ( | ) | |||||
Purchase of subsidiary noncontrolling interests | ( | ) | |||||||||
Balance at end of year | |||||||||||
Accumulated Other Comprehensive Loss: | |||||||||||
Balance at beginning of year | ( | ) | ( | ) | ( | ) | |||||
Other comprehensive income (loss) | ( | ) | ( | ) | |||||||
Reclassification of excess income tax benefits (see Note 2) | ( | ) | |||||||||
Balance at end of year | ( | ) | ( | ) | ( | ) | |||||
Retained Earnings: | |||||||||||
Balance at beginning of year | |||||||||||
Net income attributable to Avista Corporation shareholders | |||||||||||
Cash dividends paid (common stock) | ( | ) | ( | ) | ( | ) | |||||
Reclassification of excess income tax benefits (see Note 2) | |||||||||||
Balance at end of year | |||||||||||
Total Avista Corporation shareholders’ equity | $ | $ | $ | ||||||||
Noncontrolling Interests: | |||||||||||
Balance at beginning of year | $ | $ | $ | ( | ) | ||||||
Net income attributable to noncontrolling interests | ( | ) | |||||||||
Purchase of subsidiary noncontrolling interests | |||||||||||
Deconsolidation of noncontrolling interests related to sale of METALfx | ( | ) | |||||||||
Balance at end of year | |||||||||||
Total equity | $ | $ | $ | ||||||||
Dividends declared per common share | $ | $ | $ | ||||||||
The Accompanying Notes are an Integral Part of These Statements.
80
NOTES TO CONSOLIDATED FINANCIAL STATEMENTS |
NOTE 1. SUMMARY OF SIGNIFICANT ACCOUNTING POLICIES
Nature of Business
Avista Corp. is primarily an electric and natural gas utility with certain other business ventures. Avista Utilities is an operating division of Avista Corp., comprising its regulated utility operations in the Pacific Northwest. Avista Utilities provides electric distribution and transmission, and natural gas distribution services in parts of eastern Washington and northern Idaho. Avista Utilities also provides natural gas distribution service in parts of northeastern and southwestern Oregon. Avista Utilities has electric generating facilities in Washington, Idaho, Oregon and Montana. Avista Utilities also supplies electricity to a small number of customers in Montana, most of whom are employees who operate the Company's Noxon Rapids generating facility.
AERC is a wholly-owned subsidiary of Avista Corp. The primary subsidiary of AERC is AEL&P, which comprises Avista Corp.'s regulated utility operations in Alaska.
Avista Capital, a wholly owned non-regulated subsidiary of Avista Corp., is the parent company of all of the subsidiary companies in the non-utility businesses, with the exception of AJT Mining Properties, Inc., which is a subsidiary of AERC. See Note 23 for business segment information. See Note 25 for discussion of the sale of METALfx, an unregulated subsidiary of the Company.
The consolidated financial statements include the assets, liabilities, revenues and expenses of the Company and its subsidiaries and other majority owned subsidiaries and variable interest entities for which the Company or its subsidiaries are the primary beneficiaries. Intercompany balances were eliminated in consolidation. The accompanying consolidated financial statements include the Company’s proportionate share of utility plant and related operations resulting from its interests in jointly owned plants (see Note 8).
The preparation of the consolidated financial statements in conformity with GAAP requires management to make estimates and assumptions that affect the amounts reported for assets and liabilities and the disclosure of contingent assets and liabilities at the date of the financial statements and the reported amounts of revenues and expenses during the reporting period. Significant estimates include:
• | determining the market value of energy commodity derivative assets and liabilities, |
• | pension and other postretirement benefit plan obligations, |
• | contingent liabilities, |
• | goodwill impairment testing, |
• | recoverability of regulatory assets, and |
• | unbilled revenues. |
Changes in these estimates and assumptions are considered reasonably possible and may have a material effect on the consolidated financial statements and thus actual results could differ from the amounts reported and disclosed herein.
System of Accounts
The accounting records of the Company’s utility operations are maintained in accordance with the uniform system of accounts prescribed by the FERC and adopted by the state regulatory commissions in Washington, Idaho, Montana, Oregon and Alaska.
Regulation
The Company is subject to state regulation in Washington, Idaho, Montana, Oregon and Alaska. The Company is also subject to federal regulation primarily by the FERC, as well as various other federal agencies with regulatory oversight of particular aspects of its operations.
Depreciation
For utility operations, depreciation expense is estimated by a method of depreciation accounting utilizing composite rates for utility plant. Such rates are designed to provide for retirements of properties at the expiration of their service lives. For utility
81
operations, the ratio of depreciation provisions to average depreciable property was as follows for the years ended December 31:
2019 | 2018 | 2017 | ||||||
Avista Utilities | ||||||||
Ratio of depreciation to average depreciable property | % | % | % | |||||
Alaska Electric Light and Power Company | ||||||||
Ratio of depreciation to average depreciable property | % | % | % | |||||
The average service lives for the following broad categories of utility plant in service are (in years):
Avista Utilities | Alaska Electric Light and Power Company | ||
Electric thermal/other production | |||
Hydroelectric production | |||
Electric transmission | |||
Electric distribution | |||
Natural gas distribution property | N/A | ||
Other shorter-lived general plant | |||
AFUDC represents the cost of both the debt and equity funds used to finance utility plant additions during the construction period. As prescribed by regulatory authorities, AFUDC is capitalized as a part of the cost of utility plant. The debt component of AFUDC is credited against total interest expense in the Consolidated Statements of Income in the line item “capitalized interest.” The equity component of AFUDC is included in the Consolidated Statement of Income in the line item “other expense (income)-net.” The Company is permitted, under established regulatory rate practices, to recover the capitalized AFUDC, and a reasonable return thereon, through its inclusion in rate base and the provision for depreciation after the related utility plant is placed in service. Cash inflow related to AFUDC does not occur until the related utility plant is placed in service and included in rate base.
The WUTC and IPUC have authorized Avista Utilities to calculate AFUDC using its allowed rate of return. Beginning in 2018, to the extent amounts calculated using this rate exceed the AFUDC amounts calculated using the FERC formula, Avista Utilities capitalizes the excess as a regulatory asset. The regulatory asset associated with plant in service is amortized over the average useful life of Avista Utilities' utility plant which is approximately 30 years. The regulatory asset associated with construction work in progress is not amortized until the plant is placed in service. The OPUC does not allow the Company to capitalize AFUDC that exceeds the FERC calculated rate.
The effective AFUDC rate was the following for the years ended December 31:
2019 | 2018 | 2017 | ||||||
Avista Utilities | ||||||||
Effective state AFUDC rate | % | % | % | |||||
Alaska Electric Light and Power Company | ||||||||
Effective AFUDC rate | % | % | % | |||||
During the third quarter of 2019, the FERC completed an audit of Avista Corp. that covered the period January 1, 2015 through December 31, 2018. Avista Corp.’s AFUDC rate, which is prescribed by state regulatory authorities, is different than the FERC approved method for calculating AFUDC. The FERC indicated that the difference in rates should be recorded as a regulatory asset rather than in utility plant. At the conclusion of the audit, the FERC required Avista Corp. to reclassify the excess AFUDC from Net utility plant to Non-current regulatory assets for the period January 1, 2010 (the effective date of the Company’s current fixed transmission rates) to the present. As a result, Avista Corp. reclassified approximately $33 million (net of accumulated depreciation) from Net utility plant to Non-current regulatory assets as of December 31, 2019, which represents the cumulative adjustment for 2010 through 2017. The Company recorded the difference in AFUDC rates for 2018 and 2019 as a regulatory asset in the respective periods incurred. The Company did not adjust prior period Consolidated Balances Sheets
82
since the FERC required the adjustment to be reflected on a cumulative basis at the end of the audit and required the AFUDC calculation to be modified on a prospective basis. The Company concluded that the differences were insignificant during each prior period and on a cumulative basis. The adjustment recorded during 2019 had no effect on net income or earnings per share.
Income Taxes
Deferred income tax assets represent future income tax deductions the Company expects to utilize in future tax returns to reduce taxable income. Deferred income tax liabilities represent future taxable income the Company expects to recognize in future tax returns. Deferred tax assets and liabilities arise when there are temporary differences resulting from differing treatment of items for tax and accounting purposes. A deferred income tax asset or liability is determined based on the enacted tax rates that will be in effect when the temporary differences between the financial statement carrying amounts and tax basis of existing assets and liabilities are expected to be reported in the Company’s consolidated income tax returns. The deferred income tax expense for the period is equal to the net change in the deferred income tax asset and liability accounts from the beginning to the end of the period. The effect on deferred income taxes from a change in tax rates is recognized in income in the period that includes the enactment date unless a regulatory order specifies deferral of the effect of the change in tax rates over a longer period of time. The Company establishes a valuation allowance when it is more likely than not that all, or a portion, of a deferred tax asset will not be realized. Deferred income tax liabilities and regulatory assets are established for income tax benefits flowed through to customers.
The Company's largest deferred income tax item is the difference between the book and tax basis of utility plant. This item results from the temporary difference on depreciation expense. In early tax years, this item is recorded as a deferred income tax liability that will eventually reverse and become subject to income tax in later tax years.
See Note 12 for discussion of the TCJA and its impacts on the Company's financial statements, as well as a tabular presentation of all the Company's deferred tax assets and liabilities.
The Company did not incur any penalties on income tax positions in 2019, 2018 or 2017. The Company would recognize interest accrued related to income tax positions as interest expense and any penalties incurred as other operating expense.
Stock-Based Compensation
The Company currently issues three types of stock-based compensation awards - restricted shares, market-based awards and performance-based awards. Historically, these stock compensation awards have not been material to the Company's overall financial results. Compensation cost relating to share-based payment transactions is recognized in the Company’s financial statements based on the fair value of the equity or liability instruments issued and recorded over the requisite service period.
The Company recorded stock-based compensation expense (included in other operating expenses) and income tax benefits in the Consolidated Statements of Income of the following amounts for the years ended December 31 (dollars in thousands):
2019 | 2018 | 2017 | |||||||||
Stock-based compensation expense | $ | $ | $ | ||||||||
Income tax benefits (1) | |||||||||||
Excess tax benefits (expenses) on settled share-based employee payments | ( | ) | |||||||||
(1) | For 2017 income tax benefits were calculated using a |
Restricted share awards vest in equal thirds each year over 3 years and are payable in Avista Corp. common stock at the end of each year if the service condition is met. In addition to the service condition, for restricted shares granted in 2017, the Company must meet a return on equity target in order for the Chief Executive Officer's restricted shares to vest. Restricted stock is valued at the close of market of the Company’s common stock on the grant date.
Total Shareholder Return (TSR) awards are market-based awards and Cumulative Earnings Per Share (CEPS) awards are performance awards. Both types of awards vest after a period of 3 years and are payable in cash or Avista Corp. common stock at the end of the three-year period. The method of settlement is at the discretion of the Company and historically the Company has settled these awards through issuance of Avista Corp. common stock and intends to continue this practice. Both types of awards entitle the recipients to dividend equivalent rights, are subject to forfeiture under certain circumstances, and are subject to meeting specific market or performance conditions. Based on the level of attainment of the market or performance conditions, the amount of cash paid or common stock issued will range from 0 to 200 percent of the initial awards granted. Dividend equivalent rights are accumulated and paid out only on shares that eventually vest and have met the market and performance conditions.
83
For both the TSR awards and the CEPS awards, the Company accounts for them as equity awards and compensation cost for these awards is recognized over the requisite service period, provided that the requisite service period is rendered. For TSR awards, if the market condition is not met at the end of the three-year service period, there will be no change in the cumulative amount of compensation cost recognized, since the awards are still considered vested even though the market metric was not met. For CEPS awards, at the end of the three-year service period, if the internal performance metric of cumulative earnings per share is not met, all compensation cost for these awards is reversed as these awards are not considered vested.
The fair value of each TSR award is estimated on the date of grant using a statistical model that incorporates the probability of meeting the market targets based on historical returns relative to a peer group. The estimated fair value of the equity component of CEPS awards was estimated on the date of grant as the share price of Avista Corp. common stock on the date of grant, less the net present value of the estimated dividends over the three-year period.
The following table summarizes the number of grants, vested and unvested shares, earned shares (based on market metrics), and other pertinent information related to the Company's stock compensation awards for the years ended December 31:
2019 | 2018 | 2017 | |||||||||
Restricted Shares | |||||||||||
Shares granted during the year | |||||||||||
Shares vested during the year | ( | ) | ( | ) | ( | ) | |||||
Unvested shares at end of year | |||||||||||
Unrecognized compensation expense at end of year (in thousands) | $ | $ | $ | ||||||||
TSR Awards | |||||||||||
TSR shares granted during the year | |||||||||||
TSR shares vested during the year | ( | ) | ( | ) | ( | ) | |||||
TSR shares earned based on market metrics | |||||||||||
Unvested TSR shares at end of year | |||||||||||
Unrecognized compensation expense (in thousands) | $ | $ | $ | ||||||||
CEPS Awards | |||||||||||
CEPS shares granted during the year | |||||||||||
CEPS shares vested during the year | ( | ) | ( | ) | ( | ) | |||||
CEPS shares earned based on market metrics | |||||||||||
Unvested CEPS shares at end of year | |||||||||||
Unrecognized compensation expense (in thousands) | $ | $ | $ | ||||||||
Outstanding TSR and CEPS share awards include a dividend component that is paid in cash. This component of the share grants is accounted for as a liability award. These liability awards are revalued on a quarterly basis taking into account the number of awards outstanding, historical dividend rate, the change in the value of the Company’s common stock relative to an external benchmark (TSR awards only) and the amount of CEPS earned to date compared to estimated CEPS over the performance period (CEPS awards only). Over the life of these awards, the cumulative amount of compensation expense recognized will match the actual cash paid. As of December 31, 2019 and 2018, the Company had recognized cumulative compensation expense and a liability of $0.9 million and $0.3 million, respectively, related to the dividend component on the outstanding and unvested share grants.
Other Expense (Income) - Net
Other Expense (Income) - net consisted of the following items for the years ended December 31 (dollars in thousands):
2019 | 2018 | 2017 | |||||||||
Interest income | $ | ( | ) | $ | ( | ) | $ | ( | ) | ||
Interest on regulatory deferrals | ( | ) | ( | ) | ( | ) | |||||
Equity-related AFUDC | ( | ) | ( | ) | ( | ) | |||||
Non-service portion of pension and other postretirement benefit expenses | |||||||||||
Net (income) loss on investments | ( | ) | |||||||||
Other expense (income) | ( | ) | |||||||||
Total | $ | ( | ) | $ | $ | ||||||
84
Basic earnings per common share attributable to Avista Corp. shareholders is computed by dividing net income attributable to Avista Corp. shareholders by the weighted-average number of common shares outstanding for the period. Diluted earnings per common share attributable to Avista Corp. shareholders is calculated by dividing net income attributable to Avista Corp. shareholders by diluted weighted-average common shares outstanding during the period, including common stock equivalent shares outstanding using the treasury stock method, unless such shares are anti-dilutive. Common stock equivalent shares include shares issuable under contingent stock awards. See Note 20 for earnings per common share calculations.
Cash and Cash Equivalents
For the purposes of the Consolidated Statements of Cash Flows, the Company considers all temporary investments with a maturity of three months or less when purchased to be cash equivalents.
Allowance for Doubtful Accounts
The Company maintains an allowance for doubtful accounts to provide for estimated and potential losses on accounts receivable. The Company determines the allowance for utility and other customer accounts receivable based on historical write-offs as compared to accounts receivable and operating revenues. Additionally, the Company establishes specific allowances for certain individual accounts. The following table presents the activity in the allowance for doubtful accounts during the years ended December 31 (dollars in thousands):
2019 | 2018 | 2017 | |||||||||
Allowance as of the beginning of the year | $ | $ | $ | ||||||||
Additions expensed during the year | |||||||||||
Net deductions | ( | ) | ( | ) | ( | ) | |||||
Allowance as of the end of the year | $ | $ | $ | ||||||||
The cost of additions to utility plant in service, including an allowance for funds used during construction and replacements of units of property and improvements, is capitalized. The cost of depreciable units of property retired plus the cost of removal less salvage is charged to accumulated depreciation.
Asset Retirement Obligations
The Company records the fair value of a liability for an ARO in the period in which it is incurred. When the liability is initially recorded, the associated costs of the ARO are capitalized as part of the carrying amount of the related long-lived asset. The liability is accreted to its present value each period and the related capitalized costs are depreciated over the useful life of the related asset. In addition, if there are changes in the estimated timing or estimated costs of the AROs, adjustments are recorded during the period new information becomes available as an increase or decrease to the liability, with the offset recorded to the related long-lived asset. Upon retirement of the asset, the Company either settles the ARO for its recorded amount or recognizes a regulatory asset or liability for the difference, which will be surcharged/refunded to customers through the ratemaking process. The Company records regulatory assets and liabilities for the difference between asset retirement costs currently recovered in rates and AROs recorded since asset retirement costs are recovered through rates charged to customers (see Note 10 for further discussion of the Company's AROs).
The Company recovers certain asset retirement costs through rates charged to customers as a portion of its depreciation expense for which the Company has not recorded asset retirement obligations. The Company has recorded the amount of estimated retirement costs collected from customers (that do not represent legal or contractual obligations) and included them as a non-current regulatory liability on the Consolidated Balance Sheets in the following amounts as of December 31 (dollars in thousands):
2019 | 2018 | ||||||
Regulatory liability for utility plant retirement costs | $ | $ | |||||
Goodwill
Goodwill arising from acquisitions represents the future economic benefit arising from other assets acquired in a business combination that are not individually identified and separately recognized. The Company evaluates goodwill for impairment using a fair value to carrying amount comparison (Step 1) for AEL&P. The Company completed its annual evaluation of goodwill for potential impairment as of November 30, 2019 and determined that goodwill was not impaired at that time
85
(carrying value was less than the determined fair value). There were no events or circumstances that changed between November 30, 2019 and December 31, 2019 that would more likely than not reduce the fair values of the reporting units below their carrying amounts.
The changes in the carrying amount of goodwill are as follows (dollars in thousands):
AEL&P | Other | Accumulated Impairment Losses | Total | ||||||||||||
Balance as of January 1, 2019 | $ | $ | $ | ( | ) | $ | |||||||||
Goodwill sold during the year | ( | ) | ( | ) | |||||||||||
Balance as of December 31, 2019 | $ | $ | $ | $ | |||||||||||
Goodwill sold during the year relates to the sale of METALfx in April 2019. See Note 25 for further discussion. Accumulated impairment losses were attributable to METALfx, which was a part of the other businesses.
Derivative Assets and Liabilities
Derivatives are recorded as either assets or liabilities on the Consolidated Balance Sheets measured at estimated fair value.
The WUTC and the IPUC issued accounting orders authorizing Avista Corp. to offset energy commodity derivative assets or liabilities with a regulatory asset or liability. This accounting treatment is intended to defer the recognition of mark-to-market gains and losses on energy commodity transactions until the period of delivery. Realized benefits and costs result in adjustments to retail rates through PGAs, the ERM in Washington, the PCA mechanism in Idaho, and periodic general rates cases. The resulting regulatory assets associated with energy commodity derivative instruments have been concluded to be probable of recovery through future rates.
Substantially all forward contracts to purchase or sell power and natural gas are recorded as derivative assets or liabilities at estimated fair value with an offsetting regulatory asset or liability. Contracts that are not considered derivatives are accounted for on the accrual basis until they are settled or realized unless there is a decline in the fair value of the contract that is determined to be other-than-temporary.
For interest rate swap derivatives, Avista Corp. records all mark-to-market gains and losses in each accounting period as assets and liabilities, as well as offsetting regulatory assets and liabilities, such that there is no income statement impact. The interest rate swap derivatives are risk management tools similar to energy commodity derivatives. Upon settlement of interest rate swap derivatives, the regulatory asset or liability is amortized as a component of interest expense over the term of the associated debt. The Company records an offset of interest rate swap derivative assets and liabilities with regulatory assets and liabilities, based on the prior practice of the commissions to provide recovery through the ratemaking process.
The Company has multiple master netting agreements with a variety of entities that allow for cross-commodity netting of derivative agreements with the same counterparty (i.e. power derivatives can be netted with natural gas derivatives). In addition, some master netting agreements allow for the netting of commodity derivatives and interest rate swap derivatives for the same counterparty. The Company does not have any agreements which allow for cross-affiliate netting among multiple affiliated legal entities. The Company nets all derivative instruments when allowed by the agreement for presentation in the Consolidated Balance Sheets.
Fair Value Measurements
Fair value represents the price that would be received when selling an asset or paid to transfer a liability (an exit price) in an orderly transaction between market participants at the measurement date. Energy commodity derivative assets and liabilities, deferred compensation assets, as well as derivatives related to interest rate swap derivatives and foreign currency exchange derivatives, are reported at estimated fair value on the Consolidated Balance Sheets. See Note 17 for the Company’s fair value disclosures.
Regulatory Deferred Charges and Credits
The Company prepares its consolidated financial statements in accordance with regulatory accounting practices because:
• | rates for regulated services are established by or subject to approval by independent third-party regulators, |
• | the regulated rates are designed to recover the cost of providing the regulated services, and |
• | in view of demand for the regulated services and the level of competition, it is reasonable to assume that rates can be charged to and collected from customers at levels that will recover costs. |
86
Regulatory accounting practices require that certain costs and/or obligations (such as incurred power and natural gas costs not currently reflected in rates, but expected to be recovered or refunded in the future), are reflected as deferred charges or credits on the Consolidated Balance Sheets. These costs and/or obligations are not reflected in the Consolidated Statements of Income until the period during which matching revenues are recognized. The Company also has decoupling revenue deferrals. Decoupling revenue deferrals are recognized in the Consolidated Statements of Income during the period they occur (i.e. during the period of revenue shortfall or excess due to fluctuations in customer usage), subject to certain limitations, and a regulatory asset/liability is established which will be surcharged or rebated to customers in future periods. GAAP requires that for any alternative regulatory revenue program, like decoupling, the revenue must be expected to be collected from customers within 24 months of the deferral to qualify for recognition in the current period Consolidated Statement of Income. Any amounts included in the Company's decoupling program that are not expected to be collected from customers within 24 months are not recorded in the financial statements until the period in which revenue recognition criteria are met. This could ultimately result in decoupling revenue that arose during the current year being recognized in a future period.
If at some point in the future the Company determines that it no longer meets the criteria for continued application of regulatory accounting practices for all or a portion of its regulated operations, the Company could be:
• | required to write off its regulatory assets, and |
• | precluded from the future deferral of costs or decoupled revenues not recovered through rates at the time such amounts are incurred, even if the Company expected to recover these amounts from customers in the future. |
See Note 22 for further details of regulatory assets and liabilities.
Unamortized Debt Expense
Unamortized debt expense includes debt issuance costs that are amortized over the life of the related debt. These costs are recorded as an offset to Long-Term Debt and Capital Leases on the Consolidated Balance Sheets.
Unamortized Debt Repurchase Costs
For the Company’s Washington regulatory jurisdiction and for any debt repurchases beginning in 2007 in all jurisdictions, premiums paid to repurchase debt are amortized over the remaining life of the original debt that was repurchased or, if new debt is issued in connection with the repurchase, these costs are amortized over the life of the new debt. In the Company’s other regulatory jurisdictions, premiums paid to repurchase debt prior to 2007 are being amortized over the average remaining maturity of outstanding debt when no new debt was issued in connection with the debt repurchase. These costs are recovered through retail rates as a component of interest expense.
Appropriated Retained Earnings
In accordance with the hydroelectric licensing requirements of section 10(d) of the Federal Power Act (FPA), the Company maintains an appropriated retained earnings account for any earnings in excess of the specified rate of return on the Company's investment in the licenses for its various hydroelectric projects. Per section 10(d) of the FPA, the Company must maintain these excess earnings in an appropriated retained earnings account until the termination of the licensing agreements or apply them to reduce the net investment in the licenses of the hydroelectric projects at the discretion of the FERC. The Company calculates the earnings in excess of the specified rate of return on an annual basis, usually during the second quarter.
The appropriated retained earnings amounts included in retained earnings were as follows as of December 31 (dollars in thousands):
2019 | 2018 | ||||||
Appropriated retained earnings | $ | $ | |||||
Contingencies
The Company has unresolved regulatory, legal and tax issues which have inherently uncertain outcomes. The Company accrues a loss contingency if it is probable that a liability has been incurred and the amount of the loss or impairment can be reasonably estimated. The Company also discloses loss contingencies that do not meet these conditions for accrual, if there is a reasonable possibility that a material loss may be incurred. As of December 31, 2019, the Company has not recorded any significant amounts related to unresolved contingencies. See Note 21 for further discussion of the Company's commitments and contingencies.
87
NOTE 2. NEW ACCOUNTING STANDARDS
ASU No. 2014-09, “Revenue from Contracts with Customers (Topic 606)”
On January 1, 2018, the Company adopted ASU No. 2014-09, which outlines a single comprehensive model for entities to use in accounting for revenue arising from contracts with customers and supersedes most current revenue recognition guidance, including industry-specific guidance.
The Company elected to use a modified retrospective method of adoption, which required a cumulative adjustment to opening retained earnings (if any were identified), as opposed to a full retrospective application. The Company did not identify any adjustments required to opening retained earnings related to the adoption of the new revenue standard. The Company applied the standards only to contracts that were not completed as of the implementation date. The Company did not apply the new guidance to contracts that were completed with all revenue recognized prior to the implementation date. In addition, total operating revenues on the Consolidated Statements of Income in years prior to 2018 would not have changed if the Company had elected to apply the full retrospective method of adoption.
Since the majority of Avista Corp.’s revenue is from rate-regulated sales of electricity and natural gas to retail customers and revenue is recognized as energy is delivered to these customers, the Company does not expect any significant change in operating revenues or net income going forward as a result of the adoption of this standard.
The only changes in revenue that resulted from the adoption of this ASU were related to the presentation of utility-related taxes collected from customers and the timing of when revenue from self-generated RECs is recognized.
Under ASU No. 2014-09, revenue associated with the sale of RECs is recognized at the time of generation and sale of the credits as opposed to when the RECs are certified in the Western Renewable Energy Generation Information System, which generally occurs during a period subsequent to the sale. This represents a change from the Company's prior practice, which was to defer revenue recognition until the time of certification. Revenue associated with the sale of RECs is not material to the financial statements and almost all of the Company's REC revenue is deferred for future rebate to retail customers. As such, the change in the timing of revenue recognition does not have a material impact on net income.
See Note 4 for the Company's complete revenue disclosures.
ASU No. 2016-02, "Leases (Topic 842)"
ASU No. 2018-01, "Leases (Topic 842): Land Easement Practical Expedient for Transition to Topic 842"
ASU No. 2018-11, "Leases (Topic 842): Targeted Improvements"
On January 1, 2019, the Company adopted ASU No. 2016-02, which outlines a model for entities to use in accounting for leases and supersedes previous lease accounting guidance, as well as several practical expedients in ASU Nos. 2018-01 and 2018-11.
The Company adopted ASU No. 2016-02 utilizing a modified retrospective adoption method with the "package of three" and hindsight practical expedients offered by the standard. The "package of three" provides for an entity to not reassess at adoption whether any expired or existing contracts are deemed, for accounting purposes, to be or contain leases, the classification of any expired or existing leases, and any initial direct costs for any existing leases. As a result, the Company did not reassess existing or expired contracts under the new lease guidance, and it did not reassess the classification of any existing leases. The Company used the benefit of hindsight in determining both term and impairments associated with any existing leases. Use of this practical expedient has resulted in lease terms that best represent management's expectations with respect to use of the underlying asset but did not result in recognition of any impairment.
The Company elected to adopt ASU No. 2018-01, which allows an entity to exclude from application of Topic 842 all easements executed prior to January 1, 2019. In addition, the Company elected to adopt the "comparatives under 840" practical expedient offered in ASU No. 2018-11, which allows an entity to apply the new lease standard at the adoption date, recognizing any necessary cumulative-effect adjustment to the opening balance of retained earnings in the period of adoption and presenting comparative periods in the financial statements under ASC 840 (previous lease accounting guidance). Adoption of the standard did not result in a cumulative effect adjustment within the Company's financial statements.
As allowed by ASU No. 2016-02, the Company elected not to apply the requirements of the standard to short-term leases, those leases with an initial term of 12 months or less. These leases are not recorded on the balance sheet and are not material to the financial statements.
88
Adoption of the standard impacted the Company's Consolidated Balance Sheet through recognition of right-of-use (ROU) assets and lease liabilities for the Company's operating leases. Accounting for finance leases (formerly capital leases) remained substantially unchanged. See Note 5 for further information on the Company's leases.
ASU No. 2017-07 “Compensation-Retirement Benefits (Topic 715): Improving the Presentation of Net Periodic Pension Cost and Net Periodic Postretirement Benefit Cost”
On January 1, 2018, the Company adopted ASU No. 2017-07, which amended the income statement presentation of the components of net periodic benefit cost for an entity’s defined benefit pension and other postretirement plans. Under previous GAAP, net benefit cost consisted of several components that reflected different aspects of an employer’s financial arrangements as well as the cost of benefits earned by employees. These components were aggregated and reported net in the financial statements. ASU No. 2017-07 requires entities to (1) disaggregate the current service-cost component from the other components of net benefit cost (other components) and present it with other current compensation costs for related employees in the income statement and (2) present the other components elsewhere in the income statement and outside of income from operations.
In addition, only the service-cost component of net benefit cost is eligible for capitalization (e.g., as part of utility plant). This is a change from prior practice, under which entities capitalized the aggregate net benefit cost to utility plant when applicable, in accordance with FERC accounting guidance. Avista Corp. is a rate-regulated entity and all components of net benefit cost are currently recovered from customers as a component of utility plant and, under the new ASU, these costs will continue to be recovered from customers in the same manner over the depreciable lives of utility plant. As all such costs are expected to continue to be recoverable, the components that are no longer eligible to be recorded as a component of utility plant for GAAP will be recorded as regulatory assets.
Upon adoption, entities must use a retrospective transition method to adopt the requirement for separate presentation in the income statement and a prospective transition method to adopt the requirement to limit the capitalization of benefit costs to the service-cost component. Due to the retrospective requirements for income statement presentation, for the year ended December 31, 2017, the Company reclassified $7.7 million in non-service cost components of pension and other postretirement benefits from utility other operating expenses to other expense (income)-net on the Consolidated Statements of Income. See Note 11 for additional discussion regarding pension and other postretirement benefit expense.
ASU No. 2018-02 “Income Statement-Reporting Comprehensive Income (Topic 220): Reclassification of Certain Tax Effects from Accumulated Other Comprehensive Income”
In February 2018, the FASB issued ASU No. 2018-02, which amended the guidance for reporting comprehensive income. This ASU allows a reclassification from accumulated other comprehensive income to retained earnings for stranded tax effects resulting from the enactment of the TCJA in December 2017. This ASU is effective for periods beginning after December 15, 2018 and early adoption is permitted. Upon adoption, the requirements of this ASU must be applied either in the period of adoption or retrospectively to each period (or periods) in which the effect of the change in the U.S. federal corporate income tax rate in the TCJA is recognized. The Company early adopted this standard effective January 1, 2018 and elected to apply the guidance during the period of adoption rather than apply the standard retrospectively. As a result, the Company reclassified $1.7 million in tax benefits from accumulated other comprehensive loss to retained earnings during the year ended December 31, 2018.
ASU 2018-13 "Fair Value Measurement (Topic 820)"
In August 2018, the FASB issued ASU No. 2018-13, which amends the fair value measurement disclosure requirements of ASC 820. The requirements of this ASU include additional disclosure regarding the range and weighted average used to develop significant unobservable inputs for Level 3 fair value estimates and the elimination of certain other previously required disclosures, such as the narrative description of the valuation process for Level 3 fair value measurements. This ASU is effective for periods beginning after December 15, 2019 and early adoption is permitted. Entities have the option to early adopt the eliminated or modified disclosure requirements and delay the adoption of all the new disclosure requirements until the effective date of the ASU. The Company is in the process of evaluating this standard; however, it has determined that it will not early adopt any portion of this standard as of December 31, 2019.
ASU No. 2018-14 "Compensation - Retirement Benefits - Defined Benefit Plans - General (Subtopic 715-20)"
In August 2018, the FASB issued ASU No. 2018-14, which amends ASC 715 to add, remove and/or clarify certain disclosure requirements related to defined benefit pension and other postretirement plans. The additional disclosure requirements are primarily narrative discussion of significant changes in the benefit obligations and plan assets. The removed disclosures are primarily information about accumulated other comprehensive income expected to be recognized over the next year and the effects of changes associated with assumed health care costs. This ASU is effective for periods beginning after December 15,
89
2021 and early adoption is permitted. The Company is in the process of evaluating this standard; however, it has determined that it will not early adopt this standard as of December 31, 2019.
NOTE 3. BALANCE SHEET COMPONENTS
Materials and Supplies, Fuel Stock and Stored Natural Gas
Inventories of materials and supplies, fuel stock and stored natural gas are recorded at average cost for our regulated operations and the lower of cost or market for our non-regulated operations and consisted of the following as of December 31 (dollars in thousands):
2019 | 2018 | ||||||
Materials and supplies | $ | $ | |||||
Fuel stock | |||||||
Stored natural gas | |||||||
Total | $ | $ | |||||
Other Current Assets
Other current assets consisted of the following as of December 31 (dollars in thousands):
2019 | 2018 | ||||||
Collateral posted for derivative instruments after netting with outstanding derivative liabilities | $ | $ | |||||
Prepayments | |||||||
Income taxes receivable | |||||||
Other | |||||||
Total | $ | $ | |||||
Other Property and Investments-Net and Other Non-Current Assets
Other property and investments-net and other non-current assets consisted of the following as of December 31 (dollars in thousands):
2019 | 2018 | ||||||
Operating lease ROU assets | $ | $ | |||||
Finance lease ROU assets | |||||||
Non-utility property | |||||||
Equity investments | |||||||
Investment in affiliated trust | |||||||
Notes receivable | |||||||
Deferred compensation assets | |||||||
Other | |||||||
Total | $ | $ | |||||
Other Current Liabilities
Other current liabilities consisted of the following as of December 31 (dollars in thousands):
2019 | 2018 | ||||||
Accrued taxes other than income taxes | $ | $ | |||||
Unsettled interest rate swap derivative liabilities | |||||||
Employee paid time off accruals | |||||||
Accrued interest | |||||||
Pensions and other postretirement benefits | |||||||
Utility energy commodity derivative liabilities | |||||||
Other | |||||||
Total | $ | $ | |||||
90
Other Non-Current Liabilities and Deferred Credits
Other non-current liabilities and deferred credits consisted of the following as of December 31 (dollars in thousands):
2019 | 2018 | ||||||
Operating lease liabilities | $ | $ | |||||
Finance lease liabilities | |||||||
Deferred investment tax credits | |||||||
Asset retirement obligations | |||||||
Derivative liabilities | |||||||
Other | |||||||
Total | $ | $ | |||||
NOTE 4. REVENUE
ASC 606 defines the core principle of the revenue recognition model is that an entity should identify the various performance obligations in a contract, allocate the transaction price among the performance obligations and recognize revenue when (or as) the entity satisfies each performance obligation.
Utility Revenues
Revenue from Contracts with Customers
General
The majority of Avista Corp.’s revenue is from rate-regulated sales of electricity and natural gas to retail customers, which has two performance obligations, (1) having service available for a specified period (typically a month at a time) and (2) the delivery of energy to customers. The total energy price generally has a fixed component (basic charge) related to having service available and a usage-based component, related to the delivery and consumption of energy. The commodity is sold and/or delivered to and consumed by the customer simultaneously, and the provisions of the relevant utility commission authorization determine the charges the Company may bill the customer. Given that all revenue recognition criteria are met upon the delivery of energy to customers, revenue is recognized immediately.
In addition, the sale of electricity and natural gas is governed by the various state utility commissions, which set rates, charges, terms and conditions of service, and prices. Collectively, these rates, charges, terms and conditions are included in a “tariff,” which governs all aspects of the provision of regulated services. Tariffs are only permitted to be changed through a rate-setting process involving an independent, third-party regulator empowered by statute to establish rates that bind customers. Thus, all regulated sales by the Company are conducted subject to the regulator-approved tariff.
Tariff sales involve the current provision of commodity service (electricity and/or natural gas) to customers for a price that generally has a basic charge and a usage-based component. Tariff rates also include certain pass-through costs to customers such as natural gas costs, retail revenue credits and other miscellaneous regulatory items that do not impact net income, but can cause total revenue to fluctuate significantly up or down compared to previous periods. The commodity is sold and/or delivered to and consumed by the customer simultaneously, and the provisions of the relevant tariff determine the charges the Company may bill the customer, payment due date, and other pertinent rights and obligations of both parties. Generally, tariff sales do not involve a written contract. Given that all revenue recognition criteria are met upon the delivery of energy to customers, revenue is recognized immediately at that time.
Revenues from contracts with customers are presented in the Consolidated Statements of Income in the line item "Utility revenues, exclusive of alternative revenue programs."
Unbilled Revenue from Contracts with Customers
The determination of the volume of energy sales to individual customers is based on the reading of their meters, which occurs on a systematic basis throughout the month (once per month for each individual customer). At the end of each calendar month, the amount of energy delivered to customers since the date of the last meter reading is estimated and the corresponding unbilled revenue is estimated and recorded. The Company's estimate of unbilled revenue is based on:
• | the number of customers, |
• | current rates, |
• | meter reading dates, |
91
• | actual native load for electricity, |
• | actual throughput for natural gas, and |
• | electric line losses and natural gas system losses. |
Any difference between actual and estimated revenue is automatically corrected in the following month when the actual meter reading and customer billing occurs.
Accounts receivable includes unbilled energy revenues of the following amounts as of December 31 (dollars in thousands):
2019 | 2018 | ||||||
Unbilled accounts receivable | $ | $ | |||||
Non-Derivative Wholesale Contracts
The Company has certain wholesale contracts which are not accounted for as derivatives that are within the scope of ASC 606 and considered revenue from contracts with customers. Revenue is recognized as energy is delivered to the customer or the service is available for specified period of time, consistent with the discussion of tariff sales above.
Alternative Revenue Programs (Decoupling)
ASC 606 retained existing GAAP associated with alternative revenue programs, which specified that alternative revenue programs are contracts between an entity and a regulator of utilities, not a contract between an entity and a customer. GAAP requires that an entity present revenue arising from alternative revenue programs separately from revenues arising from contracts with customers on the face of the Consolidated Statements of Income. The Company's decoupling mechanisms (also known as a FCA in Idaho) qualify as alternative revenue programs. Decoupling revenue deferrals are recognized in the Consolidated Statements of Income during the period they occur (i.e. during the period of revenue shortfall or excess due to fluctuations in customer usage), subject to certain limitations, and a regulatory asset or liability is established which will be surcharged or rebated to customers in future periods. GAAP requires that for any alternative revenue program, like decoupling, the revenue must be expected to be collected from customers within 24 months of the deferral to qualify for recognition in the current period Consolidated Statement of Income. Any amounts included in the Company's decoupling program that are not expected to be collected from customers within 24 months are not recorded in the financial statements until the period in which revenue recognition criteria are met. The amounts expected to be collected from customers within 24 months represents an estimate which must be made by the Company on an ongoing basis due to it being based on the volumes of electric and natural gas sold to customers on a go-forward basis.
The Company records alternative program revenues under the gross method, which is to amortize the decoupling regulatory asset/liability to the alternative revenue program line item on the Consolidated Statement of Income as it is collected from or refunded to customers. The cash passing between the Company and the customers is presented in revenue from contracts with customers since it is a portion of the overall tariff paid by customers. This method results in a gross-up to both revenue from contracts with customers and revenue from alternative revenue programs, but has a net zero impact on total revenue. Depending on whether the previous deferral balance being amortized was a regulatory asset or regulatory liability, and depending on the size and direction of the current year deferral of surcharges and/or rebates to customers, it could result in negative alternative revenue program revenue during the year.
Derivative Revenue
Most wholesale electric and natural gas transactions (including both physical and financial transactions), and the sale of fuel are considered derivatives, which are scoped out of ASC 606. As such, these revenues are disclosed separately from revenue from contracts with customers. Revenue is recognized for these items upon the settlement/expiration of the derivative contract. Derivative revenue includes those transactions which are entered into and settled within the same month.
Other Utility Revenue
Other utility revenue includes rent, revenues from the lineman training school, sales of materials, late fees and other charges that do not represent contracts with customers. Other utility revenue also includes the provision for earnings sharing and the deferral and amortization of refunds to customers associated with the TCJA, enacted in December 2017. This revenue is scoped out of ASC 606, as this revenue does not represent items where a customer is a party that has contracted with the Company to obtain goods or services that are an output of the Company’s ordinary activities in exchange for consideration. As such, these revenues are presented separately from revenue from contracts with customers.
92
Other Considerations for Utility Revenues
Contracts with Multiple Performance Obligations
In addition to the tariff sales described above, which are stand-alone energy sales, the Company has bundled arrangements which contain multiple performance obligations including some combination of energy, capacity, energy reserves and RECs. Under these arrangements, the total contract price is allocated to the various performance obligations and revenue is recognized as the obligations are satisfied. Depending on the source of the revenue, it could either be included in revenue from contracts with customers or derivative revenue.
Gross Versus Net Presentation
Revenues and resource costs from Avista Utilities’ settled energy contracts that are “booked out” (not physically delivered) are reported on a net basis as part of derivative revenues.
Utility-related taxes collected from customers (primarily state excise taxes and city utility taxes) are taxes that are imposed on Avista Utilities as opposed to being imposed on its customers; therefore, Avista Utilities is the taxpayer and records these transactions on a gross basis in revenue from contracts with customers and operating expense (taxes other than income taxes). The utility-related taxes collected from customers at AEL&P are imposed on the customers rather than AEL&P; therefore, the customers are the taxpayers and AEL&P is acting as their agent. As such, effective January 1, 2018, these transactions at AEL&P are presented on a net basis within revenue from contracts with customers. Prior to the adoption of ASU No. 2014-09, the Company presented utility-related taxes at AEL&P on a gross basis. In prior years, there were approximately $2.0 million annually in utility-related taxes collected from customers included in revenue for AEL&P.
Utility-related taxes that were included in revenue from contracts with customers were as follows for the years ended December 31 (dollars in thousands):
2019 | 2018 | 2017 | |||||||||
Utility-related taxes | $ | $ | $ | ||||||||
Non-Utility Revenues
Revenue from Contracts with Customers
Non-utility revenue from contracts with customers is derived from contracts with one performance obligation. Prior to its sale in April 2019 (See Note 25 for further discussion on the sale of METALfx), METALfx had one performance obligation, the delivery of a product, and revenues were recognized when the risk of loss transferred to the customer, which occurred when products were shipped. The Steam Plant Brew Pub serves food and beverages to customers, its one performance obligation, and recognizes revenues at the time of service to the customer.
Other Revenue
Other non-utility revenue primarily relates to rent revenue, which is scoped out of ASC 606; therefore, this revenue is presented separately from revenue from contracts with customers.
Significant Judgments and Unsatisfied Performance Obligations
The vast majority of the Company's revenues are derived from the rate-regulated sale of electricity and natural gas that have two performance obligations that are satisfied throughout the period and as energy is delivered to customers. In addition, the customers do not pay for energy in advance of receiving it. As such, the Company does not have any significant unsatisfied performance obligations or deferred revenues as of period-end associated with these revenues. Also, the only significant judgments involving revenue recognition are estimates surrounding unbilled revenue and receivables from contracts with customers (discussed in detail above) and estimates surrounding the amount of decoupling revenues which will be collected from customers within 24 months.
The Company has certain capacity arrangements, where the Company has a contractual obligation to provide either electric or natural gas capacity to its customers for a fixed fee. Most of these arrangements are paid for in arrears by the customers and do not result in deferred revenue and only result in receivables from the customers. The Company does have one capacity agreement where the customer makes payments throughout the year and depending on the timing of the customer payments, it can result in an immaterial amount of deferred revenue or a receivable from the customer. As of December 31, 2019, the Company estimates it had unsatisfied capacity performance obligations of $5.9 million, which will be recognized as revenue in future periods as the capacity is provided to the customers. These performance obligations are not reflected in the financial statements, as the Company has not received payment for these services.
93
Disaggregation of Total Operating Revenue
The following table disaggregates total operating revenue by segment and source for the years ended December 31 (dollars in thousands):
2019 | 2018 | ||||||
Avista Utilities | |||||||
Revenue from contracts with customers | $ | $ | |||||
Derivative revenues | |||||||
Alternative revenue programs | |||||||
Deferrals and amortizations for rate refunds to customers | ( | ) | |||||
Other utility revenues | |||||||
Total Avista Utilities | |||||||
AEL&P | |||||||
Revenue from contracts with customers | |||||||
Deferrals and amortizations for rate refunds to customers | ( | ) | ( | ) | |||
Other utility revenues | |||||||
Total AEL&P | |||||||
Other | |||||||
Revenue from contracts with customers | |||||||
Other revenues | |||||||
Total other | |||||||
Total operating revenues | $ | $ | |||||
Utility Revenue from Contracts with Customers by Type and Service
The following table disaggregates revenue from contracts with customers associated with the Company's electric operations for the years ended December 31 (dollars in thousands):
2019 | 2018 | ||||||||||||||||||||||
Avista Utilities | AEL&P | Total Utility | Avista Utilities | AEL&P | Total Utility | ||||||||||||||||||
ELECTRIC OPERATIONS | |||||||||||||||||||||||
Revenue from contracts with customers | |||||||||||||||||||||||
Residential | $ | $ | $ | $ | $ | $ | |||||||||||||||||
Commercial and governmental | |||||||||||||||||||||||
Industrial | |||||||||||||||||||||||
Public street and highway lighting | |||||||||||||||||||||||
Total retail revenue | |||||||||||||||||||||||
Transmission | |||||||||||||||||||||||
Other revenue from contracts with customers | |||||||||||||||||||||||
Total revenue from contracts with customers | $ | $ | $ | $ | $ | $ | |||||||||||||||||
94
The following table disaggregates revenue from contracts with customers associated with the Company's natural gas operations for the years ended December 31 (dollars in thousands):
2019 | 2018 | ||||||
Avista Utilities | Avista Utilities | ||||||
NATURAL GAS OPERATIONS | |||||||
Revenue from contracts with customers | |||||||
Residential | $ | $ | |||||
Commercial | |||||||
Industrial and interruptible | |||||||
Total retail revenue | |||||||
Transportation | |||||||
Other revenue from contracts with customers | |||||||
Total revenue from contracts with customers | $ | $ | |||||
NOTE 5. LEASES
ASC 842, which outlines a model for entities to use in accounting for leases and supersedes previous lease accounting guidance, became effective on January 1, 2019. The core principle of the model is that an entity should recognize the ROU assets and liabilities that arise from leases on the balance sheet and depreciate or amortize the asset and liability over the term of the lease, as well as provide disclosure to enable users of the consolidated financial statements to assess the amount, timing, and uncertainty of cash flows arising from leases.
Significant Judgments and Assumptions
The Company determines if an arrangement is a lease, as well as its classification, at its inception.
ROU assets represent the Company's right to use an underlying asset for the lease term, and lease liabilities represent the Company's obligation to make lease payments arising from the lease. Operating and finance lease ROU assets and lease liabilities are recognized at the commencement date of the agreement based on the present value of lease payments over the lease term. As most of the Company's leases do not provide an implicit rate, the Company uses its incremental borrowing rate based on the information available at the commencement date to determine the present value of lease payments. The implicit rate is used when it is readily determinable. The operating and finance lease ROU assets also include any lease payments made and exclude lease incentives, if any, that accrue to the benefit of the lessee.
Lease terms may include options to extend or terminate the lease when it is reasonably certain that the Company will exercise that option. Lease expense for lease payments is recognized on a straight-line basis over the lease term. Any difference between lease expense and cash paid for leased assets is recognized as a regulatory asset or regulatory liability.
Description of Leases
Operating Leases
The Company's most significant operating lease is with the State of Montana associated with submerged land around the Company's hydroelectric facilities in the Clark Fork River basin, which expires in 2046. The terms of this lease are subject to renegotiation, depending on the outcome of ongoing litigation between Montana and NorthWestern Energy. In addition, the State of Montana and Avista Corp. are engaged in litigation regarding lease terms, including how much money, if any, the State of Montana will return to Avista Corp. The Company is currently paying all lease payments to the State of Montana into an escrow account until the litigation is resolved. As such, amounts recorded for this lease are uncertain and amounts may change in the future depending on the outcome of the ongoing litigation. Any reduction in future lease payments or the return of previously paid amounts to Avista Corp. will be included in the future ratemaking process.
In addition to the lease with the State of Montana, the Company also has other operating leases for land associated with its utility operations, as well as communication sites which support network and radio communications within its service territory. The Company's leases have remaining terms of 1 to 74 years. Most of the Company's leases include options to extend the lease term for periods of 5 to 50 years. Options are exercised at the Company's discretion.
Certain of the Company's lease agreements include rental payments which are periodically adjusted over the term of the agreement based on the consumer price index. The Company's lease agreements do not include any material residual value guarantees or material restrictive covenants.
95
Avista Corp. does not record leases with a term of 12 months or less in the Consolidated Balance Sheet. Total short-term lease costs for the year ended December 31, 2019 are immaterial.
Finance Lease
AEL&P has a PPA which is treated as a finance lease for accounting purposes related to the Snettisham Hydroelectric Project, which expires in 2034. For ratemaking purposes, this lease is treated as an operating lease with a constant level of annual rental expense (straight line rent expense). Because of this regulatory treatment, any difference between the operating lease expense for ratemaking purposes and the expenses recognized under GAAP (interest expense and amortization of the finance lease ROU asset) is recorded as a regulatory asset and amortized during the later years of the lease when the finance lease expense is less than the operating lease expense included in base rates. In 2018 and prior years, the total cost associated with the Snettisham PPA was included in resource costs. Due to the adoption of the new lease standard, the amortization of the ROU asset is now included in depreciation and amortization and the interest associated with the lease liability is now included in interest expense on the Consolidated Statement of Income.
Leases that Have Not Yet Commenced
In June 2018, the Company finalized a lease agreement for office space in Spokane, Washington. The lease period was expected to commence in April 2020, once the Company took possession of its portion of the building. However, at the end of 2019 the Company executed an agreement to terminate the lease agreement and, pending the resolution of certain contingencies, is no longer responsible for the lease payments subject to the resolution of certain contingencies.
In March 2019, the Company signed a PPA with Clearway Energy Group (Clearway) to purchase all of the power generated from the Rattlesnake Flat Wind project in Adams County, Washington. The facility has a nameplate capacity of 144 MW and is expected to generate approximately 50 aMW annually. During negotiations with Clearway, Avista Corp. was involved in the selection of the preferred generation facility type. The PPA is a 20 -year agreement with deliveries expected to begin in 2020. The PPA provides Avista Corp. with additional renewable energy, capacity and environmental attributes. Avista Corp. expects to recover the cost of the power purchased through its retail rates. This PPA is considered a lease under ASC 842; however, all of the payments are variable payments based on whether power is generated from the facility. Since all the payments are variable, the Company will not record a lease liability for the agreement, but the expense will be included in resource costs when it becomes operational in 2020.
The components of lease expense were as follows for the year ended December 31, 2019 (dollars in thousands):
2019 | |||
Operating lease cost: | |||
Fixed lease cost (Other operating expenses) | $ | ||
Variable lease cost (Other operating expenses) | |||
Total operating lease cost | $ | ||
Finance lease cost: | |||
Amortization of ROU asset (Depreciation and amortization) | $ | ||
Interest on lease liabilities (Interest expense) | |||
Total finance lease cost | $ | ||
96
Supplemental cash flow information related to leases was as follows for the year ended December 31, 2019 (dollars in thousands):
2019 | |||
Cash paid for amounts included in the measurement of lease liabilities: | |||
Operating cash outflows: | |||
Operating lease payments | $ | ||
Interest on finance lease | |||
Total operating cash outflows | $ | ||
Finance cash outflows: | |||
Principal payments on finance lease | $ | ||
Supplemental balance sheet information related to leases was as follows for December 31, 2019 (dollars in thousands):
December 31, | |||
2019 | |||
Operating Leases | |||
Operating lease ROU assets (Other property and investments-net and other non-current assets) | $ | ||
Other current liabilities | $ | ||
Other non-current liabilities and deferred credits | |||
Total operating lease liabilities | $ | ||
Finance Leases | |||
Finance lease ROU assets (Other property and investments-net and other non-current assets) (a) | $ | ||
Other current liabilities (b) | $ | ||
Other non-current liabilities and deferred credits (b) | |||
Total finance lease liabilities | $ | ||
Weighted Average Remaining Lease Term | |||
Operating leases | |||
Finance leases | |||
Weighted Average Discount Rate | |||
Operating leases | % | ||
Finance leases | % | ||
97
(a) | At December 31, 2018, the finance lease ROU assets were included in "Net utility property" on the Consolidated Balance Sheet. Due to the adoption of ASC 842 on January 1, 2019, the Company has reclassified these amounts to "Other property and investments-net and other non-current assets" on the Consolidated Balance Sheet such that their presentation as of December 31, 2019 is consistent with operating leases. |
(b) | At December 31, 2018, the finance lease liabilities were included in "Current portion of long-term debt" and "Long-term debt and capital leases" on the Consolidated Balance Sheet. Due to the adoption of ASC 842 on January 1, 2019, the Company has reclassified these amounts to "Other current liabilities" and "Other non-current liabilities and deferred credits" on the Consolidated Balance Sheet such that their presentation as of December 31, 2019 is consistent with operating leases. |
Maturities of lease liabilities (including principal and interest) were as follows as of December 31, 2019 (dollars in thousands):
Operating Leases | Finance Leases | ||||||
2020 | $ | $ | |||||
2021 | |||||||
2022 | |||||||
2023 | |||||||
2024 | |||||||
Thereafter | |||||||
Total lease payments | $ | $ | |||||
Less: imputed interest | ( | ) | ( | ) | |||
Total | $ | $ | |||||
Future minimum lease payments (including principal and interest) under Topic 840 as of December 31, 2018 (dollars in thousands):
Operating Leases | Finance Leases | ||||||
2019 | $ | $ | |||||
2020 | |||||||
2021 | |||||||
2022 | |||||||
2023 | |||||||
Thereafter | |||||||
Total lease payments | $ | $ | |||||
Less: imputed interest | ( | ) | |||||
Total | $ | $ | |||||
NOTE 6. VARIABLE INTEREST ENTITIES
Lancaster Power Purchase Agreement
The Company has a PPA for the purchase of all the output of the Lancaster Plant, a 270 MW natural gas-fired combined cycle combustion turbine plant located in Kootenai County, Idaho, owned by an unrelated third-party (Rathdrum Power LLC), through 2026.
Avista Corp. has a variable interest in the PPA. Accordingly, Avista Corp. made an evaluation of which interest holders have the power to direct the activities that most significantly impact the economic performance of the entity and which interest holders have the obligation to absorb losses or receive benefits that could be significant to the entity. Avista Corp. pays a fixed capacity and operations and maintenance payment and certain monthly variable costs under the PPA. Under the terms of the PPA, Avista Corp. makes the dispatch decisions, provides all natural gas fuel and receives all of the electric energy output from the Lancaster Plant. However, Rathdrum Power LLC (the owner) controls the daily operation of the Lancaster Plant and makes operating and maintenance decisions. Rathdrum Power LLC controls all of the rights and obligations of the Lancaster Plant after the expiration of the PPA in 2026 and Avista Corp. does not have any further obligations after the expiration. It is estimated that the plant will have 15 to 25 years of useful life after that time. Rathdrum Power LLC bears the maintenance risk
98
of the plant and will receive the residual value of the Lancaster Plant. Avista Corp. has no debt or equity investments in the Lancaster Plant and does not provide financial support through liquidity arrangements or other commitments (other than the PPA). Based on its analysis, Avista Corp. does not consider itself to be the primary beneficiary of the Lancaster Plant. Accordingly, neither the Lancaster Plant nor Rathdrum Power LLC is included in Avista Corp.’s consolidated financial statements. The Company has a future contractual obligation of $174.6 million under the PPA (representing the fixed capacity and operations and maintenance payments through 2026) and believes this would be its maximum exposure to loss. However, the Company believes that such costs will be recovered through retail rates.
Limited Partnerships and Similar Entities
Under current GAAP, a limited partnership or similar legal entity that is the functional equivalent of a limited partnership is considered a VIE regardless of whether it otherwise qualifies as a voting interest entity unless a simple majority or lower threshold of the “unrelated” limited partners (i.e., parties other than the general partner, entities under common control with the general partner, and other parties acting on behalf of the general partner) have substantive kick-out rights (including liquidation rights) or participating rights.
As of December 31, 2019, the Company has eight investments in limited partnerships (or the functional equivalent) where Avista Corp. is a limited partner investor in an investment fund where the general partner makes all of the investment and operating decisions with regards to the partnership and fund. To remove the general partner from any of the funds, approval from greater than a simple majority of the limited partners is required. As such, the limited partners do not have substantive kick-out rights and these investments are considered VIEs. Consolidation of these VIEs by Avista Corp. is not required because the Company does not have majority ownership in any of the funds, it does not have the power to direct any activities of the funds, and it does not have the power to appoint executive leadership, including the board of directors.
Avista Corp. participates in profits and losses of the investment funds based on its ownership percentage and its losses are capped at its total initial investment in the funds. For seven of the ten VIEs, Avista Corp. does not have any additional commitments beyond its initial investment. For the other three VIEs, as of December 31, 2019, Avista Corp. has invested $40.2 million, leaving $43.2 million remaining to be invested. In addition, the Company is not allowed to withdraw any capital contributions from the investment funds until after the funds' expiration dates and all liabilities of the funds are settled. The expiration dates range from 2021 to 2040 , with three investments having no termination date (as they are perpetual). In addition, one of the funds is closed and expired and the Company is awaiting final distribution as soon as the underlying investments are liquidated. As of December 31, 2019, the Company has a total carrying amount in these investment funds of $45.9 million.
NOTE 7. DERIVATIVES AND RISK MANAGEMENT
Energy Commodity Derivatives
Avista Corp. is exposed to market risks relating to changes in electricity and natural gas commodity prices and certain other fuel prices. Market risk is, in general, the risk of fluctuation in the market price of the commodity being traded and is influenced primarily by supply and demand. Market risk includes the fluctuation in the market price of associated derivative commodity instruments. Avista Corp. utilizes derivative instruments, such as forwards, futures, swap derivatives and options in order to manage the various risks relating to these commodity price exposures. Avista Corp. has an energy resources risk policy and control procedures to manage these risks.
As part of Avista Corp.'s resource procurement and management operations in the electric business, the Company engages in an ongoing process of resource optimization, which involves the economic selection from available energy resources to serve Avista Corp.'s load obligations and the use of these resources to capture available economic value through wholesale market transactions. These include sales and purchases of electric capacity and energy, fuel for electric generation, and derivative contracts related to capacity, energy and fuel. Such transactions are part of the process of matching resources with load obligations and hedging a portion of the related financial risks. These transactions range from terms of intra-hour up to multiple years.
As part of its resource procurement and management of its natural gas business, Avista Corp. makes continuing projections of its natural gas loads and assesses available natural gas resources including natural gas storage availability. Natural gas resource planning typically includes peak requirements, low and average monthly requirements and delivery constraints from natural gas supply locations to Avista Corp.'s distribution system. However, daily variations in natural gas demand can be significantly different than monthly demand projections. On the basis of these projections, Avista Corp. plans and executes a series of transactions to hedge a portion of its projected natural gas requirements through forward market transactions and derivative instruments. These transactions may extend as much as three natural gas operating years (November through October) into the
99
future. Avista Corp. also leaves a significant portion of its natural gas supply requirements unhedged for purchase in short-term and spot markets.
Avista Corp. plans for sufficient natural gas delivery capacity to serve its retail customers for a theoretical peak day event. Avista Corp. generally has more pipeline and storage capacity than what is needed during periods other than a peak day. Avista Corp. optimizes its natural gas resources by using market opportunities to generate economic value that helps mitigate fixed costs. Avista Corp. also optimizes its natural gas storage capacity by purchasing and storing natural gas when prices are traditionally lower, typically in the summer, and withdrawing during higher priced months, typically during the winter. However, if market conditions and prices indicate that Avista Corp. should buy or sell natural gas during other times in the year, Avista Corp. engages in optimization transactions to capture value in the marketplace. Natural gas optimization activities include, but are not limited to, wholesale market sales of surplus natural gas supplies, purchases and sales of natural gas to optimize use of pipeline and storage capacity, and participation in the transportation capacity release market.
The following table presents the underlying energy commodity derivative volumes as of December 31, 2019 that are expected to be delivered in each respective year (in thousands of MWhs and mmBTUs):
Purchases | Sales | ||||||||||||||||||||||
Electric Derivatives | Gas Derivatives | Electric Derivatives | Gas Derivatives | ||||||||||||||||||||
Year | Physical (1) MWh | Financial (1) MWh | Physical (1) mmBTUs | Financial (1) mmBTUs | Physical (1) MWh | Financial (1) MWh | Physical (1) mmBTUs | Financial (1) mmBTUs | |||||||||||||||
2020 | |||||||||||||||||||||||
2021 | |||||||||||||||||||||||
2022 | |||||||||||||||||||||||
As of December 31, 2019, there are no expected deliveries of energy commodity derivatives after 2022.
The following table presents the underlying energy commodity derivative volumes as of December 31, 2018 that were expected to be delivered in each respective year (in thousands of MWhs and mmBTUs):
Purchases | Sales | ||||||||||||||||||||||
Electric Derivatives | Gas Derivatives | Electric Derivatives | Gas Derivatives | ||||||||||||||||||||
Year | Physical (1) MWh | Financial (1) MWh | Physical (1) mmBTUs | Financial (1) mmBTUs | Physical (1) MWh | Financial (1) MWh | Physical (1) mmBTUs | Financial (1) mmBTUs | |||||||||||||||
2019 | |||||||||||||||||||||||
2020 | |||||||||||||||||||||||
2021 | |||||||||||||||||||||||
As of December 31, 2018, there were no expected deliveries of energy commodity derivatives after 2021.
(1) | Physical transactions represent commodity transactions in which Avista Corp. will take or make delivery of either electricity or natural gas; financial transactions represent derivative instruments with delivery of cash in the amount of the benefit or cost but with no physical delivery of the commodity, such as futures, swap derivatives, options, or forward contracts. |
The electric and natural gas derivative contracts above will be included in either power supply costs or natural gas supply costs during the period they are delivered and will be included in the various deferral and recovery mechanisms (ERM, PCA, and PGAs), or in the general rate case process, and are expected to be collected through retail rates from customers.
Foreign Currency Exchange Derivatives
A significant portion of Avista Corp.'s natural gas supply (including fuel for power generation) is obtained from Canadian sources. Most of those transactions are executed in U.S. dollars, which avoids foreign currency risk. A portion of Avista Corp.’s short-term natural gas transactions and long-term Canadian transportation contracts are committed based on Canadian currency prices and settled within 60 days with U.S. dollars. Avista Corp. hedges a portion of the foreign currency risk by purchasing Canadian currency exchange derivatives when such commodity transactions are initiated. The foreign currency exchange derivatives and the unhedged foreign currency risk have not had a material effect on Avista Corp.’s financial condition, results of operations or cash flows and these differences in cost related to currency fluctuations are included with natural gas supply costs for ratemaking.
100
The following table summarizes the foreign currency exchange derivatives that Avista Corp. has outstanding as of December 31 (dollars in thousands):
2019 | 2018 | ||||||
Number of contracts | |||||||
Notional amount (in United States dollars) | $ | $ | |||||
Notional amount (in Canadian dollars) | |||||||
Interest Rate Swap Derivatives
Avista Corp. is affected by fluctuating interest rates related to a portion of its existing debt, and future borrowing requirements. Avista Corp. hedges a portion of its interest rate risk with financial derivative instruments. These financial derivative instruments are considered economic hedges against fluctuations in future cash flows associated with anticipated debt issuances.
The following table summarizes the unsettled interest rate swap derivatives that Avista Corp. has outstanding as of the balance sheet date indicated below (dollars in thousands):
Balance Sheet Date | Number of Contracts | Notional Amount | Mandatory Cash Settlement Date | ||||
December 31, 2019 | |||||||
December 31, 2018 | |||||||
The fair value of outstanding interest rate swap derivatives can vary significantly from period to period depending on the total notional amount of swap derivatives outstanding and fluctuations in market interest rates compared to the interest rates fixed by the swaps. Avista Corp. is required to make cash payments to settle the interest rate swap derivatives when the fixed rates are higher than prevailing market rates at the date of settlement. Conversely, Avista Corp. receives cash to settle its interest rate swap derivatives when prevailing market rates at the time of settlement exceed the fixed swap rates.
Summary of Outstanding Derivative Instruments
The amounts recorded on the Consolidated Balance Sheet as of December 31, 2019 and December 31, 2018 reflect the offsetting of derivative assets and liabilities where a legal right of offset exists.
101
The following table presents the fair values and locations of derivative instruments recorded on the Consolidated Balance Sheet as of December 31, 2019 (in thousands):
Fair Value | |||||||||||||||
Derivative and Balance Sheet Location | Gross Asset | Gross Liability | Collateral Netting | Net Asset (Liability) on Balance Sheet | |||||||||||
Foreign currency exchange derivatives | |||||||||||||||
Other current assets | $ | $ | $ | $ | |||||||||||
Interest rate swap derivatives | |||||||||||||||
Other current assets | |||||||||||||||
Other current liabilities | ( | ) | ( | ) | |||||||||||
Other non-current liabilities and deferred credits | ( | ) | ( | ) | |||||||||||
Energy commodity derivatives | |||||||||||||||
Other current assets | ( | ) | |||||||||||||
Other property and investments-net and other non-current assets | ( | ) | |||||||||||||
Other current liabilities | ( | ) | ( | ) | |||||||||||
Other non-current liabilities and deferred credits | ( | ) | ( | ) | |||||||||||
Total derivative instruments recorded on the balance sheet | $ | $ | ( | ) | $ | $ | ( | ) | |||||||
The following table presents the fair values and locations of derivative instruments recorded on the Consolidated Balance Sheet as of December 31, 2018 (in thousands):
Fair Value | |||||||||||||||
Derivative and Balance Sheet Location | Gross Asset | Gross Liability | Collateral Netting | Net Asset (Liability) on Balance Sheet | |||||||||||
Foreign currency exchange derivatives | |||||||||||||||
Other current liabilities | $ | $ | ( | ) | $ | $ | ( | ) | |||||||
Interest rate swap derivatives | |||||||||||||||
Other current assets | |||||||||||||||
Other property and investments-net and other non-current assets | ( | ) | |||||||||||||
Other non-current liabilities and deferred credits | ( | ) | ( | ) | |||||||||||
Energy commodity derivatives | |||||||||||||||
Other current assets | ( | ) | |||||||||||||
Other current liabilities | ( | ) | ( | ) | |||||||||||
Other non-current liabilities and deferred credits | ( | ) | ( | ) | |||||||||||
Total derivative instruments recorded on the balance sheet | $ | $ | ( | ) | $ | $ | ( | ) | |||||||
Exposure to Demands for Collateral
Avista Corp.'s derivative contracts often require collateral (in the form of cash or letters of credit) or other credit enhancements, or reductions or terminations of a portion of the contract through cash settlement. In the event of a downgrade in Avista Corp.'s credit ratings or changes in market prices, additional collateral may be required. In periods of price volatility, the level of exposure can change significantly. As a result, sudden and significant demands may be made against Avista Corp.'s credit facilities and cash. Avista Corp. actively monitors the exposure to possible collateral calls and takes steps to mitigate capital requirements.
102
The following table presents Avista Corp.'s collateral outstanding related to its derivative instruments as of December 31 (in thousands):
2019 | 2018 | ||||||
Energy commodity derivatives | |||||||
Cash collateral posted | $ | $ | |||||
Letters of credit outstanding | |||||||
Balance sheet offsetting (cash collateral against net derivative positions) | |||||||
Interest rate swap derivatives | |||||||
Cash collateral posted | |||||||
Balance sheet offsetting (cash collateral against net derivative positions) | |||||||
There were no letters of credit outstanding related to interest rate swap derivatives as of December 31, 2019 and December 31, 2018.
Certain of Avista Corp.’s derivative instruments contain provisions that require the Company to maintain an "investment grade" credit rating from the major credit rating agencies. If Avista Corp.’s credit ratings were to fall below “investment grade,” it would be in violation of these provisions, and the counterparties to the derivative instruments could request immediate payment or demand immediate and ongoing collateralization on derivative instruments in net liability positions.
The following table presents the aggregate fair value of all derivative instruments with credit-risk-related contingent features that are in a liability position and the amount of additional collateral Avista Corp. could be required to post as of December 31 (in thousands):
2019 | 2018 | ||||||
Energy commodity derivatives | |||||||
Liabilities with credit-risk-related contingent features | $ | $ | |||||
Additional collateral to post | |||||||
Interest rate swap derivatives | |||||||
Liabilities with credit-risk-related contingent features | |||||||
Additional collateral to post | |||||||
NOTE 8. JOINTLY OWNED ELECTRIC FACILITIES
The Company has a 15 percent ownership interest in a twin-unit coal-fired generating facility, Colstrip, located in southeastern Montana, and provides financing for its ownership interest in the project. The Company’s share of related fuel costs as well as operating expenses for plant in service are included in the corresponding accounts in the Consolidated Statements of Income. The Company’s share of utility plant in service for Colstrip and accumulated depreciation (inclusive of the ARO assets and accumulated amortization) were as follows as of December 31 (dollars in thousands):
2019 | 2018 | ||||||
Utility plant in service | $ | $ | |||||
Accumulated depreciation | ( | ) | ( | ) | |||
See Note 10 for further discussion of AROs.
While the obligations and liabilities with respect to Colstrip are to be shared among the co-owners on a pro-rata basis, many of the environmental liabilities are joint and several under the law, so that if any co-owner failed to pay its share of such liability, the other co-owners (or any one of them) could be required to pay the defaulting co-owner‘s share (or the entire liability).
103
NOTE 9. PROPERTY, PLANT AND EQUIPMENT
Net Utility Property
Net utility property consisted of the following as of December 31 (dollars in thousands):
2019 | 2018 | ||||||
Utility plant in service | $ | $ | |||||
Construction work in progress | |||||||
Total | |||||||
Less: Accumulated depreciation and amortization | |||||||
Total net utility property | $ | $ | |||||
Gross Property, Plant and Equipment
The gross balances of the major classifications of property, plant and equipment are detailed in the following table as of December 31 (dollars in thousands):
2019 | 2018 | ||||||
Avista Utilities: | |||||||
Electric production | $ | $ | |||||
Electric transmission | |||||||
Electric distribution | |||||||
Electric construction work-in-progress (CWIP) and other | |||||||
Electric total | |||||||
Natural gas underground storage | |||||||
Natural gas distribution | |||||||
Natural gas CWIP and other | |||||||
Natural gas total | |||||||
Common plant (including CWIP) | |||||||
Total Avista Utilities | |||||||
AEL&P: | |||||||
Electric production | |||||||
Electric transmission | |||||||
Electric distribution | |||||||
Electric production held under long-term capital lease (1) | |||||||
Electric CWIP and other | |||||||
Electric total | |||||||
Common plant | |||||||
Total AEL&P | |||||||
Total gross utility property | |||||||
Other (2) | |||||||
Total | $ | $ | |||||
(1) | At December 31, 2018, the finance lease ROU assets were included in "Net utility property" on the Consolidated Balance Sheet. Due to the adoption of ASC 842 on January 1, 2019, the Company has reclassified these amounts to "Other property and investments-net and other non-current assets" on the Consolidated Balance Sheet such that their presentation as of December 31, 2019 is consistent with operating leases. |
(2) | Included in other property and investments-net and other non-current assets on the Consolidated Balance Sheets. Accumulated depreciation was $ |
104
NOTE 10. ASSET RETIREMENT OBLIGATIONS
The Company has recorded liabilities for future AROs to:
• | restore coal ash containment ponds and coal holding areas at Colstrip, |
• | cap a landfill at the Kettle Falls Plant, and |
• | remove plant and restore the land at the Coyote Springs 2 site at the termination of the land lease. |
Due to an inability to estimate a range of settlement dates, the Company cannot estimate a liability for the:
• | removal and disposal of certain transmission and distribution assets, and |
• | abandonment and decommissioning of certain hydroelectric generation and natural gas storage facilities. |
In 2015, the EPA issued a final rule regarding CCRs. Colstrip, of which Avista Corp. is a 15 percent owner of units 3 & 4, produces this byproduct. The CCR rule has been the subject of ongoing litigation. In August 2018, the D.C. Circuit struck down provisions of the rule. The rule includes technical requirements for CCR landfills and surface impoundments. The Colstrip owners developed a multi-year compliance plan to address the CCR requirements and existing state obligations.
The actual asset retirement costs related to the CCR rule requirements may vary substantially from the estimates used to record the ARO due to the uncertainty and evolving nature of the compliance strategies that will be used and the availability of data used to estimate costs, such as the quantity of coal ash present at certain sites and the volume of fill that will be needed to cap and cover certain impoundments. The Company updates its estimates as new information becomes available. The Company expects to seek recovery of any increased costs related to complying with the CCR rule through customer rates.
In addition to the above, under a 2018 Administrative Order on Consent and ongoing negotiations with the Montana Department of Ecological Quality, the owners of Colstrip are required to provide financial assurance, primarily in the form of surety bonds, to secure each owner's pro-rata share of various anticipated closure and remediation of the ash ponds and coal holding areas. The amount of financial assurance required of each owner may, like the ARO, vary substantially due to the uncertainty and evolving nature of anticipated closure and remediation activities, and as those activities are completed over time.
The following table documents the changes in the Company’s asset retirement obligation during the years ended December 31 (dollars in thousands):
2019 | 2018 | 2017 | |||||||||
Asset retirement obligation at beginning of year | $ | $ | $ | ||||||||
Liabilities incurred | |||||||||||
Liabilities settled | ( | ) | ( | ) | |||||||
Accretion expense | |||||||||||
Asset retirement obligation at end of year | $ | $ | $ | ||||||||
NOTE 11. PENSION PLANS AND OTHER POSTRETIREMENT BENEFIT PLANS
The pension and other postretirement benefit plans described below only relate to Avista Utilities. AEL&P (not discussed below) participates in a defined contribution multiemployer plan for its union workers and a defined contribution money purchase pension plan for its nonunion workers. None of the subsidiary retirement plans, individually or in the aggregate, are significant to Avista Corp.
Avista Utilities
The Company has a defined benefit pension plan covering the majority of all regular full-time employees at Avista Utilities that were hired prior to January 1, 2014. Individual benefits under this plan are based upon the employee’s years of service, date of hire and average compensation as specified in the plan. Non-union employees hired on or after January 1, 2014 participate in a defined contribution 401(k) plan in lieu of a defined benefit pension plan. The Company’s funding policy is to contribute at least the minimum amounts that are required to be funded under the Employee Retirement Income Security Act, but not more than the maximum amounts that are currently deductible for income tax purposes. The Company contributed $22.0 million in cash to the pension plan in 2019, 2018, and 2017. The Company expects to contribute $22.0 million in cash to the pension plan in 2020.
The Company also has a SERP that provides additional pension benefits to certain executive officers and certain key employees of the Company. The SERP is intended to provide benefits to individuals whose benefits under the defined benefit pension plan
105
are reduced due to the application of Section 415 of the Internal Revenue Code of 1986 and the deferral of salary under deferred compensation plans. The liability and expense for this plan are included as pension benefits in the tables included in this Note.
The Company expects that benefit payments under the pension plan and the SERP will total (dollars in thousands):
2020 | 2021 | 2022 | 2023 | 2024 | Total 2025-2029 | ||||||||||||||||||
Expected benefit payments | $ | $ | $ | $ | $ | $ | |||||||||||||||||
The expected long-term rate of return on plan assets is based on past performance and economic forecasts for the types of investments held by the plan. In selecting a discount rate, the Company considers yield rates for highly rated corporate bond portfolios with maturities similar to that of the expected term of pension benefits.
The Company provides certain health care and life insurance benefits for eligible retired employees that were hired prior to January 1, 2014. The Company accrues the estimated cost of postretirement benefit obligations during the years that employees provide services. The liability and expense of this plan are included as other postretirement benefits. Non-union employees hired on or after January 1, 2014, will have access to the retiree medical plan upon retirement; however, Avista Corp. will no longer provide a contribution toward their medical premium.
The Company has a Health Reimbursement Arrangement (HRA) to provide employees with tax-advantaged funds to pay for allowable medical expenses upon retirement. The amount earned by the employee is fixed on the retirement date based on the employee’s years of service and the ending salary. The liability and expense of the HRA are included as other postretirement benefits.
The Company provides death benefits to beneficiaries of executive officers who die during their term of office or after retirement. Under the plan, an executive officer’s designated beneficiary will receive a payment equal to twice the executive officer’s annual base salary at the time of death (or if death occurs after retirement, a payment equal to twice the executive officer’s total annual pension benefit). The liability and expense for this plan are included as other postretirement benefits.
The Company expects that benefit payments under other postretirement benefit plans will total (dollars in thousands):
2020 | 2021 | 2022 | 2023 | 2024 | Total 2025-2029 | ||||||||||||||||||
Expected benefit payments | $ | $ | $ | $ | $ | $ | |||||||||||||||||
The Company expects to contribute $6.7 million to other postretirement benefit plans in 2020, representing expected benefit payments to be paid during the year excluding the Medicare Part D subsidy. The Company uses a December 31 measurement date for its pension and other postretirement benefit plans.
The following table sets forth the pension and other postretirement benefit plan disclosures as of December 31, 2019 and 2018 and the components of net periodic benefit costs for the years ended December 31, 2019, 2018 and 2017 (dollars in thousands):
Pension Benefits | Other Post- retirement Benefits | ||||||||||||||
2019 | 2018 | 2019 | 2018 | ||||||||||||
Change in benefit obligation: | |||||||||||||||
Benefit obligation as of beginning of year | $ | $ | $ | $ | |||||||||||
Service cost | |||||||||||||||
Interest cost | |||||||||||||||
Actuarial (gain)/loss | ( | ) | ( | ) | |||||||||||
Benefits paid | ( | ) | ( | ) | ( | ) | ( | ) | |||||||
Benefit obligation as of end of year | $ | $ | $ | $ | |||||||||||
Change in plan assets: | |||||||||||||||
Fair value of plan assets as of beginning of year | $ | $ | $ | $ | |||||||||||
Actual return on plan assets | ( | ) | ( | ) | |||||||||||
Employer contributions | |||||||||||||||
Benefits paid | ( | ) | ( | ) | |||||||||||
Fair value of plan assets as of end of year | $ | $ | $ | $ | |||||||||||
106
Pension Benefits | Other Post- retirement Benefits | ||||||||||||||
2019 | 2018 | 2019 | 2018 | ||||||||||||
Funded status | $ | ( | ) | $ | ( | ) | $ | ( | ) | $ | ( | ) | |||
Amounts recognized in the Consolidated Balance Sheets: | |||||||||||||||
Other current liabilities | $ | ( | ) | $ | ( | ) | $ | ( | ) | $ | ( | ) | |||
Non-current liabilities | ( | ) | ( | ) | ( | ) | ( | ) | |||||||
Net amount recognized | $ | ( | ) | $ | ( | ) | $ | ( | ) | $ | ( | ) | |||
Accumulated pension benefit obligation | $ | $ | |||||||||||||
Accumulated postretirement benefit obligation: | |||||||||||||||
For retirees | $ | $ | |||||||||||||
For fully eligible employees | $ | $ | |||||||||||||
For other participants | $ | $ | |||||||||||||
Included in accumulated other comprehensive loss (income) (net of tax): | |||||||||||||||
Unrecognized prior service cost | $ | $ | $ | ( | ) | $ | ( | ) | |||||||
Unrecognized net actuarial loss | |||||||||||||||
Total | |||||||||||||||
Less regulatory asset | ( | ) | ( | ) | ( | ) | ( | ) | |||||||
Accumulated other comprehensive loss for unfunded benefit obligation for pensions and other postretirement benefit plans | $ | $ | $ | $ | |||||||||||
Pension Benefits | Other Post- retirement Benefits | ||||||||||
2019 | 2018 | 2019 | 2018 | ||||||||
Weighted-average assumptions as of December 31: | |||||||||||
Discount rate for benefit obligation | % | % | % | % | |||||||
Discount rate for annual expense | % | % | % | % | |||||||
Expected long-term return on plan assets | % | % | % | % | |||||||
Rate of compensation increase | % | % | |||||||||
Medical cost trend pre-age 65 – initial | % | % | |||||||||
Medical cost trend pre-age 65 – ultimate | % | % | |||||||||
Ultimate medical cost trend year pre-age 65 | |||||||||||
Medical cost trend post-age 65 – initial | % | % | |||||||||
Medical cost trend post-age 65 – ultimate | % | % | |||||||||
Ultimate medical cost trend year post-age 65 | |||||||||||
Pension Benefits | Other Post-retirement Benefits | ||||||||||||||||||||||
2019 | 2018 | 2017 | 2019 | 2018 | 2017 | ||||||||||||||||||
Components of net periodic benefit cost: | |||||||||||||||||||||||
Service cost (a) | $ | $ | $ | $ | $ | $ | |||||||||||||||||
Interest cost | |||||||||||||||||||||||
Expected return on plan assets | ( | ) | ( | ) | ( | ) | ( | ) | ( | ) | ( | ) | |||||||||||
Amortization of prior service cost | ( | ) | ( | ) | ( | ) | |||||||||||||||||
Net loss recognition | |||||||||||||||||||||||
Net periodic benefit cost | $ | $ | $ | $ | $ | $ | |||||||||||||||||
(a) | Total service costs in the table above are recorded to the same accounts as labor expense. Labor and benefits expense is recorded to various projects based on whether the work is a capital project or an operating expense. Approximately |
107
See Note 2 for discussion regarding the adoption of ASU No. 2017-07 and its impact to the presentation of pension and other postretirement benefits in the Consolidated Statements of Income and the Consolidated Balance Sheets.
Assumed health care cost trend rates have a significant effect on the amounts reported for the health care plans. A one-percentage-point increase in the assumed health care cost trend rate for each year would increase the accumulated postretirement benefit obligation as of December 31, 2019 by $13.9 million and the service and interest cost by $0.8 million. A one-percentage-point decrease in the assumed health care cost trend rate for each year would decrease the accumulated postretirement benefit obligation as of December 31, 2019 by $10.7 million and the service and interest cost by $0.6 million.
Plan Assets
The Finance Committee of the Company’s Board of Directors approves investment policies, objectives and strategies that seek an appropriate return for the pension plan and other postretirement benefit plans and reviews and approves changes to the investment and funding policies.
The Company has contracted with investment consultants who are responsible for monitoring the individual investment managers. The investment managers’ performance and related individual fund performance is periodically reviewed by an internal benefits committee and by the Finance Committee to monitor compliance with investment policy objectives and strategies.
Pension plan assets are invested in mutual funds, trusts and partnerships that hold marketable debt and equity securities, real estate, absolute return and commodity funds. In seeking to obtain a return that aligns with the funded status of the pension plan, the investment consultant recommends allocation percentages by asset classes. These recommendations are reviewed by the internal benefits committee, which then recommends their adoption by the Finance Committee. The Finance Committee has established target investment allocation percentages by asset classes and also investment ranges for each asset class. The target investment allocation percentages are typically the midpoint of the established range. The target investment allocation percentages by asset classes are indicated in the table below:
2019 | 2018 | ||||
Equity securities | % | % | |||
Debt securities | % | % | |||
Real estate | % | % | |||
Absolute return | % | % | |||
The fair value of pension plan assets invested in debt and equity securities was based primarily on fair value (market prices). The fair value of investment securities traded on a national securities exchange is determined based on the reported last sales price; securities traded in the over-the-counter market are valued at the last reported bid price. Investment securities for which market prices are not readily available or for which market prices do not represent the value at the time of pricing, the investment manager estimates fair value based upon other inputs (including valuations of securities that are comparable in coupon, rating, maturity and industry).
Pension plan and other postretirement plan assets whose fair values are measured using net asset value (NAV) are excluded from the fair value hierarchy and are included as reconciling items in the tables below.
Investments in common/collective trust funds are presented at estimated fair value, which is determined based on the unit value of the fund. Unit value is determined by an independent trustee, which sponsors the fund, by dividing the fund’s net assets by its units outstanding at the valuation date. The Company's investments in common/collective trusts have redemption limitations that permit quarterly redemptions following notice requirements of 45 to 60 days. The fair values of the closely held investments and partnership interests are based upon the allocated share of the fair value of the underlying net assets as well as the allocated share of the undistributed profits and losses, including realized and unrealized gains and losses. Most of the Company's investments in closely held investments and partnership interests have redemption limitations that range from bi-monthly to semi-annually following redemption notice requirements of 60 to 90 days. One investment in a partnership has a lock-up for redemption currently expiring in 2022 and is subject to extension.
108
The fair value of pension plan assets invested in real estate was determined by the investment manager based on three basic approaches:
• | properties are externally appraised on an annual basis by independent appraisers, additional appraisals may be performed as warranted by specific asset or market conditions, |
• | property valuations are reviewed quarterly and adjusted as necessary, and |
• | loans are reflected at fair value. |
The fair value of pension plan assets was determined as of December 31, 2019 and 2018.
The following table discloses by level within the fair value hierarchy (see Note 17 for a description of the fair value hierarchy) of the pension plan’s assets measured and reported as of December 31, 2019 at fair value (dollars in thousands):
Level 1 | Level 2 | Level 3 | Total | ||||||||||||
Cash equivalents | $ | $ | $ | $ | |||||||||||
Fixed income securities: | |||||||||||||||
U.S. government issues | — | ||||||||||||||
Corporate issues | — | ||||||||||||||
International issues | — | ||||||||||||||
Municipal issues | — | ||||||||||||||
Mutual funds: | |||||||||||||||
U.S. equity securities | — | — | |||||||||||||
International equity securities | — | — | |||||||||||||
Absolute return (1) | — | — | |||||||||||||
Plan assets measured at NAV (not subject to hierarchy disclosure) | |||||||||||||||
Common/collective trusts: | |||||||||||||||
Real estate | — | — | — | ||||||||||||
Partnership/closely held investments: | |||||||||||||||
Absolute return (1) | — | — | — | ||||||||||||
Real estate | — | — | — | ||||||||||||
Total | $ | $ | $ | $ | |||||||||||
109
The following table discloses by level within the fair value hierarchy (see Note 17 for a description of the fair value hierarchy) of the pension plan’s assets measured and reported as of December 31, 2018 at fair value (dollars in thousands):
Level 1 | Level 2 | Level 3 | Total | ||||||||||||
Cash equivalents | $ | $ | $ | $ | |||||||||||
Fixed income securities: | |||||||||||||||
U.S. government issues | — | ||||||||||||||
Corporate issues | — | ||||||||||||||
International issues | — | ||||||||||||||
Municipal issues | — | ||||||||||||||
Mutual funds: | |||||||||||||||
U.S. equity securities | — | — | |||||||||||||
International equity securities | — | — | |||||||||||||
Absolute return (1) | — | — | |||||||||||||
Plan assets measured at NAV (not subject to hierarchy disclosure) | |||||||||||||||
Common/collective trusts: | |||||||||||||||
Real estate | — | — | — | ||||||||||||
International equity securities | — | — | — | ||||||||||||
Partnership/closely held investments: | |||||||||||||||
Absolute return (1) | — | — | — | ||||||||||||
Real estate | — | — | — | ||||||||||||
Total | $ | $ | $ | $ | |||||||||||
(1) | This category invests in multiple strategies to diversify risk and reduce volatility. The strategies include: (a) event driven, relative value, convertible, and fixed income arbitrage, (b) distressed investments, (c) long/short equity and fixed income, and (d) market neutral strategies. |
The fair value of other postretirement plan assets was determined as of December 31, 2019 and 2018.
The following table discloses by level within the fair value hierarchy (see Note 16 for a description of the fair value hierarchy) of other postretirement plan assets measured and reported as of December 31, 2019 at fair value (dollars in thousands):
Level 1 | Level 2 | Level 3 | Total | ||||||||||||
Balanced index mutual funds (1) | $ | $ | $ | $ | |||||||||||
The following table discloses by level within the fair value hierarchy (see Note 16 for a description of the fair value hierarchy) of other postretirement plan assets measured and reported as of December 31, 2018 at fair value (dollars in thousands):
Level 1 | Level 2 | Level 3 | Total | ||||||||||||
Balanced index mutual funds (1) | $ | $ | $ | $ | |||||||||||
(1) | The balanced index fund for 2019 and 2018 is a single mutual fund that includes a percentage of U.S. equity and fixed income securities and International equity and fixed income securities. |
401(k) Plans and Executive Deferral Plan
Avista Utilities has a salary deferral 401(k) plan that is a defined contribution plan and covers substantially all employees. Employees can make contributions to their respective accounts in the plans on a pre-tax basis up to the maximum amount permitted by law. The Company matches a portion of the salary deferred by each participant according to the schedule in the respective plan.
110
Employer matching contributions were as follows for the years ended December 31 (dollars in thousands):
2019 | 2018 | 2017 | |||||||||
Employer 401(k) matching contributions | $ | $ | $ | ||||||||
The Company has an Executive Deferral Plan. This plan allows executive officers and other key employees the opportunity to defer until the earlier of their retirement, termination, disability or death, up to 75 percent of their base salary and/or up to 100 percent of their incentive payments. Deferred compensation funds are held by the Company in a Rabbi Trust.
There were deferred compensation assets included in other property and investments-net and corresponding deferred compensation liabilities included in other non-current liabilities and deferred credits on the Consolidated Balance Sheets of the following amounts as of December 31 (dollars in thousands):
2019 | 2018 | ||||||
Deferred compensation assets and liabilities | $ | $ | |||||
NOTE 12. ACCOUNTING FOR INCOME TAXES
Federal Income Tax Law Changes
On December 22, 2017, the TCJA was signed into law. The legislation included substantial changes to the taxation of individuals as well as U.S. businesses, multi-national enterprises, and other types of taxpayers. Highlights of provisions most relevant to Avista Corp. included:
• | A permanent reduction in the statutory corporate tax rate from |
• | Statutory provisions requiring that excess deferred taxes associated with public utility property be normalized using the ARAM or the Reverse South Georgia Method for determining the timing of the return of excess deferred taxes to customers. Excess deferred taxes result from revaluing deferred tax assets and liabilities based on the newly enacted tax rate instead of the previous tax rate, which, for most rate-regulated utilities like Avista Utilities and AEL&P, results in a net benefit to customers that will be deferred as a regulatory liability and passed through to customers over future periods; |
• | Repeal of the corporate AMT; |
• | Bonus depreciation (expensing of capital investment on an accelerated basis) was removed as a deduction for property predominantly used in certain rate-regulated businesses (like Avista Utilities and AEL&P), but is still allowed for the Company's non-regulated businesses; and |
• | NOL carryback deductions were eliminated, but carryforward deductions are allowed indefinitely with some annual limitations versus the previous 20-year limitation. |
As a result of the TCJA and its reduction of the corporate income tax rate from 35 percent to 21 percent (among many other changes in the law), the Company recorded a regulatory liability associated with the revaluing of its deferred income tax assets and liabilities to the new corporate tax rate. The total net amount of the regulatory liability for excess deferred income taxes associated with the TCJA is $416.7 million as of December 31, 2019, compared to $436.7 million as of December 31, 2018, which reflects the amounts to be refunded to customers through the regulatory process. The Avista Utilities amounts related to utility plant commenced being returned to customers in 2018 and the Company expects they will be returned to customers over a period of approximately 36 years using the ARAM. The AEL&P amounts related to utility plant commenced being returned to customers in 2018 and the Company expects they will be returned to customers over a period of approximately 40 years using the Reverse South Georgia Method. The return of the regulatory liability attributable to non-plant excess deferred taxes has begun through tariffs or other regulatory mechanisms or proceedings.
Because most of the provisions of the TCJA were effective as of January 1, 2018 but customers' rates included a 35 percent corporate tax rate built in from prior general rate cases, the Company began accruing for a refund to customers for the change in federal income tax expense beginning January 1, 2018 forward. For Washington and Idaho, this accrual was recorded until all benefits prior to a permanent rate change were properly captured through the deferral process. For Oregon, this accrual was recorded through 2019 with new customer rates effective January 15, 2020. Refunds have begun to Washington, Idaho, and Oregon customers through tariffs or other regulatory mechanisms or proceedings.
111
Income Tax Expense
Income tax expense consisted of the following for the years ended December 31 (dollars in thousands):
2019 | 2018 | 2017 | |||||||||
Current income tax expense | $ | $ | $ | ||||||||
Deferred income tax expense | |||||||||||
Total income tax expense | $ | $ | $ | ||||||||
State income taxes do not represent a significant portion of total income tax expense on the Consolidated Statements of Income for any periods presented.
A reconciliation of federal income taxes derived from statutory federal tax rates (21 percent in 2019 and 2018 and 35 percent in 2017) applied to income before income taxes as set forth in the accompanying Consolidated Statements of Income is as follows for the years ended December 31 (dollars in thousands):
2019 | 2018 | 2017 | |||||||||||||||
Federal income taxes at statutory rates | $ | % | $ | % | $ | % | |||||||||||
Increase (decrease) in tax resulting from: | |||||||||||||||||
Tax effect of regulatory treatment of utility plant differences | ( | ) | ( | ) | ( | ) | ( | ) | |||||||||
State income tax expense | |||||||||||||||||
Settlement of prior year tax returns and adjustment of tax reserves | ( | ) | ( | ) | ( | ) | ( | ) | |||||||||
Manufacturing deduction | ( | ) | ( | ) | |||||||||||||
Settlement of equity awards | ( | ) | ( | ) | ( | ) | ( | ) | |||||||||
Acquisition costs | ( | ) | ( | ) | |||||||||||||
Federal income tax rate change | |||||||||||||||||
Non-plant excess deferred turnaround | ( | ) | ( | ) | |||||||||||||
Tax loss on sale of METALfx | ( | ) | ( | ) | |||||||||||||
Valuation allowance | |||||||||||||||||
Other | ( | ) | ( | ) | ( | ) | ( | ) | ( | ) | ( | ) | |||||
Total income tax expense | $ | % | $ | % | $ | % | |||||||||||
112
Deferred Income Taxes
Deferred income taxes reflect the net tax effects of temporary differences between the carrying amounts of assets and liabilities for financial reporting purposes and the amounts used for income tax purposes and tax credit carryforwards. The total net deferred income tax liability consisted of the following as of December 31 (dollars in thousands):
2019 | 2018 | ||||||
Deferred income tax assets: | |||||||
Unfunded benefit obligation | $ | $ | |||||
Utility energy commodity and interest rate swap derivatives | |||||||
Regulatory deferred tax credits | |||||||
Tax credits | |||||||
Power and natural gas deferrals | |||||||
Deferred compensation | |||||||
Deferred taxes on regulatory liabilities | |||||||
Other | |||||||
Total gross deferred income tax assets | |||||||
Valuation allowances for deferred tax assets | ( | ) | ( | ) | |||
Total deferred income tax assets after valuation allowances | |||||||
Deferred income tax liabilities: | |||||||
Differences between book and tax basis of utility plant | |||||||
Regulatory asset on utility, property plant and equipment | |||||||
Regulatory asset for pensions and other postretirement benefits | |||||||
Utility energy commodity and interest rate swap derivatives | |||||||
Long-term debt and borrowing costs | |||||||
Settlement with Coeur d’Alene Tribe | |||||||
Other regulatory assets | |||||||
Other | |||||||
Total deferred income tax liabilities | |||||||
Net long-term deferred income tax liability | $ | $ | |||||
The realization of deferred income tax assets is dependent upon the ability to generate taxable income in future periods. The Company evaluated available evidence supporting the realization of its deferred income tax assets and determined it is more likely than not that deferred income tax assets will be realized.
As of December 31, 2019, the Company had $22.3 million of state tax credit carryforwards. Of the total amount, the Company believes that it is more likely than not that it will only be able to utilize $6.0 million of the state tax credits. As such, the Company has recorded a valuation allowance of $16.3 million against the state tax credit carryforwards and reflected the net amount of $6.0 million as an asset as of December 31, 2019. State tax credits expire from 2020 to 2033 .
Status of Internal Revenue Service (IRS) and State Examinations
The Company and its eligible subsidiaries file consolidated federal income tax returns. The Company also files state income tax returns in certain jurisdictions, including Idaho, Oregon, Montana and Alaska. Subsidiaries are charged or credited with the tax effects of their operations on a stand-alone basis. All tax years after 2016 are open for an IRS tax examination.
The Idaho State Tax Commission is currently reviewing tax years 2014 through 2017. The statute of limitations for Montana and Oregon to review 2015 and earlier tax years has expired.
The Company believes that any open tax years for federal or state income taxes will not result in adjustments that would be significant to the consolidated financial statements.
NOTE 13. ENERGY PURCHASE CONTRACTS
The below discussion only relates to Avista Utilities. The sole energy purchase contract at AEL&P is a PPA for the Snettisham hydroelectric project and it is accounted for as a lease. AEL&P does not have any other significant operating agreements or contractual obligations. See Note 5 for further discussion of the Snettisham PPA.
Avista Utilities has contracts for the purchase of fuel for thermal generation, natural gas for resale and various agreements for the purchase or exchange of electric energy with other entities. The remaining term of the contracts range from one month to twenty-five years.
113
Total expenses for power purchased, natural gas purchased, fuel for generation and other fuel costs, which are included in utility resource costs in the Consolidated Statements of Income, were as follows for the years ended December 31 (dollars in thousands):
2019 | 2018 | 2017 | |||||||||
Utility power resources | $ | $ | $ | ||||||||
The following table details Avista Utilities’ future contractual commitments for power resources (including transmission contracts) and natural gas resources (including transportation contracts) (dollars in thousands):
2020 | 2021 | 2022 | 2023 | 2024 | Thereafter | Total | |||||||||||||||||||||
Power resources | $ | $ | $ | $ | $ | $ | $ | ||||||||||||||||||||
Natural gas resources | |||||||||||||||||||||||||||
Total | $ | $ | $ | $ | $ | $ | $ | ||||||||||||||||||||
These energy purchase contracts were entered into as part of Avista Utilities’ obligation to serve its retail electric and natural gas customers’ energy requirements, including contracts entered into for resource optimization. As a result, these costs are recovered either through base retail rates or adjustments to retail rates as part of the power and natural gas cost deferral and recovery mechanisms.
The above future contractual commitments for power resources include fixed contractual amounts related to the Company's contracts with certain PUDs to purchase portions of the output of certain generating facilities. Although Avista Utilities has no investment in the PUD generating facilities, the fixed contracts obligate Avista Utilities to pay certain minimum amounts whether or not the facilities are operating. The cost of power obtained under the contracts, including payments made when a facility is not operating, is included in utility resource costs in the Consolidated Statements of Income. The contractual amounts included above consist of Avista Utilities’ share of existing debt service cost and its proportionate share of the variable operating expenses of these projects. The minimum amounts payable under these contracts are based in part on the proportionate share of the debt service requirements of the PUD's revenue bonds for which the Company is indirectly responsible. The Company's total future debt service obligation associated with the revenue bonds outstanding at December 31, 2019 (principal and interest) was $67.2 million.
In addition, Avista Utilities has operating agreements, settlements and other contractual obligations related to its generating facilities and transmission and distribution services. The expenses associated with these agreements are reflected as other operating expenses in the Consolidated Statements of Income. The following table details future contractual commitments under these agreements (dollars in thousands):
2020 | 2021 | 2022 | 2023 | 2024 | Thereafter | Total | |||||||||||||||||||||
Contractual obligations | $ | $ | $ | $ | $ | $ | $ | ||||||||||||||||||||
NOTE 14. COMMITTED LINES OF CREDIT
Avista Corp.
Avista Corp. has a committed line of credit with various financial institutions in the total amount of $400.0 million that expires in April 2021. The committed line of credit is secured by non-transferable first mortgage bonds of Avista Corp. issued to the agent bank that would only become due and payable in the event, and then only to the extent, that Avista Corp. defaults on its obligations under the committed line of credit.
The committed line of credit agreement contains customary covenants and default provisions. The credit agreement has a covenant which does not permit the ratio of “consolidated total debt” to “consolidated total capitalization” of Avista Corp. to be greater than 65 percent at any time. As of December 31, 2019, the Company was in compliance with this covenant.
Balances outstanding and interest rates of borrowings (excluding letters of credit) under the Company’s revolving committed lines of credit were as follows as of December 31 (dollars in thousands):
2019 | 2018 | ||||||
Balance outstanding at end of period | $ | $ | |||||
Letters of credit outstanding at end of period | $ | $ | |||||
Average interest rate at end of period | % | % | |||||
114
As of December 31, 2019 and 2018, the borrowings outstanding under Avista Corp.'s committed line of credit were classified as short-term borrowings on the Consolidated Balance Sheet.
AEL&P
In December of 2019, AEL&P renewed its committed line of credit in the amount of $25.0 million with a new expiration date in November 2024. The committed line of credit is secured by non-transferable first mortgage bonds of AEL&P issued to the agent bank that would only become due and payable in the event, and then only to the extent, that AEL&P defaults on its obligations under the committed line of credit.
The committed line of credit agreement contains customary covenants and default provisions. The credit agreement has a covenant which does not permit the ratio of “consolidated total debt at AEL&P” to “consolidated total capitalization at AEL&P,” including the impact of the Snettisham bonds to be greater than 67.5 percent at any time. As of December 31, 2019, AEL&P was in compliance with this covenant.
Balances outstanding and interest rates of borrowings under AEL&P's revolving committed lines of credit were as follows as of December 31 (dollars in thousands):
2019 | 2018 | ||||||
Balance outstanding at end of period | $ | $ | |||||
Average interest rate at end of period | % | % | |||||
115
NOTE 15. LONG-TERM DEBT
The following details long-term debt outstanding as of December 31 (dollars in thousands):
Maturity Year | Description | Interest Rate | 2019 | 2018 | ||||||||
Avista Corp. Secured Long-Term Debt | ||||||||||||
First Mortgage Bonds | ||||||||||||
First Mortgage Bonds | ||||||||||||
First Mortgage Bonds | ||||||||||||
Secured Medium-Term Notes | 7.18%-7.54% | |||||||||||
Secured Medium-Term Notes | ||||||||||||
Secured Pollution Control Bonds (1) | (1) | |||||||||||
Secured Pollution Control Bonds (1) | (1) | |||||||||||
First Mortgage Bonds | ||||||||||||
First Mortgage Bonds | ||||||||||||
First Mortgage Bonds | ||||||||||||
First Mortgage Bonds | ||||||||||||
First Mortgage Bonds | ||||||||||||
First Mortgage Bonds | ||||||||||||
First Mortgage Bonds | ||||||||||||
First Mortgage Bonds | ||||||||||||
First Mortgage Bonds | ||||||||||||
First Mortgage Bonds (2) | ||||||||||||
First Mortgage Bonds | ||||||||||||
Total Avista Corp. secured long-term debt | ||||||||||||
Alaska Electric Light and Power Company Secured Long-Term Debt | ||||||||||||
First Mortgage Bonds | ||||||||||||
Total secured long-term debt | ||||||||||||
Alaska Energy and Resources Company Unsecured Long-Term Debt | ||||||||||||
Unsecured Term Loan | ||||||||||||
Unsecured Term Loan | ||||||||||||
Total secured and unsecured long-term debt | ||||||||||||
Other Long-Term Debt Components | ||||||||||||
Capital lease obligations (3) | ||||||||||||
Unamortized debt discount | ( | ) | ( | ) | ||||||||
Unamortized long-term debt issuance costs | ( | ) | ( | ) | ||||||||
Total | ||||||||||||
Secured Pollution Control Bonds held by Avista Corporation (1) | ( | ) | ( | ) | ||||||||
Current portion of long-term debt and capital leases | ( | ) | ( | ) | ||||||||
Total long-term debt and capital leases | $ | $ | ||||||||||
(1) | In December 2010, $ |
116
(2) | In November 2019, the Company issued and sold $ |
(3) | Effective January 1, 2019, due to the adoption of the new lease standard (ASU 2016-02), capital leases will now be defined as finance leases and are presented in "Other current liabilities" and "Other non-current liabilities and deferred credits" on the Consolidated Balance Sheet such that their presentation as of December 31, 2019 is consistent with operating leases. See Notes 2 and 5 for further discussion of the new lease standard. |
2020 | 2021 | 2022 | 2023 | 2024 | Thereafter | Total | |||||||||||||||||||||
Debt maturities | $ | $ | $ | $ | $ | $ | $ | ||||||||||||||||||||
Substantially all of Avista Utilities' and AEL&P's owned properties are subject to the lien of their respective mortgage indentures. Under the Mortgages and Deeds of Trust (Mortgages) securing their first mortgage bonds (including secured medium-term notes), Avista Utilities and AEL&P may each issue additional first mortgage bonds under their specific mortgage in an aggregate principal amount equal to the sum of:
• | 66-2/3 percent of the cost or fair value (whichever is lower) of property additions of that entity which have not previously been made the basis of any application under that entity's Mortgage, or |
• | an equal principal amount of retired first mortgage bonds of that entity which have not previously been made the basis of any application under that entity's Mortgage, or |
• | deposit of cash. |
Avista Utilities and AEL&P may not individually issue any additional first mortgage bonds (with certain exceptions in the case of bonds issued on the basis of retired bonds) unless the particular entity issuing the bonds has “net earnings” (as defined in that entity's Mortgage) for any period of 12 consecutive calendar months out of the preceding 18 calendar months that were at least twice the annual interest requirements on all mortgage securities at the time outstanding, including the first mortgage bonds to be issued, and on all indebtedness of prior rank. As of December 31, 2019, property additions and retired bonds would have allowed, and the net earnings test would not have prohibited, the issuance of $1.5 billion in an aggregate principal amount of additional first mortgage bonds at Avista Utilities and $30.4 million by AEL&P.
NOTE 16. LONG-TERM DEBT TO AFFILIATED TRUSTS
In 1997, the Company issued Floating Rate Junior Subordinated Deferrable Interest Debentures, Series B, with a principal amount of $51.5 million to Avista Capital II, an affiliated business trust formed by the Company. Avista Capital II issued $50.0 million of Preferred Trust Securities with a floating distribution rate of LIBOR plus 0.875 percent, calculated and reset quarterly.
The distribution rates paid were as follows during the years ended December 31:
2019 | 2018 | 2017 | ||||||
Low distribution rate | % | % | % | |||||
High distribution rate | % | % | % | |||||
Distribution rate at the end of the year | % | % | % | |||||
Concurrent with the issuance of the Preferred Trust Securities, Avista Capital II issued $1.5 million of Common Trust Securities to the Company. These Preferred Trust Securities may be redeemed at the option of Avista Capital II at any time and mature on June 1, 2037. In December 2000, the Company purchased $10.0 million of these Preferred Trust Securities.
The Company owns 100 percent of Avista Capital II and has solely and unconditionally guaranteed the payment of distributions on, and redemption price and liquidation amount for, the Preferred Trust Securities to the extent that Avista Capital II has funds available for such payments from the respective debt securities. Upon maturity or prior redemption of such debt securities, the
117
Preferred Trust Securities will be mandatorily redeemed. The Company does not include these capital trusts in its consolidated financial statements as Avista Corp. is not the primary beneficiary. As such, the sole assets of the capital trusts are $51.5 million of junior subordinated deferrable interest debentures of Avista Corp., which are reflected on the Consolidated Balance Sheets. Interest expense to affiliated trusts in the Consolidated Statements of Income represents interest expense on these debentures.
NOTE 17. FAIR VALUE
The carrying values of cash and cash equivalents, accounts and notes receivable, accounts payable and short-term borrowings are reasonable estimates of their fair values. Long-term debt (including current portion and material capital leases) and long-term debt to affiliated trusts are reported at carrying value on the Consolidated Balance Sheets.
The fair value hierarchy prioritizes the inputs used to measure fair value. The hierarchy gives the highest priority to unadjusted quoted prices in active markets for identical assets or liabilities (Level 1 measurements) and the lowest priority to fair values derived from unobservable inputs (Level 3 measurements).
The three levels of the fair value hierarchy are defined as follows:
Level 1 – Quoted prices are available in active markets for identical assets or liabilities. Active markets are those in which transactions for the asset or liability occur with sufficient frequency and volume to provide pricing information on an ongoing basis.
Level 2 – Pricing inputs are other than quoted prices in active markets included in Level 1, but which are either directly or indirectly observable as of the reporting date. Level 2 includes those financial instruments that are valued using models or other valuation methodologies. These models are primarily industry-standard models that consider various assumptions, including quoted forward prices for commodities, time value, volatility factors, and current market and contractual prices for the underlying instruments, as well as other relevant economic measures. Substantially all of these assumptions are observable in the marketplace throughout the full term of the instrument, can be derived from observable data or are supported by observable levels at which transactions are executed in the marketplace.
Level 3 – Pricing inputs include significant inputs that are generally unobservable from objective sources. These inputs may be used with internally developed methodologies that result in management’s best estimate of fair value.
Financial assets and liabilities are classified in their entirety based on the lowest level of input that is significant to the fair value measurement. The Company’s assessment of the significance of a particular input to the fair value measurement requires judgment, and may affect the valuation of fair value assets and liabilities and their placement within the fair value hierarchy levels. The determination of the fair values incorporates various factors that not only include the credit standing of the counterparties involved and the impact of credit enhancements (such as cash deposits and letters of credit), but also the impact of Avista Corp.’s nonperformance risk on its liabilities.
The following table sets forth the carrying value and estimated fair value of the Company’s financial instruments not reported at estimated fair value on the Consolidated Balance Sheets as of December 31 (dollars in thousands):
2019 | 2018 | ||||||||||||||
Carrying Value | Estimated Fair Value | Carrying Value | Estimated Fair Value | ||||||||||||
Long-term debt (Level 2) | $ | $ | $ | $ | |||||||||||
Long-term debt (Level 3) | |||||||||||||||
Snettisham capital lease obligation (Level 3) | |||||||||||||||
Long-term debt to affiliated trusts (Level 3) | |||||||||||||||
These estimates of fair value of long-term debt and long-term debt to affiliated trusts were primarily based on available market information, which generally consists of estimated market prices from third party brokers for debt with similar risk and terms. The price ranges obtained from the third party brokers consisted of par values of 80.00 to 134.11 , where a par value of 100.00 represents the carrying value recorded on the Consolidated Balance Sheets. Level 2 long-term debt represents publicly issued bonds with quoted market prices; however, due to their limited trading activity, they are classified as Level 2 because brokers must generate quotes and make estimates using comparable debt with similar risk and terms if there is no trading activity near a period end. Level 3 long-term debt consists of private placement bonds and debt to affiliated trusts, which typically have no secondary trading activity. Fair values in Level 3 are estimated based on market prices from third party brokers using secondary market quotes for debt with similar risk and terms to generate quotes for Avista Corp. bonds. Due to the unique nature of the Snettisham capital lease obligation, the estimated fair value of these items was determined based on a discounted cash flow
model using available market information. The Snettisham capital lease obligation was discounted to present value using the Morgan Markets A Ex-Fin discount rate as published on December 31, 2019.
The following table discloses by level within the fair value hierarchy the Company’s assets and liabilities measured and reported on the Consolidated Balance Sheets as of December 31, 2019 at fair value on a recurring basis (dollars in thousands):
Level 1 | Level 2 | Level 3 | Counterparty and Cash Collateral Netting (1) | Total | |||||||||||||||
December 31, 2019 | |||||||||||||||||||
Assets: | |||||||||||||||||||
Energy commodity derivatives | $ | — | $ | $ | — | $ | ( | ) | $ | ||||||||||
Level 3 energy commodity derivatives: | |||||||||||||||||||
Natural gas exchange agreements | — | — | ( | ) | |||||||||||||||
Foreign currency exchange derivatives | — | — | |||||||||||||||||
Interest rate swap derivatives | — | — | ( | ) | |||||||||||||||
Deferred compensation assets: | |||||||||||||||||||
Mutual Funds: | |||||||||||||||||||
Fixed income securities (2) | — | — | — | ||||||||||||||||
Equity securities (2) | — | — | — | ||||||||||||||||
Total | $ | $ | $ | $ | ( | ) | $ | ||||||||||||
Liabilities: | |||||||||||||||||||
Energy commodity derivatives | $ | — | $ | $ | — | $ | ( | ) | $ | ||||||||||
Level 3 energy commodity derivatives: | |||||||||||||||||||
Natural gas exchange agreement | — | — | ( | ) | |||||||||||||||
Interest rate swap derivatives | — | — | ( | ) | |||||||||||||||
Total | $ | $ | $ | $ | ( | ) | $ | ||||||||||||
The following table discloses by level within the fair value hierarchy the Company’s assets and liabilities measured and reported on the Consolidated Balance Sheets as of December 31, 2018 at fair value on a recurring basis (dollars in thousands):
Level 1 | Level 2 | Level 3 | Counterparty and Cash Collateral Netting (1) | Total | |||||||||||||||
December 31, 2018 | |||||||||||||||||||
Assets: | |||||||||||||||||||
Energy commodity derivatives | $ | — | $ | $ | — | $ | ( | ) | $ | ||||||||||
Level 3 energy commodity derivatives: | |||||||||||||||||||
Natural gas exchange agreement | — | — | ( | ) | |||||||||||||||
Interest rate swap derivatives | — | — | ( | ) | |||||||||||||||
Deferred compensation assets: | |||||||||||||||||||
Mutual Funds: | |||||||||||||||||||
Fixed income securities (2) | — | — | — | ||||||||||||||||
Equity securities (2) | — | — | — | ||||||||||||||||
Total | $ | $ | $ | $ | ( | ) | $ | ||||||||||||
118
Level 1 | Level 2 | Level 3 | Counterparty and Cash Collateral Netting (1) | Total | |||||||||||||||
Liabilities: | |||||||||||||||||||
Energy commodity derivatives | $ | — | $ | $ | — | $ | ( | ) | $ | ||||||||||
Level 3 energy commodity derivatives: | |||||||||||||||||||
Natural gas exchange agreement | — | — | ( | ) | |||||||||||||||
Power exchange agreement | — | — | |||||||||||||||||
Power option agreement | — | — | |||||||||||||||||
Foreign currency exchange derivatives | — | — | |||||||||||||||||
Interest rate swap derivatives | — | — | ( | ) | |||||||||||||||
Total | $ | $ | $ | $ | ( | ) | $ | ||||||||||||
(1) | The Company is permitted to net derivative assets and derivative liabilities with the same counterparty when a legally enforceable master netting agreement exists. In addition, the Company nets derivative assets and derivative liabilities against any payables and receivables for cash collateral held or placed with these same counterparties. |
(2) | These assets are included in other property and investments-net and other non-current assets on the Consolidated Balance Sheets. |
The difference between the amount of derivative assets and liabilities disclosed in respective levels in the table above and the amount of derivative assets and liabilities disclosed on the Consolidated Balance Sheets is due to netting arrangements with certain counterparties. See Note 7 for additional discussion of derivative netting.
To establish fair value for energy commodity derivatives, the Company uses quoted market prices and forward price curves to estimate the fair value of energy commodity derivative instruments included in Level 2. In particular, electric derivative valuations are performed using market quotes, adjusted for periods in between quotable periods. Natural gas derivative valuations are estimated using New York Mercantile Exchange pricing for similar instruments, adjusted for basin differences, using market quotes. Where observable inputs are available for substantially the full term of the contract, the derivative asset or liability is included in Level 2.
To establish fair values for interest rate swap derivatives, the Company uses forward market curves for interest rates for the term of the swaps and discounts the cash flows back to present value using an appropriate discount rate. The discount rate is calculated by third party brokers according to the terms of the swap derivatives and evaluated by the Company for reasonableness, with consideration given to the potential non-performance risk by the Company. Future cash flows of the interest rate swap derivatives are equal to the fixed interest rate in the swap compared to the floating market interest rate multiplied by the notional amount for each period.
To establish fair value for foreign currency derivatives, the Company uses forward market curves for Canadian dollars against the US dollar and multiplies the difference between the locked-in price and the market price by the notional amount of the derivative. Forward foreign currency market curves are provided by third party brokers. The Company's credit spread is factored into the locked-in price of the foreign exchange contracts.
Deferred compensation assets and liabilities represent funds held by the Company in a Rabbi Trust for an executive deferral plan. These funds consist of actively traded equity and bond funds with quoted prices in active markets. The balance disclosed in the table above excludes cash and cash equivalents of $0.4 million as of December 31, 2019 and $0.5 million as of December 31, 2018.
Level 3 Fair Value
Under the power exchange agreement, which expired on June 30, 2019, the Company purchased power at a price that was based on the average operating and maintenance (O&M) charges from three surrogate nuclear power plants around the country. To estimate the fair value of this agreement the Company estimated the difference between the purchase price based on the future O&M charges and forward prices for energy. The Company compared the Level 2 brokered quotes and forward price curves described above to an internally developed forward price which was based on the average O&M charges from the three surrogate nuclear power plants for the current year. The Company estimated the volumes of the transactions that would take place in the future based on historical average transaction volumes per delivery year (November to April). Significant increases or decreases in any of these inputs in isolation would result in a significantly higher or lower fair value measurement.
119
For the natural gas commodity exchange agreement, the Company uses the same Level 2 brokered quotes described above; however, the Company also estimates the purchase and sales volumes (within contractual limits) as well as the timing of those transactions. Changing the timing of volume estimates changes the timing of purchases and sales, impacting which brokered quote is used. Because the brokered quotes can vary significantly from period to period, the unobservable estimates of the timing and volume of transactions can have a significant impact on the calculated fair value. The Company currently estimates volumes and timing of transactions based on a most likely scenario using historical data. Historically, the timing and volume of transactions have not been highly correlated with market prices and market volatility.
The following table presents the quantitative information which was used to estimate the fair values of the Level 3 assets and liabilities above as of December 31, 2019 (dollars in thousands):
Fair Value (Net) at | |||||||||
December 31, 2019 | Valuation Technique | Unobservable Input | Range | ||||||
Natural gas exchange | ( | ) | Internally derived | Forward purchase prices | $1.49 - $2.38/mmBTU | ||||
agreement | weighted-average | Forward sales prices | $1.60 - $3.80/mmBTU | ||||||
cost of gas | Purchase volumes | 50,000 - 310,000 mmBTUs | |||||||
Sales volumes | 60,000 - 310,000 mmBTUs | ||||||||
The following table presents activity for energy commodity derivative assets (liabilities) measured at fair value using significant unobservable inputs (Level 3) for the years ended December 31 (dollars in thousands):
Natural Gas Exchange Agreement | Power Exchange Agreement | Total | |||||||||
Year ended December 31, 2019: | |||||||||||
Balance as of January 1, 2019 | $ | ( | ) | $ | ( | ) | $ | ( | ) | ||
Total gains or (losses) (realized/unrealized): | |||||||||||
Included in regulatory assets/liabilities (1) | |||||||||||
Settlements | ( | ) | ( | ) | |||||||
Ending balance as of December 31, 2019 (2) | $ | ( | ) | $ | $ | ( | ) | ||||
Year ended December 31, 2018: | |||||||||||
Balance as of January 1, 2018 | $ | ( | ) | $ | ( | ) | $ | ( | ) | ||
Total gains or (losses) (realized/unrealized): | |||||||||||
Included in regulatory assets/liabilities (1) | |||||||||||
Settlements | |||||||||||
Ending balance as of December 31, 2018 (2) | $ | ( | ) | $ | ( | ) | $ | ( | ) | ||
Year ended December 31, 2017: | |||||||||||
Balance as of January 1, 2017 | $ | ( | ) | $ | ( | ) | $ | ( | ) | ||
Total gains or (losses) (realized/unrealized): | |||||||||||
Included in regulatory assets/liabilities (1) | ( | ) | ( | ) | |||||||
Settlements | ( | ) | |||||||||
Ending balance as of December 31, 2017 (2) | $ | ( | ) | $ | ( | ) | $ | ( | ) | ||
(1) | All gains and losses are included in other regulatory assets and liabilities. There were no gains and losses included in either net income or other comprehensive income during any of the periods presented in the table above. |
(2) | There were no purchases, issuances or transfers from other categories of any derivatives instruments during the periods presented in the table above. |
120
NOTE 18. COMMON STOCK
The payment of dividends on common stock could be limited by:
• | certain covenants applicable to preferred stock (when outstanding) contained in the Company’s Restated Articles of Incorporation, as amended (currently there are no preferred shares outstanding), |
• | certain covenants applicable to the Company's outstanding long-term debt and committed line of credit agreements, |
• | the hydroelectric licensing requirements of section 10(d) of the FPA (see Note 1), and |
• | certain requirements under the OPUC approval of the AERC acquisition in 2014. The OPUC's AERC acquisition order requires Avista Utilities to maintain a capital structure of no less than |
The requirements of the OPUC approval of the AERC acquisition are the most restrictive. Under the OPUC restriction, the amount available for dividends at December 31, 2019 was limited to $293.9 million.
See the Consolidated Statements of Equity for dividends declared in the years 2019 through 2017.
The Company has 10 million authorized shares of preferred stock. The Company did not have any preferred stock outstanding as of December 31, 2019 and 2018.
Equity Issuances
The Company issued equity in 2019 for total net proceeds of $64.6 million. Most of these issuances came through the Company's four separate sales agency agreements under which the sales agents may offer and sell new shares of common stock from time to time. These agreements provide for the offering of a maximum of 4.6 million shares, of which approximately 3.2 million remain unissued as of December 31, 2019. In 2019, 1.4 million shares were issued under these agreements resulting in total net proceeds of $63.6 million. Subject to the satisfaction of customary conditions (including any required regulatory approvals), the Company has the right to increase the maximum number of shares that may be offered under these agreements. These agreements expire on February 29, 2020. The Company expects to negotiate and enter into new sales agency agreements in the second quarter of 2020.
NOTE 19. ACCUMULATED OTHER COMPREHENSIVE LOSS
Accumulated Other Comprehensive Loss
Accumulated other comprehensive loss, net of tax, consisted of the following as of December 31 (dollars in thousands):
2019 | 2018 | ||||||
Unfunded benefit obligation for pensions and other postretirement benefit plans - net of taxes of $2,727 and $2,091, respectively | $ | $ | |||||
Amounts Reclassified from Accumulated Other Comprehensive Loss | ||||||||||||||
Details about Accumulated Other Comprehensive Loss Components | 2019 | 2018 | 2017 | Affected Line Item in Statement of Income | ||||||||||
Amortization of defined benefit pension items | ||||||||||||||
Amortization of net prior service cost | $ | ( | ) | $ | ( | ) | $ | ( | ) | (a) | ||||
Amortization of net loss | ( | ) | (a) | |||||||||||
Adjustment due to effects of regulation | ( | ) | ( | ) | (a) | |||||||||
( | ) | ( | ) | Total before tax | ||||||||||
( | ) | Tax benefit (expense) | ||||||||||||
$ | ( | ) | $ | $ | ( | ) | Net of tax | |||||||
(a) | These accumulated other comprehensive loss components are included in the computation of net periodic pension cost (see Note 11 for additional details). |
NOTE 20. EARNINGS PER COMMON SHARE ATTRIBUTABLE TO AVISTA CORPORATION SHAREHOLDERS
The following table presents the computation of basic and diluted earnings per common share attributable to Avista Corp. shareholders for the years ended December 31 (in thousands, except per share amounts):
2019 | 2018 | 2017 | |||||||||
Numerator: | |||||||||||
Net income attributable to Avista Corp. shareholders | $ | $ | $ | ||||||||
Denominator: | |||||||||||
Weighted-average number of common shares outstanding-basic | |||||||||||
Effect of dilutive securities: | |||||||||||
Performance and restricted stock awards | |||||||||||
Weighted-average number of common shares outstanding-diluted | |||||||||||
Earnings per common share attributable to Avista Corp. shareholders: | |||||||||||
Basic | $ | $ | $ | ||||||||
Diluted | $ | $ | $ | ||||||||
There were no shares excluded from the calculation because they were antidilutive.
NOTE 21. COMMITMENTS AND CONTINGENCIES
In the course of its business, the Company becomes involved in various claims, controversies, disputes and other contingent matters, including the items described in this Note. Some of these claims, controversies, disputes and other contingent matters involve litigation or other contested proceedings. For all such matters, the Company intends to vigorously protect and defend its interests and pursue its rights. However, no assurance can be given as to the ultimate outcome of any particular matter because litigation and other contested proceedings are inherently subject to numerous uncertainties. For matters that affect Avista Utilities’ or AEL&P's operations, the Company intends to seek, to the extent appropriate, recovery of incurred costs through the ratemaking process.
Collective Bargaining Agreements
The Company’s collective bargaining agreements with the IBEW represent approximately 45 percent of all of Avista Utilities’ employees. A three-year agreement with the local union in Washington and Idaho representing the majority (approximately 90 percent) of the Avista Utilities' bargaining unit employees will expire in March 2021. A three-year agreement in Oregon, which covers approximately 50 employees will also expire on April 1, 2020.
The Company is in the process of negotiating new agreements with each of these represented bargaining units. However, there is a risk that if collective bargaining agreements expire and new agreements are not reached in each of our jurisdictions, employees could strike. Given the magnitude of employees that are covered by collective bargaining agreements, this could result in disruptions to our operations. However, the Company believes that the possibility of this occurring is remote.
Legal Proceedings Related to the Terminated Acquisition by Hydro One
See Note 24 for information regarding the termination of the proposed acquisition of the Company by Hydro One.
In connection with the now terminated acquisition, three lawsuits were filed in the United States District Court for the Eastern District of Washington and were subsequently voluntarily dismissed by the plaintiffs.
One lawsuit was filed in the Superior Court for the State of Washington in and for Spokane County, captioned as follows:
• | Fink v. Morris, et al., No. 17203616-6 (filed September 15, 2017, amended complaint filed October 25, 2017). |
The complaint generally alleged that the members of the Board of Directors of Avista Corp. breached their fiduciary duties by, among other things, conducting an allegedly inadequate sale process and agreeing to the acquisition at a price that allegedly undervalued Avista Corporation, and that Hydro One Limited, Olympus Holding Corp., and Olympus Corp. aided and abetted those purported breaches of duty. The complaint sought various remedies, including monetary damages, attorneys’ fees and expenses. Subsequent to the termination of the proposed acquisition in January 2019, the complaint was voluntarily dismissed by the plaintiffs.
121
2015 Washington General Rate Cases
In January 2016, the Company received an order (Order 05) that concluded its electric and natural gas general rate cases that were originally filed with the WUTC in February 2015. New electric and natural gas rates were effective on January 11, 2016.
WUTC Order Denying Industrial Customers of Northwest Utilities / Public Counsel Joint Motion for Clarification, WUTC Staff Motion to Reconsider and WUTC Staff Motion to Reopen Record
In January 2016, the Industrial Customers of Northwest Utilities, the Public Counsel Unit of the Washington State Office of the Attorney General (PC) and the WUTC Staff, which is a separate party in the general rate case proceedings from the WUTC Advisory Staff, filed Motions for Clarification requesting the WUTC to clarify their attrition adjustment and the end result electric revenue amounts. The Motions for Clarification suggested that the electric revenue decrease should have been significantly larger than what was included in Order 05.
In February 2016, the WUTC issued an order (Order 06) denying the Motions summarized above and affirming Order 05, including an $8.1 million decrease in electric base revenue.
PC Petition for Judicial Review
In March 2016, PC filed in Thurston County Superior Court a Petition for Judicial Review of the WUTC's Order 05 and Order 06 described above. In April 2016, this matter was certified for review directly by the Court of Appeals, an intermediate appellate court in the State of Washington.
On August 7, 2018, the Court of Appeals issued a "Published Opinion" (Opinion) which concluded that the WUTC's use of an attrition allowance to calculate Avista Corp.'s rate base violated Washington law. In the Opinion, the Court stated that because the projected additions to rate base in the future were not "used and useful" for service at the time the request for the rate increase was made, they may not lawfully be included in the Company's rate base to justify a rate increase. Accordingly, the Court concluded that the WUTC erred in including an attrition allowance in the calculation of Avista Corp.’s electric and natural gas rate base. The Court noted, however, that the law does not prohibit an attrition allowance in the calculation, for ratemaking purposes, of recoverable operating and maintenance expense. Since the WUTC order provided one lump sum attrition allowance without distinguishing what portion was for rate base and which was for operating and maintenance expenses or other considerations, the Court struck all portions of the attrition allowance attributable to Avista Corp.'s rate base and reversed and remanded the case for the WUTC to recalculate Avista Corp.’s rates without including an attrition allowance in the calculation of rate base. On October 1, 2018, the Court of Appeals terminated its review of this case, remanding it back to the Thurston County Superior Court.
During 2019, other parties in the case filed testimony and based on the testimony filed (including Avista Corp.'s testimony) the Company believes the range for a refund to customers is approximately $3.6 million to approximately $77.0 million. The other parties justified the proposed refund by claiming that the rates in question were in effect from 2016 to April 2018 as opposed to the 11 months argued by Avista Corp. Further, the parties asserted that the WUTC should, directly or indirectly, correct what they believe is a power supply calculation error (approximately $20.0 million), an issue that the WUTC already addressed and which the Company believes the Courts did not remand back to the WUTC for further process. While not its primary recommendation for a refund, the WUTC Staff included an alternative refund methodology in its testimony, which Avista Corp. calculates as calling for a refund of $3.6 million, if limited to the 11 month period and if other adjustments are made. While the Company does not agree as a legal matter with the positions of the other parties to the case, as a practical matter the Company believes that it is probable that it will refund some amount to customers. As such, as of December 31, 2019, the Company recorded a refund liability of $3.6 million, which represents the low-end of the range, as we cannot predict an outcome of this case.
Boyds Fire (State of Washington Department of Natural Resources v. Avista)
On August 19, 2019, the Company was served with a complaint filed by the State of Washington Department of Natural Resources, seeking recovery of fire suppression costs and related expenses incurred in connection with a wildfire that occurred in Ferry County, Washington in August 2018. Specifically, the complaint alleges that the fire, which became known as the “Boyds Fire,” was caused by a dead ponderosa pine tree falling into an overhead distribution line, and that Avista Corp. was negligent in failing to identify and remove it before the tree came into contact with the line. Avista Corp. disputes that the tree in question was the cause of the fire, and that it was negligent in failing to identify and remove it. The case is in the early stages of discovery and the plaintiff has not yet provided a statement specifying damages. Because the resolution of this claim remains uncertain, legal counsel cannot express an opinion on the extent, if any, of the Company’s liability, nor is it possible for the Company to estimate the impact of any outcome at this time. The Company intends to vigorously defend itself in the litigation.
122
Other Contingencies
In the normal course of business, the Company has various other legal claims and contingent matters outstanding. The Company believes that any ultimate liability arising from these actions will not have a material impact on its financial condition, results of operations or cash flows. It is possible that a change could occur in the Company’s estimates of the probability or amount of a liability being incurred. Such a change, should it occur, could be significant.
The Company routinely assesses, based on studies, expert analysis and legal reviews, its contingencies, obligations and commitments for remediation of contaminated sites, including assessments of ranges and probabilities of recoveries from other responsible parties who either have or have not agreed to a settlement as well as recoveries from insurance carriers. The Company’s policy is to accrue and charge to current expense identified exposures related to environmental remediation sites based on estimates of investigation, cleanup and monitoring costs to be incurred. For matters that affect Avista Utilities’ or AEL&P's operations, the Company seeks, to the extent appropriate, recovery of incurred costs through the ratemaking process.
The Company has potential liabilities under the Endangered Species Act for species of fish, plants and wildlife that have either already been added to the endangered species list, listed as “threatened” or petitioned for listing. Thus far, measures adopted and implemented have had minimal impact on the Company. However, the Company will continue to seek recovery, through the ratemaking process, of all operating and capitalized costs related to these issues.
Under the federal licenses for its hydroelectric projects, the Company is obligated to protect its property rights, including water rights. In addition, the Company holds additional non-hydro water rights. The State of Montana is examining the status of all water right claims within state boundaries through a general adjudication. Claims within the Clark Fork River basin could adversely affect the energy production of the Company’s Cabinet Gorge and Noxon Rapids hydroelectric facilities. The state of Idaho has initiated adjudication in northern Idaho, which will ultimately include the lower Clark Fork River, the Spokane River and the Coeur d’Alene basin. The Company is and will continue to be a participant in these and any other relevant adjudication processes. The complexity of such adjudications makes each unlikely to be concluded in the foreseeable future. As such, it is not possible for the Company to estimate the impact of any outcome at this time. The Company will continue to seek recovery, through the ratemaking process, of all operating and capitalized costs related to this issue.
NOTE 22. REGULATORY MATTERS
Regulatory Assets and Liabilities
The following table presents the Company’s regulatory assets and liabilities as of December 31, 2019 (dollars in thousands):
Receiving Regulatory Treatment | 2019 | 2018 | ||||||||||||||||||||||||||||
Remaining Amortization Period | (1) Earning A Return | Not Earning A Return | (2) Expected Recovery or Refund | Current | Non-current | Current | Non-current | |||||||||||||||||||||||
Regulatory Assets: | ||||||||||||||||||||||||||||||
Deferred income tax | (3 | ) | $ | $ | $ | $ | $ | $ | $ | |||||||||||||||||||||
Pensions and other postretirement benefit plans | (4 | ) | ||||||||||||||||||||||||||||
Energy commodity derivatives | (5 | ) | ||||||||||||||||||||||||||||
Unamortized debt repurchase costs | (6 | ) | ||||||||||||||||||||||||||||
Settlement with Coeur d’Alene Tribe | 2059 | |||||||||||||||||||||||||||||
Demand side management programs | (3 | ) | ||||||||||||||||||||||||||||
Decoupling surcharge | 2021 | |||||||||||||||||||||||||||||
Utility plant to be abandoned | (7 | ) | ||||||||||||||||||||||||||||
Interest rate swaps | (8 | ) | ||||||||||||||||||||||||||||
AFUDC above FERC allowed rate | (11 | ) | ||||||||||||||||||||||||||||
Other regulatory assets | (3 | ) | ||||||||||||||||||||||||||||
123
Receiving Regulatory Treatment | 2019 | 2018 | ||||||||||||||||||||||||||||
Remaining Amortization Period | (1) Earning A Return | Not Earning A Return | (2) Expected Recovery or Refund | Current | Non-current | Current | Non-current | |||||||||||||||||||||||
Total regulatory assets | $ | $ | $ | $ | $ | $ | $ | |||||||||||||||||||||||
Regulatory Liabilities: | ||||||||||||||||||||||||||||||
Deferred natural gas costs | (3 | ) | $ | $ | $ | $ | $ | $ | $ | |||||||||||||||||||||
Deferred power costs | (3 | ) | ||||||||||||||||||||||||||||
Utility plant retirement costs | (9 | ) | ||||||||||||||||||||||||||||
Income tax related liabilities | (3) (10) | |||||||||||||||||||||||||||||
Interest rate swaps | (8 | ) | ||||||||||||||||||||||||||||
Decoupling rebate | 2021 | |||||||||||||||||||||||||||||
Other regulatory liabilities | (3 | ) | ||||||||||||||||||||||||||||
Total regulatory liabilities | $ | $ | $ | $ | $ | $ | $ | |||||||||||||||||||||||
(1) | Earning a return includes either interest on the regulatory asset/liability or a return on the investment as a component of rate base at the allowed rate of return. |
(2) | Expected recovery is pending regulatory treatment including regulatory assets and liabilities with prior regulatory precedence. |
(3) | Remaining amortization period varies depending on timing of underlying transactions. |
(4) | As the Company has historically recovered and currently recovers its pension and other postretirement benefit costs related to its regulated operations in retail rates, the Company records a regulatory asset for that portion of its pension and other postretirement benefit funding deficiency. |
(5) | The WUTC and the IPUC issued accounting orders authorizing Avista Corp. to offset energy commodity derivative assets or liabilities with a regulatory asset or liability. This accounting treatment is intended to defer the recognition of mark-to-market gains and losses on energy commodity transactions until the period of delivery. Realized benefits and losses result in adjustments to retail rates through PGAs, the ERM in Washington, the PCA mechanism in Idaho, and periodic general rates cases. The resulting regulatory assets associated with energy commodity derivative instruments have been concluded to be probable of recovery through future rates. |
(6) | For the Company’s Washington jurisdiction and for any debt repurchases beginning in 2007 in all jurisdictions, premiums paid to repurchase debt are amortized over the remaining life of the original debt that was repurchased or, if new debt is issued in connection with the repurchase, these costs are amortized over the life of the new debt. In the Company’s other regulatory jurisdictions, premiums paid to repurchase debt prior to 2007 are being amortized over the average remaining maturity of outstanding debt when no new debt was issued in connection with the debt repurchase. These costs are recovered through retail rates as a component of interest expense. |
(7) | In March 2016, the WUTC granted the Company's Petition for an Accounting Order to defer and include in a regulatory asset the undepreciated value of its existing Washington electric meters for the opportunity for later recovery. This accounting treatment is related to the Company's plan to replace approximately 253,000 of its existing electric meters with new two-way digital meters and the related software and support services through its AMI project in Washington State. In September 2017, the WUTC also approved the Company's request to defer the undepreciated net book value of existing natural gas ERTs (consistent with the accounting treatment for the electric meters) that will be retired as part of the AMI project. Replacement of the meters and natural gas ERTs began in the second half of 2018. The other piece of abandoned plant, relates to the Company's decision to replace a three-phase transformer at one of its generating facilities with three separate single-phase transformers. The Company expects to receive full recovery of the cost of the three-phase transformer; therefore, it has recorded the remaining net book value as a regulatory asset. |
(8) | For interest rate swap derivatives, Avista Corp. records all mark-to-market gains and losses in each accounting period as assets and liabilities, as well as offsetting regulatory assets and liabilities, such that there is no income statement impact. The interest rate swap derivatives are risk management tools similar to energy commodity derivatives. Upon settlement of interest rate swap derivatives, the regulatory asset or liability is amortized as a component of interest expense over the term of the associated debt. The Company records an offset of interest rate swap derivative assets and liabilities with regulatory assets and liabilities, based on the prior practice of the commissions to provide recovery |
124
through the ratemaking process. Settled interest rate swap derivatives which have been through a general rate case proceeding are classified as earning a return in the table above, whereas all unsettled interest rate swap derivatives and settled interest rate swap derivatives which have not been included in a general rate case are classified as expected recovery.
(9) | This amount is dependent upon the cost of removal of underlying utility plant assets and the life of utility plant. |
(10) | The amount pending recovery represents amounts due back to customers and resulted from the TCJA, which changed the federal income tax rate from 35 percent to 21 percent. The Company revalued all deferred income taxes as of December 31, 2017. The Company expects the amounts for utility plant items for Avista Utilities to be returned to customers over a period of approximately |
(11) | See Note 1 for a description of a reclassification associated with this regulatory asset, which is being amortized based on the underlying utility plant assets and the life of utility plant. |
Deferred power supply costs are recorded as a deferred charge or liability on the Consolidated Balance Sheets for future prudence review and recovery or rebate through retail rates. The power supply costs deferred include certain differences between actual net power supply costs incurred by Avista Utilities and the costs included in base retail rates. This difference in net power supply costs primarily results from changes in:
• | short-term wholesale market prices and sales and purchase volumes, |
• | the level, availability and optimization of hydroelectric generation, |
• | the level and availability of thermal generation (including changes in fuel prices), |
• | retail loads, and |
• | sales of surplus transmission capacity. |
In Washington, the ERM allows Avista Utilities to periodically increase or decrease electric rates with WUTC approval to reflect changes in power supply costs. The ERM is an accounting method used to track certain differences between actual power supply costs, net of wholesale sales and sales of fuel, and the amount included in base retail rates for Washington customers and defer these differences (over the $4.0 million deadband and sharing bands) for future surcharge or rebate to customers. For 2019, the Company recognized a pre-tax benefit of $4.4 million under the ERM in Washington compared to a benefit of $6.1 million for 2018. Total net deferred power costs under the ERM were a liability of $37.0 million as of December 31, 2019 and a liability of $34.4 million as of December 31, 2018. These deferred power cost balances represent amounts due to customers. Pursuant to WUTC requirements, should the cumulative deferral balance exceed $30 million in the rebate or surcharge direction, the Company must make a filing with the WUTC to adjust customer rates to either return the balance to customers or recover the balance from customers. Avista Utilities makes an annual filing on, or before, April 1 of each year to provide the opportunity for the WUTC staff and other interested parties to review the prudence of, and audit, the ERM deferred power cost transactions for the prior calendar year.
The cumulative rebate balance exceeds $30 million and as a result, the Company's 2019 filing contained a proposed rate refund, effective July 1, 2019 over a three-year period. Subsequent to this filing, the ERM matter has been moved to a separate docket and the Company expects resolution to this matter in the first half of 2020. The parties to the ERM docket have agreed to rebate the ERM over a two-year period.
Avista Utilities has a PCA mechanism in Idaho that allows it to modify electric rates on October 1 of each year with IPUC approval. Under the PCA mechanism, Avista Utilities defers 90 percent of the difference between certain actual net power supply expenses and the amount included in base retail rates for its Idaho customers. The October 1 rate adjustments recover or rebate power costs deferred during the preceding July-June twelve-month period. Total net power supply costs deferred under the PCA mechanism were an asset of $0.3 million as of December 31, 2019 and a liability of $7.6 million as of December 31, 2018. Deferred power cost assets represent amounts due from customers and liabilities represent amounts due to customers.
125
Natural Gas Cost Deferrals and Recovery Mechanisms
Avista Utilities files a PGA in all three states it serves to adjust natural gas rates for: 1) estimated commodity and pipeline transportation costs to serve natural gas customers for the coming year, and 2) the difference between actual and estimated commodity and transportation costs for the prior year. Total net deferred natural gas costs to be refunded to customers were a liability of $3.2 million as of December 31, 2019 and a liability of $40.7 million as of December 31, 2018. These balances represent amounts due to customers.
Decoupling and Earnings Sharing Mechanisms
Decoupling (also known as an FCA in Idaho) is a mechanism designed to sever the link between a utility's revenues and consumers' energy usage. In each of Avista Utilities' jurisdictions, Avista Utilities' electric and natural gas revenues are adjusted so as to be based on the number of customers in certain customer rate classes and assumed "normal" kilowatt hour and therm sales, rather than being based on actual kilowatt hour and therm sales. The difference between revenues based on the number of customers and "normal" sales and revenues based on actual usage is deferred and either surcharged or rebated to customers beginning in the following year. Only residential and certain commercial customer classes are included in decoupling mechanisms.
Washington Decoupling and Earnings Sharing
In Washington, the WUTC approved the Company's decoupling mechanisms for electric and natural gas for a five-year period beginning January 1, 2015. In February 2019, the WUTC approved an all-party agreement that extends the life of the mechanisms through the end of the Company's next general rate case, or April 1, 2020, whichever comes first. In the Company's 2019 Washington general rate cases Avista Corp. has requested an extension of the mechanisms for an additional five-year term. Public Counsel is contesting the continuation of the decoupling mechanisms. Electric and natural gas decoupling surcharge rate adjustments to customers are limited to a 3 percent increase on an annual basis, with any remaining surcharge balance carried forward for recovery in a future period. There is no limit on the level of rebate rate adjustments.
The decoupling mechanisms each include an after-the-fact earnings test. At the end of each calendar year, separate electric and natural gas earnings calculations are made for the calendar year just ended. These earnings tests reflect actual decoupled revenues, normalized power supply costs and other normalizing adjustments. If the Company earns more than its authorized ROR in Washington, 50 percent of excess earnings are rebated to customers through adjustments to decoupling surcharge or rebate balances. See below for a summary of cumulative balances under the decoupling and earnings sharing mechanisms.
Idaho FCA and Earnings Sharing Mechanisms
In Idaho, the IPUC approved the implementation of FCAs for electric and natural gas (similar in operation and effect to the Washington decoupling mechanisms) for an initial term of three years, beginning January 1, 2016. During the first quarter of 2018, the FCA in Idaho was extended for a one-year term through December 31, 2019. On December 13, 2019, the IPUC approved an extension of the FCAs through March 31, 2025.
Oregon Decoupling Mechanism
In February 2016, the OPUC approved the implementation of a decoupling mechanism for natural gas, similar to the Washington and Idaho mechanisms described above. The decoupling mechanism became effective on March 1, 2016. There will be an opportunity for interested parties to review the mechanism and recommend changes, if any, by September 2019. Changes related to deferral interest rates were recommended by the parties in Avista Corp.'s 2019 general rate case and were implemented effective January 15, 2020. In Oregon, an earnings review is conducted on an annual basis. In the annual earnings review, if the Company earns more than 100 basis points above its allowed ROE, one-third of the earnings above the 100 basis points would be deferred and later returned to customers. The earnings review is separate from the decoupling mechanism and was in place prior to decoupling. See below for a summary of cumulative balances under the decoupling and earnings sharing mechanisms.
126
Cumulative Decoupling and Earnings Sharing Mechanism Balances
As of December 31, 2019 and December 31, 2018, the Company had the following cumulative balances outstanding related to decoupling and earnings sharing mechanisms in its various jurisdictions (dollars in thousands):
December 31, | December 31, | ||||||
2019 | 2018 | ||||||
Washington | |||||||
Decoupling surcharge | $ | $ | |||||
Provision for earnings sharing rebate | ( | ) | |||||
Idaho | |||||||
Decoupling surcharge | $ | $ | |||||
Provision for earnings sharing rebate | ( | ) | ( | ) | |||
Oregon | |||||||
Decoupling rebate | $ | ( | ) | $ | ( | ) | |
Provision for earnings sharing rebate | |||||||
NOTE 23. INFORMATION BY BUSINESS SEGMENTS
The business segment presentation reflects the basis used by the Company's management to analyze performance and determine the allocation of resources. The Company's management evaluates performance based on income (loss) from operations before income taxes as well as net income (loss) attributable to Avista Corp. shareholders. The accounting policies of the segments are the same as those described in the summary of significant accounting policies. Avista Utilities' business is managed based on the total regulated utility operation; therefore, it is considered one segment. AEL&P is a separate reportable business segment as it has separate financial reports that are reviewed in detail by the Chief Operating Decision Maker and its operations and risks are sufficiently different from Avista Utilities and the other businesses at AERC that it cannot be aggregated with any other operating segments. The Other category, which is not a reportable segment, includes other investments and operations of various subsidiaries, as well as certain other operations of Avista Capital.
127
The following table presents information for each of the Company’s business segments (dollars in thousands):
Avista Utilities | Alaska Electric Light and Power Company | Total Utility | Other | Intersegment Eliminations (1) | Total | ||||||||||||||||||
For the year ended December 31, 2019: | |||||||||||||||||||||||
Operating revenues | $ | $ | $ | $ | $ | $ | |||||||||||||||||
Resource costs | ( | ) | |||||||||||||||||||||
Other operating expenses (2) | |||||||||||||||||||||||
Depreciation and amortization | |||||||||||||||||||||||
Income (loss) from operations | ( | ) | |||||||||||||||||||||
Interest expense (3) | ( | ) | |||||||||||||||||||||
Income taxes | |||||||||||||||||||||||
Net income from continuing operations attributable to Avista Corp. shareholders | |||||||||||||||||||||||
Capital expenditures (4) | |||||||||||||||||||||||
For the year ended December 31, 2018: | |||||||||||||||||||||||
Operating revenues | $ | $ | $ | $ | $ | $ | |||||||||||||||||
Resource costs | |||||||||||||||||||||||
Other operating expenses (2) | |||||||||||||||||||||||
Depreciation and amortization | |||||||||||||||||||||||
Income (loss) from operations | ( | ) | |||||||||||||||||||||
Interest expense (3) | ( | ) | |||||||||||||||||||||
Income taxes | ( | ) | |||||||||||||||||||||
Net income (loss) from continuing operations attributable to Avista Corp. shareholders | ( | ) | |||||||||||||||||||||
Capital expenditures (4) | |||||||||||||||||||||||
For the year ended December 31, 2017: | |||||||||||||||||||||||
Operating revenues | $ | $ | $ | $ | $ | $ | |||||||||||||||||
Resource costs | |||||||||||||||||||||||
Other operating expenses (2)(5) | |||||||||||||||||||||||
Depreciation and amortization | |||||||||||||||||||||||
Income (loss) from operations (5) | ( | ) | |||||||||||||||||||||
Interest expense (3) | ( | ) | |||||||||||||||||||||
Income taxes | ( | ) | |||||||||||||||||||||
Net income (loss) from continuing operations attributable to Avista Corp. shareholders | ( | ) | |||||||||||||||||||||
Capital expenditures (4) | |||||||||||||||||||||||
Total Assets: | |||||||||||||||||||||||
As of December 31, 2019 | $ | $ | $ | $ | $ | ( | ) | $ | |||||||||||||||
As of December 31, 2018 | $ | $ | $ | $ | $ | ( | ) | $ | |||||||||||||||
As of December 31, 2017 | $ | $ | $ | $ | $ | ( | ) | $ | |||||||||||||||
(1) | Intersegment eliminations reported as interest expense represent intercompany interest. Intersegment eliminations reported as assets represent intersegment accounts receivable. |
(2) | Other operating expenses for Avista Utilities for 2019, 2018 and 2017 include merger transaction costs which are separately disclosed on the Consolidated Statements of Income. |
(3) | Including interest expense to affiliated trusts. |
128
(4) | The capital expenditures for the other businesses are included in other investing activities on the Consolidated Statements of Cash Flows. |
(5) | Effective January 1, 2018, the Company adopted ASU No. 2017-07, which resulted in a $ |
NOTE 24. TERMINATION OF PROPOSED ACQUISITION BY HYDRO ONE
On July 19, 2017, Avista Corp. entered into a Merger Agreement that provided for Avista Corp. to become an indirect, wholly-owned subsidiary of Hydro One, subject to the satisfaction or waiver of specified closing conditions, including approval by regulatory agencies. Hydro One, based in Toronto, is Ontario’s largest electricity transmission and distribution provider.
Termination of the Merger Agreement
Due to the denial of the proposed merger by certain of the Company's regulatory commissions, on January 23, 2019, Avista Corp., Hydro One and certain subsidiaries thereof, entered into a Termination Agreement indicating their mutual agreement to terminate the Merger Agreement, effective immediately. Pursuant to the terms of the Termination Agreement, Hydro One paid Avista Corp. a $103 million termination fee on January 24, 2019. The termination fee was used for reimbursing the Company's transaction costs incurred from 2017 to 2019. The balance of the termination fee remaining after payment of 2019 transaction costs and applicable income taxes was used for general corporate purposes and reduced the Company's need for external financing. The 2019 costs totaled $19.7 million pre-tax and included financial advisers' fees, legal fees, consulting fees and employee time.
Other Information Related to the Terminated Acquisition
Due to the termination of the acquisition, all the financial commitments that were included in the various settlement agreements with the commissions for the proposed acquisition will not be required to be performed or observed.
The Company incurred significant transaction costs consisting primarily of consulting, banking fees, legal fees and employee time, and these costs are not being passed through to customers. When the Company was assuming the transaction was going to be completed, a significant portion of these costs were not deductible for income tax purposes. Now that the transaction has been terminated, more of the previously incurred transaction costs are deductible so it has recorded additional tax benefits from these costs in 2019.
See Note 21 for discussion of shareholder lawsuits filed against the Company, the Company’s directors, Hydro One, Olympus Holding Corp., and Olympus Corp. in relation to the Merger Agreement and the proposed acquisition.
NOTE 25. SALE OF METALfx
In April 2019, Bay Area Manufacturing, Inc., a non-regulated subsidiary of Avista Corp., entered into a definitive agreement to sell its interest in METALfx to an independent third party. The transaction was a stock sale for a total cash purchase price of $17.5 million, plus cash on-hand, subject to customary closing adjustments. The transaction closed on April 18, 2019, and as of that date the Company has no further involvement with METALfx.
The purchase price of $17.5 million, as adjusted, was divided among the security holders of METALfx, including the minority shareholder, pro-rata based on ownership (Avista Corp. owned 89.2 percent of the equity of METALfx). As required under the purchase agreement, $1.2 million (7 percent of the purchase price) will be held in escrow for 24 months from the closing of the transaction to satisfy certain indemnification obligations.
When all escrow amounts are released, the sales transaction is expected to provide cash proceeds to Avista Corp., net of payments to the minority holder, contractually obligated compensation payments and other transaction expenses, of $16.5 million and result in a net gain after-tax of $3.3 million. The Company expects to receive the full amount of its portion of the escrow accounts; therefore, the full amounts are included in the gain calculation. The gross gain is included in "Other income," the transaction expenses paid are included in "Non-utility Other operating expenses" and any taxes associated with the sale are included in "Income tax expense" on the Consolidated Statements of Income.
Prior to the completion of the sales transaction, METALfx was not a reportable business segment and was included in other in the business segment footnote at Note 23. This transaction does not meet the criteria for discontinued operations as it does not represent a strategic shift that will have a major effect on the Company's ongoing operations,
NOTE 26. SELECTED QUARTERLY FINANCIAL DATA (Unaudited)
The Company’s energy operations are significantly affected by weather conditions. Consequently, there can be large variances in revenues, expenses and net income between quarters based on seasonal factors such as, but not limited to, temperatures and streamflow conditions, including the impact on electric and natural gas commodity prices.
129
A summary of quarterly operations (in thousands, except per share amounts) for 2019 and 2018 follows:
Three Months Ended | |||||||||||||||
March 31 | June 30 | September 30 | December 31 | ||||||||||||
2019 | |||||||||||||||
Operating revenues | $ | $ | $ | $ | |||||||||||
Operating expenses | |||||||||||||||
Income from operations | $ | $ | $ | $ | |||||||||||
Net income | |||||||||||||||
Less: Net income (loss) attributable to noncontrolling interests | ( | ) | |||||||||||||
Net income attributable to Avista Corporation | $ | $ | $ | $ | |||||||||||
Outstanding common stock: | |||||||||||||||
Weighted average, basic | |||||||||||||||
Weighted average, diluted | |||||||||||||||
Earnings per common share attributable to Avista Corp. shareholders, diluted | $ | $ | $ | $ | |||||||||||
Three Months Ended | |||||||||||||||
March 31 | June 30 | September 30 | December 31 | ||||||||||||
2018 | |||||||||||||||
Operating revenues | $ | $ | $ | $ | |||||||||||
Operating expenses | |||||||||||||||
Income from operations | $ | $ | $ | $ | |||||||||||
Net income | |||||||||||||||
Less: Net loss attributable to noncontrolling interests | ( | ) | ( | ) | ( | ) | ( | ) | |||||||
Net income attributable to Avista Corporation | $ | $ | $ | $ | |||||||||||
Outstanding common stock: | |||||||||||||||
Weighted average, basic | |||||||||||||||
Weighted average, diluted | |||||||||||||||
Earnings per common share attributable to Avista Corp. shareholders, diluted | $ | $ | $ | $ | |||||||||||
Item 9. Changes in and Disagreements with Accountants on Accounting and Financial Disclosure
Not applicable.
Item 9A. Controls and Procedures
Conclusion Regarding the Effectiveness of Disclosure Controls and Procedures
The Company has disclosure controls and procedures (as defined in Rules 13a-15(e) and 15d-15(e) under the Securities Exchange Act of 1934, as amended (Act) that are designed to ensure that information required to be disclosed in the reports it files or submits under the Act is recorded, processed, summarized and reported on a timely basis. Disclosure controls and procedures include, without limitation, controls and procedures designed to ensure that information required to be disclosed by the Company in the reports that it files or submits under the Act is accumulated and communicated to the Company’s management, including its principal executive and principal financial officers, as appropriate, to allow timely decisions regarding required disclosure. With the participation of the Company’s principal executive officer and principal financial officer, the Company's management evaluated its disclosure controls and procedures as of the end of the period covered by this report. There are inherent limitations to the effectiveness of any system of disclosure controls and procedures, including the possibility of human error and the circumvention or overriding of the controls and procedures. Accordingly, even effective disclosure controls and procedures can only provide reasonable assurance of achieving their control objectives. Based upon this evaluation, the Company’s principal executive officer and principal financial officer have concluded that the Company’s disclosure controls and procedures are effective at a reasonable assurance level as of December 31, 2019.
130
Management’s Report on Internal Control Over Financial Reporting
The Company’s management, together with its consolidated subsidiaries, is responsible for establishing and maintaining adequate internal control over financial reporting (as defined in Rule 13a-15(f) under the Securities Exchange Act of 1934). The Company’s internal control over financial reporting is a process designed under the supervision of the Company’s principal executive officer and principal financial officer to provide reasonable assurance regarding the reliability of financial reporting and the preparation of the Company’s financial statements for external reporting purposes in accordance with accounting principles generally accepted in the United States of America.
The Company’s internal control over financial reporting includes policies and procedures that pertain to the maintenance of records that, in reasonable detail, accurately and fairly reflect transactions and dispositions of assets; provide reasonable assurances that transactions are recorded as necessary to permit preparation of financial statements in accordance with accounting principles generally accepted in the United States of America, and that receipts and expenditures are being made only in accordance with authorizations of management and the directors of the Company; and provide reasonable assurance regarding prevention or timely detection of unauthorized acquisition, use or disposition of the Company’s assets that could have a material effect on the Company’s financial statements.
Under the supervision and with the participation of the Company’s management, including the Company’s principal executive officer and principal financial officer, the Company conducted an assessment of the effectiveness of the Company’s internal control over financial reporting based on the framework established in Internal Control-Integrated Framework (2013) issued by the Committee of Sponsoring Organizations of the Treadway Commission. Based on this assessment, management determined that the Company’s internal control over financial reporting as of December 31, 2019 is effective at a reasonable assurance level.
The Company’s independent registered public accounting firm, Deloitte & Touche LLP, has issued an attestation report on the Company’s internal control over financial reporting as of December 31, 2019.
Changes in Internal Control Over Financial Reporting
There have been no changes in the Company’s internal control over financial reporting that occurred during the Company’s last fiscal quarter that has materially affected, or is reasonably likely to materially affect, the Company’s internal control over financial reporting.
131
REPORT OF INDEPENDENT REGISTERED PUBLIC ACCOUNTING FIRM
To the shareholders and the Board of Directors of Avista Corporation
Opinion on Internal Control over Financial Reporting
We have audited the internal control over financial reporting of Avista Corporation and subsidiaries (the “Company”) as of December 31, 2019, based on criteria established in Internal Control - Integrated Framework (2013) issued by the Committee of Sponsoring Organizations of the Treadway Commission (COSO). In our opinion, the Company maintained, in all material respects, effective internal control over financial reporting as of December 31, 2019, based on criteria established in Internal Control - Integrated Framework (2013) issued by COSO.
We have also audited, in accordance with the standards of the Public Company Accounting Oversight Board (United States) (PCAOB), the consolidated financial statements as of and for the year ended December 31, 2019, of the Company and our report dated February 25, 2020, expressed an unqualified opinion on those financial statements.
Basis for Opinion
The Company’s management is responsible for maintaining effective internal control over financial reporting and for its assessment of the effectiveness of internal control over financial reporting, included in the accompanying Management’s Report on Internal Control Over Financial Reporting. Our responsibility is to express an opinion on the Company’s internal control over financial reporting based on our audit. We are a public accounting firm registered with the PCAOB and are required to be independent with respect to the Company in accordance with the U.S. federal securities laws and the applicable rules and regulations of the Securities and Exchange Commission and the PCAOB.
We conducted our audit in accordance with the standards of the PCAOB. Those standards require that we plan and perform the audit to obtain reasonable assurance about whether effective internal control over financial reporting was maintained in all material respects. Our audit included obtaining an understanding of internal control over financial reporting, assessing the risk that a material weakness exists, testing and evaluating the design and operating effectiveness of internal control based on the assessed risk, and performing such other procedures as we considered necessary in the circumstances. We believe that our audit provides a reasonable basis for our opinion.
Definition and Limitations of Internal Control over Financial Reporting
A company’s internal control over financial reporting is a process designed to provide reasonable assurance regarding the reliability of financial reporting and the preparation of financial statements for external purposes in accordance with generally accepted accounting principles. A company’s internal control over financial reporting includes those policies and procedures that (1) pertain to the maintenance of records that, in reasonable detail, accurately and fairly reflect the transactions and dispositions of the assets of the company; (2) provide reasonable assurance that transactions are recorded as necessary to permit preparation of financial statements in accordance with generally accepted accounting principles, and that receipts and expenditures of the company are being made only in accordance with authorizations of management and directors of the company; and (3) provide reasonable assurance regarding prevention or timely detection of unauthorized acquisition, use, or disposition of the company’s assets that could have a material effect on the financial statements.
Because of its inherent limitations, internal control over financial reporting may not prevent or detect misstatements. Also, projections of any evaluation of effectiveness to future periods are subject to the risk that controls may become inadequate because of changes in conditions, or that the degree of compliance with the policies or procedures may deteriorate.
/s/ Deloitte & Touche LLP
Seattle, Washington
February 25, 2020
132
Item 9B. Other Information
None.
PART III
Item 10. Directors, Executive Officers and Corporate Governance
The information required by this Item (other than the information regarding executive officers and the Company's Code of Business Conduct and Ethics set forth below) is omitted pursuant to General Instruction G to Form 10-K. Such information is incorporated herein by reference as follows:
• | on and after the date of filing with the SEC the Registrant's definitive Proxy Statement relating to its Annual Meeting of Shareholders scheduled to be held on May 11, 2020, from such Proxy Statement; and |
• | prior to such date, from the Registrant's definitive Proxy Statement, dated March 29, 2019, relating to its Annual Meeting of Shareholders held on May 9, 2019. |
Information about our Executive Officers | |||||
Name | Age | Business Experience | |||
Dennis P. Vermillion | 58 | Chief Executive Officer since October 2019; President of Avista Corp since January 2018; Director since January 2018; Senior Vice President from January 2010 to January 2018; Vice President July 2007- December 2009; President – Avista Utilities since January 2009; Vice President of Energy Resources and Optimization – Avista Utilities July 2007 – December 2008; President and Chief Operating Officer of Avista Energy February 2001 – July 2007; various other management and staff positions with the Company since 1985. | |||
Mark T. Thies | 56 | Executive Vice President since October 2019; Treasurer since January 2013; Chief Financial Officer since September 2008; Senior Vice President from September 2008 to October 2019; prior to employment with the Company held the following positions with Black Hills Corporation: Executive Vice President and Chief Financial Officer March 2003 to January 2008; Senior Vice President and Chief Financial Officer March 2000 to March 2003; Controller May 1997 to March 2000. | |||
Kevin J. Christie | 52 | Senior Vice President, External Affairs and Chief Customer Officer since October 2019; Vice President, External Affairs and Chief Customer Officer January 2018; Vice President of Customer Solutions since February 2015; various other management and staff positions with the Company since 2005. | |||
Marian M. Durkin | 66 | Chief Legal Officer since January 2020; Senior Vice President since May 2005; General Counsel from November 2005 to December 2019; Chief Compliance Officer from August 2005 to December 2019; Corporate Secretary since May 2016; prior to employment with the Company: held several legal positions with United Air Lines, Inc. from 1995 to August 2005, most recently served as Vice President Deputy General Counsel and Assistant Secretary. | |||
Karen S. Feltes | 64 | Senior Vice President of Human Resources since November 2005 (retiring effective March 1, 2020); Corporate Secretary November 2005 – April 2016; Vice President of Human Resources and Corporate Secretary March 2003 – November 2005; Vice President of Human Resources and Corporate Services February 2002 – March 2003; various human resources positions with the Company April 1998 – February 2002. | |||
Heather L. Rosentrater | 42 | Senior Vice President, Energy Delivery and Shared Services since January 2020; Senior Vice President, Energy Delivery from October 2019 to December 2019; Vice President of Energy Delivery December 2015; various other management and staff positions with the Company since 1996. | |||
Jason R. Thackston | 49 | Senior Vice President since January 2014; Environmental Compliance Officer since May 2018; Vice President of Energy Resources since December 2012; Vice President of Customer Solutions – Avista Utilities June 2012 - December 2012; Vice President of Energy Delivery April 2011 – December 2012; Vice President of Finance June 2009 – April 2011; various other management and staff positions with the Company since 1996. | |||
Bryan A. Cox | 50 | Vice President, Safety and Human Resources Shared Services since January 2018; various other management and staff positions with the Company since 1997. | |||
Gregory C. Hesler | 42 | Vice President, General Counsel Chief Compliance Officer since January 2020; various other management and staff positions with the Company since 2015. | |||
133
Information about our Executive Officers | |||||
Name | Age | Business Experience | |||
Latisha D. Hill | 40 | Vice President of Community and Economic Vitality since January 2020; various other management and staff positions with the Company since 2005. | |||
James M. Kensok | 61 | Vice President and Chief Information Officer since January 2007; Chief Information Officer February 2001 – December 2006; various other management and staff positions with the Company since 1996. | |||
Ryan L. Krasselt | 50 | Vice President, Controller and Principal Accounting Officer since October 2015; various other management and staff positions with the Company since 2001. | |||
David J. Meyer | 66 | Vice President and Chief Counsel for Regulatory and Governmental Affairs since February 2004; Senior Vice President and General Counsel September 1998 – February 2004. | |||
Edward D. Schlect Jr. | 59 | Vice President and Chief Strategy Officer since September 2015; prior to employment with the Company, Executive Vice President of Corporate Development at Ecova, Inc. | |||
All of the Company’s executive officers, with the exception of James M. Kensok, David J. Meyer, Kevin J. Christie, Heather L. Rosentrater, Bryan A. Cox and Gregory C. Hesler were officers or directors of one or more of the Company’s subsidiaries in 2019. The Company’s executive officers are elected annually by the Board of Directors.
The Company has adopted a Code of Conduct for directors, officers (including the principal executive officer, principal financial officer and principal accounting officer), and employees. The Code of Conduct is available on the Company’s website at www.avistacorp.com and will also be provided to any shareholder without charge upon written request to:
Avista Corp.
General Counsel
P.O. Box 3727 MSC-12
Spokane, Washington 99220-3727
Any changes to or waivers for executive officers and directors of the Company’s Code of Conduct will be posted on the Company’s website.
Item 11. Executive Compensation
The information required by this Item is omitted pursuant to General Instruction G to Form 10-K. Such information is incorporated herein by reference as follows:
• | on and after the date of filing with the SEC the Registrant's definitive Proxy Statement relating to its Annual Meeting of Shareholders scheduled to be held on May 11, 2020, from such Proxy Statement; and |
• | prior to such date, from the Registrant's definitive Proxy Statement, dated March 29, 2019, relating to its Annual Meeting of Shareholders held on May 9, 2019. |
Item 12. Security Ownership of Certain Beneficial Owners and Management and Related Stockholder Matters
(a) | Security ownership of certain beneficial owners (owning 5 percent or more of Registrant’s voting securities): |
Information regarding security ownership of certain beneficial owners (owning 5 percent or more of Registrant’s voting securities) has been omitted pursuant to General Instruction G to Form 10-K. Such information is incorporated herein by reference as follows:
• | on and after the date of filing with the SEC the Registrant's definitive Proxy Statement relating to its Annual Meeting of Shareholders scheduled to be held on May 11, 2020, from such Proxy Statement; and |
• | prior to such date, from the Registrant's definitive Proxy Statement, dated March 29, 2019, relating to its Annual Meeting of Shareholders held on May 9, 2019; reference also being made to Schedules 13G, as amended, on file with the SEC with respect to the Registrant's voting securities (the information contained in such schedules 13G, as amended, not being incorporated herein by reference). |
(b) | Security ownership of management: |
The information required by this Item regarding the security ownership of management is omitted pursuant to General Instruction G to Form 10-K. Such information is incorporated herein by reference as follows:
134
• | on and after the date of filing with the SEC the Registrant's definitive Proxy Statement relating to its Annual Meeting of Shareholders scheduled to be held on May 11, 2020, from such Proxy Statement; and |
• | prior to such date, from the Registrant's definitive Proxy Statement, dated March 29, 2019, relating to its Annual Meeting of Shareholders held on May 9, 2019. |
(c) | Changes in control: |
None.
(d) | Securities authorized for issuance under equity compensation plans as of December 31, 2019: |
Plan category | (a) Number of securities to be issued upon exercise of outstanding options, warrants and rights | (b) Weighted average exercise price of outstanding options, warrants and rights | (c) Number of securities remaining available for future issuance under equity compensation plans (excluding securities reflected in column (a)) | ||||||
(1) | |||||||||
Equity compensation plans approved by security holders (2) | — | $ | — | 1,470,329 | |||||
(1) | Excludes unvested restricted shares and performance share awards granted under Avista Corp.’s Long-Term Incentive Plan. At December 31, 2019, 93,351 Restricted Share awards were outstanding. Performance and market-based share awards may be paid out at zero shares at a minimum achievement level; 267,025 shares at target level; or 534,050 shares at a maximum level. Because there is no exercise price associated with restricted shares or performance and market-based share awards, such shares are not included in the weighted-average price calculation. |
(2) | Includes the Long-Term Incentive Plan approved by shareholders in 1998 (amended in 2016) and the Non-Employee Director Stock Plan approved by shareholders in 1996. In February 2005, the Board of Directors elected to terminate the Non-Employee Director Stock Plan. |
Item 13. Certain Relationships and Related Transactions, and Director Independence
The information required by this Item is omitted pursuant to General Instruction G to Form 10-K. Such information is incorporated herein by reference as follows:
• | on and after the date of filing with the SEC the Registrant's definitive Proxy Statement relating to its Annual Meeting of Shareholders scheduled to be held on May 11, 2020, from such Proxy Statement; and |
• | prior to such date, from the Registrant's definitive Proxy Statement, dated March 29, 2019, relating to its Annual Meeting of Shareholders held on May 9, 2019. |
Item 14. Principal Accounting Fees and Services
The information required by this Item is omitted pursuant to General Instruction G to Form 10-K. Such information is incorporated herein by reference as follows:
• | on and after the date of filing with the SEC the Registrant's definitive Proxy Statement relating to its Annual Meeting of Shareholders scheduled to be held on May 11, 2020, from such Proxy Statement; and |
• | prior to such date, from the Registrant's definitive Proxy Statement, dated March 29, 2019, relating to its Annual Meeting of Shareholders held on May 9, 2019. |
135
PART IV
Item 15. Exhibits, Financial Statement Schedules
(a) | 1. Financial Statements (Included in Part II of this report): |
Report of Independent Registered Public Accounting Firm
Consolidated Statements of Income for the Years Ended December 31, 2019, 2018 and 2017
Consolidated Statements of Comprehensive Income for the Years Ended December 31, 2019, 2018 and 2017
Consolidated Balance Sheets as of December 31, 2019 and 2018
Consolidated Statements of Cash Flows for the Years Ended December 31, 2019, 2018 and 2017
Consolidated Statements of Equity for the Years Ended December 31, 2019, 2018 and 2017
Notes to Consolidated Financial Statements
(a) | 2. Financial Statement Schedules: |
None
(a) | 3. Exhibits: |
Reference is made to the Exhibit Index commencing on the following page. The Exhibits include the management contracts and compensatory plans or arrangements required to be filed as exhibits to this Form 10-K pursuant to Item 15(b).
136
EXHIBIT INDEX
Previously Filed (1) | ||||||
Exhibit | With Registration Number | As Exhibit | ||||
(with Form 8-K filed as of July 19, 2017) | 2.1 | |||||
(with Form 8-K filed as of January 23, 2019) | 2.1 | |||||
(with June 30, 2012 Form 10-Q) | 3.1 | |||||
(with Form 8-K filed as of August 17, 2016) | 3.2 | |||||
4.1 | 2-4077 | B-3 | Mortgage and Deed of Trust, dated as of June 1, 1939. | |||
4.2 | 2-9812 | 4(c) | First Supplemental Indenture, dated as of October 1, 1952. | |||
4.3 | 2-60728 | 2(b)-2 | Second Supplemental Indenture, dated as of May 1, 1953. | |||
4.4 | 2-13421 | 4(b)-3 | Third Supplemental Indenture, dated as of December 1, 1955. | |||
4.5 | 2-13421 | 4(b)-4 | Fourth Supplemental Indenture, dated as of March 15, 1967. | |||
4.6 | 2-60728 | 2(b)-5 | Fifth Supplemental Indenture, dated as of July 1, 1957. | |||
4.7 | 2-60728 | 2(b)-6 | Sixth Supplemental Indenture, dated as of January 1, 1958. | |||
4.8 | 2-60728 | 2(b)-7 | Seventh Supplemental Indenture, dated as of August 1, 1958. | |||
4.9 | 2-60728 | 2(b)-8 | Eighth Supplemental Indenture, dated as of January 1, 1959. | |||
4.10 | 2-60728 | 2(b)-9 | Ninth Supplemental Indenture, dated as of January 1, 1960. | |||
4.11 | 2-60728 | 2(b)-10 | Tenth Supplemental Indenture, dated as of April 1, 1964. | |||
4.12 | 2-60728 | 2(b)-11 | Eleventh Supplemental Indenture, dated as of March 1, 1965. | |||
4.13 | 2-60728 | 2(b)-12 | Twelfth Supplemental Indenture, dated as of May 1, 1966. | |||
4.14 | 2-60728 | 2(b)-13 | Thirteenth Supplemental Indenture, dated as of August 1, 1966. | |||
4.15 | 2-60728 | 2(b)-14 | Fourteenth Supplemental Indenture, dated as of April 1, 1970. | |||
4.16 | 2-60728 | 2(b)-15 | Fifteenth Supplemental Indenture, dated as of May 1, 1973. | |||
4.17 | 2-60728 | 2(b)-16 | Sixteenth Supplemental Indenture, dated as of February 1, 1975. | |||
4.18 | 2-60728 | 2(b)-17 | Seventeenth Supplemental Indenture, dated as of November 1, 1976. | |||
4.19 | 2-69080 | 2(b)-18 | Eighteenth Supplemental Indenture, dated as of June 1, 1980. | |||
4.20 | (with 1980 Form 10-K) | 4(a)-20 | Nineteenth Supplemental Indenture, dated as of January 1, 1981. | |||
4.21 | 2-79571 | 4(a)-21 | Twentieth Supplemental Indenture, dated as of August 1, 1982. | |||
4.22 | (with Form 8-K dated September 20, 1983) | 4(a)-22 | Twenty-First Supplemental Indenture, dated as of September 1, 1983. | |||
4.23 | 2-94816 | 4(a)-23 | Twenty-Second Supplemental Indenture, dated as of March 1, 1984. | |||
4.24 | (with 1986 Form 10-K) | 4(a)-24 | Twenty-Third Supplemental Indenture, dated as of December 1, 1986. | |||
4.25 | (with 1987 Form 10-K) | 4(a)-25 | Twenty-Fourth Supplemental Indenture, dated as of January 1, 1988. | |||
4.26 | (with 1989 Form 10-K) | 4(a)-26 | Twenty-Fifth Supplemental Indenture, dated as of October 1, 1989. | |||
4.27 | 33-51669 | 4(a)-27 | Twenty-Sixth Supplemental Indenture, dated as of April 1, 1993. | |||
(with 1993 Form 10-K) | 4(a)-28 | |||||
(with 2001 Form 10-K) | 4(a)-29 | |||||
333-82502 | 4(b) | |||||
(with June 30, 2002 Form 10-Q) | 4(f) | |||||
137
Previously Filed (1) | ||||||
Exhibit | With Registration Number | As Exhibit | ||||
333-39551 | 4(b) | |||||
(with September 30, 2003 Form 10-Q) | 4(f) | |||||
333-64652 | 4(a)33 | |||||
(with Form 8-K dated as of December 15, 2004) | 4.1 | |||||
(with Form 8-K dated as of December 15, 2004) | 4.2 | |||||
(with Form 8-K dated as of December 15, 2004) | 4.3 | |||||
(with Form 8-K dated as of December 15, 2004) | 4.4 | |||||
(with Form 8-K dated as of May 12, 2005) | 4.1 | |||||
(with Form 8-K dated as of November 17, 2005) | 4.1 | |||||
(with Form 8-K dated as of April 6, 2006) | 4.1 | |||||
(with Form 8-K dated as of December 15, 2006) | 4.1 | |||||
(with Form 8-K dated as of April 3, 2008) | 4.1 | |||||
(with Form 8-K dated as of November 26, 2008) | 4.1 | |||||
(with Form 8-K dated as of December 16, 2008) | 4.1 | |||||
(with Form 8-K dated as of December 30, 2008) | 4.3 | |||||
(with Form 8-K dated as of September 15, 2009) | 4.1 | |||||
(with Form 8-K dated as of November 25, 2009) | 4.1 | |||||
(with Form 8-K dated as of December 15, 2010) | 4.5 | |||||
(with Form 8-K dated as of December 20, 2010) | 4.1 | |||||
(with Form 8-K dated as of December 30, 2010) | 4.1 | |||||
(with Form 8-K dated as of February 11, 2011) | 4.1 | |||||
(with Form 8-K dated as of August 16, 2011) | 4.1 | |||||
(with Form 8-K dated as of December 14, 2011) | 4.1 | |||||
(with Form 8-K dated as of November 30, 2012) | 4.1 | |||||
(with Form 8-K dated as of August 14, 2013) | 4.1 | |||||
(with Form 8-K dated as of April 18, 2014) | 4.1 | |||||
138
Previously Filed (1) | ||||||
Exhibit | With Registration Number | As Exhibit | ||||
(with Form 8-K dated as of December 18, 2014) | 4.1 | |||||
(with Form 8-K dated as of December 16, 2015) | 4.1 | |||||
(with Form 8-K dated as of December 16, 2016) | 4.1 | |||||
(with Form 8-K dated as of December 14, 2017) | 4.1 | |||||
(with Form 8-K dated as of May 15, 2018) | 4(a)(62) | |||||
(with Form 8-K dated as of November 26, 2019) | 4.1 | |||||
(with Form 8-K dated as of December 15, 2004) | 4.5 | |||||
333-82165 | 4(a) | |||||
(with Form 8-K dated as of December 15, 2010) | 4.1 | |||||
(with Form 8-K dated as of December 15, 2010) | 4.3 | |||||
(with Form 8-K dated as of December 15, 2010) | 4.2 | |||||
(with Form 8-K dated as of December 15, 2010) | 4.4 | |||||
(with June 30, 2012 Form 10-Q) | 3.1 | |||||
(with Form 8-K filed as of August 17, 2016) | 3.2 | |||||
(Form 10/A) | N/A | |||||
(2) | ||||||
(with Form 8-K dated as of February 11, 2011) | 10.1 | |||||
(with Form 8-K dated as of April 18, 2014) | 10.1 | |||||
139
Previously Filed (1) | ||||||
Exhibit | With Registration Number | As Exhibit | ||||
(with Form 8-K dated as of April 18, 2014) | 10.2 | |||||
(with Form 8-K dated as of December 14, 2011) | 10.1 | |||||
(with 2002 Form 10-K) | 10(b)-3 | |||||
(with 2002 Form 10-K) | 10(b)-4 | |||||
(with 2002 Form 10-K) | 10(b)-5 | |||||
10.8 | 2-60728 | 5(g) | Power Sales Contract (Wells Project) with Public Utility District No. 1 of Douglas County, Washington, dated as of September 18, 1963. | |||
10.9 | 2-60728 | 5(g)-1 | Amendment to Power Sales Contract (Wells Project) with Public Utility District No. 1 of Douglas County, Washington, dated as of February 9, 1965. | |||
10.10 | 2-60728 | 5(h) | Reserved Share Power Sales Contract (Wells Project) with Public Utility District No. 1 of Douglas County, Washington, dated as of September 18, 1963. | |||
10.11 | 2-60728 | 5(h)-1 | Amendment to Reserved Share Power Sales Contract (Wells Project) with Public Utility District No. 1 of Douglas County, Washington, dated as of February 9, 1965. | |||
10.12 | (with September 30, 1985 Form 10-Q) | 1 | Settlement Agreement and Covenant Not to Sue executed by the United States Department of Energy acting by and through the Bonneville Power Administration and the Company, dated as of September 17, 1985, describing the settlement of Project 3 litigation. | |||
10.13 | (with 1981 Form 10-K) | 10(s)-7 | Ownership and Operation Agreement for Colstrip Units No. 3 & 4, dated as of May 6, 1981. | |||
(2) | ||||||
(2) | ||||||
10.16 | (with 1992 Form 10-K) | 10(t)-11 | The Company’s Unfunded Supplemental Executive Disability Plan. (3) | |||
(with 2007 Form 10-K) | 10.34 | |||||
(with 2018 Form 10-K) | 10.21 | |||||
(with 2010 Form 10-K) | 10.23 | |||||
(with 2017 Form 10-K) | 10.25 | |||||
(with 2018 Form 10-K) | 10.25 | |||||
(2) | ||||||
(with Form 8-K dated June 21, 2005) | 10.1 | |||||
(with Form 8-K dated August 13, 2008) | 10.1 | |||||
140
Previously Filed (1) | ||||||
Exhibit | With Registration Number | As Exhibit | ||||
(with 2010 Form 10-K) | 10.31 | |||||
(with September 30, 2019 Form 10-Q) | 10.1 | |||||
(with September 30, 2019 Form 10-Q) | 10.2 | |||||
(2) | ||||||
(2) | ||||||
(2) | ||||||
(2) | ||||||
(2) | ||||||
(4) | ||||||
101.INS | (2) | XBRL Instance Document | ||||
101.SCH | (2) | XBRL Taxonomy Extension Schema Document | ||||
101.CAL | (2) | XBRL Taxonomy Extension Calculation Linkbase Document | ||||
101.DEF | (2) | XBRL Taxonomy Extension Definition Linkbase Document | ||||
101.LAB | (2) | XBRL Taxonomy Extension Label Linkbase Document | ||||
101.PRE | (2) | XBRL Taxonomy Extension Presentation Linkbase Document | ||||
104 | (2) | Cover page formatted as Inline XBRL and contained in Exhibit 101. | ||||
(1) | Incorporated herein by reference. |
(2) | Filed herewith. |
(3) | Management contracts or compensatory plans filed as exhibits to this Form 10-K pursuant to Item 15(b). |
(4) | Furnished herewith. |
(5) | Applies to Kevin J. Christie, Bryan A. Cox, Marian M. Durkin, Karen S. Feltes, Gregory C. Hesler, Latisha D. Hill, James M. Kensok, Ryan L. Krasselt, David J. Meyer, Scott L. Morris, Heather L. Rosentrater, Edward D. Schlect, Jason R. Thackston, Mark T. Thies, and Dennis P. Vermillion. |
(6) | Applies to Kevin J. Christie, Bryan A. Cox, Marian M. Durkin, Karen S. Feltes, Latisha D. Hill, James M. Kensok, Ryan L. Krasselt, David J. Meyer, Scott L. Morris, Heather L. Rosentrater, Jason R. Thackston, Mark T. Thies, and Dennis P. Vermillion. |
(7) | Applies to Scott L. Morris and Karen S. Feltes. |
(8) | Applies to Kevin J. Christie, Bryan A. Cox, Marian M. Durkin, Gregory C. Hesler, Latisha D. Hill, James M. Kensok, Ryan L. Krasselt, David J. Meyer, Heather L. Rosentrater, Edward D. Schlect, Jason R. Thackston, Mark T. Thies, and Dennis P. Vermillion. |
141
SIGNATURES
Pursuant to the requirements of Section 13 or 15(d) of the Securities Exchange Act of 1934, the Registrant has duly caused this report to be signed on its behalf by the undersigned, thereunto duly authorized.
AVISTA CORPORATION | |||||
February 25, 2020 | By | /s/ Dennis P. Vermillion | |||
Date | Dennis P. Vermillion | ||||
President and Chief Executive Officer | |||||
Pursuant to the requirements of the Securities Exchange Act of 1934, this report has been signed below by the following persons on behalf of the Registrant and in the capacities and on the dates indicated.
Signature | Title | Date |
/s/ Dennis P. Vermillion | Principal Executive Officer and Director | February 25, 2020 |
Dennis P. Vermillion | ||
President and Chief Executive Officer | ||
/s/ Mark T. Thies | Principal Financial Officer | February 25, 2020 |
Mark T. Thies | ||
Executive Vice President, Chief Financial Officer, and Treasurer | ||
/s/ Ryan L. Krasselt | Principal Accounting Officer | February 25, 2020 |
Ryan L. Krasselt | ||
Vice President, Controller and Principal Accounting Officer | ||
/s/ Scott L. Morris | Director | February 25, 2020 |
Scott L. Morris | ||
Chairman of the Board | ||
/s/ Kristianne Blake | Director | February 25, 2020 |
Kristianne Blake | ||
/s/ Donald C. Burke | Director | February 25, 2020 |
Donald C. Burke | ||
/s/ Rebecca A. Klein | Director | February 25, 2020 |
Rebecca A. Klein | ||
/s/ Scott H. Maw | Director | February 25, 2020 |
Scott H. Maw | ||
/s/ Marc F. Racicot | Director | February 25, 2020 |
Marc F. Racicot | ||
142
/s/ Heidi B. Stanley | Director | February 25, 2020 |
Heidi B. Stanley | ||
/s/ R. John Taylor | Director | February 25, 2020 |
R. John Taylor | ||
/s/ Janet D. Widmann | Director | February 25, 2020 |
Janet D. Widmann | ||
/s/ Jeffry L. Philipps | Director | February 25, 2020 |
Jeffry L. Philipps | ||
143