UNITED STATES
SECURITIES AND EXCHANGE COMMISSION
WASHINGTON, D.C. 20549
FORM 10-Q
x | Quarterly Report Pursuant To Section 13 or 15(d) of the Securities Exchange Act of 1934 |
FOR THE QUARTERLY PERIOD ENDED SEPTEMBER 30, 2016
OR
¨ | Transition Report Pursuant to Section 13 or 15(d) of the Securities Exchange Act of 1934 |
For the transition period from to
Commission File Number | Exact name of registrant as specified in its charter and principal executive office address and telephone number | State of Incorporation | I.R.S. Employer ID. Number | |||
1-14514 | Consolidated Edison, Inc. | New York | 13-3965100 | |||
4 Irving Place, New York, New York 10003 | ||||||
(212) 460-4600 | ||||||
1-1217 | Consolidated Edison Company of New York, Inc. | New York | 13-5009340 | |||
4 Irving Place, New York, New York 10003 | ||||||
(212) 460-4600 | ||||||
Indicate by check mark whether the registrant (1) has filed all reports required to be filed by Section 13 or 15(d) of the Securities Exchange Act of 1934 during the preceding 12 months (or for such shorter period that the registrant was required to file such reports), and (2) has been subject to such filing requirements for the past 90 days.
Consolidated Edison, Inc. (Con Edison) | Yes x | No ¨ |
Consolidated Edison Company of New York, Inc. (CECONY) | Yes x | No ¨ |
Indicate by check mark whether the registrant has submitted electronically and posted on its corporate Web site, if any, every Interactive Data File required to be submitted and posted pursuant to Rule 405 of Regulation S-T (§232.405 of this chapter) during the preceding 12 months (or for such shorter period that the registrant was required to submit and post such files).
Con Edison | Yes x | No ¨ |
CECONY | Yes x | No ¨ |
Indicate by check mark whether the registrant is a large accelerated filer, an accelerated filer, a non-accelerated filer, or a smaller reporting company. See the definitions of “large accelerated filer”, “accelerated filer” and “smaller reporting company” in Rule 12b-2 of the Exchange Act.
Con Edison | |||
Large accelerated filer x | Accelerated filer ¨ | Non-accelerated filer ¨ | Smaller reporting company ¨ |
CECONY | |||
Large accelerated filer ¨ | Accelerated filer ¨ | Non-accelerated filer x | Smaller reporting company ¨ |
Indicate by check mark whether the registrant is a shell company (as defined in Rule 12b-2 of the Exchange Act).
Con Edison | Yes ¨ | No x |
CECONY | Yes ¨ | No x |
As of October 28, 2016, Con Edison had outstanding 304,727,523 Common Shares ($.10 par value). All of the outstanding common equity of CECONY is held by Con Edison.
Filing Format
This Quarterly Report on Form 10-Q is a combined report being filed separately by two different registrants: Consolidated Edison, Inc. (Con Edison) and Consolidated Edison Company of New York, Inc. (CECONY). CECONY is a wholly-owned subsidiary of Con Edison and, as such, the information in this report about CECONY also applies to Con Edison. As used in this report, the term the “Companies” refers to Con Edison and CECONY. However, CECONY makes no representation as to the information contained in this report relating to Con Edison or the subsidiaries of Con Edison other than itself.
Glossary of Terms
The following is a glossary of abbreviations or acronyms that are used in the Companies’ SEC reports:
Con Edison Companies | ||
Con Edison | Consolidated Edison, Inc. | |
CECONY | Consolidated Edison Company of New York, Inc. | |
Con Edison Development | Consolidated Edison Development, Inc. | |
Con Edison Energy | Consolidated Edison Energy, Inc. | |
Con Edison Solutions | Consolidated Edison Solutions, Inc. | |
Con Edison Transmission | Con Edison Transmission, Inc. | |
CET Electric | Consolidated Edison Transmission, LLC | |
CET Gas | Con Edison Gas Pipeline and Storage, LLC | |
O&R | Orange and Rockland Utilities, Inc. | |
Pike | Pike County Light & Power Company | |
RECO | Rockland Electric Company | |
The Companies | Con Edison and CECONY | |
The Utilities | CECONY and O&R | |
Regulatory Agencies, Government Agencies and Other Organizations | ||
EPA | U.S. Environmental Protection Agency | |
FASB | Financial Accounting Standards Board | |
FERC | Federal Energy Regulatory Commission | |
IASB | International Accounting Standards Board | |
IRS | Internal Revenue Service | |
NJBPU | New Jersey Board of Public Utilities | |
NJDEP | New Jersey Department of Environmental Protection | |
NYISO | New York Independent System Operator | |
NYPA | New York Power Authority | |
NYSDEC | New York State Department of Environmental Conservation | |
NYSERDA | New York State Energy Research and Development Authority | |
NYSPSC | New York State Public Service Commission | |
NYSRC | New York State Reliability Council, LLC | |
PAPUC | Pennsylvania Public Utility Commission | |
PJM | PJM Interconnection LLC | |
SEC | U.S. Securities and Exchange Commission | |
Accounting | ||
ASU | Accounting Standards Update | |
GAAP | Generally Accepted Accounting Principles in the United States of America | |
OCI | Other Comprehensive Income | |
VIE | Variable interest entity | |
2
Environmental | ||
CO2 | Carbon dioxide | |
GHG | Greenhouse gases | |
MGP Sites | Manufactured gas plant sites | |
PCBs | Polychlorinated biphenyls | |
PRP | Potentially responsible party | |
RGGI | Regional Greenhouse Gas Initiative | |
Superfund | Federal Comprehensive Environmental Response, Compensation and Liability Act of 1980 and similar state statutes | |
Units of Measure | ||
AC | Alternating current | |
Dt | Dekatherms | |
kV | Kilovolt | |
kWh | Kilowatt-hour | |
MDt | Thousand dekatherms | |
MMlb | Million pounds | |
MVA | Megavolt ampere | |
MW | Megawatt or thousand kilowatts | |
MWh | Megawatt hour | |
Other | ||
AFUDC | Allowance for funds used during construction | |
AMI | Advanced metering infrastructure | |
COSO | Committee of Sponsoring Organizations of the Treadway Commission | |
DER | Distributed energy resources | |
EGWP | Employer Group Waiver Plan | |
Fitch | Fitch Ratings | |
First Quarter Form 10-Q | The Companies' combined Quarterly Report on Form 10-Q for the quarterly period ended March 31 of the current year | |
Second Quarter Form 10-Q | The Companies' combined Quarterly Report on Form 10-Q for the quarterly period ended June 30 of the current year | |
Third Quarter Form 10-Q | The Companies' combined Quarterly Report on Form 10-Q for the quarterly period ended September 30 of the current year | |
Form 10-K | The Companies’ combined Annual Report on Form 10-K for the year ended December 31, 2015 | |
LTIP | Long Term Incentive Plan | |
Moody’s | Moody’s Investors Service | |
REV | Reforming the Energy Vision | |
S&P | Standard & Poor’s Financial Services LLC | |
VaR | Value-at-Risk | |
3
TABLE OF CONTENTS
PAGE | ||
ITEM 1 | Financial Statements (Unaudited) | |
Con Edison | ||
CECONY | ||
ITEM 2 | ||
ITEM 3 | ||
ITEM 4 | ||
ITEM 1 | ||
ITEM 1A | ||
ITEM 6 | ||
4
FORWARD-LOOKING STATEMENTS
This report includes forward-looking statements intended to qualify for the safe-harbor provisions of Section 27A of the Securities Act of 1933, as amended, and Section 21E of the Securities Exchange Act of 1934, as amended. Forward-looking statements are statements of future expectation and not facts. Words such as “forecasts,” “expects,” “estimates,” “anticipates,” “intends,” “believes,” “plans,” “will” and similar expressions identify forward-looking statements. Forward-looking statements are based on information available at the time the statements are made, and accordingly speak only as of that time. Actual results or developments might differ materially from those included in the forward-looking statements because of various factors including:
• | the Companies are extensively regulated and are subject to penalties; |
• | the Utilities’ rate plans may not provide a reasonable return; |
• | the Companies may be adversely affected by changes to the Utilities’ rate plans; |
• | the intentional misconduct of employees or contractors could adversely affect the Companies; |
• | the failure of, or damage to, the Companies’ facilities could adversely affect the Companies; |
• | a cyber attack could adversely affect the Companies; |
• | the Companies are exposed to risks from the environmental consequences of their operations; |
• | a disruption in the wholesale energy markets or failure by an energy supplier could adversely affect the Companies; |
• | the Companies have substantial unfunded pension and other postretirement benefit liabilities; |
• | Con Edison’s ability to pay dividends or interest depends on dividends from its subsidiaries; |
• | the Companies require access to capital markets to satisfy funding requirements; |
• | the Companies’ strategies may not be effective to address changes in the external business environment; and |
• | the Companies also face other risks that are beyond their control. |
5
Consolidated Edison, Inc.
CONSOLIDATED INCOME STATEMENT (UNAUDITED)
For the Three Months Ended September 30, | For the Nine Months Ended September 30, | |||||
2016 | 2015 | 2016 | 2015 | |||
(Millions of Dollars/ Except Share Data) | ||||||
OPERATING REVENUES | ||||||
Electric | $2,769 | $2,762 | $6,717 | $6,937 | ||
Gas | 235 | 237 | 1,246 | 1,293 | ||
Steam | 63 | 58 | 406 | 529 | ||
Non-utility | 350 | 386 | 999 | 1,088 | ||
TOTAL OPERATING REVENUES | 3,417 | 3,443 | 9,368 | 9,847 | ||
OPERATING EXPENSES | ||||||
Purchased power | 798 | 860 | 2,047 | 2,404 | ||
Fuel | 29 | 31 | 133 | 216 | ||
Gas purchased for resale | 81 | 64 | 320 | 415 | ||
Other operations and maintenance | 840 | 869 | 2,447 | 2,485 | ||
Depreciation and amortization | 305 | 285 | 905 | 840 | ||
Taxes, other than income taxes | 528 | 504 | 1,523 | 1,459 | ||
TOTAL OPERATING EXPENSES | 2,581 | 2,613 | 7,375 | 7,819 | ||
Gain on sale of retail electric supply business | 104 | — | 104 | — | ||
OPERATING INCOME | 940 | 830 | 2,097 | 2,028 | ||
OTHER INCOME (DEDUCTIONS) | ||||||
Investment and other income | 51 | 12 | 70 | 31 | ||
Allowance for equity funds used during construction | 3 | 1 | 7 | 3 | ||
Other deductions | (5) | (4) | (16) | (11) | ||
TOTAL OTHER INCOME | 49 | 9 | 61 | 23 | ||
INCOME BEFORE INTEREST AND INCOME TAX EXPENSE | 989 | 839 | 2,158 | 2,051 | ||
INTEREST EXPENSE | ||||||
Interest on long-term debt | 174 | 157 | 504 | 469 | ||
Other interest | 5 | 6 | 17 | 19 | ||
Allowance for borrowed funds used during construction | (1) | (1) | (4) | (2) | ||
NET INTEREST EXPENSE | 178 | 162 | 517 | 486 | ||
INCOME BEFORE INCOME TAX EXPENSE | 811 | 677 | 1,641 | 1,565 | ||
INCOME TAX EXPENSE | 314 | 249 | 602 | 548 | ||
NET INCOME | $497 | $428 | $1,039 | $1,017 | ||
Net income per common share—basic | $1.63 | $1.46 | $3.47 | $3.47 | ||
Net income per common share—diluted | $1.62 | $1.45 | $3.46 | $3.46 | ||
DIVIDENDS DECLARED PER COMMON SHARE | $0.67 | $0.65 | $2.01 | $1.95 | ||
AVERAGE NUMBER OF SHARES OUTSTANDING—BASIC (IN MILLIONS) | 304.5 | 292.9 | 299.1 | 292.9 | ||
AVERAGE NUMBER OF SHARES OUTSTANDING—DILUTED (IN MILLIONS) | 305.9 | 294.2 | 300.5 | 294.2 | ||
The accompanying notes are an integral part of these financial statements.
6
Consolidated Edison, Inc.
CONSOLIDATED STATEMENT OF COMPREHENSIVE INCOME (UNAUDITED)
For the Three Months Ended September 30, | For the Nine Months Ended September 30, | |||
2016 | 2015 | 2016 | 2015 | |
(Millions of Dollars) | ||||
NET INCOME | $497 | $428 | $1,039 | $1,017 |
OTHER COMPREHENSIVE INCOME, NET OF TAXES | ||||
Pension and other postretirement benefit plan liability adjustments, net of taxes | 1 | 1 | 2 | 7 |
TOTAL OTHER COMPREHENSIVE INCOME, NET OF TAXES | 1 | 1 | 2 | 7 |
COMPREHENSIVE INCOME | $498 | $429 | $1,041 | $1,024 |
The accompanying notes are an integral part of these financial statements.
7
Consolidated Edison, Inc.
CONSOLIDATED STATEMENT OF CASH FLOWS (UNAUDITED)
For the Nine Months Ended September 30, | ||||
2016 | 2015 | |||
(Millions of Dollars) | ||||
OPERATING ACTIVITIES | ||||
Net income | $1,039 | $1,017 | ||
PRINCIPAL NON-CASH CHARGES/(CREDITS) TO INCOME | ||||
Depreciation and amortization | 905 | 840 | ||
Deferred income taxes | 524 | 466 | ||
Rate case amortization and accruals | (157) | (38) | ||
Common equity component of allowance for funds used during construction | (7) | (3) | ||
Net derivative (gains)/losses | (7) | (4) | ||
Pre-tax gain on sale of retail electric supply business | (104) | — | ||
Other non-cash items, net | 99 | 73 | ||
CHANGES IN ASSETS AND LIABILITIES | ||||
Accounts receivable – customers | (138) | (82) | ||
Materials and supplies, including fuel oil and gas in storage | 15 | 32 | ||
Other receivables and other current assets | 90 | 44 | ||
Income taxes receivable | 100 | 194 | ||
Prepayments | (403) | (568) | ||
Accounts payable | 142 | 83 | ||
Pensions and retiree benefits obligations, net | 464 | 566 | ||
Pensions and retiree benefits contributions | (510) | (753) | ||
Accrued taxes | (21) | (19) | ||
Accrued interest | 66 | 48 | ||
Superfund and environmental remediation costs, net | 68 | 23 | ||
Distributions from equity investments | 45 | 29 | ||
Deferred charges, noncurrent assets and other regulatory assets | (104) | (17) | ||
Deferred credits and other regulatory liabilities | 116 | 220 | ||
Other current and noncurrent liabilities | 114 | 48 | ||
NET CASH FLOWS FROM OPERATING ACTIVITIES | 2,336 | 2,199 | ||
INVESTING ACTIVITIES | ||||
Utility construction expenditures | (2,057) | (1,838) | ||
Cost of removal less salvage | (149) | (156) | ||
Non-utility construction expenditures | (436) | (366) | ||
Investments in/acquisitions of renewable electric production and electric and gas transmission projects | (1,281) | (286) | ||
Proceeds from sale of assets | 250 | — | ||
Proceeds from the transfer of assets to NY Transco | 122 | — | ||
Restricted cash | (21) | (23) | ||
Other investing activities | (145) | (18) | ||
NET CASH FLOWS USED IN INVESTING ACTIVITIES | (3,717) | (2,687) | ||
FINANCING ACTIVITIES | ||||
Net (payment)/issuance of short-term debt | (928) | 360 | ||
Issuance of long-term debt | 1,765 | 238 | ||
Retirement of long-term debt | (407) | (145) | ||
Debt issuance costs | (16) | (2) | ||
Common stock dividends | (570) | (560) | ||
Issuance of common shares - public offering | 702 | — | ||
Issuance of common shares for stock plans, net of repurchases | 38 | (9 | ) | |
Distribution to noncontrolling interest | (1) | — | ||
NET CASH FLOWS FROM/(USED IN) FINANCING ACTIVITIES | 583 | (118) | ||
CASH AND TEMPORARY CASH INVESTMENTS: | ||||
NET CHANGE FOR THE PERIOD | (798) | (606) | ||
BALANCE AT BEGINNING OF PERIOD | 944 | 699 | ||
BALANCE AT END OF PERIOD | 146 | 93 | ||
LESS: CHANGE IN CASH BALANCES HELD FOR SALE | (4 | ) | 2 | |
BALANCE AT END OF PERIOD EXCLUDING HELD FOR SALE | $150 | $91 | ||
SUPPLEMENTAL DISCLOSURE OF CASH INFORMATION | ||||
Cash paid/(received) during the period for: | ||||
Interest | $437 | $411 | ||
Income taxes | $(144) | $(7) | ||
SUPPLEMENTAL DISCLOSURE OF NON-CASH INFORMATION | ||||
Construction expenditures in accounts payable | $242 | $204 | ||
Issuance of common shares for dividend reinvestment | $35 | $11 | ||
The accompanying notes are an integral part of these financial statements.
8
Consolidated Edison, Inc.
CONSOLIDATED BALANCE SHEET (UNAUDITED)
September 30, 2016 | December 31, 2015 | ||
(Millions of Dollars) | |||
ASSETS | |||
CURRENT ASSETS | |||
Cash and temporary cash investments | $150 | $944 | |
Special deposits | 3 | 3 | |
Accounts receivable – customers, less allowance for uncollectible accounts of $75 and $85 in 2016 and 2015, respectively | 1,157 | 1,052 | |
Other receivables, less allowance for uncollectible accounts of $13 and $11 in 2016 and 2015, respectively | 165 | 304 | |
Income taxes receivable | 66 | 166 | |
Accrued unbilled revenue | 373 | 360 | |
Fuel oil, gas in storage, materials and supplies, at average cost | 335 | 350 | |
Prepayments | 580 | 177 | |
Regulatory assets | 119 | 132 | |
Assets held for sale | — | 157 | |
Other current assets | 206 | 191 | |
TOTAL CURRENT ASSETS | 3,154 | 3,836 | |
INVESTMENTS | 1,931 | 884 | |
UTILITY PLANT, AT ORIGINAL COST | |||
Electric | 27,239 | 26,358 | |
Gas | 7,253 | 6,858 | |
Steam | 2,374 | 2,336 | |
General | 2,657 | 2,622 | |
TOTAL | 39,523 | 38,174 | |
Less: Accumulated depreciation | 8,451 | 8,044 | |
Net | 31,072 | 30,130 | |
Construction work in progress | 1,286 | 1,003 | |
NET UTILITY PLANT | 32,358 | 31,133 | |
NON-UTILITY PLANT | |||
Non-utility property, less accumulated depreciation of $122 and $95 in 2016 and 2015, respectively | 1,127 | 832 | |
Construction work in progress | 421 | 244 | |
NET PLANT | 33,906 | 32,209 | |
OTHER NONCURRENT ASSETS | |||
Goodwill | 429 | 429 | |
Intangible assets, less accumulated amortization of $5 and $4 in 2016 and 2015, respectively | — | 2 | |
Regulatory assets | 7,544 | 8,096 | |
Other deferred charges and noncurrent assets | 352 | 186 | |
TOTAL OTHER NONCURRENT ASSETS | 8,325 | 8,713 | |
TOTAL ASSETS | $47,316 | $45,642 | |
The accompanying notes are an integral part of these financial statements.
9
Consolidated Edison, Inc.
CONSOLIDATED BALANCE SHEET (UNAUDITED)
September 30, 2016 | December 31, 2015 | ||
(Millions of Dollars) | |||
LIABILITIES AND SHAREHOLDERS’ EQUITY | |||
CURRENT LIABILITIES | |||
Long-term debt due within one year | $346 | $739 | |
Notes payable | 601 | 1,529 | |
Accounts payable | 1,113 | 1,008 | |
Customer deposits | 356 | 354 | |
Accrued taxes | 41 | 62 | |
Accrued interest | 202 | 136 | |
Accrued wages | 101 | 97 | |
Fair value of derivative liabilities | 70 | 66 | |
Regulatory liabilities | 123 | 115 | |
Liabilities held for sale | — | 89 | |
Other current liabilities | 638 | 525 | |
TOTAL CURRENT LIABILITIES | 3,591 | 4,720 | |
NONCURRENT LIABILITIES | |||
Provision for injuries and damages | 170 | 185 | |
Pensions and retiree benefits | 2,197 | 2,911 | |
Superfund and other environmental costs | 752 | 765 | |
Asset retirement obligations | 254 | 242 | |
Fair value of derivative liabilities | 52 | 39 | |
Deferred income taxes and unamortized investment tax credits | 10,155 | 9,537 | |
Regulatory liabilities | 1,920 | 1,977 | |
Other deferred credits and noncurrent liabilities | 203 | 199 | |
TOTAL NONCURRENT LIABILITIES | 15,703 | 15,855 | |
LONG-TERM DEBT | 13,747 | 12,006 | |
EQUITY | |||
Common shareholders’ equity | 14,267 | 13,052 | |
Noncontrolling interest | 8 | 9 | |
TOTAL EQUITY (See Statement of Equity) | 14,275 | 13,061 | |
TOTAL LIABILITIES AND EQUITY | $47,316 | $45,642 | |
The accompanying notes are an integral part of these financial statements.
10
Consolidated Edison, Inc.
CONSOLIDATED STATEMENT OF EQUITY (UNAUDITED)
(In Millions) | Common Stock | Additional Paid-In Capital | Retained Earnings | Treasury Stock | Capital Stock Expense | Accumulated Other Comprehensive Income/(Loss) | Noncontrolling Interest | Total | |||||||
Shares | Amount | Shares | Amount | ||||||||||||
BALANCE AS OF DECEMBER 31, 2014 | 293 | $32 | $4,991 | $8,691 | 23 | $(1,032) | $(61) | $(45) | $9 | $12,585 | |||||
Net income | 370 | 370 | |||||||||||||
Common stock dividends | (190) | (190) | |||||||||||||
Issuance of common shares for stock plans, net of repurchases | — | 2 | — | (2) | — | ||||||||||
Other comprehensive income | 5 | 5 | |||||||||||||
BALANCE AS OF MARCH 31, 2015 | 293 | $32 | $4,993 | $8,871 | 23 | $(1,034) | $(61) | $(40) | $9 | $12,770 | |||||
Net income | 219 | 219 | |||||||||||||
Common stock dividends | (190) | (190) | |||||||||||||
Issuance of common shares for stock plans, net of repurchases | — | — | — | (3) | (3) | ||||||||||
Other comprehensive income | 1 | 1 | |||||||||||||
BALANCE AS OF JUNE 30, 2015 | 293 | $32 | $4,993 | $8,900 | 23 | $(1,037) | $(61) | $(39) | $9 | $12,797 | |||||
Net income | 428 | 428 | |||||||||||||
Common stock dividends | (191) | (191) | |||||||||||||
Issuance of common shares for stock plans, net of repurchases | — | 15 | — | (1) | 14 | ||||||||||
Other comprehensive income | 1 | 1 | |||||||||||||
BALANCE AS OF SEPTEMBER 30, 2015 | 293 | $32 | $5,008 | $9,137 | 23 | $(1,038) | $(61) | $(38) | $9 | $13,049 | |||||
BALANCE AS OF DECEMBER 31, 2015 | 293 | $32 | $5,030 | $9,123 | 23 | $(1,038) | $(61) | $(34) | $9 | $13,061 | |||||
Net income | 310 | 310 | |||||||||||||
Common stock dividends | (197) | (197) | |||||||||||||
Issuance of common shares for stock plans | 1 | 28 | 28 | ||||||||||||
Other comprehensive income | — | — | |||||||||||||
Noncontrolling interest | (1) | (1) | |||||||||||||
BALANCE AS OF MARCH 31, 2016 | 294 | $32 | $5,058 | $9,236 | 23 | $(1,038) | $(61) | $(34) | $8 | $13,201 | |||||
Net income | 232 | 232 | |||||||||||||
Common stock dividends | (204) | (204) | |||||||||||||
Issuance of common shares - public offering | 10 | 1 | 723 | (22) | 702 | ||||||||||
Issuance of common shares for stock plans | — | 26 | 26 | ||||||||||||
Other comprehensive income | 1 | 1 | |||||||||||||
BALANCE AS OF JUNE 30, 2016 | 304 | $33 | $5,807 | $9,264 | 23 | $(1,038) | $(83) | $(33) | $8 | $13,958 | |||||
Net income | 497 | 497 | |||||||||||||
Common stock dividends | (204) | (204) | |||||||||||||
Issuance of common shares for stock plans | 1 | 23 | 23 | ||||||||||||
Other comprehensive income | 1 | 1 | |||||||||||||
BALANCE AS OF SEPTEMBER 30, 2016 | 305 | $33 | $5,830 | $9,557 | 23 | $(1,038) | $(83) | $(32) | $8 | $14,275 | |||||
The accompanying notes are an integral part of these financial statements.
11
Consolidated Edison Company of New York, Inc.
CONSOLIDATED INCOME STATEMENT (UNAUDITED)
For the Three Months Ended September 30, | For the Nine Months Ended September 30, | |||
2016 | 2015 | 2016 | 2015 | |
(Millions of Dollars) | ||||
OPERATING REVENUES | ||||
Electric | $2,557 | $2,558 | $6,222 | $6,416 |
Gas | 208 | 213 | 1,113 | 1,177 |
Steam | 63 | 58 | 406 | 529 |
TOTAL OPERATING REVENUES | 2,828 | 2,829 | 7,741 | 8,122 |
OPERATING EXPENSES | ||||
Purchased power | 495 | 526 | 1,216 | 1,423 |
Fuel | 29 | 31 | 133 | 216 |
Gas purchased for resale | 34 | 30 | 217 | 282 |
Other operations and maintenance | 724 | 750 | 2,105 | 2,140 |
Depreciation and amortization | 278 | 262 | 825 | 773 |
Taxes, other than income taxes | 502 | 485 | 1,446 | 1,399 |
TOTAL OPERATING EXPENSES | 2,062 | 2,084 | 5,942 | 6,233 |
OPERATING INCOME | 766 | 745 | 1,799 | 1,889 |
OTHER INCOME (DEDUCTIONS) | ||||
Investment and other income | 4 | (1) | 6 | 3 |
Allowance for equity funds used during construction | 2 | 1 | 6 | 3 |
Other deductions | (4) | (3) | (10) | (10) |
TOTAL OTHER INCOME (DEDUCTIONS) | 2 | (3) | 2 | (4) |
INCOME BEFORE INTEREST AND INCOME TAX EXPENSE | 768 | 742 | 1,801 | 1,885 |
INTEREST EXPENSE | ||||
Interest on long-term debt | 150 | 141 | 440 | 423 |
Other interest | 5 | 5 | 14 | 14 |
Allowance for borrowed funds used during construction | (1) | (1) | (3) | (2) |
NET INTEREST EXPENSE | 154 | 145 | 451 | 435 |
INCOME BEFORE INCOME TAX EXPENSE | 614 | 597 | 1,350 | 1,450 |
INCOME TAX EXPENSE | 226 | 222 | 491 | 515 |
NET INCOME | $388 | $375 | $859 | $935 |
The accompanying notes are an integral part of these financial statements.
12
Consolidated Edison Company of New York, Inc.
CONSOLIDATED STATEMENT OF COMPREHENSIVE INCOME (UNAUDITED)
For the Three Months Ended September 30, | For the Nine Months Ended September 30, | ||||
2016 | 2015 | 2016 | 2015 | ||
(Millions of Dollars) | |||||
NET INCOME | $388 | $375 | $859 | $935 | |
OTHER COMPREHENSIVE INCOME, NET OF TAXES | |||||
Pension and other postretirement benefit plan liability adjustments, net of taxes | — | 1 | 1 | 2 | |
TOTAL OTHER COMPREHENSIVE INCOME, NET OF TAXES | — | 1 | 1 | 2 | |
COMPREHENSIVE INCOME | $388 | $376 | $860 | $937 | |
The accompanying notes are an integral part of these financial statements.
13
Consolidated Edison Company of New York, Inc.
CONSOLIDATED STATEMENT OF CASH FLOWS (UNAUDITED)
For the Nine Months Ended September 30, | |||
2016 | 2015 | ||
(Millions of Dollars) | |||
OPERATING ACTIVITIES | |||
Net income | $859 | $935 | |
PRINCIPAL NON-CASH CHARGES/(CREDITS) TO INCOME | |||
Depreciation and amortization | 825 | 773 | |
Deferred income taxes | 569 | 391 | |
Rate case amortization and accruals | (170) | (57) | |
Common equity component of allowance for funds used during construction | (6) | (3) | |
Other non-cash items, net | 7 | 13 | |
CHANGES IN ASSETS AND LIABILITIES | |||
Accounts receivable – customers | (79) | (51) | |
Materials and supplies, including fuel oil and gas in storage | 15 | 34 | |
Other receivables and other current assets | 18 | 60 | |
Accounts receivable from affiliated companies | 38 | (32) | |
Prepayments | (351) | (336) | |
Accounts payable | 82 | 18 | |
Accounts payable to affiliated companies | 8 | 5 | |
Pensions and retiree benefits obligations, net | 439 | 530 | |
Pensions and retiree benefits contributions | (472) | (700) | |
Superfund and environmental remediation costs, net | 76 | 21 | |
Accrued taxes | (17) | (1) | |
Accrued taxes to affiliated companies | (2) | (8) | |
Accrued interest | 43 | 37 | |
Deferred charges, noncurrent assets and other regulatory assets | (153) | (49) | |
Deferred credits and other regulatory liabilities | 165 | 222 | |
Other current and noncurrent liabilities | 123 | — | |
NET CASH FLOWS FROM OPERATING ACTIVITIES | 2,017 | 1,802 | |
INVESTING ACTIVITIES | |||
Utility construction expenditures | (1,932) | (1,732) | |
Cost of removal less salvage | (146) | (149) | |
Proceeds from the transfer of assets to NY Transco | 122 | — | |
Restricted cash | 13 | (19) | |
NET CASH FLOWS USED IN INVESTING ACTIVITIES | (1,943) | (1,900) | |
FINANCING ACTIVITIES | |||
Net (payment)/issuance of short-term debt | (553) | 199 | |
Issuance of long-term debt | 550 | — | |
Retirement of long-term debt | (400) | — | |
Debt issuance costs | (6) | (1) | |
Capital contribution by parent | 76 | — | |
Dividend to parent | (558) | (694) | |
NET CASH FLOWS USED IN FINANCING ACTIVITIES | (891) | (496) | |
CASH AND TEMPORARY CASH INVESTMENTS: | |||
NET CHANGE FOR THE PERIOD | (817) | (594) | |
BALANCE AT BEGINNING OF PERIOD | 843 | 645 | |
BALANCE AT END OF PERIOD | $26 | $51 | |
SUPPLEMENTAL DISCLOSURE OF CASH INFORMATION | |||
Cash paid/(received) during the period for: | |||
Interest | $386 | $376 | |
Income taxes | $(130) | $143 | |
SUPPLEMENTAL DISCLOSURE OF NON-CASH INFORMATION | |||
Construction expenditures in accounts payable | $195 | $152 | |
The accompanying notes are an integral part of these financial statements.
14
Consolidated Edison Company of New York, Inc.
CONSOLIDATED BALANCE SHEET (UNAUDITED)
September 30, 2016 | December 31, 2015 | |
(Millions of Dollars) | ||
ASSETS | ||
CURRENT ASSETS | ||
Cash and temporary cash investments | $26 | $843 |
Special deposits | 2 | 2 |
Accounts receivable – customers, less allowance for uncollectible accounts of $70 and $80 in 2016 and 2015, respectively | 1,076 | 987 |
Other receivables, less allowance for uncollectible accounts of $12 and $11 in 2016 and 2015, respectively | 55 | 70 |
Accrued unbilled revenue | 330 | 327 |
Accounts receivable from affiliated companies | 152 | 190 |
Fuel oil, gas in storage, materials and supplies, at average cost | 273 | 288 |
Prepayments | 464 | 113 |
Regulatory assets | 111 | 121 |
Other current assets | 98 | 131 |
TOTAL CURRENT ASSETS | 2,587 | 3,072 |
INVESTMENTS | 318 | 286 |
UTILITY PLANT, AT ORIGINAL COST | ||
Electric | 25,648 | 24,828 |
Gas | 6,564 | 6,191 |
Steam | 2,374 | 2,336 |
General | 2,437 | 2,411 |
TOTAL | 37,023 | 35,766 |
Less: Accumulated depreciation | 7,750 | 7,378 |
Net | 29,273 | 28,388 |
Construction work in progress | 1,200 | 922 |
NET UTILITY PLANT | 30,473 | 29,310 |
NON-UTILITY PROPERTY | ||
Non-utility property, less accumulated depreciation of $25 in 2016 and 2015 | 4 | 5 |
NET PLANT | 30,477 | 29,315 |
OTHER NONCURRENT ASSETS | ||
Regulatory assets | 6,986 | 7,482 |
Other deferred charges and noncurrent assets | 68 | 75 |
TOTAL OTHER NONCURRENT ASSETS | 7,054 | 7,557 |
TOTAL ASSETS | $40,436 | $40,230 |
The accompanying notes are an integral part of these financial statements.
15
Consolidated Edison Company of New York, Inc.
CONSOLIDATED BALANCE SHEET (UNAUDITED)
September 30, 2016 | December 31, 2015 | ||
(Millions of Dollars) | |||
LIABILITIES AND SHAREHOLDER’S EQUITY | |||
CURRENT LIABILITIES | |||
Long-term debt due within one year | $250 | $650 | |
Notes payable | 480 | 1,033 | |
Accounts payable | 838 | 771 | |
Accounts payable to affiliated companies | 20 | 12 | |
Customer deposits | 341 | 339 | |
Accrued taxes | 32 | 49 | |
Accrued taxes to affiliated companies | — | 2 | |
Accrued interest | 161 | 118 | |
Accrued wages | 92 | 88 | |
Fair value of derivative liabilities | 61 | 50 | |
Regulatory liabilities | 96 | 84 | |
Other current liabilities | 558 | 443 | |
TOTAL CURRENT LIABILITIES | 2,929 | 3,639 | |
NONCURRENT LIABILITIES | |||
Provision for injuries and damages | 164 | 178 | |
Pensions and retiree benefits | 1,895 | 2,565 | |
Superfund and other environmental costs | 661 | 665 | |
Asset retirement obligations | 241 | 234 | |
Fair value of derivative liabilities | 45 | 36 | |
Deferred income taxes and unamortized investment tax credits | 9,472 | 8,755 | |
Regulatory liabilities | 1,725 | 1,789 | |
Other deferred credits and noncurrent liabilities | 177 | 167 | |
TOTAL NONCURRENT LIABILITIES | 14,380 | 14,389 | |
LONG-TERM DEBT | 11,334 | 10,787 | |
SHAREHOLDER’S EQUITY (See Statement of Shareholder’s Equity) | 11,793 | 11,415 | |
TOTAL LIABILITIES AND SHAREHOLDER’S EQUITY | $40,436 | $40,230 | |
The accompanying notes are an integral part of these financial statements.
16
Consolidated Edison Company of New York, Inc.
CONSOLIDATED STATEMENT OF SHAREHOLDER’S EQUITY (UNAUDITED)
Common Stock | Additional Paid-In Capital | Retained Earnings | Repurchased Con Edison Stock | Capital Stock Expense | Accumulated Other Comprehensive Income/(Loss) | Total | ||||
(In Millions) | Shares | Amount | ||||||||
BALANCE AS OF DECEMBER 31, 2014 | 235 | $589 | $4,234 | $7,399 | $(962) | $(61) | $(11) | $11,188 | ||
Net income | 348 | 348 | ||||||||
Common stock dividend to parent | (338) | (338) | ||||||||
Other comprehensive income | — | — | ||||||||
BALANCE AS OF MARCH 31, 2015 | 235 | $589 | $4,234 | $7,409 | $(962) | $(61) | $(11) | $11,198 | ||
Net income | 211 | 211 | ||||||||
Common stock dividend to parent | (178) | (178) | ||||||||
Other comprehensive income | 1 | 1 | ||||||||
BALANCE AS OF JUNE 30, 2015 | 235 | $589 | $4,234 | $7,442 | $(962) | $(61) | $(10) | $11,232 | ||
Net income | 375 | 375 | ||||||||
Common stock dividend to parent | (178) | (178) | ||||||||
Other comprehensive income | 1 | 1 | ||||||||
BALANCE AS OF SEPTEMBER 30, 2015 | 235 | $589 | $4,234 | $7,639 | $(962) | $(61) | $(9) | $11,430 | ||
BALANCE AS OF DECEMBER 31, 2015 | 235 | $589 | $4,247 | $7,611 | $(962) | $(61) | $(9) | $11,415 | ||
Net income | 310 | 310 | ||||||||
Common stock dividend to parent | (186) | (186) | ||||||||
Capital contribution by parent | 23 | 23 | ||||||||
Other comprehensive income | — | — | ||||||||
BALANCE AS OF MARCH 31, 2016 | 235 | $589 | $4,270 | $7,735 | $(962) | $(61) | $(9) | $11,562 | ||
Net income | 161 | 161 | ||||||||
Common stock dividend to parent | (186) | (186) | ||||||||
Capital contribution by parent | 28 | 28 | ||||||||
Other comprehensive income | 1 | 1 | ||||||||
BALANCE AS OF JUNE 30, 2016 | 235 | $589 | $4,298 | $7,710 | $(962) | $(61) | $(8) | $11,566 | ||
Net income | 388 | 388 | ||||||||
Common stock dividend to parent | (186) | (186) | ||||||||
Capital contribution by parent | 25 | 25 | ||||||||
Other comprehensive income | — | — | ||||||||
BALANCE AS OF SEPTEMBER 30, 2016 | 235 | $589 | $4,323 | $7,912 | $(962) | $(61) | $(8) | $11,793 | ||
The accompanying notes are an integral part of these financial statements.
17
NOTES TO THE FINANCIAL STATEMENTS (UNAUDITED)
General
These combined notes accompany and form an integral part of the separate consolidated financial statements of each of the two separate registrants: Consolidated Edison, Inc. and its subsidiaries (Con Edison) and Consolidated Edison Company of New York, Inc. and its subsidiaries (CECONY). CECONY is a subsidiary of Con Edison and as such its financial condition and results of operations and cash flows, which are presented separately in the CECONY consolidated financial statements, are also consolidated, along with those of Con Edison’s other utility subsidiary, Orange and Rockland Utilities, Inc. (O&R), Con Edison Transmission, Inc. (Con Edison Transmission) and Con Edison’s competitive energy businesses in Con Edison’s consolidated financial statements. The term “Utilities” is used in these notes to refer to CECONY and O&R.
As used in these notes, the term “Companies” refers to Con Edison and CECONY and, except as otherwise noted, the information in these combined notes relates to each of the Companies. However, CECONY makes no representation as to information relating to Con Edison or the subsidiaries of Con Edison other than itself.
The separate interim consolidated financial statements of each of the Companies are unaudited but, in the opinion of their respective managements, reflect all adjustments (which include only normally recurring adjustments) necessary for a fair presentation of the results for the interim periods presented. The Companies’ separate interim consolidated financial statements should be read together with their separate audited financial statements (including the combined notes thereto) included in Item 8 of their combined Annual Report on Form 10-K for the year ended December 31, 2015 and their separate unaudited financial statements (including the combined notes thereto) included in Part I, Item 1 of their combined Quarterly Report on Form 10-Q for the quarterly periods ended March 31, 2016 and June 30, 2016. Certain prior period amounts have been reclassified to conform to the current period presentation.
Con Edison has two regulated utility subsidiaries: CECONY and O&R. CECONY provides electric service and gas service in New York City and Westchester County. The company also provides steam service in parts of Manhattan. O&R, along with its regulated utility subsidiary, provides electric service in southeastern New York and northern New Jersey and gas service in southeastern New York. Con Edison has the following competitive energy businesses: Consolidated Edison Solutions, Inc. (Con Edison Solutions), a company which provides energy-related products and services to retail customers; Consolidated Edison Energy, Inc. (Con Edison Energy), a company that provides energy-related products and services to wholesale customers; and Consolidated Edison Development, Inc. (Con Edison Development), a company that develops, owns and operates renewable and energy infrastructure projects. In addition, Con Edison has a subsidiary, Con Edison Transmission, that invests in electric transmission facilities through its subsidiary, Consolidated Edison Transmission, LLC (CET Electric), and invests in gas pipeline and storage facilities through its subsidiary Con Edison Gas Pipeline and Storage, LLC (CET Gas). See Note P.
Note A – Summary of Significant Accounting Policies
Earnings Per Common Share
For the three and nine months ended September 30, 2016 and 2015, basic and diluted earnings per share (EPS) for Con Edison are calculated as follows:
For the Three Months Ended September 30, | For the Nine Months Ended September 30, | |||
(Millions of Dollars, except per share amounts/Shares in Millions) | 2016 | 2015 | 2016 | 2015 |
Net income | $497 | $428 | $1,039 | $1,017 |
Weighted average common shares outstanding – basic | 304.5 | 292.9 | 299.1 | 292.9 |
Add: Incremental shares attributable to effect of potentially dilutive securities | 1.4 | 1.3 | 1.4 | 1.3 |
Adjusted weighted average common shares outstanding – diluted | 305.9 | 294.2 | 300.5 | 294.2 |
Net income per common share – basic | $1.63 | $1.46 | $3.47 | $3.47 |
Net income per common share – diluted | $1.62 | $1.45 | $3.46 | $3.46 |
18
Changes in Accumulated Other Comprehensive Income/(Loss) by Component
For the three and nine months ended September 30, 2016 and 2015, changes to accumulated other comprehensive income/(loss) (OCI) for Con Edison and CECONY are as follows:
For the Three Months Ended September 30, | |||||
Con Edison | CECONY | ||||
(Millions of Dollars) | 2016 | 2015 | 2016 | 2015 | |
Beginning balance, accumulated OCI, net of taxes (a) | $(33) | $(39) | $(8) | $(10) | |
Amounts reclassified from accumulated OCI related to pension plan liabilities, net of tax of $(1) for Con Edison in 2016 and 2015 (a)(b) | 1 | 1 | — | 1 | |
Current period OCI, net of taxes | 1 | 1 | — | 1 | |
Ending balance, accumulated OCI, net of taxes | $(32) | $(38) | $(8) | $(9) | |
For the Nine Months Ended September 30, | ||||||
Con Edison | CECONY | |||||
(Millions of Dollars) | 2016 | 2015 | 2016 | 2015 | ||
Beginning balance, accumulated OCI, net of taxes (a) | $(34) | $(45) | $(9) | $(11) | ||
OCI before reclassifications, net of tax of $1 and $(2) for Con Edison in 2016 and 2015, respectively | (1) | 3 | — | — | ||
Amounts reclassified from accumulated OCI related to pension plan liabilities, net of tax of $(2) and $(3) for Con Edison in 2016 and 2015 (a)(b) | 3 | 4 | 1 | 2 | ||
Current period OCI, net of taxes | 2 | 7 | 1 | 2 | ||
Ending balance, accumulated OCI, net of taxes | $(32) | $(38) | $(8) | $(9) | ||
(a) | Tax reclassified from accumulated OCI is reported in the income tax expense line item of the consolidated income statement. |
(b) | For the portion of unrecognized pension and other postretirement benefit costs relating to the Utilities, costs are recorded into, and amortized out of, regulatory assets instead of OCI. The net actuarial losses and prior service costs recognized during the period are included in the computation of total periodic pension and other postretirement benefit cost. See Notes E and F. |
Note B — Regulatory Matters
Rate Plans
CECONY - Electric
In September 2016, CECONY, the staff of the New York State Public Service Commission (NYSPSC) and other parties entered into a Joint Proposal for a CECONY electric rate plan for the three-year period January 2017 through December 2019. The Joint Proposal is subject to NYSPSC approval. The following table contains a summary of the electric rate plan.
19
Effective period | January 2017 - December 2019 | |
Base rate changes (a) | Yr. 1 - $195 million Yr. 2 - $155 million Yr. 3 - $155 million | |
Amortizations to income of net regulatory (assets) liabilities | Yr. 1 - $84 million Yr. 2 - $83 million Yr. 3 - $69 million | |
Other revenue sources | Retention of $75 million of annual transmission congestion revenues. Potential earnings adjustment mechanism incentives for energy efficiency and other potential incentives of up to: Yr. 1 - $28 million; Yr. 2 - $47 million; and Yr. 3 - $64 million. | |
Revenue decoupling mechanism | Continuation of reconciliation of actual to authorized electric delivery revenues. | |
Recoverable energy costs | Continuation of current rate recovery of purchased power and fuel costs. | |
Negative revenue adjustments | Potential penalties if certain performance targets relating to service, reliability, safety and other matters are not met: Yr. 1 - $376 million; Yr. 2 - $383 million; and Yr. 3 - $395 million. | |
Cost reconciliations | Continuation of reconciliation of expenses for pension and other postretirement benefits, variable-rate tax-exempt debt, major storms, property taxes(b), municipal infrastructure support costs(c), the impact of new laws and environmental site investigation and remediation to amounts reflected in rates.(d) | |
Net utility plant reconciliations | Target levels reflected in rates: Electric average net plant target excluding advanced metering infrastructure (AMI): Yr. 1 - $21,689 million; Yr. 2 - $22,338 million; Yr. 3 - $23,002 million AMI: Yr. 1 - $126 million; Yr. 2 - $257 million; Yr. 3 - $415 million | |
Average rate base | Yr. 1 - $18,902 million Yr. 2 - $19,530 million Yr. 3 - $20,277 million | |
Weighted average cost of capital (after-tax) | Yr. 1 - 6.82 percent Yr. 2 - 6.80 percent Yr. 3 - 6.73 percent | |
Authorized return on common equity | 9.00 percent | |
Earnings sharing | Most earnings above an annual earnings threshold of 9.5 percent are to be applied to reduce regulatory assets for environmental remediation and other costs accumulated in the rate year. | |
Cost of long-term debt | Yr. 1 - 4.93 percent Yr. 2 - 4.88 percent Yr. 3 - 4.74 percent | |
Common equity ratio | 48 percent | |
(a) | The electric base rate increases shown above are in addition to a $48 million increase resulting from the December 2016 expiration of a temporary credit under the current rate plan. At the NYSPSC’s option, these increases may be implemented with increases of $199 million in each rate year. |
(b) | Deferrals for property taxes are limited to 90 percent of the difference from amounts reflected in rates, subject to an annual maximum for the remaining difference of not more than a maximum number of basis points impact on return on common equity: Yr. 1 - 10.0 basis points; Yr. 2 - 7.5 basis points; and Yr. 3 - 5.0 basis points. |
(c) | In general, if actual expenses for municipal infrastructure support (other than company labor) are below the amounts reflected in rates the company will defer the difference for credit to customers, and if the actual expenses are above the amount reflected in rates the company will defer for recovery from customers 80 percent of the difference subject to a maximum deferral of 30 percent of the amount reflected in rates. |
(d) | In addition, amounts reflected in rates relating to the regulatory asset for future income tax and the excess deferred federal income tax liability are subject to reconciliation. The NYSPSC staff is to audit the regulatory asset and the tax liability. Differences resulting from the NYSPSC staff review will be deferred for NYSPSC determination of any amounts to be refunded or collected from customers. |
In April 2016, the Federal Energy Regulatory Commission (FERC) rejected CECONY’s challenge to FERC’s approval of substantially increased charges allocated to CECONY for transmission service provided pursuant to the open access tariff of PJM Interconnection LLC (PJM). CECONY will continue to challenge FERC’s approval of the increased charges that will be incurred over the remaining contract term, and in May 2016 filed an appeal of FERC's decision with the U.S. Court of Appeals. In April 2016, CECONY notified PJM that it will not be exercising its option to continue the service beyond April 2017.
CECONY - Gas
In September 2016, CECONY, the staff of the NYSPSC and other parties entered into a Joint Proposal for a CECONY gas rate plan for the three-year period January 2017 through December 2019. The Joint Proposal is subject to NYSPSC approval. The following table contains a summary of the gas rate plan.
20
Effective period | January 2017 - December 2019 | |
Base rate changes | Yr. 1 - $(5) million(a) Yr. 2 - $92 million Yr. 3 - $90 million | |
Amortizations to income of net regulatory (assets) liabilities | Yr. 1 - $39 million Yr. 2 - $37 million Yr. 3 - $36 million | |
Other revenue sources | Retention of annual revenues from non-firm customers of up to $65 million and 15 percent of any such revenues above $65 million. Potential incentives if performance targets related to gas leak backlog, leak prone pipe and service terminations are met: Yr. 1 - $7 million; Yr. 2 - $8 million; and Yr. 3 - $8 million. | |
Revenue decoupling mechanism | Continuation of reconciliation of actual to authorized gas delivery revenues. | |
Recoverable energy costs | Continuation of current rate recovery of purchased gas costs. | |
Negative revenue adjustments | Potential penalties if performance targets relating to service, safety and other matters are not met: Yr. 1 - $68 million; Yr. 2 - $75 million; and Yr. 3 - $83 million. | |
Cost reconciliations | Continuation of reconciliation of expenses for pension and other postretirement benefits, variable-rate tax-exempt debt, major storms, property taxes, municipal infrastructure support costs, the impact of new laws and environmental site investigation and remediation to amounts reflected in rates.(b) | |
Net utility plant reconciliations | Target levels reflected in rates: Gas average net plant target excluding AMI: Yr. 1 - $5,844 million; Yr. 2 - $6,512 million; Yr. 3 - $7,177 million AMI: Yr. 1 - $27 million; Yr. 2 - $57 million; Yr. 3 - $100 million | |
Average rate base | Yr. 1 - $4,841 million Yr. 2 - $5,395 million Yr. 3 - $6,005 million | |
Weighted average cost of capital (after-tax) | Yr. 1 - 6.82 percent Yr. 2 - 6.80 percent Yr. 3 - 6.73 percent | |
Authorized return on common equity | 9.00 percent | |
Earnings sharing | Most earnings above an annual earnings threshold of 9.5 percent are to be applied to reduce regulatory assets for environmental remediation and other costs accumulated in the rate year. | |
Cost of long-term debt | Yr. 1 - 4.93 percent Yr. 2 - 4.88 percent Yr. 3 - 4.74 percent | |
Common equity ratio | 48 percent | |
(a) | The base rate decrease is offset by a $41 million increase resulting from the December 2016 expiration of a temporary credit under the current rate plan. |
(b) | See footnotes (b), (c) and (d) to the table under “CECONY-Electric,” above. |
Rockland Electric Company (RECO)
In April 2016, RECO filed a request with the New Jersey Board of Public Utilities for an electric rate increase of $10 million, effective March 2017. The filing reflected a return on common equity of 10.20 percent and a common equity ratio of 49.81 percent. In October 2016, RECO filed an update to its April 2016 request. The company decreased its requested March 2017 rate increase by $4 million to $6 million. The updated filing reflects a return on common equity of 10.20 percent and a common equity ratio of 50.15 percent. The filing reflects continuation of provisions pursuant to which the company recovers its purchased power and fuel costs from customers.
21
Other Regulatory Matters
In April 2016, the NYSPSC approved the September 2015 Joint Proposal among CECONY, the NYSPSC staff and others with respect to the prudence proceeding the NYSPSC commenced in February 2009 and related matters. Pursuant to the Joint Proposal, the company is required to credit $116 million to customers and, for the period 2017 through 2044, to not seek to recover from customers an aggregate $55 million relating to return on its capital expenditures. In addition, the company’s revenues that were made subject to potential refund in this proceeding are no longer subject to refund. At September 30, 2016, the company had a $96 million regulatory liability for the remaining amount to be credited to customers related to this matter.
In June 2014, the NYSPSC initiated a proceeding to investigate the practices of qualifying persons to perform plastic fusions on gas facilities. New York State regulations require gas utilities to qualify and, except in certain circumstances, annually requalify workers that perform fusion to join plastic pipe. The NYSPSC directed the New York gas utilities to provide information in this proceeding about their compliance with the qualification and requalification requirements and related matters; their procedures for compliance with all gas safety regulations; and their annual chief executive officer certifications regarding these and other procedures. CECONY’s qualification and requalification procedures had not included certain required testing to evaluate specimen fuses. In addition, CECONY and O&R had not timely requalified certain workers that had been qualified under their respective procedures to perform fusion to join plastic pipe. CECONY and O&R have requalified their workers who perform plastic pipe fusions. In May 2015, the NYSPSC, which indicated that it would address enforcement at a later date, ordered CECONY, O&R and other gas utilities to perform risk assessment and remediation plans, additional leakage surveying and reporting; CECONY to hire an independent statistician to develop a risk assessment and remediation plan; and the gas utilities to implement certain new plastic fusion requirements. In December 2015, the NYSPSC staff informed O&R that the company had satisfactorily completed its risk assessment and remediation plan. CECONY submitted its risk assessment and remediation plan to the NYSPSC staff in October 2016.
In November 2015, the NYSPSC ordered CECONY to show cause why the NYSPSC should not commence proceedings to penalize the company for alleged violations of gas safety regulations identified by the NYSPSC staff in its investigation of a March 2014 explosion and fire and to review the prudence of the company's conduct associated with the incident. See "Manhattan Explosion and Fire" in Note H. In December 2015, the company responded that the NYSPSC should not institute the proceedings and disputed the alleged violations.
At September 30, 2016, CECONY had a $28 million regulatory liability related to the June 2014 plastic fusion proceeding and the November 2015 order to show cause. The company is unable to estimate the amount or range of its possible loss related to these matters in excess of this regulatory liability.
CECONY has incurred costs for gas emergency response activities in 2014, 2015 and 2016 in excess of amounts reflected in the company’s gas rate plan. The company has requested NYSPSC authorization to defer as a regulatory asset $29 million and $35 million of such incremental costs incurred in 2014 and 2015, respectively. The company estimates that it will incur $37 million of such incremental costs in 2016. At September 30, 2016, the company had not deferred any such incremental costs.
22
Regulatory Assets and Liabilities
Regulatory assets and liabilities at September 30, 2016 and December 31, 2015 were comprised of the following items:
Con Edison | CECONY | ||||||
(Millions of Dollars) | 2016 | 2015 | 2016 | 2015 | |||
Regulatory assets | |||||||
Unrecognized pension and other postretirement costs | $3,369 | $3,876 | $3,220 | $3,697 | |||
Future income tax | 2,429 | 2,350 | 2,312 | 2,232 | |||
Environmental remediation costs | 823 | 904 | 720 | 800 | |||
Revenue taxes | 298 | 253 | 283 | 240 | |||
Deferred storm costs | 89 | 185 | 30 | 110 | |||
Deferred derivative losses | 55 | 50 | 49 | 46 | |||
Unamortized loss on reacquired debt | 45 | 50 | 43 | 48 | |||
Surcharge for New York State assessment | 43 | 44 | 40 | 40 | |||
O&R property tax reconciliation | 39 | 46 | — | — | |||
Pension and other postretirement benefits deferrals | 34 | 45 | 3 | 16 | |||
Net electric deferrals | 29 | 44 | 29 | 44 | |||
Preferred stock redemption | 25 | 26 | 25 | 26 | |||
O&R transition bond charges | 16 | 21 | — | — | |||
Workers’ compensation | 15 | 11 | 15 | 11 | |||
Recoverable energy costs | 7 | 16 | 5 | 15 | |||
Other | 228 | 175 | 212 | 157 | |||
Regulatory assets – noncurrent | 7,544 | 8,096 | 6,986 | 7,482 | |||
Deferred derivative losses | 94 | 113 | 87 | 103 | |||
Recoverable energy costs | 25 | 19 | 24 | 18 | |||
Regulatory assets – current | 119 | 132 | 111 | 121 | |||
Total Regulatory Assets | $7,663 | $8,228 | $7,097 | $7,603 | |||
Regulatory liabilities | |||||||
Allowance for cost of removal less salvage | $713 | $676 | $602 | $570 | |||
Property tax reconciliation | 205 | 303 | 205 | 303 | |||
Pension and other postretirement benefit deferrals | 163 | 76 | 130 | 46 | |||
Net unbilled revenue deferrals | 121 | 109 | 121 | 109 | |||
Prudence proceeding | 96 | 99 | 96 | 99 | |||
Unrecognized other postretirement costs | 91 | 28 | 91 | 28 | |||
New York State income tax rate change | 66 | 75 | 64 | 72 | |||
Base rate change deferrals | 62 | 128 | 62 | 128 | |||
Variable-rate tax-exempt debt – cost rate reconciliation | 60 | 70 | 52 | 60 | |||
Carrying charges on repair allowance and bonus depreciation | 57 | 49 | 56 | 48 | |||
Earnings sharing - electric, gas and steam | 34 | 80 | 26 | 80 | |||
Net utility plant reconciliations | 27 | 32 | 27 | 31 | |||
Property tax refunds | 12 | 44 | 12 | 44 | |||
World Trade Center settlement proceeds | 5 | 21 | 5 | 21 | |||
Other | 208 | 187 | 176 | 150 | |||
Regulatory liabilities – noncurrent | 1,920 | 1,977 | 1,725 | 1,789 | |||
Revenue decoupling mechanism | 74 | 45 | 70 | 45 | |||
Refundable energy costs | 37 | 64 | 18 | 33 | |||
Deferred derivative gains | 12 | 6 | 8 | 6 | |||
Regulatory liabilities – current | 123 | 115 | 96 | 84 | |||
Total Regulatory Liabilities | $2,043 | $2,092 | $1,821 | $1,873 | |||
23
Note C — Capitalization
In February 2016, a Con Edison Development subsidiary issued $218 million aggregate principal amount of 4.21 percent senior notes, due 2041, secured by the company's Texas Solar 7 solar project.
In May 2016, Con Edison issued approximately 10 million common shares resulting in net proceeds, after issuance expenses, of $702 million, and $500 million aggregate principal amount of 2.00 percent debentures, due 2021. Also, in May 2016, a Con Edison Development subsidiary issued $95 million aggregate principal amount of 4.07 percent senior notes, due 2036, secured by the company's California Holding 3 solar projects. In June 2016, Con Edison borrowed $400 million pursuant to a credit agreement with a syndicate of banks. The borrowing matures in 2018 and bears interest at a LIBOR plus margin of 1.00 percent. Also in June 2016, CECONY issued $550 million aggregate principal amount of 3.85 percent debentures, due 2046. Also, in June 2016, a Con Edison Solutions subsidiary borrowed $2 million pursuant to a loan agreement with a New Jersey utility. The borrowing matures in 2026, bears interest of 11.18 percent and may be repaid in cash or project Solar Renewable Energy Certificates.
In September 2016, CECONY redeemed at maturity $400 million aggregate principal amount of 5.50 percent debentures. In September 2016, O&R agreed to issue and sell for delivery in December 2016 $75 million aggregate principal amount of 3.88 percent debentures, due 2046. In October 2016, O&R redeemed at maturity $75 million aggregate principal amount of 5.45 percent debentures.
The carrying amounts and fair values of long-term debt at September 30, 2016 and December 31, 2015 were:
(Millions of Dollars) | 2016 | 2015 | ||
Long-Term Debt (including current portion) | Carrying Amount | Fair Value | Carrying Amount | Fair Value |
Con Edison | $14,093 | $16,325 | $12,745 | $13,856 |
CECONY | $11,584 | $13,564 | $11,437 | $12,427 |
Fair values of long-term debt have been estimated primarily using available market information. For Con Edison, $15,689 million and $636 million of the fair value of long-term debt at September 30, 2016 are classified as Level 2 and Level 3, respectively. For CECONY, $12,928 million and $636 million of the fair value of long-term debt at September 30, 2016 are classified as Level 2 and Level 3, respectively (see Note L). The $636 million of long-term debt classified as Level 3 is CECONY’s tax-exempt, auction-rate securities for which the market is highly illiquid and there is a lack of observable inputs.
Note D — Short-Term Borrowing
At September 30, 2016, Con Edison had $601 million of commercial paper outstanding of which $480 million was outstanding under CECONY’s program. The weighted average interest rate at September 30, 2016 was 0.7 percent for both Con Edison and CECONY. At December 31, 2015, Con Edison had $1,529 million of commercial paper outstanding of which $1,033 million was outstanding under CECONY’s program. The weighted average interest rate at December 31, 2015 was 0.7 percent for both Con Edison and CECONY.
At September 30, 2016 and December 31, 2015, no loans were outstanding under the credit agreement (Credit Agreement) and $2 million (including $2 million for CECONY) and $15 million of letters of credit were outstanding under the Credit Agreement, respectively.
Note E — Pension Benefits
Total Periodic Benefit Cost
The components of the Companies’ total periodic benefit costs for the three and nine months ended September 30, 2016 and 2015 were as follows:
24
For the Three Months Ended September 30, | |||||||
Con Edison | CECONY | ||||||
(Millions of Dollars) | 2016 | 2015 | 2016 | 2015 | |||
Service cost – including administrative expenses | $69 | $74 | $65 | $70 | |||
Interest cost on projected benefit obligation | 149 | 144 | 140 | 135 | |||
Expected return on plan assets | (237) | (222) | (225) | (210) | |||
Recognition of net actuarial loss | 149 | 194 | 141 | 183 | |||
Recognition of prior service costs | 1 | 1 | — | — | |||
NET PERIODIC BENEFIT COST | $131 | $191 | $121 | $178 | |||
Amortization of regulatory asset | — | 1 | — | 1 | |||
TOTAL PERIODIC BENEFIT COST | $131 | $192 | $121 | $179 | |||
Cost capitalized | (51) | (80) | (49) | (76) | |||
Reconciliation to rate level | 10 | (14) | 13 | (14) | |||
Cost charged to operating expenses | $90 | $98 | $85 | $89 | |||
For the Nine Months Ended September 30, | ||||||
Con Edison | CECONY | |||||
(Millions of Dollars) | 2016 | 2015 | 2016 | 2015 | ||
Service cost – including administrative expenses | $207 | $223 | $194 | $209 | ||
Interest cost on projected benefit obligation | 447 | 431 | 419 | 404 | ||
Expected return on plan assets | (711) | (664) | (674) | (630) | ||
Recognition of net actuarial loss | 447 | 581 | 424 | 550 | ||
Recognition of prior service costs | 3 | 3 | 1 | 1 | ||
NET PERIODIC BENEFIT COST | $393 | $574 | $364 | $534 | ||
Amortization of regulatory asset | — | 2 | — | 2 | ||
TOTAL PERIODIC BENEFIT COST | $393 | $576 | $364 | $536 | ||
Cost capitalized | (157) | (224) | (148) | (214) | ||
Reconciliation to rate level | 35 | (56) | 39 | (56) | ||
Cost charged to operating expenses | $271 | $296 | $255 | $266 | ||
Expected Contributions
Based on estimates as of September 30, 2016, the Companies expect to make contributions to the pension plans during 2016 of $508 million (of which $469 million is to be contributed by CECONY). The Companies’ policy is to fund the total periodic benefit cost of the qualified plan to the extent tax deductible and to also contribute to the non-qualified supplemental plans. During the first nine months of 2016, the Companies contributed $504 million (of which $466 million was contributed by CECONY) to the pension plans. CECONY also contributed $17 million to its external trust for supplemental plans.
Note F — Other Postretirement Benefits
Total Periodic Benefit Cost
The components of the Companies’ total periodic other postretirement benefit costs for the three and nine months ended September 30, 2016 and 2015 were as follows:
For the Three Months Ended September 30, | ||||
Con Edison | CECONY | |||
(Millions of Dollars) | 2016 | 2015 | 2016 | 2015 |
Service cost | $4 | $5 | $3 | $4 |
Interest cost on accumulated other postretirement benefit obligation | 12 | 13 | 10 | 11 |
Expected return on plan assets | (19) | (20) | (17) | (17) |
Recognition of net actuarial loss | 1 | 8 | 1 | 7 |
Recognition of prior service cost | (5) | (5) | (3) | (4) |
TOTAL PERIODIC OTHER POSTRETIREMENT BENEFIT COST | $(7) | $1 | $(6) | $1 |
Cost capitalized | 2 | (1) | 2 | (1) |
Reconciliation to rate level | 7 | 4 | 6 | 2 |
Cost charged to operating expenses | $2 | $4 | $2 | $2 |
25
For the Nine Months Ended September 30, | ||||
Con Edison | CECONY | |||
(Millions of Dollars) | 2016 | 2015 | 2016 | 2015 |
Service cost | $13 | $15 | $10 | $11 |
Interest cost on accumulated other postretirement benefit obligation | 36 | 38 | 30 | 32 |
Expected return on plan assets | (58) | (59) | (50) | (51) |
Recognition of net actuarial loss | 4 | 24 | 2 | 21 |
Recognition of prior service cost | (15) | (15) | (11) | (10) |
TOTAL PERIODIC OTHER POSTRETIREMENT BENEFIT COST | $(20) | $3 | $(19) | $3 |
Cost capitalized | 5 | (2) | 5 | (2) |
Reconciliation to rate level | 20 | 12 | 19 | 5 |
Cost charged to operating expenses | $5 | $13 | $5 | $6 |
Contributions
During the first nine months of 2016, the Companies contributed $6 million, nearly all of which was contributed by CECONY, to the other postretirement benefit plans. The Companies' policy is to fund the total periodic benefit cost of the plans to the extent tax deductible.
Note G — Environmental Matters
Superfund Sites
Hazardous substances, such as asbestos, polychlorinated biphenyls (PCBs) and coal tar, have been used or generated in the course of operations of the Utilities and their predecessors and are present at sites and in facilities and equipment they currently or previously owned, including sites at which gas was manufactured or stored.
The Federal Comprehensive Environmental Response, Compensation and Liability Act of 1980 and similar state statutes (Superfund) impose joint and several liability, regardless of fault, upon generators of hazardous substances for investigation and remediation costs (which include costs of demolition, removal, disposal, storage, replacement, containment and monitoring) and natural resource damages. Liability under these laws can be material and may be imposed for contamination from past acts, even though such past acts may have been lawful at the time they occurred. The sites at which the Utilities have been asserted to have liability under these laws, including their manufactured gas plant sites and any neighboring areas to which contamination may have migrated, are referred to herein as “Superfund Sites.”
For Superfund Sites where there are other potentially responsible parties and the Utilities are not managing the site investigation and remediation, the accrued liability represents an estimate of the amount the Utilities will need to pay to investigate and, where determinable, discharge their related obligations. For Superfund Sites (including the manufactured gas plant sites) for which one of the Utilities is managing the investigation and remediation, the accrued liability represents an estimate of the company’s share of the undiscounted cost to investigate the sites and, for sites that have been investigated in whole or in part, the cost to remediate the sites, if remediation is necessary and if a reasonable estimate of such cost can be made. Remediation costs are estimated in light of the information available, applicable remediation standards and experience with similar sites.
The accrued liabilities and regulatory assets related to Superfund Sites at September 30, 2016 and December 31, 2015 were as follows:
Con Edison | CECONY | |||
(Millions of Dollars) | 2016 | 2015 | 2016 | 2015 |
Accrued Liabilities: | ||||
Manufactured gas plant sites | $664 | $679 | $574 | $579 |
Other Superfund Sites | 88 | 86 | 87 | 86 |
Total | $752 | $765 | $661 | $665 |
Regulatory assets | $823 | $904 | $720 | $800 |
Most of the accrued Superfund Site liability relates to sites that have been investigated, in whole or in part. However, for some of the sites, the extent and associated cost of the required remediation has not yet been determined. As investigations progress and information pertaining to the required remediation becomes available,
26
the Utilities expect that additional liability may be accrued, the amount of which is not presently determinable but may be material. The Companies are unable to estimate the time period over which the remaining accrued liability will be incurred because, among other things, the required remediation has not been determined for some of the sites. Under their current rate plans, the Utilities are permitted to recover or defer as regulatory assets (for subsequent recovery through rates) certain site investigation and remediation costs.
Environmental remediation costs incurred related to Superfund Sites for the three and nine months ended September 30, 2016 and 2015 were as follows:
For the Three Months Ended September 30, | ||||
Con Edison | CECONY | |||
(Millions of Dollars) | 2016 | 2015 | 2016 | 2015 |
Remediation costs incurred | $8 | $6 | $5 | $6 |
For the Nine Months Ended September 30, | ||||
Con Edison | CECONY | |||
(Millions of Dollars) | 2016 | 2015 | 2016 | 2015 |
Remediation costs incurred | $20 | $21 | $10 | $18 |
Con Edison and CECONY received $1 million in insurance recoveries for the three and nine months ended September 30, 2016. No insurance recoveries were received by Con Edison or CECONY for the three and nine months ended September 30, 2015.
In 2015, Con Edison and CECONY estimated that for their manufactured gas plant sites (including CECONY’s Astoria site), the aggregate undiscounted potential liability for the investigation and remediation of coal tar and/or other environmental contaminants could range up to $2.8 billion and $2.7 billion, respectively. These estimates were based on the assumption that there is contamination at all sites, including those that have not yet been fully investigated and additional assumptions about the extent of the contamination and the type and extent of the remediation that may be required. Actual experience may be materially different.
Asbestos Proceedings
Suits have been brought in New York State and federal courts against the Utilities and many other defendants, wherein a large number of plaintiffs sought large amounts of compensatory and punitive damages for deaths and injuries allegedly caused by exposure to asbestos at various premises of the Utilities. The suits that have been resolved, which are many, have been resolved without any payment by the Utilities, or for amounts that were not, in the aggregate, material to them. The amounts specified in all the remaining thousands of suits total billions of dollars; however, the Utilities believe that these amounts are greatly exaggerated, based on the disposition of previous claims. At September 30, 2016, Con Edison and CECONY had accrued their estimated aggregate undiscounted potential liabilities for these suits and additional suits that may be brought over the next 15 years as shown in the following table. The estimates were based upon a combination of modeling, historical data analysis and risk factor assessment. Trial courts have begun, and unless otherwise determined by an appellate court may continue, to apply a different standard for determining liability in asbestos suits than the standard that applied historically. As a result, the Companies currently believe that there is a reasonable possibility of an exposure to loss in excess of the liability accrued for the suits. The Companies are unable to estimate the amount or range of such loss. In addition, certain current and former employees have claimed or are claiming workers’ compensation benefits based on alleged disability from exposure to asbestos. Under its current rate plans, CECONY is permitted to defer as regulatory assets (for subsequent recovery through rates) costs incurred for its asbestos lawsuits and workers’ compensation claims.
The accrued liability for asbestos suits and workers’ compensation proceedings (including those related to asbestos exposure) and the amounts deferred as regulatory assets for the Companies at September 30, 2016 and December 31, 2015 were as follows:
27
Con Edison | CECONY | |||
(Millions of Dollars) | 2016 | 2015 | 2016 | 2015 |
Accrued liability – asbestos suits | $8 | $8 | $7 | $7 |
Regulatory assets – asbestos suits | $8 | $8 | $7 | $7 |
Accrued liability – workers’ compensation | $90 | $86 | $85 | $81 |
Regulatory assets – workers’ compensation | $15 | $11 | $15 | $11 |
Note H — Other Material Contingencies
Manhattan Steam Main Rupture
In July 2007, a CECONY steam main located in midtown Manhattan ruptured. It has been reported that one person died and others were injured as a result of the incident. Several buildings in the area were damaged. Debris from the incident included dirt and mud containing asbestos. The response to the incident required the closing of several buildings and streets for various periods. Approximately sixty suits are pending against the company seeking generally unspecified compensatory and, in some cases, punitive damages, for wrongful death, personal injury, property damage and business interruption. The company has notified its insurers of the incident and believes that the policies in force at the time of the incident will cover the company’s costs to satisfy its liability to others in connection with the suits. In the company’s estimation, there is not a reasonable possibility that an exposure to loss exists for the suits that is materially in excess of the estimated liability accrued. At September 30, 2016, the company has accrued its estimated liability for the suits of $30 million and an insurance receivable of $39 million.
Manhattan Explosion and Fire
On March 12, 2014, two multi-use five-story tall buildings located on Park Avenue between 116th and 117th Street in Manhattan were destroyed by an explosion and fire. CECONY had delivered gas to the buildings through service lines from a distribution main located below ground on Park Avenue. Eight people died and more than 50 people were injured. Additional buildings were also damaged. The National Transportation Safety Board (NTSB) investigated. The parties to the investigation included the company, the City of New York, the Pipeline and Hazardous Materials Safety Administration and the NYSPSC (which also conducted an investigation). In June 2015, the NTSB issued a final report concerning the incident, its probable cause and safety recommendations. The NTSB determined that the probable cause of the incident was (1) the failure of a defective fusion joint at a service tee (which joined a plastic service line to a plastic distribution main) installed by the company that allowed gas to leak from the distribution main and migrate into a building where it ignited and (2) a breach in a City sewer line that allowed groundwater and soil to flow into the sewer, resulting in a loss of support for the distribution main, which caused it to sag and overstressed the defective fusion joint. The NTSB also made safety recommendations, including recommendations to the company that addressed its procedures for the preparation and examination of plastic fusions, training of its staff on conditions for notifications to the City’s Fire Department and extension of its gas main isolation valve installation program. Approximately seventy suits are pending against the company seeking generally unspecified damages and, in some cases, punitive damages, for wrongful death, personal injury, property damage and business interruption. The company has notified its insurers of the incident and believes that the policies in force at the time of the incident will cover the company’s costs, in excess of a required retention (the amount of which is not material), to satisfy any liability it may have for damages in connection with the incident. The company is unable to estimate the amount or range of its possible loss for damages related to the incident. At September 30, 2016, the company had not accrued a liability for damages related to the incident.
Other Contingencies
See “Other Regulatory Matters” in Note B and “Uncertain Tax Positions” in Note I.
Guarantees
Con Edison and its subsidiaries enter into various agreements providing financial or performance assurance primarily to third parties on behalf of their subsidiaries. Maximum amounts guaranteed by Con Edison totaled $2,422 million and $2,856 million at September 30, 2016 and December 31, 2015, respectively.
28
A summary, by type and term, of Con Edison’s total guarantees at September 30, 2016 is as follows:
Guarantee Type | 0 – 3 years | 4 – 10 years | > 10 years | Total | |||
(Millions of Dollars) | |||||||
Con Edison Transmission | $618 | $430 | $— | $1,048 | |||
Energy transactions | 635 | 57 | 91 | 783 | |||
Renewable electric production projects | 445 | — | 18 | 463 | |||
Other | 128 | — | — | 128 | |||
Total | $1,826 | $487 | $109 | $2,422 | |||
Con Edison Transmission — Con Edison has guaranteed payment by CET Electric of the contributions CET Electric agreed to make to New York Transco LLC (NY Transco). CET Electric acquired a 45.7 percent interest in NY Transco when it was formed in 2014. NY Transco’s transmission projects are expected to be initially developed by CECONY and other New York transmission owners and then transferred to NY Transco. In May 2016, the transmission owners transferred certain projects to NY Transco, as to which CET Electric made its required contributions. The other projects that were proposed when NY Transco was formed remain subject to certain authorizations from the NYSPSC, the FERC and, as applicable, other federal, state and local agencies. Guarantee amount shown is for the maximum possible required amount of CET Electric’s contributions for these other projects as calculated based on the assumptions that the projects are completed at 175 percent of their estimated costs and NY Transco does not use any debt financing for the projects. Guarantee term shown is assumed as the timing of the contributions is not certain. Also included within the table above is a guarantee for $25 million from Con Edison on behalf of CET Gas in relation to a proposed gas transmission project in West Virginia and Virginia. See Note P.
Energy Transactions — Con Edison guarantees payments on behalf of its competitive energy businesses in order to facilitate physical and financial transactions in electricity, gas, pipeline capacity, transportation, oil, renewable energy credits and energy services. To the extent that liabilities exist under the contracts subject to these guarantees, such liabilities are included in Con Edison’s consolidated balance sheet. Guarantee amounts shown above include $123 million of guarantees or other credit support provided by Con Edison on behalf of Con Edison Solutions that may continue in effect during the period in which Con Edison Solutions provides transition services in connection with the retail electric supply business it sold in September 2016. See Note P. As part of the sale agreement, the purchaser has agreed to pay Con Edison Solutions for draws on such guarantees or other credit support.
Renewable Electric Production Projects — Con Edison, Con Edison Development, and Con Edison Solutions guarantee payments associated with the investment in solar and wind energy facilities on behalf of their wholly-owned subsidiaries.
Other — Other guarantees include $70 million in guarantees provided by Con Edison to Travelers Insurance Company for indemnity agreements for surety bonds in connection with energy service projects and operation of solar energy facilities of Con Edison Solutions and Con Edison Development, respectively. Other guarantees also includes Con Edison's guarantee (subject to a $53 million maximum amount) of certain obligations of Con Edison Solutions under its agreement to sell its retail electric supply business. See Note P. In addition, Con Edison issued a guarantee estimated at $5 million to the Public Utility Commission of Texas covering obligations of Con Edison Solutions as a retail electric provider. As part of the sale agreement for the retail electric supply business discussed above, the purchaser has agreed to pay Con Edison Solutions for draws on the guarantee to the Public Utility Commission of Texas.
Note I — Income Tax
Con Edison’s income tax expense increased to $314 million for the three months ended September 30, 2016 from $249 million for the three months ended September 30, 2015. Con Edison's effective tax rate for the three months ended September 30, 2016 and 2015 was 39 percent and 37 percent, respectively. The increase in Con Edison's effective tax rate is primarily due to higher state income taxes and a decrease in tax benefits for plant-related flow through items, offset in part by higher tax benefits for injuries and damages payments, research and development tax credits and renewable energy tax credits.
CECONY’s income tax expense increased to $226 million for the three months ended September 30, 2016 from $222 million for the three months ended September 30, 2015. CECONY's effective tax rate for the three months ended September 30, 2016 and 2015 was 37 percent. The decrease in tax benefits for plant-related flow through items, were more than offset by lower state income taxes and increased tax benefits as a result of higher injuries and damages payments and research and development tax credits.
29
Con Edison’s income tax expense increased to $602 million for the nine months ended September 30, 2016 from $548 million for the nine months ended September 30, 2015. Con Edison's effective tax rate for the nine months ended September 30, 2016 and 2015 was 37 percent and 35 percent, respectively. The increase in Con Edison's effective tax rate is primarily due to higher state income taxes and a decrease in tax benefits for plant-related flow through items, offset in part by higher tax benefits for injuries and damages payments, research and development tax credits and renewable energy tax credits.
CECONY’s income tax expense decreased to $491 million for the nine months ended September 30, 2016 from $515 million for the nine months ended September 30, 2015. CECONY's effective tax rate for the nine months ended September 30, 2016 and 2015 was 36 percent and 35 percent, respectively. The increase in CECONY's effective tax rate is primarily related to a decrease in tax benefits for plant-related flow through items, offset in part by lower state income taxes and increased research and development tax credits.
In September 2016, Con Edison filed its 2015 federal income tax return, requesting a refund of $19 million of estimated tax payments and, in October 2016, the company received the refund. The company carried back a 2015 net operating loss to 2007, requesting a refund of $16 million of federal income tax and, in October 2016, the company received the refund. Con Edison anticipates a federal net operating loss for 2016, primarily due to bonus depreciation. Con Edison expects to carryback a portion of its 2016 net operating loss and recover $32 million of income tax. General business tax credits that became available as a result of the net operating loss carryback, as well as the remaining 2016 net operating loss will be carried forward to future tax years. A deferred tax asset for these tax attribute carryforwards was recorded, and no valuation allowance has been provided, as it is more likely than not that the deferred tax asset will be realized.
Uncertain Tax Positions
At September 30, 2016, the estimated liability for uncertain tax positions for Con Edison was $37 million ($5 million for CECONY). Con Edison reasonably expects to resolve approximately $29 million ($20 million, net of federal taxes) of its uncertain tax positions within the next twelve months, of which the entire amount, if recognized, would reduce Con Edison’s effective tax rate. The amount related to CECONY is approximately $5 million ($4 million, net of federal taxes), of which the entire amount, if recognized, would reduce CECONY’s effective tax rate. The total amount of unrecognized tax benefits, if recognized, that would reduce Con Edison’s effective tax rate is $37 million ($25 million, net of federal taxes).
The Companies recognize interest on liabilities for uncertain tax positions in interest expense and would recognize penalties, if any, in operating expenses in the Companies’ consolidated income statements. In the three and nine months ended September 30, 2016, the Companies recognized an immaterial amount of interest expense and no penalties for uncertain tax positions in their consolidated income statements. At September 30, 2016 and December 31, 2015, the Companies recognized an immaterial amount of accrued interest on their consolidated balance sheets.
30
Note J — Financial Information by Business Segment
Con Edison’s principal business segments prior to June 2016 were CECONY’s regulated utility activities, O&R’s regulated utility activities and Con Edison’s competitive energy businesses. CECONY’s principal business segments are its regulated electric, gas and steam utility activities. In 2016, Con Edison Transmission began investing, through CET Electric and CET Gas, in electric transmission and gas pipeline and storage assets (see Note P). As a result of these investments, in June 2016 Con Edison changed its business segments to add Con Edison Transmission as a separate reportable segment based on management’s reporting and decision-making, including performance evaluation and resource allocation. For comparison purposes, the previously reported financial information by business segments was reclassified to reflect the current business segment presentation.
The financial data for the business segments are as follows:
As of and for the Three Months Ended September 30, | ||||||||||||||||||||||||||||||||||||||
Operating revenues | Inter-segment revenues | Depreciation and amortization | Operating income | Other income (deductions) | Interest charges | Income taxes on operating income | Total assets | Construction expenditures | ||||||||||||||||||||||||||||||
(Millions of Dollars) | 2016 | 2015 | 2016 | 2015 | 2016 | 2015 | 2016 | 2015 | 2016 | 2015 | 2016 | 2015 | 2016 | 2015 | 2016 | 2015 | 2016 | 2015 | ||||||||||||||||||||
CECONY | ||||||||||||||||||||||||||||||||||||||
Electric | $2,557 | $2,558 | $5 | $4 | $217 | $207 | $841 | $811 | $2 | $(2) | $117 | $111 | $275 | $260 | $30,580 | $30,369 | $411 | $419 | ||||||||||||||||||||
Gas | 208 | 213 | 1 | 1 | 41 | 35 | (28) | (17) | — | (1) | 27 | 24 | (24) | (17) | 7,300 | 6,687 | 224 | 178 | ||||||||||||||||||||
Steam | 63 | 58 | 22 | 22 | 20 | 20 | (47) | (49) | — | — | 10 | 10 | (17) | (18) | 2,556 | 2,614 | 24 | 27 | ||||||||||||||||||||
Consolidation adjustments | — | — | (28) | (27) | — | — | — | — | — | — | — | — | — | — | — | — | — | — | ||||||||||||||||||||
Total CECONY | $2,828 | $2,829 | $— | $— | $278 | $262 | $766 | $745 | $2 | $(3) | $154 | $145 | $234 | $225 | $40,436 | $39,670 | $659 | $624 | ||||||||||||||||||||
O&R | ||||||||||||||||||||||||||||||||||||||
Electric | $213 | $205 | $— | $— | $12 | $13 | $55 | $51 | $1 | $(4) | $6 | $6 | $20 | $17 | $1,985 | $1,959 | $24 | $26 | ||||||||||||||||||||
Gas | 27 | 24 | — | — | 5 | 4 | (7) | (9) | — | (1) | 3 | 3 | (4) | (5) | 799 | 754 | 14 | 12 | ||||||||||||||||||||
Total O&R | $240 | $229 | $— | $— | $17 | $17 | $48 | $42 | $1 | $(5) | $9 | $9 | $16 | $12 | $2,784 | $2,713 | $38 | $38 | ||||||||||||||||||||
Competitive energy businesses | $350 | $386 | $(2) | $(2) | $11 | $6 | $125 | $43 | $27 | $17 | $7 | $2 | $67 | $21 | $2,394 | $1,547 | $121 | $212 | ||||||||||||||||||||
Con Edison Transmission | — | — | — | — | — | — | (1) | — | 20 | — | 3 | — | — | — | 1,072 | 2 | — | — | ||||||||||||||||||||
Other (a) | (1) | (1) | 2 | 2 | (1) | — | 2 | — | (1) | — | 5 | 6 | 4 | 2 | 630 | 1,039 | — | — | ||||||||||||||||||||
Total Con Edison | $3,417 | $3,443 | $— | $— | $305 | $285 | $940 | $830 | $49 | $9 | $178 | $162 | $321 | $260 | $47,316 | $44,971 | $818 | $874 | ||||||||||||||||||||
(a) | Parent company and consolidation adjustments. Other does not represent a business segment. |
31
As of and for the Nine Months Ended September 30, | ||||||||||||||||||||||||||||||||||||||
Operating revenues | Inter-segment revenues | Depreciation and amortization | Operating income | Other income (deductions) | Interest charges | Income taxes on operating income | Total assets | Construction expenditures | ||||||||||||||||||||||||||||||
(Millions of Dollars) | 2016 | 2015 | 2016 | 2015 | 2016 | 2015 | 2016 | 2015 | 2016 | 2015 | 2016 | 2015 | 2016 | 2015 | 2016 | 2015 | 2016 | 2015 | ||||||||||||||||||||
CECONY | ||||||||||||||||||||||||||||||||||||||
Electric | $6,222 | $6,416 | $13 | $13 | $645 | $610 | $1,487 | $1,511 | $3 | $(3) | $342 | $333 | $412 | $401 | $30,580 | $30,369 | $1,133 | $1,165 | ||||||||||||||||||||
Gas | 1,113 | 1,177 | 4 | 4 | 118 | 105 | 273 | 278 | (1) | (1) | 79 | 71 | 73 | 82 | 7,300 | 6,687 | 589 | 466 | ||||||||||||||||||||
Steam | 406 | 529 | 65 | 65 | 62 | 58 | 39 | 100 | — | — | 30 | 31 | 18 | 42 | 2,556 | 2,614 | 74 | 65 | ||||||||||||||||||||
Consolidation adjustments | — | — | (82) | (82) | — | — | — | — | — | — | — | — | — | — | — | — | — | — | ||||||||||||||||||||
Total CECONY | $7,741 | $8,122 | $— | $— | $825 | $773 | $1,799 | $1,889 | $2 | $(4) | $451 | $435 | $503 | $525 | $40,436 | $39,670 | $1,796 | $1,696 | ||||||||||||||||||||
O&R | ||||||||||||||||||||||||||||||||||||||
Electric | $497 | $523 | $— | $— | $37 | $38 | $86 | $85 | $1 | $(2) | $19 | $18 | $27 | $26 | $1,985 | $1,959 | $70 | $72 | ||||||||||||||||||||
Gas | 133 | 117 | — | — | 13 | 13 | 28 | — | — | (2) | 9 | 9 | 8 | (4) | 799 | 754 | 36 | 29 | ||||||||||||||||||||
Total O&R | $630 | $640 | $— | $— | $50 | $51 | $114 | $85 | $1 | $(4) | $28 | $27 | $35 | $22 | $2,784 | $2,713 | $106 | $101 | ||||||||||||||||||||
Competitive energy businesses | $998 | $1,087 | $7 | $(5) | $30 | $16 | $184 | $53 | $36 | $33 | $23 | $5 | $76 | $24 | $2,394 | $1,547 | $677 | $676 | ||||||||||||||||||||
Con Edison Transmission | — | — | — | — | — | — | (1) | — | 23 | — | 4 | — | — | — | 1,072 | 2 | — | — | ||||||||||||||||||||
Other (a) | (1) | (2) | (7) | 5 | — | — | 1 | 1 | (1) | (2) | 11 | 19 | 6 | 3 | 630 | 1,039 | — | — | ||||||||||||||||||||
Total Con Edison | $9,368 | $9,847 | $— | $— | $905 | $840 | $2,097 | $2,028 | $61 | $23 | $517 | $486 | $620 | $574 | $47,316 | $44,971 | $2,579 | $2,473 | ||||||||||||||||||||
(a) | Parent company and consolidation adjustments. Other does not represent a business segment. |
32
Note K — Derivative Instruments and Hedging Activities
Con Edison’s subsidiaries hedge market price fluctuations associated with physical purchases and sales of electricity, natural gas, steam and, to a lesser extent, refined fuels by using derivative instruments including futures, forwards, basis swaps, options, transmission congestion contracts and financial transmission rights contracts. Derivatives are recognized on the consolidated balance sheet at fair value (see Note L), unless an exception is available under the accounting rules for derivatives and hedging. Qualifying derivative contracts that have been designated as normal purchases or normal sales contracts are not reported at fair value under the accounting rules.
The fair values of the Companies’ commodity derivatives including the offsetting of assets and liabilities on the consolidated balance sheet at September 30, 2016 and December 31, 2015 were:
(Millions of Dollars) | 2016 | 2015 | ||||||||||
Balance Sheet Location | Gross Amounts of Recognized Assets/(Liabilities) | Gross Amounts Offset | Net Amounts of Assets/ (Liabilities) (a) | Gross Amounts of Recognized Assets/(Liabilities) | Gross Amounts Offset | Net Amounts of Assets/ (Liabilities) (a) | ||||||
Con Edison | ||||||||||||
Fair value of derivative assets | ||||||||||||
Current | $75 | $(60) | $15 | (b) | $59 | $(41) | $18 | (b) | ||||
Current - assets held for sale (c) | — | — | — | 51 | (50) | 1 | ||||||
Noncurrent | 58 | (57) | 1 | 57 | (54) | 3 | ||||||
Noncurrent - assets held for sale (c) | — | — | — | 15 | (15) | — | ||||||
Total fair value of derivative assets | $133 | $(117) | $16 | $182 | $(160) | $22 | ||||||
Fair value of derivative liabilities | ||||||||||||
Current | $(143) | $73 | $(70) | $(144) | $78 | $(66) | ||||||
Current - liabilities held for sale (c) | — | — | — | (115) | 50 | (65) | ||||||
Noncurrent | (111) | 59 | (52) | (102) | 63 | (39) | ||||||
Noncurrent - liabilities held for sale (c) | — | — | — | (28) | 15 | (13) | ||||||
Total fair value of derivative liabilities | $(254) | $132 | $(122) | $(389) | $206 | $(183) | ||||||
Net fair value derivative assets/(liabilities) | $(121) | $15 | $(106) | (b) | $(207) | $46 | $(161) | (b) | ||||
CECONY | ||||||||||||
Fair value of derivative assets | ||||||||||||
Current | $52 | $(46) | $6 | (b) | $40 | $(32) | $8 | (b) | ||||
Noncurrent | 45 | (45) | — | 48 | (47) | 1 | ||||||
Total fair value of derivative assets | $97 | $(91) | $6 | $88 | $(79) | $9 | ||||||
Fair value of derivative liabilities | ||||||||||||
Current | $(122) | $61 | $(61) | $(121) | $71 | $(50) | ||||||
Noncurrent | (92) | 47 | (45) | (92) | 56 | (36) | ||||||
Total fair value of derivative liabilities | $(214) | $108 | $(106) | $(213) | $127 | $(86) | ||||||
Net fair value derivative assets/(liabilities) | $(117) | $17 | $(100) | (b) | $(125) | $48 | $(77) | (b) | ||||
(a) | Derivative instruments and collateral were offset on the consolidated balance sheet as applicable under the accounting rules. The Companies enter into master agreements for their commodity derivatives. These agreements typically provide offset in the event of contract termination. In such case, generally the non-defaulting party’s payable will be offset by the defaulting party’s payable. The non-defaulting party will customarily notify the defaulting party within a specific time period and come to an agreement on the early termination amount. |
(b) | At September 30, 2016 and December 31, 2015, margin deposits for Con Edison ($12 million and $26 million, respectively) and CECONY ($12 million and $26 million, respectively) were classified as derivative assets on the consolidated balance sheet, but not included in the table. Margin is collateral, typically cash, that the holder of a derivative instrument is required to deposit in order to transact on an exchange and to cover its potential losses with its broker or the exchange. |
(c) | Amounts represent derivative assets and liabilities included in assets and liabilities held for sale on the consolidated balance sheet. |
The Utilities generally recover their prudently incurred fuel, purchased power and gas costs, including hedging gains and losses, in accordance with rate provisions approved by the applicable state utility regulators. In accordance with the accounting rules for regulated operations, the Utilities record a regulatory asset or liability to defer recognition of unrealized gains and losses on their electric and gas derivatives. As gains and losses are realized in future periods, they will be recognized as purchased power, gas and fuel costs in the Companies’ consolidated income statements. Con Edison’s competitive energy businesses record realized and unrealized gains and losses on their derivative contracts in purchased power, gas purchased for resale and non-utility revenue in the
33
reporting period in which they occur. Management believes that these derivative instruments represent economic hedges that mitigate exposure to fluctuations in commodity prices.
The following table presents the realized and unrealized gains or losses on commodity derivatives that have been deferred or recognized in earnings for the three and nine months ended September 30, 2016 and 2015:
For the Three Months Ended September 30, | ||||||||||||
Con Edison | CECONY | |||||||||||
(Millions of Dollars) | Balance Sheet Location | 2016 | 2015 | 2016 | 2015 | |||||||
Pre-tax gains/(losses) deferred in accordance with accounting rules for regulated operations: | ||||||||||||
Current | Deferred derivative gains | $(1) | $(1) | $(3) | $(1) | |||||||
Noncurrent | Deferred derivative gains | (2) | — | — | — | |||||||
Total deferred gains/(losses) | $(3) | $(1) | $(3) | $(1) | ||||||||
Current | Deferred derivative losses | $(19) | $8 | $(18) | $8 | |||||||
Current | Recoverable energy costs | (39) | (53) | (35) | (49) | |||||||
Noncurrent | Deferred derivative losses | (17) | 14 | (14) | 13 | |||||||
Total deferred gains/(losses) | $(75) | $(31) | $(67) | $(28) | ||||||||
Net deferred gains/(losses) | $(78) | $(32) | $(70) | $(29) | ||||||||
Income Statement Location | ||||||||||||
Pre-tax gain/(loss) recognized in income | ||||||||||||
Purchased power expense | $(37) | (a) | $(31) | (b) | $— | $— | ||||||
Gas purchased for resale | (38) | (26) | — | — | ||||||||
Non-utility revenue | (2) | (a) | 5 | (b) | — | — | ||||||
Total pre-tax gain/(loss) recognized in income | $(77) | $(52) | $— | $— | ||||||||
(a) | For the three months ended September 30, 2016, Con Edison recorded unrealized losses in non-utility operating revenue ($2 million) and purchase power expense ($23 million). |
(b) | For the three months ended September 30, 2015, Con Edison recorded in purchased power expense an unrealized pre-tax gain of $12 million. |
For the Nine Months Ended September 30, | |||||||||||||
Con Edison | CECONY | ||||||||||||
(Millions of Dollars) | Balance Sheet Location | 2016 | 2015 | 2016 | 2015 | ||||||||
Pre-tax gains/(losses) deferred in accordance with accounting rules for regulated operations: | |||||||||||||
Current | Deferred derivative gains | $6 | $— | $2 | $1 | ||||||||
Noncurrent | Deferred derivative gains | (1) | — | (1) | — | ||||||||
Total deferred gains/(losses) | $5 | $— | $1 | $1 | |||||||||
Current | Deferred derivative losses | $19 | $40 | $16 | $40 | ||||||||
Current | Recoverable energy costs | (163) | (92) | (148) | (87) | ||||||||
Noncurrent | Deferred derivative losses | (5) | (7) | (3) | (5) | ||||||||
Total deferred gains/(losses) | $(149) | $(59) | $(135) | $(52) | |||||||||
Net deferred gains/(losses) | $(144) | $(59) | $(134) | $(51) | |||||||||
Income Statement Location | |||||||||||||
Pre-tax gain/(loss) recognized in income | |||||||||||||
Purchased power expense | $(106) | (a) | $(60) | (b) | $— | $— | |||||||
Gas purchased for resale | (72) | (94) | — | — | |||||||||
Non-utility revenue | 15 | (a) | 20 | (b) | — | — | |||||||
Total pre-tax gain/(loss) recognized in income | $(163) | $(134) | $— | $— | |||||||||
(a) | For the nine months ended September 30, 2016, Con Edison recorded unrealized gains and losses in non-utility operating revenue ($3 million loss) and purchase power expense ($11 million gain). |
(b) | For the nine months ended September 30, 2015, Con Edison recorded unrealized pre-tax gains and losses in non-utility operating revenue ($3 million loss) and purchased power expense ($6 million gain). |
34
The following table presents the hedged volume of Con Edison’s and CECONY’s derivative transactions at September 30, 2016:
Electric Energy (MWh) (a)(b) | Capacity (MW) (a) | Natural Gas (Dt) (a)(b) | Refined Fuels (gallons) | |||||
Con Edison | 22,797,395 | 15,472 | 69,954,738 | 1,344,000 | ||||
CECONY | 20,724,225 | 9,000 | 70,100,000 | 1,344,000 | ||||
(a) | Volumes are reported net of long and short positions, except natural gas collars where the volumes of long positions are reported. |
(b) | Excludes electric congestion and gas basis swap contracts, which are associated with electric and gas contracts and hedged volumes. |
The Companies are exposed to credit risk related to transactions entered into primarily for the various energy supply and hedging activities by the Utilities and the competitive energy businesses. Credit risk relates to the loss that may result from a counterparty’s nonperformance. The Companies use credit policies to manage this risk, including an established credit approval process, monitoring of counterparty limits, netting provisions within agreements, collateral or prepayment arrangements, credit insurance and credit default swaps. The Companies measure credit risk exposure as the replacement cost for open energy commodity and derivative positions plus amounts owed from counterparties for settled transactions. The replacement cost of open positions represents unrealized gains, net of any unrealized losses where the Companies have a legally enforceable right to offset.
At September 30, 2016, Con Edison and CECONY had $141 million and $13 million of credit exposure in connection with energy supply and hedging activities, net of collateral, respectively. Con Edison’s net credit exposure consisted of $77 million with independent system operators, $34 million with investment-grade counterparties, $20 million with commodity exchange brokers, and $10 million with non-investment grade/non-rated counterparties. CECONY’s net credit exposure consisted of $12 million with commodity exchange brokers and $1 million with investment-grade counterparties.
The collateral requirements associated with, and settlement of, derivative transactions are included in net cash flows from operating activities in the Companies’ consolidated statement of cash flows. Most derivative instrument contracts contain provisions that may require a party to provide collateral on its derivative instruments that are in a net liability position. The amount of collateral to be provided will depend on the fair value of the derivative instruments and the party’s credit ratings.
The following table presents the aggregate fair value of the Companies’ derivative instruments with credit-risk-related contingent features that are in a net liability position, the collateral posted for such positions and the additional collateral that would have been required to be posted had the lowest applicable credit rating been reduced one level and to below investment grade at September 30, 2016:
(Millions of Dollars) | Con Edison (a) | CECONY (a) | ||
Aggregate fair value – net liabilities | $111 | $97 | ||
Collateral posted | 24 | 23 | ||
Additional collateral (b) (downgrade one level from current ratings) | 18 | 15 | ||
Additional collateral (b) (downgrade to below investment grade from current ratings) | 106 | (c) | 84 | (c) |
(a) | Non-derivative transactions for the purchase and sale of electricity and gas and qualifying derivative instruments, which have been designated as normal purchases or normal sales, are excluded from the table. These transactions primarily include purchases of electricity from independent system operators. In the event the Utilities and the competitive energy businesses were no longer extended unsecured credit for such purchases, the Companies would be required to post additional collateral of $10 million at September 30, 2016. For certain other such non-derivative transactions, the Companies could be required to post collateral under certain circumstances, including in the event counterparties had reasonable grounds for insecurity. |
(b) | The Companies measure the collateral requirements by taking into consideration the fair value amounts of derivative instruments that contain credit-risk-related contingent features that are in a net liabilities position plus amounts owed to counterparties for settled transactions and amounts required by counterparties for minimum financial security. The fair value amounts represent unrealized losses, net of any unrealized gains where the Companies have a legally enforceable right to offset. |
(c) | Derivative instruments that are net assets have been excluded from the table. At September 30, 2016, if Con Edison had been downgraded to below investment grade, it would have been required to post additional collateral for such derivative instruments of $9 million. |
Note L — Fair Value Measurements
The accounting rules for fair value measurements and disclosures define fair value as the price that would be received to sell an asset or paid to transfer a liability in an orderly transaction between market participants at the measurement date in a principal or most advantageous market. Fair value is a market-based measurement that is determined based on inputs, which refer broadly to assumptions that market participants use in pricing assets or
35
liabilities. These inputs can be readily observable, market corroborated, or generally unobservable firm inputs. The Companies often make certain assumptions that market participants would use in pricing the asset or liability, including assumptions about risk, and the risks inherent in the inputs to valuation techniques. The Companies use valuation techniques that maximize the use of observable inputs and minimize the use of unobservable inputs.
The accounting rules for fair value measurements and disclosures established a fair value hierarchy, which prioritizes the inputs to valuation techniques used to measure fair value in three broad levels. The rules require that assets and liabilities be classified in their entirety based on the level of input that is significant to the fair value measurement. Assessing the significance of a particular input may require judgment considering factors specific to the asset or liability, and may affect the valuation of the asset or liability and their placement within the fair value hierarchy. The Companies classify fair value balances based on the fair value hierarchy defined by the accounting rules for fair value measurements and disclosures as follows:
• | Level 1 – Consists of assets or liabilities whose value is based on unadjusted quoted prices in active markets at the measurement date. An active market is one in which transactions for assets or liabilities occur with sufficient frequency and volume to provide pricing information on an ongoing basis. This category includes contracts traded on active exchange markets valued using unadjusted prices quoted directly from the exchange. |
• | Level 2 – Consists of assets or liabilities valued using industry standard models and based on prices, other than quoted prices within Level 1, that are either directly or indirectly observable as of the measurement date. The industry standard models consider observable assumptions including time value, volatility factors and current market and contractual prices for the underlying commodities, in addition to other economic measures. This category includes contracts traded on active exchanges or in over-the-counter markets priced with industry standard models. |
• | Level 3 – Consists of assets or liabilities whose fair value is estimated based on internally developed models or methodologies using inputs that are generally less readily observable and supported by little, if any, market activity at the measurement date. Unobservable inputs are developed based on the best available information and subject to cost benefit constraints. This category includes contracts priced using models that are internally developed and contracts placed in illiquid markets. It also includes contracts that expire after the period of time for which quoted prices are available and internal models are used to determine a significant portion of the value. |
Assets and liabilities measured at fair value on a recurring basis as of September 30, 2016 and December 31, 2015 are summarized below.
2016 | 2015 | ||||||||||||||||||
(Millions of Dollars) | Level 1 | Level 2 | Level 3 | Netting Adjustment (e) | Total | Level 1 | Level 2 | Level 3 | Netting Adjustment (e) | Total | |||||||||
Con Edison | |||||||||||||||||||
Derivative assets: | |||||||||||||||||||
Commodity (a)(b)(c) | $6 | $21 | $6 | $(5) | $28 | $2 | $25 | $13 | $7 | $47 | |||||||||
Commodity held for sale (f) | — | — | — | — | — | — | 63 | 1 | (63) | 1 | |||||||||
Other (a)(b)(d) | 224 | 113 | — | — | 337 | 185 | 112 | — | — | 297 | |||||||||
Total assets | $230 | $134 | $6 | $(5) | $365 | $187 | $200 | $14 | $(56) | $345 | |||||||||
Derivative liabilities: | |||||||||||||||||||
Commodity (a)(b)(c) | $3 | $146 | $5 | $(32) | $122 | $16 | $153 | $1 | $(65) | $105 | |||||||||
Commodity held for sale (f) | — | — | — | — | — | 1 | 133 | 7 | (63) | 78 | |||||||||
Total liabilities | $3 | $146 | $5 | $(32) | $122 | $17 | $286 | $8 | $(128) | $183 | |||||||||
CECONY | |||||||||||||||||||
Derivative assets: | |||||||||||||||||||
Commodity (a)(b)(c) | $4 | $7 | $1 | $6 | $18 | $1 | $9 | $8 | $17 | $35 | |||||||||
Other (a)(b)(d) | 200 | 108 | — | — | 308 | 171 | 105 | — | — | 276 | |||||||||
Total assets | $204 | $115 | $1 | $6 | $326 | $172 | $114 | $8 | $17 | $311 | |||||||||
Derivative liabilities: | |||||||||||||||||||
Commodity (a)(b)(c) | $2 | $126 | $1 | $(23) | $106 | $14 | $129 | $— | $(57) | $86 | |||||||||
36
(a) | The Companies’ policy is to review the fair value hierarchy and recognize transfers into and transfers out of the levels at the end of each reporting period. There were no transfers between levels 1, 2 and 3 for the nine months ended September 30, 2016 and for the year ended December 31, 2015. |
(b) | Level 2 assets and liabilities include investments held in the deferred compensation plan and/or non-qualified retirement plans, exchange-traded contracts where there is insufficient market liquidity to warrant inclusion in Level 1, certain over-the-counter derivative instruments for electricity, refined products and natural gas. Derivative instruments classified as Level 2 are valued using industry standard models that incorporate corroborated observable inputs; such as pricing services or prices from similar instruments that trade in liquid markets, time value and volatility factors. |
(c) | The accounting rules for fair value measurements and disclosures require consideration of the impact of nonperformance risk (including credit risk) from a market participant perspective in the measurement of the fair value of assets and liabilities. At September 30, 2016 and December 31, 2015, the Companies determined that nonperformance risk would have no material impact on their financial position or results of operations. |
(d) | Other assets are comprised of assets such as life insurance contracts within the deferred compensation plan and non-qualified retirement plans. |
(e) | Amounts represent the impact of legally-enforceable master netting agreements that allow the Companies to net gain and loss positions and cash collateral held or placed with the same counterparties. |
(f) | Amounts represent derivative assets and liabilities included in Assets and Liabilities held for sale on the consolidated balance sheet. |
The employees in the Companies’ risk management group develop and maintain the Companies’ valuation policies and procedures for, and verify pricing and fair value valuation of, commodity derivatives. Under the Companies’ policies and procedures, multiple independent sources of information are obtained for forward price curves used to value commodity derivatives. Fair value and changes in fair value of commodity derivatives are reported on a monthly basis to the Companies’ risk committees, comprised of officers and employees of the Companies that oversee energy hedging at the Utilities and the competitive energy businesses. The risk management group reports to the Companies’ Vice President and Treasurer.
Fair Value of Level 3 at September 30, 2016 | Valuation Techniques | Unobservable Inputs | Range | |||
(Millions of Dollars) | ||||||
Con Edison – Commodity | ||||||
Electricity | $(1) | Discounted Cash Flow | Forward energy prices (a) | $19.75-$80.00 per MWh | ||
1 | Discounted Cash Flow | Forward capacity prices (a) | $2.68-$9.45 per kW-month | |||
Transmission Congestion Contracts/Financial Transmission Rights | 1 | Discounted Cash Flow | Discount to adjust auction prices for inter-zonal forward price curves (b) | 52.8%-59.4% | ||
Discount/(premium) to adjust auction prices for historical monthly realized settlements (b) | (44.9)%-58.9% | |||||
Inter-zonal forward price curves adjusted for historical zonal losses (b) | $(0.14)-$2.82 per MWh | |||||
Total Con Edison—Commodity | $1 | |||||
CECONY—Commodity | ||||||
Electricity | $(1) | Discounted Cash Flow | Forward energy prices (a) | $21.10-$80.00 per MWh | ||
Transmission Congestion Contracts | $1 | Discounted Cash Flow | Discount to adjust auction prices for inter-zonal forward price curves (b) | 52.8%-59.4% | ||
Discount/(premium) to adjust auction prices for historical monthly realized settlements (b) | (44.9)%-58.9% | |||||
Total CECONY—Commodity | $— | |||||
(a) | Generally, increases/(decreases) in this input in isolation would result in a higher/(lower) fair value measurement. |
(b) | Generally, increases/(decreases) in this input in isolation would result in a lower/(higher) fair value measurement. |
The table listed below provides a reconciliation of the beginning and ending net balances for assets and liabilities measured at fair value as of September 30, 2016 and 2015 and classified as Level 3 in the fair value hierarchy:
For the Three Months Ended September 30, | |||||||||
Con Edison | CECONY | ||||||||
(Millions of Dollars) | 2016 | 2015 | 2016 | 2015 | |||||
Beginning balance as of July 1, | $5 | $13 | $2 | $11 | |||||
Included in earnings | (4) | (4) | — | (1) | |||||
Included in regulatory assets and liabilities | (5) | (1) | (3) | (1) | |||||
Purchases | — | 1 | — | 1 | |||||
Sales (a) | 4 | — | — | — | |||||
Settlements | 1 | (5) | 1 | (2) | |||||
Ending balance as of September 30, | $1 | $4 | $— | $8 | |||||
37
For the Nine Months Ended September 30, | ||||||||
Con Edison | CECONY | |||||||
(Millions of Dollars) | 2016 | 2015 | 2016 | 2015 | ||||
Beginning balance as of January 1, | $6 | $20 | $8 | $13 | ||||
Included in earnings | (1) | (18) | (1) | (5) | ||||
Included in regulatory assets and liabilities | (11) | (1) | (6) | (1) | ||||
Purchases | 2 | 9 | 1 | 5 | ||||
Sales (a) | 4 | — | — | — | ||||
Settlements | 1 | (6) | (2) | (4) | ||||
Ending balance as of September 30, | $1 | $4 | $— | $8 | ||||
(a) | Amounts represent derivative instruments novated as part of the assets of Con Edison Solutions’ retail electric supply business which were sold to a subsidiary of Exelon Corporation (see Note P). |
For the Utilities, realized gains and losses on Level 3 commodity derivative assets and liabilities are reported as part of purchased power, gas and fuel costs. The Utilities generally recover these costs in accordance with rate provisions approved by the applicable state public utilities regulators. Unrealized gains and losses for commodity derivatives are generally deferred on the consolidated balance sheet in accordance with the accounting rules for regulated operations.
For the competitive energy businesses, realized and unrealized gains and losses on Level 3 commodity derivative assets and liabilities are reported in non-utility revenues (immaterial for both periods) and purchased power costs ($5 million loss and $3 million loss) on the consolidated income statement for the three months ended September 30, 2016 and 2015, respectively. Realized and unrealized gains and losses on Level 3 commodity derivative assets and liabilities are reported in non-utility revenues (immaterial for both periods) and purchased power costs ($6 million loss and $12 million loss) on the consolidated income statement for the nine months ended September 30, 2016, and 2015, respectively. The change in fair value relating to Level 3 commodity derivative assets and liabilities held at September 30, 2016 and 2015 is included in non-utility revenues (immaterial for both periods) and purchased power costs ($4 million loss and $3 million loss) on the consolidated income statement for the three months ended September 30, 2016 and 2015, respectively. For the nine months ended September 30, 2016, and 2015, the change in fair value relating to Level 3 commodity derivative assets and liabilities is included in non-utility revenues (immaterial for both periods) and purchased power costs ($2 million loss and $8 million loss) on the consolidated income statement, respectively.
Note M — Variable Interest Entities
Con Edison enters into arrangements including leases, partnerships and electricity purchase agreements, with various entities. As a result of these arrangements, Con Edison retains or may retain a variable interest in these entities.
CECONY had a variable interest in a non-consolidated variable interest entity (VIE), Astoria Energy, LLC (Astoria Energy), with which CECONY entered into a long-term electricity purchase agreement that expired in April 2016. CECONY has ongoing long-term electricity purchase agreements with the following two potential VIEs: Cogen Technologies Linden Venture, LP, and Brooklyn Navy Yard Cogeneration Partners, LP. In 2015, requests were made of these two counterparties for information necessary to determine whether the entity was a VIE and whether CECONY is the primary beneficiary; however, the information was not made available. The payments for these contracts constitute CECONY’s maximum exposure to loss with respect to the potential VIEs.
38
The following table summarizes the VIEs in which Con Edison Development has entered into as of September 30, 2016:
Project Name (a) | Generating Capacity (b) (MW AC) | Power Purchase Agreement Term (in Years) | Year of Initial Investment | Location | Maximum Exposure to Loss (Millions of Dollars) (c) |
Copper Mountain Solar 3 | 128 | 20 | 2014 | Nevada | $179 |
Panoche Valley (d) | 120 | 20 | 2015 | California | 274 |
Mesquite Solar 1 | 83 | 20 | 2013 | Arizona | 107 |
Copper Mountain Solar 2 | 75 | 25 | 2013 | Nevada | 84 |
California Solar | 55 | 25 | 2012 | California | 70 |
Broken Bow II | 38 | 25 | 2014 | Nebraska | 51 |
Texas Solar 4 | 32 | 25 | 2014 | Texas | 43 |
(a) With the exception of Texas Solar 4, Con Edison’s ownership interest is 50 percent and these projects are accounted for using the equity method of accounting. Con Edison is not the primary beneficiary since the power to direct the activities that most significantly impact the economics of the entities are shared equally between Con Edison Development and third parties. Con Edison’s ownership interest in Texas Solar 4 is 80 percent and is consolidated in the financial statements. Con Edison is the primary beneficiary since the power to direct the activities that most significantly impact the economics of Texas Solar 4 is held by Con Edison Development. The maximum exposure for Texas Solar 4 is the net assets of the investment offset by an $8 million noncontrolling interest.
(b) Represents Con Edison Development’s ownership interest in the project.
(c) For investments accounted for under the equity method, maximum exposure is equal to the carrying value of the investment on the consolidated balance sheet and any related receivables due from the project. For consolidated investments, maximum exposure is equal to the net assets of the project on the consolidated balance sheet less any applicable noncontrolling interest. Con Edison did not provide any financial or other support during the year that was not previously contractually required.
(d) In October 2016, Con Edison Development acquired the remaining 50 percent ownership interest in the project. See Note P.
Note N — Related Party Transactions
The Utilities perform work and incur expenses on behalf of NY Transco, a company in which CET Electric has a 45.7 percent equity interest (see Note P). The Utilities bill NY Transco for such work and expenses in accordance with established policies. For the three and nine months ended September 30, 2016, the amounts billed by CECONY to NY Transco were immaterial.
CECONY has storage and wheeling service contracts with Stagecoach Gas Services LLC (Stagecoach), a joint venture formed by a subsidiary of CET Gas and a subsidiary of Crestwood Equity Partners LP (Crestwood) (see Note P). In addition, CECONY is the replacement shipper on one of Crestwood’s firm transportation agreements with Tennessee Gas Pipeline Company LLC. For the three months ended September 30, 2016, the amount of storage and wheeling services received by CECONY from Stagecoach was $8 million. Since the formation of the joint venture in June 2016, the amount of storage and wheeling services received by CECONY from Stagecoach was $10 million.
CECONY has a financial electric capacity contract with Con Edison Energy for the period May 2016 through April 2017. For the three and nine months ended September 30, 2016, Con Edison Energy's realized losses under this contract were $1 million.
At September 30, 2016 Con Edison Development has an outstanding note receivable of $234 million from Panoche Valley, a solar electric production project in which Con Edison Development has an ownership interest of 50 percent (see Note M). In October 2016, Con Edison Development acquired the remaining 50 percent interest in the project (see Note P).
Note O — New Financial Accounting Standards
In May 2014, the Financial Accounting Standards Board (FASB) and the International Accounting Standards Board jointly issued a revenue recognition standard that will supersede the revenue recognition requirements within Accounting Standards Codification Topic 605, “Revenue Recognition,” and most industry-specific guidance under the Codification through Accounting Standards Update (ASU) No. 2014-09, “Revenue from Contracts with Customers (Topic 606).” The purpose of the new guidance is to create a consistent framework for revenue recognition. The guidance clarifies how to measure and recognize revenue arising from customer contracts to depict the transfer of goods or services in an amount that reflects the consideration the entity expects to receive. Additionally, in March and April 2016, respectively, the FASB issued ASU No. 2016-08, “Revenue from Contracts with Customers (Topic 606): Principal Versus Agent Considerations (Reporting Revenue Gross Versus Net)” to clarify how to apply the implementation guidance for principal versus agent considerations and ASU No. 2016-10,“Revenue from Contracts with Customers (Topic 606): Identifying Performance Obligations and Licensing”
39
to clarify the guidance pertaining to identifying performance obligations and licensing implementation guidance. Furthermore in May 2016, the FASB issued ASU No. 2016-12, “Revenue from Contracts with Customers (Topic 606): Narrow-Scope Improvements and Practical Expedients” to clarify assessing collectibility, presentation of sales taxes, noncash consideration, contract modification at transition, and completed contracts at transition. The new standard is effective for reporting periods beginning after December 15, 2017. Early adoption is permitted for reporting periods beginning after December 15, 2016. The Companies are in the process of evaluating the application and impact of the new guidance on the Companies’ financial position, results of operations and liquidity.
In January 2016, the FASB issued amendments on certain aspects of recognition, measurement, presentation, and disclosure of financial instruments through ASU No. 2016-01, “Financial Instruments (Subtopic 825-10): Recognition and Measurement of Financial Assets and Financial Liabilities.” The amendments require changes to the accounting for equity investments, the presentation and disclosure requirements for financial liabilities under the fair value option, and the presentation and disclosure requirements for financial instruments. In addition, clarification was provided related to the valuation allowance assessment when recognizing deferred tax assets resulting from unrealized losses on available-for-sale debt securities. For public entities, the amendments are effective for reporting periods beginning after December 15, 2017. Early adoption is permitted for portions of the standard. The
Companies are in the process of evaluating the potential impact of the new guidance on the Companies’ financial position, results of operations and liquidity.
In February 2016, the FASB issued amendments on financial reporting of leasing transactions through ASU No. 2016-02, “Leases (Topic 842)." The amendments require lessees to recognize assets and liabilities on the balance sheet and disclose key information about leasing arrangements. Lessees will need to recognize a right-of-use asset and a lease liability for virtually all of their leases (other than leases that meet the definition of a short-term lease). Lessor accounting is similar to the current model, but updated to align with certain changes to the lessee model. For income statement purposes, the pattern of expense recognition will be dependent on whether transactions are designated as operating leases or finance leases. The amendments are effective for reporting periods beginning after December 15, 2018. Early adoption is permitted. The amendments must be adopted using a modified retrospective transition and provide for certain practical expedients. The Companies are in the process of evaluating the potential impact of the new guidance on the Companies’ financial position, results of operations and liquidity.
In March 2016, the FASB issued amendments to the guidance for Derivatives and Hedging accounting through ASU 2016-05, “Derivatives and Hedging (Topic 815): Effect of Derivative Contract Novations on Existing Hedge Accounting Relationships." The amendments clarify that a change in the counterparty to a derivative instrument that has been designated as a hedging instrument under Topic 815 does not, in and of itself, require discontinuation of the application of hedge accounting. The amendments in this update are effective for financial statements issued for reporting periods beginning after December 15, 2016. Early adoption is permitted. The application of this guidance is not expected to have a material impact on the Companies’ financial position, results of operations and liquidity.
In March 2016, the FASB issued amendments to clarify the guidance for assessing whether contingent call (put) options that can accelerate the payment of principal on debt instruments are clearly and closely related to their debt hosts through ASU No. 2016-06, “Derivatives & Hedging (Topic 815): Contingent Put and Call Options in Debt Instruments.” An entity performing the assessment under the amendments is required to assess the embedded call (put) options solely in accordance with the four-step decision sequence. The amendments are effective for financial statements issued for reporting periods beginning after December 15, 2016. Early adoption is permitted. The application of this guidance is not expected to have a material impact on the Companies’ financial position, results of operations and liquidity.
In March 2016, the FASB issued amendments to eliminate the requirement to retroactively adopt the equity method of accounting when a company increases its level of ownership or degree of influence over an investment through ASU No. 2016-07, “Investments-Equity Method and Joint Ventures (Topic 323): Simplifying the Transition to the Equity Method of Accounting.” This amendment requires that an entity that has an available-for-sale equity security that becomes qualified for the equity method of accounting recognize through earnings the unrealized holding gain or loss in Accumulated Other Comprehensive Income at the date the investment qualifies for the equity method. The amendments in this Update are effective for reporting periods beginning after December 15, 2016. The application of this guidance is not expected to have a material impact on the Companies’ financial position, results of operations and liquidity.
In March 2016, the FASB issued amendments to simplify several aspects of the accounting for share-based payment transactions through ASU No. 2016-09, “Compensation - Stock Compensation (Topic 718): Improvements
40
to Employee Share-Based Payment Accounting.” The amendments simplify areas such as income tax consequences, classification of awards as either equity or liabilities, and classification on the statement of cash flows. The amendments are effective for reporting periods beginning after December 15, 2016. Early adoption is permitted. The application of this guidance is not expected to have a material impact on the Companies’ financial position, results of operations and liquidity.
In May 2016, the FASB issued amendments to the guidance on revenue recognition and derivatives and hedging through ASU 2016-11, “Revenue Recognition (Topic 605) and Derivatives and Hedging (Topic 815): Rescission of SEC Guidance Because of Accounting Standards Updates 2014-09 and 2014-16 Pursuant to Staff Announcements at the March 3, 2016 EITF Meeting (SEC Update).” The amendment rescinds certain SEC guidance superseded by the newly issued revenue recognition and hedging guidance (ASU 2014-09 and 2014-16 respectively). The amendments will be effective upon adoption of the 2014-09 and 2014-16. The Companies are in the process of evaluating the potential impact of the amendments on the Companies’ financial position, results of operations and liquidity.
In June 2016, the FASB issued amendments to the guidance for recognition of credit losses for financial
instruments through ASU 2016-13, “Financial Instruments-Credit Losses (Topic 326): Measurement of Credit Losses on Financial Instruments.” The amendment replaces the incurred loss impairment methodology which involved delayed recognition of credit losses. As the updated guidance now requires credit losses to be recognized when expected rather than when incurred, a broader range of reasonable and supportable information must be considered in developing the credit loss estimates. This includes financial instruments that are valued at amortized cost and available for sale. For public entities, the amendments are effective for reporting periods beginning after December 15, 2019. Early adoption is permitted for reporting periods beginning after December 15, 2018. The application of this guidance is not expected to have a material impact on the Companies’ financial position, results of operations and liquidity.
In August 2016, the FASB issued amendments to the guidance for the Statement of Cash Flows through ASU 2016-15, “Statement of Cash Flows (Topic 230): Classification of Certain Cash Receipts and Cash Payments (a consensus of the Emerging Issues Task Force).” The amendment specifies the classification and presentation of certain cash flow items to reduce diversity in practice. For public entities, the amendments are effective for reporting periods beginning after December 15, 2017. Early adoption is permitted. The application of this guidance is not expected to have a material impact on the Companies’ financial position, results of operations and liquidity.
In October 2016, the FASB issued amendments to the guidance for Income Taxes through ASU 2016-16, “Income Taxes (Topic 740): Intra-Entity Transfers of Assets Other Than Inventory.” The amendment clarifies the tax treatment of intra-entity transfers of assets other than inventory. The updated guidance requires entities recognize the income tax consequences of an intra-entity transfer of assets other than inventory when the transfer occurs. For public entities, the amendments are effective for reporting periods beginning after December 15, 2017. Early adoption is permitted. The application of this guidance is not expected to have a material impact on the Companies’ financial position, results of operations and liquidity.
Note P — Acquisitions, Investments and Dispositions
Acquisitions and Investments
Texas Solar 7
In January 2016, Con Edison Development acquired a 100 percent interest in a company that is the owner of a 106 MW (AC) solar electric production project in Texas (Texas Solar 7) for $227 million; $218 million was recorded as non-utility construction work in progress and the remaining $9 million was recorded as other receivables. At September 30, 2016 net assets of the project are approximately $123 million. The project has been financed, in part, by debt secured by the project (see Note C). Electricity generated by this project is to be purchased by the City of San Antonio pursuant to a long-term power purchase agreement. The project commenced commercial operation in the third quarter of 2016. Con Edison's interest in Texas Solar 7 is consolidated in the financial statements.
Mountain Valley Pipeline
In January 2016, CET Gas acquired a 12.5 percent equity interest in Mountain Valley Pipeline, LLC (MVP), a company developing a proposed gas transmission project in West Virginia and Virginia. The company's initial contribution to MVP was $18 million. At September 30, 2016, CET Gas' investment in MVP was $41 million. The estimated total project cost is $3,000 million to $3,500 million. Subject to FERC approval, MVP is targeting to be fully in-service during 2018. Con Edison is accounting for its equity interest in MVP as an equity method investment.
41
Stagecoach Gas Services
In April 2016, a CET Gas subsidiary agreed with a subsidiary of Crestwood to form a joint venture to own, operate and further develop existing natural gas pipeline and storage businesses located in northern Pennsylvania and southern New York. The transaction was substantially completed during June 2016. Crestwood contributed businesses to a new entity, Stagecoach, and the CET Gas subsidiary purchased a 50 percent equity interest in Stagecoach for $945 million (subject to closing adjustments). At September 30, 2016, CET Gas' investment in Stagecoach was $968 million. Con Edison is accounting for its equity interest in Stagecoach as an equity method investment.
NY Transco
In January 2016, CECONY entered into an agreement to transfer certain electric transmission projects to NY Transco, a company in which CET Electric has a 45.7 percent equity interest. In April 2016, the NYSPSC authorized CECONY, subject to certain conditions, to transfer the projects to NY Transco. In May 2016, CECONY transferred the projects to NY Transco for a purchase price of $122 million and an $8 million payment for easement rights on certain associated property. At September 30, 2016, CET Electric's investment in NY Transco was $53 million. Con Edison is accounting for its equity interest in NY Transco as an equity method investment.
Pilesgrove
In June 2016, Con Edison Development recorded an $8 million ($5 million, net of taxes) impairment charge on its 50 percent interest in Pilesgrove Solar, LLC (Pilesgrove), which owns an 18 MW (AC) solar electric production project in New Jersey. In August 2016, Con Edison Development acquired the remaining 50 percent interest in Pilesgrove for a purchase price of approximately $16 million and recorded a bargain purchase gain of $8 million ($5 million, net of taxes). The impairment charge and bargain purchase gain are included in Investment and other income on Con Edison’s consolidated income statement. Con Edison's interest in Pilesgrove is consolidated in the financial statements subsequent to the August 2016 acquisition. At September 30, 2016, net assets of the project are approximately $48 million, consisting primarily of $45 million recorded as non-utility property and $3 million recorded in current assets.
Panoche Valley
In October 2016, Con Edison Development acquired the remaining 50 percent interest in Panoche Holdings, LLC, which is developing a 240 MW (AC) solar electric production project in California, for cash consideration of $37 million, net of applicable purchase price adjustments. Con Edison will consolidate the project on its financial statements as of the date of acquisition. See Note M.
Dispositions
Pike County Light & Power Company (Pike)
In October 2015, upon evaluating strategic alternatives, O&R entered into an agreement to sell Pike to Corning Natural Gas Holding Corporation (Corning). In August 2016, the sale was completed. O&R received cash consideration of $15 million for the sale. O&R has agreed to provide transition services to Corning for operations and customer support for a period of up to 18 months subsequent to the sale. In addition, O&R will continue to purchase and sell to Pike electric and gas commodity for three years. Pike has an option to extend the service for up to an additional three years.
At September 30, 2015, O&R recorded an impairment charge of $5 million ($3 million, net of taxes), representing the difference between the carrying amount of Pike’s assets and the estimated sales proceeds. At December 31, 2015, Pike’s total assets and liabilities held for sale were $23 million and $5 million, respectively. There were no amounts outstanding at September 30, 2016.
Con Edison Solutions' Retail Electric Supply Business
In July 2016, Con Edison Solutions entered into an agreement to sell the assets of its retail electric supply business (including retail contracts, related derivative instruments, information systems, and accounts receivable) to a subsidiary of Exelon Corporation (Exelon). In September 2016, the sale was completed for cash consideration of $235 million, subject to working capital adjustments. The sale resulted in a gain of $104 million ($47 million, net of taxes), inclusive of a $65 million ($42 million, net of taxes) gain on derivative instruments. The tax effect of the sale includes $29 million ($19 million, net of federal tax) of state taxes related to a change in the apportionment of state income taxes. Con Edison Solutions has agreed to provide transition services to the Exelon subsidiary for operations and customer support through the end of 2017 during which period certain guarantees or other credit support provided by Con Edison in connection with the retail electric supply business may continue in effect. See
42
Note H. At December 31, 2015, Con Edison Solutions' total assets and liabilities held for sale were $134 million and $84 million, respectively. There were no amounts outstanding at September 30, 2016.
43
Item 2: Management’s Discussion and Analysis of Financial Condition and Results of Operations
This combined management’s discussion and analysis of financial condition and results of operations (MD&A) relates to the consolidated financial statements (the Third Quarter Financial Statements) included in this report of two separate registrants: Consolidated Edison, Inc. (Con Edison) and Consolidated Edison Company of New York, Inc. (CECONY). As used in this report, the term the “Companies” refers to Con Edison and CECONY. CECONY is a subsidiary of Con Edison and, as such, information in this management’s discussion and analysis about CECONY applies to Con Edison.
This MD&A should be read in conjunction with the Third Quarter Financial Statements and the notes thereto, the MD&A in Item 7 of the Companies’ combined Annual Report on Form 10-K for the year ended December 31, 2015 (File Nos. 1-14514 and 1-1217, the Form 10-K) and the MD&A in Part 1, Item 2 of the Companies’ combined Quarterly Reports on Form 10-Q for the quarterly periods ended March 31, 2016 and June 30, 2016 (File Nos. 1-14514 and 1-1217).
Information in any item of this report referred to in this discussion and analysis is incorporated by reference herein. The use of terms such as “see” or “refer to” shall be deemed to incorporate by reference into this discussion and analysis the information to which reference is made.
Con Edison, incorporated in New York State in 1997, is a holding company that owns all of the outstanding common stock of CECONY, Orange and Rockland Utilities, Inc. (O&R), the competitive energy businesses and Con Edison Transmission, Inc. (Con Edison Transmission). As used in this report, the term the “Utilities” refers to CECONY and O&R.
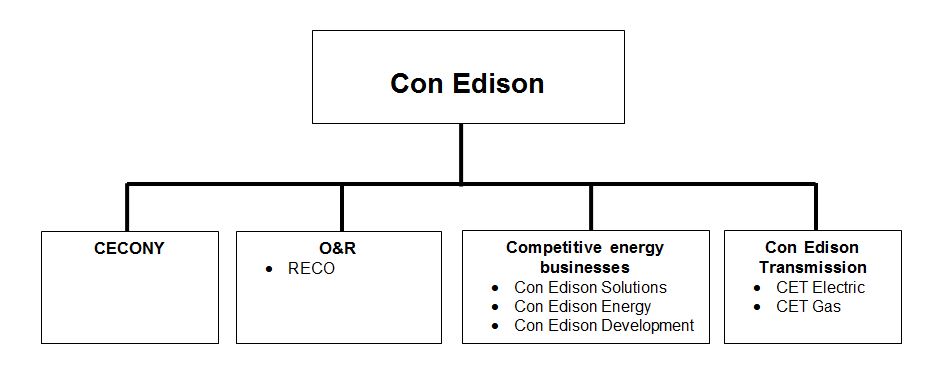
Con Edison’s principal business operations are those of CECONY, O&R, the competitive energy businesses and Con Edison Transmission. CECONY’s principal business operations are its regulated electric, gas and steam delivery businesses. O&R’s principal business operations are its regulated electric and gas delivery businesses. The competitive energy businesses provide energy-related products and services, and develop, own and operate renewable and energy infrastructure projects. Con Edison Transmission invests in electric transmission facilities and gas pipeline and storage facilities.
Con Edison seeks to provide shareholder value through continued dividend growth, supported by earnings growth in regulated utilities and contracted assets. The company invests to provide reliable, resilient, safe and clean energy critical for New York City’s growing economy. The company is an industry leading owner and operator of contracted, large-scale solar generation in the United States. Con Edison is a responsible neighbor, helping the communities it serves become more sustainable.
44
CECONY
Electric
CECONY provides electric service to approximately 3.4 million customers in all of New York City (except a part of Queens) and most of Westchester County, an approximately 660 square mile service area with a population of more than nine million.
During the summer of 2016, electric peak demand in the company's service area was 12,652 MW (which occurred on August 11, 2016). At design conditions, electric peak demand in the company's service area would have been approximately 13,450 MW in 2016 compared to the company's forecast of 13,650 MW. The company's five-year forecast of average annual growth of the electric peak demand in its service area at design conditions is approximately 0.2 percent for 2017 to 2021 (the same as its forecast for 2016 to 2020).
Gas
CECONY delivers gas to approximately 1.1 million customers in Manhattan, the Bronx, parts of Queens and most of Westchester County.
Steam
CECONY operates the largest steam distribution system in the United States by producing and delivering approximately 22,000 MMlb of steam annually to approximately 1,700 customers in parts of Manhattan.
Collective Bargaining Agreement
In June 2016, CECONY reached a four-year collective bargaining agreement with its largest union covering approximately 8,000 employees, effective June 26, 2016.
O&R
Electric
O&R and its utility subsidiary, Rockland Electric Company (RECO) (together referred to herein as O&R) provide electric service to approximately 0.3 million customers in southeastern New York and in northern New Jersey, an approximately 1,300 square mile service area.
During the summer of 2016, electric peak demand in the company's service area was 1,435 MW (which occurred on July 22, 2016). At design conditions, electric peak demand in the company's service area would have been approximately 1,615 MW in 2016 compared to the company's forecast of 1,632 MW. The company decreased its five-year forecast of average annual growth of the electric peak demand in its service area at design conditions from approximately 0.3 percent (for 2016 to 2020) to (0.1) percent (for 2017 to 2021) primarily due to a forecasted increase in distributed generation (photovoltaic) as well as lower growth in demand from customers.
Gas
O&R delivers gas to over 0.1 million customers in southeastern New York.
Sale of Pike County Light & Power Company (Pike)
In August 2016, O&R sold its Pennsylvania subsidiary, Pike, to Corning Natural Gas Holding Corporation (see Note P to the Third Quarter Financial Statements).
Competitive Energy Businesses
Con Edison pursues competitive energy opportunities through three wholly-owned subsidiaries: Con Edison Solutions, Con Edison Energy and Con Edison Development. These businesses provide energy-related products and services to wholesale and retail customers, and develop, own and operate renewable and energy infrastructure projects.
Sale of the Retail Electric Supply Business
In September 2016, Con Edison sold the retail electric supply business of its competitive energy businesses to a subsidiary of Exelon Corporation (see Note P to the Third Quarter Financial Statements).
45
Con Edison Transmission
Con Edison Transmission invests in electric and gas transmission projects through its wholly-owned subsidiaries, Consolidated Edison Transmission, LLC (CET Electric) and Con Edison Gas Pipeline and Storage, LLC (formerly known as Con Edison Gas Midstream, LLC, CET Gas). CET Electric, which was formed in 2014, is investing in a company that owns electric transmission assets in New York. CET Gas, which was formed in 2016, owns, through a subsidiary, a 50 percent equity interest in a joint venture that owns, operates and will further develop an existing gas pipeline and storage business located in northern Pennsylvania and southern New York. In addition, CET Gas owns a 12.5 percent equity interest in a company developing a proposed gas transmission project in West Virginia and Virginia. See “Con Edison Transmission,” below.
Certain financial data of Con Edison’s businesses are presented below:
For the Three Months Ended September 30, 2016 | For the Nine Months Ended September 30, 2016 | At September 30, 2016 | |||||||||||||||
(Millions of Dollars, except percentages) | Operating Revenues | Net Income | Operating Revenues | Net Income | Assets | ||||||||||||
CECONY | $2,828 | 83 | % | $388 | 78 | % | $7,741 | 82 | % | $859 | 83 | % | $40,436 | 85 | % | ||
O&R | 240 | 7 | 27 | 5 | 630 | 7 | 55 | 5 | 2,784 | 6 | |||||||
Total Utilities | 3,068 | 90 | 415 | 83 | 8,371 | 89 | 914 | 88 | 43,220 | 91 | |||||||
Competitive energy businesses (a) | 350 | 10 | 78 | 16 | 998 | 11 | 120 | 12 | 2,394 | 5 | |||||||
Con Edison Transmission | — | — | 10 | 2 | — | — | 11 | 1 | 1,072 | 2 | |||||||
Other (b) | (1) | — | (6) | (1 | ) | (1) | — | (6) | (1 | ) | 630 | 2 | |||||
Total Con Edison | $3,417 | 100 | % | $497 | 100 | % | $9,368 | 100 | % | $1,039 | 100 | % | $47,316 | 100 | % | ||
(a) | Net income from the competitive energy businesses for the three and nine months ended September 30, 2016 includes $47 million of net gain related to the sale of the retail electric supply business, $5 million of net gain related to the acquisition of a solar electric production investment and for the nine months ended September 30, 2016 includes $5 million of net loss related to the impairment of a solar electric production investment (see Note P to the Third Quarter Financial Statements). Also includes for the three and nine months ended September 30, 2016 $(15) million and $5 million, respectively, of net after-tax mark-to-market gains/(losses). |
(b) | Other includes parent company and consolidation adjustments. |
Results of Operations
Net income and earnings per share for the three and nine months ended September 30, 2016 and 2015 were as follows:
For the Three Months Ended September 30, | For the Nine Months Ended September 30, | |||||||||||||||||
2016 | 2015 | 2016 | 2015 | 2016 | 2015 | 2016 | 2015 | |||||||||||
(Millions of Dollars, except per share amounts) | Net Income | Earnings per Share | Net Income | Earnings per Share | ||||||||||||||
CECONY | $388 | $375 | $1.27 | $1.28 | $859 | $935 | $2.87 | $3.19 | ||||||||||
O&R (a) | 27 | 20 | 0.09 | 0.07 | 55 | 35 | 0.18 | 0.12 | ||||||||||
Competitive energy businesses (b) | 78 | 37 | 0.26 | 0.12 | 120 | 55 | 0.40 | 0.19 | ||||||||||
Con Edison Transmission | 10 | — | 0.03 | — | 11 | — | 0.04 | — | ||||||||||
Other (c) | (6) | (4) | (0.02 | ) | (0.01 | ) | (6) | (8) | (0.02 | ) | (0.03 | ) | ||||||
Con Edison (d) | $497 | $428 | $1.63 | $1.46 | $1,039 | $1,017 | $3.47 | $3.47 | ||||||||||
(a) | Includes $3 million or $0.01 a share of net loss for the three and nine months ended September 30, 2015 related to the impairment of certain assets held for sale (see Note P to the Third Quarter Financial Statements). |
(b) | Includes $47 million or $0.15 a share of net gain related to the sale of the retail electric supply business, $5 million or $0.02 a share of net gain related to the acquisition of a solar electric production investment for the three and nine months ended September 30, 2016 and $5 million and or $0.02 a share of net loss related to the impairment of a solar electric production investment for the nine months ended September 30, 2016 (see Note P to the Third Quarter Financial Statements). Also includes $(15) million or $(0.05) a share and $7 million or $0.02 a share of net after-tax mark-to-market gains/(losses) for the three months ended September 30, 2016 and 2015, respectively, and $5 million or $0.02 a share and $2 million or $0.01 a share of net after-tax mark-to-market gains for the nine months ended September 30, 2016 and 2015, respectively. |
(c) | Other includes parent company and consolidation adjustments. |
(d) | Earnings per share on a diluted basis were $1.62 a share and $1.45 a share for the three months ended September 30, 2016 and 2015, respectively, and $3.46 a share for the nine months ended September 30, 2016 and 2015. |
46
The Companies’ results of operations for the three and nine months ended September 30, 2016, as compared with the 2015 periods, reflect changes in rate plans and regulatory charges and, in the nine month period, the impact of warmer than normal weather on steam revenues. Other lower operations and maintenance expenses reflect lower surcharges for assessments and fees that are collected in revenues from customers at the Utilities. In the nine month period, these expenses also reflect higher expenses for emergency response, municipal infrastructure support and stock-based compensation at CECONY. In addition, the Utilities' rate plans provide for revenues to cover expected changes in certain operating costs including depreciation, property taxes and other tax matters. The results of operations also include higher electric retail gross profit and income from renewable investments, the gain on sale of retail electric supply business, the gain and impairment related to a solar electric production investment, and the impact of the net mark-to-market effects of the competitive energy businesses.
The following table presents the estimated effect on earnings per share and net income for the three and nine months ended September 30, 2016 period as compared with 2015 periods, resulting from these and other major factors:
Three Months Variation | Nine Months Variation | ||||||
(Millions of Dollars, except per share amounts) | Earnings per Share Variation | Net Income Variation | Earnings per Share Variation | Net Income Variation | |||
CECONY (a) | |||||||
Changes in rate plans and regulatory charges | $0.05 | $16 | $0.14 | $40 | |||
Weather impact on steam revenues | — | 1 | (0.12) | (36) | |||
Other operations and maintenance expenses | 0.05 | 16 | 0.07 | 21 | |||
Depreciation, property taxes and other tax matters | (0.06) | (18) | (0.30) | (88) | |||
Other (b) | (0.05) | (2) | (0.11) | (13) | |||
Total CECONY | (0.01) | 13 | (0.32) | (76) | |||
O&R (a) | |||||||
Changes in rate plans and regulatory charges | 0.02 | 5 | 0.02 | 7 | |||
Other operations and maintenance expenses | 0.01 | 3 | 0.06 | 17 | |||
Depreciation and property taxes | (0.01) | (3) | (0.03) | (8) | |||
Other (c) | — | 2 | 0.01 | 4 | |||
Total O&R | 0.02 | 7 | 0.06 | 20 | |||
Competitive energy businesses | |||||||
Operating revenues less energy costs | (0.02) | (7) | 0.14 | 41 | |||
Other operations and maintenance expenses | — | (2) | (0.05) | (16) | |||
Gain on sale of retail electric supply business | 0.15 | 47 | 0.15 | 47 | |||
Other (b) | 0.01 | 3 | (0.03) | (7) | |||
Total competitive energy businesses (c) | 0.14 | 41 | 0.21 | 65 | |||
Con Edison Transmission | 0.03 | 10 | 0.04 | 11 | |||
Other, including parent company expenses | (0.01) | (2) | 0.01 | 2 | |||
Total variations | $0.17 | $69 | $— | $22 | |||
(a) | Under the revenue decoupling mechanisms in the Utilities’ New York electric and gas rate plans and the weather-normalization clause applicable to their gas businesses, revenues are generally not affected by changes in delivery volumes from levels assumed when rates were approved. In general, the Utilities recover on a current basis the fuel, gas purchased for resale and purchased power costs they incur in supplying energy to their full-service customers. Accordingly, such costs do not generally affect the Companies’ results of operations. |
(b) | Includes the impact of the dilutive effect of Con Edison's stock issuances. |
(c) | These variations include the impairment of certain assets held for sale in 2015, the gain and impairment related to a solar electric production investment and net mark-to-market effects shown in notes (a) and (b) in the Results of Operations table above. |
47
The Companies’ other operations and maintenance expenses for the three and nine months ended September 30, 2016 and 2015 were as follows:
For the Three Months Ended September 30, | For the Nine Months Ended September 30, | |||||
(Millions of Dollars) | 2016 | 2015 | 2016 | 2015 | ||
CECONY | ||||||
Operations | $381 | $383 | $1,109 | $1,074 | ||
Pensions and other postretirement benefits | 87 | 91 | 261 | 273 | ||
Health care and other benefits | 44 | 38 | 122 | 116 | ||
Regulatory fees and assessments (a) | 129 | 153 | 346 | 433 | ||
Other | 83 | 85 | 267 | 244 | ||
Total CECONY | 724 | 750 | 2,105 | 2,140 | ||
O&R | 77 | 82 | 220 | 249 | ||
Competitive energy businesses | 40 | 37 | 124 | 98 | ||
Con Edison Transmission | 1 | — | 1 | — | ||
Other (b) | (2) | — | (3) | (2) | ||
Total other operations and maintenance expenses | $840 | $869 | $2,447 | $2,485 | ||
(a) | Includes Demand Side Management, System Benefit Charges and Public Service Law 18A assessments which are collected in revenues. |
(b) | Includes parent company and consolidation adjustments. |
Con Edison’s principal business segments are CECONY’s regulated utility activities, O&R’s regulated utility activities, Con Edison’s competitive energy businesses and Con Edison Transmission. CECONY’s principal business segments are its regulated electric, gas and steam utility activities. A discussion of the results of operations by principal business segment for the three and nine months ended September 30, 2016 and 2015 follows. For additional business segment financial information, see Note J to the Third Quarter Financial Statements.
48
Three Months Ended September 30, 2016 Compared with Three Months Ended September 30, 2015
The Companies’ results of operations in 2016 compared with 2015 were:
CECONY | O&R | Competitive Energy Businesses | Con Edison Transmission | Other (a) | Con Edison (b) | ||||||||||||||||||||
(Millions of Dollars) | Increases (Decreases) Amount | Increases (Decreases) Percent | Increases (Decreases) Amount | Increases (Decreases) Percent | Increases (Decreases) Amount | Increases (Decreases) Percent | Increases (Decreases) Amount | Increases (Decreases) Percent | Increases (Decreases) Amount | Increases (Decreases) Percent | Increases (Decreases) Amount | Increases (Decreases) Percent | |||||||||||||
Operating revenues | $(1) | — | % | $11 | 4.8 | % | $(36) | (9.3 | )% | $— | — | % | $— | —% | $(26) | (0.8 | )% | ||||||||
Purchased power | (31) | (5.9 | ) | 5 | 7.8 | (36) | (13.3 | ) | — | — | — | — | (62) | (7.2 | ) | ||||||||||
Fuel | (2) | (6.5 | ) | — | — | — | — | — | — | — | — | (2) | (6.5 | ) | |||||||||||
Gas purchased for resale | 4 | 13.3 | (1) | (11.1 | ) | 14 | 56.0 | — | — | — | — | 17 | 26.6 | ||||||||||||
Other operations and maintenance | (26) | (3.5 | ) | (5) | (6.1 | ) | 3 | 8.1 | 1 | — | (2) | — | (29) | (3.3 | ) | ||||||||||
Depreciation and amortization | 16 | 6.1 | — | — | 5 | 83.3 | — | — | (1) | — | 20 | 7.0 | |||||||||||||
Taxes, other than income taxes | 17 | 3.5 | 6 | 40.0 | — | — | — | — | 1 | Large | 24 | 4.8 | |||||||||||||
Gain on sale of retail electric supply business | — | — | — | — | 104 | — | — | — | — | — | 104 | — | |||||||||||||
Operating income | 21 | 2.8 | 6 | 14.3 | 82 | Large | (1) | — | 2 | — | 110 | 13.3 | |||||||||||||
Other income less deductions | 5 | Large | 6 | Large | 10 | 58.8 | 20 | — | (1) | — | 40 | Large | |||||||||||||
Net interest expense | 9 | 6.2 | — | — | 5 | Large | 3 | — | (1) | (16.7 | ) | 16 | 9.9 | ||||||||||||
Income before income tax expense | 17 | 2.8 | 12 | 42.9 | 87 | Large | 16 | — | 2 | 33.3 | 134 | 19.8 | |||||||||||||
Income tax expense | 4 | 1.8 | 5 | 62.5 | 46 | Large | 6 | — | 4 | Large | 65 | 26.1 | |||||||||||||
Net income | $13 | 3.5 | % | $7 | 35.0 | % | $41 | Large | $10 | — | % | $(2) | (50.0 | )% | $69 | 16.1 | % | ||||||||
(a) | Includes parent company and consolidation adjustments. |
(b) | Represents the consolidated financial results of Con Edison and its businesses. |
49
CECONY
For the Three Months Ended September 30, 2016 | For the Three Months Ended September 30, 2015 | ||||||||||||||
(Millions of Dollars) | Electric | Gas | Steam | 2016 Total | Electric | Gas | Steam | 2015 Total | 2016-2015 Variation | ||||||
Operating revenues | $2,557 | $208 | $63 | $2,828 | $2,558 | $213 | $58 | $2,829 | $(1) | ||||||
Purchased power | 486 | — | 9 | 495 | 519 | — | 7 | 526 | (31) | ||||||
Fuel | 21 | — | 8 | 29 | 24 | — | 7 | 31 | (2) | ||||||
Gas purchased for resale | — | 34 | — | 34 | — | 30 | — | 30 | 4 | ||||||
Other operations and maintenance | 578 | 102 | 44 | 724 | 598 | 106 | 46 | 750 | (26) | ||||||
Depreciation and amortization | 217 | 41 | 20 | 278 | 207 | 35 | 20 | 262 | 16 | ||||||
Taxes, other than income taxes | 414 | 59 | 29 | 502 | 399 | 59 | 27 | 485 | 17 | ||||||
Operating income | $841 | $(28) | $(47) | $766 | $811 | $(17) | $(49) | $745 | $21 | ||||||
Electric
CECONY’s results of electric operations for the three months ended September 30, 2016 compared with the 2015 period is as follows:
For the Three Months Ended | |||
(Millions of Dollars) | September 30, 2016 | September 30, 2015 | Variation |
Operating revenues | $2,557 | $2,558 | $(1) |
Purchased power | 486 | 519 | (33) |
Fuel | 21 | 24 | (3) |
Other operations and maintenance | 578 | 598 | (20) |
Depreciation and amortization | 217 | 207 | 10 |
Taxes, other than income taxes | 414 | 399 | 15 |
Electric operating income | $841 | $811 | $30 |
CECONY’s electric sales and deliveries for the three months ended September 30, 2016 compared with the 2015 period were:
Millions of kWh Delivered | Revenues in Millions (a) | |||||||||||||
For the Three Months Ended | For the Three Months Ended | |||||||||||||
Description | September 30, 2016 | September 30, 2015 | Variation | Percent Variation | September 30, 2016 | September 30, 2015 | Variation | Percent Variation | ||||||
Residential/Religious (b) | 3,653 | 3,577 | 76 | 2.1 | % | $883 | $903 | $(20) | (2.2 | )% | ||||
Commercial/Industrial | 2,749 | 2,692 | 57 | 2.1 | 551 | 574 | (23) | (4.0 | ) | |||||
Retail choice customers | 8,136 | 7,822 | 314 | 4.0 | 918 | 888 | 30 | 3.4 | ||||||
NYPA, Municipal Agency and other sales | 2,764 | 2,731 | 33 | 1.2 | 204 | 198 | 6 | 3.0 | ||||||
Other operating revenues (c) | — | — | — | — | 1 | (5) | 6 | Large | ||||||
Total | 17,302 | 16,822 | 480 | 2.9 | % | (d) | $2,557 | $2,558 | $(1) | — | % | |||
(a) | Revenues from electric sales are subject to a revenue decoupling mechanism, as a result of which delivery revenues generally are not affected by changes in delivery volumes from levels assumed when rates were approved. |
(b) | “Residential/Religious” generally includes single-family dwellings, individual apartments in multi-family dwellings, religious organizations and certain other not-for-profit organizations. |
(c) | Other electric operating revenues generally reflect changes in regulatory assets and liabilities in accordance with the revenue decoupling mechanism and other provisions of the company’s rate plans. |
(d) | After adjusting for variations, principally weather and billing days, electric delivery volumes in CECONY’s service area increased 1.0 percent in the three months ended September 30, 2016 compared with the 2015 period. |
50
Operating revenues decreased $1 million in the three months ended September 30, 2016 compared with the 2015 period due primarily to lower purchased power costs ($33 million) and fuel expenses ($3 million), offset in part by higher revenues from the electric rate plan ($35 million).
Purchased power expenses decreased $33 million in the three months ended September 30, 2016 compared with the 2015 period due to lower unit costs ($39 million), offset by higher purchased volumes ($6 million).
Fuel expenses decreased $3 million in the three months ended September 30, 2016 compared with the 2015 period due to lower unit costs.
Other operations and maintenance expenses decreased $20 million in the three months ended September 30, 2016 compared with the 2015 period due primarily to a decrease in the surcharges for assessments and fees that are collected in revenues from customers.
Depreciation and amortization increased $10 million in the three months ended September 30, 2016 compared with the 2015 period due primarily to higher electric utility plant balances.
Taxes, other than income taxes increased $15 million in the three months ended September 30, 2016 compared with the 2015 period principally due to higher property taxes ($13 million) and state and local taxes ($2 million).
Gas
CECONY’s results of gas operations for the three months ended September 30, 2016 compared with the 2015 period is as follows:
For the Three Months Ended | ||||
(Millions of Dollars) | September 30, 2016 | September 30, 2015 | Variation | |
Operating revenues | $208 | $213 | $(5) | |
Gas purchased for resale | 34 | 30 | 4 | |
Other operations and maintenance | 102 | 106 | (4) | |
Depreciation and amortization | 41 | 35 | 6 | |
Taxes, other than income taxes | 59 | 59 | — | |
Gas operating income | $(28) | $(17) | $(11) | |
CECONY’s gas sales and deliveries, excluding off-system sales, for the three months ended September 30, 2016 compared with the 2015 period were:
Thousands of Dt Delivered | Revenues in Millions (a) | |||||||||||||||
For the Three Months Ended | For the Three Months Ended | |||||||||||||||
Description | September 30, 2016 | September 30, 2015 | Variation | Percent Variation | September 30, 2016 | September 30, 2015 | Variation | Percent Variation | ||||||||
Residential | 4,335 | 4,118 | 217 | 5.3 | % | $88 | $83 | $5 | 6.0 | % | ||||||
General | 3,963 | 3,226 | 737 | 22.8 | 41 | 35 | 6 | 17.1 | ||||||||
Firm transportation | 8,305 | 8,185 | 120 | 1.5 | 53 | 58 | (5) | (8.6 | ) | |||||||
Total firm sales and transportation | 16,603 | 15,529 | 1,074 | 6.9 | (b) | 182 | 176 | 6 | 3.4 | |||||||
Interruptible sales (c) | 1,664 | 1,772 | (108 | ) | (6.1 | ) | 4 | 6 | (2) | (33.3 | ) | |||||
NYPA | 12,800 | 14,023 | (1,223 | ) | (8.7 | ) | 1 | 1 | — | — | ||||||
Generation plants | 35,745 | 30,610 | 5,135 | 16.8 | 7 | 7 | — | — | ||||||||
Other | 4,975 | 4,512 | 463 | 10.3 | 6 | 6 | — | — | ||||||||
Other operating revenues (d) | — | — | — | — | 8 | 17 | (9) | (52.9 | ) | |||||||
Total | 71,787 | 66,446 | 5,341 | 8.0 | % | $208 | $213 | $(5) | (2.3 | )% | ||||||
(a) | Revenues from gas sales are subject to a weather normalization clause and a revenue decoupling mechanism as a result of which delivery revenues are generally not affected by changes in delivery volumes from levels assumed when rates were approved. |
51
(b) | After adjusting for variations, principally billing days, firm gas sales and transportation volumes in the company’s service area increased 7.8 percent in the three months ended September 30, 2016 compared with the 2015 period, reflecting primarily increased volumes attributable to additional customers that have converted from oil-to-gas as heating fuel for their buildings. |
(c) | Includes 915 thousands and 765 thousands of Dt for the 2016 and 2015 periods, respectively, which are also reflected in firm transportation and other. |
(d) | Other gas operating revenues generally reflect changes in regulatory assets and liabilities in accordance with the company’s rate plans. |
Operating revenues decreased $5 million in the three months ended September 30, 2016 compared with the 2015 period due primarily to changes in regulatory charges ($12 million), offset in part by higher gas purchased for resale expense ($4 million).
Gas purchased for resale increased $4 million in the three months ended September 30, 2016 compared with the 2015 period due to higher unit costs ($7 million), offset by lower sendout volumes ($3 million).
Other operations and maintenance expenses decreased $4 million in the three months ended September 30, 2016 compared with the 2015 period due primarily to a decrease in the surcharges for assessments and fees that are collected in revenues from customers ($2 million) and lower stock-based compensation costs ($2 million).
Depreciation and amortization increased $6 million in the three months ended September 30, 2016 compared with the 2015 period due primarily to higher gas utility plant balances.
Steam
CECONY’s results of steam operations for the three months ended September 30, 2016 compared with the 2015 period is as follows:
For the Three Months Ended | ||||
(Millions of Dollars) | September 30, 2016 | September 30, 2015 | Variation | |
Operating revenues | $63 | $58 | $5 | |
Purchased power | 9 | 7 | 2 | |
Fuel | 8 | 7 | 1 | |
Other operations and maintenance | 44 | 46 | (2) | |
Depreciation and amortization | 20 | 20 | — | |
Taxes, other than income taxes | 29 | 27 | 2 | |
Steam operating income | $(47) | $(49) | $2 | |
CECONY’s steam sales and deliveries for the three months ended September 30, 2016 compared with the 2015 period were:
Millions of Pounds Delivered | Revenues in Millions | |||||||||||||||
For the Three Months Ended | For the Three Months Ended | |||||||||||||||
Description | September 30, 2016 | September 30, 2015 | Variation | Percent Variation | September 30, 2016 | September 30, 2015 | Variation | Percent Variation | ||||||||
General | 10 | 19 | (9 | ) | (47.4 | )% | $2 | $2 | $— | — | % | |||||
Apartment house | 776 | 816 | (40 | ) | (4.9 | ) | 15 | 16 | (1) | (6.3 | ) | |||||
Annual power | 2,950 | 2,961 | (11 | ) | (0.4 | ) | 49 | 46 | 3 | 6.5 | ||||||
Other operating revenues (a) | — | — | — | — | (3) | (6) | 3 | 50.0 | ||||||||
Total | 3,736 | 3,796 | (60 | ) | (1.6 | )% | (b) | $63 | $58 | $5 | 8.6 | % | ||||
(a) | Other steam operating revenues generally reflect changes in regulatory assets and liabilities in accordance with the company’s rate plan. |
(b) | After adjusting for variations, principally weather and billing days, steam sales and deliveries decreased 3.4 percent in three months ended September 30, 2016 compared with the 2015 period. |
Operating revenues increased $5 million in the three months ended September 30, 2016 compared with the 2015 period due primarily to higher revenues from the steam rate plan ($3 million), purchased power costs ($2 million) and fuel expenses ($1 million).
Purchased power expenses increased $2 million in the three months ended September 30, 2016 compared with the 2015 period due to higher unit costs.
52
Fuel expenses increased $1 million in the three months ended September 30, 2016 compared with the 2015 period due to higher unit costs.
Other operations and maintenance expenses decreased $2 million in the three months ended September 30, 2016 compared with the 2015 period due primarily to lower stock-based compensation costs.
Taxes, other than income taxes increased $2 million in the three months ended September 30, 2016 compared with the 2015 period principally due to higher property taxes.
Net Interest Expense
Net interest expense increased $9 million in the three months ended September 30, 2016 compared with the 2015 period due primarily higher long-term debt balances in the 2016 period.
Income Tax Expense
Income taxes increased $4 million in the three months ended September 30, 2016 compared with the 2015 period due primarily to higher income before income tax expense ($7 million) and plant-related flow through items ($13 million), offset in part by lower state income taxes ($8 million), a research and development tax credit ($5 million) and higher settlement payments related to injuries and damages ($2 million).
O&R
For the Three Months Ended September 30, 2016 | For the Three Months Ended September 30, 2015 | |||||||||||
(Millions of Dollars) | Electric | Gas | 2016 Total | Electric | Gas | 2015 Total | 2016-2015 Variation | |||||
Operating revenues | $213 | $27 | $240 | $205 | $24 | $229 | $11 | |||||
Purchased power | 69 | — | 69 | 64 | — | 64 | 5 | |||||
Gas purchased for resale | — | 8 | 8 | — | 9 | 9 | (1) | |||||
Other operations and maintenance | 63 | 14 | 77 | 66 | 16 | 82 | (5) | |||||
Depreciation and amortization | 12 | 5 | 17 | 13 | 4 | 17 | — | |||||
Taxes, other than income taxes | 14 | 7 | 21 | 11 | 4 | 15 | 6 | |||||
Operating income | $55 | $(7) | $48 | $51 | $(9) | $42 | $6 | |||||
Electric
O&R’s results of electric operations for the three months ended September 30, 2016 compared with the 2015 period is as follows:
For the Three Months Ended | |||
(Millions of Dollars) | September 30, 2016 | September 30, 2015 | Variation |
Operating revenues | $213 | $205 | $8 |
Purchased power | 69 | 64 | 5 |
Other operations and maintenance | 63 | 66 | (3) |
Depreciation and amortization | 12 | 13 | (1) |
Taxes, other than income taxes | 14 | 11 | 3 |
Electric operating income | $55 | $51 | $4 |
53
O&R’s electric sales and deliveries for the three months ended September 30, 2016 compared with the 2015 period were:
Millions of kWh Delivered | Revenues in Millions (a) | ||||||||||||||
For the Three Months Ended | For the Three Months Ended | ||||||||||||||
Description | September 30, 2016 | September 30, 2015 | Variation | Percent Variation | September 30, 2016 | September 30, 2015 | Variation | Percent Variation | |||||||
Residential/Religious (b) | 585 | 533 | 52 | 9.8 | % | $109 | $99 | $10 | 10.1 | % | |||||
Commercial/Industrial | 216 | 220 | (4 | ) | (1.8 | ) | 35 | 35 | — | — | |||||
Retail choice customers | 925 | 926 | (1 | ) | (0.1 | ) | 70 | 69 | 1 | 1.4 | |||||
Public authorities | 31 | 28 | 3 | 10.7 | 2 | 3 | (1 | ) | (33.3 | ) | |||||
Other operating revenues (c) | — | — | — | — | (3) | (1) | (2) | Large | |||||||
Total | 1,757 | 1,707 | 50 | 2.9 | % | (d) | $213 | $205 | $8 | 3.9 | % | ||||
(a) | O&R’s New York electric delivery revenues are subject to a revenue decoupling mechanism, as a result of which delivery revenues are generally not affected by changes in delivery volumes from levels assumed when rates were approved. O&R’s electric sales in New Jersey and Pennsylvania are not subject to a decoupling mechanism, and as a result, changes in such volumes do impact revenues. |
(b) | “Residential/Religious” generally includes single-family dwellings, individual apartments in multi-family dwellings, religious organizations and certain other not-for-profit organizations. |
(c) | Other electric operating revenues generally reflect changes in regulatory assets and liabilities in accordance with the company’s electric rate plans. |
(d) | After adjusting for weather and other variations, electric delivery volumes in O&R’s service area decreased 0.9 percent in the three months ended September 30, 2016 compared with the 2015 period. |
Operating revenues increased $8 million in the three months ended September 30, 2016 compared with the 2015 period due primarily to higher revenues from the electric rate plans ($6 million) and purchased power costs ($5 million).
Purchased power expenses increased $5 million in the three months ended September 30, 2016 compared with the 2015 period due to higher purchased volumes ($6 million), offset by lower unit costs ($1 million).
Other operations and maintenance expenses decreased $3 million in the three months ended September 30, 2016 compared with the 2015 period due primarily to regulatory accounting effects of pension costs.
Depreciation and amortization decreased $1 million in the three months ended September 30, 2016 compared with the 2015 period due primarily to lower average depreciation rates.
Taxes, other than income taxes increased $3 million in the three months ended September 30, 2016 compared with the 2015 period principally due to higher property taxes.
Gas
O&R’s results of gas operations for the three months ended September 30, 2016 compared with the 2015 period is as follows:
For the Three Months Ended | |||
(Millions of Dollars) | September 30, 2016 | September 30, 2015 | Variation |
Operating revenues | $27 | $24 | $3 |
Gas purchased for resale | 8 | 9 | (1) |
Other operations and maintenance | 14 | 16 | (2) |
Depreciation and amortization | 5 | 4 | 1 |
Taxes, other than income taxes | 7 | 4 | 3 |
Gas operating income | $(7) | $(9) | $2 |
54
O&R’s gas sales and deliveries, excluding off-system sales, for the three months ended September 30, 2016 compared with the 2015 period were:
Thousands of Dt Delivered | Revenues in Millions (a) | ||||||||||||||||
For the Three Months Ended | For the Three Months Ended | ||||||||||||||||
Description | September 30, 2016 | September 30, 2015 | Variation | Percent Variation | September 30, 2016 | September 30, 2015 | Variation | Percent Variation | |||||||||
Residential | 550 | 481 | 69 | 14.3 | % | $9 | $7 | $2 | 28.6 | % | |||||||
General | 177 | 120 | 57 | 47.5 | 2 | 1 | 1 | Large | |||||||||
Firm transportation | 884 | 980 | (96 | ) | (9.8 | ) | 8 | 8 | — | — | |||||||
Total firm sales and transportation | 1,611 | 1,581 | 30 | 1.9 | (b) | 19 | 16 | 3 | 18.8 | ||||||||
Interruptible sales | 893 | 938 | (45 | ) | (4.8 | ) | — | — | — | — | |||||||
Generation plants | 3 | 10 | (7 | ) | (70.0 | ) | — | — | — | — | |||||||
Other | 70 | 70 | — | — | — | — | — | — | |||||||||
Other gas revenues | — | — | — | — | 8 | 8 | — | — | |||||||||
Total | 2,577 | 2,599 | (22 | ) | (0.8 | )% | $27 | $24 | $3 | 12.5 | % | ||||||
(a) | Revenues from New York gas sales are subject to a weather normalization clause and a revenue decoupling mechanism as a result of which delivery revenues are generally not affected by changes in delivery volumes from levels assumed when rates were approved. |
(b) | After adjusting for weather and other variations, total firm sales and transportation volumes decreased 1.7 percent in the three months ended September 30, 2016 compared with 2015 period. |
Operating revenues increased $3 million in the three months ended September 30, 2016 compared with the 2015 period due primarily to higher revenues from the New York gas rate plan ($4 million), offset by a decrease in gas purchased for resale ($1 million).
Gas purchased for resale decreased $1 million in the three months ended September 30, 2016 compared with the 2015 period due to lower purchased volumes ($2 million), offset by higher unit costs ($1 million).
Other operations and maintenance expenses decreased $2 million in the three months ended September 30, 2016 compared with the 2015 period due primarily to regulatory accounting effects of pension costs.
Depreciation and amortization increased $1 million in the three months ended September 30, 2016 compared with the 2015 period due primarily to higher gas utility plant balances.
Taxes, other than income taxes increased $3 million in the three months ended September 30, 2016 compared with the 2015 period principally due to higher property taxes.
Other Income (Deductions)
Other income (deductions) increased $6 million in the three months ended September 30, 2016 compared with the 2015 period due primarily to the impairment of certain assets held for sale in 2015 (see Note P to the Third Quarter Financial Statements).
Income Tax Expense
Income taxes increased $5 million in the three months ended September 30, 2016 compared with the 2015 period due primarily to higher income before income tax expense.
55
Competitive Energy Businesses
The competitive energy businesses’ results of operations for the three months ended September 30, 2016 compared with the 2015 period is as follows:
For the Three Months Ended | |||||
(Millions of Dollars) | September 30, 2016 | September 30, 2015 | Variation | ||
Operating revenues | $350 | $386 | $(36) | ||
Purchased power | 234 | 270 | (36) | ||
Gas purchased for resale | 39 | 25 | 14 | ||
Other operations and maintenance | 40 | 37 | 3 | ||
Depreciation and amortization | 11 | 6 | 5 | ||
Taxes, other than income taxes | 5 | 5 | — | ||
Gain on sale of retail electric supply business | (104) | — | (104) | ||
Operating income | $125 | $43 | $82 | ||
Operating revenues decreased $36 million in the three months ended September 30, 2016 compared with the 2015 period, due primarily to lower electric retail revenues due in part to the sale of the retail electric supply business (see Note P to the Third Quarter Financial Statements). Electric retail revenues decreased $71 million due to lower sales volume ($57 million) and unit prices ($14 million). Renewable revenues increased $15 million primarily due to an increase in renewable electric production projects in operation. Energy services revenues increased $9 million. Wholesale revenues increased $12 million due to higher sales volumes. Net mark-to-market values decreased $36 million, of which $35 million in losses are reflected in purchased power costs and $1 million in losses are reflected in revenues.
Purchased power expenses decreased $36 million in the three months ended September 30, 2016 compared with the 2015 period due primarily to lower volumes ($51 million) and lower unit prices ($20 million), offset by changes in mark-to-market losses ($35 million).
Gas purchased for resale increased $14 million in the three months ended September 30, 2016 compared with the 2015 period due to higher sale volumes.
Other operations and maintenance expenses increased $3 million in the three months ended September 30, 2016 compared with the 2015 period due primarily to an increase in energy services costs.
Depreciation and amortization increased $5 million in the three months ended September 30, 2016 compared with the 2015 period due an increase in solar electric production projects in operation during 2016.
Gain on sale of retail electric supply business was $104 million in the three months ended September 30, 2016 reflecting the sale of the competitive energy businesses' retail electric supply business (see Note P to the Third Quarter Financial Statements).
Other Income (Deductions)
Other income (deductions) increased $10 million in the three months ended September 30, 2016 compared with the 2015 period due primarily to the gain related to the acquisition of a solar electric production investment (see Note P to the Third Quarter Financial Statements).
Net Interest Expense
Net interest expense increased $5 million in the three months ended September 30, 2016 compared with the 2015 period due primarily to increased debt on solar projects.
Income Tax Expense
Income taxes increased $46 million in the three months ended September 30, 2016 compared with the 2015 period due primarily to higher income before income tax expense ($35 million) and an adjustment to deferred state income taxes as a result of the sale of the retail electric supply business that increased the competitive energy businesses'
56
state apportionment factors on its cumulative temporary differences ($13 million), offset in part by higher renewable energy tax credits ($2 million).
Con Edison Transmission
Other Income (Deductions)
Other income (deductions) increased $20 million in the three months ended September 30, 2016 compared with the 2015 period due primarily to earnings from equity investments in 2016 (see Note P).
Other
For Con Edison, “Other” includes parent company and consolidation adjustments.
57
Nine Months Ended September 30, 2016 Compared with Nine Months Ended September 30, 2015
The Companies’ results of operations in 2016 compared with 2015 were:
CECONY | O&R | Competitive Energy Businesses | Con Edison Transmission | Other (a) | Con Edison (b) | |||||||||||||||||||
(Millions of Dollars) | Increases (Decreases) Amount | Increases (Decreases) Percent | Increases (Decreases) Amount | Increases (Decreases) Percent | Increases (Decreases) Amount | Increases (Decreases) Percent | Increases (Decreases) Amount | Increases (Decreases) Percent | Increases (Decreases) Amount | Increases (Decreases) Percent | Increases (Decreases) Amount | Increases (Decreases) Percent | ||||||||||||
Operating revenues | $(381) | (4.7 | )% | $(10) | (1.6 | )% | $(89) | (8.2 | )% | $— | — | % | $1 | 50.0 | % | $(479) | (4.9 | )% | ||||||
Purchased power | (207) | (14.5 | ) | (15) | (8.9 | ) | (136) | (16.7 | ) | — | — | 1 | — | (357) | (14.9 | ) | ||||||||
Fuel | (83) | (38.4 | ) | — | — | — | — | — | — | — | — | (83) | (38.4 | ) | ||||||||||
Gas purchased for resale | (65) | (23.0 | ) | (8) | (20.0 | ) | (22) | (23.4 | ) | — | — | — | — | (95) | (22.9 | ) | ||||||||
Other operations and maintenance | (35) | (1.6 | ) | (29) | (11.6 | ) | 26 | 26.5 | 1 | — | (1) | (50.0 | ) | (38) | (1.5 | ) | ||||||||
Depreciation and amortization | 52 | 6.7 | (1) | (2.0 | ) | 14 | 87.5 | — | — | — | — | 65 | 7.7 | |||||||||||
Taxes, other than income taxes | 47 | 3.4 | 14 | 30.4 | 2 | 14.3 | — | — | 1 | — | 64 | 4.4 | ||||||||||||
Gain on sale of retail electric supply business | — | — | — | — | 104 | — | — | — | — | — | 104 | — | ||||||||||||
Operating income | (90) | (4.8 | ) | 29 | 34.1 | 131 | Large | (1) | — | — | — | 69 | 3.4 | |||||||||||
Other income less deductions | 6 | Large | 5 | Large | 3 | 9.4 | 23 | — | 1 | Large | 38 | Large | ||||||||||||
Net interest expense | 16 | 3.7 | 1 | 3.7 | 18 | Large | 4 | — | (8) | (42.1 | ) | 31 | 6.4 | |||||||||||
Income before income tax expense | (100) | (6.9 | ) | 33 | 61.1 | 116 | Large | 18 | — | 9 | 47.4 | 76 | 4.9 | |||||||||||
Income tax expense | (24) | (4.7 | ) | 13 | 68.4 | 51 | Large | 7 | — | 7 | 63.6 | 54 | 9.9 | |||||||||||
Net income | $(76) | (8.1 | )% | $20 | 57.1 | % | $65 | Large | $11 | — | % | $2 | 25.0 | % | $22 | 2.2 | % | |||||||
(a) | Includes parent company and consolidation adjustments. |
(b) | Represents the consolidated financial results of Con Edison and its businesses. |
58
CECONY
For the Nine Months Ended September 30, 2016 | For the Nine Months Ended September 30, 2015 | ||||||||||||||
(Millions of Dollars) | Electric | Gas | Steam | 2016 Total | Electric | Gas | Steam | 2015 Total | 2016-2015 Variation | ||||||
Operating revenues | $6,222 | $1,113 | $406 | $7,741 | $6,416 | $1,177 | $529 | $8,122 | $(381) | ||||||
Purchased power | 1,191 | — | 25 | 1,216 | 1,395 | — | 28 | 1,423 | (207) | ||||||
Fuel | 81 | — | 52 | 133 | 96 | — | 120 | 216 | (83) | ||||||
Gas purchased for resale | — | 217 | — | 217 | — | 282 | — | 282 | (65) | ||||||
Other operations and maintenance | 1,659 | 307 | 139 | 2,105 | 1,677 | 323 | 140 | 2,140 | (35) | ||||||
Depreciation and amortization | 645 | 118 | 62 | 825 | 610 | 105 | 58 | 773 | 52 | ||||||
Taxes, other than income taxes | 1,159 | 198 | 89 | 1,446 | 1,127 | 189 | 83 | 1,399 | 47 | ||||||
Operating income | $1,487 | $273 | $39 | $1,799 | $1,511 | $278 | $100 | $1,889 | $(90) | ||||||
Electric
CECONY’s results of electric operations for the nine months ended September 30, 2016 compared with the 2015 period is as follows:
For the Nine Months Ended | |||
(Millions of Dollars) | September 30, 2016 | September 30, 2015 | Variation |
Operating revenues | $6,222 | $6,416 | $(194) |
Purchased power | 1,191 | 1,395 | (204) |
Fuel | 81 | 96 | (15) |
Other operations and maintenance | 1,659 | 1,677 | (18) |
Depreciation and amortization | 645 | 610 | 35 |
Taxes, other than income taxes | 1,159 | 1,127 | 32 |
Electric operating income | $1,487 | $1,511 | $(24) |
CECONY’s electric sales and deliveries for the nine months ended September 30, 2016 compared with the 2015 period were:
Millions of kWh Delivered | Revenues in Millions (a) | |||||||||||||
For the Nine Months Ended | For the Nine Months Ended | |||||||||||||
Description | September 30, 2016 | September 30, 2015 | Variation | Percent Variation | September 30, 2016 | September 30, 2015 | Variation | Percent Variation | ||||||
Residential/Religious (b) | 8,130 | 8,247 | (117 | ) | (1.4 | )% | $2,017 | $2,198 | $(181) | (8.2 | )% | |||
Commercial/Industrial | 7,220 | 7,375 | (155 | ) | (2.1 | ) | 1,381 | 1,549 | (168) | (10.8 | ) | |||
Retail choice customers | 20,404 | 20,339 | 65 | 0.3 | 2,114 | 2,102 | 12 | 0.6 | ||||||
NYPA, Municipal Agency and other sales | 7,641 | 7,687 | (46 | ) | (0.6 | ) | 474 | 467 | 7 | 1.5 | ||||
Other operating revenues (c) | — | — | — | — | 236 | 100 | 136 | Large | ||||||
Total | 43,395 | 43,648 | (253 | ) | (0.6 | )% | (d) | $6,222 | $6,416 | $(194) | (3.0 | )% | ||
(a) | Revenues from electric sales are subject to a revenue decoupling mechanism, as a result of which delivery revenues generally are not affected by changes in delivery volumes from levels assumed when rates were approved. |
(b) | “Residential/Religious” generally includes single-family dwellings, individual apartments in multi-family dwellings, religious organizations and certain other not-for-profit organizations. |
(c) | Other electric operating revenues generally reflect changes in regulatory assets and liabilities in accordance with the revenue decoupling mechanism and other provisions of the company’s rate plans. |
(d) | After adjusting for variations, principally weather and billing days, electric delivery volumes in CECONY’s service area increased 0.5 percent in the nine months ended September 30, 2016 compared with the 2015 period. |
59
Operating revenues decreased $194 million in the nine months ended September 30, 2016 compared with the 2015 period due primarily to lower purchased power costs ($204 million) and fuel expenses ($15 million), offset in part by changes in regulatory charges ($20 million).
Purchased power expenses decreased $204 million in the nine months ended September 30, 2016 compared with the 2015 period due to lower unit costs ($169 million) and purchased volumes ($35 million).
Fuel expenses decreased $15 million in the nine months ended September 30, 2016 compared with the 2015 period due to lower unit costs ($20 million), offset by higher sendout volumes from the company’s electric generating facilities ($5 million).
Other operations and maintenance expenses decreased $18 million in the nine months ended September 30, 2016 compared with the 2015 period due primarily to a decrease in the surcharges for assessments and fees that are collected in revenues from customers ($62 million), offset in part by higher costs for municipal infrastructure support ($15 million), emergency response ($13 million), stock-based compensation ($7 million) and injuries and damages ($6 million).
Depreciation and amortization increased $35 million in the nine months ended September 30, 2016 compared with the 2015 period due primarily to higher electric utility plant balances.
Taxes, other than income taxes increased $32 million in the nine months ended September 30, 2016 compared with the 2015 period principally due to higher property taxes ($47 million), offset in part by lower state and local taxes ($6 million), a favorable state audit settlement ($4 million) and lower sales and use tax reserve based on a favorable audit settlement ($3 million).
Gas
CECONY’s results of gas operations for the nine months ended September 30, 2016 compared with the 2015 period is as follows:
For the Nine Months Ended | |||
(Millions of Dollars) | September 30, 2016 | September 30, 2015 | Variation |
Operating revenues | $1,113 | $1,177 | $(64) |
Gas purchased for resale | 217 | 282 | (65) |
Other operations and maintenance | 307 | 323 | (16) |
Depreciation and amortization | 118 | 105 | 13 |
Taxes, other than income taxes | 198 | 189 | 9 |
Gas operating income | $273 | $278 | $(5) |
60
CECONY’s gas sales and deliveries, excluding off-system sales, for the nine months ended September 30, 2016 compared with the 2015 period were:
Thousands of Dt Delivered | Revenues in Millions (a) | |||||||||||||||
For the Nine Months Ended | For the Nine Months Ended | |||||||||||||||
Description | September 30, 2016 | September 30, 2015 | Variation | Percent Variation | September 30, 2016 | September 30, 2015 | Variation | Percent Variation | ||||||||
Residential | 35,565 | 39,010 | (3,445 | ) | (8.8 | )% | $506 | $532 | $(26) | (4.9 | )% | |||||
General | 20,962 | 22,641 | (1,679 | ) | (7.4 | ) | 200 | 217 | (17) | (7.8 | ) | |||||
Firm transportation | 51,333 | 57,578 | (6,245 | ) | (10.8 | ) | 332 | 342 | (10) | (2.9 | ) | |||||
Total firm sales and transportation | 107,860 | 119,229 | (11,369 | ) | (9.5 | ) | (b) | 1,038 | 1,091 | (53) | (4.9 | ) | ||||
Interruptible sales (c) | 7,587 | 5,933 | 1,654 | 27.9 | 29 | 45 | (16) | (35.6 | ) | |||||||
NYPA | 31,970 | 33,825 | (1,855 | ) | (5.5 | ) | 2 | 2 | — | — | ||||||
Generation plants | 70,895 | 62,650 | 8,245 | 13.2 | 19 | 20 | (1) | (5.0 | ) | |||||||
Other | 16,442 | 16,285 | 157 | 1.0 | 25 | 21 | 4 | 19.0 | ||||||||
Other operating revenues (d) | — | — | — | — | — | (2) | 2 | Large | ||||||||
Total | 234,754 | 237,922 | (3,168 | ) | (1.3 | )% | $1,113 | $1,177 | $(64) | (5.4 | )% | |||||
(a) | Revenues from gas sales are subject to a weather normalization clause and a revenue decoupling mechanism as a result of which delivery revenues are generally not affected by changes in delivery volumes from levels assumed when rates were approved. |
(b) | After adjusting for variations, principally billing days, firm gas sales and transportation volumes in the company’s service area increased 4.1 percent in the nine months ended September 30, 2016 compared with the 2015 period, reflecting primarily increased volumes attributable to additional customers that have converted from oil-to-gas as heating fuel for their buildings. |
(c) | Includes 3,940 thousands and 1,809 thousands of Dt for the 2016 and 2015 periods, respectively, which are also reflected in firm transportation and other. |
(d) | Other gas operating revenues generally reflect changes in regulatory assets and liabilities in accordance with the company’s rate plans. |
Operating revenues decreased $64 million in the nine months ended September 30, 2016 compared with the 2015 period due primarily to lower gas purchased for resale expense ($65 million) and changes in regulatory charges ($17 million), offset in part by higher revenues from the gas rate plan ($26 million) reflecting primarily higher delivery volumes attributable to oil-to-gas conversions.
Gas purchased for resale decreased $65 million in the nine months ended September 30, 2016 compared with the 2015 period due to lower unit costs ($48 million) and sendout volumes ($17 million).
Other operations and maintenance expenses decreased $16 million in the nine months ended September 30, 2016 compared with the 2015 period due primarily to a decrease in the surcharges for assessments and fees that are collected in revenues from customers ($19 million), offset in part by higher costs for municipal infrastructure support ($5 million).
Depreciation and amortization increased $13 million in the nine months ended September 30, 2016 compared with the 2015 period due primarily to higher gas utility plant balances.
Taxes, other than income taxes increased $9 million in the nine months ended September 30, 2016 compared with the 2015 period principally due to higher property taxes ($12 million), offset in part by lower state and local taxes ($1 million).
61
Steam
CECONY’s results of steam operations for the nine months ended September 30, 2016 compared with the 2015 period is as follows:
For the Nine Months Ended | |||
(Millions of Dollars) | September 30, 2016 | September 30, 2015 | Variation |
Operating revenues | $406 | $529 | $(123) |
Purchased power | 25 | 28 | (3) |
Fuel | 52 | 120 | (68) |
Other operations and maintenance | 139 | 140 | (1) |
Depreciation and amortization | 62 | 58 | 4 |
Taxes, other than income taxes | 89 | 83 | 6 |
Steam operating income | $39 | $100 | $(61) |
CECONY’s steam sales and deliveries for the nine months ended September 30, 2016 compared with the 2015 period were:
Millions of Pounds Delivered | Revenues in Millions | ||||||||||||||
For the Nine Months Ended | For the Nine Months Ended | ||||||||||||||
Description | September 30, 2016 | September 30, 2015 | Variation | Percent Variation | September 30, 2016 | September 30, 2015 | Variation | Percent Variation | |||||||
General | 345 | 460 | (115 | ) | (25.0 | )% | $18 | $24 | $(6) | (25.0 | )% | ||||
Apartment house | 4,251 | 5,056 | (805 | ) | (15.9 | ) | 107 | 145 | (38) | (26.2 | ) | ||||
Annual power | 10,640 | 12,593 | (1,953 | ) | (15.5 | ) | 284 | 379 | (95) | (25.1 | ) | ||||
Other operating revenues (a) | — | — | — | — | (3 | ) | (19) | 16 | 84.2 | % | |||||
Total | 15,236 | 18,109 | (2,873 | ) | (15.9 | )% | (b) | $406 | $529 | $(123) | (23.3 | )% | |||
(a) | Other steam operating revenues generally reflect changes in regulatory assets and liabilities in accordance with the company’s rate plan. |
(b) | After adjusting for variations, principally weather and billing days, steam sales and deliveries decreased 0.5 percent in nine months ended September 30, 2016 compared with the 2015 period. |
Operating revenues decreased $123 million in the nine months ended September 30, 2016 compared with the 2015 period due primarily to lower fuel expenses ($68 million), the weather impact on revenues ($59 million) and lower purchased power costs ($3 million), offset in part by higher revenues from the steam rate plan ($12 million).
Purchased power expenses decreased $3 million in the nine months ended September 30, 2016 compared with the 2015 period due to lower unit costs ($2 million) and purchased volumes ($1 million).
Fuel expenses decreased $68 million in the nine months ended September 30, 2016 compared with the 2015 period due to lower unit costs ($59 million) and sendout volumes from the company’s steam generating facilities ($9 million).
Other operations and maintenance expenses decreased $1 million in the nine months ended September 30, 2016 compared with the 2015 period due primarily to a decrease in the surcharges for assessments and fees that are collected in revenues from customers ($6 million), offset in part by higher costs for municipal infrastructure support ($6 million).
Depreciation and amortization increased $4 million in the nine months ended September 30, 2016 compared with the 2015 period due primarily to higher steam utility plant balances.
Taxes, other than income taxes increased $6 million in the nine months ended September 30, 2016 compared with the 2015 period principally due to higher property taxes ($9 million), offset in part by lower state and local taxes ($3 million).
62
Net Interest Expense
Net interest expense increased $16 million in the nine months ended September 30, 2016 compared with the 2015 period due primarily higher long-term debt balances in the 2016 period.
Income Tax Expense
Income taxes decreased $24 million in the nine months ended September 30, 2016 compared with the 2015 period due primarily to lower income before income tax expense ($40 million), lower state income taxes ($10 million), a research and development tax credit ($14 million) and higher settlement payments related to injuries and damages ($4 million), offset in part by plant-related flow through items ($41 million) and an increase in uncertain tax positions ($3 million).
O&R
For the Nine Months Ended September 30, 2016 | For the Nine Months Ended September 30, 2015 | ||||||||||
(Millions of Dollars) | Electric | Gas | 2016 Total | Electric | Gas | 2015 Total | 2016-2015 Variation | ||||
Operating revenues | $497 | $133 | $630 | $523 | $117 | $640 | $(10) | ||||
Purchased power | 154 | — | 154 | 169 | — | 169 | (15) | ||||
Gas purchased for resale | — | 32 | 32 | — | 40 | 40 | (8) | ||||
Other operations and maintenance | 180 | 40 | 220 | 198 | 51 | 249 | (29) | ||||
Depreciation and amortization | 37 | 13 | 50 | 38 | 13 | 51 | (1) | ||||
Taxes, other than income taxes | 40 | 20 | 60 | 33 | 13 | 46 | 14 | ||||
Operating income | $86 | $28 | $114 | $85 | $0 | $85 | $29 | ||||
Electric
O&R’s results of electric operations for the nine months ended September 30, 2016 compared with the 2015 period is as follows:
For the Nine Months Ended | |||
(Millions of Dollars) | September 30, 2016 | September 30, 2015 | Variation |
Operating revenues | $497 | $523 | $(26) |
Purchased power | 154 | 169 | (15) |
Other operations and maintenance | 180 | 198 | (18) |
Depreciation and amortization | 37 | 38 | (1) |
Taxes, other than income taxes | 40 | 33 | 7 |
Electric operating income | $86 | $85 | $1 |
63
O&R’s electric sales and deliveries for the nine months ended September 30, 2016 compared with the 2015 period were:
Millions of kWh Delivered | Revenues in Millions (a) | |||||||||||||
For the Nine Months Ended | For the Nine Months Ended | |||||||||||||
Description | September 30, 2016 | September 30, 2015 | Variation | Percent Variation | September 30, 2016 | September 30, 2015 | Variation | Percent Variation | ||||||
Residential/Religious (b) | 1,307 | 1,278 | 29 | 2.3 | % | $240 | $246 | $(6) | (2.4 | )% | ||||
Commercial/Industrial | 607 | 611 | (4 | ) | (0.7 | ) | 89 | 98 | (9) | (9.2 | ) | |||
Retail choice customers | 2,434 | 2,504 | (70 | ) | (2.8 | ) | 166 | 168 | (2) | (1.2 | ) | |||
Public authorities | 76 | 78 | (2 | ) | (2.6 | ) | 6 | 8 | (2) | (25.0 | ) | |||
Other operating revenues (c) | — | — | — | — | (4) | 3 | (7) | Large | ||||||
Total | 4,424 | 4,471 | (47 | ) | (1.1 | )% | (d) | $497 | $523 | $(26) | (5.0 | )% | ||
(a) | O&R’s New York electric delivery revenues are subject to a revenue decoupling mechanism, as a result of which delivery revenues are generally not affected by changes in delivery volumes from levels assumed when rates were approved. O&R’s electric sales in New Jersey and Pennsylvania are not subject to a decoupling mechanism, and as a result, changes in such volumes do impact revenues. |
(b) | “Residential/Religious” generally includes single-family dwellings, individual apartments in multi-family dwellings, religious organizations and certain other not-for-profit organizations. |
(c) | Other electric operating revenues generally reflect changes in regulatory assets and liabilities in accordance with the company’s electric rate plans. |
(d) | After adjusting for weather and other variations, electric delivery volumes in O&R’s service area decreased 1.1 percent in the nine months ended September 30, 2016 compared with the 2015 period. |
Operating revenues decreased $26 million in the nine months ended September 30, 2016 compared with the 2015 period due primarily to lower purchased power costs ($15 million) and revenues from the electric rate plans ($2 million).
Purchased power expenses decreased $15 million in the nine months ended September 30, 2016 compared with the 2015 period due to lower unit costs ($16 million), offset by lower purchased volumes ($1 million).
Other operations and maintenance expenses decreased $18 million in the nine months ended September 30, 2016 compared with the 2015 period due primarily to regulatory accounting effects of pension costs ($9 million), lower surcharges for assessments and fees that are collected in revenues from customers ($7 million) and operating costs ($3 million).
Depreciation and amortization decreased $1 million in the nine months ended September 30, 2016 compared with the 2015 period due primarily to lower average depreciation rates.
Taxes, other than income taxes increased $7 million in the nine months ended September 30, 2016 compared with the 2015 period principally due to higher property taxes.
Gas
O&R’s results of gas operations for the nine months ended September 30, 2016 compared with the 2015 period is as follows:
For the Nine Months Ended | ||||
(Millions of Dollars) | September 30, 2016 | September 30, 2015 | Variation | |
Operating revenues | $133 | $117 | $16 | |
Gas purchased for resale | 32 | 40 | (8) | |
Other operations and maintenance | 40 | 51 | (11) | |
Depreciation and amortization | 13 | 13 | — | |
Taxes, other than income taxes | 20 | 13 | 7 | |
Gas operating income | $28 | $0 | $28 | |
64
O&R’s gas sales and deliveries, excluding off-system sales, for the nine months ended September 30, 2016 compared with the 2015 period were:
Thousands of Dt Delivered | Revenues in Millions (a) | |||||||||||||||||
For the Nine Months Ended | For the Nine Months Ended | |||||||||||||||||
Description | September 30, 2016 | September 30, 2015 | Variation | Percent Variation | September 30, 2016 | September 30, 2015 | Variation | Percent Variation | ||||||||||
Residential | 5,266 | 5,789 | (523 | ) | (9.0 | )% | $55 | $55 | $— | — | % | |||||||
General | 1,224 | 1,294 | (70 | ) | (5.4 | ) | 10 | 10 | — | — | ||||||||
Firm transportation | 7,188 | 9,012 | (1,824 | ) | (20.2 | ) | 49 | 51 | (2) | (3.9 | ) | |||||||
Total firm sales and transportation | 13,678 | 16,095 | (2,417 | ) | (15.0 | ) | (b) | 114 | 116 | (2) | (1.7 | ) | ||||||
Interruptible sales | 3,020 | 3,237 | (217 | ) | (6.7 | ) | 2 | 2 | — | — | ||||||||
Generation plants | 15 | 25 | (10 | ) | (40.0 | ) | — | — | — | — | ||||||||
Other | 583 | 674 | (91 | ) | (13.5 | ) | — | — | — | — | ||||||||
Other gas revenues | — | — | — | — | 17 | (1) | 18 | Large | ||||||||||
Total | 17,296 | 20,031 | (2,735 | ) | (13.7 | )% | $133 | $117 | $16 | 13.7 | % | |||||||
(a) | Revenues from New York gas sales are subject to a weather normalization clause and a revenue decoupling mechanism as a result of which delivery revenues are generally not affected by changes in delivery volumes from levels assumed when rates were approved. |
(b) | After adjusting for weather and other variations, total firm sales and transportation volumes increased 2.3 percent in the nine months ended September 30, 2016 compared with 2015 period. |
Operating revenues increased $16 million in the nine months ended September 30, 2016 compared with the 2015 period due primarily to the charge-off of certain regulatory assets in 2015 ($14 million) and higher revenues from the New York gas rate plan ($13 million), offset in part by a decrease in gas purchased for resale ($8 million).
Gas purchased for resale decreased $8 million in the nine months ended September 30, 2016 compared with the 2015 period due to lower purchased volumes ($11 million), offset by higher unit costs ($3 million).
Other operations and maintenance expenses decreased $11 million in the nine months ended September 30, 2016 compared with the 2015 period due primarily to regulatory accounting effects of pension costs ($10 million) and lower surcharges for assessments and fees that are collected in revenues from customers ($2 million).
Taxes, other than income taxes increased $7 million in the nine months ended September 30, 2016 compared with the 2015 period principally due to higher property taxes.
Other Income (Deductions)
Other income (deductions) increased $5 million in the nine months ended September 30, 2016 compared with the 2015 period due primarily to the impairment of certain assets held for sale in 2015 (see Note P to the Third Quarter Financial Statements).
Income Tax Expense
Income taxes increased $13 million in the nine months ended September 30, 2016 compared with the 2015 period due primarily to higher income before income tax expense ($13 million) and plant-related flow through items ($3 million), offset in part by lower state income taxes ($1 million) and lower reimbursement in insurance claims ($1 million).
65
Competitive Energy Businesses
The competitive energy businesses’ results of operations for the nine months ended September 30, 2016 compared with the 2015 period is as follows:
For the Nine Months Ended | ||||
(Millions of Dollars) | September 30, 2016 | September 30, 2015 | Variation | |
Operating revenues | $998 | $1,087 | $(89) | |
Purchased power | 676 | 812 | (136) | |
Gas purchased for resale | 72 | 94 | (22) | |
Other operations and maintenance | 124 | 98 | 26 | |
Depreciation and amortization | 30 | 16 | 14 | |
Taxes, other than income taxes | 16 | 14 | 2 | |
Gain on sale of retail electric supply business | (104) | — | (104) | |
Operating income | $184 | $53 | $131 | |
Operating revenues decreased $89 million in the nine months ended September 30, 2016 compared with the 2015 period, due primarily to lower electric retail revenues due in part to the sale of the retail electric supply business (see Note P to the Third Quarter Financial Statements). Electric retail revenues decreased $135 million due to lower unit prices ($98 million) and lower sales volume ($37 million). Wholesale revenues decreased $25 million due to lower sales volumes. Renewable revenues increased $40 million primarily due to an increase in renewable electric production projects in operation. Energy services revenues increased $31 million.
Purchased power expenses decreased $136 million in the nine months ended September 30, 2016 compared with the 2015 period due primarily to lower unit prices ($85 million), lower volumes ($46 million) and changes in mark-to-market gains ($5 million).
Gas purchased for resale decreased $22 million in the nine months ended September 30, 2016 compared with the 2015 period due to lower sales volumes.
Other operations and maintenance expenses increased $26 million in the nine months ended September 30, 2016 compared with the 2015 period due primarily to an increase in energy services costs.
Depreciation and amortization increased $14 million in the nine months ended September 30, 2016 compared with the 2015 period due an increase in solar electric production projects in operation during 2016.
Gain on sale of retail electric supply business was $104 million in the nine months ended September 30, 2016 reflecting the sale of the competitive energy businesses' retail electric supply business (see Note P to the Third Quarter Financial Statements).
Other Income (Deductions)
Other income (deductions) increased $3 million in the nine months ended September 30, 2016 compared with the 2015 period due primarily to the earnings from equity investments.
Net Interest Expense
Net interest expense increased $18 million in the nine months ended September 30, 2016 compared with the 2015 period due primarily to increased debt on solar electric production projects.
Income Tax Expense
Income taxes increased $51 million in the nine months ended September 30, 2016 compared with the 2015 period due primarily to higher income before income tax expense ($46 million) and an adjustment to deferred state income taxes as a result of the sale of the retail electric supply business that increased the competitive energy businesses' state apportionment factors on its cumulative temporary differences ($13 million), offset in part by higher renewable energy tax credits ($7 million).
66
Con Edison Transmission
Other Income (Deductions)
Other income (deductions) increased $23 million in the nine months ended September 30, 2016 compared with the 2015 period due primarily to earnings from the equity investments in 2016 (see Note P).
Other
For Con Edison, “Other” includes parent company and consolidation adjustments.
Liquidity and Capital Resources
The Companies’ liquidity reflects cash flows from operating, investing and financing activities, as shown on their respective consolidated statement of cash flows and as discussed below.
Changes in the Companies’ cash and temporary cash investments resulting from operating, investing and financing activities for the nine months ended September 30, 2016 and 2015 are summarized as follows:
For the Nine Months Ended September 30, | |||||||||
Con Edison | CECONY | ||||||||
(Millions of Dollars) | 2016 | 2015 | Variation | 2016 | 2015 | Variation | |||
Operating activities | $2,336 | $2,199 | $137 | $2,017 | $1,802 | $215 | |||
Investing activities | (3,717) | (2,687) | (1,030) | (1,943) | (1,900) | (43) | |||
Financing activities | 583 | (118) | 701 | (891) | (496) | (395) | |||
Net change for the period | (798) | (606) | (192) | (817) | (594) | (223) | |||
Balance at beginning of period | 944 | 699 | 245 | 843 | 645 | 198 | |||
Balance at end of period | 146 | 93 | 53 | 26 | 51 | (25) | |||
Less: Change in cash balances held for sale | (4) | 2 | (6) | — | — | — | |||
Balance at end of period excluding held for sale | $150 | $91 | $59 | $26 | $51 | $(25) | |||
Cash Flows From Operating Activities
The Utilities’ cash flows from operating activities reflect principally their energy sales and deliveries and cost of operations. The volume of energy sales and deliveries is affected primarily by factors external to the Utilities, such as growth of customer demand, weather, market prices for energy, economic conditions and measures that promote energy efficiency. Under the revenue decoupling mechanisms in the Utilities’ New York electric and gas rate plans, changes in delivery volumes from levels assumed when rates were approved may affect the timing of cash flows but generally not net income. The prices at which the Utilities provide energy to their customers are determined in accordance with their rate plans. In general, changes in the Utilities’ cost of purchased power, fuel and gas may affect the timing of cash flows but not net income because the costs are recovered in accordance with rate plans.
Net income is the result of cash and non-cash (or accrual) transactions. Only cash transactions affect the Companies’ cash flows from operating activities. Principal non-cash charges or credits include depreciation, deferred income tax expense and amortizations of certain regulatory assets and liabilities. Non-cash charges or credits may also be accrued under the revenue decoupling and cost reconciliation mechanisms in the Utilities’ New York electric and gas rate plans.
Net cash flows from operating activities for the nine months ended September 30, 2016 for Con Edison and CECONY were $137 million and $215 million higher, respectively, than in the 2015 period. The change in net cash flows for Con Edison and CECONY reflects primarily the income taxes paid, net of refunds received in the 2016 period as compared with the 2015 period ($137 million and $273 million, respectively). The amount and timing of income tax payments and refunds reflect, among other things, the extension of bonus depreciation tax provisions.
The change in net cash flows also reflects the timing of payments for and recovery of energy costs. This timing is reflected within changes to accounts receivable – customers, recoverable energy costs and accounts payable balances.
Cash Flows Used in Investing Activities
Net cash flows used in investing activities for Con Edison and CECONY were $1,030 million and $43 million higher, respectively, for the nine months ended September 30, 2016 compared with the 2015 period. The change for Con Edison reflects primarily increased investments in/acquisitions of renewable electric production and electric and gas
67
transmission projects ($995 million), increased utility construction expenditures in 2016 ($219 million) and increased non-utility construction expenditures related to development of renewable electric production projects ($70 million), offset in part by the proceeds from the sale of assets ($250 million). In addition, the change for CECONY reflects primarily increased utility construction expenditures in 2016 ($200 million), offset in part by the proceeds from the transfer of assets to NY Transco ($122 million).
Cash Flows From/(Used In) Financing Activities
Net cash flows from financing activities for Con Edison and CECONY were $701 million higher and $395 million lower, respectively, in the nine months ended September 30, 2016 compared with the 2015 period.
In June 2016, Con Edison borrowed $400 million pursuant to a credit agreement with a syndicate of banks. The borrowing matures in 2018 and bears interest at a LIBOR plus margin of 1.00 percent.
In May 2016, Con Edison issued approximately 10 million common shares resulting in net proceeds, after issuance expenses, of $702 million and $500 million aggregate principal amount of 2.00 percent debentures, due 2021, the net proceeds from the sale of which were used in connection with the acquisition by a CET Gas subsidiary of a 50 percent equity interest in a gas pipeline and storage joint venture (see "Con Edison Transmission", below) and for general corporate purposes.
In June 2016, CECONY issued $550 million of 3.85 percent 30-year debentures, the net proceeds from the sale of which were used to repay short-term borrowings and for other general corporate purposes. In September 2016, CECONY redeemed at maturity $400 million of 5.50 percent 10-year debentures.
In June 2016, a Con Edison Solutions subsidiary borrowed $2 million pursuant to a loan agreement with a New Jersey utility. The borrowing matures in 2026, bears interest of 11.18 percent and may be repaid in cash or project Solar Renewable Energy Certificates. In May 2016, a Con Edison Development subsidiary issued $95 million aggregate principal amount of 4.07 percent senior notes, due 2036, secured by the company's California Holdings 3 solar project. In February 2016, a Con Edison Development subsidiary issued $218 million aggregate principal amount of 4.21 percent senior notes, due 2041, secured by the company's Texas Solar 7 solar project. In June 2015, a Con Edison Development subsidiary issued $118 million aggregate principal amount of 3.94 percent senior notes, due 2036, secured by four of the company's solar projects.
In June 2015, O&R issued $120 million of 4.95 percent 30-year debentures, the net proceeds from the sale of which were used to repay short-term borrowings and for other general corporate purposes. In April 2015, O&R redeemed at maturity $40 million of 5.30 percent 10-year debentures. In August 2015, O&R redeemed at maturity $55 million of 2.50 percent 5-year debentures and $44 million of variable rate tax-exempt 20-year debt.
Cash flows used in financing activities of the Companies also reflect commercial paper issuance. The commercial paper amounts outstanding at September 30, 2016 and 2015 and the average daily balances for the nine months ended September 30, 2016 and 2015 for Con Edison and CECONY were as follows:
2016 | 2015 | |||
(Millions of Dollars, except Weighted Average Yield) | Outstanding at September 30, | Daily average | Outstanding at September 30, | Daily average |
Con Edison | $601 | $813 | $1,160 | $765 |
CECONY | $480 | $385 | $649 | $367 |
Weighted average yield | 0.7% | 0.6% | 0.3% | 0.4% |
Capital Requirements and Resources
Con Edison has increased its estimates for capital requirements for 2016 from $4,892 million to $6,117 million. The increase reflects the $975 million purchase of a 50 percent equity interest in a gas pipeline and storage joint venture. See “Con Edison Transmission,” below. The increase also reflects increased estimates of capital expenditures by its competitive energy businesses from $985 million to $1,235 million to reflect additional renewable energy project development. See "Con Edison Development," below. The company plans to meet its 2016 capital requirements, including for maturing securities, through internally-generated funds and the issuance of securities. See "Cash Flows From/(Used In) Financing Activities," above. In September 2016, O&R agreed to issue
68
and sell for delivery in December 2016 $75 million aggregate principal amount of 3.88 percent debentures, due 2046. CECONY plans to issue up to $750 million of long-term debt later in 2016.
Con Edison has also increased its estimates of capital expenditures by its competitive energy businesses from $360 million to $400 million for both 2017 and 2018 to reflect additional renewable energy project development.
For each of the Companies, the ratio of earnings to fixed charges (Securities and Exchange Commission basis) for the nine months ended September 30, 2016 and 2015 and the twelve months ended December 31, 2015 was:
Ratio of Earnings to Fixed Charges | |||
For the Nine Months Ended September 30, 2016 | For the Nine Months Ended September 30, 2015 | For the Twelve Months Ended December 31, 2015 | |
Con Edison | 4.0 | 3.9 | 3.5 |
CECONY | 3.8 | 4.1 | 3.6 |
For each of the Companies, the common equity ratio at September 30, 2016 and December 31, 2015 was:
Common Equity Ratio (Percent of total capitalization) | ||
September 30, 2016 | December 31, 2015 | |
Con Edison | 50.9 | 52.1 |
CECONY | 51.0 | 51.4 |
Contractual Obligations
Con Edison’s obligations to make payments pursuant to contracts increased to $38,611 million at September 30, 2016 from $34,884 million at December 31, 2015 due primarily to increases in the company’s long-term debt ($1,358 million, including $150 million for CECONY, see "Cash Flows From/(Used In) Financing Activities," above) and interest on long-term debt ($891 million, including $704 million for CECONY). The change also reflects increases in obligations under natural gas supply, transportation and storage contracts ($1,862 million, including $1,577 million for CECONY). In addition, in October 2016, CECONY's obligations increased by $878 million reflecting the estimated aggregate annual amounts payable under the twenty-year renewal of the New York City revocable consent for the use of streets and public places for installation and operation of transformers and associated vaults and equipment.
Other Changes in Assets and Liabilities
The following table shows changes in certain assets and liabilities at September 30, 2016, compared with December 31, 2015.
Con Edison | CECONY | ||
(Millions of Dollars) | 2016 vs. 2015 Variation | 2016 vs. 2015 Variation | |
Assets | |||
Investments | $1,047 | $32 | |
Prepayments | 403 | 351 | |
Regulatory asset — Unrecognized pension and other postretirement costs | (507) | (477) | |
Income taxes receivable | (100) | — | |
Liabilities | |||
Deferred income taxes and investment tax credits | $618 | $717 | |
Pension and retiree benefits | (714) | (670) | |
Investments
The increase in investments for Con Edison reflects the purchase of a 50 percent equity interest in a natural gas pipeline and storage joint venture. See “Con Edison Transmission,” below and Note P to the Third Quarter Financial Statements.
69
Prepayments
The increase in prepayments for Con Edison and CECONY reflects primarily the portion allocable to the 2016 fourth quarter of CECONY's July 2016 payment of its New York City semi-annual property taxes.
Regulatory Asset for Unrecognized Pension and Other Postretirement Costs and Liability for Pension and Retiree Benefits
The decrease in the regulatory asset for unrecognized pension and other postretirement costs and the liability for pension and retiree benefits reflects the final actuarial valuation of the pension and other retiree benefit plans as measured at December 31, 2015, in accordance with the accounting rules for retirement benefits. The change in the regulatory asset also reflects the year’s amortization of accounting costs. The change in the liability for pension and retiree benefits reflects in part contributions to the plans made by the Utilities in 2016. See Notes B, E and F to the Third Quarter Financial Statements.
Income Taxes Receivable
The decrease in income taxes receivable for Con Edison reflects primarily the refund received in February 2016 from the Internal Revenue Service as a result of the extension of bonus depreciation in December 2015.
Deferred Income Taxes and Investment Tax Credits
The increase in the liability for deferred income taxes and investment tax credits for Con Edison and CECONY reflects primarily bonus depreciation in 2016, partially offset by the increase in deferred income tax assets associated with the federal tax attribute carryforwards related to the net operating loss and general business tax credits.
Off-Balance Sheet Arrangements
None of the Companies’ interests in variable interest entities (VIEs) meet the Securities and Exchange Commission definition of off-balance sheet arrangements. For information regarding the Companies’ VIEs, see Note M to the Third Quarter Financial Statements.
Regulatory Matters
In March 2016, the New York State Public Service Commission (NYSPSC) issued an order in which it approved CECONY’s advanced metering infrastructure (AMI) plan for the company’s electric and gas delivery businesses, subject to a cap on capital expenditures of $1,285 million. AMI components include smart meters, a communication network, information technology systems and business applications. The plan provides for full deployment of AMI to the company’s customers to be implemented over a six-year period. The NYSPSC directed CECONY to submit a customer engagement plan, an update to the company’s benefit cost analysis and metrics that the NYSPSC can use to monitor the success of the project.
In May 2016, the NYSPSC issued an order in its Reforming the Energy Vision (REV) proceeding adopting a ratemaking and utility revenue framework. The order indicated that utilities will have four ways of achieving earnings: traditional cost-of-service earnings; earnings tied to achievement of alternatives that reduce utility capital spending and provide definitive consumer benefit; earnings from market-facing platform activities; and transitional outcome-based performance measures. The order also indicated, among other things, that existing measures for negative revenue adjustments for utility failure to meet basic service standards should generally be retained and net utility plant reconciliations should be modified to encourage cost-effective distributed energy resources (DER) as an alternative to utility capital investment. The order directs each utility to file a system efficiency proposal; an interconnection survey process and proposed earnings adjustment mechanism; a progress report on aggregated data reporting automation; an aggregated data privacy policy statement; revisions to standby service tariffs and cost allocation matrix; one or more smart home rate demonstration proposals; and revisions to voluntary time of use rates and promotion and education tools.
In June 2016, CECONY and O&R each filed initial distributed system implementation plans with the NYSPSC, pursuant to which the companies provide additional system and planning information for third-party developers to facilitate the integration of DER in the distributed system platform.
In August 2016, the NYSPSC issued an order adopting the New York State Energy Plan’s goal of 50 percent of the State’s electricity to be generated by renewable sources by 2030 as part of a strategy to reduce statewide greenhouse gas emissions 40 percent by 2030. The NYSPSC also adopted a Clean Energy Standard (CES) that
70
includes renewable energy credit (REC) and zero-emissions credit (ZEC) requirements. Beginning in 2017, load serving entities (LSEs), including CECONY and O&R for their full-service customers, will be required to obtain RECs and ZECs in amounts determined by the NYSPSC. LSEs may satisfy their REC obligation by either purchasing RECs acquired through central procurement by the New York State Energy Research and Development Authority (NYSERDA), by self-supply through direct purchase of tradable RECs, or by making alternative compliance payments. LSEs will purchase ZECs from NYSERDA at prices determined by the NYSPSC. The order establishes an annual NYSPSC staff review and triennial NYSPSC review of the CES.
For certain information about the Utilities' rate plans and other regulatory matters affecting the Companies, see Note B to the Third Quarter Financial Statements.
Con Edison Development
The following table provides information about the renewable electric production projects Con Edison Development owned at September 30, 2016:
Project Name | Production Technology | Generating Capacity (a) (MW AC) | Power Purchase Agreement Term (in Years) | Actual/Expected In-Service Date | Location |
Wholly owned projects | |||||
Pilesgrove (c) | Solar | 18 | n/a (b) | 2011 | New Jersey |
Flemington Solar | Solar | 8 | n/a (b) | 2011 | New Jersey |
Frenchtown I, II and III | Solar | 14 | n/a (b) | 2011-13 | New Jersey |
PA Solar | Solar | 10 | n/a (b) | 2012 | Pennsylvania |
California Solar 2 | Solar | 80 | 20 | 2014-16 | California |
Oak Tree Wind | Wind | 20 | 20 | 2014 | South Dakota |
Texas Solar 3 | Solar | 6 | 25 | 2015 | Texas |
Texas Solar 5 | Solar | 95 | 25 | 2015 | Texas |
Campbell County Wind | Wind | 95 | 30 | 2015 | South Dakota |
Texas Solar 7 (c) | Solar | 106 | 25 | 2016 | Texas |
Projects of less than 5 MW | Solar | 20 | Various (b) | Various | Various |
Jointly owned projects (d) | |||||
California Solar | Solar | 55 | 25 | 2012-13 | California |
Mesquite Solar 1 | Solar | 83 | 20 | 2013 | Arizona |
Copper Mountain Solar 2 | Solar | 75 | 25 | 2013-15 | Nevada |
Copper Mountain Solar 3 | Solar | 128 | 20 | 2014-15 | Nevada |
Broken Bow II | Wind | 38 | 25 | 2014 | Nebraska |
Texas Solar 4 | Solar | 32 | 25 | 2014 | Texas |
Total MW (AC) in Operation | 883 | ||||
California Solar 3 | Solar | 110 | 20 | 2016 | California |
Upton County | Solar | 150 | 25 | 2017 | Texas |
Panoche Valley (d) | Solar | 120 | 20 | 2019 | California |
Total MW (AC) in Construction | 380 | ||||
Total MW (AC), All Projects | 1,263 (e) | ||||
(a) | Represents Con Edison Development’s ownership interest in the project. |
(b) | New Jersey, Pennsylvania and Massachusetts assets have 3-4 year Solar Renewable Energy Credit hedges in place. |
(c) | See Note P to the Third Quarter Financial Statements. |
(d) | See Note M to the Third Quarter Financial Statements. |
(e) | Additionally, in October 2015, Con Edison Development purchased Lost Hills, which is developing but has not started constructing, a 20 MW (AC) solar electric production project in California. |
71
Con Edison Transmission
CET Electric
In March 2016, the Federal Energy Regulatory Commission approved a November 2015 settlement agreement applicable to three transmission projects that the NYSPSC approved in October 2013 in its proceeding to address potential needs that could arise should the Indian Point Energy Center (which is owned by Entergy Corporation subsidiaries) no longer be able to operate. CECONY developed and, in May 2016, transferred two of the projects to New York Transco LLC. See Note P to the Third Quarter Financial Statements. The settlement agreement, among other things, provides for a 10 percent return on common equity (and/or 9.5 percent for capital costs in excess of $228 million incurred for initial commercial operation), a maximum common equity ratio of 53 percent and allocation of 63 percent of the costs of the projects to load serving entities in the CECONY and O&R service areas.
CET Gas
In April 2016, a CET Gas subsidiary agreed with a subsidiary of Crestwood Equity Partners LP to form a joint venture to own, operate and further develop a gas pipeline and storage business located in northern Pennsylvania and southern New York. In June 2016, the transaction was substantially completed. See Note P to the Third Quarter Financial Statements.
Financial and Commodity Market Risks
The Companies are subject to various risks and uncertainties associated with financial and commodity markets. The most significant market risks include interest rate risk, commodity price risk, credit risk and investment risk.
Interest Rate Risk
The Companies’ interest rate risk relates primarily to variable rate debt and to new debt financing needed to fund capital requirements, including the construction expenditures of the Utilities and maturing debt securities. Con Edison and its businesses manage interest rate risk through the issuance of mostly fixed-rate debt with varying maturities and through opportunistic refinancing of debt. Con Edison and CECONY estimate that at September 30, 2016, a 10 percent increase in interest rates applicable to its variable rate debt would result in an increase in annual interest expense of $2 million. Under CECONY’s current gas, steam and electric rate plans, variations in actual variable rate tax-exempt debt interest expense are reconciled to levels reflected in rates.
Commodity Price Risk
Con Edison’s commodity price risk relates primarily to the purchase and sale of electricity, gas and related derivative instruments. The Utilities and Con Edison’s competitive energy businesses apply risk management strategies to mitigate their related exposures. See Note K to the Third Quarter Financial Statements.
Con Edison estimates that, as of September 30, 2016, a 10 percent decline in market prices would result in a decline in fair value of $61 million for the derivative instruments used by the Utilities to hedge purchases of electricity and gas, of which $54 million is for CECONY and $7 million is for O&R. Con Edison expects that any such change in fair value would be largely offset by directionally opposite changes in the cost of the electricity and gas purchased. In accordance with provisions approved by state regulators, the Utilities generally recover from customers the costs they incur for energy purchased for their customers, including gains and losses on certain derivative instruments used to hedge energy purchased and related costs.
Con Edison’s competitive energy businesses use a value-at-risk (VaR) model to assess the market price risk of their portfolio of electricity and gas commodity fixed-price purchase and sales commitments, physical forward contracts, generating assets and commodity derivative instruments. VaR represents the potential change in fair value of the portfolio due to changes in market prices, for a specified time period and confidence level. These businesses estimate VaR across their portfolio using a delta-normal variance/covariance model with a 95 percent confidence level and compare the measured VaR results against performance due to actual prices and stress test the portfolio each quarter using an assumed 30 percent price change from forecast. Since the VaR calculation involves complex methodologies and estimates and assumptions that are based on past experience, it is not necessarily indicative of future results. VaR for the portfolio, assuming a one-day holding period, for the nine months ended September 30, 2016 and the year ended December 31, 2015, respectively, was as follows:
72
95% Confidence Level, One-Day Holding Period | September 30, 2016 | December 31, 2015 | |
(Millions of Dollars) | |||
Average for the period | $2 | $1 | |
High | 4 | 2 | |
Low | 1 | — | |
Credit Risk
The Companies are exposed to credit risk related to transactions entered into primarily for the various energy supply and hedging activities by the Utilities and the competitive energy businesses. See Note K to the Third Quarter Financial Statements.
Investment Risk
The Companies’ investment risk relates to the investment of plan assets for their pension and other postretirement benefit plans. The Companies’ current investment policy for pension plan assets includes investment targets of 55 to 65 percent equities and 35 to 45 percent fixed income and other securities. At September 30, 2016, the pension plan investments consisted of 58 percent equity and 42 percent fixed income and other securities.
For the Utilities’ pension and other postretirement benefit plans, regulatory accounting treatment is generally applied in accordance with the accounting rules for regulated operations. In accordance with the Statement of Policy issued by the NYSPSC and its current electric, gas and steam rate plans, CECONY defers for payment to or recovery from customers the difference between the pension and other postretirement benefit expenses and the amounts for such expenses reflected in rates. Generally, O&R also defers such difference pursuant to its rate plans.
Material Contingencies
For information concerning potential liabilities arising from the Companies’ material contingencies, see Notes B, G and H to the Third Quarter Financial Statements.
73
Item 3: Quantitative and Qualitative Disclosures About Market Risk
For information about the Companies’ primary market risks associated with activities in derivative financial instruments, other financial instruments and derivative commodity instruments, see “Financial and Commodity Market Risks,” in Part I, Item 2 of this report, which information is incorporated herein by reference.
Item 4: Controls and Procedures
The Companies maintain disclosure controls and procedures designed to provide reasonable assurance that the information required to be disclosed in the reports that they submit to the Securities and Exchange Commission (SEC) is recorded, processed, summarized and reported within the time periods specified in the rules and forms of the SEC. Disclosure controls and procedures include, without limitation, controls and procedures designed to ensure that information required to be disclosed by an issuer in the reports that it files or submits under the Securities Exchange Act of 1934, as amended, is accumulated and communicated to the issuer’s management, including its principal executive and principal financial officers, or persons performing similar functions, as appropriate to allow timely decisions regarding required disclosure. For each of the Companies, its management, with the participation of its principal executive officer and principal financial officer, has evaluated its disclosure controls and procedures as of the end of the period covered by this report and, based on such evaluation, has concluded that the controls and procedures are effective to provide such reasonable assurance. Reasonable assurance is not absolute assurance, however, and there can be no assurance that any design of controls or procedures would be effective under all potential future conditions, regardless of how remote.
There was no change in the Companies’ internal control over financial reporting that occurred during the Companies’ most recent fiscal quarter that has materially affected, or is reasonably likely to materially affect, the Companies’ internal control over financial reporting.
74
Part II Other Information
Item 1: Legal Proceedings
For information about certain legal proceedings affecting the Companies, see Notes B, G and H to the financial statements in Part I, Item 1 of this report, which information is incorporated herein by reference.
Item 1A: Risk Factors
There were no material changes in the Companies’ risk factors compared to those disclosed in Item 1A of the Form 10-K.
Item 6: Exhibits
Con Edison
Exhibit 12.1 | Statement of computation of Con Edison’s ratio of earnings to fixed charges for the nine-month periods ended September 30, 2016 and 2015, and the 12-month period ended December 31, 2015. |
Exhibit 31.1.1 | Rule 13a-14(a)/15d-14(a) Certifications – Chief Executive Officer. |
Exhibit 31.1.2 | Rule 13a-14(a)/15d-14(a) Certifications – Chief Financial Officer. |
Exhibit 32.1.1 | Section 1350 Certifications – Chief Executive Officer. |
Exhibit 32.1.2 | Section 1350 Certifications – Chief Financial Officer. |
Exhibit 101.INS | XBRL Instance Document. |
Exhibit 101.SCH | XBRL Taxonomy Extension Schema. |
Exhibit 101.CAL | XBRL Taxonomy Extension Calculation Linkbase. |
Exhibit 101.DEF | XBRL Taxonomy Extension Definition Linkbase. |
Exhibit 101.LAB | XBRL Taxonomy Extension Label Linkbase. |
Exhibit 101.PRE | XBRL Taxonomy Extension Presentation Linkbase. |
CECONY
Exhibit 12.2 | Statement of computation of CECONY’s ratio of earnings to fixed charges for the nine-month periods ended September 30, 2016 and 2015, and the 12-month period ended December 31, 2015. |
Exhibit 31.2.1 | Rule 13a-14(a)/15d-14(a) Certifications – Chief Executive Officer. |
Exhibit 31.2.2 | Rule 13a-14(a)/15d-14(a) Certifications – Chief Financial Officer. |
Exhibit 32.2.1 | Section 1350 Certifications – Chief Executive Officer. |
Exhibit 32.2.2 | Section 1350 Certifications – Chief Financial Officer. |
Exhibit 101.INS | XBRL Instance Document. |
Exhibit 101.SCH | XBRL Taxonomy Extension Schema. |
Exhibit 101.CAL | XBRL Taxonomy Extension Calculation Linkbase. |
Exhibit 101.DEF | XBRL Taxonomy Extension Definition Linkbase. |
Exhibit 101.LAB | XBRL Taxonomy Extension Label Linkbase. |
Exhibit 101.PRE | XBRL Taxonomy Extension Presentation Linkbase. |
Pursuant to Item 601(b)(4)(iii)(A) of Regulation S-K, instruments defining the rights of holders of long-term debt of Con Edison’s subsidiaries other than CECONY, the total amount of which does not exceed ten percent of the total assets of Con Edison and its subsidiaries on a consolidated basis, are not filed as exhibits to Con Edison’s Form 10-K or Form 10-Q. Con Edison agrees to furnish to the SEC upon request a copy of any such instrument.
75
Signatures
Pursuant to the requirements of the Securities Exchange Act of 1934, each Registrant has duly caused this report to be signed on its behalf by the undersigned thereunto duly authorized.
Consolidated Edison, Inc. | ||
Consolidated Edison Company of New York, Inc. | ||
Date: November 3, 2016 | By | /s/ Robert Hoglund |
Robert Hoglund Senior Vice President, Chief Financial Officer and Duly Authorized Officer | ||
76