http://fasb.org/us-gaap/2021-01-31#OtherAssetsNoncurrenthttp://fasb.org/us-gaap/2021-01-31#OtherLiabilitiesNoncurrenthttp://fasb.org/us-gaap/2021-01-31#OtherLiabilitiesNoncurrent0001046102--12-312022Q1false1107917881106180490.0033http://fasb.org/us-gaap/2021-01-31#OtherAssetsNoncurrentP1Yhttp://fasb.org/us-gaap/2021-01-31#OtherLiabilitiesNoncurrenthttp://fasb.org/us-gaap/2021-01-31#OtherLiabilitiesNoncurrentP2Y90200000001046102rba:FourthAmendmentOfCreditAgreementMemberrba:DelayedDrawTermLoanFacilityMember2022-06-282022-06-280001046102us-gaap:EmployeeStockOptionMember2021-04-012021-06-300001046102us-gaap:StockCompensationPlanMember2022-04-012022-06-300001046102us-gaap:EmployeeStockOptionMember2022-04-012022-06-300001046102us-gaap:StockCompensationPlanMember2021-04-012021-06-300001046102us-gaap:StockCompensationPlanMember2021-01-012021-06-300001046102us-gaap:RetainedEarningsMember2022-06-300001046102us-gaap:NoncontrollingInterestMember2022-06-300001046102us-gaap:AdditionalPaidInCapitalMember2022-06-300001046102us-gaap:AccumulatedOtherComprehensiveIncomeMember2022-06-300001046102us-gaap:RetainedEarningsMember2022-03-310001046102us-gaap:NoncontrollingInterestMember2022-03-310001046102us-gaap:AdditionalPaidInCapitalMember2022-03-310001046102us-gaap:AccumulatedOtherComprehensiveIncomeMember2022-03-3100010461022022-03-310001046102us-gaap:RetainedEarningsMember2021-12-310001046102us-gaap:NoncontrollingInterestMember2021-12-310001046102us-gaap:AdditionalPaidInCapitalMember2021-12-310001046102us-gaap:AccumulatedOtherComprehensiveIncomeMember2021-12-310001046102us-gaap:RetainedEarningsMember2021-06-300001046102us-gaap:NoncontrollingInterestMember2021-06-300001046102us-gaap:AdditionalPaidInCapitalMember2021-06-300001046102us-gaap:AccumulatedOtherComprehensiveIncomeMember2021-06-300001046102us-gaap:RetainedEarningsMember2021-03-310001046102us-gaap:NoncontrollingInterestMember2021-03-310001046102us-gaap:AdditionalPaidInCapitalMember2021-03-310001046102us-gaap:AccumulatedOtherComprehensiveIncomeMember2021-03-3100010461022021-03-310001046102us-gaap:RetainedEarningsMember2020-12-310001046102us-gaap:NoncontrollingInterestMember2020-12-310001046102us-gaap:AdditionalPaidInCapitalMember2020-12-310001046102us-gaap:AccumulatedOtherComprehensiveIncomeMember2020-12-310001046102us-gaap:CommonStockMember2022-06-300001046102us-gaap:CommonStockMember2022-03-310001046102us-gaap:CommonStockMember2021-12-310001046102us-gaap:CommonStockMember2021-06-300001046102us-gaap:CommonStockMember2021-03-310001046102us-gaap:CommonStockMember2020-12-310001046102us-gaap:EmployeeStockOptionMember2021-01-012021-12-310001046102rba:PremiumPricedStockOptionsMember2021-01-012021-12-310001046102rba:PremiumPricedStockOptionsMember2021-12-310001046102us-gaap:EmployeeStockOptionMember2021-12-310001046102rba:PremiumPricedStockOptionsMember2022-04-012022-06-300001046102rba:PremiumPricedStockOptionsMemberrba:StockOptionPlanMember2022-01-012022-06-300001046102us-gaap:RestrictedStockUnitsRSUMemberus-gaap:EquitySecuritiesMember2022-06-300001046102us-gaap:PerformanceSharesMemberus-gaap:EquitySecuritiesMember2022-06-300001046102rba:PerformanceShareUnitsWithMarketConditionsMemberus-gaap:EquitySecuritiesMember2022-06-300001046102rba:DeferredShareUnitsMemberus-gaap:DebtSecuritiesMember2022-06-300001046102rba:SmartequipMember2022-06-300001046102rba:RouseServicesLlcMember2022-06-300001046102us-gaap:RestrictedStockUnitsRSUMemberus-gaap:EquitySecuritiesMember2021-12-310001046102us-gaap:PerformanceSharesMemberus-gaap:EquitySecuritiesMember2021-12-310001046102rba:PerformanceShareUnitsWithMarketConditionsMemberus-gaap:EquitySecuritiesMember2021-12-310001046102rba:DeferredShareUnitsMemberus-gaap:DebtSecuritiesMember2021-12-310001046102rba:SmartequipMember2021-12-310001046102rba:RouseServicesLlcMember2021-12-310001046102rba:RouseServicesLlcMember2021-06-300001046102rba:RouseServicesLlcMember2020-12-310001046102rba:PerformanceShareUnitsWithMarketConditionsMemberus-gaap:EquitySecuritiesMember2022-01-012022-06-300001046102rba:DeferredShareUnitsMemberus-gaap:DebtSecuritiesMember2022-01-012022-06-300001046102rba:RouseServicesLlcMember2022-01-012022-06-300001046102rba:RouseServicesLlcMember2021-01-012021-06-300001046102rba:DeferredShareUnitsMember2021-12-310001046102us-gaap:OperatingSegmentsMemberrba:FeesRevenueMemberrba:OtherReportingUnitMember2022-04-012022-06-300001046102us-gaap:OperatingSegmentsMemberrba:FeesRevenueMemberrba:AuctionsAndMarketPlacesMember2022-04-012022-06-300001046102us-gaap:OperatingSegmentsMemberrba:CommissionRevenueMemberrba:AuctionsAndMarketPlacesMember2022-04-012022-06-300001046102us-gaap:OperatingSegmentsMemberrba:FeesRevenueMember2022-04-012022-06-300001046102us-gaap:OperatingSegmentsMemberrba:CommissionRevenueMember2022-04-012022-06-300001046102srt:EuropeMember2022-04-012022-06-300001046102rba:OtherCountriesMember2022-04-012022-06-300001046102rba:FeesRevenueMember2022-04-012022-06-300001046102rba:CommissionRevenueMember2022-04-012022-06-300001046102country:US2022-04-012022-06-300001046102country:CA2022-04-012022-06-300001046102country:AU2022-04-012022-06-300001046102us-gaap:OperatingSegmentsMemberrba:FeesRevenueMemberrba:OtherReportingUnitMember2022-01-012022-06-300001046102us-gaap:OperatingSegmentsMemberrba:FeesRevenueMemberrba:AuctionsAndMarketPlacesMember2022-01-012022-06-300001046102us-gaap:OperatingSegmentsMemberrba:CommissionRevenueMemberrba:AuctionsAndMarketPlacesMember2022-01-012022-06-300001046102us-gaap:OperatingSegmentsMemberrba:FeesRevenueMember2022-01-012022-06-300001046102us-gaap:OperatingSegmentsMemberrba:CommissionRevenueMember2022-01-012022-06-300001046102srt:EuropeMember2022-01-012022-06-300001046102rba:OtherCountriesMember2022-01-012022-06-300001046102rba:FeesRevenueMember2022-01-012022-06-300001046102rba:CommissionRevenueMember2022-01-012022-06-300001046102country:US2022-01-012022-06-300001046102country:CA2022-01-012022-06-300001046102country:AU2022-01-012022-06-300001046102us-gaap:OperatingSegmentsMemberrba:FeesRevenueMemberrba:OtherReportingUnitMember2021-04-012021-06-300001046102us-gaap:OperatingSegmentsMemberrba:FeesRevenueMemberrba:AuctionsAndMarketPlacesMember2021-04-012021-06-300001046102us-gaap:OperatingSegmentsMemberrba:CommissionRevenueMemberrba:AuctionsAndMarketPlacesMember2021-04-012021-06-300001046102us-gaap:OperatingSegmentsMemberrba:FeesRevenueMember2021-04-012021-06-300001046102us-gaap:OperatingSegmentsMemberrba:CommissionRevenueMember2021-04-012021-06-300001046102srt:EuropeMember2021-04-012021-06-300001046102rba:OtherCountriesMember2021-04-012021-06-300001046102rba:FeesRevenueMember2021-04-012021-06-300001046102rba:CommissionRevenueMember2021-04-012021-06-300001046102country:US2021-04-012021-06-300001046102country:CA2021-04-012021-06-300001046102country:AU2021-04-012021-06-300001046102us-gaap:OperatingSegmentsMemberrba:FeesRevenueMemberrba:OtherReportingUnitMember2021-01-012021-06-300001046102us-gaap:OperatingSegmentsMemberrba:FeesRevenueMemberrba:AuctionsAndMarketPlacesMember2021-01-012021-06-300001046102us-gaap:OperatingSegmentsMemberrba:CommissionRevenueMemberrba:AuctionsAndMarketPlacesMember2021-01-012021-06-300001046102us-gaap:OperatingSegmentsMemberrba:FeesRevenueMember2021-01-012021-06-300001046102us-gaap:OperatingSegmentsMemberrba:CommissionRevenueMember2021-01-012021-06-300001046102srt:EuropeMember2021-01-012021-06-300001046102rba:OtherCountriesMember2021-01-012021-06-300001046102rba:FeesRevenueMember2021-01-012021-06-300001046102rba:CommissionRevenueMember2021-01-012021-06-300001046102country:US2021-01-012021-06-300001046102country:CA2021-01-012021-06-300001046102country:AU2021-01-012021-06-300001046102rba:BoltonPropertiesSaleLeasebackTransactionMember2022-03-310001046102rba:BoltonPropertiesSaleLeasebackTransactionMember2022-03-170001046102rba:MaltbyAuctionSiteMember2022-06-300001046102us-gaap:OtherNoncurrentAssetsMember2022-06-300001046102rba:TradeAndOtherReceivablesMember2022-06-300001046102us-gaap:OtherNoncurrentAssetsMember2021-12-310001046102rba:TradeAndOtherReceivablesMember2021-12-310001046102us-gaap:FairValueInputsLevel2Memberus-gaap:EstimateOfFairValueFairValueDisclosureMemberus-gaap:FairValueMeasurementsRecurringMember2022-06-300001046102us-gaap:FairValueInputsLevel2Memberus-gaap:CarryingReportedAmountFairValueDisclosureMemberus-gaap:FairValueMeasurementsRecurringMember2022-06-300001046102us-gaap:FairValueInputsLevel2Memberus-gaap:EstimateOfFairValueFairValueDisclosureMemberus-gaap:FairValueMeasurementsRecurringMember2021-12-310001046102us-gaap:FairValueInputsLevel2Memberus-gaap:CarryingReportedAmountFairValueDisclosureMemberus-gaap:FairValueMeasurementsRecurringMember2021-12-310001046102rba:DelayedDrawTermLoanFacilityMemberrba:FourthAmendmentOfCreditAgreementMember2022-06-270001046102us-gaap:RevolvingCreditFacilityMemberrba:RevolvingCreditFacilitiesMaturingSeptember2026Member2022-06-300001046102rba:DelayedDrawTermLoanFacilityMemberrba:FourthAmendmentOfCreditAgreementMember2021-09-300001046102rba:FourthAmendmentOfCreditAgreementMember2021-09-300001046102us-gaap:RevolvingCreditFacilityMemberrba:RevolvingCreditFacilitiesNoMaturityMember2022-06-300001046102us-gaap:RevolvingCreditFacilityMemberrba:RevolvingCreditFacilitiesMaturingOctober2023Member2022-06-3000010461022022-03-170001046102rba:BoltonPropertiesSaleLeasebackTransactionMember2022-06-300001046102srt:MinimumMember2022-06-300001046102srt:MaximumMember2022-06-300001046102us-gaap:RestrictedStockUnitsRSUMember2022-01-012022-06-300001046102us-gaap:PerformanceSharesMember2022-01-012022-06-300001046102rba:SharesIssuedForBusinessCombinationMember2022-01-012022-06-300001046102rba:PremiumPricedStockOptionsMember2022-01-012022-06-300001046102us-gaap:RestrictedStockUnitsRSUMember2022-06-300001046102us-gaap:PerformanceSharesMember2022-06-300001046102us-gaap:EmployeeStockOptionMember2022-06-300001046102rba:PremiumPricedStockOptionsMember2022-06-300001046102rba:PerformanceShareUnitsWithMarketConditionsMember2022-06-300001046102rba:DeferredShareUnitsMember2022-06-300001046102rba:SharesIssuedForBusinessCombinationMember2021-06-300001046102currency:USDus-gaap:ForwardContractsMember2022-03-310001046102currency:CADus-gaap:ForwardContractsMember2022-03-310001046102us-gaap:ForwardContractsMember2022-01-012022-06-300001046102us-gaap:ForwardContractsMemberus-gaap:FairValueInputsLevel2Memberus-gaap:EstimateOfFairValueFairValueDisclosureMemberus-gaap:FairValueMeasurementsRecurringMember2022-06-300001046102us-gaap:ForwardContractsMemberus-gaap:FairValueInputsLevel2Memberus-gaap:CarryingReportedAmountFairValueDisclosureMemberus-gaap:FairValueMeasurementsRecurringMember2022-06-300001046102rba:DealContingentForwardContractMemberus-gaap:FairValueInputsLevel3Memberus-gaap:EstimateOfFairValueFairValueDisclosureMemberus-gaap:FairValueMeasurementsRecurringMember2021-12-310001046102rba:DealContingentForwardContractMemberus-gaap:FairValueInputsLevel3Memberus-gaap:CarryingReportedAmountFairValueDisclosureMemberus-gaap:FairValueMeasurementsRecurringMember2021-12-310001046102rba:TermLoansMember2022-06-300001046102rba:FourthAmendmentOfCreditAgreementMember2022-06-300001046102rba:TermLoansMember2021-12-310001046102rba:LongTermRevolverLoan2.29MaturingSeptember2026TwoMemberrba:RevolverLoanMember2022-06-300001046102rba:LongTermRevolverLoan2.29MaturingSeptember2026Memberrba:RevolverLoanMember2022-06-300001046102rba:FourPointSevenFivePercentSeniorUnsecuredNotesDueJanuary2031Memberus-gaap:UnsecuredDebtMember2022-06-300001046102rba:FourPointNineFivePercentSeniorUnsecuredNotesDueDecember2029Memberus-gaap:UnsecuredDebtMember2022-06-300001046102us-gaap:RevolvingCreditFacilityMember2022-06-300001046102us-gaap:RevolvingCreditFacilityMember2021-12-310001046102us-gaap:SeniorNotesMember2022-05-042022-05-040001046102rba:SeniorUnsecuredNotes2021UsdNotesMember2022-05-042022-05-040001046102rba:FivePointThreeSevenFivePercentSeniorUnsecuredNoteDueJanuary2025Memberus-gaap:UnsecuredDebtMember2022-01-012022-06-300001046102us-gaap:FairValueInputsLevel2Memberus-gaap:EstimateOfFairValueFairValueDisclosureMemberus-gaap:FairValueMeasurementsRecurringMemberus-gaap:LongTermDebtMemberrba:TermLoansMember2022-06-300001046102us-gaap:FairValueInputsLevel2Memberus-gaap:EstimateOfFairValueFairValueDisclosureMemberus-gaap:FairValueMeasurementsRecurringMemberus-gaap:LongTermDebtMemberrba:RevolverLoanMember2022-06-300001046102us-gaap:FairValueInputsLevel2Memberus-gaap:CarryingReportedAmountFairValueDisclosureMemberus-gaap:FairValueMeasurementsRecurringMemberus-gaap:LongTermDebtMemberrba:TermLoansMember2022-06-300001046102us-gaap:FairValueInputsLevel2Memberus-gaap:CarryingReportedAmountFairValueDisclosureMemberus-gaap:FairValueMeasurementsRecurringMemberus-gaap:LongTermDebtMemberrba:RevolverLoanMember2022-06-300001046102rba:SeniorUnsecuredNotes2016NotesMemberus-gaap:FairValueInputsLevel1Memberus-gaap:EstimateOfFairValueFairValueDisclosureMemberus-gaap:FairValueMeasurementsRecurringMemberus-gaap:LongTermDebtMember2022-06-300001046102rba:SeniorUnsecuredNotes2016NotesMemberus-gaap:FairValueInputsLevel1Memberus-gaap:CarryingReportedAmountFairValueDisclosureMemberus-gaap:FairValueMeasurementsRecurringMemberus-gaap:LongTermDebtMember2022-06-300001046102us-gaap:FairValueInputsLevel2Memberus-gaap:EstimateOfFairValueFairValueDisclosureMemberus-gaap:FairValueMeasurementsRecurringMemberus-gaap:ShortTermDebtMember2022-06-300001046102us-gaap:FairValueInputsLevel2Memberus-gaap:CarryingReportedAmountFairValueDisclosureMemberus-gaap:FairValueMeasurementsRecurringMemberus-gaap:ShortTermDebtMember2022-06-300001046102us-gaap:FairValueInputsLevel2Memberus-gaap:EstimateOfFairValueFairValueDisclosureMemberus-gaap:FairValueMeasurementsRecurringMemberus-gaap:LongTermDebtMemberrba:TermLoansMember2021-12-310001046102us-gaap:FairValueInputsLevel2Memberus-gaap:EstimateOfFairValueFairValueDisclosureMemberus-gaap:FairValueMeasurementsRecurringMemberus-gaap:LongTermDebtMemberrba:RevolverLoanMember2021-12-310001046102us-gaap:FairValueInputsLevel2Memberus-gaap:CarryingReportedAmountFairValueDisclosureMemberus-gaap:FairValueMeasurementsRecurringMemberus-gaap:LongTermDebtMemberrba:TermLoansMember2021-12-310001046102us-gaap:FairValueInputsLevel2Memberus-gaap:CarryingReportedAmountFairValueDisclosureMemberus-gaap:FairValueMeasurementsRecurringMemberus-gaap:LongTermDebtMemberrba:RevolverLoanMember2021-12-310001046102rba:SeniorUnsecuredNotes2021UsdNotesMemberus-gaap:FairValueInputsLevel2Memberus-gaap:EstimateOfFairValueFairValueDisclosureMemberus-gaap:FairValueMeasurementsRecurringMemberus-gaap:LongTermDebtMember2021-12-310001046102rba:SeniorUnsecuredNotes2021UsdNotesMemberus-gaap:FairValueInputsLevel2Memberus-gaap:CarryingReportedAmountFairValueDisclosureMemberus-gaap:FairValueMeasurementsRecurringMemberus-gaap:LongTermDebtMember2021-12-310001046102rba:SeniorUnsecuredNotes2021CadNotesMemberus-gaap:FairValueInputsLevel2Memberus-gaap:EstimateOfFairValueFairValueDisclosureMemberus-gaap:FairValueMeasurementsRecurringMemberus-gaap:LongTermDebtMember2021-12-310001046102rba:SeniorUnsecuredNotes2021CadNotesMemberus-gaap:FairValueInputsLevel2Memberus-gaap:CarryingReportedAmountFairValueDisclosureMemberus-gaap:FairValueMeasurementsRecurringMemberus-gaap:LongTermDebtMember2021-12-310001046102rba:SeniorUnsecuredNotes2016NotesMemberus-gaap:FairValueInputsLevel1Memberus-gaap:EstimateOfFairValueFairValueDisclosureMemberus-gaap:FairValueMeasurementsRecurringMemberus-gaap:LongTermDebtMember2021-12-310001046102rba:SeniorUnsecuredNotes2016NotesMemberus-gaap:FairValueInputsLevel1Memberus-gaap:CarryingReportedAmountFairValueDisclosureMemberus-gaap:FairValueMeasurementsRecurringMemberus-gaap:LongTermDebtMember2021-12-310001046102us-gaap:FairValueInputsLevel2Memberus-gaap:EstimateOfFairValueFairValueDisclosureMemberus-gaap:FairValueMeasurementsRecurringMemberus-gaap:ShortTermDebtMember2021-12-310001046102us-gaap:FairValueInputsLevel2Memberus-gaap:CarryingReportedAmountFairValueDisclosureMemberus-gaap:FairValueMeasurementsRecurringMemberus-gaap:ShortTermDebtMember2021-12-310001046102rba:SeniorUnsecuredNotes2021UsdNotesMemberus-gaap:SeniorNotesMember2021-12-210001046102rba:SeniorUnsecuredNotes2021CadNotesMemberus-gaap:SeniorNotesMember2021-12-210001046102rba:FivePointThreeSevenFivePercentSeniorUnsecuredNoteDueJanuary2025Memberus-gaap:UnsecuredDebtMember2016-12-210001046102rba:TermLoanMemberrba:TermLoansMember2022-06-300001046102rba:LongTermRevolverLoan1.89MaturingSeptember2026Memberrba:RevolverLoanMember2022-06-300001046102rba:FivePointThreeSevenFivePercentSeniorUnsecuredNoteDueJanuary2025Memberus-gaap:UnsecuredDebtMember2022-06-300001046102rba:TermLoanMemberrba:TermLoansMember2021-12-310001046102rba:LongTermRevolverLoan2.29MaturingSeptember2026TwoMemberrba:RevolverLoanMember2021-12-310001046102rba:LongTermRevolverLoan2.29MaturingSeptember2026Memberrba:RevolverLoanMember2021-12-310001046102rba:LongTermRevolverLoan1.89MaturingSeptember2026Memberrba:RevolverLoanMember2021-12-310001046102rba:FourPointSevenFivePercentSeniorUnsecuredNotesDueJanuary2031Memberus-gaap:UnsecuredDebtMember2021-12-310001046102rba:FourPointNineFivePercentSeniorUnsecuredNotesDueDecember2029Memberus-gaap:UnsecuredDebtMember2021-12-310001046102rba:FivePointThreeSevenFivePercentSeniorUnsecuredNoteDueJanuary2025Memberus-gaap:UnsecuredDebtMember2021-12-310001046102rba:DelayedDrawTermLoanFacilityMemberrba:ThirdAmendmentOfCreditAgreementMember2021-08-310001046102us-gaap:OperatingSegmentsMemberrba:ServiceRevenuesMemberrba:OtherReportingUnitMember2022-04-012022-06-300001046102us-gaap:OperatingSegmentsMemberrba:ServiceRevenuesMemberrba:AuctionsAndMarketPlacesMember2022-04-012022-06-300001046102us-gaap:OperatingSegmentsMemberrba:RevenueFromInventorySalesMemberrba:AuctionsAndMarketPlacesMember2022-04-012022-06-300001046102us-gaap:OperatingSegmentsMemberrba:ServiceRevenuesMember2022-04-012022-06-300001046102us-gaap:OperatingSegmentsMemberrba:RevenueFromInventorySalesMember2022-04-012022-06-300001046102rba:RevenueFromInventorySalesMember2022-04-012022-06-300001046102us-gaap:OperatingSegmentsMemberrba:ServiceRevenuesMemberrba:OtherReportingUnitMember2022-01-012022-06-300001046102us-gaap:OperatingSegmentsMemberrba:ServiceRevenuesMemberrba:AuctionsAndMarketPlacesMember2022-01-012022-06-300001046102us-gaap:OperatingSegmentsMemberrba:RevenueFromInventorySalesMemberrba:AuctionsAndMarketPlacesMember2022-01-012022-06-300001046102us-gaap:OperatingSegmentsMemberrba:ServiceRevenuesMember2022-01-012022-06-300001046102us-gaap:OperatingSegmentsMemberrba:RevenueFromInventorySalesMember2022-01-012022-06-300001046102rba:RevenueFromInventorySalesMember2022-01-012022-06-300001046102us-gaap:OperatingSegmentsMemberrba:ServiceRevenuesMemberrba:OtherReportingUnitMember2021-04-012021-06-300001046102us-gaap:OperatingSegmentsMemberrba:ServiceRevenuesMemberrba:AuctionsAndMarketPlacesMember2021-04-012021-06-300001046102us-gaap:OperatingSegmentsMemberrba:RevenueFromInventorySalesMemberrba:AuctionsAndMarketPlacesMember2021-04-012021-06-300001046102us-gaap:OperatingSegmentsMemberrba:ServiceRevenuesMember2021-04-012021-06-300001046102us-gaap:OperatingSegmentsMemberrba:RevenueFromInventorySalesMember2021-04-012021-06-300001046102rba:RevenueFromInventorySalesMember2021-04-012021-06-300001046102us-gaap:OperatingSegmentsMemberrba:ServiceRevenuesMemberrba:OtherReportingUnitMember2021-01-012021-06-300001046102us-gaap:OperatingSegmentsMemberrba:ServiceRevenuesMemberrba:AuctionsAndMarketPlacesMember2021-01-012021-06-300001046102us-gaap:OperatingSegmentsMemberrba:RevenueFromInventorySalesMemberrba:AuctionsAndMarketPlacesMember2021-01-012021-06-300001046102us-gaap:OperatingSegmentsMemberrba:ServiceRevenuesMember2021-01-012021-06-300001046102us-gaap:OperatingSegmentsMemberrba:RevenueFromInventorySalesMember2021-01-012021-06-300001046102rba:RevenueFromInventorySalesMember2021-01-012021-06-300001046102us-gaap:SubsequentEventMember2022-07-012022-08-030001046102rba:FourthQuarter2021Member2022-01-012022-06-300001046102rba:FirstQuarter2022Member2022-01-012022-06-300001046102rba:FourthQuarter2020Member2021-01-012021-06-300001046102rba:FirstQuarter2021Member2021-01-012021-06-3000010461022021-06-3000010461022020-12-310001046102rba:SmartequipMemberus-gaap:TrademarksAndTradeNamesMember2021-11-020001046102rba:SmartequipMemberus-gaap:OrderOrProductionBacklogMember2021-11-020001046102rba:SmartequipMemberus-gaap:CustomerRelationshipsMember2021-11-020001046102rba:SmartequipMemberus-gaap:ComputerSoftwareIntangibleAssetMember2021-11-020001046102rba:SmartequipMember2021-11-020001046102rba:SmartequipMemberrba:EmploymentCostsMember2021-11-022021-11-020001046102rba:SmartequipMemberrba:EmploymentCostsMember2022-04-012022-06-300001046102rba:RouseServicesLlcMemberrba:EmploymentCostsMember2022-04-012022-06-300001046102rba:EuroAuctionsLimitedMemberrba:OtherRelatedCostsMember2022-04-012022-06-300001046102rba:SmartequipMemberrba:OtherRelatedCostsMember2022-01-012022-06-300001046102rba:SmartequipMemberrba:EmploymentCostsMember2022-01-012022-06-300001046102rba:RouseServicesLlcMemberrba:OtherRelatedCostsMember2022-01-012022-06-300001046102rba:RouseServicesLlcMemberrba:EmploymentCostsMember2022-01-012022-06-300001046102rba:EuroAuctionsLimitedMemberrba:OtherRelatedCostsMember2022-01-012022-06-300001046102rba:RouseServicesLlcMemberrba:OtherRelatedCostsMember2021-04-012021-06-300001046102rba:RouseServicesLlcMemberrba:EmploymentCostsMember2021-04-012021-06-300001046102rba:RouseServicesLlcMemberrba:OtherRelatedCostsMember2021-01-012021-06-300001046102rba:RouseServicesLlcMemberrba:EmploymentCostsMember2021-01-012021-06-300001046102rba:ArizonaUnitedStatesMemberus-gaap:DisposalGroupHeldforsaleNotDiscontinuedOperationsMember2021-12-310001046102srt:MinimumMemberrba:SmartequipMemberus-gaap:CustomerRelationshipsMember2021-11-022021-11-020001046102srt:MaximumMemberrba:SmartequipMemberus-gaap:CustomerRelationshipsMember2021-11-022021-11-020001046102rba:SmartequipMemberus-gaap:TrademarksAndTradeNamesMember2021-11-022021-11-020001046102rba:SmartequipMemberus-gaap:OrderOrProductionBacklogMember2021-11-022021-11-020001046102rba:SmartequipMemberus-gaap:ComputerSoftwareIntangibleAssetMember2021-11-022021-11-020001046102us-gaap:CommonStockMember2021-04-012021-06-300001046102us-gaap:CommonStockMember2021-01-012021-06-300001046102rba:SharesIssuedForBusinessCombinationMember2022-06-300001046102rba:PerformanceShareUnitsWithMarketConditionsMember2022-01-012022-06-300001046102rba:PerformanceShareUnitPlansMember2022-01-012022-06-300001046102rba:PerformanceShareUnitPlansMember2021-01-012021-12-310001046102us-gaap:RestrictedStockUnitsRSUMemberus-gaap:EquitySecuritiesMember2022-01-012022-06-300001046102us-gaap:PerformanceSharesMemberus-gaap:EquitySecuritiesMember2022-01-012022-06-300001046102rba:PerformanceShareUnitsWithMarketConditionsMember2022-06-012022-06-300001046102rba:PerformanceShareUnitsWithMarketConditionsMember2021-11-012021-11-300001046102rba:PerformanceShareUnitsWithMarketConditionsMember2021-08-012021-08-310001046102rba:PerformanceShareUnitsWithMarketConditionsMember2022-04-012022-06-300001046102rba:BoltonOntarioMember2022-03-172022-03-170001046102us-gaap:FairValueInputsLevel1Memberus-gaap:EstimateOfFairValueFairValueDisclosureMemberus-gaap:FairValueMeasurementsRecurringMember2022-06-300001046102us-gaap:FairValueInputsLevel1Memberus-gaap:CarryingReportedAmountFairValueDisclosureMemberus-gaap:FairValueMeasurementsRecurringMember2022-06-300001046102us-gaap:FairValueInputsLevel1Memberus-gaap:EstimateOfFairValueFairValueDisclosureMemberus-gaap:FairValueMeasurementsRecurringMember2021-12-310001046102us-gaap:FairValueInputsLevel1Memberus-gaap:CarryingReportedAmountFairValueDisclosureMemberus-gaap:FairValueMeasurementsRecurringMember2021-12-310001046102us-gaap:ForwardContractsMember2022-01-012022-03-310001046102rba:BoltonOntarioMember2022-03-170001046102rba:DelayedDrawTermLoanFacilityMemberrba:FourthAmendmentOfCreditAgreementMember2022-06-282022-06-280001046102rba:SmartequipMember2021-08-092021-08-090001046102rba:EuroAuctionsLimitedMember2021-08-092021-08-0900010461022022-03-172022-03-1700010461022021-06-012021-06-0100010461022021-01-012021-12-310001046102us-gaap:OperatingSegmentsMemberrba:OtherReportingUnitMember2022-04-012022-06-300001046102us-gaap:OperatingSegmentsMemberrba:AuctionsAndMarketPlacesMember2022-04-012022-06-300001046102us-gaap:OperatingSegmentsMember2022-04-012022-06-300001046102us-gaap:OperatingSegmentsMemberrba:OtherReportingUnitMember2022-01-012022-06-300001046102us-gaap:OperatingSegmentsMemberrba:AuctionsAndMarketPlacesMember2022-01-012022-06-300001046102us-gaap:OperatingSegmentsMember2022-01-012022-06-300001046102us-gaap:OperatingSegmentsMemberrba:OtherReportingUnitMember2021-04-012021-06-300001046102us-gaap:OperatingSegmentsMemberrba:AuctionsAndMarketPlacesMember2021-04-012021-06-300001046102us-gaap:OperatingSegmentsMember2021-04-012021-06-300001046102us-gaap:OperatingSegmentsMemberrba:OtherReportingUnitMember2021-01-012021-06-300001046102us-gaap:OperatingSegmentsMemberrba:AuctionsAndMarketPlacesMember2021-01-012021-06-300001046102us-gaap:OperatingSegmentsMember2021-01-012021-06-300001046102srt:MinimumMemberus-gaap:FinanceReceivablesMember2022-01-012022-06-300001046102srt:MaximumMemberus-gaap:FinanceReceivablesMember2022-01-012022-06-300001046102us-gaap:SellingGeneralAndAdministrativeExpensesMember2022-04-012022-06-300001046102us-gaap:SellingGeneralAndAdministrativeExpensesMember2022-01-012022-06-300001046102us-gaap:SellingGeneralAndAdministrativeExpensesMember2021-04-012021-06-300001046102us-gaap:SellingGeneralAndAdministrativeExpensesMember2021-01-012021-06-300001046102srt:MinimumMember2022-01-012022-06-300001046102srt:MaximumMember2022-01-012022-06-300001046102us-gaap:StockCompensationPlanMember2022-01-012022-06-300001046102us-gaap:EmployeeStockOptionMember2022-01-012022-06-300001046102us-gaap:EmployeeStockOptionMember2021-01-012021-06-300001046102us-gaap:ForwardContractsMember2022-03-310001046102us-gaap:RetainedEarningsMember2022-04-012022-06-300001046102us-gaap:NoncontrollingInterestMember2022-04-012022-06-300001046102us-gaap:AccumulatedOtherComprehensiveIncomeMember2022-04-012022-06-300001046102us-gaap:RetainedEarningsMember2022-01-012022-06-300001046102us-gaap:NoncontrollingInterestMember2022-01-012022-06-300001046102us-gaap:AccumulatedOtherComprehensiveIncomeMember2022-01-012022-06-300001046102us-gaap:RetainedEarningsMember2021-04-012021-06-300001046102us-gaap:NoncontrollingInterestMember2021-04-012021-06-300001046102us-gaap:AccumulatedOtherComprehensiveIncomeMember2021-04-012021-06-300001046102us-gaap:RetainedEarningsMember2021-01-012021-06-300001046102us-gaap:NoncontrollingInterestMember2021-01-012021-06-300001046102us-gaap:AccumulatedOtherComprehensiveIncomeMember2021-01-012021-06-300001046102us-gaap:AcquisitionRelatedCostsMember2022-04-012022-06-300001046102us-gaap:AcquisitionRelatedCostsMember2022-01-012022-06-300001046102us-gaap:AcquisitionRelatedCostsMember2021-04-012021-06-300001046102us-gaap:AcquisitionRelatedCostsMember2021-01-012021-06-300001046102rba:SmartequipMember2022-01-012022-06-300001046102rba:SmartequipMember2021-11-022021-11-020001046102us-gaap:CommonStockMember2022-04-012022-06-300001046102us-gaap:AdditionalPaidInCapitalMember2022-04-012022-06-3000010461022022-04-012022-06-300001046102us-gaap:CommonStockMember2022-01-012022-06-300001046102us-gaap:AdditionalPaidInCapitalMember2022-01-012022-06-300001046102us-gaap:AdditionalPaidInCapitalMember2021-04-012021-06-3000010461022021-04-012021-06-300001046102us-gaap:AdditionalPaidInCapitalMember2021-01-012021-06-300001046102rba:ServiceRevenuesMember2022-04-012022-06-300001046102rba:ServiceRevenuesMember2022-01-012022-06-300001046102rba:ServiceRevenuesMember2021-04-012021-06-300001046102rba:ServiceRevenuesMember2021-01-012021-06-3000010461022021-01-012021-06-3000010461022022-06-3000010461022021-12-3100010461022022-08-0300010461022022-01-012022-06-30xbrli:sharesiso4217:USDiso4217:CADiso4217:USDxbrli:sharesxbrli:purerba:itemiso4217:GBPrba:contractrba:segment

Table of Contents

UNITED STATES

SECURITIES AND EXCHANGE COMMISSION

Washington, D.C. 20549

FORM 10-Q

QUARTERLY REPORT PURSUANT TO SECTION 13 OR 15(d) OF THE SECURITIES EXCHANGE ACT OF 1934

For the quarterly period ended June 30, 2022

OR

TRANSITION REPORT PURSUANT TO SECTION 13 OR 15(d) OF THE SECURITIES EXCHANGE ACT OF 1934

For the transition period from ______ to ______

Commission file number: 001-13425

Graphic

Ritchie Bros. Auctioneers Incorporated

(Exact Name of Registrant as Specified in its Charter)

Canada


98-0626225

(State or other jurisdiction of incorporation or organization)


(I.R.S. Employer Identification No.)


9500 Glenlyon Parkway


Burnaby, British Columbia, Canada


V5J 0C6

(Address of Principal Executive Offices)


(Zip Code)

(778) 331-5500

(Registrant’s Telephone Number, including Area Code)

Securities registered pursuant to Section 12(b) of the Act:

Title of each class

Trading Symbol(s)

Name of each exchange on which registered

Common shares

RBA

New York Stock Exchange

Common Share Purchase Rights

N/A

New York Stock Exchange

Indicate by checkmark whether the registrant (1) filed all reports required to be filed by Section 13 or 15(d) of the Securities Exchange Act of 1934 during the preceding 12 months (or for such shorter period that the registrant was required to file such reports), and (2) has been subject to such filing requirements for the past 90 days. Yes No

Indicate by check mark whether the registrant has submitted electronically every Interactive Data File required to be submitted pursuant to Rule 405 of Regulation S-T (§ 232.405 of this chapter) during the preceding 12 months (or for such shorter period that the registrant was required to submit such files).  Yes No

Indicate by check mark whether the registrant is a large accelerated filer, an accelerated filer, a non-accelerated filer, smaller reporting company, or an emerging growth company. See the definitions of “large accelerated filer,” “accelerated filer,” “smaller reporting company,” and “emerging growth company” in Rule 12b-2 of the Exchange Act.

Large accelerated filer 

Accelerated filer 

Non-accelerated filer 

Smaller reporting company 

Emerging growth company 

If an emerging growth company, indicate by check mark if the registrant has elected not to use the extended transition period for complying with any new or revised financial accounting standards provided pursuant to Section 13(a) of the Exchange Act. 

Indicate by check mark whether the registrant is a shell company (as defined in Rule 12b-2 of the Exchange Act):

Yes No

Indicate the number of shares outstanding of each of the issuer’s classes of common stock, as of the latest practical date: 110,809,591 common shares, without par value, outstanding as of August 3, 2022.

Table of Contents

RITCHIE BROS. AUCTIONEERS INCORPORATED

FORM 10-Q

For the quarter ended June 30, 2022

INDEX

PART I – FINANCIAL INFORMATION

ITEM 1:

Consolidated Financial Statements

1

ITEM 2:

Management’s Discussion and Analysis of Financial Condition and Results of Operations

28

ITEM 3:

Quantitative and Qualitative Disclosures About Market Risk

54

ITEM 4:

Controls and Procedures

54

PART II – OTHER INFORMATION

ITEM 1:

Legal Proceedings

55

ITEM 1A:

Risk Factors

55

ITEM 2:

Unregistered Sales of Equity Securities and Use of Proceeds

55

ITEM 3:

Defaults Upon Senior Securities

55

ITEM 4:

Mine Safety Disclosures

55

ITEM 5:

Other Information

55

ITEM 6:

Exhibits

56

SIGNATURES

57

Table of Contents

PART I – FINANCIAL INFORMATION

ITEM 1:           CONSOLIDATED FINANCIAL STATEMENTS

Condensed Consolidated Income Statements

(Expressed in thousands of United States dollars, except share and per share data)

(Unaudited)

Three months ended

Six months ended

June 30, 

June 30, 


2022


2021


2022


2021

Revenue:


Service revenue

$

286,502

$

252,748

$

531,363

$

458,778

Inventory sales revenue


198,044


143,613


347,104


269,138

Total revenue


484,546


396,361


878,467


727,916

Operating expenses:


Costs of services


45,039


41,301


84,054


79,167

Cost of inventory sold


176,171


131,023


307,753


241,770

Selling, general and administrative


144,277


109,560


270,883


223,799

Acquisition-related costs


3,399


3,049


13,036


5,971

Depreciation and amortization


24,298


21,935


48,523


43,005

Foreign exchange loss (gain)


(158)


151


(322)


428

Total operating expenses


393,026


307,019


723,927


594,140

Gain on disposition of property, plant and equipment


347


175

170,167

243

Operating income


91,867


89,517


324,707


134,019

Interest expense


(18,463)


(8,867)


(39,149)


(17,813)

Change in fair value of derivatives, net


1,263


Other income, net


1,639


1,196


2,559


2,198

Income before income taxes


75,043


81,846


289,380


118,404

Income tax expense

21,632

21,065

57,868

29,484

Net income

$

53,411

$

60,781

$

231,512

$

88,920

Net income (loss) attributable to:


Stockholders

$

53,365

$

60,749

$

231,459

$

88,937

Non-controlling interests


46


32


53


(17)

Net income

$

53,411

$

60,781

$

231,512

$

88,920

Earnings per share attributable to stockholders:


Basic

$

0.48

$

0.55

$

2.09

$

0.81

Diluted

$

0.48

$

0.55

$

2.07

$

0.80

Weighted average number of shares outstanding:


Basic


110,760,339


110,311,615


110,705,182


110,144,229

Diluted


111,705,102


111,334,184


111,681,644


111,302,711

See accompanying notes to the condensed consolidated financial statements.

Ritchie Bros.

1

Table of Contents

Condensed Consolidated Statements of Comprehensive Income

(Expressed in thousands of United States dollars)

(Unaudited)

Three months ended

Six months ended


June 30, 

June 30, 

2022


2021


2022


2021

Net income

$

53,411

$

60,781

$

231,512

$

88,920

Other comprehensive income (loss), net of income tax:


Foreign currency translation adjustment


(22,775)


1,468


(23,942)


(8,892)

Total comprehensive income

$

30,636

$

62,249

$

207,570

$

80,028

Total comprehensive income (loss) attributable to:


Stockholders

$

30,612

$

62,215

$

207,549

$

80,059

Non-controlling interests


24


34


21


(31)

$

30,636

$

62,249

$

207,570

$

80,028

See accompanying notes to the condensed consolidated financial statements.

Ritchie Bros.

2

Table of Contents

Condensed Consolidated Balance Sheets

(Expressed in thousands of United States dollars, except share data)

(Unaudited)

June 30, 

December 31, 


2022


2021

Assets

Cash and cash equivalents

$

367,289

$

326,113

Restricted cash


164,371


102,875

Trade and other receivables


295,241


150,895

Less: allowance for credit losses

(3,763)

(4,396)

Inventory


124,964


102,494

Other current assets


36,212


64,346

Income taxes receivable


12,525


19,895

Total current assets


996,839


762,222

Restricted cash

933,464

Property, plant and equipment


442,743


449,087

Other non-current assets


168,360


142,504

Intangible assets


332,615


350,516

Goodwill


945,950


947,715

Deferred tax assets


7,458


7,406

Total assets

$

2,893,965

$

3,592,914

Liabilities and Equity


Auction proceeds payable

$

493,688

$

292,789

Trade and other liabilities


254,514


280,308

Income taxes payable


31,362


5,677

Short-term debt


8,637


6,147

Current portion of long-term debt


4,617


3,498

Total current liabilities


792,818


588,419

Long-term debt


639,755


1,733,940

Other non-current liabilities


155,911


147,260

Deferred tax liabilities


61,396


52,232

Total liabilities


1,649,880


2,521,851

Commitments and Contingencies (Note 22 and Note 23 respectively)


Stockholders' equity:


Share capital:


Common stock; no par value, unlimited shares authorized, issued and outstanding shares: 110,791,788 (December 31, 2021: 110,618,049)


235,244


227,504

Additional paid-in capital


73,014


59,535

Retained earnings


1,015,301


839,609

Accumulated other comprehensive loss


(79,883)


(55,973)

Stockholders' equity


1,243,676


1,070,675

Non-controlling interest


409


388

Total stockholders' equity


1,244,085


1,071,063

Total liabilities and equity

$

2,893,965

$

3,592,914

See accompanying notes to the condensed consolidated financial statements.

Ritchie Bros.

3

Table of Contents

Condensed Consolidated Statements of Changes in Equity

(Expressed in thousands of United States dollars, except where noted)

(Unaudited)

Attributable to stockholders


Additional

Accumulated

Non-

Common stock

paid-In

other

controlling

Number of

capital

Retained

comprehensive

interest

Total

Three months ended June 30, 2022


shares


Amount


("APIC")


earnings


loss


("NCI")


equity


Balance, March 31, 2022

110,735,243

$

231,064

$

61,123

$

989,923

$

(57,130)

$

385

$

1,225,365

Net income


53,365


46


53,411

Other comprehensive loss


(22,753)


(22)


(22,775)


53,365


(22,753)


24


30,636

Stock option exercises

55,935


2,347


(471)


1,876

Issuance of common stock related to vesting of share units

610


14


(43)


(29)

Share-based continuing employment costs related to business combinations


1,819


261


2,080

Stock option compensation expense

3,056

3,056

Equity-classified share units expense

8,794


8,794

Equity-classified share units divided equivalents

294

(294)


Cash dividends paid


(27,693)


(27,693)

Balance, June 30, 2022

110,791,788

$

235,244

$

73,014

$

1,015,301

$

(79,883)

$

409

$

1,244,085

Three months ended June 30, 2021


Balance, March 31, 2021

110,253,056

$

210,765

$

43,612

$

795,781

$

(44,639)

$

5,089

$

1,010,608

Net income


60,749


32


60,781

Other comprehensive income


1,466


2


1,468


60,749


1,466


34


62,249

Stock option exercises


113,290

4,889

(910)


3,979

Issuance of common stock related to vesting of share units


462

12

(30)


(18)

Share-based continuing employment costs related to business combinations

2,678


2,678

Stock option compensation expense


1,909


1,909

Equity-classified share units expense


4,404


4,404

Equity-classified share units dividend equivalents


137


(137)


Cash dividends paid


(24,356)


(26)

(24,382)

Balance, June 30, 2021


110,366,808

$

215,666

$

51,800

$

832,037

$

(43,173)

$

5,097

$

1,061,427

Ritchie Bros.

4

Table of Contents


Attributable to stockholders


Additional

Accumulated

Non-

Common stock

paid-In

other

controlling

Number of

capital

Retained

comprehensive

interest

Total

Six months ended June 30, 2022


shares


Amount


("APIC")


earnings


loss


("NCI")


equity


Balance, December 31, 2021

110,618,049

$

227,504

$

59,535

$

839,609

$

(55,973)

$

388

$

1,071,063

Net income


231,459


53


231,512

Other comprehensive loss


(23,910)


(32)


(23,942)


231,459


(23,910)


21


207,570

Stock option exercises

80,183


3,554


(692)


2,862

Issuance of common stock related to vesting of share units

93,556


2,367


(5,945)


(3,578)

Share-based continuing employment costs related to business combinations

1,819

2,394


4,213

Stock option compensation expense

5,623


5,623

Equity-classified share units expense


11,684


11,684

Equity-classified share units dividend equivalents


415


(415)


Cash dividends paid


(55,352)


(55,352)

Balance, June 30, 2022

110,791,788

$

235,244

$

73,014

$

1,015,301

$

(79,883)

$

409

$

1,244,085

Six months ended June 30, 2021


Balance, December 31, 2020


109,876,428

$

200,451

$

49,171

$

791,918

$

(34,295)

$

5,154

$

1,012,399

Net income


88,937


(17)


88,920

Other comprehensive income


(8,878)


(14)


(8,892)


88,937


(8,878)


(31)


80,028

Stock option exercises


311,153

13,157

(2,458)


10,699

Issuance (forfeiture) of common stock related to vesting of share units


234,737

2,058

(11,377)


(9,319)

Forfeiture of common stock related to business combinations


(55,510)


Share-based continuing employment costs related to business combinations


5,231


5,231

Stock option compensation expense


3,770


3,770

Equity-classified share units expense


7,182


7,182

Equity-classified share units dividend equivalents


281


(281)


Cash dividends paid


(48,537)


(26)

(48,563)

Balance, June 30, 2021


110,366,808

$

215,666

$

51,800

$

832,037

$

(43,173)

$

5,097

$

1,061,427

See accompanying notes to the condensed consolidated financial statements.

Ritchie Bros.

5

Table of Contents

Condensed Consolidated Statements of Cash Flows

(Expressed in thousands of United States dollars)

(Unaudited)

Six months ended June 30, 


2022


2021

Cash provided by (used in):


Operating activities:


Net income

$

231,512

$

88,920

Adjustments for items not affecting cash:


Depreciation and amortization


48,523


43,005

Share-based payments expense


21,527


16,183

Deferred income tax expense


9,480


1,719

Unrealized foreign exchange gain


(1,965)


(65)

Gain on disposition of property, plant and equipment


(170,167)


(243)

Loss on redemption of the 2021 Notes

4,792

Amortization of debt issuance costs


2,352


1,443

Amortization of right-of-use assets

8,586

6,280

Change in fair value of derivatives

(1,263)

Other, net


2,805


1,568

Net changes in operating assets and liabilities


41,844


52,577

Net cash provided by operating activities


198,026


211,387

Investing activities:


Acquisitions, net of cash acquired


(63)


728

Property, plant and equipment additions


(4,522)


(4,616)

Proceeds on disposition of property, plant and equipment


165,132


342

Intangible asset additions


(15,730)


(17,361)

Issuance of loans receivable

(6,093)

(2,622)

Repayment of loans receivable

1,554

226

Net cash provided by (used in) investing activities


140,278


(23,303)

Financing activities:


Dividends paid to stockholders


(55,352)


(48,537)

Dividends paid to NCI


(26)

Proceeds from exercise of options and share option plans


2,862


10,699

Payment of withholding taxes on issuance of shares


(3,716)


(9,155)

Net increase (decrease) in short-term debt

2,722

6,842

Repayment of long-term debt

(1,093,772)

(5,328)

Debt issue costs


(3,677)


Repayment of finance lease obligations


(5,390)


(5,355)

Net cash used in financing activities


(1,156,323)


(50,860)

Effect of changes in foreign currency rates on cash, cash equivalents, and restricted cash


(12,773)


(1,396)

(Decrease) Increase


(830,792)


135,828

Beginning of period


1,362,452


306,895

Cash, cash equivalents, and restricted cash, end of period

$

531,660

$

442,723

See accompanying notes to the condensed consolidated financial statements.

Ritchie Bros.

6

Table of Contents

1.    General information

Ritchie Bros. Auctioneers Incorporated and its subsidiaries (collectively referred to as the “Company”, “Ritchie Bros.”, “we”, “us”, or “our”) provide a marketplace for insights, services and transaction solutions for commercial assets. The Company offers its customers end-to-end transaction solutions for used commercial and other durable assets through its omnichannel platform, which includes auctions, online marketplaces, listing services, and private brokerage services. The Company also offers a wide array of value-added services connected to commercial assets as well as asset management software and data as a service solutions to help customers make more accurate and reliable business decisions. Ritchie Bros. Auctioneers Incorporated is a company incorporated in Canada under the Canada Business Corporations Act, whose shares are publicly traded on the Toronto Stock Exchange (“TSX”) and the New York Stock Exchange (“NYSE”).

2.    Significant accounting policies

(a) Basis of preparation

These unaudited condensed consolidated interim financial statements have been prepared in accordance with United States generally accepted accounting principles (“US GAAP”). They include the accounts of Ritchie Bros. Auctioneers Incorporated and its subsidiaries from their respective dates of formation or acquisition. All significant intercompany balances and transactions have been eliminated.

Certain information and footnote disclosure required by US GAAP for complete annual financial statements have been omitted and, therefore, these unaudited condensed consolidated interim financial statements should be read in conjunction with the Company’s audited consolidated financial statements for the year ended December 31, 2021, included in the Company’s Annual Report on Form 10-K, filed with the Securities and Exchange Commission (“SEC”). These unaudited condensed consolidated interim financial statements follow the same accounting policies and methods of application as our most recent annual audited consolidated financial statements except as described in Note 2(b) “ New and amended accounting standards and accounting policies”. In the opinion of management, these unaudited condensed consolidated interim financial statements reflect all adjustments, consisting of normal recurring adjustments, which are necessary to present fairly, in all material respects, the Company’s consolidated financial position, results of operations, cash flows and changes in equity for the interim periods presented. The preparation of financial statements in conformity with US GAAP requires management to make estimates and assumptions that affect the amounts reported in the financial statements and accompanying notes. Actual results could differ from those estimates.

On February 24, 2022, the geopolitical situation in Eastern Europe intensified with Russia’s invasion of Ukraine, sharply affecting economic and global financial markets. Subsequent economic sanctions of Russia have exacerbated ongoing economic challenges, including issues such as rising inflation and global supply chain disruption. The Company does not have any direct or significant operations in Russia or Ukraine, or any material operations in neighboring countries and only has limited number of direct customers in the effected region. The extent of the ongoing impacts of the conflict on our operational and financial performance, the impact of higher fuel costs globally adding to inflationary pressures, including our ability to execute on our business strategies and initiatives and sustain our operations in Europe and globally, will depend on future developments, including the continued evolvement of military activity and sanctions imposed with Russia’s invasion of Ukraine. Given the evolving nature of the crisis, the Company cannot currently reasonably estimate the impacts of the conflict on its business operations, results of operations, cash flows or financial performance.

Reclassification

Certain amounts in the prior period financial statements have been reclassified from selling, general and administrative expenses to cost of services for certain employee costs related to equipment inspections to conform to the presentation of the current period financial statements.

Ritchie Bros.

7

Table of Contents

2.    Significant accounting policies (continued)

(b) New and amended accounting standards and accounting policies

New accounting policies

Sale and leaseback

The transfer of the asset shall not be accounted for as a sale if the leaseback would be classified as a finance lease or a sales-type lease. For sale and leaseback transactions, the Company applies the requirements of ASC 606 Revenue from Contracts with Customers to determine whether the transfer of the asset should be accounted for as a sale and applies ASC 842 Leases when accounting for the sale and leaseback transactions. If the transfer of the asset is a sale, the Company derecognizes the underlying asset and recognizes the gain on sale of property, plant and equipment. The Company recognizes a lease obligation arising from the leaseback and the corresponding ROU asset. If the fair value of the consideration for the sale of an asset does not equal the fair value of the asset, or if the payments for the lease are not at market rates, the Company will make adjustments to measure the sale proceeds at fair value. Any below-market terms are accounted for as a prepayment of lease payments and any above- market terms are accounted for as additional financing provided by the buyer-lessor. If the transaction does not qualify for sale and leaseback accounting treatment, and control of the asset has not transferred, then the asset is not derecognized, and no gain or loss is recorded as the transaction is accounted for as a financing transaction.

New and amended accounting standards

In October 2021, the FASB issued ASU 2021-08, Business Combinations (Topic 805): Accounting for Contract Assets and Contract Liabilities from Contracts with Customers. The update primarily addresses the accounting for contract assets and contract liabilities from revenue contracts with customers acquired in a business combination. The update requires that an acquirer recognize and measure contract assets and contract liabilities acquired in a business combination in accordance with ASC 606 - Revenue from Contracts with Customers, whereas prior to the adoption of the update, contract assets acquired and contract liabilities assumed in a business combination were recognized at fair value on the acquisition date. The amendments in this update are effective for fiscal years beginning after December 15, 2022, including interim periods within those fiscal years. Early adoption of the amendments is permitted, including adoption in an interim period. An entity that early adopts in an interim period should apply the amendments (1) retrospectively to all business combinations for which the acquisition date occurs on or after the beginning of the fiscal year that includes the interim period of early application and (2) prospectively to all business combinations that occur on or after the date of initial application. The Company has early adopted the update as of October 1, 2021 and therefore has applied the amendments to all acquisitions completed since January 1, 2021, which includes only the acquisition of SmartEquip, which was completed on November 2, 2021.

3.    Significant judgments, estimates and assumptions

The preparation of financial statements in conformity with US GAAP requires management to make judgments, estimates and assumptions that affect the reported amounts of assets and liabilities and the disclosure of contingent liabilities at the date of the financial statements, and the reported amounts of revenues and expenses during the reporting period.

Future differences arising between actual results and the judgments, estimates and assumptions made by the Company at the reporting date, or future changes to estimates and assumptions, could necessitate adjustments to the underlying reported amounts of assets, liabilities, revenues and expenses in future reporting periods.

Judgments, estimates and underlying assumptions are evaluated on an ongoing basis by management and are based on historical experience and other factors, including expectations of future events that are believed to be reasonable under the circumstances. However, existing circumstances and assumptions about future developments may change due to market changes or circumstances and such changes are reflected in the assumptions when they occur.

Significant items subject to estimates and judgments during the six months ended June 30, 2022 were made in accounting for the completed sale and leaseback transaction of our Bolton property (Note 15 & Note 21). The Company determined the following estimates in calculating the gain on sale: the present value of market rental payments of the Bolton property sold, the expected lease term in the leaseback arrangement and the Company’s incremental borrowing rate based on information available at the commencement date of the lease.

Ritchie Bros.

8

Table of Contents

4.    Seasonality

The Company’s operations are both seasonal and event driven. Revenue tends to be the highest during the second and fourth calendar quarters as the Company generally conducts more auctions during these quarters. Volumes tend to also be lower during the third quarter, as supply of used equipment is lower as it is actively being used and not available for sale. Late December through mid-February and mid-July through August are traditionally less active periods.

5.   Business combinations

(a)SmartEquip acquisition

On November 2, 2021, the Company acquired all of the issued and outstanding common shares of SmartEquip for a total cash purchase price of $173,743,000. During the first quarter of 2022, the Company finalized the net working capital adjustment under the purchase agreement and increased the purchase price by $63,000, resulting in a total purchase price of $173,806,000.

SmartEquip is an innovative technology platform that supports customers' management of the equipment lifecycle and integrates parts procurement with both original equipment manufacturers and dealers.

The acquisition was accounted for in accordance with ASC 805, Business Combinations. The following table summarizes the preliminary allocation of the purchase price to the fair value of assets acquired and liabilities assumed.

SmartEquip purchase price allocation

Purchase price

$

173,806


Assets acquired:


Cash and cash equivalents

$

2,039

Trade and other receivables


2,926

Other current assets

486

Property, plant and equipment


120

Other non-current assets


75

Deferred tax assets


8,932

Intangible assets


71,700


Liabilities assumed:


Trade and other liabilities


1,239

Deferred revenue

3,565

Other non-current liabilities

119

Deferred tax liabilities


18,192

Fair value of identifiable net assets acquired


63,163

Goodwill acquired on acquisition

$

110,643

The deferred tax assets are presented net of a $1,486,000 valuation allowance. 

The following table summarizes the fair values of the identifiable intangible assets acquired:

Fair value

Weighted average

Asset

at acquisition

amortization period

Customer relationships

$

50,700

4 - 15 years

Software and technology assets

18,900

7 years

Trade names and trademarks

1,000

3 years

Backlog

1,100

2 years

Total

$

71,700

11.3 years

Ritchie Bros.

9

Table of Contents

5.   Business combinations (continued)

SmartEquip purchase price allocation (continued)

The amounts included in the SmartEquip provisional purchase price allocation are preliminary in nature and are subject to adjustment as additional information is obtained about the facts and circumstances that existed at the date of the acquisition. The final determination of the fair values of certain assets and liabilities will be completed within the measurement period of up to one year from the acquisition date. Adjustments to the preliminary values during the measurement period may impact the amounts recorded as assets and liabilities with a corresponding adjustment to goodwill and will be recognized in the period in which the adjustments are determined.

Goodwill

Goodwill has been assigned and allocated to “Other” for segmented information purposes and is based on an analysis of the fair value of net assets acquired. Goodwill relates to benefits expected from the acquisition of SmartEquip’s business, its assembled workforce and associated technical expertise, as well as anticipated synergies from applying the Company’s auction expertise and transactional capabilities to SmartEquip’s existing customer base. The transaction is considered a non-taxable business combination and the goodwill is not deductible for tax purposes.

Transactions recognized separately from the acquisition of assets and assumptions of liabilities

At the date of acquisition, the Company issued 63,971 common shares to certain previous shareholders of SmartEquip in return for their continuing employment service. The common shares are expected to vest one third on each anniversary date of the acquisition over a three-year period as continuing employment services are provided to the Company. At the date of acquisition, the Company estimated that it will recognize a total fair value of $4,375,000 share-based continuing employment costs in acquisition-related costs over the vesting period, with an increase to additional paid-in capital, subject to continuing employment of those individuals. As and when the common shares vest, the Company will recognize the fair value of the issued common shares from additional paid-in capital to share capital (Note 19).

During the quarter ended June 30, 2022, the Company recorded $668,000 of acquisition-related costs, all of which related to share-based continuing employment costs.

(b)Euro Auctions acquisition

On August 9, 2021, the Company entered into a Sale and Purchase Agreement (“SPA”) pursuant to which it agreed to purchase Euro Auctions Limited, William Keys & Sons Holdings Limited, Equipment & Plant Services Ltd, and Equipment Sales Ltd. (collectively, “Euro Auctions”), each being a private limited company incorporated in Northern Ireland (the “Euro Auctions Acquisition”).

Under the terms of the SPA, the Company was to acquire all of the outstanding shares of Euro Auctions from their existing shareholders for approximately £775,000,000 (approximately $1.02 billion) cash consideration, to be paid on closing. On April 29, 2022, the Company made a decision to discontinue the Phase 2 review by the United Kingdom’s Competition and Markets Authority (“CMA”). The SPA automatically terminated on June 28, 2022. In addition, in April 2022, the Company terminated, without cost, its deal contingent forward currency contracts (Note 13) and on May 4, 2022, redeemed all of the 2021 Notes (Note 17) at a redemption price equal to 100% of the original offering price of the notes, plus accrued and unpaid interest..

Ritchie Bros.

10

Table of Contents

6.    Segmented information

The Company’s principal business activity is the management and disposition of used industrial equipment and other durable assets. The Company’s operations are comprised of one reportable segment and other business activities that are not reportable as follows:

Auctions and Marketplaces – This is the Company’s only reportable segment, which consists of the Company’s live onsite auctions, its online auctions and marketplaces, and its brokerage service;
Other includes the results of Ritchie Bros. Financial Services (“RBFS”), Rouse, Mascus online services, SmartEquip, and the results from various value-added services and make-ready activities, including the Company’s equipment refurbishment services, and Ritchie Bros. Logistical Services (“RB Logistics”).

Three months ended June 30, 2022

Six months ended June 30, 2022


A&M


Other


Consolidated


A&M


Other


Consolidated

Service revenue:

Commissions

$

136,403

$

$

136,403

$

252,778

$

$

252,778

Fees

98,588

51,511

150,099

183,217

95,368

278,585

Total service revenue

234,991

51,511

286,502

435,995

95,368

531,363

Inventory sales revenue


198,044


198,044


347,104


347,104

Total revenue

$

433,035

$

51,511

$

484,546

$

783,099

$

95,368

$

878,467

Costs of services


28,985


16,054


45,039


54,559


29,495


84,054

Cost of inventory sold


176,171


176,171


307,753


307,753

Selling, general and administrative


125,535


18,742


144,277


234,346


36,537


270,883

Segment profit

$

102,344

$

16,715

$

119,059

$

186,441

$

29,336

$

215,777

Acquisition-related costs


3,399


13,036

Depreciation and amortization


24,298


48,523

Foreign exchange gain


(158)


(322)

Total operating expenses

$

393,026

723,927

Gain on disposition of property, plant and equipment


347


170,167

Operating income


$

91,867


$

324,707

Interest expense


(18,463)


(39,149)

Change in fair value of derivatives

1,263

Other income, net


1,639


2,559

Income tax expense


(21,632)


(57,868)

Net income


$

53,411


$

231,512

Three months ended June 30, 2021

Six months ended June 30, 2021


A&M


Other


Consolidated


A&M


Other


Consolidated

Service revenue:

Commissions

$

129,334

$

$

129,334

$

233,309

$

$

233,309

Fees

83,334

40,080

123,414

151,430

74,039

225,469

Total service revenue

212,668

40,080

252,748

384,739

74,039

458,778

Inventory sales revenue


143,613


143,613


269,138


269,138

Total revenue

$

356,281

$

40,080

$

396,361

$

653,877

$

74,039

$

727,916

Costs of services


25,176


16,125


41,301


49,480


29,687


79,167

Cost of inventory sold


131,023


131,023


241,770


241,770

Selling, general and administrative


99,215


10,345


109,560


201,996


21,803


223,799

Segment profit

$

100,867

$

13,610

$

114,477

$

160,631

$

22,549

$

183,180

Acquisition-related costs


3,049


5,971

Depreciation and amortization


21,935


43,005

Foreign exchange loss


151


428

Total operating expenses

$

307,019

594,140

Gain on disposition of property, plant and equipment


175


243

Operating income


$

89,517


$

134,019

Interest expense


(8,867)


(17,813)

Other income, net


1,196


2,198

Income tax expense


(21,065)


(29,484)

Net income


$

60,781


$

88,920

Ritchie Bros.

11

Table of Contents

6.    Segmented information (continued)

The Chief Operating Decision Maker does not evaluate the performance of the Company’s operating segments or assess allocation of resources based on segment assets and liabilities, nor does the Company classify liabilities on a segmented basis.

The Company’s geographic breakdown of total revenue and location is as follows:

United 


Total revenue for the three months ended:

States

Canada

Australia

Europe

Other

Consolidated

June 30, 2022

$

215,466

$

143,466

$

71,734

$

36,989

$

16,891

$

484,546

June 30, 2021

183,391


98,690

44,514


55,467


14,299


396,361

Total revenue for the six months ended:


June 30, 2022

$

463,416

$

208,699

$

100,809

$

74,809

$

30,734

$

878,467

June 30, 2021

390,805


147,168

64,077


102,643


23,223


727,916

7.    Revenue

The Company’s revenue from the rendering of services is as follows:

Three months ended

Six months ended


June 30, 

June 30, 


2022

2021

2022

2021

Service revenue:


Commissions

$

136,403

$

129,334

$

252,778

$

233,309

Fees


150,099


123,414


278,585


225,469


286,502


252,748


531,363


458,778

Inventory sales revenue


198,044


143,613


347,104


269,138

$

484,546

$

396,361

$

878,467

$

727,916

Ritchie Bros.

12

Table of Contents

8.    Operating expenses

Costs of services

Three months ended

Six months ended

June 30, 

June 30, 


2022


2021


2022


2021

Employee compensation expenses

$

17,045

$

14,953

$

32,966

$

29,483

Ancillary and logistical service expenses

13,446


14,819

24,201


27,088

Travel, advertising and promotion expenses

7,200


5,299

12,372


9,817

Other costs of services

4,323


3,926

7,636


7,774

Buildings, facilities and technology expenses

3,025


2,304

6,879


5,005

$

45,039

$

41,301

$

84,054

$

79,167

Selling, general and administrative

Three months ended

Six months ended

June 30, 


June 30, 


2022


2021


2022


2021

Wages, salaries and benefits

$

84,301

$

67,932

$

161,787

$

144,889

Share-based compensation expense

13,640

7,540

19,026

11,318

Buildings, facilities and technology expenses


23,327


17,479


43,412


34,822

Travel, advertising and promotion expenses


9,392


6,824


17,366


11,986

Professional fees


7,616


5,202


17,363


10,234

Other selling, general and administrative


6,001


4,583


11,929


10,550

$

144,277


$

109,560

$

270,883

$

223,799

Acquisition-related costs

Three months ended

Six months ended

June 30, 

June 30, 


2022


2021


2022


2021

SmartEquip:

Share-based continuing employment costs

$

668

$

$

1,326

$

Other acquisition-related costs

516

Euro Auctions:

Other acquisition-related costs

1,317

8,012

Rouse:

Share-based continuing employment costs

1,414

2,678

2,887

5,231

Other acquisition-related costs

371

295

740

$

3,399

$

3,049

$

13,036


$

5,971

Depreciation and amortization

Three months ended

Six months ended

June 30, 


June 30, 


2022


2021


2022


2021

Depreciation

$

7,889

$

8,345

$

15,636

$

16,182

Amortization


16,409


13,590


32,887


26,823

$

24,298

$

21,935

$

48,523

$

43,005

Ritchie Bros.

13

Table of Contents

9.    Income taxes

At the end of each interim period, the Company estimates the effective tax rate expected to be applicable for the full fiscal year. The estimate reflects, among other items, management’s best estimate of operating results. It does not include the estimated impact of foreign exchange rates or unusual and/or infrequent items, which may cause significant variations in the customary relationship between income tax expense and income before income taxes.

For the three months ended June 30, 2022, income tax expense was $21,632,000, compared to an income tax expense of $21,065,000 for the same period in 2021. The effective tax rate was 29% in the second quarter of 2022, compared to 26% in the second quarter of 2021. The effective tax rate increased in the three months ended June 30, 2022 compared to the three months ended June 30, 2021 primarily due to higher return to provision adjustments and higher income taxes related to tax uncertainties. Partially offsetting this increase was a lower estimate of non-deductible expenses.

For the six months ended June 30, 2022, income tax expense was $57,868,000, compared to an income tax expense of $29,484,000 for the same period in 2021. The effective tax rate was 20% for the six months ended June 30, 2022, compared to 25% for the six months ended June 30, 2021. The effective tax rate decreased in the six months ended June 30, 2022 compared to the six months ended June 30, 2021 primarily due to the non-taxable gain portion on the sale of a parcel of land including all buildings in Bolton, Ontario and a decrease in the estimate of non-deductible expenses.

Partially offsetting this decrease was a higher estimate of income taxed in jurisdictions with higher tax rates and a lower tax deduction for performance share units (“PSUs”) and restricted share units (“RSUs”) expenses that exceeded the related compensation expense.

The Canada Revenue Agency (“CRA”) is currently conducting an audit of the Company’s 2014, 2015, 2017, and 2018 taxation years. Management believes that the Company is in full compliance with Canadian tax laws. However, the CRA could challenge the manner in which the Company has filed its income tax returns and reported its income. In the event that the CRA challenges the manner in which the Company has filed its tax returns and reported its income, the Company will have the option to appeal any such decision. If the Company is not successful, however, the CRA audit could potentially result in additional income taxes, penalties, and interest, which could have a material adverse effect on the Company.

Ritchie Bros.

14

Table of Contents

10.    Earnings per share attributable to stockholders

Basic earnings per share (“EPS”) attributable to stockholders was calculated by dividing the net income attributable to stockholders by the weighted average (“WA”) number of common shares outstanding during the period. Diluted EPS attributable to stockholders was calculated by dividing the net income attributable to stockholders by the weighted average number of shares of common stock outstanding if the potentially dilutive securities had been issued. Potentially dilutive securities include unvested PSUs, unvested RSUs, and outstanding stock options. The dilutive effect of potentially dilutive securities is reflected in diluted EPS by application of the treasury stock method. Under the treasury stock method, an increase in the fair market value of the Company’s common stock can result in a greater dilutive effect from potentially dilutive securities.

Three months ended

Six months ended

June 30, 2022

June 30, 2022

Net income

WA

Per

Net income

WA

Per


attributable to


number


share

attributable to


number


share


stockholders


of shares


amount

stockholders


of shares


amount

Basic

$

53,365


110,760,339

$

0.48

$

231,459


110,705,182

$

2.09

Effect of dilutive securities:


Share units


397,274


423,767


(0.01)

Stock options


547,489


552,695


(0.01)

Diluted

$

53,365


111,705,102

$

0.48

$

231,459


111,681,644

$

2.07

Three months ended

Six months ended

June 30, 2021

June 30, 2021

Net income

WA

Per

Net income

WA

Per


attributable to


number


share

attributable to


number


share


stockholders


of shares


amount


stockholders


of shares


amount

Basic

$

60,749

110,311,615

$

0.55

$

88,937


110,144,229

$

0.81

Effect of dilutive securities:


Share units

322,371


450,752


Stock options

700,198


707,730


(0.01)

Diluted

$

60,749

111,334,184

$

0.55

$

88,937


111,302,711

$

0.80

Ritchie Bros.

15

Table of Contents

11.    Supplemental cash flow information

Net changes in operating assets and liabilities

Six months ended June 30, 

2022

2021

Trade and other receivables


$

(152,893)


$

(134,522)

Inventory

(25,842)

(2,207)

Advances against auction contracts

(11,238)

(761)

Prepaid expenses and deposits

20,774

3,157

Income taxes receivable

6,985

(3,847)

Auction proceeds payable

205,910

230,309

Trade and other liabilities

(22,639)

(20,686)

Income taxes payable

25,866

(12,723)

Operating lease obligation

(6,936)

(6,329)

Other

1,857

186

Net changes in operating assets and liabilities


$

41,844


$

52,577

Interest and tax payments

Six months ended June 30, 

2022

2021

Interest paid, net of interest capitalized


$

20,846


$

16,387

Interest received

1,415

635

Net income taxes paid

13,855

43,249

Non-cash purchase of property, plant and equipment under finance lease


5,261


4,568

Non-cash right of use assets obtained in exchange for new lease obligations


18,472


9,451

Cash, cash equivalents, and restricted cash

June 30, 

December 31, 

2022

2021

Cash and cash equivalents


$

367,289

$

326,113

Restricted cash

Current

164,371

102,875

Non-current

933,464

Cash, cash equivalents, and restricted cash


$

531,660

$

1,362,452

12.    Fair value measurement

All assets and liabilities for which fair value is measured or disclosed in the consolidated financial statements are categorized within the fair value hierarchy, described as follows, based on the lowest level input that is significant to the fair value measurement or disclosure:

Level 1: Unadjusted quoted prices in active markets for identical assets or liabilities that the entity can access at measurement date;
Level 2: Inputs other than quoted prices included in Level 1 that are observable for the asset or liability, either directly or indirectly; and
Level 3: Unobservable inputs for the asset or liability.

Ritchie Bros.

16

Table of Contents

12.    Fair value measurement (continued)

June 30, 2022

December 31, 2021

Carrying

Carrying


Category


amount


Fair value


amount


Fair value

Fair values disclosed:


Cash and cash equivalents


Level 1

$

367,289

$

367,289

$

326,113

$

326,113

Restricted cash


Level 1


164,371


164,371


1,036,339


1,036,339

Loans receivable

Level 2

11,749

11,678

7,267

7,267

Derivative financial assets

Deal contingent forward contract

Level 3

751

751

Forward currency contracts

Level 2

37

37

Derivative financial liabilities

Deal contingent forward contract

Level 3

2,005

2,005

Short-term debt


Level 2


8,637


8,637


6,147


6,147

Long-term debt


Senior unsecured notes (as defined in Note 17)


2016 Notes

Level 1

495,434

489,800

494,531

508,125

2021 USD Notes

Level 2

598,052

625,125

2021 CAD Notes

Level 2

332,337

339,100

Term loan

Level 2

91,989

92,348

92,821

93,226

Long-term revolver loans


Level 2


56,949


57,000


219,699


219,772

The carrying value of the Company’s cash and cash equivalents, restricted cash, trade and other receivables, advances against auction contracts, loan receivables maturing within a year, auction proceeds payable, trade and other payables, and short-term debt approximate their fair values due to their short terms to maturity. The fair value of the loan receivables with a maturity date greater than one year are determined by estimating discounted cash flows using market rates. The carrying values of the term loan and long-term revolver loan, before deduction of deferred debt issue costs, approximate their fair values as the interest rates on the loans is short-term in nature. The fair values of the senior unsecured notes are determined by reference to a quoted market price of the notes traded in an over-the-counter broker market.

The Company holds derivative financial assets and liabilities that are required to be measured at fair value on a recurring basis. The fair values of the deal contingent forward contracts were determined using a probability weighted mark to market valuation and observable Level 2 inputs, including foreign currency spot exchange rates, forward pricing curves, and an unobservable Level 3 input, the expected date of settlement. The change in the valuation of the derivatives due to the range of possible expected settlement dates was not significant to the financial statements. The fair value of the forward currency contracts are determined using observable Level 2 inputs, including foreign currency spot exchange rates and forward pricing curves. The fair value considers the credit risk of the Company and its counterparties.

13. Derivative financial instruments

The Company’s derivative financial instruments are accounted for as derivatives under ASC 815, Derivatives and Hedging, and are classified in other current assets and other current liabilities. The Company has not applied hedge accounting to these instruments.

The Company enters into forward currency contracts from time to time to manage its exposure to foreign currency exchange rate fluctuations recognized by its subsidiaries on specific monetary loan receivables. During the three and six month periods ended June 30, 2022, a loss of $1,866,000 and $1,296,000 respectively was recognized for the change in fair values of the forward currency contracts within foreign exchange loss (gain) in the consolidated income statement.

The Company also held two deal contingent foreign exchange forward currency contracts to manage its exposure to foreign currency exchange rate fluctuations against the U.S. and Canadian dollar on £343,000,000 of the £775,000,000 purchase consideration for the proposed Euro Auctions Acquisition. The notional amounts of the derivative instruments were £216,000,000 (U.S. dollar forward) and £127,000,000 (Canadian dollar forward). These forward contracts were terminated by the Company in April 2022 at no cost.

Ritchie Bros.

17

Table of Contents

14. Trade and other receivables

Trade receivables are generally secured by the equipment that they relate to as it is Company policy that equipment is not released until payment has been collected. The following table presents the activity in the allowance for expected credit losses for the period ended June 30, 2022:

Balance at December 31, 2021


$

(4,396)

Current period provision


(120)

Write-offs charged against the allowance


753

Balance at June 30, 2022

$

(3,763)

15.    Other current assets

June 30, 

December 31, 


2022


2021

Advances against auction contracts

$

14,783

$

4,102

Assets held for sale


323


17,538

Prepaid expenses and deposits


21,069


41,955

Derivative financial asset

37

751

$

36,212

$

64,346

Assets held for sale

Balance at December 31, 2021


$

17,538

Reclassified from (to) property, plant and equipment


(10,148)

Disposal


(7,067)

Balance at June 30, 2022

$

323

On March 17, 2022, the Company completed the sale and leaseback of a parcel of land including all buildings, in Bolton, Ontario, for a total sale consideration of $208,195,000 Canadian dollars (approximately $165 million) net of closing and transaction costs, and recognized a gain on disposition of property, plant and equipment of $169,092,000. The net book value of the Bolton property was $7,067,000. The payments for the lease were not considered to be at market rates given an initial two year rent free period and, accordingly, the Company adjusted the sales proceeds and the gain to fair value. The Bolton property continues to be used for auction operations under the operating leaseback agreement until the completion of the acquisition and development of a replacement property located in Amaranth, Ontario. (Note 21)

As at December 31, 2021, the Company also classified vacant land in Casa Grande, Arizona with a net book value of $10,500,000 as an asset held for sale. During the quarter ended June 30, 2022, the Company assessed that the property no longer met the asset held for sale criteria and therefore reclassified the net book value of the property to property, plant and equipment.

16.    Other non-current assets

June 30, 

December 31, 


2022


2021

Right-of-use assets

$

134,219

$

114,414

Tax receivable

10,641

10,289

Loans receivable

7,199

Deferred debt issue costs


4,223


5,236

Other


12,078


12,565

$

168,360

$

142,504

The Company recognized a right-of-use asset of $16,587,000 as a result of the sale and leaseback transaction on the Bolton property in March 2022 (Note 15 and 21) and recognized a right-of-use asset of $9,020,000 as a result of a new lease signed on an auction site in Maltby, United Kingdom in June 2022 (Note 21).

Ritchie Bros.

18

Table of Contents

16.    Other non-current assets (continued)

Loans receivable

As at June 30, 2022, the Company held four financing lending arrangements that are fully collateralized and secured by certain equipment. These financing lending arrangements have a term of one to four years. In the event of default under these agreements, the Company will take possession of the equipment as collateral to recover its loans receivable balance. The loans receivable balance as at June 30, 2022 was $11,749,000, of which $4,550,000 is recorded in trade and other receivables and $7,199,000 in non-current loans receivable (December 31, 2021: $7,267,000, of which $7,267,000 was recorded in trade and other receivables and nil in non-current loans receivable). The expected credit loss allowance is not significant.

17.    Debt


Carrying amount

June 30, 

December 31, 


2022


2021

Short-term debt

$

8,637

$

6,147

Long-term debt:


Revolving facilities and delayed-draw term loan facility:


Delayed-draw term loan denominated in Canadian dollars, secured, bearing interest at a weighted average rate of 3.08%, due in monthly installments of interest only, maturing in September 2026


92,348


93,283

Long-term revolver loan denominated in Canadian dollars, secured, bearing interest at a weighted average rate of 2.29%, due in monthly installments of interest only, maturing in September 2026


-


46,206

Long-term revolver loan denominated in Canadian dollars, secured, bearing interest at a weighted average rate of 2.29%, due in monthly installments of interest only, maturing in September 2026


-


56,492

Long-term revolver loan denominated in U.S. dollars, secured, bearing interest at a weighted average rate of 2.53%, due in monthly installments of interest only, maturing in September 2026


57,000


117,000

Less: unamortized debt issue costs


(410)


(463)

Senior unsecured notes:


Bearing interest at 5.375% due in semi-annual installments, with the full amount of principal due in January 2025 (the "2016 Notes")


500,000


500,000

Less: unamortized debt issue costs


(4,566)


(5,469)

Bearing interest at 4.75% due in semi-annual installments, with the full amount of principal due in December 2031 (the "2021 USD Notes")

-

600,000

Less: unamortized debt issue costs

-

(1,948)

Bearing interest at 4.95% due in semi-annual installments, with the full amount of principal due in December 2029 (the "2021 CAD Notes")

-

333,464

Less: unamortized debt issue costs

-

(1,127)

Total long-term debt


644,372


1,737,438

Total debt

$

653,009

$

1,743,585

Long-term debt:


Current portion

$

4,617

$

3,498

Non-current portion


639,755


1,733,940

Total long-term debt

$

644,372

$

1,737,438

As at June 30, 2022, the Company had unused committed revolving credit facilities aggregating $673,459,000 that are available until September 2026 subject to certain covenant restrictions, unused uncommitted revolving credit facilities aggregating $5,000,000 that are available until October 2023, and unused uncommitted revolving credit facilities aggregating $5,000,000 with no maturity date. The Company was in compliance with all financial and other covenants applicable to the credit facilities at June 30, 2022.

Ritchie Bros.

19

Table of Contents

17.    Debt (continued)

Short-term debt

Short-term debt is comprised of drawings in different currencies on the Company’s committed revolving credit facilities and has a weighted average interest rate of 2.7% (December 31, 2021: 1.8%).

Long-term debt

a)Revolving facilities and delayed-draw term loan facility

During 2016, the Company entered into a credit agreement with a syndicate of lenders. The credit agreement is comprised of multicurrency revolving facilities (the “Revolving Facilities”) and a delayed-draw term loan facility (the “DDTL Facility”, together with the Revolving Facilities, the “Facilities”). The credit agreement was most recently amended in September 2021, which, among other things (i) extended the maturity date of the Facilities from October 27, 2023 to September 21, 2026, (ii) increased the total size of the Facilities provided under the Credit Agreement to up to $1,045,000,000, including $295,000,000 of commitments under the DDTL Facility, (iii) reduced the applicable margin for base rate loans and LIBOR loans at each pricing tier level, (iv) reduced the applicable percentage per annum used to calculate the commitment fee in respect of the unused commitments under the Facilities at each pricing tier level, and (v) included customary provisions to provide for the eventual replacement of LIBOR as a benchmark interest rate.

Immediately prior to the amendment, the aggregate principal amount outstanding under the DDTL Facility was $90,000,000 ($118,889,995 Canadian dollars). In connection with the amendment, the Company refinanced that amount with the proceeds from a borrowing under the DDTL Facility. Under the terms of the amendment, there are no mandatory principal repayments of borrowings under the DDTL Facility until the earlier of when the remaining $205,000,000 is drawn or the third quarter of 2022. The Company did not draw on the remaining $205,000,000 before it expired on June 28, 2022 and, therefore, mandatory principal repayments will begin in the third quarter of 2022. Once principal payments become mandatory, they are subject to an annual amortization rate of 5%, payable in quarterly installments, with the balance payable at maturity. As a result of the expiry of the DDTL Facility, the Company wrote off $710,000 of deferred debt issuance costs in the quarter recognized in non-current asset to interest expense.

As of June 30, 2022, the Company had unamortized deferred debt issue costs relating to the Facilities of $4,633,000.

b)Senior unsecured notes

2016 Notes

On December 21, 2016, the Company completed the offering of $500,000,000 aggregate principal amount of 5.375% senior unsecured notes due January 15, 2025 (the “2016 Notes”). Interest on the 2016 Notes is payable semi-annually. The 2016 Notes are jointly and severally guaranteed on an unsecured basis, subject to certain exceptions, by certain of the Company’s subsidiaries. IronPlanet, Rouse, SmartEquip, and certain of their respective subsidiaries were added as additional guarantors in connection with the acquisitions of IronPlanet, Rouse and SmartEquip, respectively.

2021 Notes

On December 21, 2021, the Company completed the offering of two series of senior notes: (i) $600,000,000 aggregate principal amount of 4.750% senior notes due December 15, 2031 (the “2021 USD Notes”) and (ii) $425,000,000 Canadian dollar aggregate principal amount of 4.950% senior notes due December 15, 2029 (the “2021 CAD Notes”, and together with the 2021 USD Notes, the “2021 Notes”).

The gross proceeds from the 2021 Notes offering together with certain additional amounts including prepaid interest were placed into escrow accounts and were expected to be held in escrow until the completion of the proposed Euro Auctions Acquisition. On May 4, 2022, the Company redeemed all of the 2021 Notes at a redemption price equal to 100% of the original offering price of the notes, plus accrued and unpaid interest. The Company was relieved of its obligations for the 2021 Notes upon redemption and therefore recognized the difference of $4,792,000 between the reacquisition price and the net carrying amount of the debt extinguished (which included unamortized deferred debt issuance costs) as a loss on redemption of the 2021 Notes in interest expense in the consolidated income statement.

Ritchie Bros.

20

Table of Contents

18.    Other non-current liabilities

June 30, 

December 31, 


2022


2021

Operating lease liability

$

118,737

$

109,882

Tax payable

19,657

18,859

Finance lease liability


13,458


13,983

Other


4,059


4,536

$

155,911

$

147,260

19.    Equity and dividends

Share capital

Common stock

Unlimited number of common shares, without par value.

Preferred stock

Unlimited number of senior preferred shares, without par value, issuable in series.

Unlimited number of junior preferred shares, without par value, issuable in series.

All issued shares are fully paid. No preferred shares have been issued.

Shares issued for business combinations

The Company has issued the following common shares in connection with the acquisitions of Rouse and SmartEquip. These shares were issued to certain previous unitholders and shareholders of Rouse and SmartEquip, based on the fair market value of the Company’s common shares at the acquisition date. The Company records share-based continuing employment costs in acquisition-related costs over the vesting period, with an increase to additional paid-in capital. The vesting of shares issued for business combinations is subject to continuing employment with the Company over various dates over a three year period from their respective acquisition dates. As and when the common shares vest, the Company will recognize the fair value of the issued common shares from additional paid-in capital to share capital.

Ritchie Bros.

21

Table of Contents

19.    Equity and dividends (continued)

Shares issued for business combinations (continued)

Rouse

SmartEquip

Total


Weighted average

Common

Fair value

Common

Fair value


Common

fair value

shares 

per common

shares 

per common


shares 

per common

issued


shares


issued


shares


issued


shares

Outstanding, December 31, 2021

189,665

$

71.09

63,971

$

68.39

253,636

$

70.41

Granted

Vested

(27,816)

71.09

(27,816)

71.09

Forfeited

Outstanding, June 30, 2022

161,849

$

71.09

63,971

$

68.39

225,820

$

70.33

Outstanding, December 31, 2020

312,193

$

71.09

$

312,193

$

71.09

Granted

Vested

Forfeited

(55,510)

71.09

(55,510)

71.09

Outstanding, June 30, 2021

256,683

$

71.09

$

256,683

$

71.09

In the three months ended June 30, 2022, the Company recognized $1,819,000 of share capital from additional paid-in capital for the portion of common shares previously issued in connection with the acquisition of Rouse that have vested as of June 30, 2022.

As at June 30, 2022, the unrecognized share-based continuing employment cost was $6,520,000 (June 30, 2021: $11,898,000), which is expected to be recognized over a weighted average period of 1.4 years.

Dividends

Declared and paid

The Company declared and paid the following dividends during the six months ended June 30, 2022 and 2021:


Dividend  


Total


Declaration date

per share

Record date

dividends

Payment date

Six months ended June 30, 2022:


Fourth quarter 2021

January 21, 2022

$

0.2500

February 11, 2022

$

27,659

March 4, 2022

First quarter 2022

May 6, 2022

0.2500

May 27, 2022

27,693

June 17, 2022

Six months ended June 30, 2021:


Fourth quarter 2020

January 22, 2021

$

0.2200

February 12, 2021

$

24,181

March 5, 2021

First quarter 2021

May 7, 2021

0.2200

May 26, 2021

24,279

June 16, 2021

Declared and undistributed

Subsequent to June 30, 2022, the Company’s Board of Directors declared a quarterly dividend of $0.27 cents per common share, payable on September 14, 2022 to stockholders of record on August 24, 2022. This dividend payable has not been recognized as a liability in the consolidated financial statements. The payment of this dividend is expected to not have any tax consequences for the Company.

Foreign currency translation reserve

Foreign currency translation adjustments within other comprehensive income include intra-entity foreign currency transactions that are of a long-term investment nature, which generated a net loss of $8,553,000 and $9,437,000 for the three and six months ended June 30, 2022 (2021: net gain of $1,095,000 and net loss of $2,559,000).

Ritchie Bros.

22

Table of Contents

20.    Share-based payments

Share-based payments consist of the following compensation costs:

Three months ended


Six months ended

June 30, 

June 30, 


2022


2021


2022


2021

Selling, general and administrative:


Stock option compensation expense

$

3,056

$

1,909

$

5,623

$

3,770

Equity-classified share units

8,801

4,404

11,691

7,557

Liability-classified share units

1,075

526

319

(1,389)

Employee share purchase plan - employer contributions


708


701


1,393


1,380

13,640

7,540

19,026

11,318

Acquisition-related costs:


Share-based continuing employment costs


2,080


2,678


4,213


5,231


2,080


2,678


4,213


5,231

$

15,720

$

10,218

$

23,239

$

16,549

Stock option plans

The Company has the following three stock option plans that provide for the award of stock options and premium-priced stock options to selected employees, directors, and officers of the Company: (i) Amended and Restated Stock Option Plan, (ii) IronPlanet 1999 Stock Plan, and (iii) IronPlanet 2015 Stock Plan.

Stock option activity for the six months ended June 30, 2022 is presented below:

Stock options

Premium-priced stock options

WA

WA

Common

WA

remaining

Aggregate

Common

WA

remaining

Aggregate

shares under

exercise

contractual

intrinsic

shares under

exercise

contractual

intrinsic

option


price


life (in years)


value


option


price


life (in years)


value

Outstanding, December 31, 2021

2,208,057

42.55

7.7

41,884

1,017,064

91.24

5.7

Granted

689,437

58.02


119,157

91.37

Exercised

(80,183)

35.70

1,964

Forfeited

(36,126)

42.85


(17,789)

90.93


Outstanding, June 30, 2022

2,781,185

46.58

7.8

51,797

1,118,432

91.26

5.2

Exercisable, June 30, 2022

1,307,090

37.42

6.5

36,130


Stock options

The Company uses the Black Scholes option pricing model to fair value stock options. Significant assumptions used to estimate the fair value of stock options granted during the six months ended June 30, 2022 and 2021 are presented in the following table on a weighted average basis:

Six months ended June 30, 


2022


2021


Risk free interest rate


2.2

%  

0.5

%

Expected dividend yield


1.74

%  

1.66

%

Expected lives of the stock options


4

years

4

years

Expected volatility


31.7

%  

32.3

%

At June 30, 2022, the unrecognized stock-based compensation cost related to the non-vested stock options was $11,746,000, which is expected to be recognized over a weighted average period of 2.4 years.

Ritchie Bros.

23

Table of Contents

20.    Share-based payments (continued)

Premium-priced stock options

The Company also grants premium-priced stock options to the senior executives with exercise prices above the fair market value of the Company’s common shares on grant dates. The premium-priced stock options vest and become exercisable upon the third anniversary of their grant date. The premium-priced stock options granted in August and November 2021 expire on the sixth anniversary of their grant date, and those granted in June 2022 expire in August 2027 to coincide with the expiry of the August 2021 grant. The fair values of the premium-priced stock options were calculated on the grant date using a Monte Carlo simulation model. The weighted average estimated grant date fair value of premium-priced options during the three month period ended June 30, 2022 was $8.00 per option.

The significant assumptions used to estimate the fair values were as follows:

Six months ended June 30, 


2022


2021

Risk free interest rate


3.0

%  

%  

Expected dividend yield


1.63

%  

%  

Expected lives of the stock options

4

years

years

Expected volatility


30.2

%  

%  

At June 30, 2022, the unrecognized stock-based compensation cost related to the premium-priced stock options was $7,380,000, which is expected to be recognized over a weighted average period of 2.4 years.

Share unit plans

Share unit activity for the six months ended June 30, 2022 is presented below:

Equity-classified awards

Liability-classified awards

PSUs

PSUs with Market Conditions

RSUs

DSUs

WA grant

WA grant

WA grant

WA grant

date fair

date fair

date fair

date fair


Number


value


Number


value


Number


value


Number


value

Outstanding at December 31, 2021


523,618

$

45.90

88,305

$

65.45

79,112

$

54.96


156,589

$

35.28

Granted


225,382


58.66

14,574


69.92

33,827


57.68


12,124


56.78

Vested and settled


(93,241)


36.42


(22,349)


46.01


Forfeited


(3,474)


51.04


(3,891)


61.55


Outstanding at June 30, 2022


652,285

$

51.64

102,879

$

66.08

86,699

$

58.03


168,713

$

36.82

The total market value of liability-classified share units vested and released during the first six months of 2022 was nil (as at December 31, 2021: nil).

Senior executive and employee PSU plans

The Company grants PSUs under a senior executive PSU plan and an employee PSU plan (the “PSU Plans”). Under the PSU Plans, the number of PSUs that vest is conditional upon specified market, service, and/or performance vesting conditions being met. The PSU Plans allow the Company to choose whether to settle the awards in cash or in shares. The Company intends to settle by issuance of shares. With respect to settling in shares, the Company has the option to either (i) arrange for the purchase of shares on the open market on the employee’s behalf based on the cash value that otherwise would be delivered, or (ii) issue a number of shares equal to the number of units that vest.

Fair values of equity-classified PSUs are estimated on grant date using the market close price of the Company's common shares listed on the NYSE, as these are not subject to market vesting conditions.

At June 30, 2022, the unrecognized share unit expense related to equity-classified PSU’s was $21,018,000, which is expected to be recognized over a weighted average period of 2.1 years.

Ritchie Bros.

24

Table of Contents

20.    Share-based payments (continued)

PSUs with market conditions

The Company also grants PSUs to senior executives with a market condition where vesting is conditional upon the total stockholder return performance of the Company’s stock relative to the performance of a peer group over a three year performance period from the date of grant. The PSUs granted in August and November 2021 have a three year performance period and the PSUs granted in June 2022 have approximately a 2 year performance period to coincide with the remaining performance period of the August 2021 grant. The fair value per PSU granted during the three month period ended June 30, 2022 of $69.92 was calculated on the grant date using the Monte Carlo simulation model which takes into consideration a required post-vesting holding period of one year with a discount value of $5.34 per PSU. The discount was calculated using the Chaffe Protective Put Method and an effective tax rate of 35%.

The significant assumptions used to estimate the fair value are presented in the following table:

Six months ended June 30, 


2022


2021

Risk free interest rate


2.7

%  

%  

Expected dividend yield


1.63

%  

%  

Expected lives of the PSUs

2

years

years

Expected volatility


33.4

%  

%  

Average expected volatility of comparable companies

34.4

%  

%  

At June 30, 2022, the unrecognized share unit expense related to equity-classified PSUs with market conditions was $5,062,000, which is expected to be recognized over a weighted average period of 2.1 years.

RSUs

The Company has restricted share unit plans (RSU plans) that are equity-settled and not subject to market vesting conditions.

Fair values of RSUs are estimated on grant date using the market close price of the Company's common shares listed on the NYSE.

At June 30, 2022, the unrecognized share unit expense related to equity-classified RSUs was $2,849,000, which is expected to be recognized over a weighted average period of 1.6 years.

DSUs

The Company has deferred share unit plans (DSU plans) that are cash-settled and not subject to market vesting conditions.

Fair values of deferred share units (“DSUs”) are estimated on grant date and at each reporting date using the market close price of the Company’s common shares listed on the NYSE. DSUs are granted under the DSU plan to members of the Board of Directors. There is no unrecognized share unit expense related to liability-classified DSUs as they vest immediately and are expensed upon grant.

At June 30, 2022, the Company had a total share unit liability of $10,976,000 (as at December 31, 2021: $10,056,000) in respect of share units under the DSU plans.

Employee share purchase plan

The Company has an employee share purchase plan that allows all employees that have completed two months of service to contribute funds to purchase common shares at the current market value at the time of share purchase. Employees may contribute up to 4% of their salary. The Company will match between 50% and 100% of the employee’s contributions, depending on the employee’s length of service with the Company.

Ritchie Bros.

25

Table of Contents

21.    Leases

The Company enters into commercial leases for various auctions sites and offices, the majority of which are non-cancellable, and additional operating leases for computer equipment, motor vehicles and small office equipment. The majority of the Company’s operating leases have a fixed term with a remaining life between one month and 18 years, with renewal options included in the contracts. The leases have varying contract terms, escalation clauses and renewal options.

The Company also enters into finance lease arrangements for certain vehicles, computer and yard equipment and office furniture, the majority of these leases have a fixed term with a remaining life of one month to six years with renewal options included in the contracts.

On March 17, 2022, the Company completed the sale and leaseback of its Bolton property, a parcel of land including all buildings, in Bolton, Ontario (Note 15). The Company intends to lease the Bolton property for a period of 28 months until such time that the replacement property is available for the relocation of the Company’s operations. The lease has an initial rent-free period of two years and an option to renew the lease for two additional one-year periods, during which time the lease is cancellable at one month’s notice. Upon completion of the sale, the Company recorded a $16,587,000 ROU asset representing the right-of-use of the Bolton property for the estimated lease term and a $4,477,000 long term lease liability representing the obligation to make lease payments arising from the operating lease at the end of the initial two-year period.

On June 30, 2022, the Company also recorded $9,020,000 in ROU asset and long term lease liability relating to a lease signed on its Maltby auction site in the United Kingdom.

The Company’s breakdown of lease expense is as follows:

Three months ended

Six months ended

June 30, 

June 30, 

2022

2021

2022

2021

Operating lease cost

$

6,229

$

4,392

$

10,940

$

8,992

Finance lease cost


Amortization of leased assets


2,616

2,815


5,248

5,403

Interest on lease liabilities


186

205


360

426

Short-term lease cost


2,901

1,922


6,364

4,583

Sublease income


(15)


(30)

$

11,932

$

9,319

$

22,912

$

19,374

22.    Commitments

Commitment for inventory purchases

The Company was awarded two new contracts with the United States Government Defense Logistics Agency (the “DLA”) on April 1, 2021. The new contracts (one for the Eastern portion of the United States and one for the Western portion of the United States) cover both surplus non-rolling and rolling stock. Both contracts commenced on June 1, 2021 and have a base term of two years with three one-year renewal options. 

During the first two years of the contracts, the Company is committed to purchase on a combined basis up to either: (i) 600,000 assets, or (ii) assets with an expected minimum value of up to $77,000,000; whichever is less. At June 30, 2022, the Company has purchased 263,503 assets with a total value of $54,520,000 pursuant to the two year period of this contract, which commenced on June 1, 2021.

Ritchie Bros.

26

Table of Contents

23.    Contingencies

Legal and other claims

The Company is subject to legal and other claims that arise in the ordinary course of its business. Management does not believe that the results of these claims will have a material effect on the Company’s consolidated balance sheet or consolidated income statement.

Guarantee contracts

In the normal course of business, the Company will in certain situations guarantee to a consignor a minimum level of proceeds in connection with the sale at auction of that consignor’s equipment.

At June 30, 2022, there were $30,791,000 of assets guaranteed under contract, of which 88% is expected to be sold prior to September 30, 2022, with the remainder to be sold by December 31, 2022 (as at December 31, 2021: $43,450,000 of which 61% was expected to be sold prior to the end of March 31, 2022 with the remainder to be sold by December 31, 2022).

The outstanding guarantee amounts are undiscounted and before estimated proceeds from sale at auction.

Ritchie Bros.

27

Table of Contents

ITEM 2:      MANAGEMENT’S DISCUSSION AND ANALYSIS OF FINANCIAL CONDITION AND RESULTS OF OPERATIONS

Cautionary Note Regarding Forward-Looking Statements

Forward-looking statements may appear throughout this Quarterly Report on Form 10-Q, including the following section “Management’s Discussion and Analysis of Financial Condition and Results of Operations”. Forward-looking statements are typically identified by such words as “aim”, “anticipate”, “believe”, “could”, “continue”, “estimate”, “expect”, “intend”, “may”, “ongoing”, “plan”, “potential”, “predict”, “will”, “should”, “would”, “could”, “likely”, “generally”, “future”, “long-term”, or the negative of these terms, and similar expressions intended to identify forward-looking statements. Forward-looking statements are based on current expectations and assumptions that are subject to risks and uncertainties that may cause actual results to differ materially, and include, among others, statements relating to:

our future strategy, objectives, targets, projections and performance;
potential growth and market opportunities;
potential future mergers and acquisitions;
our ability to integrate potential acquisitions;
the impact of our new initiatives, services, investments, and acquisitions on us and our customers;
our future capital expenditures and returns on those expenditures; and
financing available to us from our credit facilities or other sources, our ability to refinance borrowings, and the sufficiency of our working capital to meet our financial needs.

While we have not described all potential risks related to our business and owning our common shares, the important factors discussed in “Part II, Item 1A: Risk Factors” of this Quarterly Report on Form 10-Q and in “Part I, Item 1A: Risk Factors” of our Annual Report on Form 10-K for the year ended December 31, 2021, which is available on our website at https://investor.ritchiebros.com, on EDGAR at www.sec.gov, or on SEDAR at www.sedar.com, are among those that we consider may affect our performance materially or could cause our actual financial and operational results to differ significantly from our expectations. Except as required by applicable securities law and regulations of relevant securities exchanges, we do not intend to update publicly any forward-looking statements, even if our expectations have been affected by new information, future events or other developments.

Unless indicated otherwise, all tabular dollar amounts, including related footnotes, presented below are expressed in thousands of United States (“U.S.”) dollars.

We prepare our consolidated financial statements in accordance with United States generally accepted accounting principles (“US GAAP”). Except for Gross Transaction Value (“GTV”)1, which is a measure of operational performance and not a measure of financial performance, liquidity, or revenue, the amounts discussed below are based on our consolidated financial statements.

In the accompanying analysis of financial information, we sometimes use information derived from consolidated financial data but not presented in our financial statements prepared in accordance with US GAAP. Certain of these data are considered “non-GAAP financial measures” under the SEC rules. The definitions of and reasons we use these non-GAAP financial measures and the reconciliations to their most directly comparable US GAAP financial measures are included either with the first use thereof or in the Non-GAAP Measures section within the Management’s Discussion and Analysis of Financial Condition and Results of Operations. Non-GAAP financial measures referred to in this Quarterly Report on Form 10-Q are labeled as “non-GAAP measure”. Please see pages 51-53 for explanations of why we use these non-GAAP measures and the reconciliation to the most comparable GAAP financial measures.

Overview

Ritchie Bros. Auctioneers Incorporated (“Ritchie Bros.”, the “Company”, “we”, or “us”) (NYSE & TSX: RBA) was founded in 1958 in Kelowna, British Columbia, Canada and is a world leader in asset management technologies and disposition of commercial assets, selling $5.5 billion of used equipment and other assets during 2021. Our expertise, unprecedented global reach, market insights, and trusted portfolio of brands provide us with a unique position within the used equipment market.

1  GTV represents total proceeds from all items sold at our auctions and online marketplaces. GTV is not a measure of financial performance, liquidity, or revenue, and is not presented in our consolidated financial statements.

Ritchie Bros.

28

Table of Contents

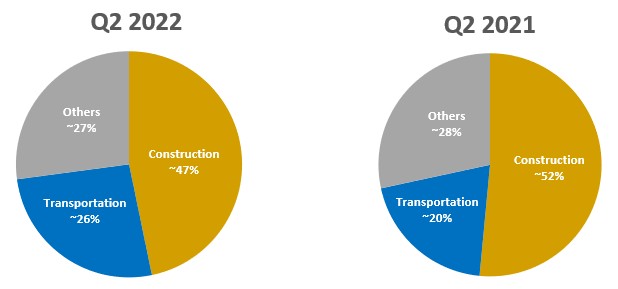
Through our unreserved auctions, online marketplaces, listings, and private brokerage services, we sell a broad range of primarily used commercial and industrial assets as well as government surplus. Construction and transportation assets comprise the majority of the equipment sold by GTV dollar value. Customers selling equipment through our sales channels include end users (such as construction companies), equipment dealers, original equipment manufacturers (“OEMs”) and other equipment owners (such as rental companies). Our customers participate in a variety of sectors, including construction, transportation, agriculture, energy, and natural resources.

We also provide our customers with a wide array of value added services aligned with our growth strategy to create a global marketplace for used equipment services and solutions. Our other services include access to equipment financing, asset appraisals and inspections, online equipment listing, logistical services, and ancillary services such as equipment refurbishment. We offer our customers asset technology solutions to manage the end to end disposition process of their assets and provide market data intelligence to make more accurate and reliable business decisions. Additionally, we offer our customers an innovative technology platform that supports equipment lifecycle management and parts procurement integration with both original equipment manufacturers and dealers, as well as software as a service platform for end-to-end parts procurement and digital catalogs and diagrams.

We operate globally with locations in 12 countries, including the United States, Canada, the Netherlands, Australia, and the United Arab Emirates, and maintain a presence in 48 countries where customers are able to sell from their own yards. In addition, we employ more than 2,700 full-time employees worldwide.

Discontinuation of the proposed acquisition of Euro Auctions

On August 9, 2021, we entered into a Sale and Purchase Agreement (“SPA”) pursuant to which we agreed to purchase Euro Auctions Limited, William Keys & Sons Holdings Limited, Equipment & Plant Services Ltd, and Equipment Sales Ltd. (collectively, “Euro Auctions”), each being a private limited company incorporated in Northern Ireland (the “Euro Auctions Acquisition”), for a purchase price of approximately £775 million (approximately $1.02 billion) in cash, which was to be paid on closing. On April 29, 2022, the Company announced its decision to discontinue the Phase 2 review by the Competition and Markets Authority (“CMA”). The SPA automatically terminated on June 28, 2022.

Impact of COVID-19 to our Business

In March 2020, the World Health Organization declared the outbreak of COVID-19 a global pandemic (“COVID-19”).

In response, we transitioned all of our traditional live onsite auctions to online bidding utilizing our existing online bidding technology. As restrictions ease, we began to return to travel and to welcome in-person attendance at several of our live onsite auctions, and we continue to consider a transition back to our other onsite auction events throughout the year. The health and welfare of our employees, customers and suppliers continues to be a top priority and we continue to operate with precautionary measures in place, as appropriate.

In the first six months of 2022, our ability to move equipment to and from our auction sites and across borders has improved with travel restrictions and quarantine requirements continuing to lift particularly in Australia and Europe, but with certain countries within Asia continuing to experience lockdowns. In the United States and Canada, COVID-19 has not materially impacted our ability to operate our businesses and move equipment. Globally, we continued to see heightened shipping, fuel and freight costs combined with extended lead times, making transportation of equipment both more costly and more challenging, negatively impacting the buying and selling behaviour of our customers. Additionally, COVID-19 in combination with various macro economic factors impacted the supply chains of new equipment production, which in turn negatively affected the supply of used equipment being sold throughout our regions, most predominantly in North America.

For a further discussion of risks to our business and operating results arising from COVID-19, please refer to the “Risk Factors” section of our Annual Report on Form 10-K for the year ended December 31, 2021.

Impact of Russia-Ukraine conflict on our Business

On February 24, 2022, the geopolitical situation in Eastern Europe intensified with Russia’s invasion of Ukraine, sharply affecting economic and global financial markets. Subsequent economic sanctions on Russia have exacerbated ongoing economic challenges, including issues such as rising inflation, global supply chain disruption and increase in fuel prices.

The rise in fuel cost has impacted us to some extent due to the surge in transportation costs which has impacted both the cost and timing of export and import of equipment between countries globally and contributed to an increase in operating costs of our

Ritchie Bros.

29

Table of Contents

equipment in our operations. Increases in European natural gas prices may also result in an acceleration of a slowdown in the economy, especially in Europe where, historically, Eastern European countries have contributed to importing and exporting equipment for our operations.

We do not have any operations in Russia or Ukraine, or any material operations in neighboring countries and only have a limited number of direct customers in the effected region. However, we cannot estimate the extent of the ongoing impacts of the conflict, other unforeseen conditions, future developments, including the continued evolvement of military activity and sanctions imposed with Russia’s invasion of Ukraine, which could adversely affect the domestic economy generally and our business specifically.

Service Offerings

We offer our equipment seller and buyer customers multiple distinct, complementary, multi-channel brand solutions that address the range of their needs. Our global customer base has a variety of transaction options, breadth of services, and the widest selection of used equipment available to them. For a complete listing of channels and brand solutions available under our Auctions & Marketplace ("A&M") segment, as well as our Other Services segment, please refer to our Annual Report on Form 10-K for the year ended December 31, 2021, which is available on our website at www.rbauction.com, on EDGAR at www.sec.gov, or on SEDAR at www.sedar.com.

Contract options

We offer consignors several contract options to meet their individual needs and sale objectives. Through our A&M business, options include:

Straight commission contracts, where the consignor receives the gross proceeds from the sale less a pre-negotiated commission rate;
Guarantee contracts, where the consignor receives a guaranteed minimum amount plus an additional amount if proceeds exceed a specified level; and
Inventory contracts, where we purchase, take custody, and hold used equipment and other assets before they are resold in the ordinary course of business.

We collectively refer to guarantee and inventory contracts as underwritten or “at-risk” contracts.

Value-added services

We also provide a wide array of value-added services to make the process of selling and buying equipment convenient for our customers, including repair and refurbishment services, financial services through Ritchie Bros. Financial Services (“RBFS”), logistical services through RB Logistics, end-to-end asset management and disposition services through RB Asset Solutions, as well as other services such as appraisals, insights, data intelligence and performance benchmarking solutions. We offer equipment listing services under the RitchieList brand in North America and Mascus brand in Europe to make private selling more efficient and safe for customers, including a secure transaction management service, complete with invoicing. We also provide an innovative technology platform that supports customers' management of the equipment lifecycle and integrates parts procurement with both original equipment manufacturers and dealers.

Seasonality

Our GTV and resulting A&M segment revenue are affected by the seasonal nature of our business. GTV and our A&M segment revenue tend to increase during the second and fourth calendar quarters, during which time we generally conduct more business than in the first and third calendar quarters. Given the operating leverage inherent in our business model, the second and fourth quarter also tend to produce higher operating margins, given the higher volume and revenue generated in those quarters.

Revenue Mix Fluctuations

Our revenue is comprised of service revenue and inventory sales revenue. Service revenue from A&M segment activities includes commissions earned at our auctions, online marketplaces, and private brokerage services, and various auction-related fees, including listing and buyer transaction fees. We also recognize revenues from our Other Services segment as fees within service revenue. Inventory sales revenue is recognized as part of our A&M activities and relates to revenues earned through our inventory contracts.

Inventory sales revenue can fluctuate significantly, as it changes based on whether our customers sell using a straight or guarantee commission contract, or an inventory contract at time of selling. Straight or guarantee commission contracts will result in the commission being recognized as service revenue, while inventory contracts will result in the gross transaction value of the equipment sold being recorded as inventory sales revenue with the related cost recognized in cost of inventory sold. As a result, a change in the revenue mix between service revenues and inventory sales revenue can have a significant impact on revenue growth percentages.

Ritchie Bros.

30

Table of Contents

Performance Overview

Net income attributable to stockholders decreased 12% to $53.4 million, compared to $60.7 million in the second quarter of 2021. Diluted earnings per share (“EPS”) attributable to stockholders decreased 13% to $0.48 per share in the second quarter of 2022 as compared to $0.55 per share in the second quarter of 2021. Non-GAAP diluted adjusted EPS attributable to stockholders increased 10% to $0.74 per share in the second quarter of 2022 compared to $0.67 per share in the second quarter of 2021.

For the second quarter of 2022 as compared to the second quarter of 2021:

Consolidated results:

Total revenue increased 22% to $484.5 million
oService revenue increased 13% to $286.5 million
oInventory sales revenue increased 38% to $198.0 million
Operating income increased 3% to $91.9 million
Non-GAAP adjusted operating income increased 12% to $119.6 million
Net income decreased 12% to $53.4 million
Non-GAAP adjusted earnings before interest, taxes, depreciation and amortization (“EBITDA”) increased 11% to $136.2 million
Cash provided by operating activities was $198.0 million for the first six months of 2022
Cash on hand at the end of the second quarter of 2022 was $531.7 million, of which $367.3 million was unrestricted, and restricted cash decreased 84% in the six month period ending June 30, 2022 as a result of the redemption of our 2021 Notes in the quarter for $931.0 million

Auctions & Marketplaces segment results:

GTV increased 10% to $1.7 billion and increased 13% when excluding the impact of foreign exchange
A&M total revenue increased 22% to $433.0 million
oService revenue increased 10% to $235.0 million
oInventory sales revenue increased 38% to $198.0 million

Other Services segment results:

Other Services total revenue increased 29% to $51.5 million
oRBFS revenue increased 69% to $19.9 million
oSmartEquip revenue of $5.0 million was recognized in the second quarter of 2022, which was its second full quarter since its acquisition in November 2021

In addition, the total number of organizations activated on our business inventory management system (“IMS”), a gateway into our marketplace, increased by 50% as compared to the first quarter of 2022.

Other Company developments:

On June 2, 2022, the Company announced the appointment of Eric Jacobs as its Chief Financial Officer, effective June 6, 2022. Sharon Driscoll, the former Chief Financial Officer, is remaining with the Company in an advisory capacity to assist with the transition prior to her previously announced retirement. 

Ritchie Bros.

31

Table of Contents

Results of Operations

Financial overview

Three months ended June 30, 

Six months ended June 30, 

% Change

% Change

(in U.S. $000's, except EPS and percentages)


2022


2021


2022 over 2021


2022


2021


2022 over 2021


Service revenue:

Commissions

$

136,403

$

129,334

5

%

$

252,778

$

233,309

8

%

Fees

150,099

123,414

22

%

278,585

225,469

24

%

Total service revenue

286,502

252,748

13

%

531,363

458,778

16

%

Inventory sales revenue

198,044

143,613

38

%

347,104

269,138

29

%

Total revenue

484,546

396,361

22

%

878,467

727,916

21

%

Costs of services


45,039


41,301


9

%


84,054


79,167


6

%

Cost of inventory sold


176,171


131,023


34

%


307,753


241,770


27

%

Selling, general and administrative


144,277


109,560


32

%


270,883


223,799


21

%

Total operating expenses

393,026

307,019

28

%

723,927

594,140

22

%

Gain on disposition of property, plant and equipment


347


175

98

%

170,167

243

69,928

%

Operating income


91,867


89,517


3

%


324,707


134,019


142

%

Operating income as a % of total revenue

19.0

%

22.6

%

(360)

bps

37.0

%

18.4

%

1,860

bps

Non-GAAP adjusted operating income

119,579

106,973

12

%

208,439

164,748

27

%

Non-GAAP adjusted operating income as a % of total revenue

24.7

%

27.0

%

(230)

bps

23.7

%

22.6

%

110

bps

Net income attributable to stockholders


53,365


60,749


(12)

%


231,459


88,937


160

%

Non-GAAP adjusted net income attributable to stockholders


83,072


74,545


11

%


134,035


110,540


21

%

Non-GAAP adjusted EBITDA

136,219

122,970

11

%

192,624

195,874

(2)

%

Diluted earnings per share attributable to stockholders

$

0.48

$

0.55

(13)

%

$

2.07

$

0.80

159

%

Non-GAAP diluted adjusted EPS attributable to stockholders

$

0.74

$

0.67

10

%

$

1.20

$

0.99

21

%

Effective tax rate


28.8

%


25.7

%


310

bps


20.0

%


24.9

%


(490)

bps

Total GTV

1,684,276

1,527,642

10

%

3,123,381

2,802,182

11

%

Service GTV

1,486,232

1,384,029

7

%

2,776,277

2,533,044

10

%

Service revenue as a % of total GTV

17.0

%

16.5

%

50

bps

17.0

%

16.4

%

60

bps

Inventory GTV

198,044

143,613

38

%

347,104

269,138

29

%

Service GTV as a % of total GTV - Mix

88.2

%

90.6

%

(240)

bps

88.9

%

90.4

%

(150)

bps

Inventory sales revenue as a % of total GTV - Mix

11.8

%

9.4

%

240

bps

11.1

%

9.6

%

150

bps

Certain amounts in the prior period have been reclassified from selling, general and administrative expenses to cost of services, refer to note 2(a) of the consolidated financial statements

Total GTV

Total GTV increased 10% to $1.7 billion in the second quarter of 2022 and increased 11% to $3.1 billion in the first six months of 2022. Total GTV increased 13% in each of second quarter of 2022 and the first six months of 2022, when excluding the impact of foreign exchange.

In second quarter of 2022, GTV increased year-over-year with consistently strong used equipment values, aided by inflation, partially offset by lower lot counts, unfavourable mix and an unfavourable impact of foreign exchange. In Canada, several large inventory packages in Western Canada and strong year-over-year performances at our agricultural events primarily contributed to the growth in GTV volume. Canada also benefited from higher GTV generated by RBFS via PurchaseSafe which provides escrow services for private brokered transactions. In the United States, we saw favourable year-over-year performances across a number of our auctions and began to see the results of our strategic growth initiatives, including from our local yards, and investments made in our sales teams in Texas. In International, Australia saw significant growth in GTV volume driven by a higher number of inventory packages and strong performances from a large new national auction event attributable primarily to overall improved market conditions and the lifting of border restrictions.

For the first six months of 2022, total GTV increased 11% driven by the same macro economic factors as discussed above, with higher volumes growth across all regions, despite a continued unfavourable supply environment. In Canada, GTV growth was driven by strong performances across several agricultural events, strong execution by our Canadian strategic accounts teams, higher volume from RBFS, and higher numbers of inventory packages as discussed above. In the United States, GTV volume increased primarily for the same reasons as discussed above. In addition, we saw a large dispersal of construction equipment in our Phoenix, Arizona auction and positive year-over year performance at our flagship Orlando, Florida event. In International, the increase in GTV volume was primarily driven by Australia for the same reasons as discussed above, as well as due to a new event in Corio, Victoria and two agricultural events.

Ritchie Bros.

32

Table of Contents

Total revenue

Total revenue increased 22% to $484.5 million in the second quarter of 2022, with total service revenue increasing by 13% and inventory sales revenue increasing by 38%. Total revenue increased 21% to $878.5 million for the first six months of 2022, with total service revenue increasing by 16% and inventory sales revenue increasing by 29%.

Foreign currency fluctuation also had an unfavourable impact on our revenue primarily due to the depreciation of the Euro, the Australian dollar and the Canadian dollar relative to the U.S. dollar.

Service Revenue

Service revenue is comprised of commissions that are earned on service GTV, and fees which are earned on total GTV, as well as from our other services such as Ancillary Services, RBFS, Rouse, Mascus, RB Logistics, RB Asset Solutions and SmartEquip.

In the second quarter of 2022, total service revenue increased 13% with fees revenue increasing 22% and commissions revenue increasing 5%. Service GTV increased 7% to $1.5 billion mainly in the United States and Canada. Fees revenue increased 22% with buyer fees growing faster than the GTV increase of 10%, reflecting the increase in buyer fee rates implemented in early 2022. Fees revenue also increased due to higher RBFS revenues on higher funded volumes, and the inclusion of fees from SmartEquip since its acquisition on November 2, 2021. Commissions revenue increased 5%, slightly less than the 7% increase in service GTV, primarily driven by the non-repeat of several high performing guarantee contracts in Canada, as well as a lower commissions revenue from a higher proportion of GTV contributed by RBFS from facilitating financing arrangements.

For the first six months of 2022, total service revenue increased 16% with fees revenue increasing 24% and commissions revenue increasing 8%. Service GTV increased 10% to $2.8 billion across all regions with increases most notably in the United States and Canada. Fees revenue increased 24% with buyer fees growing faster than GTV of 11% for the same reasons as discussed above.

Commissions revenue increased 8%, slightly less than the 10% increase in service GTV for the same reasons as discussed above.

Inventory Sales Revenue

Inventory sales revenue as a percentage of total GTV increased to 11.8% from 9.4% in the second quarter of 2022 and increased to 11.1% from 9.6% in the first six months of 2022.

In the second quarter of 2022, inventory sales revenue increased 38% primarily due to higher activity in Canada. The improved year-over-year performance in Canada was driven primarily by two large inventory contracts in the transportation sector. In International, inventory sales revenue grew in Australia from higher inventory contracts sold at a large new national auction event, as well as a result of the overall improvement in market conditions and the lifting of border restrictions. In the United States, higher volume of inventory contracts contributed to higher inventory sales revenue.

For the first six months of 2022, inventory sales revenue increased 29% primarily in the United States and Canada for the same reasons as discussed above. In addition, in the United States, inventory sales revenue also grew from a large dispersal of construction equipment in our Phoenix, Arizona auction, partially offset by a lower volume of inventory contracts in our Orlando, Florida and Atlanta, Georgia events.

Underwritten Contracts

We offer our customers the opportunity to use underwritten commission contracts to serve their disposition strategy needs, entering into such contracts where the risk and reward profile of the terms are agreeable. Our underwritten contracts, which include inventory and guarantee contracts increased to 21.0% in the second quarter of 2022 compared to 17.6% in the second quarter of 2021. For the first six months of 2022, our underwritten contracts were 19.2% compared to 16.3% in the prior period.

Operating Income

For the second quarter of 2022, operating income increased 3% or $2.4 million to $91.9 million, primarily due to flow through from higher revenues, partially offset by higher selling, general and administrative expenses. Selling, general and administrative expenses increased due to higher short-term incentive expenses and share-based payments driven by strong performance. Share-based payments also increased as a result of a higher expense relating to share-based awards issued to senior executives, and higher expense from the premium-priced options and PSU’s with market conditions granted in late 2021. We saw higher wages, salaries and benefits expenses driven by higher headcount, in part due to the acquisition of SmartEquip, as well as to accelerate our growth initiatives and our

Ritchie Bros.

33

Table of Contents

transformational journey to become a trusted global marketplace. Building, facilities and technology costs also increased mainly due to the amortization of the right-of-use asset of the Bolton property from the sale and lease back arrangement completed in the first quarter of 2022, as well as higher costs as we shift to cloud-based solutions to improve customer experiences. In addition, we saw higher travel, advertising and promotion costs from increased activity in global travel as well as inflation, and higher marketing expenses to promote new initiatives. Professional fees also increased, primarily driven by our investment in new modern architecture to support our future marketplace and services strategy. Inflation also resulted in higher personnel and travel costs.

For the first six months of 2022, operating income increased 142% due to the inclusion of a gain of $169.1 million on property, plant and equipment from the sale of the Bolton property in the first quarter of 2022. Operating income increased 16%, when excluding the impact of the gain, primarily due to flow through from higher revenue, partially offset by higher selling, general and administrative expenses mainly due the same reasons as discussed above.

Income tax expense and effective tax rate

At the end of each interim period, we estimate the effective tax rate expected to be applicable for the full fiscal year. The estimate reflects, among other items, management’s best estimate of operating results. It does not include the estimated impact of foreign exchange rates or unusual and/or infrequent items, which may cause significant variations in the customary relationship between income tax expense and income before income taxes.

For the second quarter of 2022, income tax expense increased 3% to $21.6 million and our effective tax rate increased 310 bps to 28.8% as compared to the second quarter of 2021. For the first six months of 2022, income tax expense increased 96.3% to $57.9 million and our effective tax rate decreased 490 bps to 20.0% as compared to the first six months of 2021.

The increase in the effective tax rate for the second quarter of 2022 compared to the second quarter of 2021 was primarily due to higher return to provision adjustments and higher income taxes related to tax uncertainties. Partially offsetting this increase was a lower estimate of non-deductible expenses.

The decrease in the effective tax rate for the first six months of 2022 compared to the first six months of 2021 was primarily due to the non-taxable gain portion on the sale of the Bolton property. Partially offsetting this decrease was a higher estimate of income taxed in jurisdictions with higher tax rates and a lower tax deduction for PSU and RSU share unit expenses that exceeded the related compensation expense.

Net income

In the second quarter of 2022, net income attributable to stockholders decreased 12% to $53.4 million primarily due to higher interest expense, which included the loss on redemption of the 2021 Notes and certain related interest expense incurred in the quarter in connection with the discontinued Euro Auctions acquisition. For the first six months of 2022, net income attributable to stockholders increased 160% to $231.5 million, primarily due to the gain of $169.1 million on property, plant and equipment from the sale of the Bolton property recognized in the first quarter of 2022, as well as higher operating income, offset by higher interest expense incurred on our 2021 Notes.

Diluted EPS

Diluted EPS attributable to stockholders decreased 13% to $0.48 per share for the second quarter of 2022 and increased 159% to $2.07 per share for the first six months of 2022, in line with net income.

Ritchie Bros.

34

Table of Contents

U.S. dollar exchange rate comparison

We conduct global operations in many different currencies, with our presentation currency being the U.S. dollar. The following table presents the variance in select foreign exchange rates over the comparative reporting periods:


% Change


2022 over

Value of one local currency to U.S. dollar


2022


2021


2021

Period-end exchange rate - June 30,


Canadian dollar

0.7768

0.8067


(4)

%

Euro


1.0477


1.1857


(12)

%

Australian dollar

0.6898

0.7499

(8)

%

Average exchange rate - Three months ended June 30, 


Canadian dollar

0.7836

0.8139


(4)

%

Euro

1.0658


1.2046


(12)

%

Australian dollar

0.7151

0.7698

(7)

%

Average exchange rate - Six months ended June 30, 


Canadian dollar

0.7864

0.8139


(3)

%

Euro

1.0941


1.2046


(9)

%

Australian dollar

0.7194

0.7698

(7)

%

For the second quarter of 2022, foreign exchange had an unfavourable impact on total revenue and a favourable impact on expenses. These impacts were primarily due to the fluctuations in the Euro, Australian dollar and Canadian dollar exchange rates relative to the U.S. dollar.

Non-GAAP Measures

As part of management’s non-GAAP measures, we may eliminate the financial impact of adjusting items which are after-tax effects of significant recurring and non-recurring items that we do not consider to be part of our normal operating results.

Non-GAAP adjusted net income attributed to stockholders increased 11% to $83.1 million in the second quarter of 2022 and increased 21% to $134.0 million for the first six months of 2022.

Non-GAAP diluted Adjusted EPS attributable to stockholders increased 10% to $0.74 per share in the second quarter of 2022 and increased 21% to $1.20 per share for the first six months of 2022.

Non-GAAP adjusted EBITDA increased 11% to $136.2 million in the second quarter of 2022 and increased 23% to $241.1 million for the first six months of 2022.

Debt at the end of the second quarter of 2022 represented 2.2 times net income as at and for the 12 months ended June 30, 2022, compared to debt at the second quarter of 2021, which represented 3.7 times net income as at and for the 12 months ended June 30, 2021. The non-GAAP adjusted net debt/non-GAAP adjusted EBITDA was 0.7 times as at and for the 12 months ended June 30, 2022, compared to 0.9 times as at and for the 12 months ended June 30, 2021.

Ritchie Bros.

35

Table of Contents

Segment Performance

We provide our customers with a wide array of services. The following table presents a breakdown of our consolidated results between the A&M segment and Other Services segment. A complete listing of channels and brand solutions under the A&M segment, as well as our Other Services segment, is available in our Annual Report on Form 10-K for the year ended December 31, 2021.

Three months ended June 30, 2022

Six months ended June 30, 2022

(in U.S $000's)


A&M


Other


Consolidated

A&M


Other


Consolidated

Service revenue:

Commissions

$

136,403

$

$

136,403

$

252,778

$

$

252,778

Fees

98,588

51,511

150,099

183,217

95,368

278,585

Total service revenue

234,991

51,511

286,502

435,995

95,368

531,363

Inventory sales revenue

198,044

198,044

347,104

347,104

Total revenue

$

433,035

$

51,511

$

484,546

$

783,099

$

95,368

$

878,467

Ancillary and logistical service expenses

13,446

13,446

24,201

24,201

Other costs of services

28,985

2,608

31,593

54,559

5,294

59,853

Cost of inventory sold


176,171


176,171


307,753


307,753

Selling, general and administrative


125,535


18,742


144,277


234,346


36,537


270,883

Segment profit

$

102,344

$

16,715

$

119,059

$

186,441

$

29,336

$

215,777

Three months ended June 30, 2021

Six months ended June 30, 2021

(in U.S $000's)

A&M


Other


Consolidated

A&M


Other


Consolidated

Service revenue:

Commissions

$

129,334

$

$

129,334

$

233,309

$

$

233,309

Fees

83,334

40,080

123,414

151,430

74,039

225,469

Total service revenue

212,668

40,080

252,748

384,739

74,039

458,778

Inventory sales revenue

143,613

143,613

269,138

269,138

Total revenue

$

356,281

$

40,080

$

396,361

$

653,877

$

74,039

$

727,916

Ancillary and logistical service expenses

14,819

14,819

27,088

27,088

Other costs of services

25,176

1,306

26,482

49,480

2,599

52,079

Cost of inventory sold


131,023


131,023


241,770


241,770

Selling, general and administrative


99,215


10,345


109,560


201,996


21,803


223,799

Segment profit

$

100,867

$

13,610

$

114,477

$

160,631

$

22,549

$

183,180

Ritchie Bros.

36

Table of Contents

Auctions and Marketplaces Segment

Results of A&M segment operations are presented below for the comparative reporting periods.

Three months ended June 30, 

Six months ended June 30, 

% Change

% Change


2022 over


2022 over


(in U.S. $000's, except percentages)

2022


2021

2021

2022


2021

2021

Service revenue:

Commissions

$

136,403

$

129,334

5

%  

252,778

233,309

8

%

Fees

98,588

83,334

18

%  

183,217

151,430

21

%

Total service revenue


234,991

212,668

10

%  

$

435,995

$

384,739

13

%

Inventory sales revenue


198,044

143,613

38

%  

347,104

269,138

29

%

Total revenue

$

433,035

$

356,281

22

%  

783,099

653,877

20

%

A&M service revenue as a % of total A&M revenue

54.3

%  

59.7

%  

(540)

bps

55.7

%  

58.8

%  

(310)

bps

Inventory sales revenue as a % of total A&M revenue

45.7

%  

40.3

%  

540

bps

44.3

%  

41.2

%  

310

bps

Costs of services

28,985

25,176

15

%  

54,559

49,480

10

%

Cost of inventory sold

176,171

131,023

34

%  

307,753

241,770

27

%

Selling, general and administrative

125,535

99,215

27

%  

234,346

201,996

16

%

A&M segment expenses

$

330,691

$

255,414

29

%  

$

596,658

$

493,246

21

%

Cost of inventory sold as a % of A&M expenses

53.3

%  

51.3

%

200

bps

51.6

%  

49.0

%

260

bps

A&M segment profit

$

102,344

$

100,867

1

%  

$

186,441

$

160,631

16

%

Total GTV

1,684,276

1,527,642

10

%  

3,123,381

2,802,182

11

%

A&M service revenue as a % of total GTV- Rate


14.0

%  

13.9

%

10

bps

14.0

%  

13.7

%

30

bps

Gross Transaction Value

In response to COVID-19, in March 2020, we transitioned all our traditional onsite auctions to online bidding utilizing our existing online bidding technology and simultaneously ceased almost all public attendance at our live auction theaters. Our core online auction channels (IronPlanet.com, GovPlanet.com, Marketplace-E) continued to operate as usual. In 2022, we began to return to live in-person onsite bidding at some of our auction events, offering both onsite and online bidding.

To facilitate the auction process, we have continued to enable equipment drop off at our physical yards, with buyers able to conduct inspections pre-auction and collect equipment post auction. In addition, we balanced Timed Auctioned Lots (“TAL”) solutions for selected industrial and on-the-farm agriculture events.

We believe it is meaningful to consider revenue in relation to GTV. Total GTV and Service GTV by geographical regions, as well as GTV by sector, are presented below for the comparative reporting period.

GTV by Geography

Three months ended June 30, 

Six months ended June 30, 

% Change

% Change

(in U.S. $000's, except percentages)


2022


2021

2022 over 2021

2022


2021

2022 over 2021

Total GTV by Geography

United States

$

803,604

$

740,826

8

%

$

1,723,456


$

1,622,479

6

%

Canada

626,389

551,075

14

%

936,157


761,687

23

%

International

254,283

235,741

8

%

463,768


418,016

11

%

Total GTV

1,684,276

1,527,642

10

%

3,123,381


2,802,182

11

%


Service GTV by Geography


United States

736,268

686,973

7

%

1,567,428


1,502,289

4

%

Canada

586,945

543,147

8

%

887,648


744,044

19

%

International

163,019

153,909

6

%

321,201


286,711

12

%

Total Service GTV1

1,486,232

1,384,029

7

%

2,776,277

2,533,044

10

%

Ritchie Bros.

37

Table of Contents

GTV by Sector

The following pie charts illustrate the breakdown of total GTV by sector for the second quarter of 2022 compared to the second quarter of 2021.

The construction sector includes heavy equipment such as trucks, excavators, cranes and dozers. The transportation sector includes vehicles, buses, trailers and trucks that are used for transport. The other sector primarily includes equipment sold in the agricultural, forestry and energy industries.

In the second quarter of 2022, total GTV mix compared to the second quarter of 2021 increased by 6 percentage points in the transportation sector driven by large inventory contracts in Canada, primarily offset by a 5 percentage points decrease in the construction sector.

Graphic

Total Auction Metrics

We review a number of metrics including the following key metrics, to evaluate our business, measure our performance and identify trends affecting our business.

Bids per lot sold. Each bid is completed electronically through our real-time online bidding system. A lot is defined as a single asset to be sold, or a group of assets bundled for sale as one unit. This metric calculates the total number of bids received for a lot divided by the total number of lots sold.

Total lots sold. We define a lot as a single asset to be sold, or a group of assets bundled for sale as one unit. Low value assets are sometimes bundled into a single lot, collectively referred to as “small value lots”.

Three months ended June 30, 

Six months ended June 30, 

% Change

% Change


2022


2021


2022 over 2021


2022


2021


2022 over 2021


Bids per lot sold *


28


27

4

%  

28


28

%

Total lots sold *


144,167


148,206

(3)

%  

249,934


263,035

(5)

%

* Management reviews industrial equipment auction metrics excluding GovPlanet; as a result, GovPlanet business metrics are excluded from these metrics


The total number of bids per lot sold increased 4% to 28 in the second quarter of 2022 compared to the second quarter of 2021 and remained flat for the first six months of 2022, reflecting continued strong demand for used equipment from buyers in a tight supply market.

The total lots sold decreased 3% to 144,167 in the second quarter of 2022 primarily impacted by the tight supply market, the shift to a lower proportion of small value lots sold across all regions, as well as reduction in lot counts, partially offset by higher average selling prices. For the first six months of 2022, the total lots sold decreased 5% to 249,934, primarily for the same reasons as discussed above.

Ritchie Bros.

38

Table of Contents

A&M revenue

Total A&M revenue increased 22% to $433.0 million in the second quarter of 2022.

A&M revenue by geographical region are presented below:

Three months ended June 30, 

Six months ended June 30, 

% Change

% Change

(in U.S. $000's, except percentages)


2022


2021

2022 over 2021

2022


2021

2022 over 2021

A&M Revenue by Geography

United States


Service revenue

$

127,318

$

112,183

13

%

$

266,188


$

236,388

13

%

Inventory sales revenue


67,337


53,853

25

%

156,028


120,190

30

%

A&M revenue - United States


194,655


166,036

17

%

422,216


356,578

18

%

Canada


Service revenue


80,702


76,021

6

%

119,517


104,080

15

%

Inventory sales revenue


39,444


7,928

398

%

48,509


17,643

175

%

A&M revenue - Canada


120,146


83,949

43

%

168,026


121,723

38

%

International


Service revenue


26,971


24,464

10

%

50,290


44,271

14

%

Inventory sales revenue


91,263


81,832

12

%

142,567


131,305

9

%

A&M revenue - International


118,234


106,296

11

%

192,857


175,576

10

%

Total


Service revenue


234,991


212,668

10

%

435,995


384,739

13

%

Inventory sales revenue


198,044


143,613

38

%

347,104


269,138

29

%

Total A&M revenue


433,035


356,281

22

%

783,099


653,877

20

%

United States

In the second quarter of 2022, service revenue increased 13% partially due to the 7% increase in service GTV. The remaining increase was primarily due to higher buyer fee rates implemented in early 2022. In addition, we saw positive rate performances in our straight commission contracts from a lower proportion of GTV sourced from strategic accounts. These increases were partially offset by lower buyer fees on a lower proportion of small value lots.

For the first six months of 2022, service revenue increased 13% while Service GTV increased 4% primarily for the same reasons as discussed above. In addition, we saw lower fees associated with online inspections driven by lower online lot counts.

In the second quarter of 2022, inventory sales revenue increased 25% primarily due to higher volume of inventory contracts, including higher volumes sold through our GovPlanet business as a result of the new non-rolling and rolling stock contracts effective June 1, 2021. For the first six months of 2022, inventory sales revenue increased 30% primarily due to a large dispersal of construction equipment in our Phoenix, Arizona auction, as well as for the same reasons as discussed earlier. These increases were partially offset by a lower volume of inventory contracts in Orlando, Florida and Atlanta, Georgia auctions.

Canada

In the second quarter of 2022, service revenue increased 6%, slightly less than the 8% increase in Service GTV primarily driven by the non-repeat of several high performing guarantee contracts in the prior year, as well as lower commissions from a higher proportion of GTV contributed by RBFS. These were partially offset by an increase in fees from the higher buyer fee rates implemented in early 2022.

For the first six months of 2022, service revenue increased 15% while Service GTV increased 19%. Service revenue growth was lower than the increase in Service GTV primarily for the same reasons as discussed above.

In the second quarter of 2022, inventory sales revenue increased 398% primarily driven by two large inventory contracts in the transportation sector.

For the first six months of 2022, inventory sales revenue increased 175% primarily for the same reason.

Ritchie Bros.

39

Table of Contents

International

In the second quarter of 2022, service revenue increased 10% partially due to the 6% increase in Service GTV. The remaining increase was due to higher buyer fees in Australia arising from a favourable mix of contracts resulting in net higher buyer fees rate.

For the first six months of 2022, service revenue increased 14% primarily due to the 12% increase in Service GTV for the same reason as discussed above.

In the second quarter of 2022, inventory sales revenue increased 12%, mainly in Australia driven by a higher number of inventory contracts sold at a large new national auction event, as well as from the overall improvement in market conditions and the lifting of border restrictions.

For the first six months of 2022, inventory sales revenue increased 9% primarily driven by growth in Australia as discussed above, combined with the addition of one new event and two agricultural events.

Costs of services

A&M costs of services increased 15% to $29.0 million in the second quarter of 2022 compared to the second quarter of 2021 in line with total GTV increase of 10%. In addition, we incurred additional fees paid to third parties in connection with profit sharing arrangements on inventory packages.

For the first six months of 2022, A&M costs of services increased 10% to $54.6 million, in line with total GTV increase of 11% and for the same reason as discussed above. We also incurred higher building, facilities and technology expenses to support our flagship Orlando event, which returned to live in-person onsite bidding.

Cost of inventory sold

A&M cost of inventory sold increased 34% to $176.2 million in the second quarter of 2022 compared to the second quarter of 2021 primarily in line with 38% increase in inventory sales revenue. Cost of inventory sold increased at a lower rate than the increase in inventory sales revenue, indicating an increase in the revenue rates, primarily in Canada.

For the first six months of 2022, A&M cost of inventory sold increased 27% to $307.8 million primarily in line with the 29% increase in inventory sales revenue.

Selling, general and administrative

A&M selling, general and administrative increased 27% to $125.5 million in the second quarter of 2022 compared to the second quarter of 2021. This increase was primarily due to higher short-term incentive expenses and higher share-based payments driven by strong performance. Share-based payments also increased as a result of a higher expense relating to share-based awards issued to senior executives, and higher expense from the premium-priced options and PSU’s with market conditions granted in late 2021. Building, facilities and technology costs also increased mainly due to the amortization of the right-of-use asset of the Bolton property from the sale and lease back arrangement completed in the first quarter of 2022, as well as higher costs as we shift to cloud-based solutions to improve customer experiences. In addition, we saw higher wages, salaries and benefits expenses, as well as higher headcount to accelerate our growth initiatives and our transformational journey to become a trusted global marketplace. We also saw higher travel, advertising and promotion costs from increased activity in global travel, and higher marketing expenses to promote new initiatives. Inflation has also driven higher personnel and travel costs. Professional fees also increased primarily driven by our investment in new modern architecture to support our future marketplace and services strategy. These increases were partially offset by a favourable impact of foreign exchange.

For the first six months of 2022, A&M selling, general and administrative increased 16% to $234.3 million primarily due to higher building, facilities and technology costs, higher share-based payments, higher professional fees, higher wages, salaries and benefits expenses and travel, advertising and promotion for the same reasons as discussed above.

Ritchie Bros.

40

Table of Contents

Other Services Segment

Results of Other Services segment operations are presented below for the comparative reporting periods.

Three months ended June 30, 

Six months ended June 30, 

% Change

% Change

(in U.S. $000's, except percentages)


2022


2021

2022 over 2021


2022


2021

2022 over 2021


Service revenue

$

51,511

$

40,080

29

%  

$

95,368

$

74,039

29

%

Ancillary and logistical service expenses


13,446


14,819

(9)

%


24,201


27,088

(11)

%

Other costs of services


2,608


1,306

100

%  


5,294


2,599

104

%

Selling, general and administrative


18,742


10,345

81

%  


36,537


21,803

68

%

Other services profit

$

16,715

$

13,610

23

%  

$

29,336

$

22,549

30

%

In the second quarter of 2022, Other Services revenue increased 29% to $51.5 million primarily due to higher RBFS revenues of $8.1 million, and $5.0 million of second full quarter revenue recognized since the acquisition of SmartEquip on November 2, 2021. These increases were partially offset by lower ancillary revenue of $1.4 million driven by lower fees earned on redeployment of assets in the United States.

In the first six months of 2022, Other Services revenue increased 29% to $95.4 million due to higher RBFS revenues of $14.6 million and $9.7 million of revenue from SmartEquip. These increases were partially offset by lower ancillary revenue of $2.2 million.

Ancillary and logistical service expenses decreased 9% to $13.4 million in the second quarter of 2022 and decreased 11% to $24.2 million in the first six months of 2022, in line with lower ancillary revenue. Other costs of services increased 100% to $2.6 million in the second quarter of 2022 and increased 104% to $5.3 million in the first six months of 2022 mainly due to the inclusion of SmartEquip since its acquisition on November 2, 2021. Selling, general and administrative increased 81% to $18.7 million in the second quarter of 2022 and increased 68% to $36.5 million in the first six months of 2022, primarily in wages, salaries and benefits expenses due to the growth in our RBFS business, the inclusion of SmartEquip and higher headcount in Rouse to support our growth initiatives.

RBFS revenue increased 69% in the second quarter of 2022 and increased 70% in the first six months of 2022, driven by higher funded volumes and improved rate on fees earned from facilitating financing arrangements. In the second quarter of 2022, our funded volume, which represents the amount of lending brokered by RBFS, increased 51% to $298.0 million, and increased 57% when excluding the impact of foreign exchange. In the first six months of 2022, our funded volume increased 55% to $531.6 million, and increased 58% when excluding the impact of foreign exchange.

In the second quarter of 2022, Other Services profit increased 23% to $16.7 million mainly driven by RBFS. In the first six months of 2022, Other Services profit increased 30% to $29.3 million also driven by RBFS.

Additionally, in the first quarter of 2021, we launched a business version of our IMS, which offers our customers end-to-end asset management and disposition services, data analytics, dashboards, branded e-commerce sites and multiple external sales channels to help our customers achieve optimal returns. We continue to grow the number of organizations activated on IMS. During the second quarter of 2022, the number of organizations activated on our IMS increased by 50% compared to the first quarter of 2022.

As we evolve to a marketplace, we also facilitate retail and peer-to-peer auction events and equipment sale transactions via our online technology in exchange for hosting fees. During the second quarter of 2022, customers that used this service disposed of $31.9 million of assets, which is a decrease of 12% from the second quarter of 2021 primarily driven by an unfavourable supply environment. For the first six months of 2022, this service facilitated transactions of $68.3 million, a 14% decrease as compared to the prior year for the same reason mentioned above.

Ritchie Bros.

41

Table of Contents

Liquidity and Capital Resources

Our principal sources of liquidity are our cash provided by operating activities and borrowings from our revolving credit facilities, which we renewed on September 21, 2021.

We believe that our existing working capital and availability under our credit facilities are sufficient to satisfy our present operating requirements and contractual obligations. Our material short-term cash requirements include (i) inventory purchases, (ii) capital expenditures for intangible assets and property, plant and equipment (iii) payment of quarterly dividends on an as-declared basis, (iv) settlement of contracts with consignors and other suppliers, (v) personnel expenditures, with a majority of bonuses paid annually in the first quarter following each fiscal period, (vi) income tax payments, primarily paid in quarterly installments, (vii) lease payments, and (viii) principal payments on short-term and current portions of long-term debt, and (ix) interest payments related to our current debt obligations. We also have inventory purchase commitments, related to our GovPlanet business, which is described in Note 26 of our consolidated financial statements.

During the first quarter of 2022, we completed the sale and leaseback of the Bolton property for a total sale consideration and net proceeds of approximately $165.0 million. The proceeds from the sale were used to repay our revolving credit facilities. We have also leased back the Bolton property while we complete the acquisition and development of a replacement property and auction site located in Amaranth, Ontario over the next two to three years. We intend to fund the material cash requirement for the acquisition and development of the Amaranth property from cash flows from ongoing operations.

During the second quarter of 2022, as a result of the Company’s decision to discontinue the phase 2 review by the United Kingdom’s Competition and Markets Authority (“CMA”), the Company redeemed all of the 2021 Notes, which were held in escrow, at a redemption price equal to 100% of the original offering price of the notes, plus accrued and unpaid interest. As such, on May 4, 2022, the Company paid net proceeds of approximately $931 million to its bondholders.

Other long-term cash requirements include long-term debt principal repayments, which are disclosed according to maturity date in Note 21 in our Annual Report on Form 10-K for the year ended December 31, 2021, as well as interest payments related to our non-current debt obligations. We are also committed under various letters of credit and provide certain guarantees in the normal course of business.

If we were to consider further acquisitions to deliver on our strategic growth drivers, we may seek financing through equity markets or additional debt markets. The sale of equity securities may result in dilution to our shareholders. Issuance of preferred equity securities could provide for rights, preferences or privileges senior to those of our common stock. Further, this additional capital may not be available on reasonable terms, or at all.

We assess our liquidity based on our ability to generate cash and secure credit to fund operating, investing, and financing activities. Our liquidity is primarily affected by fluctuations in cash provided by operating activities, significant acquisitions of businesses, payment of dividends, share repurchases, our net capital spending1, and voluntary repayments of debt. We believe our principal sources of liquidity, which include cash flow from operations, our current unused capacity under our revolving credit facilities of $683 million, is sufficient to fund our current operating activities and future growth strategies.

Cash provided by operating activities can fluctuate significantly from period to period due to factors such as differences in the timing, size and number of auctions during the period, the volume of our inventory contracts, the timing of the receipt of auction proceeds from buyers and of the payment of net amounts due to consignors, as well as the location of the auction with respect to restrictions on the use of cash generated therein.

1We calculate net capital spending as property, plant and equipment additions plus intangible asset additions less proceeds on disposition of property, plant and equipment.

Ritchie Bros.

42

Table of Contents

Cash flows

Six months ended June 30, 

% Change

(in U.S. $000's, except percentages)

2022


2021

2022 over 2021


Cash provided by (used in):


Operating activities

$

198,026

$

211,381

(6)

%

Investing activities


140,278


(23,303)

(702)

%

Financing activities


(1,156,323)


(50,861)

2,173

%

Effect of changes in foreign currency rates


(12,773)


(1,389)

820

%

Net (decrease) increase in cash, cash equivalents, and restricted cash

$

(830,792)

$

135,828

(712)

%

Net cash provided by operating activities decreased $13.4 million in the first six months of 2022, mainly due to lower cash inflows from the change in operating assets and liabilities. This change arose primarily due to the timing, size and number of auctions. We also saw a net higher outflow from inventory, with an increase in purchases in the United States partially offset by higher sales in International mainly in Australia, as well as an increase in advances paid against auction contracts for several consignment contracts in Europe, which are expected to be sold in the third quarter of 2022. These outflows were offset by cash inflows from income taxes for the accrual of the taxable gain portion on the sale of our Bolton property made in the first quarter of 2022, and lower-income tax payments as a result of timing of instalments. We also saw a positive net cash flow impact from prepaying in the fourth quarter of 2021 and the first quarter of 2022 interest on the 2021 Notes held in escrow and from lower bonus payments.

Net cash provided by investing activities increased $163.6 million in the first six months of 2022. This increase was primarily due to the sale of our Bolton property for total net cash proceeds of approximately $165.0 million.

Net cash used in financing activities increased $1.1 billion in the first six months of 2022, primarily due to the $931 million repayment of long-term debt as a result of the redemption of our 2021 Notes on May 4, 2022. We also made a $164.0 million repayment of debt on our long-term revolving credit facilities from the proceeds from the sale of the Bolton property in the first quarter of 2022. In addition, we also saw lower proceeds of $7.8 million from the exercise of stock options and higher dividends of $6.8 million paid to our shareholders compared to the comparative period in 2021. Partially offsetting these changes were a $15.4 million increase in draws on our short-term debt and a decrease of $5.4 million in withholding tax payments on the issuance of shares.

Dividend information

We declared a dividend of $0.25 per common share for each of the quarter ended June 30, 2021, September 30, 2021, December 31, 2021, and March 31, 2022. We have declared, but not yet paid, a dividend of $0.27 per common share for the quarter ended June 30, 2022. All dividends that we pay are “eligible dividends” for Canadian income tax purposes unless indicated otherwise.

Return on average invested capital

Our return on average invested capital is calculated as net income attributable to stockholders divided by our average invested capital. We calculate average invested capital over a trailing 12-month period by adding the average long-term debt over that period to the average stockholders’ equity over that period.

Return on average invested capital increased 500 bps to 16.4% for the 12-month period ending June 30, 2022 from 11.4% for the 12-month period ending June 30, 2021. This increase is primarily due to an increase in net income attributable to stockholders over the comparative period, mainly driven by the gain from the sale of the Bolton property. This increase was offset by a higher average invested capital over the comparative period as a result of the senior notes issued into escrow on December 21, 2021. Return on invested capital (“ROIC”) excluding escrowed debt (non-GAAP measure) decreased 60 bps to 13.4% during the 12 months ended June 30, 2022 compared to 14.0% in 2021, primarily due to the inclusion of the gain on the Bolton property in the non-GAAP adjusted average invested capital.

Credit facilities

We have a credit agreement which is comprised of multicurrency revolving facilities (the “Revolving Facilities”) and a delayed-draw term loan facility (the “DDTL Facility”, together with the Revolving Facilities, the “Facilities”). The credit agreement was most recently amended in September 2021, which, among other things (i) extended the maturity date of the Facilities from October 27, 2023 to September 21, 2026, (ii) increased the total size of the Facilities provided under the Credit Agreement to up to $1.045 billion,

Ritchie Bros.

43

Table of Contents

including $295.0 million of commitments under the DDTL Facility, (iii) reduced the applicable margin for base rate loans and LIBOR loans at each pricing tier level, (iv) reduced the applicable percentage per annum used to calculate the commitment fee in respect of the unused commitments under the Facilities at each pricing tier level, and (v) included customary provisions to provide for the eventual replacement of LIBOR as a benchmark interest rate.

Immediately prior to the amendment, the aggregate principal amount outstanding under the DDTL Facility was $90.0 million ($118.9 million CAD). In connection with the amendment, the Company refinanced that amount with the proceeds from a borrowing under the DDTL Facility. There are no mandatory principal repayments of borrowings under the DDTL Facility until the earlier of when the remaining $205.0 million is drawn or third quarter of 2022. The Company did not draw on the remaining $205,000,000 before it expired on June 28, 2022 and, therefore, mandatory principal repayments will begin in the third quarter of 2022. Once principal payments become mandatory, they are subject to an annual amortization rate of 5%, payable in quarterly installments, with the balance payable at maturity.

Credit facilities at June 30, 2022 and December 31, 2021 were as follows:

(in U.S. $000's, except percentages)


June 30, 2022


December 31, 2021


% Change


Committed


DDTL Facility

$

92,349

$

298,284


(69)

%

Revolving credit facilities


750,000


750,000


%

Uncommitted

Revolving credit facilities

10,000

10,000

%

Total credit facilities

$

852,349

$

1,058,284


(19)

%

Unused


DDTL Facility

$

$

205,000


(100)

%

Revolving credit facilities


683,459


525,581


30

%

Total credit facilities unused

$

683,459

$

730,581


(6)

%

Debt covenants

We were in compliance with all financial and other covenants applicable to our credit facilities at June 30, 2022.

Our ability to borrow under our syndicated revolving credit facility is subject to compliance with financial covenants of a consolidated leverage ratio and a consolidated interest coverage ratio. In the event of sustained deterioration of global markets and economies, we expect the covenants pertaining to our leverage ratio would be the most restrictive to our ability to access funding under our credit agreement. We continue to evaluate courses of action to maintain current levels of liquidity and compliance with our debt covenants.

Critical Accounting Policies, Judgments, Estimates and Assumptions

In preparing our consolidated financial statements in conformity with US GAAP, we must make decisions that impact the reported amounts and related disclosures. Such decisions include the selection of the appropriate accounting principles to be applied and the assumptions on which to base accounting estimates. In reaching such decisions, we apply judgments based on our understanding and analysis of the relevant circumstances and historical experience and related circumstances. As at June 30, 2022, other than the estimates in accounting for the sale and leaseback transaction related to the sale of our Bolton property in the first quarter of 2022, as described below, there were no material changes in our critical accounting policies, judgments, estimates and assumptions from those disclosed in our Annual Report on Form 10-K for the year ended December 31, 2021, or in the notes to our consolidated financial statements included in “Part I, Item 1: Consolidated Financial Statements” in this Quarterly Report on Form 10-Q.

Effective October 1, 2021, we early adopted ASU 2021-08, Business Combinations (Topic 805): Accounting for Contract Assets and Contract Liabilities from Contracts with Customers. The update primarily addresses the accounting for contract assets and contract liabilities from revenue contracts with customers acquired in a business combination. An entity that early adopts in an interim period should apply the amendments (i) retrospectively to all business combinations for which the acquisition date occurs on or after the beginning of the fiscal year that includes the interim period of early application and (ii) prospectively to all business combinations that occur on or after the date of initial application. We have applied the amendments to the SmartEquip acquisition, which was completed on November 2, 2021.

Significant items subject to estimates and judgements during the six month period ended June 30, 2022 were made in accounting for the completed sale and leaseback transaction of our Bolton property. We determined the following estimates in calculating the gain on

Ritchie Bros.

44

Table of Contents

sale: the present value of market rental payments of the Bolton property sold, the expected lease term in the leaseback arrangement and our incremental borrowing rate based on information available at the commencement date of the lease.

For a discussion of our new and amended accounting standards, refer to Note 2(b) of the Consolidated Financial Statements, Significant Accounting Policies.

Non-GAAP Measures

We reference various non-GAAP measures throughout this Quarterly Report on Form 10-Q. These measures do not have a standardized meaning and are, therefore, unlikely to be comparable to similar measures presented by other companies. The presentation of this financial information, which is not prepared under any comprehensive set of accounting rules or principles, is not intended to be considered in isolation of, or as a substitute for, the financial information prepared and presented in accordance with US GAAP. Non-GAAP financial measures included in this Quarterly Report on Form 10-Q are labeled as “non-GAAP measure”.

Non-GAAP Adjusted Operating Income Reconciliation

We believe that non-GAAP adjusted operating income provides useful information about the growth or decline of our operating income for the relevant financial period and eliminates the financial impact of adjusting items we do not consider to be part of our normal operating results.

Non-GAAP adjusted operating income eliminates the financial impact of adjusting items from operating income, which are significant recurring and non-recurring items that we do not consider to be part of our normal operating results, such as share-based payments expense, acquisition-related costs, amortization of acquired intangible assets, management reorganization costs, and certain other items, which we refer to as “adjusting items”.

In 2021, we updated the calculation of non-GAAP adjusted operating income to add-back share-based payments expense, all acquisition-related costs (including any share based continuing employment costs recognized in acquisition-related costs), amortization of acquired intangible assets, and gain or loss on disposition of property, plant and equipment. We have also adjusted for certain non-recurring advisory, legal and restructuring costs. These adjustments have been applied retrospectively to all periods presented, as applicable.

The following table reconciles non-GAAP adjusted operating income to operating income, which is the most directly comparable GAAP measure in our consolidated financial statements.

Three months ended June 30, 

Six months ended June 30, 

% Change

% Change

(in U.S. $000's, except percentages)


2022

2021

2022 over 2021


2022

2021

2022 over 2021


Operating income

$

91,867

$

89,517

3

%  

$

324,707

$

134,019

142

%

Share-based payments expense

13,640

7,540

81

%  

19,026

11,318

68

%  

Acquisition-related costs

3,399

3,049

11

%  

13,036

5,971

118

%  

Amortization of acquired intangible assets

8,426

6,802

24

%  

16,958

13,443

26

%  

Gain on disposition of property, plant and equipment and related costs

1,153

(175)

(759)

%  

(168,667)

(243)

69,310

%  

Non-recurring advisory, legal and restructuring costs

1,094

240

356

%  

3,379

240

1,308

%  

Non-GAAP adjusted operating income

$

119,579

$

106,973

12

%  

$

208,439

$

164,748

27

%

(1)Please refer to pages 51-53 for a summary of adjusting items during the three and six months ended June 30, 2022 and June 30, 2021.
(2)Non-GAAP adjusted operating income represents operating income excluding the effects of adjusting items.

Ritchie Bros.

45

Table of Contents

Non-GAAP Adjusted Net Income Attributable to Stockholders and Non-GAAP Diluted Adjusted EPS Attributable to Stockholders Reconciliation

We believe that non-GAAP adjusted net income attributable to stockholders provides useful information about the growth or decline of our net income attributable to stockholders for the relevant financial period and eliminates the financial impact of adjusting items we do not consider to be part of our normal operating results. Non-GAAP diluted Adjusted EPS attributable to stockholders eliminates the financial impact of adjusting items from net income attributable to stockholders which are after-tax effects of significant non-recurring or recurring items that we do not consider to be part of our normal operating results, such as share-based payments expense, acquisition-related costs, amortization of acquired intangible assets, management reorganization costs, and certain other items, which we refer to as “adjusting items”.

In 2021, we updated the calculation of non-GAAP diluted adjusted EPS attributable to stockholders to add-back certain adjustments that have been applied retrospectively to all periods presented, as applicable (refer to non-GAAP adjusted operating income reconciliation above).

The following table reconciles non-GAAP adjusted net income attributable to stockholders and non-GAAP diluted adjusted EPS attributable to stockholders to net income attributable to stockholders and diluted EPS attributable to stockholders, which are the most directly comparable GAAP measures in our consolidated financial statements.

(in U.S. $000's, except share and per share data, and percentages)

Three months ended June 30, 

Six months ended June 30, 


% Change


% Change


2022


2021

2022 over 2021

2022


2021

2022 over 2021


Net income attributable to stockholders

$

53,365

$

60,749

(12)

%  

$

231,459

$

88,937

160

%

Share-based payments expense

13,640

7,540

81

%  

19,026

11,318

68

%  

Acquisition-related costs

3,399

3,049

11

%  

13,036

5,971

118

%  

Amortization of acquired intangible assets

8,426

6,802

24

%  

16,958

13,443

26

%  

Gain on disposition of property, plant and equipment and related costs

1,153

(175)

(759)

%  

(168,667)

(243)

69,310

%  

Loss on redemption of the 2021 Notes and certain related interest expense

9,664

100

%  

9,664

100

%  

Change in fair value of derivatives


%  


(1,263)


(100)

%

Non-recurring advisory, legal and restructuring costs


1,094

240

356

%  

3,379

240

1,308

%

Related tax effects of the above

(7,669)

(3,660)

110

%

10,443

(9,126)

(214)

%

Non-GAAP adjusted net income attributable to stockholders

$

83,072

$

74,545

11

%  

$

134,035

$

110,540

21

%

Weighted average number of dilutive shares outstanding


111,705,102


111,334,184


0

%  


111,681,644


111,302,711


0

%

Diluted earnings per share attributable to stockholders

$

0.48

$

0.55

(13)

%  

$

2.07

$

0.80

159

%

Non-GAAP diluted adjusted EPS attributable to stockholders

$

0.74

$

0.67

10

%  

$

1.20

$

0.99

21

%

(1)Please refer to pages 51-53 for a summary of adjusting items during the three and six months ended June 30, 2022 and June 30, 2021.
(2)Non-GAAP adjusted net income attributable to stockholders represents net income attributable to stockholders excluding the effects of adjusting items.
(3)Non-GAAP diluted adjusted EPS attributable to stockholders is calculated by dividing non-GAAP adjusted net income attributable to stockholders, net of the effect of dilutive securities, by the weighted average number of dilutive shares outstanding.

Ritchie Bros.

46

Table of Contents

Non-GAAP Adjusted EBITDA

We believe non-GAAP adjusted EBITDA provides useful information about the growth or decline of our net income when compared between different financial periods. We use non-GAAP adjusted EBITDA as a key performance measure because we believe it facilitates operating performance comparisons from period to period.

In 2021, we updated the calculation of non-GAAP adjusted EBITDA to add-back certain adjustments which have been applied retrospectively to all periods presented, as applicable (refer to non-GAAP adjusted operating income reconciliation above).

The following table reconciles non-GAAP adjusted EBITDA to net income, which is the most directly comparable GAAP measure in, or calculated from, our consolidated financial statements:

Three months ended June 30, 

Six months ended June 30, 


% Change


% Change


2022 over


2022 over


(in U.S. $000's, except percentages)


2022


2021

2021


2022


2021

2021


Net income

$

53,411

$

60,781

(12)

%  

$

231,512

$

88,920

160

%

Add: depreciation and amortization


24,298


21,935


11

%  


48,523


43,005


13

%

Add: interest expense


18,463


8,867


108

%  


39,149


17,813


120

%

Less: interest income


(871)


(332)


162

%  


(1,415)


(634)


123

%

Add: income tax expense


21,632


21,065


3

%  


57,867


29,484


96

%

EBITDA


116,933


112,316


4

%  


375,636


178,588


110

%

Share-based payments expense

13,640

7,540

81

%  

19,026

11,318

68

%  

Acquisition-related costs


3,399


3,049


11

%  


13,036


5,971


118

%  

Gain on disposition of property, plant and equipment and related costs

1,153

(175)

(759)

%  

(168,667)

(243)

69,310

%  

Change in fair value of derivatives


%  


(1,263)


(100)

%

Non-recurring advisory, legal and restructuring costs

1,094

240

356

%  

3,379

240

1,308

%

Non-GAAP adjusted EBITDA

$

136,219

$

122,970

11

%  

$

241,147

$

195,874

23

%

(1)Please refer to pages 51-53 for a summary of adjusting items during the three and six months ended June 30, 2022 and June 30, 2021.
(2)Non-GAAP adjusted EBITDA is calculated by adding back depreciation and amortization, interest expense, income tax expense, and subtracting interest income from net income, as well as adding back share-based payments expense, acquisition-related costs, and excluding the effects of any non-recurring or unusual adjusting items.

Ritchie Bros.

47

Table of Contents

Non-GAAP Adjusted Net Debt and Non-GAAP Adjusted Net Debt/Non-GAAP Adjusted EBITDA Reconciliation

We believe that comparing non-GAAP adjusted net debt/non-GAAP adjusted EBITDA on a trailing 12-month basis for different financial periods provides useful information about the performance of our operations as an indicator of the amount of time it would take us to settle both our short and long-term debt. We do not consider this to be a measure of our liquidity, which is our ability to settle only short-term obligations, but rather a measure of how well we fund liquidity. Measures of liquidity are noted under “Liquidity and Capital Resources”.

The following table reconciles non-GAAP adjusted net debt to debt, non-GAAP adjusted EBITDA to net income, and non-GAAP adjusted net debt/ non-GAAP adjusted EBITDA to debt/ net income, respectively, which are the most directly comparable GAAP measures in, or calculated from, our consolidated financial statements.

As at and for the 12 months ended June 30, 

% Change

(in U.S. $millions, except percentages)

2022

2021

2022 over 2021

Short-term debt


$

8.6


$

35.2


(76)

%

Long-term debt


644.4


636.5

1

%

Debt


653.0


671.7

(3)

%

Less: cash and cash equivalents


(367.3)


(301.8)

22

%

Non-GAAP adjusted net debt


285.7


369.9

(23)

%

Net income

$

294.4

$

183.3

61

%

Add: depreciation and amortization


93.4


80.8

16

%

Add: interest expense


58.3


35.3

65

%

Less: interest income


(2.2)


(1.7)

29

%

Add: income tax expense


81.8


61.7

33

%

EBITDA


525.7


359.4

46

%

Share-based payments expense


30.8


24.4

26

%

Acquisition-related costs


37.3


12.0

211

%

Gain on disposition of property, plant and equipment and related costs

(169.9)

(0.5)

33,880

%

Change in fair value of derivatives

%

Non-recurring advisory, legal and restructuring costs


6.6


4.2

57

%

Non-GAAP adjusted EBITDA

$

430.5

$

399.5

8

%

Debt/net income


2.2

x


3.7

x

(41)

%

Non-GAAP adjusted net debt/non-GAAP adjusted EBITDA


0.7

x


0.9

x

(22)

%

(1)Please refer to pages 51-53 for a summary of adjusting items during the trailing 12-months ended June 30, 2022 and June 30, 2021.
(2)Non-GAAP adjusted EBITDA is calculated by adding back depreciation and amortization, interest expense, income tax expense, and subtracting interest income from net income, as well as adding back share-based payments expense, acquisition-related costs, gain/ loss on disposition of property, plant and equipment, terminated and ongoing transaction costs, and excluding the effects of any non-recurring or unusual adjusting items.
(3)Non-GAAP adjusted net debt is calculated by subtracting cash and cash equivalents from short and long-term debt.
(4)Non-GAAP adjusted net debt/Non-GAAP adjusted EBITDA is calculated by dividing non-GAAP adjusted net debt by non-GAAP adjusted EBITDA.

Ritchie Bros.

48

Table of Contents

Operating Free Cash Flow (“OFCF”) Reconciliation

We believe OFCF, when compared on a trailing 12-month basis to different financial periods, provides an effective measure of the cash generated by our business and provides useful information regarding cash flows remaining for discretionary return to stockholders, mergers and acquisitions, or debt reduction. Our balance sheet scorecard includes OFCF as a performance metric. OFCF is also an element of the performance criteria for certain annual short-term and long-term incentive awards.

The following table reconciles OFCF to cash provided by operating activities, which is the most directly comparable GAAP measure in, or calculated from, our consolidated statements of cash flows:

12 months ended June 30, 

% Change

(in U.S. $ millions, except percentages)


2022


2021

2022 over 2021


Cash provided by operating activities

$

304.2

$

270.9

12

%

Property, plant and equipment additions


9.7


12.7


(24)

%

Intangible asset additions


32.0


33.0


(3)

%

Proceeds on disposition of property plant and equipment


(166.7)


(0.6)


27,683

%

Net capital spending

$

(125.0)

$

45.1

(377)

%

OFCF

$

429.2

$

225.8

90

%

(1)OFCF is calculated by subtracting net capital spending from cash provided by operating activities.

Ritchie Bros.

49

Table of Contents

Non-GAAP Adjusted Net Income Attributable to Stockholders and ROIC Reconciliation

We believe that comparing ROIC on a trailing 12-month basis for different financial periods, provides useful information about the after-tax return generated by our investments.

In 2021, we updated the calculation of non-GAAP adjusted net income attributable to stockholders to add-back certain adjustments that have been applied retrospectively to all periods presented, as applicable (refer to non-GAAP adjusted operating income reconciliation above).

The following table reconciles non-GAAP adjusted net income attributable to stockholders and ROIC to net income attributable to stockholders and return on average invested capital which are the most directly comparable GAAP measures in, or calculated from, our consolidated financial statements:

As at and for the 12 months ended June 30, 


% Change


(in U.S. $millions, except percentages)


2022


2021


2022 over 2021


Net income attributable to stockholders

$

294.4

$

183.2

61

%

Share-based payments expense


30.8


24.4


26

%  

Acquisition-related costs


37.3


12.0


211

%  

Amortization of acquired intangible assets

31.5

24.1

31

%  

Gain on disposition of property, plant and equipment and related costs

(169.9)

(0.5)

33,880

%  

Loss on redemption of the 2021 Notes and certain related interest expense

9.7

100

%  

Non-recurring advisory, legal and restructuring costs


6.6


4.2


57

%

Related tax effects of the above


(0.8)


(23.3)


(97)

%

Change in uncertain tax provision - tax effect


1.5


(100)

%  

Non-GAAP adjusted net income attributable to stockholders

$

239.6

$

225.6

6

%

Long-term debt - opening balance

$

636.5

$

632.0

1

%

Long-term debt - ending balance


644.4


636.5

1

%

Non-GAAP adjusted ending long-term debt

644.4

636.5

1

%

Average long-term debt

640.5

634.3

1

%

Non-GAAP adjusted average long-term debt

640.5

634.3

1

Stockholders' equity - opening balance

$

1,056.3

$

899.1

17

%

Stockholders' equity - ending balance


1,244.1


1,056.3

18

%

Average stockholders' equity


1,150.2


977.7

18

%

Average invested capital

$

1,790.8

$

1,612.0

11

%

Return on average invested capital


16.4

%  


11.4

%  

500

bps

Non-GAAP ROIC


13.4

%  


14.0

%  

(60)

bps

Non-GAAP ROIC excluding escrowed debt

13.4

%  

14.0

%  

(60)

bps

(1)Please refer to pages 51-53 for a summary of adjusting items during the trailing 12-months ended June 30, 2022 and June 30, 2021.
(2)Return on average invested capital is calculated as net income attributable to stockholders divided by average invested capital. We calculate average invested capital as the average long-term debt and average stockholders’ equity over a trailing 12-month period.
(3)ROIC is calculated as non-GAAP adjusted net income attributable to stockholders divided by average invested capital.
(4)Leases (Topic 842) requires lessees to recognize almost all leases, including operating leases, on the balance sheet through a right-of-use asset and a corresponding lease liability. The lease liability is not included in the calculation of debt.

Ritchie Bros.

50

Table of Contents

Adjusting Items Non-GAAP Measures

In 2021, we began adjusting for share-based payment expenses, amortization of acquired intangible assets and all gains or losses on disposition of property, plant and equipment, which we did not consider to be part of our normal operating results. These adjustments in 2021 have been applied retrospectively to all periods presented.

Adjusting items during the trailing 12-months ended June 30, 2022 were:

Recognized in the second quarter of 2022

$13.6 million share based payments expense.
$3.4 million of acquisition-related costs related to the proposed acquisition of Euro Auctions and the completed acquisitions of SmartEquip and Rouse.
$8.4 million amortization of acquired intangible assets primarily from the acquisitions of Iron Planet, SmartEquip, and Rouse.
$1.2 million gain on disposition of property, plant and equipment and related costs includes a $1.3 million non-cash cost in the quarter relating to the adjustment made to recognize the Bolton property sale proceeds at fair value when calculating the $169.0 million gain on the Bolton property in the first quarter of 2022, and $0.1 million gain on disposition of property, plant and equipment in the quarter.
$9.7 million loss on redemption of the 2021 Notes and certain related interest expense includes (a) $4.8 million of loss on redemption of the 2021 Notes due to a difference between the reacquisition price of the 2021 Notes and the net carrying amount of the extinguished debt (primarily the write off of the unamortized debt issuance costs), (b) $0.7 million of deferred debt issuance costs written off due to the expiry of the undrawn $205.0 million DDTL Facility in the quarter, and (c) non-recurring interest expense of $4.2 million incurred in the quarter relating to the 2021 Notes, which were redeemed as a result of the discontinued Euro Auctions acquisition in April 2022.
$1.1 million of non-recurring advisory, legal and restructuring costs, which include $0.6 million of terminated and ongoing transaction and legal costs relating to mergers and acquisition activity, $0.3 million of severance and retention costs in connection with the restructuring of our information technology team driven by our strategy to build a new digital technology platform, and $0.2 million of advisory costs relating to a cybersecurity incident detected in the fourth quarter of 2021.

Recognized in the first quarter of 2022

$5.4 million share based payments expense.
$8.5 million amortization of acquired intangible assets primarily from the acquisitions of Iron Planet, SmartEquip, and Rouse.
$169.8 million gain recognized on the disposition of property, plant and equipment of which $169.1 million related to the sale of a property located in Bolton, Ontario.
$9.6 million of acquisition-related costs related to the proposed acquisition of Euro Auctions and the completed acquisitions of SmartEquip and Rouse.
$1.3 million gain due to the change in fair value of derivatives to manage our exposure to foreign currency exchange rate fluctuations on the purchase consideration for the proposed acquisition of Euro Auctions.
$2.3 million of non-recurring advisory, legal and restructuring costs, which include $0.9 million related to severance and retention costs in connection with the restructuring of our information technology team driven by our strategy to build a new digital technology platform, $0.5 million of terminated and ongoing transaction and legal costs relating to mergers and acquisition activity, $0.4 million of SOX remediation costs, and $0.6 million of advisory costs relating to a cybersecurity incident detected in the fourth quarter of 2021.

Ritchie Bros.

51

Table of Contents

Recognized in the fourth quarter of 2021

$6.2 million share based payments expense.
$7.9 million amortization of acquired intangible assets primarily from the acquisitions of Iron Planet, SmartEquip, and Rouse.
$14.0 million of acquisition-related costs related to the proposed acquisition of Euro Auctions and the completed acquisitions of SmartEquip and Rouse.
$0.1 million gain recognized on the disposition of property, plant and equipment
$1.3 million loss due to the change in fair value of derivatives to manage our exposure to foreign currency exchange rate fluctuations on the purchase consideration for the proposed acquisition of Euro Auctions.
$2.6 million of non-recurring advisory, legal and restructuring costs, which include $1.4 million of terminated and ongoing transaction and legal costs relating to mergers and acquisition activity, $0.7 million of SOX remediation costs relating to our efforts to remediate the material weaknesses identified in 2020, and $0.5 million of advisory costs relating to a cybersecurity incident detected in the fourth quarter of 2021.

Recognized in the third quarter of 2021

$5.6 million share based payments expense.
$6.6 million amortization of acquired intangible assets primarily from the acquisitions of Iron Planet and Rouse.
$10.3 million of acquisition-related costs related to the acquisitions of Rouse, and SmartEquip and proposed acquisition of Euro Auctions.
$1.1 million gain recognized on the sale of a property in Denver, Colorado.
$0.7 million of non-recurring advisory, legal and restructuring costs related to SOX remediation costs relating to our efforts to remediate the material weaknesses identified in 2020, which has been retrospectively applied to the third quarter of 2021.

Recognized in the second quarter of 2021

$7.5 million share based payments expense.
$6.8 million amortization of acquired intangible assets primarily from the acquisitions of Iron Planet and Rouse.
$3.0 million of acquisition-related costs related to the acquisition of Rouse.
$0.2 million gain recognized on the disposition of property, plant and equipment
$0.2 million of non-recurring advisory, legal and restructuring costs related to SOX remediation costs relating to our efforts to remediate the material weaknesses identified in 2020, which has been retrospectively applied to the second quarter of 2021.

Ritchie Bros.

52

Table of Contents

Adjusting items during the trailing 12-months ended June 30, 2021 were:

Recognized in the first quarter of 2021

$3.8 million share based payments expense.
$6.6 million amortization of acquired intangible assets primarily from the acquisitions of Iron Planet and Rouse.
$2.9 million of acquisition-related costs related to the acquisition of Rouse.

Recognized in the fourth quarter of 2020

$4.6 million share based payments expense.
$5.6 million amortization of acquired intangible assets primarily from the acquisitions of Iron Planet and Rouse.
$6.0 million of acquisition-related costs related to the acquisition of Rouse.
$1.5 million of current income tax expense recognized related to an unfavourable adjustment to reflect final regulations published in the second quarter of 2020 regarding hybrid financing arrangements. 

Recognized in the third quarter of 2020

$8.6 million share based payments expense.
$5.0 million amortization of acquired intangible assets primarily from the acquisitions of Iron Planet.
$0.3 million gain recognized on the disposition of property, plant and equipment
$3.9 million of severance costs, recognized in non-recurring advisory, legal and restructuring costs, related to the realignment of leadership to support the new global operations organization, in line with strategic growth priorities led by the new CEO. These severance costs were reclassified to non-recurring advisory, legal and restructuring costs in 2021.

Ritchie Bros.

53

Table of Contents

ITEM 3:     QUANTITATIVE AND QUALITATIVE DISCLOSURES ABOUT MARKET RISK

There have been no material changes to our market risk during the six months ended June 30, 2022 from those disclosed in Item 7A in our Annual Report on Form 10-K for the year ended December 31, 2021, which is available on our website at www.rbauction.com, on EDGAR at www.sec.gov, or on SEDAR at www.sedar.com.

ITEM 4:     CONTROLS AND PROCEDURES

Disclosure Controls and Procedures

Management of the Company, including the Chief Executive Officer (“CEO”) and Chief Financial Officer (“CFO”), have evaluated the effectiveness of the Company’s disclosure controls and procedures as at June 30, 2022. The term “disclosure controls and procedures” means controls and other procedures established by the Company that are designed to ensure that information required to be disclosed by the Company in the reports that it files or submits under the Exchange Act is recorded, processed, summarized and reported within the time periods specified in the SEC’s rules and forms. Disclosure controls and procedures include, without limitation, controls and procedures designed to ensure that information required to be disclosed by the Company in the reports that it files or submits under the Exchange Act is accumulated and communicated to the Company’s management, including its CEO and CFO, as appropriate, to allow timely decisions regarding required disclosure.

Based upon their evaluation of the Company’s disclosure controls and procedures, the CEO and the CFO concluded that, as of June 30, 2022, the disclosure controls are effective to provide reasonable assurance that information required to be disclosed by the Company in the reports that it files or submits under the Exchange Act is accumulated and communicated to management, including the CEO and CFO, as appropriate, to allow timely decisions regarding required disclosure and are effective to provide reasonable assurance that such information is recorded, processed, summarized and reported within the time periods specified by the SEC’s rules and forms.

On November 2, 2021, the Company completed the acquisition of SmartEquip. SEC guidance permits management to exclude acquisitions from their assessment of internal control over financial reporting during the first year of an acquisition. The Company is in the process of incorporating SmartEquip into its system of internal control over financial reporting. SmartEquip’s total assets and revenues constituted 6.8% and 1.0%, respectively, of the Company’s total assets and revenues as shown in its consolidated financial statements for the three month period ended June 30, 2022.

Changes in Internal Control over Financial Reporting

Management, with the participation of the CEO and CFO, concluded that there were no changes in our internal control over financial reporting during the quarter ended June 30, 2022 that have materially affected, or are reasonably likely to materially affect, the Company’s internal control over financial reporting.

Ritchie Bros.

54

Table of Contents

PART II – OTHER INFORMATION

ITEM 1:     LEGAL PROCEEDINGS

We have no material legal proceedings pending, other than ordinary routine litigation incidental to the business, and we do not know of any material proceedings contemplated by governmental authorities.

ITEM 1A:     RISK FACTORS

Our business is subject to a number of risks and uncertainties, and our past performance is no guarantee of our performance in future periods. In addition to the other information set forth in this Quarterly Report on Form 10-Q, you should carefully consider the risks and uncertainties discussed in “Part I, Item 1A: Risk Factors” of our Annual Report on Form 10-K for the year ended December 31, 2021, which is available on our website at www.rbauction.com, on EDGAR at www.sec.gov, or on SEDAR at www.sedar.com, before purchasing our common shares. Our business could also be affected by additional risks not currently known to us or that we currently deem to be immaterial. If any of the risks actually occur, our business, financial condition and results of operations could materially suffer. As a result, the trading price of our common shares could decline, and you may lose all or part of your investment.

There were no material changes in risk factors during the three months or six months ended June 30, 2022.

ITEM 2: UNREGISTERED SALES OF EQUITY SECURITIES AND USE OF PROCEEDS

None.

ITEM 3:     DEFAULTS UPON SENIOR SECURITIES

None.

ITEM 4:     MINE SAFETY DISCLOSURES

Not applicable.

ITEM 5:     OTHER INFORMATION

None.

Ritchie Bros.

55

Table of Contents

ITEM 6:     EXHIBITS

Exhibits

The exhibits listed in below are filed as part of this Quarterly Report on Form 10-Q and incorporated herein by reference.

Exhibit

Number


Document

10.1

Employment Agreement between Ritchie Bros. Auctioneers (Canada) Ltd. and Eric Jacobs, dated May 31, 2022

31.1

Certification of Chief Executive Officer pursuant to Rule 13a-14(a) under the Securities Exchange Act of 1934, as amended

31.2

Certification of Chief Financial Officer pursuant to Rule 13a-14(a) under the Securities Exchange Act of 1934, as amended

32.1

Certification of Chief Executive Officer pursuant to 18 U.S.C. Section 1350, as adopted pursuant to Section 906 of the Sarbanes-Oxley Act of 2002

32.2

Certification of Chief Financial Officer pursuant to 18 U.S.C. Section 1350, as adopted pursuant to Section 906 of the Sarbanes-Oxley Act of 2002

101

Interactive Data Files Pursuant to Rule 405 of Regulation S-T , for the Company’s Quarterly Report on Form 10-Q for the quarter ended June 30, 2022, formatted in Inline XBRL: (i) Condensed Consolidated Income Statements; (ii) Condensed Consolidated Balance Sheets; (iii) Condensed Consolidated Statements of Changes in Equity; (iv) Condensed Consolidated Statements of Cash Flows; and (v) Notes to the Condensed Consolidated Financial Statements

104

Cover page from the Company’s Quarterly Report on Form 10-Q for the quarter ended June 30, 2022, formatted in Inline XBRL and contained in Exhibit 101

Ritchie Bros.

56

Table of Contents

SIGNATURES

Pursuant to the requirements of the Securities Exchange Act of 1934, the registrant has duly caused this report to be signed on its behalf by the undersigned, thereunto duly authorized.

RITCHIE BROS. AUCTIONEERS INCORPORATED

Dated: August 4, 2022

By:

/s/ Ann Fandozzi

Ann Fandozzi

Chief Executive Officer

Dated: August 4, 2022

By:

/s/ Eric Jacobs

Eric Jacobs

Chief Financial Officer

Ritchie Bros.

57