0001046025false2020FYP3Y0M0Dus-gaap:OtherLiabilitiesus-gaap:OtherLiabilities00010460252020-01-012020-12-31iso4217:USD00010460252020-06-30xbrli:shares00010460252021-02-1700010460252020-12-3100010460252019-12-31iso4217:USDxbrli:shares00010460252019-01-012019-12-3100010460252018-01-012018-12-310001046025us-gaap:AccumulatedOtherComprehensiveIncomeMember2020-01-012020-12-310001046025us-gaap:AccumulatedOtherComprehensiveIncomeMember2019-01-012019-12-310001046025us-gaap:AccumulatedOtherComprehensiveIncomeMember2018-01-012018-12-310001046025us-gaap:CommonStockMember2019-12-310001046025us-gaap:RetainedEarningsMember2019-12-310001046025us-gaap:AccumulatedOtherComprehensiveIncomeMember2019-12-310001046025us-gaap:RetainedEarningsMembersrt:CumulativeEffectPeriodOfAdoptionAdjustmentMember2019-12-310001046025us-gaap:AccumulatedOtherComprehensiveIncomeMembersrt:CumulativeEffectPeriodOfAdoptionAdjustmentMember2019-12-310001046025srt:CumulativeEffectPeriodOfAdoptionAdjustmentMember2019-12-310001046025us-gaap:CommonStockMember2020-01-012020-12-310001046025us-gaap:RetainedEarningsMember2020-01-012020-12-310001046025us-gaap:CommonStockMember2020-12-310001046025us-gaap:RetainedEarningsMember2020-12-310001046025us-gaap:AccumulatedOtherComprehensiveIncomeMember2020-12-310001046025us-gaap:CommonStockMember2018-12-310001046025us-gaap:RetainedEarningsMember2018-12-310001046025us-gaap:AccumulatedOtherComprehensiveIncomeMember2018-12-3100010460252018-12-310001046025us-gaap:RetainedEarningsMembersrt:CumulativeEffectPeriodOfAdoptionAdjustmentMember2018-12-310001046025us-gaap:AccumulatedOtherComprehensiveIncomeMembersrt:CumulativeEffectPeriodOfAdoptionAdjustmentMember2018-12-310001046025srt:CumulativeEffectPeriodOfAdoptionAdjustmentMember2018-12-310001046025us-gaap:CommonStockMember2019-01-012019-12-310001046025us-gaap:RetainedEarningsMember2019-01-012019-12-310001046025us-gaap:CommonStockMember2017-12-310001046025us-gaap:RetainedEarningsMember2017-12-310001046025us-gaap:AccumulatedOtherComprehensiveIncomeMember2017-12-3100010460252017-12-310001046025us-gaap:RetainedEarningsMembersrt:CumulativeEffectPeriodOfAdoptionAdjustmentMember2017-12-310001046025us-gaap:AccumulatedOtherComprehensiveIncomeMembersrt:CumulativeEffectPeriodOfAdoptionAdjustmentMember2017-12-310001046025srt:CumulativeEffectPeriodOfAdoptionAdjustmentMember2017-12-310001046025us-gaap:CommonStockMember2018-01-012018-12-310001046025us-gaap:RetainedEarningsMember2018-01-012018-12-31hfwa:branch0001046025hfwa:HeritageBankMember2020-12-310001046025hfwa:UnusedCommitmentstoExtendCreditMember2020-12-310001046025us-gaap:BuildingAndBuildingImprovementsMembersrt:MinimumMember2020-01-012020-12-310001046025us-gaap:BuildingAndBuildingImprovementsMembersrt:MaximumMember2020-01-012020-12-310001046025srt:MinimumMemberus-gaap:FurnitureAndFixturesMember2020-01-012020-12-310001046025us-gaap:FurnitureAndFixturesMembersrt:MaximumMember2020-01-012020-12-31hfwa:tranch0001046025srt:SubsidiariesMemberus-gaap:InvestmentCreditMember2020-12-31xbrli:purehfwa:segment0001046025us-gaap:AccountingStandardsUpdate201602Member2019-01-010001046025country:US2019-12-310001046025us-gaap:StateAndLocalJurisdictionMember2019-12-310001046025hfwa:PurchaseCreditImpairedLoansMemberDomain2020-01-010001046025hfwa:TotalAllowanceForCreditLossesMember2020-01-010001046025hfwa:PurchaseCreditImpairedLoansMember2020-01-010001046025us-gaap:AccountingStandardsUpdate201613Member2020-01-0100010460252020-01-010001046025hfwa:UnusedCommitmentstoExtendCreditMembersrt:CumulativeEffectPeriodOfAdoptionAdjustmentMember2019-12-310001046025hfwa:UnusedCommitmentstoExtendCreditMember2020-01-010001046025hfwa:PugetSoundBankMember2018-01-160001046025hfwa:PugetSoundBankMember2018-01-162018-01-160001046025hfwa:PugetSoundBankMember2018-01-120001046025hfwa:PugetSoundBankMember2020-01-012020-12-310001046025hfwa:PugetSoundBankMember2019-01-012019-12-310001046025hfwa:PugetSoundBankMember2018-01-012018-12-310001046025hfwa:PremierCommercialBancorpMember2018-07-020001046025hfwa:PremierCommercialBancorpMember2018-07-022018-07-020001046025hfwa:PremierCommercialBancorpMember2018-06-290001046025hfwa:PremierCommercialBancorpMember2020-01-012020-12-310001046025hfwa:PremierCommercialBancorpMember2019-01-012019-12-310001046025hfwa:PremierCommercialBancorpMember2018-01-012018-12-310001046025us-gaap:USTreasuryAndGovernmentMember2020-12-310001046025us-gaap:MunicipalBondsMember2020-12-310001046025us-gaap:ResidentialMortgageBackedSecuritiesMember2020-12-310001046025us-gaap:CommercialMortgageBackedSecuritiesMember2020-12-310001046025us-gaap:CorporateDebtSecuritiesMember2020-12-310001046025us-gaap:OtherAggregatedInvestmentsMember2020-12-310001046025us-gaap:USTreasuryAndGovernmentMember2019-12-310001046025us-gaap:MunicipalBondsMember2019-12-310001046025us-gaap:ResidentialMortgageBackedSecuritiesMember2019-12-310001046025us-gaap:CommercialMortgageBackedSecuritiesMember2019-12-310001046025us-gaap:CorporateDebtSecuritiesMember2019-12-310001046025us-gaap:OtherAggregatedInvestmentsMember2019-12-310001046025us-gaap:AvailableforsaleSecuritiesMember2020-12-310001046025us-gaap:AvailableforsaleSecuritiesMember2019-12-310001046025hfwa:WashingtonAndOregonStateToSecurePublicDepositsMember2020-12-310001046025hfwa:WashingtonAndOregonStateToSecurePublicDepositsMember2019-12-310001046025us-gaap:RepurchaseAgreementsMember2020-12-310001046025us-gaap:RepurchaseAgreementsMember2019-12-310001046025hfwa:OtherSecuritiesPledgedMember2020-12-310001046025hfwa:OtherSecuritiesPledgedMember2019-12-310001046025us-gaap:LoansReceivableMember2020-12-310001046025us-gaap:LoansReceivableMember2019-12-310001046025us-gaap:LoansAndFinanceReceivablesMember2020-12-310001046025us-gaap:CommercialPortfolioSegmentMemberhfwa:CommercialAndIndustrialMember2020-12-310001046025us-gaap:CommercialPortfolioSegmentMemberhfwa:CommercialAndIndustrialMember2019-12-310001046025us-gaap:CommercialPortfolioSegmentMemberhfwa:PaycheckProtectionProgramMember2020-12-310001046025us-gaap:CommercialPortfolioSegmentMemberhfwa:PaycheckProtectionProgramMember2019-12-310001046025us-gaap:CommercialPortfolioSegmentMemberhfwa:OwnerOccupiedCommercialRealEstateMember2020-12-310001046025us-gaap:CommercialPortfolioSegmentMemberhfwa:OwnerOccupiedCommercialRealEstateMember2019-12-310001046025us-gaap:CommercialPortfolioSegmentMemberhfwa:NonOwnerOccupiedCommercialRealEstateMember2020-12-310001046025us-gaap:CommercialPortfolioSegmentMemberhfwa:NonOwnerOccupiedCommercialRealEstateMember2019-12-310001046025us-gaap:CommercialPortfolioSegmentMember2020-12-310001046025us-gaap:CommercialPortfolioSegmentMember2019-12-310001046025us-gaap:ResidentialPortfolioSegmentMember2020-12-310001046025us-gaap:ResidentialPortfolioSegmentMember2019-12-310001046025hfwa:OnetoFourFamilyRealEstateConstructionMemberhfwa:RealEstateConstructionAndLandDevelopmentMember2020-12-310001046025hfwa:OnetoFourFamilyRealEstateConstructionMemberhfwa:RealEstateConstructionAndLandDevelopmentMember2019-12-310001046025hfwa:RealEstateConstructionAndLandDevelopmentMemberhfwa:FiveOrMoreFamilyResidentialAndCommercialPropertiesMember2020-12-310001046025hfwa:RealEstateConstructionAndLandDevelopmentMemberhfwa:FiveOrMoreFamilyResidentialAndCommercialPropertiesMember2019-12-310001046025hfwa:RealEstateConstructionAndLandDevelopmentMember2020-12-310001046025hfwa:RealEstateConstructionAndLandDevelopmentMember2019-12-310001046025us-gaap:ConsumerPortfolioSegmentMember2020-12-310001046025us-gaap:ConsumerPortfolioSegmentMember2019-12-310001046025us-gaap:CommercialPortfolioSegmentMembersrt:MinimumMemberhfwa:SBAPPPLoansMember2020-01-012020-12-310001046025us-gaap:CommercialPortfolioSegmentMemberhfwa:SBAPPPLoansMembersrt:MaximumMember2020-01-012020-12-310001046025us-gaap:CommercialPortfolioSegmentMemberhfwa:SBAPPPLoansMember2020-01-012020-12-310001046025us-gaap:CommercialPortfolioSegmentMemberhfwa:SBAPPPLoansMember2020-12-310001046025us-gaap:ResidentialPortfolioSegmentMember2020-01-012020-12-310001046025srt:MinimumMemberus-gaap:ResidentialPortfolioSegmentMember2020-01-012020-12-310001046025us-gaap:ResidentialPortfolioSegmentMembersrt:MaximumMember2020-01-012020-12-310001046025hfwa:RealEstateConstructionAndLandDevelopmentMemberhfwa:CommercialBusinessMember2020-01-012020-12-310001046025hfwa:RealEstateConstructionAndLandDevelopmentMemberhfwa:CommercialBusinessMember2019-01-012019-12-310001046025us-gaap:CommercialPortfolioSegmentMemberus-gaap:PassMemberhfwa:CommercialAndIndustrialMember2020-12-310001046025us-gaap:CommercialPortfolioSegmentMemberus-gaap:SpecialMentionMemberhfwa:CommercialAndIndustrialMember2020-12-310001046025us-gaap:CommercialPortfolioSegmentMemberus-gaap:SubstandardMemberhfwa:CommercialAndIndustrialMember2020-12-310001046025us-gaap:CommercialPortfolioSegmentMemberus-gaap:PassMemberhfwa:PaycheckProtectionProgramMember2020-12-310001046025us-gaap:CommercialPortfolioSegmentMemberus-gaap:PassMemberhfwa:OwnerOccupiedCommercialRealEstateMember2020-12-310001046025us-gaap:CommercialPortfolioSegmentMemberus-gaap:SpecialMentionMemberhfwa:OwnerOccupiedCommercialRealEstateMember2020-12-310001046025us-gaap:CommercialPortfolioSegmentMemberus-gaap:SubstandardMemberhfwa:OwnerOccupiedCommercialRealEstateMember2020-12-310001046025us-gaap:CommercialPortfolioSegmentMemberus-gaap:PassMemberhfwa:NonOwnerOccupiedCommercialRealEstateMember2020-12-310001046025us-gaap:CommercialPortfolioSegmentMemberhfwa:NonOwnerOccupiedCommercialRealEstateMemberus-gaap:SpecialMentionMember2020-12-310001046025us-gaap:CommercialPortfolioSegmentMemberhfwa:NonOwnerOccupiedCommercialRealEstateMemberus-gaap:SubstandardMember2020-12-310001046025us-gaap:CommercialPortfolioSegmentMemberus-gaap:PassMember2020-12-310001046025us-gaap:CommercialPortfolioSegmentMemberus-gaap:SpecialMentionMember2020-12-310001046025us-gaap:CommercialPortfolioSegmentMemberus-gaap:SubstandardMember2020-12-310001046025us-gaap:PassMemberus-gaap:ResidentialPortfolioSegmentMember2020-12-310001046025us-gaap:ResidentialPortfolioSegmentMemberus-gaap:SubstandardMember2020-12-310001046025us-gaap:PassMemberhfwa:OnetoFourFamilyRealEstateConstructionMemberhfwa:RealEstateConstructionAndLandDevelopmentMember2020-12-310001046025hfwa:OnetoFourFamilyRealEstateConstructionMemberhfwa:RealEstateConstructionAndLandDevelopmentMemberus-gaap:SubstandardMember2020-12-310001046025us-gaap:PassMemberhfwa:RealEstateConstructionAndLandDevelopmentMemberhfwa:FiveOrMoreFamilyResidentialAndCommercialPropertiesMember2020-12-310001046025hfwa:RealEstateConstructionAndLandDevelopmentMemberhfwa:FiveOrMoreFamilyResidentialAndCommercialPropertiesMemberus-gaap:SpecialMentionMember2020-12-310001046025hfwa:RealEstateConstructionAndLandDevelopmentMemberhfwa:FiveOrMoreFamilyResidentialAndCommercialPropertiesMemberus-gaap:SubstandardMember2020-12-310001046025us-gaap:PassMemberhfwa:RealEstateConstructionAndLandDevelopmentMember2020-12-310001046025hfwa:RealEstateConstructionAndLandDevelopmentMemberus-gaap:SpecialMentionMember2020-12-310001046025hfwa:RealEstateConstructionAndLandDevelopmentMemberus-gaap:SubstandardMember2020-12-310001046025us-gaap:PassMemberus-gaap:ConsumerPortfolioSegmentMember2020-12-310001046025us-gaap:SubstandardMemberus-gaap:ConsumerPortfolioSegmentMember2020-12-310001046025us-gaap:PassMember2020-12-310001046025us-gaap:SpecialMentionMember2020-12-310001046025us-gaap:SubstandardMember2020-12-310001046025us-gaap:CommercialPortfolioSegmentMemberus-gaap:SpecialMentionMemberhfwa:OwnerOccupiedCommercialRealEstateMember2019-12-310001046025us-gaap:CommercialPortfolioSegmentMemberhfwa:NonaccrualMemberhfwa:CommercialAndIndustrialMember2020-01-012020-12-310001046025us-gaap:CommercialPortfolioSegmentMemberhfwa:NonaccrualMemberhfwa:CommercialAndIndustrialMember2019-01-012019-12-310001046025us-gaap:CommercialPortfolioSegmentMemberhfwa:NonaccrualMemberhfwa:OwnerOccupiedCommercialRealEstateMember2020-01-012020-12-310001046025us-gaap:CommercialPortfolioSegmentMemberhfwa:NonaccrualMemberhfwa:OwnerOccupiedCommercialRealEstateMember2019-01-012019-12-310001046025us-gaap:CommercialPortfolioSegmentMemberhfwa:NonaccrualMemberhfwa:NonOwnerOccupiedCommercialRealEstateMember2020-01-012020-12-310001046025us-gaap:CommercialPortfolioSegmentMemberhfwa:NonaccrualMemberhfwa:NonOwnerOccupiedCommercialRealEstateMember2019-01-012019-12-310001046025us-gaap:CommercialPortfolioSegmentMemberhfwa:NonaccrualMember2020-01-012020-12-310001046025us-gaap:CommercialPortfolioSegmentMemberhfwa:NonaccrualMember2019-01-012019-12-310001046025hfwa:NonaccrualMemberus-gaap:ResidentialPortfolioSegmentMember2020-01-012020-12-310001046025hfwa:NonaccrualMemberus-gaap:ResidentialPortfolioSegmentMember2019-01-012019-12-310001046025hfwa:NonaccrualMemberhfwa:OnetoFourFamilyRealEstateConstructionMemberhfwa:RealEstateConstructionAndLandDevelopmentMember2020-01-012020-12-310001046025hfwa:NonaccrualMemberhfwa:OnetoFourFamilyRealEstateConstructionMemberhfwa:RealEstateConstructionAndLandDevelopmentMember2019-01-012019-12-310001046025hfwa:NonaccrualMemberhfwa:RealEstateConstructionAndLandDevelopmentMemberhfwa:FiveOrMoreFamilyResidentialAndCommercialPropertiesMember2020-01-012020-12-310001046025hfwa:NonaccrualMemberhfwa:RealEstateConstructionAndLandDevelopmentMemberhfwa:FiveOrMoreFamilyResidentialAndCommercialPropertiesMember2019-01-012019-12-310001046025hfwa:NonaccrualMemberhfwa:RealEstateConstructionAndLandDevelopmentMember2020-01-012020-12-310001046025hfwa:NonaccrualMemberhfwa:RealEstateConstructionAndLandDevelopmentMember2019-01-012019-12-310001046025hfwa:NonaccrualMemberus-gaap:ConsumerPortfolioSegmentMember2020-01-012020-12-310001046025hfwa:NonaccrualMemberus-gaap:ConsumerPortfolioSegmentMember2019-01-012019-12-310001046025hfwa:NonaccrualMember2020-01-012020-12-310001046025hfwa:NonaccrualMember2019-01-012019-12-310001046025us-gaap:CommercialPortfolioSegmentMemberhfwa:FinancingReceivables30to89DaysPastDueMemberhfwa:CommercialAndIndustrialMember2020-12-310001046025us-gaap:CommercialPortfolioSegmentMemberus-gaap:FinancingReceivablesEqualToGreaterThan90DaysPastDueMemberhfwa:CommercialAndIndustrialMember2020-12-310001046025us-gaap:CommercialPortfolioSegmentMemberhfwa:SBAPPPLoansMemberhfwa:FinancingReceivables30to89DaysPastDueMember2020-12-310001046025us-gaap:CommercialPortfolioSegmentMemberus-gaap:FinancingReceivablesEqualToGreaterThan90DaysPastDueMemberhfwa:SBAPPPLoansMember2020-12-310001046025us-gaap:CommercialPortfolioSegmentMemberhfwa:FinancingReceivables30to89DaysPastDueMemberhfwa:OwnerOccupiedCommercialRealEstateMember2020-12-310001046025us-gaap:CommercialPortfolioSegmentMemberus-gaap:FinancingReceivablesEqualToGreaterThan90DaysPastDueMemberhfwa:OwnerOccupiedCommercialRealEstateMember2020-12-310001046025us-gaap:CommercialPortfolioSegmentMemberhfwa:NonOwnerOccupiedCommercialRealEstateMemberhfwa:FinancingReceivables30to89DaysPastDueMember2020-12-310001046025us-gaap:CommercialPortfolioSegmentMemberhfwa:NonOwnerOccupiedCommercialRealEstateMemberus-gaap:FinancingReceivablesEqualToGreaterThan90DaysPastDueMember2020-12-310001046025us-gaap:CommercialPortfolioSegmentMemberhfwa:FinancingReceivables30to89DaysPastDueMember2020-12-310001046025us-gaap:CommercialPortfolioSegmentMemberus-gaap:FinancingReceivablesEqualToGreaterThan90DaysPastDueMember2020-12-310001046025us-gaap:ResidentialPortfolioSegmentMemberhfwa:FinancingReceivables30to89DaysPastDueMember2020-12-310001046025us-gaap:ResidentialPortfolioSegmentMemberus-gaap:FinancingReceivablesEqualToGreaterThan90DaysPastDueMember2020-12-310001046025hfwa:OnetoFourFamilyRealEstateConstructionMemberhfwa:RealEstateConstructionAndLandDevelopmentMemberhfwa:FinancingReceivables30to89DaysPastDueMember2020-12-310001046025hfwa:OnetoFourFamilyRealEstateConstructionMemberhfwa:RealEstateConstructionAndLandDevelopmentMemberus-gaap:FinancingReceivablesEqualToGreaterThan90DaysPastDueMember2020-12-310001046025hfwa:RealEstateConstructionAndLandDevelopmentMemberhfwa:FiveOrMoreFamilyResidentialAndCommercialPropertiesMemberhfwa:FinancingReceivables30to89DaysPastDueMember2020-12-310001046025hfwa:RealEstateConstructionAndLandDevelopmentMemberus-gaap:FinancingReceivablesEqualToGreaterThan90DaysPastDueMemberhfwa:FiveOrMoreFamilyResidentialAndCommercialPropertiesMember2020-12-310001046025hfwa:RealEstateConstructionAndLandDevelopmentMemberhfwa:FinancingReceivables30to89DaysPastDueMember2020-12-310001046025hfwa:RealEstateConstructionAndLandDevelopmentMemberus-gaap:FinancingReceivablesEqualToGreaterThan90DaysPastDueMember2020-12-310001046025hfwa:FinancingReceivables30to89DaysPastDueMemberus-gaap:ConsumerPortfolioSegmentMember2020-12-310001046025us-gaap:FinancingReceivablesEqualToGreaterThan90DaysPastDueMemberus-gaap:ConsumerPortfolioSegmentMember2020-12-310001046025hfwa:FinancingReceivables30to89DaysPastDueMember2020-12-310001046025us-gaap:FinancingReceivablesEqualToGreaterThan90DaysPastDueMember2020-12-310001046025us-gaap:CommercialPortfolioSegmentMemberhfwa:FinancingReceivables30to89DaysPastDueMemberhfwa:CommercialAndIndustrialMember2019-12-310001046025us-gaap:CommercialPortfolioSegmentMemberus-gaap:FinancingReceivablesEqualToGreaterThan90DaysPastDueMemberhfwa:CommercialAndIndustrialMember2019-12-310001046025us-gaap:CommercialPortfolioSegmentMemberhfwa:FinancingReceivables30to89DaysPastDueMemberhfwa:OwnerOccupiedCommercialRealEstateMember2019-12-310001046025us-gaap:CommercialPortfolioSegmentMemberus-gaap:FinancingReceivablesEqualToGreaterThan90DaysPastDueMemberhfwa:OwnerOccupiedCommercialRealEstateMember2019-12-310001046025us-gaap:CommercialPortfolioSegmentMemberhfwa:NonOwnerOccupiedCommercialRealEstateMemberhfwa:FinancingReceivables30to89DaysPastDueMember2019-12-310001046025us-gaap:CommercialPortfolioSegmentMemberhfwa:NonOwnerOccupiedCommercialRealEstateMemberus-gaap:FinancingReceivablesEqualToGreaterThan90DaysPastDueMember2019-12-310001046025us-gaap:CommercialPortfolioSegmentMemberhfwa:FinancingReceivables30to89DaysPastDueMember2019-12-310001046025us-gaap:CommercialPortfolioSegmentMemberus-gaap:FinancingReceivablesEqualToGreaterThan90DaysPastDueMember2019-12-310001046025us-gaap:ResidentialPortfolioSegmentMemberhfwa:FinancingReceivables30to89DaysPastDueMember2019-12-310001046025us-gaap:ResidentialPortfolioSegmentMemberus-gaap:FinancingReceivablesEqualToGreaterThan90DaysPastDueMember2019-12-310001046025hfwa:OnetoFourFamilyRealEstateConstructionMemberhfwa:RealEstateConstructionAndLandDevelopmentMemberhfwa:FinancingReceivables30to89DaysPastDueMember2019-12-310001046025hfwa:OnetoFourFamilyRealEstateConstructionMemberhfwa:RealEstateConstructionAndLandDevelopmentMemberus-gaap:FinancingReceivablesEqualToGreaterThan90DaysPastDueMember2019-12-310001046025hfwa:RealEstateConstructionAndLandDevelopmentMemberhfwa:FiveOrMoreFamilyResidentialAndCommercialPropertiesMemberhfwa:FinancingReceivables30to89DaysPastDueMember2019-12-310001046025hfwa:RealEstateConstructionAndLandDevelopmentMemberus-gaap:FinancingReceivablesEqualToGreaterThan90DaysPastDueMemberhfwa:FiveOrMoreFamilyResidentialAndCommercialPropertiesMember2019-12-310001046025hfwa:RealEstateConstructionAndLandDevelopmentMemberhfwa:FinancingReceivables30to89DaysPastDueMember2019-12-310001046025hfwa:RealEstateConstructionAndLandDevelopmentMemberus-gaap:FinancingReceivablesEqualToGreaterThan90DaysPastDueMember2019-12-310001046025hfwa:FinancingReceivables30to89DaysPastDueMemberus-gaap:ConsumerPortfolioSegmentMember2019-12-310001046025us-gaap:FinancingReceivablesEqualToGreaterThan90DaysPastDueMemberus-gaap:ConsumerPortfolioSegmentMember2019-12-310001046025hfwa:LoansReceivableExcludingPCILoansMemberhfwa:FinancingReceivables30to89DaysPastDueMember2019-12-310001046025hfwa:LoansReceivableExcludingPCILoansMemberus-gaap:FinancingReceivablesEqualToGreaterThan90DaysPastDueMember2019-12-310001046025hfwa:LoansReceivableExcludingPCILoansMember2019-12-310001046025us-gaap:CommercialPortfolioSegmentMemberus-gaap:CommercialRealEstateMemberhfwa:CommercialAndIndustrialMember2020-12-310001046025us-gaap:CommercialPortfolioSegmentMemberhfwa:FarmlandMemberhfwa:CommercialAndIndustrialMember2020-12-310001046025us-gaap:CommercialPortfolioSegmentMemberhfwa:SingleFamilyResidenceMemberhfwa:CommercialAndIndustrialMember2020-12-310001046025us-gaap:CommercialPortfolioSegmentMemberhfwa:EquipmentorAccountsReceivableMemberhfwa:CommercialAndIndustrialMember2020-12-310001046025us-gaap:CommercialPortfolioSegmentMemberhfwa:OtherMemberhfwa:CommercialAndIndustrialMember2020-12-310001046025us-gaap:CommercialPortfolioSegmentMemberus-gaap:CommercialRealEstateMemberhfwa:OwnerOccupiedCommercialRealEstateMember2020-12-310001046025us-gaap:CommercialPortfolioSegmentMemberhfwa:FarmlandMemberhfwa:OwnerOccupiedCommercialRealEstateMember2020-12-310001046025us-gaap:CommercialPortfolioSegmentMemberhfwa:SingleFamilyResidenceMemberhfwa:OwnerOccupiedCommercialRealEstateMember2020-12-310001046025us-gaap:CommercialPortfolioSegmentMemberhfwa:EquipmentorAccountsReceivableMemberhfwa:OwnerOccupiedCommercialRealEstateMember2020-12-310001046025us-gaap:CommercialPortfolioSegmentMemberhfwa:OtherMemberhfwa:OwnerOccupiedCommercialRealEstateMember2020-12-310001046025us-gaap:CommercialPortfolioSegmentMemberhfwa:NonOwnerOccupiedCommercialRealEstateMemberus-gaap:CommercialRealEstateMember2020-12-310001046025us-gaap:CommercialPortfolioSegmentMemberhfwa:NonOwnerOccupiedCommercialRealEstateMemberhfwa:FarmlandMember2020-12-310001046025us-gaap:CommercialPortfolioSegmentMemberhfwa:NonOwnerOccupiedCommercialRealEstateMemberhfwa:SingleFamilyResidenceMember2020-12-310001046025us-gaap:CommercialPortfolioSegmentMemberhfwa:NonOwnerOccupiedCommercialRealEstateMemberhfwa:EquipmentorAccountsReceivableMember2020-12-310001046025us-gaap:CommercialPortfolioSegmentMemberhfwa:NonOwnerOccupiedCommercialRealEstateMemberhfwa:OtherMember2020-12-310001046025us-gaap:CommercialPortfolioSegmentMemberus-gaap:CommercialRealEstateMember2020-12-310001046025us-gaap:CommercialPortfolioSegmentMemberhfwa:FarmlandMember2020-12-310001046025us-gaap:CommercialPortfolioSegmentMemberhfwa:SingleFamilyResidenceMember2020-12-310001046025us-gaap:CommercialPortfolioSegmentMemberhfwa:EquipmentorAccountsReceivableMember2020-12-310001046025us-gaap:CommercialPortfolioSegmentMemberhfwa:OtherMember2020-12-310001046025us-gaap:ResidentialPortfolioSegmentMemberus-gaap:CommercialRealEstateMember2020-12-310001046025us-gaap:ResidentialPortfolioSegmentMemberhfwa:FarmlandMember2020-12-310001046025us-gaap:ResidentialPortfolioSegmentMemberhfwa:SingleFamilyResidenceMember2020-12-310001046025us-gaap:ResidentialPortfolioSegmentMemberhfwa:EquipmentorAccountsReceivableMember2020-12-310001046025us-gaap:ResidentialPortfolioSegmentMemberhfwa:OtherMember2020-12-310001046025hfwa:RealEstateConstructionAndLandDevelopmentMemberhfwa:FiveOrMoreFamilyResidentialAndCommercialPropertiesMemberus-gaap:RealEstateMember2020-12-310001046025hfwa:RealEstateConstructionAndLandDevelopmentMemberhfwa:FiveOrMoreFamilyResidentialAndCommercialPropertiesMemberhfwa:FarmlandMember2020-12-310001046025hfwa:RealEstateConstructionAndLandDevelopmentMemberhfwa:FiveOrMoreFamilyResidentialAndCommercialPropertiesMembersrt:SingleFamilyMember2020-12-310001046025hfwa:RealEstateConstructionAndLandDevelopmentMemberhfwa:EquipmentorAccountsReceivableMemberhfwa:FiveOrMoreFamilyResidentialAndCommercialPropertiesMember2020-12-310001046025hfwa:RealEstateConstructionAndLandDevelopmentMemberhfwa:FiveOrMoreFamilyResidentialAndCommercialPropertiesMemberhfwa:OtherMember2020-12-310001046025us-gaap:RealEstateMemberus-gaap:ConsumerPortfolioSegmentMember2020-12-310001046025hfwa:FarmlandMemberus-gaap:ConsumerPortfolioSegmentMember2020-12-310001046025srt:SingleFamilyMemberus-gaap:ConsumerPortfolioSegmentMember2020-12-310001046025hfwa:EquipmentorAccountsReceivableMemberus-gaap:ConsumerPortfolioSegmentMember2020-12-310001046025hfwa:OtherMemberus-gaap:ConsumerPortfolioSegmentMember2020-12-310001046025us-gaap:CommercialRealEstateMember2020-12-310001046025hfwa:FarmlandMember2020-12-310001046025hfwa:SingleFamilyResidenceMember2020-12-310001046025hfwa:EquipmentorAccountsReceivableMember2020-12-310001046025hfwa:OtherMember2020-12-310001046025us-gaap:CommercialPortfolioSegmentMemberhfwa:CommercialAndIndustrialMember2019-01-012019-12-310001046025us-gaap:CommercialPortfolioSegmentMemberhfwa:CommercialAndIndustrialMember2018-01-012018-12-310001046025us-gaap:CommercialPortfolioSegmentMemberhfwa:OwnerOccupiedCommercialRealEstateMember2019-01-012019-12-310001046025us-gaap:CommercialPortfolioSegmentMemberhfwa:OwnerOccupiedCommercialRealEstateMember2018-01-012018-12-310001046025us-gaap:CommercialPortfolioSegmentMemberhfwa:NonOwnerOccupiedCommercialRealEstateMember2019-01-012019-12-310001046025us-gaap:CommercialPortfolioSegmentMemberhfwa:NonOwnerOccupiedCommercialRealEstateMember2018-01-012018-12-310001046025us-gaap:CommercialPortfolioSegmentMember2019-01-012019-12-310001046025us-gaap:CommercialPortfolioSegmentMember2018-01-012018-12-310001046025us-gaap:ResidentialPortfolioSegmentMember2019-01-012019-12-310001046025us-gaap:ResidentialPortfolioSegmentMember2018-01-012018-12-310001046025hfwa:OnetoFourFamilyRealEstateConstructionMemberhfwa:RealEstateConstructionAndLandDevelopmentMember2019-01-012019-12-310001046025hfwa:OnetoFourFamilyRealEstateConstructionMemberhfwa:RealEstateConstructionAndLandDevelopmentMember2018-01-012018-12-310001046025hfwa:RealEstateConstructionAndLandDevelopmentMemberhfwa:FiveOrMoreFamilyResidentialAndCommercialPropertiesMember2019-01-012019-12-310001046025hfwa:RealEstateConstructionAndLandDevelopmentMemberhfwa:FiveOrMoreFamilyResidentialAndCommercialPropertiesMember2018-01-012018-12-310001046025hfwa:RealEstateConstructionAndLandDevelopmentMember2019-01-012019-12-310001046025hfwa:RealEstateConstructionAndLandDevelopmentMember2018-01-012018-12-310001046025us-gaap:ConsumerPortfolioSegmentMember2019-01-012019-12-310001046025us-gaap:ConsumerPortfolioSegmentMember2018-01-012018-12-310001046025hfwa:TroubledDebtRestructuredLoansMember2020-01-012020-12-310001046025hfwa:TroubledDebtRestructuredLoansMember2019-01-012019-12-310001046025hfwa:TroubledDebtRestructuredLoansMember2018-01-012018-12-31hfwa:contract0001046025us-gaap:CommercialPortfolioSegmentMemberhfwa:TroubledDebtRestructuredLoansMemberhfwa:CommercialAndIndustrialMember2020-01-012020-12-310001046025us-gaap:CommercialPortfolioSegmentMemberhfwa:TroubledDebtRestructuredLoansMemberhfwa:CommercialAndIndustrialMember2019-01-012019-12-310001046025us-gaap:CommercialPortfolioSegmentMemberhfwa:TroubledDebtRestructuredLoansMemberhfwa:CommercialAndIndustrialMember2018-01-012018-12-310001046025us-gaap:CommercialPortfolioSegmentMemberhfwa:TroubledDebtRestructuredLoansMemberhfwa:OwnerOccupiedCommercialRealEstateMember2020-01-012020-12-310001046025us-gaap:CommercialPortfolioSegmentMemberhfwa:TroubledDebtRestructuredLoansMemberhfwa:OwnerOccupiedCommercialRealEstateMember2019-01-012019-12-310001046025us-gaap:CommercialPortfolioSegmentMemberhfwa:TroubledDebtRestructuredLoansMemberhfwa:OwnerOccupiedCommercialRealEstateMember2018-01-012018-12-310001046025us-gaap:CommercialPortfolioSegmentMemberhfwa:NonOwnerOccupiedCommercialRealEstateMemberhfwa:TroubledDebtRestructuredLoansMember2020-01-012020-12-310001046025us-gaap:CommercialPortfolioSegmentMemberhfwa:NonOwnerOccupiedCommercialRealEstateMemberhfwa:TroubledDebtRestructuredLoansMember2019-01-012019-12-310001046025us-gaap:CommercialPortfolioSegmentMemberhfwa:NonOwnerOccupiedCommercialRealEstateMemberhfwa:TroubledDebtRestructuredLoansMember2018-01-012018-12-310001046025us-gaap:CommercialPortfolioSegmentMemberhfwa:TroubledDebtRestructuredLoansMember2020-01-012020-12-310001046025us-gaap:CommercialPortfolioSegmentMemberhfwa:TroubledDebtRestructuredLoansMember2019-01-012019-12-310001046025us-gaap:CommercialPortfolioSegmentMemberhfwa:TroubledDebtRestructuredLoansMember2018-01-012018-12-310001046025hfwa:OnetoFourFamilyRealEstateConstructionMemberhfwa:TroubledDebtRestructuredLoansMember2020-01-012020-12-310001046025hfwa:OnetoFourFamilyRealEstateConstructionMemberhfwa:TroubledDebtRestructuredLoansMember2019-01-012019-12-310001046025hfwa:OnetoFourFamilyRealEstateConstructionMemberhfwa:TroubledDebtRestructuredLoansMember2018-01-012018-12-310001046025hfwa:OnetoFourFamilyRealEstateConstructionMemberhfwa:RealEstateConstructionAndLandDevelopmentMemberhfwa:TroubledDebtRestructuredLoansMember2020-01-012020-12-310001046025hfwa:OnetoFourFamilyRealEstateConstructionMemberhfwa:RealEstateConstructionAndLandDevelopmentMemberhfwa:TroubledDebtRestructuredLoansMember2019-01-012019-12-310001046025hfwa:OnetoFourFamilyRealEstateConstructionMemberhfwa:RealEstateConstructionAndLandDevelopmentMemberhfwa:TroubledDebtRestructuredLoansMember2018-01-012018-12-310001046025hfwa:RealEstateConstructionAndLandDevelopmentMemberhfwa:FiveOrMoreFamilyResidentialAndCommercialPropertiesMemberhfwa:TroubledDebtRestructuredLoansMember2020-01-012020-12-310001046025hfwa:RealEstateConstructionAndLandDevelopmentMemberhfwa:FiveOrMoreFamilyResidentialAndCommercialPropertiesMemberhfwa:TroubledDebtRestructuredLoansMember2019-01-012019-12-310001046025hfwa:RealEstateConstructionAndLandDevelopmentMemberhfwa:FiveOrMoreFamilyResidentialAndCommercialPropertiesMemberhfwa:TroubledDebtRestructuredLoansMember2018-01-012018-12-310001046025hfwa:RealEstateConstructionAndLandDevelopmentMemberhfwa:TroubledDebtRestructuredLoansMember2020-01-012020-12-310001046025hfwa:RealEstateConstructionAndLandDevelopmentMemberhfwa:TroubledDebtRestructuredLoansMember2019-01-012019-12-310001046025hfwa:RealEstateConstructionAndLandDevelopmentMemberhfwa:TroubledDebtRestructuredLoansMember2018-01-012018-12-310001046025hfwa:TroubledDebtRestructuredLoansMemberus-gaap:ConsumerPortfolioSegmentMember2020-01-012020-12-310001046025hfwa:TroubledDebtRestructuredLoansMemberus-gaap:ConsumerPortfolioSegmentMember2019-01-012019-12-310001046025hfwa:TroubledDebtRestructuredLoansMemberus-gaap:ConsumerPortfolioSegmentMember2018-01-012018-12-310001046025hfwa:ModifiedduringthequarterMemberhfwa:TroubledDebtRestructuredLoansMember2020-12-310001046025hfwa:ModifiedduringthequarterMemberhfwa:TroubledDebtRestructuredLoansMember2019-12-310001046025hfwa:ModifiedduringthequarterMemberhfwa:TroubledDebtRestructuredLoansMember2018-12-31hfwa:Contract0001046025hfwa:PastModifiedMaturityDateMemberhfwa:TroubledDebtRestructuredLoansMember2020-01-012020-12-310001046025hfwa:PastModifiedMaturityDateMemberhfwa:TroubledDebtRestructuredLoansMember2019-01-012019-12-310001046025hfwa:PastModifiedMaturityDateMemberhfwa:TroubledDebtRestructuredLoansMember2018-01-012018-12-310001046025us-gaap:FinancingReceivablesEqualToGreaterThan90DaysPastDueMemberhfwa:TroubledDebtRestructuredLoansMember2019-01-012019-12-310001046025us-gaap:FinancingReceivablesEqualToGreaterThan90DaysPastDueMemberhfwa:TroubledDebtRestructuredLoansMember2018-01-012018-12-310001046025hfwa:FinanceReceivableModifiedSubsequentDefaultMemberhfwa:TroubledDebtRestructuredLoansMember2020-12-310001046025hfwa:FinanceReceivableModifiedSubsequentDefaultMemberhfwa:TroubledDebtRestructuredLoansMember2019-12-310001046025hfwa:FinanceReceivableModifiedSubsequentDefaultMemberhfwa:TroubledDebtRestructuredLoansMember2018-12-310001046025hfwa:PurchaseCreditImpairedLoansMemberDomain2018-12-310001046025hfwa:PurchaseCreditImpairedLoansMemberDomain2017-12-310001046025hfwa:PurchaseCreditImpairedLoansMemberDomain2019-01-012019-12-310001046025hfwa:PurchaseCreditImpairedLoansMemberDomain2018-01-012018-12-310001046025hfwa:PurchaseCreditImpairedLoansMemberDomain2019-12-310001046025hfwa:SBALoansMember2020-12-310001046025hfwa:SBALoansMember2019-12-310001046025hfwa:SBALoansMember2020-01-012020-12-310001046025hfwa:SBALoansMember2019-01-012019-12-310001046025hfwa:SBALoansMember2018-01-012018-12-310001046025us-gaap:MeasurementInputDiscountRateMembersrt:MinimumMember2020-12-310001046025srt:MinimumMemberus-gaap:MeasurementInputPrepaymentRateMember2020-12-310001046025us-gaap:MeasurementInputPrepaymentRateMembersrt:MaximumMember2020-12-310001046025us-gaap:MeasurementInputDiscountRateMembersrt:MinimumMember2019-12-310001046025us-gaap:MeasurementInputDiscountRateMembersrt:MaximumMember2019-12-310001046025srt:MinimumMemberus-gaap:MeasurementInputPrepaymentRateMember2019-12-310001046025us-gaap:MeasurementInputPrepaymentRateMembersrt:MaximumMember2019-12-310001046025srt:CumulativeEffectPeriodOfAdoptionAdjustedBalanceMember2019-12-310001046025srt:CumulativeEffectPeriodOfAdoptionAdjustedBalanceMember2018-12-310001046025srt:CumulativeEffectPeriodOfAdoptionAdjustedBalanceMember2017-12-310001046025us-gaap:CommercialPortfolioSegmentMemberus-gaap:AccountingStandardsUpdate201613Memberhfwa:CommercialAndIndustrialMember2020-01-010001046025us-gaap:CommercialPortfolioSegmentMemberhfwa:CommercialAndIndustrialMember2020-01-010001046025us-gaap:CommercialPortfolioSegmentMemberhfwa:CommercialAndIndustrialMember2020-01-012020-12-310001046025us-gaap:CommercialPortfolioSegmentMemberus-gaap:AccountingStandardsUpdate201613Memberhfwa:PaycheckProtectionProgramMember2020-01-010001046025us-gaap:CommercialPortfolioSegmentMemberhfwa:PaycheckProtectionProgramMember2020-01-010001046025us-gaap:CommercialPortfolioSegmentMemberhfwa:PaycheckProtectionProgramMember2020-01-012020-12-310001046025us-gaap:CommercialPortfolioSegmentMemberus-gaap:AccountingStandardsUpdate201613Memberhfwa:OwnerOccupiedCommercialRealEstateMember2020-01-010001046025us-gaap:CommercialPortfolioSegmentMemberhfwa:OwnerOccupiedCommercialRealEstateMember2020-01-010001046025us-gaap:CommercialPortfolioSegmentMemberhfwa:OwnerOccupiedCommercialRealEstateMember2020-01-012020-12-310001046025us-gaap:CommercialPortfolioSegmentMemberhfwa:NonOwnerOccupiedCommercialRealEstateMemberus-gaap:AccountingStandardsUpdate201613Member2020-01-010001046025us-gaap:CommercialPortfolioSegmentMemberhfwa:NonOwnerOccupiedCommercialRealEstateMember2020-01-010001046025us-gaap:CommercialPortfolioSegmentMemberhfwa:NonOwnerOccupiedCommercialRealEstateMember2020-01-012020-12-310001046025us-gaap:CommercialPortfolioSegmentMemberus-gaap:AccountingStandardsUpdate201613Member2020-01-010001046025us-gaap:CommercialPortfolioSegmentMember2020-01-010001046025us-gaap:CommercialPortfolioSegmentMember2020-01-012020-12-310001046025us-gaap:ResidentialPortfolioSegmentMemberus-gaap:AccountingStandardsUpdate201613Member2020-01-010001046025us-gaap:ResidentialPortfolioSegmentMember2020-01-010001046025hfwa:OnetoFourFamilyRealEstateConstructionMemberhfwa:RealEstateConstructionAndLandDevelopmentMemberus-gaap:AccountingStandardsUpdate201613Member2020-01-010001046025hfwa:OnetoFourFamilyRealEstateConstructionMemberhfwa:RealEstateConstructionAndLandDevelopmentMember2020-01-010001046025hfwa:OnetoFourFamilyRealEstateConstructionMemberhfwa:RealEstateConstructionAndLandDevelopmentMember2020-01-012020-12-310001046025hfwa:RealEstateConstructionAndLandDevelopmentMemberhfwa:FiveOrMoreFamilyResidentialAndCommercialPropertiesMemberus-gaap:AccountingStandardsUpdate201613Member2020-01-010001046025hfwa:RealEstateConstructionAndLandDevelopmentMemberhfwa:FiveOrMoreFamilyResidentialAndCommercialPropertiesMember2020-01-010001046025hfwa:RealEstateConstructionAndLandDevelopmentMemberhfwa:FiveOrMoreFamilyResidentialAndCommercialPropertiesMember2020-01-012020-12-310001046025hfwa:RealEstateConstructionAndLandDevelopmentMemberus-gaap:AccountingStandardsUpdate201613Member2020-01-010001046025hfwa:RealEstateConstructionAndLandDevelopmentMember2020-01-010001046025hfwa:RealEstateConstructionAndLandDevelopmentMember2020-01-012020-12-310001046025us-gaap:AccountingStandardsUpdate201613Memberus-gaap:ConsumerPortfolioSegmentMember2020-01-010001046025us-gaap:ConsumerPortfolioSegmentMember2020-01-010001046025us-gaap:ConsumerPortfolioSegmentMember2020-01-012020-12-310001046025hfwa:UnallocatedMember2019-12-310001046025hfwa:UnallocatedMemberus-gaap:AccountingStandardsUpdate201613Member2020-01-010001046025hfwa:UnallocatedMember2020-01-010001046025hfwa:UnallocatedMember2020-01-012020-12-310001046025hfwa:UnallocatedMember2020-12-310001046025us-gaap:AccountingStandardsUpdate201613Member2020-01-012020-01-010001046025us-gaap:CommercialPortfolioSegmentMemberhfwa:CommercialAndIndustrialMember2018-12-310001046025us-gaap:CommercialPortfolioSegmentMemberhfwa:OwnerOccupiedCommercialRealEstateMember2018-12-310001046025us-gaap:CommercialPortfolioSegmentMemberhfwa:NonOwnerOccupiedCommercialRealEstateMember2018-12-310001046025us-gaap:CommercialPortfolioSegmentMember2018-12-310001046025us-gaap:ResidentialPortfolioSegmentMember2018-12-310001046025hfwa:OnetoFourFamilyRealEstateConstructionMemberhfwa:RealEstateConstructionAndLandDevelopmentMember2018-12-310001046025hfwa:RealEstateConstructionAndLandDevelopmentMemberhfwa:FiveOrMoreFamilyResidentialAndCommercialPropertiesMember2018-12-310001046025hfwa:RealEstateConstructionAndLandDevelopmentMember2018-12-310001046025us-gaap:ConsumerPortfolioSegmentMember2018-12-310001046025hfwa:UnallocatedMember2018-12-310001046025hfwa:UnallocatedMember2019-01-012019-12-310001046025us-gaap:CommercialPortfolioSegmentMemberhfwa:CommercialAndIndustrialMember2017-12-310001046025us-gaap:CommercialPortfolioSegmentMemberhfwa:OwnerOccupiedCommercialRealEstateMember2017-12-310001046025us-gaap:CommercialPortfolioSegmentMemberhfwa:NonOwnerOccupiedCommercialRealEstateMember2017-12-310001046025us-gaap:CommercialPortfolioSegmentMember2017-12-310001046025us-gaap:ResidentialPortfolioSegmentMember2017-12-310001046025hfwa:OnetoFourFamilyRealEstateConstructionMemberhfwa:RealEstateConstructionAndLandDevelopmentMember2017-12-310001046025hfwa:RealEstateConstructionAndLandDevelopmentMemberhfwa:FiveOrMoreFamilyResidentialAndCommercialPropertiesMember2017-12-310001046025hfwa:RealEstateConstructionAndLandDevelopmentMember2017-12-310001046025us-gaap:ConsumerPortfolioSegmentMember2017-12-310001046025hfwa:UnallocatedMember2017-12-310001046025hfwa:UnallocatedMember2018-01-012018-12-310001046025us-gaap:LandMember2020-12-310001046025us-gaap:LandMember2019-12-310001046025us-gaap:BuildingAndBuildingImprovementsMember2020-12-310001046025us-gaap:BuildingAndBuildingImprovementsMember2019-12-310001046025us-gaap:FurnitureAndFixturesMember2020-12-310001046025us-gaap:FurnitureAndFixturesMember2019-12-310001046025hfwa:ValleyCommunityBancsharesMemberus-gaap:CoreDepositsMember2020-01-012020-12-310001046025us-gaap:CoreDepositsMemberhfwa:WashingtonBankingMember2020-01-012020-12-310001046025us-gaap:CoreDepositsMemberhfwa:PremierCommercialBancorpMember2020-01-012020-12-310001046025us-gaap:CoreDepositsMemberhfwa:PugetSoundMergerMember2020-01-012020-12-310001046025hfwa:WashingtonBankingMember2014-05-0100010460252007-12-310001046025us-gaap:LondonInterbankOfferedRateLIBORMember2007-01-012007-12-310001046025us-gaap:JuniorSubordinatedDebtMember2020-01-012020-12-310001046025us-gaap:JuniorSubordinatedDebtMember2019-01-012019-12-310001046025us-gaap:JuniorSubordinatedDebtMember2018-01-012018-12-310001046025srt:MinimumMember2020-01-012020-12-310001046025srt:MaximumMember2020-01-012020-12-310001046025us-gaap:FederalReserveBankAdvancesMember2020-12-310001046025us-gaap:FederalReserveBankAdvancesMember2019-12-310001046025hfwa:PPPLFFacilityMember2020-12-310001046025hfwa:HeritageFinancialCorporation401kPlanandTrustSalarySavingPlanMember2020-01-012020-12-310001046025hfwa:HeritageFinancialCorporation401kPlanandTrustSalarySavingPlanMember2019-01-012019-12-310001046025hfwa:HeritageFinancialCorporation401kPlanandTrustSalarySavingPlanMember2018-01-012018-12-31hfwa:hour0001046025hfwa:HeritageFinancialCorporation401kPlanandTrustMember2020-01-012020-12-310001046025hfwa:HeritageFinancialCorporation401kPlanandTrustMember2019-01-012019-12-310001046025hfwa:HeritageFinancialCorporation401kPlanandTrustMember2018-01-012018-12-310001046025hfwa:AccruedExpensesandOtherLiabilitiesMemberhfwa:WashingtonBankingMember2020-12-310001046025hfwa:AccruedExpensesandOtherLiabilitiesMemberhfwa:WashingtonBankingMember2019-12-310001046025hfwa:AccruedExpensesandOtherLiabilitiesMember2020-12-310001046025hfwa:AccruedExpensesandOtherLiabilitiesMember2019-12-310001046025hfwa:AccruedExpensesandOtherLiabilitiesMember2018-12-310001046025hfwa:UnusedCommitmentstoExtendCreditMember2019-12-310001046025hfwa:UnusedCommitmentstoExtendCreditMember2018-12-310001046025hfwa:UnusedCommitmentstoExtendCreditMember2017-12-310001046025hfwa:UnusedCommitmentstoExtendCreditMembersrt:CumulativeEffectPeriodOfAdoptionAdjustmentMember2018-12-310001046025hfwa:UnusedCommitmentstoExtendCreditMembersrt:CumulativeEffectPeriodOfAdoptionAdjustmentMember2017-12-310001046025srt:CumulativeEffectPeriodOfAdoptionAdjustedBalanceMemberhfwa:UnusedCommitmentstoExtendCreditMember2019-12-310001046025srt:CumulativeEffectPeriodOfAdoptionAdjustedBalanceMemberhfwa:UnusedCommitmentstoExtendCreditMember2018-12-310001046025srt:CumulativeEffectPeriodOfAdoptionAdjustedBalanceMemberhfwa:UnusedCommitmentstoExtendCreditMember2017-12-310001046025hfwa:UnusedCommitmentstoExtendCreditMember2020-01-012020-12-310001046025hfwa:UnusedCommitmentstoExtendCreditMember2019-01-012019-12-310001046025hfwa:UnusedCommitmentstoExtendCreditMember2018-01-012018-12-310001046025srt:ScenarioForecastMember2021-12-310001046025srt:ScenarioForecastMember2022-12-310001046025srt:ScenarioForecastMember2034-12-310001046025srt:SubsidiariesMemberus-gaap:InvestmentCreditMemberhfwa:TwentyTwentyMember2020-12-310001046025us-gaap:NondesignatedMemberus-gaap:InterestRateSwapMember2020-12-310001046025us-gaap:InterestRateSwapMember2020-12-310001046025us-gaap:NondesignatedMemberus-gaap:InterestRateSwapMember2019-12-310001046025us-gaap:PrepaidExpensesAndOtherCurrentAssetsMember2020-12-310001046025us-gaap:InterestRateSwapMemberus-gaap:PrepaidExpensesAndOtherCurrentAssetsMember2019-12-3100010460252018-01-242018-01-2400010460252018-04-252018-04-2500010460252018-07-242018-07-2400010460252018-10-242018-10-240001046025hfwa:SpecialDividendMember2018-10-242018-10-2400010460252019-01-232019-01-2300010460252019-04-242019-04-2400010460252019-07-242019-07-2400010460252019-10-232019-10-230001046025hfwa:SpecialDividendMember2019-10-232019-10-2300010460252020-01-222020-01-2200010460252020-04-292020-04-2900010460252020-07-222020-07-2200010460252020-10-212020-10-210001046025hfwa:EleventhStockRepurchasePlanMemberMember2014-10-232014-10-230001046025hfwa:EleventhStockRepurchasePlanMemberMember2014-10-230001046025hfwa:TwelfthStockRepurchasePlanMember2020-03-122020-03-120001046025hfwa:TwelfthStockRepurchasePlanMember2020-03-120001046025hfwa:EleventhStockRepurchasePlanMemberMember2020-01-012020-12-310001046025hfwa:TwelfthStockRepurchasePlanMember2020-01-012020-12-310001046025hfwa:EleventhStockRepurchasePlanMemberMember2019-01-012019-12-310001046025hfwa:EleventhStockRepurchasePlanMemberMember2018-01-012018-12-310001046025hfwa:SharesRelatedtoWithholdingTaxesontheVestingofRestrictedStockMember2020-01-012020-12-310001046025hfwa:SharesRelatedtoWithholdingTaxesontheVestingofRestrictedStockMember2019-01-012019-12-310001046025hfwa:SharesRelatedtoWithholdingTaxesontheVestingofRestrictedStockMember2018-01-012018-12-310001046025us-gaap:USTreasuryAndGovernmentMemberus-gaap:FairValueMeasurementsRecurringMember2020-12-310001046025us-gaap:USTreasuryAndGovernmentMemberus-gaap:FairValueMeasurementsRecurringMemberus-gaap:FairValueInputsLevel1Member2020-12-310001046025us-gaap:FairValueInputsLevel3Memberus-gaap:USTreasuryAndGovernmentMemberus-gaap:FairValueMeasurementsRecurringMember2020-12-310001046025us-gaap:FairValueMeasurementsRecurringMemberus-gaap:MunicipalBondsMember2020-12-310001046025us-gaap:FairValueMeasurementsRecurringMemberus-gaap:MunicipalBondsMemberus-gaap:FairValueInputsLevel1Member2020-12-310001046025us-gaap:FairValueInputsLevel3Memberus-gaap:FairValueMeasurementsRecurringMemberus-gaap:MunicipalBondsMember2020-12-310001046025us-gaap:FairValueMeasurementsRecurringMemberus-gaap:ResidentialMortgageBackedSecuritiesMember2020-12-310001046025us-gaap:FairValueMeasurementsRecurringMemberus-gaap:ResidentialMortgageBackedSecuritiesMemberus-gaap:FairValueInputsLevel1Member2020-12-310001046025us-gaap:FairValueInputsLevel3Memberus-gaap:FairValueMeasurementsRecurringMemberus-gaap:ResidentialMortgageBackedSecuritiesMember2020-12-310001046025us-gaap:FairValueMeasurementsRecurringMemberus-gaap:CommercialMortgageBackedSecuritiesMember2020-12-310001046025us-gaap:FairValueMeasurementsRecurringMemberus-gaap:FairValueInputsLevel1Memberus-gaap:CommercialMortgageBackedSecuritiesMember2020-12-310001046025us-gaap:FairValueInputsLevel3Memberus-gaap:FairValueMeasurementsRecurringMemberus-gaap:CommercialMortgageBackedSecuritiesMember2020-12-310001046025us-gaap:CorporateDebtSecuritiesMemberus-gaap:FairValueMeasurementsRecurringMember2020-12-310001046025us-gaap:CorporateDebtSecuritiesMemberus-gaap:FairValueMeasurementsRecurringMemberus-gaap:FairValueInputsLevel1Member2020-12-310001046025us-gaap:FairValueInputsLevel3Memberus-gaap:CorporateDebtSecuritiesMemberus-gaap:FairValueMeasurementsRecurringMember2020-12-310001046025us-gaap:FairValueMeasurementsRecurringMemberus-gaap:OtherAggregatedInvestmentsMember2020-12-310001046025us-gaap:FairValueMeasurementsRecurringMemberus-gaap:FairValueInputsLevel1Memberus-gaap:OtherAggregatedInvestmentsMember2020-12-310001046025us-gaap:FairValueInputsLevel3Memberus-gaap:FairValueMeasurementsRecurringMemberus-gaap:OtherAggregatedInvestmentsMember2020-12-310001046025us-gaap:FairValueMeasurementsRecurringMember2020-12-310001046025us-gaap:FairValueMeasurementsRecurringMemberus-gaap:FairValueInputsLevel1Member2020-12-310001046025us-gaap:FairValueInputsLevel2Memberus-gaap:FairValueMeasurementsRecurringMember2020-12-310001046025us-gaap:FairValueInputsLevel3Memberus-gaap:FairValueMeasurementsRecurringMember2020-12-310001046025us-gaap:InterestRateSwapMemberus-gaap:FairValueMeasurementsRecurringMember2020-12-310001046025us-gaap:InterestRateSwapMemberus-gaap:FairValueMeasurementsRecurringMemberus-gaap:FairValueInputsLevel1Member2020-12-310001046025us-gaap:FairValueInputsLevel2Memberus-gaap:InterestRateSwapMemberus-gaap:FairValueMeasurementsRecurringMember2020-12-310001046025us-gaap:FairValueInputsLevel3Memberus-gaap:InterestRateSwapMemberus-gaap:FairValueMeasurementsRecurringMember2020-12-310001046025us-gaap:USTreasuryAndGovernmentMemberus-gaap:FairValueMeasurementsRecurringMember2019-12-310001046025us-gaap:USTreasuryAndGovernmentMemberus-gaap:FairValueMeasurementsRecurringMemberus-gaap:FairValueInputsLevel1Member2019-12-310001046025us-gaap:USTreasuryAndGovernmentMemberus-gaap:FairValueInputsLevel2Memberus-gaap:FairValueMeasurementsRecurringMember2019-12-310001046025us-gaap:FairValueInputsLevel3Memberus-gaap:USTreasuryAndGovernmentMemberus-gaap:FairValueMeasurementsRecurringMember2019-12-310001046025us-gaap:FairValueMeasurementsRecurringMemberus-gaap:MunicipalBondsMember2019-12-310001046025us-gaap:FairValueMeasurementsRecurringMemberus-gaap:MunicipalBondsMemberus-gaap:FairValueInputsLevel1Member2019-12-310001046025us-gaap:FairValueInputsLevel2Memberus-gaap:FairValueMeasurementsRecurringMemberus-gaap:MunicipalBondsMember2019-12-310001046025us-gaap:FairValueInputsLevel3Memberus-gaap:FairValueMeasurementsRecurringMemberus-gaap:MunicipalBondsMember2019-12-310001046025us-gaap:FairValueMeasurementsRecurringMemberus-gaap:ResidentialMortgageBackedSecuritiesMember2019-12-310001046025us-gaap:FairValueMeasurementsRecurringMemberus-gaap:ResidentialMortgageBackedSecuritiesMemberus-gaap:FairValueInputsLevel1Member2019-12-310001046025us-gaap:FairValueInputsLevel2Memberus-gaap:FairValueMeasurementsRecurringMemberus-gaap:ResidentialMortgageBackedSecuritiesMember2019-12-310001046025us-gaap:FairValueInputsLevel3Memberus-gaap:FairValueMeasurementsRecurringMemberus-gaap:ResidentialMortgageBackedSecuritiesMember2019-12-310001046025us-gaap:FairValueMeasurementsRecurringMemberus-gaap:CommercialMortgageBackedSecuritiesMember2019-12-310001046025us-gaap:FairValueMeasurementsRecurringMemberus-gaap:FairValueInputsLevel1Memberus-gaap:CommercialMortgageBackedSecuritiesMember2019-12-310001046025us-gaap:FairValueInputsLevel2Memberus-gaap:FairValueMeasurementsRecurringMemberus-gaap:CommercialMortgageBackedSecuritiesMember2019-12-310001046025us-gaap:FairValueInputsLevel3Memberus-gaap:FairValueMeasurementsRecurringMemberus-gaap:CommercialMortgageBackedSecuritiesMember2019-12-310001046025us-gaap:CorporateDebtSecuritiesMemberus-gaap:FairValueMeasurementsRecurringMember2019-12-310001046025us-gaap:CorporateDebtSecuritiesMemberus-gaap:FairValueMeasurementsRecurringMemberus-gaap:FairValueInputsLevel1Member2019-12-310001046025us-gaap:CorporateDebtSecuritiesMemberus-gaap:FairValueInputsLevel2Memberus-gaap:FairValueMeasurementsRecurringMember2019-12-310001046025us-gaap:FairValueInputsLevel3Memberus-gaap:CorporateDebtSecuritiesMemberus-gaap:FairValueMeasurementsRecurringMember2019-12-310001046025us-gaap:FairValueMeasurementsRecurringMemberus-gaap:OtherAggregatedInvestmentsMember2019-12-310001046025us-gaap:FairValueMeasurementsRecurringMemberus-gaap:FairValueInputsLevel1Memberus-gaap:OtherAggregatedInvestmentsMember2019-12-310001046025us-gaap:FairValueInputsLevel2Memberus-gaap:FairValueMeasurementsRecurringMemberus-gaap:OtherAggregatedInvestmentsMember2019-12-310001046025us-gaap:FairValueInputsLevel3Memberus-gaap:FairValueMeasurementsRecurringMemberus-gaap:OtherAggregatedInvestmentsMember2019-12-310001046025us-gaap:FairValueMeasurementsRecurringMember2019-12-310001046025us-gaap:FairValueMeasurementsRecurringMemberus-gaap:FairValueInputsLevel1Member2019-12-310001046025us-gaap:FairValueInputsLevel2Memberus-gaap:FairValueMeasurementsRecurringMember2019-12-310001046025us-gaap:FairValueInputsLevel3Memberus-gaap:FairValueMeasurementsRecurringMember2019-12-310001046025us-gaap:InterestRateSwapMemberus-gaap:FairValueMeasurementsRecurringMember2019-12-310001046025us-gaap:InterestRateSwapMemberus-gaap:FairValueMeasurementsRecurringMemberus-gaap:FairValueInputsLevel1Member2019-12-310001046025us-gaap:FairValueInputsLevel2Memberus-gaap:InterestRateSwapMemberus-gaap:FairValueMeasurementsRecurringMember2019-12-310001046025us-gaap:FairValueInputsLevel3Memberus-gaap:InterestRateSwapMemberus-gaap:FairValueMeasurementsRecurringMember2019-12-310001046025us-gaap:CommercialPortfolioSegmentMemberhfwa:ImpairedLoansMemberus-gaap:FairValueMeasurementsNonrecurringMemberhfwa:CommercialAndIndustrialMember2020-12-310001046025us-gaap:CommercialPortfolioSegmentMemberhfwa:ImpairedLoansMemberus-gaap:FairValueMeasurementsNonrecurringMemberus-gaap:FairValueInputsLevel1Memberhfwa:CommercialAndIndustrialMember2020-12-310001046025us-gaap:CommercialPortfolioSegmentMemberhfwa:ImpairedLoansMemberus-gaap:FairValueMeasurementsNonrecurringMemberus-gaap:FairValueInputsLevel2Memberhfwa:CommercialAndIndustrialMember2020-12-310001046025us-gaap:FairValueInputsLevel3Memberus-gaap:CommercialPortfolioSegmentMemberhfwa:ImpairedLoansMemberus-gaap:FairValueMeasurementsNonrecurringMemberhfwa:CommercialAndIndustrialMember2020-12-310001046025us-gaap:FairValueMeasurementsNonrecurringMemberhfwa:BranchHeldForSaleMember2020-12-310001046025us-gaap:FairValueMeasurementsNonrecurringMemberus-gaap:FairValueInputsLevel1Memberhfwa:BranchHeldForSaleMember2020-12-310001046025us-gaap:FairValueMeasurementsNonrecurringMemberus-gaap:FairValueInputsLevel2Memberhfwa:BranchHeldForSaleMember2020-12-310001046025us-gaap:FairValueInputsLevel3Memberus-gaap:FairValueMeasurementsNonrecurringMemberhfwa:BranchHeldForSaleMember2020-12-310001046025us-gaap:FairValueMeasurementsNonrecurringMember2020-12-310001046025us-gaap:FairValueMeasurementsNonrecurringMemberus-gaap:FairValueInputsLevel1Member2020-12-310001046025us-gaap:FairValueMeasurementsNonrecurringMemberus-gaap:FairValueInputsLevel2Member2020-12-310001046025us-gaap:FairValueInputsLevel3Memberus-gaap:FairValueMeasurementsNonrecurringMember2020-12-310001046025hfwa:ImpairedLoansMemberus-gaap:FairValueMeasurementsNonrecurringMemberhfwa:CommercialAndIndustrialMember2019-12-310001046025hfwa:ImpairedLoansMemberus-gaap:FairValueMeasurementsNonrecurringMemberus-gaap:FairValueInputsLevel1Memberhfwa:CommercialAndIndustrialMember2019-12-310001046025hfwa:ImpairedLoansMemberus-gaap:FairValueMeasurementsNonrecurringMemberus-gaap:FairValueInputsLevel2Memberhfwa:CommercialAndIndustrialMember2019-12-310001046025us-gaap:FairValueInputsLevel3Memberhfwa:ImpairedLoansMemberus-gaap:FairValueMeasurementsNonrecurringMemberhfwa:CommercialAndIndustrialMember2019-12-310001046025hfwa:ImpairedLoansMemberus-gaap:FairValueMeasurementsNonrecurringMember2019-12-310001046025hfwa:ImpairedLoansMemberus-gaap:FairValueMeasurementsNonrecurringMemberus-gaap:FairValueInputsLevel1Member2019-12-310001046025hfwa:ImpairedLoansMemberus-gaap:FairValueMeasurementsNonrecurringMemberus-gaap:FairValueInputsLevel2Member2019-12-310001046025us-gaap:FairValueInputsLevel3Memberhfwa:ImpairedLoansMemberus-gaap:FairValueMeasurementsNonrecurringMember2019-12-310001046025us-gaap:CommercialPortfolioSegmentMemberhfwa:ImpairedLoansMemberus-gaap:FairValueMeasurementsNonrecurringMemberhfwa:CommercialAndIndustrialMember2020-01-012020-12-310001046025us-gaap:CommercialPortfolioSegmentMemberhfwa:ImpairedLoansMemberus-gaap:FairValueMeasurementsNonrecurringMemberhfwa:CommercialAndIndustrialMember2019-01-012019-12-310001046025us-gaap:CommercialPortfolioSegmentMemberhfwa:ImpairedLoansMemberus-gaap:FairValueMeasurementsNonrecurringMemberhfwa:CommercialAndIndustrialMember2018-01-012018-12-310001046025us-gaap:CommercialPortfolioSegmentMemberhfwa:ImpairedLoansMemberus-gaap:FairValueMeasurementsNonrecurringMemberhfwa:NonOwnerOccupiedCommercialRealEstateMember2020-01-012020-12-310001046025us-gaap:CommercialPortfolioSegmentMemberhfwa:ImpairedLoansMemberus-gaap:FairValueMeasurementsNonrecurringMemberhfwa:NonOwnerOccupiedCommercialRealEstateMember2019-01-012019-12-310001046025us-gaap:CommercialPortfolioSegmentMemberhfwa:ImpairedLoansMemberus-gaap:FairValueMeasurementsNonrecurringMemberhfwa:NonOwnerOccupiedCommercialRealEstateMember2018-01-012018-12-310001046025us-gaap:CommercialPortfolioSegmentMemberhfwa:ImpairedLoansMemberus-gaap:FairValueMeasurementsNonrecurringMember2020-01-012020-12-310001046025us-gaap:CommercialPortfolioSegmentMemberhfwa:ImpairedLoansMemberus-gaap:FairValueMeasurementsNonrecurringMember2019-01-012019-12-310001046025us-gaap:CommercialPortfolioSegmentMemberhfwa:ImpairedLoansMemberus-gaap:FairValueMeasurementsNonrecurringMember2018-01-012018-12-310001046025hfwa:ImpairedLoansMemberus-gaap:FairValueMeasurementsNonrecurringMemberus-gaap:ConsumerPortfolioSegmentMember2020-01-012020-12-310001046025hfwa:ImpairedLoansMemberus-gaap:FairValueMeasurementsNonrecurringMemberus-gaap:ConsumerPortfolioSegmentMember2019-01-012019-12-310001046025hfwa:ImpairedLoansMemberus-gaap:FairValueMeasurementsNonrecurringMemberus-gaap:ConsumerPortfolioSegmentMember2018-01-012018-12-310001046025hfwa:BranchHeldForSaleMemberhfwa:ImpairedLoansMemberus-gaap:FairValueMeasurementsNonrecurringMember2020-01-012020-12-310001046025hfwa:BranchHeldForSaleMemberhfwa:ImpairedLoansMemberus-gaap:FairValueMeasurementsNonrecurringMember2019-01-012019-12-310001046025hfwa:BranchHeldForSaleMemberhfwa:ImpairedLoansMemberus-gaap:FairValueMeasurementsNonrecurringMember2018-01-012018-12-310001046025us-gaap:FairValueMeasurementsNonrecurringMember2020-01-012020-12-310001046025us-gaap:FairValueMeasurementsNonrecurringMember2019-01-012019-12-310001046025us-gaap:FairValueMeasurementsNonrecurringMember2018-01-012018-12-310001046025us-gaap:FairValueInputsLevel3Memberhfwa:ImpairedLoansMemberus-gaap:FairValueMeasurementsNonrecurringMember2020-12-310001046025us-gaap:FairValueInputsLevel3Memberus-gaap:MeasurementInputComparabilityAdjustmentMemberhfwa:ImpairedLoansMemberus-gaap:FairValueMeasurementsNonrecurringMembersrt:MaximumMember2020-12-310001046025us-gaap:FairValueInputsLevel3Memberus-gaap:MeasurementInputComparabilityAdjustmentMembersrt:MinimumMemberhfwa:ImpairedLoansMemberus-gaap:FairValueMeasurementsNonrecurringMember2020-12-310001046025us-gaap:FairValueInputsLevel3Memberus-gaap:MeasurementInputComparabilityAdjustmentMemberhfwa:ImpairedLoansMemberus-gaap:FairValueMeasurementsNonrecurringMembersrt:WeightedAverageMember2020-12-310001046025us-gaap:FairValueInputsLevel3Memberus-gaap:MeasurementInputComparabilityAdjustmentMemberus-gaap:FairValueMeasurementsNonrecurringMemberhfwa:BranchHeldForSaleMembersrt:MaximumMember2020-12-310001046025us-gaap:FairValueInputsLevel3Memberus-gaap:MeasurementInputComparabilityAdjustmentMembersrt:MinimumMemberus-gaap:FairValueMeasurementsNonrecurringMemberhfwa:BranchHeldForSaleMember2020-12-310001046025us-gaap:FairValueInputsLevel3Memberus-gaap:MeasurementInputComparabilityAdjustmentMemberus-gaap:FairValueMeasurementsNonrecurringMembersrt:WeightedAverageMemberhfwa:BranchHeldForSaleMember2020-12-310001046025us-gaap:FairValueInputsLevel3Memberus-gaap:MeasurementInputComparabilityAdjustmentMemberhfwa:ImpairedLoansMemberus-gaap:FairValueMeasurementsNonrecurringMembersrt:MaximumMember2019-12-310001046025us-gaap:FairValueInputsLevel3Memberus-gaap:MeasurementInputComparabilityAdjustmentMembersrt:MinimumMemberhfwa:ImpairedLoansMemberus-gaap:FairValueMeasurementsNonrecurringMember2019-12-310001046025us-gaap:FairValueInputsLevel3Memberus-gaap:MeasurementInputComparabilityAdjustmentMemberhfwa:ImpairedLoansMemberus-gaap:FairValueMeasurementsNonrecurringMembersrt:WeightedAverageMember2019-12-310001046025us-gaap:CarryingReportedAmountFairValueDisclosureMember2020-12-310001046025us-gaap:EstimateOfFairValueFairValueDisclosureMember2020-12-310001046025us-gaap:EstimateOfFairValueFairValueDisclosureMemberus-gaap:FairValueInputsLevel1Member2020-12-310001046025us-gaap:FairValueInputsLevel2Memberus-gaap:EstimateOfFairValueFairValueDisclosureMember2020-12-310001046025us-gaap:FairValueInputsLevel3Memberus-gaap:EstimateOfFairValueFairValueDisclosureMember2020-12-310001046025us-gaap:CarryingReportedAmountFairValueDisclosureMember2019-12-310001046025us-gaap:EstimateOfFairValueFairValueDisclosureMember2019-12-310001046025us-gaap:EstimateOfFairValueFairValueDisclosureMemberus-gaap:FairValueInputsLevel1Member2019-12-310001046025us-gaap:FairValueInputsLevel2Memberus-gaap:EstimateOfFairValueFairValueDisclosureMember2019-12-310001046025us-gaap:FairValueInputsLevel3Memberus-gaap:EstimateOfFairValueFairValueDisclosureMember2019-12-310001046025hfwa:TwoThousandFourteenOmnibusEquityPlanMember2014-07-242014-07-240001046025hfwa:OptionOneMemberus-gaap:EmployeeStockOptionMember2020-01-012020-12-310001046025hfwa:OptionTwoMemberus-gaap:EmployeeStockOptionMember2020-01-012020-12-310001046025us-gaap:EmployeeStockOptionMember2020-01-012020-12-310001046025us-gaap:EmployeeStockOptionMember2019-01-012019-12-310001046025us-gaap:EmployeeStockOptionMember2018-01-012018-12-310001046025hfwa:PerformanceBasedRestrictedStockUnitsPRSUsMember2020-01-012020-12-310001046025us-gaap:RestrictedStockMember2020-01-012020-12-310001046025us-gaap:RestrictedStockMember2019-01-012019-12-310001046025us-gaap:RestrictedStockMember2018-01-012018-12-310001046025us-gaap:RestrictedStockMember2017-12-310001046025us-gaap:RestrictedStockMember2018-12-310001046025us-gaap:RestrictedStockMember2019-12-310001046025us-gaap:RestrictedStockMember2020-12-310001046025us-gaap:RestrictedStockUnitsRSUMember2020-01-012020-12-310001046025hfwa:PerformanceBasedRestrictedStockUnitsPRSUsMembersrt:MinimumMember2020-01-012020-12-310001046025hfwa:PerformanceBasedRestrictedStockUnitsPRSUsMembersrt:MaximumMember2020-01-012020-12-310001046025hfwa:PerformanceBasedRestrictedStockUnitsPRSUsMember2019-01-012019-12-310001046025hfwa:PerformanceBasedRestrictedStockUnitsPRSUsMember2018-01-012018-12-310001046025hfwa:PerformanceBasedRestrictedStockUnitsPRSUsMembersrt:WeightedAverageMember2020-01-012020-12-310001046025hfwa:PerformanceBasedRestrictedStockUnitsPRSUsMembersrt:WeightedAverageMember2019-01-012019-12-310001046025hfwa:PerformanceBasedRestrictedStockUnitsPRSUsMembersrt:WeightedAverageMember2018-01-012018-12-310001046025hfwa:PerformanceBasedRestrictedStockUnitsPRSUsMemberhfwa:PeerCompanyMember2020-01-012020-12-310001046025hfwa:PerformanceBasedRestrictedStockUnitsPRSUsMemberhfwa:PeerCompanyMember2019-01-012019-12-310001046025hfwa:PerformanceBasedRestrictedStockUnitsPRSUsMemberhfwa:PeerCompanyMember2018-01-012018-12-310001046025hfwa:PerformanceBasedRestrictedStockUnitsPRSUsMembersrt:MinimumMemberhfwa:PeerCompanyMember2020-01-012020-12-310001046025hfwa:PerformanceBasedRestrictedStockUnitsPRSUsMemberhfwa:PeerCompanyMembersrt:MaximumMember2020-01-012020-12-310001046025hfwa:PerformanceBasedRestrictedStockUnitsPRSUsMembersrt:MinimumMemberhfwa:PeerCompanyMember2019-01-012019-12-310001046025hfwa:PerformanceBasedRestrictedStockUnitsPRSUsMemberhfwa:PeerCompanyMembersrt:MaximumMember2019-01-012019-12-310001046025hfwa:PerformanceBasedRestrictedStockUnitsPRSUsMembersrt:MinimumMemberhfwa:PeerCompanyMember2018-01-012018-12-310001046025hfwa:PerformanceBasedRestrictedStockUnitsPRSUsMemberhfwa:PeerCompanyMembersrt:MaximumMember2018-01-012018-12-310001046025us-gaap:RestrictedStockUnitsRSUMember2019-01-012019-12-310001046025us-gaap:RestrictedStockUnitsRSUMember2018-01-012018-12-310001046025us-gaap:RestrictedStockUnitsRSUMember2020-12-310001046025us-gaap:RestrictedStockUnitsRSUMember2017-12-310001046025us-gaap:RestrictedStockUnitsRSUMember2018-12-310001046025us-gaap:RestrictedStockUnitsRSUMember2019-12-310001046025hfwa:HeritageBankMember2019-12-310001046025srt:ParentCompanyMember2020-12-310001046025srt:ParentCompanyMember2019-12-310001046025srt:ParentCompanyMember2020-01-012020-12-310001046025srt:ParentCompanyMember2019-01-012019-12-310001046025srt:ParentCompanyMember2018-01-012018-12-310001046025srt:ParentCompanyMember2018-12-310001046025srt:ParentCompanyMember2017-12-3100010460252020-01-012020-03-3100010460252020-04-012020-06-3000010460252020-07-012020-09-3000010460252020-10-012020-12-3100010460252019-01-012019-03-3100010460252019-04-012019-06-3000010460252019-07-012019-09-3000010460252019-10-012019-12-31hfwa:Loan0001046025us-gaap:SubsequentEventMember2021-02-190001046025us-gaap:SubsequentEventMember2021-01-012021-02-19
UNITED STATES
SECURITIES AND EXCHANGE COMMISSION
WASHINGTON, D.C. 20549
☒ ANNUAL REPORT PURSUANT TO SECTION 13 OR 15(d) OF THE SECURITIES EXCHANGE ACT OF 1934
For the fiscal year ended December 31, 2020
or
☐ TRANSITION REPORT PURSUANT TO SECTION 13 OR 15(d) OF THE SECURITIES EXCHANGE ACT OF 1934
For the transition period from __________ to __________
Commission File Number 000-29480
| | |
|
HERITAGE FINANCIAL CORPORATION |
| (Exact name of registrant as specified in its charter) |
|
| | | | | | | | | | | | | | |
| Washington | | 91-1857900 |
(State or other jurisdiction of
incorporation or organization) | | (I.R.S. Employer
Identification No.) |
| | | |
| 201 Fifth Avenue SW, | Olympia | WA | | 98501 |
| (Address of principal executive offices) | | (Zip Code) |
(360) 943-1500
(Registrant’s telephone number, including area code)
Securities registered pursuant to Section 12(b) of the Act:
| | | | | | | | |
| Title of each class | Trading Symbol(s) | Name of each exchange on which registered |
| Common Stock | HFWA | NASDAQ Stock Market LLC |
Securities registered pursuant to Section 12(g) of the Act: None
Indicate by check mark if the registrant is a well-known seasoned issuer, as defined in Rule 405 of the Securities Act.
Yes ☒ No ☐
Indicate by check mark if the registrant is not required to file reports pursuant to Section 13 or Section 15(d) of the Act.
Yes ☐ No ☒
Indicate by check mark whether the registrant (1) has filed all reports required to be filed by Section 13 or 15(d) of the Securities Exchange Act of 1934 during the preceding 12 months (or for such shorter period that the registrant was required to file such reports), and (2) has been subject to such filing requirements for the past 90 days.
Yes ☒ No ☐
Indicate by check mark whether the registrant has submitted electronically every Interactive Data File required to be submitted pursuant to Rule 405 of Regulation S-T (§232.405 of this chapter) during the preceding 12 months (or for such shorter period that the registrant was required to submit such files).
Yes ☒ No ☐
Indicate by check mark whether the registrant is a large accelerated filer, an accelerated filer, a non-accelerated filer, smaller reporting company, or an emerging growth company. See the definitions of "large accelerated filer", "accelerated filer", "smaller reporting company," and "emerging growth company" in Rule 12b-2 of the Exchange Act
| | | | | | | | | | | |
Large accelerated filer | ☒ | Accelerated filer | ☐ |
Non-accelerated filer | ☐ | Smaller reporting company | ☐ |
| | Emerging growth company | ☐ |
If an emerging growth company, indicate by check mark if the registrant has elected not to use the extended transition period for complying with any new or revised financial accounting standards pursuant to Section 13(a) of the Exchange Act. ☐
Indicate by check mark whether the registrant has filed a report on and attestation to its management's assessment of the effectiveness of its internal control over financial reporting under Section 404(b) of the Sarbanes-Oxley Act (15 U.S.C 7262(b)) by the registered public accounting firm that prepared or issued its audit report. ☒
Indicate by check mark whether the registrant is a shell company (as defined in Rule 12b-2 of the Exchange Act).
Yes ☐ No ☒
The aggregate market value of the voting and non-voting common equity held by non-affiliates of the registrant as of June 30, 2020, based on the closing price of its common stock on such date, on the NASDAQ Global Select Market, of $20.00 per share, and 35,347,655 shares held by non-affiliates was $706,953,100. The registrant had 35,914,775 shares of common stock outstanding as of February 17, 2021.
DOCUMENTS INCORPORATED BY REFERENCE
Portions of the registrant’s definitive Proxy Statement for the 2021 Annual Meeting of Shareholders are incorporated by reference into Part III of this Annual Report on Form 10-K where indicated. The 2021 Proxy Statement will be filed with the U.S. Securities and Exchange Commission within 120 days after the end of the fiscal year to which this report relates.
HERITAGE FINANCIAL CORPORATION AND SUBSIDIARIES
FORM 10-K
December 31, 2020
TABLE OF CONTENTS
| | | | | | | | | | | | | | |
| | | | Page |
| |
| |
| | | | |
| ITEM 1. | | |
| ITEM 1A. | | |
| ITEM 1B. | | |
| ITEM 2. | | |
| ITEM 3. | | |
| ITEM 4. | | |
| | | | |
| ITEM 5. | | |
| ITEM 6. | | |
| ITEM 7. | | |
| | |
| | |
| | |
| | |
| | |
| | |
| | |
| | |
| | |
| | |
| | |
| | |
| | |
| | |
| | |
| | |
| | |
| | |
| | |
| | |
| | |
| | |
| | |
| ITEM 7A. | | |
| ITEM 8. | | |
| | | |
| | | |
| | | | | | | | | | | | | | |
| | | |
| | | |
| | | |
| | | |
| | | |
| | NOTE 1. | | |
| | NOTE 2. | | |
| | NOTE 3. | | |
| | NOTE 4. | | |
| | NOTE 5. | | |
| | NOTE 6. | | |
| | NOTE 7. | | |
| | NOTE 8. | | |
| | NOTE 9. | | |
| | NOTE 10. | | |
| | NOTE 11. | | |
| | NOTE 12. | | |
| | NOTE 13. | | |
| | NOTE 14. | | |
| | NOTE 15. | | |
| | NOTE 16. | | |
| | NOTE 17. | | |
| | NOTE 18. | | |
| | NOTE 19. | | |
| | NOTE 20. | | |
| | NOTE 21. | | |
| | NOTE 22. | | |
| | NOTE 23. | | |
| | NOTE 24. | | |
| | NOTE 25. | | |
| ITEM 9. | | |
| ITEM 9A. | | |
| ITEM 9B. | | |
| | | | |
| ITEM 10. | | |
| ITEM 11. | | |
| ITEM 12. | | |
| ITEM 13. | | |
| ITEM 14. | | |
| | | | |
| ITEM 15. | | |
| ITEM 16. | | |
| | |
Glossary of Acronyms, Abbreviations, and Terms
The acronyms, abbreviations, and terms listed below are used in various sections of this Annual Report on Form 10-K. As used throughout this report, the terms “we”, “our”, or “us” refer to Heritage Financial Corporation and its consolidated subsidiaries, unless the context otherwise requires.
| | | | | |
| ACL | Allowance for Credit Losses |
| ALL | Allowance for Loan Losses |
| AOCI | Accumulated other comprehensive income, net |
| ASC | Accounting Standards Codification |
| ASU | Accounting Standards Update |
| Bank | Heritage Bank |
| BOLI | Bank owned life insurance |
| CA Act | Consolidated Appropriations Act of 2021 |
| CARES Act | Coronavirus Aid, Relief, and Economic Security Act of 2020 |
| CDI | Core Deposit Intangible |
| CECL | Current Expected Credit Loss |
| CECL Adoption | Company's adoption on January 1, 2020 of FASB ASU 2016-13 Financial Instruments - Credit Losses (Topic 326): Measurement of Credit Losses on Financial Instruments, as amended, which replaces the incurred loss methodology with an expected loss methodology that is referred to as the CECL methodology |
| CMO | Collateralized Mortgage Obligation |
| Company | Heritage Financial Corporation |
| COVID Modifications | Loans with modifications made in compliance with the CARES Act and related regulatory guidance |
| COVID-19 Pandemic | Coronavirus Disease of 2019 pandemic |
| CRE | Commercial real estate |
| DEI | Diversity, Equity, and Inclusion |
| DFI | Division of Banks of the Washington State Department of Financial Institutions |
| Dodd Frank Act | Dodd-Frank Wall Street Reform and Consumer Protection Act of 2010 |
| Economic Growth Act | Economic Growth, Regulatory Relief and Consumer Protection Act |
| Equity Plan | Heritage Financial Corporation 2014 Omnibus Equity Plan |
| Exchange Act | Securities Exchange Act of 1934, as amended |
| FASB | Financial Accounting Standards Board |
| FDIC | Federal Deposit Insurance Corporation |
| Federal Reserve | Board of Governors of the Federal Reserve System |
| Federal Reserve Bank | Federal Reserve Bank of San Francisco |
| FHLB | Federal Home Loan Bank of Des Moines |
| Form 10-K | Company's Annual Report on Form 10-K |
| GAAP | U.S. Generally Accepted Accounting Principles |
| GDP | U.S. Gross Domestic Product |
| Heritage | Heritage Financial Corporation |
| LIBOR | London Interbank Offering Rate |
| LIHTC | Low-Income Housing Tax Credit partnerships |
| NMTC | New Market Tax Credits |
| MBS | Mortgage-backed security |
| OCC | Office of the Comptroller of the Currency |
| PCD | Purchased Credit Deteriorated; loans purchased with evidence of credit deterioration since origination for which it is probable that not all contractually required payments will be collected; accounted for under FASB ASC 326 |
| PCI | Purchased Credit Impaired; loans purchased with evidence of credit deterioration since origination for which it is probable that not all contractually required payments will be collected; accounted for under FASB ASC 310-30 |
| Plan | Heritage Financial Corporation 401(k) Profit Sharing Plan and Trust |
| PPP | Paycheck Protection Program |
| | | | | |
| PPPLF | Paycheck Protection Program Liquidity Facility |
| Premier Merger | Merger with Premier Commercial Bancorp & Premier Community Bank completed July 2, 2018 |
| Puget Sound Merger | Merger with Puget Sound Bancorp, Inc. & Puget Sound Bank completed January 16, 2018 |
| Premier and Puget Mergers | Premier Merger and Puget Sound Mergers, collectively |
| Proxy Statement | Definitive proxy statement for the annual meeting of shareholders to be held on May 4, 2021 |
| Related Party | Certain directors, executive officers and their affiliates |
| ROU | Right-of-Use |
| SBA | Small Business Administration |
| SEC | Securities and Exchange Commission |
| SOFR | Secured Overnight Financing Rate |
| TDR | Troubled Debt Restructured |
| Unfunded Commitments | Off-balance sheet credit exposures such as loan commitments, standby letters of credit, financial guarantees, and other similar instruments |
| USDA | United States Department of Agriculture |
| Washington Banking Merger | Merger with Washington Banking Company & Whidbey Island Bank completed on May 1, 2014 |
CAUTIONARY NOTE REGARDING FORWARD-LOOKING STATEMENTS
This Form 10-K may contain forward-looking statements within the meaning of the Private Securities Litigation Reform Act of 1995. Forward-looking statements often include the words “believes,” “expects,” “anticipates,” “estimates,” “forecasts,” “intends,” “plans,” “targets,” “potentially,” “probably,” “projects,” “outlook” or similar expressions or future or conditional verbs such as “may,” “will,” “should,” “would” and “could.” These forward-looking statements are subject to known and unknown risks, uncertainties and other factors that could cause actual results to differ materially from the results anticipated. In this regard, the COVID-19 pandemic is adversely affecting us, our customers, counterparties, employees, and third-party service providers, and the ultimate extent of the impacts on our business, financial position, results of operations, liquidity, and prospects is uncertain. Continued deterioration in general business and economic conditions, including further increases in unemployment rates, or turbulence in domestic or global financial markets could adversely affect our revenues and the values of our assets and liabilities, reduce the availability of funding, lead to a tightening of credit, and further increase stock price volatility. In addition, changes to statutes, regulations, or regulatory policies or practices as a result of, or in response to COVID-19, could affect us in substantial and unpredictable ways. Other factors that could cause or contribute to such differences include, but are not limited to:
•the credit risks of lending activities, including changes in the level and trend of loan delinquencies and write-offs and changes in our ACL on loans and provision for credit losses on loans that may be effected by deterioration in the housing and commercial real estate markets, which may lead to increased losses and nonperforming assets in our loan portfolio, and may result in our ACL on loans no longer being adequate to cover actual losses, and require us to increase our allowance for credit losses on loans;
•changes in general economic conditions, either nationally or in our market areas;
•changes in the levels of general interest rates and the relative differences between short-term and long-term interest rates, deposit interest rates, our net interest margin and funding sources;
•risks related to acquiring assets in or entering markets in which we have not previously operated and may not be familiar;
•fluctuations in the demand for loans, the number of unsold homes and other properties and fluctuations in real estate values in our market areas;
•results of examinations of us by the bank regulators, including the possibility that any such regulatory authority may, among other things, initiate an enforcement action against the Company or our bank subsidiary which could require us to increase our allowance for credit losses on loans, write-down assets, change our regulatory capital position, affect our ability to borrow funds or maintain or increase deposits, or impose additional requirements on us, any of which could affect our ability to continue our growth through mergers, acquisitions or similar transactions and adversely affect our liquidity and earnings;
•legislative or regulatory changes that adversely affect our business;
•implementing regulations, changes in regulatory policies and principles, or the interpretation of regulatory capital or other rules;
•our ability to control operating costs and expenses;
•the use of estimates in determining fair value of certain of our assets, which estimates may prove to be incorrect and result in significant declines in valuation;
•difficulties in reducing risk associated with the loans on our Consolidated Statements of Financial Condition;
•staffing fluctuations in response to product demand or the implementation of corporate strategies that affect our workforce and potential associated charges;
•disruptions, security breaches, or other adverse events, failures or interruptions in, or attacks on, our information technology systems or on the third-party vendors who perform several of our critical processing functions;
•our ability to retain key members of our senior management team;
•costs and effects of litigation, including settlements and judgments;
•our ability to implement our growth strategies;
•our ability to successfully integrate any assets, liabilities, customers, systems, and management personnel we may acquire into our operations and our ability to realize related revenue synergies and cost savings within expected time frames or at all, and any goodwill charges related thereto and costs or difficulties relating to integration matters, including but not limited to customer and employee retention, which might be greater than expected;
•increased competitive pressures among financial service companies;
•changes in consumer spending, borrowing and savings habits;
•the availability of resources to address changes in laws, rules, or regulations or to respond to regulatory actions;
•adverse changes in the securities markets;
•inability of key third-party providers to perform their obligations to us;
•changes in accounting policies and practices, as may be adopted by the financial institution regulatory agencies or the FASB, including additional guidance and interpretation on accounting issues and details of the implementation of new accounting methods and as a result of the CARES Act and the CA Act; and
•other economic, competitive, governmental, regulatory, and technological factors affecting our operations, pricing, products and services, including as a result of the CARES Act, CA Act and recent COVID-19 vaccination efforts, and the other risks detailed from time to time in our filings with the SEC including in this Form 10-K.
Some of these and other factors are discussed in this Form 10-K under the caption Item 1A. Risk Factors and elsewhere in this Form 10-K.
The Company cautions readers not to place undue reliance on any forward-looking statements. Moreover, you should treat these statements as speaking only as of the date they are made and based only on information then actually known to the Company. The Company does not undertake and specifically disclaims any obligation to revise any forward-looking statements to reflect the occurrence of anticipated or unanticipated events or circumstances after the date of such statements. These risks could cause our actual results for future periods to differ materially from those expressed in any forward-looking statements by, or on behalf of, us, and could negatively affect the Company's operating results and stock price performance.
PART I
ITEM 1. BUSINESS
Overview
Heritage Financial Corporation is a bank holding company that was incorporated in the State of Washington in August 1997. We are primarily engaged in the business of planning, directing, and coordinating the business activities of our wholly owned subsidiary and single reportable segment, Heritage Bank.
Heritage Bank is headquartered in Olympia, Washington and conducts business from its 53 branch offices located primarily along the I-5 corridor in the western Washington and the greater Portland, Oregon area. We additionally have offices located in central Washington, primarily in Yakima County. The deposits of the Bank are insured by the FDIC.
In October 2020, the Company announced a plan to consolidate nine branches to create a more efficient branch footprint, reducing the branch count to 53 from 62 at December 31, 2019. One branch was consolidated during October 2020 and eight branches were consolidated during January 2021. The Company integrated these locations into other branches within its network.
Our business consists primarily of commercial lending and deposit relationships with small and medium sized businesses and their owners in our market areas and attracting deposits from the general public. We also make real estate construction and land development loans and consumer loans. The Bank also originates for sale or investment purposes residential real estate loans on residential properties located primarily in our market.
General Development of Business
During the year ended December 31, 2020, the Bank participated in the SBA's PPP in accordance with the CARES Act. Through the conclusion of the initial PPP on August 8, 2020, the Bank had funded 4,642 SBA PPP loans totaling $897.4 million with an average loan size of $193,000. Of the funded loans, approximately 21% of both the count and the originated balance were loans to new customers. As of December 31, 2020, SBA PPP loans totaled $715.1 million, including unamortized net deferred fees of $15.4 million. The decrease in SBA PPP loans since origination was primarily due to principal and interest forgiveness payments from the SBA of $159.2 million during the fourth quarter of 2020 as the Bank began accepting and processing the forgiveness applications. During the year ended December 31, 2020, SBA PPP loans provided an additional $19.5 million of interest and fee income on loans.
A combination of new deposit relationships obtained in conjunction with the SBA PPP lending process and existing customers maintaining higher cash balances due to the COVID-19 pandemic also caused a material impact to our deposit balances, which increased $1.0 billion, or 22.2%, to $5.6 billion at December 31, 2020 from $4.6 billion at December 31, 2019.
The CA Act was signed into law on December 27, 2020 and provides coronavirus emergency response and relief, including renewing and extending the PPP until March 31, 2021. As a result, the Company began originating SBA PPP loans again starting in January 2021. As of February 19, 2021, the Bank has funded 1,724 loans totaling $297.1 million.
The Bank accommodated COVID Modifications on 2,041 loans with a balance of $666.6 million at March 31, 2020, a date before the prolonged impacts of the COVID-19 pandemic. COVID Modifications are not reported as TDR loans based on the CARES Act and regulatory guidance. Instead, the Bank assesses TDR status, at a minimum, once the loan deferment period reaches 180-days. At December 31, 2020, approximately 177 loans totaling $92.5 million were still in payment deferral
modification status, with 63.4% of those classified as a TDR and 36.6% as a COVID Modification. Approximately 86.1% of total COVID Modifications with payment deferrals during the year ended December 31, 2020 are no longer on payment deferral status at December 31, 2020. The CA Act extends relief offered under the CARES Act related to TDRs as a result of COVID-19 through January 1, 2022 or 60 days after the end of the national emergency declared by the President, whichever is earlier.
For additional discussion of impacts to our business from the COVID-19 pandemic, see also Item 1A. Risk Factors—Risks Related to the COVID-19 Pandemic and Associated Economic Slowdown, and Item 7. Management’s Discussion And Analysis Of Financial Condition And Results Of Operations—COVID-19 Impacts.
Other significant events during include:
•The Bank adopted CECL effective January 1, 2020.
•During the first quarter of 2020, we ceased indirect auto loan originations.
•During the second quarter of 2020, the Bank completed the implementation of the Heritage Direct platform, a full suite of upgraded treasury management tools for commercial customers, including online banking, ACH, wires, positive pay, remote deposit capture and merchant services. The related vendor implementation cost recorded within Professional services on the Consolidated Statements of Income during the year ended December 31, 2020 was $1.6 million.
•During the fourth quarter of 2020, we announced a branch consolidation plan and closed one branch in October 2020 and a further eight branches in January 2021.
Business Strategy
Our business strategy is to be a commercial community bank, seeking deposits from our communities and making loans to customers with local ties to our markets. We believe we have an innovative team providing financial services and focusing on the success of our customers. We are committed to being the leading commercial community bank in the Pacific Northwest by continuously improving customer satisfaction, employee empowerment, community investment and shareholder value. Our commitment defines our relationships, sets expectations for our actions and directs decision-making in these four fundamental areas. We will seek to achieve our business goals through the following strategies:
Expand geographically as opportunities present themselves. We are committed to continuing the controlled expansion of our franchise through strategic acquisitions designed to increase our market share and enhance franchise value. We believe that consolidation across the community bank landscape will continue to take place and further believe that, with our capital and liquidity positions, our approach to credit management, and our extensive acquisition experience, we are well-positioned to take advantage of acquisitions or other business opportunities in our market areas. In markets where we wish to enter or expand our business, we will also consider opening de novo branches. In the past, we have successfully integrated acquired institutions and opened de novo branches. We will continue to be disciplined and opportunistic as it pertains to future acquisitions and de novo branching, focusing on the Pacific Northwest markets we know and understand.
Focus on asset quality. A strong credit culture is a high priority for us. We have a well-developed credit approval structure that has enabled us to maintain a standard of asset quality that we believe has moderate risk while at the same time allowing us to achieve our lending objectives. We will continue to focus on loan types and markets that we know well and where we have a historical record of success. We focus on loan relationships that are well-diversified in both size and industry types. With respect to commercial business lending, which is our predominant lending activity, we view ourselves as cash-flow lenders obtaining additional support from realistic collateral values, personal guarantees and other secondary sources of repayment. We have a problem loan resolution process that is focused on quick detection and implementing feasible solutions. We seek to maintain strong internal controls and subject our loans to periodic internal loan reviews.
Maintain a strong balance sheet. In addition to our focus on underwriting, we believe that the strength of our balance sheet provides us with the flexibility to manage through a variety of scenarios including additional growth-related activities. Our liquidity position was also strong, with $743.3 million in cash and cash equivalents as of December 31, 2020. As of December 31, 2020, the regulatory capital ratios of our subsidiary bank were well in excess of the levels required for “well-capitalized” status, and our consolidated common equity tier 1 capital to risk-weighted assets, leverage capital, Tier 1 risk-based capital, and total risk-based capital ratios were 12.3%, 9.0%, 12.8% and 14.0%, respectively.
Focused deposit growth. Our strategic focus is to continuously grow deposits with emphasis on total relationship banking with our business and retail customers. We continue to seek to increase our market share in the communities we serve by providing exceptional customer service, focusing on relationship development with local businesses and strategic branch expansion. Our primary focus is to maintain a high level of non-maturity deposits to internally fund our loan growth with a low reliance on maturity (certificate) deposits. At December 31, 2020, our non-maturity deposits were 92.9% of our total deposits. Our technology-based products, including online personal financial management, business cash management and business remote deposit products enable us to compete effectively with banks of all sizes. Our retail and commercial management teams are well-seasoned and have strong ties to the communities we serve with a strong focus on relationship building and customer service.
Emphasize business relationships with a focus on commercial lending. We will continue to market primarily commercial business loans and the deposit balances that accompany these relationships. Our seasoned lending staff has extensive knowledge and can add value through a focused advisory role that we believe strengthens our customer relationships and develops loyalty. We currently have and will seek to maintain a diversified portfolio of lending relationships without significant concentrations in any industry.
Recruit and retain highly competent personnel to execute our strategies. Our compensation and staff development programs are aligned with our strategies to grow our loans and core deposits (which we define to include all deposits except
certificates of deposit) while maintaining our focus on asset quality. Our incentive systems are designed to achieve balanced, high quality asset growth while maintaining appropriate mechanisms to reduce or eliminate incentive payments when appropriate. Our equity compensation programs and retirement benefits are designed to build and encourage employee ownership at all levels of the Company and we align employee performance objectives with corporate growth strategies and shareholder value. We have a strong corporate culture, which is supported by our commitment to internal development and promotion from within as well as the retention of management and officers in key roles.
There have been no material changes to our business strategy during the year ended December 31, 2020, except for our participation in the SBA's PPP.
History
The Bank was established in 1927 as a federally-charted mutual savings bank. In 1992, the Bank converted to a state-chartered mutual savings bank under the name Heritage Savings Bank. Through the mutual holding company reorganization of the Bank and the subsequent conversion of the mutual holding company, the Bank became a stock savings bank and a wholly-owned subsidiary of the Company effective August 1997. Effective September 1, 2004, Heritage Savings Bank switched its charter from a state-chartered savings bank to a state-chartered commercial bank and changed its legal name from Heritage Savings Bank to Heritage Bank.
The Company acquired North Pacific Bancorporation in June 1998 and Washington Independent Bancshares and its wholly-owned subsidiary, Central Valley Bank, in March 1999. In June 2006, the Company completed the acquisition of Western Washington Bancorp and its wholly owned subsidiary, Washington State Bank, N.A., at which time Washington State Bank, N.A. was merged into Heritage Bank.
Effective July 30, 2010, Heritage Bank entered into a definitive agreement with the FDIC, pursuant to which Heritage Bank acquired certain assets and assumed certain liabilities of Cowlitz Bank, a Washington state-chartered commercial bank headquartered in Longview, Washington. The acquisition included nine branches of Cowlitz Bank, including its division Bay Bank, which opened as branches of Heritage Bank on August 2, 2010. The acquisition also included the Trust Services Division of Cowlitz Bank.
Effective November 5, 2010, Heritage Bank entered into a definitive agreement with the FDIC, pursuant to which Heritage Bank acquired certain assets and assumed certain liabilities of Pierce Commercial Bank, a Washington state-chartered commercial bank headquartered in Tacoma, Washington. The acquisition included one branch, which opened as a branch of Heritage Bank on November 8, 2010.
On September 14, 2012, the Company announced that it had entered into a definitive agreement along with Heritage Bank, to acquire Northwest Commercial Bank, a full-service commercial bank headquartered in Lakewood, Washington that operated two branch locations in Washington State. The acquisition was completed on January 9, 2013, at which time Northwest Commercial Bank was merged with and into Heritage Bank.
On March 11, 2013, the Company entered into a definitive agreement to acquire Valley Community Bancshares, Inc. and its wholly-owned subsidiary, Valley Bank, both headquartered in Puyallup, Washington, and its eight branches. The acquisition was completed on July 15, 2013.
On April 8, 2013, the Company announced its intent to merge two of its wholly-owned bank subsidiaries, Central Valley Bank and Heritage Bank, with Central Valley Bank merging into Heritage Bank. The common control merger was completed on June 19, 2013. Central Valley Bank operated as a division of Heritage Bank until September 2018 at which time the five Central Valley Bank branches were renamed to Heritage Bank branches.
On October 23, 2013, the Company, the Bank, Washington Banking Company and its wholly-owned subsidiary bank, Whidbey Island Bank, jointly announced the signing of a definitive merger agreement pursuant to which Heritage and Washington Banking Company entered into a strategic merger with Washington Banking Company merging into Heritage. Whidbey Island Bank branches adopted the Heritage Bank name in all markets, with the exception of six branches in Whidbey Island markets which continue to operate using the Whidbey Island Bank name, as a division of Heritage Bank. The Washington Banking Merger was completed on May 1, 2014.
On July 26, 2017, the Company announced the execution of a definitive agreement to purchase Puget Sound Bancorp, Inc., the holding company of Puget Sound Bank, a one-branch business bank headquartered in Bellevue, Washington. The Puget Sound Merger was completed on January 16, 2018.
On March 8, 2018, the Company announced the signing of a definitive agreement to purchase Premier Commercial Bancorp, the holding company for Premier Community Bank, both of Hillsboro, Oregon, and its six branches. The Premier Merger was completed on July 2, 2018.
For additional information regarding the Puget Sound Merger and Premier Merger see Note (2) Business Combinations of the Notes to Consolidated Financial Statements included in Item 8. Financial Statements And Supplementary Data.
Description of Business
Retail Banking
We offer a full range of products and services to customers for personal and business banking needs designed to attract both short-term and long-term deposits. Deposits are our primary source of funds. Our personal and business banking customers have the option of selecting from a variety of accounts. The major categories of deposit accounts that we offer are described below. These accounts, with the exception of noninterest demand accounts, generally earn interest at rates
established by management based on competitive market factors and management’s desire to increase or decrease certain types or maturities of deposits.
Noninterest Demand Deposits. Deposits are noninterest bearing and may be charged service fees based on activity and balances.
Interest Bearing Demand Deposits. Deposits are interest bearing and may be charged service fees based on activity and balances. Interest bearing demand deposits pay interest, but require a higher minimum balance to avoid service charges.
Money Market Accounts. Deposits pay an interest rate that is tiered depending on the balance maintained in the account. Minimum opening balances vary.
Savings Accounts. Deposits are interest bearing and allow for unlimited deposits and withdrawals, provided that a minimum balance is maintained.
Certificate of Deposit Accounts. Deposits require a minimum deposit of $2,500 and have maturities ranging from three months to five years. Jumbo certificate of deposit accounts are offered in amounts of $100,000 or more for terms of seven days to one year.
Our personal checking accounts feature an array of benefits and options, including online banking, online statements, mobile banking with mobile deposit, VISA debit cards and access to more than 32,000 surcharge free Automated Teller Machines through the MoneyPass network.
We also offer investment advice through a Wealth Management department that provides objective advice from trusted advisers.
Lending Activities
Our lending activities are conducted through Heritage Bank. While our focus is on commercial business lending, we also originate consumer loans, real estate construction and land development loans and residential real estate loans. Our loans are originated under policies that are reviewed and approved annually by our Board of Directors. In addition, we have established internal lending guidelines that are updated as needed. These policies and guidelines address underwriting standards, structure and rate considerations, and compliance with laws, regulations and internal lending limits. We conduct post-approval reviews on selected loans and routinely perform internal loan reviews of our loan portfolio to confirm credit quality, proper documentation and compliance with laws and regulations. Loan repayments are considered one of the primary sources of funding for the Bank.
Commercial Business Lending
We offer different types of commercial business loans, including lines of credit, term equipment financing and term owner-occupied and non-owner occupied commercial real estate loans. We also originate loans that are guaranteed by the U.S. SBA, for which Heritage Bank is a “preferred lender”, the U.S. Department of Agriculture and the Federal Agricultural Mortgage Corporation. Before extending credit to a business, we review and analyze the borrower’s management ability, financial history, including cash flow of the borrower and all guarantors, and the liquidation value of the collateral. Emphasis is placed on having a comprehensive understanding of the borrower’s global cash flow and performing necessary financial due diligence.
At December 31, 2020 we had $3.72 billion, or 83.1% of our loans receivable, in commercial business loans with an average outstanding loan balance of approximately $393,000 at December 31, 2020, excluding loans with no outstanding balance.
We originate commercial real estate loans within our primary market areas with a preference for loans secured by owner-occupied properties. Our underwriting standards require that non-owner occupied and owner-occupied commercial real estate loans not exceed 75% and 80%, respectively, of the lower of appraised value at origination or cost of the underlying collateral. Cash flow debt coverage requirements range from 1.15 times to 1.25 times, depending on the type of property. We also stress test debt coverage using an “underwriting” interest rate that is higher than the note rate.
Commercial real estate loans typically involve a greater degree of risk than residential real estate loans. Payments on loans secured by commercial real estate properties are dependent on successful operation and management of the properties and repayment of these loans may be affected by adverse conditions in the real estate market or the economy. We seek to minimize these risks by determining the financial condition of the borrower and any tenants, the quality and value of the collateral, and the management of the property securing the loan. We also generally obtain personal guarantees from the owners of the collateral after a thorough review of personal financial statements. In addition, we review our commercial real estate loan portfolio annually for performance of individual loans, and stress-test loans for potential changes in interest rates, occupancy, and collateral values.
See also Item 1A. Risk Factors—Our loan portfolio is concentrated in loans with a higher risk of loss.
The Bank may enter into non-hedging interest rate swap contracts with commercial customers to accommodate their business needs. For additional information, see Note (16) Derivative Financial Instruments of the Notes to Consolidated Financial Statements included in Item 8. Financial Statements And Supplementary Data.
Residential Real Estate Loans, Originations and Sales
At December 31, 2020, residential real estate loans totaled $122.8 million, or 2.7%, of our loans receivable. The majority of our residential real estate loans are secured by single-family residences located in our primary market areas. Our
underwriting standards require that residential real estate loans generally are owner-occupied and do not exceed 80% of the lower of appraised value at origination or cost of the underlying collateral. Terms typically range from 15 to 30 years.
As part of our asset/liability management strategy, we typically sell a significant portion of our residential real estate loans in the secondary market with no recourse and servicing released. Residential real estate loans intended for sale totaled $4.9 million at December 31, 2020 within Loans held for sale on the Consolidated Statements of Financial Condition. See Item 7. Management’s Discussion And Analysis Of Financial Condition And Results Of Operations—Asset and Liability Management. We did not service any of these sold loans during the years ended December 31, 2020, 2019 or 2018.
Real Estate Construction and Land Development
At December 31, 2020, we had $305.7 million, or 6.9%, of our loans receivable, in real estate construction and land development loans, including residential construction loans and commercial and multifamily construction loans.
We originate residential construction loans for the construction of single-family custom homes (where the home buyer is the borrower). We also provide financing to builders for the construction of pre-sold homes and speculative residential property. Because of the higher risks present in the residential construction industry, our lending to builders is limited to those who have demonstrated a favorable record of performance and who are building in markets that management understands. We further endeavor to limit our construction lending risk through adherence to strict underwriting guidelines and procedures. Speculative construction loans are short term in nature and have a variable rate of interest. We require builders to have tangible equity in each construction project; have prompt and thorough documentation of all draw requests; and we inspect the project prior to paying any draw requests.
Commercial and multifamily construction loans also have a higher risk because of construction element. As a result, this type of construction loan is made only to strong borrowers with sufficient equity into the project and additional resources they can draw on if needed. The Bank performs due diligence to gain comfort that the experience of the general contractor is sufficient to finish the project on budget and on time. Project feasibility is also important and our lenders ensure the project is economically viable. Commercial and multifamily construction loans are monitored through cost reviews, regulatory-compliant appraisals, sufficient equity, engineering inspections and controlled disbursements.
See also Item 1A. Risk Factors—Our loan portfolio is concentrated in loans with a higher risk of loss.
Consumer
At December 31, 2020, we had $325.0 million, or 7.3% of our loans receivable, in consumer loans. We originate consumer loans and lines of credit that are both secured and unsecured. During the first quarter of 2020, we ceased indirect auto loan originations. These indirect consumer loans were secured by new and used automobile and recreational vehicles and were originated indirectly by established and well-known dealers located in our market areas. In addition, the indirect loans purchased were made to only prime borrowers. At December 31, 2020, we had $212.2 million, or 4.7% of our loans receivable, in indirect auto loans. The majority of our remaining consumer loans are for relatively small amounts disbursed among many individual borrowers.
Liquidity
Our primary sources of funds are deposits and loan repayments. Scheduled loan repayments are a relatively stable source of funds, while deposits and unscheduled loan prepayments, which are influenced significantly by general interest rate levels, interest rates available on other investments, competition, economic conditions and other factors, may not be stable. Customer deposits remain an important source of funding, but these balances have been influenced in the past by adverse market conditions in the industry and may be affected by future developments such as interest rate fluctuations and new competitive pressures. In addition to customer deposits, management may utilize brokered deposits on an as-needed basis and securities sold under agreement to repurchase. We had no brokered deposits as of December 31, 2020. At December 31, 2020, securities sold under agreement to repurchase of $35.7 million which were secured by investment securities available for sale.
As secondary sources of funding, we might utilize other borrowings on a short-term basis to compensate for reductions in other sources of funds (such as deposit inflows at less than projected levels). Borrowings may also be used on a longer-term basis to support expanded lending activities and match the maturity of repricing intervals of assets. Other borrowings include advances from the FHLB and other credit facilities.
Federal Home Loan Bank:
The Bank is a member of the FHLB which is one of 11 regional Federal Home Loan Banks that administer the home financing credit function of savings institutions. Each Federal Home Loan Bank serves as a reserve or central bank for its member financial institutions within its assigned region. The FHLB is funded primarily from proceeds derived from the sale of consolidated obligations of the Federal Home Loan Bank system. It makes loans or advances to members in accordance with policies and procedures, established by the Board of Directors of the FHLB, which are subject to the oversight of the Federal Housing Finance Agency. We rely upon advances from the FHLB as a secondary source of liquidity to supplement our supply of lendable funds and meet deposit withdrawal requirements. Advances are made pursuant to several different programs. Each credit program has its own interest rate and range of maturities. Depending on the program, limitations on the amount of advances are based on a percentage of an institution’s assets or on the FHLB’s assessment of the institution’s creditworthiness. Under its current credit policies, the FHLB limits advances to 45% of the Bank's assets.
At December 31, 2020, the Bank maintained a credit facility with the FHLB with availability in the amount of $991.7 million, of which there were no advances outstanding. Advances from the FHLB are typically secured by our first lien residential real estate loans, commercial real estate loans and stock issued by the FHLB, which is owned by us.
For membership purposes, the Bank is required to maintain an investment in the stock of the FHLB in an amount equal to 0.12% of the Bank's assets as calculated on an annual basis. In addition to the FHLB stock required for membership, the Bank must purchase activity stock equal to 4.0% of all outstanding borrowing balances. The activity stock is automatically redeemed in amounts equal to the FHLB advance balances as they are repaid. At December 31, 2020 the Bank had an investment in stock issued by the FHLB carried at a cost basis (par value) of $6.7 million, which entirely represented its FHLB membership stock. The Bank was not required to purchase additional FHLB stock as it did not have any outstanding FHLB advances at December 31, 2020.
Other borrowings:
In addition to liquidity provided by the FHLB, the Bank maintained an uncommitted credit facility with the Federal Reserve Bank of $54.3 million, of which there were no advances or borrowings outstanding as of December 31, 2020. The Bank also maintains advance lines with Wells Fargo Bank, US Bank, The Independent Bankers Bank, Pacific Coast Bankers’ Bank, and JP Morgan Chase to purchase federal funds of up to $215.0 million, of which there were no advances or borrowings outstanding as of December 31, 2020.
Supervision and Regulation
We are subject to extensive legislation, regulation, and supervision under federal law and the law of Washington State, which are primarily intended to protect depositors and the FDIC, and not shareholders. The Dodd-Frank Act established additional laws and regulations affecting banks and bank holding companies, including the establishment of the Consumer Financial Protection Bureau as an independent bureau of the Federal Reserve. The Consumer Financial Protection Bureau assumed responsibility for the implementation of the federal financial consumer protection and fair lending laws and regulations and has authority to impose new requirements. See “—Other Regulatory Developments—The Dodd-Frank Act” herein for a discussion of this legislation.
Any change in applicable laws, regulations, or regulatory policies may have a material effect on our business, operations, and prospects. We cannot predict the nature or the extent of the effects on our business and earnings that any fiscal or monetary policies or new Federal or State legislation may have in the future.
The following is a summary discussion of certain laws and regulations applicable to Heritage and Heritage Bank which is qualified in its entirety by reference to the actual laws and regulations.
Heritage
As a bank holding company registered with the Federal Reserve, we are subject to comprehensive regulation and supervision by the Federal Reserve under the Bank Holding Company Act of 1956, as amended, and the regulations of the Federal Reserve. This regulation and supervision is generally intended to ensure that we limit our activities to those allowed by law and that we operate in a safe and sound manner without endangering the financial health of Heritage Bank. We are required to file annual and periodic reports with the Federal Reserve and provide additional information as the Federal Reserve may require. The Federal Reserve may examine us, and any of our subsidiaries, and assess us for the cost of such examination.
The Federal Reserve has extensive enforcement authority over bank holding companies, including, among other things, the ability to assess civil money penalties, to issue cease and desist or removal orders, or require that a holding company divest subsidiaries (including its bank subsidiary). In general, enforcement actions may be initiated for violations of laws and regulations and unsafe or unsound practices. The Company is also required to file certain reports with, and otherwise comply with, the rules and regulations of the SEC. The Federal Reserve may also order termination of non-banking activities by non-banking subsidiaries of bank holding companies, or divestiture of ownership and control of a non-banking subsidiary by a bank holding company. Some violations may also result in criminal penalties.
The Dodd Frank Act and Federal Reserve policy provides that a bank holding company is required to serve as a source of financial and managerial strength to its subsidiary banks and may not conduct its operations in an unsafe or unsound manner. A bank holding company’s failure to meet its obligation to serve as a source of strength by providing financial assistance to a subsidiary bank in financial distress is generally considered by the Federal Reserve to be an unsafe and unsound banking practice or a violation of the Federal Reserve’s regulations or both.
As a bank holding company, we are required to obtain the prior approval of the Federal Reserve to acquire all, or substantially all, of the assets of any other bank or bank holding company. Prior Federal Reserve approval is required for any bank holding company to acquire direct or indirect ownership or control of any voting securities of any bank or bank holding company if, after such acquisition, the acquiring bank holding company would, directly or indirectly, own or control more than 5% of any class of voting shares of the bank or bank holding company. In addition to the approval of the Federal Reserve, prior approval may for such acquisitions also be necessary from other agencies including the DFI and agencies that regulate the target.
Under the prompt corrective action provisions of the Federal Deposit Insurance Act, a bank holding company with an undercapitalized subsidiary bank must guarantee, within limitations, the capital restoration plan that is required to be implemented for its undercapitalized subsidiary bank. If an undercapitalized subsidiary bank fails to file an acceptable capital restoration plan or fails to implement an accepted plan, the Federal Reserve may, among other restrictions, prohibit the bank holding company or its undercapitalized subsidiary bank from paying any dividend or making any other form of capital distribution
without the prior approval of the Federal Reserve. Federal Reserve policy also provides that a bank holding company may pay cash dividends only to the extent that the company’s net income for the past year is sufficient to cover both the cash dividend and a rate of earnings retention that is consistent with the company’s capital needs, asset quality and overall financial condition. A bank holding company or bank that does not meet the capital conservation buffer requirement is subject to restrictions on the payment of dividends. See “—Capital Adequacy” below. In addition, under Washington corporate law, a company generally may not pay dividends if, after that payment, the company would not be able to pay its liabilities as they become due in the usual course of business or its total assets would be less than its total liabilities.
We, and any subsidiaries which we may control, are considered “affiliates” of the Bank within the meaning of the Federal Reserve Act, and transactions between our bank subsidiary and affiliates are subject to numerous restrictions. With some exceptions, we and our subsidiaries are prohibited from tying the provision of various products or services, such as extensions of credit, to other products or services offered by us, or our affiliates.
Bank regulations require bank holding companies and banks to maintain minimum capital ratios. For additional information, see “—Capital Adequacy” below.
Heritage Bank
Heritage Bank is a Washington state-chartered commercial bank; the deposits of which are insured by the FDIC. Heritage Bank is subject to regulation by the FDIC and the DFI.
Applicable Federal and State statutes and regulations which govern a bank’s operations relate to minimum capital requirements, required reserves against deposits, investments, loans, legal lending limits, mergers and consolidation, borrowings, issuance of securities, payment of dividends, establishment of branches, privacy, anti-money laundering and other aspects of its operations, among other things. The DFI and the FDIC also have authority to prohibit banks under their supervision from engaging in what they consider to be unsafe and unsound practices.
The Bank is required to file periodic reports with the FDIC and is subject to periodic examinations and evaluations by the FDIC and the DFI. Based upon these evaluations, the regulators may revalue the assets of an institution and require that it establish specific reserves to compensate for the differences between the determined value and the book value of such assets. These examinations must be conducted at least every 12 months.
The Bank pays dividends to Heritage. The FDIC and the DFI also have the general authority to restrict capital distributions by the Bank, including dividends paid by the Bank to Heritage. Such restrictions are generally tied to the Bank’s capital levels after giving effect to such distributions. For additional information regarding the restrictions on the payment of dividends, see ”—Capital Adequacy" below and Note (17) Stockholders' Equity of the Notes to Consolidated Financial Statements included in Item 8. Financial Statements And Supplementary Data.
Capital Adequacy
The Federal Reserve and FDIC have issued substantially similar risk-based and leverage capital regulations applicable to bank holding companies and banks, respectively. In addition, these regulatory agencies may from time to time require that a bank holding company or bank maintain capital above the minimum levels, based on its financial condition or actual or anticipated growth. These regulations implement the regulatory capital reforms required by the Dodd-Frank Act and the Basel III requirements, a comprehensive capital framework and rules for U.S. banking organizations approved by the Federal Reserve Board and the FDIC in 2013.
Under these capital regulations, the minimum capital ratios are: (1) a common equity Tier 1 capital ratio of 4.5% of risk-weighted assets; (2) a leverage ratio (the ratio of Tier 1 capital to average total adjusted assets) of 4.0%; (3) a Tier 1 capital ratio of 6.0% of risk-weighted assets; and (4) a total capital ratio of 8.0% of risk-weighted assets. Common equity Tier 1 generally consists of common stock; retained earnings; accumulated other comprehensive income (loss), net unless an institution elects to exclude accumulated other comprehensive income (loss), net from regulatory capital; and certain minority interests; all subject to applicable regulatory adjustments and deductions. Tier 1 capital generally consists of common equity Tier 1 and noncumulative perpetual preferred stock. Tier 2 capital generally consists of other preferred stock and subordinated debt meeting certain conditions plus an amount of the allowance for credit losses up to 1.25% of risk-weighted assets. Total capital is the sum of Tier 1 and Tier 2 capital.
In addition to the minimum common equity Tier 1, Tier 1, leverage ratio and total capital ratios, the Company and the Bank must maintain a capital conservation buffer consisting of additional common equity Tier 1 capital greater than 2.5% above the required minimum risk-based capital levels in order to avoid limitations on paying dividends, repurchasing shares, and paying discretionary bonuses. To be considered "well capitalized," a bank holding company must have, on a consolidated basis, a Tier 1 risk-based capital ratio of 6.0% or greater and a total risk-based capital ratio of 10.0% or greater and must not be subject to an individual order, directive or agreement under which the Federal Reserve requires it to maintain a specific capital level. To be considered “well capitalized,” a depository institution must have a common equity Tier 1 capital ratio of at least 6.5%, a leverage ratio of at least 5%, a Tier 1 risk-based capital ratio of at least 8%, a total risk-based capital ratio of at least 10% and not be subject to an individualized order, directive or agreement under which its primary federal banking regulator requires it to maintain a specific capital level. The FDIC has not imposed such a requirement on Heritage Bank.
The Company’s and the Bank's required and actual capital levels as of December 31, 2020 are listed in Note (22) Regulatory Capital Requirements of the Notes to Consolidated Financial Statements included in Item 8. Financial Statements And Supplementary Data.
Prompt Corrective Action
Federal statutes establish a supervisory framework for FDIC-insured institutions based on five capital categories: well capitalized, adequately capitalized, undercapitalized, significantly undercapitalized and critically undercapitalized. An institution’s category depends upon where its capital levels are in relation to relevant capital measures. The well capitalized category is described in the Capital Adequacy section above. An institution that is not well capitalized is subject to certain restrictions on brokered deposits, including restrictions on the rates it can offer on its deposits. To be considered adequately capitalized, an institution must have the minimum capital ratios described in the Capital Adequacy section above. Any institution which is neither well capitalized nor adequately capitalized is considered undercapitalized.
Undercapitalized institutions are subject to certain prompt corrective action requirements, regulatory controls and restrictions which become more extensive as an institution becomes more severely undercapitalized. Failure by a bank to comply with applicable capital requirements would result in progressively more severe restrictions on its activities and lead to enforcement actions, including, but not limited to, the issuance of a capital directive to ensure the maintenance of required capital levels and, ultimately, the appointment of the FDIC as receiver or conservator. Banking regulators will take prompt corrective action with respect to depository institutions that do not meet minimum capital requirements. Additionally, approval of any regulatory application filed for their review may be dependent on compliance with capital requirements.
As of December 31, 2020, the Company and the Bank met all minimum capital requirements and the most recent regulatory notifications categorized the Bank as well capitalized under the regulatory framework for prompt corrective action. See Note (22) Regulatory Capital Requirements of the Notes to Consolidated Financial Statements included in Item 8. Financial Statements And Supplementary Data.
Classification of Loans
Federal regulations require the Bank to periodically evaluate the risks inherent in its loan portfolio. In addition, the DFI and the FDIC have the authority to identify adversely classified loans and, if appropriate, require them to be reclassified. There are three types of classified loans: Substandard, Doubtful, and Loss. Substandard loans have one or more defined weaknesses and are characterized by the distinct possibility that the institution will sustain some loss if the deficiencies are not corrected. Doubtful loans have the weaknesses of Substandard loans, with additional characteristics that the weaknesses make collection or liquidation in full on the basis of currently existing facts, conditions, and values questionable. There is a high probability of some loss in loans classified as Doubtful. A loan classified as Loss is considered uncollectible and of such little value that continuance as a loan of the institution is not warranted. If a loan or a portion of the loan is classified as Loss, the institution must charge-off this amount.
Deposit Insurance and Other FDIC Programs
The deposits of the Bank are insured up to $250,000 per separately insured category by the Deposit Insurance Fund, which is administered by the FDIC. The FDIC is an independent federal agency that insures the deposits, up to applicable limits, of depository institutions. As insurer of the Bank's deposits, the FDIC has supervisory and enforcement authority over the Bank and this insurance is backed by the full faith and credit of the United States government. As insurer, the FDIC imposes deposit insurance assessments and is authorized to conduct examinations of and to require reporting by institutions insured by the FDIC. It also may prohibit any FDIC-insured institution from engaging in any activity determined by regulation or order to pose a serious risk to the institution and the Deposit Insurance Fund. The FDIC also has the authority to initiate enforcement actions and may terminate the deposit insurance if it determines that an institution has engaged in unsafe or unsound practices or is in an unsafe or unsound condition.
Deposit insurance assessments are based on the average consolidated total assets less tangible equity capital of a financial institution. In addition, the Dodd-Frank Act set the minimum designated reserve ratio of the Deposit Insurance Fund at 1.35%, required the FDIC to set a target for the ratio each year, and eliminated the requirement that the FDIC pay dividends to insured depository institutions when the ratio exceeds certain thresholds. The FDIC set the target ratio at 2.0% and adopted a plan to achieve that target ratio. Currently, total base assessment rates range from 1.5 to 40 basis points on an annualized basis, subject to certain adjustments. Under current regulations, the ranges of assessment rates are scheduled to decrease as the ratio increases in increments above 2.0%. No institution may pay a dividend if it is in default on its deposit insurance assessment.
The FDIC announced that the Deposit Insurance Fund ratio surpassed 1.35% as of September 30, 2018 which triggered two changes under the regulations: surcharges on large banks (total consolidated assets of $10 billion or more) ended and small banks (total consolidated assets of less than $10 billion, which includes the Bank) were awarded assessment credits for the portion of their assessments that contributed to the growth in the Reserve Ratio from 1.15% to 1.35% to be applied when the reserve ratio is at least 1.35%. The Bank was awarded $1.2 million in small bank assessment credits to be used in future periods as assessments were incurred as part of this action. The Bank applied the small bank credits to its quarterly deposit insurance assessments (during any quarter the reserve ratio met the 1.35% minimum) in the amounts of $518,000 and $726,000 during the years ended December 31, 2020 and 2019, respectively.
Other Regulatory Developments
The following summarizes some of the significant federal legislation affecting banking in recent years.
Economic Growth Act. In May 2018 the Economic Growth Act was enacted to modify or remove certain financial reform rules and regulations, including some of those implemented under the Dodd-Frank Act. While the Economic Growth Act maintains most of the regulatory structure established by the Dodd-Frank Act, it amends certain aspects of the regulatory framework for small depository institutions with assets of less than $10 billion and for large banks with assets of more than $50 billion.
The Economic Growth Act, among other matters, expands the definition of qualified mortgages which may be held by a financial institution and simplifies the regulatory capital rules for financial institutions and their holding companies with total consolidated assets of less than $10 billion by instructing the federal banking regulators to establish a Community Bank Leverage Ratio. In addition, the Economic Growth Act includes regulatory relief for community banks regarding regulatory examination cycles, call reports, the Volcker Rule (proprietary trading prohibitions), mortgage disclosures and risk weights for certain high-risk commercial real estate loans.
The FDIC introduced the final rule applicable to the Community Bank Leverage Ratio which became effective January 1, 2020. The new ratio is an optional framework that is designed to reduce regulatory burden by removing the requirements for calculating and reporting risk-based capital ratios for qualifying community banking organizations that opt into the framework starting in the first quarter of 2020. Qualifying community banking organizations that elect to use the Community Bank Leverage Ratio framework and that maintain a leverage ratio of greater than nine percent are considered to have satisfied the risk-based and leverage capital requirements in the agencies’ generally applicable capital rule. Additionally, such insured depository institutions are considered to have met the well-capitalized ratio requirements for purposes of section 38 of the Federal Deposit Insurance Act. The leverage ratio required for purposes of the new framework is calculated as Tier 1 capital divided by average total consolidated assets, consistent with how banking organizations calculate their leverage ratio under the current rules.
The Company and the Bank did not opt into the Community Bank Leverage Ratio for the year ended December 31, 2020.
CECL. The FASB issued a new accounting standard that the Bank adopted on January 1, 2020. This standard, referred to as CECL, requires FDIC-insured institutions and their holding companies (banking organizations) to recognize credit losses expected over the life of certain financial assets. CECL covers a broader range of assets than the current method of recognizing credit losses and generally results in earlier recognition of credit losses. Upon adoption of CECL, a banking organization must record a one-time adjustment to its credit loss allowances as of the beginning of the fiscal year of adoption equal to the difference, if any, between the amount of credit loss allowances under the current methodology and the amount required under CECL. For a banking organization, implementation of CECL is generally likely to reduce retained earnings, and to affect other items, in a manner that reduces its regulatory capital. See discussion of CECL Adoption on January 1, 2020 in Note (1) Description of Business, Basis of Presentation, Significant Accounting Policies and Recently Issued Accounting Pronouncements of the Notes to Consolidated Financial Statements included in Item 8. Financial Statements And Supplementary Data
The federal banking regulators (the Federal Reserve, the OCC and the FDIC) have adopted a rule that gives a banking organization the option to phase in over a three-year period the day-one adverse effects of CECL on its regulatory capital.
CARES Act and CA Act. In response to the COVID-19 pandemic, Congress, through the enactment of the CARES Act and the CA Act and the federal banking agencies, through rulemaking, interpretive guidance and modifications to agency policies and procedures, have taken a series of actions to provide national emergency economic relief measures including, among others, the following:
•The CARES Act allows banks to elect to suspend requirements under GAAP for loan modifications related to the COVID-19 pandemic (for loans that were not more than 30 days past due as of December 31, 2019) that would otherwise be categorized as a TDR, including impairment for accounting purposes, until the earlier of 60 days after the termination date of the national emergency or December 31, 2020. The CA Act extended the relief offered under the CARES Act related to TDRs as a result of COVID-19 through January 1, 2022 or 60 days after the end of the national emergency declared by the President, whichever is earlier. The suspension of GAAP is applicable for the entire term of the modification. The federal banking agencies also issued guidance to encourage banks to make loan modifications for borrowers affected by COVID-19 by providing that short-term modifications made in response to COVID-19, such as payment deferrals, fee waivers, extensions of repayment terms, or other delays in payment that are insignificant related to the loans in which the borrower is less than 30 days past due on its contractual payments at the time a modification program is implemented; and such loan is not a TDR. The Bank is applying this guidance to qualifying COVID-19 Modifications. See Item 7. Management’s Discussion And Analysis Of Financial Condition And Results Of Operations—COVID-19 Impacts” for further information about the COVID Modifications completed by the Bank.
•The CARES Act amended the SBA’s loan program, in which the Bank participates, to create a guaranteed, unsecured loan program, the PPP, to fund payroll and operational costs of eligible businesses, organizations and self-employed persons during COVID-19. The SBA PPP loans are provided through participating financial institutions, such as the Bank, that process loan applications and service the loans and are eligible for SBA repayment and loan forgiveness if the borrower meets the PPP conditions. The application period for a SBA PPP loan closed on August 8, 2020. The SBA began approving PPP forgiveness applications and remitting forgiveness payments to PPP lenders on October 2, 2020. The CA Act renews and extends the PPP until March 31, 2021. As a participating lender, the Bank began originating SBA PPP loans again starting in January 2021 and will continue to monitor legislative, regulatory, and supervisory developments related to the PPP.
•Concurrent with enactment of the CARES Act, federal banking agencies issued an interim final rule that delays the estimated impact on regulatory capital resulting from the adoption of CECL. The interim final rule provides banking organizations that implement CECL before the end of 2020 the option to delay for two years the estimated impact of CECL on regulatory capital relative to regulatory capital determined under the prior incurred loss methodology, followed by a three-year transition period to phase out the aggregate amount of capital benefit provided during the initial two-year delay. The changes in the final rule apply only to those banking organizations that elect the CECL transition relief provided under the rule. The Company elected this option.
•Pursuant to the CARES Act, the federal banking agencies authorities adopted an interim rule, effective until the earlier of the termination of the coronavirus emergency declaration by the President and December 31, 2020, to (i) reduce the minimum Community Bank Leverage Ratio from 9% to 8% percent and (ii) give community banks two-quarter grace period to satisfy such ratio if such ratio falls out of compliance by no more than 1%.
As the on-going COVID-19 pandemic evolves, federal regulatory authorities continue to issue additional guidance with respect to the implementation, lifecycle, and eligibility requirements for the various CARES Act programs as well as industry-specific recovery procedures for COVID-19. In addition, it is possible that Congress will enact supplementary COVID-19 response legislation. The Company continues to assess the impact of the CARES Act, CA Act and other statues, regulations and supervisory guidance related to the COVID-19 pandemic.
Website Access to Company Reports
We post publicly available reports required to be filed with the SEC on our website, www.hf-wa.com, as soon as reasonably practicable after filing such reports. The required reports are available free of charge through our website.
Code of Ethics
We have adopted a Code of Ethics that applies to our principal officers. We have posted the text of our Code of Ethics at www.hf-wa.com in the section titled Overview: Governance Documents. Any waivers of the code of ethics will be publicly disclosed to shareholders.
Competition
We compete for loans and deposits with other commercial banks, credit unions, mortgage bankers, and other providers of financial services, including finance companies, online-only banks, mutual funds, insurance companies, and more recently with financial technology companies that rely on technology to provide financial services. Many of our competitors have substantially greater resources than we do. Particularly in times of high or rising interest rates, we also face significant competition for investors’ funds from short-term money market securities and other corporate and government securities.
We compete for loans principally through the range and quality of the services we provide, interest rates and loan fees, and robust delivery channels of our products and services. We actively solicit deposit-related clients and compete for deposits by offering depositors a variety of savings accounts, checking accounts, cash management and other services.
Human Capital
Demographics
As of December 31, 2020, Heritage Bank employed 804 full-time and 52 part-time employees across Washington and Oregon. None of these employees are represented by a collective bargaining agreement. During 2020, we hired 133 regular full-time and part-time employees. Voluntary workforce turnover (rolling 12-month attrition) was 15.4% and our average tenure was 7.1 years. Our workforce was 72% female and 28% male, and women held 69% of the bank’s management roles (including department supervisors and managers, as well as executive leadership). The average tenure of management was 9.5 years. The ethnicity of our workforce was 78% White, 8% Asian, 6% Hispanic, 4% Two or More Races, 2% Black, and 2% other.
Our Culture and Our People
Heritage's success depends on the success of its people. As a result, Heritage is focused on enhancing employee empowerment through human capital and talent management. Our strong culture was built upon adherence to a well-defined company mission and values, which aligns employees across all levels of the Company to a common goal and enables them to reach their full potential.
Heritage views its employees as our most important assets, which makes training and professional development a worthy investment. We offer an array of learning opportunities through virtual and in-house courses via “Heritage Bank University”, as well as sponsoring courses through external providers, such as Ken Blanchard Companies, Washington Bankers Association, and the Pacific Coast Banking School. Additionally, in 2020 we rolled out situational leadership training that focuses on communication and employee engagement.
The Company strives to maintain an environment of open communication with access to senior management, which includes quarterly all-employee virtual meetings, as well as New Employee Orientation hosted by the Chief Executive Officer. To further enhance our “listening culture” and foster open communications, in 2020 we introduced a pulse survey platform to provide employees with a chance to share feedback directly with leadership throughout the year, including internal communications and pandemic-related surveys. Survey results were shared with executive leadership and drove action planning. We also host Celebrate Great, an active internal peer recognition platform, where managers and employees post appreciation and recognition for co-workers and teams. The Company celebrates “Employee Appreciation Days” in the spring and fall which includes prizes, games, employee recognition and in-person events hosted by executive management.
In addition to vacation and sick leave, all employees receive at least eight hours of paid time each year specifically to use for volunteer activities of their choice in the communities where they live and work.
COVID-19
The safety, health and wellness of our employees is a top priority. The COVID-19 pandemic presented a unique challenge with regard to maintaining employee safety while continuing successful operations. Taking that into account, we acted
quickly to implement the following measures commensurate with guidance issued by the Centers for Disease Control and state/local health authorities:
•Transitioned a significant portion (~40%) of our workforce to remote work arrangements.
•Most branch lobbies were closed to foot traffic except by appointment.
•Enforced social distancing, daily health screening, and mask-wearing protocols for onsite employees.
•Encouraged employees to stay home when they are experiencing COVID-19-like symptoms.
•Provided a supply of masks, hand sanitizer, and disinfecting agents to each location.
•Limited essential business travel to those situations where business cannot reasonably be conducted without face-to-face interaction or visits to specific locations.
•Launched a Parent Resource Community Board on the Company Intranet and partnered with a company that provides virtual enrichment courses for the children of our employees at a discounted rate.
•Provided up to 80 hours of paid time off to full-time employees for COVID-19 related absences, to use in lieu of sick or vacation time, for the employee's own illness, to care for an ill family member, due to a required self-isolation/quarantine, or school/day care closures.
Heritage continues to monitor the situation and makes additional accommodations as necessary.
Diversity, Equity, and Inclusion
We recognize and appreciate the importance of creating an environment in which all employees feel valued, included, and empowered to do their best work. We recognize that each employee's unique experiences, perspectives, and viewpoints add value to our ability to be the leading commercial community bank in the Pacific Northwest.
Heritage has a DEI plan, a Diversity Council and a DEI Officer who has been certified by the National Diversity Council. The Council is made up of a diverse group of employees that acts on behalf of the Bank to promote the diversity and inclusion process. The Council works closely with senior leaders to ensure DEI initiatives align with the Bank's overall strategic goals and initiatives. Both our Chief Executive Officer and Senior Vice President Chief Human Resources Officer serve as Executive Sponsors to the DEI Council. The Council is a critical driver in fostering organizational change, establishing a dedicated focus on diversity, equity, and inclusion priorities. The primary role of the Council is to connect DEI activities to a broader, business-driven and results-oriented strategy.
The objectives of the Bank's DEI plan include:
•Workforce Diversity: Recruit from a diverse, qualified group of potential applicants to secure a high-performing workforce drawn from all segments of the communities we serve.
•Workplace Inclusion: Promote a culture that encourages collaboration, flexibility and fairness to enable individuals to contribute to their full potential.
•Sustainability: Develop structures and strategies to equip leaders with the ability to manage diversity, be accountable, measure results, refine approaches on the basis of such data and foster a culture of inclusion.
Compensation and Benefits
We provide competitive compensation and benefit programs to aid us in attracting and retaining top talent in the very competitive Puget Sound and Portland, Oregon job markets where many of our offices are located. These programs include annual bonuses, equity, 401(k) Plan with an employer matching contribution, health insurance, transit passes, paid parking, and paid time off.
Executive Officers
The following table sets forth certain information with respect to the executive officers of the Company at December 31, 2020.
| | | | | | | | | | | | | | | | | | | | |
| Name | | Age as of
December 31,
2020 | | Position | | Has Served
the Company or Heritage
Bank Since |
| Jeffrey J. Deuel | | 62 | | | Chief Executive Officer of Heritage | | 2010 |
| Donald J. Hinson | | 59 | | | Executive Vice President and Chief Financial Officer of Heritage and Heritage Bank | | 2005 |
| Tony Chalfant | | 59 | | | Executive Vice President and Chief Credit Officer of Heritage and Heritage Bank | | 2018 |
| Bryan McDonald | | 49 | | | Executive Vice President and Chief Operating Officer of Heritage and Heritage Bank | | 2014 |
| Cindy Huntley | | 57 | | | Executive Vice President and Chief Banking Officer of Heritage Bank | | 1988 |
The business experience of each executive officer is set forth below.
Mr. Deuel is the Chief Executive Officer of Heritage Bank and Heritage Financial Corporation. He was previously promoted to President and Chief Executive Officer of Heritage Bank and President of Heritage Financial Corporation effective
July 2018 and then promoted to Chief Executive Officer of Heritage Financial Corporation effective July 2019. Mr. Deuel was promoted to President and Chief Operating Officer of Heritage Bank and Executive Vice President of Heritage Financial Corporation in September 2012. In November 2010, Mr. Deuel was named Executive Vice President and Chief Operating Officer of Heritage Bank and Executive Vice President of the Company after joining Heritage Bank in February 2010 as Executive Vice President. Mr. Deuel came to the Company with 28 years of banking experience and previously held the position of Executive Vice President Commercial Operations with JPMorgan Chase, formerly Washington Mutual. Prior to joining Washington Mutual, Mr. Deuel was based in Philadelphia where he worked for Bank United, First Union Bank, CoreStates Bank, and First Pennsylvania Bank. During his career Mr. Deuel held a variety of leadership positions in commercial banking including lending, credit administration, portfolio management, retail, corporate strategies, and support services. He earned his Bachelor’s degree at Gettysburg College.
Mr. Hinson was promoted to Executive Vice President and Chief Financial Officer in September 2012. From 2007 to 2012, he was Senior Vice President and Chief Financial Officer. Mr. Hinson joined the Company in 2005 as Vice President and Controller. Prior to that, he served in the banking audit practice of local and national accounting firms of Knight, Vale and Gregory and RSM McGladrey from 1994 to 2005. Mr. Hinson holds a Bachelor's degrees in Accounting from Central Washington University and in Psychology from Western Washington University and is a licensed Certified Public Accountant.
Tony Chalfant became Executive Vice President and Chief Credit Officer of Heritage and Heritage Bank in July 2020. Previously, Mr. Chalfant held the title of Senior Vice President and Deputy Chief Credit Officer of Heritage Bank since July 2019. Prior to that, he served as a Regional Credit Officer since January 2018 when Heritage acquired Puget Sound Bank. Mr. Chalfant served as the Chief Credit Officer for Puget Sound Bank for 13 years and prior to joining Puget Sound Bank had held commercial lending and leadership positions with U.S. Bank for 11 years. Mr. Chalfant started his career with the U.S. Office of Comptroller of the Currency, working there for eight years. Mr. Chalfant obtained his Bachelor's degree in Finance and Economics from Washington State University and is a graduate of the Pacific Coast Banking School.
Bryan McDonald was appointed Executive Vice President and Chief Operating Officer of Heritage Bank in July of 2018. Mr. McDonald became Executive Vice President and Chief Lending Officer of Heritage Bank upon completion of the Washington Banking Merger effective on May 1, 2014. Mr. McDonald had previously served as President and Chief Executive Officer of Whidbey Island Bank since January 1, 2012. Mr. McDonald joined Whidbey Island Bank in 2006 as Commercial Banking Manager and he served as Senior Vice President and Chief Operating Officer of Whidbey Island Bank from April 1, 2010 until his promotion to Executive Vice President on August 26, 2010. Mr. McDonald has been serving in the banking industry since 1994, including regional commercial lending management roles with Washington Mutual and Peoples Bank. Mr. McDonald holds a Bachelor's and Master’s Degree in Business Administration from Washington State University.
Cindy Huntley was appointed Executive Vice President and Chief Banking Officer in September of 2019. Cindy has been with Heritage Bank since 1988 and previously served as a Director of Retail Banking in 2006 and a Senior Vice President in 2004. She holds a Bachelor's Degree in Management from the University of Northern Colorado and graduated from the Pacific Coast Banking School.
ITEM 1A. RISK FACTORS
We assume and manage a certain degree of risk in order to conduct our business strategy. The following provides a discussion of material risks that management believes are specific to our business. This discussion should not be viewed as an all-inclusive list or in any particular order.
Risks Related to the COVID-19 Pandemic and Associated Economic Slowdown
The outbreak of COVID-19 has adversely affected certain industries in which our customers operate and may impair their ability to fulfill their obligations to us. Further, the spread of the outbreak has disrupted banking and other financial activity in the areas in which we operate, could lead to an economic recession or other additional severe disruptions in the U.S. economy, and could potentially create business continuity issues for us.
The worldwide COVID-19 pandemic has negatively affected our business and is likely to continue to do so. The COVID-19 pandemic has caused major economic disruption and volatility in the financial markets both in the United States and globally. In our market areas, stay-at-home orders, social distancing and travel restrictions, and similar orders imposed across the United States to restrict the spread of COVID-19, resulted in significant business and operational disruptions, including business closures, supply chain disruptions, and significant layoffs and furloughs. While the stay-at-home orders have terminated or been phased-out along with reopening of businesses in certain markets, localities in the Pacific Northwest, where we do primarily the most business, have resumed such orders in November 2020 and still apply capacity restrictions and health and safety recommendations that encourage continued social distancing and working remotely, thereby limiting the ability of businesses to return to pre-pandemic levels of activity. As of December 31, 2020, all of our branch lobbies remain closed with most services processed through the drive-up, where applicable, or by appointment. Further branch reopening will occur based on further guidance received from the state and local governments and our determination that is safe for our customers and employees.
Currently, a portion of our employees are working remotely to enable us to continue to provide banking services to our customers during the shelter in place orders. Heightened cybersecurity, information security and operational risks may result from these work-from-home arrangements. We also could be adversely affected if key personnel or a significant number of employees were to become unavailable due to the effects and restrictions of the COVID-19 pandemic. Further, we also rely upon our third-party vendors to conduct business and to process, record, and monitor transactions. If any of these vendors are unable
to continue to provide us with these services, it could negatively impact our ability to serve our customers. Although we have business continuity plans and other safeguards in place, there is no assurance that such plans and safeguards will be effective.
There is pervasive uncertainty surrounding the future economic conditions that will emerge in the months and years following the start of the pandemic. As a result, management is confronted with a significant and unfamiliar degree of uncertainty in estimating the impact of the pandemic on the Company's business, prospects, credit quality, revenues and asset values. To date, the COVID-19 pandemic has resulted in declines in loan demand and loan originations other than through government sponsored programs such as the SBA's PPP. The COVID-19 pandemic has also impacted market interest rates and negatively impacted many of our business and consumer borrower’s ability to make their loan payments. Because the length of the pandemic and the efficacy of the extraordinary measures being put in place to address its economic consequences are unknown, including the continued low targeted federal funds rate, until the pandemic subsides, we expect our net interest income and net interest margin will be adversely affected in the near term, if not longer. Many of our borrowers have become unemployed or may face unemployment, and certain businesses are at risk of insolvency as revenues declined precipitously, especially in businesses related to travel, hospitality, leisure, and physical personal services. Businesses may ultimately not reopen as there is a significant level of uncertainty regarding the level of economic activity that will return to the Pacific Northwest region over time, the impact of governmental assistance, the speed of economic recovery, the resurgence of COVID-19 in subsequent seasons and changes to demographic and social norms that will take place.
The impact of the pandemic is expected to continue to adversely affect us during 2021 as the ability of many of our customers to make loan payments has been significantly affected. Although the Company has made estimates of credit losses related to the pandemic as part of its evaluation of the ACL on loans, such estimates involve significant judgment and are made in the context of significant uncertainty as to the impact that the pandemic will have on the credit quality of our loan portfolio. The extent of the economic impact of the pandemic is also impossible to determine with certainty at this time as it is partly dependent on a still evolving virus. Accordingly, estimates of the pandemic's effect on credit losses could change over time as additional information becomes available. If our estimates are incorrect, our ACL on loans may not be sufficient to cover losses in our loan portfolio, resulting in the need for increases in our ACL on loans through the provision for credit losses which is recorded and charged against income. Any increases in the ACL on loans will result in a decrease in net income and, most likely, capital, and may have a material negative effect on our financial condition and results of operations.
As of December 31, 2020, we hold and service a portfolio of SBA PPP loans totaling $715.1 million. These SBA PPP loans are subject to the provisions of the CARES Act as well as complex and evolving rules and guidance issued by the SBA and other government agencies. We expect that the great majority of our SBA PPP borrowers will seek full or partial forgiveness of their loan obligations. We have credit risk on SBA PPP loans if the SBA determines that there is a deficiency in the manner in which we originated, funded or serviced loans, including any issue with the eligibility of a borrower to receive a SBA PPP loan. We could face additional risks in our administrative capabilities to service our SBA PPP loans, and risk with respect to the determination of loan forgiveness, depending on any further updates to the final procedures for determining loan forgiveness. In the event of a loss resulting from a default on a SBA PPP loan and a determination by the SBA that there was a deficiency in the manner in which we originated, funded or serviced a SBA PPP loan, the SBA may deny its liability under the guaranty, reduce the amount of the guaranty or, if the SBA has already paid under the guaranty, seek recovery of any loss related to the deficiency from us. As of December 31, 2020, there was no ACL on SBA PPP loans.
In addition to SBA PPP loans, the Company is providing assistance to commercial business loan borrowers in response to the economic disruption caused by COVID-19 by offering short-term modifications such as interest only payments, payment deferrals, loan re-amortization, and increases of lines of credit. Also, the Company is assisting mortgage and consumer loan borrowers by offering short-term modifications for payment deferrals when the borrower meets certain criteria, or on a case-by-case analysis. Notwithstanding these COVID Modifications, these borrowers may not be able to resume making full payments on their loans once the COVID-19 pandemic is resolved. If the economic disruption from the COVID-19 pandemic continues for several months or worsens, it may result in increased loan delinquencies, adversely classified loans and loan charge-offs. As a result, our ACL on loans may require additional provision for credit losses to absorb losses in our loan portfolio, which may cause our results of operations, liquidity and financial condition to be adversely affected.
Further, given the widespread level of disruption to commercial and consumer activity due to COVID-19, the Company decided to adopt certain measures to assist its deposit customers in affected areas. These measures include the waiver of certain fees and charges, such as early withdrawal penalties for certificates of deposit and overdrafts, and while important to assist our customers, these concessions will negatively impact our results of operations.
In accordance with GAAP, and as a part of our prior business combinations, we recorded assets acquired and liabilities assumed at their fair value with the excess of the purchase consideration over the net assets acquired, resulting in the recognition of goodwill. If adverse economic conditions persist or we experience a decrease in our stock price and market capitalization as a result of the pandemic were to be deemed sustained rather than temporary, it may significantly affect the fair value of our goodwill and may trigger impairment charges. Any impairment charge could have a material adverse effect on our results of operations and financial condition.
We are an entity separate and distinct from our principal subsidiary, Heritage Bank, and derive substantially all of our revenue at the holding company level in the form of dividends from that subsidiary. If the COVID-19 pandemic were to materially adversely affect Heritage Bank’s regulatory capital levels or liquidity, it may result in Heritage Bank being unable to pay dividends to us, which may result in our not being able to pay dividends on our common stock at the same rate or at all.
The ultimate impact of the COVID-19 pandemic on our business, results of operations and financial condition, as well as our regulatory capital and liquidity ratios, will depend on future developments, which are highly uncertain and cannot be predicted, including the scope and duration of the pandemic and actions taken by governmental authorities in response to the
pandemic. Even after the COVID-19 pandemic subsides, the U.S. economy may continue to experience the recession, and we anticipate our business would be materially and adversely affected by a prolonged recession.
Risks Related to our Business Strategy
Our strategy of pursuing acquisitions and de novo branching exposes us to financial and operational risks that could adversely affect us.
We are pursuing a strategy of supplementing organic growth by acquiring other financial institutions or their businesses that we believe will help us fulfill our strategic objectives and enhance our earnings. There are risks associated with this strategy, however, including the following:
•we may be exposed to potential asset quality issues or unknown or contingent liabilities of the banks, businesses, assets and liabilities we acquire. If these issues or liabilities exceed our estimates, our results of operations and financial condition may be materially negatively affected;
•higher than expected deposit attrition;
•potential diversion of our management's time and attention;
•prices at which acquisitions are made can fluctuate with market conditions. We have experienced times during which acquisitions could not be made in specific markets at prices we considered acceptable and expect that we may continue to experience this condition in the future;
•the acquisition of other entities generally requires integration of systems, procedures and personnel of the acquired entity into our company to make the transaction economically successful. This integration process is complicated and time consuming and can also be disruptive to the customers of the acquired business. If the integration process is not conducted successfully and with minimal effect on the acquired business and its customers, we may not realize the anticipated economic benefits of an acquisition within the expected time frame, and we may lose customers or employees of the acquired business. We may also experience greater than anticipated customer losses even if the integration process is successful.
•to finance an acquisition, we may borrow funds, thereby increasing our leverage and diminishing our liquidity, or raise additional capital, which could dilute the interests of our existing shareholders;
•from 2006 through 2020, we completed eight acquisitions or mergers, including one acquisition in 2006, two acquisitions during 2010, two acquisitions during 2013, one merger in 2014 and two acquisitions in 2018 that enhanced our rate of growth. We may not be able to continue to sustain our past rate of growth or to grow at all in the future;
•we expect our net income will increase following our acquisitions; however, we also expect our general and administrative expenses and consequently our efficiency ratios may also increase. Ultimately, we would expect our efficiency ratio to improve; however, if we are not successful in our integration process, this may not occur, and our acquisitions or branching activities may not be accretive to earnings in the short or long-term;
•to the extent our costs of an acquisition exceed the fair value of the net assets acquired, the acquisition will generate goodwill. As discussed below under “-If the goodwill we have recorded in connection with acquisitions becomes impaired, our earnings and capital could be reduced,” we are required to assess our goodwill for impairment at least annually, and any goodwill impairment charge could have a material adverse effect on our results of operations and financial condition; and
•we are required to record purchased loans acquired through acquisitions at fair value, which may differ from the outstanding balance of such loans. Estimating the fair value of such loans requires management to make estimates based on available information and facts and circumstances on the acquisition date. The difference between the fair value and the outstanding balance of such loans is accreted into net interest income. Thus, our net interest margins may initially increase due to accretion. The yields on our loans could decline as our acquired loan portfolio pays down or matures, and we expect downward pressure on our interest income to the extent that the runoff on our acquired loan portfolio is not replaced with comparable high-yielding loans. This could result in higher net interest margins and interest income in current periods and lower net interest rate margins and lower interest income in future periods.
Our business strategy includes significant growth plans, and our financial condition and results of operations could be negatively affected if we are not successful in executing this strategy or if we fail to grow or manage our growth effectively.
We intend to pursue a growth strategy for our business. We regularly evaluate potential acquisitions and expansion opportunities. If appropriate opportunities present themselves, we expect to engage in selected acquisitions of financial institutions in the future, including branch acquisitions, or other business growth initiatives or undertakings. There can be no assurance that we will successfully identify appropriate opportunities, that we will be able to negotiate or finance such activities or that such activities, if undertaken, will be successful.
Our growth initiatives may require us to recruit experienced personnel to assist in such initiatives, which will increase our compensation costs. In addition, the failure to identify and retain such personnel would place significant limitations on our ability to successfully execute our growth strategy. To the extent we expand our lending beyond our current market areas, we also could incur additional risk related to those new market areas. We may not be able to expand our market presence in our existing market areas or successfully enter new markets.
If we do not successfully execute our acquisition growth plan, it could adversely affect our business, financial condition, results of operations, reputation and growth prospects. In addition, if we were to conclude that the value of an acquired business had decreased and that the related goodwill had been impaired, that conclusion would result in an impairment of goodwill charge
to us, which would adversely affect our results of operations. While we believe we have the executive management resources and internal systems in place to successfully manage our future growth, there can be no assurance that suitable growth opportunities will be available or that we will successfully manage our growth.
Risks Related to our Lending Activities
Our loan portfolio is concentrated in loans with a higher risk of loss.
Repayment of our commercial business loans, consisting of commercial and industrial loans as well as owner-occupied and non-owner occupied commercial real estate loans, is often dependent on the cash flows of the borrower, which may be unpredictable, and the collateral securing these loans may fluctuate in value. We offer different types of commercial business loans to a variety of businesses in industries such as real estate and rental and leasing, healthcare, accommodation and food services, retail trade and construction. The primary types of commercial business loans offered are lines of credit, term equipment financing and term real estate loans. We also originate loans that are guaranteed by the SBA, and we are a “preferred lender” of the SBA. Commercial business lending involves risks that are different from those associated with residential real estate lending. Our commercial business loans are primarily made based on our assessment of the cash flow of the borrower and secondarily on the underlying collateral provided by the borrower. The borrower's cash flow may be unpredictable, and collateral securing these loans may fluctuate in value. Although these commercial business loans are often collateralized by equipment, inventory, accounts receivable or other business assets, the liquidation of collateral in the event of default is often an insufficient source of repayment because accounts receivable may be uncollectible and inventories may be obsolete or of limited use, among other things. Accordingly, the repayment of commercial business loans depends primarily on the cash flow and creditworthiness of the borrower and secondarily on the underlying collateral provided by the borrower. In addition, as part of our commercial business lending activities, we originate agricultural loans. Agricultural lending involves a greater degree of risk. Payments on agricultural loans are typically dependent on the profitable operation or management of the related farm property. The success of the farm may be affected by many factors outside the control of the borrower, including adverse weather conditions that prevent the planting of a crop or limit crop yields (such as hail, drought and floods), loss of livestock due to disease or other factors, declines in market prices for agricultural products (both domestically and internationally), changes in the economy (such as tariffs) and the impact of government regulations (including changes in price supports, subsidies and environmental regulations). In addition, many farms are dependent on a limited number of key individuals whose injury or death may significantly affect the successful operation of the farm. If the cash flow from a farming operation is diminished, the borrower’s ability to repay the loan may be impaired.
Consequently, agricultural loans may involve a greater degree of risk than other types of loans, particularly in the case of loans that are unsecured or secured by rapidly depreciating assets such as farm equipment (some of which is highly specialized with a limited or no market for resale), or assets such as livestock or crops. In such cases, any repossessed collateral for a defaulted agricultural operating loan may not provide an adequate source of repayment of the outstanding loan balance as a result of the greater likelihood of damage, loss or depreciation or because the assessed value of the collateral exceeds the eventual realization value.
At December 31, 2020, our commercial business loans totaled $3.72 billion, or approximately 83.1% of our total loan portfolio. Approximately $56.8 million, or 1.5% of our commercial business loans, were nonperforming at December 31, 2020. The majority of the nonperforming commercial business loans were secured by real estate. Our agricultural loans totaled $81.6 million, or 1.8% of our total loan portfolio and 2.2% of our commercial business loans at December 31, 2020. Nonperforming agricultural loans totaled $17.8 million, or 30.6% of nonperforming loans at December 31, 2020.
Our owner and non-owner occupied commercial real estate loans, which include multifamily residential real estate loans, involve higher principal amounts than other loans and repayment of these loans may be dependent on factors outside our control or the control of our borrowers. We originate commercial real estate loans for individuals and businesses for various purposes, which are secured by commercial properties. These loans typically involve higher principal amounts than other types of loans, and repayment is dependent upon income generated, or expected to be generated, by the property securing the loan in amounts sufficient to cover operating expenses and debt service, which may be adversely affected by changes in the economy or local market conditions. For example, if the cash flow from the borrower’s project is reduced as a result of leases not being obtained or renewed, the borrower’s ability to repay the loan may be impaired. There is little difference in risk between owner-occupied commercial real estate loans and non-owner occupied commercial real estate loans.
Commercial real estate loans also expose us to greater credit risk than loans secured by residential real estate because the collateral securing these loans typically cannot be sold as easily as residential real estate. In addition, many of our commercial real estate loans are not fully amortizing and contain large balloon payments upon maturity. Such balloon payments may require the borrower to either sell or refinance the underlying property in order to make the payment, which may increase the risk of default or non-payment. If we foreclose on a commercial real estate loan, our holding period for the collateral typically is longer than for residential real estate loans because there are fewer potential purchasers of the collateral. Additionally, commercial real estate loans generally have relatively large balances to single borrowers or related groups of borrowers. Accordingly, if we make any errors in judgment regarding the collectability of our commercial real estate loans, any resulting charge-offs may be larger on a per loan basis than those incurred with our residential or consumer loan portfolios.
As of December 31, 2020, our owner and non-owner occupied commercial real estate loans totaled $2.27 billion, or 50.7% of our total loan portfolio. Approximately $25.5 million, or 1.1% of our owner and non-owner occupied commercial real estate loans, were nonperforming at December 31, 2020.
Our real estate construction and land development loans are based upon estimates of costs and the related value associated with the completed project. These estimates may be inaccurate. Construction lending involves additional risks when
compared with permanent commercial and residential lending because funds are advanced upon the collateral for the project based on an estimate of costs that will produce a future value at completion. Because of the uncertainties inherent in estimating construction costs, as well as the market value of the complete project and the effects of governmental regulation on real property, it is relatively difficult to evaluate accurately the total funds required to complete a project and the completed project loan-to-value ratio. Changes in demand and higher than anticipated building costs may cause actual results to vary significantly from those estimated. For these reasons, this type of lending also typically involves higher loan principal amounts and may be concentrated with a small number of builders. A downturn in housing, or the real estate market, could increase delinquencies, defaults and foreclosures, and significantly impair the value of our collateral and our ability to sell the collateral upon foreclosure. Some of our borrowers are builders with more than one loan outstanding with us. Consequently, an adverse development with respect to one loan or one credit relationship can expose us to a significantly greater risk of loss. As a result, these loans often involve the disbursement of funds with repayment substantially dependent on the success of the ultimate project and the ability of the borrower to sell or lease the property or obtain permanent take-out financing, rather than the ability of the borrower or guarantor to repay principal and interest. If our appraisal of the value of a completed project proves to be overstated, we may have inadequate security for the repayment of the loan upon completion of construction of the project and may incur a loss. Because construction loans require active monitoring of the building process, including cost comparisons and on-site inspections, these loans are more difficult and more costly to monitor. Increases in market rates of interest may have a more pronounced effect on construction loans by rapidly increasing the end-purchaser's borrowing costs, thereby possibly reducing the borrower's ability to finance the project upon completion or the overall demand for the project. Properties under construction are often difficult to sell and typically must be completed in order to be successfully sold which also complicates the process of working out problem construction loans. This may require us to advance additional funds and/or contract with another builder to complete construction and assume the market risk of selling the project at a future market price, which may or may not enable us to fully recover unpaid loan funds and associated construction and liquidation costs. Furthermore, in the case of speculative construction loans, there is the added risk associated with identifying an end-purchaser for the finished project. Land development loans also pose additional risk because of the lack of income being produced by the property and potential illiquid nature of the collateral. These risks can be significantly impacted by supply and demand conditions.
As of December 31, 2020, our real estate construction and land development loans totaled $305.7 million, or 6.9% of our total loan portfolio. Of these loans, $78.3 million, or 1.8% of our total loan portfolio, were residential construction and $227.5 million, or 5.1% of our total loan portfolio, were commercial and multifamily construction. Approximately $1.0 million, or 0.3% of our total real estate construction and land development loans, were nonperforming at December 31, 2020.
Our ACL on loans may prove to be insufficient to absorb losses in our loan portfolio.
Lending money is a substantial part of our business. Every loan carries a certain risk that it will not be repaid in accordance with its terms or that any underlying collateral will not be sufficient to assure repayment. This risk is affected by, among other things:
•the cash flow of the borrower, guarantors and/or the project being financed;
•the changes and uncertainties as to the future value of the collateral, in the case of a collateralized loan;
•the character and creditworthiness of a particular borrower or guarantor;
•changes in economic and industry conditions; and
•the duration of the loan.
The ACL on loans is a valuation account that is deducted from the amortized cost of loans receivable to present the net amount expected to be collected. Loans are charged-off through the ACL on loans when management believes the uncollectibility of a loan balance is confirmed. Subsequent recoveries, if any, are recorded to the ACL on loans. The Bank records the changes in the ACL on loans through earnings as a provision for credit losses on the Consolidated Statements of Income.
The determination of the appropriate level of ACL on loans inherently involves a high degree of subjectivity and requires us to make significant estimates of current credit risks and future trends, all of which may undergo material changes. If our estimates are incorrect, the ACL on loans may not be sufficient to cover credit losses inherent in our loan portfolio, resulting in the need for increases in our ACL on loans through the provision for credit losses which is charged against income. Management also recognizes that significant new growth in loan portfolios, new loan products and the refinancing of existing loans can result in portfolios comprised of unseasoned loans that may not perform in a historical or projected manner and will increase the risk that our ACL on loans may be insufficient to absorb losses without significant additional provisions.
Deterioration in economic conditions affecting borrowers, new information regarding existing loans, identification of additional problem loans and other factors, both within and outside of our control, may require an increase in the ACL on loans. If current conditions in the housing and real estate markets weaken, we expect we will experience increased delinquencies and credit losses. In addition, bank regulatory agencies periodically review our ACL on loans and may require an increase in the provision for credit losses or the recognition of further loan charge-offs, based on their judgments about information available to them at the time of their examination. In addition, if charge-offs in future periods exceed the ACL on loans, we will need additional provisions to increase the ACL on loans.
If our ACL on loans is not sufficient to cover actual loan losses our earnings could decrease.
For the year ended December 31, 2020 we recorded a provision for credit losses on loans of $35.4 million compared to $4.3 million for the year ended December 31, 2019, primarily due to forecasted economic conditions amidst the COVID-19 pandemic. We recorded net charge-offs of loans of $3.2 million for both of the years ended December 31, 2020 and December 31, 2019. Our allowance for credit losses on loans was 1.57% of the loan portfolio at December 31, 2020 compared to 1.01% at January 1, 2020, the adjusted beginning balance after CECL adoption, and represented management's best estimate of current expected credit losses over the life of the loans given the current economic conditions. At December 31, 2020 our total
nonperforming loans were $58.1 million, or 1.30% of loans receivable compared to $44.5 million or 1.18% of loans receivable at December 31, 2019. Generally, our nonperforming loans reflect operating difficulties of individual borrowers, which may be the result of current economic conditions. If economic conditions deteriorate, including as a result of COVID-19, we expect that we could experience significantly higher delinquencies and loan charge-offs. As a result, we may be required to make further increases in our provision for credit losses in the future, which could adversely affect our financial condition and results of operations.
General economic conditions tend to impact loan segments at varying degrees. At December 31, 2020, our commercial and industrial loan portfolio had the greatest percentage of nonaccrual loans of 53.8% as the borrowers are primarily business owners whose business results are influenced by current economic conditions. Our owner-occupied commercial real estate loans and non-owner occupied commercial real estate loans portfolio, which contained 31.7% and 12.3%, respectively, of our nonaccrual loans at December 31, 2020, generally have a larger percentage of nonperforming loans because of the same reasons as the commercial and industrial loan portfolio noted above.
Risks Related to Economic Conditions
The current economic condition in the market areas we serve may adversely impact our earnings and could increase the credit risk associated with our loan portfolio.
Substantially all of our loans are to businesses and individuals in the states of Washington and Oregon. A decline in the economies of our primary market areas of the Pacific Northwest in which we operate could have a material adverse effect on our business, financial condition, results of operations and prospects. Weakness in the global economy has adversely affected many businesses operating in our markets that are dependent upon international trade and it is not known how the recent changes in tariffs being imposed on international trade may also affect these businesses.
A deterioration in economic conditions in our market areas of the Pacific Northwest could result in the following consequences, any of which could have a materially adverse impact on our business, financial condition and results of operations:
•loan delinquencies, problem assets and foreclosures may increase;
•we may increase our ACL on loans;
•the sale of foreclosed assets may be slow;
•our provision for credit losses may increase;
•demand for our products and services may decline, possibly resulting in a decrease in our total loans;
•collateral for loans made may decline further in value, exposing us to increased risk of loss on existing loans;
•the net worth and liquidity of loan guarantors may decline, impairing their ability to honor commitments to us; and
•the amount of our deposits may decrease and the composition of our deposits may be adversely affected.
A decline in local economic conditions may have a greater effect on our earnings and capital than on the earnings and capital of larger financial institutions whose real estate loans are geographically diverse. Many of the loans in our portfolio are secured by real estate. Deterioration in the real estate markets where collateral for a loan is located could negatively affect the borrower’s ability to repay the loan and the value of the collateral securing the loan. Real estate values are affected by various other factors, including changes in general or regional economic conditions, governmental rules or policies and natural disasters such as earthquakes and flooding. If we are required to liquidate a significant amount of collateral during a period of reduced real estate values, our financial condition and profitability could be adversely affected.
Adverse changes in the regional and general economy could reduce our growth rate, impair our ability to collect loans and generally have a negative effect on our financial condition and results of operations.
Risks Related to Market Interest Rates
Fluctuating interest rates can adversely affect our profitability.
Our profitability is dependent to a large extent upon net interest income, which is the difference (or “spread”) between the interest earned on loans, investment securities and other interest earning assets and the interest paid on deposits, borrowings, and other interest bearing liabilities. Because of the differences in maturities and repricing characteristics of our interest earning assets and interest bearing liabilities, changes in interest rates do not produce equivalent changes in interest income earned on interest earning assets and interest paid on interest bearing liabilities.
We principally manage interest rate risk by managing our volume and mix of our earning assets and funding liabilities. Changes in monetary policy, including changes in interest rates, could influence not only the interest we receive on loans and investment securities and the amount of interest we pay on deposits and borrowings, but these changes could also affect (i) our ability to originate and/or sell loans and obtain deposits, (ii) the fair value of our financial assets and liabilities, which could negatively impact shareholders’ equity, and our ability to realize gains from the sale of such assets, (iii) our ability to obtain and retain deposits in competition with other available investment alternatives, (iv) the ability of our borrowers to repay adjustable or variable rate loans, and (v) the average duration of our investment securities portfolio and other interest earning assets. If the interest rates paid on deposits and other borrowings increase at a faster rate than the interest rates received on loans and other investments, our net interest income, and therefore earnings, could be adversely affected. Earnings could also be adversely affected if the interest rates decrease, as assets tend to reprice more quickly than liabilities. In a changing interest rate environment, we may not be able to manage this risk effectively. If we are unable to manage interest rate risk effectively, our business, financial condition and results of operations could be materially affected.
Interest rates are highly sensitive to many factors that are beyond our control, including general and forecasted economic conditions reflected in the rates offered along the yield curve and the FHLB's fixed-rate advance index, and policies of various governmental and regulatory agencies and, in particular, the Federal Reserve. In an attempt to help the overall economy recover from the economic slowdown of 2008, the Federal Reserve kept interest rates low through its targeted Fed Funds rate for a number of years. Starting in 2015, the Federal Reserve steadily increased the targeted Fed Funds rate until March 2020 when it reduced the targeted Fed Funds rate to 25 basis points in response to the COVID-19 pandemic. If the Federal Reserve increases the targeted federal funds rates, overall interest rates will likely rise, which may negatively impact both the housing market by reducing refinancing activity and new home purchases, and the U.S. economy. In addition, deflationary pressures, while possibly lowering our operational costs, could have a significant negative effect on our borrowers, especially our business borrowers, and the values of collateral securing loans which could negatively affect our financial performance.
A sustained increase in market interest rates could adversely affect our earnings. As is the case with many banks and saving institutions, our emphasis on increasing the development of core deposits (those deposits bearing no or a relatively low rate of interest with no state maturity date) has resulted in our interest bearing liabilities having a shorter duration than our assets. We would incur a higher cost of funds to retain these deposits in a rising interest rate environment. If the interest rates paid on deposits and other borrowings increase at a faster rate than the interest rates received on loans and other investments, our net interest income, and therefore earnings, could be adversely affected.
Changes in interest rates also affect the value of our interest earning assets and in particular our investment securities portfolio. Generally, the fair value of fixed-rate investment securities fluctuates inversely with changes in interest rates. Unrealized gains and losses on investment securities available for sale are reported as a separate component of equity, net of tax. Decreases in the fair value of investment securities available for sale resulting from increases in interest rates could have an adverse effect on stockholders’ equity.
Although management believes it has implemented effective asset and liability management strategies to reduce the potential effects of changes in interest rates on our results of operations, any substantial, unexpected or prolonged change in market interest rates could have a material adverse effect on our financial condition and results of operations. Also, our interest rate risk modeling techniques and assumptions likely may not fully predict or capture the impact of actual interest rate changes on our balance sheet.
Our investment securities portfolio may be negatively impacted by fluctuations in market value and interest rates.
Our investment securities portfolio may be impacted by fluctuations in market value, potentially reducing accumulated other comprehensive income (loss), net and/or earnings. Fluctuations in market value may be caused by changes in market interest rates, rating agency actions in respect of the securities, defaults by the issuer or with respect to the underlying securities, lower market prices for securities and limited investor demand. Our investment securities portfolio is evaluated for estimated credit losses, and an ACL on investment securities available for sale, as appropriate, is recorded as a contra asset on the financial statement of condition. If this evaluation shows actual or projected cash flows associated with one or more securities is less than the fair value of the security, a potential loss to earnings may occur through a provision for credit loss on investment securities available for sale through earnings.
Risks Related to Laws and Regulations
Non-compliance with the USA PATRIOT Act, Bank Secrecy Act, or other laws and regulations could result in fines or sanctions and limit our ability to get regulatory approval of acquisitions.
The USA PATRIOT and Bank Secrecy Acts require financial institutions to develop programs to prevent financial institutions from being used for money laundering and terrorist activities. If such activities are detected, financial institutions are obligated to file suspicious activity reports with the U.S. Treasury’s Office of Financial Crimes Enforcement Network. These rules require financial institutions to establish procedures for identifying and verifying the identity of customers seeking to open new financial accounts. Failure to comply with these regulations could result in fines or sanctions and limit our ability to get regulatory approval of acquisitions. Recently several banking institutions have received large fines for non-compliance with these laws and regulations. While we have developed policies and procedures designed to assist in compliance with these laws and regulations, no assurance can be given that these policies and procedures will be effective in preventing violations of these laws and regulations.
Failure to maintain and implement adequate programs to combat money laundering and terrorist financing could also have serious reputational consequences for us and could have a material adverse effect on our business, financial condition, results of operations and growth prospects.
Risks Related to Operational Matters
We rely on other companies to provide key components of our business infrastructure.
We rely on numerous external vendors to provide us with products and services necessary to maintain our day-to-day operations. Accordingly, our operations are exposed to risk that these vendors will not perform in accordance with the contracted arrangements under service level agreements. The failure of an external vendor to perform in accordance with the contracted arrangements under service level agreements because of changes in the vendor's organizational structure, financial condition, support for existing products and services or strategic focus or for any other reason, could be disruptive to our operations, which in turn could have a material negative impact on our financial condition and results of operations. We also could be adversely affected to the extent a service agreement is not renewed by the third-party vendor or is renewed on terms less favorable to us. Additionally, the bank regulatory agencies expect financial institutions to be responsible for all aspects of our vendors’ performance, including aspects which they delegate to third parties. Disruptions or failures in the physical infrastructure or
operating systems that support our business and customers, or cyber-attacks or security breaches of the networks, systems or devices that our customers use to access our products and services could result in client attrition, regulatory fines, penalties or intervention, reputational damage, reimbursement or other compensation costs, and/or additional compliance costs, any of which could materially adversely affect our results of operations or financial condition.
We are subject to certain risks in connection with our use of technology.
Our security measures may not be sufficient to mitigate the risk of a cyber-attack. Communications and information systems are essential to the conduct of our business, as we use such systems to manage our customer relationships, our core operating systems, our general ledger and virtually all other aspects of our business. Our operations rely on the secure processing, storage, and transmission of confidential and other information in our computer systems and networks. Although we take protective measures and endeavor to modify them as circumstances warrant, the security of our computer systems, software, and networks may be vulnerable to breaches, fraudulent or unauthorized access, denial or degradation of service attacks, misuse, computer viruses, malware or other malicious code and cyber-attacks that could have a security impact. If one or more of these events occur, this could jeopardize our or our customers' confidential and other information processed and stored in, and transmitted through, our computer systems and networks, or otherwise cause interruptions or malfunctions in our operations or the operations of our customers or counterparties. We may be required to expend significant additional resources to modify our protective measures or to investigate and remediate vulnerabilities or other exposures, and we may be subject to litigation and financial losses that are either not insured against or not fully covered through any insurance maintained by us. We could also suffer significant reputational damage.
Security breaches in our internet banking activities could further expose us to possible liability and damage our reputation. Increases in criminal activity levels and sophistication, advances in computer capabilities, new discoveries, and vulnerabilities in third-party technologies (including browsers and operating systems) or other developments could result in a compromise or breach of the technology, processes and controls that we use to prevent fraudulent transactions and to protect data about us, our clients and underlying transactions. Any compromise of our security could deter customers from using our internet banking services that involve the transmission of confidential information. We rely on standard internet security systems to provide the security and authentication necessary to effect secure transmission of data. Although we have developed and continue to invest in systems and processes that are designed to detect and prevent security breaches and cyber-attacks and periodically test our security, these precautions may not protect our systems from compromises or breaches of our security measures and could result in losses to us or our customers, our loss of business and/or customers, damage to our reputation, the incurrence of additional expenses, disruption to our business, our inability to grow our online services or other businesses, additional regulatory scrutiny or penalties, or our exposure to civil litigation and possible financial liability, any of which could have a material adverse effect on our business, financial condition and results of operations.
Our security measures may not protect us from system failures or interruptions. While we have established policies and procedures to prevent or limit the impact of systems failures and interruptions, there can be no assurance that such events will not occur or that they will be adequately addressed if they do. In addition, we outsource certain aspects of our data processing and other operational functions to certain third-party providers. While the Company selects third-party vendors carefully, it does not control their actions. If our third-party providers encounter difficulties, including those resulting from breakdowns or other disruptions in communication services provided by a vendor, failure of a vendor to handle current or higher transaction volumes, cyber-attacks and security breaches or if we otherwise have difficulty in communicating with them, our ability to adequately process and account for transactions could be affected, and our ability to deliver products and services to our customers and otherwise conduct business operations could be adversely impacted. Replacing these third-party vendors could also entail significant delay and expense. Threats to information security also exist in the processing of customer information through various other vendors and their personnel.
We cannot assure that such breaches, failures or interruptions will not occur or, if they do occur, that they will be adequately addressed by us or the third-parties on which we rely. We may not be insured against all types of losses as a result of third-party failures and insurance coverage may be inadequate to cover all losses resulting from breaches, system failures or other disruptions. If any of our third-party service providers experience financial, operational or technological difficulties, or if there is any other disruption in our relationships with them, we may be required to identify alternative sources of such services, and we cannot assure you that we could negotiate terms that are as favorable to us or could obtain services with similar functionality as found in our existing systems without the need to expend substantial resources, if at all. Further, the occurrence of any systems failure or interruption could damage our reputation and result in a loss of customers and business, could subject us to additional regulatory scrutiny, or could expose us to legal liability. Any of these occurrences could have a material adverse effect on our financial condition and results of operations.
The Board of Directors oversees the risk management process, including the risk of cybersecurity, and engages with management on cybersecurity issues.
If our enterprise risk management framework is not effective at mitigating risk and loss to us, we could suffer unexpected losses and our results of operations could be materially adversely affected.
Our enterprise risk management framework seeks to achieve an appropriate balance between risk and return, which is critical to optimizing stockholder value. We have established processes and procedures intended to identify, measure, monitor, report, analyze and control the types of risk to which we are subject. These risks include liquidity risk; credit risk; market risk; interest rate risk; operational risk; legal and compliance risk; and reputational risk, among others. We also maintain a compliance program to identify, measure, assess, and report on our adherence to applicable laws, policies and procedures. While we assess and improve these programs on an ongoing basis, there can be no assurance that our risk management or compliance programs, along with other related controls, will effectively mitigate all risk and limit losses in our business. However, as with any
risk management framework, there are inherent limitations to our risk management strategies as there may exist, or develop in the future, risks that we have not appropriately anticipated or identified. If our risk management framework proves ineffective, we could suffer unexpected losses and our business, financial condition and results of operations could be materially adversely affected.
We are subject to certain risks in connection with our data management or aggregation.
We are reliant on our ability to manage data and our ability to aggregate data in an accurate and timely manner to ensure effective risk reporting and management. Our ability to manage data and aggregate data may be limited by the effectiveness of our policies, programs, processes and practices that govern how data is acquired, validated, stored, protected and processed. While we continuously update our policies, programs, processes and practices, many of our data management and aggregation processes are manual and subject to human error or system failure. Failure to manage data effectively and to aggregate data in an accurate and timely manner may limit our ability to manage current and emerging risks, as well as to manage changing business needs.
Our business may be adversely affected by an increasing prevalence of fraud and other financial crimes.
As a bank, we are susceptible to fraudulent activity that may be committed against us or our customers which may result in financial losses or increased costs to us or our customers, disclosure or misuse of our information or our customer’s information, misappropriation of assets, privacy breaches against our customers, litigation or damage to our reputation. Such fraudulent activity may take many forms, including check fraud, electronic fraud, wire fraud, phishing, social engineering and other dishonest acts. Nationally, reported incidents of fraud and other financial crimes have increased. We have also experienced losses due to apparent fraud and other financial crimes, although such losses have been relatively insignificant to date. While we have policies and procedures designed to prevent such losses, there can be no assurance that such losses will not occur.
Managing reputational risk is important to attracting and maintaining customers, investors and employees.
Threats to our reputation can come from many sources, including adverse sentiment about financial institutions generally, unethical practices, employee misconduct, failure to deliver minimum standards of service or quality, compliance deficiencies and questionable or fraudulent activities of our customers. We have policies and procedures in place to protect our reputation and promote ethical conduct, but these policies and procedures may not be fully effective. Negative publicity regarding our business, employees, or customers, with or without merit, may result in the loss of customers, investors and employees, costly litigation, a decline in revenues and increased governmental regulation.
We are dependent on key personnel and the loss of one or more of those key personnel may materially and adversely affect our prospects.
Competition for qualified employees and personnel in the banking industry is intense and there are a limited number of qualified persons with knowledge of, and experience in, the community banking industry where we conduct our business. The process of recruiting personnel with the combination of skills and attributes required to carry out our strategies is often lengthy. Our success depends to a significant degree upon our ability to attract and retain qualified management, loan origination, finance, administrative, marketing and technical personnel and upon the continued contributions of our management and personnel. In particular, our success has been and continues to be highly dependent upon the abilities of key executives, including our Chief Executive Officer, Jeffrey J. Deuel, and certain other employees. The loss of key personnel could adversely affect our ability to successfully conduct our business.
Our ability to sustain or improve upon existing performance is dependent upon our ability to respond to technological change, and we may have fewer resources than some of our competitors to continue to invest in technological improvements.
The financial services industry is experiencing rapid technological changes with frequent introductions of new technology-driven products and services. Effective use of technology increases efficiency and enables financial institutions to better serve customers and to reduce costs. Many of our competitors have substantially greater resources to invest in technological improvements than we do. Our future success will depend, to some degree, upon our ability to address the needs of our customers by using technology to provide products and services that will satisfy customer demands for convenience, as well as create additional efficiencies in our operations. We may not be able to effectively implement new technology-driven products or services or be successful in marketing these products and services. Additionally, the implementation of technological changes and upgrades to maintain current systems and integrate new ones may cause services interruptions, transaction processing errors and system conversion delays and may cause us to fail to comply with applicable laws. There can be no assurance that we will be able to successfully manage the risks associated with increased dependency on technology.
Risks Related to Accounting Matters
New or changing tax, accounting, and regulatory rules and interpretations could significantly impact strategic initiatives, results of operations, cash flows, and financial condition.
The financial services industry is extensively regulated. Federal and state banking regulations are designed primarily to protect the deposit insurance funds and consumers, not to benefit our stockholders. These regulations, along with the currently existing tax, accounting, securities, insurance, and monetary laws, regulations, rules, standards, policies, and interpretations control the methods by which financial institutions conduct business, implement strategic initiatives and tax compliance, and govern financial reporting and disclosures. These laws, regulations, rules, standards, policies, and interpretations are constantly evolving and may change significantly over time. Any new regulations or legislation, change in existing regulation or oversight, whether a change in regulatory policy or a change in a regulator's interpretation of a law or regulation, could have a material
impact on our operations, increase our costs of regulatory compliance and of doing business and adversely affect our profitability. Regulatory authorities also have extensive discretion in connection with their supervisory and enforcement activities, including the imposition of restrictions on the operation of an institution, the classification of assets by the institution and adequacy of an institution's ACL. These bank regulators also have the ability to impose conditions in the approval of merger and acquisition transactions.
If the goodwill we have recorded in connection with acquisitions becomes impaired, our earnings and capital could be reduced.
Accounting standards require that we account for acquisitions or business combinations using the purchase method of accounting. Under purchase accounting, if the purchase price of an acquired company exceeds the fair value of its net assets, the excess is carried on the acquirer’s balance sheet as goodwill. In accordance with GAAP, our goodwill is evaluated for impairment on an annual basis or more frequently if events or circumstances indicate that a potential impairment exists. The evaluation is based on a variety of factors, including the quoted price of our common stock, market prices of common stock of other banking organizations, common stock trading multiples, discounted cash flows, and data from comparable acquisitions. At December 31, 2020, we had goodwill with a carrying amount of $240.9 million.
Declines in our stock price or a prolonged weakness in the operating environment of the financial services industry may result in a future impairment charge. Any such impairment charge could have a material adverse effect on our operating results and financial condition.
Other Risks Related to Our Business
Uncertainty relating to the LIBOR calculation process and potential phasing out of LIBOR may adversely affect our results of operations.
We have certain loans and investment securities indexed to LIBOR to calculate the loan interest rate. The continued availability of the LIBOR index is not guaranteed after 2021. We cannot predict whether and to what extent banks will continue to provide LIBOR submissions to the administrator of LIBOR or whether any additional reforms to LIBOR may be enacted. At this time, no consensus exists as to what rate or rates may become acceptable alternatives to LIBOR with the exception of overnight repurchase agreements, which are expected to be based on the Secured Overnight Financing Rate, or SOFR, and it is impossible to predict the effect of any such alternatives on the value of LIBOR-based securities and variable rate loans, subordinated debentures, or other securities or financial arrangements, given LIBOR's role in determining market interest rates globally. SOFR is observed and backward looking, which stands in contrast with LIBOR under the current methodology, which is an estimated forward-looking rate and relies, to some degree, on the expert judgment of submitting panel members. Given that SOFR is a secured rate backed by government securities, it will be a rate that does not take into account bank credit risk (as is the case with LIBOR). SOFR is therefore likely to be lower than LIBOR and is less likely to correlate with the funding costs of financial institutions. Whether or not SOFR attains market traction as a LIBOR replacement tool remains in question and the future of LIBOR remains uncertain at this time. Uncertainty as to the nature of alternative reference rates and as to potential changes or other reforms to LIBOR may adversely affect LIBOR rates and the value of LIBOR-based loans, and to a lesser extent investment securities in our portfolio, and may impact the availability and cost of hedging instruments and borrowings, including the rates we pay on our subordinated debentures and trust preferred securities. If LIBOR rates are no longer available, and we are required to implement substitute indices for the calculation of interest rates under our loan agreements with our borrowers or our existing borrowings, we may incur significant expenses in effecting the transition, and may be subject to disputes or litigation with customers and creditors over the appropriateness or comparability to LIBOR of the substitute indices, which could have an adverse effect on our results of operations.
To mitigate the uncertainty surrounding the LIBOR transition, the Bank has been utilizing specific contract language in new loan agreements that provides for changes in the index used to calculate the loan's interest rate. Additionally, effective January 25, 2021, the Company has agreed to adhere to the Interbank Offered Rate Fallbacks Protocol as published by the International Swaps and Derivatives Association, Inc. and recommended by the Alternative Reference Rates Committee. As of January 25, 2021, more than 12,000 entities across nearly 80 jurisdictions have adhered to this protocol which is expected to support a smooth transition from LIBOR to a replacement index.
Decreased volumes and lower gains on sales of mortgage loans sold could adversely impact our noninterest income.
We originate and sell residential real estate loans, or mortgage loans. The related mortgage income is a significant portion of our noninterest income. We generate gains on the sale of residential real estate loans pursuant to programs currently offered by the Federal Home Loan Mortgage Corporation and other secondary market purchasers. Any future changes in their purchase programs, our eligibility to participate in such programs, the criteria for loans to be accepted or laws that significantly affect the activity of such entities could, in turn, materially adversely affect our results of operations. Further, in a rising or higher interest rate environment, our originations of mortgage loans may decrease, resulting in fewer loans that are available to be sold to investors. This would result in a decrease in mortgage banking income and a corresponding decrease in noninterest income. In addition, our results of operations are affected by the amount of noninterest expense associated with mortgage banking activities, such as salaries and employee benefits; occupancy and equipment expense; data processing expense and other operating costs. During periods of reduced loan demand, our results of operations may be adversely affected to the extent that we are unable to reduce expenses commensurate with the decline in mortgage loan originations.
Ineffective liquidity management could adversely affect our financial results and condition.
Effective liquidity management is essential to our business. We require sufficient liquidity to meet customer loan requests, customer deposit maturities and withdrawals, payments on our debt obligations as they come due and other cash
commitments under both normal operating conditions and other unpredictable circumstances, including events causing industry or general financial market stress. An inability to raise funds through deposits, borrowings, the sale of loans or investment securities and other sources could have a substantial negative effect on our liquidity. We rely on customer deposits and at times, borrowings from the FHLB and certain other wholesale funding sources to fund our operations. Deposit flows and the prepayment of loans and mortgage-related investment securities are strongly influenced by such external factors as the direction of interest rates, whether actual or perceived, and the competition for deposits and loans in the markets we serve. Further, changes to the FHLB's underwriting guidelines for wholesale borrowings or lending policies may limit or restrict our ability to borrow, and could therefore have a significant adverse impact on our liquidity. Although we have historically been able to replace maturing deposits and borrowings if desired, we may not be able to replace such funds in the future if, among other things, our financial condition, the financial condition of the FHLB, or market conditions change. Our access to funding sources in amounts adequate to finance our activities or on terms which are acceptable could be impaired by factors that affect us specifically or the financial services industry or economy in general, such as a disruption in the financial markets or negative views and expectations about the prospects for the financial services industry or deterioration in credit markets. Additional factors that could detrimentally impact our access to liquidity sources include a decrease in the level of our business activity as a result of a downturn in the markets in which our deposits and loans are concentrated, negative operating results, or adverse regulatory action against us. Any decline in available funding in amounts adequate to finance our activities or on terms which are acceptable could adversely impact our ability to originate loans, invest in securities, pay our expenses, or fulfill obligations such as repaying our borrowings or meeting deposit withdrawal demands, any of which could, in turn, have a material adverse effect on our business, financial condition and results of operations.
Additionally, collateralized public funds are bank deposits of state and local municipalities. These deposits are required to be secured by certain investment grade securities to ensure repayment, which on the one hand tends to reduce our contingent liquidity risk by making these funds somewhat less credit sensitive, but on the other hand reduces standby liquidity by restricting the potential liquidity of the pledged collateral. Although these funds historically have been a relatively stable source of funds for us, availability depends on the individual municipality's fiscal policies and cash flow needs.
Our growth or future losses may require us to raise additional capital in the future, but that capital may not be available when it is needed or the cost of that capital may be very high; further, the resulting dilution of our equity may adversely affect the market price of our common stock.
We are required by federal and state regulatory authorities to maintain adequate levels of capital to support our operations. At some point, we may need to raise additional capital to support our growth or replenish future losses. Our ability to raise additional capital, if needed, will depend on conditions in the capital markets at that time, which are outside our control, and on our financial condition and performance. If we are able to raise capital it may not be on terms that are acceptable to us. Accordingly, we cannot make assurances that we will be able to raise additional capital if needed on terms that are acceptable to us, or at all. If we cannot raise additional capital when needed, our ability to further expand our operations through internal growth and acquisitions could be materially impaired and our financial condition and liquidity could be materially and adversely affected.
In addition, any additional capital we obtain may result in the dilution of the interests of existing holders of our common stock. Further, if we are unable to raise additional capital when required by our bank regulators, we may be subject to adverse regulatory action.
Societal responses to climate change could adversely affect our business and performance, including indirectly through impacts on our customers.
Concerns over the long-term impacts of climate change have led and will continue to lead to governmental efforts around the world to mitigate those impacts. Consumers and businesses also may change their behavior on their own as a result of these concerns. We and our customers will need to respond to new laws and regulations as well as consumer and business preferences resulting from climate change concerns. We and our customers may face cost increases, asset value reductions and operating process changes. The impact on our customers will likely vary depending on their specific attributes, including reliance on or role in carbon intensive activities. Among the impacts to us could be a drop in demand for our products and services, particularly in certain industry sectors. In addition, we could face reductions in creditworthiness on the part of some customers or in the value of assets securing loans. Our efforts to take these risks into account in making lending and other decisions, including by increasing our business with climate-friendly companies, may not be effective in protecting us from the negative impact of new laws and regulations or changes in consumer or business behavior.
We rely on dividends from Heritage Bank for substantially all of our revenue at the holding company level.
We are an entity separate and distinct from our subsidiary, Heritage Bank, and derive substantially all of our revenue at the holding company level in the form of dividends from that subsidiary. Accordingly, we are, and will be, dependent upon dividends from the Bank to pay the principal of and interest on our indebtedness, to satisfy our other cash needs and to pay dividends on our common stock. The Bank's ability to pay dividends is subject to its ability to earn net income and to meet certain regulatory requirements. In the event the Bank is unable to pay dividends to us, we may not be able to pay dividends on our common stock. Also, our right to participate in a distribution of assets upon a subsidiary's liquidation or reorganization is subject to the prior claims of the subsidiary's creditors.
ITEM 1B. UNRESOLVED STAFF COMMENTS
The Company has no unresolved staff comments from the SEC as it relates to the Company's financial information as reported in the Form 10-K.
ITEM 2. PROPERTIES
The main office of Heritage Bank is located in approximately 22,000 square feet of the headquarters building and adjacent office space and main branch office which are owned by Heritage Bank and located in downtown Olympia, Washington. In addition, the Company's branch network at December 31, 2020 was comprised of 61 branches located throughout Washington and Oregon. We consolidated eight branches in January 2021, which reduced our branch network to 53 branches as of February 26, 2021. In the opinion of management, all properties are adequately covered by insurance, are in a good state of repair and are adequate to meet our present and immediately foreseeable needs. We will, however, continue to monitor customer growth and expand our branching network, if necessary, to serve our customers' needs.
For additional information concerning our premises and equipment and lease obligations, see Note (7) Premises and Equipment and Note (15) Commitments and Contingencies of the Notes to Consolidated Financial Statements included in Item 8. Financial Statements And Supplementary Data.
ITEM 3. LEGAL PROCEEDINGS
We, and our Bank, are not a party to any material pending legal proceedings other than ordinary routine litigation incidental to the business of the Bank.
ITEM 4. MINE SAFETY DISCLOSURES
Not applicable
PART II
ITEM 5. MARKET FOR THE REGISTRANT'S COMMON EQUITY, RELATED STOCKHOLDER MATTERS AND ISSUER PURCHASES OF EQUITY SECURITIES
Our common stock is traded on the NASDAQ Global Select Market under the symbol HFWA. At December 31, 2020, we had approximately 1,249 shareholders of record (not including the number of persons or entities holding stock in nominee or street name through various brokerage firms) and 35,912,243 outstanding shares of common stock.
Stock Repurchases
The Company has had various stock repurchase programs since March 1999. On March 12, 2020 the Company's Board of Directors authorized the additional repurchase of up to 5% of the Company's outstanding common shares, or 1,799,054 shares, under the twelfth stock repurchase plan.
During the year ended December 31, 2020, the Company repurchased the remaining 639,922 shares available under the eleventh stock repurchase plan at a weighted average price per share of $23.95 and repurchased 155,778 shares at a weighted average share price of $20.34 under the twelfth stock repurchase plan, which is a total of 795,700 shares under both plans at a weighted average share price of $23.25.
During the year ended December 31, 2019, the Company repurchased 292,712 shares under the eleventh stock repurchase plan at a weighted average price per share of $26.50. No shares were repurchased under this plan during the year ended December 31, 2018.
The number, timing and price of shares repurchased will depend on business and market conditions and other factors, including opportunities to deploy the Company's capital.
In addition to the stock repurchases under a plan, the Company repurchases shares to pay withholding taxes on the vesting of restricted stock awards and units. The following table provides total repurchased shares for the periods indicated:
| | | | | | | | | | | | | | | | | |
| Year Ended December 31, |
| 2020 | | 2019 | | 2018 |
Repurchased shares to pay withholding taxes (1) | 28,887 | | | 28,479 | | | 53,256 | |
| Stock repurchase to pay withholding taxes average share price | $ | 21.57 | | | $ | 30.83 | | | $ | 31.99 | |
(1)During the year ended December 31, 2018, the Company repurchased 26,741 shares related to the withholding taxes due on the accelerated vesting of the restricted stock units of Puget Sound which were converted to Heritage common stock shares with a share price of $31.80 under the terms of the Puget Sound Merger.
The following table sets forth information about the Company’s purchases of its outstanding common stock during the quarter ended December 31, 2020:
| | | | | | | | | | | | | | | | | | | | | | | |
| Period | Total Number of Shares Purchased (1) | | Average Price
Paid Per
Share (1) | | Cumulative Total Number of Shares Purchased as Part of
Publicly Announced
Plans or Programs | | Maximum
Number of Shares that May Yet Be Purchased Under the Plans or Programs |
| October 1, 2020— October 31, 2020 | — | | | $ | — | | | 8,981,801 | | | 1,643,276 | |
| November 1, 2020— November 30, 2020 | — | | | — | | | 8,981,801 | | | 1,643,276 | |
| December 1, 2020— December 31, 2020 | 581 | | | 23.35 | | | 8,981,801 | | | 1,643,276 | |
| Total | 581 | | | $ | 23.35 | | | | | |
(1)Of the common shares repurchased by the Company between October 1, 2020 and December 31, 2020, all of the shares represented the cancellation of stock to pay withholding taxes on vested restricted stock awards or units.
Stock Performance Graph
The following graph depicts total return to shareholders during the five-year period beginning December 31, 2015 and ending December 31, 2020. Total return includes appreciation or depreciation in market value of the Company’s common stock as well as actual cash and stock dividends paid to common shareholders. The graph additionally shows the five-year comparison of the total return to shareholders of the Company’s common stock as compared to the NASDAQ Composite Index and the SNL U.S. Bank NASDAQ Index. The NASDAQ Composite Index is a comparative broad market index comprised of all domestic and international common stocks listed on the Nasdaq Stock Market. The SNL U.S. Bank NASDAQ Index is a comparative peer index comprised of banks and related holding companies listed on the NASDAQ Stock Market. The graph assumes that the value of the investment in Heritage’s common stock and each of the three indices was $100 on December 31, 2015, and that all dividends were reinvested.
.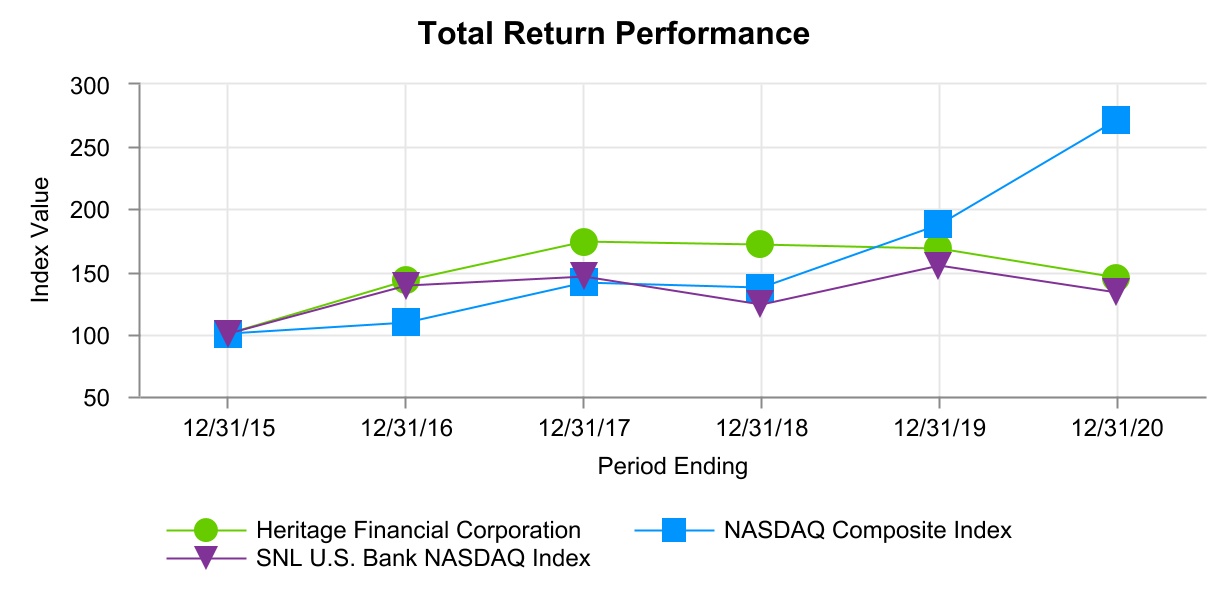
| | | | | | | | | | | | | | | | | | | | | | | | | | | | | | | | | | | |
| | Years Ended December 31, |
| Index | 2015 | | 2016 | | 2017 | | 2018 | | 2019 | | 2020 |
| Heritage Financial Corporation | $ | 100.00 | | | $ | 142.30 | | | $ | 174.01 | | | $ | 171.68 | | | $ | 168.23 | | | $ | 144.63 | |
| NASDAQ Composite Index | 100.00 | | | 108.87 | | | 141.13 | | | 137.12 | | | 187.44 | | | 271.64 | |
| SNL U.S. Bank NASDAQ Index | 100.00 | | | 138.65 | | | 145.97 | | | 123.04 | | | 154.47 | | | 132.59 | |
*Information for the graph was provided by S&P Global Market Intelligence.
ITEM 6. SELECTED FINANCIAL DATA
The following tables set forth certain information concerning our consolidated financial position and results of operations at and for the dates indicated and have been derived from our audited Consolidated Financial Statements. The information below is qualified in its entirety by the detailed information included elsewhere herein and should be read along with Item 7. Management’s Discussion And Analysis Of Financial Condition And Results Of Operations and Item 8. Financial Statements And Supplementary Data.
Matters affecting comparability in the five-year summary detailed below include the Premier and Puget Mergers completed in 2018 and the COVID-19 pandemic during 2020.
| | | | | | | | | | | | | | | | | | | | | | | | | | | | | |
| | Year Ended December 31, |
| | 2020 | | 2019 | | 2018 | | 2017 | | 2016 |
| | (Dollars in thousands, except per share amounts) |
| Operations Data: | | | | | | | | | |
| Interest income | $ | 214,320 | | | $ | 217,850 | | | $ | 199,406 | | | $ | 147,709 | | | $ | 138,512 | |
| Interest expense | 13,323 | | | 18,168 | | | 12,413 | | | 8,346 | | | 6,006 | |
| Net interest income | 200,997 | | | 199,682 | | | 186,993 | | | 139,363 | | | 132,506 | |
Provision for credit losses (1) | 36,106 | | | 4,311 | | | 5,129 | | | 4,220 | | | 4,931 | |
| Noninterest income | 37,229 | | | 32,462 | | | 31,618 | | | 35,579 | | | 31,619 | |
| Noninterest expense | 148,940 | | | 146,788 | | | 149,187 | | | 110,575 | | | 106,473 | |
Income tax expense (2) | 6,610 | | | 13,488 | | | 11,238 | | | 18,356 | | | 13,803 | |
| Net income | $ | 46,570 | | | $ | 67,557 | | | $ | 53,057 | | | $ | 41,791 | | | $ | 38,918 | |
| Earnings per common share: | | | | | | | | | |
| Basic | $ | 1.29 | | | $ | 1.84 | | | $ | 1.49 | | | $ | 1.39 | | | $ | 1.30 | |
| Diluted | $ | 1.29 | | | $ | 1.83 | | | $ | 1.49 | | | $ | 1.39 | | | $ | 1.30 | |
Dividend payout ratio to common shareholders (3) | 62.0 | % | | 45.9 | % | | 48.3 | % | | 43.9 | % | | 55.4 | % |
| Performance Ratios: | | | | | | | | | |
Net interest spread (4) | 3.49 | % | | 4.03 | % | | 4.15 | % | | 3.83 | % | | 3.89 | % |
Net interest margin (5) | 3.63 | | | 4.22 | | | 4.29 | | | 3.93 | | | 3.96 | |
Efficiency ratio (6) | 62.52 | | | 63.23 | | | 68.24 | | | 63.21 | | | 64.87 | |
| Noninterest expense to average assets | 2.37 | | | 2.71 | | | 3.00 | | | 2.78 | | | 2.84 | |
| Return on average assets | 0.74 | | | 1.25 | | | 1.07 | | | 1.05 | | | 1.04 | |
| Return on average common equity | 5.78 | % | | 8.56 | % | | 7.72 | % | | 8.36 | % | | 8.01 | % |
(1)Effective January 1, 2020, Company adopted ASU 2016-13, Financial Instruments - Credit Losses.
(2)The Tax Cuts and Jobs Act enacted on December 22, 2017 decreased the federal corporate income tax rate from 35% to 21% beginning January 1, 2018 and impacted the comparability of our results. The results for the year ended December 31, 2017 included a $2.6 million increase to the income tax expense as a result of the revaluation of our deferred tax assets and liabilities to account for the tax rate change.
(3)Dividend payout ratio is declared dividends per common share divided by diluted earnings per common share.
(4)Net interest spread is the difference between the average yield on interest earning assets and the average cost of interest bearing liabilities.
(5)Net interest margin is net interest income divided by average interest earning assets.
(6)The efficiency ratio is noninterest expense divided by the sum of net interest income and noninterest income.
| | | | | | | | | | | | | | | | | | | | | | | | | | | | | |
| | December 31, |
| | 2020 | | 2019 | | 2018 | | 2017 | | 2016 |
| | (Dollars in thousands) |
| Balance Sheet Data: | | | | | | | | | |
| Total assets | $ | 6,615,318 | | | $ | 5,552,970 | | | $ | 5,316,927 | | | $ | 4,113,270 | | | $ | 3,878,981 | |
| Loans receivable, net | 4,398,462 | | | 3,731,708 | | | 3,619,118 | | | 2,816,985 | | | 2,609,666 | |
| Investment securities | 802,163 | | | 952,312 | | | 976,095 | | | 810,530 | | | 794,645 | |
| Goodwill and other intangible assets | 254,027 | | | 257,552 | | | 261,553 | | | 125,117 | | | 126,403 | |
| Deposits | 5,597,990 | | | 4,582,676 | | | 4,432,402 | | | 3,393,060 | | | 3,229,648 | |
| Federal Home Loan Bank advances | — | | | — | | | — | | | 92,500 | | | 79,600 | |
| | | | | | | | | | | | | | | | | | | | | | | | | | | | | |
| | December 31, |
| | 2020 | | 2019 | | 2018 | | 2017 | | 2016 |
| | (Dollars in thousands) |
| Junior subordinated debentures | 20,887 | | | 20,595 | | | 20,302 | | | 20,009 | | | 19,717 | |
| Securities sold under agreement to repurchase | 35,683 | | | 20,169 | | | 31,487 | | | 31,821 | | | 22,104 | |
| Stockholders’ equity | $ | 820,439 | | | $ | 809,311 | | | $ | 760,723 | | | $ | 508,305 | | | $ | 481,763 | |
| Financial Measures: | | | | | | | | | |
| Book value per common share | $ | 22.85 | | | $ | 22.10 | | | $ | 20.63 | | | $ | 16.98 | | | $ | 16.08 | |
| Stockholders' equity to assets ratio | 12.4 | % | | 14.6 | % | | 14.3 | % | | 12.4 | % | | 12.4 | % |
Net loans to deposits (1) | 79.8 | % | | 82.2 | % | | 82.4 | % | | 84.0 | % | | 81.8 | % |
| Capital Ratios: | | | | | | | | | |
| Total risk-based capital ratio | 14.0 | % | | 12.8 | % | | 12.9 | % | | 12.8 | % | | 13.0 | % |
| Tier 1 risk-based capital ratio | 12.8 | | | 12.0 | | | 12.1 | | | 11.8 | | | 12.0 | |
| Leverage ratio | 9.0 | | | 10.6 | | | 10.5 | | | 10.2 | | | 10.3 | |
| Common equity Tier 1 capital to risk-weighted assets | 12.3 | % | | 11.5 | % | | 11.7 | % | | 11.3 | % | | 11.4 | % |
| Asset Quality Ratios: | | | | | | | | | |
| Nonperforming loans to loans receivable, net | 1.30 | % | | 1.18 | % | | 0.37 | % | | 0.38 | % | | 0.41 | % |
| Allowance for credit losses to loans receivable, net | 1.57 | | | 0.96 | | | 0.96 | | | 1.13 | | | 1.18 | |
| Allowance for credit losses to nonperforming loans | 120.82 | | | 81.24 | | | 255.73 | | | 299.79 | | | 284.93 | |
| Nonperforming assets to total assets | 0.88 | | | 0.82 | | | 0.30 | | | 0.26 | | | 0.30 | |
| Net charge-off on loans to average loans receivable, net | 0.07 | % | | 0.09 | % | | 0.06 | % | | 0.12 | % | | 0.14 | % |
| Other Data: | | | | | | | | | |
| Number of banking offices | 61 | | | 62 | | | 64 | | | 59 | | | 63 | |
| Number of full-time equivalent employees | 852 | | | 884 | | | 859 | | | 735 | | | 760 | |
| Deposits per branch | 91,770 | | | 73,914 | | | 69,256 | | | 57,509 | | | 51,264 | |
| Assets per full-time equivalent | 7,764 | | | 6,282 | | | 6,190 | | | 5,596 | | | 5,104 | |
(1)Loans receivable divided by deposits.
During the period from December 31, 2016 through December 31, 2020 total assets increased $2.74 billion, or 70.5%, to $6.62 billion as of December 31, 2020 from $3.88 billion at December 31, 2016 due primarily to loans receivable, net of allowance for credit losses on loans which increased $1.79 billion, or 68.5%, to $4.40 billion as of December 31, 2020 from $2.61 billion at December 31, 2016. Loans receivable, net increased during 2018 due primarily to the Premier and Puget Mergers with a combined fair value of loans acquired of $718.6 million as of the merger dates and during 2020 due primarily to our participation in the SBA's PPP. SBA PPP loans totaled $715.1 million at December 31, 2020. The remaining increase in loans of $355.1 million, or 3.2% annualized, was due to organic growth.
Deposits increased $2.37 billion, or 73.3%, to $5.60 billion at December 31, 2020 from $3.23 billion at December 31, 2016 due primarily to the Premier and Puget Mergers with a combined fair value of deposits acquired of $824.6 million as of the merger dates during 2018, the impact of the COVID-19 pandemic during 2020, including the impact of proceeds of SBA PPP loans deposited directly into the customers' deposit accounts at the Bank and an increase in customer deposit accounts based on changes in spending habits during the COVID-19 pandemic, and an increase in new deposit accounts. From December 31, 2016 to December 31, 2020, non-maturity or core deposits (which we define to include all deposits except certificates of deposit), including acquired deposits, increased $2.33 billion, or 81.0%, to $5.20 billion at December 31, 2020. The percentage of certificate of deposit accounts to total deposits decreased to 7.1% at December 31, 2020 from 11.1% at December 31, 2016.
Stockholders’ equity increased by $338.7 million, or 70.3%, to $820.4 million at December 31, 2020 from $481.8 million at December 31, 2016 due primarily to a combination of earnings and issuances of common stock for the Premier and Puget Mergers, partially offset by repurchases of common stock and cash dividends paid.
Net income increased $7.7 million, or 19.7%, to $46.6 million for the year ended December 31, 2020 from $38.9 million for the year ended December 31, 2016 as a result of the growth in the Company described above. Our results for the year ended December 31, 2020 were materially impacted by the COVID-19 pandemic, which caused a significant increase in our ACL on
loans through provision for credit losses expense. Pre-tax, pre-provision net income, a non-GAAP measure, reflects net income adjusted to remove the impacts of provision for credit loss expense caused primarily by the COVID-19 pandemic and lower income tax expense caused primarily by the Tax Act. Pre-tax pre-provision income increased $31.6 million, or 54.9%, to $89.3 million for the year ended December 31, 2020 from $57.7 million for the year ended December 31, 2016. For a reconciliation of net income to pre-tax, pre-provision income, see Reconciliations of Non-GAAP Measures in Item 7. Management’s Discussion And Analysis Of Financial Condition And Results Of Operations. Net interest income increased $68.5 million, or 51.7%, to $201.0 million for the year ended December 31, 2020 from $132.5 million during the year ended December 31, 2016 primarily as a result of organic growth of the Company in addition to acquisitions and participation in the SBA PPP. The increase in net interest income was primarily a result of an increase in interest income of $75.8 million, or 54.7%, to $214.3 million for the year ended December 31, 2020 from $138.5 million for the year ended December 31, 2016. The increase in net income was partially offset by an increase in noninterest expense of $42.5 million, or 39.9%, to $148.9 million for the year ended December 31, 2020 from $106.5 million for the year ended December 31, 2016.
ITEM 7. MANAGEMENT'S DISCUSSION AND ANALYSIS OF FINANCIAL CONDITION AND RESULTS OF OPERATIONS
The following discussion is intended to assist in understanding the financial condition and results of operations of the Company for the year ended December 31, 2020. The information contained in this section should be read together with the December 31, 2020 audited Consolidated Financial Statements and Notes thereto included in Item 8. Financial Statements And Supplementary Data of this Form 10-K.
This section of this Form 10-K generally discusses 2020 and 2019 items and year-to-year comparisons between 2020 and 2019. Discussions of 2018 items and year-to-year comparisons between 2019 and 2018 that are not included in this Form 10-K can be found in “Management’s Discussion and Analysis of Financial Condition and Results of Operations” in Part II, Item 7 of the Company’s Form 10-K for the fiscal year ended December 31, 2019.
COVID-19 Impacts
In response to the COVID-19 pandemic, and in an effort to mitigate the adverse impact on our employees, customers and the communities we serve, the Bank implemented various lending measures to address customer and community needs, including commercial, mortgage and consumer lending assistance. The Bank also implemented various retail-impacting measures for the safety and health of customers and employees. The following provides details of the Bank's special programs and policies.
Commercial Lending Assistance
The Bank made available the following initial short-term COVID Modifications to commercial borrowers affected by COVID-19:
•Interest only payments on term debt for up to 90 days;
•Temporary increases to line of credit commitments when supported by underlying assets, including changing the borrowing base formula or changing existing commitment restrictions to allow higher advance rates;
•Full payment deferrals for up to 90 days when an interest only period does not provide sufficient relief (contingent on credit administration approval);
•Loan re-amortization, especially in cases where significant prepayments of principal have occurred;
•Covenant waivers and resets;
•Processing new loan requests, such as a line of credit for working capital support; and
•Maturity extensions of up to 90 days for maturing lines of credit or term loans.
In the second quarter of 2020, the Bank implemented a special, streamlined initial 90-day interest only payment modification process for borrowers in certain industries as a result of the COVID-19 "stay at home" orders.
Once the initial 90-day relief option expired, the Bank extended similar relief options for a subsequent or second COVID Modification to certain commercial borrowers. The Bank maintained a preference for offering interest only payments on those secondary modifications. The Bank determined that in most instances, a request for a third payment deferral modification, where total modifications exceed 180 days, was considered a TDR status loan instead of a COVID Modification as the Bank incorporated policies consistent with regulatory guidance.
The Bank will work constructively with commercial borrowers to identify loan modifications that are based on the facts and circumstances of each borrower, and to protect the safety and soundness of the Bank.
All commercial COVID Modification loans were risk rated "Watch" or worse at initial modification date, except in certain cases where a borrower had performed well prior to the modification request and exhibited a strong financial position, or the loan had significant guarantor support, or if a more severe risk rating was determined appropriate given facts and circumstances of the borrower. Further requests for relief beyond the initial modification were reassessed for a more severe risk rating as part of the review process to grant further relief. For additional information regarding the Bank’s loan risk ratings see Note (4) Loans Receivable of the Notes to Consolidated Financial Statements included in Item 8. Financial Statements And Supplementary Data.
Mortgage and Consumer Lending Assistance
In order to effectively manage or mitigate adverse impacts on mortgage and consumer borrowers affected by COVID-19, the Bank implemented the initial COVID Modification through a streamlined approval process to include 90-day payment deferrals when the borrower met the following criteria:
•The borrower's ability to pay had been negatively impacted by COVID-19;
•The loan was not over 30 days past due on the date of the request; and
•The loan was risk rated "Pass" prior to the request for payment deferral.
Mortgage and consumer loans that did not meet the criteria to receive streamlined approval qualifications were considered outside of the automatic deferral process and were evaluated on a case-by-case basis by the Bank's credit team. Certain consumer term loans with current balances over $100,000 and original terms over 96 months were reviewed on a case-by-case basis and did not qualify for the streamlined approval process. For consumer lines of credit, for borrowers that had sufficient available credit on their line, the borrower could draw on their line of credit to make payments in lieu of payment deferrals, and for borrowers that did not have sufficient available credit, the Bank offered a 90-day payment deferral. However, after the deferral period, these borrowers were billed for the deferred months of accrued interest and the Bank worked with those borrowers unable to pay all months of interest at that time. For credit card customers, a skip payment option was included in the borrowers' billing statements between April 1, 2020 and May 30, 2020.
Based on the depth and breadth of the COVID-19 pandemic, the Bank extended similar relief options for a subsequent or second COVID Modification to certain consumer borrowers. The Bank had a preference for offering interest only payments, or partial principal and interest payments, on these secondary COVID Modifications.
All initial COVID Modifications on mortgage and consumer loans remained risk rated "Pass" through the initial 90-day relief period. This risk rating was subject to change if the Bank received additional information within the 90-day relief period that the borrower did not intend to repay the loan, which resulted in a risk rating downgrade and the implementation of further collection efforts unless facts and circumstances of the borrower mitigated additional risk of nonperformance. Risk ratings were reviewed for a more severe classification for any borrower requesting a secondary COVID Modification.
Borrowers with COVID Modifications did not have negative data reported to the credit reporting agencies. Credit reporting was not turned off on these accounts, but contractual due dates were advanced in the core loan system with appropriate loan documentation to legally support the new due dates.
COVID-19 Modifications:
During the year ended December 31, 2020 and as a direct result of COVID-19 issues cited by the borrower and the Bank's lending assistance programs described above, the Bank made COVID Modifications on loans. These modifications were not classified as TDR status in accordance with the CARES Act and related regulatory guidance unless the payment deferment period exceeded 180-days.
The following table details the amortized cost and count by each loan class of modifications that were made during the year ended December 31, 2020, with amortized costs presented as of March 31, 2020, the date before the prolonged impacts of the COVID-19 pandemic:
| | | | | | | | | | | | | | | | | | | | | | | |
| | | | | | | |
| | | | | | | | | | | | | Amortized Cost | | Count |
| | | | | | | | | | | | | (Dollars in thousands) |
| Commercial business: | | | | | | | | | | | | | | | |
| Commercial and industrial | | | | | | | | | | | | | $ | 153,009 | | | 586 | |
| | | | | | | | | | | | | | | |
| Owner-occupied CRE | | | | | | | | | | | | | 210,126 | | | 186 | |
| Non-owner occupied CRE | | | | | | | | | | | | | 233,296 | | | 135 | |
| Total commercial business | | | | | | | | | | | | | 596,431 | | | 907 | |
| Residential real estate | | | | | | | | | | | | | 18,441 | | | 38 | |
| Real estate construction and land development: | | | | | | | | | | | | | | | |
| Residential | | | | | | | | | | | | | 7,002 | | | 29 | |
Commercial and multifamily | | | | | | | | | | | | | 17,527 | | | 23 | |
| Total real estate construction and land development | | | | | | | | | | | | | 24,529 | | | 52 | |
| Consumer | | | | | | | | | | | | | 27,238 | | | 1,044 | |
| Total | | | | | | | | | | | | | $ | 666,639 | | | 2,041 | |
The following table presents COVID Modifications from the table above that were downgraded during the year ended December 31, 2020 that also had loan balances at December 31, 2020:
| | | | | | | | | | | | | | | | | | | | | | | | | | | | | | | | | | | | | | | | | | | | | | | | | | | | | | | | | | | |
| Pass (1) | Watch | | Special Mention | | Substandard | | Total |
| Amortized Cost | | Count | | Amortized Cost | | Count | | Amortized Cost | | Count | | Amortized Cost | | Count | | Amortized Cost | | Count |
| (Dollars in thousands) |
| Commercial business: | | | | | | | | | | | | | | | | | | | |
| Commercial and industrial | $ | 5,552 | | | 20 | | | $ | 12,768 | | | 64 | | | $ | 18,525 | | | 34 | | | $ | 17,050 | | | 33 | | | $ | 53,895 | | | 151 | |
| | | | | | | | | | | | | | | | | | | |
| Owner-occupied CRE | 36,713 | | | 15 | | | 20,033 | | | 29 | | | 16,352 | | | 7 | | | 17,365 | | | 8 | | | 90,463 | | | 59 | |
| Non-owner occupied CRE | 12,754 | | | 6 | | | 34,154 | | | 27 | | | 10,427 | | | 5 | | | 49,407 | | | 6 | | | 106,742 | | | 44 | |
| Total commercial business | 55,019 | | | 41 | | | 66,955 | | | 120 | | | 45,304 | | | 46 | | | 83,822 | | | 47 | | | 251,100 | | | 254 | |
| | | | | | | | | | | | | | | | | | | |
| Real estate construction and land development: | | | | | | | | | | | | | | | | | | | |
| | | | | | | | | | | | | | | | | | | |
Commercial and multifamily | 1,137 | | | 2 | | | — | | | — | | | — | | | — | | | 450 | | | 1 | | | 1,587 | | | 3 | |
| | | | | | | | | | | | | | | | | | | |
| Consumer | — | | | — | | | — | | | — | | | — | | | — | | | 840 | | | 23 | | | 840 | | | 23 | |
| Total | $ | 56,156 | | | 43 | | | $ | 66,955 | | | 120 | | | $ | 45,304 | | | 46 | | | $ | 85,112 | | | 71 | | | $ | 253,527 | | | 280 | |
(1) Downgraded within the "Pass" rating scale of 1 to 5.
Of the $130.4 million of "Special Mention" or "Substandard" downgrades, $59.1 million was classified as nonaccrual or performing TDR and the rest were classified as potential problem loans.
The following table details the amortized cost and count of modifications by each loan class for any loan that was in active payment modification deferral status as of December 31, 2020, with balances and count at December 31, 2020:
| | | | | | | | | | | | | | | | | | | | | | | |
| | | | | | | |
| | | | | | | | | | | | | Amortized Cost | | Count |
| | | | | | | | | | | | | (Dollars in thousands) |
| Commercial business: | | | | | | | | | | | | | | | |
| Commercial and industrial | | | | | | | | | | | | | $ | 20,258 | | | 44 | |
| | | | | | | | | | | | | | | |
| Owner-occupied CRE | | | | | | | | | | | | | 25,679 | | | 13 | |
| Non-owner occupied CRE | | | | | | | | | | | | | 39,950 | | | 11 | |
| Total commercial business | | | | | | | | | | | | | 85,887 | | | 68 | |
| | | | | | | | | | | | | | | |
| Real estate construction and land development: | | | | | | | | | | | | | | | |
| One-to-four family residential | | | | | | | | | | | | | 45 | | | 1 | |
Commercial and multifamily | | | | | | | | | | | | | 3,939 | | | 2 | |
| Total real estate construction and land development | | | | | | | | | | | | | 3,984 | | | 3 | |
| Consumer | | | | | | | | | | | | | 2,660 | | | 106 | |
| Total | | | | | | | | | | | | | $ | 92,531 | | | 177 | |
Of the loans in active payment modification deferral status at December 31, 2020, $67.7 million, or 73.2%, were on their second or third loan deferral modification. Included in the total of active payment modification deferral status are loans classified as nonaccrual of $22.9 million and loans classified as performing TDR of $39.0 million. The risk classification of loans in active payment modification deferral status includes "Pass" rated of $10.8 million, "Watch" rated of $16.2 million, "Special Mention" rated of $3.0 million and "Substandard" rated of $62.5 million.
COVID-19 Downgrades:
The Bank downgraded loans due to heightened risk as a direct result of COVID-19 issues cited by the borrower. All COVID-19 downgrades, including those with and without a modification, as of December 31, 2020 are as follows:
| | | | | | | | | | | | | | | | | | | | | | | | | | | | | | | | | | | | | | | | | | | | | | | | | | | | | | | | | | | |
| Pass (1) | Watch | | Special Mention | | Substandard | | Total |
| Amortized Cost | | Count | | Amortized Cost | | Count | | Amortized Cost | | Count | | Amortized Cost | | Count | | Amortized Cost | | Count |
| (Dollars in thousands) |
| Commercial business: | | | | | | | | | | | | | | | | | | | |
| Commercial and industrial | $ | 13,348 | | | 68 | | | $ | 24,352 | | | 134 | | | $ | 45,249 | | | 74 | | | $ | 17,506 | | | 39 | | | $ | 100,455 | | | 315 | |
| | | | | | | | | | | | | | | | | | | |
| Owner-occupied CRE | 58,558 | | | 29 | | | 28,670 | | | 42 | | | 31,919 | | | 15 | | | 23,031 | | | 10 | | | 142,178 | | | 96 | |
| Non-owner occupied CRE | 47,429 | | | 18 | | | 59,406 | | | 34 | | | 13,048 | | | 7 | | | 49,408 | | | 6 | | | 169,291 | | | 65 | |
| Total commercial business | 119,335 | | | 115 | | | 112,428 | | | 210 | | | 90,216 | | | 96 | | | 89,945 | | | 55 | | | 411,924 | | | 476 | |
| Residential | 979 | | | 7 | | | — | | | — | | | — | | | — | | | — | | | — | | | 979 | | | 7 | |
| Real estate construction and land development: | | | | | | | | | | | | | | | | | | | |
| One-to-four family residential | — | | | — | | | — | | | — | | | — | | | — | | | — | | | — | | | — | | | — | |
Commercial and multifamily | 8,335 | | | 3 | | | 1,175 | | | 1 | | | 1,077 | | | 3 | | | 450 | | | 1 | | | 11,037 | | | 8 | |
| Total real estate construction and land development | 8,335 | | | 3 | | | 1,175 | | | 1 | | | 1,077 | | | 3 | | | 450 | | | 1 | | | 11,037 | | | 8 | |
| Consumer | — | | | — | | | — | | | — | | | — | | | — | | | 840 | | | 23 | | | 840 | | | 23 | |
| Total | $ | 128,649 | | | 125 | | | $ | 113,603 | | | 211 | | | $ | 91,293 | | | 99 | | | $ | 91,235 | | | 79 | | | $ | 424,780 | | | 514 | |
(1) Downgraded within the "Pass" rating scale of 1 to 5.
Loans in the table above which were downgraded to Special Mention or worse are classified as potential problem loans, except for loans totaling $21.6 million and $37.5 million that were classified as nonaccrual and performing TDR, respectively, at December 31, 2020.
SBA Paycheck Protection Program
Beginning April 6, 2020, the Bank began to offer SBA PPP loans to its existing and new customers as a results of provisions in the CARES Act for customers directly impacted by the COVID-19 pandemic. SBA PPP loans are designed to provide a direct incentive for small businesses to keep their workers on the payroll. The CARES Act and its subsequent amendments allocated $669.0 billion to the program. Utilizing our internal technology solutions team, the Bank was able to develop an automated platform to control and manage processing for SBA PPP loans and immediately began originations under this program. The Bank accepted applications for SBA PPP loans, including loans to independent contractors, sole proprietors and partnerships as allowed under the guidance from the U.S. Treasury and SBA that was issued April 14, 2020. The Bank funded 4,642 loans totaling $897.4 million through the program's conclusion on August 8, 2020. The average loan balance for funded loans was $193,000. Of the funded loans, approximately 21% of both the number of loans funded and amount originated were to customers with no prior banking relationship to the Bank.
The Bank earns 1% interest on these loans as well as a fee from the SBA to cover processing costs, which is amortized over the life of the loan. The balance of unamortized net deferred fees on SBA PPP loans was $15.4 million at December 31, 2020.
The CA Act renews and extends the PPP until March 31, 2021 by authorizing an additional $284.5 billion for the program. As a result, the Bank began originating SBA PPP loans again starting in January 2021.
Additionally, the Federal Reserve established the PPPLF under Section 13(3) of the Federal Reserve Act to bolster the effectiveness of the SBA's PPP. Under the PPPLF, the Bank may pledge its SBA PPP loans as collateral at face value to obtain Federal Reserve Bank non-recourse loans. The maturity date of any PPPLF advance (the “Maturity Date”) will be the maturity date of the SBA PPP loan pledged to secure the PPPLF advance. The Maturity Date of any PPPLF advance will be accelerated on and to the extent of (i) the date of any loan forgiveness reimbursement by the SBA for any SBA PPP loan securing the PPPLF advance; or (ii) the date of purchase by the SBA from the Bank of any SBA PPP loan securing the PPPLF loan advance to realize on the SBA’s guarantee of the SBA PPP loan. PPPLF advances may be obtained until December 31, 2020. Although the Bank was approved to utilize the PPPLF, the Bank chose not to participate in PPPLF during the year ended December 31, 2020. See Note (25) Subsequent Events of the Notes to Consolidated Financial Statements included in Item 8. Financial Statements And Supplementary Data for a discussion about the renewal of this facility subsequent to December 31, 2020.
The Bank began processing loan forgiveness applications, as allowed under the SBA's PPP, during the fourth quarter of 2020. As of December 31, 2020, the Bank received principal and interest forgiveness payment of $159.2 million from the SBA.
SBA Relief
Heritage is an active SBA lender in the Pacific Northwest and had SBA loans totaling $62.0 million and $64.1 million at December 31, 2020 and December 31, 2019, respectively. During the year ended December 31, 2020, Heritage participated in the SBA's Debt Relief Program under the CARES Act. The CARES Act appropriated $17.0 billion to subsidize small business loans. Under this program, the SBA paid principal and interest for existing current SBA loans for a period of six months, commencing with payments due after March 27, 2020 as well as new SBA 7(a), 504, and microloans disbursed prior to September 27, 2020.
Under this program, the borrowers did not have to reimburse the SBA or the Bank for these payments. If a borrower had already requested a payment deferral, and the deferral was granted, the six month period began after the deferment period. There was no limitation to the monthly principal and interest amount that the SBA would pay on behalf of the borrower. The borrower could also make other principal-only payments during the six month period.
The Bank did not consider any loans for which the SBA was making the principal and interest payment as a COVID Modification loan as only the source of payment was changed and not the payment terms of the SBA loan.
Retail Policy Changes
The COVID-19 pandemic caused significant disruptions to the Bank's operations and resulted in the implementation by the Bank of various social distancing measures to address customer and community needs.
•Branch Lobby Closures. To ensure the safety of our customers and employees, branch lobbies have been closed since March 2020 with most services processed through the drive-up or by appointment, except three branches located within Island County, which opened temporarily during the summer and fall as was allowed under Washington State's Phased Approach: Reopening Business and Modifying Physical Distancing Measures.
•Early Withdrawal Penalty Waivers. For customers that may need access to funds in their certificate of deposits to assist with living expenses during the COVID-19 pandemic, the Bank assisted these customers by waiving early withdrawal penalties for withdrawals up to $25,000.
•Overdraft & Fee Reversals. Overdraft and fee reversals were waived on a case-by-case basis. The Bank was cautious when paying overdrafts beyond the customer's total deposit relationship, overdraft protection options or their overdraft coverage limits.
Employee Changes
Heritage has committed to keeping its employees safe during this COVID-19 pandemic. As a result, many policy changes have been implemented including the following measures:
•Heritage follows the guidelines recommended by the Centers for Disease Control and/or local officials, such as social distancing and maintaining six feet of separation between employees.
•Heritage has provided additional cleaning and disinfecting solutions to each location.
•A significant number of back-office employees are working remotely.
•Essential business travel is limited to those situations where business cannot reasonably be conducted without face-to-face interaction or visits to specific locations.
•Certain front-line employees were given additional hourly pay.
•Heritage offered up to 80 hours for full time employees of COVID-19 related absences, to use in lieu of sick or vacation time, for the employee's own illness, to care for an ill family member, due to a required self-isolation/quarantine or school/day care closures.
Heritage continues to monitor the situation and makes additional accommodations as necessary.
Critical Accounting Policies
The Consolidated Financial Statements have been prepared in accordance with accounting principles generally accepted in the United States of America. Companies may apply certain critical accounting policies requiring management to make subjective or complex judgments, often as a result of the need to estimate the effect of matters that are inherently uncertain.
The Company considers its most critical accounting estimates to be as follows:
ACL on Investment Securities Available for Sale
Management evaluates the need for an ACL on investment securities available for sale on at least a quarterly basis, and more frequently when economic or market conditions warrant such an evaluation. For investment securities available for sale in an unrealized loss position, the Company first assesses whether it intends to sell or it is more likely than not that it will be required to sell the security before the recovery of its amortized cost basis. If either of the criteria regarding intent or requirement to sell is met, the security’s amortized cost basis is written down to fair value through a provision for credit loss against income. For investment securities available for sale that do not meet the aforementioned criteria, the Company evaluates whether the decline in fair value has resulted from credit losses or other factors. In making this assessment, management considers the extent to which fair value is less than amortized cost, any changes to the rating of the security by a rating agency and adverse conditions specifically related to the security, among other factors. The credit loss is defined as the difference between the present value of the cash flows expected to be collected and the amortized cost basis. If the present value of cash flows expected to be collected is less than the amortized cost basis, a credit loss exists and an ACL on investment securities available for sale is recorded for the credit loss, limited by the amount that the fair value is less than the amortized cost basis. Any
unrealized decline in fair value that has not been recorded through an ACL on investment securities available for sale is recognized in other comprehensive income.
For additional information regarding the ACL on investment securities available for sale, see Note (3) Investment Securities of the Notes to Consolidated Financial Statements included in Item 8. Financial Statements And Supplementary Data.
ACL on Loans
Management utilizes a historic loss, open pool CECL methodology to calculate the ACL on loans. Under this methodology, nonaccrual loans are evaluated for credit losses on an individual basis and the remainder of the portfolio is disaggregated into similar segments of loans which are collectively evaluated for ACL on loans at the segment level. The determination of the evaluation method applied to each loan in the portfolio is a subjective management estimate based on the facts and circumstances surrounding each loan.
The allowance for individually evaluated loans is calculated using either the collateral value method, which considers the likely source of repayment as the value of the collateral, less estimated costs to sell if applicable, or the net present value method, which considers the contractual principal and interest terms and estimated cash flows available from the borrower to satisfy the debt. The determination of which method to apply and the application of either method, including evaluating the contractual principal and interest terms and estimated cash flows for the net present value method or the valuation of the collateral, less an estimate of selling costs, are subjective management estimates.
For each loan segment collectively evaluated for an ACL on loans, a baseline allowance and a macroeconomic allowance is calculated in the model. For the baseline allowance, a baseline loss rate is calculated at the segment level using the Bank's historical loss rates which are calculated using the Bank's average quarterly historical loss information. The calculated loss rates are applied to each loan's estimated cash flows over the life of the loan under the remaining life method to determine the loss estimate for each loan. Estimated cash flows consider the principal and interest in accordance with the contractual term of the loan and estimated prepayments. Prepayments are a subjective management estimate established for each segment based on rolling historical averages for the segments, which management believes is an accurate representation of future prepayment activity. Management reviews the adequacy of the prepayment period assumption on a quarterly basis.
The Company utilizes a macroeconomic sensitive model to adjust each segment's baseline loss rate over a reasonable and supportable forecast period and then reverts to the Bank's historical baseline loss rates for the remainder of the expected life of the loan segment. The macroeconomic sensitive model is developed for each segment given the current and forecasted economic conditions and a macroeconomic multiplier is calculated for each forecasted period considering the forecasted losses as compared to the long-term average actual losses of the dataset. The impact of those macroeconomic factors to each segment, both positive or negative, using the reasonable and supportable period, are considered the macroeconomic allowance. After the reasonable and supportable period, forecasted loss rates revert to historical baseline loss levels over the predetermined reversion period on a straight-lined basis. The reasonable and supportable forecast period, the reversion period, and the period used to calculate the Bank's average quarterly historical loss information at the segment level are based on subjective management estimates.
Management also considers other qualitative risk factors to adjust the estimated ACL on loans calculated by the above-mentioned model for internal or external factors outside of those considered in its historical losses or macroeconomic forecast. The qualitative adjustments are also based on subjective management estimates.
In general, management's estimate of the ACL on loans uses relevant available information, from internal and external sources, relating to past events, current conditions, and reasonable and supportable forecasts. The evaluation of ACL on loans is inherently subjective as it requires estimates that are susceptible to significant revision as more information becomes available. While management utilizes its best judgment and information available to recognize credit losses on loans, future additions to the allowance may be necessary based on further declines in local and national economic conditions. In addition, various regulatory agencies, as an integral part of their examination process, periodically review the Bank’s ACL on loans. Such agencies may require the Bank to make adjustments to the allowance based on their judgments about information available to them at the time of their examinations. The Company believes the ACL on loans is appropriate at December 31, 2020 given all of the above considerations.
For additional information regarding the ACL on loans, its relation to the provision for credit losses, its risk related to asset quality and lending activity, see “Provision for credit losses overview” and “Analysis of allowance for credit losses on loans” below, Item 1A. Risk Factors—Our ACL on loans may prove to be insufficient to absorb losses in our loan portfolio as well as Note (5) Allowance for Credit Losses on Loans of the Notes to Consolidated Financial Statements included in Item 8. Financial Statements And Supplementary Data.
ACL on Unfunded Commitments
The Bank estimates expected credit losses on unfunded, off-balance sheet commitments over the contractual period in which the Bank is exposed to credit risk from a contractual obligation to extend credit, unless the obligation is unconditionally cancellable by the Bank. The Bank has determined that no allowance is necessary for the off-balance sheet portion of the credit card portfolio as it has the ability to unconditionally cancel the available lines of credit.
The allowance methodology for unfunded commitments is similar to the ACL on loans, but additionally includes considerations of the current utilization of the commitment and an estimate of the future utilization as determined appropriate by historical commitment utilization and the Bank's estimates of future utilization given current economic forecasts.
For additional information regarding the ACL on unfunded commitments, see Note (15) Commitments and Contingencies of the Notes to Consolidated Financial Statements included in Item 8. Financial Statements And Supplementary Data.
Business Combinations
The Company applies the acquisition method of accounting for business combinations. Under the acquisition method, the acquiring entity in a business combination recognizes all of the identifiable assets acquired and liabilities assumed at their acquisition date fair values. Management utilizes prevailing valuation techniques appropriate for the asset or liability being measured in determining these fair values. Any excess of the purchase price over amounts allocated to assets acquired, including identifiable intangible assets, and liabilities assumed is recorded as goodwill. Where amounts allocated to assets acquired and liabilities assumed is greater than the purchase price, a bargain purchase gain is recognized. Acquisition-related costs are expensed as incurred unless they are directly attributable to the issuance of the Company's common stock in a business combination and the Company chooses to record these acquisition-related costs through stockholders' equity.
There were no business combinations during the years ended December 31, 2020 and 2019. For additional information see Note (2) Business Combination of the Notes to Consolidated Financial Statements included in Item 8. Financial Statements And Supplementary Data for information regarding the business combinations completed during the year ended December 31, 2018.
Goodwill
The Company’s goodwill is assigned to Heritage Bank and is evaluated for impairment at the Heritage Bank level (reporting unit). Goodwill is reviewed for impairment annually and between annual tests if an event occurs or circumstances change that might indicate the Company’s recorded value is more than its implied value. Such indicators may include, among others: a significant adverse change in legal factors or in the general business climate; significant decline in the Company’s stock price and market capitalization; unanticipated competition; and an adverse action or assessment by a regulator. Any adverse changes in these factors could have a significant impact on the recoverability of goodwill and could have a material impact on the Consolidated Financial Statements.
The Company typically performed a quantitative goodwill impairment test as of December 31st using the Company's market capitalization as an indicator of fair value. During the second quarter of 2020, the Company determined a triggering event occurred due to the deteriorating financial market and economic conditions as a result of the COVID-19 pandemic and consequently engaged a third-party valuation specialist to perform a detailed quantitative assessment of goodwill as of May 31, 2020. Management estimated the fair value of the reporting unit by weighting results from the market approach and the income approach. Significant assumptions inherent in the valuation methodologies for goodwill were employed and included, but were not limited to, prospective financial information, growth rates, terminal value, discount rates, and comparable multiples from publicly traded companies in our industry. Based on this quantitative test, management determined that the fair value of the reporting unit more likely than not exceeded the carrying value.
The Company performed its annual goodwill impairment test during the fourth quarter of 2020 and determined, based on a qualitative assessment utilizing the Company's market capitalization, that it is more likely than not that the fair value of the reporting unit exceeded the carrying value, such that the Company's goodwill was not considered impaired for the year ended December 31, 2020. Changes in the economic environment, operations of the reporting unit or other adverse events, including as a result of COVID-19, could result in future impairment charges which could have a material adverse impact on the Company’s operating results.
For additional information regarding goodwill, see Note (8) Goodwill and Other Intangible Assets of the Notes to Consolidated Financial Statements included in Item 8. Financial Statements And Supplementary Data.
Financial Overview
Heritage Financial Corporation is a bank holding company which primarily engages in the business activities of our wholly-owned financial institution subsidiary, Heritage Bank. We provide financial services to our local communities with an ongoing strategic focus on our commercial banking relationships, market expansion and asset quality.
Consolidated Financial Condition Overview
The table below provides a comparison of the changes in the Company's financial condition from December 31, 2019 to December 31, 2020:
| | | | | | | | | | | | | | | | | | | | | | | |
| December 31, 2020 | | December 31, 2019 | | Change | | % Change |
| (Dollars in thousands) |
| Assets | | | | | | | |
| Cash and cash equivalents | $ | 743,322 | | | $ | 228,568 | | | $ | 514,754 | | | 225.2 | % |
| Investment securities available for sale, at fair value, net | 802,163 | | | 952,312 | | | (150,149) | | | (15.8) | |
| Loans held for sale | 4,932 | | | 5,533 | | | (601) | | | (10.9) | |
| Loans receivable, net | 4,398,462 | | | 3,731,708 | | | 666,754 | | | 17.9 | |
| Other real estate owned | — | | | 841 | | | (841) | | | (100.0) | |
| Premises and equipment, net | 85,452 | | | 87,888 | | | (2,436) | | | (2.8) | |
| Federal Home Loan Bank stock, at cost | 6,661 | | | 6,377 | | | 284 | | | 4.5 | |
| Bank owned life insurance | 107,580 | | | 103,616 | | | 3,964 | | | 3.8 | |
| Accrued interest receivable | 19,418 | | | 14,446 | | | 4,972 | | | 34.4 | |
| Prepaid expenses and other assets | 193,301 | | | 164,129 | | | 29,172 | | | 17.8 | |
| Other intangible assets, net | 13,088 | | | 16,613 | | | (3,525) | | | (21.2) | |
| Goodwill | 240,939 | | | 240,939 | | | — | | | — | |
| Total assets | $ | 6,615,318 | | | $ | 5,552,970 | | | $ | 1,062,348 | | | 19.1 | % |
| Liabilities | | | | | | | |
| Deposits | $ | 5,597,990 | | | $ | 4,582,676 | | | $ | 1,015,314 | | | 22.2 | % |
| | | | | | | |
| Junior subordinated debentures | 20,887 | | | 20,595 | | | 292 | | | 1.4 | |
| Securities sold under agreement to repurchase | 35,683 | | | 20,169 | | | 15,514 | | | 76.9 | |
| Accrued expenses and other liabilities | 140,319 | | | 120,219 | | | 20,100 | | | 16.7 | |
| Total liabilities | 5,794,879 | | | 4,743,659 | | | 1,051,220 | | | 22.2 | |
| Stockholders' equity | | | | | | | |
| Common stock | 571,021 | | | 586,459 | | | (15,438) | | | (2.6) | |
| Retained earnings | 224,400 | | | 212,474 | | | 11,926 | | | 5.6 | |
| Accumulated other comprehensive income, net | 25,018 | | | 10,378 | | | 14,640 | | | 141.1 | |
| Total stockholders' equity | 820,439 | | | 809,311 | | | 11,128 | | | 1.4 | |
| Total liabilities and stockholders' equity | $ | 6,615,318 | | | $ | 5,552,970 | | | $ | 1,062,348 | | | 19.1 | % |
Total assets increased $1.06 billion, or 19.1%, to $6.62 billion as of December 31, 2020 compared to $5.55 billion as of December 31, 2019 due primarily to an increase in loans receivable, which is discussed in more detail below in the "Lending Activities Overview" section, and in cash and cash equivalents due primarily to an increase in total deposits, offset partially by a decrease in investment securities available for sale, which is discussed in more detail below in the "Investment Activities Overview" section. Prepaid expenses and other assets increased $29.2 million, or 17.8%, to $193.3 million at December 31, 2020 from $164.1 million at December 31, 2019 primarily as a result of an increase in the fair value of interest rate swap contracts of $17.4 million and a new investment in a low income housing tax credit partnership of $10.2 million, both of which had a nearly corresponding increase in accrued expenses and other liabilities. Accrued expenses and other liabilities increased $20.1 million, or 16.7%, to $140.3 million at December 31, 2020 compared to $120.2 million as of December 31, 2019 due to the changes described above for prepaid expenses and other assets, partially offset by a decrease related to capital contributions to low income housing tax credit partnerships of $7.1 million.
Total deposits increased $1.02 billion, or 22.2%, to $5.60 billion at December 31, 2020 from $4.58 billion at December 31, 2019 due primarily to increases in noninterest bearing demand deposits of $534.0 million, or 36.9%, to $1.98 billion, money market accounts of $209.3 million, or 27.8%, to $963.0 million, and interest bearing demand deposits of $367.3 million, or 27.2%, to $1.72 billion, offset partially by a decrease in certificate of deposit accounts of $125.0 million, or 23.8%, to $399.5 million. The increase in total deposits was due primarily to proceeds from SBA PPP loans deposited directly into customer deposit accounts and an increase in customer deposits due to changes in customer spending habits due to the COVID-19 pandemic and an increase in new deposit accounts, offset partially by a decrease in a public depositor relationship of $95.7 million. Non-maturity deposits as a percentage of total deposits increased to 92.9% as of December 31, 2020 from 88.6% at December 31, 2019.
Investment Activities Overview
Our investment policy is established by the Board of Directors and monitored by the Risk Committee of the Board of Directors. It is designed primarily to provide and maintain liquidity, generate a favorable return on investments without incurring undue interest rate and credit risk, and complements the Bank's lending activities. The policy dictates the criteria for classifying securities as either available for sale or held to maturity. The policy permits investment in various types of liquid assets permissible under applicable regulations, which include U.S. Treasury obligations, U.S. government agency obligations, some certificates of deposit of insured banks, mortgage-backed and mortgage-related securities, corporate notes, municipal bonds, and federal funds. Investment in non-investment grade bonds and stripped mortgage-backed securities is not permitted under the policy.
Investment securities available for sale decreased $150.1 million, or 15.8%, to $802.2 million at December 31, 2020 from $952.3 million at December 31, 2019. The decrease was due primarily to maturities, calls and payments of investment securities of $264.2 million and sales of investment securities of $55.0 million, offset partially by purchases of investment securities of $152.6 million. In addition, we recorded net unrealized gains of $18.8 million due to a decrease in market interest rates during the year ended December 31, 2020 that positively impacted the fair value of our bond portfolio. The following table provides information regarding our investment securities available for sale at the dates indicated:
| | | | | | | | | | | | | | | | | | | | | | | | | | | | | | | | | | | |
| | December 31, 2020 | | December 31, 2019 | | December 31, 2018 |
| | Fair Value | | % of
Total
Investments | | Fair Value | | % of
Total
Investments | | Fair Value | | % of
Total
Investments |
| | (Dollars in thousands) |
| U.S. government and agency securities | $ | 45,660 | | | 5.7 | % | | $ | 105,223 | | | 11.0 | % | | $ | 101,603 | | | 10.4 | % |
| Municipal securities | 209,968 | | | 26.2 | | | 133,014 | | | 14.0 | | | 158,864 | | | 16.3 | |
| | | | | | | | | | | |
| Residential CMO and MBS | 201,872 | | | 25.2 | | | 339,608 | | | 35.7 | | | 331,602 | | | 34.0 | |
| Commercial CMO and MBS | 303,746 | | | 37.9 | | | 327,095 | | | 34.4 | | | 333,761 | | | 34.2 | |
| Corporate obligations | 11,096 | | | 1.4 | | | 24,194 | | | 2.5 | | | 25,563 | | | 2.6 | |
| Other asset-backed securities | 29,821 | | | 3.6 | | | 23,178 | | | 2.4 | | | 24,702 | | | 2.5 | |
| Total | $ | 802,163 | | | 100.0 | % | | $ | 952,312 | | | 100.0 | % | | $ | 976,095 | | | 100.0 | % |
The following table provides information regarding our investment securities available for sale, by contractual maturity, at December 31, 2020:
| | | | | | | | | | | | | | | | | | | | | | | | | | | | | | | | | | | | | | | | | | | | | | | | | | | | | | | | | | | |
| | One Year or Less | | Over One to Five
Years | | Over Five to Ten
Years | | Over Ten Years | | Total |
| | Fair
Value | | Yield(1) | | Fair
Value | | Yield(1) | | Fair
Value | | Yield(1) | | Fair
Value | | Yield(1) | | Fair
Value | | Yield(1) |
| | (Dollars in thousands) | | | | |
| U.S. government and agency securities | $ | 14,679 | | | 2.74 | % | | $ | 1,910 | | | 2.62 | % | | $ | 5,187 | | | 3.04 | % | | $ | 23,884 | | | 2.58 | % | | $ | 45,660 | | | 2.69 | % |
| Municipal securities | 5,079 | | | 3.54 | | | 28,323 | | | 3.44 | | | 59,714 | | | 3.32 | | | 116,852 | | | 2.93 | | | 209,968 | | | 3.12 | |
| | | | | | | | | | | | | | | | | | | |
| Residential CMO and MBS | — | | | — | | | 11,365 | | | 2.14 | | | 34,309 | | | 2.13 | | | 156,198 | | | 1.92 | | | 201,872 | | | 1.97 | |
| Commercial CMO and MBS | 27,103 | | | 2.20 | | | 100,980 | | | 2.66 | | | 116,314 | | | 1.71 | | | 59,349 | | | 2.44 | | | 303,746 | | | 2.21 | |
| Corporate obligations | 9,061 | | | 2.79 | | | 2,035 | | | 1.05 | | | — | | | — | | | — | | | — | | | 11,096 | | | 2.47 | |
| Other asset-backed securities | 133 | | | 1.87 | | | 949 | | | 2.79 | | | 4,667 | | | 2.54 | | | 24,072 | | | 1.21 | | | 29,821 | | | 1.48 | |
| Total | $ | 56,055 | | | 2.55 | % | | $ | 145,562 | | | 2.75 | % | | $ | 220,191 | | | 2.26 | % | | $ | 380,355 | | | 2.31 | % | | $ | 802,163 | | | 2.21 | % |
(1) Taxable equivalent weighted average yield.
Lending Activities Overview
The Bank is a full-service commercial bank, which originates a wide variety of loans with a focus on commercial business loans. Loans receivable increased $700.8 million, or 18.6%, to $4.47 billion at December 31, 2020 from $3.77 billion at December 31, 2019 due primarily to SBA PPP loans of $715.1 million outstanding at December 31, 2020, following principal and interest forgiveness payments from the SBA of $159.2 million during the year ended December 31, 2020. Loans receivable also increased due to increases in non-owner occupied CRE loans of $121.5 million, owner-occupied CRE loans of $51.5 million and real estate construction and land development loans of $31.1 million, offset partially by decreases in commercial and industrial
loans of $119.1 million and consumer loans of $90.4 million. The decrease in commercial and industrial loans was due primarily to a decrease in the utilization rate of commercial and industrial lines of credit to 24.9% at December 31, 2020 from 34.5% at December 31, 2019. The decrease in consumer loans was primarily due to the cessation of indirect auto loan originations in March 2020.
The following table provides information about our loan portfolio by type of loan at the dates indicated:
| | | | | | | | | | | | | | | | | | | | | | | | | | | | | | | | | | | | | | | | | | | | | | | | | | | | | | | | | | | |
| | December 31, |
| | 2020 | | 2019 | | 2018 | | 2017 | | 2016 |
| | Amortized Cost (1) | | % of Total (2) | | Amortized Cost (1) | | % of Total (2) | | Amortized Cost (1) | | % of Total (2) | | Amortized Cost (1) | | % of Total (2) | | Amortized Cost (1) | | % of Total (2) |
| | (Dollars in thousands) |
| Commercial business: | | | | | | | | | | | | | | | | | | | |
| Commercial and industrial | $ | 733,098 | | | 16.4 | % | | $ | 852,220 | | | 22.6 | % | | $ | 854,142 | | | 23.4 | % | | $ | 646,100 | | | 22.7 | % | | $ | 637,773 | | | 24.2 | % |
| SBA PPP | 715,121 | | | 16.0 | | | — | | | — | | | — | | | — | | | — | | | — | | | — | | | — | |
| Owner-occupied CRE | 856,684 | | | 19.2 | | | 805,234 | | | 21.4 | | | 778,501 | | | 21.3 | | | 620,979 | | | 21.8 | | | 558,035 | | | 21.2 | |
| Non-owner occupied CRE | 1,410,303 | | | 31.5 | | | 1,288,779 | | | 34.2 | | | 1,301,871 | | | 35.5 | | | 984,286 | | | 34.6 | | | 880,880 | | | 33.4 | |
| Total commercial business | 3,715,206 | | | 83.1 | | | 2,946,233 | | | 78.2 | | | 2,934,514 | | | 80.2 | | | 2,251,365 | | | 79.1 | | | 2,076,688 | | | 78.8 | |
Residential real estate (3) | 122,756 | | | 2.7 | | | 131,660 | | | 3.5 | | | 101,490 | | | 2.8 | | | 86,748 | | | 3.0 | | | 77,391 | | | 2.9 | |
| Real estate construction and land development: | | | | | | | | | | | | | | | | | | | |
| Residential | 78,259 | | | 1.8 | | | 104,296 | | | 2.8 | | | 102,258 | | | 2.8 | | | 51,624 | | | 1.8 | | | 50,414 | | | 1.9 | |
| Commercial and multifamily | 227,454 | | | 5.1 | | | 170,350 | | | 4.5 | | | 112,024 | | | 3.1 | | | 96,955 | | | 3.4 | | | 108,764 | | | 4.1 | |
| Total real estate construction and land development | 305,713 | | | 6.9 | | | 274,646 | | | 7.3 | | | 214,282 | | | 5.9 | | | 148,579 | | | 5.2 | | | 159,178 | | | 6.0 | |
| Consumer | 324,972 | | | 7.3 | | | 415,340 | | | 11.0 | | | 403,874 | | | 11.1 | | | 362,379 | | | 12.7 | | | 325,140 | | | 12.3 | |
| Total | $ | 4,468,647 | | | 100.0 | % | | $ | 3,767,879 | | | 100.0 | % | | $ | 3,654,160 | | | 100.0 | % | | $ | 2,849,071 | | | 100.0 | % | | $ | 2,638,397 | | | 100.0 | % |
| | | | | | | | | | | | | | | | | | | |
| | | | | | | | | | | | | | | | | | | |
(1) Balances do not include unfunded loan commitments.
(2) Percent of loans receivable.
(3) Excludes loans held for sale of $4.9 million, $5.5 million, $1.6 million, $2.3 million, and $11.7 million as of December 31, 2020, 2019, 2018, 2017 and 2016, respectively.
Included in the amortized cost of loans are net discounts on loans purchased in mergers and acquisitions. Upon CECL Adoption, the Bank increased the net discount for PCD loans by $1.6 million related to the PCI to PCD transition. The remaining total net discount for purchased loans, including PCD loans and non-PCD loans, was $6.6 million at December 31, 2020 compared to $8.4 million at December 31, 2019.
The following table presents the amortized cost of the loan portfolio by segment and the aggregate amount of fixed rate and variable or adjustable rate loans in our portfolio at December 31, 2020 for the following categories of contractual maturities:
| | | | | | | | | | | | | | | | | | | | | | | |
| | Maturing |
| | One Year or Less | | Over One to Five Years | | Over Five Years | | Total |
| | (In thousands) |
| Commercial business | $ | 299,382 | | | $ | 1,448,446 | | | $ | 1,967,378 | | | $ | 3,715,206 | |
| Residential real estate | 11 | | | 1,117 | | | 121,628 | | | 122,756 | |
| Real estate construction and land development | 107,430 | | | 42,380 | | | 155,903 | | | 305,713 | |
| Consumer | 13,618 | | | 120,918 | | | 190,436 | | | 324,972 | |
| Loans receivable | $ | 420,441 | | | $ | 1,612,861 | | | $ | 2,435,345 | | | $ | 4,468,647 | |
| | | | | | | |
| Fixed rate loans | $ | 137,825 | | | $ | 1,316,578 | | | $ | 980,384 | | | $ | 2,434,787 | |
Variable or adjustable rate loans (1) | 282,616 | | | 296,283 | | | 1,454,961 | | | 2,033,860 | |
| Loans receivable | $ | 420,441 | | | $ | 1,612,861 | | | $ | 2,435,345 | | | $ | 4,468,647 | |
(1) Includes certain commercial loans in which the Bank entered into non-hedge interest rate swap contracts with the borrower and a third-party. Under these derivative contract arrangements, the Bank effectively earns a variable rate of interest based on the one-month LIBOR plus a margin, except for interest rate swap contracts on construction loans that earn fixed rates until the end of the construction period and the variable rate swap becomes effective. At December 31, 2020, the Bank had 84 separate interest rate swap contracts with borrowers with a total notional value (which approximates amortized cost) of $308.1 million compared to 60 separate interest rate swap contracts with borrowers with notional value of $221.4 million at December 31, 2019. All but nine interest rate swap contracts with borrowers with a total notional value of $31.1 million at December 31, 2020 have a maturity of over five years.
Nonperforming Assets and Credit Quality Metrics
The following table provides information about our nonaccrual loans, other real estate owned and performing TDR loans for the dates indicated:
| | | | | | | | | | | | | | | | | | | | | | | | | | | | | |
| | December 31, |
| | 2020 | | 2019 | | 2018 | | 2017 | | 2016 |
| | (Dollars in thousands) |
| Nonaccrual loans: | | | | | | | | | |
| Commercial business | $ | 56,786 | | | $ | 44,320 | | | $ | 12,557 | | | $ | 9,083 | | | $ | 8,580 | |
| Residential real estate | 184 | | | 19 | | | 71 | | | 81 | | | 94 | |
| Real estate construction and land development | 1,022 | | | — | | | 899 | | | 1,247 | | | 2,008 | |
| Consumer | 100 | | | 186 | | | 169 | | | 277 | | | 227 | |
Total nonaccrual loans (1) | 58,092 | | | 44,525 | | | 13,696 | | | 10,688 | | | 10,909 | |
| Other real estate owned | — | | | 841 | | | 1,983 | | | — | | | 754 | |
| Total nonperforming assets | $ | 58,092 | | | $ | 45,366 | | | $ | 15,679 | | | $ | 10,688 | | | $ | 11,663 | |
| | | | | | | | | |
| ACL on loans | $ | 70,185 | | | $ | 36,171 | | | $ | 35,042 | | | $ | 32,086 | | | $ | 31,083 | |
| Nonperforming loans to loans receivable | 1.30 | % | | 1.18 | % | | 0.37 | % | | 0.38 | % | | 0.41 | % |
| ACL on loans to loans receivable | 1.57 | | | 0.96 | | | 0.96 | | | 1.13 | | | 1.18 | |
ACL on loans to loans receivable, excluding SBA PPP loans (2) | 1.87 | | | 0.96 | | | 0.96 | | | 1.13 | | | 1.18 | |
| ACL on loans to nonperforming loans | 120.82 | | | 81.24 | | | 255.86 | | | 300.21 | | | 284.93 | |
| Nonperforming assets to total assets | 0.88 | % | | 0.82 | % | | 0.29 | % | | 0.26 | % | | 0.30 | % |
| | | | | | | | | |
| Performing TDR loans: | | | | | | | | | |
| Commercial business | $ | 49,403 | | | $ | 13,661 | | | $ | 22,171 | | | $ | 25,722 | | | $ | 19,837 | |
| Residential real estate | 188 | | | 196 | | | 207 | | | 216 | | | 227 | |
| Real estate construction and land development | 1,926 | | | 237 | | | — | | | 645 | | | 2,141 | |
| Consumer | 1,355 | | | 375 | | | 366 | | | 168 | | | 83 | |
| Total performing TDR loans | $ | 52,872 | | | $ | 14,469 | | | $ | 22,744 | | | $ | 26,751 | | | $ | 22,288 | |
| | | | | | | | | |
| Accruing loans past due 90 days or more | $ | — | | | $ | — | | | $ | — | | | $ | — | | | $ | — | |
Potential problem loans (3) | $ | 182,342 | | | $ | 87,788 | | | $ | 101,320 | | | $ | 83,558 | | | $ | 87,762 | |
(1) At December 31, 2020, 2019, 2018, 2017 and 2016, $43.1 million, $26.3 million, $6.9 million, $5.2 million and $6.9 million of nonaccrual loans were considered nonperforming TDR loans, respectively, with a related ACL on loans of $6.3 million, $218,000, $658,000, $379,000, and $437,000, respectively.
(2) See the "Reconciliations of Non-GAAP Measures" section below.
(3) Potential problem loans are risk rated "Special Mention" or worse that are not classified as a performing TDR or nonaccrual loan and are not individually evaluated for credit loss, but which management is closely monitoring because the financial information of the borrower causes concern as to their ability to meet their loan repayment terms.
Nonaccrual Loans. Nonaccrual loans increased $13.6 million to $58.1 million, or 1.30% of loans receivable at December 31, 2020, from $44.5 million, or 1.18% of loans receivable at December 31, 2019. The increase was due primarily to the addition of $23.4 million of loans that were previously COVID Modifications and which exhibited a continued decline in credit
quality, warranting transfer to nonaccrual status. Within these additions were six commercial business lending relationships totaling $23.2 million, including loans in industries heavily impacted by the COVID-19 pandemic such as hospitality, entertainment and leisure facilities. The Bank is actively working with the borrowers to secure a positive resolution. These additions to nonaccrual loans were offset partially by principal payments which included full payoffs of $11.0 million, including a significant agricultural lending relationship of $6.8 million.
The ratio of ACL on loans to nonperforming loans increased to 120.82% at December 31, 2020 compared to 81.24% at December 31, 2019 due primarily to an increase in the ACL on loans.
The following table reflects the changes in nonaccrual loans during the periods indicated:
| | | | | | | | | | | |
| Year Ended December 31, |
| 2020 | | 2019 |
| (In thousands) |
| Nonaccrual loans | | | |
| Balance, beginning of period | $ | 44,525 | | | $ | 13,696 | |
| Addition of previously classified pass graded loans | 19,430 | | | 4,620 | |
| Addition of previously classified potential problem loans | 8,993 | | | 23,032 | |
| Addition of previously classified performing TDR loans | 4,601 | | | 11,734 | |
| | | |
| Net principal payments | (17,215) | | | (6,609) | |
| Charge-offs | (1,691) | | | (1,948) | |
| Transfer to accruing status | (281) | | | — | |
| Transfer to OREO | (270) | | | — | |
| Balance, end of period | $ | 58,092 | | | $ | 44,525 | |
At December 31, 2020, nonaccrual loans of $27.3 million had a related ACL on loans of $6.7 million and nonaccrual loans of $30.8 million had no related ACL on loans. At December 31, 2019 nonaccrual loans of $4.4 million had a related ACL of $763,000 and nonaccrual loans of $40.1 million had no ACL.
Nonperforming Assets. Nonperforming assets consist of nonaccrual loans and other real estate owned. Nonperforming assets increased $12.7 million to $58.1 million, or 0.88% of total assets, at December 31, 2020 from $45.4 million, or 0.82% of total assets, at December 31, 2019 due primarily to the increase in nonaccrual loans discussed above partially offset by a decrease in other real estate owned resulting from the disposition of the two remaining properties during the year ended December 31, 2020.
Troubled Debt Restructured Loans. Performing TDR loans are TDRs on accrual status which are collectively evaluated for ACL based on criteria outlined in our accounting policies. Performing TDR loans are not considered nonperforming assets as they continue to accrue interest despite the restructured status. Performing TDR loans increased $38.4 million, or 265.4%, to $52.9 million at December 31, 2020 from $14.5 million at December 31, 2019. The increase was due to the addition of $39.0 million of loans with COVID Modifications that were subsequently modified to extend beyond the COVID Modification's 180-days payment deferment period in accordance with Bank policy for COVID Modifications. The increase in performing TDR loans was offset partially by one predominately commercial and industrial loan relationship totaling $4.2 million which transferred to nonaccrual status as the loan continued to show credit deterioration. Included in the net principal payments of performing TDR loans was loans paid in full of $3.7 million.
The following table reflects the changes in performing TDR loans during the periods indicated:
| | | | | | | | | | | |
| Year Ended December 31, |
| 2020 | | 2019 |
| (In thousands) |
| Performing TDR loans | | | |
| Balance, beginning of period | $ | 14,469 | | | $ | 22,744 | |
| Addition of previously classified pass graded loans | 6,967 | | | 6,846 | |
| Addition of previously classified potential problem loans | 40,860 | | | 9,424 | |
| Loans added formerly nonaccrual loans | 281 | | | — | |
| Transfers of loans to nonaccrual status | (4,601) | | | (11,734) | |
| Charge-offs | — | | | (220) | |
| Net principal payments | (5,104) | | | (12,591) | |
| Balance, end of period | $ | 52,872 | | | $ | 14,469 | |
The related ACL on loans for performing TDR loans was $1.3 million as of both December 31, 2020 and December 31, 2019.
Potential Problem Loans. Potential problem loans are loans risk rated special mention or worse that are not classified as a TDR or nonaccrual loan and are not individually evaluated for credit loss, but which management is closely monitoring because the financial information of the borrower causes concern as to their ability to meet their loan repayment terms. Potential problem loans increased $94.6 million, or 107.7%, to $182.3 million at December 31, 2020 from $87.8 million at December 31, 2019. The increase was primarily attributed to risk downgrades related to borrowers experiencing COVID-19 related issues. Included in the balance of potential problem loans at December 31, 2020 are COVID Modifications of $86.8 million and loans that were downgraded due to COVID-19 issues with no loan modification of $52.1 million. At December 31, 2020, potential problem loans totaling $149.9 million and $32.4 million were rated special mention and substandard, respectively. The increase in potential problem loans for the year ended December 31, 2020 was offset partially by net principal payments of $37.8 million, including payments in full of $23.8 million, and transfers of loans to nonaccrual and TDR status of $49.9 million due primarily to loans that showed additional credit deterioration due to the COVID-19 pandemic or which were modified beyond the Bank's 180-day deferral policy and transferred to TDR status.
The following table reflects the changes in potential problem loans during the periods indicated:
| | | | | | | | | | | |
| Year Ended December 31, |
| 2020 | | 2019 |
| (In thousands) |
| Potential problem loans | | | |
| Balance, beginning of period | $ | 87,788 | | | $ | 101,320 | |
| Addition of previously classified pass graded loans | 194,589 | | | 69,775 | |
| | | |
| Net principal payments | (37,847) | | | (33,158) | |
| Upgrades to pass graded loan status | (12,335) | | | (17,183) | |
| Transfers of loans to nonaccrual and TDR status | (49,853) | | | (32,456) | |
| | | |
| | | |
| Charge-offs | — | | | (510) | |
| Balance, end of period | $ | 182,342 | | | $ | 87,788 | |
Analysis of Allowance for Credit Losses on Loans
Effective January 1, 2020, the Bank adopted ASU 2016-13. The adoption replaced the ALL with the ACL on loans on the Consolidated Statements of Financial Condition and replaced the related provision for loan losses with the provision for credit losses on loans on the Consolidated Statements of Income.
Management adopted a historic loss, open pool CECL methodology to calculate the ACL on loans. The same methodology is applied to all loans consistent with the guidance of the accounting standard which does not require undue complexity. Under this allowance approach, the Company has identified segments of loans with similar risk characteristics that align with its identified loan classes. Nonaccrual loans are not considered to have similar risk characteristics as other loans; therefore, they are evaluated for credit loss on an individual basis. The allowance for individually evaluated loans is calculated using either the collateral value method, which considers the likely source of repayment as the value of the collateral, less estimated costs to sell if applicable, or the net present value method, which considers the contractual principal and interest terms and estimated cash flows available from the borrower to satisfy the debt.
For each loan segment collectively measured, baseline loss rates are separately calculated using the Bank's average quarterly historical loss information. The baseline loss rates are applied to each loan's estimated cash flows over the life of the loan under the remaining life method, including prepayment estimates, to determine the baseline loss estimate for each loan. The CECL methodology also includes consideration of the forecasted direction of the economic and business environment and its likely impact to the estimated allowance as compared to the historical losses over the reasonable and supportable time frame. The impact of those macroeconomic factors to each segment, positive or negative, using the reasonable and supportable period, are added to the calculated baseline loss rate and are used to establish a macroeconomic allowance. After the reasonable and supportable period, the estimated credit losses revert back to historical baseline loss levels under a reversion period on a straight-lined, input reversion basis. Management can also consider other qualitative factors to adjust the ACL on loans if internal or external conditions suggest changes to the modeled ACL on loans are appropriate.
The following table provides information regarding changes in our ACL on loans and the ACL at and for the years indicated:
| | | | | | | | | | | | | | | | | | | | | | | | | | | | | |
| | At or For the Years Ended December 31, |
| | 2020 | | 2019 | | 2018 | | 2017 | | 2016 |
| | (Dollars in thousands) |
| ACL on loans at the beginning of the period | $ | 36,171 | | | $ | 35,042 | | | $ | 32,086 | | | $ | 31,083 | | | $ | 29,746 | |
| Impact of CECL Adoption | 1,822 | | | — | | | — | | | — | | | — | |
| Adjusted ACL on loans, beginning of period | 37,993 | | | 35,042 | | | 32,086 | | | 31,083 | | | 29,746 | |
| | | | | | | | | |
| Charge-offs: | | | | | | | | | |
| Commercial business | (3,751) | | | (2,692) | | | (1,400) | | | (2,438) | | | (4,153) | |
| Residential real estate | — | | | (60) | | | (45) | | | (30) | | | — | |
| Real estate construction and land development | (417) | | | (133) | | | — | | | (556) | | | (154) | |
| Consumer | (1,454) | | | (2,104) | | | (2,160) | | | (1,814) | | | (1,778) | |
| Total charge-offs | (5,622) | | | (4,989) | | | (3,605) | | | (4,838) | | | (6,085) | |
| Recoveries: | | | | | | | | | |
| Commercial business | 1,530 | | | 657 | | | 908 | | | 947 | | | 1,844 | |
| Residential real estate | 3 | | | — | | | — | | | 2 | | | 2 | |
| Real estate construction and land development | 278 | | | 637 | | | 11 | | | 202 | | | 83 | |
| Consumer | 570 | | | 513 | | | 513 | | | 470 | | | 562 | |
| Total recoveries | 2,381 | | | 1,807 | | | 1,432 | | | 1,621 | | | 2,491 | |
| Net charge-offs | (3,241) | | | (3,182) | | | (2,173) | | | (3,217) | | | (3,594) | |
| | | | | | | | | |
| Provision for credit losses on loans | 35,433 | | | 4,311 | | | 5,129 | | | 4,220 | | | 4,931 | |
| | | | | | | | | |
| ACL on loans at the end of period | $ | 70,185 | | | $ | 36,171 | | | $ | 35,042 | | | $ | 32,086 | | | $ | 31,083 | |
| | | | | | | | | |
| ACL on loans to loans receivable | 1.57 | % | | 0.96 | % | | 0.96 | % | | 1.13 | % | | 1.18 | % |
ACL on loans to loans receivable, excluding SBA PPP loans (1) | 1.87 | | | 0.96 | | | 0.96 | | | 1.13 | | | 1.18 | |
| Net charge-offs on loans to average loans receivable, net | 0.07 | % | | 0.09 | % | | 0.06 | % | | 0.12 | % | | 0.14 | % |
| | | | | | | | | |
Loans receivable at the end of the period (2) | $ | 4,468,647 | | | $ | 3,767,879 | | | $ | 3,654,160 | | | $ | 2,849,071 | | | $ | 2,638,397 | |
| Average loans receivable, net during the period | 4,335,564 | | | 3,668,665 | | | 3,414,424 | | | 2,703,934 | | | 2,489,730 | |
(1) See "Reconciliations of Non-GAAP Measures" section below.
(2) Excludes loans held for sale.
The following table shows the ACL on loans by segment at the indicated dates:
| | | | | | | | | | | | | | | | | | | | | | | | | | | | | | | | | | | | | | | | | | | | | | | | | | | | | | | | | | | |
| | December 31, |
| | 2020 | | 2019 | | 2018 | | 2017 | | 2016 |
| | ACL on loans | | % of Total (1) | | ACL on loans | | % of Total (1) | | ACL on loans | | % of Total (1) | | ACL on loans | | % of Total (1) | | ACL on loans | | % of Total (1) |
| | (Dollars in thousands) |
| Commercial business | $ | 49,608 | | | 83.1 | % | | $ | 23,933 | | | 78.2 | % | | $ | 23,711 | | | 80.2 | % | | $ | 21,999 | | | 79.1 | % | | $ | 22,382 | | | 78.8 | % |
| Residential real estate | 1,591 | | | 2.7 | | | 1,458 | | | 3.5 | | | 1,203 | | | 2.8 | | | 1,056 | | | 3.0 | | | 1,015 | | | 2.9 | |
| Real estate construction | 13,092 | | | 6.9 | | | 3,060 | | | 7.3 | | | 2,194 | | | 5.9 | | | 2,052 | | | 5.2 | | | 2,156 | | | 6.0 | |
| Consumer | 5,894 | | | 7.3 | | | 6,821 | | | 11.0 | | | 6,581 | | | 11.1 | | | 6,081 | | | 12.7 | | | 5,024 | | | 12.3 | |
| Unallocated | — | | | — | | | 899 | | | — | | | 1,353 | | | — | | | 898 | | | — | | | 506 | | | — | |
| Total ACL on loans | $ | 70,185 | | | 100.0 | % | | $ | 36,171 | | | 100.0 | % | | $ | 35,042 | | | 100.0 | % | | $ | 32,086 | | | 100.0 | % | | $ | 31,083 | | | 100.0 | % |
(1) Represents the percent of loans receivable by loan category to loans receivable.
The ACL on loans increased $34.0 million, or 94.0%, to $70.2 million at December 31, 2020 from $36.2 million at December 31, 2019, and increased $32.2 million, or 84.7%, from the adjusted beginning balance of $38.0 million. The increase in the ACL on loans was primarily the result of the provision for credit losses on loans of $35.4 million during the year ended December 31, 2020 due primarily to forecasted credit deterioration reflecting economic conditions as a result of the COVID-19 pandemic.
The macroeconomic forecast used in the CECL model as of January 1, 2020 predicted continued economic expansion with steady GDP growth of 1.8% and low unemployment rate averages of 3.5% in 2020, among other factors. The onset of the COVID-19 pandemic resulted in the identification of an economic recession during the second quarter of 2020 as evidenced by certain economic forecasts signaling prolonged, profound, and pervasive contraction in economic activities due to the COVID-19 pandemic. The GDP contracted 3.4% during the year ended December 31, 2020 and unemployment rates averaged 8.1%. The macroeconomic forecast used in the CECL model as of December 31, 2020 reflected a slow recovery from the COVID-19 recession modeled to last through the end of 2021, including an anticipated GDP growth of 4.3% for 2021 and GDP growth slightly above 2.0% thereafter. The unemployment rate is anticipated to remain above 6.0% during 2021 and steadily decrease to a stabilized 4.0% in 2025. The macroeconomic forecast as of December 31, 2020 considered the COVID-19 vaccine progress as well as anticipated government stimulus plans; however, uncertainty remained over the time necessary to return the economy to pre-pandemic levels.
The Bank recognized net charge-offs of $3.2 million during the year ended December 31, 2020 primarily due to a commercial and industrial charge-off of $1.7 million related to issues surrounding control of the underlying loan collateral. The Bank determined it appropriate to charge-off this entire loan relationship balance and pursue an aggressive collection strategy. Net charge-offs also included two commercial and industrial loan relationships totaling $447,000 as a result of impacts from the COVID-19 pandemic, a partial charge-off of one commercial and multifamily real estate construction and land development loan totaling $417,000 as a result of cost overruns and delays in construction and small dollar net charge-offs on a large volume of consumer loans of $884,000. Net charge-offs were offset partially by the full recovery of a commercial and industrial agricultural lending relationship of $963,000 during the year ended December 31, 2020, which was charged-off during the year ended December 31, 2019.
Based on the Bank's established comprehensive CECL methodology, management deemed the ACL on loans of $70.2 million at December 31, 2020 (1.57% of loans receivable and 120.82% of nonperforming loans) appropriate to provide for current expected credit losses in the loan portfolio. This compares to an ALL of $36.2 million (0.96% of loans receivable and 81.24% of nonperforming loans) at December 31, 2019 under the probable incurred loss methodology.
While we believe we used the best information available to determine the ACL on loans, our results of operations could be significantly affected if circumstances differ substantially from the assumptions used in determining the allowance. A further decline in national and local economic conditions, as a result of the COVID-19 pandemic or other factors, could result in a material increase in the ACL on loans and may adversely affect the Company’s financial condition and results of operations. In addition, the determination of the amount of the ACL on loans is subject to review by bank regulators, as part of their routine examination process, which may result in the establishment of an additional ACL on loans based upon their judgment of information available to them at the time of their examination. Because future events affecting borrowers and collateral cannot be predicted with certainty, there can be no assurance that the existing ACL on loans is appropriate or that increased provisions will not be necessary should the quality of the loans deteriorate. Any material increase in the ACL on loans could adversely affect the Company’s financial condition and results of operations.
Deposits and Other Borrowings Overview
Total deposits increased $1.02 billion, or 22.2%, to $5.60 billion at December 31, 2020 from $4.58 billion at December 31, 2019 due primarily to proceeds from SBA PPP loans deposited directly into the customers' deposit accounts, an increase in customer deposit accounts based on changes in spending habits during the COVID-19 pandemic, and an increase in new deposit accounts. At December 31, 2020, the Bank had approximately 473 deposit accounts with balances of approximately $80.5 million related to new customers that received a SBA PPP loan from the Bank. The increase in total deposits included an increase in noninterest bearing demand deposits of $534.0 million, or 36.9%, to $1.98 billion at December 31, 2020 from $1.45 billion at December 31, 2019, in interest bearing demand deposits of $367.3 million, or 27.2%, to $1.72 billion at December 31, 2020 from $1.35 billion at December 31, 2019 and in money market accounts of $209.3 million, or 27.8%, to $963.0 million at December 31, 2020 from $753.7 million at December 31, 2019. These increases were offset partially by a decrease in certificates of deposit accounts of $125.0 million, or 23.8%, to $399.5 million at December 31, 2020 from $524.6 million at December 31, 2019. Non-maturity deposits as a percentage of total deposits increased to 92.9% at December 31, 2020 from 88.6% at December 31, 2019 and the percentage of certificates of deposit to total deposits decreased to 7.1% at December 31, 2020 from 11.4% at December 31, 2019 due primarily to promotional certificates of deposit balances maturing during the year ended December 31, 2020.
The following table summarizes the Company's deposits at the dates indicated:
| | | | | | | | | | | | | | | | | | | | | | | | | | | | | | | | | | | |
| | December 31, 2020 | | December 31, 2019 | | December 31, 2018 |
| | Balance | | Percent of Total | | Balance | | Percent of Total | | Balance | | Percent of Total |
| | (Dollars in thousands) |
| Noninterest demand deposits | $ | 1,980,531 | | | 35.4 | % | | $ | 1,446,502 | | | 31.6 | % | | $ | 1,362,268 | | | 30.7 | % |
| Interest bearing demand deposits | 1,716,123 | | | 30.7 | | | 1,348,817 | | | 29.4 | | | 1,317,513 | | | 29.7 | |
| Money market accounts | 962,983 | | | 17.2 | | | 753,684 | | | 16.4 | | | 765,316 | | | 17.3 | |
| Savings accounts | 538,819 | | | 9.6 | | | 509,095 | | | 11.2 | | | 520,413 | | | 11.8 | |
| Total non-maturity deposits | 5,198,456 | | | 92.9 | | | 4,058,098 | | | 88.6 | | | 3,965,510 | | | 89.5 | |
| Certificates of deposit | 399,534 | | | 7.1 | | | 524,578 | | | 11.4 | | | 466,892 | | | 10.5 | |
| Total deposits | $ | 5,597,990 | | | 100.0 | % | | $ | 4,582,676 | | | 100.0 | % | | $ | 4,432,402 | | | 100.0 | % |
The following table provides the average balances outstanding and the weighted average interest rates for each major category of deposits for the periods indicated:
| | | | | | | | | | | | | | | | | | | | | | | | | | | | | | | | | | | |
| | Year Ended December 31, |
| | 2020 | | 2019 | | 2018 |
| | Average
Balance | | Average
Yield/Rate | | Average
Balance | | Average
Yield/Rate | | Average
Balance | | Average
Yield/Rate |
| | (Dollars in thousands) |
| Interest bearing demand deposits and money market accounts | $ | 2,491,477 | | | 0.24 | % | | $ | 2,052,573 | | | 0.33 | % | | $ | 1,916,319 | | | 0.23 | % |
| Savings accounts | 489,471 | | | 0.11 | | | 506,073 | | | 0.52 | | | 513,680 | | | 0.40 | |
| Certificates of deposit | 482,316 | | | 1.18 | | | 512,732 | | | 1.37 | | | 463,124 | | | 0.85 | |
| Total interest bearing deposits | 3,463,264 | | | 0.35 | | | 3,071,378 | | | 0.53 | | | 2,893,123 | | | 0.36 | |
| Noninterest demand deposits | 1,835,165 | | | — | | | 1,389,721 | | | — | | | 1,240,621 | | | — | |
| Total deposits | $ | 5,298,429 | | | 0.23 | % | | $ | 4,461,099 | | | 0.37 | % | | $ | 4,133,744 | | | 0.25 | % |
The following table shows the amount and maturity of certificate of deposit accounts of $100,000 or more:
| | | | | |
| | December 31, 2020 |
| | (In thousands) |
| Remaining maturity: | |
| Three months or less | $ | 73,539 | |
| Over three months through six months | 56,116 | |
| Over six months through twelve months | 84,967 | |
| Over twelve months | 43,434 | |
| Total | $ | 258,056 | |
Borrowings may be used on a short-term basis to compensate for reductions in other sources of funds (such as deposit inflows at less than projected levels). Borrowings may also be used on a longer-term basis to support expanded lending activities and match the maturity of repricing intervals of assets. The Bank also utilizes securities sold under agreement to repurchase as a supplement to its funding sources, which are secured by available for sale investment securities. As of December 31, 2020 and December 31, 2019, only three customers utilized this product with total balances of $35.7 million at December 31, 2020, an increase of $15.5 million, or 76.9%, from $20.2 million at December 31, 2019 due primarily to customer activity during the period.
The Company also has junior subordinated debentures with a par value of $25.0 million which pay quarterly interest based on three-month LIBOR plus 1.56%. The debentures mature in 2037. The balance of the junior subordinated debentures was $20.9 million at December 31, 2020, which reflects the fair value of the junior subordinated debentures established as part of the merger with Washington Banking Company on May 1, 2014, adjusted for the accretion of discount from purchase accounting fair value adjustment.
At December 31, 2020, the Bank maintained credit facilities with the FHLB for $991.7 million and credit facilities with the Federal Reserve Bank for $54.3 million. The Company had no FHLB or Federal Reserve Bank advances outstanding at both the years ended December 31, 2020 and 2019. The average balance of FHLB advances and other borrowings was $1.5 million and $11.9 million during the years ended December 31, 2020 and 2019, respectively.
The Bank also maintains lines of credit with five correspondent banks to purchase federal funds totaling $215.0 million as of December 31, 2020. There were no federal funds purchased as of December 31, 2020 or December 31, 2019 and the lines were not utilized during the years ended December 31, 2020 and 2019.
The Bank was approved to utilize the PPPLF during the year ended December 31, 2020; however, the Bank chose not to participate.
Stockholders' Equity and Regulatory Capital Requirements Overview
Stockholders’ equity was $820.4 million at December 31, 2020 compared to $809.3 million at December 31, 2019. The Company’s stockholders' equity to assets ratio was 12.4% as of December 31, 2020 and 14.6% as of December 31, 2019. The following table reflects the changes to stockholders' equity during the periods indicated:
| | | | | | | | | | | |
| Year Ended December 31, |
| 2020 | | 2019 |
| (In thousands) |
| Balance, beginning of period | $ | 809,311 | | | $ | 760,723 | |
Cumulative effect from change in accounting policy (1) | (5,615) | | | (399) | |
| | | |
| Net income | 46,570 | | | 67,557 | |
| Dividends declared | (29,029) | | | (31,056) | |
| Other comprehensive income, net of tax | 14,640 | | | 17,833 | |
| Repurchase of common stock | (19,119) | | | (8,636) | |
| Other | 3,681 | | | 3,289 | |
| Balance, end of period | $ | 820,439 | | | $ | 809,311 | |
(1) Effective January 1, 2020, the Company adopted ASU 2016-13, Financial Instruments - Credit Losses. Effective January 1, 2019, the Company adopted ASU 2016-02, Leases.
During the year ended December 31, 2020, the Company repurchased the remaining 639,922 shares available under the eleventh stock repurchase plan at a weighted average price per share of $23.95 and repurchased 155,778 shares at a weighted average share price of $20.34 under the twelfth stock repurchase plan, which is a total of 795,700 shares under both plans at a weighted average share price of $23.25.
During the year ended December 31, 2019, the Company repurchased 292,712 shares available under the eleventh stock repurchase plan at a weighted average price per share of $26.50. No shares were repurchased under the eleventh stock repurchase plan during the year ended December 31, 2018.
The Company has historically paid cash dividends to its common shareholders. Payments of future cash dividends, if any, will be at the discretion of our Board of Directors after taking into account various factors, including our business, operating results and financial condition, capital requirements, current and anticipated cash needs, plans for expansion, any legal or contractual limitation on our ability to pay dividends and other relevant factors. Dividends on common stock from the Company depend substantially upon receipt of dividends from the Bank, which is the Company’s predominant source of income. On January 27, 2021, the Company’s Board of Directors declared a regular quarterly dividend of $0.20 per common share payable on February 24, 2021 to shareholders of record on February 10, 2021.
| | | | | | | | | | | | | | | | | |
| Year Ended December 31, |
| 2020 | | 2019 | | 2018 |
| Dividends paid per common share | $ | 0.80 | | | $ | 0.84 | | | $ | 0.72 | |
Dividend payout ratio (1) | 62.0 | % | | 45.9 | % | | 48.3 | % |
(1) Dividend payout ratio is declared dividends per common share divided by diluted earnings per common share.
The Company is a bank holding company under the supervision of the Federal Reserve Bank. Bank holding companies are subject to capital adequacy requirements of the Federal Reserve under the Bank Holding Company Act of 1956, as amended, and the regulations of the Federal Reserve. Heritage Bank is a federally insured institution and thereby is subject to the capital requirements established by the FDIC. The Federal Reserve capital requirements generally parallel the FDIC requirements. Failure to meet minimum capital requirements can initiate certain mandatory, and possibly additional discretionary, actions by regulators that, if undertaken, could have a direct material effect on the Consolidated Financial Statements. Management believes that as of December 31, 2020, the Company and the Bank meet all capital adequacy requirements to which they are subject. For additional information regarding the Company’s and the Bank’s regulatory capital requirements, see “Supervision and Regulation-Capital Adequacy” in Item 1. Business and Note (22) Regulatory Capital Requirements included in Item 8. Financial Statements And Supplementary Data.
Off-Balance Sheet Arrangements
In the ordinary course of business, we enter into various types of transactions that include commitments to extend credit that are not included in our Consolidated Financial Statements. We apply the same credit standards to these commitments as we use in all our lending activities and have included these commitments in our lending risk evaluations. Our exposure to credit loss under commitments to extend credit is represented by the amount of these commitments. The Company had off-balance sheet loan commitments, including letters of credit, of $1.11 billion at December 31, 2020, a decrease of $106.9 million, or 8.8%, from $1.21 billion at December 31, 2019. For additional information, see Note (15) Commitments and Contingencies included in Item 8. Financial Statements And Supplementary Data.
Average Balances, Yields and Rates Paid for the Years Ended December 31, 2020, 2019 and 2018
Our core profitability depends primarily on our net interest income, which is the difference between the income we receive on our loan and investment portfolios, and our interest expense, which consists of interest paid on deposits and borrowed funds. Like most financial institutions, our interest income and interest expense are affected significantly by general economic conditions, particularly changes in market interest rates and government policies.
Changes in net interest income result from changes in volume, net interest spread, and net interest margin. Volume refers to the average dollar amounts of interest earning assets and interest bearing liabilities. Net interest spread refers to the difference between the average yield on interest earning assets and the average cost of interest bearing liabilities. Net interest margin refers to net interest income divided by average interest earning assets and is influenced by the level and relative mix of interest earning assets and interest bearing and noninterest bearing liabilities.
The following table provides relevant net interest income information for periods indicated:
| | | | | | | | | | | | | | | | | | | | | | | | | | | | | | | | | | | | | | | | | | | | | | | | | | | | | |
| | Year Ended December 31, |
| | 2020 | | 2019 | | 2018 |
| | Average
Balance | | Interest
Earned/
Paid | | Average
Yield/
Rate | | Average
Balance | | Interest
Earned/
Paid | | Average
Yield/
Rate | | Average
Balance | | Interest
Earned/
Paid | | Average
Yield/
Rate |
| | (Dollars in thousands) |
| Interest Earning Assets: | | | | | | | | | | | | | | | | | |
Loans receivable, net (1) (2) | $ | 4,335,564 | | | $ | 192,417 | | | 4.44 | % | | $ | 3,668,665 | | | $ | 189,515 | | | 5.17 | % | | $ | 3,414,424 | | | $ | 175,466 | | | 5.14 | % |
| Taxable securities | 731,378 | | | 17,541 | | | 2.40 | | | 827,822 | | | 23,045 | | | 2.78 | | | 677,893 | | | 17,602 | | | 2.60 | |
Nontaxable securities (2) | 152,447 | | | 3,659 | | | 2.40 | | | 135,245 | | | 3,396 | | | 2.51 | | | 190,209 | | | 4,649 | | | 2.44 | |
| Interest earning deposits | 315,847 | | | 703 | | | 0.22 | | | 98,153 | | | 1,894 | | | 1.93 | | | 76,117 | | | 1,689 | | | 2.22 | |
| Total interest earning assets | 5,535,236 | | | 214,320 | | | 3.87 | % | | 4,729,885 | | | 217,850 | | | 4.61 | % | | 4,358,643 | | | 199,406 | | | 4.57 | % |
| Noninterest earning assets | 758,386 | | | | | | | 681,193 | | | | | | | 615,372 | | | | | |
| Total assets | $ | 6,293,622 | | | | | | | $ | 5,411,078 | | | | | | | $ | 4,974,015 | | | | | |
| | | | | | | | | | | | | | | | | |
| | | | | | | | | | | | | | | | | | | | | | | | | | | | | | | | | | | | | | | | | | | | | | | | | | | | | |
| | Year Ended December 31, |
| | 2020 | | 2019 | | 2018 |
| | Average
Balance | | Interest
Earned/
Paid | | Average
Yield/
Rate | | Average
Balance | | Interest
Earned/
Paid | | Average
Yield/
Rate | | Average
Balance | | Interest
Earned/
Paid | | Average
Yield/
Rate |
| | (Dollars in thousands) |
| Interest Bearing Liabilities: | | | | | | | | | | | | | | | | | |
| Certificates of Deposit | $ | 482,316 | | | $ | 5,675 | | | 1.18 | % | | $ | 512,732 | | | $ | 7,021 | | | 1.37 | % | | $ | 463,124 | | | $ | 3,959 | | | 0.85 | % |
| Savings accounts | 489,471 | | | 526 | | | 0.11 | | | 506,073 | | | 2,633 | | | 0.52 | | | 513,680 | | | 2,056 | | | 0.40 | |
| Interest bearing demand and money market accounts | 2,491,477 | | | 6,064 | | | 0.24 | | | 2,052,573 | | | 6,695 | | | 0.33 | | | 1,916,319 | | | 4,382 | | | 0.23 | |
| Total interest bearing deposits | 3,463,264 | | | 12,265 | | | 0.35 | | | 3,071,378 | | | 16,349 | | | 0.53 | | | 2,893,123 | | | 10,397 | | | 0.36 | |
| Junior subordinated debentures | 20,730 | | | 890 | | | 4.29 | | | 20,438 | | | 1,339 | | | 6.55 | | | 20,145 | | | 1,263 | | | 6.27 | |
| Securities sold under agreement to repurchase | 27,805 | | | 160 | | | 0.58 | | | 28,457 | | | 175 | | | 0.61 | | | 31,426 | | | 82 | | | 0.26 | |
| FHLB advances and other borrowings | 1,466 | | | 8 | | | 0.55 | | | 11,899 | | | 305 | | | 2.56 | | | 33,914 | | | 671 | | | 1.98 | |
| Total interest bearing liabilities | 3,513,265 | | | 13,323 | | | 0.38 | % | | 3,132,172 | | | 18,168 | | | 0.58 | % | | 2,978,608 | | | 12,413 | | | 0.42 | % |
| Noninterest bearing demand deposits | 1,835,165 | | | | | | | 1,389,721 | | | | | | | 1,240,621 | | | | | |
| Other noninterest bearing liabilities | 139,612 | | | | | | | 99,683 | | | | | | | 67,692 | | | | | |
| Stockholders’ equity | 805,580 | | | | | | | 789,502 | | | | | | | 687,094 | | | | | |
| Total liabilities and stock-holders’ equity | $ | 6,293,622 | | | | | | | $ | 5,411,078 | | | | | | | $ | 4,974,015 | | | | | |
| Net interest income | | | $ | 200,997 | | | | | | | $ | 199,682 | | | | | | | $ | 186,993 | | | |
| Net interest spread | | | | | 3.49 | % | | | | | | 4.03 | % | | | | | | 4.15 | % |
| Net interest margin | | | | | 3.63 | % | | | | | | 4.22 | % | | | | | | 4.29 | % |
| Average interest earning assets to average interest bearing liabilities | | | | 157.55 | % | | | | | 151.01 | % | | | | | 146.33 | % |
(1)The average loan balances presented in the table are net of ACL on loans. Nonaccrual loans have been included in the table as loans carrying a zero yield.
(2)Yields on tax-exempt securities and loans have not been stated on a tax-equivalent basis.
The following table provides the amount of change in our net interest income attributable to changes in volume and changes in interest rates. Changes attributable to the combined effect of volume and interest rates have been allocated proportionately for changes due specifically to volume and interest rates.
| | | | | | | | | | | | | | | | | | | | | | | | | | | | | | | | | | | |
| | Year Ended December 31, |
| | 2020 Compared to 2019
Increase (Decrease) Due to | | 2019 Compared to 2018
Increase (Decrease) Due to |
| | Volume | | Rate | | Total | | Volume | | Rate | | Total |
| | (Dollars in thousands) |
| Interest Earning Assets: | | | | | | | | | | | |
Loans receivable, net (1) (2) | $ | 29,598 | | | $ | (26,696) | | | $ | 2,902 | | | $ | 13,134 | | | $ | 915 | | | $ | 14,049 | |
| Taxable securities | (2,313) | | | (3,191) | | | (5,504) | | | 4,174 | | | 1,269 | | | 5,443 | |
Nontaxable securities (2) | 413 | | | (150) | | | 263 | | | (1,380) | | | 127 | | | (1,253) | |
| Interest earning deposits | 485 | | | (1,676) | | | (1,191) | | | 425 | | | (220) | | | 205 | |
| Total interest income | $ | 28,183 | | | $ | (31,713) | | | $ | (3,530) | | | $ | 16,353 | | | $ | 2,091 | | | $ | 18,444 | |
| Interest Bearing Liabilities: | | | | | | | | | | | |
| Certificates of deposit | $ | (358) | | | $ | (988) | | | $ | (1,346) | | | $ | 680 | | | $ | 2,382 | | | $ | 3,062 | |
| Savings accounts | (18) | | | (2,089) | | | (2,107) | | | (40) | | | 617 | | | 577 | |
| Interest bearing demand and money market accounts | 1,068 | | | (1,699) | | | (631) | | | 444 | | | 1,869 | | | 2,313 | |
| Total interest bearing deposits | 692 | | | (4,776) | | | (4,084) | | | 1,084 | | | 4,868 | | | 5,952 | |
| Junior subordinated debentures | 13 | | | (462) | | | (449) | | | 19 | | | 57 | | | 76 | |
| Securities sold under agreement to repurchase | (4) | | | (11) | | | (15) | | | (18) | | | 111 | | | 93 | |
| FHLB advances and other borrowings | (57) | | | (240) | | | (297) | | | (564) | | | 198 | | | (366) | |
| Total interest expense | $ | 644 | | | $ | (5,489) | | | $ | (4,845) | | | $ | 521 | | | $ | 5,234 | | | $ | 5,755 | |
| Net interest income | $ | 27,539 | | | $ | (26,224) | | | $ | 1,315 | | | $ | 15,832 | | | $ | (3,143) | | | $ | 12,689 | |
(1) The average loan balances presented in the table are net of ACL on loans. Nonaccrual loans have been included in the table as loans carrying a zero yield.
(2) Yields on tax-exempt securities and loans have not been stated on a tax-equivalent basis.
Earnings Summary
Results of Operations for the Years Ended December 31, 2020 and 2019
Net income was $46.6 million, or $1.29 per diluted common share, for the year ended December 31, 2020 compared to $67.6 million, or $1.83 per diluted common share, for the year ended December 31, 2019. Net income decreased $21.0 million, or 31.1%, for the year ended December 31, 2020 compared to the year ended December 31, 2019 primarily due to an increase in the provision for credit losses of $31.8 million as a result of estimated credit losses forecasted due to the COVID-19 pandemic and its impact on the economy, offset partially by a decrease in income tax expense of $6.9 million due to lower pre-tax income as well as a provision in the CARES Act permitting the recognition of a benefit from net operating losses related to prior acquisitions.
The net interest margin decreased 59 basis points to 3.63% for the year ended December 31, 2020 compared to 4.22% for the year ended December 31, 2019. The decrease in net interest margin was due primarily to decreases in yields of total interest earning assets as a result of decreases in short-term market interest rates and changes in the mix of total interest earning assets, including the origination of lower-yielding SBA PPP loans with an average balance of $589.6 million, offset partially by decreases in the cost of total interest bearing liabilities during the year ended December 31, 2020.
The Company’s efficiency ratio was 62.52% for the year ended December 31, 2020 compared to 63.23% for the year ended December 31, 2019. The improvement in the efficiency ratio was primarily due to the increase in noninterest income.
Net Interest Income Overview
One of the Company's key sources of earnings is net interest income. There are several factors that affect net interest income, including, but not limited to, the volume, pricing, mix and maturity of interest earning assets and interest bearing liabilities; the volume of noninterest earning assets, noninterest bearing demand deposits, other noninterest bearing liabilities and stockholders' equity; market interest rate fluctuations; and asset quality.
Market rates impact the results of the Company's net interest income, including the significant decreases in the federal funds target rate by the Federal Reserve in response to the COVID-19 pandemic during March 2020. The following table provides the federal funds target rate history and changes from each period since December 31, 2018:
| | | | | | | | | | | | | | |
| Change Date | | Rate (%) | | Rate Change (%) |
| December 31, 2018 | | 2.25 - 2.50% | | N/A |
| July 31, 2019 | | 2.00 - 2.25% | | -0.25% |
| September 18, 2019 | | 1.75 - 2.00% | | -0.25% |
| October 30, 2019 | | 1.50 - 1.75% | | -0.25% |
| March 3, 2020 | | 1.00 - 1.25% | | -0.50% |
| March 16, 2020 | | 0.00 - 0.25% | | -1.00% |
Net interest income increased $1.3 million, or 0.7%, to $201.0 million for the year ended December 31, 2020 compared to $199.7 million for the year ended December 31, 2019. The increase in net interest income was primarily due to an increase in the average balance of total interest earning assets and a decrease in the cost of total interest bearing liabilities. These increases were offset partially by decreases in the yield on interest earning assets following the decreases in market rates identified in the table above.
Interest Income
Total interest income decreased $3.5 million, or 1.6%, to $214.3 million for the year ended December 31, 2020 compared to $217.9 million for the year ended December 31, 2019 due primarily to decreases in yields on adjustable rate instruments following several decreases in short-term market rates, offset partially by increases in the average balance of total interest earning assets, primarily due to the originations of SBA PPP loans and increases in interest earning deposits. The yield on total interest earning assets decreased 74 basis points to 3.87% for the year ended December 31, 2020 compared to 4.61% for the year ended December 31, 2019. The balance of average total interest earning assets increased $805.4 million, or 17.0%, to $5.54 billion for the year ended December 31, 2020 from $4.73 billion for the year ended December 31, 2019, including increases in the average balance of SBA PPP loans of $589.6 million and interest earning deposits of $217.7 million.
Interest income from interest and fees on loans increased $2.9 million, or 1.5%, to $192.4 million for the year ended December 31, 2020 from $189.5 million for the year ended December, 31, 2019 due primarily to an increase in the average balance of loans receivable, net, offset by decreases in the loan yield. Average loans receivable, net increased $666.9 million, or 18.2%, to $4.34 billion for the year ended December 31, 2020 compared to $3.67 billion for the year ended December 31, 2019 due primarily to the impact of SBA PPP loans. There were no SBA PPP loans outstanding during the year ended December 31, 2019. Loan yield decreased 73 basis points to 4.44% for the year ended December 31, 2020 from 5.17% for the year ended December 31, 2019 due primarily to the multiple and sustained decreases in short-term market rates and secondarily due to the impact of low-yielding SBA PPP loans. Loan yield, excluding SBA PPP loans and incremental accretion on purchased loans, decreased 52 basis points to 4.52% for the year ended December 31, 2020 compared to 5.04% for the year ended December 31, 2019. SBA PPP loans had a negative impact on loan yield of 16 basis points as a result of the low-yielding 1% loan interest rate, offset by the impact of the deferred fee which increased the yield to 3.30% for the year ended December 31, 2020.
Incremental accretion represents the amount of interest income recorded on purchased loans in excess of the contractual stated interest rate in the individual loan notes due to incremental accretion of purchased discount or premium. Purchased discount or premium is the difference between the contractual loan balance and the fair value of acquired loans at the acquisition date, or as modified by CECL Adoption. The purchased discount is accreted into income over the remaining life of the loan. The impact of incremental accretion on loan yield will change during any period based on the volume of prepayments, but it is expected to decrease over time as the balance of the purchased loans decreases. Incremental accretion income was $3.4 million and $4.9 million for the years ended December 31, 2020 and 2019, respectively. The impact on loan yield from incremental accretion on purchased loans was 0.08% and 0.13% for the years ended December 31, 2020 and 2019, respectively. The incremental accretion and the impact to loan yield will change during any year based on the volume of prepayments, but is expected to decrease over time as the balance of the purchased loans continues to decrease. At December 31, 2020 and December 31, 2019, the remaining unamortized net purchase discount was $6.6 million and $8.4 million, respectively.
The following table presents the loan yield and the impacts of the balances and interest and fees earned on SBA PPP loans and the incremental accretion on purchased loans on this financial measure for the periods presented below:
| | | | | | | | | | | |
| | Year Ended December 31, |
| | 2020 | | 2019 |
| (Dollars in thousands) |
Non-GAAP reconciliation of loan yield:(1) |
| Loan yield (GAAP) | 4.44 | % | | 5.17 | % |
| Exclude Impact on loan yield from SBA PPP loans | 0.16 | % | | — | % |
| Exclude impact on loan yield from incremental accretion on purchased loans | (0.08) | % | | (0.13) | % |
| Loan yield excluding SBA PPP loans and incremental accretion on purchased loans (non-GAAP) | 4.52 | % | | 5.04 | % |
(1) For additional information, see "Reconciliations of Non-GAAP Measures" section below.
Interest income on investment securities decreased $5.2 million, or 19.8%, to $21.2 million for the year ended December 31, 2020 compared to $26.4 million for the year ended December 31, 2019 due to a combination of decreases in yield and average balance. The yield on the aggregate investment portfolio decreased 35 points to 2.40% for the year ended December 31, 2020 from 2.75% for the same period in 2019, including decreases of 38 basis points and 11 basis points on the yield on taxable securities and nontaxable securities, respectively. The decrease in yield was due primarily to decreases in market rate on adjustable securities and secondarily due to lower yields on current year purchases of investment securities compared to the existing portfolios. Also contributing to the decline in interest income on investment securities was a decrease in the average balance of total investment securities of $79.2 million, or 8.2%, to $883.8 million for the year ended December 31, 2020 from $963.1 million for the year ended December 31, 2019 due primarily to principal reduction from prepayments and calls of securities as a result of the currently low interest rate environment.
Interest income on interest earning deposits decreased $1.2 million, or 62.9%, to $703,000 during the year ended December 31, 2020 compared to $1.9 million for the year ended December 31, 2019 due to a decrease in the yield on interest earning deposits, offset partially by an increase in the average balance. The yield on interest earning deposits decreased 171 basis points to 0.22% for the year ended December 31, 2020 compared to 1.93% for the year ended December 31, 2019 due to decreases in short-term market rates. The average balance of interest earning deposits increased $217.7 million, or 221.8%, to $315.8 million for the year ended December 31, 2020 compared to $98.2 million for the year ended December 31, 2019 due primarily to excess liquidity.
Interest Expense
Total interest expense decreased $4.8 million, or 26.7%, to $13.3 million for the year ended December 31, 2020 compared to $18.2 million for the year ended December 31, 2019 due primarily to decreases in market interest rates following decreases in the federal funds target rate mentioned previously, offset partially by an increase in the average balance of total interest bearing liabilities. The cost of total interest bearing liabilities decreased 20 basis points to 0.38% for the year ended December 31, 2020 from 0.58% for the year ended December 31, 2019. The average balance of total interest bearing liabilities increased $381.1 million, or 12.2%, to $3.51 billion for the year ended December 31, 2020 from $3.13 billion for the year ended December 31, 2019.
Interest expense on total interest bearing deposits decreased $4.1 million, or 25.0%, to $12.3 million for the year ended December 31, 2020 compared to $16.3 million for the year ended December 31, 2019 due primarily to decreases in market interest rates, offset partially by an increase in the average balance. The cost of total interest bearing deposits decreased 18 basis points to 0.35% for the year ended December 31, 2020 from 0.53% for the year ended December 31, 2019 due primarily to a decrease in the cost of savings accounts of 41 basis points to 0.11% for the year ended December 31, 2020 from 0.52% for the year ended December 31, 2019 and secondarily to a decrease in the cost of certificates of deposits of 19 basis points to 1.18% from 1.37% for the years ended December 31, 2020 and 2019, respectively. The decrease in cost of total interest bearing deposits was offset partially by an increase in the average balance of total interest bearing deposits of $391.9 million, or 12.8%, to $3.46 billion for the year ended December 31, 2020 compared to $3.07 billion for the year ended December 31, 2019 as a result of the Bank's participation in the SBA's PPP as well as a change in customer's spending behaviors due to the COVID-19 pandemic and new deposit accounts.
The Company's deposit costs were favorably impacted by the increase in the average balance of noninterest bearing demand deposits compared to total interest bearing deposits. The average balance of noninterest bearing demand deposits increased $445.4 million, or 32.1%, to $1.84 billion for the year ended December 31, 2020 compared to $1.39 billion for the year ended December 31, 2019. The increase in the average balance of noninterest bearing deposits caused a decrease in the total cost of all deposits of 14 basis points to 0.23% for the year ended December 31, 2020 from 0.37% for the same period in 2019.
Provision for Credit Losses Overview
Effective January 1, 2020, CECL Adoption replaced the ALL with the ACL on loans and replaced the related provision for loan losses with the provision for credit losses on loans. CECL Adoption also replaced the allowance for unfunded commitments with the ACL on unfunded commitments and replaced the related provision for unfunded commitments with the provision for credit losses on unfunded commitments. The aggregate of the provision for credit losses on loans and the provision for credit losses on unfunded commitments is presented on the Consolidated Statements of Income as the provision for credit losses. The ACL on unfunded commitments is included on the Consolidated Statements of Financial Condition within accrued expenses and other liabilities. For additional information, see “—Critical Accounting Policies” above.
The following table presents the provision for credit losses for the periods indicated:
| | | | | | | | | | | |
| Year Ended December 31, |
| 2020 | | 2019 |
| (In thousands) |
| Provision for credit losses on loans | $ | 35,433 | | | $ | 4,311 | |
| Provision for credit losses on unfunded commitments | 673 | | | — | |
| Provision for credit losses | $ | 36,106 | | | $ | 4,311 | |
Provision for Credit Losses on Loans
The Bank has established a comprehensive methodology for determining its ACL on loans. The ACL on loans is increased by the provision for credit losses on loans which is charged against earnings. The amount of the provision expense recognized during the year ended December 31, 2020 was calculated based on a thorough review of the loan portfolio and in accordance with the Bank's CECL methodology for determining the current expected credit losses on loans. The amount of the provision expense recognized during the year ended December 31, 2019 was calculated in accordance with the Bank's probable incurred loss methodology. For additional information, see the section entitled "Analysis of Allowance for Credit Losses on Loans" above.
The provision for credit losses on loans is dependent on the Bank’s ability to manage asset quality and control the level of net charge-offs through prudent underwriting standards. In addition, a further decline in general economic conditions, including as a result of the COVID-19 pandemic, could increase future provisions for credit losses on loans and have a material adverse effect on the Company’s net income.
The provision for credit losses on loans increased $31.1 million, or 721.9%, to $35.4 million for the year ended December 31, 2020 from $4.3 million for the year ended December 31, 2019 due primarily to the credit deterioration estimated as a result of the COVID-19 pandemic, as further explained in the "Analysis of Allowance for Credit Losses on Loans" above. Additionally, the Bank recorded net charge-offs of $3.2 million during both the years ended December 31, 2020 and 2019, increasing the need for provision expense.
Provision for Credit Losses on Unfunded Commitments
The Bank has established a comprehensive methodology for determining its ACL on unfunded commitments, which is similar to the ACL on loans with additional considerations for the likelihood of funding over the contractual life of the commitment. The ACL on unfunded commitments is increased by the provision for credit losses on unfunded commitments which is charged against earnings. The amount of the provision expense recognized during the year ended December 31, 2020 was calculated based on a thorough review of the loan portfolio and in accordance with the Bank's CECL methodology for determining the current expected credit losses on unfunded commitments. The amount of the provision expense recognized during the year ended December 31, 2019 was calculated in accordance with the Bank's incurred loss methodology.
The Bank recorded a provision for credit losses on unfunded commitments of $673,000 during the year ended December 31, 2020 primarily as a result of an increased in the estimated losses as a result of credit deterioration due to the COVID-19 pandemic (as reflected in the ACL on loans) and partially offset a decrease in the utilization rates for revolving lines of credit to 38.6% at December 31, 2020 compared to 39.2% at December 31, 2019.
Noninterest Income Overview
Total noninterest income increased $4.8 million, or 14.7%, to $37.2 million for the year ended December 31, 2020 compared to $32.5 million for the same period in 2019. The following table presents the change in the key components of noninterest income for the periods noted:
| | | | | | | | | | | | | | | | | | | | | | | |
| Year Ended December 31, | | | | |
| 2020 | | 2019 | | Change | | Percentage Change |
| (Dollars in thousands) |
| Service charges and other fees | $ | 16,228 | | | $ | 18,712 | | | $ | (2,484) | | | (13.3) | % |
| Gain on sale of investment securities, net | 1,518 | | | 330 | | | 1,188 | | | 360.0 | |
| Gain on sale of loans, net | 5,044 | | | 2,424 | | | 2,620 | | | 108.1 | |
| Interest rate swap fees | 1,691 | | | 1,232 | | | 459 | | | 37.3 | |
Bank owned life insurance income | 4,319 | | | 2,160 | | | 2,159 | | | 100.0 | |
| Other income | 8,429 | | | 7,604 | | | 825 | | | 10.8 | |
| Total noninterest income | $ | 37,229 | | | $ | 32,462 | | | $ | 4,767 | | | 14.7 | % |
Gain on sale of loans, net increased $2.6 million, or 108.1%, to $5.0 million for the year ended December 31, 2020 compared to $2.4 million for the same period in 2019 from the combination of higher origination and sales volumes and higher earned sales margins reflecting an increased demand for residential loans due to the low interest rate environment during the year ended December 31, 2020. Originations of mortgage loans held for sale increased $64.9 million, or 90.1%, to $137.0 million for the year ended December 31, 2020 from $72.2 million for the year ended December 31, 2019.
Bank owned life insurance income increased $2.2 million, or 100.0%, to $4.3 million during the year ended December 31, 2020 compared to $2.2 million during the year ended December 31, 2019 due primarily to life insurance death benefit income of $1.9 million recognized during the year ended December 31, 2020. No death benefits were recognized during the year ended December 31, 2019.
Gain on sale of investment securities, net increased $1.2 million, or 360.0%, to $1.5 million for the year ended December 31, 2020 from $330,000 during the same period in 2019 as a result of the Bank's active management of the investment portfolio in the current low interest rate environment.
Other income increased $825,000, or 10.8%, to $8.4 million for the year ended December 31, 2020 compared to $7.6 million for the year ended December 31, 2019 primarily as a result of a net gain on sale of two branches held for sale of $935,000 and a termination fee from the divestiture of our trust department of $651,000, offset partially by a counterparty valuation adjustment on our back-to-back interest rate swaps of $422,000 due to the lower interest rate environment.
The increase in noninterest income was offset partially by a decrease in service charges and other fees of $2.5 million, or 13.3%, to $16.2 million for the year ended December 31, 2020 compared to $18.7 million for the year ended December 31, 2019 due primarily to a decrease in overdraft fees of $1.8 million and decreases in other activity-based fees on deposit accounts based on changes in customer spending habits as a result of the COVID-19 pandemic.
Noninterest Expense Overview
Noninterest expense increased $2.2 million, or 1.5%, to $148.9 million during the year ended December 31, 2020 compared to $146.8 million for the year ended December 31, 2019. The following table presents changes in the key components of noninterest expense for the periods indicated:
| | | | | | | | | | | | | | | | | | | | | | | |
| Year Ended December 31, | | | | |
| 2020 | | 2019 | | Change | | Percentage Change |
| (Dollars in thousands) |
| Compensation and employee benefits | $ | 88,106 | | | $ | 87,568 | | | $ | 538 | | | 0.6 | % |
| Occupancy and equipment | 22,664 | | | 21,690 | | | 974 | | | 4.5 | |
| Data processing | 9,396 | | | 8,976 | | | 420 | | | 4.7 | |
| Marketing | 3,100 | | | 3,481 | | | (381) | | | (10.9) | |
| Professional services | 5,921 | | | 5,192 | | | 729 | | | 14.0 | |
| State/municipal business and use tax | 3,754 | | | 3,754 | | | — | | | — | |
| Federal deposit insurance premium | 1,789 | | | 725 | | | 1,064 | | | 146.8 | |
| Other real estate owned, net | (145) | | | 352 | | | (497) | | | (141.2) | |
| | | | | | | | | | | | | | | | | | | | | | | |
| Year Ended December 31, | | | | |
| 2020 | | 2019 | | Change | | Percentage Change |
| (Dollars in thousands) |
| Amortization of intangible assets | 3,525 | | | 4,001 | | | (476) | | | (11.9) | |
| Other expense | 10,830 | | | 11,049 | | | (219) | | | (2.0) | |
| Total noninterest expense | $ | 148,940 | | | $ | 146,788 | | | $ | 2,152 | | | 1.5 | % |
Federal deposit insurance premium expense increased $1.1 million, or 146.8%, to $1.8 million during the year ended December 31, 2020 from $725,000 during the year ended December 31, 2019 due primarily to the impact of the decrease in the Bank's Tier 1 leverage ratio on the Bank's assessment rate, offset partially by the use of a small bank credit of $518,000 during the year ended December 31, 2020 compared to $726,000 during the year ended December 31, 2019. All small bank credits were fully utilized as of December 31, 2020.
Occupancy and equipment increased $974,000, or 4.5%, to $22.7 million during the year ended December 31, 2020 from $21.7 million during the year ended December 31, 2019 due primarily to costs, including depreciation expense, related to the Southern Operations Center location placed into operation in December 2019.
Professional services increased $729,000, or 14.0%, to $5.9 million during the year ended December 31, 2020 from $5.2 million during the year ended December 31, 2019 related primarily to the launch of the new mobile and online commercial banking platform, "Heritage Direct." The implementation of the new banking platform was completed during the second quarter of 2020.
The increases in noninterest expense were partially offset by a decrease in expense on other real estate owned, net of $497,000, or 141.2%, to a net gain of $145,000 during the year ended December 31, 2020 from a net expense of $352,000 during the year ended December 31, 2019 as a result of net gain on sales recognized during the year ended December 31, 2020 compared to net loss on sales recognized during the year ended December 31, 2019.
The ratio of noninterest expense to average total assets was 2.37% for the year ended December 31, 2020 compared to 2.71% for the year ended December 31, 2019. The decrease in the ratio of noninterest expense to average total assets was primarily due to an increase in average total assets as discussed in the Net Interest Income Overview section.
Income Tax Expense Overview
Income tax expense decreased $6.9 million, or 51.0%, to $6.6 million for the year ended December 31, 2020 from $13.5 million for the year ended December 31, 2019. The effective tax rate was 12.4% for the year ended December 31, 2020 compared to 16.6% for the year ended December 31, 2019. The decrease in income tax expense and effective tax rate during the year ended December 31, 2020 was primarily due to a provision in the CARES Act which permitted the Company to recognize a $1.0 million benefit from net operating losses related to prior acquisitions during the year ended December 31, 2020 and secondarily due to a decrease in pre-tax income which increased the impact of favorable permanent tax items such as tax-exempt investments, investments in bank owned life insurance and low-income housing tax credits.
Reconciliations of Non-GAAP Measures
This section contains certain financial information determined by methods other than in accordance with GAAP. Our management uses these non-GAAP measures, together with the related GAAP measures, in its analysis of our performance and in making business decisions. Management also uses these measures for peer comparisons. Management believes that presenting loan yield excluding the effect of discount accretion on purchased loans is useful in assessing the impact of acquisition accounting on loan yield as the effect of loan discount accretion is expected to decrease as the acquired loans mature or roll off our balance sheet. Management believes that presenting loan yield excluding the effect of SBA PPP loans is useful in assessing the impact of the special program loans that are anticipated to substantially decrease upon forgiveness by the SBA within a short time frame. This also applies to the ratio of ACL on loans to loans receivable excluding the effect of SBA PPP. Management believes that presenting pre-tax pre-provision income, which reflects our profitability before income taxes and provision for credit losses, is useful in assessing our operating income and expenses by removing the volatility that is associated with credit loss provisions. We also believe that during a crisis such as the COVID-19 pandemic, this information is useful as the impact of the pandemic on credit loss provisions of various institutions will likely vary based on the geography of the communities served by a particular institution, and the decision to adopt or defer ASC 2016-13. These non-GAAP measures have inherent limitations, are not required to be uniformly applied and are not audited. They should not be considered in isolation or as substitutes for the results determined to be in accordance with GAAP, nor are they necessarily comparable to non-GAAP performance measures that may be presented by other companies. Where applicable, comparable earnings information using GAAP financial measures is also presented.
Reconciliations of the GAAP and non-GAAP financial measures are presented below for the periods indicated:
| | | | | | | | | | | | | |
| Year Ended December 31, |
| | 2020 | | 2019 | | |
| (Dollars in thousands) | | |
| Loan yield, excluding SBA PPP loans and incremental accretion on purchased loans: | | |
| Interest and fees on loans (GAAP) | $ | 192,417 | | | $ | 189,515 | | | |
| Exclude SBA PPP loan interest and fees | (19,472) | | | — | | | |
| Exclude incremental accretion on purchased loans | (3,446) | | | (4,876) | | | |
| Adjusted interest and fees on loans (non-GAAP) | $ | 169,499 | | | $ | 184,639 | | | |
| | | | | |
| Average loans receivable, net | $ | 4,335,564 | | | $ | 3,668,665 | | | |
| Exclude average SBA PPP loans | (589,635) | | | — | | | |
| Adjusted average loans receivable, net (non-GAAP) | $ | 3,745,929 | | | $ | 3,668,665 | | | |
| | | | | |
| Loan yield (GAAP) | 4.44 | % | | 5.17 | % | | |
| Loan yield, excluding SBA PPP loans and incremental accretion on purchased loans (non-GAAP) | 4.52 | % | | 5.04 | % | | |
| | | | | | | | | | | | | |
| Year Ended December 31, |
| 2020 | | 2019 | | |
| (Dollars in thousands) | | |
| ACL on loans to loans receivable, excluding SBA PPP loans |
| Allowance for credit losses on loans | $ | 70,185 | | | $ | 36,171 | | | |
| | | | | |
| Loans receivable (GAAP) | $ | 4,468,647 | | | $ | 3,767,879 | | | |
| Exclude SBA PPP loans | 715,121 | | | — | | | |
| Loans receivable, excluding SBA PPP (non-GAAP) | $ | 3,753,526 | | | $ | 3,767,879 | | | |
| | | | | |
| ACL on loans to Loans receivable (GAAP) | 1.57 | % | | 0.96 | % | | |
| ACL on loans to Loans receivable, excluding SBA PPP loans (non-GAAP) | 1.87 | % | | 0.96 | % | | |
| | | | | | | | | | | | | | | | | | | | | | | | | | | | | |
| Year Ended December 31, |
| 2020 | | 2019 | | 2018 | | 2017 | | 2016 |
| (Dollars in thousands) |
| Pre-tax, Pre-provision Income: | | | | | | | | | |
Net income (loss) (GAAP) | $ | 46,570 | | | $ | 67,557 | | | $ | 53,057 | | | $ | 41,791 | | | $ | 38,918 | |
| Exclude income tax (benefit) expense | 6,610 | | | 13,488 | | | 11,238 | | | 18,356 | | | 13,803 | |
Exclude provision for (reversal of provision for) credit losses | 36,106 | | | 4,311 | | | 5,129 | | | 4,220 | | | 4,931 | |
Pre-tax, pre-provision income (non-GAAP) | $ | 89,286 | | | $ | 85,356 | | | $ | 69,424 | | | $ | 64,367 | | | $ | 57,652 | |
Liquidity and Capital Resources
Our primary sources of funds are customer and local government deposits, loan principal and interest payments, loan sales and interest earned on and proceeds from sales and maturities of investment securities. These funds, together with retained earnings, equity and other borrowed funds, are used to make loans, acquire investment securities and other assets, and fund continuing operations. While maturities and scheduled amortization of loans are a predictable source of funds, deposit flows and loan prepayments are greatly influenced by the level of interest rates, economic conditions and competition.
We are required to maintain an adequate level of liquidity to ensure the availability of sufficient funds for loan originations and deposit withdrawals, satisfy other financial commitments, and fund operations. We generally maintain sufficient
cash and investments to meet short-term liquidity needs. At December 31, 2020, cash and cash equivalents totaled $743.3 million, or 11.2%, of total assets. Investment securities available for sale totaled $802.2 million at December 31, 2020, of which $194.9 million were pledged to secure public deposits, borrowing arrangements or securities sold under agreement to repurchase. Management considers unpledged investment securities available for sale to be a viable source of liquidity. The fair value of investment securities available for sale that were unpledged totaled $607.3 million, or 9.2% of total assets at December 31, 2020. The fair value of investment securities available for sale with maturities of one year or less totaled $56.1 million, or 0.8% of total assets at December 31, 2020. At December 31, 2020, the Bank maintained credit facilities with the FHLB for $991.7 million and credit facilities with the Federal Reserve Bank for $54.3 million, of which there were no borrowings outstanding under either facility as of December 31, 2020. The Bank also maintains advance lines with Wells Fargo Bank, US Bank, The Independent Bankers Bank, Pacific Coast Bankers’ Bank, and JP Morgan Chase to purchase federal funds totaling $215.0 million as of December 31, 2020, of which there were none outstanding as of December 31, 2020.
Our strategy has been to acquire non-maturity deposits from our retail accounts, acquire noninterest bearing demand deposits from our commercial customers, and use our available borrowing capacity to fund growth in assets. We anticipate that we will continue to rely on the same sources of funds in the future and use those funds primarily to make loans and purchase investment securities.
Contractual Obligations
The following table provides the amounts due under specified contractual obligations for the periods indicated as of December 31, 2020:
| | | | | | | | | | | | | | | | | | | | | | | | | | | | | | | | | | | |
| | December 31, 2020 |
| | One Year or Less | | One to Three Years | | Over Three to Five Years | | Over Five Years | | Other (1) | | Total |
| | (In thousands) |
| Contractual payments by period: |
| Deposits | $ | 325,686 | | | $ | 61,643 | | | $ | 12,175 | | | $ | 30 | | | $ | 5,198,456 | | | $ | 5,597,990 | |
| Securities sold under agreement to repurchase | — | | | — | | | — | | | — | | | 35,683 | | | 35,683 | |
| Junior subordinated debentures | — | | | — | | | — | | | 25,000 | | | — | | | 25,000 | |
| Operating leases | 3,547 | | | 6,241 | | | 5,267 | | | 6,611 | | | — | | | 21,666 | |
| Total contractual obligations | $ | 329,233 | | | $ | 67,884 | | | $ | 17,442 | | | $ | 31,641 | | | $ | 5,234,139 | | | $ | 5,680,339 | |
(1)Represents noninterest bearing demand deposits, interest bearing demand deposits, money market accounts and savings accounts which can generally be withdrawn on demand and thereby have an undefined maturity.
Asset and Liability Management
Our primary financial objective is to achieve long-term profitability while controlling our exposure to fluctuations in market interest rates. To accomplish this objective, we have formulated an interest rate risk management policy that attempts to manage the mismatch between asset and liability maturities while maintaining an acceptable interest rate sensitivity position. The principal strategies which we employ to control our interest rate sensitivity are: originating certain commercial business loans and real estate construction and land development loans at variable interest rates repricing for terms generally one year or less; and offering noninterest bearing demand deposit accounts to businesses and individuals. The longer-term objective is to increase the proportion of noninterest bearing demand deposits and low-rate interest bearing demand deposits, money market accounts, and savings deposits relative to certificate of deposit accounts to reduce our overall cost of funds.
A number of measures are used to monitor and manage interest rate risk, including income simulations, interest sensitivity (gap) analysis and economic value of equity sensitivity. An income simulation model is the primary tool used to assess the direction and magnitude of changes in net interest income resulting from changes in interest rates. Key assumptions in the model include prepayment speeds on loans and investment securities, decay rates on non-maturity deposits, and pricing on investment securities, loans, deposits and borrowings. In order to measure the interest rate risk sensitivity as of December 31, 2020, this simulation model uses a “no growth” assumption and assumes an instantaneous and sustained uniform change in market interest rates at all maturities. These assumptions are inherently uncertain and, as a result, the net interest income projections should be viewed as an estimate of the net interest income sensitivity at the time of the analysis. Actual results will differ from simulated results due to timing, magnitude and frequency of interest rate changes and changes in market conditions and management strategies, among other factors.
Based on the results of the simulation model, the following table presents the change in our net interest income as a result of parallel rate shock scenarios for the presented periods after the dates shown:
| | | | | | | | | | | |
| December 31,
2020 | | December 31,
2019 |
| (Dollars in thousands) |
| Modeled increase in market interest rates of 100 basis points | | | |
| Increase in net interest income in Year 1 | $ | 15,281 | | | $ | 8,149 | |
| Increase in net interest income in Year 2 | 26,389 | | | 15,572 | |
| Modeled increase in market interest rates of 200 basis points | | | |
| Increase in net interest income in Year 1 | 28,507 | | | 15,933 | |
| Increase in net interest income in Year 2 | 51,021 | | | 29,806 | |
| Modeled decrease in market interest rates of 100 basis points | | | |
| Decrease in net interest income in Year 1 | (3,014) | | | (7,415) | |
| Decrease in net interest income in Year 2 | (7,034) | | | (15,178) | |
These scenarios are based on interest rates as of the last day of a reporting period published by independent sources and incorporate relevant spread of instruments that are actively traded in the open market. Given that the short-term rates have drastically declined during the year ended December 31, 2020, we do not believe that the results of the "Down 200" analysis provide meaningful output and have been excluded. For the "Down 100" scenario, the Bank's modeling assumption is that all deposit rates are floored to one or two basis points and new loan production is recalibrated to incorporate a chosen net interest spread over index. The simulations used to manage market risk are based on numerous assumptions regarding the effect of changes in interest rates on the timing and extent of reprice characteristics, future cash flows and customer behavior. These assumptions are inherently uncertain and, as a result, the model cannot precisely estimate net interest income or precisely predict the impact of higher or lower net interest income. Actual results will differ from simulated results due to the timing, magnitude, and frequency of interest rate changes as well as changes in market condition, customer behavior and management strategies, among other factors.
Our asset and liability management strategies have resulted in a negative three month or less “gap” of 30.8% as of December 31, 2020. This “gap” measures the difference between the dollar amount of our interest earning assets and interest bearing liabilities that mature or reprice within the designated period (three months or less) as a percentage of total interest earning assets, based on certain estimates and assumptions as discussed below. We believe that the implementation of our operating strategies has reduced the potential effects of changes in market interest rates on our results of operations. The negative gap for the three month or less period indicates that decreases in market interest rates may favorably affect our results over that period.
The following table provides the estimated maturity or repricing and the resulting interest rate sensitivity gap of our interest earning assets and interest bearing liabilities at December 31, 2020. We used certain assumptions in presenting this data so the amounts may not be consistent with other financial information prepared in accordance with generally accepted accounting principles. The amounts in the tables also could be significantly affected by external factors, such as changes in prepayment assumptions, early withdrawal of deposits and competition.
| | | | | | | | | | | | | | | | | | | | | | | | | | | | | | | | | | | |
| | December 31, 2020 |
| | Estimated Maturity or Repricing Within |
| | Three Months or Less | | Over Three Months to 12
Months | | Over One to Five Years | | Over Five to 15
Years | | Over
15 Years | | Total |
| | (Dollars in thousands) |
| Interest Earnings Assets: | | | | | | | | | | | |
| Loans receivable, net | $ | 783,053 | | | $ | 271,512 | | | $ | 2,261,786 | | | $ | 977,246 | | | $ | 104,865 | | | $ | 4,398,462 | |
| Investment securities | 134,865 | | | 72,612 | | | 247,260 | | | 227,864 | | | 119,562 | | | 802,163 | |
| Interest earning deposits | 651,404 | | | — | | | — | | | — | | | — | | | 651,404 | |
| Total interest earning assets | $ | 1,569,322 | | | $ | 344,124 | | | $ | 2,509,046 | | | $ | 1,205,110 | | | $ | 224,427 | | | $ | 5,852,029 | |
| | | | | | | | | | | |
| Percentage of interest earning assets | 26.8 | % | | 5.9 | % | | 42.9 | % | | 20.6 | % | | 3.8 | % | | 100.0 | % |
| | | | | | | | | | | |
| | | | | | | | | | | | | | | | | | | | | | | | | | | | | | | | | | | |
| | December 31, 2020 |
| | Estimated Maturity or Repricing Within |
| | Three Months or Less | | Over Three Months to 12
Months | | Over One to Five Years | | Over Five to 15
Years | | Over
15 Years | | Total |
| | (Dollars in thousands) |
| Interest Bearing Liabilities: | | | | | | | | | | | |
Total interest bearing deposits (1) | $ | 3,317,442 | | | $ | 226,158 | | | $ | 73,829 | | | $ | 30 | | | $ | — | | | $ | 3,617,459 | |
| | | | | | | | | | | |
| Junior subordinated debentures | 20,887 | | | — | | | — | | | — | | | — | | | 20,887 | |
| Securities sold under agreement to repurchase | 35,683 | | | — | | | — | | | — | | | — | | | 35,683 | |
| Total interest bearing liabilities | $ | 3,374,012 | | | $ | 226,158 | | | $ | 73,829 | | | $ | 30 | | | $ | — | | | $ | 3,674,029 | |
| | | | | | | | | | | |
| Interest bearing liabilities, as a percentage of total interest earning assets | 57.7 | % | | 3.9 | % | | 1.3 | % | | — | % | | — | % | | 62.8 | % |
| | | | | | | | | | | |
| Interest rate sensitivity gap | $ | (1,804,690) | | | $ | 117,966 | | | $ | 2,435,217 | | | $ | 1,205,080 | | | $ | 224,427 | | | $ | 2,178,000 | |
| Interest rate sensitivity gap, as a percentage of total interest earning assets | (30.8) | % | | 2.0 | % | | 41.6 | % | | 20.6 | % | | 3.8 | % | | 37.2 | % |
| Cumulative interest rate sensitivity gap | $ | (1,804,690) | | | $ | (1,686,724) | | | $ | 748,493 | | | $ | 1,953,573 | | | $ | 2,178,000 | | | |
| Cumulative interest rate sensitivity gap, as a percentage of total interest earning assets | (30.8) | % | | (28.8) | % | | 12.8 | % | | 33.4 | % | | 37.2 | % | | |
(1)Adjustable-rate liabilities are included in the period in which interest rates are next scheduled to adjust rather than in the period they are due to mature. Although noninterest demand deposits, interest bearing demand deposits, money market accounts, and saving accounts are subject to immediate withdrawal, based on historical experience, management considers a substantial amount of such accounts to be core deposits having significantly longer maturities.
Certain shortcomings are inherent in the method of analysis presented in the foregoing table. For example, although certain assets and liabilities may have similar maturities or periods to repricing, they may react in different degrees to changes in market interest rates. Also, the interest rates on some types of assets and liabilities may fluctuate in advance of changes in market interest rates, while interest rates on other types may lag behind changes in market interest rates. Additionally, some assets, such as adjustable rate residential real estate mortgages, have features, which restrict changes in the interest rates of those assets both on a short-term basis and over the lives of such assets. Further, if a change in market interest rates occurs, prepayment and early withdrawal levels could deviate significantly from those assumed in calculating the tables. Finally, the ability of many borrowers to service their adjustable rate debt may decrease if market interest rates increase substantially.
The table below provides information about our financial instruments that are sensitive to changes in interest rates as of December 31, 2020. The table presents principal cash flows and related weighted average interest rates by expected maturity dates. The expected maturity is the contractual maturity or earlier call date of the instrument. The data in this table may not be consistent with the amounts in the preceding table, which represents amounts by the estimated repricing date or maturity date, whichever occurs sooner.
| | | | | | | | | | | | | | | | | | | | | | | | | | | | | | | | | | | | | | | | | |
| | By Expected Maturity Date |
| | Year Ended December 31, 2020 |
| | Three Months or Less | | Over Three Months to 12 Months | | Over One Year to Five Years | | Over Five Years to 15 Years | | Over
15 Years | | Total | | Fair Value |
| | (Dollars in thousands) |
| Investment Securities | | | | | | | | | | | | | |
| Amounts maturing: | | | | | | | | | | | | | |
| Fixed rate | $ | 28,950 | | | $ | 58,341 | | | $ | 216,633 | | | $ | 225,698 | | | $ | 119,562 | | | $ | 649,184 | | | |
| Weighted average interest rate | 3.08 | % | | 2.62 | % | | 2.92 | % | | 2.63 | % | | 2.29 | % | | 2.68 | % | | |
| | | | | | | | | | | | | | | | | | | | | | | | | | | | | | | | | | | | | | | | | |
| | By Expected Maturity Date |
| | Year Ended December 31, 2020 |
| | Three Months or Less | | Over Three Months to 12 Months | | Over One Year to Five Years | | Over Five Years to 15 Years | | Over
15 Years | | Total | | Fair Value |
| | (Dollars in thousands) |
| Adjustable rate | $ | 4,043 | | | $ | 1,001 | | | $ | 2,034 | | | $ | 65,550 | | | $ | 80,351 | | | $ | 152,979 | | | |
| Weighted average interest rate | 0.66 | % | | 2.13 | % | | 1.05 | % | | 0.91 | % | | 1.37 | % | | 1.16 | % | | |
| Total | $ | 32,993 | | | $ | 59,342 | | | $ | 218,667 | | | $ | 291,248 | | | $ | 199,913 | | | $ | 802,163 | | | $ | 802,163 | |
| Loans Receivable | | | | | | | | | | | | | |
| Amounts maturing: | | | | | | | | | | | | | |
| Fixed rate | $ | 40,786 | | | $ | 96,637 | | | $ | 1,316,720 | | | $ | 874,645 | | | $ | 105,959 | | | $ | 2,434,747 | | | |
| Weighted average interest rate | 4.31 | % | | 4.50 | % | | 2.50 | % | | 4.22 | % | | 4.07 | % | | 3.30 | % | | |
| Adjustable rate | $ | 108,290 | | | $ | 174,366 | | | $ | 296,282 | | | $ | 1,251,530 | | | $ | 203,432 | | | $ | 2,033,900 | | | |
| Weighted average interest rate | 5.32 | % | | 4.23 | % | | 4.34 | % | | 3.93 | % | | 4.01 | % | | 4.10 | % | | |
| Total | $ | 149,076 | | | $ | 271,003 | | | $ | 1,613,002 | | | $ | 2,126,175 | | | $ | 309,391 | | | $ | 4,468,647 | | | $ | 4,556,862 | |
| Certificate of Deposit Accounts | | | | | | | | | | | | | |
| Amounts maturing: | | | | | | | | | | | | | |
| Fixed rate | $ | 99,528 | | | $ | 226,158 | | | $ | 73,818 | | | $ | 30 | | | $ | — | | | $ | 399,534 | | | $ | 402,071 | |
| Weighted average interest rate | 0.56 | % | | 0.39 | % | | 1.42 | % | | 0.80 | % | | — | % | | 0.62 | % | | |
| Junior Subordinated Debentures | | | | | | | | | | | | | |
| Amounts maturing: | | | | | | | | | | | | | |
| Adjustable rate | $ | — | | | $ | — | | | $ | — | | | $ | — | | | $ | 20,887 | | | $ | 20,887 | | | $ | 18,500 | |
Weighted average interest rate (1) | — | % | | — | % | | — | % | | — | % | | 4.29 | % | | 4.29 | % | | |
(1)The contractual interest rate of the junior subordinated debentures was 1.80% at December 31, 2020. The weighted average rate includes the accretion of the discount established at the merger date which is amortized over the life of the trust preferred securities.
Impact of Inflation and Changing Prices
Inflation affects our operations by increasing operating costs and indirectly by affecting the operations and cash flow of our customers. Unlike most industrial companies, virtually all the assets and liabilities of a financial institution are monetary in nature. As a result, changes in interest rates generally have a more significant impact on a financial institution’s performance than the effects of general levels of inflation. Although interest rates do not necessarily move in the same direction or the same extent as the prices of goods and services, increases in inflation generally have resulted in increased interest rates.
ITEM 7A. QUANTITATIVE AND QUALITATIVE DISCLOSURES ABOUT MARKET RISK
We are exposed to interest rate risk through our lending and deposit gathering activities. For a discussion of how this exposure is managed and the nature of changes in our interest rate risk profile during the past year, see Item 7. Management’s Discussion And Analysis Of Financial Condition And Results Of Operations -— Asset and Liability Management.
Neither we, nor the Bank, maintain a trading account for any class of financial instrument, nor do we, or the Bank, engage in hedging activities or purchase high risk derivative instruments. Moreover, neither we, nor the Bank, are subject to foreign currency exchange rate risk or commodity price risk.
ITEM 8. FINANCIAL STATEMENTS AND SUPPLEMENTARY DATA
Report of Independent Registered Public Accounting Firm
Stockholders and the Board of Directors of Heritage Financial Corporation
Olympia, Washington
Opinions on the Financial Statements and Internal Control over Financial Reporting
We have audited the accompanying Consolidated Statements of Financial Condition of Heritage Financial Corporation and Subsidiaries (the "Company") as of December 31, 2020 and 2019, the related Consolidated Statements of Income, Comprehensive Income, Stockholders’ Equity, and Cash Flows for each of the years in the three-year period ended December 31, 2020, and the related notes (collectively referred to as the "financial statements"). We also have audited the Company’s internal control over financial reporting as of December 31, 2020 based on criteria established in the 2013 Internal Control – Integrated Framework issued by the Committee of Sponsoring Organizations of the Treadway Commission (“COSO”).
In our opinion, the financial statements referred to above present fairly, in all material respects, the financial position of the Company as of December 31, 2020 and 2019, and the results of their operations and their cash flows for each of the years in the three-year period ended December 31, 2020 in conformity with accounting principles generally accepted in the United States of America. Also in our opinion, the Company maintained, in all material respects, effective internal control over financial reporting as of December 31, 2020 based on criteria established in the 2013 Internal Control – Integrated Framework issued by COSO.
Change in Accounting Principle
As discussed in Note 1 to the financial statements, the Company has changed its method of accounting for allowance for credit losses effective January 1, 2020 due to the adoption of Financial Accounting Standards Board Accounting Standards Codification No. 326, Financial Instruments – Credit Losses (ASC 326). The Company adopted the new current expected credit loss standard using the modified retrospective method such that prior period amounts are not adjusted and continue to be reported in accordance with previously applicable generally accepted accounting principles. The adoption of the new credit loss standard and its subsequent application is also communicated as a critical audit matter below.
Basis for Opinions
The Company’s management is responsible for these financial statements, for maintaining effective internal control over financial reporting, and for its assessment of the effectiveness of internal control over financial reporting, included in the accompanying Management’s Report on Internal Control over Financial Reporting. Our responsibility is to express an opinion on the Company’s financial statements and an opinion on the Company’s internal control over financial reporting based on our audits. We are a public accounting firm registered with the Public Company Accounting Oversight Board (United States) ("PCAOB") and are required to be independent with respect to the Company in accordance with the U.S. federal securities laws and the applicable rules and regulations of the Securities and Exchange Commission and the PCAOB.
We conducted our audits in accordance with the standards of the PCAOB. Those standards require that we plan and perform the audits to obtain reasonable assurance about whether the financial statements are free of material misstatement, whether due to error or fraud, and whether effective internal control over financial reporting was maintained in all material respects.
Our audits of the financial statements included performing procedures to assess the risks of material misstatement of the financial statements, whether due to error or fraud, and performing procedures that respond to those risks. Such procedures included examining, on a test basis, evidence regarding the amounts and disclosures in the financial statements. Our audits also included evaluating the accounting principles used and significant estimates made by management, as well as evaluating the overall presentation of the financial statements. Our audit of internal control over financial reporting included obtaining an understanding of internal control over financial reporting, assessing the risk that a material weakness exists, and testing and evaluating the design and operating effectiveness of internal control based on the assessed risk. Our audits also included performing such other procedures as we considered necessary in the circumstances. We believe that our audits provide a reasonable basis for our opinions.
Definition and Limitations of Internal Control Over Financial Reporting
A company’s internal control over financial reporting is a process designed to provide reasonable assurance regarding the reliability of financial reporting and the preparation of financial statements for external purposes in accordance with generally accepted accounting principles. A company’s internal control over financial reporting includes those policies and procedures that (1) pertain to the maintenance of records that, in reasonable detail, accurately and fairly reflect the transactions and dispositions of the assets of the company; (2) provide reasonable assurance that transactions are recorded as necessary to permit preparation of financial statements in accordance with generally accepted accounting principles, and that receipts and expenditures of the company are being made only in accordance with authorizations of management and directors of the
company; and (3) provide reasonable assurance regarding prevention or timely detection of unauthorized acquisition, use, or disposition of the company’s assets that could have a material effect on the financial statements.
Because of its inherent limitations, internal control over financial reporting may not prevent or detect misstatements. Also, projections of any evaluation of effectiveness to future periods are subject to the risk that controls may become inadequate because of changes in conditions, or that the degree of compliance with the policies or procedures may deteriorate.
Critical Audit Matters
The critical audit matters communicated below are matters arising from the current period audit of the financial statements that were communicated or required to be communicated to the audit committee and that: (1) relate to accounts or disclosures that are material to the financial statements and (2) involved our especially challenging, subjective, or complex judgments. The communication of critical audit matters does not alter in any way our opinion on the financial statements, taken as a whole, and we are not, by communicating the critical audit matters below, providing separate opinions on the critical audit matters or on the accounts or disclosures to which they relate.
Allowance for Credit Losses on Loans – Modeling Techniques and Qualitative Risk Factor Adjustments
As described in Note 1, “Description of Business, Basis of Presentation, Significant Accounting Policies and Recently Issued Accounting Pronouncements” and Note 5, “Allowance for Credit Losses (“ACL”) on Loans” to the consolidated financial statements, the Company’s consolidated allowance for credit losses on loans was $70.2 million at December 31, 2020. Provision for credit losses on loans was $35.4 million for the year then ended. On January 1, 2020, the Company adopted ASC 326 which replaced the probable incurred loss methodology with an expected loss methodology that is referred to as the current expected credit loss (“CECL”) methodology. Upon adoption, the Company recorded a reduction to retained earnings, net of tax of $5.6 million, which includes the impact for both loans and unfunded commitments, as a cumulative-effect adjustment using a modified retrospective approach. See change in accounting principle explanatory paragraph above. The ACL on loans evaluation, upon adoption and at December 31, 2020, is inherently subjective, as it utilizes estimates that require a high degree of judgment relating to risk characteristics of loan segments, macroeconomic variables used in forecasting, and other qualitative risk factors. Changes in these judgments and estimates could have a material effect on the Company’s financial results.
The Company primarily uses a historic loss, open pool CECL methodology to calculate the ACL on loans, which the Company has applied to identified loan segments with similar risk characteristics. The methodology incorporates a macroeconomic sensitive model which calculates multipliers for each loan segment to account for the current and forecasted conditions that adjust the baseline historical loss rates over a reasonable and supportable forecast period. The forecasted segment balances are impacted by a mix of macroeconomic factors not limited to, but including unemployment rate, GDP, housing price index, commercial real estate price index, disposable income growth, mortgage rates, and certain rate indices. The macroeconomic sensitive model was developed utilizing regression analysis to determine the factors that were predictive of loss rates based on historical data for each forecasted segment. Regression modeling is a complex estimation approach for determining loss rates during the forecast period which required significant judgment by management. The process involved the selection of macroeconomic factors and the evaluation of regression analysis outputs to determine the statistical fit of each macroeconomic factor used to forecast expected losses in each statistically modeled portfolio segment.
The Company also utilizes qualitative risk factor adjustments to account for credit losses that are not inherently considered in the quantitative analyses. These adjustments are subjectively selected by management and are based on established metrics to estimate risk. The subjective nature of the qualitative risk factor adjustments requires significant judgment by management both in the selection of qualitative factors to apply, if any, and the magnitude of the adjustment once selected.
The audit procedures over the modeling techniques used to develop the macroeconomic sensitive model involved a high degree of auditor judgment and required significant audit effort including the use of more experienced audit personnel and internal credit and valuation specialists due to its complexity. Additionally, the audit procedures over the qualitative adjustments utilized in management’s methodology involved especially challenging and subjective auditor judgment. Therefore, we identified auditing the ACL modeling techniques and qualitative risk factors as a critical audit matter.
Our audit procedures to address this critical audit matter primarily included the following:
•Tested the operating effectiveness of controls over the implementation and application of the macroeconomic sensitive model and related factors including:
◦The Company’s ACL committee’s oversight and approval of management’s judgments and estimates utilized in the model for ACL on loans.
◦The Company’s ACL committee’s oversight and approval of management’s application of accounting policies, selection and implementation of model methodologies, and evaluation of qualitative risk adjustments determined by management.
◦Management’s controls over the completeness and accuracy of the data utilized in the macroeconomic sensitive model
◦Management’s controls over third-party model validation and testing of model performance.
•Substantively tested management’s process over the implementation and application of the macroeconomic sensitive model and related factors including:
◦Evaluated the reasonableness and appropriateness of the methodologies employed including, but not limited to, evaluating the soundness and appropriateness of the model’s significant assumptions and judgments.
◦Utilized internal valuation services as specialists to assist in evaluating the development of the Company’s loss model used for CECL with specific emphasis on the development of the macroeconomic sensitive model.
◦Tested the completeness and accuracy of the data utilized in management’s CECL methodology to adjust baseline loss rates by loan segment, primarily relating to macroeconomic factors and qualitative risk factors.
◦Evaluated model sensitivity of different economic scenarios.
◦Evaluated the reliability and relevancy of data used as a basis for the qualitative risk factor adjustments and the reasonableness of management’s judgments used in the determination of the qualitative risk factor adjustment by loan segment and the resulting allocation to the allowance.
Goodwill Impairment Evaluation
As described in Note 1 “Description of Business, Basis of Presentation, Significant Accounting Policies and Recently Issued Accounting Pronouncements” and Note 8 “Goodwill and Other Intangible Assets” to the consolidated financial statements, the Company’s consolidated goodwill balance was $240.9 million at December 31, 2020, which is allocated to the Company’s single reporting unit. Goodwill is tested for impairment at the reporting unit at least annually, or more frequently if events or circumstances occur that indicate that it is more-likely-than not that the fair value of the reporting unit is less that it’s carrying value. Due to deteriorating financial market and economic conditions as a result of the COVID-19 pandemic, the Company determined a triggering event occurred prior to its annual assessment date and consequently engaged a third-party valuation specialist to assist management in performing a quantitative assessment of goodwill as of May 31, 2020. Based on the quantitative assessment, management estimated the fair value of the reporting unit by weighting results from the market approach and the income approach. Significant assumptions inherent in the valuation methodologies for goodwill were employed and included, but were not limited to, prospective financial information, growth rates, terminal value, discount rates, and comparable multiples from publicly traded companies in the financial institution industry. The evaluation of the methodology and the selection and weighting of these assumptions could have a significant impact on either the fair value of the reporting unit, or the determination of goodwill impairment, which could have a material effect on the Company’s financial results.
We identified auditing the Company’s May 31, 2020 goodwill impairment test as a critical audit matter. The principal considerations for this determination were the degree of auditor judgment in performing procedures over the significant assumptions, which included discount rate, growth rates, terminal value, prospective financial information, selection of relevant market comparable data, and weighting allocation to valuation methodologies, and the use of our internal valuation services as specialists due to its complexity.
Our audit procedures to address this critical audit matter primarily included the following:
•Tested the operating effectiveness of controls over the evaluation of goodwill impairment including controls addressing:
◦Management’s quarterly evaluation of potential triggering events regarding goodwill impairment.
◦Management’s evaluation of the methodology and significant assumptions utilized by third-party valuation specialist.
•Substantively tested management’s evaluation of goodwill impairment including:
◦Tested the completeness and accuracy of data utilized in the model.
◦Evaluated the reasonableness of management’s judgments regarding forecasted cash flows utilized in the methodology.
◦Utilized our internal valuation services as specialists to assist in evaluating the appropriateness of the valuation methodologies employed, significant assumptions, and the overall reasonableness of the fair value of the reporting unit.
◦Evaluated the sensitivity of the fair value to variable financial forecasting scenarios.
/s/ Crowe LLP
We have served as the Company's auditor since 2012.
Denver, Colorado
February 26, 2021
HERITAGE FINANCIAL CORPORATION AND SUBSIDIARIES
CONSOLIDATED STATEMENTS OF FINANCIAL CONDITION
(In thousands, except shares)
| | | | | | | | | | | |
| December 31, 2020 | | December 31, 2019 |
| ASSETS | | | |
| Cash on hand and in banks | $ | 91,918 | | | $ | 95,039 | |
| Interest earning deposits | 651,404 | | | 133,529 | |
| Cash and cash equivalents | 743,322 | | | 228,568 | |
Investment securities available for sale, at fair value, net (amortized cost of $770,195 and $939,160, respectively) | 802,163 | | | 952,312 | |
| Loans held for sale | 4,932 | | | 5,533 | |
| Loans receivable | 4,468,647 | | | 3,767,879 | |
| Allowance for credit losses on loans | (70,185) | | | (36,171) | |
| Loans receivable, net | 4,398,462 | | | 3,731,708 | |
| Other real estate owned | — | | | 841 | |
| Premises and equipment, net | 85,452 | | | 87,888 | |
| Federal Home Loan Bank stock, at cost | 6,661 | | | 6,377 | |
| Bank owned life insurance | 107,580 | | | 103,616 | |
| Accrued interest receivable | 19,418 | | | 14,446 | |
| Prepaid expenses and other assets | 193,301 | | | 164,129 | |
| Other intangible assets, net | 13,088 | | | 16,613 | |
| Goodwill | 240,939 | | | 240,939 | |
| Total assets | $ | 6,615,318 | | | $ | 5,552,970 | |
| LIABILITIES AND STOCKHOLDERS' EQUITY | | | |
| Deposits | $ | 5,597,990 | | | $ | 4,582,676 | |
| | | |
| Junior subordinated debentures | 20,887 | | | 20,595 | |
| Securities sold under agreement to repurchase | 35,683 | | | 20,169 | |
| Accrued expenses and other liabilities | 140,319 | | | 120,219 | |
| Total liabilities | 5,794,879 | | | 4,743,659 | |
| Stockholders’ equity: | | | |
Preferred stock, no par value, 2,500,000 shares authorized; no shares issued and outstanding, respectively | — | | | — | |
Common stock, no par value, 50,000,000 shares authorized; 35,912,243 and 36,618,729 shares issued and outstanding, respectively | 571,021 | | | 586,459 | |
| Retained earnings | 224,400 | | | 212,474 | |
| Accumulated other comprehensive income, net | 25,018 | | | 10,378 | |
| Total stockholders’ equity | 820,439 | | | 809,311 | |
| Total liabilities and stockholders’ equity | $ | 6,615,318 | | | $ | 5,552,970 | |
See accompanying Notes to Consolidated Financial Statements.
HERITAGE FINANCIAL CORPORATION AND SUBSIDIARIES
CONSOLIDATED STATEMENTS OF INCOME
(In thousands, except per share amounts and shares outstanding)
| | | | | | | | | | | | | | | | | |
| Year Ended December 31, |
| 2020 | | 2019 | | 2018 |
| INTEREST INCOME: | | | | | |
| Interest and fees on loans | $ | 192,417 | | | $ | 189,515 | | | $ | 175,466 | |
| Taxable interest on investment securities | 17,541 | | | 23,045 | | | 17,602 | |
| Nontaxable interest on investment securities | 3,659 | | | 3,396 | | | 4,649 | |
| Interest on interest earning deposits | 703 | | | 1,894 | | | 1,689 | |
| Total interest income | 214,320 | | | 217,850 | | | 199,406 | |
| INTEREST EXPENSE: | | | | | |
| Deposits | 12,265 | | | 16,349 | | | 10,397 | |
| Junior subordinated debentures | 890 | | | 1,339 | | | 1,263 | |
| Other borrowings | 168 | | | 480 | | | 753 | |
| Total interest expense | 13,323 | | | 18,168 | | | 12,413 | |
| Net interest income | 200,997 | | | 199,682 | | | 186,993 | |
| Provision for credit losses | 36,106 | | | 4,311 | | | 5,129 | |
| Net interest income after provision for credit losses | 164,891 | | | 195,371 | | | 181,864 | |
| NONINTEREST INCOME: | | | | | |
| Service charges and other fees | 16,228 | | | 18,712 | | | 18,914 | |
| Gain on sale of investment securities, net | 1,518 | | | 330 | | | 137 | |
| Gain on sale of loans, net | 5,044 | | | 2,424 | | | 2,759 | |
| Interest rate swap fees | 1,691 | | | 1,232 | | | 564 | |
| Bank owned life insurance income | 4,319 | | | 2,160 | | | 1,753 | |
| Other income | 8,429 | | | 7,604 | | | 7,491 | |
| Total noninterest income | 37,229 | | | 32,462 | | | 31,618 | |
| NONINTEREST EXPENSE: | | | | | |
| Compensation and employee benefits | 88,106 | | | 87,568 | | | 86,830 | |
| Occupancy and equipment | 22,664 | | | 21,690 | | | 19,779 | |
| Data processing | 9,396 | | | 8,976 | | | 9,888 | |
| Marketing | 3,100 | | | 3,481 | | | 3,228 | |
| Professional services | 5,921 | | | 5,192 | | | 9,670 | |
| State/municipal business and use taxes | 3,754 | | | 3,754 | | | 3,002 | |
| Federal deposit insurance premium | 1,789 | | | 725 | | | 1,480 | |
| Other real estate owned, net | (145) | | | 352 | | | 106 | |
| Amortization of intangible assets | 3,525 | | | 4,001 | | | 3,819 | |
| Other expense | 10,830 | | | 11,049 | | | 11,385 | |
| Total noninterest expense | 148,940 | | | 146,788 | | | 149,187 | |
| Income before income taxes | 53,180 | | | 81,045 | | | 64,295 | |
| Income tax expense | 6,610 | | | 13,488 | | | 11,238 | |
| Net income | $ | 46,570 | | | $ | 67,557 | | | $ | 53,057 | |
| Basic earnings per share | $ | 1.29 | | | $ | 1.84 | | | $ | 1.49 | |
| Diluted earnings per share | $ | 1.29 | | | $ | 1.83 | | | $ | 1.49 | |
| Dividends declared per share | $ | 0.80 | | | $ | 0.84 | | | $ | 0.72 | |
| Average number of basic shares outstanding | 36,014,445 | | | 36,758,230 | | | 35,194,003 | |
| Average number of diluted shares outstanding | 36,170,066 | | | 36,985,766 | | | 35,371,590 | |
See accompanying Notes to Consolidated Financial Statements.
HERITAGE FINANCIAL CORPORATION AND SUBSIDIARIES
CONSOLIDATED STATEMENTS OF COMPREHENSIVE INCOME
(In thousands)
| | | | | | | | | | | | | | | | | |
| Year Ended December 31, |
| 2020 | | 2019 | | 2018 |
| Net income | $ | 46,570 | | | $ | 67,557 | | | $ | 53,057 | |
Change in fair value of investment securities available for sale, net of tax of $4,506, $4,834 and $(1,591), respectively | 15,828 | | | 18,094 | | | (5,956) | |
Reclassification adjustment for net gain from sale of investment securities available for sale included in income, net of tax of $(330), $(69) and $(29), respectively | (1,188) | | | (261) | | | (108) | |
| Other comprehensive income (loss) | 14,640 | | | 17,833 | | | (6,064) | |
| Comprehensive income | $ | 61,210 | | | $ | 85,390 | | | $ | 46,993 | |
See accompanying Notes to Consolidated Financial Statements.
HERITAGE FINANCIAL CORPORATION AND SUBSIDIARIES
CONSOLIDATED STATEMENTS OF STOCKHOLDERS' EQUITY
(In thousands, except per share amounts)
| | | | | | | | | | | | | | | | | | | | | | | | | | | | | |
| Year Ended December 31, 2020 |
| Number of
common
shares | | Common
stock | | Retained
earnings | | Accumulated other comprehensive income, net | | Total
stockholders’
equity |
| Balance at December 31, 2019 | 36,619 | | | $ | 586,459 | | | $ | 212,474 | | | $ | 10,378 | | | $ | 809,311 | |
Cumulative effect from change in accounting policy (1) | — | | | — | | | (5,615) | | | — | | | (5,615) | |
| Restricted stock units vested, net of forfeitures of restricted stock awards | 110 | | | — | | | — | | | — | | | — | |
| Exercise of stock options | 8 | | | 122 | | | — | | | — | | | 122 | |
| Stock-based compensation expense | — | | | 3,559 | | | — | | | — | | | 3,559 | |
| Common stock repurchased | (825) | | | (19,119) | | | — | | | — | | | (19,119) | |
| Net income | — | | | — | | | 46,570 | | | — | | | 46,570 | |
| Other comprehensive income, net of tax | — | | | — | | | — | | | 14,640 | | | 14,640 | |
| | | | | | | | | |
Cash dividends declared on common stock ($0.80 per share) | — | | | — | | | (29,029) | | | — | | | (29,029) | |
| Balance at December 31, 2020 | 35,912 | | | $ | 571,021 | | | $ | 224,400 | | | $ | 25,018 | | | $ | 820,439 | |
(1) Effective January 1, 2020, the Company adopted ASU 2016-13, Financial Instruments - Credit Losses.
| | | | | | | | | | | | | | | | | | | | | | | | | | | | | |
| Year Ended December 31, 2019 |
| Number of
common
shares | | Common
stock | | Retained
earnings | | Accumulated other comprehensive (loss) income, net | | Total
stockholders’
equity |
| Balance at December 31, 2018 | 36,874 | | | $ | 591,806 | | | $ | 176,372 | | | $ | (7,455) | | | $ | 760,723 | |
Cumulative effect from change in accounting policy (1) | — | | | — | | | (399) | | | — | | | (399) | |
| Restricted stock units vested, net of forfeitures of restricted stock awards | 62 | | | — | | | — | | | — | | | — | |
| Exercise of stock options | 4 | | | 58 | | | — | | | — | | | 58 | |
| Stock-based compensation expense | — | | | 3,231 | | | — | | | — | | | 3,231 | |
| Common stock repurchased | (321) | | | (8,636) | | | — | | | — | | | (8,636) | |
| Net income | — | | | — | | | 67,557 | | | — | | | 67,557 | |
| Other comprehensive income, net of tax | — | | | — | | | — | | | 17,833 | | | 17,833 | |
| | | | | | | | | |
Cash dividends declared on common stock ($0.84 per share) | — | | | — | | | (31,056) | | | — | | | (31,056) | |
| Balance at December 31, 2019 | 36,619 | | | $ | 586,459 | | | $ | 212,474 | | | $ | 10,378 | | | $ | 809,311 | |
(1) Effective January 1, 2019, the Company adopted ASU 2016-02, Leases.
| | | | | | | | | | | | | | | | | | | | | | | | | | | | | |
| Year Ended December 31, 2018 |
| Number of
common
shares | | Common
stock | | Retained
earnings | | Accumulated other comprehensive loss, net | | Total
stockholders’
equity |
| Balance at December 31, 2017 | 29,928 | | | $ | 360,590 | | | $ | 149,013 | | | $ | (1,298) | | | $ | 508,305 | |
Cumulative effect from change in accounting policy (1) | — | | | — | | | 93 | | | (93) | | | — | |
| Restricted stock units vested, net of forfeitures of restricted stock awards | 29 | | | — | | | — | | | — | | | — | |
| Exercise of stock options | 10 | | | 133 | | | — | | | — | | | 133 | |
| Stock-based compensation expense | — | | | 2,744 | | | — | | | — | | | 2,744 | |
| Common stock repurchased | (53) | | | (1,704) | | | — | | | — | | | (1,704) | |
| Net income | — | | | — | | | 53,057 | | | — | | | 53,057 | |
| Other comprehensive loss, net of tax | — | | | — | | | — | | | (6,064) | | | (6,064) | |
| Common stock issued in business combination | 6,960 | | | 230,043 | | | — | | | — | | | 230,043 | |
Cash dividends declared on common stock ($0.72 per share) | — | | | — | | | (25,791) | | | — | | | (25,791) | |
| Balance at December 31, 2018 | 36,874 | | | $ | 591,806 | | | $ | 176,372 | | | $ | (7,455) | | | $ | 760,723 | |
(1) Effective January 1, 2018, the Company adopted ASU 2016-01, Recognition and Measurement of Financial Assets and Financial Liabilities.
See accompanying Notes to Consolidated Financial Statements.
HERITAGE FINANCIAL CORPORATION AND SUBSIDIARIES
CONSOLIDATED STATEMENTS OF CASH FLOWS
(In thousands)
| | | | | | | | | | | | | | | | | |
| Year Ended December 31, |
| 2020 | | 2019 | | 2018 |
| Cash flows from operating activities: | | | | | |
| Net income | $ | 46,570 | | | $ | 67,557 | | | $ | 53,057 | |
| Adjustments to reconcile net income to net cash provided by operating activities: | | | | | |
| Depreciation, amortization and accretion | (3,612) | | | 14,113 | | | 17,622 | |
| Provision for credit losses | 36,106 | | | 4,311 | | | 5,129 | |
| Net change in accrued interest receivable, prepaid expenses and other assets, and accrued expenses and other liabilities | (11,154) | | | 5,757 | | | 10,195 | |
| Stock-based compensation expense | 3,559 | | | 3,231 | | | 2,744 | |
| Amortization of intangible assets | 3,525 | | | 4,001 | | | 3,819 | |
| Origination of mortgage loans held for sale | (136,979) | | | (72,216) | | | (76,101) | |
| Proceeds from sale of mortgage loans held for sale | 142,624 | | | 70,397 | | | 79,237 | |
| Bank owned life insurance income | (4,319) | | | (2,160) | | | (1,753) | |
| Valuation adjustment on other real estate owned | — | | | 51 | | | 49 | |
| Valuation adjustment on interest rate swap | 422 | | | — | | | — | |
| (Gain) loss on sale of other real estate owned, net | (179) | | | 227 | | | — | |
| Gain on sale of mortgage loans held for sale, net | (5,044) | | | (2,424) | | | (2,759) | |
| Gain on sale of investment securities, net | (1,518) | | | (330) | | | (137) | |
| Gain on sale of assets held for sale | (1,043) | | | (169) | | | (798) | |
| Impairment of assets held for sale | 630 | | | 102 | | | 75 | |
| Impairment of right of use asset | 655 | | | 117 | | | — | |
| Loss (gain) on sale of premises and equipment, net | 88 | | | (75) | | | 32 | |
| Net cash provided by operating activities | 70,331 | | | 92,490 | | | 90,411 | |
| Cash flows from investing activities: | | | | | |
| Loans originated, net of principal payments | (692,720) | | | (126,142) | | | (106,527) | |
| Maturities, calls and payments of investment securities available for sale | 264,223 | | | 242,348 | | | 92,563 | |
| Purchase of investment securities available for sale | (152,618) | | | (242,776) | | | (342,141) | |
| Proceeds from sales of investment securities available for sale | 55,030 | | | 43,962 | | | 156,014 | |
| Purchase of premises and equipment | (6,997) | | | (13,041) | | | (23,265) | |
| Proceeds from sales of other loans | — | | | 3,562 | | | 9,993 | |
| Proceeds from sales of other real estate owned | 1,290 | | | 864 | | | 198 | |
| Proceeds from sales of assets held for sale | 2,407 | | | 1,664 | | | 1,908 | |
| Proceeds from redemption of Federal Home Loan Bank stock | 2,560 | | | 18,032 | | | 26,538 | |
| Purchases of Federal Home Loan Bank stock | (2,844) | | | (18,333) | | | (22,524) | |
| Proceeds from sales of premises and equipment | 554 | | | 96 | | | 28 | |
| Purchases of bank owned life insurance | (3,641) | | | (8,053) | | | (54) | |
| Proceeds from bank owned life insurance death benefit | 1,324 | | | — | | | — | |
| Capital contributions to low-income housing tax credit partnerships and new market tax credit partnerships, net | (7,117) | | | (27,485) | | | (8,303) | |
| Net cash received from acquisitions | — | | | — | | | 105,974 | |
| Net cash used by investing activities | (538,549) | | | (125,302) | | | (109,598) | |
| | | | | | | | | | | | | | | | | |
| Year Ended December 31, |
| 2020 | | 2019 | | 2018 |
| Cash flows from financing activities: | | | | | |
| Net increase in deposits | 1,015,314 | | | 150,274 | | | 214,740 | |
| Federal Home Loan Bank advances | 64,000 | | | 445,800 | | | 554,950 | |
| Repayment of Federal Home Loan Bank advances | (64,000) | | | (445,800) | | | (663,450) | |
| Common stock cash dividends paid | (28,859) | | | (30,908) | | | (25,791) | |
| Net increase (decrease) in securities sold under agreement to repurchase | 15,514 | | | (11,318) | | | (796) | |
| Proceeds from exercise of stock options | 122 | | | 58 | | | 133 | |
| Repurchase of common stock | (19,119) | | | (8,636) | | | (1,704) | |
| Net cash provided by financing activities | 982,972 | | | 99,470 | | | 78,082 | |
| Net increase in cash and cash equivalents | 514,754 | | | 66,658 | | | 58,895 | |
| Cash and cash equivalents at beginning of period | 228,568 | | | 161,910 | | | 103,015 | |
| Cash and cash equivalents at end of period | $ | 743,322 | | | $ | 228,568 | | | $ | 161,910 | |
| | | | | |
| Supplemental disclosures of cash flow information: | | | | | |
| Cash paid for interest | $ | 13,136 | | | $ | 17,867 | | | $ | 12,385 | |
| Cash paid for income taxes, net of refunds | 13,432 | | | 7,528 | | | 5,634 | |
| | | | | |
| Supplemental non-cash disclosures of cash flow information: | | | | | |
| Transfers of loans receivable to other real estate owned | $ | 270 | | | $ | — | | | $ | 434 | |
| Transfers of properties classified as held for sale to prepaid expenses and other assets from premises and equipment, net | 3,243 | | | 1,533 | | | 1,836 | |
| Investment in low-income housing tax credit partnership and related funding commitment | 10,237 | | | 46,677 | | | — | |
| | | | | |
Cumulative effect from change in accounting policy (1) | 7,175 | | | 29,754 | | | 93 | |
| Transfer of bank owned life insurance to prepaid expenses and other assets due to death benefit accrued, but not paid | 2,672 | | | 209 | | | 421 | |
| Right of use assets obtained in exchange for new operating lease liabilities | 1,265 | | | 1,505 | | | — | |
| | | | | |
| Business Combinations: | | | | | |
| Common stock issued for business combinations | $ | — | | | $ | — | | | $ | 230,043 | |
| | | | | |
| Assets acquired (liabilities assumed) in acquisitions: | | | | | |
| | | | | |
| Investment securities available for sale | — | | | — | | | 84,846 | |
| Loans receivable | — | | | — | | | 718,620 | |
| | | | | |
| | | | | |
| Other real estate owned | — | | | — | | | 1,796 | |
| Premises and equipment | — | | | — | | | 3,785 | |
| Federal Home Loan Bank stock | — | | | — | | | 1,743 | |
| | | | | |
| Accrued interest receivable | — | | | — | | | 2,454 | |
| Bank owned life insurance | — | | | — | | | 17,116 | |
| Prepaid expenses and other assets | — | | | — | | | 2,957 | |
| Other intangible assets | — | | | — | | | 18,345 | |
| Goodwill | — | | | — | | | 121,910 | |
| Deposits | — | | | — | | | (824,602) | |
| Federal Home Loan Bank advances | — | | | — | | | (16,000) | |
| Securities sold under agreement to repurchase | — | | | — | | | (462) | |
| Accrued expenses and other liabilities | — | | | — | | | (8,439) | |
(1) Effective January 1, 2020, 2019, and 2018, the Company adopted ASU 2016-13, Financial Instruments - Credit Losses; ASU 2016-02, Leases; and ASU 2016-01, Recognition and Measurement of Financial Assets and Financial Liabilities; respectively.
See accompanying Notes to Consolidated Financial Statements.
HERITAGE FINANCIAL CORPORATION AND SUBSIDIARIES
NOTES TO CONSOLIDATED FINANCIAL STATEMENTS
For the Years Ended December 31, 2020, 2019 and 2018
(1)Description of Business, Basis of Presentation, Significant Accounting Policies and Recently Issued Accounting Pronouncements
(a) Description of Business
The Company is primarily engaged in the business of planning, directing and coordinating the business activities of its wholly-owned subsidiary, Heritage Bank. The Bank is headquartered in Olympia, Washington and conducts business from its 53 branch offices at February 26, 2021 located throughout Washington State and the greater Portland, Oregon area. The Bank’s business consists primarily of commercial lending and deposit relationships with small and medium-sized businesses and their owners in its market areas and attracting deposits from the general public. The Bank also makes real estate construction and land development loans, consumer loans and originates first mortgage loans on residential properties primarily located in its market areas. The Bank's deposits are insured by the FDIC.
(b) Basis of Presentation
The accompanying audited Consolidated Financial Statements have been prepared in accordance with GAAP for annual financial information and pursuant to the rules and regulations of the SEC. To prepare the audited Consolidated Financial Statements in conformity with GAAP, management makes estimates and assumptions based on available information. These estimates and assumptions affect the amounts reported in the financial statements and the disclosures provided. Management believes that the judgments, estimates, and assumptions used in the preparation of the Consolidated Financial Statements are appropriate based on the facts and circumstances at the time. Actual results, however, could differ significantly from those estimates. Material estimates that are particularly susceptible to significant change relate to management's estimate of ACL on loans, management's estimate of ACL on unfunded commitments, management's evaluation of goodwill impairment and the fair value of financial instruments. It is reasonably possible that management's estimate of the ACL on loans of $70.2 million at December 31, 2020 as disclosed in Note (5) Allowance for Credit Losses on Loans, management's estimate of the ACL on unfunded commitments of $4.7 million as disclosed in Note (15) Commitments and Contingencies, management's conclusion that the fair value of the reporting unit more likely than not exceeds its carrying value at December 31, 2020 as disclosed in Note (8) Goodwill and Other Intangible Assets and the estimates of fair value of financial instruments as disclosed in Note (18) Fair Value Measurements could materially change. In particular, these estimates have been and will continue to be affected by the ongoing COVID-19 pandemic. The severity, magnitude and duration, as well as the economic consequences of the COVID-19 pandemic, are uncertain, rapidly changing and difficult to predict. As a result, our accounting estimates and assumptions may change over time in response to the COVID-19 pandemic.
The accompanying Consolidated Financial Statements include the accounts of the Company and its wholly-owned subsidiary, the Bank. All significant intercompany balances and transactions among the Company and the Bank have been eliminated in consolidation.
Certain prior year amounts in the Consolidated Statements of Income have been reclassified to conform to the current year’s presentation. Reclassifications had no effect on the prior years' net income or stockholders’ equity.
(c) Significant Accounting Policies
Cash and Cash Equivalents
Cash and cash equivalents include cash on hand and due from banks and interest-bearing balances due substantially from the Federal Reserve Bank. Cash equivalents have a maturity of 90 days or less at the time of purchase.
Investment Securities
The Company identifies investments as held to maturity or available for sale at the time of acquisition. Securities are classified as held to maturity when the Company has the ability and positive intent to hold them to maturity. Securities classified as available for sale are available for future liquidity requirements and may be sold prior to maturity. As of December 31, 2020 and December 31, 2019, the Bank does not hold any securities classified as held to maturity.
Securities available for sale are carried at fair value. Interest income includes amortization of purchase premiums or accretion of purchase discounts using the interest method. Unrealized gains and losses on securities available for sale are excluded from earnings and are reported in other comprehensive income (loss), net. Realized gains and losses on sale of investment securities are computed on the specific identification method. Transfers of securities between the available for sale and held to maturity categories, if executed, are accounted for at fair value.
A debt security is placed on nonaccrual status at the time any principal or payments become more than 90 days delinquent. Interest accrued, but not received for a security placed on nonaccrual, is reversed against interest income during the period that the debt security is placed on nonaccrual status.
ACL on Investment Securities Available for Sale
Management evaluates the need for an ACL on investment securities available for sale on at least a quarterly basis, and more frequently when economic or market conditions warrant such an evaluation. For investment securities available for sale in an unrealized loss position, the Company first assesses whether it intends to sell or it is more likely than not that it will be required to sell the security before the recovery of its amortized cost basis. If either of the criteria regarding intent or requirement to sell is met, the security’s amortized cost basis is written down to fair value through a provision for credit loss against income. For investment securities available for sale that do not meet the aforementioned criteria, the Company evaluates whether the decline in fair value has resulted from credit losses or other factors. In making this assessment, management considers the extent to which fair value is less than amortized cost, any changes to the rating of the security by a rating agency and adverse conditions specifically related to the security, among other factors. The credit loss is defined as the difference between the present value of the cash flows expected to be collected and the amortized cost basis. If the present value of cash flows expected to be collected is less than the amortized cost basis, a credit loss exists and an ACL on investment securities available for sale is recorded for the credit loss, limited by the amount that the fair value is less than the amortized cost basis. Any unrealized decline in fair value that has not been recorded through an ACL on investment securities available for sale is recognized in other comprehensive income.
Changes in the ACL on investment securities available for sale are recorded as provision for credit losses expense. Losses are charged against the ACL when management believes the uncollectability of an investment security available for sale is confirmed or when either of the criteria regarding intent or requirement to sell is met.
Loans Held for Sale
Mortgage loans held for sale are carried at the lower of amortized cost or fair value. Any loan that management does not have the intent and ability to hold for the foreseeable future or until maturity or payoff is classified as held for sale at the time of origination, purchase, or securitization, or when such decision is made. Unrealized losses on loans held for sale are recorded as a valuation allowance and included in other expense on the Consolidated Statements of Income.
Loans Receivable
Loans receivable includes loans originated and indirect loans purchased by the Bank as well as loans acquired in business combinations that management has the intent and ability to hold for the foreseeable future or until maturity or payoff and is reported at amortized cost. Amortized cost is the outstanding principal balance, net of purchased premiums and discounts, unearned discounts, and net deferred loan origination fees and costs. Interest on loans is calculated using the simple interest method based on the daily balance of the principal amount outstanding and is credited to income as earned. Accrued interest receivable for loans receivable is reported within Accrued interest receivable on the Consolidated Statements of Financial Condition. The Company's policies for loans receivable generally do not differ by loan segments or classes unless specified in the following policies.
Purchased Loans:
Loans acquired in a business combination are designated as “purchased” loans. Upon adoption of ASU 2016-13, the Bank's PCI loans were transitioned to PCD loans. The Bank elected to account for the PCD loans individually, terminating the pools of loans that were previously accounted for under ASC 310-30.
Loans purchased after January 1, 2020 are recorded at their fair value at acquisition date net of an ACL on loans expected to be incurred over the life of the loan. The initial ACL on purchased loans is determined using the same methodology as originated loans. For non-PCD loans, the initial ACL on loans is recorded through earnings as a provision for credit losses. For PCD loans, the initial ACL is incorporated into the calculation of the fair value of net assets acquired on the merger date and the net of the PCD loan purchase price and the initial ACL becomes the initial amortized cost basis. The difference between the initial amortized cost basis and the par value of PCD loans is the noncredit discount or premium for PCD loans. The noncredit discount or premium for PCD loans and both the noncredit and credit discount or premium for non-PCD loans are accreted through the interest and fees on loans line item on the Consolidated Statements of Income over the life of the loan using the effective interest method for non-revolving credits or the straight-line method, which approximates the effective interest method, for revolving credits. Any unrecognized discount or premium for a purchased loan that is subsequently repaid in full is recognized immediately into income. Subsequent changes to the ACL on loans for purchased loans are recorded through earnings as a provision for credit losses.
Delinquent Loans:
Loans are considered past due or delinquent when principal or interest payments are past due 30 days or more. Delinquent loans may remain on accrual status between 30 days and 89 days past due. The Credit Administration department is also involved in specifically reviewing larger loans that are delinquent more than 30 days past due.
The Bank did not designate loans with payment deferrals granted due to the COVID-19 pandemic as past due in accordance with the CARES Act and related regulatory guidance.
Nonaccrual and Charged-off Loans:
Loans for which the accrual of interest has been discontinued are designated as nonaccrual loans. The accrual of interest is generally discontinued at the time the loan is 90 days delinquent unless the credit is well secured and in the process of collection. Loans are placed on nonaccrual at an earlier date if collection of the contractual principal or interest is doubtful. All interest accrued, but not collected, on loans deemed nonaccrual during the period is reversed against interest income in that period. The interest payments received on nonaccrual loans are generally accounted for on the cost-recovery method whereby
the interest payment is applied to the principal balances. Loans may be returned to accrual status when improvements in credit quality eliminate the doubt as to the full collectability of both interest and principal and a period of sustained performance has occurred.
Due to the short-term nature of the forbearance and other relief programs we were offering as a result of the COVID-19 pandemic, borrowers granted relief under these programs generally were not reported as nonaccrual during the deferral period.
Loans are generally charged off to their net realizable value if collection of the contractual principal or interest as scheduled in the loan agreement is doubtful. Consumer loans are typically charged off no later than 90 days past due.
Troubled Debt Restructures:
A TDR is a restructuring in which the Bank, for economic or legal reasons related to a borrower’s financial difficulties, grants a concession to a borrower that it would not otherwise consider. These concessions may include changes of the interest rate, extension of the maturity date, delay in the timing of the regular payment, or any other actions intended to minimize potential losses. The Bank does not generally forgive principal as part of a TDR, but in those situations where principal is forgiven, the entire amount of such principal forgiveness is immediately charged off to the extent not done so prior to the modification. The Bank also considers insignificant delays in payments when determining if a loan should be classified as a TDR.
A loan that has been placed on nonaccrual status that is subsequently restructured will usually remain on nonaccrual status until the borrower is able to demonstrate repayment performance in compliance with the restructured terms for a sustained period, typically for six months. A restructured loan may return to accrual status sooner based on other significant events or mitigating circumstances. A loan that has not been placed on nonaccrual status may be restructured and such loan may remain on accrual status after such restructuring. In these circumstances, the borrower has made payments before the restructuring and is expected to continue to perform after the restructuring. Generally, this type of restructuring involves a reduction in the loan interest rate and/or a change to interest-only payments for a period of time.
A TDR is considered defaulted if, during the 12-month period after the restructure, the loan has not performed in accordance to the restructured terms. Defaults generally include loans whose payments are 90 days or more past due and loans whose revised maturity date passed and no further modifications will be granted for that borrower.
Once a loan is classified as a TDR loan, it generally continues to be reported as such until it is paid off or charged off.
During 2020, the CARES Act and regulatory agencies provided guidance around the modification of loans as a result of the COVID-19 pandemic, and outlined, among other criteria, that short-term modifications made on a good faith basis to borrowers who were current as defined by the CARES Act and related regulatory guidance prior to any relief, are not TDRs. This includes short-term (e.g. six months) modifications such as payment deferrals, fee waivers, extensions of repayment terms, or other delays in payment that are insignificant. Borrowers are considered current if they are less than 30 days past due on the contractual payments as of December 31, 2019 under the CARES Act, which the Bank determined was the implementation date of its modification program under related regulatory guidance.
Unfunded Loan Commitments:
Unfunded loan commitments are generally related to the unused portion of the total commitment of a loan or providing credit facilities to clients of the Bank, including standby letters of credit. These financial instruments are not actively traded and represent off-balance sheet risk to the Bank in excess of the disbursed amounts recognized in the Consolidated Statements of Financial Condition.
Loan Fees and Costs
Direct loan origination fees and costs on originated loans and premiums and discounts on acquired loans, are referred to as "net deferred fees," are deferred and subsequently amortized or accreted as a yield adjustment over the expected life of the loan without prepayment considerations utilizing the interest method, except revolving loans, for which the straight-line method is used. The objective of the interest method is to calculate periodic interest income at a constant effective yield. When a loan is paid off prior to maturity, the remaining net deferred fees are immediately recognized into interest income. In the event loans are sold, the unamortized net deferred fees are recognized as a component of the gain or loss on the sale of loans. Fees related to lending activities, other than the origination or purchase of loans, are recognized as noninterest income during the period the related services are performed.
Allowance for Credit Losses on Loans
The ACL on loans is a valuation account that is deducted from the amortized cost of loans receivable to present the net amount expected to be collected. Loans are charged against the ACL on loans when management believes the uncollectibility of a loan balance is confirmed. Expected recoveries do not exceed the aggregate of amounts previously charged-off and expected to be charged off. Subsequent recoveries, if any, are credited to the ACL on loans. The Bank records the changes in the ACL on loans through earnings as a provision for credit losses on the Consolidated Statements of Income.
Management has adopted a historic loss, open pool CECL methodology to calculate the ACL on loans. The same methodology is applied to all loans consistent with the guidance of the accounting standard which does not require undue complexity. Under this methodology, the Company has identified segments of loans with similar risk characteristics that align with their identified loan classes. Loans are determined to be collectively evaluated if they share similar risk characteristics in the segment, or individually evaluated if they do not share similar risk characteristics. Nonaccrual loans are not considered similar to other loans; therefore, they are evaluated for credit losses on an individual basis. The allowance for individually evaluated loans is calculated using either the collateral value method, which considers the likely source of repayment as the value of the
collateral, less estimated costs to sell, or the net present value method, which considers the contractual principal and interest terms and estimated cash flows available from the borrower to satisfy the debt. For each loan segment collectively measured for allowance, the allowance is comprised of the baseline loss allowance, the macroeconomic allowance, and the qualitative allowance.
A performing TDR loan is evaluated for allowance on a collective basis with loans with similar risk characteristics. Nonaccrual TDR loans do not meet the similar characteristics criteria and are evaluated for allowance on an individual basis as described above except that the original interest rate is used to discount the expected cash flows, not the rate specified in the restructuring.
Baseline allowance begins with the baseline loss rates calculated using the Bank's average quarterly historical loss information for an economic cycle. The Bank evaluates the historical period on a quarterly basis, with the assumption that economic cycles have historically lasted between 10 and 15 years. The baseline loss rates are applied to each loan's estimated cash flows over the life of the loan under the remaining life method to determine the baseline loss estimate for each loan. Estimated cash flows consider the principal and interest in accordance with the contractual term of the loan and estimated prepayments. Contractual cash flows are based on the amortized cost, and are adjusted for balances guaranteed by governmental entities, such as SBA or USDA, resulting in the unguaranteed amortized cost. The contractual term excludes expected extensions, renewals, and modifications unless either of the following applies: 1) management has a reasonable expectation at the reporting date that a TDR will be executed with an individual borrower, or 2) the extension or renewal options are included in the original or modified contract at the reporting date and are not unconditionally cancellable by the Company. Prepayments are established for each segment based on rolling historical averages for the segment, which management believes is an accurate representation of future prepayment activity. Management reviews the adequacy of the prepayment assumption on a quarterly basis.
Macroeconomic allowance includes consideration of the forecasted direction of the economic and business environment and its likely impact on the estimated allowance as compared to the historical losses over the reasonable and supportable time frame. Economic forecast models for the current period are uploaded to the model, which targets 16 forecasted macroeconomic factors, such as unemployment rate, GDP, housing price index, commercial real estate price index, disposable income growth, mortgage rates, and certain rate indices. Macroeconomic factor multipliers are determined through regression analysis and applied to loss rates for each portfolio segment. Each of the forecasted segment balances is impacted by a mix of these macroeconomic factors. Further, each of the macroeconomic factors is utilized differently by segment, including the application of lagged factors and various transformations such as percent change year over year.
A macroeconomic sensitive model is developed for each segment given the current and forecasted conditions, and a macroeconomic multiplier is calculated for each forecast period considering the forecasted losses as compared to the long-term average actual losses of the dataset. The impact of those macroeconomic factors on each segment, both positive or negative, using the reasonable and supportable period, are added to the calculated baseline loss allowance. After the reasonable and supportable period, forecasted loss rates revert to historical baseline loss levels over the predetermined reversion period on a straight-lined basis.
The Bank also considers other qualitative risk factors to adjust the estimated ACL on loans calculated by the above mentioned model. The Bank has a bias for minimal factors unless internal or external factors outside those considered in its historical losses or macroeconomic forecast indicate otherwise. The Bank has established metrics to estimate the qualitative risk factor by segment based on the identified risk.
In general, management's estimate of the ACL on loans uses relevant available information, from internal and external sources, relating to past events, current conditions, and reasonable and supportable forecasts.
The evaluation of ACL on loans is inherently subjective as it requires estimates that are susceptible to significant revision as more information becomes available. While management utilizes its best judgment and information available to recognize estimated losses on loans, future additions to the allowance may be necessary based on further declines in local and national economic conditions. In addition, various regulatory agencies, as an integral part of their examination process, periodically review the Bank’s ACL on loans. Such agencies may require the Bank to make adjustments to the allowance based on their judgments about information available to them at the time of their examinations. The Company believes the ACL on loans is appropriate given all of the above considerations.
ACL on Unfunded Commitments
The Bank estimates expected credit losses on unfunded, off-balance sheet commitments over the contractual period in which the Bank is exposed to credit risk from a contractual obligation to extend credit, unless the obligation is unconditionally cancellable by the Bank. The Bank has determined that no allowance is necessary for the off-balance sheet portion of the credit card portfolio as it has the ability to unconditionally cancel the available lines of credit.
The allowance methodology for unfunded commitments is similar to the ACL on loans, but additionally includes considerations of the current utilization of the commitment and an estimate of the future utilization as determined appropriate by historical commitment utilization and the Bank's estimates of future utilization given current economic forecasts.
The ACL for unfunded commitments is recorded in Accrued expenses and other liabilities on the Consolidated Statements of Financial Condition and changes are recognized through earnings in the provision for credit losses on the Consolidated Statements of Income.
Mortgage Banking Operations
The Bank originates and sells certain residential real estate loans on a servicing-released basis. The Bank recognizes a gain or loss to the extent that the sale proceeds of the loan sold differs from the net book value at the time of sale. Income from residential real estate loans brokered to other lenders is recognized into income on date of loan closing.
Commitments to sell residential real estate loans are made primarily during the period between the taking of the loan application and the closing of the loan. The timing of making these sale commitments is dependent upon the timing of the borrower’s election to lock-in the mortgage interest rate and fees prior to loan closing. Most of these sale commitments are made on a best-efforts basis whereby the Bank is only obligated to sell the loan if the loan is approved and closed by the Bank. Commitments to fund residential real estate loans (interest rate locks) to be sold into the secondary market and forward commitments for the future delivery of these loans are accounted for as free-standing derivatives. Fair values of these mortgage derivatives are estimated based on changes in mortgage interest rates between the date the interest on the loan was locked and the balance sheet date. The Company enters into forward commitments for the future delivery of residential real estate loans when interest rate locks are entered into, in order to hedge the interest rate risk resulting from its commitments to fund the loans. Changes in the fair values of these derivatives are included in other income.
Commercial Loan Sales, Servicing, and Commercial Servicing Asset
The Company, on a limited basis, sells the guaranteed portion of SBA and USDA loans, with servicing retained, for cash proceeds, and records a related servicing asset. The Company does not sell loans with servicing retained unless it retains a participating interest. A servicing asset is recorded at fair value upon sale, and the fair value is estimated by discounting estimated net future cash flows from servicing using discount rates that approximate current market rates and using estimated prepayment rates. Subsequent to initial recognition, all classes of servicing rights are carried at the lower of amortized cost or fair value, and are amortized in proportion to, and over the period of, the estimated net servicing income. The servicing asset is reported within Prepaid expenses and other assets on the Consolidated Statements of Financial Condition.
For purposes of evaluating and measuring impairment, the fair value of servicing rights is measured using a discounted estimated net future cash flow model as described above at least annually. Any impairment is measured as the amount by which the carrying value of servicing rights exceeds its fair value. Impairment is determined by stratifying rights into groupings based on predominant risk characteristics including investor type, loan type, and maturity. Impairment is recognized through a valuation allowance for an individual stratum, to the extent that fair value is less than the carrying amount. If the Company later determines that all or a portion of the impairment no longer exists for a particular stratum, a reduction of the allowance may be recorded as an increase to income. Changes in valuation allowances are reported within other noninterest income on the Consolidated Statements of Income. The fair values of servicing rights are subject to significant fluctuations as a result of changes in estimated and actual prepayments speeds, default rates and losses.
In connection with the sales, the Bank typically makes representations and warranties about the underlying assets conforming to specified guidelines. If the underlying assets do not conform to the specifications, the Bank may have an obligation to repurchase the assets or indemnify the purchaser against any loss. The Bank believes the potential for material loss under these arrangements is remote at December 31, 2020, December 31, 2019 and December 31, 2018.
Servicing fee income, which is reported as other noninterest income on the Consolidated Statements of Income, is recorded for fees earned for servicing loans. The fees are based on a contractual percentage of the outstanding principal and are recorded as income when earned. The amortization of mortgage servicing rights is netted against loan servicing fee income. Late fees and ancillary fees related to loan servicing were not material for the years ended December 31, 2020, 2019, and 2018.
A premium over the adjusted carrying value is received upon the sale of the guaranteed portion of a SBA or USDA loan. The Bank's investment in a SBA or USDA loan is allocated among the sold and retained portions of the loan based on the relative fair value of each portion at the time of loan origination, adjusted for payments and other activities. Because the portion retained does not carry a SBA or USDA guarantee, part of the gain recognized on the sold portion of the loan is deferred and amortized as a yield enhancement on the retained portion in order to obtain a market equivalent yield. The balance of the deferred gain was immaterial at December 31, 2020, December 31, 2019 and December 31, 2018.
Other Real Estate Owned
Other real estate acquired by the Company in partial or full satisfaction of a loan obligation is classified as held for sale. When acquired, the property is recorded at the estimated fair value (less the costs to sell) at the date of acquisition, not to exceed net realizable value, and any resulting write-down is charged against the ACL on loans. Physical possession of residential real estate property collateralizing a consumer mortgage loan occurs when legal title is obtained upon completion of foreclosure, or when the borrower conveys all interest in the properly to satisfy the loan through completion of a deed in lieu of foreclosure or through a similar legal agreement.
After acquisition, all costs incurred in maintaining the property are expensed except for costs relating to the development and improvement of the property which are capitalized to the extent of the property’s net realizable value. If the estimated realizable value of the other real estate owned property declines after the acquisition date, the valuation adjustment is charged to other real estate owned expense, net on the Consolidated Statements of Income.
Premises and Equipment
Premises and equipment, including leasehold improvements, are stated at cost less accumulated depreciation. Depreciation is computed using the straight-line method over the estimated useful lives of the assets or the lease period, whichever is shorter. The estimated useful lives used to compute depreciation and amortization for buildings and building
improvements, including lease improvements, is 15 to 39 years; and for furniture, fixtures and equipment is three to seven years. The Company reviews buildings, leasehold improvements and equipment for impairment whenever events or changes in the circumstances indicate that the undiscounted cash flows for the property are less than its carrying value. If identified, an impairment loss is recognized through a charge to earnings based on the fair value of the property.
Bank Owned Life Insurance
The Company's BOLI policies insure the lives of certain current or former Bank officers, and name the Bank as beneficiary. Noninterest income is generated tax-free (subject to certain limitations) from the increase in the policies' underlying investments made by the insurance company. The Company records BOLI at the amount that can be realized under the insurance contract at the statement of financial condition date, which is the cash surrender value adjusted for other charges or other amounts due that are probable at settlement.
ACL on Accrued Interest Receivable
Accrued interest receivable on investment securities available for sale is excluded from the estimate of credit losses on investment securities available for sale. No allowance has been established as interest accrued, but not received, is reversed timely in accordance with the policy for investment securities stated above.
Accrued interest receivable on loans receivable is excluded from the ACL on loans as interest accrued, but not received, is reversed timely in accordance with the policy for loans receivable stated above. Additional analysis was completed on ACL of accrued interest receivable during 2020 based on the significance of loan modifications in accordance with the CARES Act and regulatory guidance.
Other Intangible Assets
Other intangible assets represent CDI acquired in business combinations. The fair value of the CDI stemming from any given business combination is based on the present value of the expected cost savings attributable to the core deposit funding, relative to an alternative source of funding. The CDI is amortized over an estimated useful life which approximates the existing deposit relationships acquired on an accelerated method. The Company evaluates such identifiable intangibles for impairment annually, or more frequently if an indication of impairment exists.
Goodwill
The Company’s goodwill represents the excess of the purchase price over the fair value of net assets acquired in certain mergers and acquisitions. Goodwill is assigned to Heritage Bank and is evaluated for impairment at the Bank level (single reporting unit) on an annual basis, or more frequently if an indication of impairment exists between the annual tests. Factors to consider may include, among others: a significant change in legal factors or in the general business climate; significant change in the Company’s stock price and market capitalization; unanticipated competition; and an action or assessment by a regulator.
For the goodwill impairment assessment, the Company has the option to assess qualitative factors to determine whether the existence of events or circumstances leads to a determination that it is more-likely-than-not that the fair value of the reporting unit is less than its carrying value. If the Company opts to bypass the qualitative analysis or the qualitative analysis indicates that events or circumstances exist that it is more-likely-than-not that the fair value of the reporting unit is less than its carrying value, the Company performs a quantitative analysis. The quantitative analysis requires the Company to make assumptions and judgments regarding the fair value of the reporting unit. If the implied fair value of goodwill is less than the recorded goodwill, an impairment charge would be recorded for the difference.
Income Taxes
The Company and the Bank file a United States consolidated federal income tax return and an Oregon State income tax return. Income tax expense is the total of the current year income tax due or refundable and the change in deferred tax assets and liabilities. Deferred tax assets and liabilities are recognized for the future tax consequences attributable to differences between the carrying amounts of existing assets and liabilities and their respective tax bases. Deferred tax assets and liabilities are measured using enacted tax rates applicable to taxable income in the periods in which those temporary differences are expected to be recovered or settled. The effect on deferred tax assets and liabilities of a change in tax rate is recognized in income in the period that includes the enactment date. A valuation allowance, if needed, reduces deferred tax assets to the amounts expected to be realized.
A tax position is recognized as a benefit only if it is "more likely than not" that the tax position would be sustained in a tax examination, with a tax examination being presumed to occur. The amount recognized is the largest amount of tax benefit that is greater than 50% likely of being realized on examination. For tax positions not meeting the “more likely than not” test, no tax benefit is recorded.
The Company’s policy is to recognize interest and penalties on unrecognized tax benefits in income tax expense in the Consolidated Statements of Income as the amounts are generally insignificant each year.
Operating Leases
The Company has only identified leases classified as operating leases which are recorded as ROU assets and ROU liabilities within prepaid expenses and other assets and accrued expenses and other liabilities, respectively, in the Consolidated Statements of Financial Condition. ROU assets represent the Company's right to use an underlying asset for the lease term and ROU liabilities represent the Company's obligation to make lease payments arising from the lease. Operating lease ROU assets and ROU liabilities are recognized at the lease agreement commencement date based on the present value of lease payments over the lease term. The lease term incorporates options to extend the lease when it is reasonably certain that the Company will
exercise that option. As the Company's leases typically do not provide an implicit rate; the Company uses its incremental borrowing rate based on the information available at the operating lease commencement date in determining the present value of lease payments. The operating lease ROU asset is further reduced by any lease pre-payments made and lease incentives. The leases may contain various provisions for increases in rental rates, based either on changes in the published Consumer Price Index or a predetermined escalation schedule, and such variable lease payments are recognized as lease expense as they are incurred. The majority of the Company's leases include variable lease payments such as real estate taxes, maintenance, insurance and other similar costs in addition to the base rent. Lease expense for lease payments is recognized on a straight-line basis over the lease term.
The Company does not separate non-lease components from lease components and excludes operating leases with a term of twelve months or less from being capitalized as ROU assets and ROU liabilities. The Company follows a policy to capitalize lease agreements with total contractual lease payments of $25,000 or more. The Company does not account for any leases at a portfolio level.
Stock-Based Compensation
The Company maintains a number of stock-based incentive programs, which are discussed in more detail in Note (19) Stock-Based Compensation. Compensation cost is recognized for stock options, restricted stock awards and restricted stock units issued to employees and directors based on the fair value of these awards at the date of grant. Compensation cost is generally recognized over the requisite service period, generally defined as the vesting period, on a straight-line basis. Compensation cost for restricted stock units with market-based vesting is recognized over the service period to the extent the restricted stock units are expected to vest. Forfeitures are recognized as they occur.
The market price of the Company’s common stock at the date of grant is used to determine the fair value of the restricted stock awards and restricted stock units. The fair value of stock options granted is estimated based on the date of grant using the Black-Scholes-Merton option pricing model. Certain restricted stock unit grants are subject to performance-based vesting as well as other approved vesting conditions and cliff-vest based on those conditions, and the fair value is estimated using a Monte Carlo simulation pricing model. The assumptions used in the Black-Scholes-Merton option pricing model and the Monte Carlo simulation pricing model include the expected term based on the valuation date and the remaining contractual term of the award; the risk-free interest rate based on the U.S. Treasury curve at the valuation date of the award; the expected dividend yield based on expected dividends being payable to the holders; and the expected stock price volatility over the expected term based on the historical volatility over the equivalent historical term.
Low Income Housing Tax Credit Investments
The Company has two equity investments in LIHTC partnerships, which are indirect federal subsidies that finance low-income housing projects. As a limited liability investor in these partnerships, the Company receives tax benefits in the form of tax deductions from partnership operating losses and federal income tax credits. The federal income tax credits are earned over a 10-year period as a result of the investment properties meeting certain criteria and are subject to recapture for noncompliance with such criteria over a 15-year period. The Company accounts for the LIHTCs under the proportional amortization method and amortizes the initial cost of the investment in proportion to the tax credits and other tax benefits received and recognizes the net investment performance on the Consolidated Statements of Income as a component of income tax expense. The Company reports the carrying value of the equity investments in the unconsolidated LIHTCs as Prepaid expenses and other assets on the Company’s Statements of Financial Condition.
The maximum exposure to loss in the LIHTCs is the amount of equity invested and credit extended by the Company. Loans to these entities are underwritten in substantially the same manner as are other loans and are secured. The Company has evaluated the variable interests held by the Company in each LIHTC investment and determined that the Company does not have controlling financial interests in such investments and is not the primary beneficiary.
New Market Tax Credit Investments
The Company has a total of $25.0 million of qualified equity investments into three certified development entities which are eligible to receive NMTC. The NMTC program provides federal tax incentives to investors to make investments in distressed communities and promotes economic improvements through the development of successful businesses in these communities. The NMTC is available to investors over a seven-year period and is subject to recapture if certain events occur during such period. The Company is required to fund 85% of a tranche by a predetermined deadline to claim the entire tax credit. The Company funded its tranche before the deadline.
The Company accounts for its NMTC on the equity method and reports the investment balance in Prepaid expenses and other assets on the Consolidated Statements of Financial Condition and the related investment income is recognized in Other income on the Consolidated Statements of Income.
Deferred Compensation Plans
The Company has a Deferred Compensation Plan and has entered into arrangements with certain executive officers. Under the Deferred Compensation Plan, participants are permitted to elect to defer compensation and the Company has the discretion to make additional contributions to the Deferred Compensation Plan on behalf of any participant based on a number of factors. Such discretionary contributions are generally approved by the Compensation Committee of the Company's Board of Directors. The notional account balances of participants under the Deferred Compensation Plan earn interest on an annual basis. The applicable interest rate is the Moody’s Seasoned Aaa Corporate Bond Yield as of January 1 of each year. Generally, a participant’s account is payable upon the earliest of the participant’s separation from service with the Company, the participant’s
death or disability, or a specified date that is elected by the participant in accordance with applicable rules of the Internal Revenue Code, as amended.
Additionally, in conjunction with the Premier Merger, the Company assumed a Salary Continuation Plan. The Salary Continuation Plan is an unfunded non-qualified deferred compensation plan for select former Premier Commercial executive officers, some of which are current Heritage officers. Under the Salary Continuation Plan, the Company will pay each participant, or their beneficiary, specified amounts over specified periods beginning with the individual's termination of service due to retirement subject to early termination provisions.
The Company’s obligation to make payments under the Deferred Compensation Plan and the Salary Continuation Plan is a general obligation of the Company and is to be paid from the Company’s general assets. As such, participants are general unsecured creditors of the Company with respect to their participation under both plans. The Company records a liability within Accrued expenses and other liabilities on the Consolidated Statements of Financial Condition and records Compensation and employee benefits expense on the Consolidated Statements of Income in a systematic and rational manner. Since the amounts earned under the Deferred Compensation Plan are generally based on the Company’s annual performance, the Company records deferred compensation expense each year for an amount calculated based on that year’s financial performance.
Earnings per Share
The two-class method is used in the calculation of basic and diluted earnings per common share. Basic earnings per common share is net income allocated to common shareholders divided by the weighted average number of common shares outstanding during the period. All outstanding unvested share-based payment awards that contain rights to nonforfeitable dividends are considered participating securities for this calculation. Dividends and undistributed earnings allocated to participating securities are excluded from net income allocated to common shareholders and participating securities are excluded from weighted average common shares outstanding. Diluted earnings per common share is calculated using the treasury stock method and includes the dilutive effect of additional potential common shares issuable under stock options. Earnings and dividends per share are restated for all stock splits and stock dividends through the date of issuance of the financial statements.
Derivative Financial Instruments
The commitments to originate residential real estate loans held for sale and the related forward delivery contracts are considered derivatives.
The Company also utilizes interest rate swap derivative contracts to facilitate the needs of its commercial customers whereby it enters into an interest rate swap with a customer while at the same time entering into an offsetting interest rate swap with another financial institution. In connection with each swap transaction, the Company agrees to pay interest to the customer on a notional amount at a variable interest rate and receive interest from the customer on a similar notional amount at a fixed interest rate. At the same time, the Company agrees to pay another financial institution the same fixed interest rate on the same notional amount and receive the same variable interest rate on the same notional amount. The transaction allows the Company’s customer to effectively convert a variable rate loan to a fixed rate and the Company recognizes immediate income based upon the difference in the bid/ask spread of the underlying transactions with its customers and the third-party. Because the Company acts as an intermediary for its customer, changes in the fair value of the underlying derivative contracts for the most part offset each other and do not significantly impact the Company’s results of operations. These interest rate swaps are not designated as hedging instruments.
The Company is exposed to credit-related losses in the event of nonperformance by the counterparty to these agreements. Credit risk of the financial contract is controlled through the credit approval, limits, and monitoring procedures and management does not expect the counterparties to fail their obligations.
Fee income related to interest rate swap derivative contract transactions is recorded in Interest rate swap fees on the Consolidated Statements of Income. The fair value of derivative positions outstanding is included in Prepaid expenses and other assets and Accrued expenses and other liabilities in the Consolidated Statements of Financial Condition. The gains and losses due to changes in fair value and all cash flows are included in Other income in the Consolidated Statements of Income, but typically net to zero based on the identical back-to-back interest rate swaps unless a credit valuation adjustment is recorded to appropriately reflect nonperformance risk in the fair value measurement. Various factors impact changes in the credit valuation adjustments over time, including changes in the risk ratings of the parties to the contracts, as well as changes in market rates and volatilities, which affect the total expected exposure of the derivative instruments.
Advertising Expenses
Advertising costs are expensed as incurred. Costs related to production of advertising are considered incurred when the advertising is first used.
Provision for Credit Losses
The provision for credit losses as presented in the Consolidated Statements of Income includes the provision for credit losses on loans, the provision for credit losses on unfunded commitments, the provision for credit losses on accrued interest receivable and the provision for credit losses on investment securities available for sale.
Operating Segments
While the Company’s chief decision-makers monitor the revenue streams of the various products and services, operations are managed and financial performance is evaluated on a Company-wide basis as operating results for all segments
are similar. Accordingly, all of the financial service operations are considered by management to be aggregated in one reportable operating segment.
Revenue from Contracts with Customers
The Company's revenues are primarily composed of interest income on financial instruments, such as loans and investment securities. The Company's revenue derived from contracts with customers are generally presented in Service charges and other fees and Other income on the Consolidated Statement of Income, and includes the following:
•Service Charges on Deposit Accounts: The Company earns fees from its deposit customers from a variety of deposit products and services. Non-transaction based fees such as account maintenance fees and monthly statement fees are considered to be provided to the customer under a day-to-day contract with ongoing renewals. Revenues for these non-transaction fees are earned over the course of a month, representing the period over which the Company satisfies the performance obligation. Transaction-based fees such as non-sufficient fund charges, stop payment charges and wire fees are recognized at the time the transaction is executed as the contract duration does not extend beyond the service performed.
•Wealth Management: The Company earns fees from contracts with customers for fiduciary and brokerage activities. Revenues are generally recognized on a monthly basis and are generally based on a percentage of the customer’s assets under management or based on investment or insurance solutions that are implemented for the customer.
•Merchant Processing Services and Debit and Credit Card Fees: The Company earns fees from cardholder transactions conducted through third-party payment network providers which consist of (i) interchange fees earned from the payment network as a debit card issuer, (ii) referral fee income, and (iii) ongoing merchant fees earned for referring customers to the payment processing provider. These fees are recognized when the transaction occurs, but may settle on a daily or monthly basis.
(d) Recently Issued Accounting Pronouncements
FASB ASU 2016-01, Recognition and Measurement of Financial Assets and Financial Liabilities (Subtopic 825-10), was issued in January 2016, to enhance the reporting model for financial instruments to provide users of financial statements with more decision-useful information. This Update contained several provisions, including but not limited to (1) requiring equity investments, with certain exceptions, to be measured at fair value with changes in fair value recognized in net income; (2) simplifying the impairment assessment of equity investments without readily determinable fair values by requiring a qualitative assessment to identify impairment; (3) eliminating the requirement to disclose the method(s) and significant assumptions used to estimate fair value; and (4) requiring separate presentation of financial assets and liabilities by measurement category and form of financial asset on the balance sheet or the accompanying notes to the financial statements. The Update also changed certain financial statement disclosure requirements, including requiring disclosures of the fair value of financial instruments be made on the basis of exit price. The Company adopted this Update effective January 1, 2018 using the cumulative catch-up transition method. This change resulted in a cumulative adjustment of $93,000 from accumulated other comprehensive loss, net to retained earnings for the unrealized gain related to the Company's equity security. The Company's processes and procedures utilized to estimate the fair value of loans receivable and certificate of deposit accounts for disclosure requirements were additionally changed due to adoption of this Update. Previously, the Company valued these items using an entry price notion. This ASU emphasized that these instruments be measured using the exit price notion; accordingly, the Company refined its calculation as part of adopting this Update. Prior period information has not been updated to conform with the new guidance. See the Consolidated Statements of Stockholders' Equity and Note (18) Fair Value Measurements.
FASB ASU 2016-02, Leases (Topic 842), as amended by ASU 2017-13, 2018-01, 2018-10, 2018-11 and ASU 2018-11 and ASU 2019-01, was originally issued in February 2016, to increase transparency and comparability of leases among organizations and to disclose key information about leasing arrangements. The ASU sets out the principles for the recognition, measurement, presentation and disclosure of leases for both lessees and lessors. The ASU requires lessees to apply a dual approach, classifying leases as either a finance or operating lease. This classification will determine whether the lease expense is recognized based on an effective interest method or on a straight-line basis over the term of the lease. A lessee is also required to record a right-of-use asset and a lease liability for all leases with a term greater than 12 months regardless of their classification. All cash payments will be classified within operating activities in the statement of cash flows. In transition, lessees and lessors are required to recognize and measure leases at the beginning of the earliest period presented using a modified retrospective approach. The ASU was effective for public entities for fiscal years beginning after December 15, 2018, including interim periods within those fiscal years. The Company adopted the ASU on January 1, 2019 and elected an exclusion accounting policy for lease assets and lease liabilities for leases with a term of twelve months or less. The adoption of this ASU resulted in the recognition of operating lease assets and liabilities of approximately $29.3 million and $30.2 million, respectively, in Prepaid expenses and other assets and Accrued expenses and other liabilities in the Consolidated Statements of Financial Condition. This change also resulted in a cumulative-effect adjustment to beginning retained earnings of $399,000, net of tax, under the modified retrospective approach.
FASB ASU 2016-13, Financial Instruments - Credit Losses (Topic 326): Measurement of Credit Losses on Financial Instruments, as amended by ASU 2018-19, ASU 2019-04, ASU 2019-05, ASU 2019-10, ASU 2019-11, and 2020-02, was originally issued in June 2016. This ASU requires financial assets measured at amortized cost basis to be presented at the net amount expected to be collected. For public business entities, this ASU is effective for fiscal years beginning after December 15, 2019, including interim periods within those fiscal years with early adoption permitted for fiscal years after December 15, 2018, and can be delayed under a provision of the CARES Act until the end of the official health emergency declaration. The Company
adopted ASU 2016-13 on January 1, 2020. The Significant Accounting Policies section above reflects the policies after adoption. The CECL Adoption had the following impacts:
Investment Securities
As of December 31, 2019, the Company had no historical charge-off or recovery history and did not have any investment securities available for sale outstanding at the adoption date for which an other-than-temporary impairment was previously recorded. At the adoption date of ASU 2016-13, the unrealized losses present in the portfolio of investment securities available for sale were primarily due to decreases in market interest rates on floating rate investment securities since the purchase of the securities and the fair value of these securities was expected to recover as the securities approach their maturity dates. The basis of management’s conclusion was that at December 31, 2019, 83.5% of the investment securities were issued by or guaranteed by the United States government or its agencies, 14.0% were issued and guaranteed by State and local governments and the remainder of the portfolio was invested in at least investment-grade securities. As a result of the analysis, no ACL on investment securities available for sale was recorded upon adoption.
Loan Receivable
ASU 2016-13 was applied prospectively and replaced the ALL with the ACL on loans on the Consolidated Statements of Financial Condition and replaced the related provision for loan losses with the provision for credit losses as presented on the Consolidated Statements of Income, net with the provision for credit losses on unfunded commitments.
The adoption was completed in a specific order beginning with the transition of PCI loans to PCD loans. The Bank elected to account for the PCD loans individually, terminating the pools of loans that were previously accounted for under ASC 310-30. First, an ACL on loans was determined for each PCI loan. The ACL on PCI loans was added to the loan's carrying amount to establish a PCD loan at its amortized cost basis. The difference between the outstanding principal balance and the amortized cost basis of the PCD loan is a noncredit premium or discount, which is amortized into interest income over the remaining life of the PCD loan. The PCI to PCD transition did not have an impact on beginning retained earnings; however, it did have the effect of reducing the existing allowance for PCI loans by $1.6 million under the CECL methodology as compared to the previous ASC 310-10 methodology.
Following the PCI to PCD transition, the Bank recorded a pretax increase to the ACL on loans of $3.4 million to increase the reserve to the estimated credit losses at January 1, 2020 based on its CECL methodology as part of the cumulative-effect adjustment to beginning retained earnings. The pretax increase to the ACL on loans of $3.4 million and the reduction in ACL on loans due to the PCI to PCD transition of $1.6 million resulted in an increase in the ACL on loans of $1.8 million at January 1, 2020. Upon adoption, the adjusted beginning balance of the ACL on loans as a percentage of loans receivable was 1.01% as compared to 0.96% at December 31, 2019 under the prior incurred loss methodology.
The PCI to PCD transition also resulted in a net discount of $4.3 million for PCD loans, or an increase in the net discount for PCD loans of $1.6 million. Following the transition, the total net discount for purchased loans increased to $10.0 million at January 1, 2020 compared to $8.4 million as of December 31, 2019.
Unfunded Commitments
ASU 2016-13 was applied prospectively and replaced the reserve for unfunded commitments with the ACL on unfunded commitments as included in Accrued liabilities and other expenses on the Consolidated Statements of Financial Condition and replaced the provision for unfunded commitments which was previously recorded in Other expense with the provision for credit losses as presented on the Consolidated Statements of Income, net with the provision for credit losses on loans. Upon adoption, the Bank recorded a pretax increase in the beginning ACL on unfunded commitments of $3.7 million.
Overall CECL Adoption Impact
The adoption of ASU 2016-13, including the above mentioned increase to the ACL on loans of $3.4 million and the increase to the ACL on unfunded commitments of $3.7 million, resulted in a pretax cumulative-effect adjustment of $7.1 million. The impact of this adjustment to beginning retained earnings on January 1, 2020 was $5.6 million, net of tax.
FASB ASU 2017-04, Goodwill (Topic 350), was issued in January 2017 and eliminates Step 2 from the goodwill impairment test. The ASU was effective for annual periods or any interim goodwill impairment tests beginning after December 15, 2019 using a prospective transition method and early adoption was permitted. The Company adopted the guidance on January 1, 2020. The Company has goodwill from prior business combinations and performs an annual impairment test during the quarter ended December 31, or more frequently if changes or circumstances occur that would more-likely-than-not reduce the fair value of the reporting unit below its carrying value. Although the Company cannot anticipate future goodwill impairment assessments, based on the most recent assessment prior to adoption, it is unlikely that an impairment amount would need to be calculated and, therefore, at adoption there was no impact from these amendments to the Company’s financial position and results of operations. In addition, the current accounting policies and processes were not changed, except for the elimination of the Step 2 analysis. For additional information regarding goodwill impairment testing, see Note (8) Goodwill and Other Intangible Assets.
FASB ASU 2018-13, Disclosure Framework - Changes to the Disclosure Requirements for Fair Value Measurement, was issued in August 2018 and modifies the disclosure requirements on fair value measurements in Topic 820. The amendments
in this ASU were effective for all entities for fiscal years, and interim periods within those fiscal years, beginning after December 15, 2019. The Company adopted the guidance on January 1, 2020. The adoption did not have a material impact to Note (18) Fair Value Measurements.
FASB ASU 2020-03, Codification Improvements to Financial Instruments, was issued in March 2020 and revised a wide variety of topics in the Codification with the intent to make the Codification easier to understand and apply by eliminating inconsistencies and providing clarifications. The ASU was effective immediately upon its release and did not have a material impact on the Consolidated Financial Statements.
FASB ASU 2020-04, Reference Rate Reform (Topic 848), as amended by ASU 2021-01, was issued in March 2020 and provides optional expedients and exceptions for applying GAAP to loan and lease agreements, derivative contracts, and other transactions affected by the anticipated transition away from LIBOR toward new interest rate benchmarks. For transactions that are modified because of reference rate reform and that meet certain scope guidance (i) modifications of loan agreements should be accounted for by prospectively adjusting the effective interest rate and the modification will be considered "minor" so that any existing unamortized origination fees/costs would carry forward and continue to be amortized and (ii) modifications of lease agreements should be accounted for as a continuation of the existing agreement with no reassessments of the lease classification and the discount rate or remeasurements of lease payments that otherwise would be required for modifications not accounted for as separate contracts. ASU 2020-04 also provides numerous optional expedients for derivative accounting and is effective March 12, 2020 through December 31, 2022. An entity may elect to apply the ASU for contract modifications as of January 1, 2020, or prospectively from a date within an interim period that includes or is subsequent to March 12, 2020, up to the date that the financial statements are available to be issued. Once elected for a Topic or an Industry Subtopic within the Codification, the amendments in this ASU must be applied prospectively for all eligible contract modifications for that Topic or Industry Subtopic. The Company’s swap related transactions are the majority of its LIBOR exposure. Effective January 25, 2021, the Company has agreed to adhere to the Interbank Offered Rate Fallbacks Protocol as published by the International Swaps and Derivatives Association, Inc. and recommended by the Alternative Reference Rates Committee. As of January 25, 2021, more than 12,000 entities across nearly 80 jurisdictions have adhered to this protocol which is expected to support a smooth transition from LIBOR to a replacement index. The Company further anticipates this ASU will simplify any modifications executed between the selected start date (yet to be determined) and December 31, 2022 that are directly related to LIBOR transition by allowing prospective recognition of the continuation of the contract, rather than extinguishment of the old contract resulting in writing off unamortized net deferred fees. The Company does not expect this ASU to have a material impact on its business operations and the Consolidated Financial Statements.
FASB ASU 2020-08, Codification Improvements to Subtopic 310-20, Receivables—Nonrefundable Fees and Other Costs, was issued in October 2020 and modifies the premium amortization of purchased callable debt securities on a prospective basis. The amendments in this ASU are effective for all entities for fiscal years, and interim periods within those fiscal years, beginning after December 15, 2020. Early application is not permitted. The Company does not expect the ASU will have a material impact on its Consolidated Financial Statements.
(2)Business Combinations
There were no acquisitions or mergers completed during the years ended December 31, 2020 and 2019. During the year ended December 31, 2018, the Company completed the acquisitions of Puget Sound Bancorp and Premier Commercial Bancorp.
Puget Sound Merger:
On July 26, 2017, the Company, along with the Bank, and Puget Sound Bancorp, Inc. and its wholly owned subsidiary bank, Puget Sound Bank, jointly announced the signing of a definitive agreement. The Puget Sound Merger was effective on January 16, 2018. As of the acquisition date, Puget Sound merged into Heritage and Puget Sound Bank merged into Heritage Bank.
Pursuant to the terms of the Puget Sound Merger, all outstanding Puget Sound restricted stock awards became immediately vested on the acquisition date of the Puget Sound Merger. Puget Sound shareholders received 1.1688 shares of Heritage common stock per share of Puget Sound stock. Heritage issued an aggregate of 4,112,258 shares of its common stock based on the January 12, 2018 closing price of Heritage Common stock of $31.80 for total fair value of common shares issued of $130.8 million and paid cash of $3,000 for fractional shares in the transaction for total consideration paid of $130.8 million. Total consideration included $851,000, representing 26,741 shares which were forfeited by the Puget Sound shareholders to pay their applicable taxes.
The Company incurred no acquisition-related costs for the year ended December 31, 2020 and $75,000 and $5.4 million for the years ended December 31, 2019 and 2018, respectively, for the Puget Sound Merger.
Premier Merger:
On March 24, 2018, the Company, along with the Bank, and Premier Commercial Bancorp and its wholly-owned subsidiary bank, Premier Community Bank, jointly announced the signing of a definitive agreement. The Premier Merger was effective on July 2, 2018. As of the acquisition date, Premier Commercial Bancorp merged into Heritage and Premier Community Bank merged into Heritage Bank.
Pursuant to the terms of the Premier Merger, Premier Commercial shareholders received 0.4863 shares of Heritage common stock per share of Premier Commercial common stock. Heritage issued an aggregate of 2,848,579 shares of its
common stock based on the closing date price per share of Heritage common stock on June 29, 2018 of $34.85 and paid cash of $2,000 for fractional shares in the transaction for total consideration paid of $99.3 million.
The Company incurred no acquisition-related costs for the year ended December 31, 2020 and $57,000, and $4.9 million for the years ended December 31, 2019 and 2018, respectively, for the Premier Merger.
Business Combination Accounting:
The Premier Merger and Puget Sound Merger resulted in $53.4 million and $68.5 million, respectively, of goodwill. This goodwill is not deductible for tax purposes.
The primary reason for the Premier and Puget Mergers was to create depth in the Company's geographic footprint consistent with its ongoing growth strategy, focused heavily on metro markets, and to achieve operational scale and realize efficiencies of a larger combined organization. The mergers constitute business acquisitions as defined by FASB ASC 805, Business Combinations. FASB ASC 805 establishes principles and requirements for how the acquirer of a business recognizes and measures in its financial statements the identifiable assets acquired and the liabilities assumed. Heritage was considered the acquirer in these transactions. Accordingly, the preliminary estimates of fair values of Premier Commercial and Puget Sound assets, including the identifiable intangible assets, and the assumed liabilities, were measured and recorded as of the respective acquisition dates. Fair values on the acquisition dates are preliminary and represent management’s best estimates based on available information and facts and circumstances in existence on the acquisition date. Fair values are subject to refinement for up to one year after the closing date of the acquisitions as additional information regarding the closing date fair values becomes available. The Company finalized the purchase price allocation for both mergers as of December 31, 2018.
The fair value estimates of the assets acquired and liabilities assumed in the mergers were as follows:
| | | | | | | | | | | |
| Premier Merger | | Puget Sound Merger |
| (In thousands) |
| Assets | | | |
| Cash and cash equivalents | $ | 22,534 | | | $ | 25,889 | |
| Interest earning deposits | 3,309 | | | 54,247 | |
| Investment securities available for sale | 4,493 | | | 80,353 | |
Loans receivable (1) | 330,158 | | | 388,462 | |
| Other real estate owned | 1,796 | | | — | |
| Premises and equipment, net | 3,053 | | | 732 | |
| Federal Home Loan Bank stock, at cost | 1,120 | | | 623 | |
| Bank owned life insurance | 10,852 | | | 6,264 | |
| Accrued interest receivable | 1,006 | | | 1,448 | |
| Prepaid expenses and other assets | 1,603 | | | 1,354 | |
| Other intangible assets | 7,075 | | | 11,270 | |
| Total assets acquired | $ | 386,999 | | | $ | 570,642 | |
| Liabilities | | | |
| Deposits | $ | 318,717 | | | $ | 505,885 | |
| Federal Home Loan Bank advances | 16,000 | | | — | |
| Securities sold under agreement to repurchase | 462 | | | — | |
| Accrued expenses and other liabilities | 5,935 | | | 2,504 | |
| Total liabilities acquired | $ | 341,114 | | | $ | 508,389 | |
| | | |
| Fair value of net assets acquired | $ | 45,885 | | | $ | 62,253 | |
(1) The outstanding loan balance acquired in the Premier Merger and Puget Sound Merger was $335.4 million and $392.7 million, respectively, at the acquisition date.
Goodwill represents the excess of the consideration transferred over the estimated fair value of the net assets acquired and liabilities assumed. A summary of the net assets purchased and the estimated fair value adjustments and resulting goodwill recognized from the mergers are presented in the following table:
| | | | | | | | | | | |
| Premier Merger | | Puget Sound Merger |
| (In thousands) |
| Consideration transferred | $ | 99,275 | | | $ | 130,773 | |
| | | |
| Cost basis of net assets on merger date | $ | 40,629 | | | $ | 54,405 | |
| Fair value adjustments: | | | |
| Investment securities | (135) | | | (348) | |
| Total loans receivable, net | (111) | | | 1,400 | |
| Other real estate owned | (1,017) | | | — | |
| Premises and equipment | 1,312 | | | (121) | |
| Other intangible assets | 7,075 | | | 9,207 | |
| Prepaid expenses and other assets | (1,912) | | | (2,282) | |
| Deposits | (310) | | | (62) | |
| Accrued expenses and other liabilities | 354 | | | 54 | |
| Fair value of net assets on merger date | $ | 45,885 | | | $ | 62,253 | |
| | | |
| Goodwill recognized from the mergers | $ | 53,390 | | | $ | 68,520 | |
The following table presents certain pro forma information, for illustrative purposes only, for the year ended December 31, 2018 as if both the Premier Merger and Puget Sound Merger had occurred on January 1, 2017. The estimated pro forma information combines the historical results of Premier Commercial and Puget Sound with the Company's consolidated historical results and includes certain adjustments reflecting the estimated impact of certain fair value adjustments for the respective periods. The pro forma information is not indicative of what would have occurred had the mergers occurred on January 1, 2017. In particular, the pro forma information does not consider any changes to the ACL on loans from recorded loans at fair value. Additionally, Heritage expected to achieve further operating savings and other business synergies, including interest income growth, as a result of the mergers which are not reflected in the pro forma amounts in the following table. As a result, actual amounts will differ from the pro forma information presented.
| | | | | |
| Pro Forma for the Year Ended December 31, 2018 |
| (In thousands, except per share amounts) |
| Net interest income | $ | 194,989 | |
| Net income | 69,515 | |
| Basic earnings per common share | 1.88 | |
| Dilutive Earnings per common share | 1.87 | |
The Company believes that the historical Premier Commercial and Puget Sound operating results, individually or collectively, are not considered of enough significance to be meaningful to the Company’s results of operations.
(3)Investment Securities
The Company’s investment policy is designed primarily to provide and maintain liquidity, generate a favorable return on assets without incurring undue interest rate and credit risk, and complement the Bank’s lending activities.
There were no securities classified as trading or held to maturity at December 31, 2020 or December 31, 2019.
(a) Securities by Type and Maturity
The following tables present the amortized cost and fair value of investment securities available for sale at the dates indicated and the corresponding amounts of gross unrealized gains and losses recognized in accumulated other comprehensive income:
| | | | | | | | | | | | | | | | | | | | | | | |
| December 31, 2020 |
| Amortized
Cost | | Gross
Unrealized
Gains | | Gross
Unrealized
Losses | | Fair
Value |
| (In thousands) |
| U.S. government and agency securities | $ | 44,713 | | | $ | 947 | | | $ | — | | | $ | 45,660 | |
| Municipal securities | 197,634 | | | 12,561 | | | (227) | | | 209,968 | |
| | | | | | | |
| Residential CMO and MBS | 196,956 | | | 5,125 | | | (209) | | | 201,872 | |
| Commercial CMO and MBS | 290,638 | | | 13,198 | | | (90) | | | 303,746 | |
| Corporate obligations | 10,971 | | | 125 | | | — | | | 11,096 | |
| Other asset-backed securities | 29,283 | | | 565 | | | (27) | | | 29,821 | |
| Total | $ | 770,195 | | | $ | 32,521 | | | $ | (553) | | | $ | 802,163 | |
| | | | | | | | | | | | | | | | | | | | | | | | | |
| December 31, 2019 |
| Amortized
Cost | | Gross
Unrealized
Gains | | Gross
Unrealized
Losses | | | | Fair
Value |
| (In thousands) |
| U.S. government and agency securities | $ | 104,709 | | | $ | 598 | | | $ | (84) | | | | | $ | 105,223 | |
| Municipal securities | 128,183 | | | 4,933 | | | (102) | | | | | 133,014 | |
| | | | | | | | | |
| Residential CMO and MBS | 336,929 | | | 3,184 | | | (505) | | | | | 339,608 | |
| Commercial CMO and MBS | 322,169 | | | 5,575 | | | (649) | | | | | 327,095 | |
| Corporate obligations | 23,893 | | | 316 | | | (15) | | | | | 24,194 | |
| Other asset-backed securities | 23,277 | | | 54 | | | (153) | | | | | 23,178 | |
| Total | $ | 939,160 | | | $ | 14,660 | | | $ | (1,508) | | | | | $ | 952,312 | |
For the years ended December 31, 2020 and 2019, there was no provision for credit loss on investment securities available for sale recorded in the Consolidated Statements of Income. There was no ACL on investment securities available for sale at December 31, 2020 and December 31, 2019.
The amortized cost and fair value of investment securities available for sale at December 31, 2020, by contractual maturity, are set forth below. Actual maturities may differ from contractual maturities because certain borrowers have the right to call or prepay obligations with or without call or prepayment penalties.
| | | | | | | | | | | |
| Amortized Cost | | Fair Value |
| (In thousands) |
| Due in one year or less | $ | 55,631 | | | $ | 56,055 | |
| Due after one year through five years | 138,458 | | | 145,562 | |
| Due after five years through ten years | 209,381 | | | 220,191 | |
| Due after ten years | 366,725 | | | 380,355 | |
| | | |
| Total | $ | 770,195 | | | $ | 802,163 | |
There were no holdings of securities of any one issuer, other than the U.S. government and its agencies, in an amount greater than 10% of stockholders’ equity at December 31, 2020 and December 31, 2019.
(b) Unrealized Losses and Other-Than-Temporary Impairments
The following tables show the gross unrealized losses and fair value of the Company's investment securities available for sale aggregated by investment category and length of time that the individual securities have been in continuous unrealized loss positions as of December 31, 2020 and December 31, 2019:
| | | | | | | | | | | | | | | | | | | | | | | | | | | | | | | | | | | |
| December 31, 2020 |
| Less than 12 Months | | 12 Months or Longer | | Total |
| Fair
Value | | Unrealized
Losses | | Fair
Value | | Unrealized
Losses | | Fair
Value | | Unrealized
Losses |
| (In thousands) |
| | | | | | | | | | | |
| Municipal securities | 10,264 | | | (227) | | | — | | | — | | | 10,264 | | | (227) | |
| Residential CMO and MBS | — | | | — | | | 25,293 | | | (209) | | | 25,293 | | | (209) | |
| Commercial CMO and MBS | 11,404 | | | (29) | | | 7,499 | | | (61) | | | 18,903 | | | (90) | |
| | | | | | | | | | | |
| Other asset-backed securities | — | | | — | | | 4,570 | | | (27) | | | 4,570 | | | (27) | |
| Total | $ | 21,668 | | | $ | (256) | | | $ | 37,362 | | | $ | (297) | | | $ | 59,030 | | | $ | (553) | |
| | | | | | | | | | | | | | | | | | | | | | | | | | | | | | | | | | | |
| December 31, 2019 |
| Less than 12 Months | | 12 Months or Longer | | Total |
| Fair
Value | | Unrealized
Losses | | Fair
Value | | Unrealized
Losses | | Fair
Value | | Unrealized
Losses |
| (In thousands) |
| U.S. government and agency securities | $ | 45,999 | | | $ | (84) | | | $ | — | | | $ | — | | | $ | 45,999 | | | $ | (84) | |
| Municipal securities | 13,761 | | | (102) | | | — | | | — | | | 13,761 | | | (102) | |
| | | | | | | | | | | |
| Residential CMO and MBS | 14,272 | | | (66) | | | 60,232 | | | (439) | | | 74,504 | | | (505) | |
| Commercial CMO and MBS | 56,263 | | | (177) | | | 43,623 | | | (472) | | | 99,886 | | | (649) | |
| | | | | | | | | | | |
| Corporate obligations | 998 | | | (2) | | | 1,987 | | | (13) | | | 2,985 | | | (15) | |
| Other asset-backed securities | 14,383 | | | (127) | | | 1,609 | | | (26) | | | 15,992 | | | (153) | |
| Total | $ | 145,676 | | | $ | (558) | | | $ | 107,451 | | | $ | (950) | | | $ | 253,127 | | | $ | (1,508) | |
The Company has evaluated these investment securities available for sale as of December 31, 2020 and December 31, 2019 and determined that no ACL on investment securities available for sale is necessary. Unrealized losses on investment securities available for sale have not been recognized into earnings because the issuers of bonds are investment grade, the securities carry governmental guarantees, management does not intend to sell and it is likely that management will not be required to sell the securities prior to their anticipated recovery and the decline in fair value is largely due to changes in interest rates and other market conditions. The issuers continue to make timely principal and interest payments on the bonds and the fair value is expected to recover as the bonds approach maturity.
(c) Realized Gains and Losses
The following table presents the gross realized gains and losses on the sale of investment securities available for sale for the years ended December 31, 2020, December 31, 2019 and December 31, 2018:
| | | | | | | | | | | | | | | | | |
| Year ended December 31, |
| 2020 | | 2019 | | 2018 |
| (In thousands) |
| Gross realized gains | $ | 1,537 | | | $ | 558 | | | $ | 273 | |
| Gross realized losses | (19) | | | (228) | | | (136) | |
| Net realized gains | $ | 1,518 | | | $ | 330 | | | $ | 137 | |
(d) Pledged Securities
The following table summarizes the amortized cost and fair value of investment securities available for sale that are pledged as collateral for the following obligations at December 31, 2020 and December 31, 2019:
| | | | | | | | | | | | | | | | | | | | | | | |
| December 31, 2020 | | December 31, 2019 |
| Amortized
Cost | | Fair
Value | | Amortized
Cost | | Fair
Value |
| (In thousands) |
| Washington and Oregon state public deposits | $ | 119,652 | | | $ | 124,228 | | | $ | 187,700 | | | $ | 190,773 | |
| | | | | | | |
Securities sold under agreement to repurchase
| 38,630 | | | 39,945 | | | 22,156 | | | 22,294 | |
| Other securities pledged | 29,665 | | | 30,717 | | | 19,333 | | | 19,850 | |
| Total | $ | 187,947 | | | $ | 194,890 | | | $ | 229,189 | | | $ | 232,917 | |
(e) Accrued Interest Receivable
Accrued interest receivable, excluded from amortized cost on investment securities available for sale, totaled $3.6 million and $3.7 million at December 31, 2020 and December 31, 2019, respectively. No amounts of accrued interest receivable on investment securities available for sale were reversed against interest income on investment securities available for sale during the years ended December 31, 2020 and December 31, 2019.
(4)Loans Receivable
The Company originates loans in the ordinary course of business and has also acquired loans through mergers and acquisitions. Accrued interest receivable was excluded from disclosures presenting the Company's amortized cost of loans receivable as it was deemed insignificant. Accrued interest receivable on loans totaled $15.8 million and $10.7 million at December 31, 2020 and December 31, 2019, respectively. No ACL on accrued interest receivable on loans was recorded at December 31, 2020 and December 31, 2019.
The Company adopted ASU 2016-13 effective January 1, 2020, which prospectively changed disclosure requirements for loans receivable and increased the beginning ACL on loans as discussed in Note (5) Allowance for Credit Losses on Loans.
(a) Loan Origination/Risk Management
The Company categorizes the individual loans in the total loan portfolio into four segments: commercial business; residential real estate; real estate construction and land development; and consumer. Within these segments are classes of loans for which management monitors and assesses credit risk in the loan portfolios. The Company has certain lending policies and procedures in place that are designed to maximize loan income within an acceptable level of risk. Management reviews and approves these policies and procedures on a regular basis. A reporting system supplements the review process by providing management with frequent reports related to loan production, loan quality, concentrations of credit, loan delinquencies and nonperforming and criticized loans. The Company also conducts internal loan reviews and validates the credit risk assessment on a periodic basis and presents the results of these reviews to management. The loan review process complements and reinforces the risk identification and assessment decisions made by loan officers and credit personnel.
The amortized cost of loans receivable, net of ACL on loans at December 31, 2020 and December 31, 2019 consisted of the following portfolio segments and classes:
| | | | | | | | | | | |
| December 31, 2020 | | December 31, 2019 |
| (In thousands) |
| Commercial business: | | | |
| Commercial and industrial | $ | 733,098 | | | $ | 852,220 | |
| SBA PPP | 715,121 | | | — | |
| Owner-occupied CRE | 856,684 | | | 805,234 | |
| Non-owner occupied CRE | 1,410,303 | | | 1,288,779 | |
| Total commercial business | 3,715,206 | | | 2,946,233 | |
Residential real estate | 122,756 | | | 131,660 | |
| | | | | | | | | | | |
| December 31, 2020 | | December 31, 2019 |
| (In thousands) |
| Real estate construction and land development: | | | |
Residential | 78,259 | | | 104,296 | |
Commercial and multifamily | 227,454 | | | 170,350 | |
| Total real estate construction and land development | 305,713 | | | 274,646 | |
| Consumer | 324,972 | | | 415,340 | |
| Loans receivable | 4,468,647 | | | 3,767,879 | |
| Allowance for credit losses on loans | (70,185) | | | (36,171) | |
| Loans receivable, net | $ | 4,398,462 | | | $ | 3,731,708 | |
| | | |
| Balances included in amortized cost of Loans receivable: | | | |
| Unamortized net discount on acquired loans | $ | 6,575 | | | $ | 8,371 | |
| Unamortized net deferred (fee) cost | $ | (15,458) | | | $ | 2,441 | |
A discussion of the risk characteristics of each loan portfolio segment is as follows:
Commercial Business:
There are four significant classes of loans in the commercial business portfolio segment: commercial and industrial, SBA PPP, owner-occupied commercial real estate and non-owner occupied commercial real estate. The owner and non-owner occupied commercial real estate classes are both considered commercial real estate loans. As the commercial and industrial loans, SBA PPP loans and commercial real estate loans carry different risk characteristics, they are discussed separately below:
Commercial and industrial. Commercial and industrial loans are primarily made based on the identified cash flows of the borrower and secondarily on the underlying collateral provided by the borrower. The cash flows of borrowers, however, may not be as expected and the collateral securing these loans may fluctuate in value. Most commercial and industrial loans are secured by the assets being financed or other business assets such as accounts receivable or inventory and may include a personal guarantee; however, some short-term loans may be made on an unsecured basis. In the case of loans secured by accounts receivable, the availability of funds for the repayment of these loans may be substantially dependent on the ability of the borrower to collect amounts due from its customers. Commercial and industrial loans carry more risk than other loans because the borrowers’ cash flow is less predictable, and in the event of a default, the amount of loss is potentially greater and more difficult to quantify because the value of the collateral securing these loans may fluctuate, may be uncollectible, or may be obsolete or of limited use, among other things.
SBA PPP. The Bank began originating SBA PPP loans following the enactment of the CARES Act in April 2020. SBA PPP loans are fully guaranteed by the SBA, intended for businesses impacted by the COVID-19 pandemic and designed to provide near term relief to help small businesses sustain operations. These loans have either a two-year or five-year maturity date and earn interest at 1%. The Bank also earns a fee based on the size of the loan, which is recognized over the life of the loan. The balance of unamortized net deferred fees on SBA PPP loans was $15.4 million at December 31, 2020. The Bank expects that the great majority of SBA PPP borrowers will seek full or partial forgiveness of their loan obligations in accordance with the CARES Act.
Commercial real estate. The Company originates commercial real estate loans primarily within its primary market areas. These loans are subject to underwriting standards and processes similar to commercial and industrial loans in that these loans are viewed primarily as cash flow loans and secondarily as loans secured by real estate properties. Commercial real estate lending typically involves higher loan principal amounts and payments on loans, and repayment is dependent on successful operation and management of the properties. The value of the real estate securing these loans can be adversely affected by conditions in the real estate market or the economy. There is some common risk characteristics with owner-occupied commercial real estate loans and non-owner occupied commercial real estate loans. However, owner-occupied commercial real estate loans are generally considered to have a slightly lower risk profile as we typically have the guarantee of the owner-occupant and can underwrite risk using the complete financial information on the entity that occupies the property.
Residential Real Estate:
The majority of the Company’s residential real estate loans are secured by one-to-four family residences located in its primary market areas. The Company’s underwriting standards require that residential real estate loans maintained in the portfolio generally are owner-occupied and do not exceed 80% of the lower of appraised value at origination or cost of the underlying collateral. Terms of maturity typically range from 15 to 30 years. The Company generally sells its originated residential real estate loans in the secondary market and retains a smaller portion in its loan portfolio.
Real Estate Construction and Land Development:
The Company originates construction loans for residential and for commercial and multifamily properties. The residential construction loans generally include construction of custom single-family homes whereby the home buyer is the
borrower. The Company also provides financing to builders for the construction of pre-sold residential homes and, in selected cases, to builders for the construction of speculative single-family residential property. Substantially all construction loans are short-term in nature and priced with variable rates of interest. Construction lending can involve a higher level of risk than other types of lending because funds are advanced partially based upon the value of the project, which is uncertain prior to the project’s completion. Because of the uncertainties inherent in estimating construction costs as well as the market value of a completed project and the effects of governmental regulation of real property, the Company’s estimates with regard to the total funds required to complete a project and the related loan-to-value ratio may vary from actual results. As a result, construction loans often involve the disbursement of substantial funds with repayment dependent, in part, on the success of the ultimate project and the ability of the borrower to sell or lease the property or refinance the indebtedness. If the Company’s estimate of the value of a project at completion proves to be overstated, it may have inadequate security for repayment of the loan and may incur a loss if the borrower does not repay the loan. Sources of repayment for these types of loans may be pre-committed permanent loans from approved long-term lenders, sales of developed property or an interim loan commitment from the Company until permanent financing is obtained. These loans are closely monitored by on-site inspections and are considered to have higher risks than other real estate loans due to their ultimate repayment being dependent upon successful completion of the construction project, market interest rate changes, government regulation of real property, general economic conditions and the availability of long-term financing.
Consumer:
The Company originates consumer loans and lines of credit that are both secured and unsecured. The underwriting process for these loans ensures a qualifying primary and secondary source of repayment. Underwriting standards for home equity loans are significantly influenced by statutory requirements, which include, but are not limited to, a maximum loan-to-value percentage of 80%, collection remedies, the number of such loans a borrower can have at one time and documentation requirements. To monitor and manage consumer loan risk, policies and procedures are developed and modified, as needed. The majority of consumer loans are for relatively small amounts disbursed among many individual borrowers which reduces the credit risk for this type of loan. To further reduce the risk, trend reports are reviewed by management on a regular basis.
The Company also purchased indirect consumer loans. These indirect consumer loans were secured by new and used automobile and recreational vehicles and were originated indirectly by established and well-known dealers located in our market areas. In addition, the indirect loans purchased were made to only prime borrowers. The Company ceased indirect auto loan originations in March 2020.
(b) Concentrations of Credit
Most of the Company’s lending activity occurs within its primary market areas which are concentrated along the I-5 corridor from Whatcom County to Clark County in Washington State and Multnomah County and Washington County in Oregon, as well as other contiguous markets and represents a geographic concentration. In addition, approximately 88.2% and 82.7% of our loan portfolio at December 31, 2020 and December 31, 2019, respectively, consisted of commercial-type loans, including commercial business loans and commercial and multifamily real estate construction and land development loans. Commercial-type loans are generally viewed as having more inherent risk of default than residential real estate loans or other consumer loans. Also, the commercial-type loan balance per borrower is typically larger than that for residential real estate loans and other consumer loans, implying higher potential losses on an individual loan basis.
(c) Credit Quality Indicators
As part of the on-going monitoring of the credit quality of the Company’s loan portfolio, management tracks certain credit quality indicators including trends related to (i) the risk grade of the loans, (ii) the level of classified loans, (iii) net charge-offs, (iv) nonperforming loans and (v) the general economic conditions of the United States of America, and specifically the states of Washington and Oregon. The Company utilizes a risk grading matrix to assign a risk grade to each of its loans. Loans are graded on a scale of 1 to 10. A description of the general characteristics of the risk grades is as follows:
•Grades 1 to 5: These grades are considered “pass grade” ("Pass") and include loans with negligible to above average, but acceptable, risk. These borrowers generally have strong to acceptable capital levels and consistent earnings and debt service capacity. Loans with the higher grades within the “pass” category may include borrowers who are experiencing unusual operating difficulties, but have acceptable payment performance to date. Increased monitoring of financial information and/or collateral may be appropriate. Loans with this grade show no immediate loss exposure.
•Grade 6: This grade includes "Watch" loans and is considered a “pass grade.” The grade is intended to be utilized on a temporary basis for pass grade borrowers where a potentially significant risk-modifying action is anticipated in the near term.
•Grade 7: This grade includes "Special Mention" ("SM") loans and is intended to highlight loans deemed by management to have some elevated risks that deserve management's close attention. Loans with this grade show signs of deteriorating profits and capital and the borrower might not be strong enough to sustain a major setback. The borrower is typically higher than normally leveraged and outside support might be modest and likely illiquid. The loan is at risk of further credit decline unless active measures are taken to correct the situation.
•Grade 8: This grade includes “Substandard” ("SS") loans in accordance with regulatory guidelines, which the Company has determined have a high credit risk. These loans also have well-defined weaknesses and are characterized by the distinct possibility that the Bank will sustain some loss if the deficiencies are not corrected. The borrower may have shown serious negative trends in financial ratios and performance. Such loans may be dependent upon collateral liquidation, a secondary source of repayment or an event outside of the normal course of business. Loans with this grade are placed on accrual or nonaccrual status based on the Company’s accrual policy.
•Grade 9: This grade includes “Doubtful” loans in accordance with regulatory guidelines and the Company has determined these loans to have excessive credit risk. Such loans are placed on nonaccrual status and may be dependent upon collateral having a value that is difficult to determine or upon some near-term event which lacks certainty. Additionally, these loans generally have been partially charged off for the amount considered uncollectible.
•Grade 10: This grade includes “Loss” loans in accordance with regulatory guidelines and the Company has determined these loans have the highest risk of loss. Such loans are charged off or charged down when payment is acknowledged to be uncertain or when the timing or value of payments cannot be determined. “Loss” is not intended to imply that the loan or some portion of it will never be paid, nor does it in any way imply that there has been a forgiveness of debt.
Numerical loan grades for loans are established at the origination of the loan. Changes to loan grades are considered at the time new information about the performance of a loan becomes available, including the receipt of updated financial information from the borrower, results of annual term loan reviews performed by the Bank's credit department and scheduled loan reviews performed by the Bank’s internal Loan Review department. For consumer loans, the Bank follows the FDIC’s Uniform Retail Credit Classification and Account Management Policy for subsequent classification in the event of payment delinquencies or default. Typically, an individual loan grade will not be changed from the prior period unless there is a specific indication of credit deterioration or improvement. Credit deterioration is evidenced by delinquency, direct communications with the borrower, or other borrower information that becomes known to management. Credit improvements are evidenced by known facts regarding the borrower or the collateral property.
The loan grades relate to the likelihood of losses in that the higher the grade, the greater the loss potential. Loans with a pass grade may have some estimated inherent losses, but to a lesser extent than the other loan grades. The Special Mention loan grade is transitory in that the Company is waiting on additional information to determine the likelihood and extent of the potential loss. The likelihood of loss for Special Mention graded loans, however, is greater than Watch graded loans because there has been measurable credit deterioration. Loans with a Substandard grade are generally loans which the Company individually evaluates for an ACL on loans. For Doubtful and Loss graded loans, the Company is almost certain of the losses and the outstanding principal balances are generally charged off to the realizable value.
During the year ended December 31, 2020, the Bank did not automatically adversely classify credits that were affected by the COVID-19 pandemic or were granted a COVID Modification.
The following table presents the amortized cost of loans receivable by risk grade as of December 31, 2020:
| | | | | | | | | | | | | | | | | | | | | | | | | | | | | | | | | | | | | | | | | | | | | | | | | | | | | |
| Term Loans
Amortized Cost Basis by Origination Year | | Revolving Loans | | Revolving Loans Converted to Term Loans (1) | | Loans Receivable |
| 2020 | | 2019 | | 2018 | | 2017 | | 2016 | | Prior | | | |
| (In thousands) |
| Commercial business: |
| Commercial and industrial |
| Pass | $ | 118,971 | | | $ | 127,919 | | | $ | 70,766 | | | $ | 44,231 | | | $ | 37,658 | | | $ | 95,958 | | | $ | 121,440 | | | $ | 819 | | | $ | 617,762 | |
| SM | 14,430 | | | 9,162 | | | 10,878 | | | 4,171 | | | 5,700 | | | 3,579 | | | 11,790 | | | 814 | | | 60,524 | |
| SS | 2,199 | | | 11,835 | | | 3,416 | | | 9,348 | | | 1,052 | | | 7,651 | | | 15,484 | | | 3,827 | | | 54,812 | |
| | | | | | | | | | | | | | | | | |
| Total | 135,600 | | | 148,916 | | | 85,060 | | | 57,750 | | | 44,410 | | | 107,188 | | | 148,714 | | | 5,460 | | | 733,098 | |
| SBA PPP |
| Pass | 715,121 | | | — | | | — | | | — | | | — | | | — | | | — | | | — | | | 715,121 | |
| | | | | | | | | | | | | | | | | |
| | | | | | | | | | | | | | | | | |
| | | | | | | | | | | | | | | | | |
| Total | 715,121 | | | — | | | — | | | — | | | — | | | — | | | — | | | — | | | 715,121 | |
| Owner-occupied CRE |
| Pass | 89,224 | | | 167,095 | | | 94,830 | | | 80,138 | | | 74,902 | | | 254,864 | | | — | | | — | | | 761,053 | |
| SM | 6,146 | | | 4,540 | | | 16,386 | | | 11,231 | | | 5,464 | | | 12,105 | | | — | | | — | | | 55,872 | |
| SS | — | | | — | | | 114 | | | 7,320 | | | 3,313 | | | 29,012 | | | — | | | — | | | 39,759 | |
| | | | | | | | | | | | | | | | | |
| Total | 95,370 | | | 171,635 | | | 111,330 | | | 98,689 | | | 83,679 | | | 295,981 | | | — | | | — | | | 856,684 | |
| | | | | | | | | | | | | | | | | | | | | | | | | | | | | | | | | | | | | | | | | | | | | | | | | | | | | |
| Term Loans
Amortized Cost Basis by Origination Year | | Revolving Loans | | Revolving Loans Converted to Term Loans (1) | | Loans Receivable |
| 2020 | | 2019 | | 2018 | | 2017 | | 2016 | | Prior | | | |
| (In thousands) |
| Non-owner occupied CRE |
| Pass | 197,548 | | | 173,153 | | | 148,830 | | | 172,438 | | | 240,614 | | | 406,817 | | | — | | | — | | | 1,339,400 | |
| SM | — | | | 1,979 | | | 357 | | | 2,448 | | | 6,210 | | | 3,539 | | | — | | | — | | | 14,533 | |
| SS | — | | | — | | | 3,623 | | | — | | | 35,455 | | | 17,292 | | | — | | | — | | | 56,370 | |
| | | | | | | | | | | | | | | | | |
| Total | 197,548 | | | 175,132 | | | 152,810 | | | 174,886 | | | 282,279 | | | 427,648 | | | — | | | — | | | 1,410,303 | |
| Total commercial business |
| Pass | 1,120,864 | | | 468,167 | | | 314,426 | | | 296,807 | | | 353,174 | | | 757,639 | | | 121,440 | | | 819 | | | 3,433,336 | |
| SM | 20,576 | | | 15,681 | | | 27,621 | | | 17,850 | | | 17,374 | | | 19,223 | | | 11,790 | | | 814 | | | 130,929 | |
| SS | 2,199 | | | 11,835 | | | 7,153 | | | 16,668 | | | 39,820 | | | 53,955 | | | 15,484 | | | 3,827 | | | 150,941 | |
| | | | | | | | | | | | | | | | | |
| Total | 1,143,639 | | | 495,683 | | | 349,200 | | | 331,325 | | | 410,368 | | | 830,817 | | | 148,714 | | | 5,460 | | | 3,715,206 | |
Residential real estate |
| Pass | 30,141 | | | 41,829 | | | 15,730 | | | 10,362 | | | 7,322 | | | 16,825 | | | — | | | — | | | 122,209 | |
| | | | | | | | | | | | | | | | | |
| SS | — | | | — | | | — | | | 59 | | | — | | | 488 | | | — | | | — | | | 547 | |
| | | | | | | | | | | | | | | | | |
| Total | 30,141 | | | 41,829 | | | 15,730 | | | 10,421 | | | 7,322 | | | 17,313 | | | — | | | — | | | 122,756 | |
| Real estate construction and land development: |
Residential |
| Pass | 33,801 | | | 36,697 | | | 2,725 | | | 1,097 | | | 971 | | | 1,042 | | | — | | | — | | | 76,333 | |
| | | | | | | | | | | | | | | | | |
| SS | — | | | — | | | — | | | 1,926 | | | — | | | — | | | — | | | — | | | 1,926 | |
| | | | | | | | | | | | | | | | | |
| Total | 33,801 | | | 36,697 | | | 2,725 | | | 3,023 | | | 971 | | | 1,042 | | | — | | | — | | | 78,259 | |
Commercial and multifamily |
| Pass | 27,423 | | | 151,020 | | | 38,682 | | | 5,660 | | | 689 | | | 1,407 | | | — | | | — | | | 224,881 | |
| SM | 67 | | | 1,011 | | | — | | | — | | | — | | | 29 | | | — | | | — | | | 1,107 | |
| SS | 572 | | | 450 | | | — | | | — | | | — | | | 444 | | | — | | | — | | | 1,466 | |
| | | | | | | | | | | | | | | | | |
| Total | 28,062 | | | 152,481 | | | 38,682 | | | 5,660 | | | 689 | | | 1,880 | | | — | | | — | | | 227,454 | |
| Total real estate construction and land development |
| Pass | 61,224 | | | 187,717 | | | 41,407 | | | 6,757 | | | 1,660 | | | 2,449 | | | — | | | — | | | 301,214 | |
| SM | 67 | | | 1,011 | | | — | | | — | | | — | | | 29 | | | — | | | — | | | 1,107 | |
| SS | 572 | | | 450 | | | — | | | 1,926 | | | — | | | 444 | | | — | | | — | | | 3,392 | |
| | | | | | | | | | | | | | | | | |
| Total | 61,863 | | | 189,178 | | | 41,407 | | | 8,683 | | | 1,660 | | | 2,922 | | | — | | | — | | | 305,713 | |
| Consumer |
| Pass | 43,742 | | | 77,083 | | | 53,195 | | | 30,559 | | | 13,443 | | | 15,453 | | | 87,547 | | | 315 | | | 321,337 | |
| | | | | | | | | | | | | | | | | |
| SS | 34 | | | 404 | | | 684 | | | 648 | | | 420 | | | 1,319 | | | 78 | | | 48 | | | 3,635 | |
| | | | | | | | | | | | | | | | | |
| Total | 43,776 | | | 77,487 | | | 53,879 | | | 31,207 | | | 13,863 | | | 16,772 | | | 87,625 | | | 363 | | | 324,972 | |
| Loans receivable |
| Pass | 1,255,971 | | | 774,796 | | | 424,758 | | | 344,485 | | | 375,599 | | | 792,366 | | | 208,987 | | | 1,134 | | | 4,178,096 | |
| SM | 20,643 | | | 16,692 | | | 27,621 | | | 17,850 | | | 17,374 | | | 19,252 | | | 11,790 | | | 814 | | | 132,036 | |
| SS | 2,805 | | | 12,689 | | | 7,837 | | | 19,301 | | | 40,240 | | | 56,206 | | | 15,562 | | | 3,875 | | | 158,515 | |
| | | | | | | | | | | | | | | | | |
| Total | $ | 1,279,419 | | | $ | 804,177 | | | $ | 460,216 | | | $ | 381,636 | | | $ | 433,213 | | | $ | 867,824 | | | $ | 236,339 | | | $ | 5,823 | | | $ | 4,468,647 | |
(1) Represents loans receivable balance at December 31, 2020 which was converted from a revolving loan to an amortizing loan during the year ended December 31, 2020.
The following table presents the amortized cost of loans receivable by credit quality indicator as of December 31, 2019 in accordance with disclosure requirements prior to CECL Adoption:
| | | | | | | | | | | | | | | | | | | | | | | | | | | | | |
| December 31, 2019 |
| Pass | | Special Mention | | Substandard | | Doubtful/Loss | | Total |
| (In thousands) |
| Commercial business: | | | | | | | | | |
| Commercial and industrial | $ | 771,559 | | | $ | 16,340 | | | $ | 64,321 | | | $ | — | | | $ | 852,220 | |
| Owner-occupied CRE | 765,411 | | | 24,659 | | | 15,164 | | | — | | | 805,234 | |
| Non-owner occupied CRE | 1,274,513 | | | 5,662 | | | 8,604 | | | — | | | 1,288,779 | |
| Total commercial business | 2,811,483 | | | 46,661 | | | 88,089 | | | — | | | 2,946,233 | |
Residential real estate | 130,818 | | | — | | | 842 | | | — | | | 131,660 | |
| Real estate construction and land development: | | | | | | | | | |
Residential | 101,973 | | | 1,516 | | | 807 | | | — | | | 104,296 | |
| Commercial and multifamily | 169,668 | | | 682 | | | — | | | — | | | 170,350 | |
| Total real estate construction and land development | 271,641 | | | 2,198 | | | 807 | | | — | | | 274,646 | |
| Consumer | 411,141 | | | — | | | 3,675 | | | 524 | | | 415,340 | |
| Loans receivable | $ | 3,625,083 | | | $ | 48,859 | | | $ | 93,413 | | | $ | 524 | | | $ | 3,767,879 | |
Potential problem loans are risk rated "Special Mention" or worse that are not classified as a performing TDR or nonaccrual loan and are not individually evaluated for credit loss, but which management is closely monitoring because the financial information of the borrower causes concern as to their ability to meet their loan repayment terms. Potential problem loans as of December 31, 2020 and December 31, 2019 were $182.3 million and $87.8 million, respectively.
(d) Nonaccrual Loans
The following table presents the amortized cost of nonaccrual loans for the dates indicated:
| | | | | | | | | | | | | | | | | | | | | | | |
| December 31, 2020 | | December 31,
2019 |
| Nonaccrual without ACL | | Nonaccrual with ACL | | Total Nonaccrual | | Nonaccrual (1) |
| (In thousands) |
| Commercial business: | | | | | | | |
| Commercial and industrial | $ | 22,039 | | | $ | 9,208 | | | $ | 31,247 | | | $ | 33,544 | |
| Owner-occupied CRE | 4,693 | | | 13,700 | | | 18,393 | | | 4,714 | |
| Non-owner occupied CRE | 3,424 | | | 3,722 | | | 7,146 | | | 6,062 | |
| Total commercial business | 30,156 | | | 26,630 | | | 56,786 | | | 44,320 | |
Residential real estate | 67 | | | 117 | | | 184 | | | 19 | |
| Real estate construction and land development: | | | | | | | |
| | | | | | | |
Commercial and multifamily | 572 | | | 450 | | | 1,022 | | | — | |
| | | | | | | |
| Consumer | 31 | | | 69 | | | 100 | | | 186 | |
| Total | $ | 30,826 | | | $ | 27,266 | | | $ | 58,092 | | | $ | 44,525 | |
(1) Presentation of December 31, 2019 balances is in accordance with disclosure requirements prior to CECL Adoption.
The following table presents the reversal of interest income on loans due to the write-off of accrued interest receivable upon the initial classification of loans as nonaccrual loans and the interest income recognized due to payment in full of previously classified nonaccrual loans during the following periods:
| | | | | | | | | | | | | | | | | | | | | | | |
| December 31, 2020 | | December 31, 2019 |
| Interest Income Reversed | | Interest Income Recognized | | Interest Income Reversed | | Interest Income Recognized |
| (In thousands) |
| Commercial business: | | | | | | | |
| Commercial and industrial | $ | (95) | | | $ | 434 | | | $ | (552) | | | $ | 147 | |
| Owner-occupied CRE | (238) | | | 89 | | | — | | | 228 | |
| Non-owner occupied CRE | (208) | | | 67 | | | (32) | | | 181 | |
| Total commercial business | (541) | | | 590 | | | (584) | | | 556 | |
Residential real estate | (2) | | | 2 | | | — | | | — | |
| Real estate construction and land development: | | | | | | | |
Residential | — | | | — | | | (3) | | | 33 | |
Commercial and multifamily | (11) | | | — | | | — | | | — | |
| Total real estate construction and land development | (11) | | | — | | | (3) | | | 33 | |
| Consumer | (1) | | | 47 | | | — | | | 6 | |
| Total | $ | (555) | | | $ | 639 | | | $ | (587) | | | $ | 595 | |
For the years ended December 31, 2020 and 2019, no interest income was recognized subsequent to a loan’s classification as nonaccrual, except as indicated in the tables above.
(e) Past due loans
The Company performs an aging analysis of past due loans using policies consistent with regulatory reporting requirements with categories of 30-89 days past due and 90 or more days past due. The amortized cost of past due loans as of December 31, 2020 were as follows:
| | | | | | | | | | | | | | | | | | | | | | | | | | | | | |
| December 31, 2020 |
| 30-89 Days | | 90 Days
or Greater | | Total Past
Due | | Current | | Loans Receivable |
| (In thousands) |
| Commercial business: | | | | | | | | | |
| Commercial and industrial | $ | 4,621 | | | $ | 8,082 | | | $ | 12,703 | | | $ | 720,395 | | | $ | 733,098 | |
| SBA PPP | — | | | — | | | — | | | 715,121 | | | 715,121 | |
| Owner-occupied CRE | 991 | | | 403 | | | 1,394 | | | 855,290 | | | 856,684 | |
| Non-owner occupied CRE | 412 | | | 1,970 | | | 2,382 | | | 1,407,921 | | | 1,410,303 | |
| Total commercial business | 6,024 | | | 10,455 | | | 16,479 | | | 3,698,727 | | | 3,715,206 | |
Residential real estate | 765 | | | 16 | | | 781 | | | 121,975 | | | 122,756 | |
| Real estate construction and land development: | | | | | | | | | |
Residential | — | | | — | | | — | | | 78,259 | | | 78,259 | |
Commercial and multifamily | 2,225 | | | — | | | 2,225 | | | 225,229 | | | 227,454 | |
| Total real estate construction and land development | 2,225 | | | — | | | 2,225 | | | 303,488 | | | 305,713 | |
| Consumer | 1,407 | | | 30 | | | 1,437 | | | 323,535 | | | 324,972 | |
| Total | $ | 10,421 | | | $ | 10,501 | | | $ | 20,922 | | | $ | 4,447,725 | | | $ | 4,468,647 | |
The following table presents the amortized cost of past due loans as of December 31, 2019 in accordance with disclosure requirements prior to CECL Adoption:
| | | | | | | | | | | | | | | | | | | | | | | | | | | | | | | | | | | | | | | | | |
| December 31, 2019 |
| 30-89 Days | | 90 Days or Greater | | Total Past
Due | | Current | | Total | | PCI Loans | | Loans Receivable |
| (In thousands) |
| Commercial business: | | | | | | | | | | | | | |
| Commercial and industrial | $ | 10,479 | | | $ | 6,772 | | | $ | 17,251 | | | $ | 832,601 | | | $ | 849,852 | | | $ | 2,368 | | | $ | 852,220 | |
| Owner-occupied CRE | 607 | | | 806 | | | 1,413 | | | 798,907 | | | 800,320 | | | 4,914 | | | 805,234 | |
| Non-owner occupied CRE | 554 | | | 1,843 | | | 2,397 | | | 1,280,891 | | | 1,283,288 | | | 5,491 | | | 1,288,779 | |
| Total commercial business | 11,640 | | | 9,421 | | | 21,061 | | | 2,912,399 | | | 2,933,460 | | | 12,773 | | | 2,946,233 | |
Residential real estate | 797 | | | — | | | 797 | | | 127,288 | | | 128,085 | | | 3,575 | | | 131,660 | |
| Real estate construction and land development: | | | | | | | | | | | | | |
Residential | 1,516 | | | — | | | 1,516 | | | 102,780 | | | 104,296 | | | — | | | 104,296 | |
Commercial and multifamily | — | | | — | | | — | | | 170,350 | | | 170,350 | | | — | | | 170,350 | |
| Total real estate construction and land development | 1,516 | | | — | | | 1,516 | | | 273,130 | | | 274,646 | | | — | | | 274,646 | |
| Consumer | 2,071 | | | — | | | 2,071 | | | 411,507 | | | 413,578 | | | 1,762 | | | 415,340 | |
| Total | $ | 16,024 | | | $ | 9,421 | | | $ | 25,445 | | | $ | 3,724,324 | | | $ | 3,749,769 | | | $ | 18,110 | | | $ | 3,767,879 | |
There were no loans 90 days or more past due that were still accruing interest as of December 31, 2020 or December 31, 2019.
(f) Collateral-dependent Loans
The type of collateral securing loans individually evaluated for credit losses and for which the repayment was expected to be provided substantially through the operation or sale of the collateral as of December 31, 2020 were as follows:
| | | | | | | | | | | | | | | | | | | | | | | | | | | | | | | | | | | |
| Loans receivable(1) |
| CRE | | Farmland | | Residential Real Estate | | Equipment or Accounts Receivable | | Other | | Total |
| (In thousands) |
| Commercial business: | | | | | | | | | | | |
| Commercial and industrial | $ | 1,893 | | | $ | 18,738 | | | $ | 584 | | | $ | 774 | | | $ | 631 | | | $ | 22,620 | |
| Owner-occupied CRE | 4,693 | | | — | | | — | | | — | | | — | | | 4,693 | |
| Non-owner occupied CRE | 3,424 | | | — | | | — | | | — | | | — | | | 3,424 | |
| Total commercial business | 10,010 | | | 18,738 | | | 584 | | | 774 | | | 631 | | | 30,737 | |
Residential real estate | — | | | — | | | 67 | | | — | | | — | | | 67 | |
| Real estate construction and land development: | | | | | | | | | | | |
| | | | | | | | | | | |
Commercial and multifamily | 572 | | | — | | | — | | | — | | | — | | | 572 | |
| | | | | | | | | | | |
| Consumer | — | | | — | | | 30 | | | — | | | — | | | 30 | |
| Total | $ | 10,582 | | | $ | 18,738 | | | $ | 681 | | | $ | 774 | | | $ | 631 | | | $ | 31,406 | |
(1) Balances represent the amortized cost of the loan. If multiple collateral sources secure the loan, the entire balance is presented in the primary collateral category, which generally represents the majority of the collateral balance.
There have been no significant changes to the collateral securing individually evaluated loans for credit losses and for which repayment was expected to be provided substantially through the operation or sale of the collateral during the year ended December 31, 2020, except changes due to payoffs and additions of loans to this classification.
Under the probable incurred loss methodology, including the ASC 310-30 methodology for PCI loans, comparative
disclosures of collateral-dependent loans as of December 31, 2019 are similar to the disclosures for impaired loans. Impaired loans include nonaccrual loans, performing TDR loans, and other loans with a specific valuation allowance, excluding PCI loans. The amortized cost of impaired loans as of December 31, 2019 is set forth in the following table:
| | | | | | | | | | | | | | | | | | | | | | | | | | | | | |
| December 31, 2019 |
| Amortized Cost With
No Specific
Valuation
Allowance | | Amortized Cost With
Specific
Valuation
Allowance | | Total
Amortized Cost | | Outstanding
Principal
Balance | | Related
Specific
Valuation
Allowance |
| (In thousands) |
| Commercial business: | | | | | | | | | |
| Commercial and industrial | $ | 30,179 | | | $ | 13,629 | | | $ | 43,808 | | | $ | 45,585 | | | $ | 1,372 | |
| Owner-occupied CRE | 3,921 | | | 2,415 | | | 6,336 | | | 6,764 | | | 426 | |
| Non-owner occupied CRE | 5,309 | | | 1,015 | | | 6,324 | | | 6,458 | | | 146 | |
| Total commercial business | 39,409 | | | 17,059 | | | 56,468 | | | 58,807 | | | 1,944 | |
Residential real estate | — | | | 215 | | | 215 | | | 223 | | | 56 | |
| Real estate construction and land development: | | | | | | | | | |
Residential | 237 | | | — | | | 237 | | | 237 | | | — | |
| | | | | | | | | |
| | | | | | | | | |
| Consumer | — | | | 561 | | | 561 | | | 570 | | | 143 | |
| Total | $ | 39,646 | | | $ | 17,835 | | | $ | 57,481 | | | $ | 59,837 | | | $ | 2,143 | |
The average amortized cost of impaired loans for the year ended December 31, 2019 and 2018 are set forth in the following table:
| | | | | | | | | | | |
| Year Ended December 31, |
| 2019 | | 2018 |
| (In thousands) |
| Commercial business: | | | |
| Commercial and industrial | $ | 31,905 | | | $ | 16,773 | |
| Owner-occupied CRE | 6,008 | | | 11,313 | |
| Non-owner occupied CRE | 7,751 | | | 9,463 | |
| Total commercial business | 45,664 | | | 37,549 | |
Residential real estate | 242 | | | 290 | |
| Real estate construction and land development: | | | |
Residential | 682 | | | 1,091 | |
Commercial and multifamily | — | | | 129 | |
| Total real estate construction and land development | 682 | | | 1,220 | |
| Consumer | 576 | | | 430 | |
| Total | $ | 47,164 | | | $ | 39,489 | |
(g) Troubled Debt Restructured Loans
The majority of the Bank’s TDR loans are a result of granting extensions of maturity on troubled credits which have already been adversely classified. The Bank grants such extensions to reassess the borrower’s financial status and to develop a plan for repayment. The second most prevalent concessions are certain modifications with extensions that also include interest rate reductions. Certain TDR loans were additionally re-amortized over a longer period of time. These modifications would all be considered a concession for a borrower that could not obtain similar financing terms from another source other than from the Bank.
The financial effects of each modification will vary based on the specific restructure. The Bank’s TDR loans are primarily fully amortizing term loans. If the interest rate is not adjusted and the modified terms are consistent with other similar credits being offered, the Bank may not experience any loss associated with the restructure. If, however, the restructure involves forbearance agreements or interest rate modifications, the Bank may not collect all the principal and interest based on the original contractual terms.
During the year ended December 31, 2020, the Company elected to apply the temporary relief under the CARES Act and related regulatory guidance to certain eligible short-term modifications and did not classify the modifications as TDRs for accounting or disclosure purposes. COVID Modifications whose payment deferral exceeded 180 days following the loans' initial modification were classified as TDR based on the Bank's internal policy.
The unfunded commitment to borrowers related to TDR loans was $2.6 million and $736,000 at December 31, 2020 and December 31, 2019, respectively.
For the years ended December 31, 2020, 2019 and 2018, the Bank recorded $1.8 million, $1.2 million, and $1.4 million respectively, of interest income related to performing TDR loans.
Loans that were modified as TDR loans are set forth in the following table for the periods indicated:
| | | | | | | | | | | | | | | | | | | | | | | | | | | | | | | | | | | |
| Year Ended December 31, |
| 2020 | | 2019 | | 2018 |
| Number of Contracts (2) | | Amortized Cost (1) (2) | | Number of Contracts (2) | | Amortized Cost (1) (2) | | Number of Contracts (2) | | Amortized Cost (1) (2) |
| (Dollars in thousands) |
| Commercial business: | | | | | | | | | | | |
| Commercial and industrial | 75 | | $ | 36,118 | | | 44 | | $ | 31,122 | | | 31 | | $ | 16,132 | |
| Owner-occupied CRE | 14 | | 19,326 | | | 4 | | 1,695 | | | 4 | | 2,521 | |
| Non-owner occupied CRE | 9 | | | 25,728 | | | 4 | | | 2,208 | | | 3 | | 2,944 | |
| Total commercial business | 98 | | 81,172 | | | 52 | | 35,025 | | | 38 | | 21,597 | |
Residential real estate | 1 | | 22 | | | — | | — | | | — | | — | |
| Real estate construction and land development: | | | | | | | | | | | |
Residential | 4 | | 1,926 | | | 1 | | 237 | | | 2 | | 665 | |
Commercial and multifamily | 1 | | | 450 | | | — | | | — | | | — | | | — | |
| Total real estate construction and land development | 5 | | | 2,376 | | | 1 | | | 237 | | | 2 | | | 665 | |
| Consumer | 48 | | 1,198 | | | 12 | | 157 | | | 13 | | 243 | |
| Total | 152 | | $ | 84,768 | | | 65 | | $ | 35,419 | | | 53 | | $ | 22,505 | |
(1)Number of contracts and amortized cost represent loans which have balances as of period end, net of subsequent payments after modifications. Certain modified loans may have been paid-down or charged-off during the years ended December 31, 2020, 2019 and 2018.
(2) As the Bank did not forgive any principal or interest balance as part of the loan modifications, the Bank’s amortized cost in each loan at the date of modification (pre-modification) did not change as a result of the modification (post-modification).
The increase in TDR loans during the year ended December 31, 2020 was due primarily to the impacts of the COVID-19 pandemic and the Bank's policy to classify COVID Modifications where the payment deferral period exceeded 180-days as a TDR. For non-COVID modifications, the concessions granted largely consisted of maturity extensions. The Bank typically grants shorter extension periods to continually monitor these TDR loans despite the fact that the extended date might not be the date the Bank expects sufficient cash flow from these borrowers to repay the debt. The Bank does not consider these modifications a subsequent default of a TDR as new loan terms, specifically new maturity dates, were granted. The Bank had a related ACL on loans that were modified as TDR loans of $7.5 million, $1.0 million, and $2.3 million at December 31, 2020, December 31, 2019 and December 31, 2018, respectively.
The following table presents loans that were modified in a troubled debt restructure and subsequently defaulted within twelve months from the modification date during the periods indicated:
| | | | | | | | | | | | | | | | | | | | | | | | | | | | | | | | | | | |
| Year Ended December 31, |
| 2020 | | 2019 | | 2018 |
| Number of Contracts (1) | | Amortized Cost (1) | | Number of Contracts (1) | | Amortized Cost (1) | | Number of Contracts (1) | | Amortized Cost (1) |
| (Dollars in thousands) |
| Commercial business: | | | | | | | | | | | |
| Commercial and industrial | 4 | | | $ | 2,136 | | | 13 | | | $ | 12,854 | | | 5 | | | $ | 1,890 | |
| Owner-occupied CRE | 2 | | | 1,369 | | | 3 | | | 1,142 | | | 1 | | | 65 | |
| Non-owner occupied CRE | 2 | | | 1,811 | | | 1 | | | 52 | | | — | | | — | |
| Total commercial business | 8 | | | 5,316 | | | 17 | | 14,048 | | | 6 | | | 1955 |
| | | | | | | | | | | | | | | | | | | | | | | | | | | | | | | | | | | |
| Year Ended December 31, |
| 2020 | | 2019 | | 2018 |
| Number of Contracts (1) | | Amortized Cost (1) | | Number of Contracts (1) | | Amortized Cost (1) | | Number of Contracts (1) | | Amortized Cost (1) |
| (Dollars in thousands) |
| | | | | | | | | | | |
| Real estate construction and land development: | | | | | | | | | | | |
Residential | — | | | — | | | — | | | — | | | 2 | | | 665 | |
| | | | | | | | | | | |
| | | | | | | | | | | |
| | | | | | | | | | | |
| Total | 8 | | $ | 5,316 | | | 17 | | $ | 14,048 | | | 8 | | | $ | 2,620 | |
(1)Number of contracts and amortized cost represent loans which have balances as of period end, net of subsequent payments after modifications. Certain modified loans may have been paid-down or charged-off during the years ended December 31, 2020, 2019 and 2018.
During the years ended December 31, 2020, 2019, and 2018, eight, 11 and seven TDR loans defaulted because each was past its modified maturity date and the borrower has not subsequently repaid the credits. The Bank chose not to extend further the maturity date on these loans. The remaining six and one TDR loan for the years ended December 31, 2019 and 2018, respectively, defaulted because the borrower was more than 90 days delinquent on their scheduled loan payments. The Bank had an ACL on loans for these TDR loans which defaulted during the related years of $229,000, $88,000, and $260,000 at December 31, 2020, 2019, and 2018.
(h) Purchased Credit Impaired Loans
Upon CECL Adoption, the Company transitioned PCI loans to PCD loans. The following table reflects the outstanding principal balance and amortized cost of PCI loans at December 31, 2019:
| | | | | | | | | | | |
| December 31, 2019 |
| Outstanding Principal | | Amortized Cost |
| (In thousands) |
| Commercial business: | | | |
| Commercial and industrial | $ | 4,439 | | | $ | 2,368 | |
| Owner-occupied CRE | 4,925 | | | 4,914 | |
| Non-owner occupied CRE | 7,028 | | | 5,491 | |
| Total commercial business | 16,392 | | | 12,773 | |
Residential real estate | 3,095 | | | 3,575 | |
| | | |
| | | |
| | | |
| | | |
| Consumer | 1,463 | | | 1,762 | |
| Total | $ | 20,950 | | | $ | 18,110 | |
On the acquisition dates, the amount by which the undiscounted expected cash flows of the PCI loans exceeded the estimated fair value of the loan was the “accretable yield.” The accretable yield was then measured at each financial reporting date and represented the difference between the remaining undiscounted expected cash flows and the current carrying value of the PCI loans. The following table summarizes the accretable yield on the PCI loans during the periods indicated:
| | | | | | | | | | | |
| Year Ended December 31, |
| 2019 | | 2018 |
| (In thousands) |
| Balance at the beginning of the year | $ | 9,493 | | | $ | 11,224 | |
| Accretion | (1,936) | | | (2,674) | |
| Disposal and other | (1,600) | | | (2,871) | |
| Reclassification from nonaccretable difference | 884 | | | 3,814 | |
| Balance at the end of the year | $ | 6,841 | | | $ | 9,493 | |
(i) Related Party Loans
In the ordinary course of business, the Company has granted loans to certain directors, executive officers and their affiliates. Activity in related party loans during the periods indicated was as follows:
| | | | | | | | | | | | | | | | | |
| Year Ended December 31, |
| 2020 | | 2019 | | 2018 |
| (In thousands) |
| Balance outstanding at the beginning of year | $ | 8,144 | | | $ | 8,367 | | | $ | 8,460 | |
| | | | | |
| Principal additions | 199 | | | — | | | 211 | |
| | | | | |
| Principal reductions | (649) | | | (223) | | | (304) | |
| Balance outstanding at the end of year | $ | 7,694 | | | $ | 8,144 | | | $ | 8,367 | |
All related party loans were performing in accordance with the underlying loan agreements as of December 31, 2020 and December 31, 2019. The Company had $545,000 and $557,000 of unfunded commitments to related parties as of December 31, 2020 and December 31, 2019, respectively. The Company did not have any borrowings from related parties at December 31, 2020 or December 31, 2019.
(j) Residential Real Estate Loan Sales
The Bank originates residential real estate loans; a portion of which are sold on the secondary market. The Bank does not retain servicing on loans sold in the secondary market. At December 31, 2020 and December 31, 2019, the balance of loans held for sale was $4.9 million and $5.5 million, respectively.
The following table presents information concerning the origination and sale of the Bank's residential real estate loans and the gains from their sale:
| | | | | | | | | | | | | | | | | |
| | Year Ended December 31, |
| | 2020 | | 2019 | | 2018 |
| | (In thousands) |
| Residential real estate: | | | | | |
Originated (1) | $ | 191,207 | | | $ | 150,030 | | | $ | 121,998 | |
| Sold | 137,580 | | | 68,238 | | | 76,834 | |
Gain on sale of loans, net (2) | 5,044 | | | 2,159 | | | 2,403 | |
(1) Includes loans originated for sale in the secondary market or for the Bank's loan portfolio.
(2) Excludes net gains on sales of SBA and other loans.
The Bank may additionally make commitments to fund residential real estate loans (interest rate locks) to be sold into the secondary market. The contractual amounts of commitments to sell and fund residential real estate loans at December 31, 2020 and December 31, 2019 were as follows:
| | | | | | | | | | | |
| | December 31, 2020 | | December 31, 2019 |
| | (In thousands) |
| Commitments to sell residential real estate loans | $ | 18,127 | | | $ | 8,815 | |
| Commitments to fund residential real estate loans (at interest rates approximating market rates) for portfolio or for sale: | | | |
| Fixed rate | 19,640 | | | 15,509 | |
| Variable or adjustable rate | 98 | | | 3,111 | |
| Total commitments to fund residential real estate loans | $ | 19,738 | | | $ | 18,620 | |
The fair values of freestanding derivatives related to the commitments to fund residential real estate loans and sell at locked interest rates were not significant at December 31, 2020 or December 31, 2019.
(k) Commercial Loan Sales, Servicing, and Commercial Servicing Asset
Details of loans serviced for others are as follows:
| | | | | | | | | | | |
| | December 31, 2020 | | December 31, 2019 |
| | (In thousands) |
| Loans serviced for others with participating interest, gross loan balance | $ | 32,131 | | | $ | 40,616 | |
Loans serviced for others with participating interest, participation balance owned by Bank (1) | 7,842 | | | 9,850 | |
(1) Included in the balance of loans receivable on the Consolidated Statements of Financial Condition.
The Company recognized $423,000, $532,000 and $506,000 of servicing income for the years ended December 31, 2020, 2019 and 2018, respectively.
The Company's servicing asset at December 31, 2020 and December 31, 2019 was $583,000 and $361,000, respectively. The activity and balances for the year ended December 31, 2018 were not significant.
Fair value for the annual impairment analysis at December 31, 2020 was determined using a discount rate of 10.0% and prepayment speeds ranging from 12.5% to 18.6%. Fair value for the annual impairment analysis at December 31, 2019 was determined using discount rates ranging from 10.0% to 12.8% and prepayment speeds from 11.5% to 19.7%. There was no valuation allowance on the Company's servicing asset as of December 31, 2020, December 31, 2019 and December 31, 2018.
(5)Allowance for Credit Losses on Loans
Effective January 1, 2020, the Bank adopted ASU 2016-13. CECL Adoption replaced the ALL with the ACL on loans and replaced the related provision for loan losses with the provision for credit losses on loans.
The baseline loss rates used to calculate the ACL on loans at January 1, 2020 utilized the Bank's average quarterly historical loss information from December 31, 2007 through December 31, 2019. The baseline loss rate for the ACL at December 31, 2020 used historical losses beginning December 31, 2012 through the balance sheet date. The Bank updated the historical loss period during the year ended December 31, 2020 as it believed the economic cycle has ended with the onset of the COVID-19 recession. The Bank believes the historic loss rates are viable inputs to the current expected credit loss methodology as the Bank's lending practice and business has remained relatively stable throughout the periods. While the Bank's assets have grown, the credit culture has stayed relatively consistent.
Prepayments included in the CECL model at January 1, 2020 were based on the 48-month rolling historical averages for each segment, which management believes is an accurate representation of future prepayment activity. There were no changes to this assumption during the year ended December 31, 2020.
The reasonable and supportable period used in the CECL model as of January 1, 2020 was four quarters and was increased to five quarters for the model as of December 31, 2020 to include the additional impact of certain macroeconomic factors with lagged periods. Management believes that forecasts beyond this five quarter time period tend to diverge in economic assumptions and may be less comparable to actual future events. As the length of the reasonable and supportable period increases, the degree of judgment involved in estimating the allowance will likely increase.
The Bank used a two-quarter reversion period in calculating the ACL as of January 1, 2020 and December 31, 2020 as it believes the historical loss information is relevant to the expected credit losses and recognizes the declining precision and increasing uncertainty of estimating credit losses in those periods beyond which it can make reasonable and supportable forecasts.
The macroeconomic forecast used in the CECL model as of January 1, 2020 predicted continued economic expansion with steady GDP growth and low unemployment rates, among other factors. The onset of the COVID-19 pandemic resulted in the identification of an economic recession during the second quarter of 2020 as evidenced by certain economic forecasts signaling prolonged, profound, and pervasive contraction in economic activities due to the COVID-19 pandemic. The GDP contracted and unemployment rates increased, amount other factors, during the year ended December 31, 2020. The macroeconomic forecast used in the CECL model as of December 31, 2020 reflected a slow recovery from the COVID-19 recession, modeled to last through the end of 2021. The macroeconomic forecast as of December 31, 2020 considered the COVID-19 vaccine progress as well as anticipated government stimulus plans; however, uncertainty remained over the time necessary to return the economy to pre-pandemic levels.
The ACL on loans at December 31, 2020 does not include a reserve for SBA PPP loans as these loans are fully guaranteed by the SBA.
A summary of the changes in the ACL on loans during the years ended December 31, 2020, December 31, 2019 and December 31, 2018 is as follows:
| | | | | | | | | | | | | | | | | |
| Year Ended December 31, |
| 2020 | | 2019 | | 2018 |
| (In thousands) |
| Balance at the beginning of the year | $ | 36,171 | | | $ | 35,042 | | | $ | 32,086 | |
| Impact of CECL Adoption | 1,822 | | | — | | | — | |
| Balance at the beginning of the year, as adjusted | 37,993 | | | 35,042 | | | 32,086 | |
| Charge-offs | (5,622) | | | (4,989) | | | (3,605) | |
| Recoveries of loans previously charged-off | 2,381 | | | 1,807 | | | 1,432 | |
| Provision for loan losses | 35,433 | | | 4,311 | | | 5,129 | |
| Balance at the end of the year | $ | 70,185 | | | $ | 36,171 | | | $ | 35,042 | |
The following table details the activity in the ACL on loans disaggregated by segment and class for the year ended December 31, 2020:
| | | | | | | | | | | | | | | | | | | | | | | | | | | | | | | | | | | | | | | | | |
| Beginning Balance | | Impact of CECL Adoption | | Beginning Balance,
as Adjusted | | Charge-offs | | Recoveries | | Provision for Credit Losses | | Ending Balance |
| (In thousands) |
| Commercial business: | | | | | | | | | | | | | |
| Commercial and industrial | $ | 11,739 | | | $ | (1,348) | | | $ | 10,391 | | | $ | (3,616) | | | $ | 1,513 | | | $ | 21,722 | | | $ | 30,010 | |
SBA PPP | — | | | — | | | $ | — | | | — | | | — | | | — | | | — | |
| Owner-occupied CRE | 4,512 | | | 452 | | | 4,964 | | | (135) | | | 17 | | | 4,640 | | | 9,486 | |
| Non-owner occupied CRE | 7,682 | | | (2,039) | | | 5,643 | | | — | | | — | | | 4,469 | | | 10,112 | |
| Total commercial business | 23,933 | | | (2,935) | | | 20,998 | | | (3,751) | | | 1,530 | | | 30,831 | | | 49,608 | |
Residential real estate | 1,458 | | | 1,471 | | | 2,929 | | | — | | | 3 | | | (1,341) | | | 1,591 | |
| Real estate construction and land development: | | | | | | | | | | | | | |
Residential | 1,455 | | | (571) | | | 884 | | | — | | | 278 | | | 789 | | | 1,951 | |
Commercial and multifamily | 1,605 | | | 7,240 | | | 8,845 | | | (417) | | | — | | | 2,713 | | | 11,141 | |
| Total real estate construction and land development | 3,060 | | | 6,669 | | | 9,729 | | | (417) | | | 278 | | | 3,502 | | | 13,092 | |
| Consumer | 6,821 | | | (2,484) | | | 4,337 | | | (1,454) | | | 570 | | | 2,441 | | | 5,894 | |
| Unallocated | 899 | | | (899) | | | — | | | — | | | — | | | — | | | — | |
| Total | $ | 36,171 | | | $ | 1,822 | | | $ | 37,993 | | | $ | (5,622) | | | $ | 2,381 | | | $ | 35,433 | | | $ | 70,185 | |
The Bank recognized net charge-offs of $3.2 million during the year ended December 31, 2020 primarily due to a commercial and industrial charge-off of $1.7 million related to issues surrounding control of the underlying loan collateral. The Bank determined it appropriate to charge-off this entire loan relationship balance and pursue an aggressive collection strategy. Net charge-offs also included two commercial and industrial loan relationships totaling $447,000 as a result of impacts from the COVID-19 pandemic, a partial charge-off of one commercial and multifamily real estate construction and land development loan totaling $417,000 as a result of cost overruns and delays in construction and small dollar net charge-offs on a large volume of consumer loans of $884,000. Net charge-offs were offset partially by the full recovery of a commercial and industrial agricultural lending relationship of $963,000 during the year ended December 31, 2020, which was charged-off during the year ended December 31, 2019.
The provision for credit losses on loans of $35.4 million for the year ended December 31, 2020 was necessary to build the allowance to account for the current and forecasted economic conditions amidst the COVID-19 pandemic, including the credit losses estimated on collectively and individually evaluated loans.
The following table details the activity in the ALL disaggregated by segment and class for the year ended December 31, 2019 under the incurred loss methodology, including the ASC 310-30 methodology for PCI loans:
| | | | | | | | | | | | | | | | | | | | | | | | | | | | | |
| Beginning Balance | | Charge-offs | | Recoveries | | Provision for Loan Losses | | Ending Balance |
| (In thousands) |
| Commercial business: | | | | | | | | | |
| Commercial and industrial | $ | 11,343 | | | $ | (2,692) | | | $ | 166 | | | $ | 2,922 | | | $ | 11,739 | |
| Owner-occupied CRE | 4,898 | | | — | | | 50 | | | (436) | | | 4,512 | |
| Non-owner occupied CRE | 7,470 | | | — | | | 441 | | | (229) | | | 7,682 | |
| Total commercial business | 23,711 | | | (2,692) | | | 657 | | | 2,257 | | | 23,933 | |
Residential real estate | 1,203 | | | (60) | | | — | | | 315 | | | 1,458 | |
| Real estate construction and land development: | | | | | | | | | |
Residential | 1,240 | | | (133) | | | 637 | | | (289) | | | 1,455 | |
Commercial and multifamily | 954 | | | — | | | — | | | 651 | | | 1,605 | |
| Total real estate construction and land development | 2,194 | | | (133) | | | 637 | | | 362 | | | 3,060 | |
| Consumer | 6,581 | | | (2,104) | | | 513 | | | 1,831 | | | 6,821 | |
| Unallocated | 1,353 | | | — | | | — | | | (454) | | | 899 | |
| Total | $ | 35,042 | | | $ | (4,989) | | | $ | 1,807 | | | $ | 4,311 | | | $ | 36,171 | |
The following table details the ALL disaggregated on the basis of the Company's impairment method as of December 31, 2019 under the incurred loss methodology, including the ASC 310-30 methodology for PCI loans:
| | | | | | | | | | | | | | | | | | | | | | | |
| Loans Individually Evaluated for Impairment | | Loans Collectively Evaluated for Impairment | | PCI Loans | | Total ALL |
| (In thousands) |
| Commercial business: | | | | | | | |
| Commercial and industrial | $ | 1,372 | | | $ | 9,772 | | | $ | 595 | | | $ | 11,739 | |
| Owner-occupied CRE | 426 | | | 3,558 | | | 528 | | | 4,512 | |
| Non-owner occupied CRE | 146 | | | 7,064 | | | 472 | | | 7,682 | |
| Total commercial business | 1,944 | | | 20,394 | | | 1,595 | | | 23,933 | |
Residential real estate | 56 | | | 1,316 | | | 86 | | | 1,458 | |
| Real estate construction and land development: | | | | | | | |
Residential | — | | | 1,296 | | | 159 | | | 1,455 | |
Commercial and multifamily | — | | | 1,527 | | | 78 | | | 1,605 | |
| Total real estate construction and land development | — | | | 2,823 | | | 237 | | | 3,060 | |
| Consumer | 143 | | | 6,327 | | | 351 | | | 6,821 | |
| Unallocated | | | 899 | | | | | 899 | |
| Total | $ | 2,143 | | | $ | 31,759 | | | $ | 2,269 | | | $ | 36,171 | |
The following table details the amortized cost of the loan receivables disaggregated on the basis of the Company’s impairment method as of December 31, 2019 under the incurred loss methodology, including the ASC 310-30 methodology for PCI loans:
| | | | | | | | | | | | | | | | | | | | | | | |
| Loans Individually Evaluated for Impairment | | Loans Collectively Evaluated for Impairment | | PCI Loans | | Loans Receivable |
| (In thousands) |
| Commercial business: | | | | | | | |
| Commercial and industrial | $ | 43,808 | | | $ | 806,044 | | | $ | 2,368 | | | $ | 852,220 | |
| Owner-occupied CRE | 6,336 | | | 793,984 | | | 4,914 | | | 805,234 | |
| Non-owner occupied CRE | 6,324 | | | 1,276,964 | | | 5,491 | | | 1,288,779 | |
| Total commercial business | 56,468 | | | 2,876,992 | | | 12,773 | | | 2,946,233 | |
Residential real estate | 215 | | | 127,870 | | | 3,575 | | | 131,660 | |
| Real estate construction and land development: | | | | | | | |
Residential | 237 | | | 104,059 | | | — | | | 104,296 | |
Commercial and multifamily | — | | | 170,350 | | | — | | | 170,350 | |
| Total real estate construction and land development | 237 | | | 274,409 | | | — | | | 274,646 | |
| Consumer | 561 | | | 413,017 | | | 1,762 | | | 415,340 | |
| Total | $ | 57,481 | | | $ | 3,692,288 | | | $ | 18,110 | | | $ | 3,767,879 | |
The following table details the activity in the ALL disaggregated by segment and class for the year ended December 31, 2018 under the incurred loss methodology, including the ASC 310-30 methodology for PCI loans:
| | | | | | | | | | | | | | | | | | | | | | | | | | | | | |
| Balance at Beginning of Year | | Charge-offs | | Recoveries | | Provision for Loan Losses | | Balance at End of Year |
| (In thousands) |
| Commercial business: | | | | | | | | | |
| Commercial and industrial | $ | 9,910 | | | $ | (1,250) | | | $ | 901 | | | $ | 1,782 | | | $ | 11,343 | |
| Owner-occupied CRE | 3,992 | | | (1) | | | 7 | | | 900 | | | 4,898 | |
| Non-owner occupied CRE | 8,097 | | | (149) | | | — | | | (478) | | | 7,470 | |
| Total commercial business | 21,999 | | | (1,400) | | | 908 | | | 2,204 | | | 23,711 | |
Residential real estate | 1,056 | | | (45) | | | — | | | 192 | | | 1,203 | |
| Real estate construction and land development: | | | | | | | | | |
Residential | 862 | | | — | | | 11 | | | 367 | | | 1,240 | |
Commercial and multifamily | 1,190 | | | — | | | — | | | (236) | | | 954 | |
| Total real estate construction and land development | 2,052 | | | — | | | 11 | | | 131 | | | 2,194 | |
| Consumer | 6,081 | | | (2,160) | | | 513 | | | 2,147 | | | 6,581 | |
| Unallocated | 898 | | | — | | | — | | | 455 | | | 1,353 | |
| Total | $ | 32,086 | | | $ | (3,605) | | | $ | 1,432 | | | $ | 5,129 | | | $ | 35,042 | |
(6)Other Real Estate Owned
Changes in other real estate owned during the periods indicated were as follows:
| | | | | | | | | | | | | | | | | |
| Year Ended December 31, |
| 2020 | | 2019 | | 2018 |
| (In thousands |
| Balance at the beginning of the year | $ | 841 | | | $ | 1,983 | | | $ | — | |
| Additions | 270 | | | — | | | 434 | |
| Additions from acquisitions | — | | | — | | | 1,796 | |
| Proceeds from dispositions | (1,290) | | | (864) | | | (198) | |
| Gain (loss) on sale, net | 179 | | | (227) | | | — | |
| Valuation adjustment | — | | | (51) | | | (49) | |
| Balance at the end of the year | $ | — | | | $ | 841 | | | $ | 1,983 | |
At December 31, 2020, there were no consumer mortgage loans secured by residential real estate properties (included in Loans receivable on the Consolidated Statements of Financial Position) for which formal foreclosure proceedings were in process.
(7)Premises and Equipment
A summary of premises and equipment is as follows:
| | | | | | | | | | | |
| | December 31, 2020 | | December 31, 2019 |
| | (In thousands) |
| Land | $ | 21,599 | | | $ | 22,003 | |
| Buildings and building improvements | 71,653 | | | 72,810 | |
| Furniture, fixtures and equipment | 26,341 | | | 26,354 | |
| Total premises and equipment | 119,593 | | | 121,167 | |
| Less: Accumulated depreciation | 34,141 | | | 33,279 | |
| Premises and equipment, net | $ | 85,452 | | | $ | 87,888 | |
Total depreciation expense on premises and equipment was $5.5 million, $4.7 million and $4.4 million for the years ended December 31, 2020, 2019 and 2018, respectively.
(8)Goodwill and Other Intangible Assets
(a) Goodwill
The Company’s goodwill represents the excess of the purchase price over the fair value of net assets acquired in the following mergers: Premier Commercial Bancorp on July 2, 2018; Puget Sound Bancorp on January 16, 2018; Washington Banking Company on May 1, 2014; Valley Community Bancshares on July 15, 2013; Western Washington Bancorp in 2006 and North Pacific Bank in 1998. The Company’s goodwill is assigned to the Bank and is evaluated for impairment at the Bank level (reporting unit).
The following table presents the change in goodwill for the periods indicated:
| | | | | | | | | | | | | | | | | |
| Year Ended December 31, |
| 2020 | | 2019 | | 2018 |
| (In thousands) |
| Balance at the beginning of the period | $ | 240,939 | | | $ | 240,939 | | | $ | 119,029 | |
Additions as a result of acquisitions (1) | — | | | — | | | 121,910 | |
| | | | | |
| Balance at the end of the period | $ | 240,939 | | | $ | 240,939 | | | $ | 240,939 | |
(1) See Note (2) Business Combinations
Due to the deteriorating financial market and economic conditions as a result of the COVID-19 pandemic, the Company determined a triggering event occurred prior to its annual assessment date and consequently engaged an independent third-party valuation specialist to assist management in performing a quantitative assessment of goodwill as of May 31, 2020. Based on the quantitative assessment, management estimated the fair value of the reporting unit by weighting results from the market approach and the income approach. Significant assumptions inherent in the valuation methodologies for goodwill were employed and included, but were not limited to, prospective financial information, growth rates, terminal value, discount rates, and comparable multiples from publicly traded companies in our industry. Based on this quantitative test, management determined that the fair value of the reporting unit more likely than not exceeded the carrying value.
The Company performed a qualitative assessment during its annual impairment test, and determined that it was more likely than not that the fair value of the reporting unit exceeded the carrying value, such that the Company's goodwill was not considered impaired at December 31, 2020. Similarly, no goodwill impairment charges were required, or recorded, for the years ended December 31, 2019 or 2018. Changes in the economic environment, operations of the reporting unit or other adverse events could result in future impairment charges which could have a material adverse impact on the Company’s operating results.
(b) Other Intangible Assets
Other intangible assets represent CDI acquired in business combinations. The useful life of the CDI was estimated to be ten years for the acquisitions of Premier Commercial Bancorp, Puget Sound Bancorp, Washington Banking Company, and Valley Community Bancshares.
The following table presents the change in other intangible assets for the periods indicated:
| | | | | | | | | | | | | | | | | |
| Year Ended December 31, |
| 2020 | | 2019 | | 2018 |
| (In thousands) |
| Balance at the beginning of the period | $ | 16,613 | | | $ | 20,614 | | | $ | 6,088 | |
Additions as a result of acquisitions (1) | — | | | — | | | 18,345 | |
| Amortization | (3,525) | | | (4,001) | | | (3,819) | |
| Balance at the end of the period | $ | 13,088 | | | $ | 16,613 | | | $ | 20,614 | |
(1) See Note (2) Business Combinations
The estimated aggregate amortization expense related to these intangible assets for future years is as follows:
| | | | | |
| | Year Ending December 31, |
| | (In thousands) |
| 2021 | $ | 3,111 | |
| 2022 | 2,750 | |
| 2023 | 2,435 | |
| 2024 | 1,640 | |
| 2025 | 1,173 | |
| Thereafter | 1,979 | |
| Total | $ | 13,088 | |
(9)Deposits
Deposits consisted of the following:
| | | | | | | | | | | | | | | | | | | | | | | |
| | December 31, 2020 | | December 31, 2019 |
| | Amount | | Percent | | Amount | | Percent |
| | (Dollars in thousands) |
| Noninterest demand deposits | $ | 1,980,531 | | | 35.4 | % | | $ | 1,446,502 | | | 31.6 | % |
| Interest bearing demand deposits | 1,716,123 | | | 30.7 | | | 1,348,817 | | | 29.4 | |
| Money market accounts | 962,983 | | | 17.2 | | | 753,684 | | | 16.4 | |
| Savings accounts | 538,819 | | | 9.6 | | | 509,095 | | | 11.2 | |
| Total non-maturity deposits | 5,198,456 | | | 92.9 | | | 4,058,098 | | | 88.6 | |
| Certificates of deposit | 399,534 | | | 7.1 | | | 524,578 | | | 11.4 | |
| Total deposits | $ | 5,597,990 | | | 100.0 | % | | $ | 4,582,676 | | | 100.0 | % |
Deposit accounts overdrawn and reclassified to Loans receivable were $187,000 and $425,000 as of December 31, 2020 and December 31, 2019. Accrued interest payable on deposits was $73,000 and $160,000 as of December 31, 2020 and December 31, 2019, respectively and is included in Accrued expenses and other liabilities in the Consolidated Statements of Financial Condition.
Interest expense, by category, was as follows:
| | | | | | | | | | | | | | | | | |
| | Year Ended December 31, |
| | 2020 | | 2019 | | 2018 |
| | (In thousands) |
| Interest bearing demand deposits | $ | 3,234 | | | $ | 3,940 | | | $ | 2,728 | |
| Money market accounts | 2,830 | | | 2,754 | | | 1,654 | |
| Savings accounts | 527 | | | 2,634 | | | 2,056 | |
| Certificates of deposit | 5,674 | | | 7,021 | | | 3,959 | |
| Total interest expense | $ | 12,265 | | | $ | 16,349 | | | $ | 10,397 | |
Scheduled maturities of certificates of deposit for future years are as follows:
| | | | | |
| | Year Ending December 31, |
| | (In thousands) |
| 2021 | $ | 325,686 | |
| 2022 | 39,821 | |
| 2023 | 21,822 | |
| 2024 | 7,550 | |
| 2025 | 4,625 | |
| Thereafter | 30 | |
| Total | $ | 399,534 | |
Certificates of deposit issued in denominations equal to or in excess of $250,000 totaled $123.1 million and $182.9 million as of December 31, 2020 and December 31, 2019, respectively.
Deposits received from related parties as of December 31, 2020 and December 31, 2019 totaled $6.3 million and $6.9 million, respectively.
(10)Junior Subordinated Debentures
As part of the acquisition of Washington Banking Company on May 1, 2014, the Company assumed trust preferred securities and junior subordinated debentures with a total fair value of $18.9 million at the merger date. At December 31, 2020 and December 31, 2019, the balance of the junior subordinated debentures, net of unaccreted discount, was $20.9 million and $20.6 million, respectively.
Washington Banking Master Trust, a Delaware statutory business trust, was a wholly owned subsidiary of the Washington Banking Company created for the exclusive purposes of issuing and selling capital securities and utilizing sale proceeds to acquire junior subordinated debentures issued by the Washington Banking Company. During 2007, the Trust issued $25.0 million of trust preferred securities with a 30-year maturity, callable after the fifth year. The trust preferred securities have a quarterly adjustable rate based upon the three-month LIBOR plus 1.56%. On the merger date, the Company acquired the Trust, which retained the Washington Banking Master Trust name, and assumed the performance and observance of the covenants under the indenture related to the trust preferred securities.
The adjustable rate of the trust preferred securities at December 31, 2020 and December 31, 2019 was 1.80% and 3.47%, respectively. The weighted average rate of the junior subordinated debentures for the years ended December 31, 2020, 2019 and 2018 was 4.29%, 6.55% and 6.27%, respectively. The weighted average rate includes the accretion of the discount established at the merger date which is amortized over the life of the trust preferred securities.
The junior subordinated debentures are the sole assets of the Trust and payments under the junior subordinated debentures are the sole revenues of the Trust. All of the common securities of the Trust are owned by the Company. Heritage has fully and unconditionally guaranteed the capital securities along with all obligations of the Trust under the trust agreements. For financial reporting purposes, the Company's investment in the Master Trust is accounted for under the equity method and is included in Prepaid expenses and other assets on the Consolidated Statements of Financial Condition. The junior subordinated debentures issued and guaranteed by the Company and held by the Master Trust are reflected as liabilities on the Consolidated Statements of Financial Condition.
(11)Securities Sold Under Agreement to Repurchase
The Company utilizes securities sold under agreement to repurchase with one day maturities as a supplement to funding sources. Securities sold under agreement to repurchase are secured by pledged investment securities available for sale. Under the securities sold under agreement to repurchase, the Company is required to maintain an aggregate market value of securities pledged greater than the balance of the securities sold under agreement to repurchase. The Company is required to pledge additional securities to cover any declines below the balance of the securities sold under agreement to repurchase. For additional information on the total value of investment securities pledged for securities sold under agreement to repurchase see Note (3) Investment Securities.
The following table presents the balance of the Company's securities sold under agreement to repurchase obligations by class of collateral pledged at the dates indicated:
| | | | | | | | | | | |
| December 31, 2020 | | December 31, 2019 |
| (In thousands) |
| | | |
| | | |
| Residential CMO and MBS | $ | 7,388 | | | $ | 8,452 | |
| Commercial CMO and MBS | 28,295 | | | 11,717 | |
| Total | $ | 35,683 | | | $ | 20,169 | |
(12)Other Borrowings
(a) FHLB
The FHLB functions as a member-owned cooperative providing credit for member financial institutions. Advances are made pursuant to several different programs. Each credit program has its own interest rate and range of maturities. Limitations on the amount of advances are based on a percentage of the Bank's assets or on the FHLB’s assessment of the institution’s creditworthiness. At December 31, 2020, the Bank maintained a credit facility with the FHLB with available borrowing capacity of $991.7 million. At December 31, 2020 and December 31, 2019 the Bank had no FHLB advances outstanding.
The following table sets forth the details of FHLB advances during and as of the years ended December 31, 2020 and 2019:
| | | | | | | | | | | |
| As of or For the Year Ended |
| December 31, 2020 | | December 31, 2019 |
| (In thousands) |
| Average balance during the year | $ | 1,466 | | | $ | 11,899 | |
| Maximum month-end balance during the year | $ | — | | | $ | 90,700 | |
| Weighted average rate during the year | 0.55 | % | | 2.57 | % |
| Weighted average rate at the end of year | n/a | | n/a |
Advances from the FHLB are collateralized by a blanket pledge on FHLB stock owned by the Bank, deposits at the FHLB, certain commercial and residential real estate loans, investment securities which are obligations of or guaranteed by the United States, or other assets. In accordance with the pledge agreement, the Company must maintain unencumbered collateral in an amount equal to varying percentages ranging from 100% to 160% of outstanding advances depending on the type of collateral.
(b) Federal Funds Purchased
The Bank maintains advance lines with Wells Fargo Bank, US Bank, The Independent Bankers Bank, Pacific Coast Bankers’ Bank, and JP Morgan Chase to purchase federal funds of up to $215.0 million as of December 31, 2020. The lines generally mature annually or are reviewed annually. As of December 31, 2020 and December 31, 2019, there were no federal funds purchased.
(c) Credit Facilities
The Bank maintains a credit facility with the Federal Reserve Bank with available borrowing capacity of $54.3 million as of December 31, 2020. There were no borrowings outstanding as of December 31, 2020 and December 31, 2019. Any advances on the credit facility would be secured by certain types of the Bank's loans receivable.
(d) PPPLF Facility
The Federal Reserve established the PPPLF under Section 13(3) of the Federal Reserve Act to bolster the effectiveness of the SBA's PPP. Under the PPPLF, the Bank had the option to pledge its SBA PPP loans as collateral at face value to obtain Federal Reserve Bank non-recourse loans. PPPLF advances were available to be obtained until December 31, 2020. As of and for the year ended December 31, 2020, although the Bank was approved to utilize the PPPLF, the Bank had not participated in it. See Note (25) Subsequent Events regarding the renewal of this facility subsequent to December 31, 2020.
(13)Leases
The Company's noncancelable operating lease agreements relate to certain banking offices, back-office operational facilities, office equipment, and sublease agreements. The majority of the leases contain renewal options and provisions for increases in rental rates based on an agreed upon index or predetermined escalation schedule. As of December 31, 2020 and December 31, 2019, the Company’s operating lease ROU asset was $18.0 million and $23.0 million, respectively, and the related operating lease ROU liability was $19.3 million and $24.2 million, respectively. The Company does not have any leases designated as finance leases.
The table below summarizes the net lease cost recognized during the periods presented:
| | | | | | | | | | | |
| Year Ended December 31, |
| 2020 | | 2019 |
| (In thousands) |
| Operating lease cost | $ | 4,717 | | | $ | 4,950 | |
| Short-term lease cost | 49 | | | 95 | |
| Variable lease cost | 967 | | | 781 | |
| Sublease income | (55) | | | (71) | |
| Total net lease cost | $ | 5,678 | | | $ | 5,755 | |
Comparative disclosure of rental expense of leased premises and equipment calculated under ASC 840 methodology was $6.1 million for the year ended December 31, 2018 and is included in Occupancy and equipment expense on the Consolidated Statements of Income.
The tables below summarize other information related to the Company's operating leases during the periods presented:
| | | | | | | | | | | |
| Year Ended December 31, |
| 2020 | | 2019 |
| (In thousands) |
| Operating cash used for amounts included in the measurement of lease liabilities | $ | 4,881 | | | $ | 4,858 | |
| ROU assets obtained in exchange for lease liabilities, excluding adoption impact | 1,265 | | | 1,505 | |
| | | | | | | | | | | |
| December 31,
2020 | | December 31,
2019 |
| Weighted average remaining lease term of operating leases, in years | 7.2 | | 8.1 |
| Weighted average discount rate of operating leases | 3.12 | % | | 3.27 | % |
The following table outlines lease payment obligations as of December 31, 2020 as outlined in the Company’s lease agreements for each of the next five years and thereafter in addition to a reconciliation to the Company’s ROU liability at the date indicated:
| | | | | |
| Year Ending December 31, |
| (In thousands) |
| 2021 | $ | 3,547 | |
| 2022 | 3,136 | |
| 2023 | 3,105 | |
| 2024 | 2,759 | |
| 2025 | 2,508 | |
| Thereafter | 6,611 | |
| Total lease payments | 21,666 | |
| Implied interest | (2,391) | |
| ROU liability | $ | 19,275 | |
During the year ended December 31, 2019, the Company entered into a $7.7 million lease agreement to renew, restructure and add additional leased space at one of its branch locations commencing on January 1, 2021. The lease agreement is not included in the lease payment obligations table above. The new agreement replaced a lease included in the table above that terminated on December 31, 2020.
(14)Employee Benefit Plans
(a) 401(k) Plan
The Company provides its eligible employees with a 401(k) plan ("Plan"). The Company funds certain Plan costs as incurred.
The Plan includes the Company’s salary savings 401(k) plan for its employees. All employees hired may participate in the Plan the first of the month following employment or concurrent to their hire date if starting the first of the month. Participants may contribute a portion of their salary, which is matched by the Company at 50%, not to be greater than 3% of eligible compensation, up to Internal Revenue Service limits. All participants are 100% vested in all accounts at all times. Employer matching contributions for the years ended December 31, 2020, 2019 and 2018 were $1.7 million, $1.6 million and $1.4 million, respectively.
The Plan may make profit sharing and discretionary contributions which are completely discretionary. Participants are eligible for-profit sharing contributions upon credit of 1,000 hours of service during the plan year, the attainment of 18 years of age, and employment on the last day of the year. Employees are 100% vested in profit sharing contributions at all times. For the years ended December 31, 2020, 2019 and 2018, the Company made no employer profit sharing contributions.
(b) Employment Agreements
The Company has entered into contracts with certain senior officers that provide benefits under certain conditions following termination without cause or following a change in control of the Company.
(c) Deferred Compensation Plan
The Company has a Deferred Compensation Plan, which provides its directors and select executive officers with the opportunity to defer current compensation. Under the Deferred Compensation Plan, participants are permitted to elect to defer compensation and the Company has the discretion to make additional contributions on behalf of any participant based on a number of factors.
The following table presents a summary of the changes in the Deferred Compensation Plan during the periods indicated:
| | | | | | | | | | | | | | | | | |
| Year Ended December 31, |
| 2020 | | 2019 | | 2018 |
| (In thousands) |
| Balance outstanding at the beginning of the year | $ | 4,244 | | | $ | 3,654 | | | $ | 2,844 | |
| Employer contributions | 207 | | | 443 | | | 713 | |
| Interest credited | 128 | | | 147 | | | 97 | |
| Benefits Paid | (478) | | | — | | | — | |
| Balance outstanding at the end of the year | $ | 4,101 | | | $ | 4,244 | | | $ | 3,654 | |
(d) Split-Dollar Life Insurance Benefit Plan
In conjunction with the Washington Banking Merger, the Company assumed the split-dollar life insurance benefit plan previously maintained by Washington Banking. Life insurance policies are maintained for current or former officers of the Bank or former Washington Banking officers that are subject to split-dollar life insurance agreements, which continue after the participant's employment and retirement. All participants are fully vested in their split-dollar life insurance benefits. The accrued benefit liability for the split-dollar life insurance agreements represents the present value of the future death benefits payable to the participants' beneficiaries.
The split-dollar life insurance projected benefit obligation is included in Accrued expenses and other liabilities on the Consolidated Statements of Financial Condition. As of December 31, 2020 and December 31, 2019, the carrying value of the obligation was $165,000 and $200,000, respectively.
(e) Salary Continuation Plan
In conjunction with the Premier Merger in 2018, the Company assumed an unfunded deferred compensation plan for select former Premier Commercial executive officers, some of which are current Heritage officers. Under this salary continuation plan, the Company will pay each participant, or their beneficiary, specified benefits over specified periods beginning with the individual's termination of service due to retirement subject to early termination provisions. A liability is accrued for this obligation and is included in Accrued expenses and other liabilities on the Consolidated Statements of Financial Condition. The following table presents a summary of the changes in the salary continuation plan during the periods indicated:
| | | | | | | | | | | | | | | | | |
| Year Ended December 31, |
| 2020 | | 2019 | | 2018 |
| (In thousands) |
| Obligation, at the beginning of the year | $ | 4,334 | | | $ | 4,600 | | | $ | — | |
| Balance acquired in Premier Merger | — | | | — | | | 4,718 | |
| Benefits paid | (460) | | | (554) | | | (529) | |
| Expenses incurred | 288 | | | 288 | | | 411 | |
| Obligation, at the end of the year | $ | 4,162 | | | $ | 4,334 | | | $ | 4,600 | |
(15)Commitments and Contingencies
(a) Commitments to Extend Credit
In the ordinary course of business, the Company may enter into various types of transactions that include commitments to extend credit that are not included in its Consolidated Financial Statements. The Bank applies the same credit standards to these commitments as it uses in all its lending activities and has included these commitments in its lending risk evaluations. The majority of the commitments presented below are variable rate. Loan commitments can be either revolving or non-revolving. The Bank’s exposure to credit and market risk under commitments to extend credit is represented by the amount of these commitments.
The following table presents outstanding commitments to extend credit, including letters of credit, at the dates indicated:
| | | | | | | | | | | |
| | December 31, 2020 | | December 31, 2019 |
| | (In thousands) |
| Commercial business: | | | |
| Commercial and industrial | $ | 640,018 | | | $ | 584,287 | |
| Owner-occupied CRE | 3,488 | | | 17,193 | |
| Non-owner occupied CRE | 18,396 | | | 35,573 | |
| Total commercial business | 661,902 | | | 637,053 | |
| | | |
| Real estate construction and land development: | | | |
| Residential | 52,453 | | | 75,066 | |
Commercial and multifamily | 127,821 | | | 230,343 | |
| Total real estate construction and land development | 180,274 | | | 305,409 | |
| Consumer | 263,249 | | | 269,898 | |
| Total outstanding commitments | $ | 1,105,425 | | | $ | 1,212,360 | |
Upon CECL adoption, as described in Note (1) Description of Business, Basis of Presentation, Significant Accounting Policies and Recently Issued Accounting Pronouncements, the Company recorded an increase in the beginning ACL on unfunded commitments of $3.7 million, representing the change in methodology from an estimate of incurred losses at the balance sheet date, with an estimated probability of funding, to an estimate of credit losses on future utilization over the entire contractual period.
The following table details the activity in the ACL on unfunded commitments during the periods indicated:
| | | | | | | | | | | | | | | | | |
| Year Ended December 31, |
| 2020 | | 2019 | | 2018 |
| (In thousands) |
| Balance, beginning of period | $ | 306 | | | $ | 306 | | | $ | 170 | |
| Impact of CECL Adoption | 3,702 | | | — | | | — | |
| Adjusted balance, beginning of period | 4,008 | | | 306 | | | 170 | |
| Provision for credit losses on unfunded commitments | 673 | | | — | | | 136 | |
| Balance, end of period | $ | 4,681 | | | $ | 306 | | | $ | 306 | |
(b) Variable Interests - Low Income Housing Tax Credit Investments
The carrying values of investments in unconsolidated LIHTCs were $96.4 million and $92.7 million as of December 31, 2020 and December 31, 2019, respectively. During the years ended December 31, 2020, 2019 and 2018 the Company recognized tax benefits of $7.5 million, $5.7 million and $2.4 million, respectively, and proportional amortization of $6.5 million, $5.0 million and $3.1 million, respectively.
Total unfunded contingent commitments related to the Company’s LIHTC investments totaled $53.8 million and $50.7 million at December 31, 2020 and December 31, 2019, respectively. The Company expects to fund LIHTC commitments of $37.9 million during the year ended December 31, 2021 and $9.7 million during the year ended December 31, 2022, with the remaining commitments of $6.2 million funded by December 31, 2034. There were no impairment losses on the Company’s LIHTC investments during the years ended December 31, 2020, 2019 or 2018.
(c) Variable Interests - New Market Tax Credit Investments
The equity method balance of the NMTC investment was $25.2 million and $25.4 million at December 31, 2020 and December 31, 2019, respectively. The Company recognized related investment income of $694,000, $701,000 and $708,000 during the years ended December 31, 2020, 2019 and 2018, respectively. Gross tax credits related to the Company's certified development entities totaling $9.8 million were utilized during the seven year period ending December 31, 2020. There were no impairment losses on the Company’s NMTC investments during the years ended December 31, 2020, 2019 or 2018.
(16)Derivative Financial Instruments
The Company has entered into certain interest rate swap contracts that are not designated as hedging instruments. The following table presents the notional amounts and estimated fair values of interest rate derivative contracts outstanding at December 31, 2020 and December 31, 2019:
| | | | | | | | | | | | | | | | | | | | | | | |
| December 31, 2020 | | December 31, 2019 |
| Notional Amounts | | Estimated Fair Value | | Notional Amounts | | Estimated Fair Value |
| (In thousands) |
| Non-hedging interest rate derivatives | | | | | | | |
Interest rate swap asset (1) | 308,126 | | | $ | 25,740 | | | $ | 221,436 | | | $ | 8,318 | |
Interest rate swap liability (1) | 308,126 | | | (26,162) | | | 221,436 | | | (8,318) | |
(1) The estimated fair value of derivatives with customers was $25.4 million and $8.1 million as of December 31, 2020 and December 31, 2019, respectively. The estimated fair value of derivatives with third-parties was $(25.9) million and $(8.1) million as of December 31, 2020 and December 31, 2019, respectively.
Generally, the gains and losses of the interest rate derivatives offset due to the back-to-back nature of the contracts. However, as of December 31, 2020, the settlement values of the Bank's net derivative assets decreased due to the recognition of a credit valuation adjustment of $422,000 during the year ended December 31, 2020. A credit valuation adjustment was not recorded on the Bank's net derivative assets as of December 31, 2019.
Credit risk for derivatives with customers is concentrated within our primary market areas which are concentrated along the I-5 corridor from Whatcom County to Clark County in Washington State and Multnomah County and Washington County in Oregon, as well as other contiguous markets and represents a geographic concentration. Credit risk for derivatives with third-parties is concentrated among four well-known broker dealers.
(17)Stockholders’ Equity
(a) Earnings Per Common Share
The following table illustrates the calculation of weighted average shares used for earnings per common share computations at December 31, 2020, December 31, 2019 and December 31, 2018:
| | | | | | | | | | | | | | | | | |
| Year Ended December 31, |
| 2020 | | 2019 | | 2018 |
| (In thousands, except shares) |
| Net income: | | | | | |
| Net income | $ | 46,570 | | | $ | 67,557 | | | $ | 53,057 | |
Dividends and undistributed earnings allocated to participating securities (1) | (7) | | | (57) | | | (223) | |
| Net income allocated to common shareholders | $ | 46,563 | | | $ | 67,500 | | | $ | 52,834 | |
| Basic: | | | | | |
| Weighted average common shares outstanding | 36,018,627 | | | 36,789,244 | | | 35,281,408 | |
| Restricted stock awards | (4,182) | | | (31,014) | | | (87,405) | |
| Total basic weighted average common shares outstanding | 36,014,445 | | | 36,758,230 | | | 35,194,003 | |
| Diluted: | | | | | |
| Basic weighted average common shares outstanding | 36,014,445 | | | 36,758,230 | | | 35,194,003 | |
Effect of potentially dilutive common shares (2) | 155,621 | | | 227,536 | | | 177,587 | |
| Total diluted weighted average common shares outstanding | 36,170,066 | | | 36,985,766 | | | 35,371,590 | |
(1) Represents dividends paid and undistributed earnings allocated to unvested restricted stock awards.
(2) Represents the effect of the assumed exercise of stock options and vesting of restricted stock awards and units.
Potential dilutive shares are excluded from the computation of earnings per share if their effect is anti-dilutive. Anti-dilution occurs when the exercise price of a stock option or the unrecognized compensation cost per share of a restricted stock award exceeds the market price of the Company’s stock. For the years ended December 31, 2020 and December 31, 2019, there were 137,093 and 1,501 anti-dilutive shares outstanding, respectively. For the year ended December 31, 2018, there were no anti-dilutive shares outstanding.
(b) Dividends
The timing and amount of cash dividends paid on the Company's common stock depends on the Company’s earnings, capital requirements, financial condition and other relevant factors. Dividends on common stock from the Company depend substantially upon receipt of dividends from the Bank, which is the Company’s predominant source of income.
The following table summarizes the dividend activity during the most recent three year period:
| | | | | | | | | | | | | | | | | | | | | | | | | | |
| Declared | | Cash Dividend per Share | | Record Date | | Paid Date | | |
| | | | | | | | |
| | | | | | | | |
| | | | | | | | |
| | | | | | | | |
| | | | | | | | |
| | | | | | | | |
| | | | | | | | |
| | | | | | | | |
| | | | | | | | |
| | | | | | | | |
| | | | | | | | |
| | | | | | | | |
| | | | | | | | |
| | | | | | | | |
| | | | | | | | |
| | | | | | | | |
| | | | | | | | |
| | | | | | | | |
| | | | | | | | |
| | | | | | | | |
| | | | | | | | |
| | | | | | | | |
| | | | | | | | |
| | | | | | | | |
| | | | | | | | |
| | | | | | | | |
| | | | | | | | |
| | | | | | | | |
| | | | | | | | |
| | | | | | | | |
| January 24, 2018 | | $0.15 | | February 7, 2018 | | February 21, 2018 | | |
| April 25, 2018 | | $0.15 | | May 10, 2018 | | May 24, 2018 | | |
| July 24, 2018 | | $0.15 | | August 9, 2018 | | August 23, 2018 | | |
| October 24, 2018 | | $0.17 | | November 7, 2018 | | November 21, 2018 | | |
| October 24, 2018 | | $0.10 | | November 7, 2018 | | November 21, 2018 | | * |
| January 23, 2019 | | $0.18 | | February 7, 2019 | | February 21, 2019 | | |
| April 24, 2019 | | $0.18 | | May 8, 2019 | | May 22, 2019 | | |
| July 24, 2019 | | $0.19 | | August 8, 2019 | | August 22, 2019 | | |
| October 23, 2019 | | $0.19 | | November 7, 2019 | | November 21, 2019 | | |
| October 23, 2019 | | $0.10 | | November 7, 2019 | | November 21, 2019 | | * |
| January 22, 2020 | | $0.20 | | February 6, 2020 | | February 20, 2020 | | |
| April 29, 2020 | | $0.20 | | May 13, 2020 | | May 27, 2020 | | |
| July 22, 2020 | | $0.20 | | August 5, 2020 | | August 19, 2020 | | |
| October 21, 2020 | | $0.20 | | November 4, 2020 | | November 18, 2020 | | |
| | | | | | | | |
| | | | | | | | |
| | | | | | | | |
* Denotes a special dividend.
The FDIC and the Washington State Department of Financial Institutions, Division of Banks have the authority under their supervisory powers to prohibit the payment of dividends by the Bank to the Company. Additionally, current guidance from the Federal Reserve provides, among other things, that dividends per share on the Company’s common stock generally should not exceed earnings per share, measured over the previous four fiscal quarters. Current regulations allow the Company and the Bank to pay dividends on their common stock if the Company’s or the Bank’s regulatory capital would not be reduced below the statutory capital requirements set by the Federal Reserve and the FDIC.
(c) Stock Repurchase Program
The Company has had various stock repurchase programs since March 1999. On October 23, 2014. the Company's Board of Directors authorized the repurchase of up to 5% of the Company's outstanding common shares, or approximately 1,513,000 shares, under the eleventh stock repurchase plan. As of March 2020, all shares had been repurchased under this plan. On March 12, 2020 the Company's Board of Directors additionally authorized the repurchase of up to 5% of the Company's outstanding common shares, or 1,799,054 shares, under the twelfth stock repurchase plan. The number, timing and price of shares repurchased will depend on business and market conditions and other factors, including opportunities to deploy the Company's capital.
During the year ended December 31, 2020, the Company repurchased 639,922 shares under the eleventh stock repurchase plan at a weighted average price per share of $23.95 and repurchased 155,778 shares under the twelfth stock repurchase plan at a weighted average share price of $20.34, which is a total of 795,700 shares under both plans at a weighted average share price of $23.25.
During the year ended December 31, 2019, the Company repurchased 292,712 shares under the eleventh stock repurchase plan with a weighted average price per share of $26.50. No shares were repurchased under the eleventh stock repurchase plan during the year ended December 31, 2018.
In addition to the stock repurchases under a stock repurchase plan, the Company repurchases shares to pay withholding taxes on the vesting of restricted stock awards and units. The following table provides total shares repurchased to pay withholding taxes during the periods indicated:
| | | | | | | | | | | | | | | | | |
| Year Ended December 31, |
| 2020 | | 2019 | | 2018 |
Repurchased shares to pay withholding taxes (1) | 28,887 | | | 28,479 | | | 53,256 | |
| Stock repurchase to pay withholding taxes average share price | $ | 21.57 | | | $ | 30.83 | | | $ | 31.99 | |
(1) During the year ended December 31, 2018, the Company repurchased 26,741 shares related to the withholding taxes due on the accelerated vesting of the restricted stock units of Puget Sound which were converted to Heritage common stock shares with an average share price of $31.80 under the terms of the Puget Sound Merger. See Note (2) Business Combinations.
(d) Issuance of Common Stock
In conjunction with the Premier Merger effective on July 2, 2018 and the Puget Sound Merger effective on January 16, 2018, Heritage issued 2,848,579 and 4,112,258 shares, respectively, of the Company's common stock at the merger date share price of $34.85 and $31.80, respectively, for a fair value of $99.3 million and $130.8 million, respectively.
In addition, common stock was issued during the years ended December 31, 2020, 2019 and 2018 related to the exercise of stock options and issuance of restricted stock awards as further described in Note (19) Stock-Based Compensation.
(18)Fair Value Measurements
Fair value is the price that would be received to sell an asset or paid to transfer a liability (exit price) in the principal or most advantageous market for the asset or liability in an orderly transaction between market participants at the measurement date. There are three levels of inputs that may be used to measure fair values:
Level 1: Valuations for assets and liabilities traded in active exchange markets, or interest in open-end mutual funds that allow the Company to sell its ownership interest back to the fund at net asset value on a daily basis. Valuations are obtained from readily available pricing sources for market transactions involving identical assets, liabilities, or funds.
Level 2: Valuations for assets and liabilities traded in less active dealer or broker markets, such as quoted prices for similar assets or liabilities, quoted prices in markets that are not active, or valuations using methodologies with observable inputs.
Level 3: Valuations for assets and liabilities that are derived from other valuation methodologies, such as option pricing models, discounted cash flow models and similar techniques using unobservable inputs, and not based on market exchange, dealer, or broker traded transactions. Level 3 valuations incorporate certain assumptions and projections in determining the fair value assigned to such assets or liabilities.
(a) Recurring and Nonrecurring Basis
The Company used the following methods and significant assumptions to measure the fair value of certain assets on a recurring and nonrecurring basis:
Investment Securities Available for Sale:
The fair values of all investment securities are based upon the assumptions that market participants would use in pricing the security. If available, fair values of investment securities are determined by quoted market prices (Level 1). For investment securities where quoted market prices are not available, fair values are calculated based on market prices on similar securities (Level 2). For investment securities where quoted prices or market prices of similar securities are not available, fair values are calculated by using observable and unobservable inputs such as discounted cash flows or other market indicators (Level 3). Security valuations are obtained from third-party pricing services.
Collateral-Dependent Loans:
Collateral-dependent loans are identified as part of the calculation of the ACL on loans. The fair value used to measure credit loss for this type of loan is commonly based on recent real estate appraisals which are generally obtained at least every 18 months or earlier if there are changes to risk characteristics of the underlying loan. These appraisals may utilize a single valuation approach or a combination of approaches including comparable sales and the income approach. Adjustments are routinely made in the appraisal process by independent appraisers to adjust for differences between the comparable sales and income data available. Such adjustments are usually significant and typically result in a Level 3 classification of the inputs for determining fair value. Non-real estate collateral may be valued using an appraisal, net book value based on the borrower’s financial statements or aging reports, adjusted or discounted based on management’s historical knowledge, changes in market conditions from the time of the valuation and management’s expertise and knowledge of the customer and customer’s business (Level 3). Individually evaluated loans are analyzed for credit loss on a quarterly basis and the ACL on loans is adjusted as required based on the results.
Other Real Estate Owned:
Assets acquired through or instead of loan foreclosure are initially recorded at fair value less costs to sell when acquired, establishing a new cost basis. These assets are subsequently accounted for at lower of cost or fair value less costs to sell. Fair value is commonly based on recent real estate appraisals which are generally obtained at least every 18 months or earlier. These appraisals may utilize a single valuation approach or a combination of approaches including comparable sales and the income approach. Adjustments are routinely made in the appraisal process by independent appraisers to adjust for differences between the comparable sales and income data available. Such adjustments are usually significant and typically result in Level 3 classification of the inputs for determining fair value.
Appraisals for both collateral-dependent loans and other real estate owned are performed by certified general appraisers for commercial properties or certified residential appraisers for residential properties whose qualifications and licenses have been reviewed and verified by the Company. Once received, the Company reviews the assumptions and approaches utilized in the appraisal as well as the resulting fair value in comparison with independent data sources such as recent market data or industry-wide statistics. On a quarterly basis, the Company compares the actual selling price of collateral that has been
liquidated to the most recent appraised value to determine what additional adjustment should be made to the appraisal value to arrive at fair value.
Derivative Financial Instruments:
The Company obtains broker or dealer quotes to value its interest rate derivative contracts, which use valuation models using observable market data as of the measurement date (Level 2), and incorporates credit valuation adjustments to reflect nonperformance risk in the measurement of fair value (Level 3). Although the Bank has determined that the majority of the inputs used to value its interest rate swap derivatives fall within Level 2 of the fair value hierarchy, the credit valuation adjustments associated with its derivatives utilize Level 3 inputs, such as borrower risk ratings, to evaluate the likelihood of default by itself and its counterparties. As of December 31, 2020, the Bank assessed the significance of the impact of the credit valuation adjustment on the overall valuation of its interest rate swap derivatives and determined that the credit valuation adjustment was not significant to the overall valuation of its interest rate swap derivatives. As a result, the Bank has classified its interest rate swap derivative valuations in Level 2 of the fair value hierarchy. The Bank did not recognize a credit valuation adjustment in the valuation of its interest rate swap derivatives as of December 31, 2019; therefore, the interest rate swap derivatives are also classified in Level 2 of the fair value hierarchy for the comparative period end.
Branches held for sale:
Branches held for sale are recorded at fair value less costs to sell when transferred from Premises and equipment, net to Prepaid expenses and other assets on the Consolidated Statements of Financial Condition with any valuation adjustment recorded within Other noninterest expense on the Consolidated Statements of Income. The fair value of branches held for sale is determined based on a real estate appraisal or broker price opinion. Adjustments are routinely made in the appraisal and broker price opinion process by independent appraisers and commercial real estate brokers, respectively, to adjust for differences between the comparable sales and income data available. Such adjustments are usually significant and typically result in Level 3 classification of the inputs for determining fair value.
Recurring Basis
The following tables summarize the balances of assets and liabilities measured at fair value on a recurring basis at the dates indicated:
| | | | | | | | | | | | | | | | | | | | | | | |
| December 31, 2020 |
| Total | | Level 1 | | Level 2 | | Level 3 |
| (In thousands) |
| Assets | | | | | | | |
| Investment securities available for sale: | | | | | | | |
| U.S. government and agency securities | $ | 45,660 | | | $ | — | | | $ | 45,660 | | | $ | — | |
| Municipal securities | 209,968 | | | — | | | 209,968 | | | — | |
| Residential CMO and MBS | 201,872 | | | — | | | 201,872 | | | — | |
| Commercial CMO and MBS | 303,746 | | | — | | | 303,746 | | | — | |
| | | | | | | |
| Corporate obligations | 11,096 | | | — | | | 11,096 | | | — | |
| Other asset-backed securities | 29,821 | | | | | 29,821 | | | — | |
| Total investment securities available for sale | 802,163 | | | — | | | 802,163 | | | — | |
| Equity security | 131 | | | 131 | | | — | | | — | |
| Derivative assets - interest rate swaps | 25,740 | | | — | | | 25,740 | | | — | |
| Liabilities | | | | | | | |
| Derivative liabilities - interest rate swaps | $ | 26,162 | | | $ | — | | | $ | 26,162 | | | $ | — | |
| | | | | | | | | | | | | | | | | | | | | | | |
| December 31, 2019 |
| Total | | Level 1 | | Level 2 | | Level 3 |
| (In thousands) |
| Assets | | | | | | | |
| Investment securities available for sale: | | | | | | | |
| U.S. government and agency securities | $ | 105,223 | | | $ | — | | | $ | 105,223 | | | $ | — | |
| Municipal securities | 133,014 | | | — | | | 133,014 | | | — | |
| Residential CMO and MBS | 339,608 | | | — | | | 339,608 | | | — | |
| Commercial CMO and MBS | 327,095 | | | — | | | 327,095 | | | — | |
| | | | | | | |
| Corporate obligations | 24,194 | | | — | | | 24,194 | | | — | |
| Other asset-backed securities | 23,178 | | | — | | | 23,178 | | | — | |
| Total investment securities available for sale | 952,312 | | | — | | | 952,312 | | | — | |
| Equity security | 148 | | | 148 | | | — | | | — | |
| Derivative assets - interest rate swaps | 8,318 | | | — | | | 8,318 | | | — | |
| Liabilities | | | | | | | |
| Derivative liabilities - interest rate swaps | $ | 8,318 | | | $ | — | | | $ | 8,318 | | | $ | — | |
Nonrecurring Basis
The Company may be required to measure certain financial assets and liabilities at fair value on a nonrecurring basis. These adjustments to fair value usually result from application of lower-of-cost-or-market accounting or write-downs of individual assets.
The following tables below represent assets measured at fair value on a nonrecurring basis at the dates indicated:
| | | | | | | | | | | | | | | | | | | | | | | | | | | | | | | |
| Basis(1) | | Fair Value at December 31, 2020 | | |
| Total | | Level 1 | | Level 2 | | Level 3 | | |
| (In thousands) |
| Collateral-dependent loans: | | | | | | | | | | | |
| Commercial business: | | | | | | | | | | | |
| Commercial and industrial | $ | 1,305 | | | $ | 1,289 | | | $ | — | | | $ | — | | | $ | 1,289 | | | |
| | | | | | | | | | | |
| | | | | | | | | | | |
| | | | | | | | | | | |
| | | | | | | | | | | |
| | | | | | | | | | | |
| | | | | | | | | | | |
| | | | | | | | | | | |
| | | | | | | | | | | |
| | | | | | | | | | | |
| | | | | | | | | | | |
| Prepaid expenses and other assets: | | | | | | | | | | | |
Branch held for sale (2) | 1,330 | | | 1,330 | | | — | | | — | | | 1,330 | | | |
| Total assets measured at fair value on a nonrecurring basis | $ | 2,635 | | | $ | 2,619 | | | $ | — | | | $ | — | | | $ | 2,619 | | | |
(1)Basis represents the outstanding principal balance of collateral-dependent loans and the carrying value of the branch held for sale.
(2) In October 2020, one branch was reclassified as held for sale in accordance with ASC 360-10. As part of the transfer, the branch was written down to its net realizable value at that time.
| | | | | | | | | | | | | | | | | | | | | | | | | | | | | | | |
| Basis(1) | | Fair Value at December 31, 2019 | | |
| Total | | Level 1 | | Level 2 | | Level 3 | | |
| (In thousands) |
| Impaired loans: | | | | | | | | | | | |
| Commercial business: | | | | | | | | | | | |
| Commercial and industrial | $ | 4,111 | | | $ | 3,380 | | | $ | — | | | $ | — | | | $ | 3,380 | | | |
| | | | | | | | | | | |
| | | | | | | | | | | |
| | | | | | | | | | | |
| | | | | | | | | | | |
| | | | | | | | | | | |
| | | | | | | | | | | |
| | | | | | | | | | | |
| | | | | | | | | | | |
| | | | | | | | | | | |
| | | | | | | | | | | |
| Total assets measured at fair value on a nonrecurring basis | $ | 4,111 | | | $ | 3,380 | | | $ | — | | | $ | — | | | $ | 3,380 | | | |
(1)Basis represents the outstanding principal balance of impaired loans.
The following table represents the net realized losses (gains) recorded in earnings resulting from nonrecurring fair value adjustments during the periods indicated:
| | | | | | | | | | | | | | | | | |
| Year ended December 31, |
| 2020 | | 2019 | | 2018 |
| (In thousands) |
| Collateral-dependent loans: | | | | | |
| Commercial business: | | | | | |
| Commercial and industrial | $ | 8 | | | $ | 78 | | | $ | 10 | |
| | | | | |
| Non-owner occupied CRE | — | | | — | | | 150 | |
| Total commercial business | 8 | | | 78 | | | 160 | |
| | | | | |
| | | | | |
| | | | | |
| | | | | |
| | | | | |
| Consumer | — | | | — | | | 8 | |
| | | | | |
| Prepaid expenses and other assets: | | | | | |
| Branch held for sale | $ | 630 | | | $ | — | | | $ | — | |
| Net losses recorded in earnings resulting from nonrecurring fair value adjustments | $ | 638 | | | $ | 78 | | | $ | 168 | |
The following tables present quantitative information about Level 3 fair value measurements for financial instruments measured at fair value on a non-recurring basis at the dates indicated:
| | | | | | | | | | | | | | | | | | | | | | | |
| December 31, 2020 |
| Fair
Value | | Valuation
Technique(s) | | Unobservable Input(s) | | Range of Inputs; Weighted
Average |
| (Dollars in thousands) |
| Collateral-dependent loans | $ | 1,289 | | | Market approach | | Adjustment for differences between the comparable sales | | 0.6% - (40.1%); (24.1%) |
| Branch held for sale | 1,330 | | | Market approach | | Adjustment for differences between the comparable sales | | 140.7% - (40.3%); 33.2% |
| | | | | | | | | | | | | | | | | | | | | | | |
| December 31, 2019 |
| Fair
Value | | Valuation
Technique(s) | | Unobservable Input(s) | | Range of Inputs; Weighted
Average |
| (Dollars in thousands) |
| Impaired loans | $ | 3,380 | | | Market approach | | Adjustment for differences between the comparable sales | | 173.5% - (18.5%); 36.8% |
(b) Fair Value of Financial Instruments
Broadly traded markets do not exist for most of the Company’s financial instruments; therefore, the fair value calculations attempt to incorporate the effect of current market conditions at a specific time. These determinations are subjective in nature, involve uncertainties and matters of significant judgment and do not include tax ramifications; therefore, the results cannot be determined with precision, substantiated by comparison to independent markets and may not be realized in an actual sale or immediate settlement of the instruments. There may be inherent weaknesses in any calculation technique and changes in the underlying assumptions used, including discount rates and estimates of future cash flows, could significantly affect the results. For all of these reasons, the aggregation of the fair value calculations presented herein do not represent, and should not be construed to represent, the underlying value of the Company.
The following tables present the carrying value amount of the Company’s financial instruments and their corresponding estimated fair values at the dates indicated:
| | | | | | | | | | | | | | | | | | | | | | | | | | | | | |
| December 31, 2020 |
| Carrying
Value | | Fair Value | | Fair Value Measurements Using: |
| Level 1 | | Level 2 | | Level 3 |
| (In thousands) |
| Financial Assets: | | | | | | | | | |
| Cash and cash equivalents | $ | 743,322 | | | $ | 743,322 | | | $ | 743,322 | | | $ | — | | | $ | — | |
| | | | | | | | | | | | | | | | | | | | | | | | | | | | | |
| December 31, 2020 |
| Carrying
Value | | Fair Value | | Fair Value Measurements Using: |
| Level 1 | | Level 2 | | Level 3 |
| Investment securities available for sale | 802,163 | | | 802,163 | | | — | | | 802,163 | | | — | |
| Loans held for sale | 4,932 | | | 5,156 | | | — | | | — | | | 5,156 | |
| Loans receivable, net | 4,398,462 | | | 4,556,862 | | | — | | | — | | | 4,556,862 | |
| Accrued interest receivable | 19,418 | | | 19,418 | | | 2 | | | 3,648 | | | 15,768 | |
| Bank owned life insurance | 107,580 | | | 107,580 | | | 107,580 | | | — | | | — | |
| Derivative assets - interest rate swaps | 25,740 | | | 25,740 | | | — | | | 25,740 | | | — | |
| Equity security | 131 | | | 131 | | | 131 | | | — | | | — | |
| Financial Liabilities: | | | | | | | | | |
| Noninterest deposits, interest bearing demand deposits, money market accounts and savings accounts | $ | 5,198,456 | | | $ | 5,198,456 | | | $ | 5,198,456 | | | $ | — | | | $ | — | |
| Certificates of deposit | 399,534 | | | 402,071 | | | — | | | 402,701 | | | — | |
| | | | | | | | | |
| Securities sold under agreement to repurchase | 35,683 | | | 35,683 | | | 35,683 | | | — | | | — | |
| Junior subordinated debentures | 20,887 | | | 18,500 | | | — | | | — | | | 18,500 | |
| Accrued interest payable | 94 | | | 94 | | | 42 | | | 33 | | | 19 | |
| Derivative liabilities - interest rate swaps | 26,162 | | | 26,162 | | | — | | | 26,162 | | | — | |
| | | | | | | | | | | | | | | | | | | | | | | | | | | | | |
| December 31, 2019 |
| Carrying
Value | | Fair Value | | Fair Value Measurements Using: |
| | Level 1 | | Level 2 | | Level 3 |
| (In thousands) |
| Financial Assets: | | | | | | | | | |
| Cash and cash equivalents | $ | 228,568 | | | $ | 228,568 | | | $ | 228,568 | | | $ | — | | | $ | — | |
| Investment securities available for sale | 952,312 | | | 952,312 | | | — | | | 952,312 | | | — | |
| Loans held for sale | 5,533 | | | 5,704 | | | — | | | — | | | 5,704 | |
| Loans receivable, net | 3,731,708 | | | 3,791,557 | | | — | | | — | | | 3,791,557 | |
| Accrued interest receivable | 14,446 | | | 14,446 | | | 79 | | | 3,668 | | | 10,699 | |
| Bank owned life insurance | 103,616 | | | 103,616 | | | 103,616 | | | | | |
| Derivative assets - interest rate swaps | 8,318 | | | 8,318 | | | — | | | 8,318 | | | — | |
| Equity security | 148 | | | 148 | | | 148 | | | — | | | — | |
| Financial Liabilities: | | | | | | | | | |
| Noninterest deposits, interest bearing demand deposits, money market accounts and savings accounts | $ | 4,058,098 | | | $ | 4,058,098 | | | $ | 4,058,098 | | | $ | — | | | $ | — | |
| Certificates of deposit | 524,578 | | | 529,679 | | | — | | | 529,679 | | | — | |
| | | | | | | | | |
| Securities sold under agreement to repurchase | 20,169 | | | 20,169 | | | 20,169 | | | — | | | — | |
| Junior subordinated debentures | 20,595 | | | 20,000 | | | — | | | — | | | 20,000 | |
| Accrued interest payable | 199 | | | 199 | | | 95 | | | 64 | | | 40 | |
| Derivative liabilities - interest rate swaps | 8,318 | | | 8,318 | | | — | | | 8,318 | | | — | |
(19)Stock-Based Compensation
On July 24, 2014, the Company's shareholders approved the Equity Plan that provides for the issuance of 1,500,000 shares of the Company's common stock in the form of various types of stock-based compensation. The Company issues new shares of common stock to satisfy share option exercises and restricted stock award vests. As of December 31, 2020, shares remaining available for future issuance under the Equity Plan totaled 646,503.
(a) Stock Option Awards
Stock options generally vested ratably over three years and expired five years after they become exercisable or vested ratably over four years and expired ten years from date of grant. For the years ended December 31, 2020, 2019 and 2018, the Company did not recognize any compensation expense or related tax benefit related to stock options as all of the compensation expense related to the outstanding stock options had been previously recognized. The intrinsic value from options exercised during the years ended December 31, 2020, 2019 and 2018 was $61,000, $60,000 and $202,000, respectively. The cash proceeds from options exercised during the years ended December 31, 2020, 2019 and 2018 were $122,000, $58,000 and $132,000, respectively.
The following table summarizes the stock option activity during the periods indicated:
| | | | | | | | | | | |
| Shares | | Weighted-Average Exercise Price |
Outstanding at December 31, 2017 | 23,231 | | | $ | 14.21 | |
| Exercised | (9,842) | | | 13.45 | |
| Forfeited or expired | (831) | | | 14.77 | |
Outstanding at December 31, 2018 | 12,558 | | | 14.77 | |
| Exercised | (3,901) | | | 14.77 | |
| | | |
Outstanding at December 31, 2019 | 8,657 | | | 14.77 | |
| Exercised | (8,248) | | | 14.77 | |
| Forfeited or expired | (409) | | | 14.77 | |
Outstanding, vested and expected to vest and exercisable at December 31, 2020 | — | | | $ | — | |
(b) Restricted Stock Awards
Restricted stock awards granted generally had a four-year cliff vesting or four-year ratable vesting schedule. For the years ended December 31, 2020, 2019 and 2018, the Company recognized compensation expense related to restricted stock awards of $76,000, $440,000 and $907,000, respectively, and a related tax benefit of $17,000, $93,000 and $191,000, respectively. The vesting date fair value of restricted stock awards that vested during the years ended December 31, 2020, 2019 and 2018 was $442,000, $1.3 million and $2.2 million, respectively.
The following table summarizes the restricted stock award activity for the periods indicated
| | | | | | | | | | | |
| Shares | | Weighted-Average Grant Date Fair Value |
Nonvested at December 31, 2017 | 137,399 | | | $ | 17.00 | |
| | | |
| Vested | (67,877) | | | 16.74 | |
| Forfeited | (3,489) | | | 16.92 | |
Nonvested at December 31, 2018 | 66,033 | | | 17.28 | |
| | | |
| Vested | (43,148) | | | 17.07 | |
| Forfeited | (2,178) | | | 18.32 | |
Nonvested at December 31, 2019 | 20,707 | | | 17.59 | |
| | | |
| Vested | (20,707) | | | 17.59 | |
| | | |
Nonvested at December 31, 2020 | — | | | $ | — | |
(c) Restricted Stock Units
Restricted stock units generally vest ratably over three years and are subject to service conditions in accordance with each award agreement.
A category of restricted stock units called performance-based restricted stock units have a three-year cliff vesting schedule, participate in dividends and are additionally subject to performance-based vesting. The number of shares actually delivered pursuant to each performance-based restricted stock unit award agreement depends on the performance of the Company's Total Shareholder Return and Return on Average Assets over the performance period in relation to the performance of the common stock of a predetermined peer group. The conditions of the grants allow for an actual payout ranging between no payout and 150% of target. The payout level is calculated based on actual performance achieved during the performance period compared to a defined peer group. The fair value of each performance-based restricted stock unit was determined using a Monte Carlo simulation and will be recognized over the vesting period. The Monte-Carlo simulation model uses the same input assumptions as the Black-Scholes model; however, it also further incorporates into the fair value
determination the possibility that the market condition may not be satisfied. Compensation costs related to these awards are recognized regardless of whether the market condition is satisfied, provided that the requisite service has been provided.
The Company used the following assumptions to estimate the fair value of performance-based restricted share units granted for the periods indicated:
| | | | | | | | | | | | | | | | | |
| Year Ended December 31, |
| 2020 | | 2019 | | 2018 |
| Shares issued | 15,200 | | | 14,396 | | | 11,099 | |
| Expected Term in Years | 2.8 | | 2.8 | | 2.8 |
| Weighted-Average Risk Free Interest Rate | 1.14 | % | | 2.47 | % | | 2.39 | % |
| Weighted Average Fair Value | 23.50 | | | 30.06 | | | 27.69 | |
| Correlation coefficient | ABA NASDAQ Community Bank Index | | ABA NASDAQ Community Bank Index | | ABA NASDAQ Community Bank Index |
| Range of peer company volatilities | 18.1%-107.6% | | 19.9%-75.4% | | 19.0%-51.4% |
| Range of peer company correlation coefficients | 16.1%-90.2% | | 34.5%-90.7% | | 28.2%-94.3% |
| Heritage volatility | 23.2 | % | | 23.9 | % | | 22.3 | % |
| Heritage correlation coefficient | 80.5 | % | | 79.9 | % | | 76.4 | % |
Expected volatilities in the model were estimated using a historical period consistent with the performance period of approximately three years. The risk-free interest rate was based on the United States Treasury rate for a term commensurate with the expected life of the grant.
For the years ended December 31, 2020, 2019 and 2018, the Company recognized compensation expense related to restricted stock units of $3.5 million, $2.8 million, and $1.8 million respectively, and a related tax benefit of $757,000, $589,000, and $387,000, respectively. As of December 31, 2020, the total unrecognized compensation expense related to non-vested restricted stock units was $5.2 million and the related weighted-average period over which the compensation expense is expected to be recognized is approximately 2.3 years. The vesting date fair value of the restricted stock units that vested during the year ended December 31, 2020, 2019 and 2018 was $2.4 million, $2.0 million and $1.0 million respectively.
The following table summarizes the unit activity for the periods indicated:
| | | | | | | | | | | |
| Units | | Weighted-Average Grant Date Fair Value |
Nonvested at December 31, 2017 | 90,544 | | | $ | 25.31 | |
| Granted | 125,633 | | | 30.62 | |
| Vested | (32,375) | | | 25.44 | |
| Forfeited | (4,617) | | | 27.82 | |
Nonvested at December 31, 2018 | 179,185 | | | 28.94 | |
| Granted | 126,598 | | | 31.89 | |
| Vested | (64,173) | | | 29.25 | |
| Forfeited | (8,070) | | | 30.25 | |
Nonvested at December 31, 2019 | 233,540 | | | 30.41 | |
| Granted | 200,972 | | | 23.61 | |
| Vested | (109,853) | | | 29.21 | |
| Forfeited | (8,543) | | | 28.07 | |
Nonvested at December 31, 2020 | 316,116 | | | $ | 26.57 | |
(20)Cash Restrictions
The Company is required to maintain an average reserve balance with the Federal Reserve Bank or maintain such reserve balance in the form of cash. Effective March 24, 2020 the Federal Reserve lowered the reserve ratios on transaction accounts maintained at a depository institution to zero percent. There was no required reserve balance at December 31, 2020 and a required balance of $17.1 million at December 31, 2019 was met by holding cash and maintaining an average balance with the Federal Reserve Bank.
The Company had restricted cash included in Interest earning deposits on the Consolidated Statements of Financial Condition of $34.2 million and $15.8 million as of December 31, 2020 and December 31, 2019, respectively, relating to collateral required on interest rate swaps from third-parties as discussed in Note (16) Derivative Financial Instruments. The Company does not have a collateral requirement with customers.
(21)Income Taxes
Income tax expense is substantially due to Federal income taxes as the provision for the state of Oregon income taxes is insignificant and the state of Washington does not charge an income tax in lieu of a business and occupation tax. Income tax expense for the years ended December 31, 2020, 2019 and 2018 consisted of the following:
| | | | | | | | | | | | | | | | | |
| | Year Ended December 31, |
| | 2020 | | 2019 | | 2018 |
| | (In thousands) |
| Current tax expense | $ | 15,186 | | | $ | 12,504 | | | $ | 9,866 | |
| Deferred tax expense | (8,576) | | | 984 | | | 1,372 | |
| | | | | |
| Income tax expense | $ | 6,610 | | | $ | 13,488 | | | $ | 11,238 | |
The CARES Act, among other things, permitted net operating loss carryovers and carrybacks to offset 100% of taxable income for taxable years beginning before 2021. In addition, the CARES Act allowed net operating loss carrybacks incurred in 2018, 2019 and 2020 to be carried back to each of the five preceding taxable years to generate a refund of previously paid income taxes. During the year ended December 31, 2020, the Company recorded a tax benefit from net operating loss carryback related to prior acquisitions of $967,000.
The effective tax rate was 12.4% for the year ended December 31, 2020 compared to an effective tax rate of 16.6% and 17.5% for the years ended December 31, 2019 and 2018, respectively. The decrease in the effective tax rate during the year ended December 31, 2020 was due primarily to the tax benefit of the recognized net operating loss carryback mentioned above. A reconciliation of the Company's effective income tax rate with the Federal statutory income tax rate of 21% for the years ended December 31, 2020, 2019 and 2018 is as follows:
| | | | | | | | | | | | | | | | | |
| | Year Ended December 31, |
| | 2020 | | 2019 | | 2018 |
| | (In thousands) |
| Income tax expense at Federal statutory rate | $ | 11,168 | | | $ | 17,020 | | | $ | 13,710 | |
| Tax-exempt instruments | (1,785) | | | (1,745) | | | (1,879) | |
| Non-deductible acquisition costs | — | | | — | | | 336 | |
Federal tax credits and other benefits (1) | (1,928) | | | (1,961) | | | (515) | |
| Effects of BOLI | (827) | | | (368) | | | (330) | |
| | | | | |
| | | | | |
| | | | | |
| Tax benefit of CARES Act carryback | (967) | | | — | | | — | |
| Other, net | 949 | | | 542 | | | (84) | |
| Income tax expense | $ | 6,610 | | | $ | 13,488 | | | $ | 11,238 | |
(1) Federal tax credits are provided for under the NMTC and LIHTC programs as described in Note (1) Description of Business, Basis of Presentation, Significant Accounting Policies and Recently Issued Accounting Pronouncements. Gross tax credits related to the Company's NMTC totaling $9.8 million were utilized during the seven year period ending December 31, 2020.
The following table presents major components of the deferred income tax asset (liability) resulting from differences between financial reporting and tax basis:
| | | | | | | | | | | |
| | December 31, 2020 | | December 31, 2019 |
| | (In thousands) |
| Deferred tax assets: | | | |
| Allowance for credit losses | $ | 15,883 | | | $ | 7,389 | |
| Accrued compensation | 2,988 | | | 3,058 | |
| Stock compensation | 642 | | | 904 | |
| | | |
| | | |
| | | |
| | | |
| Market discount on purchased loans | 1,062 | | | 621 | |
| Foregone interest on nonaccrual loans | 1,456 | | | 914 | |
| Net operating loss carryforward acquired | 207 | | | 228 | |
| | | |
| | | |
| ROU lease liability | 4,161 | | | 5,227 | |
| Other deferred tax assets | 160 | | | 134 | |
| Total deferred tax assets | 26,559 | | | 18,475 | |
| Deferred tax liabilities: | | | |
| Deferred loan fees, net | (2,643) | | | (3,328) | |
| Premises and equipment | (2,680) | | | (2,510) | |
| FHLB stock | (569) | | | (569) | |
| | | |
| | | |
| Goodwill and other intangible assets | (2,186) | | | (2,807) | |
| New market tax credit | (2,048) | | | (1,781) | |
| Junior subordinated debentures | (1,050) | | | (1,113) | |
| Other deferred tax liabilities | (264) | | | (239) | |
| ROU lease asset | (3,879) | | | (4,956) | |
| Net unrealized gains on investment securities | (6,805) | | | (2,753) | |
| Total deferred tax liabilities | (22,124) | | | (20,056) | |
| Deferred tax asset (liability), net | $ | 4,435 | | | $ | (1,581) | |
In assessing the realizability of deferred tax assets, management considers whether it is more likely than not that some portion or all of the deferred tax assets will not be realized. A valuation allowance is required to be recognized for the portion of the deferred tax asset that will not be realized. The ultimate realization of deferred tax assets is dependent upon the generation of future taxable income during the periods in which those temporary differences become deductible. As of December 31, 2020, based upon the level of historical taxable income and projections for future taxable income over the periods in which the deferred tax assets are deductible, management expects to realize the benefits of these deductible differences.
At December 31, 2020 and December 31, 2019, the Company had a net operating loss carryforward of $986,000 and $1.1 million, respectively, that will begin to expire in 2024. The Company is limited to the amount of the net operating loss carryforward that it can deduct each year under Section 382. Due to sufficient earnings history and other positive evidence, management has not recorded a valuation allowance as of December 31, 2020 and December 31, 2019.
As of December 31, 2020 and December 31, 2019, the Company had an insignificant amount of unrecognized tax benefits, none of which would materially affect its effective tax rate if recognized. The Company does not anticipate that the amount of unrecognized tax benefits will significantly increase or decrease in the next 12 months. The amount of interest and penalties accrued as of December 31, 2020 and December 31, 2019 and recognized during the years ended December 31, 2020, 2019 and 2018 were immaterial.
The Company has qualified under provisions of the Internal Revenue Code to compute income taxes after deductions of additions to the bad debt reserves when it was registered as a Savings Bank. At December 31, 2020, the Company had a taxable temporary difference of approximately $2.8 million that arose before 1988 (base-year amount). In accordance with FASB ASC 740, a deferred tax liability of an estimated $588,000 has not been recognized for the temporary difference. Management does not expect this temporary difference to reverse in the foreseeable future.
The Company and its subsidiary file a United States consolidated federal income tax return and an Oregon State income tax return, and the tax years subject to examination by the Internal Revenue Service are the years ended December 31, 2020, 2019, 2018 and 2017.
(22)Regulatory Capital Requirements
The Company is a bank holding company under the supervision of the Federal Reserve Bank. Bank holding companies are subject to capital adequacy requirements of the Federal Reserve under the Bank Holding Company Act of 1956, as
amended, and the regulations of the Federal Reserve. Heritage Bank is a federally insured institution and thereby is subject to the capital requirements established by the FDIC. The Federal Reserve capital requirements generally parallel the FDIC requirements. Failure to meet minimum capital requirements can initiate certain mandatory, and possibly additional discretionary, actions by regulators that, if undertaken, could have a direct material effect on the Consolidated Financial Statements and operations. Management believes as of December 31, 2020, the Company and the Bank meet all capital adequacy requirements to which they are subject.
As of December 31, 2020 and December 31, 2019, the most recent regulatory notifications categorized the Bank as well capitalized under the regulatory framework for prompt corrective action. There are no conditions or events since that notification that management believes have changed the Bank's categories.
| | | | | | | | | | | | | | | | | | | | | | | | | | | | | | | | | | | |
| | Minimum
Requirements | | Well-
Capitalized
Requirements | | Actual |
| | $ | | % | | $ | | % | | $ | | % |
| | (Dollars in thousands) |
| As of December 31, 2020: | | | | | | | | | | | |
| The Company consolidated | | | | | | | | | | | |
| Common equity Tier 1 capital to risk-weighted assets | $ | 203,314 | | | 4.5 | % | | N/A | | N/A | | $ | 555,644 | | | 12.3 | % |
| Tier 1 leverage capital to average assets | 256,216 | | | 4.0 | | | N/A | | N/A | | 576,531 | | | 9.0 | |
| Tier 1 capital to risk-weighted assets | 271,086 | | | 6.0 | | | N/A | | N/A | | 576,531 | | | 12.8 | |
| Total capital to risk-weighted assets | 361,448 | | | 8.0 | | | N/A | | N/A | | 633,061 | | | 14.0 | |
| Heritage Bank | | | | | | | | | | | |
| Common equity Tier 1 capital to risk-weighted assets | 203,112 | | | 4.5 | | | $ | 293,383 | | | 6.5 | % | | 563,630 | | | 12.5 | |
| Tier 1 leverage capital to average assets | 256,051 | | | 4.0 | | | 320,064 | | | 5.0 | | | 563,630 | | | 8.8 | |
| Tier 1 capital to risk-weighted assets | 270,815 | | | 6.0 | | | 361,087 | | | 8.0 | | | 563,630 | | | 12.5 | |
| Total capital to risk-weighted assets | 361,087 | | | 8.0 | | | 451,359 | | | 10.0 | | | 620,124 | | | 13.7 | |
| As of December 31, 2019: | | | | | | | | | | | |
| The Company consolidated | | | | | | | | | | | |
| Common equity Tier 1 capital to risk-weighted assets | $ | 211,110 | | | 4.5 | % | | N/A | | N/A | | $ | 541,154 | | | 11.5 | % |
| Tier 1 leverage capital to average assets | 212,578 | | | 4.0 | | | N/A | | N/A | | 561,749 | | | 10.6 | |
| Tier 1 capital to risk-weighted assets | 281,479 | | | 6.0 | | | N/A | | N/A | | 561,749 | | | 12.0 | |
| Total capital to risk-weighted assets | 375,306 | | | 8.0 | | | N/A | | N/A | | 598,226 | | | 12.8 | |
| Heritage Bank | | | | | | | | | | | |
| Common equity Tier 1 capital to risk-weighted assets | 211,017 | | | 4.5 | | | $ | 304,803 | | | 6.5 | % | | 538,560 | | | 11.5 | |
| Tier 1 leverage capital to average assets | 211,187 | | | 4.0 | | | 263,984 | | | 5.0 | | | 538,560 | | | 10.2 | |
| Tier 1 capital to risk-weighted assets | 281,356 | | | 6.0 | | | 375,142 | | | 8.0 | | | 538,560 | | | 11.5 | |
| Total capital to risk-weighted assets | 375,142 | | | 8.0 | | | 468,927 | | | 10.0 | | | 575,037 | | | 12.3 | |
As of December 31, 2020, the capital measures reflect the revised CECL capital transition provisions adopted by the Federal Reserve and the FDIC, that allows us the option to delay for two years an estimate of CECL’s effect on regulatory capital, relative to the incurred loss methodology’s effect on regulatory capital, followed by a three-year transition period.
Under applicable capital requirements both the Company and the Bank are required to have a common equity Tier 1 capital ratio of 4.5%, a Tier 1 leverage ratio of 4.0%, a Tier 1 risk-based ratio of 6.0% and a total risk-based ratio of 8.0%. Both the Company and the Bank are also required to maintain a capital conservation buffer consisting of common equity Tier 1 capital above 2.5% of minimum risk based capital ratios to avoid restrictions on certain activities including payment of dividends, stock repurchases and discretionary bonuses to executive officers. At December 31, 2020, the capital conservation buffer was 6.0% and 5.7% for the Company and the Bank, respectively.
(23)Heritage Financial Corporation (Parent Company Only)
Following are the condensed financial statements of the Parent Company.
HERITAGE FINANCIAL CORPORATION
(PARENT COMPANY ONLY)
Condensed Statements of Financial Condition
| | | | | | | | | | | |
| | December 31, 2020 | | December 31, 2019 |
| | (In thousands) |
| ASSETS | | | |
| Cash and cash equivalents | $ | 9,736 | | | $ | 21,481 | |
| Investment in subsidiary bank | 828,426 | | | 806,717 | |
| Other assets | 4,469 | | | 2,281 | |
| Total assets | $ | 842,631 | | | $ | 830,479 | |
| | | |
| LIABILITIES AND STOCKHOLDERS’ EQUITY | | | |
| Junior subordinated debentures | $ | 20,887 | | | $ | 20,595 | |
| Other liabilities | 1,305 | | | 573 | |
| Total stockholders’ equity | 820,439 | | | 809,311 | |
| Total liabilities and stockholders’ equity | $ | 842,631 | | | $ | 830,479 | |
HERITAGE FINANCIAL CORPORATION
(PARENT COMPANY ONLY)
Condensed Statements of Income
| | | | | | | | | | | | | | | | | |
| | Year Ended December 31, |
| | 2020 | | 2019 | | 2018 |
| | (In thousands) |
| INTEREST INCOME: | | | | | |
| Interest on interest earning deposits | $ | 16 | | | $ | 57 | | | $ | 7 | |
| Total interest income | 16 | | | 57 | | | 7 | |
| INTEREST EXPENSE: | | | | | |
| Junior subordinated debentures | 890 | | | 1,339 | | | 1,263 | |
| Total interest expense | 890 | | | 1,339 | | | 1,263 | |
| Net interest expense | (874) | | | (1,282) | | | (1,256) | |
| NONINTEREST INCOME: | | | | | |
| Dividends from subsidiary bank | 39,000 | | | 47,000 | | | 30,000 | |
| Equity in undistributed income of subsidiary bank | 12,685 | | | 25,186 | | | 29,258 | |
| Other income | 5 | | | 39 | | | 22 | |
| Total noninterest income | 51,690 | | | 72,225 | | | 59,280 | |
| NONINTEREST EXPENSE: | | | | | |
| Professional services | 495 | | | 517 | | | 3,063 | |
| Other expense | 5,172 | | | 4,395 | | | 3,833 | |
| Total noninterest expense | 5,667 | | | 4,912 | | | 6,896 | |
| Income before income taxes | 45,149 | | | 66,031 | | | 51,128 | |
| Income tax benefit | (1,421) | | | (1,526) | | | (1,929) | |
| Net income | $ | 46,570 | | | $ | 67,557 | | | $ | 53,057 | |
HERITAGE FINANCIAL CORPORATION
(PARENT COMPANY ONLY)
Condensed Statements of Cash Flows
| | | | | | | | | | | | | | | | | |
| | Year Ended December 31, |
| | 2020 | | 2019 | | 2018 |
| | (In thousands) |
| Cash flows from operating activities: | | | | | |
| Net income | $ | 46,570 | | | $ | 67,557 | | | $ | 53,057 | |
| Adjustments to reconcile net income to net cash provided by operating activities: | | | | | |
| Equity in undistributed income of subsidiary bank | (12,685) | | | (25,186) | | | (29,258) | |
| | | | | |
| Stock-based compensation expense | 3,559 | | | 3,231 | | | 2,744 | |
| | | | | |
| Net change in other assets and other liabilities | (1,333) | | | 763 | | | 1,735 | |
| Net cash provided by operating activities | 36,111 | | | 46,365 | | | 28,278 | |
| Cash flows from investing activities: | | | | | |
| Net cash received from acquisitions | — | | | — | | | 1,782 | |
| | | | | |
| Net cash provided by investing activities | — | | | — | | | 1,782 | |
| Cash flows from financing activities: | | | | | |
| Common stock cash dividends paid | (28,859) | | | (30,908) | | | (25,791) | |
| Proceeds from exercise of stock options | 122 | | | 58 | | | 133 | |
| | | | | |
| Repurchase of common stock | (19,119) | | | (8,636) | | | (1,704) | |
| Net cash used in financing activities | (47,856) | | | (39,486) | | | (27,362) | |
| Net (decrease) increase in cash and cash equivalents | (11,745) | | | 6,879 | | | 2,698 | |
| Cash and cash equivalents at the beginning of year | 21,481 | | | 14,602 | | | 11,904 | |
| Cash and cash equivalents at the end of year | $ | 9,736 | | | $ | 21,481 | | | $ | 14,602 | |
| | | | | |
| Supplemental non-cash disclosures of cash flow information: | | | | | |
| Common stock issued for business combinations | $ | — | | | $ | — | | | $ | 230,043 | |
| Capital contribution of net assets acquired in business combinations to Bank | — | | | — | | | 228,261 | |
(24)Selected Quarterly Financial Data (Unaudited)
Results of operations on a quarterly basis were as follows:
| | | | | | | | | | | | | | | | | | | | | | | |
| | Year Ended December 31, 2020 |
| | First
Quarter | | Second
Quarter | | Third
Quarter | | Fourth
Quarter |
| | (Dollars in thousands, except per share amounts) |
| Interest income | $ | 53,086 | | | $ | 53,994 | | | $ | 52,563 | | | $ | 54,677 | |
| Interest expense | 4,535 | | | 3,681 | | | 2,885 | | | 2,222 | |
| Net interest income | 48,551 | | | 50,313 | | | 49,678 | | | 52,455 | |
| Provision for credit losses | 7,946 | | | 28,563 | | | 2,730 | | | (3,133) | |
| Net interest income after provision for credit losses | 40,605 | | | 21,750 | | | 46,948 | | | 55,588 | |
| Noninterest income | 9,486 | | | 8,248 | | | 8,210 | | | 11,285 | |
| Noninterest expense | 37,260 | | | 37,073 | | | 36,045 | | | 38,562 | |
| Income (loss) before income taxes | 12,831 | | | (7,075) | | | 19,113 | | | 28,311 | |
| Income tax expense (benefit) | 640 | | | (936) | | | 2,477 | | | 4,429 | |
| Net income (loss) | $ | 12,191 | | | $ | (6,139) | | | $ | 16,636 | | | $ | 23,882 | |
| Basic earnings per common share | $ | 0.34 | | | $ | (0.17) | | | $ | 0.46 | | | $ | 0.66 | |
| Diluted earnings per common share | 0.34 | | | (0.17) | | | 0.46 | | | 0.66 | |
| Cash dividends declared on common stock | 0.20 | | | 0.20 | | | 0.20 | | | 0.20 | |
| | | | | | | | | | | | | | | | | | | | | | | |
| | Year Ended December 31, 2019 |
| | First
Quarter | | Second
Quarter | | Third
Quarter | | Fourth
Quarter |
| | (Dollars in thousands, except per share amounts) |
| Interest income | $ | 53,807 | | | $ | 55,216 | | | $ | 54,884 | | | $ | 53,943 | |
| Interest expense | 4,019 | | | 4,680 | | | 4,641 | | | 4,828 | |
| Net interest income | 49,788 | | | 50,536 | | | 50,243 | | | 49,115 | |
| Provision for credit losses | 920 | | | 1,367 | | | 466 | | | 1,558 | |
| Net interest income after provision for credit losses | 48,868 | | | 49,169 | | | 49,777 | | | 47,557 | |
| Noninterest income | 7,429 | | | 7,564 | | | 8,458 | | | 9,011 | |
| Noninterest expense | 36,525 | | | 37,547 | | | 36,719 | | | 35,997 | |
| Income before income taxes | 19,772 | | | 19,186 | | | 21,516 | | | 20,571 | |
| Income tax expense | 3,220 | | | 3,202 | | | 3,621 | | | 3,445 | |
| Net income | $ | 16,552 | | | $ | 15,984 | | | $ | 17,895 | | | $ | 17,126 | |
| Basic earnings per common share | $ | 0.45 | | | $ | 0.43 | | | $ | 0.49 | | | $ | 0.47 | |
| Diluted earnings per common share | 0.45 | | | 0.43 | | | 0.48 | | | 0.47 | |
| Cash dividends declared on common stock | 0.18 | | | 0.18 | | | 0.19 | | | 0.29 | |
(25)Subsequent Events (Unaudited)
The CA Act was enacted into law on December 27, 2020. In accordance with the provisions, the Bank began originating the second round of SBA PPP loans to existing and new customers effective January 11, 2021. As of February 19, 2021, the Bank has funded 1,724 loans totaling $297.1 million. The average loan balance for funded SBA PPP loans under the CA Act was $172,000. The Bank earns 1% interest on these loans as well as a fee to cover processing costs.
Liquidity for the originations of these SBA PPP loans was provided from cash reserves. The Company was additionally approved to participate in the Federal Reserve's Paycheck Protection Program Liquidity Facility as a backup funding source effective January 20, 2021. The Paycheck Protection Program Liquidity Facility expires on March 31, 2021. The Company does not expect to participate in the facility.
Additionally, subsequent to year end through February 19, 2021, the Bank received principal and interest forgiveness payments from the SBA of $124.5 million, which represented approximately 13.9% of total originated first round SBA PPP loans and 17.4% of the outstanding balance of SBA PPP loans at December 31, 2020.
ITEM 9. CHANGES IN AND DISAGREEMENTS WITH ACCOUNTANTS ON ACCOUNTING AND FINANCIAL DISCLOSURE
None
ITEM 9A. CONTROLS AND PROCEDURES
Disclosure Controls and Procedures
Our disclosure controls and procedures are designed to ensure that information the Company must disclose in its reports filed or submitted under the Exchange Act, is recorded, processed, summarized, and reported on a timely basis. Our management has evaluated, with the participation and under the supervision of our Chief Executive Officer and Chief Financial Officer, the effectiveness of our disclosure controls and procedures (as defined in Rules 13a-15(e) and 15d-15(e) of the Exchange Act) as of the end of the period covered by this report. Based on this evaluation, our Chief Executive Officer and Chief Financial Officer have concluded that, as of such date, the Company’s disclosure controls and procedures are effective in ensuring that information relating to the Company, including its consolidated subsidiaries, required to be disclosed in reports that it files under the Exchange Act is (1) recorded, processed, summarized and reported within the time periods specified in the SEC’s rules and forms, and (2) accumulated and communicated to our management, including our Chief Executive Officer and Chief Financial Officer, as appropriate to allow timely decisions regarding required disclosure.
Internal Control Over Financial Reporting
(a) Management’s report on internal control over financial reporting
The Company’s management is responsible for establishing and maintaining adequate internal control over financial reporting. The Company’s internal control system is designed to provide reasonable assurance to our management and the Board of Directors regarding the preparation and fair presentation of published financial statements. Nonetheless, all internal
control systems, no matter how well designed, have inherent limitations. Even systems determined to be effective as of a particular date can provide only reasonable assurance with respect to financial statement preparation and presentation and may not eliminate the need for restatements.
The Company’s management assessed the effectiveness of the Company’s internal control over financial reporting as of December 31, 2020. In making this assessment, management used the criteria set forth by the Committee of Sponsoring Organizations of the Treadway Commission in the 2013 Internal Control—Integrated Framework. Based on our assessment, we believe that, as of December 31, 2020, the Company’s internal control over financial reporting is effective based on these criteria.
Crowe LLP, an independent registered public accounting firm, has audited the effectiveness of our internal control over financial reporting as of December 31, 2020, and their report is included in Item 8. Financial Statements And Supplementary Data.
(b) Attestation report of the registered public accounting firm.
See Item 8. Financial Statements And Supplementary Data.
(c) Changes in internal control over financial reporting.
There were no significant changes in the Company’s internal control over financial reporting during the fourth quarter of the period covered by this Form 10-K that materially affected, or are reasonably likely to materially affect, the Company’s internal control over financial reporting.
ITEM 9B. OTHER INFORMATION
None
PART III
ITEM 10. DIRECTORS, EXECUTIVE OFFICERS AND CORPORATE GOVERNANCE
Information concerning directors of the registrant is incorporated by reference to the section entitled “Proposal 1 - Election of Directors” of our Proxy Statement.
For information regarding the executive officers of the Company, see Item 1. Business—Executive Officers.”
The required information with respect to compliance with Section 16(a) of the Exchange Act is incorporated by reference to the section entitled “Security Ownership of Certain Beneficial Owners and Management” of the Proxy Statement.
The Company has adopted a written Code of Ethics that applies to our directors, officers and employees. The Code of Ethics can be accessed electronically by visiting the Company’s website at www.hf-wa.com in the section titled Overview: Governance Documents.
The Audit and Finance Committee of our Board of Directors retains our independent auditors, reviews and approves the scope and results of the audits with the auditors and management, monitors the adequacy of our system of internal controls and reviews the annual report, auditors’ fees and non-audit services to be provided by the independent auditors. The members of our Audit Committee are Deborah J. Gavin, chair of the committee, Brian S. Charneski, Jeffery S. Lyon, Gragg E. Miller and Anthony B. Pickering, all of whom are considered “independent” as defined by the SEC. Our Board of Directors has determined that Mrs. Gavin meets the definition of an audit committee financial expert, as determined by the requirements of the SEC.
ITEM 11. EXECUTIVE COMPENSATION
Information concerning executive and director compensation and certain matters regarding participation in the Company’s Compensation Committee required by this item is incorporated by reference to the headings “Executive Compensation,” “Director Compensation,” “Report of the Compensation Committee,” and "CEO Pay Ratio" of the Proxy Statement.
ITEM 12. SECURITY OWNERSHIP OF CERTAIN BENEFICIAL OWNERS AND MANAGEMENT AND RELATED STOCKHOLDER MATTERS
Information concerning security ownership of certain beneficial owners and management is incorporated by reference to the section entitled “Security Ownership of Certain Beneficial Owners and Management” of the Proxy Statement.
The following table summarizes the consolidated activity within the Company’s stock-based compensation plans as of December 31, 2020, all of which were approved by shareholders.
| | | | | | | | | | | | | | | | | | | | | | | |
| Plan Category | Number of
securities
to be issued
upon vesting of restricted stock awards | | Number of
securities
to be issued
upon vesting of restricted stock units | | Number of
securities
to be issued
upon exercise of outstanding
options | | Number of
securities
remaining
available for
future issuance
under equity
compensation
plans |
| Equity compensation plans, all of which are approved by security holders | — | | 316,116 | | — | | 646,503 |
ITEM 13. CERTAIN RELATIONSHIP AND RELATED TRANSACTIONS, AND DIRECTOR INDEPENDENCE
Information concerning certain relationships and related transactions is incorporated by reference to the sections entitled “Meetings and Committees of the Board of Directors" and "Corporate Governance” of the Proxy Statement.
Our common stock is listed on the NASDAQ Global Select Market. In accordance with NASDAQ requirements, at least a majority of our directors must be independent directors. The Board of Directors has determined that 10 of our 12 directors are independent.
ITEM 14. PRINCIPAL ACCOUNTING FEES AND SERVICES
Information concerning principal accounting fees and services is incorporated by reference to the section entitled “Proposal 3 - Ratification of the Appointment of Independent Registered Public Accounting Firm” in the Proxy Statement.
PART IV
ITEM 15. EXHIBITS, FINANCIAL STATEMENT SCHEDULES
(a) The following documents are filed as a part of this report:
(1) Financial Statements: The Consolidated Financial Statements are included in Part II. Item 8. Financial Statements And Supplementary Data.
(2) Financial Statements Schedules: All schedules are omitted because they are not required or applicable, or the required information is shown in the Consolidated Financial Statements or Notes.
(3) Exhibits: Included in schedule below.
| | | | | | | | | | | | | | | | | | | | | | | | | | |
| | | | Incorporated by Reference |
Exhibit No. | | Description of Exhibit | | Form | | Exhibit | | Filing Date/Period End Date |
| 2.1 | | | | | 8-K | | 2.1 | | 07/27/2017 |
| | | | | | | | |
| 2.2 | | | | | 8-K | | 2.1 | | 03/09/2018 |
| | | | | | | | |
| 3.1 | | | | | 8-K | | 3.1(B) | | 05/18/2010 |
| | | | | | | | |
| 3.2 | | | | | S-14A | | - | | 03/18/2011 |
| | | | | | | | |
| 3.3 | | | | | 8-K | | 3.3 | | 06/30/2020 |
| | | | | | | | |
| 4.1 | | | Form of Certificate of Heritage's Common Stock (3) | | S-1/A | | - | | 10/29/1997 |
| | | | | | | | |
| 4.2 | | | | | | | | | |
| | | | | | | | |
| 10.1* | | | | 10-K | | 10.5 | | 03/09/2017 |
| | | | | | | | |
| 10.2* | | | | 8-K | | 99.2 | | 02/01/2017 |
| | | | | | | | |
| 10.3* | | | | DEF 14A | | - | | 06/11/2014 |
| | | | | | | | |
| 10.4* | | | | 8-K | | 99.6 | | 02/01/2017 |
| | | | | | | | |
| 10.5* | | | | 8-K | | 99.7 | | 02/01/2017 |
| | | | | | | | |
| 10.6* | | | | 8-K | | 99.4 | | 02/01/2017 |
| | | | | | | | |
| | | | | | | | | | | | | | | | | | | | | | | | | | |
| 10.7* | | | | 8-K | | 99.3 | | 02/01/2017 |
| | | | | | | | |
| 10.8* | | | | 8-K | | 99.8 | | 02/01/2017 |
| | | | | | | | |
| 10.9* | | | | 8-K | | 99.5 | | 02/01/2017 |
| | | | | | | | |
| 10.10* | | | | 8-K | | 10.1 | | 07/01/2019 |
| | | | | | | | |
| 10.11* | | | | 8-K | | 10.6 | | 09/07/2012 |
| | | | | | | | |
| 10.12* | | | | 8-K | | 10.2 | | 12/22/2016 |
| | | | | | | | |
| 10.13* | | | | 10-Q | | 10.15 | | 11/06/2019 |
| | | | | | | | |
| 10.14* | | | | 10-Q | | 10.22 | | 11/06/2019 |
| | | | | | | | |
| 10.15* | | | | 8-K | | 10.7 | | 09/07/2012 |
| | | | | | | | |
| 10.16* | | | | 8-K | | 10.3 | | 12/22/2016 |
| | | | | | | | |
| 10.17* | | | | 10-Q | | 10.16 | | 11/06/2019 |
| | | | | | | | |
| 10.18* | | | | 10-Q | | 10.33 | | 11/06/2019 |
| | | | | | | | |
| 10.19* | | | | 10-K | | 10.16 | | 03/11/2015 |
| | | | | | | | |
| 10.20* | | | | 8-K | | 10.4 | | 12/22/2016 |
| | | | | | | | |
| 10.21* | | | | 10-Q | | 10.27 | | 11/06/2019 |
| | | | | | | | |
| 10.21* | | | | 10-Q | | 10.35 | | 11/06/2019 |
| | | | | | | | |
| 10.22* | | | | 10-Q | | 10.36 | | 11/06/2019 |
| | | | | | | | |
| 10.23* | | | | 10-Q | | 10.37 | | 11/06/2019 |
| | | | | | | | |
| 10.24* | | | | 10-Q | | 10.17 | | 08/06/2015 |
| | | | | | | | |
| 10.25* | | | | 10-Q | | 10.34 | | 05/09/2019 |
| | | | | | | | |
| 10.26* | | | | 8-K | | 10.1 | | 06/30/2020 |
| | | | | | | | |
| 10.27* | | | | 8-K | | 10.3 | | 06/30/2020 |
| | | | | | | | |
| 10.28* | | | | 8-K | | 10.2 | | 06/30/2020 |
| | | | | | | | |
| 14.0 | | | Code of Ethics and Conduct Policy (2) | | | | | | |
| | | | | | | | |
| 21.0 | | | | | | | | | |
| | | | | | | | |
| 23.0 | | | | | | | | | |
| | | | | | | | |
| 24.0 | | | | | | | | | |
| | | | | | | | |
| 31.1 | | | | | | | | | |
| | | | | | | | |
| 31.2 | | | | | | | | | |
| | | | | | | | |
| 32.1 | | | | | | | | | |
| | | | | | | | |
| 101.INS | | XBRL Instance Document (1) | | | | | | |
| | | | | | | | |
| 101.SCH | | XBRL Taxonomy Extension Schema Document (1) | | | | | | |
| | | | | | | | |
| | | | | | | | | | | | | | | | | | | | | | | | | | |
| 101.CAL | | XBRL Taxonomy Extension Calculation Linkbase Document (1) | | | | | | |
| | | | | | | | |
| 101.DEF | | XBRL Taxonomy Extension Definition Linkbase Document (1) | | | | | | |
| | | | | | | | |
| 101.LAB | | XBRL Taxonomy Extension Label Linkbase Document (1) | | | | | | |
| | | | | | | | |
| 101.PRE | | XBRL Taxonomy Extension Presentation Linkbase Document (1) | | | | | | |
*Indicates management contract or compensatory plan or arrangement.
(1) Filed herewith.
(2) Registrant elects to satisfy Regulation S-K §229.406(c) by posting its Code of Ethics on its website at www.HF-WA.com in the section titled Overview: Governance Documents.
(3) Exhibit not previously filed in electronic format.
ITEM 16. FORM 10-K SUMMARY
None.
SIGNATURES
Pursuant to the requirements of Section 13 or 15(d) of the Securities Exchange Act of 1934, the registrant has duly caused this report to be signed on its behalf by the undersigned, thereunto duly authorized, on February 26, 2021.
| | | | | | | | |
| | HERITAGE FINANCIAL CORPORATION |
| | (Registrant) |
| | |
| | /S/ JEFFREY J. DEUEL |
| | Jeffrey J. Deuel |
| | President and Chief Executive Officer |
Pursuant to the requirements of the Securities Exchange Act of 1934, this report has been signed below by the following persons on behalf of the registrant and in the capacities indicated on February 26, 2021.
| | | | | | | | |
| | |
| | |
| | Principal Executive Officer: |
| | /S/ JEFFREY J. DEUEL |
| | Jeffrey J. Deuel |
| | President and Chief Executive Officer |
| | |
| | |
| | Principal Financial Officer: |
| | /S/ DONALD J. HINSON |
| | Donald J. Hinson |
| | Executive Vice President and Chief Financial Officer |
| | |
| | |
| | | | | | | | |
| Jeffrey J. Deuel, pursuant to a power of attorney that is being filed with the Form 10-K, has signed this report as attorney in fact for the following directors who constitute a majority of the Board. |
|
| | |
| Brian S. Charneski | | |
| John A. Clees | | |
| Stephen A. Dennis | | |
| Kimberly T. Ellwanger | | |
| Deborah J. Gavin | | |
| Jeffrey S. Lyon | | |
| Gragg E. Miller | | |
| Anthony B. Pickering | | |
| Frederick B. Rivera | | |
| Brian L. Vance | | |
| Ann Watson | | |
| | /S/ JEFFREY J. DEUEL |
| | Jeffrey J. Deuel |
| | Attorney-in-Fact |
| | February 26, 2021 |