Table of Contents
Exhibit 99.1

Management Proxy Circular
Notice of Annual Meeting of Shareholders
April 8, 2021

Your participation is important. Please read this document and vote.
Table of Contents
Notice of Annual Meeting of Shareholders
| When: | Thursday, April 8, 2021, 10:30 a.m. Eastern Daylight Time (EDT) | |
| Virtual Meeting: |
We are holding our 2021 annual meeting virtually to continue protecting the health and safety of our shareholders, employees and other stakeholders from the ongoing impact of the COVID-19 pandemic. Please join our webcast at https://cibc.pividal.tv/agm2021 or on our phone line at 1 800 898-3989, passcode 6875673# (English) or 1 877 395-0279 passcode 9080240# (French). | |
At the meeting you will be asked to:
| 1. | receive our financial statements for the year ended October 31, 2020 and the auditors’ report on the statements; |
| 2. | elect directors; |
| 3. | appoint auditors; |
| 4. | vote on an advisory resolution on our executive compensation approach; |
| 5. | vote on shareholder proposals; and |
| 6. | consider any other business properly brought before the meeting. |
Voting instructions start on page 2 of our 2021 Management Proxy Circular (the “Circular”). Please read our Circular carefully.
Delivery of meeting materials by notice-and-access
Protecting the environment – We are proud to let you know that we have furthered our commitment to protect the environment by reducing the amount of paper we send to our shareholders. You have told us how important environmental sustainability is to you as shareholders and we are listening.
Our Management Proxy Circular – Starting this year, we are using notice-and-access to send our registered and non-registered shareholders the 2021 management proxy circular as permitted by the Canadian Securities Administrators and with the authorization of the Office of the Superintendent of Financial Institutions Canada. This means that our Circular will be posted online for you to access, rather than being printed and mailed to you. You will still receive a proxy form or a voting instruction form by mail so that you can vote your shares. You will also receive a notice with information about how you can access our Circular online and how to request a paper copy.
Our Annual Financial Statements and Management’s Discussion and Analysis – The way we send you our annual financial statements and management’s discussion and analysis (MD&A) depends on whether you are a registered shareholder or a non-registered shareholder.
You are a registered shareholder if you hold a paper share certificate in your name or your shares are held through the direct registration system. You are a non-registered shareholder if your shares are registered in the name of an intermediary, such as a bank, broker or trust company.
If you are a registered shareholder and you did not sign-up for e-delivery or opt out of receiving our annual financial statements, then we are required to send you our annual financial statements and you will receive a paper copy of our Annual Report with the notice.
If you are a non-registered shareholder, then we will use notice-and-access to send you our annual financial statements and MD&A as permitted by securities law so that you can access this material online the same way as our Circular.
Our Circular and Annual Report (the “meeting materials”) are available on the website of our transfer agent AST Trust Company (Canada) (AST) (www.meetingdocuments.com/astca/cibc), on our website (www.cibc.com), SEDAR (www.sedar.com) and EDGAR (www.sec.gov/edgar.shtml).
Table of Contents
How to request a paper copy of the meeting materials
You may request a paper copy of the Circular or the Annual Report, free of charge, up to one year from the date the meeting materials were filed on SEDAR.
To make your request before the meeting, contact AST at www.meetingdocuments.com/astca/cibc or 1 888 433-6443 (toll free in Canada and the United States) or 416 682-3801 (other countries) or email fulfilment@astfinancial.com. Please follow AST’s instructions. A paper copy of the requested documents will be sent to you within three business days of your request. Please note that you will not receive another proxy form or voting instruction form so please retain your original form to vote your shares.
To ensure receipt of the paper copy before the voting deadline and meeting date, we estimate that your request must be received no later than 5:00 p.m. (EDT) on March 25, 2021. This reflects the three business day period for processing requests as well as typical mailing times.
To make your request on or after the date of the meeting, call AST at 1 888 433-6443 (toll free in Canada and the United States) or 416 682-3801 (other countries) or email fulfilment@astfinancial.com. The requested documents will be sent to you within ten calendar days of your request.
Eligibility to vote
There were 447,964,315 common shares outstanding on February 8, 2021, our record date. Holders of common shares on that date are eligible to vote at our meeting (subject to Bank Act (Canada) restrictions).
Your vote is important
We encourage you to read the Circular and vote before the meeting. For more information on how you can vote or appoint someone else to vote for you see “Voting” starting on page 2 of the Circular. Please vote as early as possible so that your shares are represented at the meeting. AST must receive your vote no later than 10:30 a.m. (EDT) on April 7, 2021.
You may also vote online at the virtual meeting, provided you follow certain steps. These steps are set out on pages 3 and 4 of the Circular.
Questions
If you have questions about notice-and-access or our virtual meeting, you may contact AST at 1 800 258-0499 (toll free in Canada and the United States) or 416 682-3860 (other countries).
Our Board and management would like to answer as many shareholder questions as possible during the meeting. We encourage you to submit questions in advance to the Corporate Secretary at corporate.secretary@cibc.com or mailed to CIBC Corporate Secretary’s Division, 199 Bay Street, Commerce Court West, Suite 4460, Toronto, Ontario M5L 1A2.
By Order of the Board

Michelle Caturay
Senior Vice-President, Associate General
Counsel and Corporate Secretary
February 16, 2021
Table of Contents
Dear fellow shareholder,
We are pleased to invite you to attend CIBC’s Annual Meeting of Shareholders on Thursday, April 8, 2021, at 10:30 a.m. (EDT).
Engaging with you – The health and well-being of our team, clients, investors and communities remains our top priority. In line with the latest directives from public health and government authorities, this year’s meeting will be virtual. Shareholders will have the opportunity to attend the meeting online in real time regardless of their location, submit questions and vote. Please see our Circular for information on how to participate in our virtual meeting, the business to be conducted at the meeting, our executive compensation approach and our governance practices. You have the opportunity to vote and your vote matters!
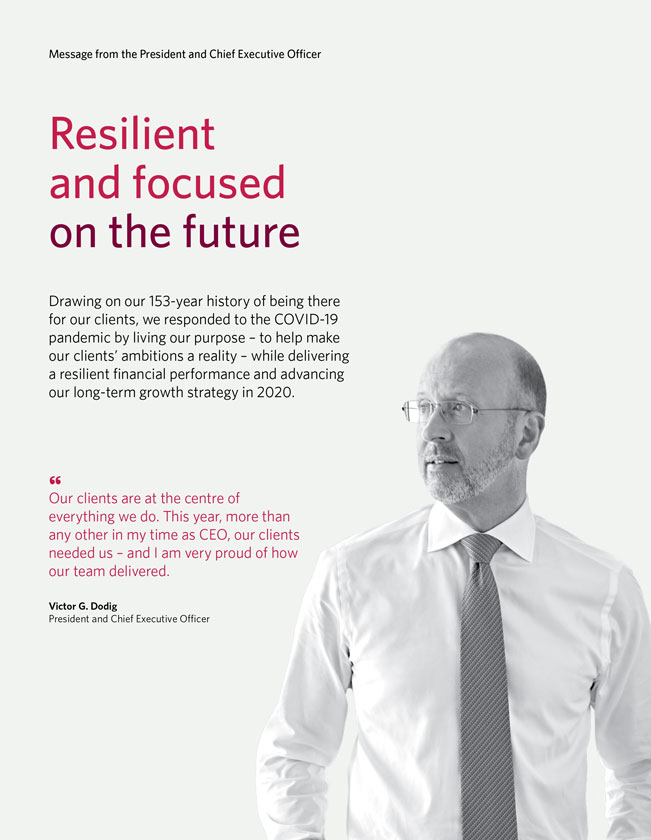
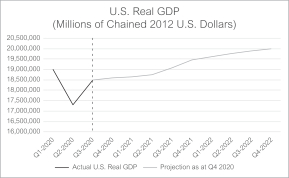
Our purpose – This past year, amidst a global pandemic, we lived our purpose to help make your ambition a reality. This shared purpose is the foundation for the efforts of our team to work collaboratively to meet the needs of our clients. The investments we have made in building a client-focused culture were realized this year, as our team responded with urgency and focus to address immediate client needs created by the onset of the pandemic, and support our clients in keeping their long-term ambitions on track. Our bank played a critical role in supporting clients, including providing payment relief to those affected by the pandemic, and working closely with governments to administer critical relief programs. We continue to be there for clients affected by the pandemic with advice and solutions to address financial hardship.
Creating value – We delivered resilient business performance in 2020. Pre-provision earnings were up over 2019 and our capital position remained strong. Our investments in technology over the past several years to digitize and simplify our bank are allowing us to provide real-time remote support to our clients at a time when physical distancing has become the norm. These efforts are being recognized by our clients with our highest client experience scores on record.
We remain focused on meeting our responsibilities to support the long-term strength and prosperity of the people and communities we serve. This is true at the corporate level with our commitment to sustainability and our support for social and economic development, as well as at the individual level, where our generous team members give back, day in and day out.
Join us – At our meeting, you will hear more about CIBC’s 2020 performance and progress on our strategy. Board members and executive officers will be available to answer your questions.
We thank you for your continued support of CIBC and look forward to your participation in our virtual meeting at https://cibc.pividal.tv/agm2021 or by phone at 1 800 898-3989, passcode 6875673# (English) or 1 877 395-0279 passcode 9080240# (French). The meeting will be archived on our website until the next annual meeting.
Sincerely,

|

| |
| John P. Manley | Victor G. Dodig | |
| Chair of the Board | President and Chief Executive Officer | |
Table of Contents
Management Proxy Circular
In this 2021 Management Proxy Circular (the “Circular”) information is as at February 11, 2021. All dollar figures are in Canadian currency, unless indicated otherwise. ‘You’, ‘your’ and ‘shareholder’ mean common shareholders of CIBC.
Glossary of Acronyms
The CIBC Logo is a trademark of CIBC in Canada and other countries.
Table of Contents
1. Financial Statements
The consolidated financial statements for the year ended October 31, 2020 are in our 2020 Annual Report available at https://www.cibc.com/en/about-cibc/investor-relations.html.
| 2. Election of Directors
You will be asked to elect 14 director nominees to serve on our Board until the earlier of the next annual meeting or the director’s retirement from the Board. The Board recommends that you vote for each director nominee. |
See pages 14 to 28 for information about our director nominees.
|
| 3. Appointment of Auditors
You will be asked to appoint Ernst & Young LLP (EY) as auditors of CIBC. EY has served as the auditors of CIBC since December 2002. The Board recommends that you vote for EY as our auditors. |
See page 37 for information on the Audit Committee’s annual assessment of EY’s effectiveness and audit quality and a description of fees paid to the auditors.
|
| 4. Advisory Resolution on our Executive Compensation Approach
You can have a “say on pay” by voting on an advisory resolution about our approach to executive compensation. Last year, 95% of shareholder votes were for our executive compensation approach. We consider the vote part of our shareholder engagement process. This vote is advisory under applicable law and does not diminish the Board’s role and responsibilities. Even though the resolution is not binding, the Board and Management Resources and Compensation Committee consider the results of the vote in making future executive compensation decisions. |
See pages 61 to 84 for Message to our Fellow Shareholders and Compensation Discussion and Analysis.
|
When reviewing its approach to executive compensation, the Committee considers shareholder feedback and any concerns that have been raised. If a concern is significant, we will disclose the Committee’s review process and the outcome of that review in our next management proxy circular. The Board recommends that you vote for the following advisory resolution on our approach to executive compensation.
RESOLVED that the shareholders accept the approach to executive compensation disclosed in CIBC’s management proxy circular for the 2021 Annual Meeting of Shareholders.
| 5. Shareholder Proposals You will be asked to vote on a shareholder proposal from the Mouvement d’education et de défense des actionnaires (MÉDAC) set out on page 6. The Board recommends that you vote against this proposal for the reasons explained in the Board’s response on page 6. In addition, MÉDAC withdrew seven shareholder proposals set out on pages 7 to 13. |
See pages 6 to 13 for shareholder proposals and management’s responses.
|
Æquo Shareholder Engagement Services, on behalf of Comité syndical national de retraite Bâtirente inc., withdrew a shareholder proposal described on page 7.
Shareholder proposals for next year’s annual meeting must be submitted by November 18, 2021.
Each item being voted on requires the approval of a majority (more than 50%) of the votes cast by proxy or during the meeting by online ballot through the live webcast. For information on voting and appointing a proxyholder see pages 2 to 5.
| C I B C P R O X Y C I R C U L A R | 1 |
Table of Contents
Who can vote
You are entitled to one vote for each common share you own on February 8, 2021, our record date. There were 447,964,315 outstanding common shares eligible to vote on that date.
Shares cannot be voted if they are beneficially owned by:
| • | the government of Canada or any of its agencies; |
| • | the government of a province or any of its agencies; |
| • | the government of a foreign country, any political subdivision of a foreign country or any of its agencies; |
| • | a person who has acquired more than 10% of any class of our shares without Minister of Finance approval; or |
| • | a person or entity controlled by a person that, in aggregate, are more than 20% of the eligible votes that may be cast unless permitted by the Minister of Finance. |
Our directors and officers are not aware of any person or company that beneficially owns, directly or indirectly, or exercises control or direction over, more than 10% of the votes attached to any class of CIBC shares.
How to vote
There are two ways to vote your shares: before the meeting by proxy or during the meeting by online ballot through the live webcast. The voting process you follow depends on whether you are a registered shareholder or a non-registered shareholder.
|
Registered shareholders
|
Non-registered shareholders
| |||
|
You are a registered shareholder if you hold a paper share certificate in your name or your shares are held through the direct registration system.
|
You are a non-registered shareholder if your shares are registered in the name of an intermediary, such as a bank, broker or trust company.
|
|
How to vote if you are a registered shareholder
|
If you are a registered shareholder you received a proxy form with a control number. If you did not receive this form, please contact AST at 1 800 258-0499 (toll free in Canada and the United States) or 416 682-3860 (other countries).You may vote by proxy before the meeting using the proxy form that was sent to you or you may vote during the meeting by online ballot through the live webcast.
If you want to vote by proxy before the meeting – To vote your shares by proxy, you may provide your voting instructions in one of these ways:

|
Online – go to www.astvotemyproxy.com, enter the 13-digit control number on your proxy form and follow the instructions on the screen; or
– scan both sides of your proxy form and email it to proxyvote@astfinancial.com; | |

|
Fax – complete your proxy form and fax both sides to AST at 1 866 781-3111 (Canada and the United States) or 1 416 368-2502 (outside North America); or | |

|
Mail – complete your proxy form and return it in the envelope provided. | |
Return your completed proxy by 10:30 a.m. (EDT) on April 7, 2021 to ensure your vote is counted. We encourage you to vote your shares early.
| 2 | C I B C P R O X Y C I R C U L A R |
Table of Contents
Voting
If you want to vote during the meeting – To attend our virtual meeting and vote your shares during the meeting, do not complete or return your proxy form. You will be able to vote online in real time by completing an online ballot through the live webcast as long as you are connected to the internet and follow these steps.
|
Step 1
|
Log in at https://cibc.pividal.tv/agm2021 at least 15 minutes before the meeting starts and check browser compatibility. There must be internet connectivity for the duration of the meeting to vote.
| |
|
Step 2
|
Select “Vote” and a separate browser will open. Enter the control number from your proxy form as your user name. Enter “cibc2021” (case sensitive) as your password. Any vote you cast at the meeting will revoke any proxy you previously submitted. If you do not wish to revoke a previously submitted proxy, you should not vote during the meeting.
|
If you want to appoint a proxyholder to vote during the meeting for you – You may appoint a proxyholder, other than management’s nominees, John Manley, Chair of the Board, and Victor Dodig, President and Chief Executive Officer, to attend, vote and act on your behalf at the meeting and any continuation or adjournment of the meeting. You should be sure your proxyholder is attending the meeting and is aware they have been appointed to vote your shares. To appoint a proxyholder you must follow these steps:
|
Step 1 |
Insert your proxyholder’s name in the space provided on your proxy form and return it online, by fax or mail as described on the previous page. The person you appoint as your proxyholder does not need to be a CIBC shareholder. You may leave the voting section blank, or you may provide voting instructions that your proxyholder must follow. | |
|
Step 2 |
You must register your proxyholder by calling AST at 1 866 751-6315 (within North America) or 1 212 235-5754 (outside North America) by 10:30 a.m. on April 7, 2021. AST will provide your proxyholder with a control number to vote during the meeting. If you do not take the additional step of registering your proxyholder with AST, your proxyholder will not receive a control number to vote your shares during the meeting. | |
|
Step 3 |
Your proxyholder should log in at https://cibc.pividal.tv/agm2021 at least 15 minutes before the meeting starts and check browser compatibility. There must be internet connectivity for the duration of the meeting to vote. | |
|
Step 4 |
Your proxyholder should select “Vote” and a separate browser will open. Your proxyholder will enter a user name and password. The user name is the control number emailed to your proxyholder after you registered your proxyholder with AST. The password is “cibc2021” and is case sensitive. | |
If you want to change your vote before the meeting – If you change your mind on the voting instructions you sent, you may revoke your proxy in one of these ways:
| • | If you returned your proxy form by fax or mail, you should sign a written statement that you revoke your proxy, provide your new instructions (or authorize your lawyer in writing to sign the statement) and send it to CIBC Corporate Secretary’s Division, 199 Bay Street, Commerce Court West, Suite 4460, Toronto, Ontario M5L 1A2, before 10:30 a.m. (EDT) on April 7, 2021. |
| • | If you voted online, you may vote online again before 10:30 a.m. (EDT) on April 7, 2021, using the control number on your proxy form. |
|
How to vote if you are a non-registered shareholder
|
If you are a non-registered shareholder, you received a voting instruction form with a control number. If you did not receive this form, please contact the intermediary where your shares are registered. You may vote by proxy before the meeting using the voting instruction form that was sent to you or you may vote during the meeting by online ballot through the live webcast provided you follow the steps below to register yourself as a proxyholder.
If you want to vote by proxy before the meeting – To vote your shares by proxy, you may provide your voting instructions in one of these ways:
|
|
Online – go to www.proxyvote.com, enter the 16-digit control number on your voting instruction form and follow the instructions on the screen; |
| C I B C P R O X Y C I R C U L A R | 3 |
Table of Contents
Voting
|
|
Mail – complete your voting instruction form and return it in the envelope provided; or | |

|
Phone – call 1 800 474-7493 (English) or 1 800 474-7501 (French) and follow the prompts. | |
You must allow sufficient time for your intermediary to receive and act on your voting instructions by 10:30 a.m. (EDT) on April 7, 2021. Please check your voting instruction form for information on the deadline for returning your form.
If you want to vote during the meeting or appoint a proxyholder to vote for you – To attend and vote at our virtual meeting, or appoint a proxyholder to attend and vote for you, you or your proxyholder will be able to vote online in real time by completing an online ballot through the live webcast as long as you, or your proxyholder, are connected to the internet and follow these steps:
|
Step 1 |
If you want to attend and vote during the meeting you must insert your name in the space provided on your voting instruction form and return it online or by mail, as described above. Do not complete the voting section if you plan to vote at the meeting.
If you want to appoint someone other than yourself, or management’s nominees, John Manley and Victor Dodig, as your proxyholder, to attend, vote and act for you at the meeting and any continuation or adjournment of the meeting, you must insert their name in the space provided on your voting instruction form and return it online or by mail, as described above. You may leave the voting section blank, or you may provide voting instructions that your proxyholder must follow. You should be sure your proxyholder is attending the meeting and is aware they have been appointed to vote your shares. The person you appoint as your proxyholder does not need to be a CIBC shareholder. | |
|
Step 2 |
You must register yourself, or your proxyholder by calling AST at 1 866 751-6315 (within North America) or 1 212 235-5754 (outside North America) by 10:30 a.m. on April 7, 2021. AST will provide you, or your proxyholder, with a control number to vote during the meeting. If you do not take the additional step of registering with AST, you, or your proxyholder, will not receive a control number to vote your shares during the meeting.
If you are a non-registered shareholder in the United States and want to vote at the meeting, you must obtain a legal proxy form from your intermediary by following the steps on the voting instruction form sent to you, or if you have not received one, contact your intermediary to request a legal proxy form. After obtaining the legal proxy form, appoint yourself, or someone else, as proxyholder. For instructions on how to appoint yourself, or someone else, as proxyholder, see Step 1 above then register yourself or your proxyholder with AST.
Legal proxies may be returned to AST by email at proxyvote@astfinancial.com or by mail: AST Trust Company (Canada), Attn: Proxy Department, P.O. Box 721, Agincourt, Ontario M1S 0A1 and must be labeled “Legal Proxy”.
Please allow sufficient time for the return of your legal proxy by the cut-off date of 10:30 a.m. (EDT) on April 7, 2021. | |
|
Step 3 |
You or your proxyholder should log in at https://cibc.pividal.tv/agm2021 at least 15 minutes before the meeting starts and check browser compatibility. There must be internet connectivity for the duration of the meeting to vote. | |
|
Step 4 |
You or your proxyholder should select “Vote” and a separate browser will open. You or your proxyholder will enter a user name and password. The user name is the control number emailed to you or your proxyholder after you registered yourself or your proxyholder with AST. The password is “cibc2021” and is case sensitive. | |
If you want to change your vote before the meeting – If you change your mind on the voting instructions you sent through your intermediary and would like to change your vote or vote during the meeting, contact your intermediary to discuss whether this is possible and what procedures you need to follow.
| 4 | C I B C P R O X Y C I R C U L A R |
Table of Contents
Voting
Other voting information
How your proxyholder will vote – If you have given voting instructions in your proxy form or voting instruction form, your proxyholder must vote according to those instructions. If you have not given voting instructions, your proxyholder will decide how to vote. Your proxyholder will also decide how to vote on any amendment or variation to any of the matters in the notice of meeting or any matters that are properly brought before the meeting.
You can vote:
| FOR or WITHHOLD |
• on each director nominee
• on the appointment of auditors | |
| FOR or AGAINST |
• the advisory resolution on our executive compensation approach | |
| FOR, AGAINST or ABSTAIN |
• on the shareholder proposal | |
If the you blank or your space proxyholder on your proxy do not form give or specific voting instruction voting instructions, form, then or management’s you do not insert nominees, a name John in Manley and Victor Dodig will be appointed as your proxyholder and your shares will be voted:
| FOR |
• each director nominee listed in the Circular
• the appointment of Ernst & Young LLP as auditors
• the advisory resolution on our executive compensation approach | |
| AGAINST |
• the shareholder proposal | |
Confidentiality of your vote – To protect the confidentiality of your vote, AST counts proxies and tabulates the results independently and does not inform CIBC about how individual shareholders have voted except where required by law or where a shareholder’s comments are intended for management.
How we solicit proxies – We are soliciting proxies primarily by mail but CIBC employees may contact you by phone or in writing. CIBC pays any costs associated with proxy solicitation.
We reserve the right to accept late proxies and to waive or extend the proxy deadline with or without notice, but are under no obligation to accept or reject a late proxy.
If you want to attend the meeting as a guest – Non-registered shareholders and others who have not been duly appointed and registered with AST as proxyholders may attend the meeting as guests. Guests will not be able to vote at the meeting. You may attend the meeting as a guest in one of these ways:
|
|
Online – go to https://cibc.pividal.tv/agm2021 to join the live webcast; or | |
|
|
Phone – call 1 800 898-3989 passcode 6875673# (English) or 1 877 395-0279 passcode 9080240# (French) for an audio only experience. | |
| Go Paperless!
|
|
Sign up for electronic delivery of our meeting materials and other continuous disclosure documents for future years. Enrolling is easy and electronic delivery is secure, free, convenient and environmentally friendly.
If you are a registered shareholder, go to https://ca.astfinancial.com/edelivery, select Canadian Imperial Bank of Commerce, complete the consent form and hit “submit”.
If you are a non-registered shareholder, go to www.proxyvote.com and use the control number provided on your voting instruction form. |
| C I B C P R O X Y C I R C U L A R | 5 |
Table of Contents
Shareholders will be asked to vote on a shareholder proposal from MÉDAC, 82 Sherbrooke Street West, Montreal, Québec H2X 1X3, telephone: 514 286-1155, email: admin@medac.qc.ca. MÉDAC’s proposal and supporting argument, and the Board’s response, are set out below.
| Proposal No. 1
Circular Economy - It is proposed that the Bank produce a report on the loans it has made in recent years to support the circular economy. |
Argument
According to the Institut de l’environnement, du développement durable et de l’économie circulaire du Québec, the circular economy is “a system of production, trade and consumption designed to optimize the use of resources at all stages of the life cycle of a good or service, taking a circular approach, while reducing the environmental footprint and contributing to the well-being of individuals and communities.”1
Circular business models are rethinking systems and processes, starting at the design stage, to find opportunities to recycle, repair, reuse, repurpose or refurbish products and materials, in order to reduce waste and greenhouse gas emissions. In Canada, as a government publication states, many of our innovators and industries are seeing the benefits of using circular models to save money or open up new market opportunities – from turning pulp-and-paper-mill waste into renewable bioproducts to launching product buy-back programs that enhance customer interaction and recover usable materials such as metals and alloys. These innovative solutions are leading the way toward a more circular economy that benefits the environment while creating wealth and opportunities in industries.
This new approach cannot be developed without financing from Canadian banks. The objective of this proposal is to expand shareholders’ awareness of the Bank’s support for the growth of this new economy in recent years.
1 http://instituteddec.org/themes/economie-circulaire/
The Board recommends that you vote against this proposal.
At CIBC, we are a strong supporter of circular business models and understand the important role that they can play in reducing the environmental impact on society.
Since 2006, we have procured paper from sources that are environmentally and socially responsible, with a preference for FSC-certified stock. At present, CIBC recognizes FSC as the most rigorous third-party certification, which guarantees that purchased forest products come from responsibly managed forests. By purchasing FSC-certified paper products, we are supporting the circular economy by promoting the regeneration of vital natural resources in responsibly managed forests. In 2020, more than 94% of our total paper use was FSC-certified. We also reduced our internal paper consumption in 2020 by 25%.
In 2019, 100% of our used electronics in Canada, the United States, the United Kingdom and the Asia-Pacific region were donated, reused, recycled or upcycled. Where feasible, we redeployed used electronics within the organization. Equipment sent for recycling was broken down into its individual material components and recycled or upcycled into new, innovative products. In 2019, we diverted 538 tonnes of e-waste from landfill.
A portion of our used electronics is donated to a not-for-profit, charitable organization in Canada that is helping to meet the need for computers in schools, public libraries and not-for-profit learning organizations. We have been the largest corporate supporter of the program since our partnership began in 1993. In 2019, we donated approximately 5,000 computer components to the program, which diverted more than 37,000 kilograms of electronic waste from landfills.
Lastly, CIBC supports the circular economy through our procurement practices and supplier partnerships. Our Environmentally Responsible Procurement Standard describes our requirements for the procurement of goods and services that may be associated with significant adverse environmental impacts. Through our supplier questionnaire, we ask our suppliers about the reuse, repair, refurbishment, remanufacturing and recycling of their products, including take-back programs.
We currently do not report on clients supporting the circular economy in our public disclosure. The content of our disclosure is guided by a detailed materiality assessment where we receive input from investors, clients, employees, non-governmental organizations (NGOs) and professional organizations around material topics. Our disclosure will continue to change as new material topics, such as the circular economy, emerge.
| 6 | C I B C P R O X Y C I R C U L A R |
Table of Contents
Shareholder Proposals
Withdrawn Shareholder Proposals
Æquo Shareholder Engagement Services for Comité syndical national de retraite Bâtirente inc.
Æquo Shareholder Engagement Services submitted a shareholder proposal on behalf of Comité syndical national de retraite Bâtirente inc. requesting that CIBC adopt a corporate-wide target to achieve net-zero greenhouse gas emissions associated with its lending and investment activities as defined by best practice carbon accounting standards by 2050.
After discussion with CIBC, Æquo withdrew the proposal based on CIBC signing the requisite forms to join the Partnership for Carbon Accounting Financials and furthering the due diligence underway at CIBC during the course of the year, to measure emissions and develop metrics. CIBC will also consider setting targets in alignment with the Paris Climate Agreement and will report on its activities by the time of the next annual shareholders meeting.
MÉDAC
MÉDAC withdrew seven shareholder proposals after discussion with CIBC. At MÉDAC’s request, the text of each proposal, MÉDAC’s supporting statement and CIBC’s response are set out below.
| 1. Purpose and Commitment - It is proposed that the Board of Directors and management state the purpose of the Canadian Imperial Bank of Commerce as an organization and that a committee of the Board of Directors be instructed to monitor the implementation of the policies, commitments and initiatives put in place in order to give concrete expression to this new strategic orientation, in particular in connection with health, the environment, human resources, and stakeholder relations. |
Argument
In August 2019, the Business Roundtable, an association whose members are the CEOs of large American corporations, published a statement asserting that the purpose of a corporation could not be limited to the pursuit of profit alone, and had to take into account all of the stakeholders who may be affected by its activity: customers, employees, suppliers, communities and shareholders. If corporations are of no social utility, they lose all purpose.
The purpose of a corporation refers to the manner in which it intends to play a role in society, beyond just its economic activity. Jean-Dominique Senard, Chairman of the Board of Renault, has said: “A corporation’s purpose brings together past and present; it is its DNA. It has no economic significance; rather, it falls into the realm of vision and meaning.”1 Essentially, it is “the contribution that the corporation seeks to make to the key social, societal, environmental and economic issues in its business or industry by involving its key stakeholders.”
While many corporations have instituted a number of good initiatives in this direction over time, no purpose that would correspond to this definition can be discerned from the various institutional reports. In addition, there is no committee of the Board whose mandate is to coordinate all of the actions taken to give concrete expression to the purpose chosen. More specifically, that committee’s mission should be:
| • | to prepare and inform the work of the Board in implementing the policies, commitments and initiatives put in place by the Canadian Imperial Bank of Commerce; |
| • | in connection with its strategic orientations, in particular health, the environment, and human resources; |
| • | to dialogue with the various stakeholders regarding its progress in achieving those objectives and report to the Board on its meetings; |
| • | to examine the systems for non-financial accountability and oversight and the key results of the non-financial information published by the Canadian Imperial Bank of Commerce; |
| • | to inform shareholders about the various issues raised by its work. |
In order for this concept of purpose to take on concrete form and not remain simply a marketing slogan, it must be given tangible expression in an institution’s governance practices.
In conclusion, we would note that for a growing number of investors, organizations that have no social utility cease to have a purpose.
1 Jean-Dominique Senard: “Le sens et le pourquoi nourrissent la motivation”, Les Échos, June 8, 2018
https://business.lesechos.fr/directions-generales/innovation/innovation-sociale/0301754783119-jean-dominique-senard-president-de-michelin-le-sens-et-le-pourquoi-nourrissent-la-motivation-321483.php
| C I B C P R O X Y C I R C U L A R | 7 |
Table of Contents
Shareholder Proposals
Board statement
In 2019, CIBC stated, and engaged our 44,000 employees around, our common purpose – to help make your ambition a reality. The word ‘your’ in our purpose statement represents all our key stakeholders: clients, employees, communities and shareholders. Externally, our purpose is clearly stated and disclosed in our Annual Report, Management Proxy Circular and Sustainability Report.
Our shared purpose has served as a galvanizing north star for our bank to accelerate our transformation and guide everything we do – how we act, how we operate and how we make decisions as we ensure sustainable value creation for all our stakeholders. Through strong leader and employee engagement, we have made significant progress to embed our purpose across the organization. This includes embedding our purpose in our strategy, Code of Conduct, learning and development, and performance measurement and management for all employees.
As a cornerstone of our strategic framework and enterprise value framework, our purpose guides our business decisions, our commitment to stakeholders, and the concrete initiatives we have undertaken to ensure our purpose is a fundamental part of how we do business. From our strategy, to how we engage with our clients, to our corporate giving program – our purpose underpins everything we do.
While our Board of Directors has overseen our multi-year purpose journey, from initial development, to enterprise-wide team engagement and strategic initiatives, to how we measure progress, the Board has committed to mandating the Corporate Governance Committee with responsibility to oversee CIBC’s alignment to our purpose and related initiatives.
| 2. Human Resources Committee with Full Committee Status - It is proposed that the Board of Directors revise the mandate of its compensation or human resources committee to include a more specific statement of its responsibilities in connection with the health, safety and wellness of all its employees. |
Argument
Since the COVID-19 crisis began, employee health, safety and wellness have been a subject of growing concern for the senior management of our organizations. In addition to those concerns, employee talent development is important for meeting the challenges presented by new technologies.
The mandate and responsibilities of compensation or human resources committees should be adjusted in order to assure shareholders and other stakeholders that all strategies and policies are being put in place to address these concerns. At present, a large part of these committees’ work focuses on managing executive performance and compensation.
The purpose of this proposal is to ask that the Board of Directors revise the mandate of the human resources committee or create a specific committee whose mandate would be to assist it in carrying out its responsibilities in connection with deciding the vision and overseeing issues relating to employee health, safety and wellness, in particular as they relate to its strategies, policies, systems and practices in that regard and management of the associated risks. For example, the committee could be asked to address the following subjects: training and talent development, diversity, labour relations, pay equity, organizational culture, physical design of the workplace, impact of teleworking on employees’ health, both physical and mental, and employee engagement and satisfaction. These strategic aspects of human resources management should be disclosed in the management circular. This proposal is based on the standards and indicators adopted by the Sustainability Accounting Standards Board (SASB), which are often cited as a roadmap for standardizing human resources management information.
Employee health and wellness do not just supplement an organization’s strategy; they are essential to it, and that is our perspective in submitting this proposal.
Board statement
The mandate of our Management Resources and Compensation Committee (MRCC) outlines the MRCC’s responsibility to assist the Board of Directors in their global oversight of CIBC’s human capital strategy, including talent and total rewards, which incorporates health, safety and well-being, and the alignment with CIBC’s strategy, risk appetite and controls. The MRCC spends a significant portion of its time on human capital strategy, culture, talent management and succession planning.
The health, safety and well-being (including physical, emotional and financial well-being) of our team members is always a priority and this was even more critical during the COVID-19 pandemic. The Board, including our MRCC members, held a number of special meetings to discuss CIBC’s response to the pandemic. CIBC took a number of actions to support the health, safety and well-being of our team, such as: the immediate transition of the majority of our team members to work remotely, new safety measures and protocols for team members working onsite, continued pay for
| 8 | C I B C P R O X Y C I R C U L A R |
Table of Contents
Shareholder Proposals
employees while on precautionary leaves, per diem pay for team members working onsite, increase in the amount of interest-free loans offered to all team members, top-up pay for part-time and casual employees, virtual access to medical professionals for team members and their families, and on-site nurses at key locations.
The MRCC’s report is included starting on page 39 of this Circular and highlights the topics discussed in 2020. CIBC’s response to COVID-19 for employees, clients and communities is one of those topics and includes discussion of an employee pulse check survey and issues related to employee health, safety and well-being; our return to the office strategy, which also has a specific focus on employee health, safety and well-being; talent management and succession planning for key leadership roles; progress against CIBC’s inclusion and diversity strategy; CIBC’s gender pay analysis; an update on our purpose, brand and marketing programs; real estate transformation; launch of CIBC’s new recognition program; and updates on the launch of CIBC’s modern human resources platform.
For more detailed information, see our Message to our Fellow Shareholders and Compensation Discussion and Analysis (CD&A), starting on page 61, “Talent Management and Succession Planning” on page 83 and “Inclusion and Diversity” on page 84.
Given the MRCC’s current responsibilities pertaining to the health, safety and well-being of our team members, the Board has committed to including these words specifically in the MRCC’s mandate.
| 3. Diversity Target - It is proposed that the Bank adopt a target of more than 40% for the composition of its Board of Directors for the next five years. |
Argument
At the last annual meeting, this proposal received 9.0% support among shareholders who voted. At present, the Bank has adopted a target of 30% representation of each sex, while representation has exceeded 40% in the last two years.
Because banks often act as beacons of sound governance for small and medium-sized enterprises, failing to update the target may suggest that this objective is the ideal to be achieved. In fact, it is recognized that there are more competent women than there are positions to be filled and that various stereotypes and biases have impeded women’s access to these positions. With this in mind, it is therefore proposed that the Bank review its diversity policy with a view to raising the minimum representation of both sexes on their boards of directors to 40%.
Board statement
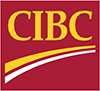
As set out in CIBC’s Board Diversity Policy, the Board seeks gender parity. Our Board is proud that the percentage of directors who are women will be 50% upon the election of the director nominees identified in this Circular at CIBC’s annual meeting. This calculation includes the CEO. In addition, the Board is proud to have announced on December 3, 2020, that CIBC’s successor Chair of the Board will be Katharine B. Stevenson, effective upon her election as a director at CIBC’s annual meeting.
The appointment or retirement of a single Board member has a notable impact on the percentage of men and women on the Board. In the coming years, that percentage will fluctuate as directors who reach their maximum term of service retire and new directors join. Therefore, the Board’s minimum target for gender diversity continues to be at least 30% women and at least 30% men.
In 2020, the Board updated CIBC’s Board Diversity Policy on the Board’s commitment to reflect the diversity of CIBC’s employees, clients and the communities CIBC serves. See “Inclusion and Diversity” on page 54 of our Circular for a detailed description of the Board Diversity Policy.
| 4. Virtual Meetings and Shareholders’ Rights - It is proposed that the Board of Directors adopt a policy stating the procedure for holding virtual annual meetings. |
Argument
Over the last year, the banks and a number of other organizations have relied on new teleconferencing technologies for holding their annual general meetings, because of the pandemic. While MÉDAC is well aware that these new technologies were often being used by the organizations for the first time, it and other individuals or organizations that are submitting shareholder proposals or that would like to make comments or suggestions at these virtual meetings have unfortunately experienced problems that limited the extent to which they were able to participate. More specifically, our impression of the 2020 virtual annual meetings was as follows: “We were unfortunately unable to speak at these meetings, since it was impossible for shareholders to access the microphone during the virtual meetings. The only people who spoke at the meetings were representatives [of the companies]: the chairperson (of the Board, and thus of the meeting), the CEOs, etc.”1 For small
| C I B C P R O X Y C I R C U L A R | 9 |
Table of Contents
Shareholder Proposals
shareholders, this limited presence at annual meetings can have an impact on the success of their proposals in the long term, since they are unable to advocate for their proposals in person and thus build additional support for potential submission of their proposals in future.
These threats are a source of concern about participation by shareholders who, whether because dialogue with the issuer was fruitless or for some other reason, take the route of submitting shareholder proposals in management circulars and at annual meetings.
Experience with shareholder participation and shareholder proposals over the last 20 years has demonstrated the added value that they bring to governance, for example regarding separation of the office of president and CEO from that of chair of the Board of Directors, advisory votes on executive compensation, disclosure of fees paid to auditors and compensation advisors, women’s representation on boards of directors and in executive positions, access to proxies for nominating directors, etc.
We recommend that the Board of Directors adopt a policy stating the procedure for shareholder participation at virtual annual meetings:
| • | oral presentation of shareholder proposals by the individuals or organizations that submitted them, lasting at least as long as the time needed to read the proposals; |
| • | visible electronic image of shareholders during their presentations and also of members of senior management; |
| • | opportunity to ask spontaneous questions following management presentations; |
| • | interaction in real time between shareholders and with the chairperson of the meeting; |
| • | in the event that questions raised by shareholders cannot be addressed at the annual meeting, management answers to be put online, on the company’s website and in SEDAR, within ten days after the meeting is held. |
1 https://medac.qc.ca/1798/
Board statement
In March 2020 and December 2020, CIBC and certain other financial institutions obtained a court order to permit a virtual annual meeting as a proactive and precautionary measure to support public health protocols related to the COVID-19 pandemic and to help protect the health and well-being of our employees, clients, shareholders and communities.
For our 2020 annual meeting, we established and disclosed procedures enabling shareholders to:
| • | access the meeting by phone or online; |
| • | vote online; |
| • | view online images of our Board members and management; |
| • | submit questions to our Board members and management in real time through the webcast and receive responses in real time; |
| • | have sufficient time throughout the meeting to submit questions or comments by opening the webcast for questions at the beginning of the meeting rather than when the Q&A period started; and |
| • | view an archived recording of the meeting at www.cibc.com when convenient for shareholders. |
We are pleased that attendance at our 2020 virtual annual meeting increased by 168% compared to our 2019 annual meeting. We thank MÉDAC and other shareholders for their feedback on our 2020 virtual meeting. We considered that feedback, the virtual meetings at other Canadian public companies, and available technological solutions.
For our 2021 virtual annual meeting, we are pleased that we have more capability to provide a better shareholder experience with improvements to the quality of video presentations during the meeting; opportunity for shareholders to present their proposals published in our Circular live by video; the ability for shareholders to make comments or ask questions verbally by phone as well as in writing through the online webcast; and the ability for shareholders to submit questions in advance of the meeting by email or mail. We look forward to the time we can host an in-person annual meeting but for those shareholders who prefer the online experience, we will continue to evolve our approach based on shareholder feedback and available technological solutions.
| 10 | C I B C P R O X Y C I R C U L A R |
Table of Contents
Shareholder Proposals
| 5. COVID-19 — Sharing the Burden of the Recovery Fairly - It is proposed that the Board of Directors disclose the actions taken by the organization to ensure that both the corporation’s executives and other employees bear their fair share of the economic recovery effort when the pandemic is over. |
Argument
The 2008 economic crisis left a bitter taste in the mouths of some shareholders. While their stock portfolios saw sharp declines in value, senior executives and directors continued to receive what some considered to be excessive pay increases unrelated to the corporation’s performance. That situation paved the way for the introduction of the non-binding advisory vote relating to executive compensation and sullied the reputations of a number of organizations.
The current pandemic and economic crisis has forced some corporations to make difficult decisions, including having to lay off employees both temporarily and permanently. When it comes to executives and Board members, little information has been disclosed concerning actions taken in their regard in order to reduce the number of people in those positions or their compensation.
The objective of this proposal is to ask that the Board of Directors disclose the following information in the next management circular:
| • | The percentage and number of people laid off, both permanently and temporarily, as a result of the pandemic, for both executive and other employees; |
| • | The percentage reduction in compensation applied to the two categories of employees; |
| • | The discretion enjoyed by the compensation committee or the Board of Directors for granting pay increases to executives even though some performance objectives have not been achieved because of the economic crisis and pandemic; |
| • | The adjustments made to the compensation policy for the coming years to reflect the declines in compensation that some of its employees may have suffered; |
| • | Any other adjustment made to the policy for granting stock or stock options to compensate executives for earnings losses suffered in 2020. |
Board statement
Throughout the COVID-19 pandemic, CIBC has been open in disclosing actions to support our employees, clients and communities. In February 2020, before the onset of the COVID-19 pandemic in Canada, we announced a restructuring charge of $339 million to cover severance from staff reductions affecting approximately 5% of employees in support of an enterprise-wide program to accelerate the delivery of our priorities, including improving efficiency. The restructuring was a difficult decision but necessary to adapt our cost structure in order to simplify, reinvest in and position our bank to further strengthen our relationships with our clients.
In March 2020, when the pandemic took hold with unexpected health and economic impacts, we put a temporary pause on implementing the planned staff reductions. We supported our employees by transitioning the majority of our team to work remotely and honoured our commitments to new hires and summer students. In addition, we provided a per diem payment to team members who were needed on site to support our clients, full pay to those whose hours were reduced temporarily to protect the health of our clients and employees, and additional paid time off.
As we disclose in our Circular, executive pay is based on Total Direct Compensation (TDC) targets which include annual salary and variable incentive awards. Targets are reviewed annually against market data and adjusted over time to ensure progression within the role is taken into account. The Board and MRCC review the TDC targets for the Named Executive Officers (NEOs) and other senior roles and only approve increases when required to appropriately align the executive’s pay with the market. In fiscal 2020, no reductions were made to salaries for executives or employees as a result of the COVID-19 pandemic. However, as discussed in our Message to our Fellow Shareholders and CD&A, based on CIBC’s fiscal 2020 performance, the calculated Business Performance Factor (BPF) was 94% and the Board approved a qualitative adjustment of -5% for our executives, in recognition of the impact of COVID-19 on our business, shareholders and communities. As a result, the BPF for our executives was 11% below our target and well below the maximum payout opportunity, while the reduction in the BPF for our employees was 10% below our target, ensuring that bonuses for those in more senior roles were impacted more than the rest of our employees during these challenging times.
We did not make any adjustments to the compensation policy to offset declines in compensation levels or to our stock option grant policy. As disclosed in our 2021 Proxy Circular, prior year stock options are out-of-the-money, shares are valued at less than their notional value, however, we have not made any adjustments to compensate our executives for losses suffered in 2020.
| C I B C P R O X Y C I R C U L A R | 11 |
Table of Contents
Shareholder Proposals
| 6. Global Warming - It is proposed that the Bank produce a report on the loans it has made to projects with polluting impacts that lead to a significant rise in global temperatures. |
Argument
The aim of the Paris Agreement is to keep the global temperature rise to 2°C and, if possible, to 1.5°C. According to Mark Carney, the former Governor of the Bank of Canada and the Bank of England, now the United Nations Special Envoy on Climate, the funds provided by banks and investment firms to support a number of large polluting projects will bring about an increase of 4°C, while the Paris Agreement seeks to keep the global temperature rise to 2°C or even 1.5°C.
He also says that the objectives of the Agreement are clear, but organizations’ policies are inconsistent; when the 20 largest energy companies in the world are responsible for a third of all carbon emissions on Earth, it is time, according to the Governor of the Bank of England, to put the brakes on the appetite of the financial system, which does not seem to be concerned about the climate emergency.
The purpose of this proposal is to ask that the Bank publish information about the amounts lent to projects that have significant impacts on global temperatures.
Board statement
CIBC has a strong commitment to climate action as demonstrated by our continued improvements in the areas of target setting, transparency and reporting. Communicating openly and regularly about our climate-related work is important to our stakeholders and it helps us track our progress and identify where we can improve. Our commitment to climate action was recognized by CDP, which gave us a score of A- for our 2020 disclosure - above the banking sector average score of B.
In 2019, we published our first report under the Task Force on Climate Related Financial Disclosure and committed to support $150 billion in environmental and sustainable finance by 2027. CIBC is committed to sustainable finance to help direct capital towards important development projects and innovations that address urgent environmental and social challenges. In 2020, we furthered our support and commitment:
| • | We increased lending and capital markets activities to businesses focused on sustainable development. |
| • | We developed a green bond framework with our second-party opinion from Sustainalytics and issued our first green bond in October 2020. |
| • | We supported $42.1 billion in environmental and sustainable financial activities, achieving a cumulative 28% of our 10-year target. |
| • | We committed to become carbon neutral and source 100% of our electricity from renewable sources by 2024. |
| • | We established a partnership with Bullfrog Power to offset 15,000 MWh of electricity use through the purchase of Ecologo certified renewable energy credits. |
| • | We disclosed our Environmental Policy and Lending Policy, which include a statement related to not financing oil and gas exploration in the Arctic National Wildlife Refuge (ANWR). |
| • | Through our partnerships with the United Nations Environment Program – Finance Initiative (UNEPFI) and the Canadian Standards Association (CSA), we are working with other stakeholders to enhance climate disclosure and ensure that financial instruments to support the transition to net zero include all sectors of our economy. |
| • | We committed $1.25 million over five years to the Institute for Sustainable Finance (ISF), which is a partnership between Canadian banks and Canadian universities to advance sustainable finance and put Canada in a leadership position related to the transition of net zero. |
We are committed to supporting our clients as they transition to a low carbon future and we recognize the important role banks will have in financing an orderly transition. According to Mark Carney, the former Governor of the Bank of Canada and the Bank of England, now the United Nations Special Envoy on Climate, “Certain people look at climate change and think they need to divest from energy companies, but they are very much part of the solution”. Transparency is extremely important and we have begun evaluating methodologies to measure the impact of our financing which we plan to disclose when available.
| 12 | C I B C P R O X Y C I R C U L A R |
Table of Contents
Shareholder Proposals
| 7. Discretion of the Board of Directors and the Compensation Committee - It is proposed that the management circular expressly set out the benchmarks used by both of these bodies for revising the objectives associated with executive compensation and performance. |
Argument
Over the last year, the health and economic crisis has certainly had an impact on key performance measures and the associated targets that executives had to meet during 2020. Have the Board of Directors and the human resources committee adjusted the objectives, if necessary, or have they used a special power to revise the compensation policy, given that performance in relation to the predetermined targets does not entirely reflect the overall quality of these executives’ performance?
The objective of this proposal is to ask that the corporation disclose precisely the adjustments made to key performance measures, to targets and to the associated compensation paid, for all executives, if such is the case.
Board statement
The CD&A section of CIBC’s Circular provides robust disclosure on our approach to executive compensation and performance. CIBC’s Board of Directors and the MRCC have not adjusted the objectives or used any special powers to revise the compensation policy in fiscal 2020.
As discussed on page 73 of our Circular, the Board and the MRCC have the discretion to adjust the calculated BPF based on qualitative factors including:
| • | relative performance vs. peers to assess our performance against key financial measures such as revenue and EPS growth; |
| • | risk, to ensure compensation is aligned with our risk appetite and objectives by considering risk outcomes with adjustments being made only to reduce the BPF (or individual awards); |
| • | unexpected outcomes and other items that either should be included or excluded from the performance that determines the BPF; and |
| • | any other factors the MRCC and the Board consider appropriate. |
When the Board and the MRCC make such discretionary adjustments to our BPF, we disclose the fact in our Circular. For example: on page 59 of our 2017 Circular, the first year that the BPF was introduced, we disclosed that the calculated BPF was 113.4% and the Board approved a qualitative adjustment of -4.4%, taking into consideration our Total Shareholder Return performance relative to our peer group and other items that the Board agreed should be considered in assessing the performance results used to calculate compensation; and on pages 60 and 71 of our 2018 Circular, we disclosed the fact that based on CIBC’s fiscal 2017 performance, the calculated BPF was 112.3% and that the Board approved a qualitative adjustment of -4.3% based on CIBC’s performance relative to our peer group.
As you can read in our current 2021 Circular, on page 62 of the Message to our Fellow Shareholders and page 74 in the CD&A, we have continued this approach to our disclosure and have noted that based on CIBC’s fiscal 2020 performance, the calculated BPF was 94% and that the Board approved a qualitative adjustment of -5%, in recognition of the impact of COVID-19 on our business, shareholders and our communities. As a result, the final BPF for our executives was 89%, 11% below our target and well below the maximum payout opportunity.
| C I B C P R O X Y C I R C U L A R | 13 |
Table of Contents
There are 14 director nominees. Each nominee was elected at the last annual meeting of shareholders on April 8, 2020, except Mary Lou Maher who is a new nominee.
On December 3, 2020, CIBC announced that The Honourable John Manley, current Chair of the Board, will retire at the close of our 2021 annual shareholders’ meeting and Katharine Stevenson will be the Chair of the Board effective on her re-election as a director at the meeting. In addition, Brent Belzberg retires at the close of our annual meeting. The Board would like to thank Mr. Manley and Mr. Belzberg for their years of dedicated service to the Board and to CIBC.
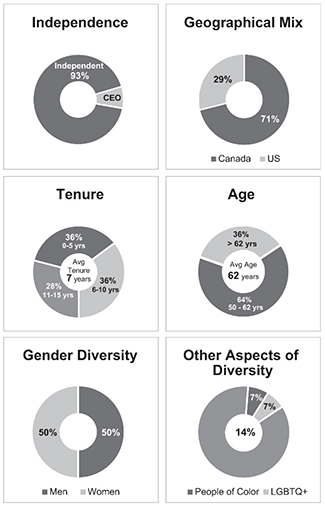
Information on each nominee starts on page 15. Below are key highlights about CIBC’s board composition if each nominee is elected by shareholders.
|
|
2020 Overall Attendance
100%
| |||
|
2020 Average votes FOR
99%
| ||||
|
Senior Leadership Experience
100%
| ||||
|
For information about the nomination process see the Statement of Corporate Governance Practices – “Director Nomination Process” and “Director Tenure” starting on page 49. | ||||
| 14 | C I B C P R O X Y C I R C U L A R |
Table of Contents
Directors
CHARLES J.G. BRINDAMOUR, Toronto, Ontario, Canada
| Skills: • Strategy | • Risk Management/Risk Governance |
|||||||
|
Director since: 2020
Age: 50
Independent
2020 Shareholder votes in favour: 99.5% |
• Financial Services |
• Corporate Responsibility/Sustainability |
||||||
| • Financial Expertise
|
• Public/Government Relations
|
|||||||
|
| ||||||||
|
Principal occupation: Chief Executive Officer, Intact Financial Corporation
| ||||||||
|
| ||||||||
|
Experience: Mr. Brindamour is Chief Executive Officer of Intact Financial Corporation, the largest provider of property and casualty insurance in Canada and a leading provider of specialty insurance in North America. Mr. Brindamour began his career with Intact in 1992 and has held progressively senior roles in Canada and abroad with Intact and its former affiliates. He was appointed President and Chief Executive Officer of Intact Financial Corporation in January 2008. Mr. Brindamour has deep experience in the North American financial services industry and is a respected business leader with more than 25 years of operating experience. In addition to the public company directorship noted below, Mr. Brindamour serves on the board of the Business Council of Canada, is Chair of the Board of the Geneva Association and co-founder of the Intact Centre for Climate Adaptation at the University of Waterloo. Mr. Brindamour is also a member of the 30% Club Canada.
| ||||||||
|
| ||||||||
|
Education: Mr. Brindamour is a graduate of Laval University in Actuarial Sciences and an Associate of the Casualty Actuarial Society and was awarded an honorary Doctorate from HEC Montréal.
| ||||||||
|
Other public company board directorships during last five years
| ||||||||
|
Current: |
Current committee memberships: | |||||||
|
Intact Financial Corporation – since 2008
|
– |
|||||||
|
| ||||||||
|
Former: |
||||||||
|
Hydro One – 2015 to 2018
|
||||||||
|
2020 Board and committee membership and attendance
| ||||||||
|
Overall attendance: 100% |
||||||||
|
Board (from February 2020): 6/6 |
||||||||
|
Risk Management Committee (from February 2020): 5/5 |
||||||||

|
CIBC equity - Mr. Brindamour meets the equity ownership guideline
| ||||||||||||||||||||
| Year | Shares(1) (#) |
DSUs(2) (#) |
Total Shares/DSUs (#) |
Total value of Shares/DSUs(3) ($) |
Total as a multiple of share ownership guideline(5) | |||||||||||||||
| 2021 |
12,532 | 0 | 12,532 | 1,362,479 | 1.8x | |||||||||||||||
| 2020 |
11,604 | 0 | 11,604 | 1,253,928 | 1.7x | |||||||||||||||
| C I B C P R O X Y C I R C U L A R | 15 |
Table of Contents
Directors
NANCI E. CALDWELL, Woodside, California, USA
| Skills: • Strategy | • Corporate Responsibility/Sustainability |
|||||||
|
Director since: 2015
Age: 62
Independent
2020 Shareholder votes in favour: 99.5% |
• Human Resources Management/ Compensation
|
• Information Technology |
||||||
|
| ||||||||
|
Principal occupation: Corporate Director
| ||||||||
|
| ||||||||
|
Experience: Ms. Caldwell was Executive Vice-President and Chief Marketing Officer for PeopleSoft, Inc. from 2002 through 2004. She held increasingly senior and executive sales and marketing roles at Hewlett Packard Company in Canada and the US from 1982 to 2001. Ms. Caldwell has served on several public and private technology company boards since 2005 and has more than 25 years of operating experience in the global technology and software industries. In addition to the public company directorships listed below, Ms. Caldwell has served as a director on private company boards including RedPrairie, Inc., now known as JDA Software, LiveOps Inc., Sophos, plc and Network General Corporation.
| ||||||||
|
| ||||||||
|
Education: Ms. Caldwell holds a Bachelor of Arts degree from Queen’s University and completed Western University’s Executive Marketing Management Program.
| ||||||||
|
Other public company board directorships during last five years
| ||||||||
|
Current: |
Current committee memberships: | |||||||
|
Citrix Systems, Inc. – since 2008
|
Independent Lead Director; Nominating and Corporate Governance (Chair); Compensation
|
|||||||
|
Equinix, Inc. – since 2015
|
Governance (Chair)
|
|||||||
|
| ||||||||
|
Former: |
||||||||
|
Donnelley Financial Solutions Inc. – 2016 to 2020
Talend – 2017 to 2020
|
||||||||
|
2020 Board and committee membership and attendance
| ||||||||
|
Overall attendance: 100% |
||||||||
|
Board: 7/7 |
||||||||
|
Management Resources and Compensation Committee: 6/6 |
||||||||

|
CIBC equity - Ms. Caldwell has until December 4, 2022 to meet the equity ownership guideline(4)
| ||||||||||||||||||||
| Year | Shares(1) (#) |
DSUs(2) (#) |
Total Shares/DSUs (#) |
Total value of Shares/DSUs(3) ($) |
Total as a multiple of share ownership guideline(5) | |||||||||||||||
| 2021 |
7,209 | 0 | 7,209 | 783,762 | 0.8x | |||||||||||||||
| 2020 |
4,582 | 0 | 4,582 | 495,131 | 0.5x | |||||||||||||||
| 16 | C I B C P R O X Y C I R C U L A R |
Table of Contents
Directors
MICHELLE L. COLLINS, Chicago, Illinois, USA
| Skills: • Financial Services
|
• Financial Expertise
|
|||||||
|
| ||||||||
|
Director since: 2017
Age: 60
Independent
2020 Shareholder votes in favour: 99.7% |
Principal occupation: President, Cambium LLC
| |||||||
|
| ||||||||
|
Experience: Ms. Collins has been President of Cambium LLC since 2007. Cambium is a Chicago-based business and financial advisory firm that serves small and medium-sized businesses. She brings 30 years of experience in corporate governance, investment banking, and private equity and has significant corporate board experience, having served as a director for several publicly traded companies across a wide range of industries. In addition to the public company directorship noted below, Ms. Collins is a director of CIBC Bancorp USA Inc., CIBC Bank USA, Health Care Service Corporation and Strategic Marketing Inc. and is a member of the Global Risk Institute. She is also a member of the Advisory Boards of Svoboda Capital Partners, LLC and Cedar Street Asset Management and has served on several philanthropic and non-profit boards, including the Chicago Public Library Foundation and the Museum of Science and Industry.
Ms. Collins received the 2018 Spirit of Erikson Award from Erikson Institute in recognition of her 22 years of service on the board, including as chair from 2014 to 2017, and her commitment to children and families that Erikson serves. Ms. Collins also received the 2018 Outstanding Leader Award for Business from the YWCA in recognition of her distinguished career in business, her community involvement and willingness to take on leadership positions on impacting women’s lives and racial justice.
| ||||||||
|
| ||||||||
|
Education: Ms. Collins holds a Bachelor of Arts degree in Economics from Yale University and a Master of Business Administration degree from Harvard University.
| ||||||||
|
Other public company board directorships during last five years
| ||||||||
|
Current: |
Current committee memberships: | |||||||
|
Ulta Beauty Inc. – since 2014
|
Audit; Nominating and Corporate Governance (Chair)
|
|||||||
|
| ||||||||
|
Former: |
||||||||
|
PrivateBancorp, Inc. – 2015 to 2017 (ceased to be a public company in 2017)
|
||||||||
|
2020 Board and committee membership and attendance
| ||||||||
|
Overall attendance: 100% |
||||||||
|
Board: 7/7 |
||||||||
|
Audit Committe (from April 2020): 3/3 |
||||||||
|
Risk Management Committee (to April 2020): 3/3 |
||||||||

|
CIBC equity - Ms. Collins meets the equity ownership guideline
| ||||||||||||||||||||
| Year | Shares(1) (#) |
DSUs(2) (#) |
Total Shares/DSUs (#) |
Total value of Shares/DSUs(3) ($) |
Total as a multiple of share ownership guideline(5) | |||||||||||||||
| 2021 |
1,357 | 10,064(6) | 11,421 | 1,241,691 | 1.2x | |||||||||||||||
| 2020 |
1,357 | 6,070(6) | 7,427 | 802,562 | 0.8x | |||||||||||||||
| C I B C P R O X Y C I R C U L A R | 17 |
Table of Contents
Directors
PATRICK D. DANIEL, Calgary, Alberta, Canada
| Skills: • Strategy | • Corporate Responsibility/Sustainability |
|||||||
|
Director since: 2009
Age: 74
Independent
2020 Shareholder votes in favour: 99.0% |
• Human Resources Management/Compensation
|
• Information Technology |
||||||
|
| ||||||||
|
Principal occupation: Corporate Director
| ||||||||
|
| ||||||||
|
Experience: Mr. Daniel was President and Chief Executive Officer of Enbridge Inc. from 2001 to 2012. Prior to his appointment as President and CEO, he was a senior executive officer of Enbridge Inc. or its predecessor since 1994. Mr. Daniel is a past recipient of Canada’s Outstanding CEO of the Year award and Chair of the Daniel Family Foundation.
| ||||||||
|
| ||||||||
|
Education: Mr. Daniel holds a Bachelor of Science degree from the University of Alberta and a Master of Science degree from the University of British Columbia.
| ||||||||
|
Other public company board directorships during last five years
| ||||||||
|
Former: |
||||||||
|
Capital Power Corporation – 2015 to 2018
Cenovus Energy Inc. – 2009 to 2020
|
||||||||
|
2020 Board and committee membership and attendance
| ||||||||
|
Overall attendance: 100% |
||||||||
|
Board: 7/7 |
||||||||
|
Corporate Governance Committe (to April 2020): 3/3 |
||||||||
|
Management Resources and Compensation Committee (Chair): 6/6 |
||||||||

|
CIBC equity - Mr. Daniel meets the equity ownership guideline
| ||||||||||||||||||||
| Year | Shares(1) (#) |
DSUs(2) (#) |
Total Shares/DSUs (#) |
Total value of Shares/DSUs(3) ($) |
Total as a multiple of share ownership guideline(5) | |||||||||||||||
| 2021 |
10,100 | 26,451 | 36,551 | 3,973,825 | 5.3x | |||||||||||||||
| 2020 |
10,100 | 23,504 | 33,604 | 3,631,248 | 4.8x | |||||||||||||||
| 18 | C I B C P R O X Y C I R C U L A R |
Table of Contents
Directors
LUC DESJARDINS, Toronto, Ontario, Canada
| Skills: • Strategy | • Corporate Responsibility/Sustainability |
|||||||
|
Director since: 2009
Age: 68
Independent
2020 Shareholder votes in favour: 98.1% |
• Financial Services |
• Legal/Regulatory/Compliance |
||||||
| • Financial Expertise |
• Public/Government Relations |
|||||||
| • Human Resources Management/Compensation
|
• Information Technology
|
|||||||
|
| ||||||||
|
Principal occupation: President and Chief Executive Officer, Superior Plus Corp.
| ||||||||
|
| ||||||||
|
Experience: Mr. Desjardins has been President and Chief Executive Officer of Superior Plus Corp., a Toronto-based public company that provides propane distribution and marketing services and specialty chemical production, since 2011. Mr. Desjardins was an equity partner at The Sterling Group, LP from 2008 to 2011 and President and Chief Executive Officer of Transcontinental Inc. from 2004 to 2008. In addition to the public company directorship noted below, Mr. Desjardins is a director of Gestion Jourdan SEC, a member of the Chief Executives Organization and a member of the 30% Club Canada. Mr. Desjardins is also a recipient of the Harvard Presidents’ Seminar “Leader of Leaders” award and the Presidents’ Program in Leadership diploma from Harvard Business School.
| ||||||||
|
| ||||||||
|
Education: Mr. Desjardins holds a Master of Business Administration degree from Université du Québec à Montréal and is a graduate of the Harvard Business School Management Development Program.
| ||||||||
|
Other public company board directorships during last five years
| ||||||||
|
Current: |
Current committee memberships: | |||||||
|
Superior Plus Corp. – since 2011
|
– |
|||||||
|
2020 Board and committee membership and attendance
| ||||||||
|
Overall attendance: 100% |
||||||||
|
Board: 7/7 |
||||||||
|
Audit Committee: 6/6 |
||||||||

|
CIBC equity - Mr. Luc Desjardins meets the equity ownership guideline
| ||||||||||||||||||||
| Year | Shares(1) (#) |
DSUs(2) (#) |
Total Shares/DSUs (#) |
Total value of Shares/DSUs(3) ($) |
Total as a multiple of share ownership guideline(5) | |||||||||||||||
| 2021 |
11,366 | 4,066 | 15,432 | 1,677,767 | 2.2x | |||||||||||||||
| 2020 |
11,366 | 2,451 | 13,817 | 1,493,065 | 2.0x | |||||||||||||||
| C I B C P R O X Y C I R C U L A R | 19 |
Table of Contents
Directors
VICTOR G. DODIG, Toronto, Ontario, Canada
| Skills: • Strategy | • Human Resources Management/Compensation |
|||||||
|
Director since: 2014
Age: 55
Not Independent See “Director Independence” on page 45.
2020 Shareholder votes in favour: 99.7% |
• Financial Services |
• Corporate Responsibility/Sustainability |
||||||
| • Financial Expertise |
• Public/Government Relations |
|||||||
| • Risk Management/Risk Governance
|
||||||||
|
| ||||||||
|
Principal occupation: President and Chief Executive Officer, CIBC
| ||||||||
|
| ||||||||
|
Experience: Mr. Dodig has been President and Chief Executive Officer of the CIBC group of companies since September 2014. He brings more than 25 years of extensive business and banking experience, including leading CIBC’s Wealth Management, Asset Management and Retail Banking businesses. Over his career, Mr. Dodig also led several businesses with UBS and Merrill Lynch in Canada and internationally, and was a management consultant with McKinsey & Company. Mr. Dodig serves on the Board of the C.D. Howe Institute and the Business Council of Canada. Mr. Dodig is a vocal advocate for inclusion in the workplace and is chair of the Inclusion and Diversity Leadership Council at CIBC and a co-chair of the BlackNorth Initiative. He serves as a member of the global Catalyst Board of Directors, is past Chair of the Catalyst Canada Advisory Board and past Chair of the 30% Club Canada. In 2017, Mr. Dodig was recognized as a Catalyst Canada Honours Champion for his leadership in advancing gender diversity.
| ||||||||
|
| ||||||||
|
Education: Mr. Dodig holds a Master of Business Administration degree from the Harvard Business School where he was recognized as a Baker Scholar, a Diploma from the Institut d’études politiques in Paris and a Bachelor of Commerce degree from the University of Toronto (St. Michael’s College). He has received an honorary Doctor of Laws degree from Ryerson University.
| ||||||||
|
Other public company board directorships during last five years
| ||||||||
|
None
|
||||||||
|
2020 Board and committee membership and attendance
| ||||||||
|
Overall attendance: 100% |
||||||||
|
Board: 7/7 |
||||||||

Mr. Dodig does not receive compensation for his services as a director. For information on Mr. Dodig’s equity ownership, see “Equity ownership of NEOs at October 31, 2020” on page 88 of the Circular.
| 20 | C I B C P R O X Y C I R C U L A R |
Table of Contents
Directors
KEVIN J. KELLY, Toronto, Ontario, Canada
| Skills: • Strategy | • Human Resources Management/Compensation |
|||||||
|
Director since: 2013
Age: 65
Independent
2020 Shareholder votes in favour: 99.8% |
• Financial Services |
• Corporate Responsibility/Sustainability |
||||||
| • Financial Expertise |
• Legal/Regulatory/Compliance |
|||||||
| • Risk Management/Risk Governance
|
• Public/Government Relations
|
|||||||
|
| ||||||||
|
Principal occupation: Corporate Director
| ||||||||
|
| ||||||||
|
Experience: Mr. Kelly was Lead Director of the Ontario Securities Commission from 2010 to 2012 and Commissioner from 2006 to 2010. He has more than 30 years’ experience in wealth and asset management in Canada and the US. Mr. Kelly was President and Co-Chief Executive Officer of Wellington West Capital, Inc. from 2004 to 2005, President of Fidelity Brokerage Company in Boston from 2000 to 2003, President of Fidelity Investments Institutional Services Company from 1997 to 2000, President of Fidelity Canada from 1996 to 1997, and President and Chief Executive Officer of Bimcor Inc. from 1992 to 1996. Mr. Kelly is a director of CIBC Bancorp USA Inc., CIBC Bank USA and CIBC National Trust Company. Mr. Kelly is also a member of the Canadian Public Accountability Board.
| ||||||||
|
| ||||||||
|
Education: Mr. Kelly holds a Bachelor of Commerce degree from Dalhousie University.
| ||||||||
|
Other public company board directorships during last five years
| ||||||||
|
None
|
||||||||
|
2020 Board and committee membership and attendance
| ||||||||
|
Overall attendance: 100% |
||||||||
|
Board: 7/7 |
||||||||
|
Audit Committee (to April 2020): 3/3 |
||||||||
|
Management Resources and Compensation Committee (from Aril 2020): 3/3 |
||||||||

|
CIBC equity - Mr. Kelly meets the equity ownership guideline
| ||||||||||||||||||||
| Year | Shares(1) (#) |
DSUs(2) (#) |
Total Shares/DSUs (#) |
Total value of Shares/DSUs(3) ($) |
Total as a multiple of share ownership guideline(5) | |||||||||||||||
| 2021 |
6,202 | 19,133 | 25,335 | 2,754,421 | 3.7x | |||||||||||||||
| 2020 |
6,202 | 15,428 | 21,630 | 2,337,338 | 3.1x | |||||||||||||||
| C I B C P R O X Y C I R C U L A R | 21 |
Table of Contents
Directors
CHRISTINE E. LARSEN, Montclair, New Jersey, USA
| Skills: • Financial Services | • Human Resources Management/Compensation |
|||||||
|
Director since: 2016
Age: 59
Independent
2020 Shareholder votes in favour: 99.8% |
• Risk Management/Risk Governance
|
• Information Technology
|
||||||
|
| ||||||||
|
Principal occupation: Corporate Director
| ||||||||
|
| ||||||||
|
Experience: Ms. Larsen was Senior Advisor to the Chief Executive Officer, First Data Corporation, a global payment technology solutions company, from January to March 2019. From 2013 to December 2018, Ms. Larsen was Executive Vice-President, Chief Operations Officer of First Data Corporation. Ms. Larsen held various progressively senior roles at JPMorgan Chase & Co. from 2006 to 2013. Before joining JPMorgan Chase, she held several leadership roles at Citigroup for 12 years. In addition to the public company directorship noted below, Ms. Larsen is a member of the Board of Trustees of Syracuse University and a member of the Borough of Manhattan Community College (CUNY) Foundation Board.
| ||||||||
|
| ||||||||
|
Education: Ms. Larsen holds a Master of Library Science degree from Syracuse University (University Fellow) and a Bachelor of Arts (Phi Beta Kappa) degree from Cornell College.
| ||||||||
|
Other public company board directorships during last five years
| ||||||||
|
Current: |
Current committee memberships: | |||||||
|
Paya Holdings, Inc. – since 2020
|
Audit & Risk; Compensation (Chair) |
|||||||
|
2020 Board and committee membership and attendance
| ||||||||
|
Overall attendance: 100% |
||||||||
|
Board: 7/7 |
||||||||
|
Risk Management Committee: 6/6 |
||||||||

|
CIBC equity - Ms. Larsen has until April 5, 2023 to meets the equity ownership guideline(4)
| ||||||||||||||||||||
| Year | Shares(1) (#) |
DSUs(2) (#) |
Total Shares/DSUs (#) |
Total value of Shares/DSUs(3) ($) |
Total as a multiple of share ownership guideline(5) | |||||||||||||||
| 2021 |
8,083 | 0 | 8,083 | 878,784 | 0.9x | |||||||||||||||
| 2020 |
5,868 | 0 | 5,868 | 634,096 | 0.7x | |||||||||||||||
| 22 | C I B C P R O X Y C I R C U L A R |
Table of Contents
Directors
NICHOLAS D. LE PAN, Ottawa, Ontario, Canada
| Skills: • Strategy | • Human Resources Management/Compensation |
|||||||
|
Director since: 2008
Age: 69
Independent
2020 Shareholder votes in favour: 97.4% |
• Financial Services |
• Legal/Regulatory/Compliance |
||||||
| • Financial Expertise |
• Public/Government Relations |
|||||||
| • Risk Management/Risk Governance
|
||||||||
|
| ||||||||
|
Principal occupation: Corporate Director
| ||||||||
|
| ||||||||
|
Experience: Mr. Le Pan was Superintendent of Financial Institutions for Canada from 2001 to 2006 and led the OSFI Supervision Sector, including the supervision programs for banks and other deposit-taking institutions from 1997 to 2000. He is past chair of the Canadian Public Accountability Board, which regulates auditors of public companies. Mr. Le Pan has been involved in various international and Canadian regulatory coordination efforts, including as Chairman of the Basel Accord Implementation Group and Vice-Chairman of the Basel Committee on Banking Supervision. He was actively involved in Group of Thirty reports, making recommendations on a new paradigm for relations between bank supervisors and boards enhancing oversight of risk culture and enhancing culture and conduct in systemically important banks. Mr. Le Pan is a member of Oliver Wyman’s North American Financial Services Senior Advisory Board and Chairs the C.D. Howe Institute Financial Services Research Initiative.
| ||||||||
|
| ||||||||
|
Education: Mr. Le Pan holds a Bachelor of Arts (Honours) degree in Economics from Carleton University and a Master of Arts degree in Economics from the University of Toronto.
| ||||||||
|
Other public company board directorships during last five years
| ||||||||
|
None
|
||||||||
|
2020 Board and committee membership and attendance
| ||||||||
|
Overall attendance: 100% |
||||||||
|
Board: 7/7 |
||||||||
|
Audit Committee (Chair): 6/6 |
||||||||

|
CIBC equity - Mr. Le Pan meets the equity ownership guideline
| ||||||||||||||||||||
| Year | Shares(1) (#) |
DSUs(2) (#) |
Total Shares/DSUs (#) |
Total value of Shares/DSUs(3) ($) |
Total as a multiple of share ownership guideline(5) | |||||||||||||||
| 2021 |
4,946 | 9,945 | 14,891 | 1,618,950 | 2.2x | |||||||||||||||
| 2020 |
3,852 | 9,354 | 13,206 | 1,427,040 | 1.9x | |||||||||||||||
| C I B C P R O X Y C I R C U L A R | 23 |
Table of Contents
Directors
MARY LOU MAHER, Toronto, Ontario, Canada
| Skills: • Financial Expertise | • Human Resources Management/Compensation |
|||||||
|
New Director Nominee
Age: 60
Independent
2020 Shareholder votes in favour: n/a |
• Risk Management/Risk Governance
|
|||||||
|
| ||||||||
|
Principal occupation: Corporate Director
| ||||||||
|
| ||||||||
|
Experience: Ms. Maher was Canadian Managing Partner, Quality and Risk, KPMG Canada from 2017 to February 2021. She was also Global Head of Inclusion and Diversity KPMG International for the same period. Ms. Maher has been with KPMG since 1983, in various executive and governance roles including Chief Financial Officer and Chief Human Resources Officer. She is a member of the World Economic Forum focused on Human Rights - the business perspective, the Alzheimer’s Society of Toronto, and has served on other not-for-profit boards including as Chair of Women’s College Hospital and member of the CPA Ontario Council. Ms. Maher created KPMG Canada’s first ever National Diversity Council and was the executive sponsor of pride@kpmg. Ms. Maher received the Wayne C. Fox Distinguished Alumni Award from McMaster University in recognition of her work on inclusion and diversity, was inducted into the Hall of Fame for the WXN 100 Top Most Powerful Women in Canada, received a Lifetime Achievement Award from Out on Bay Street (Proud Strong), and the Senior Leadership Award for Diversity from the Canadian Centre for Diversity and Inclusion.
| ||||||||
|
| ||||||||
|
Education: Ms. Maher holds a Bachelor of Commerce degree from McMaster University and holds the designation of FCPA, FCA
| ||||||||
|
Other public company board directorships during last five years
| ||||||||
|
None
|
||||||||
|
2020 Board and committee membership and attendance
| ||||||||
|
n/a |
||||||||

|
CIBC equity - Ms. Maher has until April 7, 2026 to meet the equity ownership guideline
| ||||||||||||||||||||
| Year | Shares(1) (#) |
DSUs(2) (#) |
Total Shares/DSUs (#) |
Total value of Shares/DSUs(3) ($) |
Total as a multiple of share ownership guideline(5) | |||||||||||||||
| 2021 |
1,028 | 0 | 1,028 | 111,764 | 0.2x | |||||||||||||||
| 24 | C I B C P R O X Y C I R C U L A R |
Table of Contents
Directors
JANE L. PEVERETT, West Vancouver, British Columbia, Canada
| Skills: • Strategy | • Legal/Regulatory/Compliance |
|||||||
|
Director since: 2009
Age: 62
Independent
2020 Shareholder votes in favour: 98.1% |
• Financial Services |
• Public/Government Relations |
||||||
| • Financial Expertise
|
||||||||
|
| ||||||||
|
Principal occupation: Corporate Director
| ||||||||
|
| ||||||||
|
Experience: Ms. Peverett was President and Chief Executive Officer of British Columbia Transmission Corporation (BCTC) from 2005 to 2009 and Chief Financial Officer of BCTC from 2003 to 2005. She held progressively senior finance, regulatory and executive roles with Westcoast Energy Inc. from 1988 to 2003 and was President and Chief Executive Officer of Union Gas Limited from 2001 to 2003. In addition to the public company directorships listed below, Ms. Peverett is Chair of the Board of CSA Group.
| ||||||||
|
| ||||||||
|
Education: Ms. Peverett holds a Bachelor of Commerce degree from McMaster University and a Master of Business Administration degree from Queen’s University. She is a Certified Management Accountant, a Fellow of the Society of Management Accountants and a member of the Institute of Corporate Directors with the designation ICD.D.
| ||||||||
|
Other public company board directorships during last five years
| ||||||||
|
Current: |
Current committee memberships: | |||||||
|
Canadian Pacific Railway Limited – since 2016
|
Audit and Finance (Chair); Corporate Governance and Nominating |
|||||||
|
Capital Power Corporation – since 2019
|
Health, Safety & Environment; People, Culture, and Governance |
|||||||
|
Northwest Natural Gas Company – since 2007
|
Finance (Chair); Governance; Organization and Executive Compensation; Public Affairs and Environmental Policy
|
|||||||
|
| ||||||||
|
Former: |
||||||||
|
Encana Corporation – 2003 to 2017
Hydro One Limited – 2015 to 2018
|
||||||||
|
2020 Board and committee membership and attendance
| ||||||||
|
Overall attendance: 100% |
||||||||
|
Board: 7/7 |
||||||||
|
Audit Committee: 6/6 |
||||||||
|
Corporate Governance Committee: 5/5 |
||||||||

|
CIBC equity - Ms. Peverett meets the equity ownership guideline
| ||||||||||||||||||||
| Year | Shares(1) (#) |
DSUs(2) (#) |
Total Shares/DSUs (#) |
Total value of Shares/DSUs(3) ($) |
Total as a multiple of share ownership guideline(5) | |||||||||||||||
| 2021 |
1,249 | 22,386 | 23,635 | 2,569,597 | 3.4x | |||||||||||||||
| 2020 |
542 | 21,054 | 21,596 | 2,333,664 | 3.1x | |||||||||||||||
Other:
Ms. Peverett was a director of Postmedia Network Canada Corp. (Postmedia) between April 2013 and January 2016. On October 5, 2016, Postmedia completed a recapitalization transaction pursuant to a court approved plan of arrangement under the Canada Business Corporations Act under which, approximately US$268.6 million of debt was exchanged for shares that represented approximately 98% of the outstanding shares at that time. Additionally, Postmedia repaid, extended and amended the terms of its outstanding debt obligations pursuant to the recapitalization transaction.
| C I B C P R O X Y C I R C U L A R | 25 |
Table of Contents
Directors
KATHARINE B. STEVENSON, Toronto, Ontario, Canada
| Skills: • Financial Services | • Human Resources Management/Compensation |
|||||||
|
Director since: 2011
Age: 58
Independent
2020 Shareholder votes in favour: 99.6% |
• Financial Expertise |
• Corporate Responsibility/Sustainability |
||||||
| • Risk Management/Risk Governance
|
||||||||
|
| ||||||||
|
Principal occupation: Corporate Director
| ||||||||
|
| ||||||||
|
Experience: Ms. Stevenson brings extensive business and corporate governance experience, having served on numerous public company and not-for-profit boards in Canada and the US over the past two decades, where she has consistently assumed leadership roles. Previously, Ms. Stevenson was a financial executive in the telecommunications and banking sectors. In addition to the public company directorships listed below, Ms. Stevenson is a director of CIBC Bancorp USA Inc. and CIBC Bank USA and a member of the Board of Directors and the Executive Committee of St. Michael’s Hospital Foundation. Ms. Stevenson was named one of the 2018 Top 100 Most Powerful Women in Canada.
| ||||||||
|
| ||||||||
|
Education: Ms. Stevenson holds a Bachelor of Arts degree (Magna Cum Laude) from Harvard University and is a member of the Institute of Corporate Directors with the designation ICD.D.
| ||||||||
|
Other public company board directorships during last five years
| ||||||||
|
Current: |
Current committee memberships: | |||||||
|
Capital Power Corporation – since 2017
|
Audit (Chair); People, Culture, and Governance |
|||||||
|
Open Text Corporation – since 2018
|
Audit
|
|||||||
|
| ||||||||
|
Former: |
||||||||
|
CAE Inc. – 2007 to 2019
|
||||||||
|
2020 Board and committee membership and attendance
| ||||||||
|
Overall attendance: 100% |
||||||||
|
Board: 7/7 |
||||||||
|
Corporate Governance Committee (Chair): 5/5 |
||||||||
|
Management Resources and Compensation Committee: 6/6 |
||||||||

|
CIBC equity - Ms. Stevenson meets the equity ownership guideline
| ||||||||||||||||||||
| Year | Shares(1) (#) |
DSUs(2) (#) |
Total Shares/DSUs (#) |
Total value of Shares/DSUs(3) ($) |
Total as a multiple of share ownership guideline(5) | |||||||||||||||
| 2021 |
27,211 | 0 | 27,211 | 2,958,380 | 3.9x | |||||||||||||||
| 2020 |
22,052 | 0 | 22,052 | 2,382,939 | 3.2x | |||||||||||||||
| 26 | C I B C P R O X Y C I R C U L A R |
Table of Contents
Directors
CMARTINE TURCOTTE, Ad.E., Verdun, Québec, Canada
| Skills: • Corporate Responsibility/Sustainability | • Public/Government Relations |
|||||||
|
Director since: 2014
Age: 60
Independent
2020 Shareholder votes in favour: 99.8% |
• Legal/Regulatory/Compliance
|
• Information Technology
|
||||||
|
| ||||||||
|
Principal occupation: Corporate Director
| ||||||||
|
| ||||||||
|
Experience: Ms. Turcotte was Vice Chair, Québec of BCE Inc. and Bell Canada from 2011 to 2020. She was Chief Legal Officer of BCE from 1999 to 2008 and of Bell Canada from 2003 to 2008 and was Executive Vice-President and Chief Legal and Regulatory Officer of BCE and Bell Canada from 2008 to 2011. Ms. Turcotte has more than 25 years of strategic, legal and regulatory experience. In addition to the public company directorships noted below, Ms. Turcotte is Chair of Théâtre Espace Go Inc., a member of the Information Technology and Human Resources committees of the Board of Governors of McGill University, the Board of Directors of The Institute of Corporate Directors Québec, the McGill University Bicentennial Campaign Cabinet Executive Committee (and Faculty Advisory Board of the McGill Faculty of Medicine). Ms. Turcotte is a past recipient of the Canadian General Counsel Lifetime Achievement award, was inducted into the Hall of Fame of the Top 100 Most Powerful Women in Canada, received the title of Advocatus Emeritus from the Québec Bar Association for professional excellence and was awarded both the Queen’s Gold and Diamond Jubilee Medals in recognition of her contributions to Canada. Effective June 1, 2020, Ms. Turcotte was appointed Chairperson of the Judicial Compensation and Benefits Commission.
| ||||||||
|
| ||||||||
|
Education: Ms. Turcotte holds a Bachelor degree in Civil Law and Common Law from McGill University and a Master of Business Administration degree from the London Business School.
| ||||||||
|
Other public company board directorships during last five years
| ||||||||
|
Current: |
Current committee memberships: | |||||||
|
Empire Company Limited/Sobeys Inc. – since 2012
|
Audit; Corporate Governance (Chair); Nominating (Chair)
|
|||||||
|
2020 Board and committee membership and attendance
| ||||||||
|
Overall attendance: 100% |
||||||||
|
Board: 7/7 |
||||||||
|
Corporate Governance Committee: 5/5 |
||||||||
|
Management Resources and Compensation Committee: 6/6 |
||||||||

|
CIBC equity - Ms. Turcotte meets the equity ownership guideline
| ||||||||||||||||||||
| Year | Shares(1) (#) |
DSUs(2) (#) |
Total Shares/DSUs (#) |
Total value of Shares/DSUs(3) ($) |
Total as a multiple of share ownership guideline(5) | |||||||||||||||
| 2021 |
412 | 17,489 | 17,901 | 1,946,197 | 2.6x | |||||||||||||||
| 2020 |
412 | 14,783 | 15,195 | 1,641,972 | 2.2x | |||||||||||||||
| C I B C P R O X Y C I R C U L A R | 27 |
Table of Contents
Directors
BARRY L. ZUBROW, West Palm Beach, Florida, USA
| Skills: • Strategy | • Corporate Responsibility/Sustainability |
|||||||
|
Director since: 2015
Age: 67
Independent
2020 Shareholder votes in favour: 99.8% |
• Financial Services |
• Legal/Regulatory/Compliance |
||||||
| • Financial Expertise |
• Public/Government Relations |
|||||||
| • Risk Management/Risk Governance
|
• Information TechnologyRelations
|
|||||||
|
| ||||||||
|
Principal occupation: President, ITB LLC
| ||||||||
|
| ||||||||
|
Experience: Mr. Zubrow has been President of investment-management firm ITB LLC since 2003. He is also a lecturer at the University of Chicago Law School. Mr. Zubrow was a senior executive at JPMorgan Chase & Co. and The Goldman Sachs Group, Inc. and has more than 35 years of financial services experience. Mr. Zubrow is a director of CIBC Bancorp USA Inc., CIBC Bank USA, MIO Partners and Accellix. He serves on the Advisory Board of the Promontory Financial Group (an IBM company). Mr. Zubrow is also a director of the Juvenile Law Center and Berklee College of Music, Emeritus Manager of Haverford College, and a member of the Council on Foreign Relations.
| ||||||||
|
| ||||||||
|
Education: Mr. Zubrow holds a Bachelor of Arts degree from Haverford College where he is an Emeritus Manager and former Chairman of the Board of Managers. He has a Master of Business Administration degree from the University of Chicago Graduate School of Business and a J.D. degree from the University of Chicago Law School.
| ||||||||
|
Other public company board directorships during last five years
| ||||||||
|
Former: |
||||||||
|
Arc Logistics LP – 2013 to 2018
|
– |
|||||||
|
2020 Board and committee membership and attendance
| ||||||||
|
Overall attendance: 100% |
||||||||
|
Board: 7/7 |
||||||||
|
Risk Management Committe (Chair) 6/6 |
||||||||

|
CIBC equity - Mr. Zubrow meets the equity ownership guideline
| ||||||||||||||||||||
| Year | Shares(1) (#) |
DSUs(2) (#) |
Total Shares/DSUs (#) |
Total value of Shares/DSUs(3) ($) |
Total as a multiple of share ownership guideline(5) | |||||||||||||||
| 2021 |
9,294 | 323 | 9,617 | 1,045,560 | 1.0x | |||||||||||||||
| 2020 |
7,793 | 0 | 7,793 | 842,112 | 0.9x | |||||||||||||||
| (1) | “Shares” refers to the number of CIBC common shares a nominee beneficially owned, or exercised control or direction over on February 11, 2021 (the date of information in our 2021 management proxy circular) and February 17, 2020 (the date of information in our 2020 management proxy circular). |
| (2) | “DSUs” refers to the number of deferred share units held by a nominee on February 11, 2021 and February 17, 2020. |
| (3) | “Total value of Shares/DSUs” for 2021 and 2020 is calculated by multiplying “Total Shares/DSUs” by the closing price of a CIBC common share on the Toronto Stock Exchange on December 31, 2020 ($108.72) and December 31, 2019 ($108.06). |
| (4) | In May 2019 the Board increased the director equity ownership guideline from $600,000 to $750,000. Directors who are still in the process of meeting the original guideline were given additional time to meet the new guideline. |
| (5) | “Total as a multiple of share ownership guideline” was calculated by dividing “Total value of Shares/DSUs” by the equity share ownership guideline of $750,000. Directors who are US citizens and whose primary residence is in the US received their fees in US dollars and their share ownership guideline is in US dollars. For purposes of calculating US director ownership against the guideline, the US dollar amount has been converted to Canadian dollars using the WM/Reuters exchange rate of US$1.00 = C$1.3321 for 2020 and US$1.00 = C$1.2984 for 2019 reflecting the foreign exchange rate on the last trading day of the fiscal year. |
| (6) | Includes DSUs earned for serving on the Boards of CIBC Bancorp USA Inc. and CIBC Bank USA. |
| 28 | C I B C P R O X Y C I R C U L A R |
Table of Contents
Directors
Board and committee meeting frequency and overall attendance in fiscal 2020
During fiscal 2020, directors attended 100% of regular Board and committee meetings, as set out below. For individual director nominee attendance, see biographical information starting on page 15. For information on director attendance expectations, see the Statement of Corporate Governance Practices – “Director Tenure – Meeting attendance record” on page 50.
| Number of Meetings | Overall Attendance | |||||
| Board and Committees | Regular | Special | at Regular Meetings | |||
| Board |
7 | 8 | 100% | |||
| Audit Committee |
6 | 5 | 100% | |||
| Corporate Governance Committee |
5 | - | 100% | |||
|
Management Resources and Compensation Committee |
6 | - | 100% | |||
|
Risk Management Committee |
6 | 7 | 100% | |||
Attendance of directors not standing for re-election
Brent Belzberg and John Manley are retiring from the Board. During fiscal 2020, Mr. Manley attended 100% of all regular Board meetings and Mr. Belzberg attended 100% of all regular Board, Corporate Governance Committee and Risk Management Committee meetings.
Director attendance at the annual meeting of shareholders
CIBC encourages each member of the Board to attend its annual meeting of shareholders. All 2020 director nominees attended CIBC’s 2020 annual meeting.
Director nominee independence
The Board determined that each director nominee is independent except Victor Dodig because he is President and Chief Executive Officer of CIBC.
All members of the Board committees are independent under the Board’s independence standards. These standards incorporate the Affiliated Persons (Banks) Regulations, the New York Stock Exchange (NYSE) corporate governance rules, Canadian Securities Administrators (CSA) corporate governance guidelines and the Office of the Superintendent of Financial Institutions (Canada) Corporate Governance Guideline provisions and are available at www.cibc.com. For information about how the Board determines director independence, see the Statement of Corporate Governance Practices – “Director Independence” on page 45.
| C I B C P R O X Y C I R C U L A R | 29 |
Table of Contents
Directors
Director nominee skills and experience
The table below shows the skills and experience of our director nominees in areas the Board considers important to CIBC. All director nominees have skills and experience acquired from senior level leadership in major organizations.
| Skills and Experience |
|
|
|
|
|
|
|
|
|
|
|
|
|
| ||||||||||||||
|
Strategy |
✓ | ✓ | ✓ | ✓ | ✓ | ✓ | ✓ | ✓ | ✓ | |||||||||||||||||||
|
Financial Services |
✓ | ✓ | ✓ | ✓ | ✓ | ✓ | ✓ | ✓ | ✓ | ✓ | ||||||||||||||||||
|
Financial Expertise |
✓ | ✓ | ✓ | ✓ | ✓ | ✓ | ✓ | ✓ | ✓ | ✓ | ||||||||||||||||||
|
Risk Management/Risk Governance |
✓ | ✓ | ✓ | ✓ | ✓ | ✓ | ✓ | ✓ | ||||||||||||||||||||
|
Human Resources Management/ Compensation |
✓ | ✓ | ✓ | ✓ | ✓ | ✓ | ✓ | ✓ | ✓ | |||||||||||||||||||
|
Corporate Responsibility/Sustainability |
✓ | ✓ | ✓ | ✓ | ✓ | ✓ | ✓ | ✓ | ✓ | |||||||||||||||||||
|
Legal/Regulatory/Compliance |
✓ | ✓ | ✓ | ✓ | ✓ | ✓ | ||||||||||||||||||||||
|
Public/Government Relations |
✓ | ✓ | ✓ | ✓ | ✓ | ✓ | ✓ | ✓ | ||||||||||||||||||||
|
Information Technology |
✓ | ✓ | ✓ | ✓ | ✓ | ✓ | ||||||||||||||||||||||


CIBC’s director compensation program is designed to attract and retain people with the skills and experiences to act as directors of CIBC. The Corporate Governance Committee evaluates director compensation against companies in the financial services sector that are of comparable size, scope, market presence and complexity to CIBC. Based on these criteria, CIBC director compensation is targeted within the range of its comparator group: Bank of Montreal, National Bank of Canada, Royal Bank of Canada, Bank of Nova Scotia, the Toronto-Dominion Bank, Manulife Financial and Sun Life Financial.
The Corporate Governance Committee reviews CIBC’s director compensation program annually to make sure it aligns with the interests of our shareholders, is competitive with the market, and reflects best practices. The Committee also considers the evolving complexity of CIBC businesses and its regulatory environment; the increasing engagement of directors with regulators and other stakeholders; the workload and time commitment of Board members; and CIBC’s ability to remain competitive with peers in attracting and retaining directors with the expertise and experiences required for CIBC’s Board. Based on its review in May 2020, the Committee did not recommend any changes to director compensation for fiscal 2020.
| 30 | C I B C P R O X Y C I R C U L A R |
Table of Contents
Directors
Director compensation components
The table below sets out the components of director compensation for fiscal 2020(1).
| Annual Retainers |
||||
| Cash (may be taken as cash, shares or DSUs(2)) |
||||
| Chair of the Board(3) |
$195,000 | |||
| Other Directors(4) |
$100,000 | |||
| Equity (may be taken as shares or DSUs) |
||||
| Chair of the Board(3) |
$230,000 | |||
| Other Directors |
$115,000 | |||
| Committee Chair |
$50,000 | |||
| Committee membership in excess of one(5)
|
|
$15,000
|
| |
| Meeting Attendance and Travel Fees |
||||
| Ad-hoc committees (per meeting) |
$1,000 | |||
| Travel (per trip)(6)
|
|
$2,000
|
| |
| (1) | CIBC directors who are US citizens and whose primary residence is in the US are paid their director compensation in US dollars. |
| (2) | A DSU (deferred share unit) is a bookkeeping entry credited quarterly to an account maintained for a director. The value of a director’s DSU account is payable in cash in a lump sum when he or she is no longer a director of CIBC or a subsidiary or affiliate of CIBC. The redemption value of a DSU is based on the value of the common shares of CIBC determined in accordance with the director equity plans. Directors are entitled to dividend equivalent payments that are credited quarterly in the form of additional DSUs at the same rate as dividends on common shares. DSUs do not entitle the holder to voting or other shareholder rights. |
| (3) | The Chair of the Board receives no compensation as a director of CIBC other than the annual cash and equity retainers for the Chair of the Board. |
| (4) | Paid for service on the Board and one committee. |
| (5) | Paid for service on each additional committee in excess of one (excluding special ad-hoc committees and committee chairs). |
| (6) | Paid for attending Board or committee meetings in person, where the distance from the director’s primary place of residence to the meeting location is 300 km or more. |
Directors are reimbursed for travel, accommodation and other out-of-pocket expenses incurred in attending meetings and carrying out their duties as a director. In addition, CIBC pays the cost for administration of the office of the Chair of the Board. Independent directors do not receive stock options and do not participate in CIBC’s pension plans.
Restrictions on trading and hedging CIBC Securities
Directors are prohibited from using hedging strategies to offset a decrease in the market value of CIBC securities. For more information see page 89 “Restrictions on trading and hedging CIBC Securities”.
| C I B C P R O X Y C I R C U L A R | 31 |
Table of Contents
Directors
Director compensation table
The table below sets out total compensation paid to independent directors during fiscal 2020 and includes compensation paid to directors who were asked to serve as directors on the board of CIBC subsidiaries.
| Fees Earned(2) | Allocation of Fees | |||||||||||||||||
| Annual Retainer |
Committee Member and Chair Retainers |
Share-Based | ||||||||||||||||
| Name(1) (all figures in C$) |
Equity | Cash |
Travel Fees |
All Other Compensation |
Total Compensation |
Cash |
Common Shares |
DSUs | ||||||||||
| Brent S. Belzberg(3) |
115,000 | 100,000 | 15,000 | - | 3,000 | 233,000 | - | - | 233,000 | |||||||||
| Charles J.G. Brindamour(4) |
86,250 | 75,000 | - | - | - | 161,250 | - | 161,250 | - | |||||||||
| Nanci E. Caldwell(3) |
154,273 | 134,150 | - | 5,451 | 3,998 | 297,872 | 143,599 | 154,273 | - | |||||||||
| Michelle L. Collins(3) (5) |
154,273 | 134,150 | - | 5,451 | 263,464 | 557,338 | 253,782 | - | 303,556 | |||||||||
| Patrick D. Daniel |
115,000 | 100,000 | 50,000 | 4,000 | - | 269,000 | 154,000 | - | 115,000 | |||||||||
| Luc Desjardins(3) |
115,000 | 100,000 | - | - | 3,000 | 218,000 | 103,000 | - | 115,000 | |||||||||
| Linda S. Hasenfratz(3) (6) |
57,500 | 50,000 | 3,000 | - | 10,000 | 120,500 | 56,750 | 53,750 | - | |||||||||
| Kevin J. Kelly(5) |
115,000 | 100,000 | - | - | 179,834 | 394,834 | 179,834 | - | 215,000 | |||||||||
| Christine E. Larsen |
154,273 | 134,150 | - | 5,451 | - | 293,874 | 106,064 | 187,810 | - | |||||||||
| Nicholas D. Le Pan |
115,000 | 100,000 | 50,000 | 4,000 | - | 269,000 | 154,000 | 4115,000 | - | |||||||||
| John P. Manley(5) |
230,000 | 195,000 | - | - | 246,439 | 671,439 | 246,439 | 425,000 | ||||||||||
| Jane L. Peverett |
115,000 | 100,000 | 15,000 | 4,000 | - | 234,000 | 119,000 | 115,000 | - | |||||||||
| Katharine B. Stevenson(5) |
115,000 | 100,000 | 50,000 | - | 104,903 | 369,903 | 254,903 | 115,000 | - | |||||||||
| Martine Turcotte |
115,000 | 100,000 | 15,000 | 4,000 | - | 234,000 | 88,250 | - | 145,750 | |||||||||
| Barry L. Zubrow(3) (5) |
154,273 | 134,150 | 67,075 | 5,451 | 225,163 | 586,112 | 431,838 | 154,274 | - | |||||||||
|
TOTAL |
1,910,842 | 1,656,600 | 265,075 | 37,804 | 1,039,801 | 4,910,122 | 2,291,459 | 1,481,357 | 1,127,306 | |||||||||
| (1) | Mr. Dodig did not receive compensation for his services as a director of CIBC. See “Summary compensation table” on page 85 for Mr. Dodig’s compensation as President and Chief Executive Officer. |
| (2) | Amounts paid in US dollars to directors of CIBC who are US citizens and whose primary residence is in the US were converted to Canadian dollars using the WM/Reuters exchange rate as follows: |
| • | US$1.00 = C$1.33 on February 13, 2020 |
| • | US$1.00 = C$1.39 on May 14, 2020 |
| • | US$1.00 = C$1.34 on August 13, 2020 |
| • | US$1.00 = C$1.30 on November 12, 2020 |
| (3) | The amounts reported under “All Other Compensation” include fees of $1,000 per meeting paid to Brent Belzberg, Nanci Caldwell, Luc Desjardins and Linda Hasenfratz for participating in three meetings of a Board committee established under CIBC’s Chair of the Board Succession and Selection Planning Process, and fees of $1,000 per meeting paid to Michelle Collins and Barry Zubrow for participating in four meetings on anti-money laundering with management. For US resident directors, these amounts were converted to US dollars at the rates set out in note (2). |
| (4) | Mr. Brindamour joined the Board on February 20, 2020. |
| (5) | The amounts reported under “All Other Compensation” include fees paid for serving on the boards and committees of CIBC Bancorp USA Inc. and CIBC Bank USA. Each of Ms. Collins, Mr. Kelly, Mr. Manley and Mr. Zubrow received US$135,000 for serving as a director of those subsidiaries. Ms. Collins received US$20,000 for serving as Chair of the Audit Committee. Mr. Zubrow received US$30,000 for serving as Chair of the Risk Committee. Mr. Manley received US$50,000 for serving as Chair of the Board. Ms. Stevenson joined the boards of CIBC Bancorp USA Inc. and CIBC Bank USA on April 7, 2020 and earned US$78,750 for serving as a director of those subsidiaries. US dollar amounts have been converted to Canadian dollars for purposes of this disclosure using the WM/Reuters exchange rate of US$1.00 = C$1.3321 reflecting the foreign exchange rate on the last trading day of fiscal 2020. Ms. Collins elected to receive some of this compensation in the form of DSUs. |
| (6) | Ms. Hasenfratz retired from the Board on April 8, 2020. In honour of her service, a $10,000 donation was made to a registered Canadian charity selected by Ms. Hasenfratz. |
| 32 | C I B C P R O X Y C I R C U L A R |
Table of Contents
Directors
Director equity ownership guideline
The Board expects directors to hold at least 7.5 times the annual cash retainer of $100,000 ($750,000) in CIBC common shares and/or DSUs. Directors are expected to reach this ownership level within five years after joining the Board.
Directors must take $115,000 of their $215,000 annual retainer (54%) in either CIBC common shares or DSUs. The Chair of the Board must take $230,000 of the Chair’s $425,000 annual retainer (54%) in either CIBC common shares or DSUs. The requirement to receive these amounts in equity continues even after directors have reached the equity ownership guideline. Directors may also elect to take all or a portion of their cash retainers in CIBC common shares or DSUs.
Each nominee who is currently a director has met the equity ownership guideline except for Nanci Caldwell and Christine Larsen who are acquiring equity under our director compensation program to reach the equity ownership guideline by their target date.
Each director nominee’s equity ownership interest in CIBC is set out in their biography on pages 15 to 28.
| C I B C P R O X Y C I R C U L A R | 33 |
Table of Contents
The Board has four committees: Audit Committee, Corporate Governance Committee, Management Resources and Compensation Committee and Risk Management Committee. Each committee reports highlights of its 2020 activities below. Committee mandates can be found at www.cibc.com.
Report of the Audit Committee
The key responsibilities of the Audit Committee are to: (i) fulfill its responsibilities for reviewing the integrity of CIBC’s financial statements, related management’s discussion and analysis (MD&A) and internal control over financial reporting; (ii) monitor the system of internal control; (iii) monitor CIBC’s compliance with legal and regulatory requirements as they pertain to responsibilities under the Audit Committee Mandate; (iv) select the external auditors for shareholder approval; (v) review the qualifications, independence and audit quality of the external auditors and the performance of CIBC’s internal auditors; and (vi) act as the audit committee for certain federally regulated subsidiaries.
| Responsibility | 2020 Highlights | |
| Financial Reporting and Internal Controls |
• Recommended Board approval of quarterly and annual financial statements. • Reviewed significant areas of accounting and disclosure judgment and key audit matters, including those relating to: - the measurement of expected credit losses under IFRS 9; - the assessment of goodwill impairment; - the valuation of financial instruments; - acquisitions and dispositions; and - tax, legal and restructuring-related provisions and disclosures. • Reviewed the implementation of International Financial Reporting Standards (IFRS) 16, Leases effective November 1, 2019 and the status of future accounting standards, including IFRS 17 Insurance Contracts. • Reviewed reports on internal controls over financial reporting from management and EY. • Received regular updates from Internal Audit and Finance on the control environment. • Reviewed the quarterly and annual fraud management report and approved the Fraud Risk Management Framework. • Reviewed the status of the interest rate reform project, including related accounting developments. • Monitored the impact of the pandemic on CIBC’s internal control environment. |
| 34 | C I B C P R O X Y C I R C U L A R |
Table of Contents
Board Committee Reports
|
External Auditors |
• Approved the scope of services, terms of engagement, annual audit plan and the associated fees of EY. | |
| • Reviewed and discussed with EY key areas of risk of material misstatement of the financial statements, application of professional skepticism and significant auditor judgment, including changes necessary to respond to the pandemic. | ||
| • Discussed quarterly review results and annual audit findings with EY and reviewed key audit matters set out in the auditor’s report. | ||
| • Reviewed the annual written statement of objectivity and independence provided by EY. | ||
|
• Pre-approved all EY engagements for non-audit services and fees in accordance with the Scope of Services of the Shareholders’ Auditors Policy. | ||
| • Commenced succession planning for EY audit partners. | ||
| • Completed a Periodic Comprehensive Review of the External Auditor and recommended their re-appointment for shareholder approval. | ||
|
• Updated and monitored audit quality indicators. | ||
|
Internal Audit Function |
• Approved the Internal Audit organizational framework and charter and Internal Audit’s audit plan including the audit scope and the overall risk assessment and monitored its execution, including changes necessary to respond to the pandemic. | |
| • Reviewed Internal Audit’s report of CIBC’s risk governance framework and its assessment of the oversight by Finance, Risk Management and Compliance. | ||
| • Reviewed the performance goals and the effectiveness, and approved the mandate of the Chief Auditor. | ||
| • Recommended Board approval of the re-appointment of the Chief Auditor. | ||
| • Reviewed and approved succession plans for the Chief Auditor. | ||
|
• Monitored Internal Audit compliance with regulatory expectations. | ||
|
Finance Function |
• Approved the Finance organizational framework and recommended Board approval of Finance’s financial plan and staff resources. | |
| • Reviewed management’s assessment of the effectiveness of the Finance function. | ||
| • Reviewed the performance goals and the effectiveness, and approved the mandate of and the succession plans for the Chief Financial Officer (CFO). | ||
|
• Held special meetings to discuss the impact of the pandemic on Finance’s operating environment as well as expected credit loss allowances and other areas involving significant judgement. | ||
|
Whistleblower Procedures |
• Approved the Whistleblower Policy and Procedures. | |
|
• Reviewed management’s quarterly Whistleblower Report. | ||
|
Legal and Regulatory Developments |
• Received regular updates from the legal department on legal matters. | |
|
• Monitored regulatory developments, including updates from stakeholders on the effect of evolving regulatory expectations on CIBC’s businesses, as well as regular briefings on the results of regulatory reviews, benchmarking exercises and possible pandemic impacts. |
| C I B C P R O X Y C I R C U L A R | 35 |
Table of Contents
Board Committee Reports
| Subsidiary Oversight |
• Acted as audit committee for certain federally regulated subsidiaries of CIBC. | |
| • Reviewed the financial statements and management reports from the CFO of these regulated subsidiaries. | ||
|
• Reviewed and discussed audit findings with EY and management. |
Members of the Committee are Nicholas Le Pan (Chair), Michelle Collins, Luc Desjardins and Jane Peverett. Each Committee member is independent and “financially literate” as required by the NYSE and the CSA, and all members of the Committee are “audit committee financial experts” under the U.S. Securities and Exchange Commission (SEC) rules.
Audit Committee voluntarily reports on SEC matters
Management has primary responsibility for CIBC’s financial statements and the overall reporting process, including CIBC’s system of internal controls. The external auditors, EY, are responsible for performing an independent audit of CIBC’s consolidated financial statements in accordance with Canadian generally accepted auditing standards and the standards of the Public Company Accounting Oversight Board (United States) (PCAOB), and an independent audit of internal control over financial reporting in accordance with the standards of the PCAOB. These audits serve as a basis for the auditors’ opinions included in the Annual Report addressing whether the consolidated financial statements fairly present CIBC’s financial position, results of operations, and cash flows in conformity with IFRS as issued by the International Accounting Standards Board. The Audit Committee’s responsibility is to monitor and oversee these processes.
The Audit Committee has reviewed and discussed the audited consolidated financial statements with management. In addition, the Audit Committee discussed with EY the matters required to be discussed by the PCAOB’s Statement on Auditing Standards No. 3101(Communications With Audit Committees) and Canadian Auditing Standard 260 (Communication With Those Charged With Governance) including matters relating to the conduct of the audit of CIBC’s consolidated financial statements and the assessment of the effectiveness of CIBC’s internal control over financial reporting under Section 404 of the US Sarbanes-Oxley Act of 2002.
EY provided to the Audit Committee a formal written statement describing all relationships between EY and CIBC that may reasonably be thought to bear on independence as required by PCAOB Rule 3526. The formal written statement includes confirmation that EY is independent within the meaning of the CPA Code of Professional Conduct of the Chartered Professional Accountants of Ontario and can continue to act as the Independent Registered Public Accounting Firm for CIBC.
Based on this review and these discussions, the Audit Committee recommended to the Board that the audited consolidated financial statements (i) be included in CIBC’s annual report filed with Canadian securities regulators on SEDAR (together with the external audit opinions on the consolidated financial statements prepared in accordance with both Canadian generally accepted auditing standards and the standards of the PCAOB and the external audit opinion on internal control over financial reporting in accordance with the standards of the PCAOB) for the year ended October 31, 2020 and (ii) be included in CIBC’s annual report on Form 40- F (together with the external audit opinion on the consolidated financial statements prepared in accordance with the standards of the PCAOB and the external audit opinion on internal control over financial reporting in accordance with the standards of the PCAOB) for the year ended October 31, 2020 for filing with the SEC. The Audit Committee also approved, subject to shareholder appointment, the selection of EY as CIBC’s external auditors.
This report has been adopted and approved by the members of the Audit Committee: Nicholas Le Pan (Chair), Michelle Collins, Luc Desjardins and Jane Peverett.
| 36 | C I B C P R O X Y C I R C U L A R |
Table of Contents
Board Committee Reports
Annual assessment of external auditors’ effectiveness and service quality
As part of its oversight responsibilities, the Audit Committee conducts an annual assessment of EY’s effectiveness and service quality. For the 2020 audit period, the Audit Committee’s assessment considered such factors as (i) EY’s independence, including lead audit partner rotation requirements, objectivity and professional skepticism; (ii) the quality of their engagement team; (iii) the quality of their communications and interactions; (iv) the overall quality of the service provided; and (v) a review of management’s evaluation. The Audit Committee concluded that they were satisfied with the quality of audit services provided by EY for 2020.
As a safeguard against the concern that the long tenure of the same external audit firm may create institutional familiarity threats which may impede the ability of the external auditor to exercise appropriate professional skepticism, the Audit Committee conducted a comprehensive review of EY in 2020. The Audit Committee concluded from this review that they were satisfied with the quality of audit services provided by EY.
The Board recommends that Ernst & Young LLP be appointed by shareholders as auditors of CIBC until the close of the next annual meeting of shareholders.
Fees for services provided by external auditors
The fees EY billed for professional services for the fiscal years ended October 31, 2020 and October 31, 2019 are set out below.
| Fees billed by EY | ||||||||
| (unaudited, $ millions) | 2020 | 2019 | ||||||
| Audit fees(1) |
24.0 | 22.3 | ||||||
| Audit related fees(2) |
2.2 | 1.7 | ||||||
| Tax fees(3) |
1.4 | 1.9 | ||||||
|
Other(4) |
0 | 0.1 | ||||||
| Total |
27.6 | 26.0 | ||||||
| (1) | For the audit of CIBC’s annual financial statements and the audit of certain of its subsidiaries, as well as other services normally provided by the principal auditor in connection with CIBC’s statutory and regulatory filings. Audit fees also include the audit of internal controls over financial reporting under the standards of the PCAOB. |
| (2) | For the assurance and related services that are reasonably related to the performance of the audit or review of CIBC’s financial statements, including accounting consultation, various agreed upon procedures and translation of financial reports. |
| (3) | For tax compliance and advisory services. |
| (4) | Includes fees for non-audit services. |
Pre-approval policy
The Audit Committee pre-approves work performed by CIBC’s auditors. This approval process is explained in CIBC’s Policy on the Scope of Services of the Shareholders’ Auditors which is described under “Pre-Approval Policies and Procedures” in CIBC’s Annual Information Form dated December 2, 2020, and available at www.cibc.com.
| C I B C P R O X Y C I R C U L A R | 37 |
Table of Contents
Board Committee Reports
Report of the Corporate Governance Committee
The key responsibilities of the Corporate Governance Committee are to oversee (i) CIBC’s corporate governance framework; (ii) CIBC Board and committee composition; (iii) evaluation of CIBC’s Board, committees and director effectiveness; (iv) director orientation and continuing education; and (v) CIBC’s corporate responsibility reporting, stakeholder engagement framework and matters relating to conduct.
| Responsibility | 2020 Highlights | |
| Governance |
• Oversaw CIBC’s stakeholder engagement process with shareholders, shareholder advocacy groups, proxy governance advisory firms and regulators to foster transparent relationships and discuss CIBC’s governance practices and emerging trends. • Reviewed governance regulatory developments, including the Federal Government’s Financial Consumer Protection Framework, and the Capital Markets Modernization Task Force report and recommendations. • Approved new provisions in the Board Diversity Policy on the Board’s commitment to reflect the background and demographics of CIBC employees and the clients and communities CIBC serves such as people of colour, Indigenous peoples, persons with disabilities and members of the LGBTQ+ community. • Reviewed director compensation and, based on market trends, made no changes. • Reviewed and recommended Board approval of CIBC’s Statement of Corporate Governance Practices, responses to shareholder proposals, and governance disclosure in CIBC’s management proxy circular. • Continued to focus on board governance and structure for CIBC Bancorp USA Inc. and CIBC Bank USA. • Reviewed CIBC’s Sustainability Report, including disclosure of new environmental and social metrics and targets. • Reviewed reports on managing Environment, Social and Governance (ESG) performance and realizing ESG opportunities. • Reviewed CIBC climate reports in accordance with the requirements of the Task Force on Climate-Related Financial Disclosure as well as updates on CIBC’s $150 billion environmental and sustainable finance target. | |
| Board and Committee Composition |
• Reviewed the composition, size, and collective skills and experiences of the boards of CIBC, CIBC Bancorp USA Inc. and CIBC Bank USA. • Reviewed and recommended Board approval of changes in committee composition based on principles that guide committee membership and committee chair succession to balance seasoned views with fresh perspectives while fostering diversity and ensuring the committees retain core skills and experiences among their members. • Continued Board renewal activities with support from an external consultant; considered director candidates who reflect broad aspects of diversity and experience; recruited a new director for nomination to the Board; and continued to focus on Board member succession planning. • Reviewed and recommended Board approval of director nominees and determined their independence for service on the boards of CIBC, CIBC Bancorp USA Inc. and CIBC Bank USA. |
| 38 | C I B C P R O X Y C I R C U L A R |
Table of Contents
Board Committee Reports
| Board and Committee Effectiveness |
• Oversaw the evaluation of the effectiveness of the Board, committees, Chair of the Board and Chief Executive Officer with the support of an independent external advisor, developed action plans and reviewed progress reports. • Oversaw the administration of CIBC’s continuing education program for directors and exceeded the Board’s target of having at least 10% of time at Board and committee meetings dedicated to director development. • Reviewed the effectiveness of management reports to the Board and committees and enhanced reporting to facilitate more time for meaningful discussion at meetings. | |
| Conduct |
• Reviewed conduct and culture risk reports. • Reviewed the administration of and adherence to CIBC’s Code of Conduct by team members and the Board. • Acted as the conduct review committee for CIBC and its federally regulated Canadian subsidiaries and, as such, reviewed reports on related parties and policies to foster compliance with Bank Act (Canada) (the Bank Act) on related parties that may materially affect us, and reviewed the associated procedures for promoting compliance with the Bank Act. • Reviewed, approved and monitored procedures for complying with consumer provisions under the Bank Act. • Reviewed reports on oversight items related to the Financial Consumer Protection Framework and Bill C-86. • Reviewed the effectiveness of CIBC’s procedures to handle client complaints and changes to improve client experience with the complaint resolution process. • Reviewed CIBC’s global privacy management framework, privacy issue resolution; privacy risks mitigation in CIBC initiatives and privacy regulatory developments. |
Members of the Committee are Katharine Stevenson (Chair), Brent Belzberg, Jane Peverett and Martine Turcotte. All members of the Committee are independent.
Report of the Management Resources and Compensation Committee
The Committee is responsible for assisting the Board of Directors in their global oversight of CIBC’s human capital strategy, including talent and total rewards, and the alignment with CIBC’s strategy, risk appetite and controls.
The Chair of the Committee and the Chair of the Board have written a letter to shareholders about CIBC’s approach to executive compensation, starting on page 61 of this Circular.
| Responsibility | 2020 Highlights | |
| Performance, Compensation, Employment Arrangements and Ownership |
• Reviewed, approved or recommended Board approval of the Chief Executive Officer’s (CEO), Executive Committee’s (EXCO) and other key officers’ fiscal 2020 goals and measures, performance and compensation. • Approved compensation for employees whose Total Direct Compensation (TDC) exceeds the materiality threshold determined by the Committee. • Recommended Board approval in February 2020 of changes to compensation targets for EXCO members taking on new roles or expanded accountabilities. • Reviewed adherence to share ownership guidelines for executives and Managing Directors (MDs). • Approved changes to the Executive and MD Severance Guidelines. • Reviewed a report on CIBC’s Gender Pay Analysis. |
| C I B C P R O X Y C I R C U L A R | 39 |
Table of Contents
Board Committee Reports
| Talent and Succession |
• Recommended Board approval of changes to the EXCO and other key roles by executing on our succession plans to strategically address current and future needs. • Recommended Board approval of the succession plans for the CEO and EXCO and reviewed progress on development plans for succession candidates for key leadership roles to ensure a robust pipeline. • Recommended Board approval of the CEO emergency preparedness plan and the CEO succession planning process. | |
| Human Capital Strategy and Culture |
• Reviewed key strategic initiatives of CIBC’s Human Capital Strategy, as well as broader initiatives covering people, culture and brand, including: (i) CIBC’s response to the COVID-19 pandemic for employees, clients and communities, as well as our return to the office strategy with a focus on the health, safety and well-being of our employees; (ii) an update of our purpose, brand and marketing programs; (iii) our real estate transformation; (iv) the launch of CIBC’s new recognition program, MomentMakers; (v) an update on the launch of CIBC’s modern human resources platform; and (vi) progress on CIBC’s inclusion and diversity strategy to ensure that our executives and our overall workforce reflect the communities we serve. | |
| Compensation Risk, Incentive Funding, Philosophy, Policies and Plans |
• Approved CIBC’s compensation philosophy, methodology and governance. • In a joint meeting with the Risk Management Committee, with input from the Chief Risk Officer, Chief Financial Officer, and Executive Vice- President (EVP), Purpose, Brand and Corporate Affairs, reviewed the alignment of compensation with business performance and risk. • Recommended Board approval of aggregate annual incentive compensation funding and allocations for functional groups and strategic business units. • Effective fiscal 2021, approved changes to the composition of the BPF, which drives our incentive funding by including enhancements to broaden and further strengthen our link between executive compensation and our strategic priorities, including adjusted revenue growth and ESG. • Reviewed amendments to material and non-material compensation plans. | |
| Pension |
• Approved changes to CIBC’s pension governance structure. • Approved changes to the governance of US retirement plans. • Reviewed the competitiveness of CIBC’s executive pension programs. | |
| Governance and Controls |
• Reviewed an assessment of significant human resources risks and the effectiveness of related internal controls. • Reviewed Internal Audit’s independent report on material compensation plans. • Reviewed regulatory and governance updates related to executive compensation. • Reviewed a report on conduct risk and the evolving regulatory environment. • Recommended Board approval of the executive compensation disclosure in CIBC’s management proxy circular. • Met with institutional investors to discuss aspects of CIBC’s executive compensation programs. • Obtained advice from the Committee’s Independent Compensation Advisor on executive compensation matters. |
Members of the Committee are Patrick Daniel (Chair), Nanci Caldwell, Kevin Kelly, Katharine Stevenson and Martine Turcotte. All members of the Committee are independent.
| 40 | C I B C P R O X Y C I R C U L A R |
Table of Contents
Board Committee Reports
Report of the Risk Management Committee
The primary function of the Risk Management Committee is to assist the Board of Directors in fulfilling its responsibilities for defining CIBC’s risk appetite and overseeing CIBC’s risk profile and performance against the defined risk appetite. The Committee is also responsible for overseeing the identification, measurement, monitoring and controlling of CIBC’s principal business risks.
| Responsibility | 2020 Highlights | |
| Principal Business Risks |
• Reviewed and recommended Board approval of CIBC’s risk appetite framework and risk appetite statement and approved CIBC’s strategic business unit (SBU) and functional group risk appetite statements. This included how CIBC’s risk appetite translates into actionable measures for CIBC’s SBUs and functional groups, alignment with strategic plans, as well as enhancements to strengthen CIBC’s Risk Management function to address evolving risks and regulatory frameworks. • Held four education sessions covering management’s analysis (including emerging developments) of technology risk; the Canadian Consumer and the Retail Lending Book; funding, liquidity and capital overview; operational resilience; incentive compensation; cloud computing; and various treasury-related topics including structural interest rate risk management, funding liquidity, capital and asset liability management. • Held special meetings to discuss potential risk impacts for CIBC, stress testing analysis, expected credit loss forecasts and to approve credit transactions to support clients following the onset of the pandemic. • Reviewed Risk Management’s assessment of year-end compensation recommendations. • Reviewed and recommended Board approval of the capital plan. • Reviewed and approved refinements to various risk limits, funding, frameworks and policies, and associated compliance reporting. • Monitored and reviewed reports on CIBC’s risk profile including management’s assessment of information technology risk and governance activities. • Monitored top risk themes including pandemic related risks, information and cyber security, Canadian consumer debt and geopolitical developments. • Reviewed management’s self-assessment of the design and operating effectiveness of the risk assessment processes relative to new strategies, products or services. • Reviewed presentations on the risks associated with various business activities including leveraged lending, the Canadian Consumer and the Retail Lending Book, the commercial real estate and construction portfolio, CIBC Mellon, as well as regional reviews including CIBC FirstCaribbean International Bank. • Reviewed management’s reports on stress testing relative to macro-economic conditions including an assessment of capital adequacy. • Reviewed and approved certain lending commitments that exceeded management’s lending authority. |
| C I B C P R O X Y C I R C U L A R | 41 |
Table of Contents
Board Committee Reports
| Risk Management and Compliance Functions |
• Reviewed and recommended Board approval of the Risk Management financial plan and staff resources. • Approved the Compliance department’s Independent Oversight Activities and Compliance plan for fiscal 2021. • Approved the Enterprise Anti-Money Laundering Group’s examination plan for fiscal 2021. • Reviewed succession plans, goals and assessments of effectiveness of the Chief Risk Officer, Chief Compliance Officer and Chief Anti- Money Laundering Officer. | |
| Compliance |
• Continued to monitor global regulatory developments, guidance and compliance with regulatory requirements. • Provided oversight of Anti-Money Laundering (AML) and Anti- Terrorist Financing (ATF) activities through the AML sub-committee. • Reviewed the Chief Compliance Officer’s quarterly reports on Compliance as well as Enterprise Anti-Money Laundering Group’s quarterly report and the Chief Anti-Money Laundering Officer’s annual report. |
Members of the Committee are Barry Zubrow (Chair), Brent Belzberg, Charles Brindamour and Christine Larsen. All members of the Committee are independent.
| 42 | C I B C P R O X Y C I R C U L A R |
Table of Contents
Statement of Corporate Governance Practices
Good governance is the foundation of our business and underpins CIBC’s purpose – to help make your ambition a reality. CIBC’s corporate governance framework guides the Board and management in fulfilling their responsibilities to CIBC and its stakeholders. As a recognized leader in corporate governance, we strive each year for continuous improvements to achieve excellence in governance. This statement of corporate governance practices was last reviewed and approved by the Board in February 2021.
The diagram below provides a snapshot of the relationships among the Board, management, shareholders, auditors and regulators.

Read about key elements of our governance practices:
| C I B C P R O X Y C I R C U L A R | 43 |
Table of Contents
Statement of Corporate Governance Practices
| At the foundation of CIBC’s governance structure are knowledgeable, independent and effective directors. Documenting clear roles and responsibilities for the Board and its committees helps the Board supervise the management of CIBC’s business and affairs. Every year, the Board reviews and approves the mandates of the Board of Directors, Chair of the Board, Board Committees and a Board Committee Chair. |
Find Mandates of the Board, Board
|
The composition of the Board and its committees is affected by legal requirements, CIBC’s strategic priorities and the annual Board evaluation process.
Legal requirements – The Board complies with legal and regulatory requirements on the qualifications, number, affiliation, residency and expertise of directors. These requirements come from the Bank Act (Canada) (the Bank Act), securities law, and stock exchanges that list CIBC shares.
Board size – The Corporate Governance Committee reviews Board size and composition annually. The Committee considers changes in legal requirements, best practices, the skills and experiences required to enhance the Board’s effectiveness and the number of directors needed to discharge the duties of the Board and its committees effectively. If each director nominee is elected at CIBC’s 2021 annual meeting, the size of the Board will be 14 directors.
Director skill set and competency matrix – The Corporate Governance Committee assesses the skills and experiences of Board members and reviews the composition of the Board and its committees annually using a competency matrix. The matrix lists desired skills and experiences under broad categories such as leadership, functional capabilities, market knowledge and board experience. The Corporate Governance Committee updates the matrix regularly to reflect the Board’s current and long-term needs, as well as CIBC’s strategic priorities. Each Board member self-assesses their skills and experiences identified in the matrix. The Corporate Governance Committee uses the results of the self-assessments to help identify gaps in the Board’s collective skill set, promote continuing education and determine committee composition. Mary Lou Maher is a new director nominee for election at our annual meeting on April 8, 2021. Ms. Maher brings to the Board more than 35 years of governance and executive experience within the audit sector of the financial services industry, with key strengths in enterprise risk management, corporate governance, and inclusion and diversity.
Information on the skills and experience of our director nominees in areas the Board considers important to CIBC is on page 30 of the 2021 Management Proxy Circular (the “Circular”).
The Board is responsible for supervising the management of CIBC’s business and affairs. The Mandate of the Board of Directors is incorporated into this document by reference. The Board’s key responsibilities are outlined below.
Culture of integrity – The Board oversees CIBC’s Code of Conduct and is responsible for satisfying itself about the culture of integrity throughout CIBC.
Strategic planning – The Board reviews and approves CIBC’s strategic, financial and capital plans, and monitors their effectiveness. In carrying out these responsibilities, the Board considers CIBC’s risk appetite, risk profile, capital and liquidity levels, emerging trends and the competitive environment.
Risk management – The Board approves CIBC’s risk appetite statement and, with support from the Risk Management Committee, oversees CIBC’s risk profile and processes to identify, measure, monitor and control CIBC’s principal risks.
| 44 | C I B C P R O X Y C I R C U L A R |
Table of Contents
Statement of Corporate Governance Practices
Internal control – The Board approves CIBC’s control framework. With support from the Audit Committee, the Board oversees and monitors the integrity and effectiveness of CIBC’s internal controls, the overall control environment for managing business risks, accounting, financial and disclosure controls, operational controls, and legal and regulatory controls and the impact of any identified weaknesses in internal controls on management’s conclusions.
Human resources management – With support from the Management Resources and Compensation Committee, the Board oversees CIBC’s human capital strategy, including talent, succession planning and total rewards, and the alignment with CIBC’s strategy, risk appetite and controls.
Corporate governance – With support from the Corporate Governance Committee, the Board establishes standards which allow the Board to function independently from management and Board policies that set out expectations and responsibilities of directors to contribute effectively to the Board’s operations.
Communications and disclosure – The Board reviews and monitors the effectiveness of CIBC’s communication framework, processes for maintaining effective stakeholder relationships and measures for receiving feedback from stakeholders.
| Director independence is an important part of how the Board satisfies its duty to supervise the management of CIBC’s business and affairs. The Board considers regulatory requirements, best practices and good judgment to define independence. In addition, the Board applies independence standards, which have tests to assess a director’s independence, as well as a description of relationships between CIBC and a director that would not affect a director’s independence. The Board and its committees promote independence by: |
All director nominees
|
| • | reviewing the impact of any board interlocks (where two or more CIBC directors are on the board of another public company); |
| • | retaining advisors when needed for independent advice and counsel; |
| • | conducting regular in camera sessions of the Board and its committees without the Chief Executive Officer (CEO) or any other member of management; |
| • | adhering to CIBC’s Director Tenure Policy and tenure limits (see “Director Tenure” on page 49); |
| • | determining whether directors have a material interest in a transaction; and |
| • | appointing an independent Chair of the Board to oversee the Board’s operations and decision-making. |
Independence standards
The Board independence standards require a substantial majority of its directors to be independent. A director is considered independent only where the Board affirmatively determines that the director has no material relationship with CIBC, including as a partner, shareholder or officer of an organization that has a relationship with CIBC. A “material relationship” is a relationship that could, in the view of the Board, be reasonably expected to interfere with the exercise of a director’s independent judgment and includes an indirect material relationship. In determining whether a director is independent, the Board applies standards that incorporate the Affiliated Persons (Banks) Regulations, the New York Stock Exchange (NYSE) corporate governance rules, Canadian Securities Administrators corporate governance guidelines and the Office of the Superintendent of Financial Institutions (Canada) Corporate Governance Guideline provisions. The Board determines the independence of a director when the Board approves director nominees to be named in the Circular and at other times if necessary or desirable. For example, if a director joins the Board mid-year, the Board makes a determination on the new director’s independence at that time. The Board bases its determination of independence primarily on questionnaires completed by each director nominee.
| C I B C P R O X Y C I R C U L A R | 45 |
Table of Contents
Statement of Corporate Governance Practices
All members of the Audit Committee, Corporate Governance Committee, Management Resources and Compensation Committee and Risk Management Committee must be independent. Audit Committee members must satisfy additional independence standards under the US Sarbanes-Oxley Act of 2002. Management Resources and Compensation Committee members voluntarily adopted additional independence standards under the NYSE rules.
Immaterial relationships
The Board has identified immaterial relationships that do not affect a director’s independence (unless the Board decides otherwise based on a director’s circumstances). These “immaterial relationships” include:
| • | routine banking services where a director, their immediate family members or entities they control, receive personal banking services, loans and other financial services in the ordinary course of business from CIBC or one of its subsidiaries as long as the services are on market terms, comply with applicable laws and do not exceed the monetary thresholds in the Board’s independence standards; and |
| • | the employment of an immediate family member of a director with CIBC or a subsidiary (provided the immediate family member is not the director’s spouse or an executive officer of CIBC or a subsidiary) and, as long as the compensation and benefits received by the family member were established by CIBC in accordance with policies and practices that apply to CIBC employees in comparable positions. |
Outside board memberships
| The Board does not limit the number of public companies on which a director may serve, but has strong expectations of Board members in managing time demands and increasing Board responsibilities. The Board recognizes that some directors have the time and ability to maintain the focus and commitment expected at CIBC’s Board and committee meetings as well as other public companies. The Board also recognizes that multiple public company board service enhances a director’s breadth and depth of experience and provides another means of staying abreast of topical issues, trends, governance practices and the evolving regulatory environment. |
A director is required to obtain approval from the Chair of the Board before joining a new public company board.
|
The Corporate Governance Committee believes it is important for directors to balance the insights gained from their roles on other boards (including as CEO) with the ability to prepare for, attend and participate effectively in their CIBC Board and committee meetings. As a result, the Committee monitors director performance to make sure directors continue to have the time and commitment to fulfill their obligations to CIBC’s Board. The Committee considers many factors when assessing director performance, including meeting attendance; individual contributions at meetings; results of the annual Board effectiveness evaluation; the role of the director on other boards; the time demands of outside activities; the industry, size, location and financial cycle of other public companies a director serves; and peer review feedback from one-on-one meetings between the Chair of the Board and each Board member. The Committee monitors the overboarding policies of proxy governance advisory firms and institutional shareholders, which have different numerical limits on the number of boards a director may serve. However, the Committee believes that monitoring director performance is more effective than setting a numerical limit on public company service.
| 46 | C I B C P R O X Y C I R C U L A R |
Table of Contents
Statement of Corporate Governance Practices
Board interlocks
An “interlock” occurs when two or more CIBC directors are on the board of another public company. The Board does not restrict board interlocks but recognizes that it is important for directors to remain impartial and independent even if they have a common board membership. There is one interlocking board membership among CIBC’s directors.
| Company | Director | Committee Memberships | ||
| Capital Power Corporation |
Jane Peverett | Health, Safety & Environment; People, Culture, and Governance | ||
| Katharine Stevenson | Audit (Chair); People, Culture, and Governance | |||
The Corporate Governance Committee does not believe that this common board membership impacts the ability of these directors to act in the best interests of CIBC and does not impair their independence.
Service on other public company audit committees
No member of CIBC’s Audit Committee may be on the audit committee of more than two other public companies unless the Board determines that this simultaneous service does not impair the ability of the member to be effective on CIBC’s Audit Committee.
The Corporate Governance Committee reviews service on multiple audit committees as part of its assessment of a director’s performance by looking at the annual Board effectiveness evaluation; questionnaires completed by the directors each year to assess financial literacy; qualifications to be designated as an audit committee financial expert; time demands on the director; and the director’s background and related experience.
No member of CIBC’s Audit Committee is on the audit committee of more than two other public companies.
In camera sessions
The Board and each of its committees set aside time for in camera sessions at their meetings to have open and candid discussion without the CEO or other members of management. The sessions are led by the Chair of the Board at Board meetings and the chair of each committee at committee meetings.
Conflicts of interest
To promote the Board’s independent decision-making, CIBC has a process in place to identify and deal with director conflicts of interest. If directors or executive officers have an interest in a material transaction or agreement with CIBC that is being considered by the Board or a Board committee, they: 1) disclose that interest; 2) leave the meeting during Board or committee discussion; and 3) do not vote on the matter.
Independent Chair of the Board
The Chair of the Board meets the Board’s independence standards and the additional independence standards for the Audit Committee and the Management Resources and Compensation Committee. The Board believes that the Chair’s independence is important for leading the Board in carrying out its duties.
| C I B C P R O X Y C I R C U L A R | 47 |
Table of Contents
Statement of Corporate Governance Practices
5. Director Nomination Process
Nominating a new candidate for election
The Corporate Governance Committee oversees Board renewal and is responsible for recommending director candidates. The Committee creates a candidate profile outlining the desired skills and experiences that will deepen the Board’s collective skills and experiences and support CIBC’s strategic priorities. The Committee might use an external recruitment firm to identify potential candidates who meet the desired profile. The Committee also maintains a list of potential director candidates which includes recommendations from Board members, shareholders, clients and employees. Once the best candidates are identified, the Chair of the Board, Chair of the Corporate Governance Committee and other Board members meet with each candidate to discuss the candidate’s background, skills, experiences and ability to devote the time and commitment required to be on CIBC’s Board. The Corporate Governance Committee looks at each candidate’s integrity and suitability by obtaining references, verifying educational background, conducting a security check and assessing any potential conflicts, independence concerns or other issues.
There are mechanisms for shareholders and others to recommend director candidates:
| • | Under the Bank Act, shareholders may propose a director nominee to be included in CIBC’s proxy circular, provided they hold 5% of CIBC’s outstanding common shares. |
| • | Under CIBC’s Proxy Access Policy, qualifying shareholders may submit director nominations to be included in CIBC’s proxy circular. This policy is aligned with the approach to proxy access in the United States, except where Canadian law requires CIBC to comply with different requirements on share ownership. The policy is available at www.cibc.com. |
| • | A shareholder, client, employee or any other stakeholder may contact the Chair of the Board at any time to recommend director candidates. The Chair of the Board would then ask the Corporate Governance Committee to review the recommendation and report on the outcome of that review to the stakeholder. |
Nominating an existing director for re-election
Before recommending an existing director for re-election to the Board, the Corporate Governance Committee reviews the director’s:
| • | continuing integrity and suitability; |
| • | overall performance and capability to contribute effectively to the Board and its oversight responsibilities; |
| • | compliance with CIBC’s Code of Conduct; |
| • | attendance at regularly scheduled Board and committee meetings; and |
| • | tenure on the Board. |
| 48 | C I B C P R O X Y C I R C U L A R |
Table of Contents
Statement of Corporate Governance Practices
CIBC has a Director Tenure Policy which outlines factors that affect a director’s tenure.
Term limits
| Directors are elected by shareholders for a one-year term that expires at the next annual meeting. Under CIBC’s Director Tenure Policy, the maximum period of time a director can be on CIBC’s Board is the earlier of 15 years after joining the Board or 75 years of age. A director would not stand for re-election at the annual meeting following that event. The Corporate Governance Committee might recommend a director for re-election after the expiry of their maximum term if it is in the best interests of CIBC to do so. In addition, the Board Chair may serve a five-year term after initial appointment as Chair of the Board, regardless of age or number of years served as a director. | ||
|
The Board believes that term limits help create a balance between the fresh perspective of a new director and the experience of a seasoned director. This chart shows the amount of time that the director nominees for election at the 2021 annual meeting have served on CIBC’s Board.
The average tenure of the director nominees is seven years. |
| |
Resignation of a director
The Director Tenure Policy requires a director to provide notice of resignation to the Chair of the Board in certain circumstances, including:
| • | the director no longer satisfies the director qualification requirements under applicable law; |
| • | there is a material change in the status of the director’s employment; |
| • | the director accepts a role with a company or organization which could have a material conflict with CIBC; |
| • | the director, or a company controlled by the director, causes CIBC to incur an irrecoverable loss; or |
| • | the director becomes aware that personal circumstances might have an adverse impact on the reputation of CIBC. |
The Corporate Governance Committee makes a recommendation to the Board on whether to accept a resignation. The director who tenders a resignation does not take part in the decision-making process.
Majority voting
| In an uncontested election where shareholders are asked to vote on the election of a director, a director nominee who receives a greater number of shareholder votes that are “withheld” than “for” will immediately tender their resignation to the Board. An “uncontested election” means an election where the number of nominees for director equals the number of directors to be elected. |
You can find our
| |
| The Corporate Governance Committee will recommend that the Board accept the resignation absent exceptional circumstances. The Board will make its decision within 90 days after the election and issue a press release either announcing the resignation or explaining why it was not accepted. The director who tendered the resignation will not take part in the decision-making process. | ||
| C I B C P R O X Y C I R C U L A R | 49 |
Table of Contents
Statement of Corporate Governance Practices
Meeting attendance record
Regular Board and committee meetings are set about three years in advance. Special meetings are scheduled when required. A director is encouraged to attend all meetings and expected to attend at least 75% of all regularly scheduled Board and committee meetings, except where the Corporate Governance Committee determines that personal circumstances beyond the director’s control prevent the director from doing so. This standard is not applied to attendance at special Board or committee meetings which are called on short notice.
During fiscal 2020, directors attended 100% of regular Board and committee meetings. In addition, all 2020 director nominees attended CIBC’s 2020 annual meeting. See pages 15 to 29 of the Circular for information on Board and committee meeting attendance.
Former Chief Executive Officer
Under the Director Tenure Policy, the CEO would not be re-elected as a director after ceasing to act as CEO. However, the Corporate Governance Committee may recommend that a former CEO be re-elected as a director if in the best interests of CIBC to do so.
7. Annual Board Evaluation Process
| The Corporate Governance Committee oversees the annual evaluation of the performance and effectiveness of the Board, its committees, the CEO and individual directors. An external advisor conducts the evaluation to encourage candid feedback, maintain confidentiality and promote objectivity. The external advisor also provides information on the corporate governance practices and board processes of other public companies. |
Every director
|
The evaluation includes:
| • | a survey completed by each director; |
| • | a survey completed by senior executives on the performance of the CEO, the Board and the Board committees they support; and |
| • | individual one-on-one meetings between each director and the Chair of the Board. |
The surveys ask questions about the effectiveness of the Board and committees in addressing areas of focus in the current year, what was done well and what could be done better. The topics covered by the survey are Board leadership, the Board and CEO relationship, talent management and succession planning, strategy, compliance, risk management, stakeholder engagement, tone at the top, culture, director education, board composition and operations. The survey also asks for input on areas of focus for the coming year.
One-on-one meetings between each director and the Chair of the Board provide an opportunity for open discussion about the contributions of the director and other fellow board members to the Board and its committees, what the Board and committees could do better, other responsibilities the director might be interested in and other comments or recommendations the director might have about the operation and performance of the Board. The Chair of the Board reports to the Corporate Governance Committee on broad themes from these meetings and uses peer feedback to review individual director performance, identify opportunities for individual director development and succession planning for the Board and committees.
The Corporate Governance Committee reviews the performance of the Chair of the Board each year and the Chair of the Corporate Governance Committee provides director feedback to the Chair of the Board.
The evaluation process helps identify opportunities for continuing Board and director development and forms the basis of action plans for improving the Board’s operations. The Board and Board committees monitor progress against their action plan.
| 50 | C I B C P R O X Y C I R C U L A R |
Table of Contents
Statement of Corporate Governance Practices
8. The Chief Executive Officer
The CEO leads the management of CIBC’s business and affairs. In carrying out this responsibility, the CEO is responsible for duties relating to CIBC’s vision and values; strategy and operational direction; risk governance and internal control; financial information; human resources management; and effective communication with shareholders, clients, employees, regulators and other stakeholders.
The Chair of the Board is responsible for providing effective leadership of the Board, facilitating the operations and deliberations of the Board and overseeing the satisfaction of the Board’s mandate. In carrying out these responsibilities, the Chair of the Board presides over Board and shareholder meetings; leads director development; leads the Board in overseeing the development of CIBC’s strategic plan; coordinates execution of the Board’s mandate and action plans; and communicates with shareholders, clients, employees, regulators and other stakeholders.
The Board has four committees. All committee members are independent. In determining committee membership, the Board tries to strike a balance between having members with the right experience and expertise on the committee and rotating membership to bring new ideas and insights.
The Audit Committee is responsible for reviewing the integrity of CIBC’s financial statements, related management’s discussion and analysis and internal control over financial reporting; monitoring the system of internal control; monitoring CIBC’s compliance with legal and regulatory requirements as they pertain to responsibilities under the Audit Committee Mandate; selecting the external auditors for shareholder approval; reviewing the qualifications, independence and audit quality of the external auditors and the performance of CIBC’s internal auditors; and acting as the audit committee for certain federally regulated subsidiaries. The Audit Committee also oversees succession planning for the Chief Financial Officer (CFO) and the Chief Auditor. The Audit Committee meets regularly with the external auditors, the CFO and the Chief Auditor. All Committee members are “audit committee financial experts” under the U.S. Securities and Exchange Commission rules.
The Corporate Governance Committee is responsible for overseeing CIBC’s corporate governance framework; Board and committee composition; evaluation of Board committees and director effectiveness; director orientation and continuing education; and CIBC’s corporate responsibility reporting, stakeholder engagement framework and matters relating to conduct.
The Management Resources and Compensation Committee is responsible for global oversight of CIBC’s human capital strategy, including talent and total rewards, and the alignment with CIBC’s strategy, risk appetite and controls. The Management Resources and Compensation Committee reviews and approves CIBC’s compensation philosophy, methodology and governance; recommends Board approval of annual incentive compensation funding; has duties relating to CIBC’s pension funds; and oversees the preparation of the compensation related disclosure in the Circular. The Management Resources and Compensation Committee reviews, approves or recommends Board approval of employment arrangements, goals and measures, performance, compensation, and succession plans for the CEO, Executive Committee members and other key officers.
| C I B C P R O X Y C I R C U L A R | 51 |
Table of Contents
Statement of Corporate Governance Practices
The Risk Management Committee is responsible for assisting the Board in fulfilling its responsibilities for defining CIBC’s risk appetite and overseeing CIBC’s risk profile and performance against the defined risk appetite; overseeing the identification, measurement, monitoring and controlling of CIBC’s principal risks (including those impacting capital or liquidity); reviewing and approving key frameworks, policies and risk limits established to control CIBC’s exposures to its principal risks; and overseeing CIBC’s Risk Management function. The Risk Management Committee also provides input to the Management Resources and Compensation Committee on risk-related aspects of executive compensation decisions and oversees succession planning for the Chief Risk Officer (CRO), Chief Compliance Officer and Chief Anti-Money Laundering Officer.
11. Board Access to Independent Advisors and Management
To assist the Board, the Chair of the Board and the Board committees in satisfying their responsibilities and to foster their independence, the Board, the Chair of the Board and the Board committees may retain independent advisors and set their compensation without consulting or obtaining approval of management. The Board, the Chair of the Board and the Board committees also have unrestricted access to management and employees of CIBC, as well as the external auditors. The Management Resources and Compensation Committee has an independent compensation advisor that reports directly to the Committee and does not do any other work for CIBC. The Audit Committee and Risk Management Committee retain an independent advisor periodically to review the effectiveness of Internal Audit, Finance, Compliance and Risk Management.
12. Director Orientation and Continuing Education
| CIBC’s Director Development Program provides continuing education to Board members. The program has two components: 1) orientation to help new directors become fully engaged as quickly as possible; and 2) continuing education to help directors understand new and emerging governance practices and regulatory developments related to the director’s Board and committee responsibilities. | The Board and its committees dedicated 18% of meeting time to educational presentations. |
New director orientation
CIBC has an orientation program for new directors which consists of written materials and orientation events. There is a director orientation manual that includes Board policies and procedures; CIBC’s by-law and organizational structure; CIBC’s strategic, financial and capital plans; the most recent annual and quarterly financial reports; and a summary of key business issues. In addition, a new director has separate one-on-one meetings with the Chair of the Board, the CEO and members of management. Management also hosts tours of CIBC businesses and operations. The committee chair arranges orientation sessions about the committee when a new director joins. To help a new director better understand the role of the Board and its committees and the commitment expected of a director, the Chair of the Board arranges for another Board member to act as mentor.
Continuing director education
During fiscal 2020, approximately 18% of agenda time was dedicated to continuing education, exceeding the Board’s target of 10%. The Chair of the Board is responsible for coordinating director education at the Board level. Each Board committee chair is responsible for coordinating director education at the committee level. Directors identify continuing education topics in many ways – at Board and committee meetings, in the annual board performance evaluations and through regular feedback to the Chair of the Board and committee chairs. Committee education sessions are open to all Board members.
| 52 | C I B C P R O X Y C I R C U L A R |
Table of Contents
Statement of Corporate Governance Practices
During fiscal 2020, directors participated in the following education sessions.
| Attended | Session | Date | ||
| Board |
• Modernization of Our Bank
|
December 2019 | ||
| • Investor Community Perspective on CIBC including Annual Report on Share Ownership
|
December 2019 | |||
| • Purpose, Brand and Marketing
|
February 2020 | |||
| • Digital Goal Planning
|
February 2020 | |||
| • Technology Infrastructure & Innovation Strategy
|
August 2020 | |||
| • Economic Update
|
August 2020 | |||
| • People, Culture & Brand Strategy
|
August 2020 | |||
| Audit Committee |
• Data Governance and Controls
|
December 2019 | ||
| • Treasury Control Environment and Data
|
December 2019 | |||
| • IBOR
|
July 2020 | |||
| • Ernst & Young’s Perspectives on Audit Committee Effectiveness
|
October 2020 | |||
| • Artificial Intelligence and Machine Learning Controls
|
October 2020 | |||
| Corporate Governance Committee |
• Report on Business Governance Ranking
|
December 2019 | ||
| • Quarterly Governance Update
|
December 2019, February, May and August 2020 | |||
| • Quarterly ESG Update
|
December 2019, February, May and August 2020 | |||
| • Conduct Risk Report
|
February, May and August 2020 | |||
| • Proxy Disclosure – Peer Bank Review
|
May 2020 | |||
| Management Resources and Compensation Committee |
• Stakeholder Engagement Update
|
December 2019, February, May and August 2020 | ||
| • Regulatory Update
|
February, May, August and October 2020 | |||
| • Conduct Risk and the Evolving Regulatory Environment
|
February 2020 | |||
| • Canadian Banks Proxy Review
|
May 2020 | |||
| • Market Pay and Performance Trends
|
October 2020 | |||
| Risk Management Committee |
• Technology, Governance, Operations, Protection Review
|
December 2019 | ||
| • Anti-Money Laundering – Emerging Risk in Australia
|
December 2019 | |||
| • Conduct Risk
|
December 2019 | |||
| • Leveraged Lending Portfolio Review
|
December 2019 | |||
| • Climate Resilience
|
December 2019 | |||
| • The Canadian Consumer and the Retail Lending Book
|
February 2020 | |||
| • CIBC’s Structural Interest Rate Risk Management
|
February 2020 | |||
| • Funding, Liquidity and Capital Overview
|
May 2020 | |||
| • Enterprise-wide Stress Testing Review
|
May 2020 | |||
| • Operational Resiliency
|
August 2020 | |||
| • Incentive Compensation and an Overview of Assessing Risk in Compensation Decision-making
|
August 2020 | |||
The Board also encourages each director to participate in other continuing education, outside of Board and committee meetings. Directors receive an updated catalogue of internal and external educational opportunities periodically throughout the year. Individual director education consists of external courses; one-on-one sessions between a director and an internal or external expert on a specific topic; tours of CIBC businesses and operations; and educational reports posted to the Board website. CIBC pays the cost of all director continuing education relating to CIBC.
| C I B C P R O X Y C I R C U L A R | 53 |
Table of Contents
Statement of Corporate Governance Practices
CIBC’s director compensation program is designed to attract and retain people with the skills and experience to act as directors of CIBC. The Corporate Governance Committee reviews director compensation annually to make sure it aligns with the interests of CIBC shareholders, is competitive with the market and reflects best practices. The Corporate Governance Committee also reviews the workload, time commitment and responsibility of Board members. The Corporate Governance Committee may use an external advisor for advice on its director compensation policy and practices.
The Management Resources and Compensation Committee oversees performance evaluation and compensation for the CEO, Executive Committee members and other key officers. When making incentive compensation decisions, the Management Resources and Compensation Committee looks at several factors, which include:
| • | CIBC’s financial performance and sustainability of earnings; |
| • | simplification and efficiency initiatives; |
| • | Environmental, Social and Governance metrics, including, adherence to CIBC’s risk appetite statement and controls, progress on client and employee experience results, and alignment with inclusion and diversity goals; and |
| • | qualitative considerations, such as our performance compared to peers, and individual performance against goals approved by the Board or Committee with a focus on strategy execution. |
The Management Resources and Compensation Committee considers input from the CFO, CRO and Executive Vice-President, Purpose, Brand and Corporate Affairs at a joint meeting with the Risk Management Committee where it reviews the alignment of compensation with business performance and risk, and recommends Board approval of aggregate annual incentive compensation and allocations to strategic business units and the functional groups. The Management Resources and Compensation Committee recommends for Board approval the annual incentive targets and individual compensation amounts for the CEO, Executive Committee members and other key officers, and approves compensation for any individual whose total compensation is above a certain materiality threshold.
| CIBC believes that diverse teams working in an inclusive environment are more innovative, make better decisions, reduce risk and deliver better results to shareholders. As a result, it is imperative to promote and leverage diverse perspectives that reflect the background and demographics of CIBC employees and the clients and communities CIBC serves, including age, gender/gender identity, race/ethnicity, religion, ability, sexual orientation, and experiences.
The Board strives to promote diversity in board composition through the board renewal process which seeks the best director candidates with the desired complement of skills, expertise, experience and perspectives to fulfill the Board’s obligations and oversee CIBC’s strategic priorities effectively. CIBC’s Board Diversity Policy outlines the Board’s approach to creating and maintaining a gender-balanced and diverse membership and to increasing the inclusive leadership capabilities of its directors. |
|
CIBC named one of Canada’s Best Diversity Employers for the past 10 years and included in the Bloomberg Gender Equality Index for the past 5 years.
|
|
On gender diversity, the Board seeks to achieve gender parity. Given the number of directors, the Board has set a gender-balance target to be comprised of at least 30% women and at least 30% men.
On other aspects of diversity, the Board seeks to increase the degree to which its directors reflect the diversity of CIBC employees and the clients and communities CIBC serves in North America and around the globe while ensuring the collective skills, expertise and experiences of Board members address regulatory requirements, including appropriate representation of financial industry and risk management expertise.
| 54 | C I B C P R O X Y C I R C U L A R |
Table of Contents
Statement of Corporate Governance Practices
Given the number of directors, the Board has not set specific targets for people of colour, Indigenous peoples, persons with disabilities and members of the LGBTQ+ community. The Corporate Governance Committee ensures that CIBC’s Board renewal process (and the mandate of any external firm engaged to support Board renewal) includes director candidates from these communities in the pool of prospects and the short-list from which the Corporate Governance Committee identifies potential director candidates.
| To assess progress against these objectives, directors voluntarily provide self-identification data to the Corporate Governance Committee annually.
Of the current director nominees: • 50% are women; • one identifies as a person of colour, specifically as a member of the Black community; and • one identifies as a member of the LGBTQ+ community. |
40% of CIBC’s Executive Committee and 33% of executives in global board-approved roles are women.
|
For more information, see “Inclusion and Diversity” on page 84 of the Circular, CIBC’s public webpage at www.cibc.com/inclusion and CIBC’s 2020 Sustainability Report at www.cibc.com.
16. Talent Management and Succession Planning
CIBC is committed to developing employees at all levels of the organization and ensuring that the diversity of our workforce reflects the markets where we do business.
The Management Resources and Compensation Committee and the Board review regular updates on the progress of our talent strategy and the strength and diversity of our pipeline of future leaders. At least once a year, the Management Resources and Compensation Committee and the Board review succession plans for the CEO and Executive Committee members across various time frames to ensure that management and the Board have choices when appointing talent in key roles. The Management Resources and Compensation Committee and management also discuss talent deeper in the pipeline, with potential over a longer horizon to develop into senior roles in the organization.
The Management Resources and Compensation Committee also reviews the succession plans for positions identified as other key officer and critical roles; the Audit Committee reviews the succession plans of the CFO and Chief Auditor; and the Risk Management Committee reviews the succession plans of the CRO, Chief Compliance Officer and Chief Anti-Money Laundering Officer.
The Code of Conduct (Code) is our playbook that identifies policies to guide our actions – an important element as we transform into a purpose-led organization and build a relationship-oriented bank for a modern world. This includes building an inclusive and client-focused culture that is underpinned by our core values of trust, teamwork and accountability. The Code applies to our team members – employees, contingent workers and members of the boards of directors of CIBC and its wholly-owned subsidiaries.
The Code sets out the following principles for how we behave as we help our clients achieve their ambitions:
| • | We act with honesty and integrity |
| • | We ensure a respectful and safe workplace |
| • | We identify and avoid conflicts |
| • | We serve our clients and protect our brand, our investors and our environment |
| • | We safeguard information of our clients and team members, and we protect other CIBC assets |
| • | We cooperate with investigations |
There is a training program on the Code and every year all team members must attest that they have read, understood and will always follow the Code.
| C I B C P R O X Y C I R C U L A R | 55 |
Table of Contents
Statement of Corporate Governance Practices
CIBC team members across the globe are required to speak up when they become aware of activities that they believe are inconsistent with the Code, or that might be damaging to CIBC or our stakeholders. There is no retaliation for speaking up. Our confidential Whistleblower Hotline, available 24/7 and in many languages, allows for anonymous reporting of concerns. Identifying information (including a caller’s name or telephone number) is not required to be shared with the hotline service provider and calls are not recorded. CIBC’s other ways to speak up and get advice include Human Resources/Employee Relations, Corporate Security or a Board member.
Changes to the Code are reviewed by the Board for approval. Legal requirements provide that CIBC’s Board of Directors must approve waivers for Board members and certain executive officers, and publicly disclose any waivers. No waiver has been granted to date.
| Inspired by our purpose to help make your ambition a reality, we are integrating sustainability into everything we do, focusing on environmental, social and governance (ESG) matters of importance to our stakeholders. |
Find CIBC’s Sustainability Report at www.cibc.com.
|
Key elements of ESG governance at CIBC:
| • | Nine out of 14 director nominees identify corporate responsibility as a key area of skills and experiences. |
| • | We believe that understanding stakeholder perspectives is vital to being a relationship focused bank. We engage with stakeholders in many ways. This past year, for instance, we conducted a materiality assessment to identify current issues of importance. Investor Relations held 13 ESG-related meetings with shareholders to listen to their feedback on our governance practices and talk about the interconnectivity between ESG and our strategy. |
| • | There are annual goals and measures for the CEO and management team that pertain to ESG performance. These include impacts on client experience, employee engagement, and inclusion and diversity goals. For more information on how we further embed ESG into performance, see page 71 of the Circular. |
The Corporate Governance Committee, Management Resources and Compensation Committee and Risk Management Committee have oversight accountabilities related to ESG governance at CIBC.
The Corporate Governance Committee mandate includes oversight of disclosure on CIBC’s approach to operating in an ethical, socially responsible and environmentally conscious manner. This includes reviewing highlights of CIBC’s 2020 Sustainability Report; Code of Conduct; client complaint processes; privacy matters; donations and community investments; and our stakeholder engagement practices.
The Management Resources and Compensation Committee oversees CIBC’s compensation framework and alignment of ESG performance goals with compensation. The Management Resources and Compensation Committee sets goals and measures for the CEO and Executive Committee members. These goals incorporate metrics for inclusion and diversity as well as environmental performance for certain employees, which are then incorporated into the goals and measures of other executives and team members across the bank.
The Risk Management Committee reviews and approves CIBC’s frameworks and policies on the identification and control of a variety of risks. This review includes CIBC’s Reputation Risk Management Framework.
| 56 | C I B C P R O X Y C I R C U L A R |
Table of Contents
Statement of Corporate Governance Practices
| Governance Body | Summary of Responsibilities | 2020 Activities Related to ESG | ||
| Board of Directors | Oversees CIBC’s strategic direction and implementation of an effective risk management culture. |
• Approved CIBC’s 2021 Code of Conduct, 2020 Statement of Corporate Governance Practices, responses to shareholder proposals on ESG matters and governance disclosure in CIBC’s management proxy circular. • Reviewed progress on CIBC’s ESG metrics. • Oversaw our multi-year purpose journey. | ||
| Corporate Governance Committee |
Oversees CIBC’s corporate governance framework; Board and committee composition; evaluation of Board, committee and director effectiveness; director orientation and continuing education; and CIBC’s sustainability reporting, stakeholder engagement framework, disclosure on approach to acting in an ethical, socially responsible and environmentally conscious manner and the Conduct and Culture Risk Framework. |
• Participated in quarterly updates and development sessions with internal and external ESG leaders on enhancements to CIBC’s ESG framework in support of our corporate strategy and related ESG disclosure. • Reviewed highlights of CIBC’s Sustainability Report. • Reviewed reports on adherence to the Code of Conduct, conduct and culture risk, and related regulatory developments. • Reviewed reports on global privacy risk management, privacy incidents, regulatory notification and changing privacy laws. • Approved changes to the Board Diversity Policy that advance the Board’s commitment to reflect the background of CIBC team members, clients and communities. • Reviewed climate reports in accordance with TCFD requirements, and updates on CIBC’s $150 billion environmental and sustainable finance target. • Oversaw CIBC’s stakeholder engagement process to foster transparent relationships and discuss CIBC’s governance practices and emerging trends. • Reviewed reports on managing ESG performance, realizing ESG opportunities and progress on ESG goals. • Reviewed reports on complying with consumer provisions under the Bank Act, consumer protection activities, handling and resolving client complaints and CIBC’s approach to the Federal Government’s Financial Consumer Protection Framework.
| ||
| Risk Management Committee |
Reviews and approves CIBC’s frameworks and policies on the identification and control of risks, including the Risk Management Framework and the Reputation Risk Policy. |
• Supervised key frameworks, policies and limits related to identifying, measuring, monitoring and controlling CIBC’s principal business risks, such as climate-sensitive risk exposures. • Reviewed reports on enhancing existing environmental targets and setting new targets related to renewable energy and carbon neutrality. • Reviewed reports on managing ESG performance, realizing ESG opportunities and progress towards achieving ESG goals, such as CIBC’s $150 billion environmental and sustainable finance target. | ||
| Management Resources and Compensation Committee |
Sets goals and measures for the CEO and Executive Committee members and looks at business performance and risks by considering the performance of CIBC and its businesses against financial and non-financial metrics, including client experience, culture, inclusion and diversity, risk appetite measures and compliance with governance, control and policy requirements, as well as their alignment to our corporate strategy.
|
• Reviewed inclusion and diversity, employee engagement, gender pay, risk input into compensation, conduct risk and the evolving regulatory environment. | ||
| C I B C P R O X Y C I R C U L A R | 57 |
Table of Contents
Statement of Corporate Governance Practices
Recent Milestones in Our Sustainability Journey
| 2018 | 2019 | 2020 | ||||
| Environment | Announced greenhouse gas (GHG) emission intensity reduction target | Announced commitment to mobilize $150 billion in environmental and sustainable finance activities by 2027
Issued “Building a Sustainable Future” report aligned with the Task Force on Climate-related Financial Disclosures
Set targets for carbon neutral operations and 100% renewable electricity use |
Publicly disclosed our Corporate Environmental Policy
CIBC Capital Markets offered ESG-linked loans as part of our “Green” products and services
Issued first Green Bond in line with the ICMA Green Bond Principles | |||
| Social |
Announced first Women in Leadership social bond framework in Canada
Announced community investment target of $350 million by 2023 |
First Canadian bank to join the Valuable 500 (global disability initiative)
Introduced 15 new ESG key performance indicators in areas such as Inclusion and Diversity, Small Business, Indigenous Banking, Privacy and Information Security
Launched Code of Conduct for the Delivery of Banking Services to Seniors |
Signatory to UN Women’s Empowerment Principles
Endorsed BlackNorth Initiative to end anti-Black systemic racism
CIBC Asset Management committed to Responsible Investment Association’s investor statement on diversity and inclusion
Announced two-year, US$2 billion commitment to support businesses, consumers and our partners in the US | |||
| Governance | Aligned ESG disclosure with UN Sustainable Development Goals | Introduced personal performance measures related to climate change targets and strategy for our Chief Risk Officer
Instituted quarterly review of environmental risk by Board committee
Actively participated in industry working groups to develop a consistent and comparable approach to climate risk scenario analysis and disclosure
Began obtaining limited assurance of key environmental and social metrics
|
Conducted formal, comprehensive materiality assessment, engaging internal and external stakeholders to better align our priorities and inform our ESG strategy development
Progress towards achieving formalized ESG targets for incorporation into variable incentive pool calculation | |||
CIBC received a score of A- from the CDP (formerly known as the Carbon Disclosure Project), improving from a B rating in 2019. This score demonstrates CIBC’s progress in environmental performance and reporting, and places CIBC among the highest ranking Canadian financial institutions and the top-tier of global banks.
CIBC also continues to be a constituent of the Dow Jones Sustainability Index (DJSI) North America and the FTSE4Good Index. Index members must meet globally recognized standards for ESG strategy, management and performance.
Read more about CIBC’s focus on ESG topics in our 2020 Sustainability Report.
CIBC is proud to be recognized by:
| 58 | C I B C P R O X Y C I R C U L A R |
Table of Contents
Statement of Corporate Governance Practices
CIBC’s Enterprise Subsidiary Governance Framework provides guidance on the oversight responsibilities between the CIBC Board and its subsidiary boards, including certain subsidiary boards in the US region. The framework outlines key principles of CIBC’s enterprise-wide approach to subsidiary governance, including board composition, director selection criteria, tenure and board size. The framework supports CIBC’s multi-disciplinary approach to subsidiary governance through strategic business units; control and governance functions; the CIBC Board; subsidiary boards and reporting to those boards.
The Corporate Governance Committee is responsible for overseeing the framework and reviewing reports on governance matters relating to CIBC subsidiaries. See “Report of the Corporate Governance Committee” on page 38 of the Circular for information on the committee’s continuing work regarding oversight responsibilities and interconnectivity among the boards of CIBC and certain US legal entities. In keeping with its oversight responsibilities, the Corporate Governance Committee annually reviews guidance on board composition, director selection criteria, tenure and board size for certain US subsidiary boards (collectively, the “US Board”). To create interconnectivity between the US Board and the CIBC Board, the composition of the US Board includes CIBC board members with knowledge of CIBC strategy, risk appetite and operations. This enables the CIBC Board to oversee the US subsidiary operations effectively and facilitate the exchange of information. The US Board includes the Chair of the CIBC Board, Chair of the CIBC Risk Management Committee, and other members of the CIBC Board or Executive Committee the Corporate Governance Committee considers appropriate.
| The Board and management believe that understanding the perspectives of CIBC’s stakeholders is key to being a relationship-oriented bank. Some of the ways CIBC engages with its stakeholders are set out below.
Disclosing material information to the market – CIBC’s disclosure policy outlines our commitment to promote consistent disclosure practices aimed at accurate, timely and broadly disseminated disclosure of material information about CIBC to the market. The Corporate Governance Committee reviews how management administers the policy annually. The Board reviews and approves changes to the policy. CIBC has a Disclosure Committee which meets with responsible officers each quarter to review CIBC’s interim or annual financial reports to shareholders and related earnings release, as well as controls around CIBC’s disclosure and financial reporting. |
Feedback from stakeholders provides valuable input to the Board.
| |||
Communication strategy – The Board reviews CIBC’s overall communication strategy annually to understand progress in furthering CIBC’s relationship with employees, clients, the investment community, the media, and government. The Chair of the Board and senior officers meet with shareholders, shareholder advocacy groups and others in the investment community to talk about CIBC’s approach to corporate governance, risk governance, talent management, executive compensation and emerging environmental, social and governance practices.
Whistleblowing and Confidential Whistleblower Hotline – The Audit Committee oversees CIBC’s Whistleblower Policy, which provides a framework for investigating and reporting concerns raised by CIBC employees, contingent workers or others (e.g., clients, suppliers and shareholders) about accounting, internal accounting controls or auditing matters at CIBC. In addition, CIBC employees, contingent workers and others can report concerns through the Whistleblower Hotline (online or by phone) about irregular business activities or behaviour that may expose CIBC to reputation risk, including fraud, integrity of financial reporting, ethics, actual or potential violations of CIBC’s Code of Conduct, or violations of a law or regulation. Reports to the Whistleblower Hotline are confidential and callers can choose to remain anonymous.
| C I B C P R O X Y C I R C U L A R | 59 |
Table of Contents
Statement of Corporate Governance Practices
Annual Meeting – CIBC’s annual meeting of shareholders is held at different locations across Canada so that directors and management can meet shareholders, clients and employees. The meeting is also conducted as a live webcast, so that all shareholders can participate.
| “Say on Pay” – Shareholders can have a “say on pay” by voting on an advisory resolution on CIBC’s approach to executive compensation described in the Circular. The vote is advisory, not binding and does not diminish the Board’s roles and responsibilities. However, the Board and the Management Resources and Compensation Committee consider the results of this vote in making future executive compensation decisions. |
Last year 95% of shareholder votes were in favor of CIBC’s approach to executive compensation.
| |||
Hearing from shareholders – CIBC’s Investor Relations website at www.cibc.com contains helpful information about upcoming reporting dates, quarterly investor presentations, fact sheets on CIBC’s financial performance and webcast links. CIBC’s Investor Relations group welcomes dialogue with shareholders and potential investors.
Contacting CIBC’s Board
Anyone may contact the Board, the Chair of the Board, a Board committee or a director at corporate.secretary@cibc.com or CIBC Corporate Secretary’s Division, 199 Bay Street, Commerce Court West, Suite 4460, Toronto, Ontario M5L 1A2.
Requesting paper copies
Our statement of corporate governance practices refers to material available on CIBC’s website. Shareholders may send a request for printed copies of any of these materials to the Corporate Secretary at corporate.secretary@cibc.com or CIBC Corporate Secretary’s Division, 199 Bay Street, Commerce Court West, Suite 4460, Toronto, Ontario M5L 1A2.
We encourage you to join our digital movement and go paperless by accessing these materials at www.cibc.com.
| 60 | C I B C P R O X Y C I R C U L A R |
Table of Contents
Message to our Fellow Shareholders
Responding, adapting and emerging stronger
Thanks to the collective efforts of our 44,000 employees, we responded to the immediate needs of our stakeholders – especially our clients and employees – in a crisis caused by the COVID-19 pandemic and the ensuing economic disruption. We also continued to make progress in building a relationship-oriented bank for a modern world that delivers superior client experience and shareholder returns. We executed on our strategy by focusing on four areas:

|
Delivering a modern relationship-banking value proposition to our clients by continuing to strive to bring the best of CIBC to our clients with each interaction and every decision we make. | |

|
Diversifying our earnings growth by creating a strong cross-border platform and thereby strengthening capabilities for our clients and deepening relationships across our bank. | |

|
Optimizing our operational efficiency by driving growth, maintaining a strong focus on continuous improvement and keeping a careful eye on costs. | |

|
Maintaining capital and balance sheet discipline by investing our resources aligned to our strategy to focus on growing our existing business over the next several years. |
Living our purpose
The onset of the COVID-19 pandemic in early 2020 created unique challenges for all of our stakeholders. Recognizing the important role banks play in society, and acting in line with our shared purpose, our team worked together to deliver for our clients, each other, our communities and our shareholders.
| • | Supporting our Clients – recognizing the immediate need for payment and cash flow relief as a result of economic disruption, our bank was there for clients with loan and mortgage deferrals, credit relief, skip payment options, payment protection for our US clients, and special support for seniors and persons with disabilities, all with the goal of protecting our clients’ safety and financial well-being. |
| • | Supporting our Teams – the health and well-being of our team members was at the heart of our response to the COVID-19 pandemic. We immediately transitioned the majority of our team to work remotely, and provided per diems to those who were needed on site to support our clients. In addition, we responded by instituting special payments, providing additional paid time off, leveraging our technology investments to stay connected virtually, and instituting other protocols to protect the health and well-being of our team members – all of which enabled us to perform at our best in support of our clients. |
| • | Supporting our Communities – as normal fundraising options were disrupted, community organizations were under increased pressure. We increased donations to charities, including donations of $100,000 to the World Health Organization and $650,000 to local Canadian charities. We also created the Holidays for Heroes program where Canadians were invited to nominate a frontline health care worker to receive a future travel voucher, and the Future Heroes bursary fund to support first-year students across a range of health care programs. |
| • | Supporting our Shareholders – we pivoted to a virtual platform for our 2020 Annual General Meeting so that you could vote online, hear about our progress and share your feedback. With travel restrictions in place for the balance of the year, our executives conducted numerous virtual roadshows with institutional investors to keep them informed of our initiatives and progress in response to the pandemic, as well as our investments to further our long-term growth strategy. |
Guided by our purpose, we were the first bank among our peers to announce or proactively implement many of these initiatives. As a result of our focus and commitments to our clients, CIBC was recognized during the first wave of COVID-19 as the top performing brand among Canadian banks for the way we are supporting Canadians and their communities through the pandemic; and, in an enterprise-wide Pulse Check survey, our employees told us that they were proud of CIBC’s response to the pandemic.
| C I B C P R O X Y C I R C U L A R | 61 |
Table of Contents
Message to our Fellow Shareholders
Aligning executive compensation with our strategic priorities
Our executive compensation program provides a direct connection between shareholders and our talent, ensuring we are able to attract, retain and motivate a talented team that drives long-term value. As part of our global oversight responsibilities, we consider our strategic objectives when determining executive compensation design and payout decisions, including: alignment with shareholder interests; motivating the successful achievement of our strategy; and adherence to our risk tolerance.
In 2020, the link between executive compensation and business performance was demonstrated through our Business Performance Factor (BPF), which is comprised of three key measures: financial performance measured by our adjusted diluted earnings per share (EPS) with a 50% weighting; simplification and efficiency measured by our adjusted non-interest expense to revenue (NIX) ratio with a 25% weighting; and client experience measured by our Client Experience (CX) Index with a 25% weighting. Incentive awards for all executives and most of our employees are based on our BPF and their individual performance. Individual performance is evaluated using a scorecard of role specific metrics in areas such as financial performance and Environmental, Social and Governance (ESG) performance. These metrics include aligning with our environmental objectives; client experience results; factoring in employee engagement; progressing on inclusion and diversity goals; building community; and fulfilling risk and control requirements. You can read more about this starting on page 71 of the Compensation Discussion and Analysis (CD&A).
When determining executive compensation for 2020, the Committee and Board also considered the strong leadership shown by our CEO and the Executive Committee (EXCO) as they successfully led CIBC with agility and purpose through this period of economic and societal uncertainty.
Looking forward to 2021, we have made changes to the performance measures that incorporate learnings from the past year and considered your feedback. Notably, we have revised our BPF for the 2021 fiscal year by replacing one measure (adjusted NIX ratio) with new measures, such as, adjusted revenue growth and ESG Index that we believe will broaden and further strengthen the link between executive compensation and our strategic priorities. We also added relative performance to several measures in addition to performance against our established plan. More specifically, for the 2021 fiscal year, we have made the following changes:
| Performance Measure | Current weighting | New weighting | ||
|
Adjusted diluted EPS |
50% | 35% | ||
| Adjusted operating leverage |
not applicable | 15% | ||
|
Adjusted revenue growth |
not applicable | 15% | ||
| CX Index |
25% | 25% | ||
|
ESG Index |
not applicable | 10% | ||
|
Adjusted NIX ratio |
25% | eliminated | ||
Fiscal 2020 performance
In a very challenging environment, CIBC reported solid results in 2020, demonstrating the agility and resilience of our bank. We continued to focus on our purpose to make our clients’ ambitions a reality, make ongoing investments in our business, and demonstrate disciplined risk and expense management. These actions contributed to our resilience during the disruption caused by the COVID-19 pandemic and have positioned us well for the evolving macroeconomic environment. You can read more about CIBC’s and our business units’ performance in our 2020 Annual Report.
Key financial highlights include:
| • | Delivered adjusted net income(1) of $4.4 billion and adjusted diluted EPS(1) of $9.69. |
| • | Delivered record adjusted pre-provision net income of $8.2 billion (taking adjusted income before income taxes(1) of $5.7 billion and adding back provision for credit losses(1) of $2.5 billion) which was 0.4% higher than the previous year. |
| (1) | Adjusted results are non-GAAP measures and are discussed in the Non-GAAP measures section starting on page 16 of CIBC’s 2020 Annual Report. For fiscal 2020, we used the non-GAAP measures of adjusted diluted EPS and adjusted NIX ratio as elements in determining incentive compensation funding and measuring the performance of executives for executive compensation purposes as further explained in “Assessing financial performance and determining compensation” on page 73. |
| 62 | C I B C P R O X Y C I R C U L A R |
Table of Contents
Message to our Fellow Shareholders
| • | Maintained a strong Basel III Common Equity Tier 1 capital ratio of 12.1%. |
| • | Returned 65% of profits to our common shareholders through dividends and share repurchases in fiscal 2020. |
| • | Delivered above peer median Total Shareholder Return (TSR) in fiscal 2020 and on a three-year basis. |
| • | Reported return on equity (ROE) of 10.0% and adjusted ROE(1) of 11.7% (reflects the division of adjusted net income attributable to common shareholders of $4.3 billion(2)by the average common shareholders’ equity of $36.8 billion). |
| • | Reported adjusted NIX ratio of 55.8% (reflects the division of adjusted non-interest expenses(1) of $10.6 billion into adjusted total revenue (tax equivalent basis)(1) of $18.9 billion), which measures our operating efficiency, was slightly higher than 55.5% in 2019. |
Other key performance highlights include:
| • | Demonstrated improvement in client experience year-over-year as a result of CIBC’s enhanced, closed-loop client feedback program that enables immediate response to client issues; data to inform the development of services and products that best meet client needs and ambitions; and a proactive approach to help clients respond to the pandemic. |
| • | Named once again as one of Canada’s Top 100 Employers by Mediacorp Canada Inc., our ninth consecutive year with this honour. |
| • | Continued modernization strategy with upgrades to our cash management, capital markets and payments platforms. |
| • | Furthered our commitment to a sustainable economy: |
| – | Hosted our first virtual Sustainability Conference. |
| – | Issued an inaugural US$500 million, five-year Green Bond to help finance new and existing green projects, assets, and businesses that mitigate the risks and effects of climate change. |
| – | Achieved 28% of our $150 billion sustainable financing target by 2027. |
Based on CIBC’s fiscal 2020 performance, the calculated BPF was 94%. The Board approved a qualitative adjustment of -5%, particularly in recognition of the impact of COVID-19 on our business, shareholders and our communities. The final BPF was 89% for our executives, 11% below our target and well below the maximum potential payout opportunity, clearly aligning our executive compensation with our performance. Final incentive payouts incorporate individual performance as discussed on page 62 of this letter. You can read more about our incentive plan design and BPF determination starting on page 72 of the CD&A.
Compensation for our CEO
2020 pay
We reviewed Mr. Dodig’s performance in 2020 against his individual goals and approved Total Direct Compensation (TDC) of $9.01 million for fiscal 2020, which is approximately one million or 10% below his 2020 TDC target of $10.00 million. Mr. Dodig’s fiscal 2020 TDC is $0.50 million higher than 2019, driven by the TDC target increase approved in December 2019 to align his compensation more appropriately with the market. Mr. Dodig’s performance-based incentive compensation of $8.01 million is composed of a cash bonus of $1.60 million, grants of Performance Share Units (PSUs) of $5.13 million and stock options (options) with a compensation fair value of $1.28 million. In addition to being “performance-granted”, Mr. Dodig’s PSUs also have future performance-vesting conditions comprised of relative ROE and TSR performance. The Committee and Board believe these compensation decisions are supported by Mr. Dodig’s performance and strong leadership in successfully navigating CIBC through an uncharted course in the midst of economic and social uncertainty, while continuing to strengthen our purpose as an organization and advance CIBC’s long-term strategy.
2020 ownership
Mr. Dodig strongly believes in CIBC and its future. As of October 30, 2020, he owned $23.41 million worth of CIBC equity, which is 23.4 times his salary. This substantial ownership level creates significant long-term alignment with shareholders’ interests and mitigates against excessive risk taking.
| (1) | Adjusted results are non-GAAP measures and are discussed in the Non-GAAP measures section starting on page 16 of CIBC’s 2020Annual Report. For fiscal 2020, we used the non-GAAP measures of adjusted diluted EPS and adjusted NIX ratio as elements in determining incentive compensation funding and measuring the performance of executives for executive compensation purposes as further explained in “Assessing financial performance and determining compensation” on page 73. |
| (2) | Adjusted net income attributable to common shareholders of $4.3 billion reflects adjusted net income of $4.4 billion, less net income attributable to preferred shareholders and other equity instrument holders of $122 million and to non-controlling interests of $2 million. |
| C I B C P R O X Y C I R C U L A R | 63 |
Table of Contents
Message to our Fellow Shareholders
Mobilizing talent to build a stronger CIBC
Two of our most important accountabilities are further strengthening our talent and succession planning. In 2020, against the backdrop of market volatility and disruption, we continued to provide oversight for strategic talent moves across our EXCO and our broader executive team to capitalize on their collective strengths and experience to further our transformation and accelerate client-focused growth. Some notable highlights relating to our named executive officers (NEOs) are outlined below:
| • | Effective November 1, 2019, Hratch Panossian took on the role of Senior Executive Vice-President and Chief Financial Officer (CFO) and effective March 2, 2020, his role expanded to take on accountability for Enterprise Strategy. |
| • | Effective March 2, 2020, Laura Dottori-Attanasio, former Chief Risk Officer (CRO), transitioned into the role of Senior Executive Vice-President and Group Head, Personal and Business Banking, assuming leadership of our largest business. |
| • | Effective March 2, 2020, Harry Culham took on additional responsibility for Direct Financial Services, which includes Simplii Financial, Direct Investing and Advice in his expanded mandate as Senior Executive Vice-President and Group Head, Capital Markets and Direct Financial Services. |
We made a number of other key changes effective March 2, 2020, by either transitioning EXCO members to different roles or expanding their mandate. In light of this, we postponed our annual review of the EXCO’s TDC targets from December 2019 to February 2020 when we approved the EXCO re-organization; at this time, prior to the full global impact of the first wave of the COVID-19 pandemic, we also approved TDC target changes for some of our NEOs to align compensation for their roles more appropriately with the market.
In addition, we have taken a bold stance to ensure we are developing talent and attracting the next generation of leaders that reflect the communities we serve. Some notable results are outlined below:
| • | We have increased the representation of women on the EXCO (which typically includes the CEO), from 27% in 2019 to 40% in 2020. |
| • | We have increased the focus on inclusion and diversity at CIBC with our CEO taking on the role of Chair of CIBC’s Inclusion and Diversity Leadership Council. |
| • | We joined in the efforts to stand against anti-Black systemic racism and to build a more inclusive bank and society with a variety of actions, one of which was our CEO taking on the role as co-chair of the BlackNorth initiative, created to encourage leading Canadian organizations to make specific commitments to combat anti-Black systemic racism. |
| • | We were proud our efforts in this area were recognized when CIBC was named as one of Canada’s Best Diversity Employers for the tenth year in a row, and included in the Bloomberg Gender Equality Index for the fifth consecutive year. |
You can read more about talent management, and inclusion and diversity at CIBC starting on page 83 of the CD&A.
Responding to shareholder feedback
We like to hear from our shareholders and proxy advisory firms. Some highlights of our discussions are below:
| • | We specifically linked ESG and executive compensation by including ESG related goals at the individual level for accountable officers and incorporating ESG into our BPF starting in 2021. See page 62 of this letter; and our CD&A starting on page 71 for expanded disclosure on how we are achieving this link in 2020. |
| • | We increased disclosure on targets and results for the CX Index, which constitutes 25% of our BPF. See page 74 of the CD&A. |
We welcome your feedback anytime by writing to us at corporate.secretary@cibc.com, or CIBC Corporate Secretary’s Division, 199 Bay Street, Commerce Court West, Suite 4460, Toronto, Ontario M5L 1A2.
The Committee and the Board are proud of the CIBC team and remain committed to ensuring long-term value for all the bank’s stakeholders. On behalf of the Committee and the Board, we thank you, our shareholders, for your continued support.
Sincerely,
|
|

| |||
|
Patrick D. Daniel |
John P. Manley | |||
| Chair, Management Resources and Compensation Committee |
Chair of the Board |

| 64 | C I B C P R O X Y C I R C U L A R |
Table of Contents
Compensation Discussion and Analysis
The Compensation Discussion and Analysis provides an overview of the governance of our executive compensation program, explains how CIBC compensates its executives and how we determined fiscal 2020 compensation for our NEOs.
Compensation Philosophy, Practices and Governance
At CIBC, our approach to compensation is based on three key principles:
|
Align with CIBC’s business strategy, risk appetite, creation of sustainable shareholder value and the evolving regulatory environment
|
Support CIBC’s ability to attract, motivate and retain the right talent
|
Pay for performance and encourage behaviours aligned with CIBC’s purpose and values
|
The following section summarizes how we reflect good governance and risk mitigation in our compensation programs. More information is provided on the following pages.
| Compensation Governance Practices |
| • | Align compensation approach with Financial Stability Board (FSB) Principles for Sound Compensation Practices and their Implementation Standards as adopted globally by regulators |
| • | Align performance measures with CIBC’s Board-approved strategic plan |
| • | Apply upside limits to individual incentive awards |
| • | Align the vesting of compensation awards with the time horizon of risks |
| • | Define minimum deferral levels and set minimum equity ownership levels for material risk takers |
| • | Use performance and misconduct clawback provisions to enable CIBC to recover compensation in appropriate circumstances |
| • | Determine compensation for employees in control functions independently from the performance of the business segments they oversee |
| • | Determine compensation for the CEO considering both horizontal and vertical pay ratio analyses |
| • | Assess the appropriateness of compensation by stress-testing different compensation scenarios and backtesting realizable pay |
| • | Determine realizable and realized pay using relative and absolute metrics |
| • | Require a “Double Trigger” in our Change of Control Policy (i.e., payment occurs only upon both a change of control and termination of employment) |
| • | Limit bonus guarantees to new hires or for exceptional circumstances to no more than 12 months |
| • | Ensure the Committee’s independent advisor provides advice on executive compensation matters, has the power to challenge recommendations from management and does not perform other work for CIBC |
| • | Do not re-price or backdate options, or discount options at the time of grant |
| • | Do not allow hedging designed to monetize or reduce market risk associated with equity-based compensation |
| C I B C P R O X Y C I R C U L A R | 65 |
Table of Contents
Compensation Discussion and Analysis
Committee composition
Members of the Committee, Patrick Daniel (Chair), Nanci Caldwell, Kevin Kelly, Katharine Stevenson and Martine Turcotte bring diverse skills and experiences, including leadership, human resources management/compensation, risk management and risk governance, that assist the Committee in making decisions on CIBC’s compensation policies and practices and fulfilling its mandate.
For information on the experience and educational background of the Committee members standing for re-election, see our director nominee biographies starting on page 15 and “Director nominee skills and experience” on page 30. For information on director education sessions provided to Committee members in fiscal 2020, see page 53.
Independent advice
The Committee has engaged Pay Governance LLC (Pay Governance) and its predecessors since 2006 to provide independent analysis and advice to the Committee on all executive compensation matters including compensation targets and annual compensation recommendations for the CEO and EXCO members.
The table below discloses the fees paid by the Committee over the past two fiscal years to Pay Governance. Pay Governance has not provided other services to CIBC in those years. As a result, the Committee believes Pay Governance is an independent advisor based on the U.S. Securities and Exchange Commission’s factors for evaluating advisor independence.
| Executive Compensation Related Fees |
2020 | 2019 | ||||||
| (US$) | (%) | (US$) | (%) | |||||
|
For Committee Work |
190,000(1) | 100 | 175,000(1) | 100 | ||||
|
For Management Work |
— | — | — | — | ||||
| (1) | The 2020 fees equate to C$255,417 and the 2019 fees equate to C$232,628 when converted to Canadian dollars at the average WM/Reuters exchange rate of US$1.00 = C$1.3443 for 2020 and US$1.00 = C$1.3293 for 2019. |
The Committee and the independent advisor meet in camera without management and the Chair of the Committee meets privately with the advisor. These discussions contribute to the Committee’s effectiveness in overseeing compensation.
The Committee engages external legal counsel and other advisors as required to provide expert advice or director education. The Committee also evaluates the independence of these outside advisors and considers any conflicts in advance.
CIBC’s Internal Audit group conducts an annual independent review of CIBC’s compensation governance practices and the alignment of those practices with regulatory standards, including the FSB’s Principles for Sound Compensation Practices and their Implementation Standards. The Committee reviews a report prepared by the Chief Auditor on the results of the review.
| 66 | C I B C P R O X Y C I R C U L A R |
Table of Contents
Compensation Discussion and Analysis
Approach to Executive Compensation
Our executive compensation program aligns compensation with business and individual performance and incorporates a strategy-driven and risk-controlled approach.
Key design features
|
Align with CIBC Strategy
|

|
Compensation is aligned to our strategy of building a relationship-oriented bank for a modern world that delivers superior client experience and shareholder returns | ||||
|
Pay for Performance
|
|
Incentive compensation design reinforces “one CIBC team” aligned to overall bank performance, core strategic business unit performance and individual accomplishments | ||||
|
Attract and Retain Talent
|
|
Market competitiveness is assessed when setting compensation targets | ||||
|
Risk Management
|
|
Adherence to CIBC’s risk appetite and effective risk management objectives are considered in compensation design, incentive funding and individual payouts | ||||
|
Shareholder Interests
|
|
The creation of enduring shareholder value is reinforced by promoting share ownership for all employees and a significant equity deferral for executives | ||||
|
Good Corporate Governance
|
|
All compensation programs are designed and delivered based on sustainable good governance practices |
| C I B C P R O X Y C I R C U L A R | 67 |
Table of Contents
Compensation Discussion and Analysis
Compensation elements
CIBC’s executive compensation program includes direct compensation (salary and variable incentive awards) and indirect compensation (benefits, perquisites and retirement programs). The Committee reviews these components regularly to assess market competitiveness and continued alignment with our compensation philosophy.
| Compensation Element |
Focus | Purpose | Form |
Performance Period | ||||
| Direct Compensation | ||||||||
| Salary (Fixed) |
Provide competitive fixed pay based on job scope, skills, experience and market competitiveness. | Cash | 1 year | |||||
| Variable Incentive Award(1) |
Align incentive compensation with business and individual performance.
Individual short-, medium- and long-term grants/awards are based on predetermined fixed percentages for cash and deferred equity.
|
|||||||
| Short-term | Annual cash bonus rewards the achievement of business objectives. | Cash(2) | 1 year | |||||
| Medium-term | Deferred incentive focuses on performance over the medium-term. | PSUs | 3 years | |||||
| Long-term | Deferred incentive motivates eligible executives to create sustainable shareholder value over the long-term. | Options | 3 to 10 years | |||||
| Indirect Compensation | ||||||||
| Benefits |
Invest in the health and wellness of executives and employees. | Group benefit programs | - | |||||
| Perquisites |
Executive perquisite offering may include club membership, annual health assessment and car benefits. | Annual allowance or reimbursement | - | |||||
| Retirement Programs |
Contribute to financial security after retirement. | Pension and Savings Plans(3) | - | |||||
| (1) | If an employee engages in misconduct that causes a significant financial loss to CIBC, or that causes a material restatement of the financial statements, CIBC may demand the repayment of cash or deferred incentive compensation awarded. |
| (2) | Executives may elect to voluntarily defer some or all of the cash incentive received into deferred share units (DSUs) which increase equity ownership under CIBC’s guidelines and which only pay out following retirement, termination of employment or death. |
| (3) | Competitive retirement income arrangements are provided to all employees. A Supplemental Executive Retirement Plan (SERP) is provided to certain executives at the level of Senior Vice-President and above (described on page 94). For any executive that joined the SERP or was promoted prior to January 1, 2016, credited service is based only on service while employed by CIBC and pensionable earnings are capped at a fixed dollar limit. For any executive that joined the SERP or was promoted after January 1, 2016, SERP benefits accrue on a fixed, flat dollar basis and service is credited only from the date they joined the SERP. This means SERP pension benefits at CIBC do not include service for years beyond those actually worked and the benefits do not automatically escalate with increases in compensation. |
| 68 | C I B C P R O X Y C I R C U L A R |
Table of Contents
Compensation Discussion and Analysis
Variable incentive award
Variable incentive awards are important in ensuring pay for performance alignment. Variable incentive awards for the CEO and EXCO members are awarded in cash and deferred equity-based compensation based on the weightings set out below:
|
Cash Incentive Award (Short-term) |
Deferred Incentive Award (Medium-and Long-term) | |||||
| CEO |
20% | 80% | ||||
| EXCO |
30% | 70% | ||||

| ||||||
| Deferred Incentive Mix | ||||||
| PSUs (Medium-term) |
Options (Long-term) | |||||
| 80% | 20% | |||||
Deferred incentive award
Deferred incentive awards are used to align executive compensation with mid- and long- term shareholder interests. CIBC’s deferred incentive award is granted utilizing the vehicles described below. More detail is provided starting on page 90.
|
Deferred Incentive Award Vehicle |
Description | |||||||
| PSUs
(Medium-term) |
• PSUs vest and settle in cash at the end of a three-year performance period. • The percentage of PSUs which vest ranges from 75% to 125% based on CIBC’s ROE (or adjusted ROE, as applicable)(1) and TSR performance during the three-year performance period relative to Bank of Montreal, Bank of Nova Scotia, National Bank of Canada, Royal Bank of Canada and the Toronto-Dominion Bank. • ROE (or adjusted ROE, as applicable) and TSR performance for CIBC and each peer bank are ranked from one (highest performance) to six (lowest performance). Based on CIBC’s ranking for each measure, over the three-year period, a performance factor is assigned using the following scale:
| |||||||
| Rank | Performance Factor | |||||||
| 1 | 125% | |||||||
| 2 | 115% | |||||||
| 3 | 105% | |||||||
| 4 | 95% | |||||||
| 5 | 85% | |||||||
| 6 | 75% | |||||||
|
• The ROE (or adjusted ROE, as applicable) performance factor is averaged with the TSR performance factor to determine the final vesting percentage. • The final vesting percentage is multiplied by the original number of PSUs granted, plus any additional units accumulated through reinvested dividend equivalents, to calculate the final number of PSUs which vest and pay out based on CIBC share value at that time. (See “2017 PSU vesting” on page 86 for actual calculation details). • The Board has discretion to adjust the vesting percentage and may reduce it to 0% if it deems that a material event occurred during the three-year performance period which impacts CIBC’s financial or market performance relative to the peer group.
| ||||||||
| (1) | For the F2020 PSU grants, and on a go-forward basis, CIBC has determined that vesting should be tied to adjusted ROE, instead of reported ROE. Use of the adjusted metric aligns with our overall approach to assessing CIBC’s underlying business performance in connection with executive compensation matters, as discussed in the “Assessing financial performance and determining compensation” section of this Circular on page 73. |
| C I B C P R O X Y C I R C U L A R | 69 |
Table of Contents
Compensation Discussion and Analysis
|
Deferred Incentive Award Vehicle |
Description | |
| Options (Long-term) |
• Options vest 50% on the third and fourth anniversaries of the grant date and have a 10-year term. • Future realizable value depends on shareholder value creation. | |
| DSUs (Long-term) |
• DSUs settle in cash after the executive leaves CIBC, based on CIBC share value at that time. • An executive can voluntarily elect to defer up to 100% of their cash incentive award into DSUs, which enhances the alignment of executive compensation with long-term shareholder return experience. | |
Establishing total direct compensation target
Total Direct Compensation (TDC) includes an executive’s annual salary and variable incentive award. Typically, at the beginning of each fiscal year, the Committee reviews and recommends TDC targets for the CEO and EXCO members for Board approval. Targets are reviewed against market data annually and adjusted over time to ensure that progression within the role is taken into account.
In 2020, the annual review of targets for EXCO members was postponed from the beginning of the fiscal year to align with the February 2020 EXCO re-organization, where roles and TDC target changes were approved by the Board.
When reviewing TDC targets, the Committee considers market data for the peer group, the relative size of peer organizations, the relative size and scope of the role and the incumbent’s experience. Market data is sourced from publicly available data and from benchmarking data provided by Korn Ferry Hay Group, an external service provider engaged by management that regularly conducts a syndicated study for Canada’s large financial institutions. For the US, additional benchmarking data is drawn from another external service provider engaged by management, namely Willis Towers Watson and their global financial services database.
Peer group
Compensation targets for the CEO and EXCO members are evaluated against financial services companies that are of comparable size, scope, market presence and complexity to CIBC. Based on these criteria, the CEO and EXCO roles are benchmarked against the other five major Canadian banks(1). For the CEO and CFO, the peer group is expanded to include the two largest Canadian insurance companies(1), as the market for these roles is comparable more broadly across the financial services industry. For the Group Head CIBC U.S. Region, the peer group also includes smaller regional and community banks in the US. The following chart shows CIBC’s relative position on certain key measures used to define its peer group.

| (1) | Peer group of five major Canadian banks: Bank of Montreal, Bank of Nova Scotia, National Bank of Canada, Royal Bank of Canada and the Toronto-Dominion Bank; and two Canadian Insurance companies: Manulife Financial and Sun Life Financial. |
| (2) | As at October 31, 2020 for banks and September 30, 2020 for insurance companies. |
| (3) | Year ended October 31, 2020 for banks and trailing 12 months ending September 30, 2020 for insurance companies. |
| 70 | C I B C P R O X Y C I R C U L A R |
Table of Contents
Compensation Discussion and Analysis
Pay mix
The charts below show the compensation elements as a percentage of fiscal 2020 target TDC for the CEO and EXCO members. The charts demonstrate the greater pay variability for the CEO and EXCO business leaders who are best positioned to affect business results over the long-term compared to the EXCO functional group heads in Finance, Risk Management, People, Culture and Brand, and Technology, Infrastructure and Innovation.
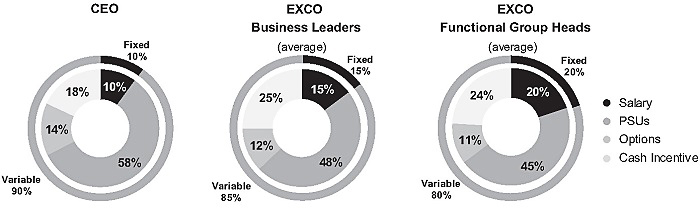
Establishing individual goals
At the beginning of each year, the Committee approves the annual goals and measures for the EXCO members and recommends the CEO’s goals and measures for Board approval.
The Audit Committee and the Risk Management Committee also review the annual goals and measures for the CFO and the CRO, respectively.
The annual goals and measures for the CEO and EXCO align with CIBC’s strategic priorities and include financial performance (achievement of financial and key business results, earnings growth by growing the franchise, simplification and efficiency initiatives) and ESG related metrics, including client experience, relevant to their role as described in the table below.
| ESG Category | Metrics | |||
| Environmental |
|
• Alignment with environmental objectives (such as, sustainable financing and climate footprint) | ||
| Social |
|
• Client experience results • Inclusive banking and financial education • Employee engagement • Employee inclusion and diversity goals • Building community | ||
| Governance |
|
• Compliance with CIBC’s risk appetite statement • Compliance with audit and compliance objectives • Adherence to CIBC’s Code of Conduct |
Assessing individual performance
At the end of each year, the Committee evaluates individual performance relative to key metrics for the CEO and EXCO members and provides its recommendation on the CEO’s individual performance to the Board for approval. In addition to the performance assessments for this group, the Committee reviews any risk, compliance, conduct or audit concerns to determine if there are any adjustments required to the evaluation of individual performance and the resulting variable incentive awards. In the case of the CFO and CRO, the Audit Committee and the Risk Management Committee, respectively, also provide their input into the Committee’s evaluation of individual performance. Following the evaluation of individual performance, the Committee recommends for Board approval the variable incentive awards for the CEO and EXCO members. See “Variable incentive plan design” below.
| C I B C P R O X Y C I R C U L A R | 71 |
Table of Contents
Compensation Discussion and Analysis
Variable incentive plan design
The variable incentive plan, known as Goals Performance Success (GPS) for all executives, including the CEO and EXCO members, provides transparency with respect to how incentive awards are determined and a strong link between pay and performance. The variable incentive plan components are described below:
| (1) | Total Variable Compensation Target, expressed as a percentage of base salary earned in the fiscal year; and |
| (2) | Performance Multiplier, which is comprised of both business performance and individual performance, equally weighted. |
An executive’s GPS award is determined using these components, as described below:
|
GPS Award
|
= |
Total Variable Compensation Target |
X | Performance Multiplier | ||||
| The GPS award is capped at a maximum of 150% of the target incentive award to mitigate undue risk taking.
Under extreme circumstances, the GPS award may be reduced to zero to ensure pay for performance alignment.
GPS awards for the CEO and EXCO members are approved by the Board. |
Determined based on competitive market analysis conducted as part of the target setting process described under “Establishing total direct compensation target” on page 70.
Varies by role, market and executive job level. |
The Performance Multiplier incorporates both individual and business performance. Individual performance is assessed at the end of the year against strategically aligned goals as described under “Establishing individual goals” and “Assessing individual performance” on page 71.
Business performance is determined based on absolute and relative business performance measured against Board-approved goals aligned to CIBC’s strategy.
The Performance Multiplier for the CEO is approved by the Board and for EXCO members by the Committee. The Committee and Board have the ability to make adjustments at their discretion. | ||||||
Performance Multiplier
The Performance Multiplier is comprised of both business performance and individual performance. The Business Performance Factor (BPF) forms part of the overall Performance Multiplier and can range from 0% to 125%. The BPF within the Performance Multiplier is determined based on performance against metrics that are aligned to CIBC’s strategic priorities with a focus on financial performance, operational efficiency and client experience.
The performance measures and relative weighting used to determine the BPF for fiscal 2020 are set out below:
| Performance Measure | Measure Description | Weight | ||
|
Adjusted diluted EPS vs. target |
Measure of profitability, incorporating performance of all businesses and aligned to creating shareholder value | 50% | ||
|
Adjusted NIX ratio vs. target |
Measure of operational efficiency that reflects how much it costs to earn a dollar | 25% | ||
|
CX Index(1) |
Measure of client experience directly aligned to our client-focused strategy | 25% | ||
| (1) | The CX Index is a composite index that includes internal and external client surveys and client experience oriented metrics from Canadian Personal and Business Banking, Capital Markets, Canadian Commercial Banking and Wealth Management and US Commercial Banking and Wealth Management. These comprise the measures that drive the most impactful behaviours to help in our pursuit of becoming number one in the market in client experience. |
| 72 | C I B C P R O X Y C I R C U L A R |
Table of Contents
Compensation Discussion and Analysis
In addition to these performance measures, the Committee and Board have discretion to adjust the calculated BPF based on qualitative factors described below:
| • | relative performance vs. peers to assess our performance against key financial measures such as revenue and EPS growth; |
| • | risk, to ensure compensation is aligned with our risk appetite and objectives by considering risk outcomes with adjustments being made only to reduce the BPF (or individual awards); |
| • | unexpected outcomes and other items that either should be included or excluded from the performance that determines the BPF; and |
| • | any other factors the Committee and the Board consider appropriate. |
We look at various factors when designing our BPF. Looking forward to fiscal 2021, we have included adjusted revenue growth, adjusted operating leverage and formalized ESG as a fundamental component of the BPF construct. We have also added relative performance to several metrics, in addition to absolute performance. See “Message to our Fellow Shareholders” on page 62 for more details on the fiscal 2021 BPF.
Assessing financial performance and determining compensation
In assessing financial performance, the CFO, the CRO, the Committee and Board review results on a reported basis (in accordance with International Financial Reporting Standards) and an adjusted basis. Both perspectives are considered useful to understand performance. Adjusted measures are used to assess CIBC’s underlying business performance and as one element of measuring executive performance for compensation decision-making purposes. As discussed on the previous page for fiscal 2020, adjusted diluted EPS(1) and adjusted NIX(2) ratio (also known as adjusted efficiency ratio), were key components used to determine the BPF. Going forward for fiscal 2021, adjusted NIX has been eliminated from our BPF, and two new adjusted measures, adjusted operating leverage and adjusted revenue growth, have been added. Additional adjusted measures considered by the Committee and the Board include: adjusted total revenue on a taxable equivalent basis (TEB)(3), adjusted net income(4) and adjusted ROE(5). A further discussion of non-Generally Accepted Accounting Principles (GAAP) used by CIBC and a reconciliation of certain non-GAAP figures to the most closely comparable GAAP figures is disclosed in the Non-GAAP measures section starting on page 16 of CIBC’s 2020 Annual Report.
Risk Management Committee and input from the CFO and the CRO
The Committee works closely with the Risk Management Committee and receives input throughout the year from the CFO and the CRO. The Committee and the Chair of the Risk Management Committee, with input from the CFO and the CRO, assess the alignment of business performance with CIBC’s risk appetite, which includes certain ESG factors such as conduct and culture, client related risk metrics and talent management metrics, and determine whether any risk adjustments are required to the BPF.
In addition, at year-end, the Committee and Risk Management Committee meet to review the alignment of business performance with CIBC’s risk appetite and both committees also review a report that includes information about individual risk and compliance issues arising during the year and the recommended impacts to individual performance assessments and compensation. Following this, if applicable, the Committee recommends for Board approval any changes to individual performance assessments and compensation for the CEO and EXCO members.
| (1) | Reported diluted EPS adjusted to remove the impact of items of note (including the amortization of intangibles, and certain items of significance that arise from time to time which management believes are not reflective of underlying business performance), and net of income taxes. |
| (2) | Reported revenue and non-interest expenses adjusted, in each case, to remove the impact of items of note, and to gross up tax- exempt revenue to bring it to a TEB, as applicable. |
| (3) | Reported total revenue, adjusted to remove the pre-tax impact of items of note, and to gross up tax-exempt revenue, as applicable. |
| (4) | Reported net income, adjusted to remove the after-tax impact of items of note. |
| (5) | Reported net income attributable to common shareholders adjusted to remove the impact of items of note, and net of income taxes. |
| C I B C P R O X Y C I R C U L A R | 73 |
Table of Contents
Compensation Discussion and Analysis
2020 Performance and Compensation
2020 Business Performance Factor
| Performance Measure | 2020 Target | 2020 Actual | Result (Actual vs. Target) | |||
|
Adjusted diluted EPS(1) |
$12.32 | $9.69 | 21% Below | |||
|
Adjusted NIX(1) ratio |
56.1% | 55.8% | 30 bps Below | |||
|
CX Index |
100% | 100% | At | |||
|
2020 Calculated BPF |
94% | |||||
|
BPF Qualitative Adjustment |
-5% | |||||
|
2020 Final BPF |
89% | |||||
CIBC’s fiscal 2020 adjusted diluted EPS(1) was $9.69, 21% below target and 19% lower than fiscal 2019. Contributing to this were adjusted total revenue and adjusted net income, which were 1% higher and 18% lower than fiscal 2019, respectively, and 3% and 22% below target.
Operating efficiency, measured by the adjusted NIX(1) ratio, was 55.8%, slightly higher by 30 basis points (bps) compared to fiscal 2019 and better than target by 30 bps.
Our CX Index is a composite index that includes internal and external client surveys and client experience oriented metrics from Canadian Personal & Business Banking, Capital Markets, Canadian Commercial Banking and Wealth Management and US Commercial Banking and Wealth Management.
In a year marked by COVID-19, where client centricity was more important than ever before, the traditional quantitative measures used for measuring client experience could not reflect the extraordinary circumstances that our clients and our bank were facing. In light of COVID-19, client and business priorities shifted and our Client Experience program for fiscal 2020 was adjusted in a number of ways to respond to the pandemic.
Our collective focus on our purpose – to help make our clients’ ambitions a reality – contributed to our client experience improving in a very challenging environment as evidenced by:
| • | the largest Net Promoter Score improvement among Canada’s five largest banks in the IPSOS Customer Service Index, when comparing fiscal 2020 performance with fiscal 2019, as well as the IPSOS Financial Service Excellence awards for our mobile banking, live agent telephone banking and automated teller machines; |
| • | our highest annual score in the 2020 J.D. Power Client Satisfaction study; |
| • | our #1 ranking in customer satisfaction among Canada’s largest banks in the J.D. Power Mobile Banking app study; |
| • | delivering the best overall mobile banking experience in Surviscor’s 2020 Canadian Mobile Banking scorCard review; and |
| • | more than 90% of respondents to client surveys conducted by CIBC noting that their impression of CIBC has improved or is the same following CIBC’s response to COVID-19. |
We achieved this by continuing to build deeper relationships with our clients, delivering personalized financial advice and enhancing the ability for our clients to engage with us when and where they choose.
In 2021, we will continue to build on this momentum to further enhance the quality and consistency of our service delivery to our clients, including continued focus on addressing complaints, investing in customer relationship management and digital goal planning programs and realizing the full potential of our new client feedback platform.
Based on CIBC’s fiscal 2020 performance, the calculated BPF was 94%. The Board approved a qualitative adjustment of -5% based on an assessment of various qualitative considerations, particularly the impact to our business, shareholders and our communities stemming from the COVID-19 pandemic.
After this discretionary reduction, the final fiscal 2020 BPF was 89% for our executives. There were no material risk incidents and, therefore, no risk adjustment was made to the BPF.
This BPF, along with the assessment of individual performance, formed the basis for fiscal 2020 NEO compensation as well as the compensation of all our EXCO members.
| (1) | Adjusted results are non-GAAP measures and are discussed in the Non-GAAP measures section starting on page 16 of CIBC’s 2020 Annual Report. We use these non-GAAP measures of adjusted diluted EPS and adjusted NIX ratio as elements in determining incentive compensation funding and measuring the performance of executives for executive compensation purposes as further explained in the “Assessing financial performance and determining compensation” section of this Circular on page 73. |
| 74 | C I B C P R O X Y C I R C U L A R |
Table of Contents
Compensation Discussion and Analysis
2020 NEO compensation
CIBC’s NEOs are the CEO, the CFO, and the three most highly compensated executive officers in fiscal 2020.
Mr. Dodig

|
As the President and CEO, Mr. Dodig is responsible for developing and executing CIBC’s Board-approved strategy and leading the day-to-day operations of CIBC. The COVID-19 pandemic posed many challenges for CIBC, as it did for most organizations. Throughout fiscal 2020, Mr. Dodig continued to instill a purpose-driven culture across all areas of the bank ensuring that our actions were aligned with the needs of our clients, employees, shareholders, and the communities in which we operate.
The Committee evaluated Mr. Dodig’s performance relative to his goals for fiscal 2020 and determined that he met his key deliverables despite the challenges associated with the COVID-19 pandemic. Mr. Dodig’s leadership and continued focus on building a relationship-oriented bank for a modern world and delivering on our purpose to help make our clients’ ambitions a reality helped steer the organization through this challenging year. |
Mr. Dodig accomplished this by placing emphasis on the well-being of our teams, our clients, and our communities. The majority of our team was transitioned to work remotely and, for team members that needed to be onsite to support our clients, per diems were provided to help them safely navigate the challenges posed by the pandemic and additional precautions were implemented in all of our locations. Mr. Dodig led the team in recognizing the need to support our clients and team members immediately by implementing programs to help our client segments most likely to go into our banking centres, providing payment deferral options, and payment protection for our US clients. Under Mr. Dodig’s leadership, CIBC increased donations to charities and created the Holidays for Heroes program in recognition of the strain the pandemic was putting on our health care workers.
Under Mr. Dodig’s leadership, despite a weaker economic environment resulting from the pandemic, CIBC reported solid results in 2020 and the strong link to our purpose – to make our clients’ ambitions a reality – remained at the forefront of how we operate as we continued to make investments in our business while demonstrating disciplined expense management. Mr. Dodig has focused his leadership team on continuing to strengthen the resilience of our bank which continues to position CIBC well for the evolving macroeconomic environment. You can read more about these developments in the “Message to our Fellow Shareholders” starting on page 61.
In considering compensation for the CEO, the Board conducted a thorough review of Mr. Dodig’s performance relative to his key strategic priorities, highlights of which are outlined in the following table:
| Key Strategic Priorities | Results | |
|
Diversify and accelerate our earnings growth |
• CIBC Bank USA Assets Under Management (AUM) year-over-year growth of 10%
• Increased US region earnings contribution from 6% in 2014 to 17% in 2020
• Revenue from non-traditional Capital Markets clients up 5% year-over-year (includes cross referrals with other SBUs)
| |
|
Deliver a modern relationship-banking value proposition |
• Ranked #1 in customer satisfaction among Canada’s largest banks in J.D. Power mobile banking app study
• Received top rank among the five major Canadian banks in consumer research asking Canadians about how their bank has responded to COVID-19
• CIBC Bank USA Wealth ranked #2 in Barron’s best RIA (Registered Investment Advisor) ranking
|
| C I B C P R O X Y C I R C U L A R | 75 |
Table of Contents
Compensation Discussion and Analysis
| Accelerate our efficiency initiatives to transform our bank |
• Fiscal 2020 adjusted NIX ratio(1) of 55.8%, slightly higher than in 2019 (55.5%) | |
| Advance our Purpose-driven culture |
• Advancements were made against the enterprise inclusion and diversity plan with women and visible minorities representing 33% and 20% of board-approved executive roles, respectively
• Victor took on the role of co-chair of the BlackNorth Initiative | |
| Deliver Financial Results and Create Enduring Shareholder Value |
• Adjusted diluted EPS(1) of $9.69 was 21% below target and 19% lower than fiscal 2019
• TSR is the ultimate measure of shareholder value. For the five years ended October 31, 2020, our TSR was 27.7%, which was below the Standard & Poor’s (S&P)/Toronto Stock Exchange (TSX) Composite Banks Index return over the same period of 35.3% while for the three years ended October 31, 2020, our TSR was 2.65%, which was above the S&P/TSX Composite Banks Index return over the same period of -5.74% | |
Based on our BPF of 89% and the Board’s assessment of his performance, the Board approved a fiscal 2020 GPS award for Mr. Dodig of $8.01 million, which was 89% of his target incentive opportunity and reflects a 7% increase over fiscal 2019, driven by the increase in his target for fiscal 2020. Effective November 1, 2019, Mr. Dodig’s target TDC was increased from $8.75 million to $10.00 million, to better align to peers and reflect his progression in the role. The percentage of his GPS award that is deferred remained at 80%. The details of the 2020 award are provided in the table below. Mr. Dodig received 90% of his target TDC for fiscal 2020.
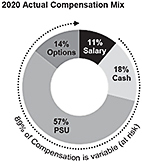
| (1) | Adjusted results are non-GAAP measures and are discussed in the Non-GAAP measures section starting on page 16 of CIBC’s 2020 Annual Report. We use these non-GAAP measures of adjusted diluted EPS and adjusted NIX ratio as elements in determining incentive compensation funding and measuring the performance of executives for executive compensation purposes as further explained in the “Assessing financial performance and determining compensation” section of this Circular on page 73. |
| 76 | C I B C P R O X Y C I R C U L A R |
Table of Contents
Compensation Discussion and Analysis
CEO realized and realizable pay
The chart and accompanying table below illustrate CIBC’s strong track record of aligning CEO pay to CIBC’s performance. The chart compares the current value of compensation awarded to CIBC’s CEO since fiscal 2016 to the value received by shareholders over the same period.
The table provides the underlying information reflected in the chart, including the CEO’s realized and realizable pay for each year. From fiscal 2016 to 2020, the current value of $100 invested by a shareholder is greater than the value of $100 in compensation awarded to CIBC’s CEO.
The current value of the CEO awards as at December 31, 2020 for the fiscal years noted represents the total of:
| (1) | realized pay received by the CEO (actual pay from awards received, dividend equivalents paid and options exercised); and |
| (2) | potential realizable value of awards yet to be paid (unvested units and unexercised options if still outstanding). |
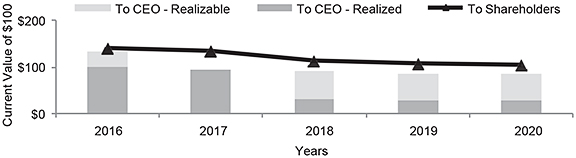
| Year | CEO | TDC Awarded ($) |
A Realized Pay(1) ($) |
B Realizable Pay(2) ($) |
A+ B = C Value ($) |
Period |
To ($) |
To ($) | ||||||||||||||||
| 2016 |
Dodig | 8,793,500 | 8,861,591 | 2,966,708 | 11,828,299 | 10/31/2015 to 12/31/2020 | 135 | 142 | ||||||||||||||||
| 2017 |
Dodig | 8,938,000 | 8,360,642 | 0 | 8,360,642 | 10/31/2016 to 12/31/2020 | 94 | 135 | ||||||||||||||||
| 2018 |
Dodig | 9,526,100 | 3,131,524 | 5,484,483 | 8,616,007 | 10/31/2017 to 12/31/2020 | 90 | 114 | ||||||||||||||||
| 2019 |
Dodig | 8,509,750 | 2,501,950 | 4,818,694 | 7,320,644 | 10/31/2018 to 12/31/2020 | 86 | 109 | ||||||||||||||||
|
2020 |
Dodig | 9,010,000 | 2,602,000 | 5,059,205 | 7,661,205 | 10/31/2019 to 12/31/2020 | 85 | 104 | ||||||||||||||||
| Weighted Average | 98 | 119 | ||||||||||||||||||||||
| (1) | Realized Pay is the sum of salary, cash incentive, the payout value of share units granted during the period, the dividend equivalents paid, and the value of options exercised during the period. |
| (2) | Realizable Pay is the sum of the current value of unvested units granted during the period and the in-the-money value of vested and unvested options that are still outstanding. The realizable value for 2017 represents options granted in 2017 which are out-of-the-money as of December 31, 2020. |
| (3) | Represents the actual value to the CEO for each $100 awarded in TDC for the fiscal year indicated, as at the end of the period. |
| (4) | Represents the value of a $100 investment in CIBC common shares made on the first day of the period indicated, assuming reinvestment of dividends. |
| C I B C P R O X Y C I R C U L A R | 77 |
Table of Contents
Compensation Discussion and Analysis
Mr. Panossian

|
As CFO & Enterprise Strategy, Mr. Panossian is responsible for strategy and corporate development, financial planning and analysis, financial and management reporting, maintenance of accounting records, regulatory reporting, tax planning and compliance, treasury and balance sheet management and liaising with CIBC’s investors.
Mr. Panossian made a strong contribution to CIBC’s fiscal 2020 financial performance in a challenging market environment and in achievement of CIBC’s strategic and risk appetite targets. Mr. Panossian delivered on his core mandate while also implementing significant operational and business capability improvements throughout 2020 and is well positioned to continue to deliver against the Finance strategy in 2021. | |
In fiscal 2020, Mr. Panossian contributed to the advancement of CIBC’s strategy and led the Finance function in alignment with CIBC’s purpose and exceeded most key employee engagement targets for the functions under his leadership.
Mr. Panossian was successful in completing several key initiatives this year while working to transform our bank. Of note, he:
| - | established an ‘Investment Committee’ responsible for ensuring alignment between enterprise strategy and large investments across the organization; |
| - | realized savings by focusing on projects centered on efficiency initiatives and revenue benefits; |
| - | developed comprehensive, detailed strategic and financial key performance indicators across our businesses; and |
| - | launched a Finance Modernization program as a key strategic priority for CIBC. |
Based on our BPF of 89% and the CEO’s assessment of his individual performance, the Board approved a fiscal 2020 GPS award for Mr. Panossian of $1.71 million, which was below his target incentive opportunity. The increase in Mr. Panossian’s 2020 GPS award over fiscal 2019 is reflective of his promotion effective November 1, 2019 and increase to his target TDC. Mr. Panossian received a one-time DSU award of $0.10 million to demonstrate an investment in him and represent a commitment to progress his compensation to align with the market over time. The award will cliff vest five years following the grant date. The details are provided in the table below.
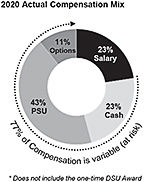
| 78 | C I B C P R O X Y C I R C U L A R |
Table of Contents
Compensation Discussion and Analysis
Mr. Culham

|
As Group Head of Capital Markets and Direct Financial Services, Mr. Culham is accountable for CIBC’s Capital Markets business and Direct Financial Services. CIBC’s Capital Markets business provides integrated credit and Capital Markets products, investment banking advisory services, corporate lending, and top-ranked research to corporate, government and institutional clients around the world. As of March 2, 2020, Mr. Culham also took on responsibility for Direct Financial Services, which includes Simplii Financial, Direct Investing and Advice and the Alternate Solutions Group. Mr. Culham is also accountable for the oversight of CIBC FirstCaribbean and CIBC Mellon. |
Mr. Culham supported CIBC’s strategy with his contributions to the successful integration of Cleary Gull, the establishment of CIBC’s Luxembourg office and his leadership of the Capital Markets business. Under Mr. Culham’s leadership, the US region’s Capital Markets revenue was up 32% year-over-year and the partnerships formed with Bank USA and the Wealth businesses in Canada are driving increased opportunities for Cleary Gull.
Under Mr. Culham’s strong leadership, in spite of the challenging economic environment, the Capital Markets business reported fiscal 2020 adjusted net income(1) of $1,131 million which was 19% higher than prior year, despite higher provision for credit losses to reflect the weaker economy. The Capital Markets business reported revenue growth of 18% due to the client- focused strategy and strong intrabank connectivity, driving cross referrals. The newly created Direct Financial Services under Mr. Culham’s leadership is an exciting and differentiated opportunity for CIBC. Simplii Financial is performing well despite the rate environment, our Alternate Solutions Group has a proven ability to innovate and grow, and our direct brokerage business had a strong year and recently won the J.D. Power award for customer service. Combining these businesses with an agile approach positions us well to compete for the ‘do-it-yourself’ client and drive outsized growth in the coming years. Mr. Culham also met or exceeded most key employee engagement targets and talent management metrics for Capital Markets and he continued to advance CIBC’s purpose-driven culture.
Based on our BPF of 89% and the CEO’s assessment of his individual performance, the Board approved a fiscal 2020 GPS award for Mr. Culham of $6.53 million, which was below his target incentive opportunity. Mr. Culham elected to defer 30% of his fiscal 2020 cash incentive into DSUs which are payable when he leaves CIBC. The details are provided in the table below.

| (1) | Adjusted results are non-GAAP measures and are discussed in the Non-GAAP measures section starting on page 16 of CIBC’s 2020 Annual Report. We use these non-GAAP measures of adjusted diluted EPS and adjusted NIX ratio as elements in determining incentive compensation funding and measuring the performance of executives for executive compensation purposes as further explained in the “Assessing financial performance and determining compensation” section of this Circular on page 73. |
| C I B C P R O X Y C I R C U L A R | 79 |
Table of Contents
Compensation Discussion and Analysis
Mr. Capatides

|
As Group Head, CIBC U.S. Region, President and CEO, CIBC Bank USA, Mr. Capatides is responsible for middle market commercial banking, wealth management, private banking, and retail and digital banking in the US market.
Mr. Capatides made strong contributions to advancing CIBC’s strategy and purpose through his leadership of CIBC US Commercial Banking and Wealth Management which contributed fiscal 2020 adjusted net income(1) of $441 million, 39% lower than prior year reflecting the lower rate environment and higher provision for credit losses related to the COVID-19 pandemic; however, revenues were supported by a 10% growth in loans and a 40% growth in deposits. |
Under Mr. Capatides’ leadership, US Commercial Banking and Wealth Management increased the number of strategic relationships by 21%. He focused the team on key client segments and 35% of loan growth was achieved through new offices or new initiatives. Mr. Capatides led our bank in conducting a very successful effort in assisting our clients with the Paycheck Protection Program designed to support small businesses in the US impacted by the COVID-19 pandemic.
Mr. Capatides met or exceeded targets on most key employee engagement and talent management metrics for the functions under his leadership and he continued to advance our purpose-driven culture.
Based on our BPF of 89% and the CEO’s assessment of his individual performance, the Board approved a fiscal 2020 GPS award for Mr. Capatides of US$3.16 million, which was below his target incentive opportunity. The details are provided in the table below.
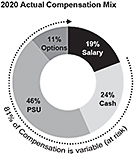
| (1) | Adjusted results are non-GAAP measures and are discussed in the Non-GAAP measures section starting on page 16 of CIBC’s 2020 Annual Report. We use these non-GAAP measures of adjusted diluted EPS and adjusted NIX ratio as elements in determining incentive compensation funding and measuring the performance of executives for executive compensation purposes as further explained in the “Assessing financial performance and determining compensation” section of this Circular on page 73. |
| 80 | C I B C P R O X Y C I R C U L A R |
Table of Contents
Compensation Discussion and Analysis
Ms. Dottori-Attanasio

|
As Group Head, Personal and Business Banking, effective March 2, 2020, Ms. Dottori-Attanasio is responsible for advice, services and products to best meet the needs of clients through their preferred channels as CIBC seeks to help make their ambitions a reality. In her previous role as CRO, Ms. Dottori-Attanasio was responsible for strategic, market, credit, operational, liquidity and reputational risk, as well as compliance and anti-money laundering.
Ms. Dottori-Attanasio made a strong contribution in fiscal 2020 to advancing CIBC’s strategy and purpose through her leadership in both of her roles.
|
Ms. Dottori-Attanasio’s focus on CIBC’s purpose significantly contributed to our COVID-19 response. The team demonstrated deep commitment to our clients, community and each other. The pandemic posed challenges for our clients and they needed us like never before and our team was there for them initiating creative approaches to help the populations that needed us the most. CIBC offered special support for seniors and persons with disabilities, reached out to clients directly to reduce the number of people having to go physically to a banking centre, implemented mortgage deferral options, credit card interest rate relief and support for small businesses.
CIBC’s Personal and Business Banking contributed fiscal 2020 adjusted net income(1) of $1,968 million, 20% lower than prior year as a result of the lower rate environment, lower transaction volumes and higher provision for credit losses to reflect the economic weakness. In spite of this, reported funds managed showed a 5% year-over-year growth and revenue was only slightly lower compared to last year. The team is also making progress in hiring diverse talent and turnover has reduced year-over-year.
Ms. Dottori-Attanasio advanced CIBC’s strategy by making significant progress in improving CIBC’s client experience results which are discussed on page 74.
In her previous role as CRO, Ms. Dottori-Attanasio supported the achievement of CIBC’s strategic objectives while ensuring CIBC managed risk effectively and complied with its risk appetite targets. Ms. Dottori-Attanasio led the Risk Management function in alignment with CIBC’s purpose and met many of the key talent management targets for businesses under her leadership.
Based on our BPF of 89% and the CEO’s assessment of her individual performance, the Board approved a fiscal 2020 GPS award for Ms. Dottori-Attanasio of $2.59 million which was below her target incentive opportunity. The details are provided in the table below.
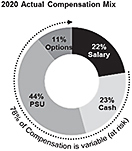
| (1) | Adjusted results are non-GAAP measures and are discussed in the Non-GAAP measures section starting on page 16 of CIBC’s 2020 Annual Report. We use these non-GAAP measures of adjusted diluted EPS and adjusted NIX ratio as elements in determining incentive compensation funding and measuring the performance of executives for executive compensation purposes as further explained in the “Assessing financial performance and determining compensation” section of this Circular on page 73. |
| C I B C P R O X Y C I R C U L A R | 81 |
Table of Contents
Compensation Discussion and Analysis
Backtesting of NEO total compensation versus TSR
The chart below compares CIBC’s cumulative TSR over the five-year period from November 1, 2015 through October 31, 2020, with the cumulative TSR of the S&P/TSX Composite and S&P/TSX Composite Banks indices over the same period. The change in annual NEO total compensation over this same period demonstrates the alignment of CIBC NEO pay with CIBC performance.
Five-year total return on $100 investment versus
CIBC NEO Total Compensation
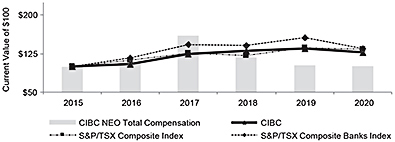
| Cumulative Return(1) (%) | 2015 | 2016 | 2017 | 2018 | 2019 | 2020 | ||||||||||||||||||
| CIBC |
100.00 | 105.19 | 124.45 | 130.30 | 135.76 | 127.74 | ||||||||||||||||||
| S&P/TSX Composite Index |
100.00 | 112.70 | 125.63 | 121.35 | 137.38 | 134.22 | ||||||||||||||||||
| S&P/TSX Composite Banks Index |
100.00 | 116.68 | 143.55 | 141.99 | 156.55 | 135.31 | ||||||||||||||||||
|
CIBC NEO Total Compensation(2) |
100.00 | 108.57 | 159.66 | 118.34 | 102.95 | 101.98 | ||||||||||||||||||
| (1) | With dividends reinvested. |
| (2) | The 2015 CIBC NEO total compensation is expressed as $100 compared to total compensation for subsequent years. CIBC NEO total compensation includes salary, cash incentive, grant date value of equity incentive awards, the compensatory portion of the change in the accrued pension obligation in the year, and all other compensation as reported in the “Summary compensation table” on page 85 of this Circular. In 2016, CIBC determined that using the amounts for NEOs’ total compensation (instead of the amounts for TDC used in prior years), was more appropriate for the purposes of the foregoing disclosure and accordingly the amounts shown in the chart above for years prior to fiscal 2016 have been adjusted from those which appeared in prior proxy circulars. The 2017 CIBC NEO Total Compensation includes for Mr. Richman a deferred incentive award of US$8.20 (C$10.72) million, received upon the closing of CIBC’s acquisition of PrivateBancorp, Inc. The 2019 CIBC NEO Total Compensation shown includes only the five highest paid NEOs (six NEOs were disclosed in the 2019 proxy circular). |
Cost of management ratio (COMR)(1)
The table below summarizes CIBC NEO total compensation as a percentage of reported net income over the past three fiscal years. While the composition of NEOs may change from year to year, the fixed definition of executives included in this group allows for the comparability of compensation amounts between years.
| Year | NEO Total Compensation(2)(4) ($000s) |
Reported Net Income(3) ($000s) |
NEO Total Compensation as a % of Reported Net Income(3) | |||
|
2020 |
29,538 | 3,792,000 | 0.78 | |||
|
2019 |
29,817 | 5,121,000 | 0.58 | |||
|
2018 |
34,275 | 5,284,000 | 0.65 |
| (1) | COMR is not a defined term under Canadian securities legislation and is not a GAAP measure. As a result, CIBC’s COMR may not be comparable to that of other companies. |
| (2) | CIBC NEO total compensation includes salary, cash incentive, grant date value of equity incentive awards, the compensatory portion of the change in the accrued pension obligation in the year, and all other compensation as reported in the “Summary compensation table” on page 85 of this Circular. |
| (3) | COMR based on NEO total compensation as a percentage of adjusted net income was 0.66% for fiscal 2020, 0.55% for fiscal 2019 and 0.62% for fiscal 2018. For a further discussion of adjusted net income, see “Assessing financial performance and determining compensation” on page 73 and the Non-GAAP measures section starting on page 16 of CIBC’s 2020 Annual Report. |
| (4) | For fiscal 2019, the NEO Total Compensation includes only the five highest paid NEOs (six NEOs were disclosed in the 2019 proxy circular). |
| 82 | C I B C P R O X Y C I R C U L A R |
Table of Contents
Compensation Discussion and Analysis
Talent Management and Succession Planning
Sustaining success over the long term will depend on our ability to build a strong, future-ready workforce; this entails being able to identify, develop and retain a pipeline of high-potential leaders. Our future-focused talent strategy concentrates on building the leadership capabilities required for future success, growing the strengths of our CIBC Team and collectively unlocking potential to ensure we are future-proofing our bank and strengthening our diverse talent pipelines to drive value for our bank today and tomorrow.
The Committee and Board review regular updates on the progress of our talent strategy, the strength and diversity of our pipeline of future leaders and the alignment of CIBC’s talent and business strategies. The Committee holds the CEO and EXCO members accountable for the progress of our talent strategy by setting specific goals on talent management, employee engagement and the strength of our leadership pipeline. Achievement against these goals is included in determining the performance and compensation for the CEO and EXCO members at the end of the year.
Throughout the year, the Committee conducts in-depth executive reviews focused on the strength and diversity of succession pools for key leadership roles across CIBC. At least once a year, the Committee and the Board review succession plans for the CEO and EXCO members across various time frames to ensure that management and the Board have choices when appointing talent in key roles. The Committee and management also discuss talent deeper in the pipeline, with potential over a longer horizon to develop into senior leaders in the organization.
In addition, the Committee reviews the progress of leadership development initiatives and receives reports on employee engagement, turnover, inclusion and diversity, external recognition of our workplace and other critical employee matters. CIBC continues to receive positive recognition as an employer, and in particular, for our work in the area of inclusion and diversity. We are confident that CIBC’s talent strategy is designed to attract and retain talented and engaged employees and leaders who are positioned to transform our bank and deliver on our purpose.
| C I B C P R O X Y C I R C U L A R | 83 |
Table of Contents
Compensation Discussion and Analysis
CIBC’s approach to inclusion and diversity emphasizes the importance of recruiting, retaining and advancing talent that reflects the communities we serve, growing the inclusive leadership capabilities of our people and making inclusion the way our bank does business. Each pillar of our strategy is tied to a strategic business outcome: fostering innovation, improving team performance and building stronger relationships with our clients.
Starting with our Board and our senior leadership team, CIBC’s commitment to inclusion and diversity is embedded into our bank’s talent and business strategies. Our senior leadership team and Board regularly assess progress against our inclusion and diversity goals and key performance indicators are considered during senior leaders’ annual performance assessments.
It remains a top organizational priority to close gaps where our workforce does not reflect the diversity of the clients and communities we serve. In 2020 we took concrete steps to accelerate progress and have set a new goal to have at least 4% of board-approved executive roles based in Canada held by leaders from the Black community by 2023. This forms part of the bank’s existing target to have at least 22% representation of visible minorities in board-approved executive roles by 2022. And, while we work towards achieving gender parity, we expect to have, at a minimum, 35% women in board-approved executive roles by the end of fiscal 2022. At the end of the 2020 fiscal year, 33% of these roles were held by women and 40% (4/10) of EXCO members (which typically includes the CEO) were women.
We have also made significant investments to increase the inclusive leadership capabilities of our team, including delivering Disrupting Unconscious Bias training to over 2,000 people managers and holding Blanket Exercises, interactive learning that supports reconciliation with Indigenous peoples, with over 200 senior leaders. In 2020, we launched new training for client-facing team members to help them disrupt unconscious bias, listen actively and demonstrate care for the unique needs of our clients.
CIBC is committed to helping all clients make their ambitions a reality. We work hard to strengthen financial literacy in Indigenous communities and help our clients through economic hardship caused by the COVID-19 pandemic. We also commit over $1 million each year to make banking more accessible to clients with a wide range of abilities, including seniors and persons with disabilities and, in 2020, partnered with the Government of Canada to create new opportunities for Black-led businesses through the Black Entrepreneurship Loan Fund.
| 84 | C I B C P R O X Y C I R C U L A R |
Table of Contents
Summary compensation table
The table below shows the compensation earned in fiscal 2020, 2019, and 2018 by CIBC’s five NEOs.
| Name and Principal Position |
Year |
Salary ($) |
Share-based Awards(1) ($) |
Option-based Awards(2) ($) |
Non-equity Variable Incentive Awards(3) ($) |
Pension Value(4) ($) |
All Other Compensation(5) ($) |
Total Compensation ($) | ||||||||||||||||||||||||
| Victor Dodig |
2020 | 1,000,000 | 5,126,400 | 1,281,600 | 1,602,000 | 666,000 | 2,250 | 9,678,250 | ||||||||||||||||||||||||
| CEO |
2019 | 1,000,000 | 4,806,240 | 1,201,560 | 1,501,950 | 505,000 | 2,250 | 9,017,000 | ||||||||||||||||||||||||
| 2018 | 1,000,000 | 5,115,661 | 1,278,915 | 2,131,524 | 520,000 | 2,250 | 10,048,350 | |||||||||||||||||||||||||
| Hratch Panossian |
2020 | 500,000 | 1,059,420 | 239,855 | 513,975 | 205,000 | 2,250 | 2,520,500 | ||||||||||||||||||||||||
| CFO & Enterprise |
2019 | 350,000 | 474,012 | 118,503 | 395,010 | 39,000 | 2,250 | 1,378,775 | ||||||||||||||||||||||||
|
Strategy |
2018 | 320,959 | 480,432 | 120,108 | 400,360 | 38,000 | 2,250 | 1,362,109 | ||||||||||||||||||||||||
| Harry Culham |
2020 | 500,000 | 3,654,518 | 913,630 | 1,957,777 | 214,000 | 2,250 | 7,242,175 | ||||||||||||||||||||||||
| Group Head, Capital |
2019 | 500,000 | 3,734,640 | 933,660 | 2,000,700 | 150,000 | 2,250 | 7,321,250 | ||||||||||||||||||||||||
| Markets and Direct |
||||||||||||||||||||||||||||||||
|
Financial Services |
2018 | 500,000 | 4,245,696 | 1,061,424 | 2,274,480 | 154,000 | 2,250 | 8,237,850 | ||||||||||||||||||||||||
| Michael Capatides(6) |
2020 | 1,008,225 | 2,380,753 | 595,188 | 1,275,404 | 400,536 | 868,182 | 6,528,288 | ||||||||||||||||||||||||
| Group Head, CIBC U.S. |
2019 | 996,975 | 2,147,664 | 536,916 | 1,150,534 | 325,789 | 982,712 | 6,140,590 | ||||||||||||||||||||||||
| Region, President and |
2018 | 966,000 | 2,005,989 | 501,497 | 1,074,635 | 351,071 | 842,430 | 5,741,622 | ||||||||||||||||||||||||
|
CEO, CIBC Bank USA |
||||||||||||||||||||||||||||||||
| Laura Dottori- |
2020 | 750,000 | 1,448,849 | 362,212 | 776,169 | 229,000 | 2,250 | 3,568,480 | ||||||||||||||||||||||||
|
Attanasio |
2019 | 750,000 | 1,424,430 | 356,108 | 763,087 | 163,000 | 2,250 | 3,458,875 | ||||||||||||||||||||||||
| Group Head, |
||||||||||||||||||||||||||||||||
| Personal & Business |
2018 | 750,000 | 1,603,925 | 400,981 | 859,244 | 170,000 | 2,250 | 3,786,400 | ||||||||||||||||||||||||
|
Banking, Canada |
||||||||||||||||||||||||||||||||
| (1) | Amounts shown represent the grant date value of PSUs awarded under the PSU Plan for the specified fiscal years. The value of one PSU at grant is the average closing price of one CIBC common share on the TSX for the 10 trading days before December 1st for the specified fiscal years. Mr. Panossian’s share-based award value includes a one-time C$100,000 DSU award granted in 2020. The value of one DSU at grant is the average closing price of one CIBC common share on the TSX for the 10 trading days before December 3rd. |
| (2) | Amounts shown are grant date fair values (compensation values) determined using a Black-Scholes model. For the specified fiscal years, the key model assumptions, accounting fair value (AFV) and variance between the compensation values and AFV are summarized in the tables below. |
| Measure |
Grants made in December 2020 for fiscal 2020 |
Grants made in December 2019 for fiscal 2019 |
Grants made in December 2018 for fiscal 2018 | |||||||||
| Methodology |
5-year Black-Scholes average | 5-year Black-Scholes average | 5-year Black-Scholes average | |||||||||
| Risk-free rate (%) |
0.80 | 1.58 | 2.27 | |||||||||
| Dividend yield (%) |
5.27 | 5.24 | 4.88 | |||||||||
|
Share price volatility (%) |
17.3 | 15.1 | 19.4 | |||||||||
| Term (years) |
10 | 10 | 10 | |||||||||
|
Compensation value ($) |
11.10 | 12.73 | 13.09 | |||||||||
| Name | 2020 | 2019 | 2018 | |||||||||
| AFV ($6.73 per option) |
Variance ($) |
AFV ($2.20 per option) |
Variance ($) |
AFV ($6.54 per option) |
Variance ($) | |||||||
| Victor Dodig |
776,965 | 504,635 | 207,590 | 993,970 | 638,965 | 639,950 | ||||||
| Hratch Panossian |
145,415 | 94,440 | 20,499 | 98,004 | 59,974 | 60,134 | ||||||
| Harry Culham |
553,886 | 359,744 | 161,306 | 772,354 | 530,309 | 531,115 | ||||||
| Michael Capatides |
349,953 | 245,235 | 92,649 | 444,267 | 257,761 | 243,736 | ||||||
|
Laura Dottori-Attanasio |
219,593 | 142,619 | 61,525 | 294,582 | 200,340 | 200,641 | ||||||
| (3) | Non-equity Variable Incentive Awards consist entirely of the annual performance-based cash incentive. Executives may elect voluntarily to defer all or part of their annual incentive into DSUs. For 2020, 2019, and 2018, Mr. Culham elected to defer 30% of his cash incentive of $1,957,777, 50% of his cash incentive of $2,000,700 and 50% of his cash incentive of $2,274,480, respectively, into DSUs. Values will be converted to units based on the average share price in the 10 trading days preceding December 1, 2020. |
| (4) | Amounts shown represent the “compensatory value” of changes in the pension obligation during the specified fiscal years. For Mr. Capatides, the amounts shown also include CIBC’s contributions to his US 401(k) savings plan of $12,536 in fiscal 2020, $14,789 in fiscal 2019 and $14,071 in fiscal 2018 converted to Canadian dollars at the average WM/Reuters exchange rate of US$1.00 = C$1.3443 for 2020, US$1.00 = C$1.3293 for 2019 and US$1.00 = C$1.2880 for 2018. In prior years, CIBC’s contributions to Mr. Capatides’ US 401(k) savings plan were included in the “All Other Compensation” column. |
| C I B C P R O X Y C I R C U L A R | 85 |
Table of Contents
Compensation Disclosure
| (5) | Amounts shown for Mr. Dodig, Mr. Panossian, Mr. Culham and Ms. Dottori-Attanasio represent CIBC’s contributions to their Employee Share Purchase Plan (ESPP) accounts. |
For all NEOs, the amounts shown exclude the value of perquisites as they are less than $50,000 for each NEO. For the CEO, the amounts also exclude the value of any personal use of the CIBC plane by the CEO because he reimburses CIBC for this cost. The amounts shown also exclude dividend equivalent amounts earned on any PSU, Restricted Share Award (RSA) and/or DSU awards granted in prior years as the expected dividend equivalents were factored into the disclosed grant date fair value of the awards, as applicable. The reinvested dividend equivalent amounts for fiscal 2020, 2019 and 2018 are $936,933, $887,000 and $791,681, respectively, for Mr. Dodig; $70,953, $65,240 and $48,987 for Mr. Panossian; $974,696, $912,932 and $793,701 for Mr. Culham; $331,197, $338,471 and $311,583 in Canadian dollars for Mr. Capatides; and $316,545, $313,937 and $293,319 for Ms. Dottori-Attanasio.
Amounts shown for Mr. Capatides represent tax equalization payments made on his behalf for Canadian income taxes paid in excess of US income taxes.
| (6) | Compensation for Mr. Capatides is determined and paid in US dollars. All compensation figures, except for the Pension Value, have been converted to Canadian dollars at the average WM/Reuters exchange rate of US$1.00 = C$1.3443 for 2020, US$1.00 = C$1.3293 for 2019 and US$1.00 = C$1.2880 for 2018. Mr. Capatides’ Pension Value has been converted to Canadian dollars using the WM/Reuters spot exchange rate on October 31 of US$1.00 = C$1.3321 for 2020, US$1.00 = C$1.3169 for 2019 and US$1.00 = C$1.3163 for 2018. |
Incentive plan awards – value vested or earned during the financial year
The table below includes information on the value of incentive plan awards vested or earned by each NEO during fiscal 2020.
| Name |
Value of Option-based Awards That Vested During the Year(1) ($) |
Value of Share-based Awards That Vested and Paid Out During the Year(2) ($) |
Value of Non-equity Variable Incentive Awards Earned During the Year(3) ($) |
|||||||||
|
Victor Dodig |
509,800 | 5,523,541 | 1,602,000 | |||||||||
|
Hratch Panossian |
27,147 | 487,257 | 513,975 | |||||||||
|
Harry Culham |
488,430 | 5,272,507 | 1,957,777 | |||||||||
|
Michael Capatides |
228,055 | 2,928,410 | 1,275,404 | |||||||||
|
Laura Dottori-Attanasio |
188,956 | 1,969,934 | 776,169 | |||||||||
| (1) | Values shown are the difference between the exercise price of the awards and the closing price of CIBC common shares on the TSX on the vesting date. As the NEO may not have exercised the options on the vesting date or subsequently, the amount shown may not reflect an actual amount realized by the NEO. |
| (2) | Values shown relate to the vesting and payment of PSUs in fiscal 2020. With respect to PSUs, the performance factor applied to the PSUs granted in December 2016 for fiscal 2016 to determine the final amount paid out to participants in December 2019 was 100%, based on CIBC’s ROE performance from November 1, 2016 to October 31, 2019. |
| (3) | Values shown are the sum of annual performance-based cash incentives for fiscal 2020 disclosed in the Summary compensation table. Mr. Capatides’ annual cash bonus award was paid in US dollars and has been converted to Canadian dollars at an average WM/Reuters exchange rate for fiscal 2020 of US$1.00 = C$1.3443. |
2017 PSU vesting
The vesting percentage for PSUs granted in 2017 that vested in December 2020 was 100% based on the average of the ROE performance factor of 95% and the TSR performance factor of 105%, resulting from a number four ranking in ROE and number three ranking in TSR over the three-year performance period. The vesting percentage calculation details for the specified fiscal year are shown in the table below. See “Deferred incentive award” starting on page 69 for the scale.
| CIBC PSU Vesting Calculation for 2017 PSU Grants | ||||||||||||||||||||||||
| 2018 | 2019 | 2020 | Average | CIBC Rank | Performance | Vesting | ||||||||||||||||||
| ROE | 16.6% | 14.5% | 10.0 % | 13.7% | 4 | 95% | 100% | |||||||||||||||||
| TSR | 4.7% | 4.2% | (5.9)% | 1.0% | 3 | 105% | ||||||||||||||||||
| 86 | C I B C P R O X Y C I R C U L A R |
Table of Contents
Compensation Disclosure
Incentive plan awards – outstanding option– and share-based awards
The table below shows the specified information for option-based and share-based awards previously awarded to the NEOs that remain outstanding as at October 31, 2020.
| Option-based Awards(1) |
Share-based Awards(2) |
|||||||||||||||||||||||||||||||||||||
| Name | Compensation Year |
Securities Underlying Unexercised Options (#) |
Option Exercise Price(3) ($) |
Option Expiration Date |
Value of Unexercised in-the- money Options ($) |
Value of Options Exercised(4)(5) ($) |
Plan | Units or Shares Not Vested (#) |
Market or Payout Value of Share- based Awards Not Vested(6) |
Market or Payout Value of Vested Share-based Awards Not Paid Out or Distributed ($) |
||||||||||||||||||||||||||||
| Victor Dodig |
2013 | — | 90.52 | 08-Dec-2023 | — | 124,196 | ||||||||||||||||||||||||||||||||
| 2014 | 35,204 | 102.33 | 07-Dec-2024 | — | — | |||||||||||||||||||||||||||||||||
| 2015 | 51,544 | 97.81 | 06-Dec-2025 | 80,924 | 402,705 | |||||||||||||||||||||||||||||||||
| 2016 | 86,375 | 111.69 | 08-Dec-2026 | — | — | DSU | — | — | 2,711,842 | |||||||||||||||||||||||||||||
| 2017 | 78,271 | 120.02 | 13-Dec-2027 | — | — | PSU | 45,198 | 3,368,866 | — | |||||||||||||||||||||||||||||
| 2018 | 97,701 | 111.50 | 02-Dec-2028 | — | — | PSU | 50,446 | 3,759,988 | — | |||||||||||||||||||||||||||||
| 2019 | 94,359 | 109.87 | 08-Dec-2029 | — | — | PSU | 44,322 | 3,303,545 | — | |||||||||||||||||||||||||||||
| Hratch Panossian |
2014 | 2,765 | 102.33 | 07-Dec-2024 | — | — | ||||||||||||||||||||||||||||||||
| 2015 | 4,503 | 97.81 | 06-Dec-2025 | 7,070 | — | |||||||||||||||||||||||||||||||||
| 2016 | 6,136 | 111.69 | 08-Dec-2026 | — | — | |||||||||||||||||||||||||||||||||
| 2017 | 6,161 | 120.02 | 13-Dec-2027 | — | — | PSU | 3,557 | 265,139 | — | |||||||||||||||||||||||||||||
| 2018 | 9,176 | 111.50 | 02-Dec-2028 | — | — | PSU | 4,738 | 353,115 | — | |||||||||||||||||||||||||||||
| 2019 | 9,307 | 109.87 | 08-Dec-2029 | — | — | PSU | 4,371 | 325,810 | — | |||||||||||||||||||||||||||||
| Harry Culham |
2014 | 61,459 | 102.33 | 07-Dec-2024 | — | — | ||||||||||||||||||||||||||||||||
| 2015 | 81,000 | 97.81 | 06-Dec-2025 | 127,170 | — | DSU | — | — | 1,536,960 | |||||||||||||||||||||||||||||
| 2016 | 82,449 | 111.69 | 08-Dec-2026 | — | — | DSU | — | — | 776,578 | |||||||||||||||||||||||||||||
| 2017 | 73,715 | 120.02 | 13-Dec-2027 | — | — | DSU | — | — | 1,133,118 | |||||||||||||||||||||||||||||
| PSU | 42,567 | 3,172,732 | — | |||||||||||||||||||||||||||||||||||
| 2018 | 81,087 | 111.50 | 02-Dec-2028 | — | — | DSU | — | — | 1,114,488 | |||||||||||||||||||||||||||||
| PSU | 41,867 | 3,120,568 | — | |||||||||||||||||||||||||||||||||||
| 2019 | 73,321 | 109.87 | 08-Dec-2029 | — | — | DSU | — | — | 916,781 | |||||||||||||||||||||||||||||
| PSU | 34,440 | 2,566,986 | — | |||||||||||||||||||||||||||||||||||
| Michael Capatides |
2014 | 23,283 | 102.33 | 07-Dec-2024 | — | — | ||||||||||||||||||||||||||||||||
| 2015 | 37,820 | 97.81 | 06-Dec-2025 | 59,377 | — | |||||||||||||||||||||||||||||||||
| 2016 | 37,797 | 111.69 | 08-Dec-2026 | — | — | |||||||||||||||||||||||||||||||||
| 2017 | 32,889 | 120.02 | 13-Dec-2027 | — | — | PSU | 18,992 | 1,415,554 | — | |||||||||||||||||||||||||||||
| 2018 | 39,413 | 111.50 | 02-Dec-2028 | — | — | PSU | 20,350 | 1,516,782 | — | |||||||||||||||||||||||||||||
| 2019 | 42,113 | 109.87 | 08-Dec-2029 | — | — | PSU | 19,781 | 1,474,375 | — | |||||||||||||||||||||||||||||
| Laura Dottori-Attanasio |
2015 | 15,668 | 97.81 | 06-Dec-2025 | 24,599 | — | DSU | — | — | 297,295 | ||||||||||||||||||||||||||||
| 2016 | 30,805 | 111.69 | 08-Dec-2026 | — | — | |||||||||||||||||||||||||||||||||
| 2017 | 27,699 | 120.02 | 13-Dec-2027 | — | — | DSU | — | — | 851,553 | |||||||||||||||||||||||||||||
| PSU | 15,995 | 1,192,175 | — | |||||||||||||||||||||||||||||||||||
| 2018 | 30,633 | 111.50 | 02-Dec-2028 | — | — | PSU | 15,816 | 1,178,878 | — | |||||||||||||||||||||||||||||
| 2019 | 27,966 | 109.87 | 08-Dec-2029 | — | — | PSU | 13,136 | 979,075 | — | |||||||||||||||||||||||||||||
| (1) | Options are in respect of CIBC common shares. Options generally vest 50% on the third anniversary and 50% on the fourth anniversary of the grant date. |
| (2) | PSUs vest and are cash-settled at the end of three years and the number of units that vest is determined by CIBC’s ROE and TSR performance relative to CIBC’s compensation peer group. |
The DSUs shown reflect annual performance-based incentive awards which have been deferred into DSUs by Mr. Dodig, Mr. Culham and Ms. Dottori-Attanasio. Such DSUs are fully vested but not payable until termination of employment, retirement or death.
For Mr. Panossian and Mr. Capatides, their RSAs vest and are cash-settled at the end of three years. The RSAs are a deferred incentive vehicle linked to CIBC share value as the vesting price is determined based on the average share price in the 10 trading days preceding the vest date.
| (3) | The option exercise price is equivalent to the closing market value of CIBC common shares on the trading day immediately preceding the date of grant. |
| (4) | The value of options exercised during fiscal 2020 that were granted in previous years. Amounts are the proceeds received (the difference between the exercise price of the options and the market price of the CIBC common shares on the exercise date) before deductions for taxes and commissions. |
| (5) | Amounts shown for Mr. Dodig relate to sale in December 2019 of 6,414 shares upon an exercise of his 2013 Employee Stock Option Plan (ESOP) grant and 33,000 shares upon an exercise of his 2015 ESOP grant. All proceeds were donated to charity. |
| (6) | Amounts shown are the threshold payout values of 75% of the applicable units. |
| C I B C P R O X Y C I R C U L A R | 87 |
Table of Contents
Compensation Disclosure
Equity ownership of NEOs at October 31, 2020
All CIBC executives (including the NEOs) and Managing Directors are expected to hold a minimum amount of equity in CIBC. Equity ownership includes all shares held in the ESPP or personal investment accounts outside of CIBC, DSUs and PSUs. It does not include the value of any in-the-money option grants. Newly appointed executives and external hires have five years from their appointment date to meet the minimum guideline, while executives promoted to a more senior level have three years to meet the applicable guidelines. Share ownership guidelines extend into retirement for all NEOs and are noted in the table below.
The table below shows NEO equity ownership relative to the minimum guideline for their position.
| Minimum Equity Ownership Guideline (Multiple of Salary) |
Hold Period Following Retirement Date (years) |
Ownership(2) (Multiple of Salary) |
Equity Ownership(1) | |||||||||||||||||||||||||
| Total(3) | ||||||||||||||||||||||||||||
| Direct Share | ||||||||||||||||||||||||||||
| DSUs | PSUs(2) | Holdings | Units | |||||||||||||||||||||||||
| Name | ($) | ($) | ($) | ($) | (#) | |||||||||||||||||||||||
| Victor Dodig |
8.0 | 2 | 23.4 | 2,711,842 | 13,909,866 | 6,789,303 | 23,411,011 | 235,571 | ||||||||||||||||||||
| Hratch Panossian(4) |
5.0 | 1 | 3.3 | - | 1,258,752 | 376,501 | 1,635,253 | 16,455 | ||||||||||||||||||||
| Harry Culham |
5.0 | 1 | 36.7 | 5,477,925 | 11,813,714 | 1,069,295 | 18,360,934 | 184,755 | ||||||||||||||||||||
| Michael Capatides(5) |
5.0 | 1 | 7.2 | - | 5,875,614 | 1,385,854 | 7,261,468 | 73,068 | ||||||||||||||||||||
|
Laura Dottori-Attanasio |
5.0 | 1 | 8.1 | 1,148,849 | 4,466,836 | 467,295 | 6,082,980 | 61,209 | ||||||||||||||||||||
| (1) | Amounts shown have been calculated using CIBC’s share price of $99.38 as at October 30, 2020 (the last trading day in the 2020 fiscal year). |
| (2) | For purposes of determining Equity Ownership, PSUs are valued based on a performance factor of 100%. |
| (3) | Amounts shown represent the aggregate number of CIBC common shares, DSUs, PSUs held. |
| (4) | As a newly promoted Senior Executive Vice-President effective November 1, 2019, Mr. Panossian is on track to meet his share ownership guidelines by the end of fiscal 2022. |
| (5) | For Mr. Capatides, his base salary has been converted from US dollars to Canadian dollars at an average WM/Reuters exchange rate for fiscal 2020 of US $1.00 = C$ 1.3443. |
Securities authorized for issuance under equity compensation plans
The table below provides information at October 31, 2020 on common shares authorized for issuance under the ESOP and the PrivateBancorp Option Plans, which are the only CIBC equity compensation plans that provide for the issuance of shares from treasury.
| A | B | C | ||||||||||
| Equity Compensation Plans | Securities to be Issued upon Exercise of Outstanding Options (#) |
Weighted-average Exercise Price of Outstanding Options ($) |
Securities Remaining Available for Future Issuance under Equity Compensation Plans (excluding securities in column A) (#) |
|||||||||
| Approved by security holders |
5,293,605 | 105.39 | 9,171,903 | |||||||||
| Not approved by security holders(1) |
386,506 | 42.49 | Nil | |||||||||
| Total |
5,680,111 | 100.39 | 9,171,903 | |||||||||
| (1) | CIBC’s assumption of PrivateBancorp’s equity compensation plans in connection with its acquisition of PrivateBancorp, Inc. in June 2017 did not require approval by security holders under applicable securities legislation and stock exchange rules. |
| 88 | C I B C P R O X Y C I R C U L A R |
Table of Contents
Compensation Disclosure
Options outstanding and available for grant at December 31, 2020
The table below provides additional disclosure on options outstanding and available for grant under the ESOP and the options outstanding under the PrivateBancorp Plans.
| A | B | C = A+B | ||||||||||||||||||||||
|
Options Outstanding |
Options Available for Grant | Total | ||||||||||||||||||||||
| Plan | (#) |
% of Common Shares Outstanding |
(#) |
% of Common Shares Outstanding |
(#) |
% of Common Shares Outstanding | ||||||||||||||||||
|
ESOP(1) |
6,140,432 | 1.37 | 8,129,588 | 1.82 | 14,270,020 | 3.19 | ||||||||||||||||||
| PrivateBancorp Plans(2) |
353,447 | 0.08 | Nil | Nil | 353,447 | 0.08 | ||||||||||||||||||
| Total |
6,493,879 | 1.45 | 8,129,588 | 1.82 | 14,623,467 | 3.27 | ||||||||||||||||||
| (1) | At October 31, 2020, the total number of common shares issuable under options outstanding was 5,293,605, the total number of common shares issuable under options available for grant was 9,171,903 and the total number of common shares outstanding was 447,085,329. |
| (2) | Upon the acquisition of PrivateBancorp, Inc. in June 2017, 1,119,211 CIBC common shares were reserved for issuance to settle outstanding PrivateBancorp option awards. These option awards were granted under the 2007 Long-Term Incentive Compensation Plan (2007 Plan), 2007 Strategic Long-Term Incentive Compensation Plan (Strategic Plan) and the 2011 Amended and Restated Incentive Compensation Plan (2011 Plan) (collectively, the PrivateBancorp Plans) and were converted into options to acquire CIBC shares based on the relative values of the PrivateBancorp, Inc. shares to the CIBC common shares pursuant to the acquisition. |
CIBC’s limited use of options is reflected in the ratios shown in the table below, which are well within best practice guidelines.
|
Measure(1) |
Year |
ESOP |
PrivateBancorp Plans | ||||||||||||
| Dilution |
|||||||||||||||
| • number of options granted but not exercised/total number of common shares outstanding at the end of the fiscal year |
2020 | 1.18% | 0.09% | ||||||||||||
| 2019 | 1.06% | 0.10% | |||||||||||||
| 2018 | 0.92% | 0.15% | |||||||||||||
| Overhang |
|||||||||||||||
| • (number of options available to be granted + options granted but not exercised)/total number of common shares outstanding at the end of the fiscal year |
2020 | 3.24% | 0.12% | ||||||||||||
| 2019 | 3.30% | 0.14% | |||||||||||||
| 2018 | 3.37% | 0.15% | |||||||||||||
| Burn Rate(2) |
|||||||||||||||
|
• total number of options granted in a fiscal year/weighted average number of common shares outstanding at the end of the fiscal year |
2020 | 0.18% | — | ||||||||||||
| 2019 | 0.20% | — | |||||||||||||
| 2018 | 0.14% | — | |||||||||||||
| (1) | All figures are calculated as a percentage of common shares outstanding on October 31 of the specified fiscal years. |
| (2) | The burn rate is expressed as a percentage calculated by dividing the number of options granted during the fiscal year (e.g., ESOP 818,290 for fiscal 2020) by the weighted average number of common shares outstanding at the end of the fiscal year (e.g., 445,434,923 for fiscal 2020). |
Restrictions on trading and hedging CIBC Securities
To maintain the intended alignment between individual and shareholder interests, CIBC prohibits directors, officers and employees from using hedging strategies to offset a decrease in market value of CIBC securities. The policy specifically prohibits directly or indirectly:
| • | buying or selling call options, put options or forward derivative contracts with respect to CIBC shares; |
| • | buying or selling any other over-the-counter derivative product used to hedge exposure to CIBC shares; and |
| • | selling CIBC shares if they do not own or have not fully paid for them (i.e., a short sale). |
| C I B C P R O X Y C I R C U L A R | 89 |
Table of Contents
Compensation Disclosure
Deferred incentive compensation plans – key terms and conditions
The following tables summarize key terms and conditions of CIBC’s ESOP, PSU Plan and DSU Plan. The Committee and Board must approve changes to key terms and conditions and any other material amendments to these plans. Certain amendments to the ESOP are subject to shareholder approval. Annually, the Committee reviews an assessment by CIBC’s control functions of plan compliance with regulatory requirements and CIBC’s risk management, governance, control and policy requirements. When plan design changes and awards are recommended, the Committee reviews scenario analysis and backtesting to ensure the plan design objectives are achieved.
ESOP
|
Eligibility |
• Any full-time employee of CIBC (or any of its subsidiaries) as may be designated by the Committee. | |
| Term |
• 10 years from the date of grant (subject to a shorter term for changes in employment status or extension due to the application of trading restrictions as described below). | |
|
Vesting |
• Outstanding grants vest 50% on each of the third and fourth anniversaries of the grant date. | |
| Exercise Price |
• Set by the Committee, but must not be less than the closing market price of CIBC common shares on the TSX on the trading day immediately preceding the date of grant. • CIBC has established an option grant date policy that sets out a process for determining the date of grant for options, which is to be applied consistently to all options granted pursuant to the ESOP, and facilitates CIBC’s compliance with the requirements of the ESOP and the TSX for the grant of options. • Where the Committee authorizes a grant of options at a time when CIBC’s internal trading restrictions are in effect or where the price of CIBC common shares otherwise does not reflect all material information known to management, the effective date of the grant is the date on which the trading restrictions have been removed or the third trading day after all material information regarding CIBC has been disclosed, respectively, unless a later date is specified by the Committee. | |
| Securities Reserved for Issue |
• The number of common shares which may be issued from treasury cannot exceed 52,634,500. | |
| Individual and Insider Limits |
• Pursuant to the ESOP, the maximum number of common shares that may be issued to any one person upon the exercise of options may not exceed 5% of the number of common shares then outstanding; however, this number has been fixed at 1% of the number of CIBC common shares then issued and outstanding by resolution of the Committee.
• No options shall be granted to any participant if such grant could result in the number of CIBC common shares: (a) issued to insiders in any one year, or (b) issuable to insiders, at any time, in each case, pursuant to the exercise of options issued under the ESOP, or when combined with all other securities-based compensation arrangements, exceeding 10% of the issued and outstanding CIBC common shares. | |
|
Termination |
• Resignation or termination of employment with cause: options are forfeited after 30 days.
• Termination of employment without cause: unvested options continue to vest, and vested options remain outstanding and exercisable, for the length of the employee severance period.
• Retirement: options continue to vest and can be exercised subject to the original vesting and expiry dates, provided the participant is 55 years of age or older on retirement. | |
| Blackout Period Extension |
• The term of options that are scheduled to expire during, or shortly after, a period in which the option holder is prohibited from exercising the option due to trading restrictions is automatically extended so that they expire 10 business days after any applicable trading restrictions end. | |
| Stock Appreciation Rights (SARs) |
• CIBC may attach a term to options that up to 50% of the options granted can be exercised as SARs (there are currently no outstanding options with SARs attached to them). | |
|
Assignability |
• ESOP award recipients are generally not permitted to assign or transfer their options. An option recipient may assign their rights to, or to the benefit of, a spouse, minor child or minor grandchild, or a trust of which any combination of the option recipient and any of the foregoing are beneficiaries, with CIBC’s prior approval. | |
| 90 | C I B C P R O X Y C I R C U L A R |
Table of Contents
Compensation Disclosure
|
Amendments |
• Shareholder approval is required for the following amendments (unless the change results from application of the anti-dilution provisions of the ESOP): – increasing the number of common shares that can be issued under the ESOP; – reducing the strike (exercise) price of an outstanding option; – extending the expiry date of an outstanding option or amending the ESOP to permit the grant of an option with an expiry date of more than 10 years from the grant date; – changing the provisions relating to the transferability of options, other than for estate settlement purposes; – expanding the categories of individuals eligible to participate in the ESOP; – amending the ESOP to provide for other types of compensation through equity issuance; – removing or exceeding the insider participation limit contained in the ESOP; – amending the ESOP’s amending provisions; or – making any amendment to the ESOP for which shareholder approval is required under applicable laws or stock exchange rules. Beyond these material plan amendments, the Committee may make changes to the ESOP, or the administration thereof, from time to time without shareholder approval (such as administrative changes, of a drafting or clarifying nature or to address regulatory and other developments and setting the terms, conditions and mechanics of grant, including with respect to vesting, exercise and expiry). In setting and amending the terms of CIBC’s stock option plans, the Committee reviews and recommends the terms and conditions of any new plan or any change in the terms and conditions of any existing plan to the Board for approval. | |
|
Clawback |
• Grants are subject to clawback for misconduct(1). | |
| (1) | Any individual who engages in misconduct that results in a significant financial loss to CIBC or causes or caused a material restatement of CIBC’s financial statements will be required to repay to CIBC upon demand the total value of any gains arising from options that vested and were exercised within the 12 months preceding the date on which CIBC determined that such significant loss occurred or such material restatement of its financial statements is required due to the individual’s misconduct. In addition, all outstanding options that vested within the previous 12 months will be cancelled. |
Misconduct is defined as (i) serious misconduct, (ii) fraud, (iii) a material breach of the terms and conditions of employment,(iv)willful breach of the provisions of CIBC’s Code of Conduct of sufficient gravity to justify the application of this provision,(v) the failure or willful refusal to substantially perform the grantee’s material duties and responsibilities, (vi) the conviction of the grantee for any crime involving fraud, misrepresentation or breach of trust, or (vii) any other circumstances sufficient for a termination of employment for cause.
PSU Plan(1)
|
Grants |
• Grants are typically awarded as a dollar amount. • Number of PSUs granted is based on the: - dollar value of the award; and - average closing price of CIBC common shares on the TSX for the 10 trading days before a fixed date. | |
| Dividend Equivalents |
• Dividend equivalents are reinvested and paid out at the same time, and subject to the same performance conditions, as the underlying PSUs. | |
| Performance Conditions |
• PSUs are subject to satisfaction of performance criteria at time of vesting based on CIBC’s TSR and adjusted ROE performance (or, for PSUs granted prior to F2020, reported ROE performance) compared with CIBC’s peer group. | |
| Performance Period |
• Three years. | |
|
Vesting |
• Vest at the end of the three-year period. | |
|
Payout |
• Payouts vary from 75% to 125% of the value of the number of PSUs granted depending on performance against the criteria described above. The performance period spans the three fiscal years that begin on the first day of the fiscal year in which the grants were made. • Vested PSUs pay out in cash, with each unit valued based on the average closing price of CIBC common shares on the TSX for the 10 trading days before a fixed date. | |
|
Clawback |
• Grants are subject to: - clawback in the event of misconduct(2); and - cancellation in certain cases for unexpected losses(3). | |
DSU Plan(1)
| Grants |
• Grants are typically awarded as a dollar amount. • Number of DSUs granted is based on the: - dollar value of the award; and - average closing price of CIBC common shares on the TSX for the 10 trading days preceding the fixed date. | |
| Dividend Equivalents |
• Dividend equivalents are reinvested and paid out when the underlying DSUs are paid. | |
|
Deferral |
• DSUs allow for a longer payout deferral than the typical three-year limit in Canada. | |
|
Vesting |
• The Board has discretion to set the vesting period and any vesting conditions, which may include performance- related vesting conditions. • When granted as part of a voluntary deferral of the executive’s cash incentive award, awards vest immediately. | |
|
Payout |
• Vested DSUs pay out in cash after the termination of employment, retirement or death, subject to Plan termination provisions and income tax requirements. • The payout price of each DSU will be the average closing price of CIBC common shares on the TSX over the ten trading days preceding the payment date. | |
|
Clawback |
• Grants are subject to clawback for misconduct(2). | |
| C I B C P R O X Y C I R C U L A R | 91 |
Table of Contents
Compensation Disclosure
| (1) | CIBC hedges its financial exposure resulting from changes in the CIBC share unit value through a total return swap arrangement with a third-party financial institution. |
| (2) | Any individual who engages in misconduct that results in a significant financial loss to CIBC or causes or caused a material restatement of CIBC’s financial statements will be required to repay to CIBC upon demand the total value of any incentive payment made within the 12 months preceding the date on which CIBC determined that such significant loss occurred or such material restatement of its financial statements is required due to the individual’s misconduct. In addition, all unvested and any outstanding deferred incentive compensation (PSUs or DSUs) that vested within the previous 12 months will be cancelled. Misconduct for this purpose is defined in note (1) on the previous page. |
| (3) | The performance clawback provisions provide that in the event of an unexpected loss for CIBC, the SBUs or key lines of business that is greater than, or equal to, the aggregate of the last three years of Net Income Before Tax, CIBC has discretion to cancel up to 100% of that year’s vesting PSUs, where CIBC determines a participant’s negligence or certain failures substantially contributed to the loss. The clawback can be applied to all or a group of individuals within the specific business unit where the significant unexpected loss occurred as well as in the associated functional group. |
| 92 | C I B C P R O X Y C I R C U L A R |
Table of Contents
Compensation Disclosure
Deferred incentive compensation plans assumed upon acquisition of PrivateBancorp, Inc. – terms and conditions
In connection with CIBC’s acquisition of PrivateBancorp, Inc., all outstanding options to purchase common stock of PrivateBancorp, Inc. were converted into options to purchase CIBC common shares and all the outstanding restricted stock awards of PrivateBancorp, Inc. were cancelled and replaced with CIBC RSAs, in each case on substantially the same terms and conditions as were applicable under the PrivateBancorp awards (including the same vesting terms).
The table below summarizes key terms and conditions of two plans assumed by CIBC upon the acquisition of PrivateBancorp, Inc. with outstanding treasury-settled awards. These are the 2007 Long-Term Incentive Compensation Plan (2007 Plan) and 2011 Amended and Restated Incentive Compensation Plan (2011 Plan). These two plans, together with the 2007 Strategic Long-Term Incentive Compensation Plan (Strategic Plan)(1) are collectively referred to as the PrivateBancorp Plans.
|
2007 Plan
|
Outstanding equity awards consist of vested, exercisable stock options with expiry dates through April 1, 2021.
| |
| 2011 Plan
|
Outstanding equity awards consist of: 1) vested, exercisable stock options with expiry dates through 2021; 2) vested stock options which cliff vested in 2018 and 2019 with expiry dates through June 1, 2026; and 3) vested restricted stock award units subject to delayed settlement over a period into 2022.
| |
|
Eligibility
|
• Outstanding awards were originally granted as PrivateBancorp awards to employees and directors of PrivateBancorp or a subsidiary thereof, and converted and/or cancelled and replaced with CIBC awards in connection with the acquisition of PrivateBancorp, Inc. Except as necessary to facilitate the conversion, exchange or settlement, as the case may be, of PrivateBancorp awards which were outstanding under the plans at the time the plans were assumed by CIBC, no further awards have been or will be granted under the PrivateBancorp Plans.
| |
|
Term
|
• Stock options under each of the PrivateBancorp Plans generally have a term of 10 years from the date of grant.
| |
|
Vesting
|
• All equity awards under the 2007 Plan and the 2011 Plan are fully vested with the last vesting occurring in February 2020.
| |
|
Exercise Price
|
• The exercise price for each share of common stock covered by the non-qualified stock option grant was not less than one hundred percent (100%) of the fair market value of the common stock on the date of grant of such award.
| |
|
Payout
|
• For the 2011 plan, restricted stock award units are cash-settled.
• For vested restricted stock units, the dividends continue to accumulate and are paid out upon settlement.
| |
|
Securities Reserved for Issue
|
• The maximum number of CIBC common shares which may be issued from treasury under the 2007 Plan and the 2011 Plan shall not exceed 150,000 and 1,000,000, respectively. | |
|
Termination
|
• The disposition of the grant of each award in the event of retirement, disability, death or other termination of a participant’s employment shall be as determined by the Committee and set forth in the award agreement.
| |
|
Assignability
|
• Except as provided below, no award may be sold, transferred, pledged, assigned, or otherwise alienated or hypothecated, except by will or by the laws of descent and distribution. Notwithstanding the foregoing, the Committee may, in its discretion, authorize all or a portion of the stock options granted to a participant to be on terms that permit transfer by such participant to: | |
| (i) the spouse, children or grandchildren of the participant (“Immediate Family Members”); | ||
| (ii) a trust or trusts for the exclusive benefit of the participant or such Immediate Family Members (or both); or | ||
| (iii) a partnership in which the participant or such Immediate Family Members (or both) are the only partners, provided that: | ||
| (A) there may be no consideration for any such transfer; | ||
| (B) the award agreement pursuant to which such stock options are granted expressly provides for transferability in a manner consistent with the PrivateBancorp Plans; and | ||
|
(C) subsequent transfers of transferred stock options shall be prohibited except those in accordance with the PrivateBancorp Plans.
| ||
|
Amendments
|
• The Board may at any time and from time to time, alter, amend, suspend or terminate the plan in whole or in part, subject to any requirement of shareholder approval imposed by applicable law, rule or regulation. No termination, amendment, or modification of the plan shall adversely affect in any material way any award previously granted under the plan, without the written consent of the participant holding such award.
| |
|
Clawback(2)
|
• Awards are subject to recovery or “clawback” under the plan or any of CIBC’s policies applicable to the grantee.
| |
| (1) | The Strategic Plan was also assumed by CIBC upon the acquisition of PrivateBancorp, Inc. However, no awards vested under the Strategic Plan since fiscal 2018 and it no longer has any outstanding awards. |
| (2) | Allows for the recoupment of annual and long-term incentive compensation paid to executive officers if the criteria upon which it was based is determined to have been incorrect or incomplete, or where the recipient engaged in illegal, dishonest, fraudulent or intentional misconduct that materially impacted the size of the award. The clawback rights apply during the three-year period following the date that a bonus was made or the date that restrictions on restricted shares lapse. |
| C I B C P R O X Y C I R C U L A R | 93 |
Table of Contents
Compensation Disclosure
Retirement Benefits
All NEOs participate in Defined Benefit (DB) pension plans on the same basis as all other CIBC employees in either Canada or the US, which are subject to limitations defined by the Income Tax Act in Canada, or US tax regulations in the US.
Supplemental DB pension benefits for the NEOs (excluding Mr. Capatides, subject to the discussion below) are provided under a Supplemental Executive Retirement Plan (SERP). For the NEOs promoted before January 1, 2016, being Mr. Dodig, Mr. Culham and Ms. Dottori- Attanasio, the SERP provides for a final average earnings pension benefit for each year of pensionable service where earnings include a portion of incentive compensation up to a cap. This means that SERP benefits do not increase commensurate with earnings. For NEOs promoted on or after January 1, 2016, being Mr. Panossian, the SERP provides for a flat dollar pension accrual, which is irrespective of earnings, for service only from SERP appointment.
Mr. Capatides is also eligible for equivalent supplemental benefits on the same basis as the Canadian NEOs, except denoted in US dollars. Effective January 1, 2021, the DB pension plan covering US employees was frozen and the existing Defined Contribution 401(k) savings plan was enhanced. Notwithstanding the US DB pension plan freeze, Mr. Capatides will continue to earn supplemental benefit service credits after January 1, 2021.
Payment of SERP benefits, including for Mr. Capatides, is subject to compliance with certain non-solicitation and non-competition covenants.
Key provisions applicable to Mr. Dodig, Mr. Culham, Ms. Dottori-Attanasio and Mr. Capatides are summarized in the table below:
|
Pension Formula
|
• 2% of final average earnings per year of pensionable service (maximum of 35 years of service), offset by other CIBC-provided retirement income benefits.
| |
| • The overall annual pension payable to Mr. Dodig is subject to an overall limit of $1,000,000.
| ||
|
• For Mr. Capatides, his supplemental benefit is further offset by a notional monthly annuity representing his 401(k) matching contributions provided by CIBC.
| ||
|
Final Average Earnings |
• The sum of: | |
| – the average of the best consecutive five years of salary in the last 10 years before retirement; and | ||
| – the average of the best five years of annual cash bonus awards in the last 10 years before retirement. | ||
| • Subject to the following limits: | ||
| – $2,300,000 for Mr. Dodig | ||
| – $913,500 for Mr. Culham and Ms. Dottori-Attanasio | ||
|
– $1,216,873(1) for Mr. Capatides
| ||
|
Reduction for Early Retirement
|
• Pensions are reduced by 4% for each year that retirement age precedes age 61 for Mr. Dodig and Mr. Capatides.
• For Mr. Culham and Ms. Dottori-Attanasio, pensions are reduced by 4% for each year that retirement age precedes age 61 for pension service accrued to December 31, 2012 and by 4% for each year that retirement precedes age 65 for pension service from January 1, 2013 forward.
| |
|
Government Pension Adjustment
|
• Pensions are reduced from age 65 by the maximum Canada/Québec Pension Plan benefit payable at that time. Mr. Capatides’ pension will be reduced by the maximum primary insurance amount payable from the Social Security Normal Retirement Age.
| |
|
Form of Pension
|
• Pension payments are made for the life of the executive. In the event of death of the executive, 50% of the pension is continued for the life of the executive’s spouse. Other optional forms of payment are made available on an actuarially equivalent basis.
| |
| (1) | The limit on final average earnings for Mr. Capatides is US$913,500. This amount has been converted to Canadian dollars in the chart above using the October 31, 2020 WM/Reuters spot exchange rate of US$1.00 = C$1.3321. |
The key provisions applicable to Mr. Panossian are summarized in the table below:
|
Pension Formula
|
• A flat dollar accrual rate of $12,500 per year of SERP pensionable service only (maximum of 35 years of service).
| |
|
Reduction for Early Retirement
|
• Pensions are reduced by 4% for each year that retirement age precedes age 65.
| |
|
Form of Pension
|
• Pension payments are made for the life of the executive only. Other optional forms of payment are made available on an actuarially equivalent basis.
| |
|
Vesting
|
• Mr. Panossian’s SERP benefits are vested on attainment of age 55 and 5 years of service.
| |
| 94 | C I B C P R O X Y C I R C U L A R |
Table of Contents
Compensation Disclosure
The table below provides additional information related to NEO Defined Benefit pension obligations:
| Defined Benefit Plans | ||||||||||||||||||||||||||||
| Number
|
Annual Benefits Payable Vested and Unvested(1) ($) |
Opening
|
Compensatory ($)
|
Non-Compensatory ($)
|
Closing Present
|
|||||||||||||||||||||||
| Name
|
At
|
At Age 65(3)
|
||||||||||||||||||||||||||
| Victor Dodig |
15.3 | 702,000 | 1,000,000 | 8,794,000 | 666,000 | 1,032,000 | 10,492,000 | |||||||||||||||||||||
| Hratch Panossian |
8.9 | 111,000 | 511,000 | 380,000 | 205,000 | 97,000 | 682,000 | |||||||||||||||||||||
| Harry Culham |
12.2 | 116,000 | 332,000 | 1,121,000 | 214,000 | 119,000 | 1,454,000 | |||||||||||||||||||||
| Michael Capatides(8) |
25.0 | 591,000 | 591,000 | 8,478,000 | 388,000 | (281,000) | 8,585,000 | |||||||||||||||||||||
| Laura Dottori-Attanasio |
11.5 | 210,000 | 420,000 | 2,210,000 | 229,000 | 120,000 | 2,559,000 | |||||||||||||||||||||
| (1) | These amounts represent the estimated annual pension payable at age 65 for vested and unvested credited service accrued to the date shown, assuming that final average earnings for SERP participants will be at or above the applicable SERP compensation limit. In addition to joining the SERP effective September 1, 2015, Mr. Culham has seven years of service credited under the CIBC Pension Plan that is not recognized under the SERP. Mr. Culham’s pension from the CIBC Pension Plan is equal to the maximum pension permitted to be paid from the CIBC Pension Plan as prescribed by the Income Tax Act, and is included in the amounts above. Mr. Panossian has 2.3 years of service credited under the CIBC Pension Plan which are not recognized under the SERP. For the NEOs except Mr. Panossian, the SERP pension in Canada will be offset by the maximum Canada Pension Plan benefit amount starting at age 65, and for Mr. Capatides, the maximum primary insurance amount under US Social Security starting at the Social Security Normal Retirement Age. |
| (2) | The amounts shown are fully vested for all NEOs except for Mr. Panossian. Vested annual benefits payable to Mr. Panossian as at October 31, 2020 is $28,000. Mr. Panossian’s benefits vest in accordance with the terms of the SERP. |
| (3) | Mr. Dodig is eligible to retire at age 61 with an unreduced pension estimated at $958,000 annually. Mr. Capatides is eligible to retire with an immediate unreduced pension of $591,000 annually. All other NEOs are eligible to retire with an unreduced pension at age 65. The CIBC Pension Plan benefits for Mr. Culham and Mr. Panossian were determined using the Income Tax Act limits applicable in 2020. |
| (4) | These amounts represent the present value of the NEO’s projected pension earned for service up to October 31, 2019. Amounts have been calculated using the same actuarial assumptions used for CIBC’s financial statement disclosure. Key actuarial assumptions include: |
| – | an annual discount rate of 3.07% (3.26% for Mr. Capatides); |
| – | an annual compensation increase that varies by age and tenure of the executive before taking into account limits on final average earnings; |
| – | no allowance for future increases in compensation limits or the different tax treatment of registered pension plans versus supplemental pension benefits; and |
| – | assumed retirement dates reflecting CIBC Pension Plan experience. |
| (5) | These amounts represent the fiscal 2020 annual service cost and, where applicable, the impact on present value of defined benefit obligations of any differences between actual and estimated earnings. Amounts have been calculated using the actuarial assumptions and discount rate of 3.14% up to January 31, 2020 and 2.80% up to October 31, 2020 (3.13% for Mr. Capatides in the US) consistent with the fiscal 2020 pension expense reported in CIBC’s financial statement disclosure. |
| (6) | These amounts include interest on the opening present value of the defined benefit obligation, experience gains and losses other than those associated with compensation levels, differences in US/Canada exchange rates during the year and changes in actuarial assumptions. |
| (7) | These amounts represent the present value of the NEO’s projected pension earned for service up to October 31, 2020. Amounts have been calculated using the same actuarial assumptions used for CIBC’s financial statement disclosure. Key actuarial assumptions include: |
| – | an annual discount rate of 2.83% (2.85% for Mr. Capatides); |
| – | an annual compensation increase that varies by age and tenure of the executive before taking into account limits on final average earnings; |
| – | no allowance for future increases in compensation limits or the different tax treatment of registered pension plans versus supplemental pension benefits; and |
| – | assumed retirement dates reflecting CIBC Pension Plan experience. |
| (8) | Mr. Capatides’ estimated annual pension has been translated to Canadian dollars using the October 31, 2020 WM/Reuters spot exchange rate of US$1.00 = C$1.3321. |
Mr. Capatides participates in the US 401(k) savings plan on the same basis as other US employees. Participants may choose to contribute up to 6% of their eligible earnings which will attract a 50% match from CIBC up to a maximum of 3%. From time to time, CIBC, at its discretion, may also remit additional non-discriminatory contributions to all US employees participating in the 401(k) savings plan. All contributions to the 401(k) savings plan are subject to applicable Internal Revenue Service limits.
The table below provides additional information related to NEO Defined Contribution pension obligations:
| Defined Contribution Plans | ||||||
| Name | Accumulated Value at start of year ($) |
Compensatory Change(1) ($) |
Accumulated value at end of year ($) | |||
| Michael Capatides(2) |
2,564,448 | 12,536 | 2,601,890 | |||
| (1) | The compensatory change consists of the contributions made by CIBC into the member’s 401(k) account during the fiscal year converted to Canadian dollars at the average WM/Reuters exchange rate of US$1.00 = C$1.3443. |
| (2) | The accumulated values have been converted to Canadian dollars using the WM/Reuters spot exchange rate on October 31 of US$1.00 = C$1.3321 for 2020 and US$1.00 = C$1.3169 for 2019. |
| C I B C P R O X Y C I R C U L A R | 95 |
Table of Contents
Compensation Disclosure
Change of Control contracts
CIBC adopted a Change of Control Policy in 2001. This policy, which covers certain senior executive officer roles, including all the NEOs, recognizes the importance to CIBC and our shareholders of neutralizing potential conflicts of interest and stabilizing key management roles in connection with potential or actual change of control activity. The underlying premise of the policy is that, under a change of control, no additional benefits would be conferred on an officer than would be otherwise provided under a standard severance arrangement, recognizing there are some distinct features to the Change of Control Policy related to the unique circumstances being addressed. The provisions of the policy are reviewed by the Committee on a regular basis for consistency with current best practice and to confirm that the list of officers to which the policy applies is appropriate. The key terms of the policy are the following:
|
Eligibility
|
• Certain senior officers of CIBC, including each of the NEOs.
| |
|
Coverage Period
|
• 24 months following the date of the change of control.
| |
|
Trigger Events (i.e., “Double Trigger”) |
• The policy includes a “Double Trigger” where severance payouts, accelerated vesting of deferred incentive compensation and accrued pension occur only if both: | |
| (1) a change of control event occurs; and | ||
| (2) the officer’s employment is terminated without cause or the officer resigns during the coverage period for one of the reasons listed below, as specified in the policy: | ||
| – a material reduction in the officer’s total compensation opportunities, job responsibilities, duties or reporting relationship; | ||
| – a material reduction in the officer’s title, unless the change is a result of a different titling structure or is to a title of essentially the same rank; | ||
| – a change in the officer’s work location that requires the officer to devote more than 50% of his/her working time over a period of three months at a location that is more than 50 miles/80 kilometers from his/her normal work location before the change of control event; or | ||
|
– any other change in the officer’s employment constituting constructive dismissal under applicable law.
| ||
|
Severance Benefits |
• Upon the “Double Trigger”, the greater of:
| |
| (1) two times the sum of annual salary plus the greater of the average annual cash incentive for the three immediately preceding fiscal years, and the average target cash incentive for the three immediately preceding fiscal years(1); and | ||
|
(2) the amount the officer may be entitled to under any employment contract (as disclosed in footnote (3) to the Termination and change of control benefits table on page 97) or applicable law.
| ||
|
Vesting of Deferred Incentive Compensation and Pension
|
• Upon the “Double Trigger”, all deferred incentive compensation awards and any unvested accrued pension vest. For PSUs, the number of units vesting is determined by applying the relevant performance criterion for the period from the grant date to the termination date. | |
|
Pension Benefits |
• Upon the “Double Trigger”, and only for participants who were SERP members prior to May 27, 2015, pension is paid in accordance with the standard terms of the SERP but with two years of service added to credited service (subject to an overall cap of 35 years of service). For participants who became members of the SERP on or after May 27, 2015, additional service credits will only be provided when the participant qualifies under CIBC’s executive severance guidelines to have severance paid in the form of salary continuance.
| |
| (1) | In addition, a cash amount of 10% of salary is paid in lieu of continued participation in CIBC’s pension, health and welfare benefits plans that would otherwise be payable during the severance period. |
| 96 | C I B C P R O X Y C I R C U L A R |
Table of Contents
Compensation Disclosure
Termination and change of control benefits
The table below summarizes estimated incremental payments, payables and benefits which each NEO would be contractually entitled to in the event of a termination without cause or change of control where the executive is terminated without cause or resigns during the coverage period for reasons specified in the Change of Control Policy. Amounts do not include any potential greater common law entitlements.
| Name | Compensation Element |
Estimated Incremental Payment at October 31, 2020(1) |
||||||||
| Termination Without Cause(2) ($) |
Change of Control(3) ($) |
|||||||||
| Victor Dodig |
Cash | 0 | 5,525,000 | |||||||
| Deferred Compensation Incremental Value | 0 | 0 | ||||||||
| Benefits | 0 | 200,000 | ||||||||
|
|
|
|
|
|||||||
| Total Incremental Payment | 0 | 5,725,000 | ||||||||
| Annual Pension Increment | 0 | 92,000(4) | ||||||||
| Hratch Panossian |
Cash | 1,910,897 | 1,913,333 | |||||||
| Deferred Compensation Incremental Value | 0 | 0 | ||||||||
| Benefits | 100,000 | 100,000 | ||||||||
|
|
|
|
|
|||||||
| Total Incremental Payment | 2,010,897 | 2,013,333 | ||||||||
| Annual Pension Increment | 0 | 108,000(4) | ||||||||
| Harry Culham |
Cash | 2,577,653 | 5,155,305 | |||||||
| Deferred Compensation Incremental Value | 0 | 0 | ||||||||
| Benefits | 50,000 | 100,000 | ||||||||
|
|
|
|
|
|||||||
| Total Incremental Payment | 2,627,653 | 5,255,305 | ||||||||
| Annual Pension Increment | 0 | 0(4) | ||||||||
| Michael Capatides |
Cash | 0 | 4,361,996 | |||||||
| Deferred Compensation Incremental Value | 0 | 0 | ||||||||
| Benefits | 0 | 199,815 | ||||||||
|
|
|
|
|
|||||||
| Total Incremental Payment | 0 | 4,561,811 | ||||||||
| Annual Pension Increment | 0 | 49,000(4) | ||||||||
|
Laura Dottori-Attanasio |
Cash | 3,099,000 | 3,120,000 | |||||||
| Deferred Compensation Incremental Value | 0 | 0 | ||||||||
| Benefits | 0 | 150,000 | ||||||||
|
|
|
|
|
|||||||
| Total Incremental Payment | 3,099,000 | 3,270,000 | ||||||||
| Annual Pension Increment | 0 | 37,000(4) | ||||||||
| (1) | No incremental amounts are payable upon retirement, resignation (other than for reasons specified in the Change of Control Policy) or termination with cause. In addition, no incremental amount would be received in respect of accelerated vesting of option- or share-based awards, if any, on the assumption that the discount rate applied to calculate the net present value of the accelerated entitlements is not greater than the rate at which the CIBC common shares would otherwise be expected to appreciate over the period of acceleration. For information regarding outstanding option- and share-based awards as at October 31, 2020, see “Incentive plan awards – outstanding option- and share-based awards” on page 87. |
The Cash, Benefits and Annual Pension amounts for Mr. Capatides have been converted to Canadian dollars at the October 31, 2020 WM/Reuters spot exchange rate of US$1.00 = C$1.3321.
| (2) | Amounts shown as Cash for Mr. Panossian, Mr. Culham and Ms. Dottori-Attanasio represent entitlements to cash payments in lieu of notice. For Mr. Panossian, the cash payment is equal to two times the sum of base salary, average annual cash bonus for the prior three years and annual car allowance. For Mr. Culham, the cash payment is equal to the sum of annual salary and average annual cash bonus for the prior three years. For Ms. Dottori-Attanasio, the cash payment is equal to two times the sum of base salary and average cash bonus for the prior three years. The amounts shown as Benefits are in lieu of continued participation in CIBC’s pension, health and welfare benefit plans, equal to a cash payment of one-twelfth of 10% of the annual salary, multiplied by the length of severance payment period for Mr. Panossian, and equal to a cash payment of 10% of the annual salary for Mr. Culham. |
For all NEOs, unvested PSU awards would continue to be eligible to vest and pay out over the normal schedule. Options would continue to be eligible to meet time-based vesting conditions over the severance period and expire at the end of the severance period.
| (3) | Amounts shown as Cash for all NEOs represent severance benefits upon a “double trigger” event. For information on the cash payments, see “Change of Control contracts” on page 96 of the Circular. |
Amounts shown as Benefits are cash payments in lieu of continued participation in CIBC’s pension, health and welfare benefit plans. Each NEO would receive a cash payment equal to 10% of the amount representing salary in the Change of Control severance payment.
| C I B C P R O X Y C I R C U L A R | 97 |
Table of Contents
Compensation Disclosure
| (4) | Annual Pension Increment amounts for Mr. Dodig, Mr. Capatides, Ms. Dottori-Attanasio and Mr. Panossian are the incremental annual lifetime pension amounts payable from their unreduced early retirement age (age 61 for Mr. Dodig, immediately for Mr. Capatides, and age 65 for Ms. Dottori-Attanasio and Mr. Panossian) as a result of being entitled to two years of additional credited service and any remaining vesting requirements being waived. Unlike the other NEOs, Mr. Panossian is not vested at October 31, 2020 and therefore his Annual Pension Increment amount consists of the value of waiving the vesting requirements and receiving two years of additional credited service. |
The present values at October 31, 2020 of the Annual Pension Increment amounts are $1,538,000 for Mr. Dodig, $861,000 for Mr. Capatides, $481,000 for Ms. Dottori-Attanasio and $916,000 for Mr. Panossian. The actuarial assumptions used to determine the present values are consistent with the assumptions used for the October 31, 2020 year-end pension plan liabilities which are disclosed in CIBC’s financial statements, with the exception that the assumed retirement age is based on the first date of retirement eligibility. Payment of the Annual Pension amounts is subject to the NEO’s acceptance of certain non-solicitation and non-competition covenants. Annual Pension Increment amount is $0 for Mr. Culham as he joined the SERP after May 27, 2015, the date the Change of Control Policy was amended to eliminate the provision of additional pension service credit upon Change of Control.
Additional disclosure under the FSB and Basel Committee on Banking Supervision
The following table provides disclosure under Standard 15 of the FSB Principles for Sound Compensation Practices and their Implementation Standards and Pillar III of the Basel Committee.
For purposes of these tables, CIBC includes in the FSB terms “senior executive officers” and “employees whose actions have a material impact on the risk exposure of the firm”, the NEOs and those employees who CIBC has determined are “material risk takers” based upon an assessment of each role’s ability to have a material impact on the risk exposure to CIBC.
Amounts denominated in foreign currencies have been converted to Canadian dollars at exchange rates used in the annual compensation process. Other issuers that make disclosure of this type may include different officers and employees in these categories, so the amounts disclosed by CIBC may not be comparable to the amounts disclosed by other issuers.
| Amounts and form of remuneration awarded(1)
|
||||||||||||||||
| 2020 | 2019 | |||||||||||||||
| (All figures in $) | NEOs | Other Material Risk Takers | NEOs | Other Material Risk Takers | ||||||||||||
| Fixed salary |
3,800,000 | 37,500,000 | 5,000,000 | 38,300,000 | ||||||||||||
| Variable compensation |
||||||||||||||||
| – Cash |
6,100,000 | 75,700,000 | 7,300,000 | 79,000,000 | ||||||||||||
| – Equity |
16,900,000 | 66,200,000 | 18,300,000 | 68,700,000 | ||||||||||||
| – Share-linked |
16,900,000 | 66,200,000 | 18,300,000 | 68,700,000 | ||||||||||||
| – Other |
— | — | — | — | ||||||||||||
|
Total variable compensation |
23,000,000 | 141,900,000 | 25,600,000 | 147,700,000 | ||||||||||||
|
Total remuneration |
26,800,000 | 179,400,000 | 30,600,000 | 186,000,000 | ||||||||||||
| Number of beneficiaries |
5 | 110 | 6 | 113 | ||||||||||||
| Deferred compensation awarded and paid out(2) | ||||||||||||||||
| Awarded for the fiscal year |
16,900,000 | 66,200,000 | 18,300,000 | 70,900,000 | ||||||||||||
| Payouts during the fiscal year(3) |
16,700,000 | 70,400,000 | 15,600,000 | 63,200,000 | ||||||||||||
| Outstanding deferred compensation(4) | ||||||||||||||||
| Vested |
9,600,000 | 13,000,000 | 14,700,000 | 20,600,000 | ||||||||||||
|
Unvested |
37,300,000 | 178,300,000 | 54,400,000 | 216,400,000 | ||||||||||||
| Total |
46,900,000 | 191,300,000 | 69,100,000 | 237,000,000 | ||||||||||||
| Implicit and explicit reductions(5) | ||||||||||||||||
| Outstanding |
17,300,000 | 131,400,000 | 25,500,000 | 153,000,000 | ||||||||||||
| Reductions |
||||||||||||||||
| – Implicit |
5,100,000 | 13,200,000 | 200,000 | 700,000 | ||||||||||||
|
– Explicit |
— | — | — | — | ||||||||||||
| (1) | Awards may have been granted and received during or after the fiscal year, but are in respect of the specified fiscal year. |
| (2) | Amounts of deferred compensation awarded for, and paid out during, the specified fiscal years under current deferred compensation plans. Payouts include realized option gains (i.e., the difference between the market value and exercise price). |
| (3) | Included in fiscal 2020 are amounts paid in December 2019 relating to fiscal 2018 and previous years and included in fiscal 2019 are amounts paid in December 2018. |
| 98 | C I B C P R O X Y C I R C U L A R |
Table of Contents
Compensation Disclosure
| (4) | All forms of deferred compensation that remain outstanding and which had not expired at the end of the specified fiscal years. Deferral periods are specified within the terms of the relevant plan and, for DSUs, extend until termination, retirement or death. |
| (5) | Implicit and explicit reductions related to outstanding remuneration at the end of the specified fiscal years that was awarded in the prior fiscal year (e.g., 2020 amounts related to remuneration awarded in 2019). Implicit reductions result from decreases in the value of CIBC common shares or share units while explicit reductions result from the application of misconduct or performance clawbacks. |
Other compensation paid
There were no guaranteed incentive compensation awards granted in fiscal 2020 for NEOs and other material risk takers (nil in fiscal 2019). Cash sign-on awards(1) granted in fiscal 2020 for two material risk takers were $730,000 (nil in fiscal 2019). No cash sign-on awards were granted to NEOs in fiscal 2020 or fiscal 2019. Severance amounts negotiated and settled in fiscal 2020 for eight material risk takers were $15,603,000 ($3,041,000 for three beneficiaries in fiscal 2019)(2). Payouts in fiscal 2020 amounted to $7,435,000 ($1,181,000 in fiscal 2019). No severance was negotiated and settled with respect to NEOs in fiscal 2020 or 2019.
| (1) | Payouts in connection with the cash sign-on awards granted in the specified fiscal years to new hires may have been made in whole or in part in the specified fiscal year or in a subsequent fiscal year. Deferred sign-on awards are included in the “Outstanding deferred compensation” section of the table on the previous page. |
| (2) | “Severance amounts” reflect the aggregate total amount payable by CIBC in connection with severance arrangements negotiated and settled (i.e., agreed to) in the applicable fiscal year, whether or not such amounts are payable during such fiscal year. The amounts shown in fiscal 2019 have been updated to reflect this approach (vs. the 2020 circular, which had excluded certain amounts not payable until subsequent to the 2019 fiscal year-end). “Payouts” reflect the aggregate severance amounts actually paid out by CIBC in the applicable fiscal year. The single highest amount of severance that CIBC negotiated and settled in fiscal 2020 was $4,960,000 ($1,650,000 in fiscal 2019). |
Indebtedness of Directors and Executive Officers
All transactions with directors and executive officers must be on market terms and conditions unless, in the case of banking products and services for executive officers, otherwise stipulated under approved policy guidelines that govern all employees. Any loans to directors and executive officers must also be made in accordance with the US Sarbanes-Oxley Act of 2002.
The table below shows outstanding indebtedness to CIBC or its subsidiaries incurred by directors, director nominees and executive officers of CIBC or its subsidiaries and their associates, other than routine indebtedness(1) as defined under Canadian securities law and indebtedness that had been entirely repaid by the date of this Circular.
| Indebtedness of Directors and Executive Officers under (1) Securities Purchases and (2) Other Programs | ||||||||||||||||||||||
| Name and Principal Position | Involvement of CIBC or Subsidiary |
Largest Amount ($) |
Amount ($) |
Financial Assisted Securities Purchases During Fiscal Year Ended October 31, 2020 (#) |
Security for Indebtedness |
Amount ($) |
||||||||||||||||
|
Securities Purchase Programs(2) |
||||||||||||||||||||||
| J. Hountalas, Group Head, Commercial Banking and Wealth Management, Canada |
CIBC as lender |
200,000 | 192,023 | 2,534 | |
CIBC common shares |
|
- | ||||||||||||||
| H. Panossian, CFO & Enterprise Strategy | CIBC as lender |
200,000 | 191,349 | 1,833 | |
CIBC common shares |
|
- | ||||||||||||||
| C I B C P R O X Y C I R C U L A R | 99 |
Table of Contents
Other Information
| (1) | Routine indebtedness includes (i) loans made on terms no more favourable than loans to employees generally, for which the amount remaining unpaid does not exceed $50,000 at any time during the last completed financial year to any director, executive officer, or proposed nominee together with their associates; (ii) loans to full-time employees, fully secured against their residence and not exceeding their annual salary; (iii) loans other than to full-time employees, on substantially the same terms available to other customers with comparable credit and involving no more than the usual risk of collectability; and (iv) loans for purchases on usual trade terms, or for ordinary travel or expense advances, or similar reasons, with repayment arrangements in accordance with usual commercial practice. |
| (2) | CIBC employees can obtain credit from CIBC to purchase CIBC common shares under CIBC’s employee loan program. All loans granted under the program have a maximum amortization of 15 years and interest rates are fixed at the time of purchase at CIBC’s prime rate or 5%, whichever is lower. The credit criteria of the program and the compensation level of the borrower are considered when determining the amount of credit granted. The balance of the loan and accrued interest will become due immediately on demand, at CIBC’s option, if the employee does not make a payment when due or if such amounts become due in accordance with any security held by CIBC for the loan (e.g. any security agreement, chattel mortgage, land mortgage, hypothec, etc.). |
The table below shows the aggregate indebtedness to CIBC or its subsidiaries of current and former directors, executive officers and employees of CIBC and its subsidiaries. This amount does not include routine indebtedness described in note (1) above.
| Aggregate Indebtedness(1) | ||||
| Purpose | To CIBC or its Subsidiaries ($) |
To Another Entity | ||
|
Securities Purchase |
383,372 | — | ||
|
Other |
89,434,007 | — | ||
| (1) | Certain loans were made in US dollars. These amounts have been converted to Canadian dollars based on the January 29, 2021 WM/Reuters exchange rate of US$1.00 = C$1.27745. |
| 100 | C I B C P R O X Y C I R C U L A R |
Table of Contents
Other Information
Directors’ and Officers’ Liability Insurance
Effective November 1, 2020, CIBC purchased at its expense a directors’ and officers’ liability insurance policy that protects directors and officers against liability incurred by them while acting as directors and officers of CIBC and its subsidiaries. The insurance applies where CIBC does not, or is not permitted to, indemnify them. This insurance has a limit of $300 million per claim and in the aggregate for the twelve-month period ending November 1, 2021. There is no deductible. The annual premium for this policy is approximately $1.6 million.
Under the Bank Act and CIBC’s by-laws, CIBC indemnifies any director or officer of CIBC, any former director or officer of CIBC, and any other person who acts or acted at CIBC’s request as a director or officer of or in a similar capacity for another entity, and their heirs and personal representatives, against all costs, charges and expenses, including an amount paid to settle an action or satisfy a judgment reasonably incurred by them in respect of any civil, criminal, administrative, investigative or other proceeding in which they are involved because of that association with CIBC or other entity provided (i) the person acted honestly and in good faith with a view to the best interests of, as the case may be, CIBC or the other entity for which they acted at CIBC’s request as a director or officer or in a similar capacity; and (ii) in the case of a criminal or administrative action or proceeding that is enforced by a monetary penalty, the person had reasonable grounds for believing that their conduct was lawful.
During fiscal 2020, CIBC paid approximately $490,480 as an advance for legal fees and disbursements on behalf of Gerald T. McCaughey, former President and Chief Executive Officer; Thomas D. Woods, former Senior Executive Vice-President and Vice-Chairman; Ken Kilgour, former Senior Executive Vice-President and Chief Risk Officer; and Brian G. Shaw, former Senior Executive Vice-President and Chief Executive Officer of CIBC World Markets Inc., in connection with the defence of the civil action entitled Howard Green and Anne Bell v. Canadian Imperial Bank of Commerce, et al, commenced in the Ontario Superior Court of Justice.
Financial information about CIBC is in our consolidated financial statements and MD&A for fiscal 2020. Additional information is available in our Circular, Annual Information Form, Annual Report and any subsequent interim financial statements and MD&A.
You can access these documents at www.cibc.com and www.sedar.com or obtain a printed copy free of charge by contacting Investor Relations at investorrelations@cibc.com or CIBC Investor Relations, 21 Melinda Street, Commerce Court East, Toronto, Ontario M5L 1G9.
Vote Results and Minutes of Meeting
Our vote results and the minutes of our meeting will be available at www.cibc.com. Vote results will also be filed on SEDAR at www.sedar.com.
Contacting our Board of Directors
You may contact the Board, the Chair of the Board, a Board committee or a Board member at corporate.secretary@cibc.com or CIBC Corporate Secretary’s Division, 199 Bay Street, Commerce Court West, Suite 4460, Toronto, Ontario M5L 1A2.
The Board approved the contents of this Circular and sending it to shareholders.

Michelle Caturay
Senior Vice-President, Associate
General Counsel and Corporate
Secretary
February 16, 2021
| C I B C P R O X Y C I R C U L A R | 101 |
Table of Contents
| Head Office
|
Investor Relations
| |
| 199 Bay Street
|
Call: 416 813-3743
| |
| Commerce Court
|
Email: investorrelations@cibc.com
| |
| Toronto, Ontario M5L 1A2 Canada |
| All paper used in the production of CIBC’s 2021 Management Proxy Circular is Forest Stewardship Council® (FSC®) certified. This paper is acid free and elemental chlorine free. Only vegetable-based, low-VOC inks have been used. |

|