Exhibit 99.9
| Item 2. | Management’s Discussion and Analysis of Financial Condition and Results of Operations |
Forward-Looking Statements
In addition to historical information, this discussion and analysis contains forward-looking statements. These statements can be identified by the use of forward-looking terminology including “may,” “believe,” “will,” “expect,” “anticipate,” “estimate,” “continue” or similar words. These forward-looking statements are subject to risks and uncertainties, as more particularly set forth in our filings with the Securities and Exchange Commission, including those described in the “Forward Looking Statements” and “Risk Factors” sections of our Annual Report on Form 10-K for the year ended December 31, 2009, that could cause actual results to differ materially from those projected in the forward-looking statements. Readers are cautioned not to place undue reliance on these forward-looking statements, which reflect management’s analysis only as of the date hereof. We undertake no obligation to publicly revise or update these forward-looking statements to reflect events or circumstances that arise after the date of this report, except as may be required by applicable law.
Overview
We are a vertically integrated commercial real estate company capable of originating, investing in, managing, servicing, trading and advising on commercial real estate-related assets. In 2010, we continue to progress in adapting RAIT to the current market environment. We are positioning RAIT for future growth in the area of its historical core competency, commercial real estate lending, while diversifying the revenue generated from our commercial real estate loans and properties and reducing or removing other non-core assets and activities.
In order to take advantage of market opportunities in the future, and to maximize shareholder value over time, we will continue to focus on:
| • | expanding RAIT’s commercial real estate revenue by investing in commercial real estate-related assets, managing and servicing investments for our own account or for others, providing property management services and providing our broker-dealer activities, including fixed-income trading and real estate advisory services; |
| • | creating value through investing in our commercial real estate properties and implementing cost savings programs to help maximize property value; |
| • | reducing our leverage while developing new financing sources; |
| • | managing our investment portfolios to reposition non-performing assets, increase our cash flows and ultimately recover the value of our assets; and |
| • | managing the size and cost structure of our business to match our operating environment. |
We generated net income allocable to common shares of $53.6 million, or $0.68 per common share-diluted, during the six-month period ended June 30, 2010. The primary items affecting our operating performance were the following:
| • | Gains on debt extinguishments. During the six-month period ended June 30, 2010, we repurchased $74.5 million of our convertible notes and $16.5 million of our CDO notes payable for total consideration of $51.7 million. The consideration was comprised of: cash of $12.0 million, the issuance of a $22.0 million convertible senior note and 8.2 million common shares. These transactions generated $37.0 million in gains on extinguishment of debt. See “Liquidity and Capital Resources-Capitalization” below for more information regarding these transactions. |
| • | Provision for losses. The provision for losses recorded during the six-month period ended June 30, 2010 was $25.0 million. While we recorded additional provision for losses during the six-month period ended June 30, 2010, we saw improvement in the performance of our portfolio of commercial real estate loans from prior quarters. |
| • | Change in fair value of financial instruments. For the six-month period ended June 30, 2010, the net change in fair value of financial instruments increased net income by $20.9 million. Generally, the change in fair value of our financial assets, which are recorded at fair value under FASB ASC Topic 825, “Financial Instruments”, was the primary driver of this improvement with several of our assets improving. This is consistent with the general improvement in asset pricing throughout the financial sector during the first and second quarters of 2010. |
We expect to continue to focus our efforts on enhancing our commercial real estate property portfolio and our commercial real estate loan portfolio, which are our primary investment portfolios. We are seeing signs of stabilization in these portfolios, including improved occupancy rates in our commercial real estate property portfolio and a reduction in our non-accrual loans and provision for losses in commercial real estate loan portfolio in the six-month period ended June 30, 2010. Although certain economic conditions are improving, some of our borrowers within our commercial real estate loan portfolio are under financial stress. Where it is likely to enhance our ultimate returns, we will consider restructuring loans or foreclosing on the underlying property. During the six-month period ended June 30, 2010, we converted five loans, originally collateralized by seven properties, into direct ownership. We expect to engage in ongoing workout activity with respect to our commercial real estate loans that may result in the conversion of some of the
1
properties into owned real estate. We may take a non-cash charge to earnings at the time of any loan conversion to the extent the amount of our loan, reduced by any allowance for losses and certain other expenses, exceeds the fair value of the property at the time of the conversion. The conversion of loans to owned properties is reflected in the growing portion of our revenue derived from rental income as opposed to net interest margin.
We are seeking to develop new sources of fee income. As described below under “Securitizations,” in April 2010 we sold or delegated our collateral management rights and responsibilities relating to eight unconsolidated Taberna securitizations which will reduce our collateral management fees for managing securitizations going forward. We are seeking to enhance our fee income through management fees generated by our multi-family property management subsidiary, Jupiter Communities, LLC, and commissions and other fees generated by our broker/dealer subsidiary, RAIT Securities, LLC, as well as other potential new businesses. We may also generate fee income by developing arrangements with third parties to originate commercial real estate investments.
Key Statistics
Set forth below are key statistics relating to our business through June 30, 2010 (dollars in thousands):
| As of or For the Three-Month Periods Ended | ||||||||||||||||||||
| June 30, 2010 |
March 31, 2010 |
December 31, 2009 |
September 30, 2009 |
June 30, 2009 |
||||||||||||||||
| Financial Statistics: |
||||||||||||||||||||
| Recourse debt maturing within 1-year |
$ | 9,919 | $ | 10,905 | $ | 24,390 | $ | 49,494 | $ | 49,494 | ||||||||||
| Assets under management (a) |
$ | 4,014,556 | $ | 9,911,824 | $ | 10,126,853 | $ | 10,374,491 | $ | 13,878,962 | ||||||||||
| Debt to equity |
2.7x | 2.8x | 3.0x | 3.3x | 7.4x | |||||||||||||||
| Total revenue |
$ | 37,137 | $ | 42,689 | $ | 38,475 | $ | 41,425 | $ | 57,831 | ||||||||||
| Earnings per share, diluted |
$ | 0.27 | $ | 0.41 | $ | 0.24 | $ | (0.38 | ) | $ | (4.43 | ) | ||||||||
| Commercial Real Estate (“CRE”) Loan Portfolio (b): |
||||||||||||||||||||
| Reported CRE Loans—unpaid principal |
$ | 1,288,466 | $ | 1,305,816 | $ | 1,360,811 | $ | 1,467,806 | $ | 1,538,077 | ||||||||||
| Non-accrual loans—unpaid principal |
$ | 131,377 | $ | 132,978 | $ | 171,372 | $ | 246,029 | $ | 171,809 | ||||||||||
| Non-accrual loans as a % of reported loans |
10.2 | % | 10.2 | % | 12.6 | % | 16.8 | % | 11.2 | % | ||||||||||
| Reserve for losses |
$ | 70,699 | $ | 68,850 | $ | 78,636 | $ | 77,647 | $ | 100,869 | ||||||||||
| Reserves as a % of non-accrual loans |
53.8 | % | 51.8 | % | 45.9 | % | 31.6 | % | 58.7 | % | ||||||||||
| Provision for losses |
$ | 7,644 | $ | 17,350 | $ | 22,500 | $ | 18,467 | $ | 19,575 | ||||||||||
| CRE Property Portfolio: |
||||||||||||||||||||
| Reported investments in real estate |
$ | 803,548 | $ | 795,952 | $ | 738,235 | $ | 645,484 | $ | 604,619 | ||||||||||
| Number of properties owned |
47 | 46 | 39 | 34 | 30 | |||||||||||||||
| Multifamily units owned |
7,893 | 7,893 | 6,967 | 6,367 | 5,550 | |||||||||||||||
| Office square feet owned |
1,732,626 | 1,550,401 | 1,350,177 | 1,035,435 | 1,035,435 | |||||||||||||||
| Retail square feet owned |
1,069,588 | 1,069,652 | 1,069,643 | 1,095,452 | 639,791 | |||||||||||||||
| Average physical occupancy data: |
||||||||||||||||||||
| Multifamily properties |
83.5 | % | 78.0 | % | 77.7 | % | 78.6 | % | 82.0 | % | ||||||||||
| Office properties |
55.5 | % | 54.2 | % | 41.5 | % | 49.7 | % | 49.2 | % | ||||||||||
| Retail properties |
58.7 | % | 60.1 | % | 61.7 | % | 60.4 | % | 43.8 | % | ||||||||||
| Total |
74.4 | % | 70.8 | % | 69.8 | % | 73.1 | % | 75.8 | % | ||||||||||
| (a) | On April 22, 2010 as a result of the sale of our collateral management rights and responsibilities relating to eight unconsolidated Taberna securitizations with $5.9 billion of assets to an affiliate of Fortress Investment Group, LLC, RAIT’s assets under management were reduced to $4.1 billion. |
| (b) | CRE Loan Portfolio includes commercial mortgages, mezzanine loans, and preferred equity interests only and does not include other loans. See Note 3-“Investments in Loans” in the Notes to Consolidated Financial Statements for information relating to all loans held by RAIT. |
2
Investors should read the Management’s Discussion and Analysis of Financial Condition and Results of Operations in our Annual Report on Form 10-K for the fiscal year ended December 31, 2009, or the Annual Report, for a detailed discussion of the following items:
| • | Credit, capital markets and liquidity risk. |
| • | Interest rate environment. |
| • | Prepayment rates. |
| • | Commercial real estate lack of liquidity and reduced performance. |
Our Investment Portfolio
Our consolidated investment portfolio is currently comprised of the following asset classes:
Commercial mortgages, mezzanine loans, other loans and preferred equity interests. We have originated senior long-term mortgage loans, short-term bridge loans, subordinated, or “mezzanine,” financing and preferred equity interests. Our financing is usually “non-recourse.” Non-recourse financing means we look primarily to the assets securing the payment of the loan, subject to certain standard exceptions. We may also engage in recourse financing by requiring personal guarantees from controlling persons of our borrowers. We also acquire existing commercial real estate loans held by banks, other institutional lenders or third-party investors. Where possible, we seek to maintain direct lending relationships with borrowers, as opposed to investing in loans controlled by third party lenders.
The tables below describe certain characteristics of our commercial mortgages, mezzanine loans, other loans and preferred equity interests as of June 30, 2010 (dollars in thousands):
| Book Value | Weighted- Average Coupon |
Range of Maturities | Number of Loans |
|||||||||||||
| Commercial Real Estate (CRE) Loans |
||||||||||||||||
| Commercial mortgages |
$ | 755,272 | 6.8 | % | Aug. 2010 to Dec. 2020 | 48 | ||||||||||
| Mezzanine loans |
427,734 | 9.2 | % | Aug. 2010 to Nov. 2038 | 119 | |||||||||||
| Preferred equity interests |
95,878 | 10.6 | % | Nov. 2011 to Sep. 2021 | 24 | |||||||||||
| Total CRE Loans |
1,278,884 | 7.9 | % | 191 | ||||||||||||
| Other loans |
109,968 | 5.0 | % | Aug. 2010 to Oct. 2016 | 7 | |||||||||||
| Total investments in loans |
$ | 1,388,852 | 7.7 | % | 198 | |||||||||||
Due to current economic conditions, we have limited capacity to originate new investments. However, we expect to focus on this asset class when economic conditions improve and as existing loans are repaid.
The charts below describe the property types and the geographic breakdown of our commercial mortgages, mezzanine loans, other loans, and preferred equity interests as of June 30, 2010:
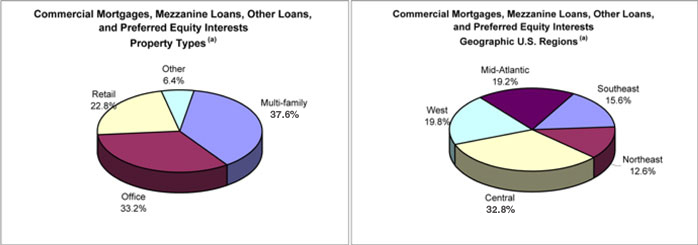
| (a) | Based on book value. |
See “Key Statistics-CRE Loan Portfolio” above for key statistics relating to this portfolio.
3
Investments in real estate. We generate a return on our real estate investments through rental income and other sources of income from the operations of the real estate underlying our investment. We also benefit from any increase in the value of the real estate in addition to current income. We finance our acquisitions of real estate through a combination of secured mortgage financing provided by financial institutions and existing financing provided by our two CRE loan securitizations. During the six-month period ended June 30, 2010, we acquired $52.7 million of real estate investments upon conversion of $64.0 million of commercial real estate loans, usually subject to retaining the existing financing provided by our two CRE loan securitizations.
The table below describes certain characteristics of our investments in real estate as of June 30, 2010 (dollars in thousands, except average effective rent):
| Investments in Real Estate (a) |
Average Physical Occupancy |
Units/ Square Feet/ Acres |
Number of Properties |
Average Effective Rent (b) |
||||||||||||||||
| Multi-family real estate properties (c) |
$ | 526,701 | 83.5 | % | 7,893 | 32 | $ | 714 | ||||||||||||
| Office real estate properties (d) |
218,207 | 55.5 | % | 1,732,626 | 10 | 18.46 | ||||||||||||||
| Retail real estate properties (d) |
36,432 | 58.7 | % | 1,069,588 | 2 | 10.20 | ||||||||||||||
| Parcels of land |
22,208 | — | 7.3 | 3 | — | |||||||||||||||
| Total |
$ | 803,548 | 74.4 | % | 47 | |||||||||||||||
| (a) | Investments in real estate include $74.7 million of assets held for sale as of June 30, 2010. |
| (b) | Based on operating performance for the six-month period ended June 30, 2010. |
| (c) | Average effective rent is rent per unit per month. |
| (d) | Average effective rent is rent per square foot per year. |
We expect to continue to protect or enhance our risk-adjusted returns by taking control of properties underlying our commercial real estate loans when restructuring or otherwise exercising our remedies regarding loans that become subject to increased credit risks.
The charts below describe the property types and the geographic breakdown of our investments in real estate as of June 30, 2010:
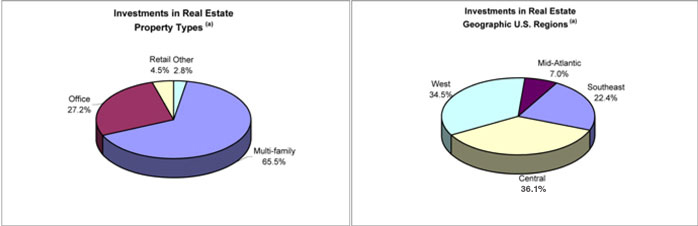
| (a) | Based on book value. |
See “Key Statistics-CRE Property Portfolio” above for key statistics relating to this portfolio.
Investment in debt securities. We have provided REITs and real estate operating companies the ability to raise subordinated debt capital through TruPS and subordinated debentures. TruPS are long-term instruments, with maturities ranging from 5 to 30 years, which are priced based on short-term variable rates, such as the three-month London Inter-Bank Offered Rate, or LIBOR. TruPS are unsecured and generally contain minimal financial and operating covenants. We financed most of our debt securities portfolio in a series of non-recourse securitizations which provided long-dated, interest-only, match funded financing to the TruPS and subordinated debenture investments. As of June 30, 2010, we retained a controlling interest in two securitizations—Taberna VIII and Taberna IX, which are consolidated entities. All of the collateral assets for the debt securities and the related non-recourse CDO financing obligations are presented at fair value in our reported results.
4
The table below describes our investment in TruPS and subordinated debentures as included in our consolidated financial statements as of June 30, 2010 (dollars in thousands):
| Issuer Statistics | ||||||||||||||||
| Industry Sector |
Estimated Fair Value |
Weighted- Average Coupon |
Weighted Average Ratio of Debt to Total Capitalization |
Weighted Average Interest Coverage Ratio |
||||||||||||
| Commercial Mortgage |
$ | 90,749 | 2.7 | % | 66.7 | % | 2.2 | x | ||||||||
| Office |
138,568 | 7.8 | % | 64.0 | % | 2.2 | x | |||||||||
| Residential Mortgage |
44,122 | 2.6 | % | 79.7 | % | (0.7 | )x | |||||||||
| Specialty Finance |
69,782 | 5.1 | % | 88.0 | % | 1.7 | x | |||||||||
| Homebuilders |
59,870 | 7.8 | % | 62.4 | % | 2.3 | x | |||||||||
| Retail |
72,557 | 4.0 | % | 84.6 | % | 1.7 | x | |||||||||
| Hospitality |
25,991 | 6.3 | % | 75.7 | % | 0.3 | x | |||||||||
| Storage |
23,957 | 8.0 | % | 59.9 | % | 3.9 | x | |||||||||
| Total |
$ | 525,596 | 5.2 | % | 72.0 | % | 1.8 | x | ||||||||
The chart below describes the equity capitalization of the issuers of the TruPS and subordinated debentures included in our consolidated financial statements as of June 30, 2010:
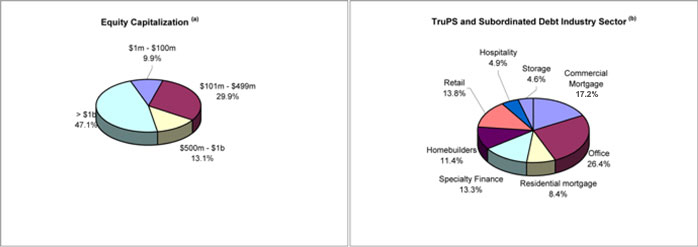
| (a) | Based on the most recent information available to management as provided by our TruPS issuers or through public filings. |
| (b) | Based on estimated fair value. |
We have invested, and expect to continue to invest, in CMBS, unsecured REIT notes and other real estate-related debt securities.
Unsecured REIT notes are publicly traded debentures issued by large public reporting REITs and other real estate companies. These debentures generally pay interest semi-annually. These companies are generally rated investment grade by one or more nationally recognized rating agencies.
CMBS generally are multi-class debt or pass-through certificates secured or backed by single loans or pools of mortgage loans on commercial real estate properties. Our CMBS investments may include loans and securities that are rated investment grade by one or more nationally-recognized rating agencies, as well as both unrated and non-investment grade loans and securities.
5
The table and the chart below describe certain characteristics of our real estate-related debt securities as of June 30, 2010 (dollars in thousands):
| Investment Description |
Estimated Fair Value |
Weighted- Average Coupon |
Weighted- Average Years to Maturity |
Book Value | ||||||||||||
| Unsecured REIT note receivables |
$ | 60,551 | 6.6 | % | 7.2 | $ | 61,000 | |||||||||
| CMBS receivables |
68,408 | 6.0 | % | 33.5 | 158,868 | |||||||||||
| Other securities |
27,260 | 2.9 | % | 32.3 | 119,503 | |||||||||||
| Total |
$ | 156,219 | 4.9 | % | 28.5 | $ | 339,371 | |||||||||
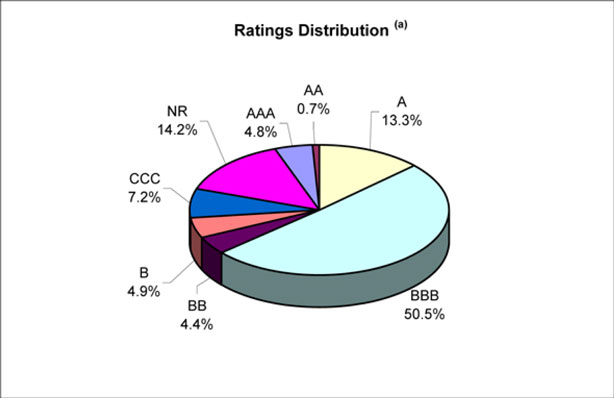
| (a) | S&P Ratings as of June 30, 2010. |
Securitization Summary
Overview. We have used securitizations, mainly through CDOs, to match fund the interest rates and maturities of our assets with the interest rates and maturities of the related financing. This strategy has helped us reduce interest rate and funding risks on our portfolio for the long-term. To finance our investments in the foreseeable future, management will seek to structure match funded financing through reinvesting asset repayments in our existing securitizations, loan participations, bank lines of credit, joint-venture opportunities and other methods that preserve our capital while making investments that generate an attractive return.
CDO Performance. Our CDOs contain interest coverage and overcollateralization triggers, or OC Triggers, that must be met in order for us to receive our subordinated management fees, return on our lower-rated debt and residual equity returns. If the interest coverage or OC Triggers are not met in a given period, then the cash flows are redirected from lower rated tranches and used to repay the principal amounts to the senior tranches of CDO notes payable. These conditions and the re-direction of cash flow continue until the triggers are met by curing the underlying payment defaults, paying down the CDO notes payable or other actions permitted under the relevant CDO indenture.
As of the most recent payment information, our Taberna I, Taberna VIII and Taberna IX CDO securitizations that we manage were not passing their required interest coverage or OC Triggers and we received only senior asset management fees. While events of default do not currently exist in the CDO securitizations that we manage, we are unable to predict with certainty which CDOs, in the future, will experience events of default or which, if any, remedies the appropriate note holders may seek to exercise in the future. All applicable interest coverage and OC Triggers continue to be met for our two commercial real estate CDOs, RAIT I and RAIT II, and we continue to receive all of our management fees, interest and residual returns from these CDOs.
6
Set forth below is a summary of the CDO investments in our consolidated securitizations as of the most recent payment information is as follows (dollars in millions):
| • | Taberna VIII—Taberna VIII has $670.1 million of total collateral, of which $121.1 million is defaulted. The current overcollateralization (O/C) test is failing at 87.0% with an O/C trigger of 103.5%. We have invested $133.0 million in this CDO. We do not expect to receive any distributions from this securitization other than our senior management fees for the foreseeable future. |
| • | Taberna IX—Taberna IX has $704.4 million of total collateral, of which $193.0 million is defaulted. The current O/C test is failing at 76.3% with an O/C trigger of 105.4%. We have invested $186.5 million in this CDO. We do not expect to receive any distributions from this securitization other than our senior management fees for the foreseeable future. |
| • | RAIT I—RAIT I has $1.0 billion of total collateral, of which $74.2 million is defaulted. The current O/C test is passing at 118.5% with an O/C trigger of 116.2%. We have invested $236.0 million in this CDO. We are currently receiving all distributions required by the terms of our retained interests in this securitization and are receiving all of our senior collateral management fees. |
| • | RAIT II—RAIT II has $814.7 million of total collateral, of which $25.4 million is defaulted. The current O/C test is passing at 114.0% with an O/C trigger of 111.7%. We have invested $234.7 million in this CDO. We are currently receiving all distributions required by the terms of our retained interests in this securitization and are receiving all of our senior collateral management fees. |
Generally, our investments in the subordinated notes and equity securities in our consolidated CDOs are subordinate in right of payment and in liquidation to the senior notes issued by the CDOs. We may also own common shares, or the non-economic residual interest, in certain of the entities above.
Assets Under Management
We use assets under management, or AUM, as a tool to measure our financial and operating performance. The following defines this measure and describes its relevance to our financial and operating performance:
Assets under management represents the total assets that we own or are managing for third parties. While not all AUM generates fee income, it is an important operating measure to gauge our asset growth, volume of originations, size and scale of our operations and our financial performance. AUM includes our total investment portfolio and assets associated with unconsolidated CDOs for which we derive asset management fees.
The table below summarizes our assets under management as of June 30, 2010 and December 31, 2009 (dollars in thousands):
| Assets Under Management at June 30, 2010 |
Assets Under Management at December 31, 2009 |
|||||||
| Commercial real estate portfolio (1) |
$ | 2,053,613 | $ | 2,084,685 | ||||
| European portfolio (2) |
— | 1,878,601 | ||||||
| U.S. TruPS portfolio (3) |
1,960,256 | 6,162,790 | ||||||
| Other investments |
687 | 777 | ||||||
| Total |
$ | 4,014,556 | $ | 10,126,853 | ||||
| (1) | As of June 30, 2010 and December 31, 2009, our commercial real estate portfolio was comprised of $1.2 billion and $1.2 billion, respectively, of assets collateralizing RAIT I and RAIT II, $803.5 million and $738.2 million, respectively, of investments in real estate and $70.2 million and $106.6 million, respectively, of commercial mortgages, mezzanine loans and preferred equity interests that were not securitized. |
| (2) | Our European portfolio as of December 31, 2009 was comprised of assets collateralizing Taberna Europe I and Taberna Europe II. On April 22, 2010 as a result of the sale of our collateral management rights and responsibilities relating to eight unconsolidated Taberna securitizations to an affiliate of Fortress Investment Group, LLC, RAIT’s assets under management were reduced by $5.9 billion. |
| (3) | Our U.S. TruPS portfolio as of December 31, 2009 was comprised of assets collateralizing Taberna I through Taberna IX, and includes TruPS and subordinated debentures, unsecured REIT note receivables, CMBS receivables, other securities, commercial mortgages and mezzanine loans. On April 22, 2010 as a result of the sale of our collateral management rights and responsibilities relating to eight unconsolidated Taberna securitizations to an affiliate of Fortress Investment Group, LLC, RAIT’s assets under management were reduced by $5.9 billion. |
7
REIT Taxable Income
To qualify as a REIT, we are required to make annual distributions to our shareholders in an amount at least equal to 90% of our REIT taxable income, determined without regard to the deduction for dividends paid and excluding net capital gains. In addition, to avoid certain U.S. federal excise taxes, we are required to make distributions to our shareholders in an amount at least equal to 90% of our REIT taxable income for each year. Because we expect to make distributions based on the foregoing requirements, and not based on our earnings computed in accordance with GAAP, we expect that our distributions may at times be more or less than our reported earnings as computed in accordance with GAAP.
Our board of trustees monitors RAIT’s REIT taxable income, and under its policy, will determine dividends when a full year of REIT taxable income is available. The board intends to declare a dividend, if any, in at least the amount necessary to meet RAIT’s annual distribution requirements. The board will also consider the composition of any common dividends declared, including the option of paying a portion in cash and the balance in additional common shares. Generally, dividends payable in stock are not treated as dividends for purposes of the deduction for dividends, or as taxable dividends to the recipient. However, the Internal Revenue Service, in Revenue Procedure 2010-12, has given guidance with respect to certain stock distributions by publicly traded REITS. That Revenue Procedure applies to distributions made on or after January 1, 2008 and declared with respect to a taxable year ending on or before December 31, 2011. It provides that publicly-traded REITs can distribute stock (common shares in our case) to satisfy their REIT distribution requirements if stated conditions are met. These conditions include that at least 10% of the aggregate declared distributions be paid in cash and that the shareholders be permitted to elect whether to receive cash or stock, subject to the limit set by the REIT on the cash to be distributed in the aggregate to all shareholders. The board expects to continue to review and determine the dividends on RAIT’s preferred shares on a quarterly basis.
Total taxable income and REIT taxable income are non-GAAP financial measurements, and do not purport to be an alternative to reported net income determined in accordance with GAAP as a measure of operating performance or to cash flows from operating activities determined in accordance with GAAP as a measure of liquidity. Our total taxable income represents the aggregate amount of taxable income generated by us and by our domestic and foreign TRSs. REIT taxable income is calculated under U.S. federal tax laws in a manner that, in certain respects, differs from the calculation of net income pursuant to GAAP. REIT taxable income excludes the undistributed taxable income of our domestic TRSs, which is not included in REIT taxable income until distributed to us. Subject to TRS value limitations, there is no requirement that our domestic TRSs distribute their earnings to us. REIT taxable income, however, generally includes the taxable income of our foreign TRSs because we will generally be required to recognize and report our taxable income on a current basis. Since we are structured as a REIT and the Internal Revenue Code requires that we distribute substantially all of our net taxable income in the form of distributions to our shareholders, we believe that presenting the information management uses to calculate our net taxable income is useful to investors in understanding the amount of the minimum distributions that we must make to our shareholders so as to comply with the rules set forth in the Internal Revenue Code. Because not all companies use identical calculations, this presentation of total taxable income and REIT taxable income may not be comparable to other similarly titled measures as determined and reported by other companies.
8
The table below reconciles the differences between reported net income (loss) total taxable income (loss) and estimated REIT taxable income (loss) for the three-month and six-month periods ended June 30, 2010 and 2009 (dollars in thousands):
| For the Three-Month Periods Ended June 30 |
For the Six-Month Periods Ended June 30 |
|||||||||||||||
| 2010 | 2009 | 2010 | 2009 | |||||||||||||
| Net income (loss), as reported |
$ | 25,376 | $ | (289,261 | ) | $ | 59,829 | $ | (437,675 | ) | ||||||
| Add (deduct): |
||||||||||||||||
| Provision for losses |
7,644 | 66,096 | 24,994 | 185,600 | ||||||||||||
| Charge-offs on allowance for losses |
(5,795 | ) | (53,831 | ) | (32,931 | ) | (119,256 | ) | ||||||||
| Domestic TRS book-to-total taxable income differences: |
||||||||||||||||
| Income tax (benefit) provision |
96 | 693 | 143 | 657 | ||||||||||||
| Stock compensation, forfeitures and other temporary tax differences |
— | 423 | 98 | (934 | ) | |||||||||||
| Capital loss carry-forward offsetting capital gains |
(7,938 | ) | — | (7,938 | ) | — | ||||||||||
| Asset impairments |
— | 46,015 | — | 46,015 | ||||||||||||
| Capital losses not offsetting capital gains and other temporary tax differences |
— | 313,808 | — | 313,808 | ||||||||||||
| Change in fair value of financial instruments, net of noncontrolling interests (1) |
(4,446 | ) | (100,157 | ) | (20,883 | ) | (13,810 | ) | ||||||||
| Amortization of intangible assets |
168 | 352 | 523 | 667 | ||||||||||||
| CDO investments aggregate book-to-taxable income differences (2) |
(12,431 | ) | (18,436 | ) | (26,303 | ) | (37,555 | ) | ||||||||
| Accretion of (premiums) discounts |
— | (106 | ) | — | (211 | ) | ||||||||||
| Other book to tax differences |
859 | (1,076 | ) | 2,632 | 57 | |||||||||||
| Total taxable income (loss) |
3,533 | (35,480 | ) | 164 | (62,637 | ) | ||||||||||
| Less: Taxable income attributable to domestic TRS entities |
2,912 | (5,654 | ) | 1,846 | (6,641 | ) | ||||||||||
| Plus: Dividends paid by domestic TRS entities |
3,500 | 5,000 | 8,500 | 5,000 | ||||||||||||
| Less: Deductible preferred dividends |
(3,415 | ) | (3,415 | ) | (6,821 | ) | (6,821 | ) | ||||||||
| Estimated REIT taxable income (loss)(3) |
$ | 6,530 | $ | (39,549 | ) | $ | 3,689 | $ | (71,099 | ) | ||||||
| (1) | Change in fair value of financial instruments is reported net of allocation to noncontrolling interests of $(8,800) and $(22,258) for the three-month and six-month periods ended June 30, 2009, respectively. |
| (2) | Amounts reflect the aggregate book-to-taxable income differences and are primarily comprised of (a) unrealized gains on interest rate hedges within CDO entities that Taberna consolidated, (b) amortization of original issue discounts and debt issuance costs and (c) differences in tax year-ends between Taberna and its CDO investments. |
| (3) | As of December 31, 2009, RAIT has an estimated tax net operating loss carry-forward of approximately $19.0 million that may be used to offset its REIT taxable income in the future. |
Results of Operations
Three-Month Period Ended June 30, 2010 Compared to the Three-Month Period Ended June 30, 2009
Revenue
Investment interest income. Investment interest income decreased $91.2 million, or 70.0%, to $39.2 million for the three-month period ended June 30, 2010 from $130.4 million for the three-month period ended June 30, 2009. This net decrease was primarily attributable to decreases in interest income of: $33.0 million resulting from the disposition of the Taberna III, Taberna IV, Taberna VI and Taberna VII securitizations in June 2009 and $48.0 million resulting from the disposition of the residential mortgage portfolio in July 2009. The remaining decrease primarily resulted from $391.5 million in total principal amount of investments on non-accrual status as of June 30, 2010 compared to $299.9 million as of June 30, 2009, $237.8 million of commercial real estate loans that were converted to owned real estate since June 30, 2009 and the reduction in short-term LIBOR of approximately 0.3% during the three-month period ended June 30, 2010 compared to the three-month period ended June 30, 2009.
Investment interest expense. Investment interest expense decreased $68.7 million, or 74.7%, to $23.2 million for the three-month period ended June 30, 2010 from $91.9 million for the three-month period ended June 30, 2009. This net decrease was primarily attributable to decreases in interest expense of: $18.6 million resulting from the disposition of the Taberna III, Taberna IV, Taberna VI and Taberna VII securitizations in June 2009 and $44.2 million resulting from the disposition of the residential mortgage portfolio in July 2009. The remaining decrease is primarily attributable to repurchases of $172.8 million of our convertible senior notes since June 30, 2009, net of additional interest cost incurred for the issuance of new debt instruments associated therewith, and the effect on our floating rate indebtedness from the reduction in short-term LIBOR of approximately 0.3% during the three-month period ended June 30, 2010 compared to the three-month period ended June 30, 2009.
9
Rental income. Rental income increased $7.1 million, or 67.0%, to $17.7 million for the three-month period ended June 30, 2010 from $10.6 million for the three-month period ended June 30, 2009. This increase was primarily attributable to: $4.9 million resulting from 13 new properties, with direct real estate investments of $201.9 million, acquired or consolidated since June 30, 2009, $0.5 million resulting from a full quarter of operations at seven properties acquired or consolidated during the three-month period ended June 30, 2009 and $1.7 million resulting from increased occupancy at properties acquired or consolidated prior to April 1, 2009. Occupancy increased 3.4% to 78.5% as of June 30, 2010 from 75.1% as of June 30, 2009 for properties acquired or consolidated prior to April 1, 2009.
Fee and other income. Fee and other income decreased $5.2 million, or 59.5%, to $3.5 million for the three-month period ended June 30, 2010 from $8.7 million for the three-month period ended June 30, 2009. Fee income from our restructuring advisory services decreased $4.5 million for the three-month period ended June 30, 2010 compared to the three-month period ended June 30, 2009 and asset management fees decreased $1.4 million due to the sale or delegation of our collateral management rights and responsibilities relating to eight Taberna securitizations during April 2010. We generated $0.8 million of riskless principal trade income through our broker-dealer during the three-month period ended June 30, 2010.
Expenses
Real estate operating expense. Real estate operating expense increased $4.9 million, or 49.4%, to $14.8 million for the three-month period ended June 30, 2010 from $9.9 million for the three-month period ended June 30, 2009. This increase was primarily attributable to: $4.4 million resulting from 13 new properties, with direct real estate investments of $201.9 million, acquired or consolidated since June 30, 2009, $0.2 million resulting from a full three months of operations at seven properties acquired or consolidated during the three-month period ended June 30, 2009 and $0.3 million of higher operating expenses from properties acquired or consolidated prior to April 1, 2009.
Compensation expense. Compensation expense increased $0.9 million, or 14.3%, to $6.9 million for the three-month period ended June 30, 2010 from $6.0 million for the three-month period ended June 30, 2009. This increase was primarily due to an increase of $0.5 million of compensation costs associated with the property management activities that were acquired in May 2009 and $0.9 million due to the expansion of our broker-dealer and advisory activities offset by $0.5 million of lower bonus expense.
General and administrative expense. General and administrative expense increased $0.1 million, or 1.8%, to $5.4 million for the three-month period ended June 30, 2010 from $5.3 million for the three-month period ended June 30, 2009. This increase is primarily due to our property management activities that we acquired in May 2009 and the expansion of our broker-dealer and advisory activities.
Provision for losses. The provision for losses relates to our investments in our commercial mortgage loan and residential mortgage portfolios. The provision for losses decreased by $58.5 million, or 88.4%, to $7.6 million for the three-month period ended June 30, 2010 from $66.1 million for the three-month period ended June 30, 2009. This decrease was primarily attributable to $38.8 million of provision for losses related to our residential mortgage portfolio during the three-month period ended June 30, 2009 which was disposed during July 2009. Subsequent to June 30, 2009, we have transitioned 14 loans to real estate owned properties, with direct real estate investments of $207.5 million, including one property that was sold and one property held for sale, and realized losses of $30.3 million when these loans were converted from impaired loans to owned real estate. While we believe we have properly reserved for the probable losses in our portfolio, we continually monitor our portfolio for evidence of loss and accrue additional provisions for loan losses as circumstances or conditions change.
Asset impairments. For the three-month period ended June 30, 2009, we recorded asset impairments totaling $46.0 million that were associated with available-for-sale securities for which we did not elect the fair value option. In making this determination, management considered the estimated fair value of the investments in relation to our cost bases, the financial condition of the related entity and our intent and ability to hold the investments for a sufficient period of time to recover our investments. For the identified investments, management believes full recovery is not likely and wrote down the investments to their current recovery value, or estimated fair value.
Depreciation expense. Depreciation expense increased $1.8 million, or 36.0%, to $6.8 million for the three-month period ended June 30, 2010 from $5.0 million for the three-month period ended June 30, 2009. This increase was primarily attributable to 13 new properties, with direct real estate investments of $201.9 million, acquired or consolidated since June 30, 2009 as well as increased depreciation of furniture and fixtures we added since June 30, 2009.
Amortization of intangible assets. Intangible amortization represents the amortization of intangible assets acquired from Taberna on December 11, 2006 and Jupiter Communities on May 1, 2009. Amortization expense decreased $0.2 million, or 52.3%, to $0.2 million for the three-month period ended June 30, 2010 from $0.4 million for the three-month period ended June 30, 2009. This decrease resulted from a $6.2 million charge-off to net intangible assets in connection with the sale or delegation of our collateral management rights and responsibilities relating to eight Taberna securitizations during April 2010.
10
Other Income (Expense)
Gains (losses) on sale of assets. Gains on sale of assets were $7.7 million during the three-month period ended June 30, 2010. The gains on sale of assets are primarily attributable to the sale or delegation of our collateral management rights and responsibilities relating to eight Taberna securitizations to an affiliate of certain funds managed by an affiliate of Fortress Investment Group LLC for $16.5 million. These securitizations were not consolidated by us and were comprised of Taberna Preferred Funding II, Ltd. through Taberna Preferred Funding VII, Ltd., Taberna Europe CDO I, P.L.C., and Taberna Europe CDO II, P.L.C. This transaction generated a $7.9 million gain on sale of assets.
Gains on extinguishment of debt. Gains on extinguishment of debt during the three-month period ended June 30, 2010 are attributable to the repurchase of $20.0 million in aggregate principal amount of convertible senior notes and $13.5 million in aggregate principal amount of CDO notes payable. The aggregate debt was repurchased from the market for 5,040,000 of our common shares and $4.7 million of cash. As a result of these repurchases, we recorded gains on extinguishment of debt of $17.2 million.
Losses on deconsolidation of VIEs. Losses on deconsolidation of VIEs are attributable to the deconsolidation of the Taberna III, Taberna IV, Taberna VI and Taberna VII securitizations. On June 25, 2009, we sold all of our equity interests and a portion of our non-investment grade debt that we owned in these four securitizations and concluded that we are no longer the primary beneficiary of the securitizations and, therefore, we deconsolidated the securitizations in accordance with FASB ASC Topic 810, “Consolidation”. We recorded losses on deconsolidation of VIEs of $313.8 million for the three-month period ended June 30, 2009.
Change in fair value of financial instruments. The change in fair value of financial instruments pertains to the majority of our assets within our investments in securities and any related CDO notes payable and derivative instruments used to finance such assets. During the three-month periods ended June 30, 2010 and 2009, the fair value adjustments we recorded were as follows (dollars in thousands):
| Description |
For the Three-Month Period Ended June 30, 2010 |
For the Three-Month Period Ended June 30, 2009 |
||||||
| Change in fair value of trading securities and security-related receivables |
$ | 35,256 | $ | 8,651 | ||||
| Change in fair value of CDO notes payable, trust preferred obligations and other liabilities |
5,046 | 69,005 | ||||||
| Change in fair value of derivatives |
(35,856 | ) | 13,701 | |||||
| Change in fair value of financial instruments |
$ | 4,446 | $ | 91,357 | ||||
Discontinued operations. Income (loss) from discontinued operations increased $0.2 million to income of $0.5 million for the three-month period ended June 30, 2010 compared to income of $0.3 million for the three-month period ended June 30, 2009 primarily due to the timing of properties acquired, sold or deconsolidated during the respective periods.
Six-Month Period Ended June 30, 2010 Compared to the Six-Month Period Ended June 30, 2009
Revenue
Investment interest income. Investment interest income decreased $201.0 million, or 71.4%, to $80.5 million for the six-month period ended June 30, 2010 from $281.5 million for the six-month period ended June 30, 2009. This net decrease was primarily attributable to decreases in interest income of: $80.1 million resulting from the disposition of the Taberna III, Taberna IV, Taberna VI and Taberna VII securitizations in June 2009 and $97.9 million resulting from the disposition of the residential mortgage portfolio in July 2009. The remaining decrease primarily resulted from $391.5 million in total principal amount of investments on non-accrual status as of June 30, 2010 compared to $299.9 million as of June 30, 2009, $237.8 million of commercial real estate loans that were converted to owned real estate since June 30, 2009 and the reduction in short-term LIBOR of approximately 0.6% during the six-month period ended June 30, 2010 compared to the six-month period ended June 30, 2009.
Investment interest expense. Investment interest expense decreased $148.1 million, or 76.0%, to $46.8 million for the six-month period ended June 30, 2010 from $194.9 million for the six-month period ended June 30, 2009. This net decrease was primarily attributable to decreases in interest expense of: $43.6 million resulting from the disposition of the Taberna III, Taberna IV, Taberna VI and Taberna VII securitizations in June 2009 and $91.1 million resulting from the disposition of the residential mortgage portfolio in July 2009. The remaining decrease is primarily attributable to repurchases of $172.8 million of our convertible senior notes since June 30, 2009, net of additional interest cost incurred for the issuance of new debt instruments associated therewith, and the effect on our floating rate indebtedness from the reduction in short-term LIBOR of approximately 0.6% during the six-month period ended June 30, 2010 compared to the six-month period ended June 30, 2009.
11
Rental income. Rental income increased $14.3 million, or 73.3%, to $33.8 million for the six-month period ended June 30, 2010 from $19.5 million for the six-month period ended June 30, 2009. This increase was primarily attributable to: $8.8 million resulting from 13 new properties, with direct real estate investments of $201.9 million, acquired or consolidated since June 30, 2009, $3.5 million resulting from a full six months of operations in 2010 at 17 properties acquired or consolidated during the six-month period ended June 30, 2009 and $2.0 million resulting from increased occupancy at properties acquired or consolidated prior to January 1, 2009. Occupancy increased 1.2% to 79.2% as of June 30, 2010 from 78.0% as of June 30, 2009 for properties acquired or consolidated prior to January 1, 2009.
Fee and other income. Fee and other income increased $0.9 million, or 7.4%, to $12.4 million for the six-month period ended June 30, 2010 from $11.5 million for the six-month period ended June 30, 2009. Property management fees and reimbursement income associated with the property management activities that we acquired in May 2009 increased $1.9 million during the six-month period ended June 30, 2010 compared to the six-month period ended June 30, 2009. We generated $1.0 million of riskless principal trade income through our broker-dealer during the six-month period ended June 30, 2010. Fee income from our restructuring advisory services decreased $1.1 million for the six-month period ended June 30, 2010 compared to the six-month period ended June 30, 2009 and asset management fees decreased $0.9 million due to the sale or delegation of our collateral management rights and responsibilities relating to eight Taberna securitizations during April 2010.
Expenses
Real estate operating expense. Real estate operating expense increased $9.1 million, or 50.0%, to $27.3 million for the six-month period ended June 30, 2010 from $18.2 million for the six-month period ended June 30, 2009. This increase was primarily attributable to: $7.7 million resulting from 13 new properties, with direct real estate investments of $201.9 million, acquired or consolidated since June 30, 2009, $2.0 million resulting from a full six months of operations at 17 properties acquired or consolidated during the six-month period ended June 30, 2009 offset by $0.6 million of lower operating expenses from properties acquired or consolidated prior to January 1, 2009.
Compensation expense. Compensation expense increased $3.2 million, or 28.1%, to $14.9 million for the six-month period ended June 30, 2010 from $11.7 million for the six-month period ended June 30, 2009. This increase was primarily due to an increase of $2.4 million of compensation costs associated with the property management activities that were acquired in May 2009 and $1.6 million due to the expansion of our broker-dealer and advisory activities offset by $0.6 million of lower bonus expense.
General and administrative expense. General and administrative expense increased $0.8 million, or 7.6%, to $10.3 million for the six-month period ended June 30, 2010 from $9.5 million for the six-month period ended June 30, 2009. This increase is primarily due to our property management activities that we acquired in May 2009 and the expansion of our broker-dealer and advisory activities.
Provision for losses. The provision for losses relates to our investments in our commercial mortgage loan and residential mortgage portfolios. The provision for losses decreased by $160.6 million, or 86.5%, to $25.0 million for the six-month period ended June 30, 2010 from $185.6 million for the six-month period ended June 30, 2009. This decrease was primarily attributable to $96.7 million of provision for losses related to our residential mortgage portfolio during the six-month period ended June 30, 2009 which was disposed during July 2009. Subsequent to June 30, 2009, we have transitioned 14 loans to real estate owned properties, with direct real estate investments of $207.5 million, including one property that was sold and one property held for sale, and realized losses of $30.3 million when these loans were converted from impaired loans to owned real estate. While we believe we have properly reserved for the probable losses in our portfolio, we continually monitor our portfolio for evidence of loss and accrue additional provisions for loan losses as circumstances or conditions change.
Asset impairments. For the six-month period ended June 30, 2009, we recorded asset impairments totaling $46.0 million that were associated with certain investments in loans and available-for-sale securities for which we did not elect the fair value option. In making this determination, management considered the estimated fair value of the investments in relation to our cost bases, the financial condition of the related entity and our intent and ability to hold the investments for a sufficient period of time to recover our investments. For the identified investments, management believes full recovery is not likely and wrote down the investments to their current recovery value, or estimated fair value.
Depreciation expense. Depreciation expense increased $4.1 million, or 47.7%, to $12.7 million for the six-month period ended June 30, 2010 from $8.6 million for the six-month period ended June 30, 2009. This increase was primarily attributable to 13 new properties, with direct real estate investments of $201.9 million, acquired or consolidated since June 30, 2009 as well as increased depreciation of furniture and fixtures we added since June 30, 2009.
Amortization of intangible assets. Intangible amortization represents the amortization of intangible assets acquired from Taberna on December 11, 2006 and Jupiter Communities on May 1, 2009. Amortization expense decreased $0.2 million, or 21.6%, to $0.5 million for the six-month period ended June 30, 2010 from $0.7 million for the six-month period ended June 30, 2009. This decrease resulted from a $6.2 million charge-off to net intangible assets in connection with the sale of our collateral management rights in eight Taberna securitizations during April 2010.
12
Other Income (Expense)
Gains (losses) on sale of assets. Gains on sale of assets were $11.6 million during the six-month period ended June 30, 2010. The gains on sale of assets are primarily attributable to the sale or delegation of our collateral management rights and responsibilities relating to eight Taberna securitizations to an affiliate of certain funds managed by an affiliate of Fortress Investment Group LLC for $16.5 million. These securitizations were not consolidated by us and were comprised of Taberna Preferred Funding II, Ltd. through Taberna Preferred Funding VII, Ltd., Taberna Europe CDO I, P.L.C., and Taberna Europe CDO II, P.L.C. This transaction generated a $7.9 million gain on sale of assets. In addition, we disposed of $11.4 million in total principal amount of unsecured REIT note receivables in our CRE securitizations and recorded a gain of $3.8 million.
Gains on extinguishment of debt. Gains on extinguishment of debt during the six-month period ended June 30, 2010 are attributable to the repurchase of $74.5 million in aggregate principal amount of convertible senior notes and $16.5 million in aggregate principal amount of CDO notes payable. The aggregate debt was repurchased from the market for 8,190,000 of our common shares, the issuance of a $22.0 million senior secured convertible note and $12.0 million of cash. As a result of these repurchases, we recorded gains on extinguishment of debt of $37.0 million.
Losses on deconsolidation of VIEs. Losses on deconsolidation of VIEs are attributable to the deconsolidation of the Taberna III, Taberna IV, Taberna VI and Taberna VII securitizations. On June 25, 2009, we sold all of our equity interests and a portion of our non-investment grade debt that we owned in these four securitizations and concluded that we are no longer the primary beneficiary of the securitizations and, therefore, we deconsolidated the securitizations in accordance with FASB ASC Topic 810, “Consolidation”. We recorded losses on deconsolidation of VIEs of $313.8 million for the six-month period ended June 30, 2009.
Change in fair value of financial instruments. The change in fair value of financial instruments pertains to the majority of our assets within our investments in securities and any related CDO notes payable and derivative instruments used to finance such assets. During the six-month periods ended June 30, 2010 and 2009, the fair value adjustments we recorded were as follows (dollars in thousands):
| Description |
For the Six-Month Period Ended June 30, 2010 |
For
the Six-Month Period Ended June 30, 2009 |
||||||
| Change in fair value of trading securities and security-related receivables |
$ | 82,998 | $ | (182,036 | ) | |||
| Change in fair value of CDO notes payable, trust preferred obligations and other liabilities |
(8,445 | ) | 151,594 | |||||
| Change in fair value of derivatives |
(53,670 | ) | 21,994 | |||||
| Change in fair value of financial instruments |
$ | 20,883 | $ | (8,448 | ) | |||
Discontinued operations. Income (loss) from discontinued operations increased $2.2 million to income of $0.9 million for the six-month period ended June 30, 2010 compared to a loss of $1.3 million for the six-month period ended June 30, 2009 primarily due to the timing of properties acquired, sold or deconsolidated during the respective periods. Additionally, we recorded a gain of $0.3 million on a property that was sold in March 2010 and a $2.1 million loss on a VIE that was deconsolidated in March 2009.
Liquidity and Capital Resources
Liquidity is a measure of our ability to meet potential cash requirements, including ongoing commitments to repay borrowings, fund and maintain investments, pay distributions and other general business needs. The disruption in the credit markets has reduced our liquidity and capital resources, limited our ability to originate new investments and has generally increased the cost of any new sources of liquidity over historical levels. Due to current market conditions, the cash flow to us from a number of the securitizations we sponsored has been reduced or eliminated and we do not expect to sponsor new securitizations to provide us with long-term financing for the foreseeable future. We are seeking to expand our use of secured lines of credit while developing other financing resources that will permit us to originate or acquire new investments generating attractive returns while preserving our capital, such as loan participations and joint venture financing arrangements.
Our consolidated securitizations collateralized by U.S. commercial real estate loans, RAIT I and RAIT II, continue to perform and make distributions on our retained interests and pay us management fees. In addition, restricted cash in these securitizations from repayment of underlying loans and other sources can be used to make new investments held by those securitizations. RAIT I and RAIT II are our primary source of cash from our operations. While our consolidated securitizations collateralized by trust preferred securities, or TruPS, Taberna VIII and Taberna IX, are currently failing several of their respective over-collateralization tests, we
13
continue to receive our senior management fees from these securitizations. We continue to explore strategies to generate liquidity from our investments in real estate and our investments in debt securities as we seek to focus on our commercial real estate lending platform.
We believe our available cash and restricted cash balances, other financing arrangements, and cash flows from operations will be sufficient to fund our liquidity requirements for the next 12 months. Should our liquidity needs exceed our available sources of liquidity, we believe that our assets could be sold directly to raise additional cash. We may not be able to obtain additional financing when we desire to do so, or may not be able to obtain desired financing on terms and conditions acceptable to us. If we fail to obtain additional financing, our ability to maintain or grow our business will be constrained.
Our primary cash requirements are as follows:
| • | to make investments and fund the associated costs; |
| • | to repay our indebtedness, including repurchasing or retiring our debt before it becomes due; |
| • | to pay our expenses, including compensation to our employees; |
| • | to pay U.S. federal, state, and local taxes of our TRSs; |
| • | to repurchase our common shares; and |
| • | to distribute a minimum of 90% of our REIT taxable income and to make investments in a manner that enables us to maintain our qualification as a REIT. |
We intend to meet these liquidity requirements primarily through the following:
| • | the use of our cash and cash equivalent balances of $28.9 million as of June 30, 2010; |
| • | cash generated from operating activities, including net investment income from our investment portfolio, and fee income generated by our vertically integrated commercial real estate platform; |
| • | proceeds from the sales of assets; |
| • | proceeds from future borrowings; and |
| • | proceeds from future offerings of our common and preferred shares, including our COD sales agreement, SEDA and DRSPP Plan. |
Our two commercial real estate securitized financing arrangements, RAIT I and RAIT II, include a revolving credit option that allows us to repay the AAA rated debt tranches totaling $475.0 million as loan repayments occur, and then draw up to the available committed amounts through the fifth anniversary of each financing in 2011 and 2012. At June 30, 2010, these revolvers are fully utilized and have no additional capacity. We also have $58.6 million of restricted cash in RAIT I and RAIT II available to invest in qualifying commercial loans as of June 30, 2010, subject to $31.1 million of future funding commitments and borrowing requirements.
Cash Flows
As of June 30, 2010 and 2009, we maintained cash and cash equivalents of approximately $28.9 million and $40.9 million, respectively. Our cash and cash equivalents were generated from the following activities (dollars in thousands):
| For the Six-Month
Periods Ended June 30 |
||||||||
| 2010 | 2009 | |||||||
| Cash flow from operating activities |
$ | 2,839 | $ | 47,009 | ||||
| Cash flow from investing activities |
34,024 | 242,543 | ||||||
| Cash flow from financing activities |
(32,953 | ) | (276,1658 | ) | ||||
| Net change in cash and cash equivalents |
3,910 | 13,387 | ||||||
| Cash and cash equivalents at beginning of period |
25,034 | 27,463 | ||||||
| Cash and cash equivalents at end of period |
$ | 28,944 | $ | 40,850 | ||||
Our principal source of cash flow is historically from our investing activities. The cash inflow from our investing activities primarily resulted from $22.5 million in principal repayments on loans and investments during the six-month period ended June 30, 2010 as compared to $259.3 million during the six-month period ended June 30, 2009. In addition, we received $14.6 million during the six-month period ended June 30, 2010 for proceeds from the sale of other securities and $16.2 million in net proceeds from the sale of collateral management rights. We did not receive any proceeds from these investing activities during the six-month period ended June 30, 2009.
14
Our decreased cash inflow from operating activities is primarily due to the disposition of the Taberna III, Taberna IV, Taberna VI, and Taberna VII securitizations in June 2009 and from the disposition of the residential mortgage portfolio in July 2009.
The cash outflow from financing activities was driven by repurchases of convertible notes of $10.5 million, repayments on secured credit facilities and other indebtedness of $11.6 million, and repurchases of CDO notes payable of $8.2 million for the six-month periods ended June 30, 2010. These outflows were offset by proceeds from common share issuances of $4.4 million for the six-month period ended June 30, 2010. The improvement in our cash flow from financing activities during the six-month period ended June 30, 2010 as compared to the six-month period ended June 30, 2009 is primarily due to a reduction in the repayments on residential mortgage-backed securities, $223.3 million during the six-month period ended June 30, 2009, as we sold this portfolio in July 2009.
Capitalization
We maintain various forms of short-term and long-term financing arrangements. Generally, these financing agreements are collateralized by assets within CDOs or mortgage securitizations. The following table summarizes our total recourse and non-recourse indebtedness as of June 30, 2010:
| Description |
Unpaid Principal Balance |
Carrying Amount |
Weighted- Average Interest Rate |
Contractual Maturity | ||||||||||
| Recourse indebtedness: |
||||||||||||||
| Convertible senior notes (1) |
$ | 171,863 | $ | 171,632 | 6.9 | % | Apr. 2027 | |||||||
| Secured credit facilities |
41,036 | 41,036 | 4.7 | % | Feb. 2011 to Dec. 2011 | |||||||||
| Senior secured notes |
63,950 | 63,950 | 11.7 | % | Apr. 2014 | |||||||||
| Loans payable on real estate |
22,513 | 22,513 | 4.9 | % | Apr. 2012 to Sept. 2012 | |||||||||
| Junior subordinated notes, at fair value (2) |
38,052 | 17,003 | 9.2 | % | Dec. 2015 to Mar. 2035 | |||||||||
| Junior subordinated notes, at amortized cost |
25,100 | 25,100 | 7.7 | % | Apr. 2037 | |||||||||
| Total recourse indebtedness |
362,514 | 341,234 | 7.6 | % | ||||||||||
| Non-recourse indebtedness: |
||||||||||||||
| CDO notes payable, at amortized cost (3)(4) |
1,380,250 | 1,380,250 | 0.8 | % | 2045 to 2046 | |||||||||
| CDO notes payable, at fair value (2)(3)(5) |
1,178,663 | 148,604 | 1.0 | % | 2037 to 2038 | |||||||||
| Loans payable on real estate |
73,451 | 73,451 | 5.7 | % | Aug. 2010 to Aug. 2016 | |||||||||
| Total non-recourse indebtedness |
2,632,364 | 1,602,305 | 1.0 | % | ||||||||||
| Total indebtedness |
$ | 2,994,878 | $ | 1,943,539 | 1.8 | % | ||||||||
| (1) | Our convertible senior notes are redeemable, at the option of the holder, in April 2012, April 2017, and April 2022. |
| (2) | Relates to liabilities which we elected to record at fair value under FASB ASC Topic 825. |
| (3) | Excludes CDO notes payable purchased by us which are eliminated in consolidation. |
| (4) | Collateralized by $1.8 billion principal amount of commercial mortgages, mezzanine loans, other loans and preferred equity interests. These obligations were issued by separate legal entities and consequently the assets of the special purpose entities that collateralize these obligations are not available to our creditors. |
| (5) | Collateralized by $1.4 billion principal amount of investments in securities and security-related receivables and loans, before fair value adjustments. The fair value of these investments as of June 30, 2010 was $906.1 million. These obligations were issued by separate legal entities and consequently the assets of the special purpose entities that collateralize these obligations are not available to our creditors. |
Recourse indebtedness refers to indebtedness that is recourse to our general assets, including the loans payable on real estate that are guaranteed by RAIT or RAIT Partnership. As indicated in the table above, our consolidated financial statements include recourse indebtedness of $341.2 million as of June 30, 2010. Non-recourse indebtedness consists of indebtedness of consolidated VIEs (i.e. CDOs and other securitization vehicles) and loans payable on real estate which is recourse only to specific assets pledged as collateral to the lenders. The creditors of each consolidated VIE have no recourse to our general credit.
15
The current status or activity in our financing arrangements occurring as of or during the six-month period ended June 30, 2010 is as follows:
Recourse Indebtedness
Convertible senior notes. During the six-month period ended June 30, 2010, we repurchased $74.5 million in aggregate principal amount of our 6.875% Convertible Senior Notes due 2027, or the convertible senior notes, for a total consideration of $50.0 million. The purchase price consisted of $10.2 million in cash, the issuance of 8.2 million common shares, and the issuance of a $22.0 million 10.0% Senior Secured Convertible Note due April 2014, or the senior secured convertible note. See “Senior Secured Convertible Note” below. As a result of these transactions, we recorded gains on extinguishment of debt of $22.3 million, net of deferred financing costs and unamortized discounts that were written off.
On July 19, 2010, we repurchased $10.0 million in aggregate principal amount of our convertible senior notes for a total consideration consisting of the issuance of 3.3 million common shares and a cash payment of $0.5 million. We recorded a gain on the extinguishment of debt of $2.1 million, net of deferred financing costs and unamortized discounts that were written off.
Secured credit facilities. As of June 30, 2010, we have borrowed an aggregate amount of $41.0 million under three secured credit facilities, each with a different bank. All of our secured credit facilities are secured by designated commercial mortgages and mezzanine loans. As of June 30, 2010, the first secured credit facility had an unpaid principal balance of $20.9 million which is payable in December 2011 under the current terms of this facility. As of June 30, 2010, the second secured credit facility had an unpaid principal balance of $16.2 million which is payable in October 2011 under the current terms of this facility. As of June 30, 2010, the third secured credit facility had an unpaid principal balance of $4.0 million. We are amortizing this balance with monthly principal repayments of $0.5 million which will result in the full repayment of this credit facility by February 2011.
Senior secured convertible note. On March 25, 2010, pursuant to a securities exchange agreement, we acquired from a noteholder $47.0 million aggregate principal amount of our convertible senior notes for a total consideration of $31.2 million. The purchase price consisted of (a) our issuance of the $22.0 million senior secured convertible note, (b) 1.5 million common shares issued, and (c) $6.0 million in cash. The senior secured convertible note is convertible into our common shares at the option of the holder. The conversion price is $3.50 per common share and the senior secured convertible note may be converted at any time during its term. We also paid $1.4 million of accrued and unpaid interest on the convertible notes through March 25, 2010. The holder of the senior secured convertible note converted $1.1 million principal amount of the senior secured convertible note into 0.3 million common shares effective May 5, 2010.
The senior secured convertible note bears interest at a rate of 10.0% per year. Interest accrues from March 25, 2010 and will be payable quarterly in arrears on January 15, April 15, July 15 and October 15 of each year, beginning July 15, 2010. The senior secured convertible note matures on April 20, 2014 unless previously prepaid in accordance with its terms prior to such date. The senior secured convertible note is fully and unconditionally guaranteed by two wholly-owned subsidiaries of RAIT, or the guarantors: RAIT Asset Holdings III Member, LLC, or RAHM3, and RAIT Asset Holdings III, LLC, or RAH3. RAHM3 is the sole member of RAH3 and has pledged the equity of RAH3 to secure its guarantee. RAH3’s assets consist of certain CDO notes payable issued by RAIT’s consolidated securitization, RAIT Preferred Funding II, LTD.
The maturity date of the senior secured convertible note may be accelerated upon the occurrence of specified customary events of default, the satisfaction of any related notice provisions and the failure to remedy such event of default, where applicable. These events of default include: RAIT’s failure to pay any amount of principal or interest on the senior secured convertible note when due; the failure of RAIT or any guarantor to perform any obligation on its or their part in any transaction document; and events of bankruptcy, insolvency or reorganization affecting RAIT or any guarantor.
Non-Recourse Indebtedness
CDO notes payable, at amortized cost. CDO notes payable at amortized cost represent notes issued by consolidated CDO entities which are used to finance the acquisition of unsecured REIT notes, CMBS securities, commercial mortgages, mezzanine loans, and other loans in our commercial real estate portfolio. Generally, CDO notes payable are comprised of various classes of notes payable, with each class bearing interest at variable or fixed rates. Both of our CRE CDOs are meeting all of their interest coverage and OC Trigger tests as of June 30, 2010.
During the six-month period ended June 30, 2010, we repurchased, from the market, a total of $16.5 million in aggregate principal amount of CDO notes payable issued by RAIT II. The aggregate purchase price was $1.8 million and we recorded a gain on extinguishment of debt of $14.7 million.
CDO notes payable, at fair value. Both of our Taberna consolidated CDOs are failing OC Trigger tests which cause a change to the priority of payments to the debt and equity holders of the respective securitizations. Upon the failure of an OC Trigger test, the indenture of each CDO requires cash flows that would otherwise have been distributed to us as equity distributions, or in some cases interest payments on our retained CDO notes payable, to be used to pay down sequentially the outstanding principal balance of the most senior note holders. The OC Trigger test failures are due to defaulted collateral assets and credit risk securities. During the six-month period ended June 30, 2010, $6.4 million of cash flows were re-directed from our retained interests in these CDOs and were used to repay the most senior holders of our CDO notes payable.
16
Equity Financing.
Preferred Shares
On January 26, 2010, our board of trustees declared first quarter 2010 cash dividends of $0.484375 per share on our 7.75% Series A Preferred Shares, $0.5234375 per share on our 8.375% Series B Preferred Shares and $0.5546875 per share on our 8.875% Series C Preferred Shares. The dividends were paid on March 31, 2010 to holders of record on March 1, 2010 and totaled $3.4 million.
On April 22, 2010, our board of trustees declared second quarter 2010 cash dividends of $0.484375 per share on our 7.75% Series A Preferred Shares, $0.5234375 per share on our 8.375% Series B Preferred Shares and $0.5546875 per share on our 8.875% Series C Preferred Shares. The dividends were paid on June 30, 2010 to holders of record on June 1, 2010 and totaled $3.4 million.
On July 27, 2010, our board of trustees declared third quarter 2010 cash dividends of $0.484375 per share on our 7.75% Series A Preferred Shares, $0.5234375 per share on our 8.375% Series B Preferred Shares and $0.5546875 per share on our 8.875% Series C Preferred Shares. The dividends will be paid on September 30, 2010 to holders of record on September 1, 2010.
Common Shares
- Share Repurchases
On January 26, 2010, the compensation committee approved a cash payment to the Board’s eight non-management trustees intended to constitute a portion of their respective 2010 annual non-management trustee compensation. The cash payment was subject to terms and conditions set forth in a letter agreement, or the letter agreement, between each of the non-management trustees and RAIT. The terms and conditions included a requirement that each trustee use a portion of the cash payment to purchase RAIT’s common shares in purchases that, individually and in the aggregate with all purchases made by all the other non-management trustees pursuant to their respective letter agreements, complied with Rule 10b-18 promulgated under the Securities Exchange Act of 1934, as amended. The aggregate amount required to be used by all of the non-management trustees to purchase common shares is $0.2 million.
-Equity Compensation
On January 26, 2010, the compensation committee awarded 1.5 million phantom units, valued at $1.9 million using our closing stock price of $1.27 on that date, to our executive officers. Half of these awards vested immediately and the remainder vests in one year. On January 26, 2010, the compensation committee awarded 0.5 million phantom units, valued at $0.6 million using our closing stock price of $1.27 on that date, to our non-executive officer employees. These awards generally vest over three-year periods.
During the six-month period ended June 30, 2010, 73,425 phantom unit awards were redeemed for common shares. These phantom units were fully vested at the time of redemption.
-Share Issuances
During the six-month period ended June 30, 2010, we issued 8.2 million common shares, along with cash and the issuance of a senior secured convertible note, to repurchase $74.5 million of our convertible notes. On July 19, 2010, we repurchased $10.0 million in aggregate principal amount of our convertible senior notes for a total consideration consisting of the issuance of 3.3 million common shares and a cash payment of $0.5 million. See “Capitalization” above.
-DRSPP
We implemented an amended and restated dividend reinvestment and share purchase plan, or DRSPP, effective as of March 13, 2008, pursuant to which we have registered and reserved for issuance, in the aggregate, 18.8 million common shares. During the six-month period ended June 30, 2010, we issued a total of 1.9 million common shares pursuant to the DRSPP at a weighted-average price of $2.27 per share and we received $4.3 million of net proceeds. As of June 30, 2010, 11.7 million common shares, in aggregate, remain available for issuance under the DRSPP.
-SEDA
On January 13, 2010, we entered into a standby equity distribution agreement, or the SEDA, with YA Global Master SPV Ltd., or YA Global, which is managed by Yorkville Advisors, LLC, whereby YA Global agreed to purchase up to $50.0 million, or the commitment amount, worth of newly issued RAIT common shares upon notices given by us, subject to the terms and conditions of the SEDA. The number of common shares issued or issuable pursuant to the SEDA, in the aggregate, cannot exceed 12.5 million common shares. The SEDA terminates automatically on the earlier of January 13, 2012 or the date YA Global has purchased $50.0 million worth of common shares under the SEDA. During the three-month period ended June 30, 2010, 0.4 million common shares were issued pursuant to this arrangement at a price of $2.26 and we received $1.0 million of proceeds. In July 2010, 0.7 million common shares were issued pursuant to this arrangement at a price of $2.11 and we received $1.5 million of proceeds. After reflecting the common shares issued in July 2010, 11.3 million common shares, in the aggregate, remain available for issuance under the SEDA.
17
-Capital on Demand™ Sales Agreement
On August 6, 2010, we entered into a Capital on Demand™ Sales Agreement, or the COD sales agreement, with JonesTrading Institutional Services LLC, or JonesTrading, pursuant to which we may issue and sell up to 17,500,000 of our common shares from time to time through JonesTrading acting as agent and/or principal, subject to the terms and conditions of the COD sales agreement. As of the date of the filing of this quarterly report on Form 10-Q, no common shares have been issued pursuant to the COD sales agreement. See Part II-Item 5 “Other Information” for further description of the COD sales agreement.
Off-Balance Sheet Arrangements and Commitments
Not applicable.
Critical Accounting Estimates and Policies
Our Annual Report on Form 10-K for the year ended December 31, 2009 contains a discussion of our critical accounting policies. On January 1, 2010 we adopted several new accounting pronouncements and revised our accounting policies as described below. See Note 2 in our unaudited consolidated financial statements as of June 30, 2010. Management discusses our critical accounting policies and management’s judgments and estimates with our Audit Committee.
Recent Accounting Pronouncements
On January 1, 2010, we adopted accounting standards classified under FASB ASC Topic 860, “Transfers and Servicing”, and accounting standards classified under FASB ASC Topic 810, “Consolidation”. The accounting standard classified under FASB Topic 860 eliminates the concept of a QSPE, changes the requirements for derecognizing financial assets, and requires additional disclosures about transfers of financial assets, including securitization transactions and continuing involvement with transferred financial assets. The accounting standard classified under FASB Topic 810 changes the determination of when a VIE should be consolidated. Under this standard, the determination of whether to consolidate a VIE is based on the power to direct the activities of the VIE that most significantly impact the VIE’s economic performance together with either the obligation to absorb losses or the right to receive benefits that could be significant to the VIE, as well as the VIE’s purpose and design. The adoption of these standards did not have a material effect on our consolidated financial statements.
On January 1, 2010, we adopted Accounting Standards Update (ASU) No. 2010-06, “Fair Value Measurements and Disclosures (Topic 820): Improving Disclosures about Fair Value Measurements.” This accounting standard requires new disclosures for significant transfers in and out of Level 1 and 2 fair value measurements and requires a description of the reasons for the transfer. This accounting standard also updates existing disclosures by providing fair value measurement disclosures for each class of assets and liabilities and provides disclosures about the valuation techniques and inputs used to measure fair value for both recurring and nonrecurring fair value measurements. For Level 3 fair value measurements, new disclosures will require entities to present information separately for purchases, sales, issuances, and settlements; however, these disclosures are effective for fiscal years beginning after December 15, 2010, and for interim periods within those fiscal years. The adoption of this standard did not have a material effect on our consolidated financial statements and management is currently evaluating the impact the new Level 3 fair value measurement disclosures may have on our consolidated financial statements.
In July 2010, the FASB issued ASU No. 2010-20, “Receivables (Topic 310): Disclosures about the Credit Quality of Financing Receivables and the Allowance for Credit Losses.” This accounting standard update is to provide additional information to assist financial statement users in assessing an entity’s credit risk exposures and evaluating the adequacy of its allowance for credit losses. Existing disclosure guidance is amended to require an entity to provide a greater level of disaggregated information about the credit quality of its financing receivables and its allowance for credit losses and to disclose credit quality indicators, past due information, and modifications of its financing receivables. The disclosures as of the end of a reporting period are effective for interim and annual reporting periods ending on or after December 15, 2010. The disclosures about activity that occurs during a reporting period are effective for interim and annual reporting periods beginning on or after December 15, 2010. Management is currently evaluating the impact that this accounting standard update may have on our consolidated financial statements.
18