 www.raitft.com www.raitft.com A Diversified Real Estate Finance REIT FBR Capital Markets Fall Investor Conference December 2, 2008 Exhibit 99.1 |
 2
www.raitft.com www.raitft.com Forward Looking Disclosure and Use of Non- GAAP Financial Measures This document and the related presentation may contain forward-looking statements within
the meaning of the Private Securities Litigation Reform Act of 1995. These forward-looking statements include, but are not limited to, statements about RAIT
Financial Trust’s (“RAIT”) plans, objectives, expectations and intentions with respect to future operations, products and services and other statements that are not
historical facts. These forward-looking statements are based upon the current beliefs and expectations of RAIT's management and are inherently subject to significant
business, economic and competitive uncertainties and contingencies, many of which are difficult to predict and generally not within RAIT’s control. In addition,
these forward-looking statements are subject to assumptions with respect to future business strategies and decisions that are subject to change. Actual results may differ
materially from the anticipated results discussed in these forward-looking statements. The following factors, among others, could cause actual results to differ materially from
the anticipated results or other expectations expressed in the forward-looking statements: the risk factors discussed and identified in filings by RAIT with the
Securities and Exchange Commission; adverse market developments and credit losses have reduced, and may continue to reduce, the value of trust preferred securities (“
TruPS”), subordinated debentures and other debt instruments directly or indirectly held by RAIT; adverse market developments and credit losses have reduced, and
may continue to reduce, the value of other assets in RAIT’s investment portfolio; RAIT’s liquidity may be adversely affected by the reduced availability of
short-term and long-term financing, including a significant curtailment of the market for securities issued in securitizations and of the availability of repurchase
agreements and warehouse facilities; RAIT’s liquidity may be adversely affected by margin calls; RAIT may be unable to obtain adequate capital at attractive rates or
otherwise; payment delinquencies or failure to meet other collateral performance criteria in collateral underlying RAIT’s securitizations have restricted, and may
continue to restrict, RAIT’s ability to receive cash distributions from RAIT’s securitizations and have reduced, and may continue to reduce, the value of RAIT’s
interests in these securitizations; failure of credit rating agencies to confirm their previously issued credit ratings for debt securities issued in RAIT’s securitizations
seeking to go effective may restrict RAIT’s ability to receive cash distributions from those securitizations; covenants in RAIT’s financing arrangements may restrict
RAIT’s business operations; fluctuations in interest rates and related hedging activities against such interest rates may affect RAIT’s earnings and the value of RAIT’s
assets; borrowing costs may increase relative to the interest received on RAIT’s investments, thereby reducing RAIT’s net investment income; RAIT may be unable to
sponsor and sell securities issued in securitizations, and, even if RAIT is able to do so, RAIT may be unable to acquire eligible securities for securitization transactions on
favorable economic terms; RAIT may experience unexpected results arising from
litigation that is currently pending or may arise in the future; RAIT and RAIT’s subsidiary, Taberna Realty Finance Trust (“ Taberna”), may fail to maintain qualification as real estate investment trusts (“REITs”); RAIT and Taberna may
fail to maintain exemptions under the Investment Company Act of 1940; investment portfolios with geographic concentrations of residential mortgage loans could be adversely
affected by economic factors unique to such concentrations; the market value of
real estate that secures mortgage loans could diminish further due to factors outside of RAIT’s control; adverse governmental or regulatory policies may be enacted; management and other key personnel may be lost; competition from other REITs and
other specialty finance companies may increase; and general business and
economic conditions could impair the credit quality of our investments and reduce our ability to originate and finance investments. You are cautioned not to place undue reliance on these forward-looking statements,
which speak only as of the date of this presentation. All subsequent written and oral forward-looking statements attributable to RAIT or any person acting on its behalf
are expressly qualified in their entirety by the cautionary statements contained or referred to in this document and the related presentation. Except to the extent required
by applicable law or regulation, RAIT undertakes no obligation to update these
forward-looking statements to reflect events or circumstances after the date of this presentation or to reflect the occurrence of unanticipated events. This document contains, and the related presentation may contain, non-U.S. generally
accepted accounting principles (“GAAP”) financial measures. A reconciliation of these non-GAAP financial measures to the most directly comparable GAAP financial
measure is included in this document which is available on RAIT’s website at www.raitft.com. |
 3
www.raitft.com www.raitft.com RAIT is a specialty finance REIT that provides a comprehensive set of debt financing options
to the real estate industry, including investors in commercial real estate, REITs and real estate operating companies and their intermediaries, throughout the United States and Europe. RAIT manages and invests in commercial mortgages, including whole and mezzanine loans, commercial real estate
investments, preferred equity interests, residential mortgage loans, trust
preferred securities and subordinated debentures. RAIT generates income for
distribution from its portfolio of investments and assets under management.
Diversified Real Estate Finance REIT Assets under management at 9/30/08 - $14.3 billion Commercial real estate portfolio - $2.1 billion Residential mortgage securitized portfolio - $3.7 billion European portfolio –European real estate assets - $1.9 billion Domestic TruPS and subordinated debt - $6.5 billion Other investments - $0.7 million |
 4
www.raitft.com www.raitft.com Experienced Management Team OfficerPosition Betsy Z. Cohen Chairman of the Board Daniel G. Cohen Chief Executive Officer Scott F. Schaeffer President & Chief Operating Officer Jack E. Salmon Chief Financial Officer & Treasurer Ken R. Frappier Executive Vice President-Risk Management Raphael Licht Chief Legal Officer & Chief Administrative Officer James J. Sebra Senior Vice President & Chief Accounting Officer Plamen M. Mitrikov Executive Vice President – Asset Management (Europe) Samuel J. Greenblatt Executive Vice President, Director of Originations (CRE) |
 5
www.raitft.com www.raitft.com Current Business Conditions International recessionary market conditions Weak real estate markets Capital constraints Securitization market frozen Banks hesitant to lend Volatile capital markets |
 6
www.raitft.com www.raitft.com Business Strategy Position RAIT in the short term to take advantage of long term recovery in the face of challenging and unprecedented market conditions Continue to focus on: Generating adjusted earnings for our investors Originating new, risk-adjusted, good performing assets, and earning fees Enhancing cash flows from our investment portfolios Repositioning non-performing assets Maintain adequate liquidity by using financing strategies to preserve capital
|
 7
www.raitft.com www.raitft.com Looking Ahead…. Market opportunities Market dislocation = opportunities Risk-reward opportunities Strong management team Leverage experience, knowledge and business relationships Potential sources of capital Joint venture capital Opportunity funds Institutional capital Asset re-positioning Experience Strong platform |
 8
www.raitft.com www.raitft.com Portfolio Gross Cash Flow Performance (1) Quarterly cash flows may not be indicative of cash flows for subsequent quarterly or annual periods.
See “Forward-Looking Disclosure and Use of Non-GAAP Financial Measures” above
for risks and uncertainties that could cause our gross cash flow for subsequent quarterly or annual periods to differ materially from these amounts. (2) Our commercial real estate portfolio is comprised of $1.6 billion of assets collateralizing our commercial
real estate securitizations (the “CRE Securitizations”), $311.2 million of
investments in real estate interests and $240.3 million of commercial mortgages and mezzanine loans all of which are included on our consolidated balance sheet as of September 30, 2008. (3) Our European portfolio is comprised of residual interests in our unconsolidated European securitizations.
(4) Our U.S. TruPS portfolio is comprised of assets collateralizing our consolidated securitizations (other
than CRE Securitizations) and interests in our unconsolidated securitizations (other than our
European securitizations) and includes TruPS and subordinated debentures, unsecured REIT note
receivables, CMBS receivables, other securities, commercial mortgages and mezzanine loans. The following chart summarizes RAIT’s total assets under management at September 30, 2008 and quarterly gross cash flow by portfolio (excluding origination fees) for the three-month periods
ended March 31, 2008, June 30, 2008 and September 30, 2008 and for the nine-month period
ended September 30, 2008 (dollars in thousands): Gross Cash Flow Assets Under Management at September 30, 2008 Three -Month Period Ended March 31, 2008 (1) Three -Month Period Ended June 30, 2008 (1) Three -Month Period Ended September 30, 2008 (1) Nine-Month Period Ended September 30, 2008 (1) Commercial real estate portfolio (2) $ 2,104,833 $ 25,137 $ 27,760 $ 23,137 $ 76,034 Residential mortgage portfolio 3,694,875 5,104 4,958 4,778 14,840 European portfolio (3) 1,945,487 3,461 3,606 4,264 11,331 U.S. TruPS portfolio (4) 6,512,275 11,850 9,173 11,952 32,975 Other investments 720 349 252 210 811 Total $ 14,258,190 $ 45,901 $ 45,749 $ 44,341 $ 135,991 |
 9
www.raitft.com www.raitft.com Credit Performance Measures Note: As of 9/30/08 (1) Carrying value represents the value at which the respective asset class is recorded on our balance sheet
in accordance with GAAP. (2) Pertains to 13 loans with a $182.0 million aggregate unpaid principal balance. (3) Includes loans delinquent over 60 days, in foreclosure, bankrupt or real estate owned as of September 30,
2008. (4) Investments in securities are recorded at fair value in our
consolidated balance sheet in accordance with GAAP. The unpaid principal value of these
investments as of September 30, 2008 is $4.3 billion. The unpaid principal balance of the non-accrual investments in this category is $475.6 million, or 11.1% of the total unpaid principal balance. (5)
Loan loss reserves are not applicable for investments in securities and security
related receivables, including our investments in European, U.S. TruPS or other securities, as
these items are carried at fair value in our consolidated financial statements. The estimated fair value adjustment for our U.S. TruPS portfolio is recorded as a component of GAAP net income. The estimated fair value
adjustments for our investments in European securitizations and other securities are recorded
as a component of accumulated other comprehensive income within shareholders’ equity. A charge to GAAP net income is recorded only if an other than temporary impairment is identified within our
European portfolio or other investments. While RAIT believes the estimated fair values of
these asset classes are affected by any related credit quality issues, under GAAP, no separate loan loss reserve is established. Portfolio Carrying Value of Investments (1) # of Non- Accrual Investments Loans Carrying Value of Non- Accrual Investments Percentage of Asset Class(es) Loan Loss Reserves 9/30/2008 Commercial mortgages, mezzanine loans, investments in real estate interests and other loans 2,412,397 $ 11 146,315 $ 6.1% $ 46,250 (2) Residential mortgages and mortgage related receivables 3,680,672 435 169,734 (3) 4.6% 19,515 Investments in securities (4) (TruPS) 2,524,695 14 37,281 1.5% N/A (5) Total 8,617,764 $ 460 353,330 $ 4.1% 65,765 $ |
 10 www.raitft.com www.raitft.com $2.1 billion CRE assets under management at 9/30/08: - Originating and underwriting commercial real estate loans since 1998 - $55.6 million unused revolver capacity in CRE securitizations at 9/30/08 Programs: Commercial Mortgage Loan Program Senior whole loans, short-term bridge loans $5 million - $20 million Commercial Real Estate Profile Extensive origination platform: - referral network and repeat borrowers $186 million of loan originations for nine months ended September 30, 2008 Strong CRE credit history Asset repositioning expertise Q3 2008 Cash flow (1) ($ in thousands) Target Yields $23,137 14%-20% 1) Excludes loan origination fees during the quarter ended September 30, 2008
|
 11 www.raitft.com www.raitft.com Commercial Real Estate Portfolio: Loan Characteristics Property Types Geographic U.S. Regions Note: As of 9/30/08 ($ in thousands) Amortized Cost Weighted Average Coupon Number of Loans % of Total Loan Portfolio Commercial mortgages $ 1,423,744 7.7% 118 67.8% Mezzanine loans 502,560 10.4% 154 23.9% Other loans 174,879 6.1% 11 8.3% Total $ 2,101,183 8.2% 283 100% |
 12 www.raitft.com www.raitft.com Residential Mortgage Loan Portfolio Summary Geographic Distribution by State ($ in thousands) Portfolio by FICO Score (1) (2) Q3 2008 Cash Flow ($ in thousands) $4,778 Target Yields 6%-8% Carrying Amount at 03/31/08 Average Interest Rate Average Next Adjustmen Date Numbe of Loans % of Portfolio 3/1 ARM............................ $ 93,098 5.6% Nov. 2008 248 2.5% 5/1 ARM............................ 3,019,721 5.6% Sept. 2010 6,295 82.1% 7/1 ARM............................ 511,174 5.7% July 2012 1,127 13.9% 10/1 ARM .......................... 56,679 5.7% June 2015 67 1.5% Total ................................. $3,680,672 5.6% 7,737 100.0% |
 13 www.raitft.com www.raitft.com $1.9 billion unconsolidated European assets under management: - Managed portfolio - Generating fee income and investment yield European Portfolio Profile Note: As of 9/30/08 Credit: As of 9/30/08: - Experienced two defaults during the quarter - Expected $800,000 decrease in Q4 2008 cash flow Q3 2008 Cash Flow ($ in thousands) $4,264 |
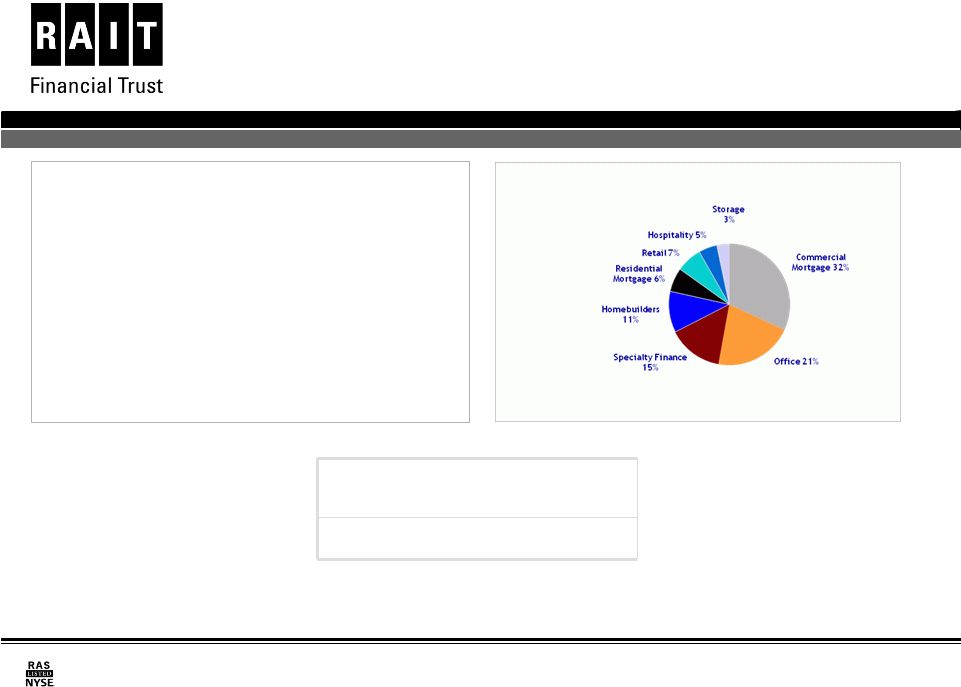 14 www.raitft.com www.raitft.com $6.5 billion assets under management - $2.5 billion – consolidated assets at fair value Fees: - Asset management fees Current market conditions - Assets and liabilities reported under fair value accounting in 2008. - No new production - Defaults in certain securitizations collateralized by TruPS has caused redirection of cash flow to prepay senior debt Domestic TruPS Profile Q3 2008 Cash Flow (1) ($ in thousands) $11,952 TruPS Issuer Types (1) Note: As of 9/30/08 (1) Based on estimated fair value |
 15 www.raitft.com www.raitft.com Liquidity & Capital Resources at 9/30/08 $38.4 million of cash on hand $55.6 million of unused capacity under our two commercial real estate securitizations $36.5 million of available capacity under existing commercial bank facilities No short term repurchase agreement margin call risk |
 16 www.raitft.com www.raitft.com Debt Capital Terms ($ in thousands) Note: As of 9/30/08 Description Unpaid Principal Balance Carrying Amount Interest Rate Terms Current Weighted- Average Interest Rate Contractual Maturity Secured credit facilities and other indebtedness ........ $ 207,182 $ 205,966 4.5% to 13.0% 6.9% Nov. 2008 to 2037 Mortgage -backed securities issued (1)(2)(3) .................. 3,464,774 3,438,431 4.6% to 5.8% 5.1% 2035 Trust preferred obligations (4) ...................................... 362,500 208,916 5.5% to 10.1% 7.0% 2035 CDO notes payable – amortized cost (1)(5) ................... 1,431,250 1,431,250 3.5% to 7.2% 3.9% 2036 to 2045 CDO notes payable – fair value (1)(4)(6) ........................ 3,615,691 841,546 3.1% to 10.0% 3.8% 2035 to 2038 Convertible senior notes ............................................. 404,000 404,000 6.9% 6.9% 2027 Total indebtedness ..................................................... $ 9,485,397 $ 6,530,109 4.6% (1) Excludes mortgage-backed securities and CDO notes payable purchased by us which are
eliminated in consolidation. (2) Collateralized by $3,694,874 principal amount of residential mortgages and
mortgage-related receivables. These obligations were issued by separate legal entities and consequently the assets of the special purpose entities that collateralize
these obligations are not available to our creditors. (3) Rates generally follow the terms of the underlying mortgages, which are fixed for a
period of time and variable thereafter. (4) Relates to liabilities for which we elected to record at fair value under SFAS
No.159. (5) Collateralized by $1,714,492 principal amount of commercial mortgages, mezzanine loans
and other loans. These obligations were issued by separate legal entities
and consequently the assets of the special purpose entities that collateralize these obligations are not available to our creditors. (6) Collateralized by $4,122,412 principal amount of investments in securities and
security-related receivables and loans, before fair value adjustments. The fair value of these investments as of September 30, 2008 was $2,583,272. These obligations were issued by separate legal entities and
consequently the assets of the special purpose entities that collateralize
these obligations are not available to our creditors. We maintain various forms of short-term and long-term financing arrangements.
Generally, these financing
agreements are collateralized by assets within CDOs or mortgage securitizations. The following table summarizes our
indebtedness as of September 30, 2008: |
 17 www.raitft.com www.raitft.com Selected GAAP Financial Data (1) Declared a $0.35 dividend per common share on October 10, 2008 payable December 5, 2008
to holders of record on October 31, 2008 2008 2007 2008 2007 Operating Data: Net investment income $ 37,390 $ 39,962 $ 111,567 $ 134,564 Total revenue 47,239 54,346 141,127 163,536 Total expenses 20,430 40,046 72,049 102,014 Change in fair value of financial instruments (302,245) — 50,661 — Asset impairments (18,038) (342,954) (38,361) (342,954) Net income (loss) available to common shares (181,690) (243,591) 62,876 (195,855) Earnings (loss) per share: Basic $ (2.83)
$ (4.02) $ 1.01 $ (3.23) Diluted $ (2.83)
$ (4.02) $ 1.01 $ (3.23) Common dividends declared per share(1) $
- $ 0.46 $ 0.92 $ 2.10 As of September 31, As of December 31, 2008 2007 Balance Sheet Data: Investments in mortgages and loans $ 5,706,273 $ 6,228,633 Investments in securities 2,524,695 3,827,800 Total assets 8,973,414 11,057,580 Total indebtedness 6,530,109 10,057,121 Total liabilities 6,930,087 10,476,735 Minority interest 361,875 1,602 Total shareholders’ 1,681,452 579,243 Book value per share $ 23.40 $ 6.78 Shares outstanding 64,783,126 61,018,231 As of and for the three months ended September 30, As of and for the nine months ended September 30, equity |
 18 www.raitft.com www.raitft.com Adjusted Earnings Reconciliation of Reported GAAP Net Income Available to Common Shares to Adjusted Earnings
(1) Performance Measures – Adjusted Earnings For the Three-Month For the Nine-Month 2008 2007 2008 2007 Net income (loss) available to common shares, as reported $ (181,690) $ (243,591) $ 62,876 $ (195,855) Add (deduct): Provision for losses 1 4,992 6,099 50,575 10,662 Depreciation expense 1,665 1,945 4,431 3,816 Amortization of intangible assets 2,883 17,473 16,048 46,051 (Gains) losses on sale of assets (2) (770) 7,569 (770) 10,329 (Gains) losses on extinguishment of debt — — (8,662) — Change in fair value of financial instruments, net of allocation to minority interest of $(118,303) and $(27,748) for the three-month and nine- month periods ended September 30, 2008, respectively 183,942 — (78,409) — Unrealized (gains) losses on interest rate hedges 290 3,122 275 2,605 Interest cost of hedges, net of allocation to minority interest of $3,850 and $10,201 for the three-month and nine-month periods ended September 30 , 2008, respectively (11,238) — 29,144 — Capital losses (3 ) — — 32,059 — Asset impairments, net of allocation to minority interest of $95,986 for the three -month and nine-month periods ended September 30, 2008 18,038 246,968 38,361 246,968 Share-based compensation 1, 237 3,016 5,535 8,753 rite-off of unamortized deferred financing costs — — — 2,985 Fee income deferred (recognized) 257 (5,263) 446 27,732 Deferred tax provision (benefit) 17 3,245 1,2 40 (15,445) Adjusted earnings $ 29,623 $ 40,583 $ 94,861 $ 148,601 eighted-average shares outstanding —Diluted 64,176,083 60, 664,698 62,492,475 60, 581,559 Adjusted earnings per diluted share $ 0. 46 $ 0. 67 $ 1.52 $ 2.45 W W Period Ended September Period Ended September 30 30 |
 19 www.raitft.com www.raitft.com Performance Measures – Adjusted Earnings (Continued) (1) We measure our performance using adjusted earnings in addition to GAAP net income (loss).
Adjusted earnings represents net income (loss) available to common shares, computed in accordance with GAAP, before provision for losses, depreciation expense,
amortization of intangible assets, (gains) losses on sale of assets, (gains) losses on extinguishment of debt, change in fair value of financial instruments, net of allocation to
minority interest, unrealized (gains) losses on interest rate hedges, interest cost of hedges, net of allocation to minority interest, capital (gains) losses, asset impairments,
net of allocation to minority interest, net (gains) losses on deconsolidation of VIEs, share-based compensation, write-off of unamortized deferred financing costs, fee
income deferred (recognized) and our deferred tax provision (benefit). These items are recorded in accordance with GAAP and are typically non-cash items that do not impact our
operating performance or dividend paying ability. Management views adjusted earnings as a useful and appropriate supplement to GAAP net income
(loss) because it helps us evaluate our performance without the effects of certain GAAP adjustments that may not have a direct financial impact on our current
operating performance and our dividend paying ability. We use adjusted earnings to evaluate the performance of our investment portfolios, our ability to generate fees, our
ability to manage our expenses and our dividend paying ability before the impact of non-cash adjustments recorded in accordance with GAAP. We believe this is a useful
performance measure for investors to evaluate these aspects of our business as well. The most significant adjustments we exclude in determining adjusted earnings are provision for
losses, amortization of intangible assets, change in fair value of financial instruments, capital (gains) losses, asset impairments and share-based compensation.
Management excludes all such items from its calculation of adjusted earnings because these items are not charges or losses which would impact our current operating performance
or dividend paying ability. By excluding these significant items, adjusted earnings reduces an investor’s understanding of our operating performance by excluding: (i)
management’s expectation of possible losses from our investment portfolio or non- performing assets that may impact future operating performance or dividend paying ability,
(ii) the allocation of non-cash costs of generating fee revenue during the periods in which we are receiving such revenue, and (iii) share-based compensation required to
retain and incentivize our management team. Adjusted earnings, as a non-GAAP financial measurement, does not purport to be an
alternative to net income (loss) determined in accordance with GAAP, or a measure of operating performance or cash flows from operating activities determined in accordance with
GAAP as a measure of liquidity. Instead, adjusted earnings should be reviewed in connection with net income (loss) and cash flows from operating, investing and financing
activities in our consolidated financial statements to help analyze management’s expectation of potential future losses from our investment portfolio and other non-cash
matters that impact our financial results. Adjusted earnings and other supplemental performance measures are defined in various ways throughout the REIT industry. Investors
should consider these differences when comparing our adjusted earnings to these other REITs. (2) During the nine-month period ended September 30, 2008, we revised our definition of
adjusted earnings to exclude capital (gains) losses and gains (losses) on sale of assets. Capital (gains) losses and gains (losses) on sale of assets, while economic gains or losses,
do not currently impact operating performance or dividend paying ability. This revision resulted in an increase of $7.6 million and $10.3 million to the computation of adjusted
earnings for the three-month and nine-month periods ended September 30, 2007, respectively. (3) During the nine-month period ended September 30, 2008, all of our warehouse arrangements
were terminated. We have recorded the estimated loss of our warehouse deposits as a component of the change in fair value of free-standing derivatives in our
consolidated statement of operations. |
 20 www.raitft.com www.raitft.com Performance Measures – Economic Book Value Economic Book Value (1) - We define Economic Book Value as shareholders’ equity, determined in accordance with GAAP, adjusted for the following items: liquidation value of preferred shares, unamortized intangible assets, goodwill,
and (gains) losses recognized in excess of our investments at risk. As of September 30, 2008 As of December 31, 2007 Amount Per Share (2) Amount Per Share (2) Shareholders’ equity, as reported .................................................................................
1,681,452 $ 25.95 $ 579,243 $ 9.49 Add (deduct): Liquidation value of preferred shares (3) .................................................................... (165,458) (2.55) (165,458) (2.71) Book Value .....................................................................................................................
1,515,994 23.40 413,785 6.78 Unamortized intangible assets ...................................................................................
(22,037) (0.34) (56,123) (0.92) Tangible Book Value (4) ..................................................................................................
1,493,957 23.06 357,662 5.86 Add (deduct): Unrealized (gains) losses recognized in excess of value at risk .. (600,032) (9.26) 284,002 4.66 Economic Book Value .....................................................................................................
$893,925 $ 13.80 $ 641,664 $ 10.52 $ ............................... (1) Management views economic book value as a useful and appropriate supplement to shareholders’ equity, book value and tangible book value per share. The measure serves as an additional measure of our value because it facilitates evaluation of us without the effects of
realized or unrealized (gains) losses on investments in excess of our total investment in that securitization, which is our maximum value at risk. Under GAAP, we record certain of our assets,
liabilities and derivatives of our consolidated entities, primarily our consolidated securitizations, at fair value. The net fair value adjustments recognized in our financial statements that reduced our total investment below zero are added back to shareholders’ equity in arriving at economic book value and the net fair value adjustments recognized in our financial statements that are in excess of our total investment are deducted from shareholders’ equity in arriving at economic book value. In performing these computations, we exclude the
impact of unrealized fair value adjustments associated with derivatives on economic book value. Economic book value is a non-GAAP financial measurement, and does not purport to be an alternative to reported shareholders’ equity, determined in accordance with GAAP, as a measure of book value. Economic book value should be reviewed in connection with shareholders’ equity as set forth in our consolidated balance sheets, to help analyze our value to investors. Economic book value is defined in various ways throughout the REIT industry. Investors
should consider these differences when comparing our economic book value to that of other REITs. We do not intend economic book value to represent the fair value of our retained interests in our securitizations or the fair value of our shareholders’ equity available to common shareholders. (2) Based on 64,783,126 and 61,018,231 common shares outstanding as of September 30, 2008 and
December 31, 2007, respectively. (3) Based on 2,760,000 Series A preferred shares, 2,258,300 Series B preferred shares, and 1,600,000 Series C preferred shares, all of which have a liquidation preference of $25.00 per share. (4) Tangible book value per share is calculated by subtracting the liquidation value of RAIT’s
cumulative redeemable preferred shares and net intangible assets from total shareholders’ equity and dividing the result by the number of common shares outstanding at the end of the
period. |
 21 www.raitft.com www.raitft.com Summary Position RAIT to take advantage of opportunities once market conditions improve and to maximize shareholder value over time Management is focused on: Monitoring credit performance of our portfolios Generating adjusted earnings Enhancing cash flows and liquidity |