Exhibit 99.1
![]()
FOR IMMEDIATE RELEASE
STONERIDGE REPORTS STRONG FOURTH-QUARTER AND FULL-YEAR 2016 RESULTS
2016 Results
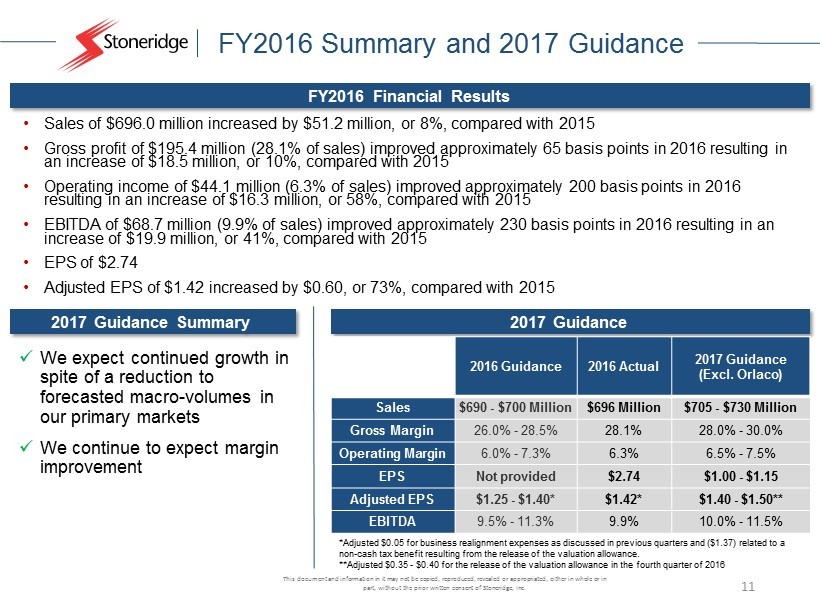
| · | Reports full-year 2016 earnings per diluted share from continuing operations attributable to Stoneridge, Inc. (“EPS”) of $2.74 |
| · | Full-year 2016 adjusted EPS of $1.42, increased by $0.60, or 73%, compared with 2015. Adjusted EPS excludes (i) benefit from the release of the valuation allowance on U.S. Federal, certain state and foreign deferred tax assets in the fourth quarter resulting in non-cash tax benefit of $1.37 in 2016, and (ii) ($0.05) related to business realignment expenses over the course of the year. |
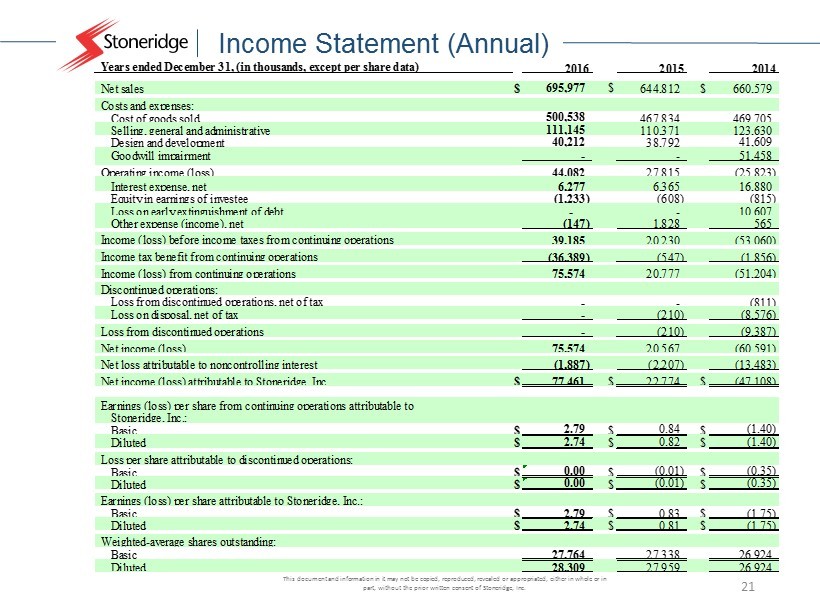
| · | Full-year sales of $696.0 million increased by $51.2 million, or 8%, compared with 2015 |
| · | Gross profit of $195.4 million (28.1% of sales) improved approximately 65 basis points in 2016 resulting in an increase of $18.5 million, or 10%, compared with 2015 |
| · | Operating income of $44.1 million (6.3% of sales) improved approximately 200 basis points in 2016 resulting in an increase of $16.3 million, or 58%, compared with 2015 |
| · | EBITDA of $68.7 million (9.9% of sales) improved approximately 230 basis points in 2016 resulting in an increase of $19.9 million, or 41%, compared with 2015 |
2017 Guidance (Excluding Orlaco Acquisition)
| · | Sales of $705 – $730 million compared with 2016 sales of $696.0 million (midpoint growth of 3.1%) |
| · | Gross margin of 28% – 30% (midpoint improvement of 90 basis points) |
| · | Operating margin of 6.5% – 7.5% (midpoint improvement of 70 basis points) |
| · | EBITDA margin of 10.0% – 11.5% (midpoint improvement of 85 basis points) |
| · | EPS of $1.00 – $1.15, including the impact of the release of the valuation allowance, which is expected to increase the Company’s effective tax rate to 30% to 35% and is estimated to have a non-cash EPS impact of $0.35 – $0.40 in 2017 |
| · | Adjusted EPS (excluding the release of the valuation allowance) of $1.40 – $1.50 compared with $1.42 in 2016 |
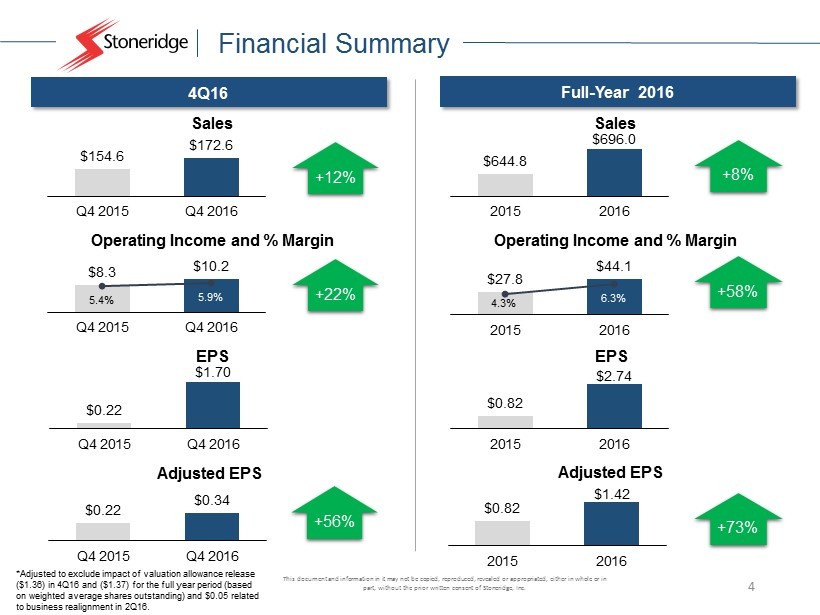
NOVI, Michigan – March 2, 2017 – Stoneridge, Inc. (NYSE: SRI) today announced financial results for the fourth quarter and full-year ended December 31, 2016, with full-year sales of $696.0 million and EPS of $2.74. Adjusted EPS was $1.42 for 2016, an increase of $0.60 per share, or 73%, compared with 2015. Sales in 2016 increased $51.2 million, or 8%, compared with 2015.
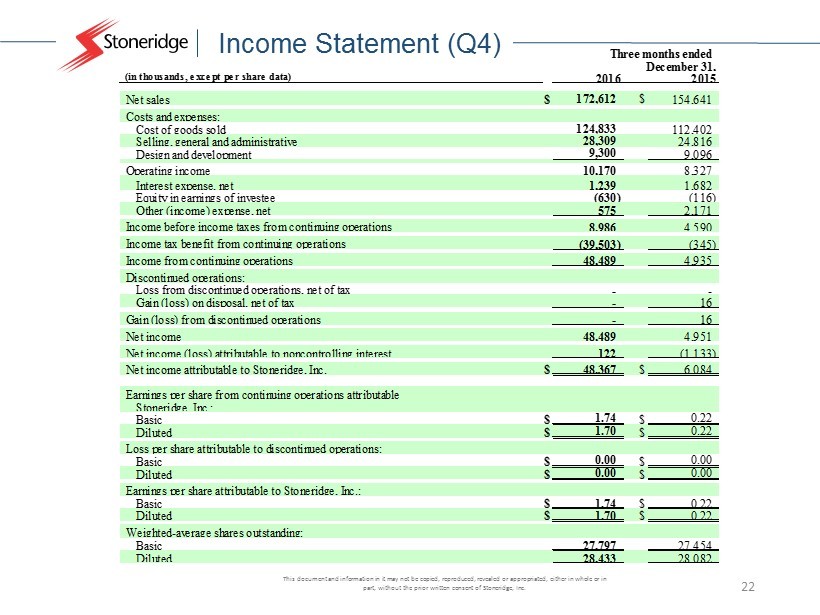
Fourth quarter 2016 sales were $172.6 million, an increase of 12% over fourth quarter 2015, with EPS of $1.70. Adjusted EPS was $0.34, an increase of $0.12, or 56%, over fourth quarter 2015.
For the full-year 2016 Stoneridge reported gross profit of $195.4 million (28.1% of sales), an improvement of approximately 65 basis points and $18.5 million, or 10%, over 2015. Operating income was $44.1 million (6.3% of sales), an improvement of approximately 200 basis points and $16.3 million, or 58%, over 2015. EBITDA was $68.7 million, (9.9% of net sales), an improvement of approximately 230 basis points, or 41%, over 2015.
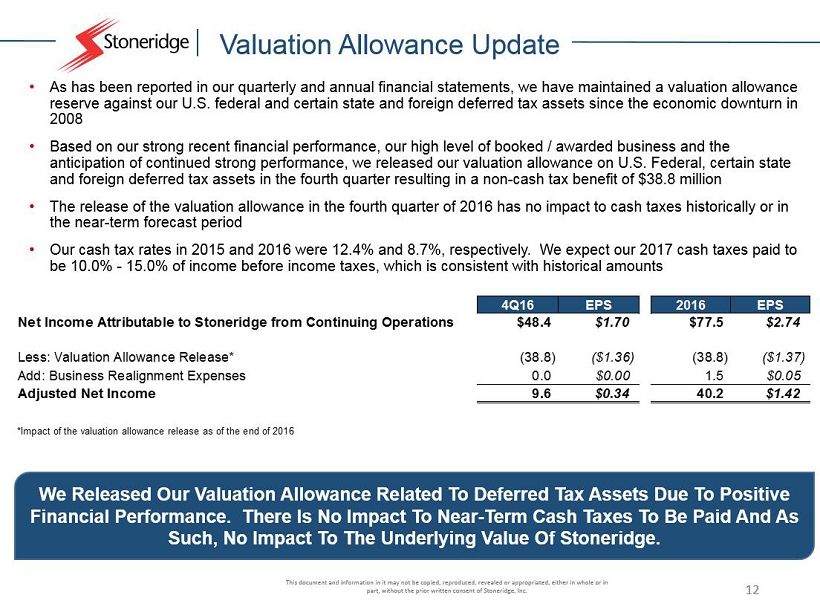
Stoneridge released the valuation allowance on U.S. Federal, certain state and foreign deferred tax assets in the fourth quarter of 2016 based on strong recent financial performance, a high level of booked awarded business and the anticipation of continued strong performance. The impact of the release of the valuation allowance in the fourth quarter of 2016 resulted in a non-cash tax benefit of $38.8 million for the full-year (additional EPS of $1.37 for the full-year based on weighted average shares outstanding and $1.36 for the fourth quarter of 2016). The release of the valuation allowance will not have an impact on historical or near-term forecasted cash taxes to be paid.
| 1 |
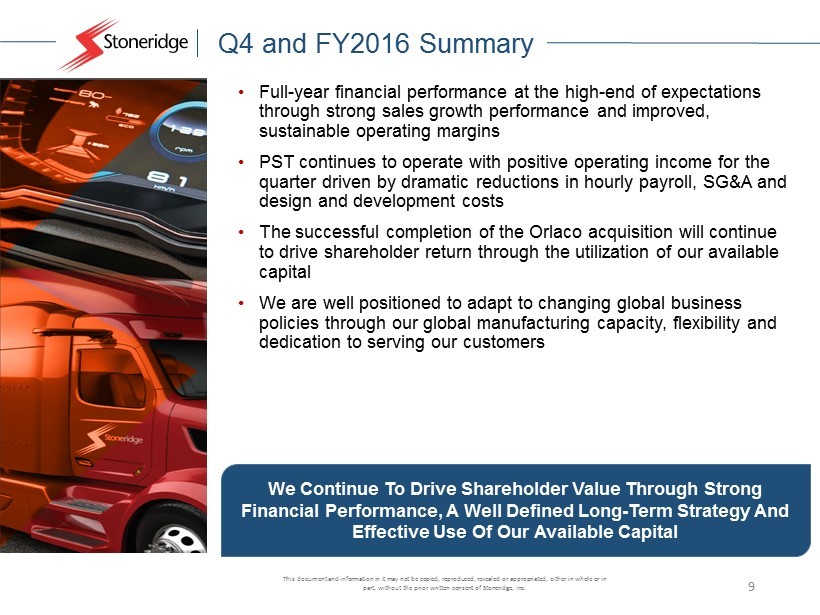
Jon DeGaynor, President and Chief Executive Officer, commented, “Strong financial performance through 2016 was supported by top-line growth that exceeds our underlying markets as well as the expansion of our margin through continued operating improvement. More specifically, we are pleased with the results of our shift-by-wire ramp-up in our Control Devices segment in 2016 as well as the improvement in our PST segment, which generated positive operating profit for the second consecutive quarter and continues to operate at sustainably profitable margins.”
Fourth Quarter and Full Year in Review
Net sales in 2016 increased by $51.2 million, or 8%, primarily due to higher sales at the Control Devices segment compared to 2015. Operating income in 2016 increased to $44.1 million from $27.8 million in 2015, driven by operating income improvement in each business segment.
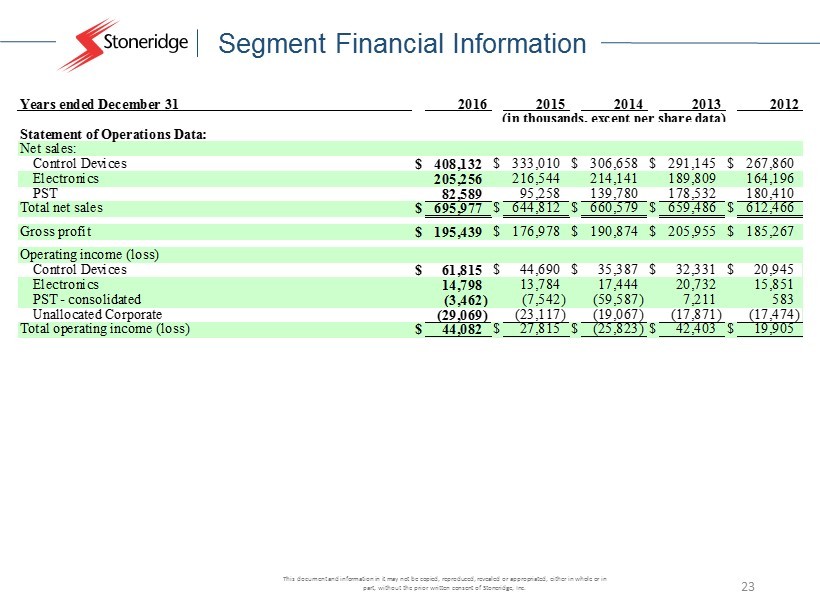
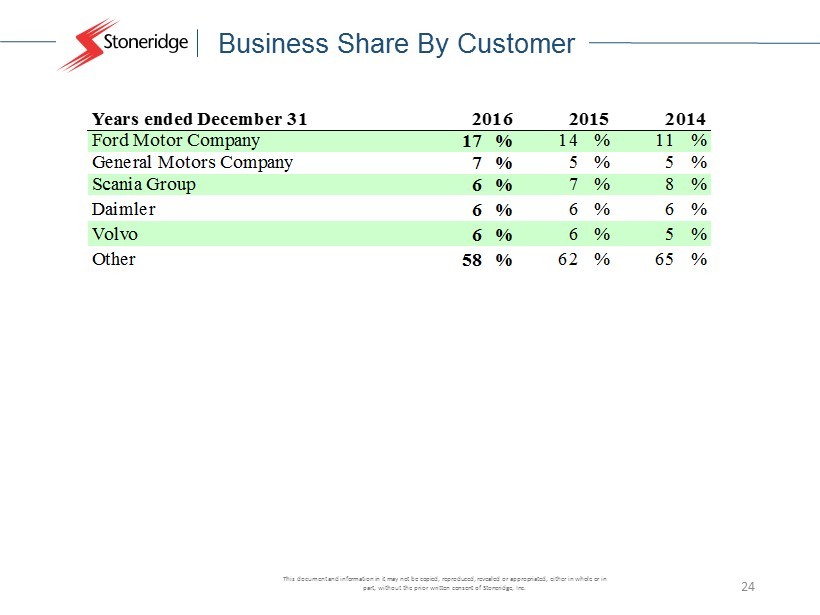
Control Devices net sales increased from $333.0 million in 2015 to $408.1 million in 2016 primarily due to new product sales and growth in the North American automotive market of $77.7 million and new program sales and increased sales volumes in the Chinese automotive market of $4.5 million. Control Devices operating income increased from $44.7 million in 2015 to $61.8 million in 2016 primarily due to the increase in sales volume.
The Electronics segment net sales decreased from $216.5 million in 2015 to $205.3 million in 2016 primarily due to a decrease in sales volume in North American commercial vehicle products of $11.9 million, an unfavorable foreign currency translation of $4.8 million, and a decrease in European off-highway vehicle product sales of $0.8 million, which were partially offset by an increase in European commercial vehicle product sales of $7.2 million. Electronics operating income increased from $13.8 million in 2015 to $14.8 million in 2016 due to a higher gross profit as material costs decreased due to favorable changes in foreign currency exchange rates and lower SG&A costs.
PST segment net sales decreased from $95.3 million in 2015 to $82.6 million in 2016 primarily due to lower product volume resulting from continued weakness in the Brazilian economy and automotive market and an unfavorable foreign currency translation, which reduced sales by $4.0 million, or 4.2%. PST’s operating performance improved due to lower material costs and structural cost reduction actions which lowered the break-even of the business by approximately 30%. The result was an operating loss of $3.5 million in 2016 relative to a $7.5 million operating loss in 2015. Notably, fourth quarter 2016 operating income was $0.7 million, or 3.2% of sales, compared with a loss of $1.7 million, or 7.8% of sales, in the fourth quarter of 2015.
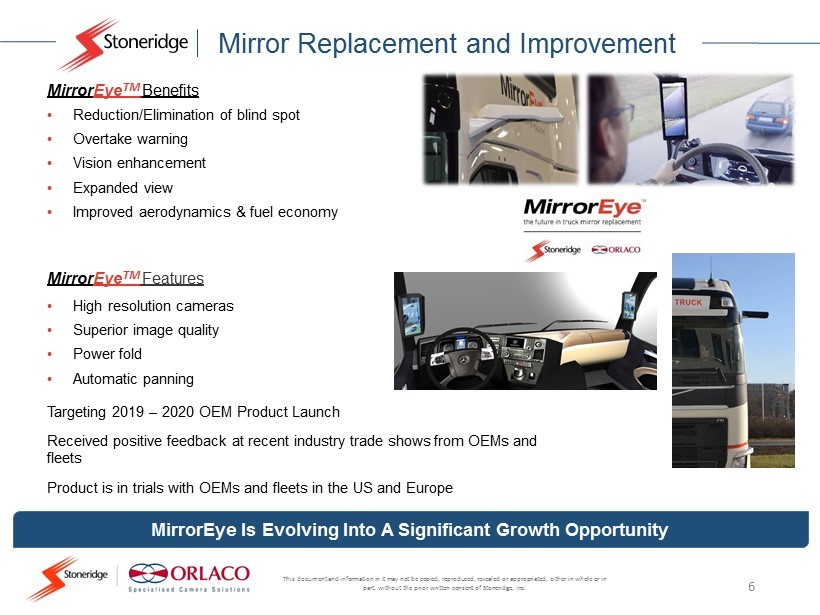
DeGaynor added, “I am pleased with our team’s performance this year in what I expect to be an inflection point for our Company. We completed our headquarters move from Warren, Ohio to Novi, Michigan to help deepen our customer relationships and position the Company for future growth. The headquarters move also facilitated our ability to continue to attract and retain talent within the organization. We have effected positive operational change throughout the Company to improve performance and leverage our sales growth. We have continued to drive our mission of higher content per vehicle and system-based solutions through our product development activities, including our MirrorEye and soot sensing products. We have made progress at PST in driving a sustainably profitable operating business, even in the face of economic headwinds in Brazil. I am confident that our progress during 2016 will provide us with a platform to drive future growth and capitalize on continued opportunities for the Company.”
Cash and Debt Balances
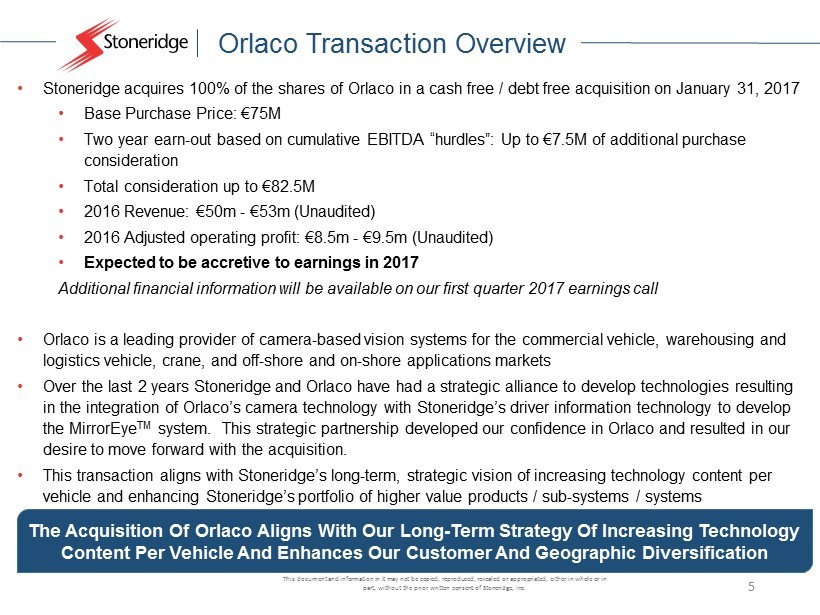
As of December 31, 2016, Stoneridge had cash and cash equivalent balances totaling $50.4 million. Total debt as of December 31, 2016, was $83.7 million, which excludes consideration paid for the Orlaco transaction which closed on January 31, 2017.
| 2 |
For 2016, Stoneridge generated $65.3 million of cash from operations, compared with $54.8 million for the previous year. Capital expenditures for the year were $24.5 million compared with $28.7 million in 2015. As a result of cash from operations less capital expenditures, free cash flow in 2016 was $40.8 million compared with $26.1 million in 2015. In 2016 Stoneridge repaid $33.0 million of debt outstanding related to our revolving credit facility.
DeGaynor added, “We have successfully converted our sales growth and margin expansion into free cash flow. This has allowed us to reduce our existing outstanding debt and subsequently take advantage of accretive acquisition opportunities, such as Orlaco. We expect Orlaco to provide significant growth opportunities at relatively high margins in the future, which will further advance our long-term strategy of increasing technology content per vehicle and enhancing Stoneridge’s portfolio of higher-value products and systems.”
2017 Outlook
The Company announces 2017 sales guidance of $705 – $730 million compared with 2016 sales of $696 million, which suggests midpoint growth of 3.1% compared with 2016.
Further, the Company announces 2017 gross margin guidance of 28% – 30% (midpoint improvement of 90 basis points compared with 2016), operating margin guidance of 6.5% – 7.5% (midpoint improvement of 70 basis points compared with 2016) and EBITDA margin guidance of 10.0% – 11.5% (midpoint improvement of 85 basis points compared with 2016).
The Company announces 2017 EPS guidance of $1.00 – $1.15, including the impact of the release of the valuation allowance, which is expected to increase the Company’s effective tax rate to 30% to 35% and is estimated to have a non-cash EPS impact of $0.35 – $0.40 in 2017.
Finally, the Company announces 2017 adjusted EPS guidance (excluding the release of the valuation allowance) of $1.40 – $1.50 compared with $1.42 in 2016.
2017 guidance excludes consideration of the recently announced acquisition of Orlaco. Guidance including the Orlaco acquisition will be provided on the first quarter call.
DeGaynor concluded, “We are pleased our guidance provides for revenue growth amplified by continued expansion of margin. While we expect some modest headwind related to forecasted vehicle volumes, we are confident that our operational efficiency and robust backlog will translate to another successful year for Stoneridge.”
Conference Call on the Web
A live Internet broadcast of Stoneridge’s conference call regarding 2016 fourth-quarter results can be accessed at 9:00 a.m. Eastern time on Thursday, March 2, 2017, at www.stoneridge.com, which will also offer a webcast replay.
About Stoneridge, Inc.
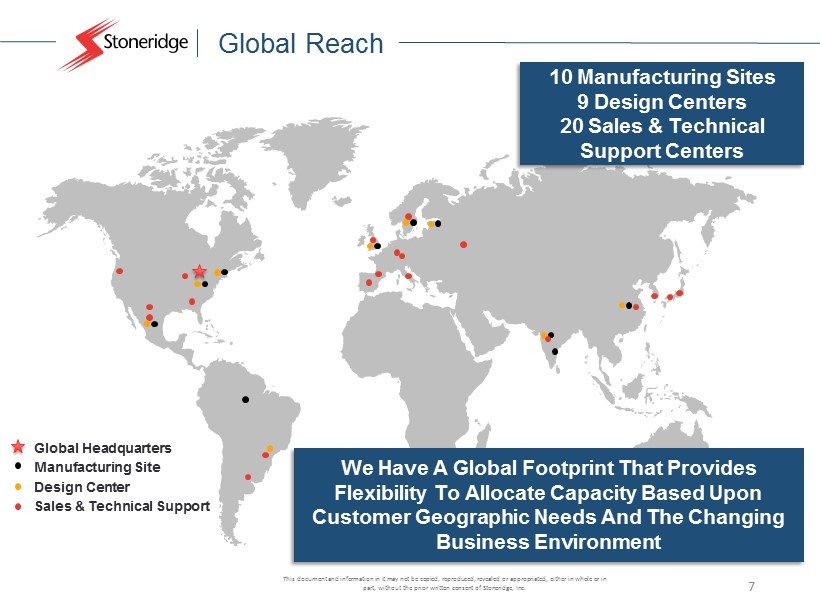
Stoneridge, Inc., headquartered in Novi, Michigan, is an independent designer and manufacturer of highly engineered electrical and electronic components, modules and systems principally for the automotive, commercial, motorcycle, agricultural and off-highway vehicle markets. Additional information about Stoneridge can be found at www.stoneridge.com.
| 3 |
Forward-Looking Statements
Statements in this release that are not historical fact are forward-looking statements which involve risks and uncertainties that could cause actual events or results to differ materially from those expressed or implied in this release. Things that may cause actual results to differ materially from those in the forward-looking statements include, among other factors, the loss of a major customer; a significant volume change in automotive, commercial, motorcycle, off-highway and agricultural vehicle production; disruption in the OEM supply chain due to bankruptcies; a significant change in general economic conditions in any of the various countries in which the Company operates; labor disruptions at the Company’s facilities or at any of the Company’s significant customers or suppliers; the ability of the Company’s suppliers to supply the Company with parts and components at competitive prices on a timely basis; customer acceptance of new products; and the failure to achieve successful integration of any acquired company or business, including Orlaco. In addition, this release contains time-sensitive information that reflects management’s best analysis only as of the date of this release. The Company does not undertake any obligation to publicly update or revise any forward-looking statements to reflect future events, information or circumstances that arise after the date of this release. Further information concerning issues that could materially affect financial performance related to forward-looking statements contained in this release can be found in the Company’s periodic filings with the Securities and Exchange Commission.
Use of Non-GAAP Financial Information
This press release contains information about Stoneridge's financial results which is not presented in accordance with accounting
principles generally accepted in the United States ("GAAP"). Such non-GAAP financial measures are reconciled to their
closest GAAP financial measures at the end of this press release. The provision of these non-GAAP financial measures for 2016 is
not intended to indicate that Stoneridge is explicitly or implicitly providing projections on those non-GAAP financial measures,
and actual results for such measures are likely to vary from those presented. The reconciliations include all information reasonably
available to the Company at the date of this press release and the adjustments that management can reasonably predict.
For more information, contact Matthew R. Horvath, Director Investor Relations and M&A (Matthew.Horvath@Stoneridge.com)
| 4 |
| CONSOLIDATED STATEMENTS OF OPERATIONS | ||||||||||||||||
| Three months ended | For the years ended | |||||||||||||||
| December 31, | December 31, | |||||||||||||||
| (in thousands, except per share data) | 2016 | 2015 | 2016 | 2015 | ||||||||||||
| Net sales | $ | 172,612 | $ | 154,641 | $ | 695,977 | $ | 644,812 | ||||||||
| Costs and expenses: | ||||||||||||||||
| Cost of goods sold | 124,833 | 112,402 | 500,538 | 467,834 | ||||||||||||
| Selling, general and administrative | 28,309 | 24,816 | 111,145 | 110,371 | ||||||||||||
| Design and development | 9,300 | 9,096 | 40,212 | 38,792 | ||||||||||||
| Operating income | 10,170 | 8,327 | 44,082 | 27,815 | ||||||||||||
| Interest expense, net | 1,239 | 1,682 | 6,277 | 6,365 | ||||||||||||
| Equity in earnings of investee | (630 | ) | (116 | ) | (1,233 | ) | (608 | ) | ||||||||
| Other (income) expense, net | 575 | 2,171 | (147 | ) | 1,828 | |||||||||||
| Income before income taxes from continuing operations | 8,986 | 4,590 | 39,185 | 20,230 | ||||||||||||
| Income tax benefit from continuing operations | (39,503 | ) | (345 | ) | (36,389 | ) | (547 | ) | ||||||||
| Income from continuing operations | 48,489 | 4,935 | 75,574 | 20,777 | ||||||||||||
| Discontinued operations: | ||||||||||||||||
| Loss from discontinued operations, net of tax | - | - | - | - | ||||||||||||
| Gain (loss) on disposal, net of tax | - | 16 | - | (210 | ) | |||||||||||
| Gain (loss) from discontinued operations | - | 16 | - | (210 | ) | |||||||||||
| Net income | 48,489 | 4,951 | 75,574 | 20,567 | ||||||||||||
| Net income (loss) attributable to noncontrolling interest | 122 | (1,133 | ) | (1,887 | ) | (2,207 | ) | |||||||||
| Net income attributable to Stoneridge, Inc. | $ | 48,367 | $ | 6,084 | $ | 77,461 | $ | 22,774 | ||||||||
| Earnings per share from continuing operations attributable | ||||||||||||||||
| Stoneridge, Inc.: | ||||||||||||||||
| Basic | $ | 1.74 | $ | 0.22 | $ | 2.79 | $ | 0.84 | ||||||||
| Diluted | $ | 1.70 | $ | 0.22 | $ | 2.74 | $ | 0.82 | ||||||||
| Loss per share attributable to discontinued operations: | ||||||||||||||||
| Basic | $ | 0.00 | $ | 0.00 | $ | 0.00 | $ | (0.01 | ) | |||||||
| Diluted | $ | 0.00 | $ | 0.00 | $ | 0.00 | $ | (0.01 | ) | |||||||
| Earnings per share attributable to Stoneridge, Inc.: | ||||||||||||||||
| Basic | $ | 1.74 | $ | 0.22 | $ | 2.79 | $ | 0.83 | ||||||||
| Diluted | $ | 1.70 | $ | 0.22 | $ | 2.74 | $ | 0.81 | ||||||||
| Weighted-average shares outstanding: | ||||||||||||||||
| Basic | 27,797 | 27,454 | 27,764 | 27,338 | ||||||||||||
| Diluted | 28,433 | 28,082 | 28,309 | 27,959 | ||||||||||||
| 5 |
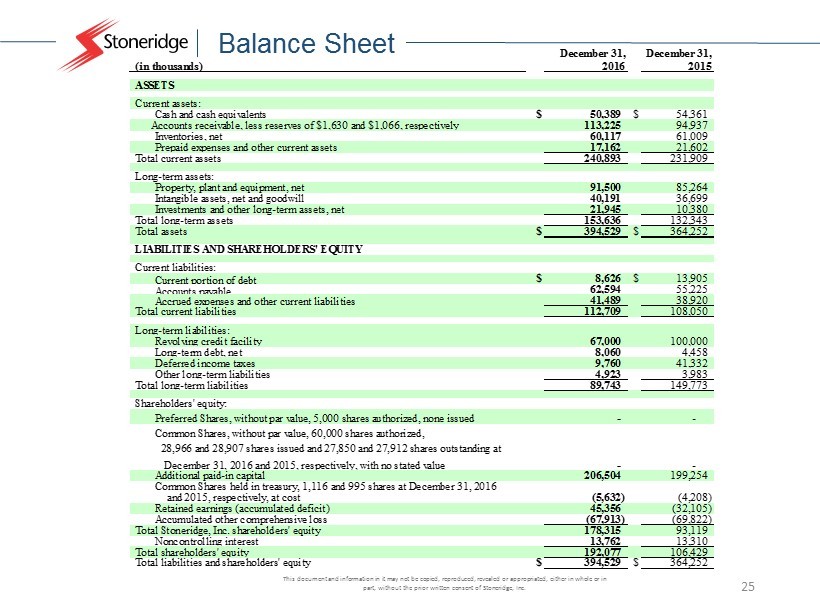
| CONSOLIDATED BALANCE SHEETS | ||||||||
| December 31, | December 31, | |||||||
| (in thousands) | 2016 | 2015 | ||||||
| ASSETS | ||||||||
| Current assets: | ||||||||
| Cash and cash equivalents | $ | 50,389 | $ | 54,361 | ||||
| Accounts receivable, less reserves of $1,630 and $1,066, respectively | 113,225 | 94,937 | ||||||
| Inventories, net | 60,117 | 61,009 | ||||||
| Prepaid expenses and other current assets | 17,162 | 21,602 | ||||||
| Total current assets | 240,893 | 231,909 | ||||||
| Long-term assets: | ||||||||
| Property, plant and equipment, net | 91,500 | 85,264 | ||||||
| Intangible assets, net and goodwill | 40,191 | 36,699 | ||||||
| Investments and other long-term assets, net | 21,945 | 10,380 | ||||||
| Total long-term assets | 153,636 | 132,343 | ||||||
| Total assets | $ | 394,529 | $ | 364,252 | ||||
| LIABILITIES AND SHAREHOLDERS' EQUITY | ||||||||
| Current liabilities: | ||||||||
| Current portion of debt | $ | 8,626 | $ | 13,905 | ||||
| Accounts payable | 62,594 | 55,225 | ||||||
| Accrued expenses and other current liabilities | 41,489 | 38,920 | ||||||
| Total current liabilities | 112,709 | 108,050 | ||||||
| Long-term liabilities: | ||||||||
| Revolving credit facility | 67,000 | 100,000 | ||||||
| Long-term debt, net | 8,060 | 4,458 | ||||||
| Deferred income taxes | 9,760 | 41,332 | ||||||
| Other long-term liabilities | 4,923 | 3,983 | ||||||
| Total long-term liabilities | 89,743 | 149,773 | ||||||
| Shareholders' equity: | ||||||||
| Preferred Shares, without par value, 5,000 shares authorized, none issued | - | - | ||||||
| Common Shares, without par value, 60,000 shares authorized, | ||||||||
| 28,966 and 28,907 shares issued and 27,850 and 27,912 shares outstanding at | ||||||||
| December 31, 2016 and 2015, respectively, with no stated value | - | - | ||||||
| Additional paid-in capital | 206,504 | 199,254 | ||||||
| Common Shares held in treasury, 1,116 and 995 shares at December 31, 2016 and | ||||||||
| 2015, respectively, at cost | (5,632 | ) | (4,208 | ) | ||||
| Retained earnings (accumulated deficit) | 45,356 | (32,105 | ) | |||||
| Accumulated other comprehensive loss | (67,913 | ) | (69,822 | ) | ||||
| Total Stoneridge, Inc. shareholders' equity | 178,315 | 93,119 | ||||||
| Noncontrolling interest | 13,762 | 13,310 | ||||||
| Total shareholders' equity | 192,077 | 106,429 | ||||||
| Total liabilities and shareholders' equity | $ | 394,529 | $ | 364,252 | ||||
| 6 |
| CONSOLIDATED STATEMENTS OF COMPREHENSIVE INCOME (LOSS) | ||||||||||||||||
| Three months ended | For the years ended | |||||||||||||||
| December 31, | December 31, | |||||||||||||||
| (in thousands) | 2016 | 2015 | 2016 | 2015 | ||||||||||||
| Net income | $ | 48,489 | $ | 4,651 | $ | 75,574 | $ | 20,567 | ||||||||
| Less: Net loss attributable to noncontrolling interest | 122 | (1,133 | ) | (1,887 | ) | (2,207 | ) | |||||||||
| Net income attributable to Stoneridge, Inc. | 48,367 | 6,084 | 77,461 | 22,774 | ||||||||||||
| Other comprehensive income (loss), net of tax attributable to | ||||||||||||||||
| Stoneridge, Inc.: | ||||||||||||||||
| Foreign currency translation | (3,522 | ) | (196 | ) | 2,401 | (24,693 | ) | |||||||||
| Benefit plan liability | - | - | (84 | ) | (45 | ) | ||||||||||
| Unrealized loss on derivatives | 65 | 418 | (408 | ) | 389 | |||||||||||
| Other comprehensive income (loss), net of tax attributable to | ||||||||||||||||
| Stoneridge, Inc. | (3,457 | ) | 222 | 1,909 | (24,349 | ) | ||||||||||
| Comprehensive income (loss) attributable to Stoneridge, Inc. | $ | 44,910 | $ | 6,306 | $ | 79,370 | $ | (1,575 | ) | |||||||
| 7 |
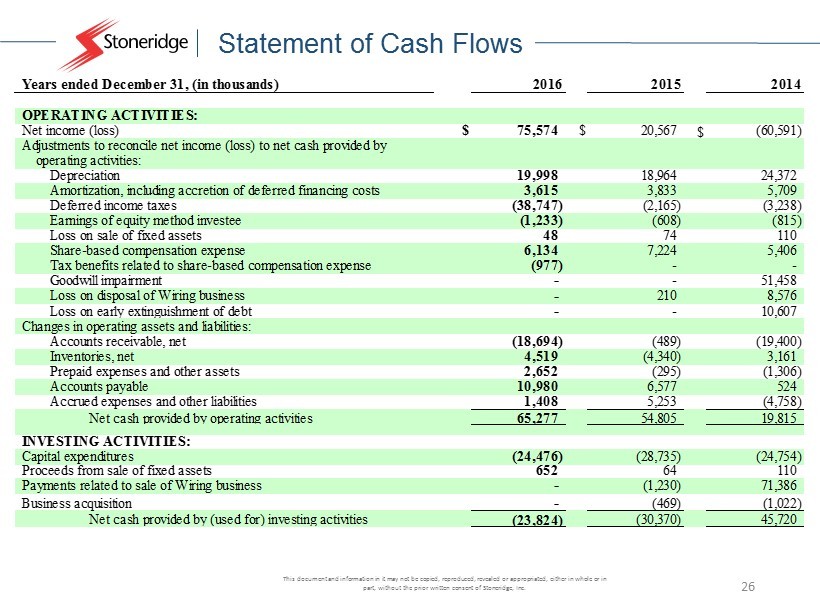
| CONSOLIDATED STATEMENTS OF CASH FLOWS | ||||||||||||
| Years ended December 31, (in thousands) | 2016 | 2015 | 2014 | |||||||||
| OPERATING ACTIVITIES: | ||||||||||||
| Net income (loss) | $ | 75,574 | $ | 20,567 | $ | (60,591 | ) | |||||
| Adjustments to reconcile net income (loss) to net cash provided by | ||||||||||||
| operating activities: | ||||||||||||
| Depreciation | 19,998 | 18,964 | 24,372 | |||||||||
| Amortization, including accretion of deferred financing costs | 3,615 | 3,833 | 5,709 | |||||||||
| Deferred income taxes | (38,747 | ) | (2,165 | ) | (3,238 | ) | ||||||
| Earnings of equity method investee | (1,233 | ) | (608 | ) | (815 | ) | ||||||
| Loss on sale of fixed assets | 48 | 74 | 110 | |||||||||
| Share-based compensation expense | 6,134 | 7,224 | 5,406 | |||||||||
| Tax benefits related to share-based compensation expense | (977 | ) | - | - | ||||||||
| Goodwill impairment | - | - | 51,458 | |||||||||
| Loss on disposal of Wiring business | - | 210 | 8,576 | |||||||||
| Loss on early extinguishment of debt | - | - | 10,607 | |||||||||
| Changes in operating assets and liabilities: | ||||||||||||
| Accounts receivable, net | (18,694 | ) | (489 | ) | (19,400 | ) | ||||||
| Inventories, net | 4,519 | (4,340 | ) | 3,161 | ||||||||
| Prepaid expenses and other assets | 2,652 | (295 | ) | (1,306 | ) | |||||||
| Accounts payable | 10,980 | 6,577 | 524 | |||||||||
| Accrued expenses and other liabilities | 1,408 | 5,253 | (4,758 | ) | ||||||||
| Net cash provided by operating activities | 65,277 | 54,805 | 19,815 | |||||||||
| INVESTING ACTIVITIES: | ||||||||||||
| Capital expenditures | (24,476 | ) | (28,735 | ) | (24,754 | ) | ||||||
| Proceeds from sale of fixed assets | 652 | 64 | 110 | |||||||||
| Payments related to sale of Wiring business | - | (1,230 | ) | 71,386 | ||||||||
| Business acquisition | - | (469 | ) | (1,022 | ) | |||||||
| Net cash provided by (used for) investing activities | (23,824 | ) | (30,370 | ) | 45,720 | |||||||
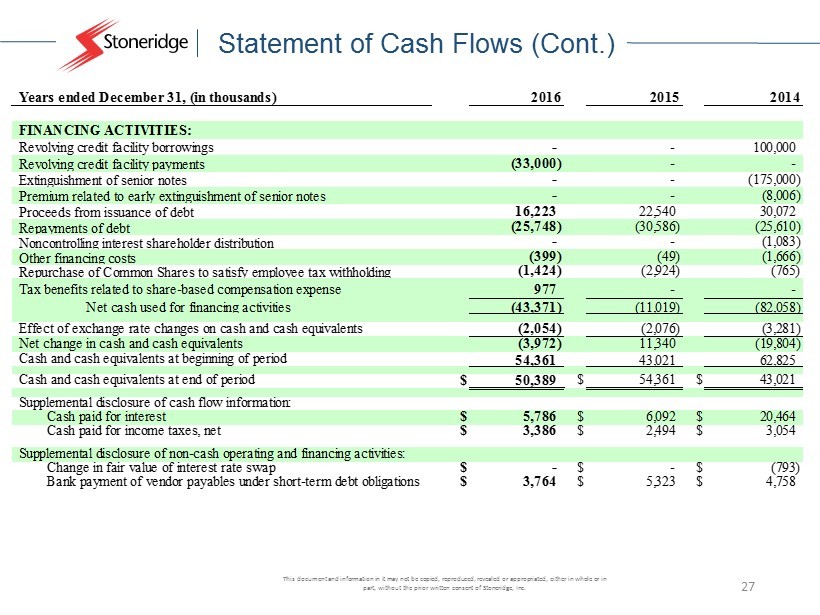
| FINANCING ACTIVITIES: | ||||||||||||
| Revolving credit facility borrowings | - | - | 100,000 | |||||||||
| Revolving credit facility payments | (33,000 | ) | - | - | ||||||||
| Extinguishment of senior notes | - | - | (175,000 | ) | ||||||||
| Premium related to early extinguishment of senior notes | - | - | (8,006 | ) | ||||||||
| Proceeds from issuance of debt | 16,223 | 22,540 | 30,072 | |||||||||
| Repayments of debt | (25,748 | ) | (30,586 | ) | (25,610 | ) | ||||||
| Noncontrolling interest shareholder distribution | - | - | (1,083 | ) | ||||||||
| Other financing costs | (399 | ) | (49 | ) | (1,666 | ) | ||||||
| Repurchase of Common Shares to satisfy employee tax withholding | (1,424 | ) | (2,924 | ) | (765 | ) | ||||||
| Tax benefits related to share-based compensation expense | 977 | - | - | |||||||||
| Net cash used for financing activities | (43,371 | ) | (11,019 | ) | (82,058 | ) | ||||||
| Effect of exchange rate changes on cash and cash equivalents | (2,054 | ) | (2,076 | ) | (3,281 | ) | ||||||
| Net change in cash and cash equivalents | (3,972 | ) | 11,340 | (19,804 | ) | |||||||
| Cash and cash equivalents at beginning of period | 54,361 | 43,021 | 62,825 | |||||||||
| Cash and cash equivalents at end of period | $ | 50,389 | $ | 54,361 | $ | 43,021 | ||||||
| Supplemental disclosure of cash flow information: | ||||||||||||
| Cash paid for interest | $ | 5,786 | $ | 6,092 | $ | 20,464 | ||||||
| Cash paid for income taxes, net | $ | 3,386 | $ | 2,494 | $ | 3,054 | ||||||
| Supplemental disclosure of non-cash operating and financing activities: | ||||||||||||
| Change in fair value of interest rate swap | $ | - | $ | - | $ | (793 | ) | |||||
| Bank payment of vendor payables under short-term debt obligations | $ | 3,764 | $ | 5,323 | $ | 4,758 | ||||||
| 8 |
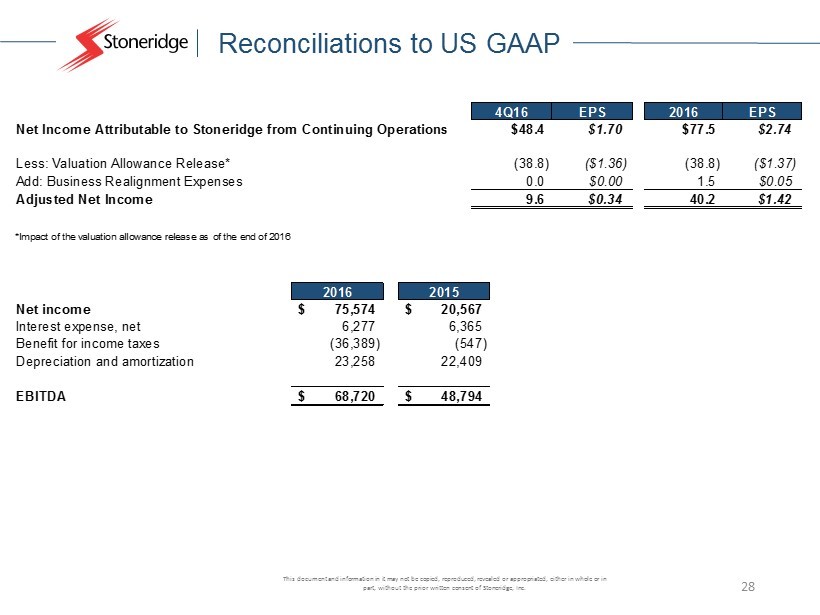
Reconciliation to US GAAP
Exhibit 1 - Adjusted EPS
| 4Q16 | EPS | 2016 | EPS | |||||||||||||
| Net Income Attributable to Stoneridge from Continuing Operations | $ | 48.4 | $ | 1.70 | $ | 77.5 | $ | 2.74 | ||||||||
| Less: Valuation Allowance Release* | (38.8 | ) | ($ | 1.36 | ) | (38.8 | ) | ($ | 1.37 | ) | ||||||
| Add: Business Realignment Expenses | 0.0 | $ | 0.00 | 1.5 | $ | 0.05 | ||||||||||
| Adjusted Net Income | 9.6 | $ | 0.34 | 40.2 | $ | 1.42 | ||||||||||
*Impact of the valuation allowance release as of the end of 2016
Exhibit 2 - EBITDA
| 2016 | 2015 | |||||||
| Net income (loss) | $ | 75,574 | $ | 20,567 | ||||
| Interest expense, net | 6,277 | 6,365 | ||||||
| Expense (benefit) for income taxes | (36,389 | ) | (547 | ) | ||||
| Depreciation and amortization | 23,258 | 22,409 | ||||||
| Adjusted EBITDA | $ | 68,720 | $ | 48,794 | ||||
| 9 |