UNITED STATES
SECURITIES AND EXCHANGE COMMISSION
Washington, D.C. 20549
FORM 8-K
CURRENT REPORT
Pursuant to Section 13 or 15(d) of the Securities Exchange Act of 1934
Date of Report (Date of earliest event reported): March 1, 2016
Commission file number: 001-13337
STONERIDGE, INC.
(Exact name of registrant as specified in its charter)
Ohio | 34-1598949 |
(State or other jurisdiction of | (I.R.S. Employer |
incorporation or organization) | Identification No.) |
9400 East Market Street, Warren, Ohio | 44484 |
(Address of principal executive offices) | (Zip Code) |
(330) 856-2443
Registrant’s telephone number, including area code
Check the appropriate box below if the Form 8-K filing is intended to simultaneously satisfy the filing obligation of the registrant under any of the following provisions (see General Instruction A.2. below):
o | Written communications pursuant to Rule 425 under the Securities Act (17 CFR 230.425) |
o | Soliciting material pursuant to Rule 14a-12 under the Exchange Act (17 CFR 240.14a-12) |
o | Pre-commencement communications pursuant to Rule 14d-2(b) under the Exchange Act (17 CFR 240.14d-2(b)) |
o | Pre-commencement communications pursuant to Rule 13e-4(c) under the Exchange Act (17 CFR 240.13e-4(c)) |
ITEM 2.02 | Results of Operations and Financial Condition. |
On March 1, 2016, Stoneridge, Inc. (the “Company”) issued a press release announcing its results for the fourth quarter and year ended December 31, 2015. A copy of the press release is attached hereto as Exhibit 99.1. On March 1, 2016, members of the Company’s management held a fourth quarter 2015 earnings conference call discussing the Company’s financial results and the presentation furnished herewith as Exhibit 99.2, accompanied management’s comments.
The press release contains certain non-GAAP financial measures including (i) Adjusted Consolidated Constant Currency Sales (“Adjusted Sales”), (ii) Adjusted Net Income from Continuing Operations Attributable to Stoneridge, Inc. (“Adjusted Income”), (iii) Adjusted Earnings per Diluted Share from Continuing Operations Attributable to Stoneridge, Inc. (“Adjusted EPS”) and (iv) Adjusted EBITDA from Continuing Operations (“Adjusted EBITDA”). Management believes that presentation of the non-GAAP financial measures used in the press release and conference call presentation are useful to both management and investors in their analysis of the Company’s financial position, results of operations and expected results of operations because the Adjusted Sales, Adjusted Income, Adjusted EPS and Adjusted EBITDA facilitates a period to period comparison of operating results by excluding the impact of foreign currency translation on sales as well as unusual, non-recurring items in 2015 and 2014. For 2015 these items relate to the share-based compensation expense associated with the retirement of our former President and Chief Executive Officer and the recognition of a tax valuation allowance at the Company’s PST segment. For 2014 these amounts relate to the goodwill impairment related to the PST segment and debt extinguishment costs resulting from the partial redemption of the senior secured notes in the fourth quarter of 2014. Adjusted EBITDA represents the sum of operating income (loss), depreciation, amortization, certain purchase accounting costs, unusual items and an adjustment for discontinued operations. These non-GAAP measures, however, should not be considered in isolation or as a substitute for the most comparable GAAP measures. Investors are cautioned that non-GAAP financial measures utilized by the Company may not be comparable to non-GAAP financial measures used by other companies. Adjusted Sales, Adjusted Net Income, Adjusted EPS and Adjusted EBITDA should not be considered a substitute for sales, net income (loss), earnings (loss) per share or EBITDA prepared in accordance with GAAP.
ITEM 7.01 | Regulation FD Disclosure. |
The information set forth in Item 2.02 above is hereby incorporated herein by reference.
The information in this report, including the press release and conference call presentation furnished as Exhibits 99.1 and 99.2 hereto, shall not be deemed to be “filed” for purposes of Section 18 of the Securities and Exchange Act of 1934, as amended (the “Exchange Act”), or otherwise subject to the liabilities of that Section, and shall not be incorporated by reference into any filing under the Securities Act of 1933, as amended, or the Exchange Act, except as shall be expressly set forth by specific reference in such a filing. In addition, the exhibits furnished herewith contain statements intended as “forward-looking statements” that are subject to the cautionary statements about forward-looking statements set forth in such exhibits.
ITEM 9.01 | Financial Statements and Exhibits. |
(d) | Exhibits |
Exhibit No. | Description |
99.1 |
Press release dated March 1, 2016, announcing results for the fourth quarter and year ended December 31, 2015. |
99.2 | Fourth quarter 2015 conference call presentation dated March 1, 2016. |
SIGNATURES
Pursuant to the requirements of the Securities Exchange Act of 1934, the registrant has duly caused this report to be signed on its behalf by the undersigned hereunto duly authorized.
Stoneridge, Inc. | ||
Date: March 1, 2016 | /s/ George E. Strickler | |
George E. Strickler, Executive Vice President, Chief Financial Officer and Treasurer (Principal Financial and Accounting Officer) |
Exhibit Index
99.1 | Press release dated March 1, 2016, announcing results for the fourth quarter and year ended December 31, 2015. |
99.2 | Fourth quarter 2015 conference call presentation dated March 1, 2016. |
Exhibit 99.1
STONERIDGE REPORTS STRONG FOURTH-QUARTER 2015 RESULTS
· | Reports Earnings Per Share From Continuing Operations of $0.22 |
· | Adjusted Earnings Per Share From Continuing Operations of $0.25 Exceeds Adjusted Earnings Per Share of $0.23 in the Fourth Quarter of 2014 |
· | New Business Launches Expected to Drive Sales Increase for 2016 12.5% to 14.0% Above 2015 Level |
· | Net New Business Forecast Revised Upward to $179.0 Million for 2016-2020, an Increase of $49.0 Million, or 38.0% |
· | 2016 Earnings Per Share Projected to be in the Range of $1.10-$1.30 Compared with $0.93 Adjusted Earnings Per Share in 2015 |
WARREN, Ohio – March 1, 2016 – Stoneridge, Inc. (NYSE: SRI) today announced financial results for the fourth quarter ended December 31, 2015 with sales of $154.6 million and earnings per diluted share from continuing operations of $0.22.
On a constant currency basis, sales increased by $4.8 million, or 2.9%, during the fourth quarter of 2015. Fourth quarter 2015 net sales were $154.6 million, a decrease of $12.2 million, or 7.3%, compared with $166.8 million for the fourth quarter of 2014. Fourth quarter 2015 sales were negatively affected by $17.0 million due to unfavorable foreign currency translation for the Company’s Electronics and PST segments. (See Exhibit 2 for reconciliation of this non-GAAP financial measure.)
The Control Devices segment sales increased by $7.1 million, or 9.6%. The sales increase in the Control Devices segment in 2015 reflects a robust North American passenger car market.
On a constant currency basis, the Electronics segment sales were substantially the same in the fourth quarter of 2015 compared with the fourth quarter of 2014. Electronics sales decreased by $4.8 million, or 8.5%, due to unfavorable foreign currency translation. (See Exhibit 2 for reconciliation of this non-GAAP financial measure.)
On a constant currency basis, the PST segment sales decreased by 6.6% compared with the fourth quarter of 2014 because of the adverse effects of the continued deterioration of economic conditions in Brazil. PST experienced a sales decrease of $14.5 million, or 40.4%, compared with the fourth quarter of 2014, due to unfavorable foreign currency exchange translation and weaker economic conditions in Brazil. The Brazilian Real depreciated 51.1% to the U.S. dollar, quarter-to-quarter, which reduced U.S. dollar reported sales for PST by approximately $12.1 million or 33.8%. (See Exhibit 2 for reconciliation of this non-GAAP financial measure.)
Earnings per diluted share from continuing operations attributable to Stoneridge, Inc. was $0.22 for the fourth quarter of 2015 compared with a loss per diluted share from continuing operations of $(0.92) in the fourth quarter of 2014. The fourth-quarter 2015 net income from continuing operations attributable to Stoneridge, Inc. of $6.1 million, or $0.22 per diluted share, included expense for the recognition of a deferred tax asset valuation allowance for our PST segment of $0.9 million, or $0.03 per share. The fourth-quarter 2014 net loss from continuing operations attributable to Stoneridge, Inc. of $(24.9) million, or $(0.92) per diluted share, included expenses of $21.8 million, or $0.81 per diluted share, for a non-cash goodwill write-off for the PST business and a loss of $(9.3) million, or $(0.34) per diluted share, for debt extinguishment related costs. (See Exhibit 3 for a reconciliation of this non-GAAP financial measure.)
At December 31, 2015, Stoneridge’s consolidated cash position was $54.4 million, an increase of $11.3 million from December 31, 2014. The cash increase was due primarily to lower interest payments, working capital decreases and improved operating performance which was partially offset by higher capital expenditures primarily for new program sales. Stoneridge’s Debt to Adjusted EBITDA ratio improved to 2.3x compared with 2.5x in the fourth quarter of 2014. (See Exhibit 4 for a reconciliation of this non-GAAP financial measure.)
Jon DeGaynor, President and Chief Executive Officer, commented, “The Control Devices and Electronics segments continued to perform well in the fourth quarter, although unfavorable foreign currency exchange rates masked the financial performance of Electronics. As 2016 begins, I am excited about the many ways our teams around the world are taking our business to a higher level of performance, focusing on execution. An example of this focus is in new products like the shift-by-wire launch, which is proceeding as planned, and mirror replacement development, with our partner Orlaco, which is gaining interest from multiple customers in both North America and Europe. Another example is in cost areas as we drive improvements in our plants, engineering and administrative activities.
“An area where our execution did not achieve our objective was PST, as PST struggled during the fourth quarter with continued sales reductions which proved to be too large for it to generate an operating profit (excluding non-cash intangible amortization expense related to the purchase of PST). The economic headwinds overshadowed the strong progress PST has made to reduce inventory by 37% from mid-year levels and pay down debt in the fourth quarter of 2015 by 21%. These reductions are the result of sustainable changes implemented at PST. To offset the continued challenges in the Brazilian market, PST is executing additional plans in the first quarter of 2016 to revise pricing and to size its cost structure to match demand. These plans should bring PST back to profitability in the second quarter of 2016.”
DeGaynor concluded, “In 2016 Stoneridge expects to grow faster than the North American light vehicle market due to our new business launches. Our 2016 guidance implies continued improvement in financial performance as a result of the execution of our sales, earnings and cash flow strategies. Our earnings per share for 2016 is estimated in the range of $1.10 to $1.30 compared with $0.93 per adjusted diluted share in 2015.” (See Exhibit 1 for further information on our guidance and Exhibit 5 for a reconciliation of 2015 adjusted diluted earnings per share of $0.93 to 2015 diluted earnings per share of $0.82). “Our strategies will also deliver results for future periods. This is tangibly demonstrated by our net new business projection which has increased by $49.0 million or 38.0% to $179.0 million compared with our five-year forward sales projection published last year at this time.”
Conference Call on the Web
A live Internet broadcast of Stoneridge’s conference call regarding 2015 fourth-quarter results can be accessed at 10 a.m. Eastern time on Tuesday, March 1, 2016, at www.stoneridge.com, which will also offer a webcast replay.
About Stoneridge, Inc.
Stoneridge, Inc., headquartered in Warren, Ohio, is an independent designer and manufacturer of highly engineered electrical and electronic components, modules and systems principally for the automotive, commercial vehicle, motorcycle, agricultural and off-highway vehicle markets. Additional information about Stoneridge can be found at www.stoneridge.com.
Forward-Looking Statements
Statements in this release that are not historical fact are forward-looking statements which involve risks and uncertainties that could cause actual events or results to differ materially from those expressed or implied in this release. Things that may cause actual results to differ materially from those in the forward-looking statements include, among other factors, the loss of a major customer; a significant volume change in automotive, commercial vehicle, motorcycle, off-highway vehicle and agricultural equipment production; disruption in the OEM supply chain due to bankruptcies; a significant change in general economic conditions in any of the various countries in which the Company operates; labor disruptions at the Company’s facilities or at any of the Company’s significant customers or suppliers; the ability of the Company’s suppliers to supply the Company with parts and components at competitive prices on a timely basis; customer acceptance of new products; and the failure to achieve successful integration of any acquired company or business. In addition, this release contains time-sensitive information that reflects management’s best analysis only as of the date of this release. The Company does not undertake any obligation to publicly update or revise any forward-looking statements to reflect future events, information or circumstances that arise after the date of this release. Further information concerning issues that could materially affect financial performance related to forward-looking statements contained in this release can be found in the Company’s periodic filings with the Securities and Exchange Commission.
For more information, contact:
Kenneth A. Kure, Corporate Treasurer and Director of Finance
CONSOLIDATED STATEMENTS OF OPERATIONS
Three months ended | For the years ended | |||||||||||||||
December 31, | December 31, | |||||||||||||||
(in thousands, except per share data) | 2015 | 2014 | 2015 | 2014 | ||||||||||||
Net sales | $ | 154,641 | $ | 166,811 | $ | 644,812 | $ | 660,579 | ||||||||
Costs and expenses: | ||||||||||||||||
Cost of goods sold | 112,402 | 121,910 | 467,834 | 469,705 | ||||||||||||
Selling, general and administrative | 24,816 | 30,043 | 110,371 | 123,630 | ||||||||||||
Design and development | 9,096 | 9,693 | 38,792 | 41,609 | ||||||||||||
Goodwill impairment | - | 27,960 | - | 51,458 | ||||||||||||
Operating income (loss) | 8,327 | (22,795 | ) | 27,815 | (25,823 | ) | ||||||||||
Interest expense, net | 1,682 | 1,821 | 6,365 | 16,880 | ||||||||||||
Equity in earnings of investee | (116 | ) | (228 | ) | (608 | ) | (815 | ) | ||||||||
Loss on early extinguishment of debt | - | 9,687 | - | 10,607 | ||||||||||||
Other (income) expense, net | 2,171 | (1,703 | ) | 1,828 | 565 | |||||||||||
Income (loss) before income taxes from continuing operations | 4,590 | (32,372 | ) | 20,230 | (53,060 | ) | ||||||||||
Benefit for income taxes from continuing operations | (345 | ) | (1,066 | ) | (547 | ) | (1,856 | ) | ||||||||
Income (loss) from continuing operations | 4,935 | (31,306 | ) | 20,777 | (51,204 | ) | ||||||||||
Discontinued operations: | ||||||||||||||||
Loss from discontinued operations, net of tax | - | (897 | ) | - | (811 | ) | ||||||||||
Gain (loss) on disposal, net of tax | 16 | (795 | ) | (210 | ) | (8,576 | ) | |||||||||
Gain (loss) from discontinued operations | 16 | (1,692 | ) | (210 | ) | (9,387 | ) | |||||||||
Net income (loss) | 4,951 | (32,998 | ) | 20,567 | (60,591 | ) | ||||||||||
Net loss attributable to noncontrolling interest | (1,133 | ) | (6,444 | ) | (2,207 | ) | (13,483 | ) | ||||||||
Net income (loss) attributable to Stoneridge, Inc. | $ | 6,084 | $ | (26,554 | ) | $ | 22,774 | $ | (47,108 | ) | ||||||
Earnings (loss) per share from continuing operations | ||||||||||||||||
attributable to Stoneridge, Inc.: | ||||||||||||||||
Basic | $ | 0.22 | $ | (0.92 | ) | $ | 0.84 | $ | (1.40 | ) | ||||||
Diluted | $ | 0.22 | $ | (0.92 | ) | $ | 0.82 | $ | (1.40 | ) | ||||||
Loss per share attributable to discontinued operations: | ||||||||||||||||
Basic | $ | 0.00 | $ | (0.07 | ) | $ | (0.01 | ) | $ | (0.35 | ) | |||||
Diluted | $ | 0.00 | $ | (0.07 | ) | $ | (0.01 | ) | $ | (0.35 | ) | |||||
Earnings (loss) per share attributable to Stoneridge, Inc.: | ||||||||||||||||
Basic | $ | 0.22 | $ | (0.99 | ) | $ | 0.83 | $ | (1.75 | ) | ||||||
Diluted | $ | 0.22 | $ | (0.99 | ) | $ | 0.81 | $ | (1.75 | ) | ||||||
Weighted-average shares outstanding: | ||||||||||||||||
Basic | 27,454 | 26,954 | 27,338 | 26,924 | ||||||||||||
Diluted | 28,082 | 26,954 | 27,959 | 26,924 |
CONSOLIDATED BALANCE SHEETS | ||||||||
As of December 31 (in thousands) | 2015 | 2014 | ||||||
ASSETS | ||||||||
Current assets: | ||||||||
Cash and cash equivalents | $ | 54,361 | $ | 43,021 | ||||
Accounts receivable, less reserves of $1,066 and $2,017, respectively | 94,937 | 105,102 | ||||||
Inventories, net | 61,009 | 71,253 | ||||||
Prepaid expenses and other current assets | 21,602 | 26,135 | ||||||
Total current assets | 231,909 | 245,511 | ||||||
Long-term assets: | ||||||||
Property, plant and equipment, net | 85,264 | 85,311 | ||||||
Other assets: | ||||||||
Intangible assets, net and goodwill | 36,699 | 57,715 | ||||||
Investments and other long-term assets, net | 10,380 | 10,214 | ||||||
Total long-term assets | 132,343 | 153,240 | ||||||
Total assets | $ | 364,252 | $ | 398,751 | ||||
LIABILITIES AND SHAREHOLDERS' EQUITY | ||||||||
Current liabilities: | ||||||||
Current portion of debt | $ | 13,905 | $ | 19,655 | ||||
Accounts payable | 55,225 | 58,593 | ||||||
Accrued expenses and other current liabilities | 38,920 | 42,066 | ||||||
Total current liabilities | 108,050 | 120,314 | ||||||
Long-term liabilities: | ||||||||
Revolving credit facility | 100,000 | 100,000 | ||||||
Long-term debt, net | 4,458 | 10,651 | ||||||
Deferred income taxes | 41,332 | 50,006 | ||||||
Other long-term liabilities | 3,983 | 3,974 | ||||||
Total long-term liabilities | 149,773 | 164,631 | ||||||
Shareholders' equity: | ||||||||
Preferred Shares, without par value, 5,000 shares authorized, none issued | - | - | ||||||
Common Shares, without par value, 60,000 shares authorized, | ||||||||
28,907 and 28,853 shares issued and 27,912 and 28,221 shares outstanding at | ||||||||
December 31, 2015 and 2014, respectively, with no stated value | - | - | ||||||
Additional paid-in capital | 199,254 | 192,892 | ||||||
Common Shares held in treasury, 995 and 632 shares at December 31, 2015 | ||||||||
and 2014, respectively, at cost | (4,208 | ) | (1,284 | ) | ||||
Accumulated deficit | (32,105 | ) | (54,879 | ) | ||||
Accumulated other comprehensive loss | (69,822 | ) | (45,473 | ) | ||||
Total Stoneridge, Inc. shareholders' equity | 93,119 | 91,256 | ||||||
Noncontrolling interest | 13,310 | 22,550 | ||||||
Total shareholders' equity | 106,429 | 113,806 | ||||||
Total liabilities and shareholders' equity | $ | 364,252 | $ | 398,751 |
CONSOLIDATED STATEMENTS OF COMPREHENSIVE INCOME (LOSS)
Three months ended | For the years ended | |||||||||||||||
December 31, | December 31, | |||||||||||||||
(in thousands) | 2015 | 2014 | 2015 | 2014 | ||||||||||||
Net income (loss) | $ | 4,951 | $ | (32,998 | ) | $ | 20,567 | $ | (60,591 | ) | ||||||
Less: Loss attributable to noncontrolling interest | (1,133 | ) | (6,444 | ) | (2,207 | ) | (13,483 | ) | ||||||||
Net income (loss) attributable to Stoneridge, Inc. | 6,084 | (26,554 | ) | 22,774 | (47,108 | ) | ||||||||||
Other comprehensive income (loss), net of tax attributable to | ||||||||||||||||
Stoneridge, Inc.: | ||||||||||||||||
Foreign currency translation | (196 | ) | (9,104 | ) | (24,693 | ) | (15,268 | ) | ||||||||
Benefit plan liability | - | 141 | (45 | ) | 141 | |||||||||||
Unrealized gain on derivatives | 418 | 161 | 389 | 112 | ||||||||||||
Other comprehensive income (loss), net of tax attributable to | ||||||||||||||||
Stoneridge, Inc. | 222 | (8,802 | ) | (24,349 | ) | (15,015 | ) | |||||||||
Comprehensive income (loss) attributable to Stoneridge, Inc. | $ | 6,306 | $ | (35,356 | ) | $ | (1,575 | ) | $ | (62,123 | ) |
The Company has combined comprehensive loss from continuing operations and comprehensive loss from discontinued operations herein.
CONSOLIDATED STATEMENTS OF CASH FLOWS
Years ended December 31 (in thousands) | 2015 | 2014 | ||||||
OPERATING ACTIVITIES: | ||||||||
Net cash provided by operating activities | $ | 54,805 | $ | 19,815 | ||||
INVESTING ACTIVITIES: | ||||||||
Capital expenditures | (28,735 | ) | (24,754 | ) | ||||
Proceeds from sale of fixed assets | 64 | 110 | ||||||
Proceeds from (payments related to) sale of Wiring business | (1,230 | ) | 71,386 | |||||
Business acquisition | (469 | ) | (1,022 | ) | ||||
Net cash provided by (used for) investing activities | (30,370 | ) | 45,720 | |||||
FINANCING ACTIVITIES: | ||||||||
Revolving credit facility borrowings | - | 100,000 | ||||||
Extinguishment of senior notes | - | (175,000 | ) | |||||
Premium related to early extinguishment of senior notes | - | (8,006 | ) | |||||
Proceeds from issuance of debt | 22,540 | 30,072 | ||||||
Repayments of debt | (30,586 | ) | (25,610 | ) | ||||
Noncontrolling interest shareholder distribution | - | (1,083 | ) | |||||
Other financing costs | (49 | ) | (1,666 | ) | ||||
Repurchase of Common Shares to satisfy employee tax withholding | (2,924 | ) | (765 | ) | ||||
Net cash used for financing activities | (11,019 | ) | (82,058 | ) | ||||
Effect of exchange rate changes on cash and cash equivalents | (2,076 | ) | (3,281 | ) | ||||
Net change in cash and cash equivalents | 11,340 | (19,804 | ) | |||||
Cash and cash equivalents at beginning of period | 43,021 | 62,825 | ||||||
Cash and cash equivalents at end of period | $ | 54,361 | $ | 43,021 |
The Company has combined cash flows from continuing operations and cash flows from discontinued operations within the operating, investing and financing categories.
Exhibit 1
Full Year | FX In Guidance | |||||||
2016 | 2016 | |||||||
Sales (in millions) | $726.0 | - | $736.0 | USD/BRL | 3.80 | |||
Gross Margin | 25.5% | - | 28.0% | USD/MXN | 15.80 | |||
Operating Margin | 5.3% | - | 7.3% | EUR/USD | 1.10 | |||
EPS | $1.10 | - | $1.30 | USD/SEK | 8.65 | |||
EBITDA | 8.0% | - | 11.0% | |||||
Exhibit 2 |
Stoneridge, Inc. |
Reconciliation of Sales to Constant Currency Adjusted Sales |
Three months ended December 31, 2015 and 2014 |
(Unaudited) |
Increase / | Percent | |||||||||||||||
2015 | 2014 | (Decrease) | Increase | |||||||||||||
Electronics Segment Sales As Reported | $ | 51,529 | $ | 56,333 | $ | (4,804 | ) | (8.5 | )% | |||||||
Plus: Constant Foreign Currency Translation Adjustment | 4,820 | - | 4,820 | |||||||||||||
Adjusted Electronics Segment Sales | $ | 56,349 | $ | 56,333 | $ | 16 | 0.0 | % | ||||||||
PST Segment Sales As Reported | $ | 21,401 | $ | 35,915 | $ | (14,514 | ) | (40.4 | )% | |||||||
Plus: Constant Foreign Currency Translation Adjustment | 12,139 | - | 12,139 | |||||||||||||
Adjusted PST Segment Sales | $ | 33,540 | $ | 35,915 | $ | (2,375 | ) | (6.6 | )% | |||||||
Total Consolidated Sales As Reported | $ | 154,641 | $ | 166,811 | $ | (12,170 | ) | (7.3 | )% | |||||||
Plus: Constant Foreign Currency Translation Adjustment | 16,959 | - | 16,959 | |||||||||||||
Total Consolidated Constant Currency Adjusted Sales | $ | 171,600 | $ | 166,811 | $ | 4,789 | 2.9 | % |
Exhibit 3 |
Stoneridge, Inc. Reconcilation of Net Income (Loss) and Earnings (Loss) Per Diluted Share to Adjusted Net Income and Earnings Per Diluted Share Three months ended December 31, 2015 and 2014 (Unaudited) |
2015 | 2014 | 2015 | 2014 | |||||||||||||
Net Income (Loss) and Earnings (Loss) Per Diluted Share | ||||||||||||||||
Attributable to Stoneridge, Inc. | $ | 6,084 | $ | (26,554 | ) | $ | 0.22 | $ | (0.99 | ) | ||||||
Less: Net Income (Loss) and Earnings (Loss) Per Diluted Share | ||||||||||||||||
Attributable to Discontinued Operations | 16 | (1,692 | ) | - | (0.07 | ) | ||||||||||
Income (Loss) and Earnings (Loss) Per Diluted Share from | ||||||||||||||||
Continuing Operations Attributable to Stoneridge, Inc. | 6,068 | (24,862 | ) | 0.22 | (0.92 | ) | ||||||||||
Unusual Items | ||||||||||||||||
PST Tax Valuation Allowance | 1,237 | - | 0.04 | - | ||||||||||||
PST Goodwill Impairment | - | 27,960 | - | 1.04 | ||||||||||||
PST Amounts Attributable to Noncontrolling Interest | (322 | ) | (6,142 | ) | (0.01 | ) | (0.23 | ) | ||||||||
Net PST Adjustments Attributable to Stoneridge, Inc. | 915 | 21,818 | 0.03 | # | 0.81 | |||||||||||
Debt Extinguishment Costs | - | 9,687 | - | 0.36 | ||||||||||||
Gain on Termination of Interest Rate Swap | - | (371 | ) | - | (0.02 | ) | ||||||||||
Total Adjustment for PST Tax Valuation Allowance and Goodwill Impairment, | ||||||||||||||||
Debt Extinguishment Costs and Gain on Interest Rate Swap Termination | 915 | 31,134 | 0.03 | 1.15 | ||||||||||||
Adjusted Net Income and Earnings Per Diluted Share from | ||||||||||||||||
Continuing Operations Attributable to Stoneridge, Inc. | $ | 6,983 | $ | 6,272 | $ | 0.25 | $ | 0.23 |
Exhibit 4 | |||||||
Stoneridge, Inc. Reconciliation of Net Income (Loss) to Adjusted EBITDA from Continuing Operations | |||||||
Years ended December 31, 2015 and 2014 (Unaudited) |
2015 | 2014 | |||||||
Net income (loss) | $ | 20,567 | $ | (60,591 | ) | |||
Interest expense, net | 6,365 | 16,880 | ||||||
Equity in earnings of investees | (608 | ) | (815 | ) | ||||
Other expense, net | 1,828 | 565 | ||||||
Benefit for income taxes | (547 | ) | (1,856 | ) | ||||
Depreciation and amortization | 22,274 | 27,105 | ||||||
Share-based compensation impact of CEO Retirement | 2,225 | - | ||||||
Discontinued operations | 210 | 9,387 | ||||||
Loss on early extinguishment of debt | - | 10,607 | ||||||
PST purchase accounting and goodwill impairment | (120 | ) | 50,918 | |||||
Adjusted EBITDA from continuing operations | $ | 52,194 | $ | 52,200 | ||||
Total Debt | $ | 118,363 | $ | 130,306 | ||||
Total Debt / Adjusted EBITDA from continuing operations | $ | 2.3 | $ | 2.5 |
Exhibit 5 | ||||||||||||
Stoneridge, Inc. Reconcilation of Net Income and Adjusted Earnings Per Diluted Share to Adjusted Net Income and Earnings Per Diluted Share from Continuing Operations Year ended December 31, 2015 (Unaudited) |
2015 | ||||||||
Net Income and Earnings Per Diluted Share | ||||||||
Attributable to Stoneridge, Inc. | $ | 22,774 | $ | 0.81 | ||||
Less: Net Loss and Loss Per Diluted Share | ||||||||
Attributable to Discontinued Operations | (210 | ) | (0.01 | ) | ||||
Net Income and Earnings Per Diluted Share from Continuing | ||||||||
Operations Attributable to Stoneridge, Inc. | 22,984 | 0.82 | ||||||
Unusual Items | ||||||||
Share-Based Compensation Expense Associated with the Retirement | ||||||||
of our Former President and Chief Executive Officer | 2,225 | 0.08 | ||||||
PST Tax Valuation Allowance | 1,237 | 0.04 | ||||||
PST Amounts Attributable to Noncontrolling Interest | (322 | ) | (0.01 | ) | ||||
Net PST Adjustments Attributable to Stoneridge, Inc. | 915 | 0.03 | ||||||
Total Adjustment for Share-Based Compensation and PST Tax | ||||||||
Valuation Allowance | 3,140 | 0.11 | ||||||
Adjusted Net Income and Earnings Per Diluted Share from Continuing | ||||||||
Operations Attributable to Stoneridge, Inc. | $ | 26,124 | $ | 0.93 |
4Q15 Earnings Release March 1, 2016 TECHNOLOGIES IN MOTION Exhibit 99.2
2 STONERIDGE FORWARD LOOKING STATEMENTS Statements in this presentation that are not historical facts are forward - looking statements, which involve risks and uncertainties that could cause actual events or results to differ materially from those expressed or implied by the statements. Important factors that may cause actual re sul ts to differ materially from those in the forward - looking statements include, among other factors, the loss or bankruptcy of a major customer; the costs and timing of facility closures, business realignment or similar actions; a significant change in medium - and heavy - duty truck, automotive or agricultural and off - highway vehicle production; our ability to achieve cost reductions that offset or exceed customer - mandated selling price reductions; a significant change in general econom ic conditions in any of the various countries in which Stoneridge operates; labor disruptions at Stoneridge’s facilities or at any of Stoneridge’s signif ica nt customers or suppliers; the ability of suppliers to supply Stoneridge with parts and components at competitive prices on a timely basis; the amount of Stoneridge ’s indebtedness and the restrictive covenants contained in the agreements governing its indebtedness, including its asset - based credit facility and senior secured n otes; customer acceptance of new products; capital availability or costs, including changes in interest rates or market perceptions; the failure to achiev e s uccessful integration of any acquired company or business; the occurrence or non - occurrence of circumstances beyond Stoneridge’s control; and the items described in “ Risk Factors” and other uncertainties or risks discussed in Stoneridge’s periodic and current reports filed with the Securities and Exchange Commissi on. Important factors that could cause the performance of the commercial vehicle and automotive industry to differ materially fro m t hose in the forward - looking statements include factors such as (1) continued economic instability or poor economic conditions in the United States and gl oba l markets, (2) changes in economic conditions, housing prices, foreign currency exchange rates, commodity prices, including shortages of and increases or volatility in the price of oil, (3) changes in laws and regulations, (4) the state of the credit markets, (5) political stability, (6) international conflicts an d ( 7) the occurrence of force majeure events. These factors should not be construed as exhaustive and should be considered with the other cautionary statements in Stonerid ge’ s filings with the Securities and Exchange Commission. Forward - looking statements are not guarantees of future performance; Stoneridge’s actual results of operations, financial condit ion and liquidity, and the development of the industry in which Stoneridge operates may differ materially from those described in or suggested by the fo rwa rd - looking statements contained in this presentation. In addition, even if Stoneridge’s results of operations, financial condition and liquidity, a nd the development of the industry in which Stoneridge operates are consistent with the forward - looking statements contained in this presentation, those results or de velopments may not be indicative of results or developments in subsequent periods. This presentation contains time - sensitive information that reflects management’s best analysis only as of the date of this prese ntation. Any forward - looking statements in this presentation speak only as of the date of this presentation, and Stoneridge undertakes no obligation to up dat e such statements. Comparisons of results for current and any prior periods are not intended to express any future trends or indications of future performan ce, unless expressed as such, and should only be viewed as historical data. Stoneridge does not undertake any obligation to publicly update or revise any forward - looking statement as a result of new infor mation, future events or otherwise, except as otherwise required by law. Rounding Disclosure : There may be slight non - material differences between figures represented in our public filings compared to what is shown in t his presentation. The differences are the a result of rounding due to the representation of values in millions rather than thous and s in public filings. The information in this document belongs to Stoneridge, Inc. or its subsidiaries and may be confidential. This document and inf ormation in it may not be copied, reproduced, revealed or appropriated, either in whole or in part, without the prior written consent of Stoneri dge , Inc.
STONERIDGE Sales by Segment – 4Q15 vs 4Q14 3 CD ELEC PST SRI CD ELEC PST SRI Pass Car / Light Truck 66.3 0.3 0.0 66.6 59.4 0.3 0.0 59.7 Med / HD Truck 8.8 49.7 0.0 58.5 8.0 52.9 0.0 60.9 Ag 3.8 0.0 0.0 3.8 4.0 0.0 0.0 4.0 PST / Other 2.8 1.5 21.4 25.7 3.2 3.1 35.9 42.2 TOTAL 81.7 51.5 21.4 154.6 74.6 56.3 35.9 166.8 CD ELEC PST SRI CD ELEC PST SRI Pass Car / Light Truck 6.9 0.0 0.0 6.9 11.6% 14.5% 0.0% 11.6% Med / HD Truck 0.8 (3.2) 0.0 (2.4) 9.5% (6.0)% 0.0% (4.0)% Ag (0.2) (0.0) 0.0 (0.2) (4.4)% (100.0)% 0.0% (4.5)% PST / Other (0.4) (1.6) (14.5) (16.5) (11.4)% (52.0)% (40.4)% (39.1)% TOTAL 7.1 (4.8) (14.5) (12.2) 9.6% (8.5)% (40.4)% (7.3)% 4Q15 4Q14 Variance $ Variance % 4Q15 vs 4Q14 4Q15 vs 4Q14
STONERIDGE Adjusted Sales – 4Q15 vs 4Q14 4 Increase / 4Q15 4Q14 (Decrease) Pctg Δ Electronics Segment Sales As Reported 51.5 56.3 (4.8) (8.5)% Plus: Constant Foreign Currency Translation Adjustment 4.8 - 4.8 Adjusted Electronics Segment Sales 56.3 56.3 0.0 0.0% PST Segment Sales As Reported 21.4 35.9 (14.5) (40.4)% Plus: Constant Foreign Currency Translation Adjustment 12.1 - 12.1 Adjusted PST Segment Sales 33.5 35.9 (2.4) (6.6)% Total Consolidated Sales As Reported 154.6 166.8 (12.2) (7.3)% Plus: Constant Foreign Currency Translation Adjustment 17.0 - 17.0 Total Consolidated Constant Currency Adjusted Sales 171.6 166.8 4.8 2.9%
SRI excl PST PST PST PPA Total PST SRI SRI SRI 4Q15 4Q14 USD [millions] except per share data Actual Actual ∆ # ∆ % Net Sales 133.2 21.4 - 21.4 154.6 166.8 (12.2) (7.3%) Cost of Materials 69.8 9.0 - 9.0 78.8 84.7 (5.9) (7.0%) Cost of Materials % 52.4% 42.1% 42.1% 51.0% 50.8% Direct Labor 5.7 1.7 - 1.7 7.4 9.0 (1.6) (17.8%) Direct Labor % 4.3% 7.9% 7.9% 4.8% 5.4% Total Overhead 22.6 3.5 0.1 3.6 26.2 28.2 (2.0) (7.1%) Cost of Goods Sold 98.1 14.2 0.1 14.3 112.4 121.9 (9.5) (7.8%) Gross Profit 35.1 7.2 (0.1) 7.1 42.2 44.9 (2.7) (6.0%) Gross Profit % 26.4% 33.6% 33.2% 27.3% 26.9% Design & Development 8.4 0.7 - 0.7 9.1 9.7 (0.6) (6.2%) Goodwill Impairment - - - - - 28.0 (28.0) (100.0%) Other SGA 16.7 7.4 0.7 8.1 24.8 30.0 (5.2) (17.3%) Total Selling, General and Administrative 25.1 8.1 0.7 8.8 33.9 67.7 (33.8) (49.9%) Operating Income 10.0 (0.9) (0.8) (1.7) 8.3 (22.8) 31.1 (136.4%) Operating Profit % 7.5% (4.2%) (7.9%) 5.4% (13.7%) Equity Earnings (0.1) - - - (0.1) (0.2) 0.1 (50.0%) Interest Expense (Income), Net 0.8 0.9 - 0.9 1.7 1.8 (0.1) (5.6%) Other (Income) / Expense (0.9) 3.1 - 3.1 2.2 8.0 (5.8) (72.5%) Income Before Taxes 10.3 (4.9) (0.8) (5.7) 4.6 (32.4) 37.0 (114.2%) Income Before Taxes % 7.7% (22.9%) (26.6%) 3.0% (19.4%) Provision for Income Taxes (0.4) 0.4 (0.3) 0.1 (0.3) (1.1) 0.8 (72.7%) Effective Tax Rate % (3.9%) (8.2%) 37.5% (1.8%) (6.5%) 3.4% Income from Continuing Operations 10.6 (5.2) (0.5) (5.7) 4.9 (31.3) 36.2 (115.7%) Income from Continuing Operations % 8.0% (24.3%) (26.6%) 3.2% (18.8%) Discontinued Operations - - - - - (0.9) 0.9 (100.0%) Gain/Loss on Disposal - - - - - (0.8) 0.8 (100.0%) Net Income (excl NC Int Exp) 10.7 (5.2) (0.5) (5.7) 5.0 (33.0) 38.0 (115.2%) Non Controlling Interest - - (1.1) (1.1) (1.1) (6.4) 5.3 (82.8%) Net Income Attributable to Stoneridge 10.7 (5.2) 0.6 (4.6) 6.1 (26.6) 32.7 (122.9%) Net Margin % 8.0% (24.3%) (21.5%) 3.9% (15.9%) EPS Impact - Cont Ops $0.38 ($0.19) $0.02 ($0.16) $0.22 ($0.92) $1.14 (123.4%) EPS Impact - Disc Ops $0.00 $0.00 $0.00 $0.00 $0.00 ($0.07) $0.07 (100.8%) EPS Impact $0.38 ($0.19) $0.02 ($0.16) $0.22 ($0.99) $1.20 (122.0%) 4Q15 v 4Q14 STONERIDGE Sales, Gross Profit, & Op Income – 4Q15 vs 4Q14 5 * * Includes Deferred Tax Valuation of $(0.03) and Argentina Devaluation of $(0.03) per Diluted Share
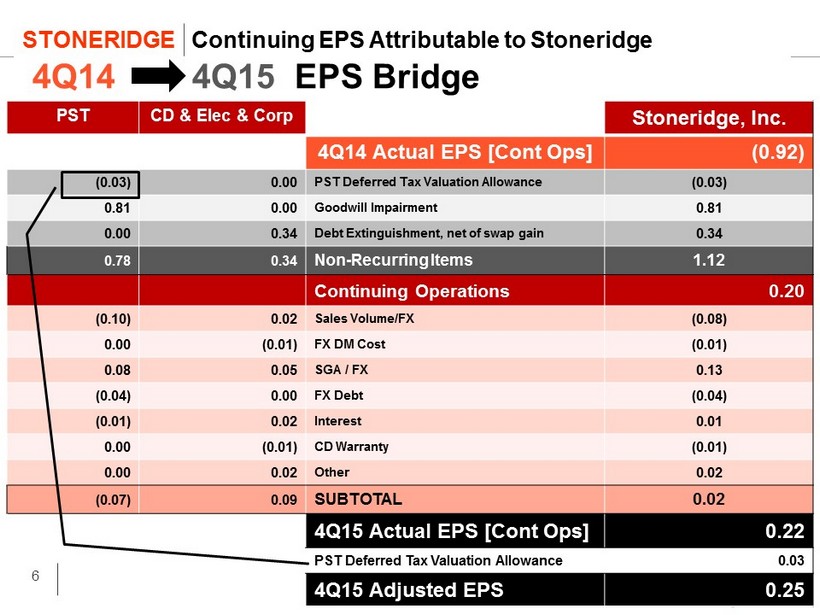
STONERIDGE Continuing EPS Attributable to Stoneridge PST CD & Elec & Corp Stoneridge, Inc. 4Q14 Actual EPS [ Cont Ops] (0.92) (0.03) 0.00 PST Deferred Tax Valuation Allowance (0.03) 0.81 0.00 Goodwill Impairment 0.81 0.00 0.34 Debt Extinguishment, net of swap gain 0.34 0.78 0.34 Non - Recurring Items 1.12 Continuing Operations 0.20 (0.10) 0.02 Sales Volume/FX (0.08) 0.00 (0.01) FX DM Cost (0.01) 0.08 0.05 SGA / FX 0.13 (0.04) 0.00 FX Debt (0.04) (0.01) 0.02 Interest 0.01 0.00 (0.01) CD Warranty (0.01) 0.00 0.02 Other 0.02 (0.07) 0.09 SUBTOTAL 0.02 4Q15 Actual EPS [ Cont Ops] 0.22 PST Deferred Tax Valuation Allowance 0.03 4Q15 Adjusted EPS 0.25 4Q14 4Q15 EPS Bridge 6
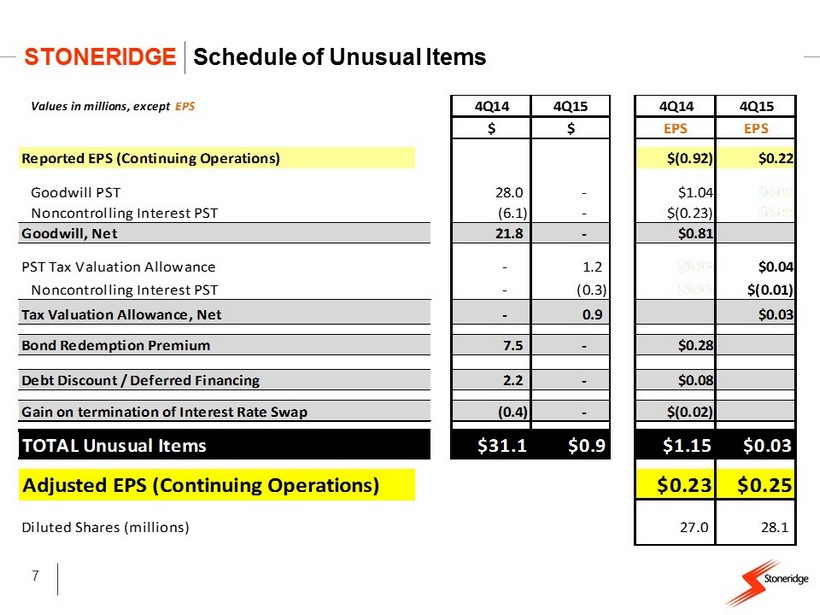
7 STONERIDGE Schedule of Unusual Items Values in millions, except EPS 4Q14 4Q15 4Q14 4Q15 $ $ EPS EPS Reported EPS (Continuing Operations) $(0.92) $0.22 Goodwill PST 28.0 - $1.04 $0.00 Noncontrolling Interest PST (6.1) - $(0.23) $0.00 Goodwill, Net 21.8 - $0.81 $0.00 PST Tax Valuation Allowance - 1.2 $0.00 $0.04 Noncontrolling Interest PST - (0.3) $0.00 $(0.01) Tax Valuation Allowance, Net - 0.9 $0.00 $0.03 Bond Redemption Premium 7.5 - $0.28 $0.00 Debt Discount / Deferred Financing 2.2 - $0.08 $0.00 Gain on termination of Interest Rate Swap (0.4) - $(0.02) $0.00 TOTAL Unusual Items $31.1 $0.9 $1.15 $0.03 Adjusted EPS (Continuing Operations) $0.23 $0.25 Diluted Shares (millions) 27.0 28.1
43% 38% 14% 5% PassCar Lt Truck Comm'l Vehicle PST Ag / Other 57% 14% 29% North America South America Europe / Asia 53% 33% 14% Control Devices Electronics PST 4Q15 Sales $154.6 NOTE: D oes not include revenue from India JV SERVED MARKETS REGIONS BUSINESS SEGMENTS Sales from Continuing Operations STONERIDGE 4Q15 Sales: Market, Region, Segment 8
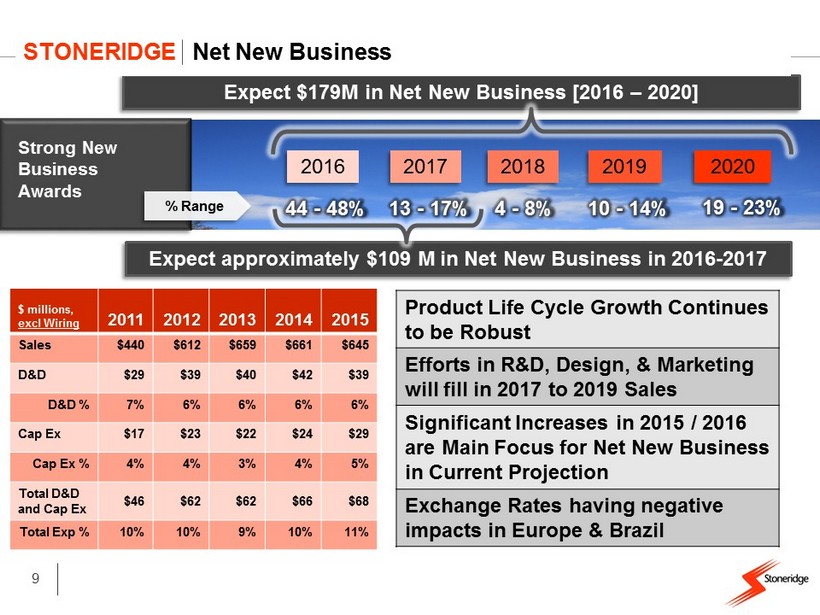
Strong New Business Awards 2016 2017 2018 2019 2020 44 - 48% % Range 13 - 17% 4 - 8% 10 - 14% 19 - 23% Expect approximately $109 M in Net New Business in 2016 - 2017 Expect $ 179M in Net New Business [ 2016 – 2020] $ millions, excl Wiring 2011 2012 2013 2014 2015 Sales $440 $612 $659 $661 $645 D&D $29 $39 $40 $42 $39 D&D % 7% 6% 6% 6% 6% Cap Ex $17 $23 $22 $24 $29 Cap Ex % 4% 4% 3% 4% 5% Total D&D and Cap Ex $46 $62 $62 $66 $68 Total Exp % 10% 10% 9% 10% 11% Product Life Cycle Growth Continues to be Robust Efforts in R&D, Design, & Marketing will fill in 2017 to 2019 Sales Significant Increases in 2015 / 2016 are Main Focus for Net New Business in Current Projection Exchange Rates having negative impacts in Europe & Brazil STONERIDGE Net New Business 9
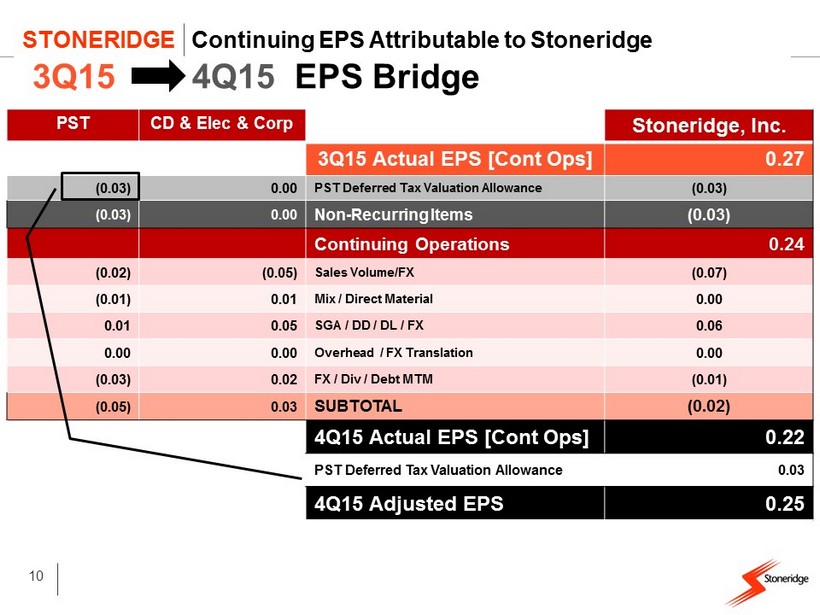
STONERIDGE Continuing EPS Attributable to Stoneridge PST CD & Elec & Corp Stoneridge, Inc. 3Q15 Actual EPS [ Cont Ops] 0.27 (0.03) 0.00 PST Deferred Tax Valuation Allowance (0.03) (0.03) 0.00 Non - Recurring Items (0.03) Continuing Operations 0.24 (0.02) (0.05) Sales Volume/FX (0.07) (0.01) 0.01 Mix / Direct Material 0.00 0.01 0.05 SGA / DD / DL / FX 0.06 0.00 0.00 Overhead / FX Translation 0.00 (0.03) 0.02 FX / Div / Debt MTM (0.01) (0.05) 0.03 SUBTOTAL (0.02) 4Q15 Actual EPS [ Cont Ops] 0.22 PST Deferred Tax Valuation Allowance 0.03 4Q15 Adjusted EPS 0.25 3Q15 4Q15 EPS Bridge 10
STONERIDGE Sales by Segment – 4Q15 vs 3Q15 11 CD ELEC PST SRI CD ELEC PST SRI Pass Car / Light Truck 66.3 0.3 0.0 66.6 71.0 0.4 0.0 71.4 Med / HD Truck 8.8 49.7 0.0 58.5 9.0 47.6 0.0 56.6 Ag 3.8 0.0 0.0 3.8 4.0 0.0 0.0 4.0 PST / Other 2.8 1.5 21.4 25.7 3.0 2.7 24.3 30.0 TOTAL 81.7 51.5 21.4 154.6 87.0 50.7 24.3 162.1 CD ELEC PST SRI CD ELEC PST SRI Pass Car / Light Truck (4.7) (0.1) 0.0 (4.8) (6.6)% (25.0)% 0.0% (6.7)% Med / HD Truck (0.2) 2.1 0.0 1.9 (2.2)% 4.4% 0.0% 3.4% Ag (0.2) 0.0 0.0 (0.2) (5.0)% 0.0% 0.0% (5.0)% PST / Other (0.2) (1.2) (2.9) (4.3) (6.7)% (44.4)% (11.9)% (14.3)% TOTAL (5.3) 0.8 (2.9) (7.5) (6.1)% 1.6% (11.9)% (4.6)% 4Q15 3Q15 Variance $ Variance % 4Q15 vs 3Q15 4Q15 vs 3Q15
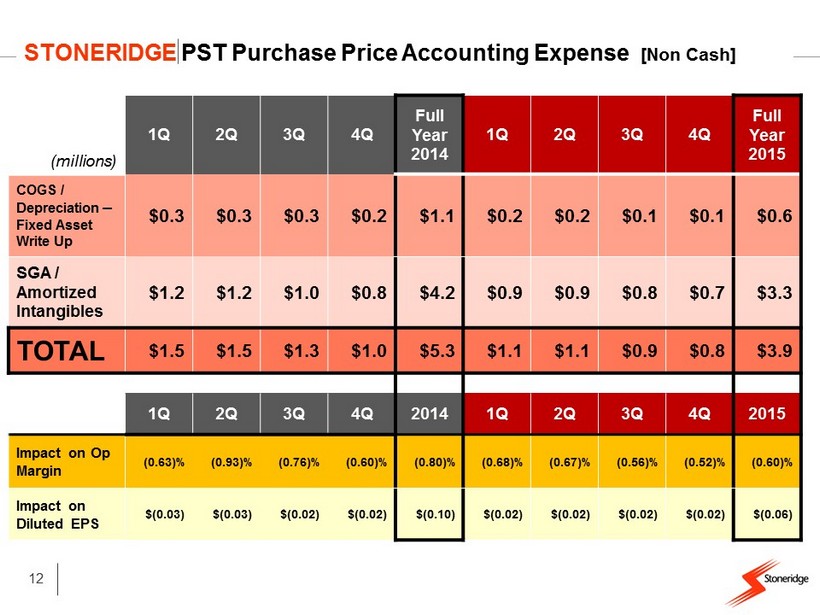
(millions) 1Q 2Q 3Q 4Q Full Year 2014 1Q 2Q 3Q 4Q Full Year 2015 COGS / Depreciation – Fixed Asset Write Up $0.3 $0.3 $0.3 $0.2 $1.1 $0.2 $0.2 $0.1 $0.1 $0.6 SGA / Amortized Intangibles $1.2 $1.2 $1.0 $0.8 $4.2 $0.9 $0.9 $0.8 $0.7 $3.3 TOTAL $1.5 $1.5 $1.3 $1.0 $5.3 $1.1 $1.1 $0.9 $0.8 $3.9 1Q 2Q 3Q 4Q 2014 1Q 2Q 3Q 4Q 2015 Impact on Op Margin (0.63)% (0.93)% (0.76)% (0.60)% (0.80)% (0.68)% (0.67)% (0.56)% (0.52)% (0.60)% Impact on Diluted EPS $(0.03) $(0.03) $(0.02) $(0.02) $(0.10) $(0.02) $(0.02) $(0.02) $(0.02) $(0.06) STONERIDGE PST Purchase Price Accounting Expense [Non Cash] 12
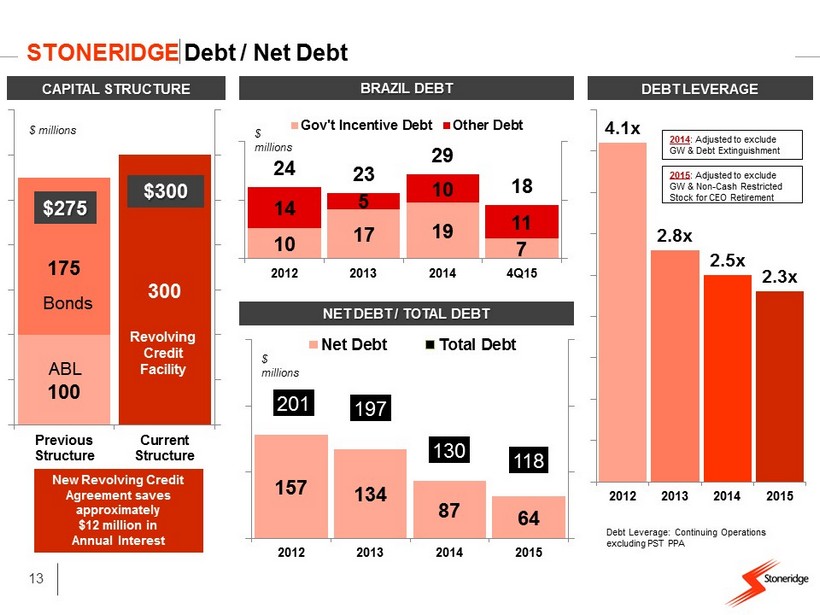
4.1x 2.8x 2.5x 2.3x 2012 2013 2014 2015 DEBT LEVERAGE Debt Leverage: Continuing Operations excluding PST PPA 100 175 300 Previous Structure Current Structure CAPITAL STRUCTURE $275 $300 New Revolving Credit Agreement saves approximately $12 million in Annual Interest 10 17 19 7 14 5 10 11 24 23 29 18 2012 2013 2014 4Q15 Gov't Incentive Debt Other Debt BRAZIL DEBT 157 134 87 64 201 197 130 118 2012 2013 2014 2015 Net Debt Total Debt NET DEBT / TOTAL DEBT Bonds ABL Revolving Credit Facility $ millions $ millions $ millions 2015 : Adjusted to exclude GW & Non - Cash Restricted Stock for CEO Retirement STONERIDGE Debt / Net Debt 13 2014 : Adjusted to exclude GW & Debt Extinguishment
STONERIDGE 2016 GUIDANCE 14 14 * Assumes no reversal of U.S. Tax Valuation Allowance 2016 Guidance * SALES $726 - $736 GROSS MARGIN 25.5% - 28.0% OP MARGIN 5.3% - 7.3% EPS $1.10 - $1.30 EBITDA 8.0% - 11.0% FX RATES 2016 Guidance USD / BRL 3.80 USD / MXN 15.80 EUR / USD 1.10 USD / SEK 8.65
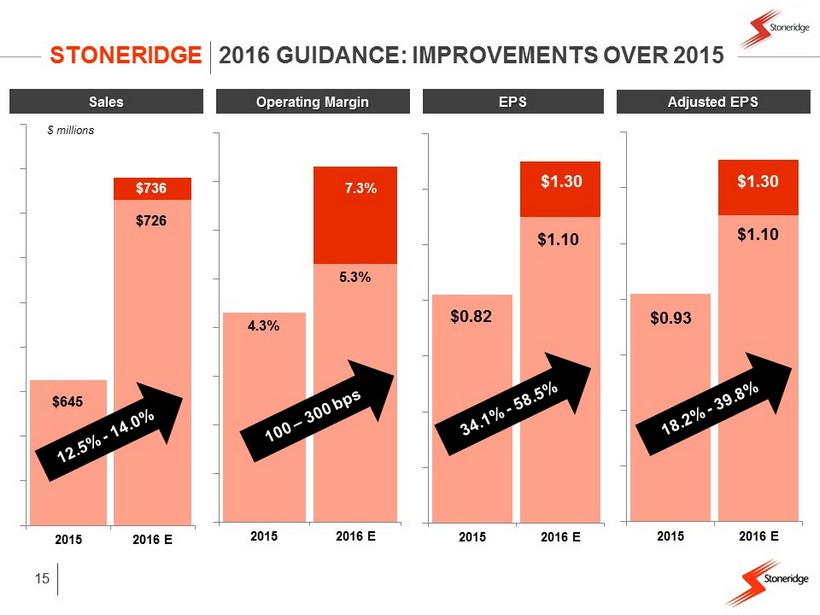
STONERIDGE 2016 GUIDANCE: IMPROVEMENTS OVER 2015 15 15 2015 2016 E Sales $ millions $736 4.3% 5.3% 2015 2016 E Operating Margin 7.3% 2015 2016 E EPS $1.30 $1.10 $0.82 $726 $645 2015 2016 E Adjusted EPS $0.93 $1.10 $1.30
16
MAI3*:;-Y*" WCYQFFUVQ2<'&<_%74PTK/&!^
ME-.6T'/3]*KN$N"*BF!@;B:6F-@]ZL#L!&"%#] *'5;_ /"G ^:I3LG37!&-
ML\#BGVV<]J*3#4#\?%+2WM(&,T[04Q#;./UHIIO!KD-\T2AO':LVS1'-M_:B
M6F