Exhibit 99.1
![]()
FOR IMMEDIATE RELEASE
Stoneridge Reports Strong Third-Quarter 2020 Results
STRONG EXECUTION IN Q3 RESULTING IN EPS OF $0.25 (ADJUSTED EPS OF $0.18)
2021 PRELIMINARY OUTLOOK EXPECTS SALES OF AT LEAST $715 MILLION, GROWTH OF AT LEAST 20% ADJUSTED FOR DISCONTINUED SOOT SENSOR PRODUCT LINES
2020 Third-Quarter Results
| · | Earnings per diluted share (“EPS”) of $0.25 |
| · | Adjusted EPS of $0.18 |
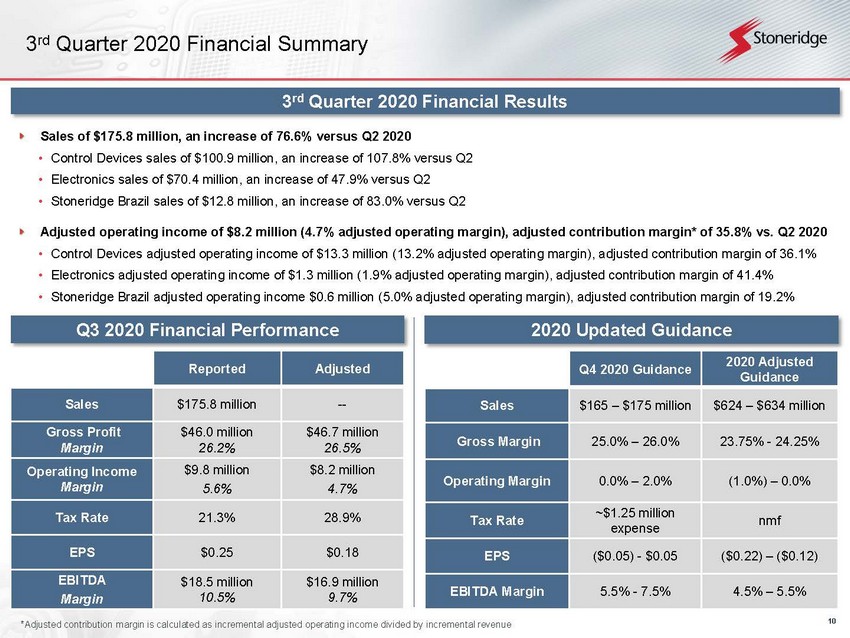
| · | Sales of $175.8 million |
| · | Gross profit of $46.0 million |
| · | Adjusted gross profit of $46.7 million (26.5% of sales) |
| · | Operating income of $9.8 million |
| · | Adjusted operating income of $8.2 million (4.7% of sales) |
| · | Adjusted EBITDA of $16.9 million (9.6% of sales) |
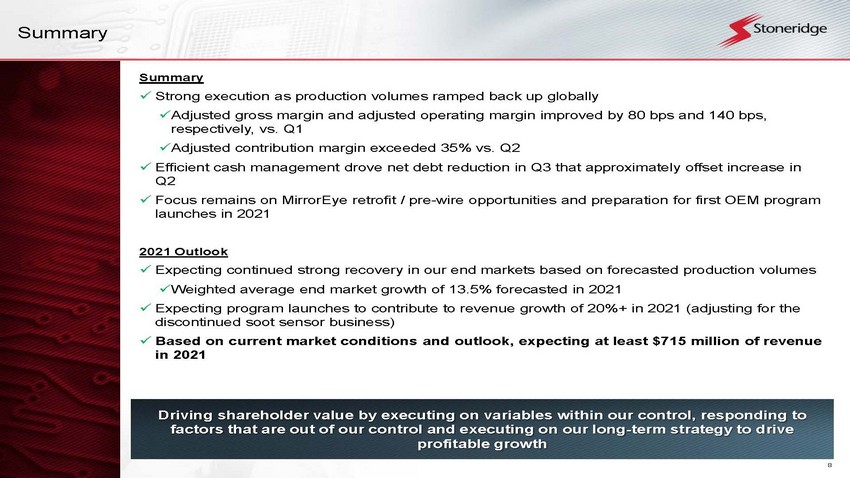
| · | Incremental adjusted operating margin on incremental revenue (“adjusted contribution margin”) of 35.8% vs. Q2 |
2020 Fourth-Quarter Guidance
| · | Sales of $165 - $175 million (2020 sales of $624 - $634 million) |
| · | Adjusted gross margin of 25.5% - 26.0% (2020 adjusted gross margin of 23.75% - 24.25%) |
| · | Adjusted operating margin of 0.0% - 2.0% (2020 adjusted operating margin of (1.0%) - 0.0%) |
| · | Adjusted EBITDA margin of 5.5% - 7.5% (2020 adjusted EBITDA margin of 4.5% - 5.5%) |
| · | Q4 tax expense expected to be approximately $1.25 million |
| · | Adjusted EPS of ($0.05) - $0.05 (2020 adjusted EPS of ($0.22) - ($0.12)) |
2021 Outlook
| · | Sales of at least $715 million (20%+ growth adjusted for discontinued soot sensor product lines) based on current market outlook |
NOVI, Mich. – October 28, 2020 – Stoneridge, Inc. (NYSE: SRI) today announced financial results for the third quarter ended September 30, 2020, with sales of $175.8 million and earnings per diluted share of $0.25. Adjusted EPS was $0.18 for the third quarter, considering normalizing adjustments as outlined in the exhibits attached hereto.
For the third quarter of 2020, Stoneridge reported gross profit of $46.0 million and adjusted gross profit of $46.7 million (26.5% of sales), which was an increase of adjusted gross margin of 12.1% relative to the second quarter of 2020. Operating income was $9.8 million and adjusted operating income was $8.2 million (4.7% of sales). Adjusted EBITDA was $16.9 million (9.6% of sales).
Jon DeGaynor, president and chief executive officer, commented, “In the third quarter, we experienced top-line growth that exceeded our previously outlined expectations due to strong recovery across our global end markets. We took advantage of the incremental revenue with improved gross and operating margins, resulting in an adjusted contribution margin of 35.8% relative to the second quarter, again exceeding our previously outlined expectations.”
| 1 |
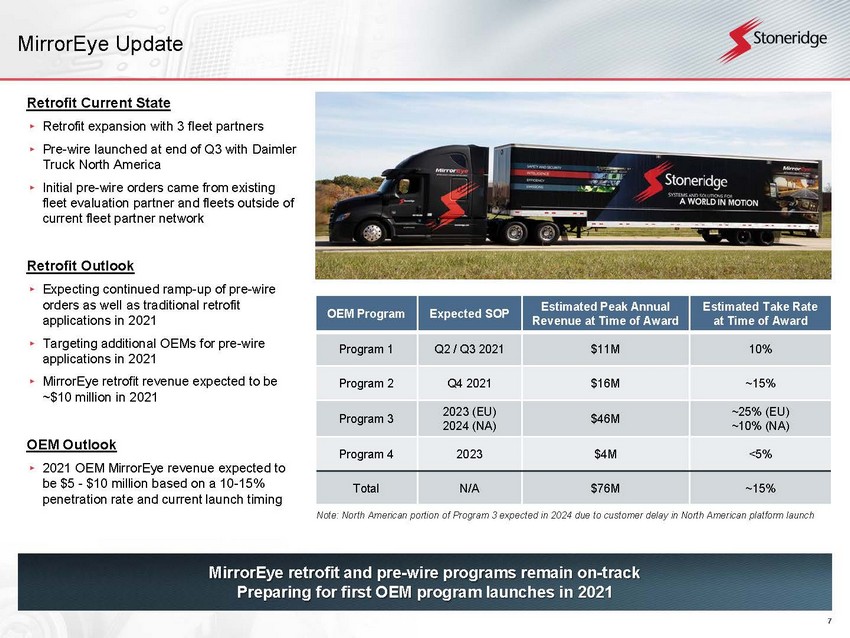
DeGaynor continued, “In the third quarter, we took several steps forward in our continued commercialization of MirrorEye®. Through our partnership with Daimler Trucks North America (“DTNA”), the pre-wire option became available at the end of the third quarter. We have already received orders from our existing fleet partners as well as from fleets that have not been a part of our long-term evaluation process. Looking forward to 2021, we expect the continued ramp-up of MirrorEye® retrofit orders in the traditional retrofit application, as well as through our pre-wire partnership with DTNA. In addition, we are pursuing pre-wire relationships with other OEMs and expect to launch our first OEM MirrorEye platforms in both North America and Europe in 2021.”
Third Quarter in Review
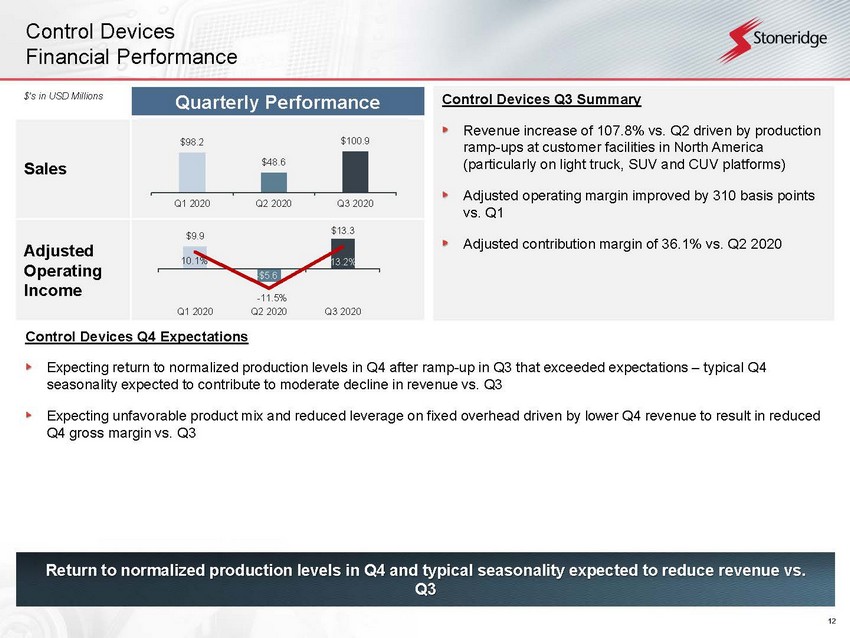
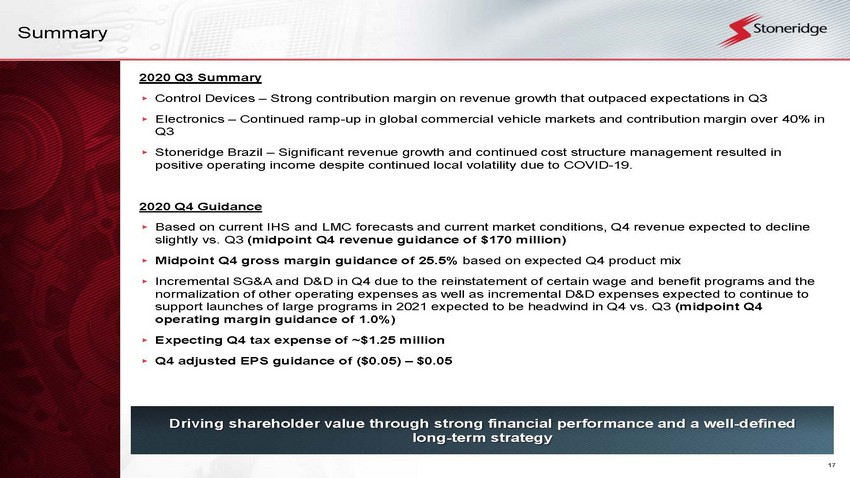
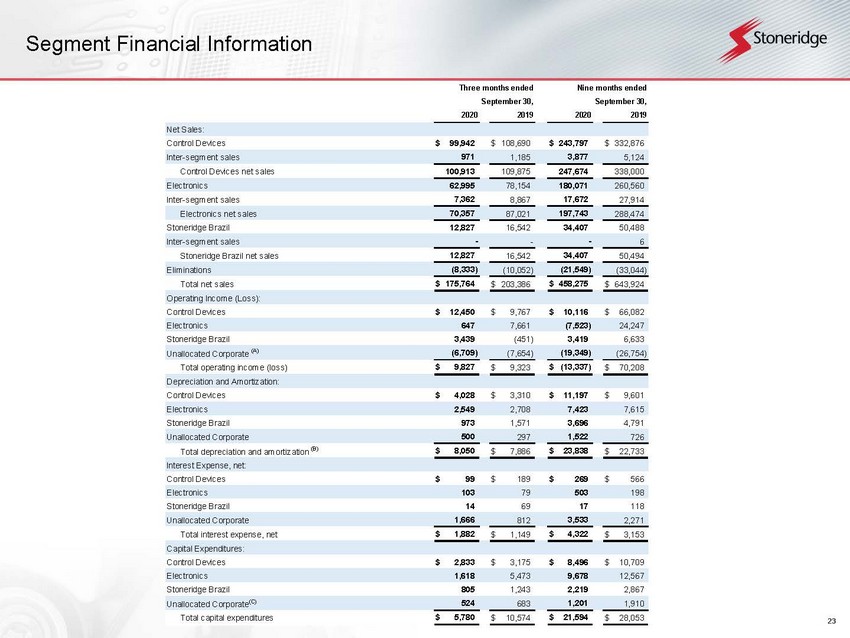
Control Devices sales totaled $100.9 million, an increase of $52.3 million, or 107.8%, as a result of the broad production volume increases primarily in the North America automotive market, relative to the second quarter of 2020. Control Devices adjusted gross margin increased primarily due to fixed cost leverage as a result of continued operational improvements as well as decreased direct material and labor costs as a percentage of sales compared to the second quarter of 2020. The segment’s adjusted operating income increased relative to the second quarter as a result of the increase in sales and gross margin as well as lower SG&A and D&D as a percentage of sales, resulting in an adjusted operating margin of 13.2%. Sales increased by approximately 2.8% and adjusted operating margin increased by 310 basis points compared to the first quarter.
Electronics sales totaled $70.4 million, an increase of $22.8 million, or 47.9%, relative to the second quarter of 2020 primarily as a result of broad production ramp-ups at customer facilities primarily in the North America and Europe commercial vehicle markets. Electronics adjusted gross margin increased primarily due to fixed cost leverage as a result of continued operational improvements as well as a decrease in direct materials as a percentage of sales compared to the second quarter of 2020. The segment’s adjusted operating income increased relative to the second quarter as a result of the increase in sales and gross margin as well as lower SG&A and D&D as a percentage of sales, resulting in an adjusted operating margin of 1.9%. Sales declined by approximately 11.8% while adjusted operating margin decreased by 170 basis points compared to the first quarter.
Stoneridge Brazil sales totaled $12.8 million, an increase of $5.8 million, or 83.0% relative to the second quarter primarily due to the increase in aftermarket, OEM and mass retail product sales. Stoneridge Brazil’s adjusted gross margin declined due to the increase in direct material costs as a result of product mix, partially offset by fixed cost leverage as compared to the second quarter. The segment’s adjusted operating income increased relative to the second quarter as a result of the increase in sales and lower SG&A and D&D expenses as a percentage of sales, resulting in an adjusted operating margin of 5.0%. Adjusted operating margin increased by 240 basis points compared to the first quarter despite a sales decline of approximately 12.0%.
Cash and Debt Balances
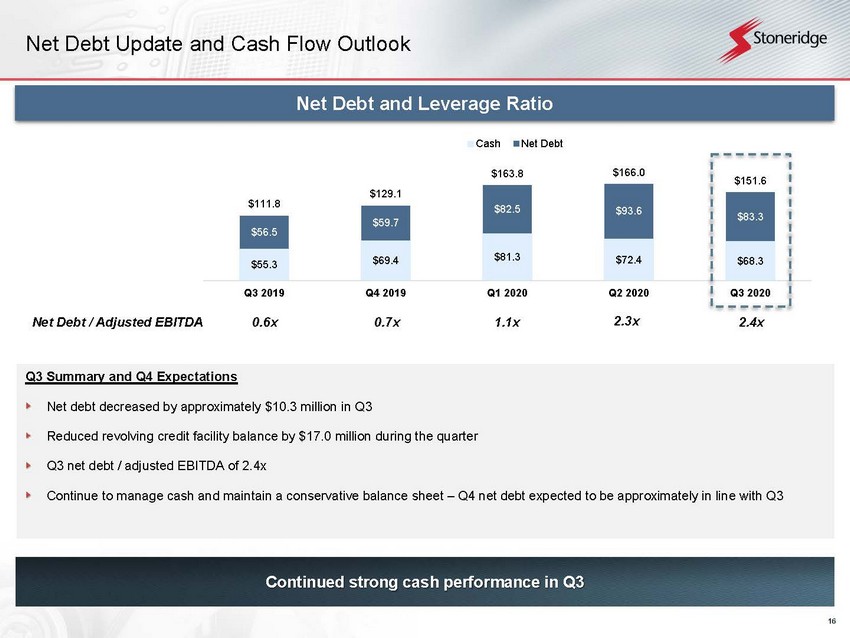
During the quarter, the Company reduced net debt by approximately $10.3 million relative to the prior quarter and repaid $17.0 million on its existing credit facility. At September 30, 2020, Stoneridge had cash and cash equivalents balances totaling $68.3 million. Total debt as of September 30, 2020 was $151.6 million. Total debt less cash and cash equivalents yielded a current net debt to trailing-twelve-month adjusted EBITDA ratio of approximately 2.4x. The Company had approximately $254.3 million of undrawn commitments under the existing credit facility as of September 30, 2020, which resulted in total undrawn commitments and cash balances of $322.6 million.
Outlook
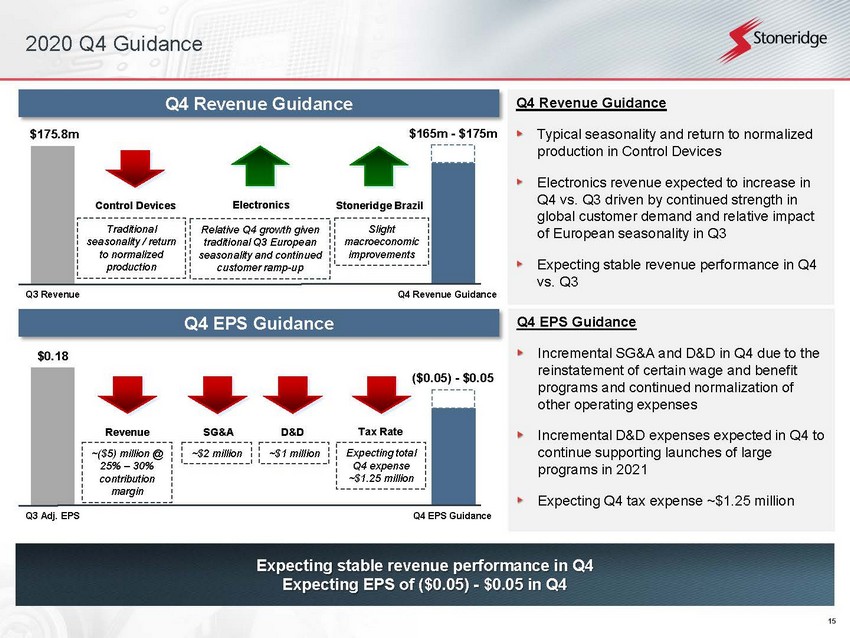
Bob Krakowiak, chief financial officer, commented, “We expect fourth quarter revenue to decline slightly relative to the third quarter based on the continued stabilization of global production, offset by historical seasonality in Control Devices. We expect continued strong margin performance however we anticipate incremental expenses due to the reinstatement of certain wage and benefit programs and the normalization of other operating expenses. Additionally, we expect incremental D&D expenses to continue to support launches of large programs in 2021. As a result, we are guiding fourth quarter adjusted earnings per share to a range of ($0.05) to $0.05.”
| 2 |
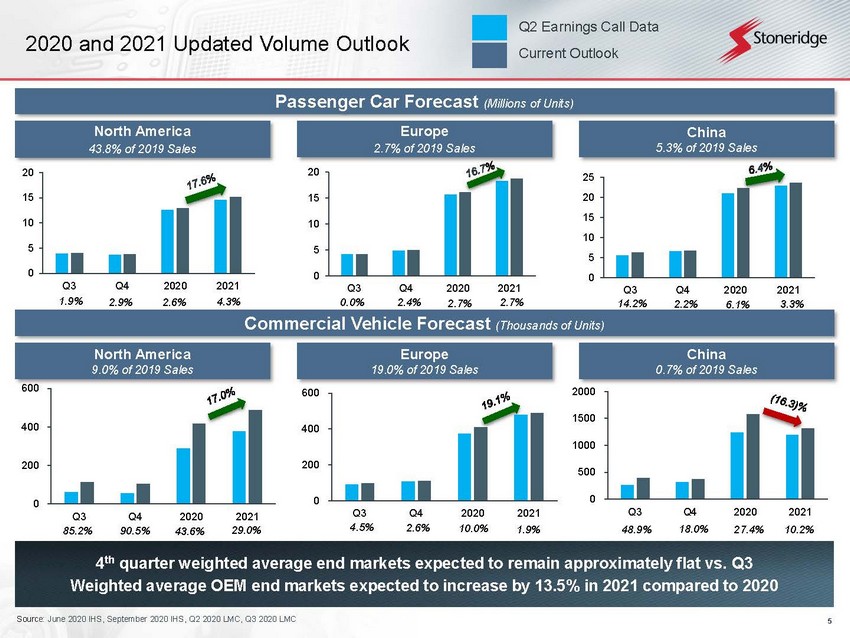
DeGaynor concluded, “We believe the actions we took in response to the global pandemic positioned each of our segments for continued long-term success. As we look into 2021, we expect continued recovery with production forecasts implying 13.5% growth in our weighted-average end markets. In addition, new program launches are expected to create significant growth opportunities for the Company in 2021 and beyond. As a result of production forecast tailwinds based on current market conditions, the continued ramp-up of our MirrorEye® retrofit programs and the launch of several new programs in 2021, we expect revenue to exceed $715 million next year, an increase of at least 20% adjusted for the discontinued soot sensor business. Stoneridge remains well positioned to capitalize on the industry megatrends that will drive outperformance of our underlying markets going forward.”
Conference Call on the Web
A live Internet broadcast of Stoneridge’s conference call regarding 2020 third-quarter results can be accessed at 9:00 a.m. Eastern Time on Thursday, October 29, 2020, at www.stoneridge.com, which will also offer a webcast replay.
About Stoneridge, Inc.
Stoneridge, Inc., headquartered in Novi, Michigan, is an independent designer and manufacturer of highly engineered electrical and electronic components, modules and systems principally for the automotive, commercial, off-highway, motorcycle and agricultural vehicle markets. Additional information about Stoneridge can be found at www.stoneridge.com.
Forward-Looking Statements
Statements in this release contain “forward-looking statements” under the Private Securities Litigation Reform Act of 1995. These statements appear in a number of places in this report and may include statements regarding the intent, belief or current expectations of the Company, with respect to, among other things, our (i) future product and facility expansion, (ii) acquisition strategy, (iii) investments and new product development, (iv) growth opportunities related to awarded business, and (v) operational expectations. Forward-looking statements may be identified by the words “will,” “may,” “should,” “designed to,” “believes,” “plans,” “projects,” “intends,” “expects,” “estimates,” “anticipates,” “continue,” and similar words and expressions. The forward-looking statements are subject to risks and uncertainties that could cause actual events or results to differ materially from those expressed in or implied by the statements. Important factors that could cause actual results to differ materially from those in the forward-looking statements include, among other factors:
| · | the impact of COVID-19, or other future pandemics, on the global economy, and on our customers, suppliers, employees, business and cash flows; |
| · | the reduced purchases, loss or bankruptcy of a major customer or supplier; |
| · | the costs and timing of business realignment, facility closures or similar actions; |
| · | a significant change in automotive, commercial, off-highway, motorcycle or agricultural vehicle production; |
| · | competitive market conditions and resulting effects on sales and pricing; |
| · | the impact of changes in foreign currency exchange rates on sales, costs and results, particularly the Argentinian peso, Brazilian real, Chinese renminbi, euro, Mexican peso and Swedish krona; |
| · | our ability to achieve cost reductions that offset or exceed customer-mandated selling price reductions; |
| · | customer acceptance of new products; |
| · | our ability to successfully launch/produce products for awarded business; |
| · | adverse changes in laws, government regulations or market conditions, including tariffs, affecting our products or our customers’ products; |
| · | our ability to protect our intellectual property and successfully defend against assertions made against us; |
| · | liabilities arising from warranty claims, product recall or field actions, product liability and legal proceedings to which we are or may become a party, or the impact of product recall or field actions on our customers; |
| · | labor disruptions at our facilities or at any of our significant customers or suppliers; |
| · | business disruption due to natural disasters or other disasters outside of our control; |
| 3 |
| · | the ability of our suppliers to supply us with parts and components at competitive prices on a timely basis, including the impact of potential tariffs and trade considerations on their operations and output; |
| · | the amount of our indebtedness and the restrictive covenants contained in the agreements governing our indebtedness, including our revolving credit facility; |
| · | capital availability or costs, including changes in interest rates or market perceptions; |
| · | the failure to achieve the successful integration of any acquired company or business; |
| · | risks related to a failure of our information technology systems and networks, and risks associated with current and emerging technology threats and damage from computer viruses, unauthorized access, cyber-attack and other similar disruptions; and |
| · | the items described in Part II Item 1A (“Risk Factors”) of the Company’s Quarterly Report on Form 10-Q for the period ended September 30, 2020 and in Part I, Item IA (“Risk Factors”) of our 2019 10-K filed with the SEC. |
The forward-looking statements contained herein represent our estimates only as of the date of this release and should not be relied upon as representing our estimates as of any subsequent date. While we may elect to update these forward-looking statements at some point in the future, we specifically disclaim any obligation to do so, whether to reflect actual results, changes in assumptions, changes in other factors affecting such forward-looking statements or otherwise.
Use of Non-GAAP Financial Information
This press release contains information about the Company’s financial results which is not presented in accordance
with accounting principles generally accepted in the United States (”GAAP”). Such non-GAAP financial measures are reconciled
to their closest GAAP financial measures at the end of this press release. The provision of these non-GAAP financial measures for
2020 and 2019 is not intended to indicate that Stoneridge is explicitly or implicitly providing projections on those non-GAAP financial
measures, and actual results for such measures are likely to vary from those presented. The reconciliations include all information
reasonably available to the Company at the date of this press release and the adjustments that management can reasonably predict.
Management believes the non-GAAP financial measures used in this press release are useful to both management and investors in their analysis of the Company’s financial position and results of operations. In particular, management believes that adjusted gross profit and margin, adjusted operating income (loss) and margin, adjusted net income (loss), adjusted earnings (loss) per share, adjusted EBITDA, adjusted contribution margin, net debt, adjusted income (loss) before tax and adjusted tax rate are useful measures in assessing the Company’s financial performance by excluding certain items that are not indicative of the Company’s core operating performance or that may obscure trends useful in evaluating the Company’s continuing operating activities. Management also believes that these measures are useful to both management and investors in their analysis of the Company’s results of operations and provide improved comparability between fiscal periods.
Adjusted gross profit and margin, adjusted operating income (loss) and margin, adjusted net income (loss), adjusted earnings (loss) per share, adjusted EBITDA, adjusted contribution margin, net debt, adjusted income (loss) before tax and adjusted tax rate should not be considered in isolation or as a substitute for gross profit, operating income (loss), net income (loss), earnings (loss) per share, debt, income (loss) before tax or tax rate prepared in accordance with GAAP.
For more information, contact Matthew R. Horvath, Executive Director Corporate Strategy and Investor Relations (Matthew.Horvath@Stoneridge.com) or Kelly Harvey, Director Investor Relations (Kelly.Harvey@Stoneridge.com)
| 4 |
| CONDENSED CONSOLIDATED STATEMENTS OF OPERATIONS |
| (Unaudited) |
| Three months ended | Nine months ended | |||||||||||||||
| September 30, | September 30, | |||||||||||||||
| (in thousands, except per share data) | 2020 | 2019 | 2020 | 2019 | ||||||||||||
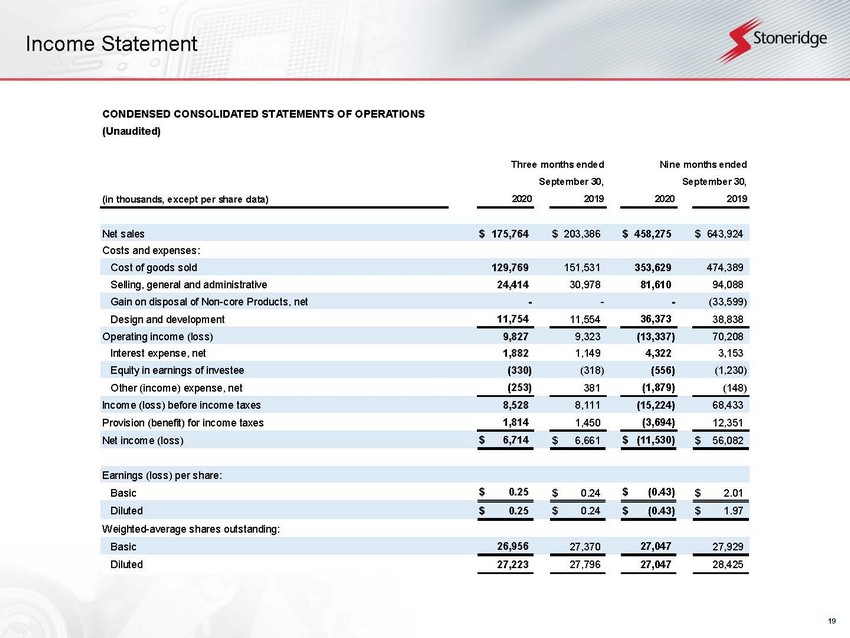
| Net sales | $ | 175,764 | $ | 203,386 | $ | 458,275 | $ | 643,924 | ||||||||
| Costs and expenses: | ||||||||||||||||
| Cost of goods sold | 129,769 | 151,531 | 353,629 | 474,389 | ||||||||||||
| Selling, general and administrative | 24,414 | 30,978 | 81,610 | 94,088 | ||||||||||||
| Gain on disposal of Non-core Products, net | - | - | - | (33,599 | ) | |||||||||||
| Design and development | 11,754 | 11,554 | 36,373 | 38,838 | ||||||||||||
| Operating income (loss) | 9,827 | 9,323 | (13,337 | ) | 70,208 | |||||||||||
| Interest expense, net | 1,882 | 1,149 | 4,322 | 3,153 | ||||||||||||
| Equity in earnings of investee | (330 | ) | (318 | ) | (556 | ) | (1,230 | ) | ||||||||
| Other (income) expense, net | (253 | ) | 381 | (1,879 | ) | (148 | ) | |||||||||
| Income (loss) before income taxes | 8,528 | 8,111 | (15,224 | ) | 68,433 | |||||||||||
| Provision (benefit) for income taxes | 1,814 | 1,450 | (3,694 | ) | 12,351 | |||||||||||
| Net income (loss) | $ | 6,714 | $ | 6,661 | $ | (11,530 | ) | $ | 56,082 | |||||||
| Earnings (loss) per share: | ||||||||||||||||
| Basic | $ | 0.25 | $ | 0.24 | $ | (0.43 | ) | $ | 2.01 | |||||||
| Diluted | $ | 0.25 | $ | 0.24 | $ | (0.43 | ) | $ | 1.97 | |||||||
| Weighted-average shares outstanding: | ||||||||||||||||
| Basic | 26,956 | 27,370 | 27,047 | 27,929 | ||||||||||||
| Diluted | 27,223 | 27,796 | 27,047 | 28,425 | ||||||||||||
| 5 |
CONDENSED CONSOLIDATED BALANCE SHEETS
| September 30, | December 31, | |||||||
| (in thousands) | 2020 | 2019 | ||||||
| (Unaudited) | ||||||||
| ASSETS | ||||||||
| Current assets: | ||||||||
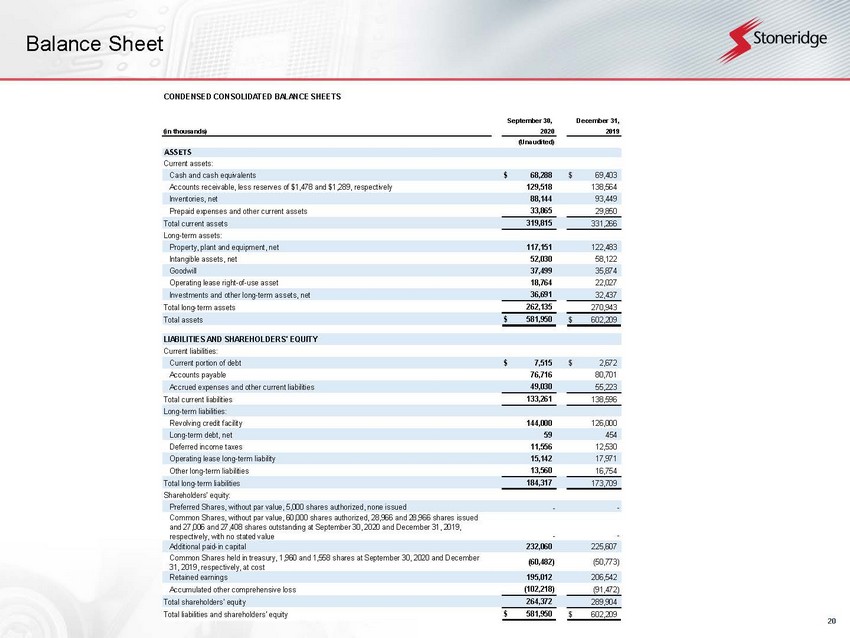
| Cash and cash equivalents | $ | 68,288 | $ | 69,403 | ||||
| Accounts receivable, less reserves of $1,478 and $1,289, respectively | 129,518 | 138,564 | ||||||
| Inventories, net | 88,144 | 93,449 | ||||||
| Prepaid expenses and other current assets | 33,865 | 29,850 | ||||||
| Total current assets | 319,815 | 331,266 | ||||||
| Long-term assets: | ||||||||
| Property, plant and equipment, net | 117,151 | 122,483 | ||||||
| Intangible assets, net | 52,030 | 58,122 | ||||||
| Goodwill | 37,499 | 35,874 | ||||||
| Operating lease right-of-use asset | 18,764 | 22,027 | ||||||
| Investments and other long-term assets, net | 36,691 | 32,437 | ||||||
| Total long-term assets | 262,135 | 270,943 | ||||||
| Total assets | $ | 581,950 | $ | 602,209 | ||||
| LIABILITIES AND SHAREHOLDERS' EQUITY | ||||||||
| Current liabilities: | ||||||||
| Current portion of debt | $ | 7,515 | $ | 2,672 | ||||
| Accounts payable | 76,716 | 80,701 | ||||||
| Accrued expenses and other current liabilities | 49,030 | 55,223 | ||||||
| Total current liabilities | 133,261 | 138,596 | ||||||
| Long-term liabilities: | ||||||||
| Revolving credit facility | 144,000 | 126,000 | ||||||
| Long-term debt, net | 59 | 454 | ||||||
| Deferred income taxes | 11,556 | 12,530 | ||||||
| Operating lease long-term liability | 15,142 | 17,971 | ||||||
| Other long-term liabilities | 13,560 | 16,754 | ||||||
| Total long-term liabilities | 184,317 | 173,709 | ||||||
| Shareholders' equity: | ||||||||
| Preferred Shares, without par value, 5,000 shares authorized, none issued | - | - | ||||||
| Common Shares, without par value, 60,000 shares authorized, 28,966 and 28,966 shares issued and 27,006 and 27,408 shares outstanding at September 30, 2020 and December 31, 2019, respectively, with no stated value | - | - | ||||||
| Additional paid-in capital | 232,060 | 225,607 | ||||||
| Common Shares held in treasury, 1,960 and 1,558 shares at September 30, 2020 and December 31, 2019, respectively, at cost | (60,482 | ) | (50,773 | ) | ||||
| Retained earnings | 195,012 | 206,542 | ||||||
| Accumulated other comprehensive loss | (102,218 | ) | (91,472 | ) | ||||
| Total shareholders' equity | 264,372 | 289,904 | ||||||
| Total liabilities and shareholders' equity | $ | 581,950 | $ | 602,209 | ||||
| 6 |
| CONDENSED CONSOLIDATED STATEMENTS OF CASH FLOWS |
| (Unaudited) |
| Nine months ended September 30 (in thousands) | 2020 | 2019 | ||||||
| OPERATING ACTIVITIES: | ||||||||
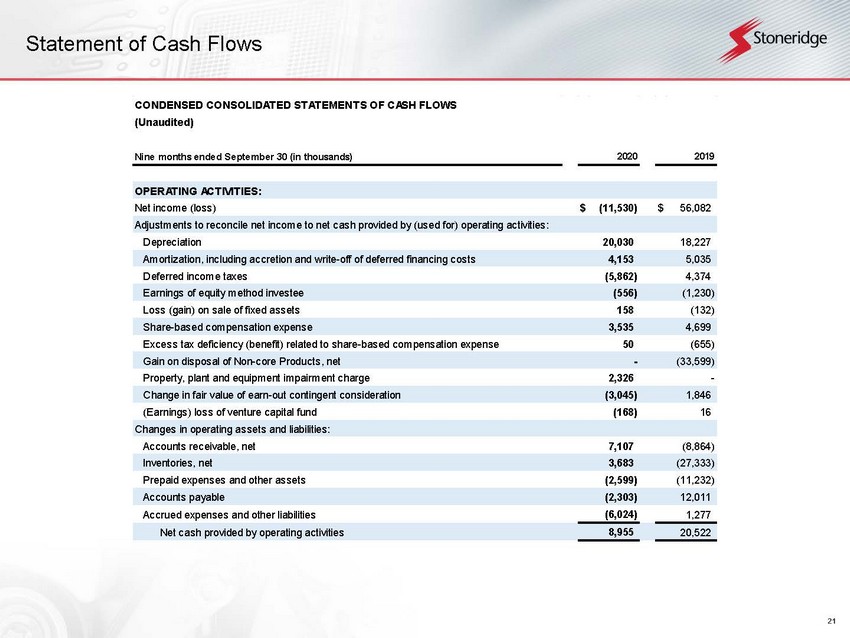
| Net income (loss) | $ | (11,530 | ) | $ | 56,082 | |||
| Adjustments to reconcile net income to net cash provided by (used for) operating activities: | ||||||||
| Depreciation | 20,030 | 18,227 | ||||||
| Amortization, including accretion and write-off of deferred financing costs | 4,153 | 5,035 | ||||||
| Deferred income taxes | (5,862 | ) | 4,374 | |||||
| Earnings of equity method investee | (556 | ) | (1,230 | ) | ||||
| Loss (gain) on sale of fixed assets | 158 | (132 | ) | |||||
| Share-based compensation expense | 3,535 | 4,699 | ||||||
| Excess tax deficiency (benefit) related to share-based compensation expense | 50 | (655 | ) | |||||
| Gain on disposal of Non-core Products, net | - | (33,599 | ) | |||||
| Property, plant and equipment impairment charge | 2,326 | - | ||||||
| Change in fair value of earn-out contingent consideration | (3,045 | ) | 1,846 | |||||
| (Earnings) loss of venture capital fund | (168 | ) | 16 | |||||
| Changes in operating assets and liabilities: | ||||||||
| Accounts receivable, net | 7,107 | (8,864 | ) | |||||
| Inventories, net | 3,683 | (27,333 | ) | |||||
| Prepaid expenses and other assets | (2,599 | ) | (11,232 | ) | ||||
| Accounts payable | (2,303 | ) | 12,011 | |||||
| Accrued expenses and other liabilities | (6,024 | ) | 1,277 | |||||
| Net cash provided by operating activities | 8,955 | 20,522 | ||||||
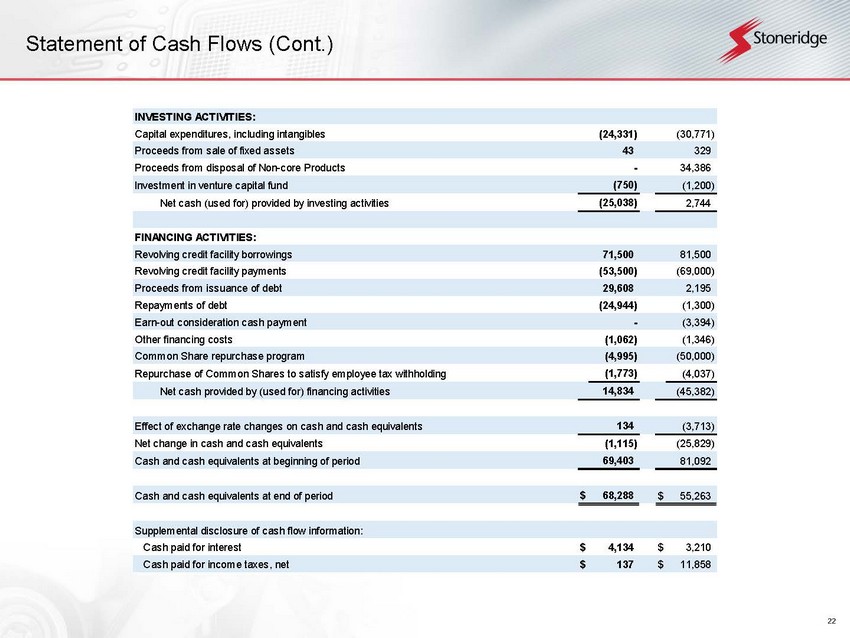
| INVESTING ACTIVITIES: | ||||||||
| Capital expenditures, including intangibles | (24,331 | ) | (30,771 | ) | ||||
| Proceeds from sale of fixed assets | 43 | 329 | ||||||
| Proceeds from disposal of Non-core Products | - | 34,386 | ||||||
| Investment in venture capital fund | (750 | ) | (1,200 | ) | ||||
| Net cash (used for) provided by investing activities | (25,038 | ) | 2,744 | |||||
| FINANCING ACTIVITIES: | ||||||||
| Revolving credit facility borrowings | 71,500 | 81,500 | ||||||
| Revolving credit facility payments | (53,500 | ) | (69,000 | ) | ||||
| Proceeds from issuance of debt | 29,608 | 2,195 | ||||||
| Repayments of debt | (24,944 | ) | (1,300 | ) | ||||
| Earn-out consideration cash payment | - | (3,394 | ) | |||||
| Other financing costs | (1,062 | ) | (1,346 | ) | ||||
| Common Share repurchase program | (4,995 | ) | (50,000 | ) | ||||
| Repurchase of Common Shares to satisfy employee tax withholding | (1,773 | ) | (4,037 | ) | ||||
| Net cash provided by (used for) financing activities | 14,834 | (45,382 | ) | |||||
| Effect of exchange rate changes on cash and cash equivalents | 134 | (3,713 | ) | |||||
| Net change in cash and cash equivalents | (1,115 | ) | (25,829 | ) | ||||
| Cash and cash equivalents at beginning of period | 69,403 | 81,092 | ||||||
| Cash and cash equivalents at end of period | $ | 68,288 | $ | 55,263 | ||||
| Supplemental disclosure of cash flow information: | ||||||||
| Cash paid for interest | $ | 4,134 | $ | 3,210 | ||||
| Cash paid for income taxes, net | $ | 137 | $ | 11,858 | ||||
| 7 |
Regulation G Non-GAAP Financial Measure Reconciliations
Reconciliation to US GAAP
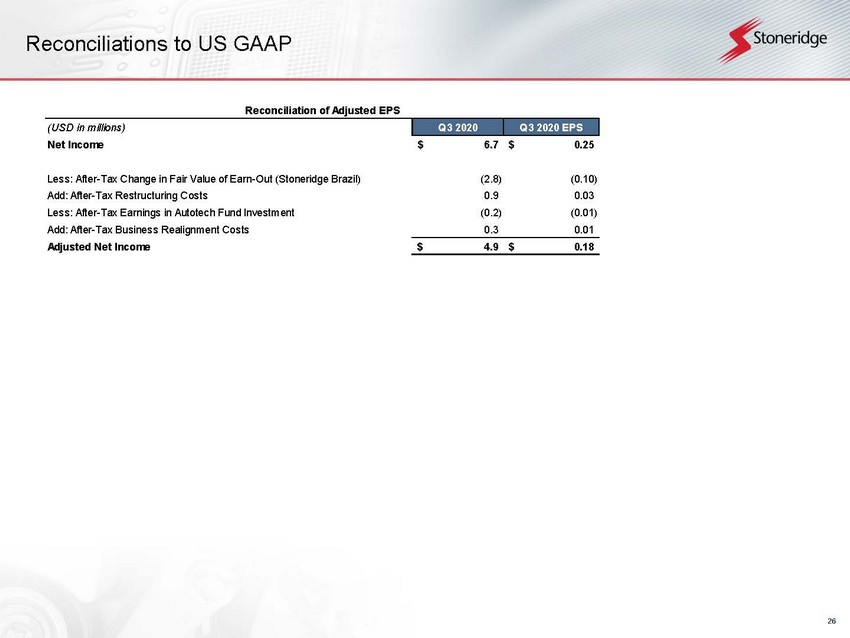
Exhibit 1 - Adjusted EPS
| Reconciliation of Adjusted EPS | ||||||||
| (USD in millions) | Q3 2020 | Q3 2020 EPS | ||||||
| Net Income | $ | 6.7 | $ | 0.25 | ||||
| Less: After-Tax Change in Fair Value of Earn-Out (Stoneridge Brazil) | (2.8 | ) | (0.10 | ) | ||||
| Add: After-Tax Restructuring Costs | 0.9 | 0.03 | ||||||
| Less: After-Tax Earnings in Autotech Fund Investment | (0.2 | ) | (0.01 | ) | ||||
| Add: After-Tax Business Realignment Costs | 0.3 | 0.01 | ||||||
| Adjusted Net Income | $ | 4.9 | $ | 0.18 | ||||
Exhibit 2 – Adjusted Operating Income (Loss) by Segment
| Reconciliation of Control Devices Adjusted Operating Income (Loss) | ||||||||||||
| (USD in millions) | Q1 2020 | Q2 2020 | Q3 2020 | |||||||||
| Control Devices Operating Income (Loss) | $ | 7.3 | $ | (9.7 | ) | $ | 12.5 | |||||
| Add: Pre-Tax Restructuring Costs | 2.2 | 3.0 | 0.5 | |||||||||
| Add: Pre-Tax Business Realignment Costs | 0.4 | 1.0 | 0.3 | |||||||||
| Control Devices Adjusted Operating Income (Loss) | $ | 9.9 | $ | (5.6 | ) | $ | 13.3 | |||||
| Reconciliation of Electronics Adjusted Operating Income (Loss) | ||||||||||||
| (USD in millions) | Q1 2020 | Q2 2020 | Q3 2020 | |||||||||
| Electronics Operating Income (Loss) | $ | 2.9 | $ | (11.0 | ) | $ | 0.6 | |||||
| Add: Pre-Tax Restructuring Costs | 0.0 | 1.6 | 0.6 | |||||||||
| Add: Pre-Tax Business Realignment Costs | - | 1.3 | 0.1 | |||||||||
| Electronics Adjusted Operating Income (Loss) | $ | 2.9 | $ | (8.1 | ) | $ | 1.3 | |||||
| Reconciliation of Stoneridge Brazil Adjusted Operating Income (Loss) | ||||||||||||
| (USD in millions) | Q1 2020 | Q2 2020 | Q3 2020 | |||||||||
| Stoneridge Brazil Operating Income (Loss) | $ | 0.9 | $ | (0.9 | ) | $ | 3.4 | |||||
| Add(Less): Pre-Tax Change in Fair Value of Earn-Out (Stoneridge Brazil) | (0.6 | ) | 0.4 | (2.8 | ) | |||||||
| Add: Pre-Tax Business Realignment Costs | 0.2 | - | 0.0 | |||||||||
| Stoneridge Brazil Adjusted Operating Income (Loss) | $ | 0.4 | $ | (0.5 | ) | $ | 0.6 | |||||
Exhibit 3 – Adjusted Operating Income (Loss)
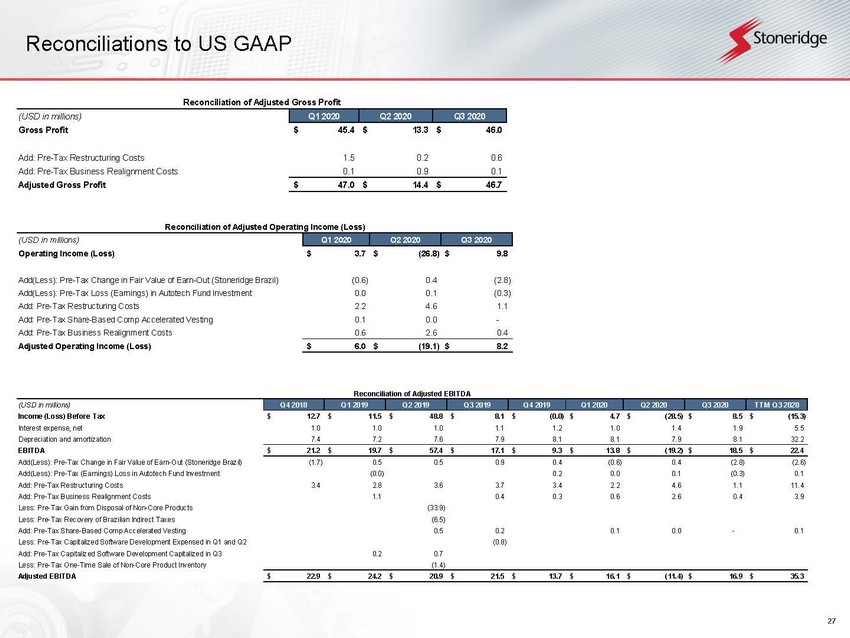
| Reconciliation of Adjusted Operating Income (Loss) | ||||||||
| (USD in millions) | Q2 2020 | Q3 2020 | ||||||
| Operating Income (Loss) | $ | (26.8 | ) | $ | 9.8 | |||
| Add(Less): Pre-Tax Change in Fair Value of Earn-Out (Stoneridge Brazil) | 0.4 | (2.8 | ) | |||||
| Add(Less): Pre-Tax Loss (Earnings) in Autotech Fund Investment | 0.1 | (0.3 | ) | |||||
| Add: Pre-Tax Restructuring Costs | 4.6 | 1.1 | ||||||
| Add: Pre-Tax Share-Based Comp Accelerated Vesting | 0.0 | - | ||||||
| Add: Pre-Tax Business Realignment Costs | 2.6 | 0.4 | ||||||
| Adjusted Operating Income (Loss) | $ | (19.1 | ) | $ | 8.2 | |||
| 8 |
Exhibit 4 – Adjusted EBITDA
| Reconciliation of Adjusted EBITDA | ||||||||||||||||||||
| (USD in millions) | Q4 2019 | Q1 2020 | Q2 2020 | Q3 2020 | TTM Q3 2020 | |||||||||||||||
| Income (Loss) Before Tax | $ | (0.0 | ) | $ | 4.7 | $ | (28.5 | ) | $ | 8.5 | $ | (15.3 | ) | |||||||
| Interest expense, net | 1.2 | 1.0 | 1.4 | 1.9 | 5.5 | |||||||||||||||
| Depreciation and amortization | 8.1 | 8.1 | 7.9 | 8.1 | 32.2 | |||||||||||||||
| EBITDA | $ | 9.3 | $ | 13.8 | $ | (19.2 | ) | $ | 18.5 | $ | 22.4 | |||||||||
| Add(Less): Pre-Tax Change in Fair Value of Earn-Out (Stoneridge Brazil) | 0.4 | (0.6 | ) | 0.4 | (2.8 | ) | (2.6 | ) | ||||||||||||
| Add(Less): Pre-Tax Loss (Earnings) in Autotech Fund Investment | 0.2 | 0.0 | 0.1 | (0.3 | ) | 0.1 | ||||||||||||||
| Add: Pre-Tax Restructuring Costs | 3.4 | 2.2 | 4.6 | 1.1 | 11.4 | |||||||||||||||
| Add: Pre-Tax Business Realignment Costs | 0.3 | 0.6 | 2.6 | 0.4 | 3.9 | |||||||||||||||
| Add: Pre-Tax Share-Based Comp Accelerated Vesting | 0.1 | 0.0 | - | 0.1 | ||||||||||||||||
| Adjusted EBITDA | $ | 13.7 | $ | 16.1 | $ | (11.4 | ) | $ | 16.9 | $ | 35.3 | |||||||||
Exhibit 5 – Adjusted Gross Profit
| Reconciliation of Adjusted Gross Profit | ||||||||
| (USD in millions) | Q2 2020 | Q3 2020 | ||||||
| Gross Profit | $ | 13.3 | $ | 46.0 | ||||
| Add: Pre-Tax Restructuring Costs | 0.2 | 0.6 | ||||||
| Add: Pre-Tax Business Realignment Costs | 0.9 | 0.1 | ||||||
| Adjusted Gross Profit | $ | 14.4 | $ | 46.7 | ||||
Exhibit 6 – Adjusted Tax Rate
| Reconciliation of Adjusted Tax Rate | ||||
| (USD in millions) | Q3 2020 | |||
| Income Before Tax | $ | 8.5 | ||
| Less: Pre-Tax Change in Fair Value of Earn-Out (Stoneridge Brazil) | (2.8 | ) | ||
| Less: Pre-Tax Earnings in Autotech Fund Investment | (0.3 | ) | ||
| Add: Pre-Tax Restructuring Costs | 1.1 | |||
| Add: Pre-Tax Business Realignment Costs | 0.4 | |||
| Adjusted Income Before Tax | $ | 6.9 | ||
| Income Tax Expense | $ | 1.8 | ||
| Add: Tax Impact From Pre-Tax Adjustments | 0.2 | |||
| Adjusted Income Tax Expense | $ | 2.0 | ||
| Adjusted Tax Rate | 28.9 | % | ||
| 9 |