Exhibit 99.1
|
|
| |
ANNALY CAPITAL MANAGEMENT, INC. REPORTS 1st QUARTER 2017 RESULTS
NEW YORK--(BUSINESS WIRE)—May 3, 2017 -- Annaly Capital Management, Inc. (NYSE: NLY) (the "Company" or "Annaly") today announced its financial results for the quarter ended March 31, 2017.
|
·
|
Improvement in earnings quality and growth in book value for the quarter ended March 31, 2017
|
|
·
|
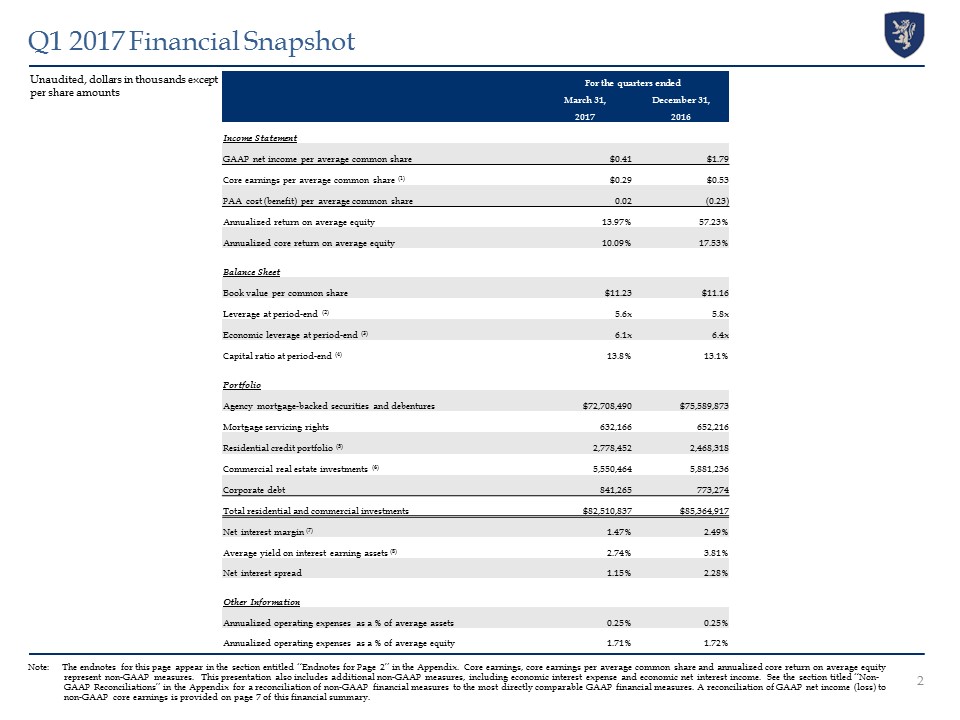
GAAP net income was $440.4 million, $0.41 per average common share
|
|
·
|
Core earnings was $318.0 million, $0.29 per average common share, which was reduced by a premium amortization adjustment ("PAA") cost of $0.02 per average common share. Comparatively, core earnings for the fourth quarter of 2016 was $0.53 per average common share, which was increased by a PAA benefit of $0.23 per average common share for that period
|
|
·
|
Common stock book value per share increased to $11.23 as compared to $11.16 per share at December 31, 2016
|
|
·
|
Declared common dividend of $0.30 for the 14th consecutive fiscal quarter
|
|
·
|
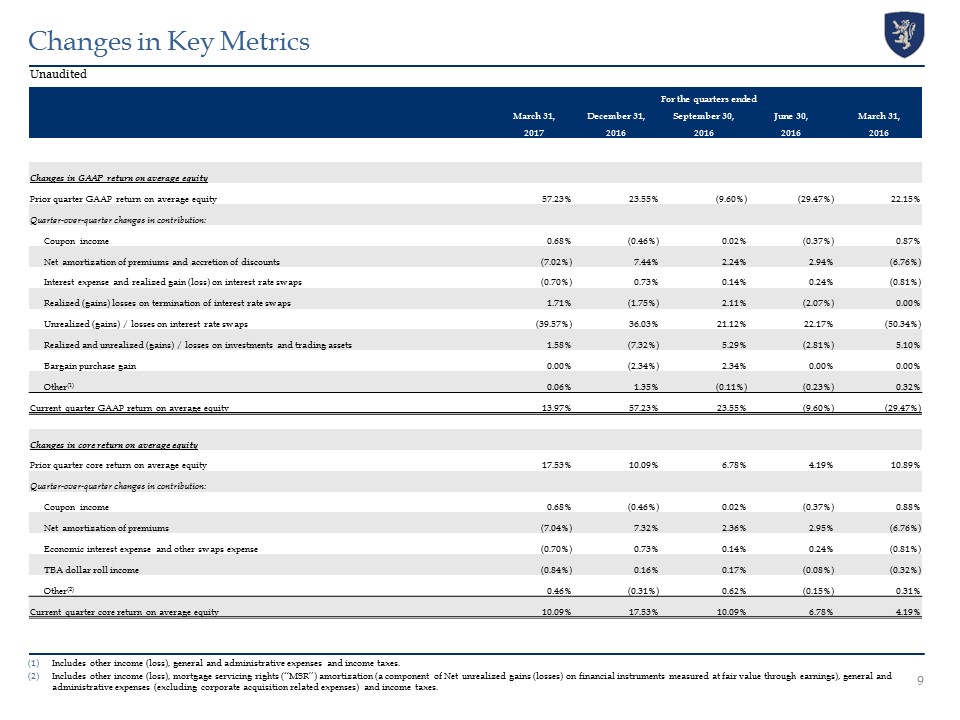
GAAP return on average equity was 13.97% and core return on average equity was 10.09%
|
|
·
|
Economic leverage decreased to 6.1x as compared to 6.4x at December 31, 2016
|
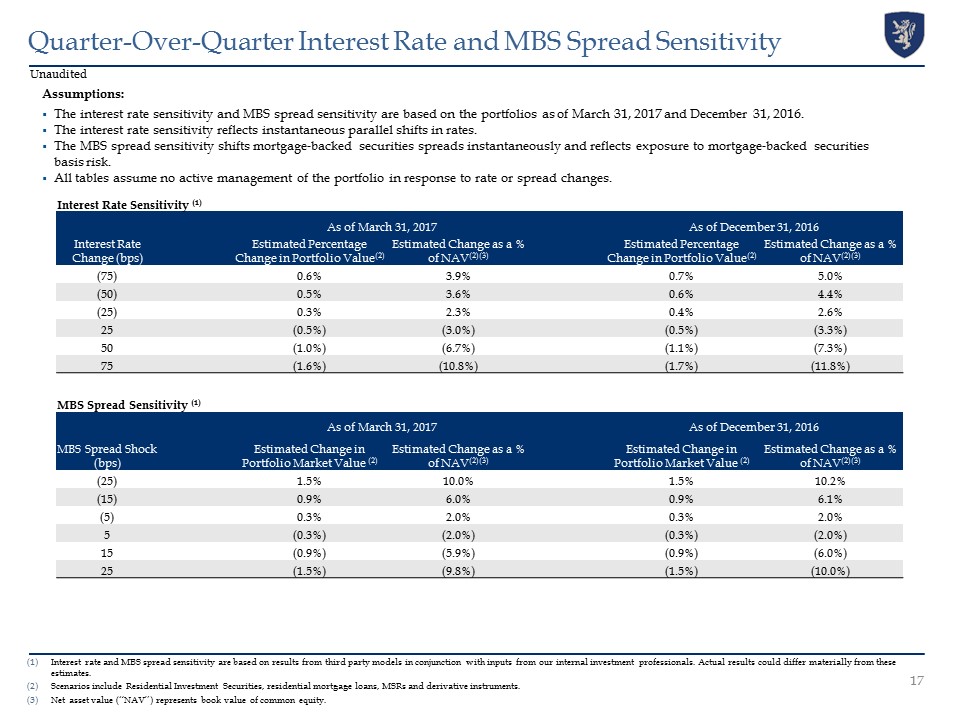
"I am very pleased with our continued strong results for the first quarter highlighted by our growth in book value and the improved quality of our earnings," commented Kevin Keyes, Chief Executive Officer and President. "We continue to benefit from our enhanced size, conservative leverage profile and portfolio diversification; we are now 19x the size of the median mREIT and our economic leverage of 6.1x remained nearly 20% lower than the agency industry average. As we've consistently stressed, liquidity is of paramount importance when operating in this marketplace and, as of quarter end, we have maintained $7.4 billion in unencumbered assets to opportunistically invest at attractive entry points. As a direct result of our enhanced hedging strategies and comprehensive diversification efforts, which now include approximately 30 investment options across four investment groups, Annaly's interest rate sensitivity has been meaningfully reduced and potential for growth further expanded.
"In addition, our prudent risk management is reflective of the fact that within our shared capital model, our investment teams' interests are aligned with our shareholders. While numerous other management teams in the industry have been selling stock recently - our people have been purchasing stock through our Employee Stock Ownership Program -- whereby over 40% of all our employees were not granted stock, but rather, have been asked to purchase predetermined amounts of shares in the open market. Establishing a long term ownership culture throughout the Firm is extremely important to me and I'm pleased that as of March 31, 2017, all individuals subject to these guidelines either met or, within the applicable period, are expected to meet these stock ownership guidelines. This broad-based initiative is not just unique in our industry, it is unique in all of corporate America."
"Our quarterly financial results demonstrated sequential improvement in both earnings quality and book value," added Glenn Votek, Chief Financial Officer. "Of note, the fourth quarter's GAAP and core earnings included a significant PAA benefit versus our first quarter results which reflected a PAA cost. While we no longer exclude the PAA from our core results, we continue to separately disclose this amount to help investors better understand our performance."
Disclosure of Non-GAAP Financial Measures
To supplement its consolidated financial statements, which are prepared and presented in accordance with U.S. generally accepted accounting principles ("GAAP"), the Company provides non-GAAP financial measures to enhance investor understanding of the Company's period-over-period operating performance and business trends, as well as for assessing the Company's performance versus that of industry peers. Prior to the fourth quarter 2016, the Company's definition of "core earnings", a non-GAAP measure, excluded the PAA resulting from the quarter-over-quarter change in estimated long-term constant prepayment rate ("CPR").
Based upon recent regulatory guidance and interpretations on the use of non-GAAP financial measures, in its fourth quarter 2016 filings, news releases and presentations, the Company furnished both unrevised non-GAAP financial measures that excluded the PAA as well as revised non-GAAP financial measures that included the PAA. In addition, the Company indicated that the fourth quarter 2016 would be the final quarter that the Company would report core earnings metrics that exclude the PAA. Beginning with the first quarter 2017, the Company is no longer disclosing non-GAAP financial measures that exclude the PAA. However, given its usefulness in evaluating the Company's financial performance, the Company is continuing to separately disclose the PAA. Additionally, comparative prior period results reported in the current and future periods will conform to the revised presentation.
The Company believes its non-GAAP financial measures are useful for management, investors, analysts, and other interested parties in evaluating the Company's performance but should not be viewed in isolation and are not a substitute for financial measurements computed in accordance with GAAP. Please refer to the "Non-GAAP Financial Measures" section for additional information.
1
Financial Performance
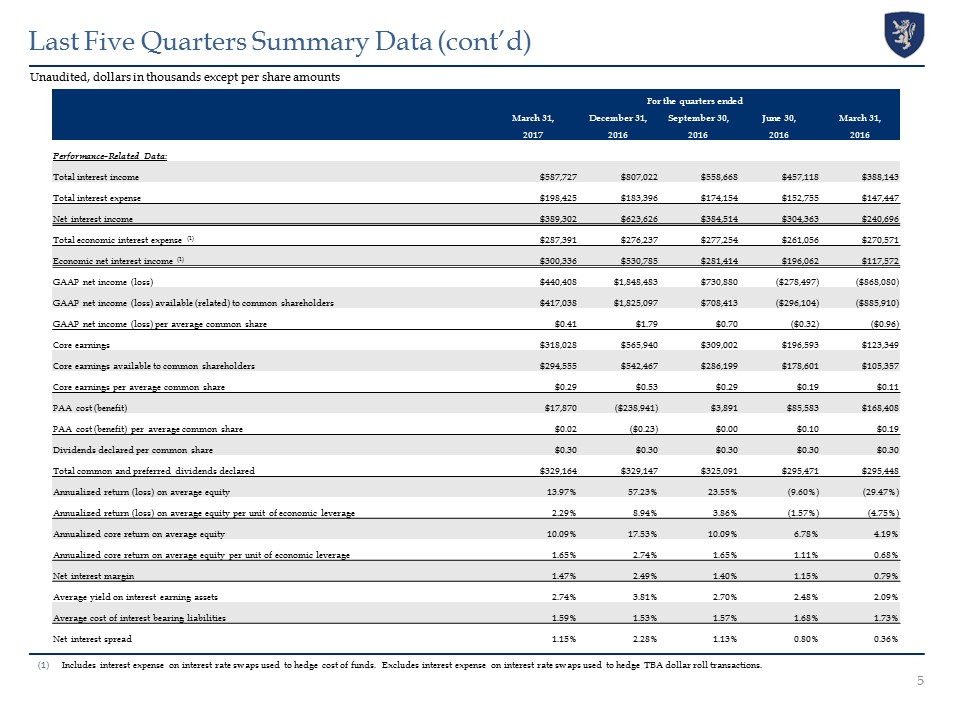
The following table summarizes certain key performance indicators as of and for the quarters ended March 31, 2017, December 31, 2016, and March 31, 2016:
|
March 31, 2017
|
December 31, 2016
|
March 31, 2016
|
||||||||||
|
Book value per common share
|
$
|
11.23
|
$
|
11.16
|
$
|
11.61
|
||||||
|
Economic leverage at period-end (1)
|
6.1:1
|
6.4:1
|
6.2:1
|
|||||||||
|
GAAP net income (loss) per average common share
|
$
|
0.41
|
$
|
1.79
|
$
|
(0.96
|
)
|
|||||
|
Core earnings per average common share (2)*
|
$
|
0.29
|
$
|
0.53
|
$
|
0.11
|
||||||
|
PAA cost (benefit) per average common share
|
$
|
0.02
|
$
|
(0.23
|
)
|
$
|
0.19
|
|||||
|
Annualized return (loss) on average equity
|
13.97
|
%
|
57.23
|
%
|
(29.47
|
%)
|
||||||
|
Annualized core return on average equity *
|
10.09
|
%
|
17.53
|
%
|
4.19
|
%
|
||||||
|
Net interest margin (3)
|
1.47
|
%
|
2.49
|
%
|
0.79
|
%
|
||||||
|
Net interest spread
|
1.15
|
%
|
2.28
|
%
|
0.36
|
%
|
||||||
|
Average yield on interest earning assets
|
2.74
|
%
|
3.81
|
%
|
2.09
|
%
|
||||||
|
*
|
Represents a non-GAAP financial measure. Please refer to the 'Non-GAAP Financial Measures' section for additional information.
|
|
(1)
|
Computed as the sum of recourse debt, to-be-announced ("TBA") derivative notional outstanding and net forward purchases of investments divided by total equity. Recourse debt consists of repurchase agreements and other secured financing. Securitized debt, participation sold and mortgages payable are non-recourse to the Company and are excluded from this measure.
|
|
(2)
|
Core earnings is defined as net income (loss) excluding gains or losses on disposals of investments and termination of interest rate swaps, unrealized gains or losses on interest rate swaps and investments measured at fair value through earnings, net gains and losses on trading assets, impairment losses, net income (loss) attributable to noncontrolling interest, corporate acquisition related expenses and certain other non-recurring gains or losses, and inclusive of TBA dollar roll income (a component of Net gains (losses) on trading assets) and realized amortization of MSRs (a component of net unrealized gains (losses) on investments measured at fair value through earnings).
|
|
(3)
|
Represents the sum of the Company's annualized economic net interest income (inclusive of interest expense on interest rate swaps used to hedge cost of funds) plus TBA dollar roll income (less interest expense on swaps used to hedge TBA dollar roll transactions) divided by the sum of its average interest earning assets plus average outstanding TBA derivative balances. Average interest earning assets reflects the average amortized cost of our investments during the period.
|
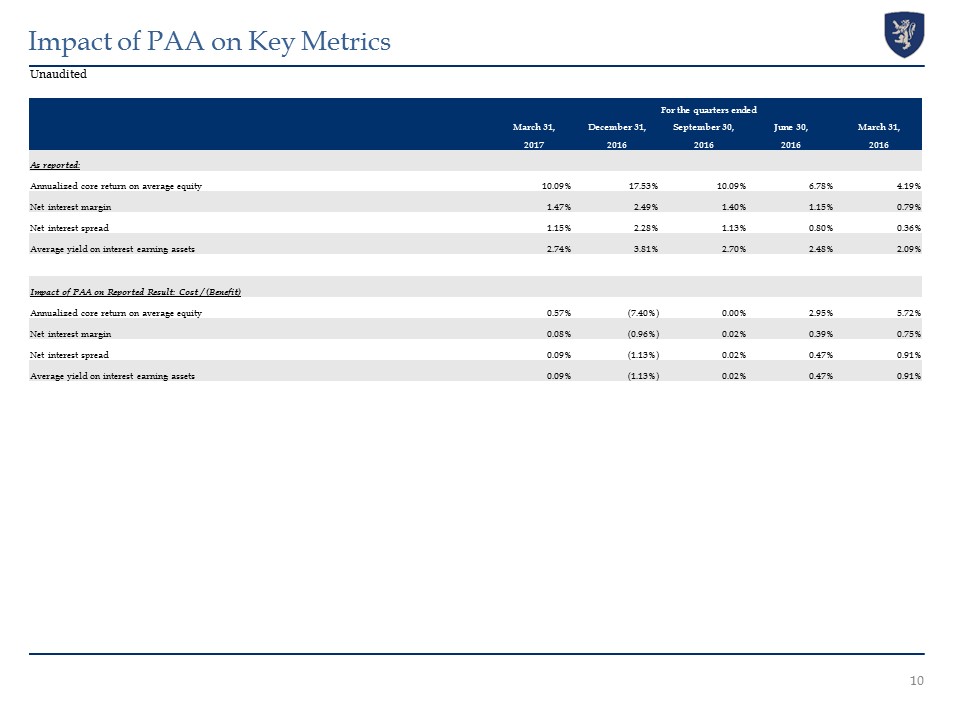
The following table illustrates the cost (benefit) impact of the PAA on certain key performance indicators as of and for the quarters ended March 31, 2017, December 31, 2016 and March 31, 2016:
|
March 31, 2017
|
December 31, 2016
|
March 31, 2016
|
||||||||||||||||||||||
|
As reported
|
PAA impact: cost / (benefit)
|
As reported
|
PAA impact: cost / (benefit)
|
As reported
|
PAA impact: cost / (benefit)
|
|||||||||||||||||||
|
Annualized core return on average equity *
|
10.09
|
%
|
0.57
|
%
|
17.53
|
%
|
(7.40
|
%)
|
4.19
|
%
|
5.72
|
%
|
||||||||||||
|
Net interest margin
|
1.47
|
%
|
0.08
|
%
|
2.49
|
%
|
(0.96
|
%)
|
0.79
|
%
|
0.75
|
%
|
||||||||||||
|
Net interest spread
|
1.15
|
%
|
0.09
|
%
|
2.28
|
%
|
(1.13
|
%)
|
0.36
|
%
|
0.91
|
%
|
||||||||||||
|
Average yield on interest earning assets
|
2.74
|
%
|
0.09
|
%
|
3.81
|
%
|
(1.13
|
%)
|
2.09
|
%
|
0.91
|
%
|
||||||||||||
|
* Represents a non-GAAP financial measure. Please refer to the 'Non-GAAP Financial Measures' section for additional information.
|
Amortization
In accordance with GAAP, the Company amortizes or accretes premiums or discounts into interest income for its Agency mortgage-backed securities, excluding interest-only securities, taking into account estimates of future principal prepayments in the calculation of the effective yield. The Company recalculates the effective yield as differences between anticipated and actual prepayments occur. Using third-party model and market information to project future cash flows and expected remaining lives of securities, the effective interest rate determined for each security is applied as if it had been in place from the date of the security's acquisition. The amortized cost of the security is then adjusted to the amount that would have existed had the new effective yield been applied since the acquisition date. The adjustment to amortized cost is offset with a charge or credit to interest income. Changes in interest rates and other market factors will impact prepayment speed projections and the amount of premium amortization recognized in any given period.
The Company's GAAP metrics include the unadjusted impact of amortization and accretion associated with this method. In its fourth quarter 2016 filings, news releases and presentations, the Company furnished both unrevised non-GAAP financial measures that excluded the PAA as well as revised non-GAAP financial measures that included the PAA. In addition, the Company indicated that the fourth quarter 2016 would be the final quarter that the Company would report core earnings metrics that exclude the PAA. Beginning with the first quarter 2017, the Company is no longer disclosing non-GAAP financial measures that exclude the PAA. However, given its usefulness in evaluating the Company's financial performance, the Company is continuing to separately disclose the PAA, as contained herein.
The following table illustrates the impact of quarter-over-quarter changes to long-term CPR estimates on premium amortization expense for the Company's Residential Investment Securities portfolio for the quarters ended March 31, 2017, December 31, 2016, and March 31, 2016:
2
|
For the quarters ended
|
||||||||||||
|
March 31, 2017
|
December 31, 2016
|
March 31, 2016
|
||||||||||
|
(dollars in thousands)
|
||||||||||||
|
Premium amortization expense (accretion)
|
$
|
203,634
|
$
|
(19,812
|
)
|
$
|
355,671
|
|||||
|
Less: PAA cost (benefit)
|
17,870
|
(238,941
|
)
|
168,408
|
||||||||
|
Premium amortization expense exclusive of PAA
|
$
|
185,764
|
$
|
219,129
|
$
|
187,263
|
||||||
|
For the quarters ended
|
||||||||||||
|
March 31, 2017
|
December 31, 2016
|
March 31, 2016
|
||||||||||
|
(per average common share)
|
||||||||||||
|
Premium amortization expense (accretion)
|
$
|
0.20
|
$
|
(0.02
|
)
|
$
|
0.38
|
|||||
|
Less: PAA cost (benefit)
|
0.02
|
(0.23
|
)
|
0.19
|
||||||||
|
Premium amortization expense exclusive of PAA
|
$
|
0.18
|
$
|
0.21
|
$
|
0.19
|
||||||
Other Information
This news release and our public documents to which we refer contain or incorporate by reference certain forward-looking statements which are based on various assumptions (some of which are beyond our control) and may be identified by reference to a future period or periods or by the use of forward-looking terminology, such as "may," "will," "believe," "expect," "anticipate," "continue," or similar terms or variations on those terms or the negative of those terms. Actual results could differ materially from those set forth in forward-looking statements due to a variety of factors, including, but not limited to, changes in interest rates; changes in the yield curve; changes in prepayment rates; the availability of mortgage-backed securities and other securities for purchase; the availability of financing and, if available, the terms of any financings; changes in the market value of our assets; changes in business conditions and the general economy; our ability to grow our commercial business; our ability to grow our residential mortgage credit business; credit risks related to our investments in credit risk transfer securities, residential mortgage-backed securities and related residential mortgage credit assets, commercial real estate assets and corporate debt; risks related to investments in mortgage servicing rights and ownership of a servicer; our ability to consummate any contemplated investment opportunities; changes in government regulations affecting our business; our ability to maintain our qualification as a REIT for U.S. federal income tax purposes; and our ability to maintain our exemption from registration under the Investment Company Act of 1940, as amended. For a discussion of the risks and uncertainties which could cause actual results to differ from those contained in the forward-looking statements, see "Risk Factors" in our most recent Annual Report on Form 10-K and any subsequent Quarterly Reports on Form 10-Q. We do not undertake, and specifically disclaim any obligation, to publicly release the result of any revisions which may be made to any forward-looking statements to reflect the occurrence of anticipated or unanticipated events or circumstances after the date of such statements, except as required by law.
Annaly is a leading diversified capital manager that invests in and finances residential and commercial assets. Since our founding in 1996 and subsequent initial public offering ("IPO") in 1997, we have generated net income for distribution to our shareholders and have preserved capital through the prudent selection of investments and continued management of our portfolio. The Company's portfolio includes securities, loans and equity in both the residential and commercial markets. Annaly has elected to be taxed as a real estate investment trust, or REIT, for federal income tax purposes. Annaly is externally managed by Annaly Management Company LLC. Annaly's manager guides the Company's overall business strategy and oversees its investment portfolio and financial services processes and solutions.
The Company prepares a supplemental investor presentation and a financial summary for the benefit of its shareholders. Both the First Quarter 2017 Investor Presentation and the First Quarter 2017 Financial Summary can be found at the Company's website (www.annaly.com) in the Investors section under Investor Presentations.
Conference Call
The Company will hold the first quarter 2017 earnings conference call on May 4, 2017 at 10:00 a.m. Eastern Time. The number to call is 888-317-6003 for domestic calls and 412-317-6061 for international calls. The conference passcode is 0692131. There will also be an audio webcast of the call on www.annaly.com. The replay of the call will be available for one week following the conference call. The replay number is 877-344-7529 for domestic calls and 412-317-0088 for international calls and the conference passcode is 10104196. If you would like to be added to the e-mail distribution list, please visit www.annaly.com, click on Investors, then select Email Alerts and complete the email notification form.
3
|
ANNALY CAPITAL MANAGEMENT, INC. AND SUBSIDIARIES
|
||||||||||||||||||||
|
CONSOLIDATED STATEMENTS OF FINANCIAL CONDITION
|
||||||||||||||||||||
|
(dollars in thousands, except per share data)
|
||||||||||||||||||||
|
March 31,
|
December 31,
|
September 30,
|
June 30,
|
March 31,
|
||||||||||||||||
|
2017(1)
|
2016(2)
|
2016
|
2016
|
2016
|
||||||||||||||||
|
(Unaudited)
|
(Unaudited)
|
(Unaudited)
|
(Unaudited)
|
|||||||||||||||||
|
ASSETS
|
||||||||||||||||||||
|
Cash and cash equivalents
|
$
|
819,421
|
$
|
1,539,746
|
$
|
2,382,188
|
$
|
2,735,250
|
$
|
2,416,136
|
||||||||||
|
Investments, at fair value:
|
||||||||||||||||||||
|
Agency mortgage-backed securities
|
72,708,490
|
75,589,873
|
73,476,105
|
64,862,992
|
65,439,824
|
|||||||||||||||
|
Agency debentures
|
-
|
-
|
-
|
-
|
157,035
|
|||||||||||||||
|
Credit risk transfer securities
|
686,943
|
724,722
|
669,295
|
520,321
|
501,167
|
|||||||||||||||
|
Non-Agency mortgage-backed securities
|
1,409,093
|
1,401,307
|
1,460,261
|
1,197,549
|
1,157,507
|
|||||||||||||||
|
Residential mortgage loans (3)
|
682,416
|
342,289
|
310,148
|
-
|
-
|
|||||||||||||||
|
Mortgage servicing rights
|
632,166
|
652,216
|
492,169
|
-
|
-
|
|||||||||||||||
|
Commercial real estate debt investments (4)
|
4,102,613
|
4,321,739
|
4,319,077
|
4,361,972
|
4,401,725
|
|||||||||||||||
|
Commercial real estate debt and preferred equity, held for investment (5)
|
985,091
|
970,505
|
1,070,197
|
1,137,971
|
1,177,468
|
|||||||||||||||
|
Commercial loans held for sale, net
|
-
|
114,425
|
144,275
|
164,175
|
278,600
|
|||||||||||||||
|
Investments in commercial real estate
|
462,760
|
474,567
|
500,027
|
504,605
|
527,786
|
|||||||||||||||
|
Corporate debt
|
841,265
|
773,274
|
716,831
|
669,612
|
639,481
|
|||||||||||||||
|
Interest rate swaps, at fair value
|
19,195
|
68,194
|
113,253
|
146,285
|
93,312
|
|||||||||||||||
|
Other derivatives, at fair value
|
196,935
|
171,266
|
87,921
|
137,490
|
77,449
|
|||||||||||||||
|
Receivable for investments sold
|
354,126
|
51,461
|
493,839
|
697,943
|
2,220
|
|||||||||||||||
|
Accrued interest and dividends receivable
|
266,887
|
270,400
|
260,583
|
227,225
|
232,180
|
|||||||||||||||
|
Other assets
|
388,224
|
333,063
|
301,419
|
237,959
|
234,407
|
|||||||||||||||
|
Goodwill
|
71,815
|
71,815
|
71,815
|
71,815
|
71,815
|
|||||||||||||||
|
Intangible assets, net
|
31,517
|
34,184
|
39,903
|
43,306
|
35,853
|
|||||||||||||||
|
Total assets
|
$
|
84,658,957
|
$
|
87,905,046
|
$
|
86,909,306
|
$
|
77,716,470
|
$
|
77,443,965
|
||||||||||
|
LIABILITIES AND STOCKHOLDERS' EQUITY
|
||||||||||||||||||||
|
Liabilities:
|
||||||||||||||||||||
|
Repurchase agreements
|
$
|
62,719,087
|
$
|
65,215,810
|
$
|
61,784,121
|
$
|
53,868,385
|
$
|
54,448,141
|
||||||||||
|
Other secured financing
|
3,876,150
|
3,884,708
|
3,804,742
|
3,588,326
|
3,588,326
|
|||||||||||||||
|
Securitized debt of consolidated VIEs (6)
|
3,477,059
|
3,655,802
|
3,712,821
|
3,748,289
|
3,802,682
|
|||||||||||||||
|
Participation sold
|
12,760
|
12,869
|
12,976
|
13,079
|
13,182
|
|||||||||||||||
|
Mortgages payable
|
311,707
|
311,636
|
327,632
|
327,643
|
334,765
|
|||||||||||||||
|
Interest rate swaps, at fair value
|
572,419
|
1,443,765
|
2,919,492
|
3,208,986
|
2,782,961
|
|||||||||||||||
|
Other derivatives, at fair value
|
52,496
|
86,437
|
73,445
|
154,017
|
69,171
|
|||||||||||||||
|
Dividends payable
|
305,691
|
305,674
|
269,111
|
277,479
|
277,456
|
|||||||||||||||
|
Payable for investments purchased
|
340,383
|
65,041
|
454,237
|
746,090
|
250,612
|
|||||||||||||||
|
Accrued interest payable
|
182,478
|
163,013
|
173,320
|
159,435
|
163,983
|
|||||||||||||||
|
Accounts payable and other liabilities
|
161,378
|
184,319
|
115,606
|
62,868
|
54,679
|
|||||||||||||||
|
Total liabilities
|
72,011,608
|
75,329,074
|
73,647,503
|
66,154,597
|
65,785,958
|
|||||||||||||||
|
Stockholders' Equity:
|
||||||||||||||||||||
|
7.875% Series A Cumulative Redeemable Preferred Stock:
7,412,500 authorized, issued and outstanding
|
177,088
|
177,088
|
177,088
|
177,088
|
177,088
|
|||||||||||||||
|
7.625% Series C Cumulative Redeemable Preferred Stock
12,650,000 authorized, 12,000,000 issued and outstanding
|
290,514
|
290,514
|
290,514
|
290,514
|
290,514
|
|||||||||||||||
|
7.50% Series D Cumulative Redeemable Preferred Stock:
18,400,000 authorized, issued and outstanding
|
445,457
|
445,457
|
445,457
|
445,457
|
445,457
|
|||||||||||||||
|
7.625% Series E Cumulative Redeemable Preferred Stock:
11,500,000 authorized, issued and outstanding
|
287,500
|
287,500
|
287,500
|
-
|
-
|
|||||||||||||||
|
Common stock, par value $0.01 per share, 1,945,437,500, 1,945,437,500, 1,945,437,500, 1,956,937,500 and 1,956,937,500 authorized, 1,018,971,441, 1,018,913,249, 1,018,857,866, 924,929,607 and 924,853,133 issued and outstanding, respectively
|
10,190
|
10,189
|
10,189
|
9,249
|
9,249
|
|||||||||||||||
|
Additional paid-in capital
|
15,580,038
|
15,579,342
|
15,578,677
|
14,575,426
|
14,573,760
|
|||||||||||||||
|
Accumulated other comprehensive income (loss)
|
(1,126,091
|
)
|
(1,085,893
|
)
|
1,119,677
|
1,117,046
|
640,366
|
|||||||||||||
|
Accumulated deficit
|
(3,024,670
|
)
|
(3,136,017
|
)
|
(4,655,440
|
)
|
(5,061,565
|
)
|
(4,487,982
|
)
|
||||||||||
|
Total stockholders' equity
|
12,640,026
|
12,568,180
|
13,253,662
|
11,553,215
|
11,648,452
|
|||||||||||||||
|
Noncontrolling interest
|
7,323
|
7,792
|
8,141
|
8,658
|
9,555
|
|||||||||||||||
|
Total equity
|
12,647,349
|
12,575,972
|
13,261,803
|
11,561,873
|
11,658,007
|
|||||||||||||||
|
Total liabilities and equity
|
$
|
84,658,957
|
$
|
87,905,046
|
$
|
86,909,306
|
$
|
77,716,470
|
$
|
77,443,965
|
||||||||||
|
(1)
|
As a result of a change to a clearing organization's rulebook effective January 3, 2017, beginning with the first quarter 2017 the Company is presenting the fair value of centrally cleared interest rate swaps adjusted for $673.2 million of variation margin. The variation margin was previously reported under cash and cash equivalents and is currently reported as a reduction to interest rate swaps, at fair value. Prior period balances will not be adjusted.
|
|
(2)
|
Derived from the audited consolidated financial statements at December 31, 2016.
|
|
(3)
|
Includes securitized mortgage loans of a consolidated variable interest entity ("VIE") carried at fair value of $155.6 million, $165.9 million and $176.7 million at March 31, 2017, December 31, 2016 and September 30, 2016, respectively.
|
|
(4)
|
Includes senior securitized commercial mortgage loans of consolidated VIEs with a carrying value of $3.7 billion, $3.9 billion, $4.0 billion, $4.0 billion and $4.0 billion at March 31, 2017, December 31, 2016, September 30, 2016, June 30, 2016 and March 31, 2016, respectively.
|
|
(5)
|
Includes senior securitized commercial mortgage loans of a consolidated VIE with a carrying value of $0, $0, $128.9 million, $187.2 million and $211.9 million at March 31, 2017, December 31, 2016, September 30, 2016, June 30, 2016 and March 31, 2016, respectively.
|
|
(6)
|
Includes securitized debt of consolidated VIEs carried at fair value of $3.5 billion, $3.7 billion, $3.7 billion, $3.7 billion and $3.7 billion at March 31, 2017, December 31, 2016, September 30, 2016, June 30, 2016 and March 31, 2016, respectively
|
4
|
ANNALY CAPITAL MANAGEMENT, INC. AND SUBSIDIARIES
|
||||||||||||||||||||
|
CONSOLIDATED STATEMENTS OF COMPREHENSIVE INCOME (LOSS)
|
||||||||||||||||||||
|
(UNAUDITED)
|
||||||||||||||||||||
|
(dollars in thousands, except per share data)
|
||||||||||||||||||||
|
For the quarters ended
|
||||||||||||||||||||
|
|
March 31,
|
December 31,
|
September 30,
|
June 30,
|
March 31,
|
|||||||||||||||
|
2017
|
2016
|
2016
|
2016
|
2016
|
||||||||||||||||
|
Net interest income:
|
||||||||||||||||||||
|
Interest income
|
$
|
587,727
|
$
|
807,022
|
$
|
558,668
|
$
|
457,118
|
$
|
388,143
|
||||||||||
|
Interest expense
|
198,425
|
183,396
|
174,154
|
152,755
|
147,447
|
|||||||||||||||
|
Net interest income
|
389,302
|
623,626
|
384,514
|
304,363
|
240,696
|
|||||||||||||||
|
Realized and unrealized gains (losses):
|
||||||||||||||||||||
|
Realized gains (losses) on interest rate swaps(1)
|
(104,156
|
)
|
(103,872
|
)
|
(124,572
|
)
|
(130,762
|
)
|
(147,475
|
)
|
||||||||||
|
Realized gains (losses) on termination of interest rate swaps
|
-
|
(55,214
|
)
|
1,337
|
(60,064
|
)
|
-
|
|||||||||||||
|
Unrealized gains (losses) on interest rate swaps
|
149,184
|
1,430,668
|
256,462
|
(373,220
|
)
|
(1,031,720
|
)
|
|||||||||||||
|
Subtotal
|
45,028
|
1,271,582
|
133,227
|
(564,046
|
)
|
(1,179,195
|
)
|
|||||||||||||
|
Net gains (losses) on disposal of investments
|
5,235
|
7,782
|
14,447
|
12,535
|
(1,675
|
)
|
||||||||||||||
|
Net gains (losses) on trading assets
|
319
|
(139,470
|
)
|
162,981
|
81,880
|
125,189
|
||||||||||||||
|
Net unrealized gains (losses) on investments measured at fair value through earnings
|
23,683
|
110,742
|
29,675
|
(54,154
|
)
|
128
|
||||||||||||||
|
Bargain purchase gain
|
-
|
-
|
72,576
|
-
|
-
|
|||||||||||||||
|
Subtotal
|
29,237
|
(20,946
|
)
|
279,679
|
40,261
|
123,642
|
||||||||||||||
|
Total realized and unrealized gains (losses)
|
74,265
|
1,250,636
|
412,906
|
(523,785
|
)
|
(1,055,553
|
)
|
|||||||||||||
|
Other income (loss)
|
31,646
|
30,918
|
29,271
|
(9,930
|
)
|
(6,115
|
)
|
|||||||||||||
|
General and administrative expenses:
|
||||||||||||||||||||
|
Compensation and management fee
|
39,262
|
39,845
|
38,709
|
36,048
|
36,997
|
|||||||||||||||
|
Other general and administrative expenses
|
14,566
|
15,608
|
59,028
|
13,173
|
10,948
|
|||||||||||||||
|
Total general and administrative expenses
|
53,828
|
55,453
|
97,737
|
49,221
|
47,945
|
|||||||||||||||
|
Income (loss) before income taxes
|
441,385
|
1,849,727
|
728,954
|
(278,573
|
)
|
(868,917
|
)
|
|||||||||||||
|
Income taxes
|
977
|
1,244
|
(1,926
|
)
|
(76
|
)
|
(837
|
)
|
||||||||||||
|
Net income (loss)
|
440,408
|
1,848,483
|
730,880
|
(278,497
|
)
|
(868,080
|
)
|
|||||||||||||
|
Net income (loss) attributable to noncontrolling interest
|
(103
|
)
|
(87
|
)
|
(336
|
)
|
(385
|
)
|
(162
|
)
|
||||||||||
|
Net income (loss) attributable to Annaly
|
440,511
|
1,848,570
|
731,216
|
(278,112
|
)
|
(867,918
|
)
|
|||||||||||||
|
Dividends on preferred stock
|
23,473
|
23,473
|
22,803
|
17,992
|
17,992
|
|||||||||||||||
|
Net income (loss) available (related) to common stockholders
|
$
|
417,038
|
$
|
1,825,097
|
$
|
708,413
|
$
|
(296,104
|
)
|
$
|
(885,910
|
)
|
||||||||
|
Net income (loss) per share available (related) to common stockholders:
|
||||||||||||||||||||
|
Basic
|
$
|
0.41
|
$
|
1.79
|
$
|
0.70
|
$
|
(0.32
|
)
|
$
|
(0.96
|
)
|
||||||||
|
Diluted
|
$
|
0.41
|
$
|
1.79
|
$
|
0.70
|
$
|
(0.32
|
)
|
$
|
(0.96
|
)
|
||||||||
|
Weighted average number of common shares outstanding:
|
||||||||||||||||||||
|
Basic
|
1,018,942,746
|
1,018,886,380
|
1,007,607,893
|
924,887,316
|
926,813,588
|
|||||||||||||||
|
Diluted
|
1,019,307,379
|
1,019,251,111
|
1,007,963,406
|
924,887,316
|
926,813,588
|
|||||||||||||||
|
Net income (loss)
|
$
|
440,408
|
$
|
1,848,483
|
$
|
730,880
|
$
|
(278,497
|
)
|
$
|
(868,080
|
)
|
||||||||
|
Other comprehensive income (loss):
|
||||||||||||||||||||
|
Unrealized gains (losses) on available-for-sale securities
|
(59,615
|
)
|
(2,206,288
|
)
|
18,237
|
483,930
|
1,017,707
|
|||||||||||||
|
Reclassification adjustment for net (gains) losses included in net income (loss)
|
19,417
|
718
|
(15,606
|
)
|
(7,250
|
)
|
255
|
|||||||||||||
|
Other comprehensive income (loss)
|
(40,198
|
)
|
(2,205,570
|
)
|
2,631
|
476,680
|
1,017,962
|
|||||||||||||
|
Comprehensive income (loss)
|
400,210
|
(357,087
|
)
|
733,511
|
198,183
|
149,882
|
||||||||||||||
|
Comprehensive income (loss) attributable to noncontrolling interest
|
(103
|
)
|
(87
|
)
|
(336
|
)
|
(385
|
)
|
(162
|
)
|
||||||||||
|
Comprehensive income (loss) attributable to Annaly
|
$
|
400,313
|
$
|
(357,000
|
)
|
$
|
733,847
|
$
|
198,568
|
$
|
150,044
|
|||||||||
|
(1)
|
Interest expense related to the Company's interest rate swaps is recorded in Realized gains (losses) on interest rate swaps on the Consolidated Statements of Comprehensive Income.
|
5
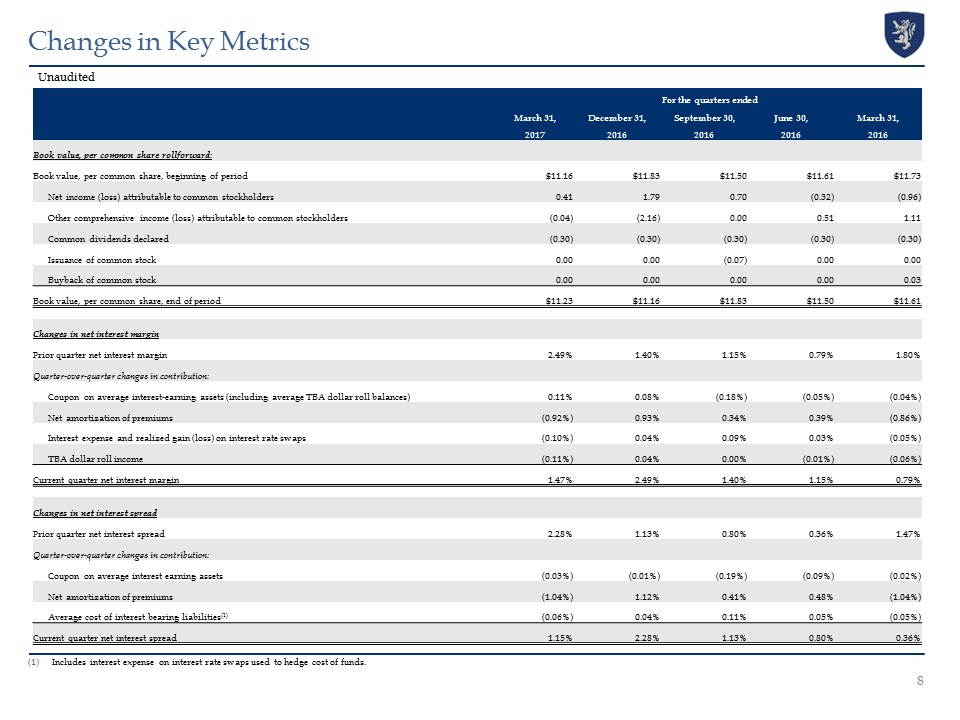
Key Metrics
The following table presents key metrics of the Company's portfolio, liabilities and hedging positions, and performance as of and for the quarters ended March 31, 2017, December 31, 2016, and March 31, 2016:
|
March 31, 2017
|
December 31, 2016
|
March 31, 2016
|
||||||||||
|
Portfolio Related Metrics:
|
||||||||||||
|
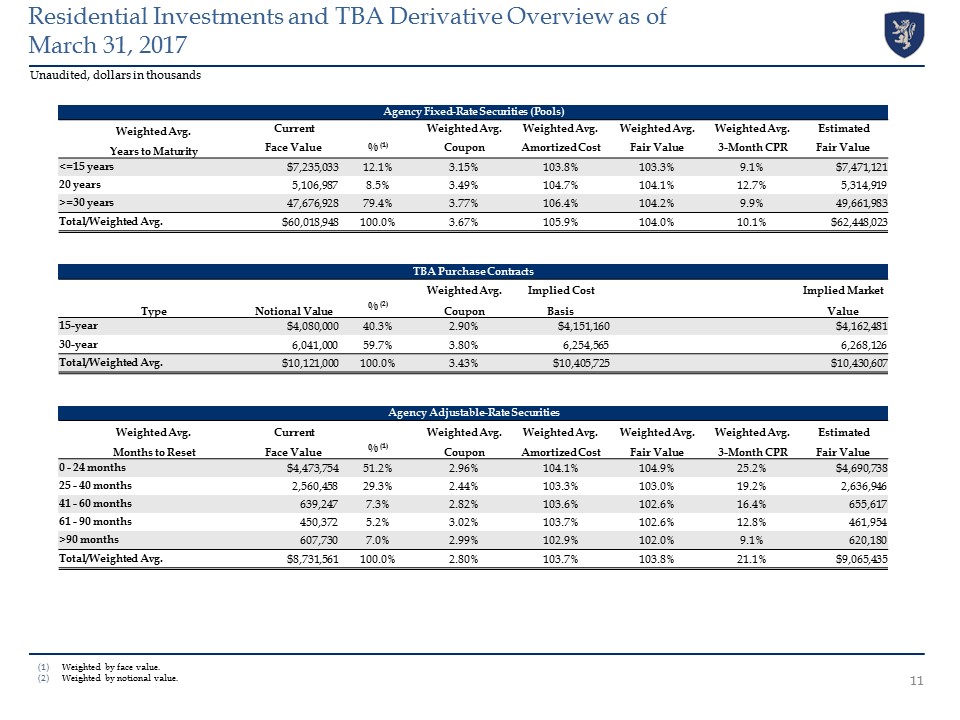
Fixed-rate Residential Investment Securities as a percentage of total Residential Investment Securities
|
85
|
%
|
83
|
%
|
93
|
%
|
||||||
|
Adjustable-rate and floating-rate Residential Investment Securities as a percentage of total Residential Investment Securities
|
15
|
%
|
17
|
%
|
7
|
%
|
||||||
|
Weighted average experienced CPR for the period
|
11.5
|
%
|
15.6
|
%
|
8.8
|
%
|
||||||
|
Weighted average projected long-term CPR at period-end
|
10.0
|
%
|
10.1
|
%
|
11.8
|
%
|
||||||
|
Liabilities and Hedging Metrics:
|
||||||||||||
|
Weighted average days to maturity on repurchase agreements outstanding at period-end
|
88
|
96
|
136
|
|||||||||
|
Hedge ratio (1)
|
63
|
%
|
56
|
%
|
51
|
%
|
||||||
|
Weighted average pay rate on interest rate swaps at period-end (2)
|
2.25
|
%
|
2.22
|
%
|
2.26
|
%
|
||||||
|
Weighted average receive rate on interest rate swaps at period-end (2)
|
1.15
|
%
|
1.02
|
%
|
0.69
|
%
|
||||||
|
Weighted average net rate on interest rate swaps at period-end (2)
|
1.10
|
%
|
1.20
|
%
|
1.57
|
%
|
||||||
|
Leverage at period-end (3)
|
5.6:1
|
5.8:1
|
5.3:1
|
|||||||||
|
Economic leverage at period-end (4)
|
6.1:1
|
6.4:1
|
6.2:1
|
|||||||||
|
Capital ratio at period-end
|
13.8
|
%
|
13.1
|
%
|
13.2
|
%
|
||||||
|
Performance Related Metrics:
|
||||||||||||
|
Book value per common share
|
$
|
11.23
|
$
|
11.16
|
$
|
11.61
|
||||||
|
GAAP net income (loss) per average common share
|
$
|
0.41
|
$
|
1.79
|
$
|
(0.96
|
)
|
|||||
|
Core earnings per average common share *
|
$
|
0.29
|
$
|
0.53
|
$
|
0.11
|
||||||
|
PAA cost (benefit) per average common share
|
$
|
0.02
|
$
|
(0.23
|
)
|
$
|
0.19
|
|||||
|
Dividend declared per common share
|
$
|
0.30
|
$
|
0.30
|
$
|
0.30
|
||||||
|
Annualized dividend yield (5)
|
10.80
|
%
|
12.04
|
%
|
11.70
|
%
|
||||||
|
Annualized return (loss) on average equity
|
13.97
|
%
|
57.23
|
%
|
(29.47
|
%)
|
||||||
|
Annualized core return on average equity *
|
10.09
|
%
|
17.53
|
%
|
4.19
|
%
|
||||||
|
Net interest margin
|
1.47
|
%
|
2.49
|
%
|
0.79
|
%
|
||||||
|
Average yield on interest earning assets (6)
|
2.74
|
%
|
3.81
|
%
|
2.09
|
%
|
||||||
|
Average cost of interest bearing liabilities (7)
|
1.59
|
%
|
1.53
|
%
|
1.73
|
%
|
||||||
|
Net interest spread
|
1.15
|
%
|
2.28
|
%
|
0.36
|
%
|
||||||
|
*
|
Represents a non-GAAP financial measure. Please refer to the 'Non-GAAP Financial Measures' section for additional information.
|
|
(1)
|
Measures total notional balances of interest rate swaps, interest rate swaptions and futures relative to repurchase agreements, other secured financing and TBA notional outstanding.
|
|
(2)
|
Excludes forward starting swaps.
|
|
(3)
|
Debt consists of repurchase agreements, other secured financing, securitized debt, participation sold and mortgages payable. Securitized debt, participation sold and mortgages payable are non-recourse to the Company.
|
|
(4)
|
Computed as the sum of recourse debt, TBA derivative notional outstanding and net forward purchases of investments divided by total equity.
|
|
(5)
|
Based on the closing price of the Company's common stock of $11.11, $9.97 and $10.26 at March 31, 2017, December 31, 2016 and March 31, 2016, respectively.
|
|
(6)
|
Average interest earning assets reflects the average amortized cost of our investments during the period.
|
|
(7)
|
Includes interest expense on interest rate swaps used to hedge cost of funds. |
6
Non-GAAP Financial Measures
Based upon recent regulatory guidance and interpretations on the use of non-GAAP financial measures, in its fourth quarter 2016 filings, news releases and presentations, the Company furnished both unrevised non-GAAP financial measures that excluded the PAA as well as revised non-GAAP financial measures that included the PAA. In addition, the Company indicated that the fourth quarter 2016 would be the final quarter that the Company would report core earnings metrics that exclude the PAA. Beginning with the first quarter 2017, the Company is no longer disclosing non-GAAP financial measures that exclude the PAA. However, given its usefulness in evaluating the Company's financial performance, the Company is continuing to separately disclose the PAA. Additionally, comparative prior period results reported in the current and future periods will conform to the revised presentation.
To supplement its consolidated financial statements, which are prepared and presented in accordance with GAAP, the Company provides the following non-GAAP financial measures. These measures should not be considered a substitute for, or superior to, financial measures computed in accordance with GAAP.
|
·
|
core earnings;
|
|
·
|
core earnings per average common share;
|
|
·
|
annualized core return on average equity;
|
|
·
|
economic interest expense; and
|
|
·
|
economic net interest income.
|
These non-GAAP measures provide additional detail to enhance investor understanding of the Company's period-over-period operating performance and business trends, as well as for assessing the Company's performance versus that of industry peers. Additional information pertaining to the Company's use of these non-GAAP financial measures, including discussion of how each such measure is useful to investors, and reconciliations to their most directly comparable GAAP results are provided below.
Core earnings, core earnings per average common share and annualized core return on average equity
One of the Company's principal business objectives is to generate net income by earning a net interest spread on its investment portfolio, which is a function of the Company's interest income from its investment portfolio less financing, hedging and operating costs. Core earnings, which is comprised of interest income plus TBA dollar roll incomei, less financing and hedging costsii and general and administrative expenses, is used by management to measure its progress in achieving this objective.
Prior to the fourth quarter 2016, the Company defined "core earnings", a non-GAAP measure, as net income (loss) excluding gains or losses on disposals of investments and termination of interest rate swaps, unrealized gains or losses on interest rate swaps and investments measured at fair value through earnings, net gains and losses on trading assets, impairment losses, net income (loss) attributable to noncontrolling interest, the PAA resulting from the quarter-over-quarter change in estimated long-term CPR, corporate acquisition related expenses and certain other non-recurring gains or losses, and inclusive of TBA dollar roll income (a component of Net gains (losses) on trading assets) and realized amortization of MSRs (a component of net unrealized gains (losses) on investments measured at fair value through earnings). Beginning with the first quarter 2017 core earnings does not exclude the PAA.
The Company believes these non-GAAP measures provide management and investors with additional details regarding the Company's underlying operating results and investment portfolio trends by (i) making adjustments to account for the disparate reporting of changes in fair value where certain instruments are reflected in GAAP net income (loss) while others are reflected in other comprehensive income (loss), and (ii) by excluding certain unrealized, non-cash or episodic components of GAAP net income (loss) in order to provide additional transparency into the operating performance of the Company's portfolio. Annualized core return on average equity, which is calculated by dividing core earnings over average stockholders' equity, provides investors with additional detail on the core earnings generated by the Company's invested equity capital.
i TBA dollar roll transactions are accounted for as derivatives, with gains and losses reflected as a component of Net gains (losses) on trading assets in the Company's Consolidated Statements of Comprehensive Income (Loss). TBA dollar roll income represents the economic equivalent of interest income on the underlying security less the implied cost of financing.
ii The interest component of hedging costs are reported as realized gains (losses) on interest rate swaps in the Company's Consolidated Statements of Comprehensive Income (Loss).
7
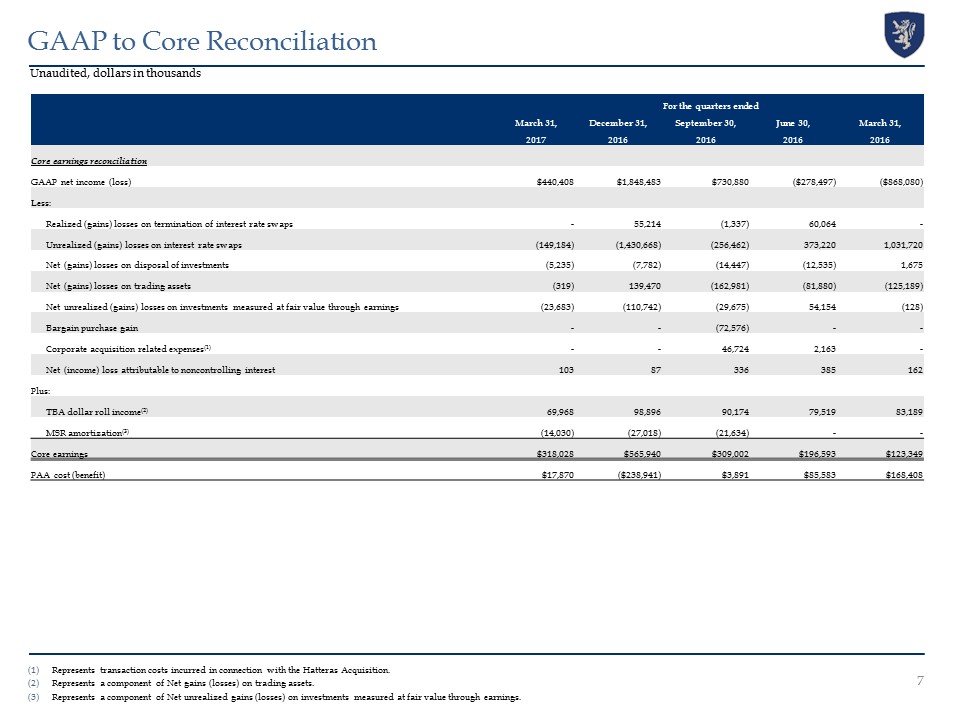
The following table presents a reconciliation of GAAP financial results to non-GAAP core earnings for the periods presented.
|
For the quarters ended
|
||||||||||||
|
March 31, 2017
|
December 31, 2016
|
March 31, 2016
|
||||||||||
|
(dollars in thousands, except per share data)
|
||||||||||||
|
GAAP net income (loss)
|
$
|
440,408
|
$
|
1,848,483
|
$
|
(868,080
|
)
|
|||||
|
Less:
|
||||||||||||
|
Realized (gains) losses on termination of interest rate swaps
|
-
|
55,214
|
-
|
|||||||||
|
Unrealized (gains) losses on interest rate swaps
|
(149,184
|
)
|
(1,430,668
|
)
|
1,031,720
|
|||||||
|
Net (gains) losses on disposal of investments
|
(5,235
|
)
|
(7,782
|
)
|
1,675
|
|||||||
|
Net (gains) losses on trading assets
|
(319
|
)
|
139,470
|
(125,189
|
)
|
|||||||
|
Net unrealized (gains) losses on investments measured at fair value through earnings
|
(23,683
|
)
|
(110,742
|
)
|
(128
|
)
|
||||||
|
Net (income) loss attributable to noncontrolling interest
|
103
|
87
|
162
|
|||||||||
|
Plus:
|
||||||||||||
|
TBA dollar roll income (1)
|
69,968
|
98,896
|
83,189
|
|||||||||
|
MSR amortization (2)
|
(14,030
|
)
|
(27,018
|
)
|
-
|
|||||||
|
Core earnings *
|
$ |
318,028
|
$ |
565,940
|
$ |
123,349
|
||||||
|
GAAP net income (loss) per average common share
|
$
|
0.41
|
$
|
1.79
|
$
|
(0.96
|
)
|
|||||
|
Core earnings per average common share *
|
$
|
0.29
|
$
|
0.53
|
$
|
0.11
|
||||||
|
PAA cost (benefit) per average common share
|
$
|
0.02
|
$
|
(0.23
|
)
|
$
|
0.19
|
|||||
|
Annualized GAAP return (loss) on average equity
|
13.97
|
%
|
57.23
|
%
|
(29.47
|
%)
|
||||||
|
Annualized core return on average equity *
|
10.09
|
%
|
17.53
|
%
|
4.19
|
%
|
||||||
|
*
|
Represents a non-GAAP financial measure.
|
|
(1)
|
Represents a component of Net gains (losses) on trading assets.
|
|
(2)
|
Represents the portion of changes in fair value that is attributable to the realization of estimated cash flows on the Company's MSR portfolio and is reported as a component of Net unrealized gains (losses) on investments measured at fair value.
|
From time to time, the Company enters into TBA forward contracts as an alternate means of investing in and financing Agency mortgage-backed securities. A TBA contract is an agreement to purchase or sell, for future delivery, an Agency mortgage-backed security with a specified issuer, term and coupon. A TBA dollar roll represents a transaction where TBA contracts with the same terms but different settlement dates are simultaneously bought and sold. The TBA contract settling in the later month typically prices at a discount to the earlier month contract with the difference in price commonly referred to as the "drop". The drop is a reflection of the expected net interest income from an investment in similar Agency mortgage-backed securities, net of an implied financing cost, that would be foregone as a result of settling the contract in the later month rather than in the earlier month. The drop between the current settlement month price and the forward settlement month price occurs because in the TBA dollar roll market, the party providing the financing is the party that would retain all principal and interest payments accrued during the financing period. Accordingly, TBA dollar roll income generally represents the economic equivalent of the net interest income earned on the underlying Agency mortgage-backed security less an implied financing cost.
TBA dollar roll transactions are accounted for under GAAP as a series of derivatives transactions. The fair value of TBA derivatives is based on methods similar to those used to value Agency mortgage-backed securities. The Company records TBA derivatives at fair value on its Consolidated Statements of Financial Condition and recognizes periodic changes in fair value as Net gains (losses) on trading assets in the Consolidated Statements of Comprehensive Income (Loss), which includes both unrealized and realized gains and losses on derivatives (excluding interest rate swaps).
TBA dollar roll income is calculated as the difference in price between two TBA contracts with the same terms but different settlement dates multiplied by the notional amount of the TBA contract. Although accounted for as derivatives, TBA dollar rolls capture the economic equivalent of net interest income, or carry, on the underlying Agency mortgage-backed security (interest income less an implied cost of financing). TBA dollar roll income is reported as a component of Net gains (losses) on trading assets in the Consolidated Statements of Comprehensive Income (Loss).
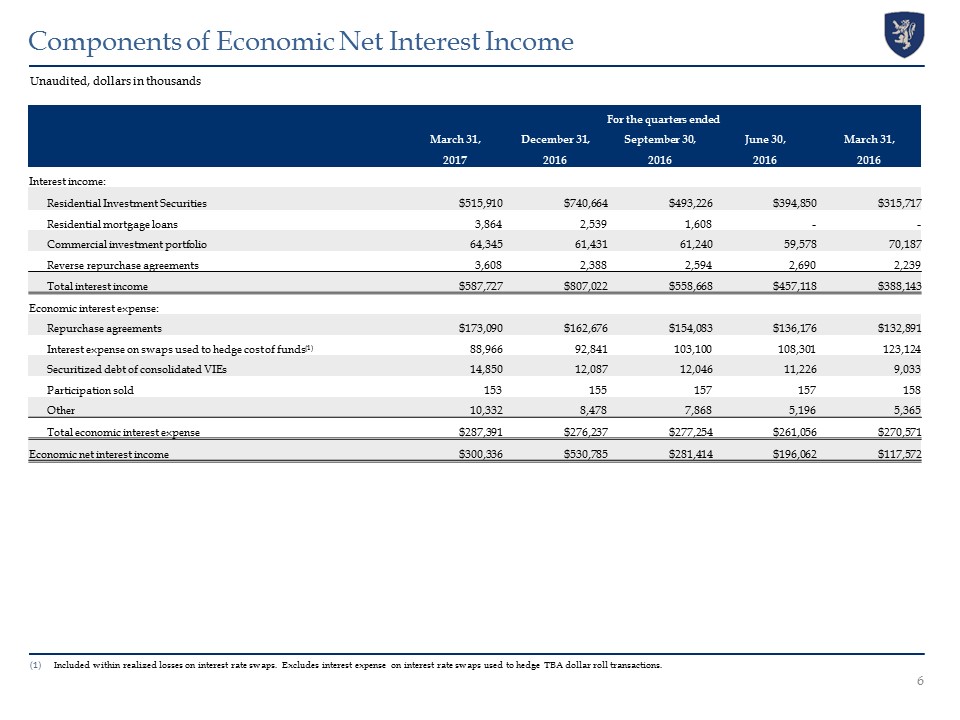
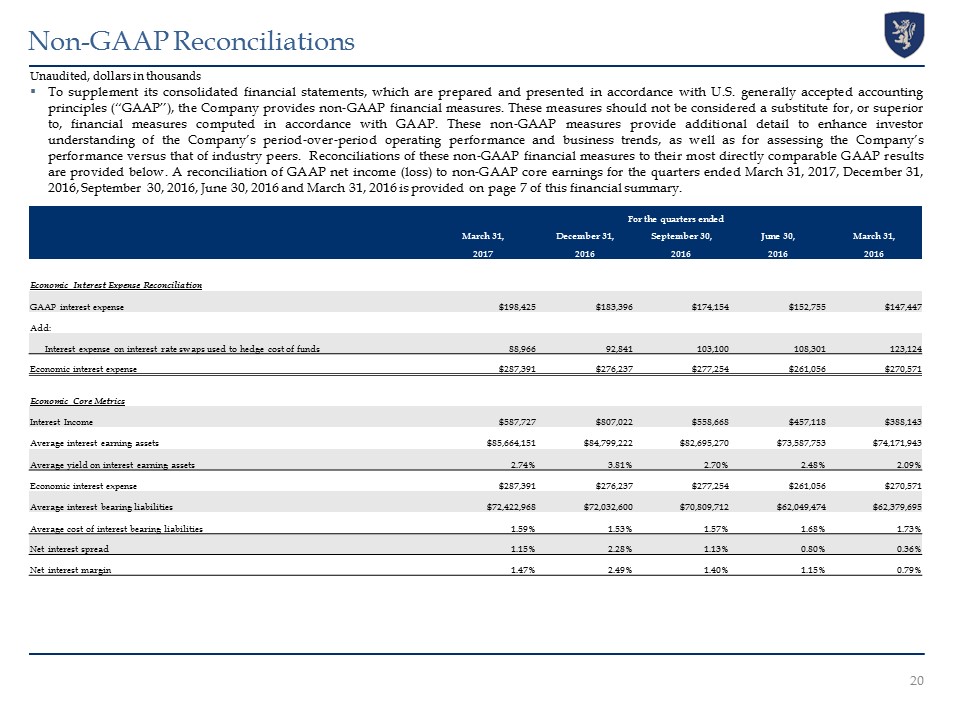
Economic interest expense and economic net interest income
Economic interest expense is comprised of interest expense, as computed in accordance with GAAP, plus interest expense on interest rate swaps used to hedge cost of funds, which is a component of Realized gains (losses) on interest rate swaps in the Company's Consolidated Statements of Comprehensive Income (Loss). The Company uses interest rate swaps to manage its exposure to changing interest rates on its repurchase agreements by economically hedging cash flows associated with these borrowings. Accordingly, adding the contractual interest payments on interest rate swaps to interest expense, as computed in accordance with GAAP, reflects the total contractual interest expense and thus, provides investors with additional information about the cost of our financing strategy.
Similarly, economic net interest income, as computed below, provides investors with additional information to enhance their understanding of the net economics of our primary business operations.
8
|
For the quarters ended
|
||||||||||||
|
March 31, 2017
|
December 31, 2016
|
March 31, 2016
|
||||||||||
|
(dollars in thousands)
|
||||||||||||
|
Economic Interest Expense Reconciliation
|
||||||||||||
|
GAAP interest expense
|
$
|
198,425
|
$
|
183,396
|
$
|
147,447
|
||||||
|
Add:
|
||||||||||||
|
Interest expense on interest rate swaps used to hedge cost of funds
|
88,966
|
92,841
|
123,124
|
|||||||||
|
Economic interest expense*
|
$
|
287,391
|
$
|
276,237
|
$
|
270,571
|
||||||
|
Economic Net Interest Income Reconciliation
|
||||||||||||
|
GAAP interest income
|
$
|
587,727
|
$
|
807,022
|
$
|
388,143
|
||||||
|
Less:
|
||||||||||||
|
Economic interest expense*
|
287,391
|
276,237
|
270,571
|
|||||||||
|
Economic net interest income*
|
$
|
300,336
|
$
|
530,785
|
$
|
117,572
|
||||||
|
*
|
Represents a non-GAAP financial measure.
|
9