Exhibit 99.1
ANNALY CAPITAL MANAGEMENT, INC. REPORTS 4th QUARTER 2016 RESULTS
|
·
|
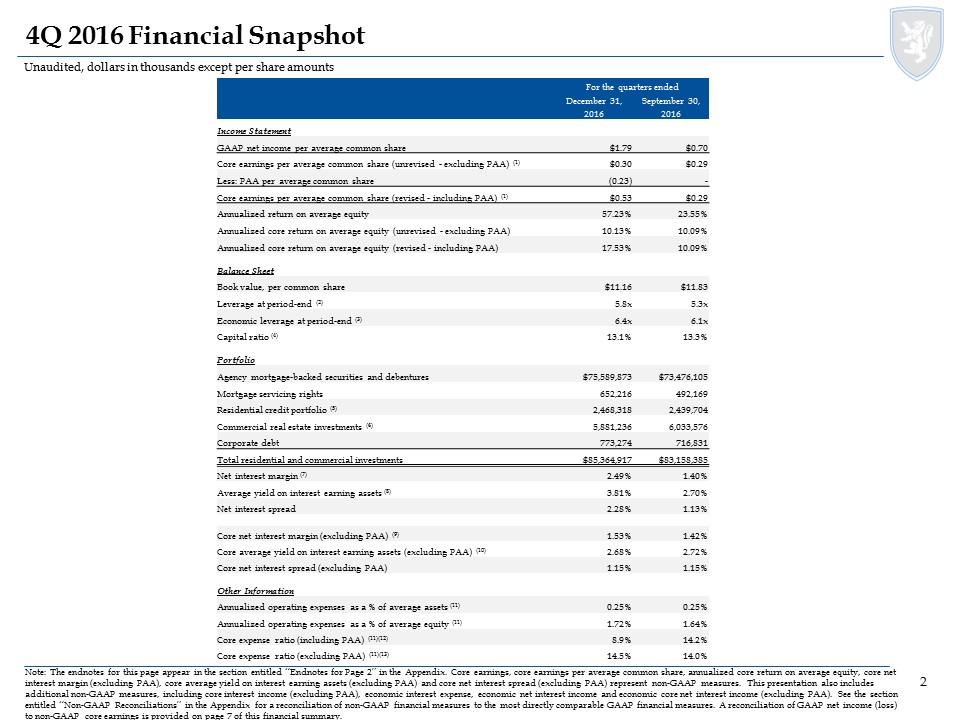
GAAP net income of $1.8 billion, $1.79 per average common share
|
|
·
|
Transition to revised core earnings metrics to conform with regulatory guidance on non-GAAP measures
|
|
·
|
Core earnings (unrevised - excluding premium amortization adjustment (“PAA”)) of $327.0 million, $0.30 per average common share
|
|
·
|
Core earnings (revised - including PAA) of $565.9 million, $0.53 per average common share
|
|
·
|
Common stock book value per share of $11.16
|
NEW YORK--(BUSINESS WIRE)—February 15, 2017 -- Annaly Capital Management, Inc. (NYSE: NLY) (the “Company” or “Annaly”) today announced its financial results for the quarter and year ended December 31, 2016.
“The fourth quarter of 2016 was yet another period of historically high market volatility with interest rate levels rising meaningfully and credit spreads contracting significantly,” commented Kevin Keyes, Chief Executive Officer and President. “Once again, amidst this uncertainty, Annaly delivered stable core earnings and dividends producing an attractive return on equity for our shareholders. In addition, the effectiveness of our diversification and hedging strategies contributed to our book value for the quarter outperforming expected changes despite the pronounced sell-off in the fixed income markets.
“2016 was also a year of notable milestones for Annaly in which we continued to expand our four complementary business platforms into 25 investment options, completed the largest mortgage REIT acquisition in history and delivered a $0.30 per share dividend for the 13th consecutive quarter.
“Entering 2017, we are prepared for even more volatility and uncertainty. Importantly, considering the wide range of potential outcomes in the global macro-economies and marketplaces, we are confident our diversified model is uniquely positioned to take advantage of multiple investment opportunities.”
Updated Disclosure of Non-GAAP Financial Measures
To supplement its consolidated financial statements, which are prepared and presented in accordance with U.S. generally accepted accounting principles (GAAP), the Company provides non-GAAP financial measures to enhance investor understanding of the Company’s period-over-period operating performance and business trends, as well as for assessing the Company’s performance versus that of industry peers. Historically, the Company has defined “core earnings”, a non-GAAP measure, as net income (loss) excluding gains or losses on disposals of investments and termination of interest rate swaps, unrealized gains or losses on interest rate swaps and investments measured at fair value through earnings, net gains and losses on trading assets, impairment losses, net income (loss) attributable to noncontrolling interest, the premium amortization adjustment resulting from the quarter-over-quarter change in estimated long-term CPR (“PAA”), corporate acquisition related expenses and certain other non-recurring gains or losses, and inclusive of dollar roll income (a component of Net gains (losses) on trading assets) and realized amortization of mortgage servicing rights (“MSR”) (a component of net unrealized gains (losses) on investments measured at fair value through earnings).
Based upon recent regulatory guidance and interpretations on the use of non-GAAP financial measures, beginning with the fourth quarter 2016, the Company will report core earnings metrics (revised) that include the PAA. In addition, this is the final quarter that the Company will report core earnings metrics (unrevised) that exclude the PAA. In future periods, the Company will not make an adjustment to GAAP net income (loss) to exclude the PAA. However, given its usefulness in evaluating the Company’s financial performance, the Company will continue to separately disclose the PAA. Additionally, comparative prior period results reported in future periods will conform to the revised presentation.
The Company believes its non-GAAP financial measures are useful for management, investors, analysts, and other interested parties in evaluating the Company’s performance but should not be viewed in isolation and are not a substitute for financial measurements computed in accordance with GAAP. Please refer to the “Non-GAAP Financial Measures” section for additional information.
1
Financial Performance
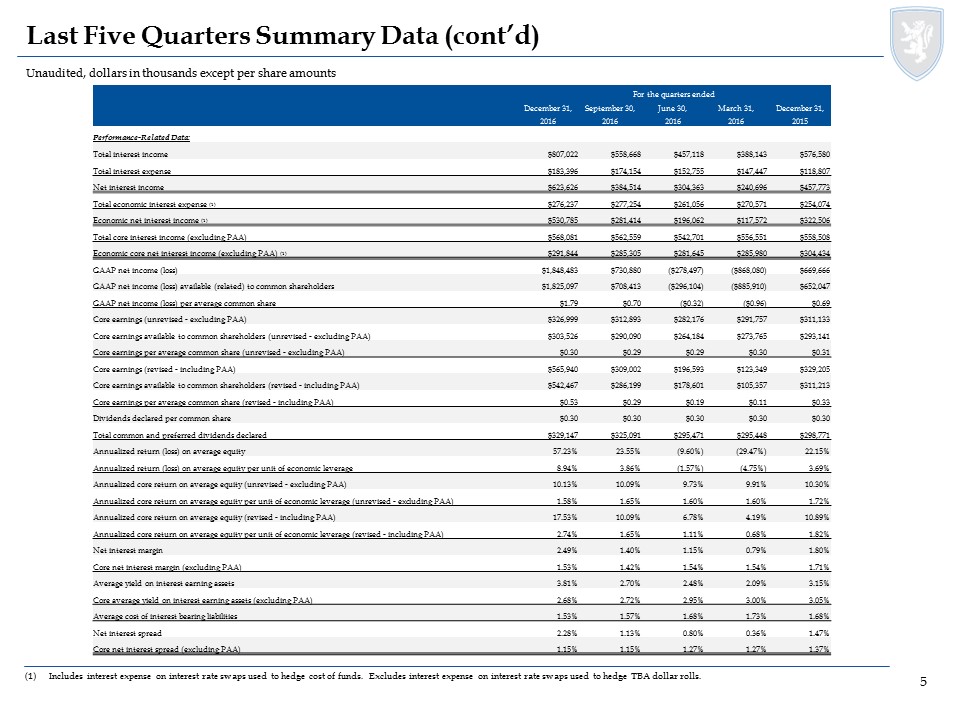
The following table summarizes certain key performance indicators as of and for the quarters ended December 31, 2016, September 30, 2016, and December 31, 2015:
|
December 31, 2016
|
September 30, 2016
|
December 31, 2015
|
||||||||||
|
Book value per common share
|
$
|
11.16
|
$
|
11.83
|
$
|
11.73
|
||||||
|
Economic leverage at period-end (1)
|
6.4:1
|
6.1:1
|
6.0:1
|
|||||||||
|
GAAP net income (loss) per average common share
|
$
|
1.79
|
$
|
0.70
|
$
|
0.69
|
||||||
|
Core earnings per average common share (unrevised - excluding PAA)* (2)
|
$
|
0.30
|
$
|
0.29
|
$
|
0.31
|
||||||
|
Less: PAA cost (benefit) per average common share
|
(0.23
|
)
|
-
|
(0.02
|
)
|
|||||||
|
Core earnings per average common share (revised - including PAA)* (2)
|
$
|
0.53
|
$
|
0.29
|
$
|
0.33
|
||||||
|
Annualized return (loss) on average equity
|
57.23
|
%
|
23.55
|
%
|
22.15
|
%
|
||||||
|
Annualized core return on average equity (unrevised - excluding PAA)*
|
10.13
|
%
|
10.09
|
%
|
10.30
|
%
|
||||||
|
Annualized core return on average equity (revised - including PAA)*
|
17.53
|
%
|
10.09
|
%
|
10.89
|
%
|
||||||
|
Net interest margin (3)
|
2.49
|
%
|
1.40
|
%
|
1.80
|
%
|
||||||
|
Core net interest margin (excluding PAA)*
|
1.53
|
%
|
1.42
|
%
|
1.71
|
%
|
||||||
|
Net interest spread
|
2.28
|
%
|
1.13
|
%
|
1.47
|
%
|
||||||
|
Core net interest spread (excluding PAA)*
|
1.15
|
%
|
1.15
|
%
|
1.37
|
%
|
||||||
|
Average yield on interest earning assets
|
3.81
|
%
|
2.70
|
%
|
3.15
|
%
|
||||||
|
Core average yield on interest earning assets (excluding PAA)*
|
2.68
|
%
|
2.72
|
%
|
3.05
|
%
|
||||||
| * |
Represents a non-GAAP financial measure. Please refer to the ‘Non-GAAP Financial Measures’ section for additional information.
|
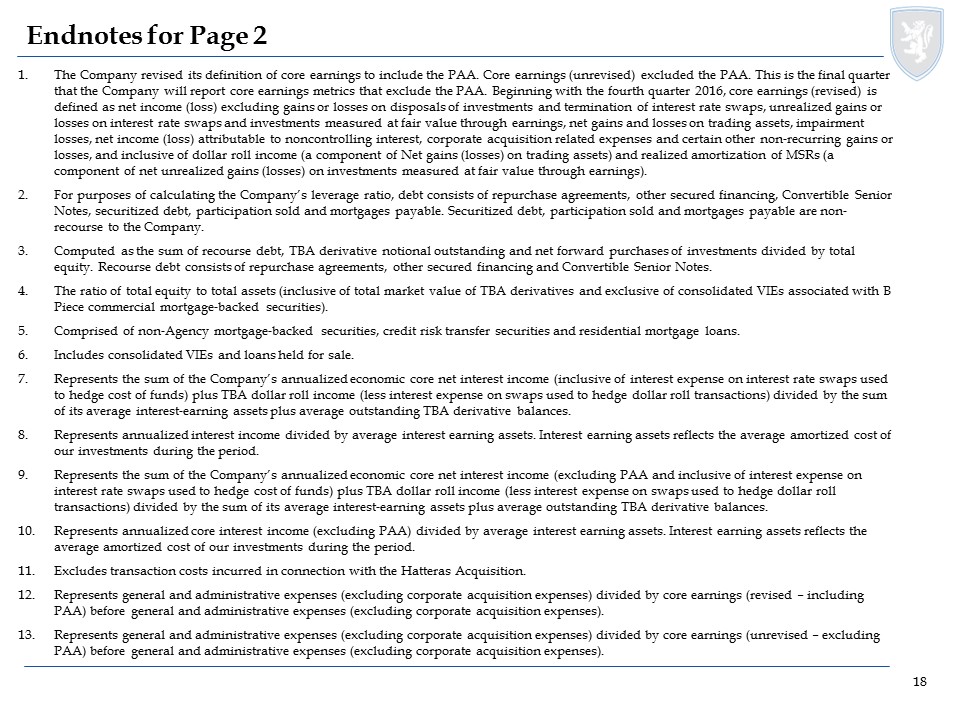
| (1) | Computed as the sum of recourse debt, TBA derivative notional outstanding and net forward purchases of investments divided by total equity. Recourse debt consists of repurchase agreements, other secured financing and Convertible Senior Notes. Securitized debt, participation sold and mortgages payable are non-recourse to the Company and are excluded from this measure. |
| (2) | The Company revised its definition of core earnings to include the PAA. Core earnings (unrevised) excluded the PAA. This is the final quarter that the Company will report core earnings metrics that exclude the PAA. Beginning with the fourth quarter 2016, core earnings (revised) is defined as net income (loss) excluding gains or losses on disposals of investments and termination of interest rate swaps, unrealized gains or losses on interest rate swaps and investments measured at fair value through earnings, net gains and losses on trading assets, impairment losses, net income (loss) attributable to noncontrolling interest, corporate acquisition related expenses and certain other non-recurring gains or losses, and inclusive of dollar roll income (a component of Net gains (losses) on trading assets) and realized amortization of MSRs (a component of net unrealized gains (losses) on investments measured at fair value through earnings). |
| (3) |
Represents the sum of the Company’s annualized economic net interest income (inclusive of interest expense on interest rate swaps used to hedge cost of funds) plus TBA dollar roll income (less interest expense on swaps used to hedge dollar roll transactions) divided by the sum of its average interest earning assets plus average outstanding TBA derivative balances. Average interest earning assets reflects the average amortized cost of our investments during the period.
|
Among the financial highlights for the fourth quarter 2016 are the following:
|
-
|
GAAP net income of $1.8 billion, or $1.79 per average common share
|
|
-
|
Core earnings* (unrevised – excluding PAA) of $327.0 million, or $0.30 per average common share
|
|
-
|
Core earnings* (revised – including PAA) of $565.9 million, or $0.53 per average common share (inclusive of PAA benefit of $238.9 million, or $0.23 per average common share)
|
|
-
|
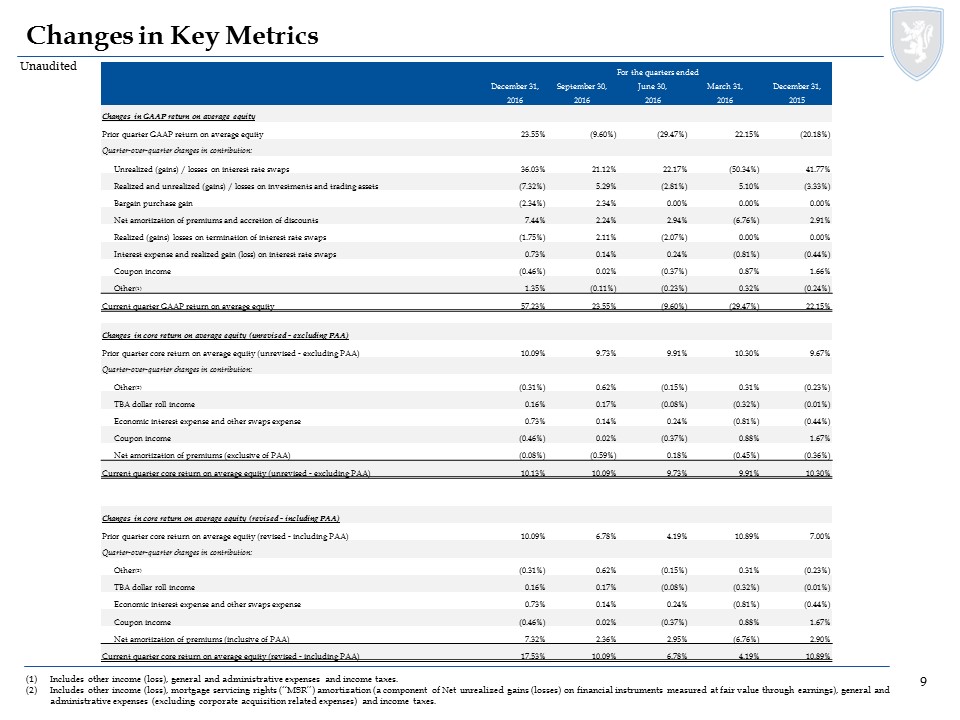
GAAP return on average equity of 57.23%, core return on average equity* (unrevised – excluding PAA) of 10.13%, core return on average equity* (revised – including PAA) of 17.53% (PAA related benefit of 7.40%)
|
|
-
|
Common dividend declared for the quarter ended December 31, 2016 of $0.30 per common share. The annualized dividend yield on the Company’s common stock for the quarter ended December 31, 2016, based on the December 31, 2016 closing price of $9.97, was 12.04%
|
Among the business highlights for the year ended December 31, 2016 are the following:
|
-
|
Completed the largest mREIT acquisition in history with purchase of Hatteras Financial Corp.
|
|
-
|
Continued diversification strategy with expansion of investment options and targeted growth in select credit assets
|
|
-
|
Advanced funding strategy with dedicated financing facilities for credit businesses while also capitalizing on FHLB term funding
|
|
-
|
Further aligned management and shareholder interests by initiating employee stock ownership program
|
* Represents a non-GAAP financial measure. Please refer to the ‘Non-GAAP Financial Measures’ section for additional information.
Amortization
In accordance with GAAP, the Company amortizes or accretes premiums or discounts into interest income for its Agency mortgage-backed securities, excluding interest-only securities, considering estimates of future principal prepayment in the calculation of the effective yield because they are probable and the timing and amount of prepayments can be reasonably estimated. The Company recalculates the effective yield as differences between anticipated and actual prepayments occur. Using third-party model and market information to project future cash flows and expected remaining lives of securities, the effective interest rate determined for each security is applied as if it had been in place from the date of the security’s acquisition. The amortized cost of the investment is then adjusted to the amount that would have existed had the new effective yield been applied since the acquisition date. The adjustment to amortized cost is offset with a charge or credit to interest income. Changes in interest rates and other market factors will impact prepayment speed projections and the amount of premium amortization recognized in any given period.
2
The Company’s GAAP metrics include the unadjusted impact of amortization and accretion associated with this method. The Company’s non-GAAP measures previously excluded the effect of the PAA, however, beginning with the fourth quarter 2016, the Company revised its definition of core earnings such that no adjustment will be made to exclude the PAA. In addition, this is the final quarter that the Company will report core earnings metrics (unrevised) that exclude the PAA. However, given its usefulness in evaluating the Company’s financial performance, the Company will continue to separately disclose the PAA.
The following table illustrates the impact of quarter-over-quarter changes to long-term CPR estimates on premium amortization expense for the Company’s Residential Investment Securities portfolio for the quarters ended December 31, 2016, September 30, 2016, and December 31, 2015:
|
For the quarters ended
|
||||||||||||
|
December 31, 2016
|
September 30, 2016
|
December 31, 2015
|
||||||||||
|
(dollars in thousands)
|
||||||||||||
|
Premium amortization expense
|
$
|
(19,812
|
)
|
$
|
213,241
|
$
|
159,720
|
|||||
|
Less: PAA cost (benefit)
|
(238,941
|
)
|
3,891
|
(18,072
|
)
|
|||||||
|
Premium amortization expense exclusive of PAA
|
$
|
219,129
|
$
|
209,350
|
$
|
177,792
|
||||||
|
For the quarters ended
|
||||||||||||
|
December 31, 2016
|
September 30, 2016
|
December 31, 2015
|
||||||||||
|
(per average common share)
|
||||||||||||
|
Premium amortization expense
|
$
|
(0.02
|
)
|
$
|
0.21
|
$
|
0.17
|
|||||
|
Less: PAA cost (benefit)
|
(0.23
|
)
|
-
|
(1) |
(0.02
|
)
|
||||||
|
Premium amortization expense exclusive of PAA
|
$
|
0.21
|
$
|
0.21
|
$
|
0.19
|
||||||
| (1) |
Rounds to less than $0.01 per average common share.
|
Other Information
This news release and our public documents to which we refer contain or incorporate by reference certain forward-looking statements which are based on various assumptions (some of which are beyond our control) and may be identified by reference to a future period or periods or by the use of forward-looking terminology, such as “may,” “will,” “believe,” “expect,” “anticipate,” “continue,” or similar terms or variations on those terms or the negative of those terms. Actual results could differ materially from those set forth in forward-looking statements due to a variety of factors, including, but not limited to, changes in interest rates; changes in the yield curve; changes in prepayment rates; the availability of mortgage-backed securities and other securities for purchase; the availability of financing and, if available, the terms of any financings; changes in the market value of our assets; changes in business conditions and the general economy; our ability to grow our commercial business; our ability to grow our residential mortgage credit business; credit risks related to our investments in credit risk transfer securities, residential mortgage-backed securities and related residential mortgage credit assets, commercial real estate assets and corporate debt; risks related to investments in mortgage servicing rights and ownership of a servicer; our ability to consummate any contemplated investment opportunities; changes in government regulations affecting our business; our ability to maintain our qualification as a REIT; and our ability to maintain our exemption from registration under the Investment Company Act of 1940, as amended. For a discussion of the risks and uncertainties which could cause actual results to differ from those contained in the forward-looking statements, see “Risk Factors” in our most recent Annual Report on Form 10-K and any subsequent Quarterly Reports on Form 10-Q. We do not undertake, and specifically disclaim any obligation, to publicly release the result of any revisions which may be made to any forward-looking statements to reflect the occurrence of anticipated or unanticipated events or circumstances after the date of such statements, except as required by law.
Annaly’s principal business objectives are to generate net income for distribution to its shareholders from its investments and capital preservation. Annaly is a Maryland corporation that has elected to be taxed as a real estate investment trust (“REIT”). Annaly is managed and advised by Annaly Management Company LLC.
The Company prepares a supplemental investor presentation and a financial summary for the benefit of its shareholders. Both the Fourth Quarter 2016 Investor Presentation and the Fourth Quarter 2016 Financial Summary can be found at the Company’s website (www.annaly.com) in the Investors section under Investor Presentations.
Conference Call
The Company will hold the fourth quarter 2016 earnings conference call on February 16, 2017 at 10:00 a.m. Eastern Time. The number to call is 888-317-6003 for domestic calls and 412-317-6061 for international calls. The conference passcode is 8442755. There will also be an audio webcast of the call on www.annaly.com. The replay of the call is available for one week following the conference call. The replay number is 877-344-7529 for domestic calls and 412-317-0088 for international calls and the conference passcode is 10100346. If you would like to be added to the e-mail distribution list, please visit www.annaly.com, click on Investors, then select Email Alerts and complete the email notification form.
3
|
ANNALY CAPITAL MANAGEMENT, INC. AND SUBSIDIARIES
|
|||||||||||||||||||
|
CONSOLIDATED STATEMENTS OF FINANCIAL CONDITION
|
|||||||||||||||||||
|
(dollars in thousands, except per share data)
|
|||||||||||||||||||
|
December 31,
|
September 30,
|
June 30,
|
March 31,
|
December 31,
|
|||||||||||||||
|
2016
|
2016
|
2016
|
2016
|
2015(1)
|
|||||||||||||||
|
(Unaudited)
|
(Unaudited)
|
(Unaudited)
|
(Unaudited)
|
||||||||||||||||
|
ASSETS
|
|||||||||||||||||||
|
Cash and cash equivalents
|
$
|
1,539,746
|
$
|
2,382,188
|
$
|
2,735,250
|
$
|
2,416,136
|
$
|
1,769,258
|
|||||||||
|
Investments, at fair value:
|
|||||||||||||||||||
|
Agency mortgage-backed securities
|
75,589,873
|
73,476,105
|
64,862,992
|
65,439,824
|
65,718,224
|
||||||||||||||
|
Agency debentures
|
-
|
-
|
-
|
157,035
|
152,038
|
||||||||||||||
|
Credit risk transfer securities
|
724,722
|
669,295
|
520,321
|
501,167
|
456,510
|
||||||||||||||
|
Non-Agency mortgage-backed securities
|
1,401,307
|
1,460,261
|
1,197,549
|
1,157,507
|
906,722
|
||||||||||||||
|
Residential mortgage loans (2)
|
342,289
|
310,148
|
-
|
-
|
-
|
||||||||||||||
|
Mortgage servicing rights
|
652,216
|
492,169
|
-
|
-
|
-
|
||||||||||||||
|
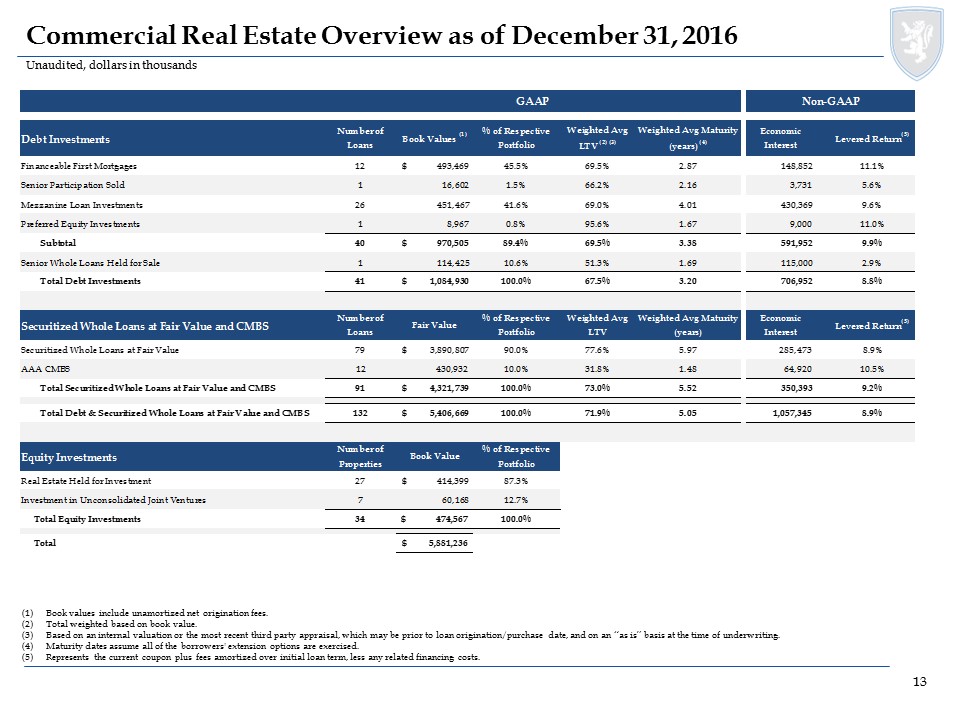
Commercial real estate debt investments (3)
|
4,321,739
|
4,319,077
|
4,361,972
|
4,401,725
|
2,911,828
|
||||||||||||||
|
Commercial real estate debt and preferred equity, held for investment (4)
|
970,505
|
1,070,197
|
1,137,971
|
1,177,468
|
1,348,817
|
||||||||||||||
|
Commercial loans held for sale, net
|
114,425
|
144,275
|
164,175
|
278,600
|
278,600
|
||||||||||||||
|
Investments in commercial real estate
|
474,567
|
500,027
|
504,605
|
527,786
|
535,946
|
||||||||||||||
|
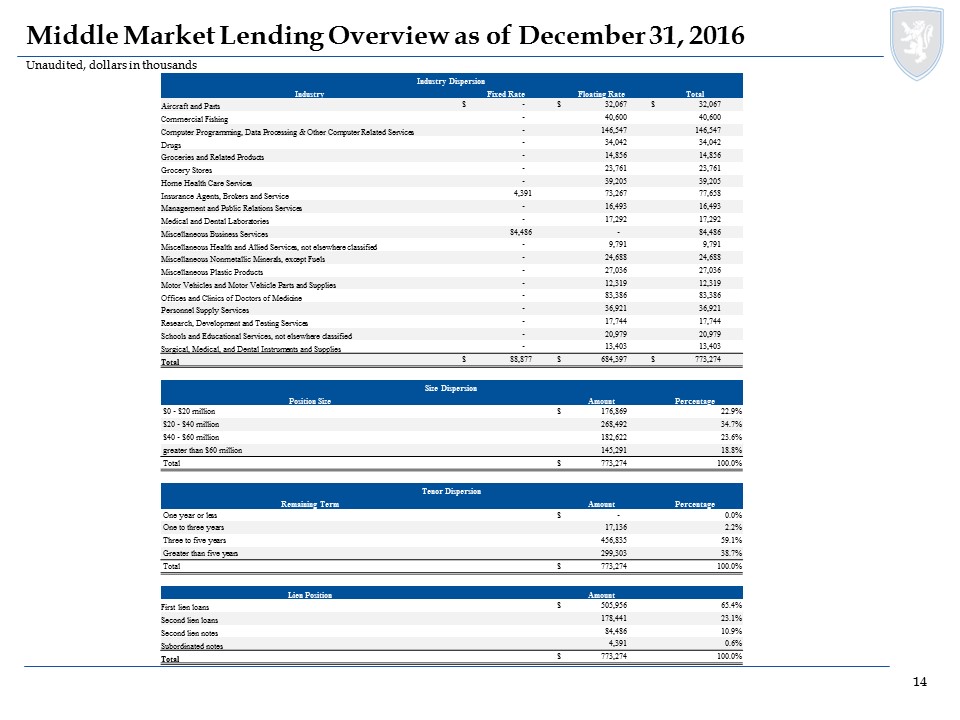
Corporate debt
|
773,274
|
716,831
|
669,612
|
639,481
|
488,508
|
||||||||||||||
|
Interest rate swaps, at fair value
|
68,194
|
113,253
|
146,285
|
93,312
|
19,642
|
||||||||||||||
|
Other derivatives, at fair value
|
171,266
|
87,921
|
137,490
|
77,449
|
22,066
|
||||||||||||||
|
Receivable for investments sold
|
51,461
|
493,839
|
697,943
|
2,220
|
121,625
|
||||||||||||||
|
Accrued interest and dividends receivable
|
270,400
|
260,583
|
227,225
|
232,180
|
231,336
|
||||||||||||||
|
Other assets
|
333,063
|
301,419
|
237,959
|
234,407
|
119,422
|
||||||||||||||
|
Goodwill
|
71,815
|
71,815
|
71,815
|
71,815
|
71,815
|
||||||||||||||
|
Intangible assets, net
|
34,184
|
39,903
|
43,306
|
35,853
|
38,536
|
||||||||||||||
|
Total assets
|
$
|
87,905,046
|
$
|
86,909,306
|
$
|
77,716,470
|
$
|
77,443,965
|
$
|
75,190,893
|
|||||||||
|
LIABILITIES AND STOCKHOLDERS’ EQUITY
|
|||||||||||||||||||
|
Liabilities:
|
|||||||||||||||||||
|
Repurchase agreements
|
$
|
65,215,810
|
$
|
61,784,121
|
$
|
53,868,385
|
$
|
54,448,141
|
$
|
56,230,860
|
|||||||||
|
Other secured financing
|
3,884,708
|
3,804,742
|
3,588,326
|
3,588,326
|
1,845,048
|
||||||||||||||
|
Securitized debt of consolidated VIEs (5)
|
3,655,802
|
3,712,821
|
3,748,289
|
3,802,682
|
2,540,711
|
||||||||||||||
|
Participation sold
|
12,869
|
12,976
|
13,079
|
13,182
|
13,286
|
||||||||||||||
|
Mortgages payable
|
311,636
|
327,632
|
327,643
|
334,765
|
334,707
|
||||||||||||||
|
Interest rate swaps, at fair value
|
1,443,765
|
2,919,492
|
3,208,986
|
2,782,961
|
1,677,571
|
||||||||||||||
|
Other derivatives, at fair value
|
86,437
|
73,445
|
154,017
|
69,171
|
49,963
|
||||||||||||||
|
Dividends payable
|
305,674
|
269,111
|
277,479
|
277,456
|
280,779
|
||||||||||||||
|
Payable for investments purchased
|
65,041
|
454,237
|
746,090
|
250,612
|
107,115
|
||||||||||||||
|
Accrued interest payable
|
163,013
|
173,320
|
159,435
|
163,983
|
151,843
|
||||||||||||||
|
Accounts payable and other liabilities
|
184,319
|
115,606
|
62,868
|
54,679
|
53,088
|
||||||||||||||
|
Total liabilities
|
75,329,074
|
73,647,503
|
66,154,597
|
65,785,958
|
63,284,971
|
||||||||||||||
|
Stockholders’ Equity:
|
|||||||||||||||||||
|
7.875% Series A Cumulative Redeemable Preferred Stock:
7,412,500 authorized, issued and outstanding
|
177,088
|
177,088
|
177,088
|
177,088
|
177,088
|
||||||||||||||
|
7.625% Series C Cumulative Redeemable Preferred Stock
12,650,000 authorized, 12,000,000 issued and outstanding
|
290,514
|
290,514
|
290,514
|
290,514
|
290,514
|
||||||||||||||
|
7.50% Series D Cumulative Redeemable Preferred Stock:
18,400,000 authorized, issued and outstanding
|
445,457
|
445,457
|
445,457
|
445,457
|
445,457
|
||||||||||||||
|
7.625% Series E Cumulative Redeemable Preferred Stock:
11,500,000 authorized, issued and outstanding
|
287,500
|
287,500
|
-
|
-
|
-
|
||||||||||||||
|
Common stock, par value $0.01 per share, 1,945,437,500, 1,945,437,500, 1,956,937,500, 1,956,937,500 and 1,956,937,500 authorized, 1,018,913,249, 1,018,857,866, 924,929,607, 924,853,133
and 935,929,561 issued and outstanding, respectively
|
10,189
|
10,189
|
9,249
|
9,249
|
9,359
|
||||||||||||||
|
Additional paid-in capital
|
15,579,342
|
15,578,677
|
14,575,426
|
14,573,760
|
14,675,768
|
||||||||||||||
|
Accumulated other comprehensive income (loss)
|
(1,085,893
|
)
|
1,119,677
|
1,117,046
|
640,366
|
(377,596
|
)
|
||||||||||||
|
Accumulated deficit
|
(3,136,017
|
)
|
(4,655,440
|
)
|
(5,061,565
|
)
|
(4,487,982
|
)
|
(3,324,616
|
)
|
|||||||||
|
Total stockholders’ equity
|
12,568,180
|
13,253,662
|
11,553,215
|
11,648,452
|
11,895,974
|
||||||||||||||
|
Noncontrolling interest
|
7,792
|
8,141
|
8,658
|
9,555
|
9,948
|
||||||||||||||
|
Total equity
|
12,575,972
|
13,261,803
|
11,561,873
|
11,658,007
|
11,905,922
|
||||||||||||||
|
Total liabilities and equity
|
$
|
87,905,046
|
$
|
86,909,306
|
$
|
77,716,470
|
$
|
77,443,965
|
$
|
75,190,893
|
|||||||||
| (1) |
Derived from the audited consolidated financial statements at December 31, 2015.
|
| (2) | Includes securitized mortgage loans of a consolidated VIE carried at fair value of $165.9 million and $176.7 million at December 31, 2016 and September 30, 2016, respectively. |
| (3) | Includes senior securitized commercial mortgage loans of consolidated VIEs with a carrying value of $3.9 billion, $4.0 billion, $4.0 billion, $4.0 billion and $2.6 billion at December 31, 2016, September 30, 2016, June 30, 2016, March 31, 2016 and December 31, 2015, respectively. |
| (4) | Includes senior securitized commercial mortgage loans of consolidated VIE with a carrying value of $0, $128.9 million, $187.2 million, $211.9 million and $262.7 million at December 31, 2016, September 30, 2016, June 30, 2016, March 31, 2016 and December 31, 2015, respectively. |
| (5) |
Includes securitized debt of consolidated VIEs carried at fair value of $3.7 billion, $3.7 billion, $3.7 billion, $3.7 billion and $2.4 billion at December 31, 2016, September 30, 2016, June 30, 2016, March 31, 2016 and December 31, 2015, respectively.
|
4
|
ANNALY CAPITAL MANAGEMENT, INC. AND SUBSIDIARIES
|
|||||||||||||||||||
|
CONSOLIDATED STATEMENTS OF COMPREHENSIVE INCOME (LOSS)
|
|||||||||||||||||||
|
(UNAUDITED)
|
|||||||||||||||||||
|
(dollars in thousands, except per share data)
|
|||||||||||||||||||
|
For the quarters ended
|
|||||||||||||||||||
|
December 31,
|
September 30,
|
June 30,
|
March 31,
|
December 31,
|
|||||||||||||||
|
2016
|
2016
|
2016
|
2016
|
2015
|
|||||||||||||||
|
Net interest income:
|
|||||||||||||||||||
|
Interest income
|
$
|
807,022
|
$
|
558,668
|
$
|
457,118
|
$
|
388,143
|
$
|
576,580
|
|||||||||
|
Interest expense
|
183,396
|
174,154
|
152,755
|
147,447
|
118,807
|
||||||||||||||
|
Net interest income
|
623,626
|
384,514
|
304,363
|
240,696
|
457,773
|
||||||||||||||
|
Realized and unrealized gains (losses):
|
|||||||||||||||||||
|
Realized gains (losses) on interest rate swaps(1)
|
(103,872
|
)
|
(124,572
|
)
|
(130,762
|
)
|
(147,475
|
)
|
(159,487
|
)
|
|||||||||
|
Realized gains (losses) on termination of interest rate swaps
|
(55,214
|
)
|
1,337
|
(60,064
|
)
|
-
|
-
|
||||||||||||
|
Unrealized gains (losses) on interest rate swaps
|
1,430,668
|
256,462
|
(373,220
|
)
|
(1,031,720
|
)
|
463,126
|
||||||||||||
|
Subtotal
|
1,271,582
|
133,227
|
(564,046
|
)
|
(1,179,195
|
)
|
303,639
|
||||||||||||
|
Net gains (losses) on disposal of investments
|
7,782
|
14,447
|
12,535
|
(1,675
|
)
|
(7,259
|
)
|
||||||||||||
|
Net gains (losses) on trading assets
|
(139,470
|
)
|
162,981
|
81,880
|
125,189
|
42,584
|
|||||||||||||
|
Net unrealized gains (losses) on investments measured at fair value through earnings
|
110,742
|
29,675
|
(54,154
|
)
|
128
|
(62,703
|
)
|
||||||||||||
|
Bargain purchase gain
|
-
|
72,576
|
-
|
-
|
-
|
||||||||||||||
|
Subtotal
|
(20,946
|
)
|
279,679
|
40,261
|
123,642
|
(27,378
|
)
|
||||||||||||
|
Total realized and unrealized gains (losses)
|
1,250,636
|
412,906
|
(523,785
|
)
|
(1,055,553
|
)
|
276,261
|
||||||||||||
|
Other income (loss)
|
30,918
|
29,271
|
(9,930
|
)
|
(6,115
|
)
|
(10,447
|
)
|
|||||||||||
|
General and administrative expenses:
|
|||||||||||||||||||
|
Compensation and management fee
|
39,845
|
38,709
|
36,048
|
36,997
|
37,193
|
||||||||||||||
|
Other general and administrative expenses
|
15,608
|
59,028
|
13,173
|
10,948
|
10,643
|
||||||||||||||
|
Total general and administrative expenses
|
55,453
|
97,737
|
49,221
|
47,945
|
47,836
|
||||||||||||||
|
Income (loss) before income taxes
|
1,849,727
|
728,954
|
(278,573
|
)
|
(868,917
|
)
|
675,751
|
||||||||||||
|
Income taxes
|
1,244
|
(1,926
|
)
|
(76
|
)
|
(837
|
)
|
6,085
|
|||||||||||
|
Net income (loss)
|
1,848,483
|
730,880
|
(278,497
|
)
|
(868,080
|
)
|
669,666
|
||||||||||||
|
Net income (loss) attributable to noncontrolling interest
|
(87
|
)
|
(336
|
)
|
(385
|
)
|
(162
|
)
|
(373
|
)
|
|||||||||
|
Net income (loss) attributable to Annaly
|
1,848,570
|
731,216
|
(278,112
|
)
|
(867,918
|
)
|
670,039
|
||||||||||||
|
Dividends on preferred stock
|
23,473
|
22,803
|
17,992
|
17,992
|
17,992
|
||||||||||||||
|
Net income (loss) available (related) to common stockholders
|
$
|
1,825,097
|
$
|
708,413
|
$
|
(296,104
|
)
|
$
|
(885,910
|
)
|
$
|
652,047
|
|||||||
|
Net income (loss) per share available (related) to common stockholders:
|
|||||||||||||||||||
|
Basic
|
$
|
1.79
|
$
|
0.70
|
$
|
(0.32
|
)
|
$
|
(0.96
|
)
|
$
|
0.69
|
|||||||
|
Diluted
|
$
|
1.79
|
$
|
0.70
|
$
|
(0.32
|
)
|
$
|
(0.96
|
)
|
$
|
0.69
|
|||||||
|
Weighted average number of common shares outstanding:
|
|||||||||||||||||||
|
Basic
|
1,018,886,380
|
1,007,607,893
|
924,887,316
|
926,813,588
|
945,072,058
|
||||||||||||||
|
Diluted
|
1,019,251,111
|
1,007,963,406
|
924,887,316
|
926,813,588
|
945,326,098
|
||||||||||||||
|
Net income (loss)
|
$
|
1,848,483
|
$
|
730,880
|
$
|
(278,497
|
)
|
$
|
(868,080
|
)
|
$
|
669,666
|
|||||||
|
Other comprehensive income (loss):
|
|||||||||||||||||||
|
Unrealized gains (losses) on available-for-sale securities
|
(2,206,288
|
)
|
18,237
|
483,930
|
1,017,707
|
(648,106
|
)
|
||||||||||||
|
Reclassification adjustment for net (gains) losses included in net income (loss)
|
718
|
(15,606
|
)
|
(7,250
|
)
|
255
|
7,655
|
||||||||||||
|
Other comprehensive income (loss)
|
(2,205,570
|
)
|
2,631
|
476,680
|
1,017,962
|
(640,451
|
)
|
||||||||||||
|
Comprehensive income (loss)
|
(357,087
|
)
|
733,511
|
198,183
|
149,882
|
29,215
|
|||||||||||||
|
Comprehensive income (loss) attributable to noncontrolling interest
|
(87
|
)
|
(336
|
)
|
(385
|
)
|
(162
|
)
|
(373
|
)
|
|||||||||
|
Comprehensive income (loss) attributable to Annaly
|
$
|
(357,000
|
)
|
$
|
733,847
|
$
|
198,568
|
$
|
150,044
|
$
|
29,588
|
||||||||
| (1) |
Interest expense related to the Company’s interest rate swaps is recorded in Realized gains (losses) on interest rate swaps on the Consolidated Statements of Comprehensive Income.
|
5
|
ANNALY CAPITAL MANAGEMENT, INC. AND SUBSIDIARIES
|
||||||||
|
CONSOLIDATED STATEMENTS OF COMPREHENSIVE INCOME (LOSS)
|
||||||||
|
(dollars in thousands, except per share data)
|
||||||||
|
For the years ended
|
||||||||
|
December 31,
|
December 31,
|
|||||||
|
2016
|
2015 (1)
|
|||||||
|
(Unaudited)
|
||||||||
|
Net interest income:
|
||||||||
|
Interest income
|
$
|
2,210,951
|
$
|
2,170,697
|
||||
|
Interest expense
|
657,752
|
471,596
|
||||||
|
Net interest income
|
1,553,199
|
1,699,101
|
||||||
|
Realized and unrealized gains (losses):
|
||||||||
|
Realized gains (losses) on interest rate swaps(2)
|
(506,681
|
)
|
(624,495
|
)
|
||||
|
Realized gains (losses) on termination of interest rate swaps
|
(113,941
|
)
|
(226,462
|
)
|
||||
|
Unrealized gains (losses) on interest rate swaps
|
282,190
|
(124,869
|
)
|
|||||
|
Subtotal
|
(338,432
|
)
|
(975,826
|
)
|
||||
|
Net gains (losses) on disposal of investments
|
33,089
|
50,987
|
||||||
|
Net gains (losses) on trading assets
|
230,580
|
29,623
|
||||||
|
Net unrealized gains (losses) on investments measured at fair value through earnings
|
86,391
|
(103,169
|
)
|
|||||
|
Bargain purchase gain
|
72,576
|
-
|
||||||
|
Impairment of goodwill
|
-
|
(22,966
|
)
|
|||||
|
Subtotal
|
422,636
|
(45,525
|
)
|
|||||
|
Total realized and unrealized gains (losses)
|
84,204
|
(1,021,351
|
)
|
|||||
|
Other income (loss):
|
||||||||
|
Investment advisory income
|
-
|
24,848
|
||||||
|
Dividend income from affiliate
|
-
|
8,636
|
||||||
|
Other income (loss)
|
44,144
|
(47,201
|
)
|
|||||
|
Total other income (loss)
|
44,144
|
(13,717
|
)
|
|||||
|
General and administrative expenses:
|
||||||||
|
Compensation and management fee
|
151,599
|
150,286
|
||||||
|
Other general and administrative expenses
|
98,757
|
49,954
|
||||||
|
Total general and administrative expenses
|
250,356
|
200,240
|
||||||
|
Income (loss) before income taxes
|
1,431,191
|
463,793
|
||||||
|
Income taxes
|
(1,595
|
)
|
(1,954
|
)
|
||||
|
Net income (loss)
|
1,432,786
|
465,747
|
||||||
|
Net income (loss) attributable to noncontrolling interest
|
(970
|
)
|
(809
|
)
|
||||
|
Net income (loss) attributable to Annaly
|
1,433,756
|
466,556
|
||||||
|
Dividends on preferred stock
|
82,260
|
71,968
|
||||||
|
Net income (loss) available (related) to common stockholders
|
$
|
1,351,496
|
$
|
394,588
|
||||
|
Net income (loss) per share available (related) to common stockholders:
|
||||||||
|
Basic
|
$
|
1.39
|
$
|
0.42
|
||||
|
Diluted
|
$
|
1.39
|
$
|
0.42
|
||||
|
Weighted average number of common shares outstanding:
|
||||||||
|
Basic
|
969,787,583
|
947,062,099
|
||||||
|
Diluted
|
970,102,353
|
947,276,742
|
||||||
|
Net income (loss)
|
$
|
1,432,786
|
$
|
465,747
|
||||
|
Other comprehensive income (loss):
|
||||||||
|
Unrealized gains (losses) on available-for-sale securities
|
(686,414
|
)
|
(531,952
|
)
|
||||
|
Reclassification adjustment for net (gains) losses included in net income (loss)
|
(21,883
|
)
|
(50,527
|
)
|
||||
|
Other comprehensive income (loss)
|
(708,297
|
)
|
(582,479
|
)
|
||||
|
Comprehensive income (loss)
|
724,489
|
(116,732
|
)
|
|||||
|
Comprehensive income (loss) attributable to noncontrolling interest
|
(970
|
)
|
(809
|
)
|
||||
|
Comprehensive income (loss) attributable to Annaly
|
$
|
725,459
|
$
|
(115,923
|
)
|
|||
| (1) |
Derived from the audited consolidated financial statements at December 31, 2015.
|
| (2) |
Interest expense related to the Company’s interest rate swaps is recorded in Realized gains (losses) on interest rate swaps on the Consolidated Statements of Comprehensive Income.
|
6
Key Metrics
The following table presents key metrics of the Company’s portfolio, liabilities and hedging positions, and performance as of and for the quarters ended December 31, 2016, September 30, 2016, and December 31, 2015:
|
December 31, 2016
|
September 30, 2016
|
December 31, 2015
|
|||||||||
|
Portfolio Related Metrics:
|
|||||||||||
|
Fixed-rate Residential Investment Securities as a percentage of total Residential Investment Securities
|
83
|
%
|
81
|
%
|
93
|
%
|
|||||
|
Adjustable-rate and floating-rate Residential Investment Securities as a percentage of total Residential Investment Securities
|
17
|
%
|
19
|
%
|
7
|
%
|
|||||
|
Weighted average experienced CPR for the period
|
15.6
|
%
|
15.9
|
%
|
9.7
|
%
|
|||||
|
Weighted average projected long-term CPR at period end
|
10.1
|
%
|
14.4
|
%
|
8.8
|
%
|
|||||
|
Liabilities and Hedging Metrics:
|
|||||||||||
|
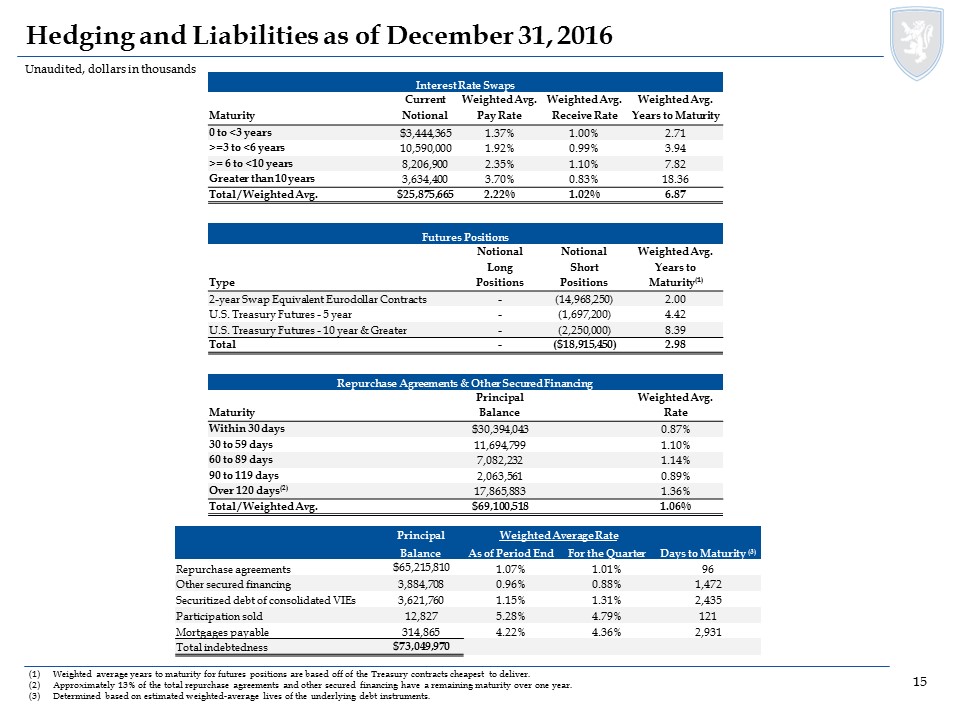
Weighted average days to maturity on repurchase agreements outstanding at period-end
|
96
|
128
|
151
|
||||||||
|
Hedge ratio (1)
|
56
|
%
|
52
|
%
|
55
|
%
|
|||||
|
Weighted average pay rate on interest rate swaps at period-end (2)
|
2.22
|
%
|
2.25
|
%
|
2.26
|
%
|
|||||
|
Weighted average receive rate on interest rate swaps at period-end (2)
|
1.02
|
%
|
0.88
|
%
|
0.53
|
%
|
|||||
|
Weighted average net rate on interest rate swaps at period-end (2)
|
1.20
|
%
|
1.37
|
%
|
1.73
|
%
|
|||||
|
Leverage at period-end (3)
|
5.8:1
|
5.3:1
|
5.1:1
|
||||||||
|
Economic leverage at period-end (4)
|
6.4:1
|
6.1:1
|
6.0:1
|
||||||||
|
Capital ratio at period-end
|
13.1
|
%
|
13.3
|
%
|
13.7
|
%
|
|||||
|
Performance Related Metrics:
|
|||||||||||
|
Book value per common share
|
$
|
11.16
|
$
|
11.83
|
$
|
11.73
|
|||||
|
GAAP net income (loss) per common share
|
$
|
1.79
|
$
|
0.70
|
$
|
0.69
|
|||||
|
Core earnings per common share (unrevised - excluding PAA)*
|
$
|
0.30
|
$
|
0.29
|
$
|
0.31
|
|||||
|
Less: PAA cost (benefit)
|
(0.23
|
)
|
-
|
(0.02
|
)
|
||||||
|
Core earnings per common share (revised - including PAA)*
|
$
|
0.53
|
$
|
0.29
|
$
|
0.33
|
|||||
|
Annualized return (loss) on average equity
|
57.23
|
%
|
23.55
|
%
|
22.15
|
%
|
|||||
|
Annualized core return on average equity (unrevised - excluding PAA)*
|
10.13
|
%
|
10.09
|
%
|
10.30
|
%
|
|||||
|
Annualized core return on average equity (revised - including PAA)*
|
17.53
|
%
|
10.09
|
%
|
10.89
|
%
|
|||||
|
Net interest margin
|
2.49
|
%
|
1.40
|
%
|
1.80
|
%
|
|||||
|
Core net interest margin (excluding PAA)*
|
1.53
|
%
|
1.42
|
%
|
1.71
|
%
|
|||||
|
Average yield on interest earning assets (5)
|
3.81
|
%
|
2.70
|
%
|
3.15
|
%
|
|||||
|
Core average yield on interest earning assets (excluding PAA)* (6)
|
2.68
|
%
|
2.72
|
%
|
3.05
|
%
|
|||||
|
Average cost of interest bearing liabilities (6)
|
1.53
|
%
|
1.57
|
%
|
1.68
|
%
|
|||||
|
Net interest spread
|
2.28
|
%
|
1.13
|
%
|
1.47
|
%
|
|||||
|
Core net interest spread (excluding PAA)*
|
1.15
|
%
|
1.15
|
%
|
1.37
|
%
|
|||||
| * | Represents a non-GAAP financial measure. Please refer to the ‘Non-GAAP Financial Measures’ section for additional information. |
| (1) | Measures total notional balances of interest rate swaps, interest rate swaptions and futures relative to repurchase agreements, other secured financing and TBA notional outstanding. |
| (2) | Excludes forward starting swaps. |
| (3) | Debt consists of repurchase agreements, other secured financing, Convertible Senior Notes, securitized debt, participation sold and mortgages payable. Securitized debt, participation sold and mortgages payable are non-recourse to the Company. |
| (4) | Computed as the sum of recourse debt, TBA derivative notional outstanding and net forward purchases of investments divided by total equity. |
| (5) |
Average interest earning assets reflects the average amortized cost of our investments during the period.
|
| (6) |
Includes interest expense on interest rate swaps used to hedge cost of funds.
|
7
Non-GAAP Financial Measures
Based upon recent regulatory guidance and interpretations on the use of non-GAAP financial measures, beginning with the fourth quarter 2016, the Company will report core earnings metrics (revised) that include the PAA. In addition, this is the final quarter that the Company will report core earnings metrics (unrevised) that exclude the PAA. In future periods, the Company will not make an adjustment to GAAP net income (loss) to exclude the PAA. However, given its usefulness in evaluating the Company’s financial performance, the Company will continue to separately disclose the PAA. Additionally, comparative prior period results reported in future periods will conform to the revised presentation.
To supplement its consolidated financial statements, which are prepared and presented in accordance with U.S. generally accepted accounting principles (“GAAP”), the Company provides the following non-GAAP financial measures. These measures should not be considered a substitute for, or superior to, financial measures computed in accordance with GAAP.
|
·
|
core earnings;
|
|
·
|
core earnings per average common share;
|
|
·
|
annualized core return on average equity;
|
|
·
|
core interest income (excluding PAA);
|
|
·
|
economic interest expense;
|
|
·
|
economic core net interest income (excluding PAA);
|
|
·
|
core average yield on interest earning assets (excluding PAA);
|
|
·
|
core net interest margin (excluding PAA); and
|
|
·
|
core net interest spread (excluding PAA).
|
These non-GAAP measures provide additional detail to enhance investor understanding of the Company’s period-over-period operating performance and business trends, as well as for assessing the Company’s performance versus that of industry peers. Additional information pertaining to the Company’s use of these non-GAAP financial measures, including discussion of how each such measure is useful to investors, and reconciliations to their most directly comparable GAAP results are provided below.
Core earnings, core earnings per average common share and annualized core return on average equity
One of the Company’s principal business objectives is to generate net income by earning a net interest spread on its investment portfolio, which is a function of the Company’s interest income from its investment portfolio less financing, hedging and operating costs. Core earnings, which is comprised of interest income plus TBA dollar roll incomei, less financing and hedging costsii and general and administrative expenses, is used by management to measure its progress in achieving this objective.
Historically, the Company has defined “core earnings”, a non-GAAP measure, as net income (loss) excluding gains or losses on disposals of investments and termination of interest rate swaps, unrealized gains or losses on interest rate swaps and investments measured at fair value through earnings, net gains and losses on trading assets, impairment losses, net income (loss) attributable to noncontrolling interest, the premium amortization adjustment resulting from the quarter-over-quarter change in estimated long-term CPR (“PAA”), corporate acquisition related expenses and certain other non-recurring gains or losses, and inclusive of dollar roll income (a component of Net gains (losses) on trading assets) and realized amortization of mortgage servicing rights (“MSR”) (a component of net unrealized gains (losses) on investments measured at fair value through earnings).
Beginning with the fourth quarter 2016, the Company will report core earnings metrics (revised) that include the PAA. In addition, this is the final quarter that the Company will report core earnings metrics (unrevised) that exclude the PAA. In future periods, the Company will not make an adjustment to GAAP net income (loss) to exclude the PAA.
The Company believes these measures provide management and investors with additional details regarding the Company’s underlying operating results and investment portfolio trends by (i) making adjustments to account for the disparate reporting of changes in fair value where certain instruments are reflected in GAAP net income (loss) while others are reflected in other comprehensive income (loss), and (ii) by excluding certain unrealized, non-cash or episodic components of GAAP net income (loss) in order to provide additional transparency into the operating performance of the Company’s portfolio. Annualized core return on average equity, which is calculated by dividing core earnings over average stockholders’ equity, provides investors with additional detail on the core earnings generated by the Company’s invested equity capital.
i TBA dollar roll transactions are accounted for as derivatives, with gains and losses reflected as a component of Net gains (losses) on trading assets in the Company’s Consolidated Statements of Comprehensive Income (Loss). TBA dollar roll income represents the economic equivalent of interest income on the underlying security less the implied cost of financing.
ii The interest component of hedging costs are reported as realized gains (losses) on interest rate swaps in the Company’s Consolidated Statements of Comprehensive Income (Loss).
8
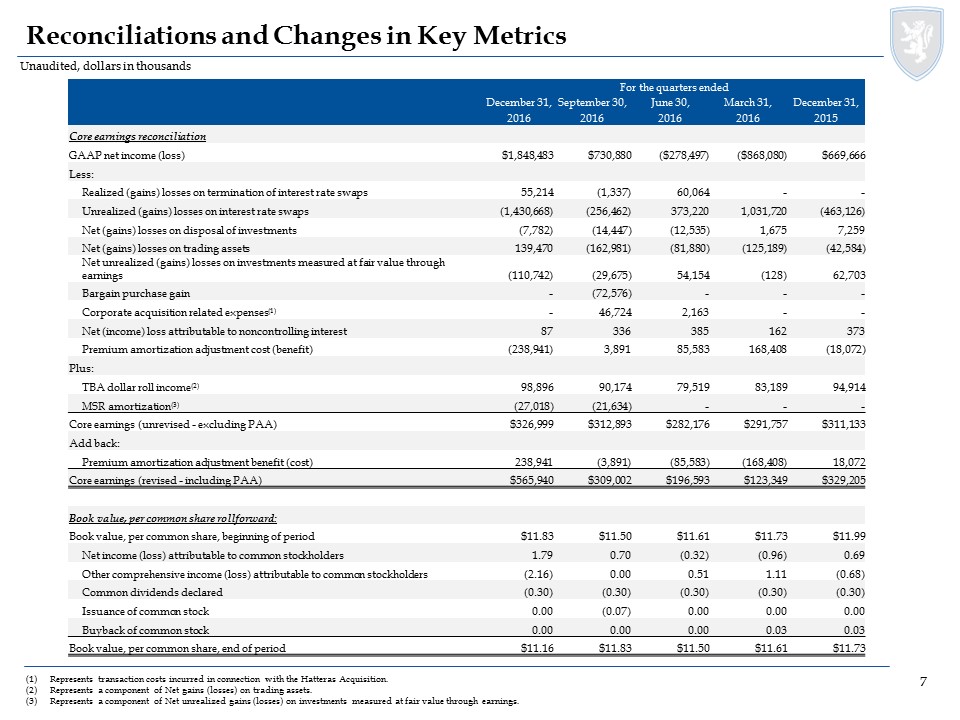
The following table presents a reconciliation of GAAP financial results to non-GAAP core earnings for the periods presented.
|
For the quarters ended
|
||||||||||||
|
December 31, 2016
|
September 30, 2016
|
December 31, 2015
|
||||||||||
|
(dollars in thousands)
|
||||||||||||
|
GAAP net income (loss)
|
$
|
1,848,483
|
$
|
730,880
|
$
|
669,666
|
||||||
|
Less:
|
||||||||||||
|
Realized (gains) losses on termination of interest rate swaps
|
55,214
|
(1,337
|
)
|
-
|
||||||||
|
Unrealized (gains) losses on interest rate swaps
|
(1,430,668
|
)
|
(256,462
|
)
|
(463,126
|
)
|
||||||
|
Net (gains) losses on disposal of investments
|
(7,782
|
)
|
(14,447
|
)
|
7,259
|
|||||||
|
Net (gains) losses on trading assets
|
139,470
|
(162,981
|
)
|
(42,584
|
)
|
|||||||
|
Net unrealized (gains) losses on investments measured at fair value through earnings
|
(110,742
|
)
|
(29,675
|
)
|
62,703
|
|||||||
|
Bargain purchase gain
|
-
|
(72,576
|
)
|
-
|
||||||||
|
Corporate acquisition related expenses (1)
|
-
|
46,724
|
-
|
|||||||||
|
Net (income) loss attributable to noncontrolling interest
|
87
|
336
|
373
|
|||||||||
|
Premium amortization adjustment cost (benefit)
|
(238,941
|
)
|
3,891
|
(18,072
|
)
|
|||||||
|
Plus:
|
||||||||||||
|
TBA dollar roll income (2)
|
98,896
|
90,174
|
94,914
|
|||||||||
|
MSR amortization (3)
|
(27,018
|
)
|
(21,634
|
)
|
-
|
|||||||
|
Core earnings (unrevised - excluding PAA)*
|
326,999
|
312,893
|
311,133
|
|||||||||
|
Add back:
|
||||||||||||
|
Premium amortization adjustment
|
238,941
|
(3,891
|
)
|
18,072
|
||||||||
|
Core earnings (revised - including PAA)*
|
$
|
565,940
|
$
|
309,002
|
$
|
329,205
|
||||||
|
GAAP net income (loss) per average common share
|
$
|
1.79
|
$
|
0.70
|
$
|
0.69
|
||||||
|
Core earnings per average common share (unrevised - excluding PAA)*
|
$
|
0.30
|
$
|
0.29
|
$
|
0.31
|
||||||
|
Core earnings per average common share (revised - including PAA)*
|
$
|
0.53
|
$
|
0.29
|
$
|
0.33
|
||||||
|
Annualized GAAP return (loss) on average equity
|
57.23
|
%
|
23.55
|
%
|
22.15
|
%
|
||||||
|
Annualized core return on average equity (unrevised - excluding PAA)*
|
10.13
|
%
|
10.09
|
%
|
10.30
|
%
|
||||||
|
Annualized core return on average equity (revised - including PAA)*
|
17.53
|
%
|
10.09
|
%
|
10.89
|
%
|
||||||
|
For the years ended
|
||||||||
|
December 31, 2016
|
December 31, 2015
|
|||||||
|
(dollars in thousands)
|
||||||||
|
GAAP net income (loss)
|
$
|
1,432,786
|
$
|
465,747
|
||||
|
Less:
|
||||||||
|
Realized (gains) losses on termination of interest rate swaps
|
113,941
|
226,462
|
||||||
|
Unrealized (gains) losses on interest rate swaps
|
(282,190
|
)
|
124,869
|
|||||
|
Net (gains) losses on disposal of investments
|
(33,089
|
)
|
(50,987
|
)
|
||||
|
Net (gains) losses on trading assets
|
(230,580
|
)
|
(29,623
|
)
|
||||
|
Net unrealized (gains) losses on investments measured at fair value through earnings
|
(86,391
|
)
|
103,169
|
|||||
|
Bargain purchase gain
|
(72,576
|
)
|
-
|
|||||
|
Impairment of goodwill
|
-
|
22,966
|
||||||
|
Corporate acquisition related expenses (1)
|
48,887
|
-
|
||||||
|
Net (income) loss attributable to noncontrolling interest
|
970
|
809
|
||||||
|
Premium amortization adjustment cost (benefit)
|
18,941
|
73,365
|
||||||
|
Plus:
|
||||||||
|
TBA dollar roll income (2)
|
351,778
|
348,531
|
||||||
|
MSR amortization (3)
|
(48,652
|
)
|
-
|
|||||
|
Core earnings (unrevised - excluding PAA)*
|
1,213,825
|
1,285,308
|
||||||
|
Add back:
|
||||||||
|
Premium amortization adjustment
|
(18,941
|
)
|
(73,365
|
)
|
||||
|
Core earnings (revised - including PAA)*
|
$
|
1,194,884
|
$
|
1,211,943
|
||||
|
GAAP net income (loss) per average common share
|
$
|
1.39
|
$
|
0.42
|
||||
|
Core earnings per average common share (unrevised - excluding PAA)*
|
$
|
1.17
|
$
|
1.28
|
||||
|
Core earnings per average common share (revised - including PAA)*
|
$
|
1.15
|
$
|
1.20
|
||||
|
Annualized GAAP return (loss) on average equity
|
11.75
|
%
|
3.73
|
%
|
||||
|
Annualized core return on average equity (unrevised - excluding PAA)*
|
9.96
|
%
|
10.17
|
%
|
||||
|
Annualized core return on average equity (revised - including PAA)*
|
9.81
|
%
|
9.59
|
%
|
||||
| * |
Represents a non-GAAP financial measure.
|
| (1) | Represents non-recurring transaction costs incurred in connection with the Company’s acquisition of Hatteras Financial Corp. |
| (2) |
Represents a component of Net gains (losses) on trading assets.
|
| (3) |
Represents the portion of changes in fair value that is attributable to the realization of estimated cash flows on the Company’s MSR portfolio and is reported as a component of Net unrealized gains (losses) on investments measured at fair value.
|
9
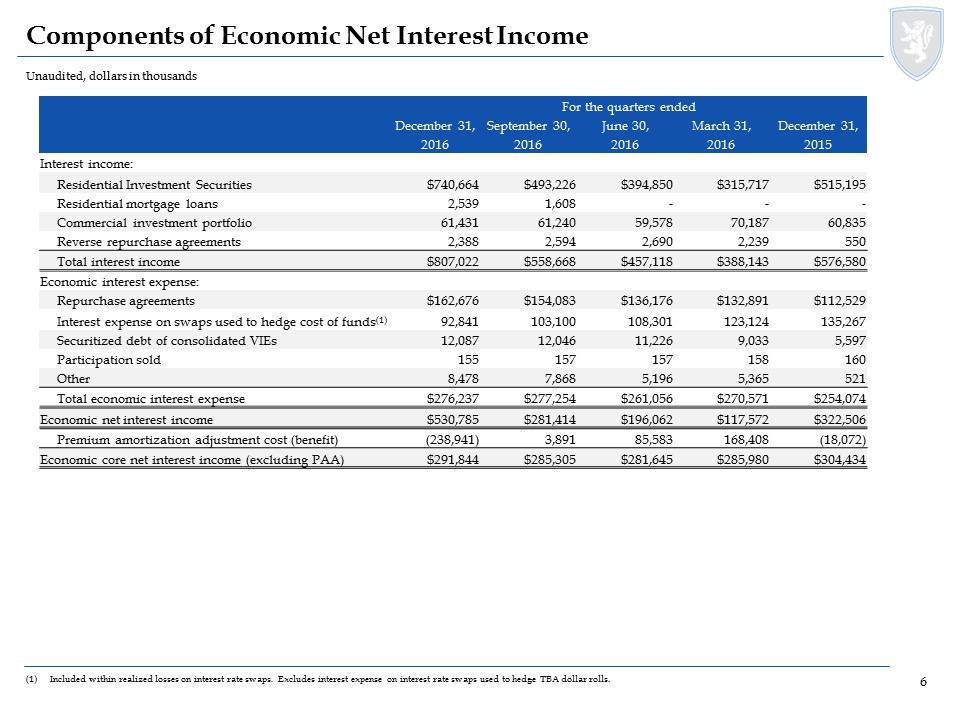
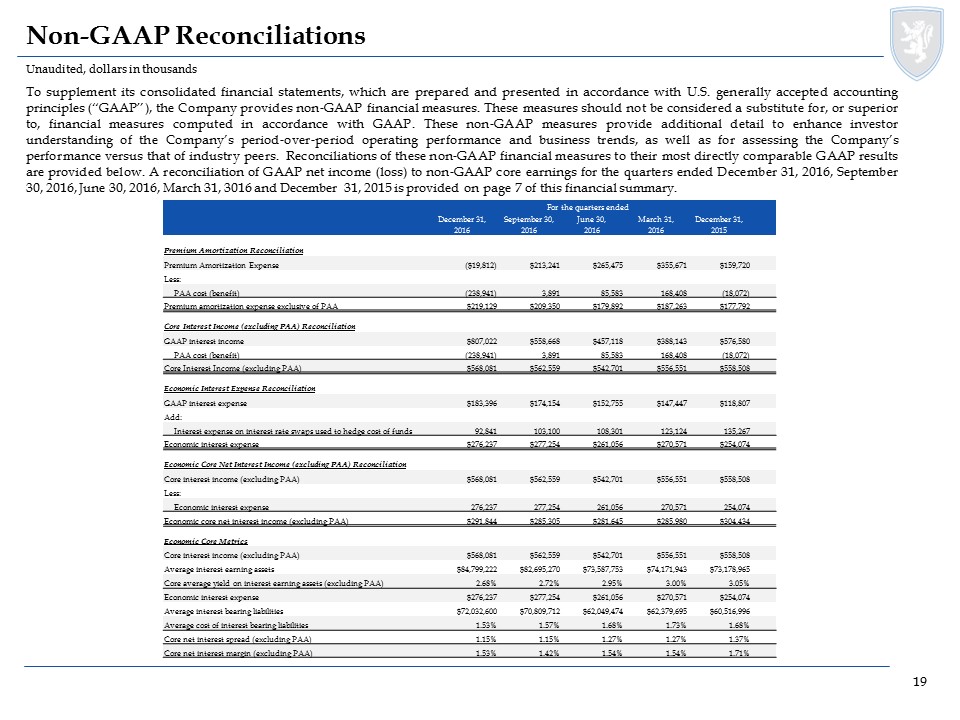
Core interest income (excluding PAA), economic interest expense and economic core net interest income (excluding PAA)
Core interest income (excluding PAA) represents interest income excluding the effect of the PAA, and serves as the basis for deriving core average yield on interest bearing assets (excluding PAA), core net interest margin (excluding PAA) and core net interest spread (excluding PAA), which are discussed below. The Company believes this measure provides management and investors with additional detail to enhance their understanding of the Company’s operating results and trends by excluding the component of premium amortization expense representing the cumulative effect of quarter-over-quarter changes in estimated long-term prepayment speeds related to the Company’s Agency mortgage-backed securities (other than interest-only securities), which can obscure underlying trends in the performance of the portfolio.
Economic interest expense is comprised of interest expense, as computed in accordance with GAAP, plus interest expense on interest rate swaps used to hedge cost of funds, which is a component of Realized gains (losses) on interest rate swaps in the Company’s Consolidated Statements of Comprehensive Income (Loss). The Company uses interest rate swaps to manage its exposure to changing interest rates on its repurchase agreements by economically hedging cash flows associated with these borrowings. Accordingly, adding the contractual interest payments on interest rate swaps to interest expense, as computed in accordance with GAAP, reflects the total contractual interest expense and thus, provides investors with additional information about the cost of our financing strategy.
Similarly, economic core net interest income (excluding PAA), as computed below, provides investors with additional information to enhance their understanding of the net economics of our primary business operations.
|
For the quarters ended
|
||||||||||||
|
December 31, 2016
|
September 30, 2016
|
December 31, 2015
|
||||||||||
|
(dollars in thousands)
|
||||||||||||
|
Core Interest Income Reconciliation
|
||||||||||||
|
GAAP interest income
|
$
|
807,022
|
$
|
558,668
|
$
|
576,580
|
||||||
|
Premium amortization adjustment
|
(238,941
|
)
|
3,891
|
(18,072
|
)
|
|||||||
|
Core interest income (excluding PAA)*
|
$
|
568,081
|
$
|
562,559
|
$
|
558,508
|
||||||
|
Economic Interest Expense Reconciliation
|
||||||||||||
|
GAAP interest expense
|
$
|
183,396
|
$
|
174,154
|
$
|
118,807
|
||||||
|
Add:
|
||||||||||||
|
Interest expense on interest rate swaps used to hedge cost of funds
|
92,841
|
103,100
|
135,267
|
|||||||||
|
Economic interest expense*
|
$
|
276,237
|
$
|
277,254
|
$
|
254,074
|
||||||
|
Economic Core Net Interest Income Reconciliation
|
||||||||||||
|
Core interest income (excluding PAA)*
|
$
|
568,081
|
$
|
562,559
|
$
|
558,508
|
||||||
|
Less:
|
||||||||||||
|
Economic interest expense*
|
276,237
|
277,254
|
254,074
|
|||||||||
|
Economic core net interest income (excluding PAA)*
|
$
|
291,844
|
$
|
285,305
|
$
|
304,434
|
||||||
| * |
Represents a non-GAAP financial measure.
|
Core average yield on interest earnings assets (excluding PAA), core net interest margin (excluding PAA) and core net interest spread (excluding PAA)
Core net interest spread (excluding PAA), which is the difference between the core average yield on interest earning assets (excluding PAA) and the average cost of interest bearing liabilities, and core net interest margin (excluding PAA), which is calculated by dividing the economic core net interest income (excluding PAA) by average interest earning assets, provide management with additional measures of the Company’s profitability that management relies upon in monitoring the performance of the business. Disclosure of these measures, which are presented below, provides investors with additional detail regarding how management evaluates the Company’s performance.
|
For the quarters ended
|
||||||||||||
|
December 31, 2016
|
September 30, 2016
|
December 31, 2015
|
||||||||||
|
Economic Core Metrics
|
(dollars in thousands)
|
|||||||||||
|
Core interest income (excluding PAA)*
|
$
|
568,081
|
$
|
562,559
|
$
|
558,508
|
||||||
|
Average interest earning assets
|
$
|
84,799,222
|
$
|
82,695,270
|
$
|
73,178,965
|
||||||
|
Core average yield on interest earning assets (excluding PAA)*
|
2.68
|
%
|
2.72
|
%
|
3.05
|
%
|
||||||
|
Economic interest expense*
|
$
|
276,237
|
$
|
277,254
|
$
|
254,074
|
||||||
|
Average interest bearing liabilities
|
$
|
72,032,600
|
$
|
70,809,712
|
$
|
60,516,996
|
||||||
|
Average cost of interest bearing liabilities
|
1.53
|
%
|
1.57
|
%
|
1.68
|
%
|
||||||
|
Core net interest spread (excluding PAA)*
|
1.15
|
%
|
1.15
|
%
|
1.37
|
%
|
||||||
|
Core net interest margin (excluding PAA)*
|
1.53
|
%
|
1.42
|
%
|
1.71
|
%
|
||||||
| * |
Represents a non-GAAP financial measure.
|
10