|
●
|
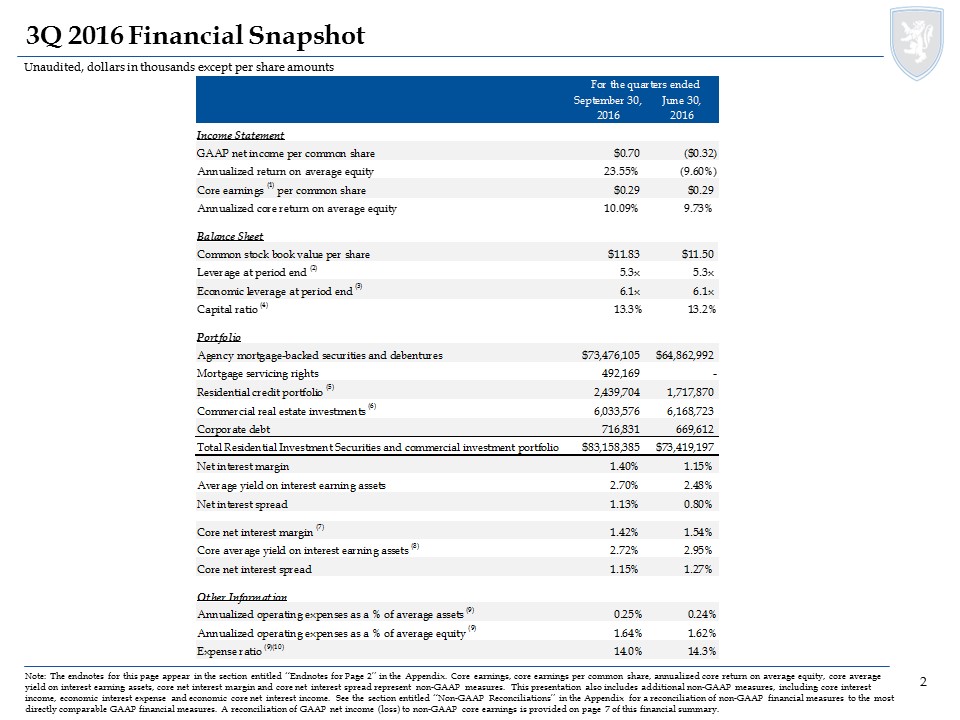
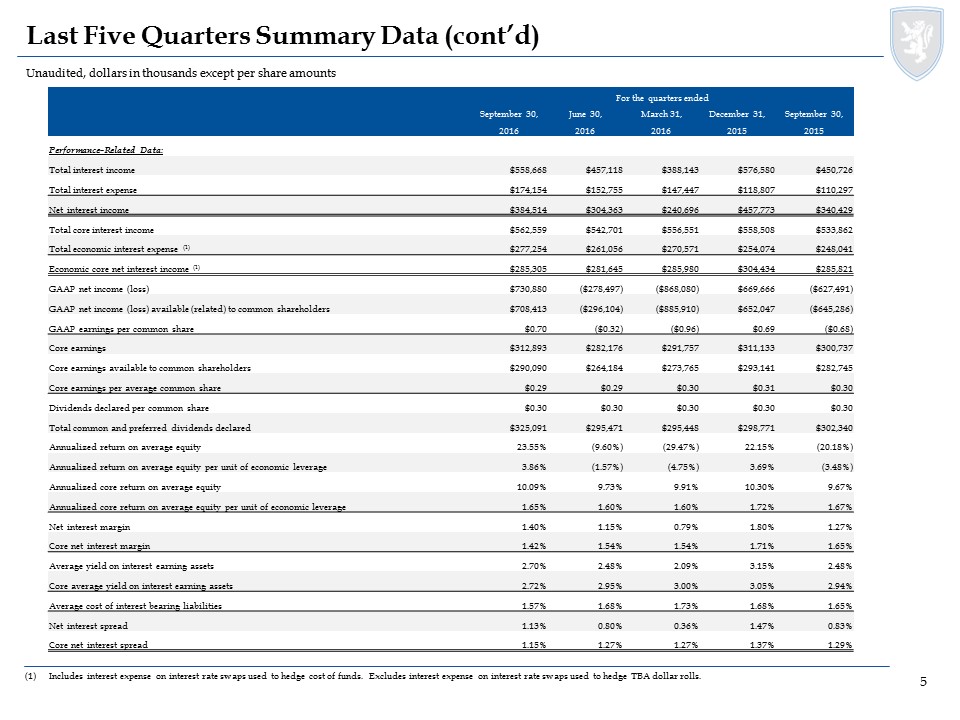
GAAP net income of $730.9 million, $0.70 per average common share
|
|
●
|
Core earnings of $0.29 per average common share, unchanged from prior quarteri
|
|
●
|
Common stock book value per share of $11.83, up 3% from prior quarter
|
|
●
|
Economic leverage of 6.1:1, unchanged from prior quarter
|
|
●
|
Credit investment portfolio represents 22% of stockholders’ equity
|
|
●
|
Successfully integrated $1.5 billion acquisition of Hatteras Financial Corp.
|
|
For the quarters ended
|
||||||||||||
|
September 30, 2016
|
June 30, 2016
|
September 30, 2015
|
||||||||||
|
Book value per common share
|
|
$11.83
|
|
$11.50
|
|
$11.99
|
||||||
|
Economic leverage at period-end (1)
|
6.1:1
|
6.1:1
|
5.8:1
|
|||||||||
|
GAAP net income (loss) per common share
|
|
$0.70
|
|
$(0.32)
|
|
|
$(0.68)
|
|
||||
|
Core earnings per common share* (2)
|
|
$0.29
|
|
$0.29
|
|
$0.30
|
||||||
|
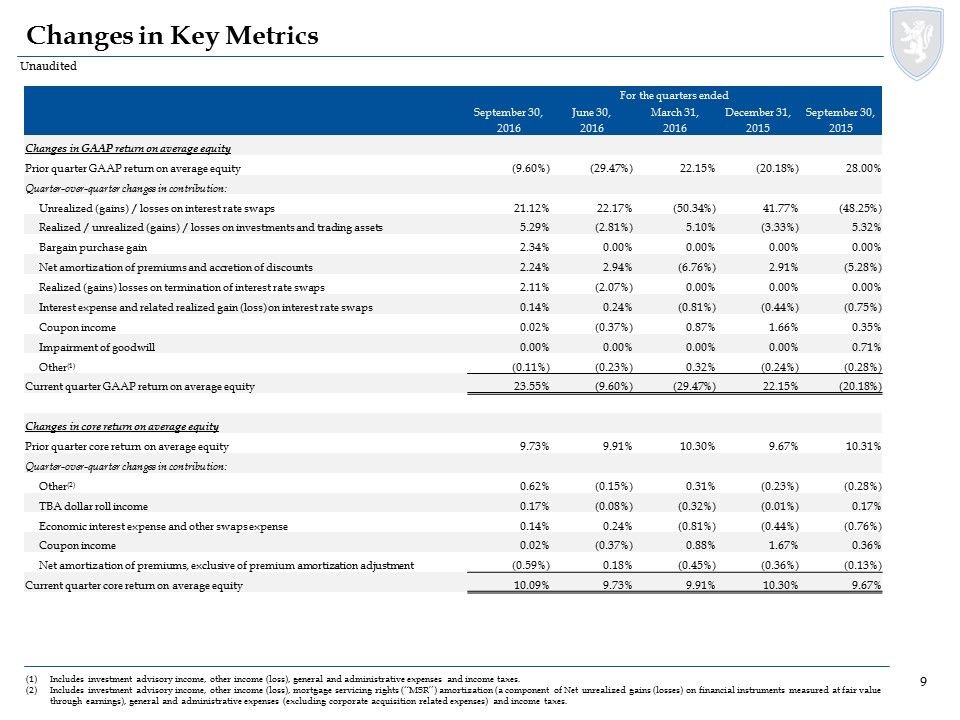
Annualized return (loss) on average equity
|
23.55%
|
|
(9.60%)
|
|
(20.18%)
|
|
||||||
|
Annualized core return on average equity*
|
10.09%
|
|
9.73%
|
|
9.67%
|
|
||||||
|
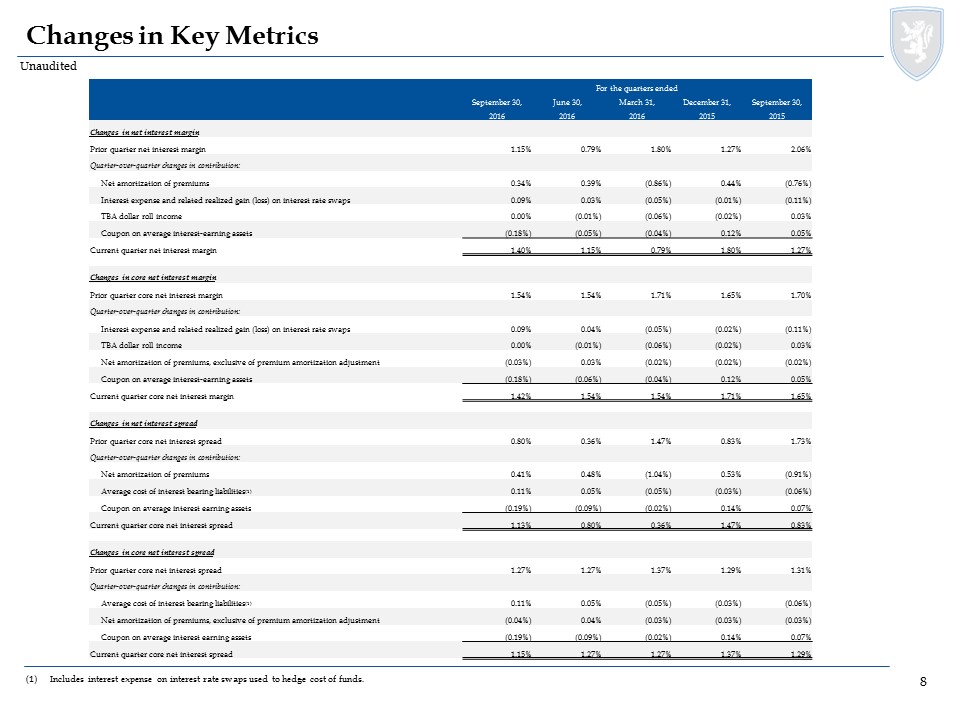
Net interest margin
|
1.40%
|
|
1.15%
|
|
1.27%
|
|
||||||
|
Core net interest margin* (3)
|
1.42%
|
|
1.54%
|
|
1.65%
|
|
||||||
|
Net interest spread
|
1.13%
|
|
0.80%
|
|
0.83%
|
|
||||||
|
Core net interest spread*
|
1.15%
|
|
1.27%
|
|
1.29%
|
|
||||||
|
Average yield on interest earning assets
|
2.70%
|
|
2.48%
|
|
2.48%
|
|
||||||
|
Core average yield on interest earning assets*
|
2.72%
|
|
2.95%
|
|
2.94%
|
|
||||||
|
*
|
Represents a non-GAAP financial measure. Please refer to the ‘Non-GAAP Financial Measures’ section for additional information.
|
|
|
(1)
|
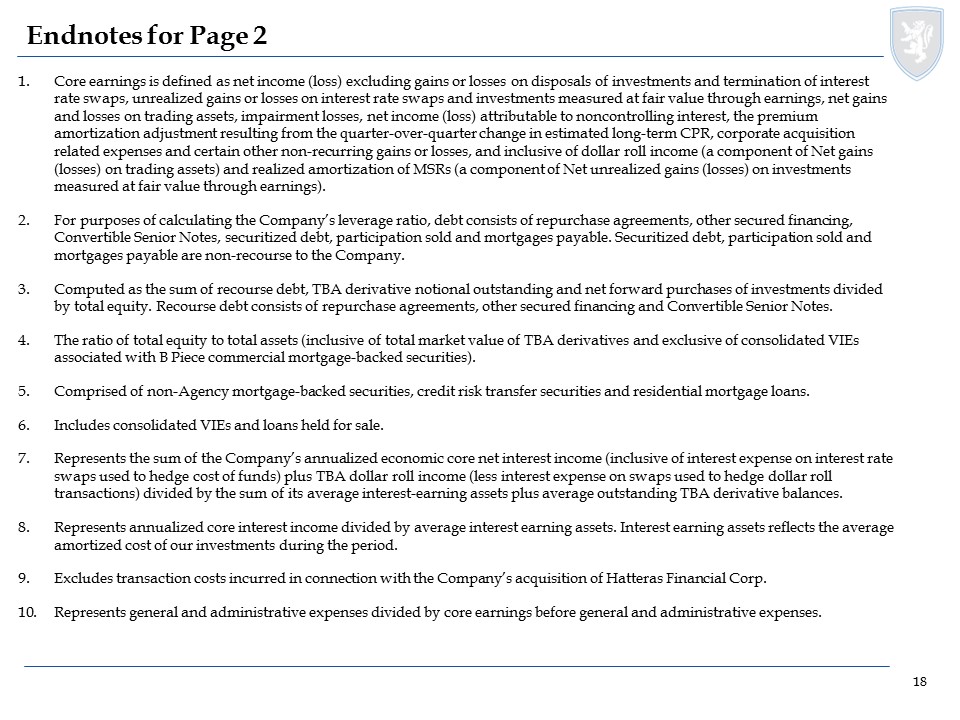
Computed as the sum of recourse debt, TBA derivative notional outstanding and net forward purchases of investments divided by total equity. Recourse debt consists of repurchase agreements, other secured financing and Convertible Senior Notes. Securitized debt, participation sold and mortgages payable are non-recourse to the Company and are excluded from this measure.
|
|
|
(2)
|
Core earnings is defined as net income (loss) excluding gains or losses on disposals of investments and termination of interest rate swaps, unrealized gains or losses on interest rate swaps and investments measured at fair value through earnings, net gains and losses on trading assets, impairment losses, net income (loss) attributable to noncontrolling interest, the premium amortization adjustment resulting from the quarter-over-quarter change in estimated long-term CPR, corporate acquisition related expenses and certain other non-recurring gains or losses, and inclusive of dollar roll income (a component of Net gains (losses) on trading assets) and realized amortization of MSRs (a component of net unrealized gains (losses) on investments measured at fair value through earnings).
|
|
|
(3)
|
Represents the sum of the Company’s annualized economic core net interest income (exclusive of the premium amortization adjustment (referred to herein as “PAA”) and inclusive of interest expense on interest rate swaps used to hedge cost of funds) plus TBA dollar roll income (less interest expense on swaps used to hedge dollar roll transactions) divided by the sum of its average interest earning assets plus average outstanding TBA derivative balances. PAA excludes the component of premium amortization representing the quarter-over-quarter change in estimated long-term constant prepayment rates (“CPR”). Average interest earning assets reflects the average amortized cost of our investments during the period.
|
|
For the quarters ended
|
||||||||||||
|
September 30, 2016
|
June 30, 2016
|
September 30, 2015
|
||||||||||
|
(dollars in thousands)
|
||||||||||||
|
Premium amortization expense
|
$
|
213,241
|
$
|
265,475
|
$
|
255,123
|
||||||
|
Less: PAA cost (benefit)
|
3,891
|
85,583
|
83,136
|
|||||||||
|
Premium amortization expense exclusive of PAA
|
$
|
209,350
|
$
|
179,892
|
$
|
171,987
|
||||||
|
September 30, 2016
|
June 30, 2016
|
September 30, 2015
|
||||||||||
|
(per common share)
|
||||||||||||
|
Premium amortization expense
|
$
|
0.21
|
$
|
0.29
|
$
|
0.27
|
||||||
|
Less: PAA cost (benefit)
|
--
|
(1) |
0.10
|
0.09
|
||||||||
|
Premium amortization expense exclusive of PAA
|
$
|
0.21
|
$
|
0.19
|
$
|
0.18
|
||||||
|
(1)
|
Rounds to less than $0.01 per common share.
|
|
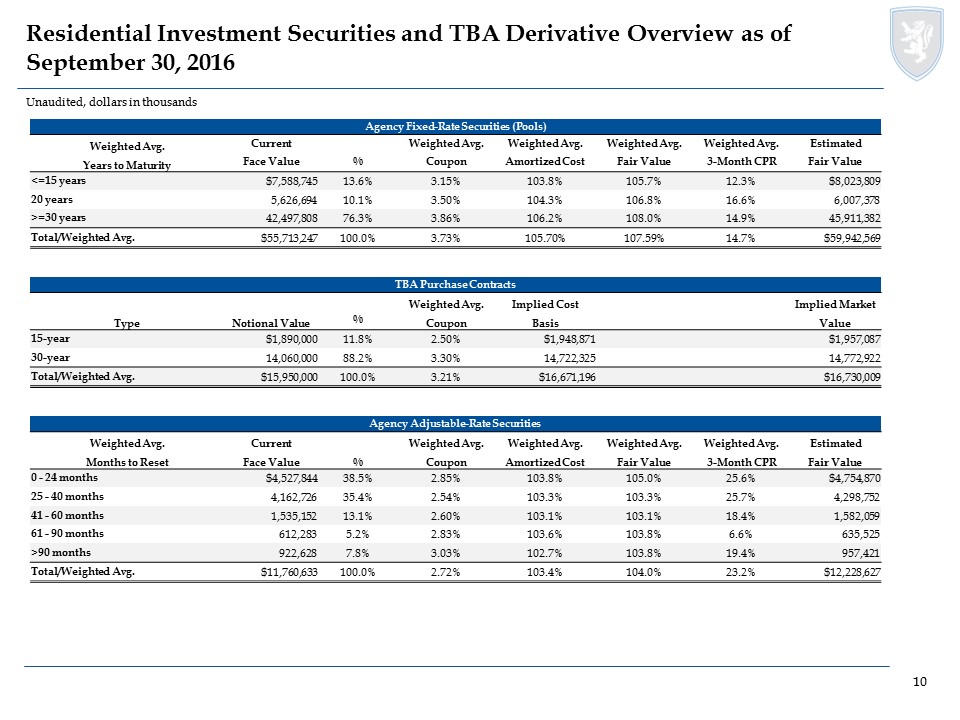
TBA Purchase Contracts
|
Notional
|
Implied Cost Basis
|
Implied Market Value
|
Net Carrying Value
|
||||||||||||
|
(dollars in thousands)
|
||||||||||||||||
|
Purchase contracts
|
$
|
15,950,000
|
$
|
16,671,196
|
$
|
16,730,009
|
$
|
58,813
|
||||||||
|
Maturity
|
Principal Balance
|
Weighted Average Rate
|
||||||
|
|
(dollars in thousands) | |||||||
|
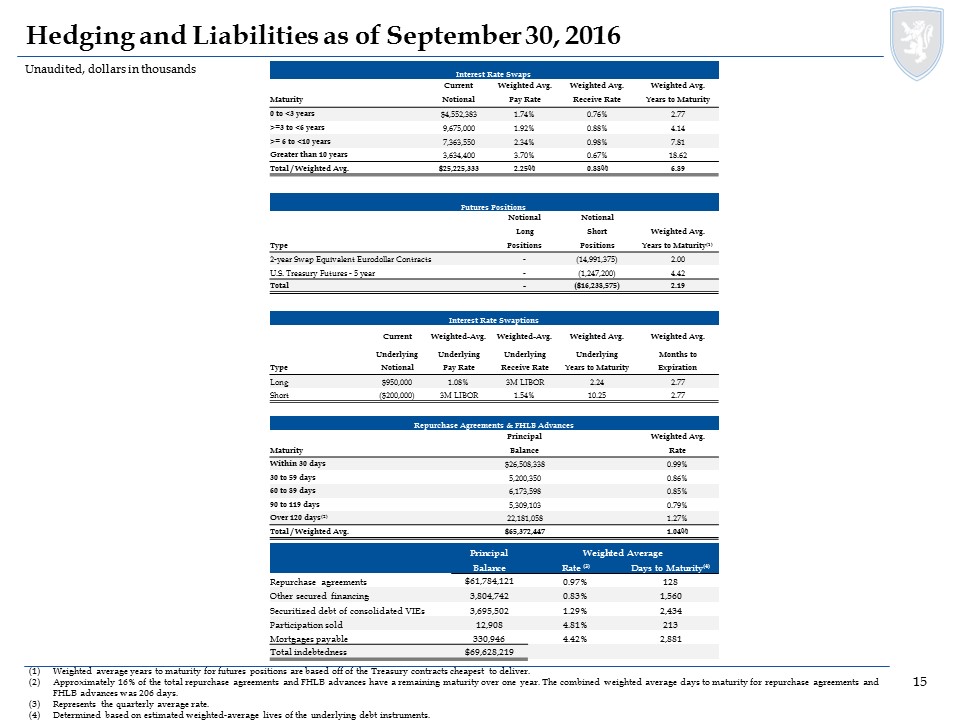
Within 30 days
|
$
|
26,508,338
|
0.99
|
%
|
||||
|
30 to 59 days
|
5,200,350
|
0.86
|
%
|
|||||
|
60 to 89 days
|
6,173,598
|
0.85
|
%
|
|||||
|
90 to 119 days
|
5,309,103
|
0.79
|
%
|
|||||
|
Over 120 days(1)
|
22,181,058
|
1.27
|
%
|
|||||
|
Total
|
$
|
65,372,447
|
1.04
|
%
|
||||
|
(1)Approximately 16% of the total repurchase agreements and FHLB advances have a remaining maturity over 1 year. The combined weighted average days to maturity for repurchase agreements and FHLB advances was 206 days.
|
|
Weighted Average
|
||||||||||||
|
Principal Balance
|
Rate (3)
|
Days to Maturity (4)
|
||||||||||
|
(dollars in thousands)
|
||||||||||||
|
Repurchase agreements
|
$
|
61,784,121
|
0.97
|
%
|
128
|
|||||||
|
Other secured financing (1)
|
3,804,742
|
0.83
|
%
|
1,560
|
||||||||
|
Securitized debt of consolidated VIEs (2)
|
3,695,502
|
1.29
|
%
|
2,434
|
||||||||
|
Participation sold (2)
|
12,908
|
4.81
|
%
|
213
|
||||||||
|
Mortgages payable (2)
|
330,946
|
4.42
|
%
|
2,881
|
||||||||
| Total indebtedness | $ |
69,628,219
|
||||||||||
|
(1)
|
Comprised of advances from the Federal Home Loan Bank of Des Moines and other credit facilities.
|
|
(2)
|
Non-recourse to the Company.
|
|
(3)
|
Represents the quarterly average rate.
|
|
(4)
|
Determined based on estimated weighted-average lives of the underlying debt instruments. |
|
Maturity
|
Current Notional (1)
|
Weighted
Average Pay
Rate
|
Weighted
Average Receive
Rate
|
Weighted
Average Years
to Maturity
|
||||||||||||
|
|
(dollars in thousands) | |||||||||||||||
|
0 - 3 years
|
$
|
4,552,383
|
1.74
|
%
|
0.76
|
%
|
2.77
|
|||||||||
|
3 - 6 years
|
9,675,000
|
1.92
|
%
|
0.88
|
%
|
4.14
|
||||||||||
|
6 - 10 years
|
7,363,550
|
2.34
|
%
|
0.98
|
%
|
7.81
|
||||||||||
|
Greater than 10 years
|
3,634,400
|
3.70
|
%
|
0.67
|
%
|
18.62
|
||||||||||
|
Total / Weighted Average
|
$
|
25,225,333
|
2.25
|
%
|
0.88
|
%
|
6.89
|
|||||||||
| (1) |
There were no forward starting swaps.
|
|
Current Underlying Notional
|
Weighted Average Underlying Pay Rate
|
Weighted Average Underlying Receive Rate
|
Weighted Average Underlying Years to Maturity
|
Weighted Average Months to Expiration
|
||||||
|
(dollars in thousands)
|
||||||||||
|
Long
|
$
|
950,000
|
1.08%
|
|
3M LIBOR
|
2.24
|
2.77
|
|||
|
Short
|
$
|
(200,000
|
)
|
3M LIBOR
|
1.54%
|
|
10.25
|
2.77
|
||
|
Notional - Long Positions
|
Notional - Short Positions
|
Weighted Average Years to Maturity
|
||||||||||
|
(dollars in thousands)
|
||||||||||||
|
2-year swap equivalent Eurodollar contracts
|
$
|
-
|
$
|
(14,991,375
|
)
|
2.00
|
||||||
|
U.S. Treasury futures - 5 year
|
-
|
(1,247,200
|
)
|
4.42
|
||||||||
|
Total
|
$
|
-
|
$
|
(16,238,575
|
)
|
2.19
|
||||||
|
For the quarters ended
|
||||||||||||
|
September 30, 2016
|
June 30, 2016
|
September 30, 2015
|
||||||||||
|
Portfolio Related Metrics:
|
||||||||||||
|
Fixed-rate Residential Investment Securities as a percentage of total
Residential Investment Securities
|
81%
|
|
92%
|
|
93%
|
|
||||||
|
Adjustable-rate and floating-rate Residential Investment Securities as a
percentage of total Residential Investment Securities
|
19%
|
|
8%
|
|
7%
|
|
||||||
|
Weighted average experienced CPR for the period
|
15.9%
|
|
12.7%
|
|
11.5%
|
|
||||||
|
Weighted average projected long-term CPR at period end
|
14.4%
|
|
13.0%
|
|
9.2%
|
|
||||||
|
Weighted average levered return on commercial real estate debt and preferred
equity at period-end (1)
|
8.26%
|
|
8.25%
|
|
7.36%
|
|
||||||
|
Weighted average levered return on investments in commercial real estate
equity at period-end
|
10.63%
|
|
10.63%
|
|
11.36%
|
|
||||||
|
Liabilities and Hedging Metrics:
|
||||||||||||
|
Weighted average days to maturity on repurchase agreements outstanding at period-end
|
128
|
129
|
147
|
|||||||||
|
Hedge ratio (2)
|
52%
|
|
49%
|
|
57%
|
|
||||||
|
Weighted average pay rate on interest rate swaps at period-end (3)
|
2.25%
|
|
2.28%
|
|
2.26%
|
|
||||||
|
Weighted average receive rate on interest rate swaps at period-end (3)
|
0.88%
|
|
0.74%
|
|
0.42%
|
|
||||||
|
Weighted average net rate on interest rate swaps at period-end (3)
|
1.37%
|
|
1.54%
|
|
1.84%
|
|
||||||
|
Leverage at period-end (4)
|
5.3:1
|
5.3:1
|
4.8:1
|
|||||||||
|
Economic leverage at period-end (5)
|
6.1:1
|
6.1:1
|
5.8:1
|
|||||||||
|
Capital ratio at period-end
|
13.3%
|
|
13.2%
|
|
14.0%
|
|
||||||
|
Performance Related Metrics:
|
||||||||||||
|
Book value per common share
|
|
$11.83
|
|
$11.50
|
|
$11.99
|
||||||
|
GAAP net income (loss) per common share
|
|
$0.70
|
|
$(0.32)
|
|
|
$(0.68)
|
|
||||
|
Core earnings per common share*
|
|
$0.29
|
|
$0.29
|
|
$0.30
|
||||||
|
Annualized return (loss) on average equity
|
23.55%
|
|
(9.60%)
|
|
(20.18%)
|
|
||||||
|
Annualized core return on average equity*
|
10.09%
|
|
9.73%
|
|
9.67%
|
|
||||||
|
Net interest margin
|
1.40%
|
|
1.15%
|
|
1.27%
|
|
||||||
|
Core net interest margin*
|
1.42%
|
|
1.54%
|
|
1.65%
|
|
||||||
|
Average yield on interest earning assets (6)
|
2.70%
|
|
2.48%
|
|
2.48%
|
|
||||||
|
Core average yield on interest earning assets *(6)
|
2.72%
|
|
2.95%
|
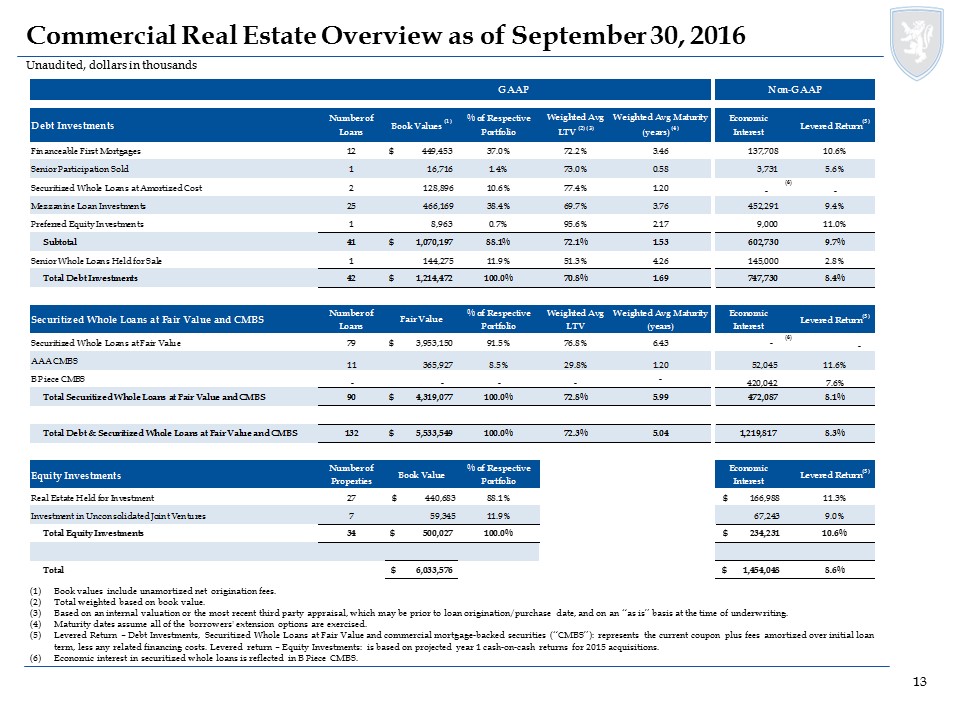
|
2.94%
|
|
||||||
|
Average cost of interest bearing liabilities (7)
|
1.57%
|
|
1.68%
|
|
1.65%
|
|
||||||
|
Net interest spread
|
1.13%
|
|
0.80%
|
|
0.83%
|
|
||||||
|
Core net interest spread*
|
1.15%
|
|
1.27%
|
|
1.29%
|
|
||||||
|
*
|
Represents a non-GAAP financial measure. Please refer to the ‘Non-GAAP Financial Measures’ section for additional information.
|
|
(1)
|
Includes loans held for sale. Excluding loans held for sale, the weighted average levered return on commercial real estate debt and preferred equity was 8.99%, 9.09% and 9.38% at September 30, 2016, June 30, 2016, and September 30, 2015, respectively.
|
|
(2)
|
Measures total notional balances of interest rate swaps, interest rate swaptions and futures relative to repurchase agreements, other secured financing and TBA notional outstanding.
|
|
(3)
|
Excludes forward starting swaps.
|
|
(4)
|
Debt consists of repurchase agreements, other secured financing, Convertible Senior Notes, securitized debt, participation sold and mortgages payable. Securitized debt, participation sold and mortgages payable are non-recourse to the Company.
|
|
(5)
|
Computed as the sum of recourse debt, TBA derivative notional outstanding and net forward purchases of investments divided by total equity.
|
|
(6)
|
Average interest earning assets reflects the average amortized cost of our investments during the period.
|
|
(7)
|
Includes interest expense on interest rate swaps used to hedge cost of funds.
|
|
ANNALY CAPITAL MANAGEMENT, INC. AND SUBSIDIARIES
|
||||||||||||||||||||
|
CONSOLIDATED STATEMENTS OF FINANCIAL CONDITION
|
||||||||||||||||||||
|
(dollars in thousands, except per share data)
|
||||||||||||||||||||
|
For the quarters ended
|
||||||||||||||||||||
|
September 30,
|
June 30,
|
March 31,
|
December 31,
|
September 30,
|
||||||||||||||||
|
2016
|
2016
|
2016
|
2015(1)
|
2015
|
||||||||||||||||
|
(Unaudited)
|
(Unaudited)
|
(Unaudited)
|
(Unaudited)
|
|||||||||||||||||
|
ASSETS
|
||||||||||||||||||||
|
Cash and cash equivalents
|
$
|
2,382,188
|
$
|
2,735,250
|
$
|
2,416,136
|
$
|
1,769,258
|
$
|
2,237,423
|
||||||||||
|
Investments, at fair value:
|
||||||||||||||||||||
|
Agency mortgage-backed securities
|
73,476,105
|
64,862,992
|
65,439,824
|
65,718,224
|
65,806,640
|
|||||||||||||||
|
Agency debentures
|
-
|
-
|
157,035
|
152,038
|
413,115
|
|||||||||||||||
|
Credit risk transfer securities
|
669,295
|
520,321
|
501,167
|
456,510
|
330,727
|
|||||||||||||||
|
Non-Agency mortgage-backed securities
|
1,460,261
|
1,197,549
|
1,157,507
|
906,722
|
490,037
|
|||||||||||||||
|
Residential mortgage loans (2)
|
310,148
|
-
|
-
|
-
|
-
|
|||||||||||||||
|
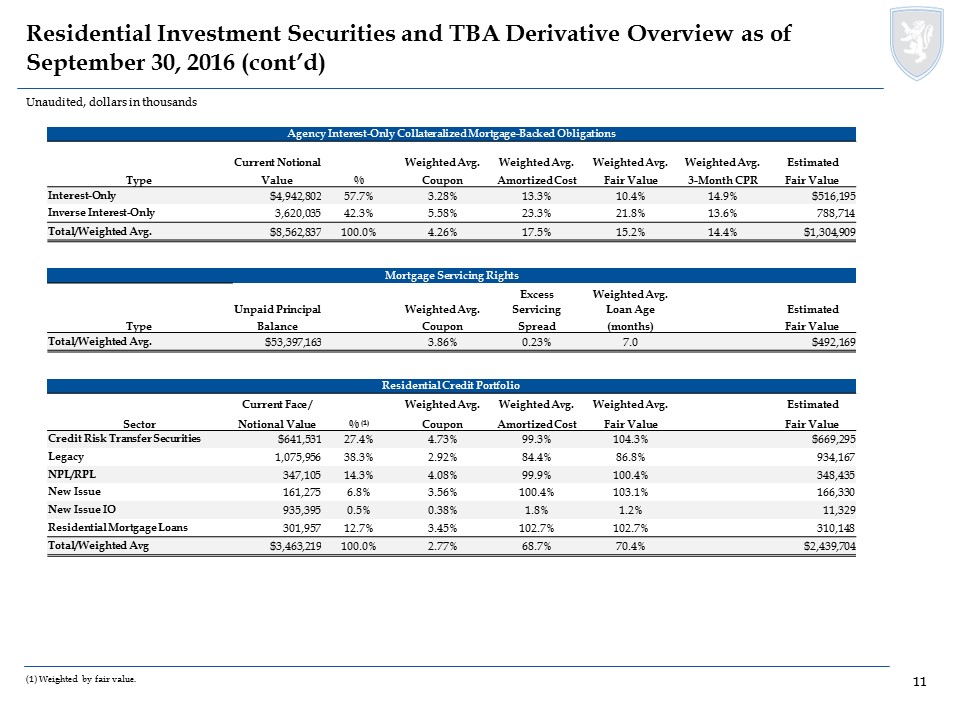
Mortgage servicing rights
|
492,169
|
-
|
-
|
-
|
-
|
|||||||||||||||
|
Commercial real estate debt investments (3)
|
4,319,077
|
4,361,972
|
4,401,725
|
2,911,828
|
2,881,659
|
|||||||||||||||
|
Commercial real estate debt and preferred equity, held for investment (4)
|
1,070,197
|
1,137,971
|
1,177,468
|
1,348,817
|
1,316,595
|
|||||||||||||||
|
Commercial loans held for sale, net
|
144,275
|
164,175
|
278,600
|
278,600
|
476,550
|
|||||||||||||||
|
Investments in commercial real estate
|
500,027
|
504,605
|
527,786
|
535,946
|
301,447
|
|||||||||||||||
|
Corporate debt
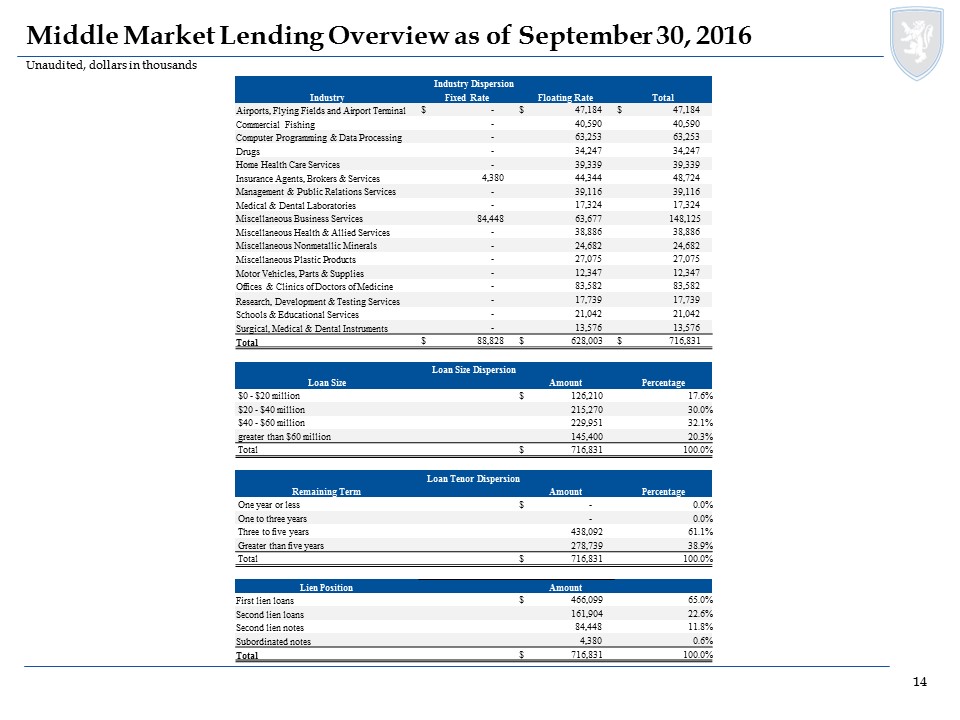
|
716,831
|
669,612
|
639,481
|
488,508
|
424,974
|
|||||||||||||||
|
Interest rate swaps, at fair value
|
113,253
|
146,285
|
93,312
|
19,642
|
39,295
|
|||||||||||||||
|
Other derivatives, at fair value
|
87,921
|
137,490
|
77,449
|
22,066
|
87,516
|
|||||||||||||||
|
Receivable for investments sold
|
493,839
|
697,943
|
2,220
|
121,625
|
127,571
|
|||||||||||||||
|
Accrued interest and dividends receivable
|
260,583
|
227,225
|
232,180
|
231,336
|
228,169
|
|||||||||||||||
|
Receivable for investment advisory income
|
-
|
-
|
-
|
-
|
3,992
|
|||||||||||||||
|
Other assets
|
301,419
|
237,959
|
234,407
|
119,422
|
67,738
|
|||||||||||||||
|
Goodwill
|
71,815
|
71,815
|
71,815
|
71,815
|
71,815
|
|||||||||||||||
|
Intangible assets, net
|
39,903
|
43,306
|
35,853
|
38,536
|
33,424
|
|||||||||||||||
|
Total assets
|
$
|
86,909,306
|
$
|
77,716,470
|
$
|
77,443,965
|
$
|
75,190,893
|
$
|
75,338,687
|
||||||||||
|
LIABILITIES AND STOCKHOLDERS’ EQUITY
|
||||||||||||||||||||
|
Liabilities:
|
||||||||||||||||||||
|
Repurchase agreements
|
$
|
61,784,121
|
$
|
53,868,385
|
$
|
54,448,141
|
$
|
56,230,860
|
$
|
56,449,364
|
||||||||||
|
Other secured financing
|
3,804,742
|
3,588,326
|
3,588,326
|
1,845,048
|
359,970
|
|||||||||||||||
|
Securitized debt of consolidated VIEs (5)
|
3,712,821
|
3,748,289
|
3,802,682
|
2,540,711
|
2,553,398
|
|||||||||||||||
|
Participation sold
|
12,976
|
13,079
|
13,182
|
13,286
|
13,389
|
|||||||||||||||
|
Mortgages payable
|
327,632
|
327,643
|
334,765
|
334,707
|
166,697
|
|||||||||||||||
|
Interest rate swaps, at fair value
|
2,919,492
|
3,208,986
|
2,782,961
|
1,677,571
|
2,160,350
|
|||||||||||||||
|
Other derivatives, at fair value
|
73,445
|
154,017
|
69,171
|
49,963
|
113,626
|
|||||||||||||||
|
Dividends payable
|
269,111
|
277,479
|
277,456
|
280,779
|
284,348
|
|||||||||||||||
|
Payable for investments purchased
|
454,237
|
746,090
|
250,612
|
107,115
|
744,378
|
|||||||||||||||
|
Accrued interest payable
|
173,320
|
159,435
|
163,983
|
151,843
|
145,554
|
|||||||||||||||
|
Accounts payable and other liabilities
|
115,606
|
62,868
|
54,679
|
53,088
|
63,280
|
|||||||||||||||
|
Total liabilities
|
73,647,503
|
66,154,597
|
65,785,958
|
63,284,971
|
63,054,354
|
|||||||||||||||
|
Stockholders’ Equity:
|
||||||||||||||||||||
|
7.875% Series A Cumulative Redeemable Preferred Stock:
7,412,500 authorized, issued and outstanding
|
177,088
|
177,088
|
177,088
|
177,088
|
177,088
|
|||||||||||||||
|
7.625% Series C Cumulative Redeemable Preferred Stock
12,650,000 authorized, 12,000,000 issued and outstanding
|
290,514
|
290,514
|
290,514
|
290,514
|
290,514
|
|||||||||||||||
|
7.50% Series D Cumulative Redeemable Preferred Stock:
18,400,000 authorized, issued and outstanding
|
445,457
|
445,457
|
445,457
|
445,457
|
445,457
|
|||||||||||||||
|
7.625% Series E Cumulative Redeemable Preferred Stock:
11,500,000 authorized, issued and outstanding
|
287,500
|
-
|
-
|
-
|
-
|
|||||||||||||||
|
Common stock, par value $0.01 per share, 1,945,437,500, 1,956,937,500, 1,956,937,500, 1,956,937,500 and 1,956,937,500 authorized, 1,018,857,866, 924,929,607, 924,853,133, 935,929,561 and 947,826,176 issued and outstanding, respectively
|
10,189
|
9,249
|
9,249
|
9,359
|
9,478
|
|||||||||||||||
|
Additional paid-in capital
|
15,578,677
|
14,575,426
|
14,573,760
|
14,675,768
|
14,789,320
|
|||||||||||||||
|
Accumulated other comprehensive income (loss)
|
1,119,677
|
1,117,046
|
640,366
|
(377,596
|
)
|
262,855
|
||||||||||||||
|
Accumulated deficit
|
(4,655,440
|
)
|
(5,061,565
|
)
|
(4,487,982
|
)
|
(3,324,616
|
)
|
(3,695,884
|
)
|
||||||||||
|
Total stockholders’ equity
|
13,253,662
|
11,553,215
|
11,648,452
|
11,895,974
|
12,278,828
|
|||||||||||||||
|
Noncontrolling interest
|
8,141
|
8,658
|
9,555
|
9,948
|
5,505
|
|||||||||||||||
|
Total equity
|
13,261,803
|
11,561,873
|
11,658,007
|
11,905,922
|
12,284,333
|
|||||||||||||||
|
Total liabilities and equity
|
$
|
86,909,306
|
$
|
77,716,470
|
$
|
77,443,965
|
$
|
75,190,893
|
$
|
75,338,687
|
||||||||||
|
(1)
|
Derived from the audited consolidated financial statements at December 31, 2015.
|
|
(2)
|
Includes securitized mortgage loans of a consolidated VIE carried at fair value of $176.7 million at September 30, 2016.
|
|
(3)
|
Includes senior securitized commercial mortgage loans of consolidated VIEs with a carrying value of $4.0 billion, $4.0 billion, $4.0 billion, $2.6 billion and $2.6 billion at September 30, 2016, June 30, 2016, March 31, 2016, December 31, 2015 and September 30, 2015, respectively.
|
|
(4)
|
Includes senior securitized commercial mortgage loans of consolidated VIE with a carrying value of $128.9 million, $187.2 million, $211.9 million, $262.7 million and $314.9 million at September 30, 2016, June 30, 2016, March 31, 2016, December 31, 2015 and September 30, 2015, respectively.
|
|
(5)
|
Includes securitized debt of consolidated VIEs carried at fair value of $3.7 billion, $3.7 billion, $3.7 billion, $2.4 billion and $2.4 billion at September 30, 2016, June 30, 2016, March 31, 2016, December 31, 2015 and September 30, 2015, respectively.
|
|
ANNALY CAPITAL MANAGEMENT, INC. AND SUBSIDIARIES
|
||||||||||||||||||||
|
CONSOLIDATED STATEMENTS OF COMPREHENSIVE INCOME (LOSS)
|
||||||||||||||||||||
|
(UNAUDITED)
|
||||||||||||||||||||
|
(dollars in thousands, except per share data)
|
||||||||||||||||||||
|
For the quarters ended
|
||||||||||||||||||||
|
September 30,
|
June 30,
|
March 31,
|
December 31,
|
September 30,
|
||||||||||||||||
|
2016
|
2016
|
2016
|
2015
|
2015
|
||||||||||||||||
|
Interest income
|
$
|
558,668
|
$
|
457,118
|
$
|
388,143
|
$
|
576,580
|
$
|
450,726
|
||||||||||
|
Interest expense
|
174,154
|
152,755
|
147,447
|
118,807
|
110,297
|
|||||||||||||||
|
Net interest income
|
384,514
|
304,363
|
240,696
|
457,773
|
340,429
|
|||||||||||||||
|
Realized and unrealized gains (losses):
|
||||||||||||||||||||
|
Realized gains (losses) on interest rate swaps(1)
|
(124,572
|
)
|
(130,762
|
)
|
(147,475
|
)
|
(159,487
|
)
|
(162,304
|
)
|
||||||||||
|
Realized gains (losses) on termination of interest rate swaps
|
1,337
|
(60,064
|
)
|
-
|
-
|
-
|
||||||||||||||
|
Unrealized gains (losses) on interest rate swaps
|
256,462
|
(373,220
|
)
|
(1,031,720
|
)
|
463,126
|
(822,585
|
)
|
||||||||||||
|
Subtotal
|
133,227
|
(564,046
|
)
|
(1,179,195
|
)
|
303,639
|
(984,889
|
)
|
||||||||||||
|
Net gains (losses) on disposal of investments
|
14,447
|
12,535
|
(1,675
|
)
|
(7,259
|
)
|
(7,943
|
)
|
||||||||||||
|
Net gains (losses) on trading assets
|
162,981
|
81,880
|
125,189
|
42,584
|
108,175
|
|||||||||||||||
|
Net unrealized gains (losses) on investments measured at fair value through earnings
|
29,675
|
(54,154
|
)
|
128
|
(62,703
|
)
|
(24,501
|
)
|
||||||||||||
|
Bargain purchase gain
|
72,576
|
-
|
-
|
-
|
-
|
|||||||||||||||
|
Subtotal
|
279,679
|
40,261
|
123,642
|
(27,378
|
)
|
75,731
|
||||||||||||||
|
Total realized and unrealized gains (losses)
|
412,906
|
(523,785
|
)
|
(1,055,553
|
)
|
276,261
|
(909,158
|
)
|
||||||||||||
|
Other income (loss):
|
||||||||||||||||||||
|
Investment advisory income
|
-
|
-
|
-
|
-
|
3,780
|
|||||||||||||||
|
Other income (loss)
|
29,271
|
(9,930
|
)
|
(6,115
|
)
|
(10,447
|
)
|
(13,455
|
)
|
|||||||||||
|
Total other income (loss)
|
29,271
|
(9,930
|
)
|
(6,115
|
)
|
(10,447
|
)
|
(9,675
|
)
|
|||||||||||
|
General and administrative expenses:
|
||||||||||||||||||||
|
Compensation and management fee
|
38,709
|
36,048
|
36,997
|
37,193
|
37,450
|
|||||||||||||||
|
Other general and administrative expenses
|
59,028
|
13,173
|
10,948
|
10,643
|
12,007
|
|||||||||||||||
|
Total general and administrative expenses
|
97,737
|
49,221
|
47,945
|
47,836
|
49,457
|
|||||||||||||||
|
Income (loss) before income taxes
|
728,954
|
(278,573
|
)
|
(868,917
|
)
|
675,751
|
(627,861
|
)
|
||||||||||||
|
Income taxes
|
(1,926
|
)
|
(76
|
)
|
(837
|
)
|
6,085
|
(370
|
)
|
|||||||||||
|
Net income (loss)
|
730,880
|
(278,497
|
)
|
(868,080
|
)
|
669,666
|
(627,491
|
)
|
||||||||||||
|
Net income (loss) attributable to noncontrolling interest
|
(336
|
)
|
(385
|
)
|
(162
|
)
|
(373
|
)
|
(197
|
)
|
||||||||||
|
Net income (loss) attributable to Annaly
|
731,216
|
(278,112
|
)
|
(867,918
|
)
|
670,039
|
(627,294
|
)
|
||||||||||||
|
Dividends on preferred stock
|
22,803
|
17,992
|
17,992
|
17,992
|
17,992
|
|||||||||||||||
|
Net income (loss) available (related) to common stockholders
|
$
|
708,413
|
$
|
(296,104
|
)
|
$
|
(885,910
|
)
|
$
|
652,047
|
$
|
(645,286
|
)
|
|||||||
|
Net income (loss) per share available (related) to common stockholders:
|
||||||||||||||||||||
|
Basic
|
$
|
0.70
|
$
|
(0.32
|
)
|
$
|
(0.96
|
)
|
$
|
0.69
|
$
|
(0.68
|
)
|
|||||||
|
Diluted
|
$
|
0.70
|
$
|
(0.32
|
)
|
$
|
(0.96
|
)
|
$
|
0.69
|
$
|
(0.68
|
)
|
|||||||
|
Weighted average number of common shares outstanding:
|
||||||||||||||||||||
|
Basic
|
1,007,607,893
|
924,887,316
|
926,813,588
|
945,072,058
|
947,795,500
|
|||||||||||||||
|
Diluted
|
1,007,963,406
|
924,887,316
|
926,813,588
|
945,326,098
|
947,795,500
|
|||||||||||||||
|
Net income (loss)
|
$
|
730,880
|
$
|
(278,497
|
)
|
$
|
(868,080
|
)
|
$
|
669,666
|
$
|
(627,491
|
)
|
|||||||
|
Other comprehensive income (loss):
|
||||||||||||||||||||
|
Unrealized gains (losses) on available-for-sale securities
|
18,237
|
483,930
|
1,017,707
|
(648,106
|
)
|
609,725
|
||||||||||||||
|
Reclassification adjustment for net (gains) losses included in net income (loss)
|
(15,606
|
)
|
(7,250
|
)
|
255
|
7,655
|
8,095
|
|||||||||||||
|
Other comprehensive income (loss)
|
2,631
|
476,680
|
1,017,962
|
(640,451
|
)
|
617,820
|
||||||||||||||
|
Comprehensive income (loss)
|
733,511
|
198,183
|
149,882
|
29,215
|
(9,671
|
)
|
||||||||||||||
|
Comprehensive income (loss) attributable to noncontrolling interest
|
(336
|
)
|
(385
|
)
|
(162
|
)
|
(373
|
)
|
(197
|
)
|
||||||||||
|
Comprehensive income (loss) attributable to Annaly
|
$
|
733,847
|
$
|
198,568
|
$
|
150,044
|
$
|
29,588
|
$
|
(9,474
|
)
|
|||||||||
|
(1)
|
Interest expense related to the Company’s interest rate swaps is recorded in Realized gains (losses) on interest rate swaps on the Consolidated Statements of Comprehensive Income.
|
|
ANNALY CAPITAL MANAGEMENT, INC. AND SUBSIDIARIES
|
||||||||
|
CONSOLIDATED STATEMENTS OF COMPREHENSIVE INCOME (LOSS)
|
||||||||
|
(UNAUDITED)
|
||||||||
|
(dollars in thousands, except per share data)
|
||||||||
|
For the nine months ended
|
||||||||
|
September 30,
|
September 30,
|
|||||||
|
2016
|
2015
|
|||||||
|
Net interest income:
|
||||||||
|
Interest income
|
$
|
1,403,929
|
$
|
1,594,117
|
||||
|
Interest expense
|
474,356
|
352,789
|
||||||
|
Net interest income
|
929,573
|
1,241,328
|
||||||
|
Realized and unrealized gains (losses):
|
||||||||
|
Realized gains (losses) on interest rate swaps(1)
|
(402,809
|
)
|
(465,008
|
)
|
||||
|
Realized gains (losses) on termination of interest rate swaps
|
(58,727
|
)
|
(226,462
|
)
|
||||
|
Unrealized gains (losses) on interest rate swaps
|
(1,148,478
|
)
|
(587,995
|
)
|
||||
|
Subtotal
|
(1,610,014
|
)
|
(1,279,465
|
)
|
||||
|
Net gains (losses) on disposal of investments
|
25,307
|
58,246
|
||||||
|
Net gains (losses) on trading assets
|
370,050
|
(12,961
|
)
|
|||||
|
Net unrealized gains (losses) on investments measured at fair value through earnings
|
(24,351
|
)
|
(40,466
|
)
|
||||
|
Bargain purchase gain
|
72,576
|
-
|
||||||
|
Impairment of goodwill
|
-
|
(22,966
|
)
|
|||||
|
Subtotal
|
443,582
|
(18,147
|
)
|
|||||
|
Total realized and unrealized gains (losses)
|
(1,166,432
|
)
|
(1,297,612
|
)
|
||||
|
Other income (loss):
|
||||||||
|
Investment advisory income
|
-
|
24,848
|
||||||
|
Dividend income from affiliate
|
-
|
8,636
|
||||||
|
Other income (loss)
|
13,226
|
(36,754
|
)
|
|||||
|
Total other income (loss)
|
13,226
|
(3,270
|
)
|
|||||
|
General and administrative expenses:
|
||||||||
|
Compensation and management fee
|
111,754
|
113,093
|
||||||
|
Other general and administrative expenses
|
83,149
|
39,311
|
||||||
|
Total general and administrative expenses
|
194,903
|
152,404
|
||||||
|
Income (loss) before income taxes
|
(418,536
|
)
|
(211,958
|
)
|
||||
|
Income taxes
|
(2,839
|
)
|
(8,039
|
)
|
||||
|
Net income (loss)
|
(415,697
|
)
|
(203,919
|
)
|
||||
|
Net income (loss) attributable to noncontrolling interest
|
(883
|
)
|
(436
|
)
|
||||
|
Net income (loss) attributable to Annaly
|
(414,814
|
)
|
(203,483
|
)
|
||||
|
Dividends on preferred stock
|
58,787
|
53,976
|
||||||
|
Net income (loss) available (related) to common stockholders
|
$
|
(473,601
|
)
|
$
|
(257,459
|
)
|
||
|
Net income (loss) per share available (related) to common stockholders:
|
||||||||
|
Basic
|
$
|
(0.50
|
)
|
$
|
(0.27
|
)
|
||
|
Diluted
|
$
|
(0.50
|
)
|
$
|
(0.27
|
)
|
||
|
Weighted average number of common shares outstanding:
|
||||||||
|
Basic
|
953,301,855
|
947,732,735
|
||||||
|
Diluted
|
953,301,855
|
947,732,735
|
||||||
|
Net income (loss)
|
$
|
(415,697
|
)
|
$
|
(203,919
|
)
|
||
|
Other comprehensive income (loss):
|
||||||||
|
Unrealized gains (losses) on available-for-sale securities
|
1,519,874
|
116,154
|
||||||
|
Reclassification adjustment for net (gains) losses included in net income (loss)
|
(22,601
|
)
|
(58,182
|
)
|
||||
|
Other comprehensive income (loss)
|
1,497,273
|
57,972
|
||||||
|
Comprehensive income (loss)
|
1,081,576
|
(145,947
|
)
|
|||||
|
Comprehensive income (loss) attributable to noncontrolling interest
|
(883
|
)
|
(436
|
)
|
||||
|
Comprehensive income (loss) attributable to Annaly
|
$
|
1,082,459
|
$
|
(145,511
|
)
|
|||
|
(1)
|
Interest expense related to the Company’s interest rate swaps is recorded in Realized gains (losses) on interest rate swaps on the Consolidated Statements of Comprehensive Income.
|
|
●
|
Core earnings
|
● | Economic core net interest income; | ||
|
●
|
Core earnings per common share;
|
● | Core average yield on interest earning assets; | ||
|
●
|
Annualized core return on average equity;
|
● | Core net interest margin; and | ||
|
●
|
Core interest income;
|
● | Core net interest spread | ||
| ● | Economic interest expense; |
|
For the quarters ended
|
||||||||||||
|
September 30, 2016
|
June 30, 2016
|
September 30, 2015
|
||||||||||
|
(dollars in thousands)
|
||||||||||||
|
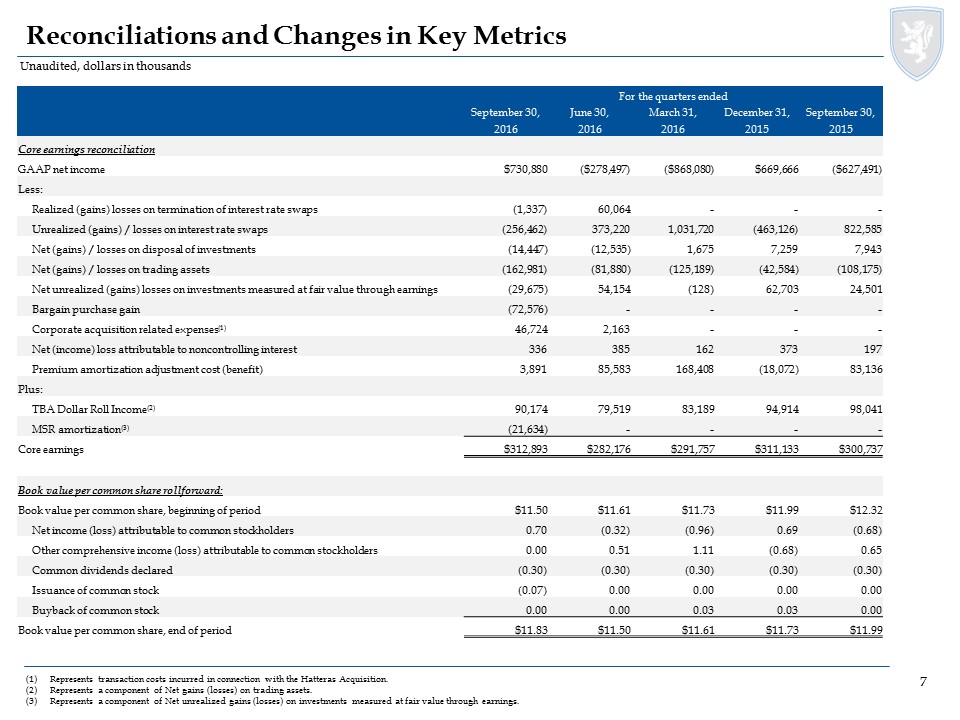
GAAP net income (loss)
|
$
|
730,880
|
$
|
(278,497
|
)
|
$
|
(627,491
|
)
|
||||
|
Less:
|
||||||||||||
|
Realized (gains) losses on termination of interest rate swaps
|
(1,337
|
)
|
60,064
|
-
|
||||||||
|
Unrealized (gains) losses on interest rate swaps
|
(256,462
|
)
|
373,220
|
822,585
|
||||||||
|
Net (gains) losses on disposal of investments
|
(14,447
|
)
|
(12,535
|
)
|
7,943
|
|||||||
|
Net (gains) losses on trading assets
|
(162,981
|
)
|
(81,880
|
)
|
(108,175
|
)
|
||||||
|
Net unrealized (gains) losses on investments measured at fair value through earnings
|
(29,675
|
)
|
54,154
|
24,501
|
||||||||
|
Bargain purchase gain
|
(72,576
|
)
|
-
|
-
|
||||||||
|
Corporate acquisition related expenses (1)
|
46,724
|
2,163
|
-
|
|||||||||
|
Net (income) loss attributable to noncontrolling interest
|
336
|
385
|
197
|
|||||||||
|
Premium amortization adjustment cost (benefit)
|
3,891
|
85,583
|
83,136
|
|||||||||
|
Plus:
|
||||||||||||
|
TBA dollar roll income (2)
|
90,174
|
79,519
|
98,041
|
|||||||||
|
MSR amortization (3)
|
(21,634
|
)
|
-
|
-
|
||||||||
|
Core earnings*
|
$
|
312,893
|
$
|
282,176
|
$
|
300,737
|
||||||
|
GAAP net income (loss) per average common share
|
$
|
0.70
|
$
|
(0.32
|
)
|
$
|
(0.68
|
)
|
||||
|
Core earnings per average common share*
|
$
|
0.29
|
$
|
0.29
|
$
|
0.30
|
||||||
|
*
|
Represents a non-GAAP financial measure.
|
|
(1)
|
Represents non-recurring transaction costs incurred in connection with the Company’s acquisition of Hatteras.
|
|
(2)
|
Represents a component of Net gains (losses) on trading assets.
|
|
(3)
|
Represents the portion of changes in fair value that is attributable to the realization of estimated cash flows on the Company’s MSR portfolio and is reported as a component of Net unrealized gains (losses) on investments measured at fair value.
|
|
For the quarters ended
|
||||||||||||
|
September 30, 2016
|
June 30, 2016
|
September 30, 2015
|
||||||||||
|
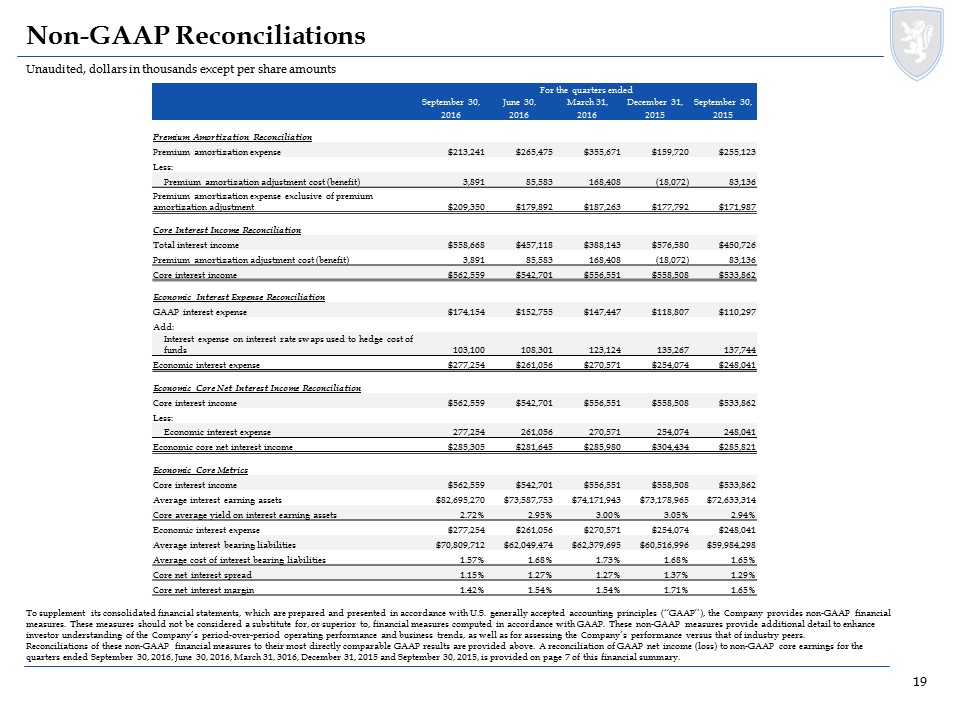
Core Interest Income Reconciliation
|
(dollars in thousands)
|
|||||||||||
|
GAAP interest income
|
$
|
558,668
|
$
|
457,118
|
$
|
450,726
|
||||||
|
Premium amortization adjustment
|
3,891
|
85,583
|
83,136
|
|||||||||
|
Core interest income*
|
$
|
562,559
|
$
|
542,701
|
$
|
533,862
|
||||||
|
Economic Interest Expense Reconciliation
|
||||||||||||
|
GAAP interest expense
|
$
|
174,154
|
$
|
152,755
|
$
|
110,297
|
||||||
|
Add:
|
||||||||||||
|
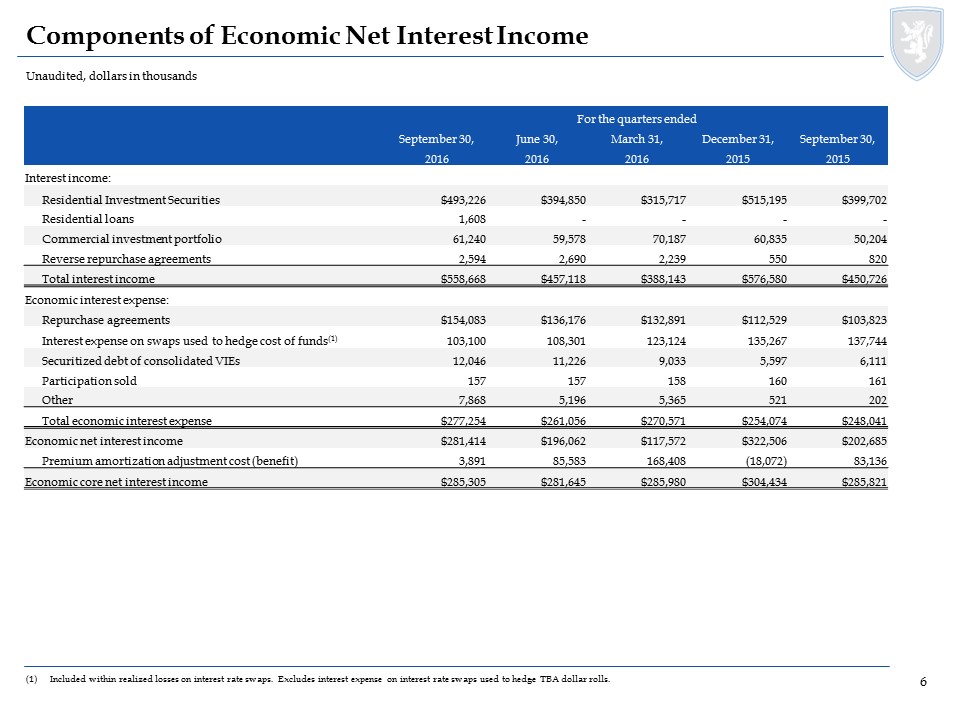
Interest expense on interest rate swaps used to hedge cost of funds
|
103,100
|
108,301
|
137,744
|
|||||||||
|
Economic interest expense*
|
$
|
277,254
|
$
|
261,056
|
$
|
248,041
|
||||||
|
Economic Core Net Interest Income Reconciliation
|
||||||||||||
|
Core interest income*
|
$
|
562,559
|
$
|
542,701
|
$
|
533,862
|
||||||
|
Less:
|
||||||||||||
|
Economic interest expense*
|
277,254
|
261,056
|
248,041
|
|||||||||
|
Economic core net interest income*
|
$
|
285,305
|
$
|
281,645
|
$
|
285,821
|
||||||
|
*
|
Represents a non-GAAP financial measure.
|
|
For the quarters ended
|
||||||||||||
|
September 30, 2016
|
June 30, 2016
|
September 30, 2015
|
||||||||||
|
Economic Core Metrics
|
(dollars in thousands)
|
|||||||||||
|
Core interest income*
|
$
|
562,559
|
$
|
542,701
|
$
|
533,862
|
||||||
|
Average interest earning assets
|
$
|
82,695,270
|
$
|
73,587,753
|
$
|
72,633,314
|
||||||
|
Core average yield on interest earning assets*
|
2.72
|
%
|
2.95
|
%
|
2.94
|
%
|
||||||
|
Economic interest expense*
|
$
|
277,254
|
$
|
261,056
|
$
|
248,041
|
||||||
|
Average interest bearing liabilities
|
$
|
70,809,712
|
$
|
62,049,474
|
$
|
59,984,298
|
||||||
|
Average cost of interest bearing liabilities
|
1.57
|
%
|
1.68
|
%
|
1.65
|
%
|
||||||
|
Core net interest spread*
|
1.15
|
%
|
1.27
|
%
|
1.29
|
%
|
||||||
|
Core net interest margin*
|
1.42
|
%
|
1.54
|
%
|
1.65
|
%
|
||||||
|
*
|
Represents a non-GAAP financial measure.
|

