Exhibit 99.1
|
|
FOR IMMEDIATE RELEASE
ANNALY CAPITAL MANAGEMENT, INC. REPORTS 4th QUARTER 2014 RESULTS
|
●
|
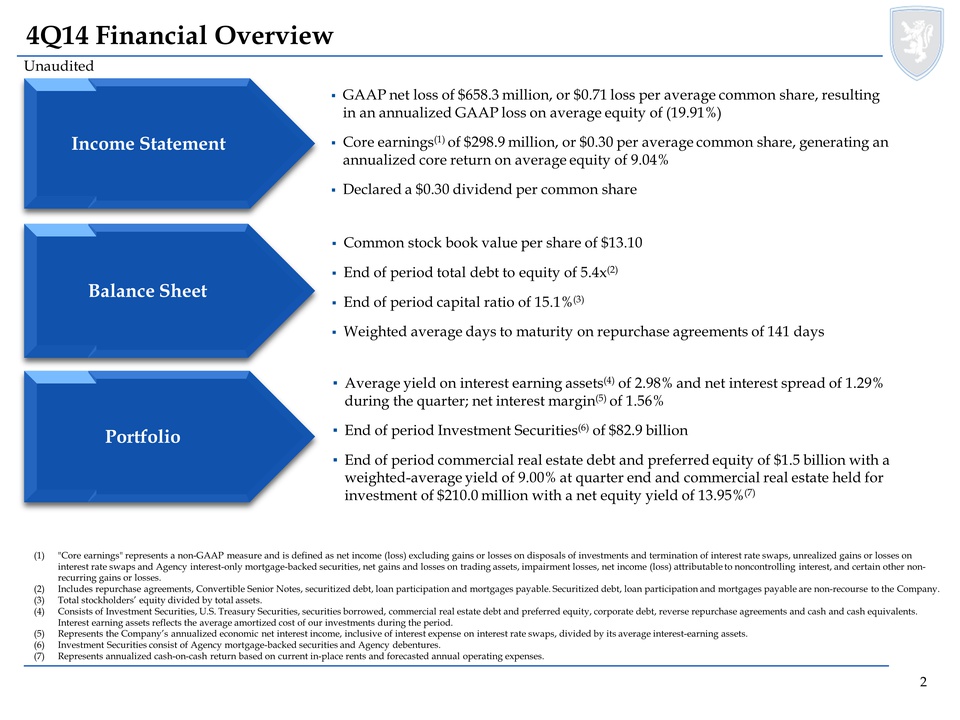
GAAP net loss of $658.3 million, $0.71 loss per common share
|
|
●
|
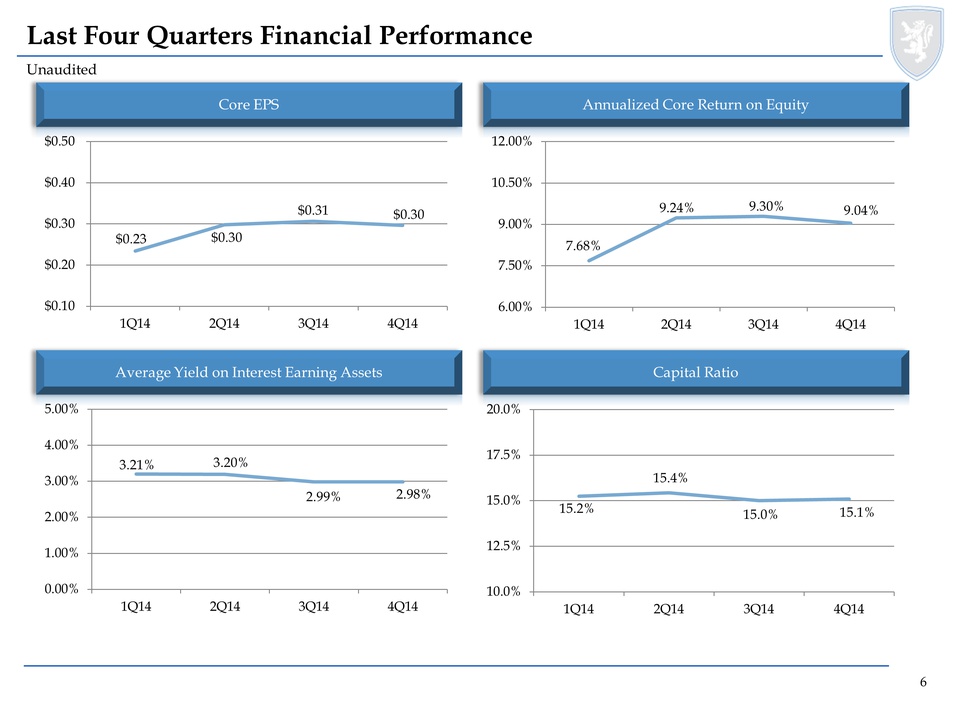
Core earnings of $298.9 million, $0.30 earnings per common share
|
|
●
|
Common stock book value of $13.10, up from $12.87 at prior quarter end
|
|
●
|
Capital ratio of 15.1% and leverage of 5.4:1
|
|
●
|
Net interest margin of 1.56%
|
New York, New York–February 24, 2015–Annaly Capital Management, Inc. (NYSE: NLY) today announced its financial results for the quarter and year ended December 31, 2014.
Financial Performance
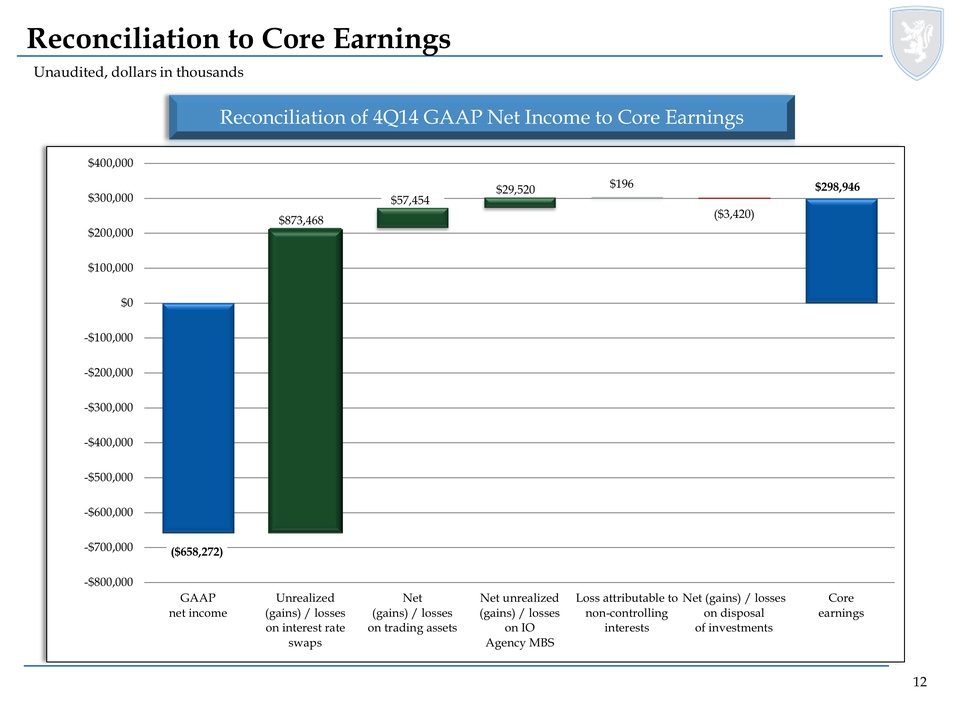
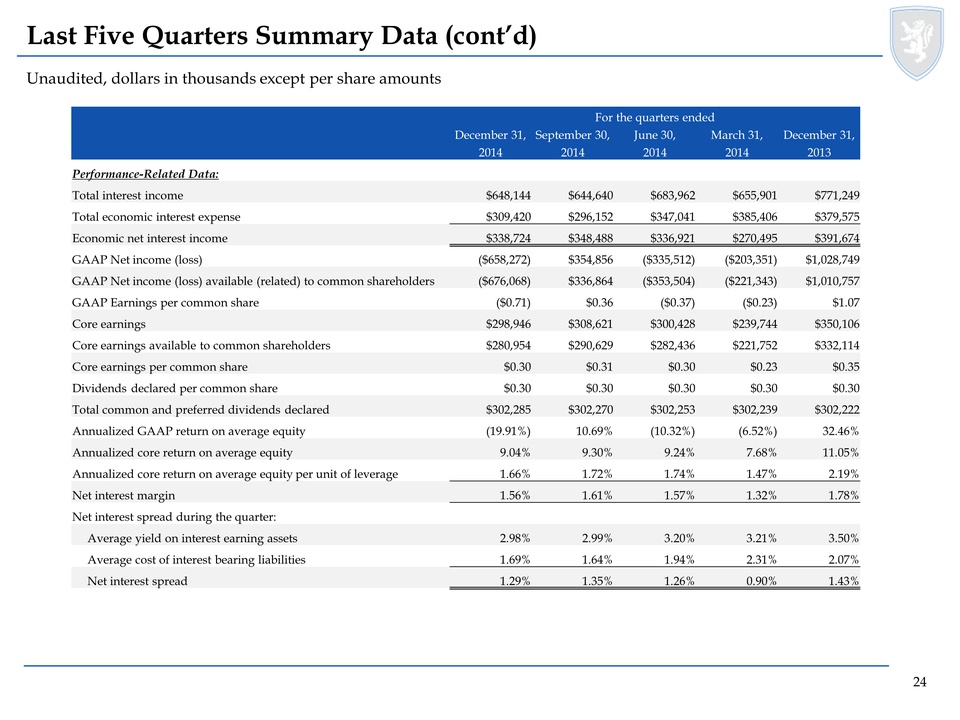
GAAP net loss for the quarter ended December 31, 2014 was $658.3 million, or $0.71 loss per average common share, compared to GAAP net income of $354.9 million, or $0.36 per average common share, for the quarter ended September 30, 2014, and GAAP net income of $1.0 billion, or $1.07 per average common share, for the quarter ended December 31, 2013. The decrease in net income for the quarter ended December 31, 2014 compared to the quarters ended September 30, 2014 and December 31, 2013 was primarily attributable to mark-to-market losses on our interest rate swaps. Core earnings for the quarter ended December 31, 2014 was $298.9 million, or $0.30 per average common share, compared to $308.6 million, or $0.31 per average common share, for the quarter ended September 30, 2014, and $350.1 million, or $0.35 per average common share, for the quarter ended December 31, 2013. "Core earnings" represents a non-GAAP measure and is defined as net income (loss) excluding gains or losses on disposals of investments and termination of interest rate swaps, unrealized gains or losses on interest rate swaps and Agency interest-only mortgage-backed securities, net gains and losses on trading assets, impairment losses, net income (loss) attributable to noncontrolling interest, and certain other non-recurring gains or losses.
GAAP net loss for the year ended December 31, 2014 was $842.3 million, or $0.96 loss per average common share and GAAP net income for the year ended December 31, 2013 was $3.7 billion, or $3.86 per average common share. Core earnings for the years ended December 31, 2014 and 2013, respectively, were $1.1 billion or $1.14 per average common share and $1.2 billion, or $1.21 per average common share.
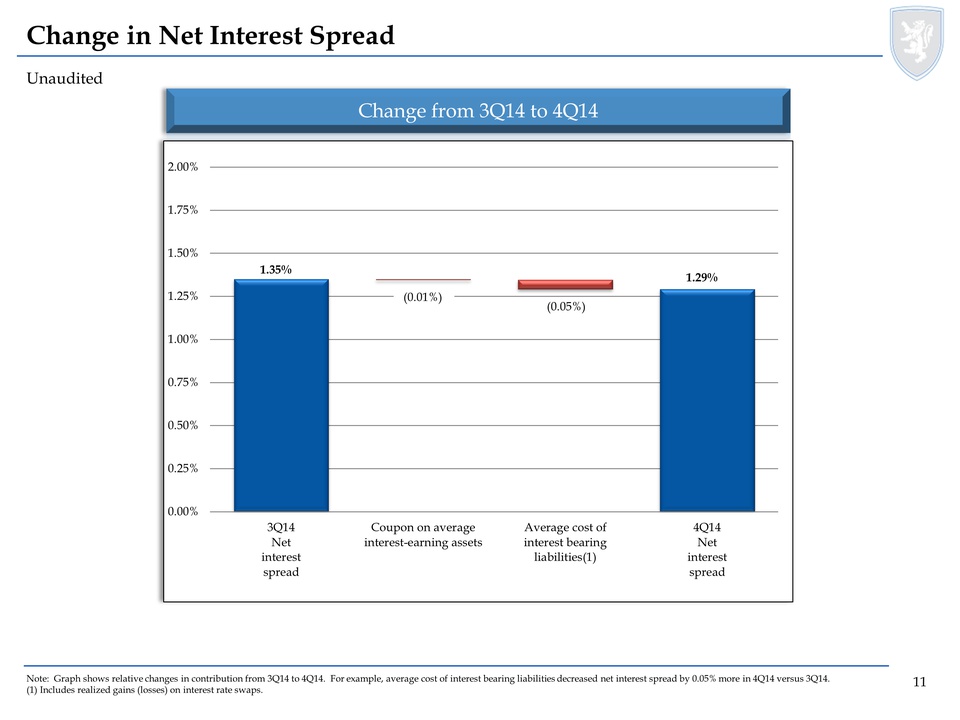
Net interest margin for the quarters ended December 31, 2014, September 30, 2014 and December 31, 2013 was 1.56%, 1.61% and 1.78%, respectively. Net interest margin represents the Company’s annualized economic net interest income, inclusive of interest expense on interest rate swaps, divided by its average interest-earning assets. For the quarter ended December 31, 2014, the average yield on interest earning assets was 2.98% and the average cost of interest bearing liabilities, including interest expense on interest rate swaps, was 1.69%, which resulted in a net interest spread of 1.29%. Our average yield on interest earning assets was relatively unchanged for the quarter ended December 31, 2014 when compared to the quarter ended September 30, 2014. Our average yield on interest earning assets decreased for the quarter ended December 31, 2014 when compared to the quarter ended December 31, 2013 due to higher amortization expense in the current quarter resulting from faster prepayment speeds. Our average cost of interest bearing liabilities increased for the quarter ended December 31, 2014 when compared to the quarter ended September 30, 2014 due to higher interest expense on interest rate swaps. Our average cost of interest bearing liabilities decreased for the quarter ended December 31, 2014 when compared to the quarter ended December 31, 2013 due to lower interest rate swap and swaption notional balances as a percentage of repurchase agreements.
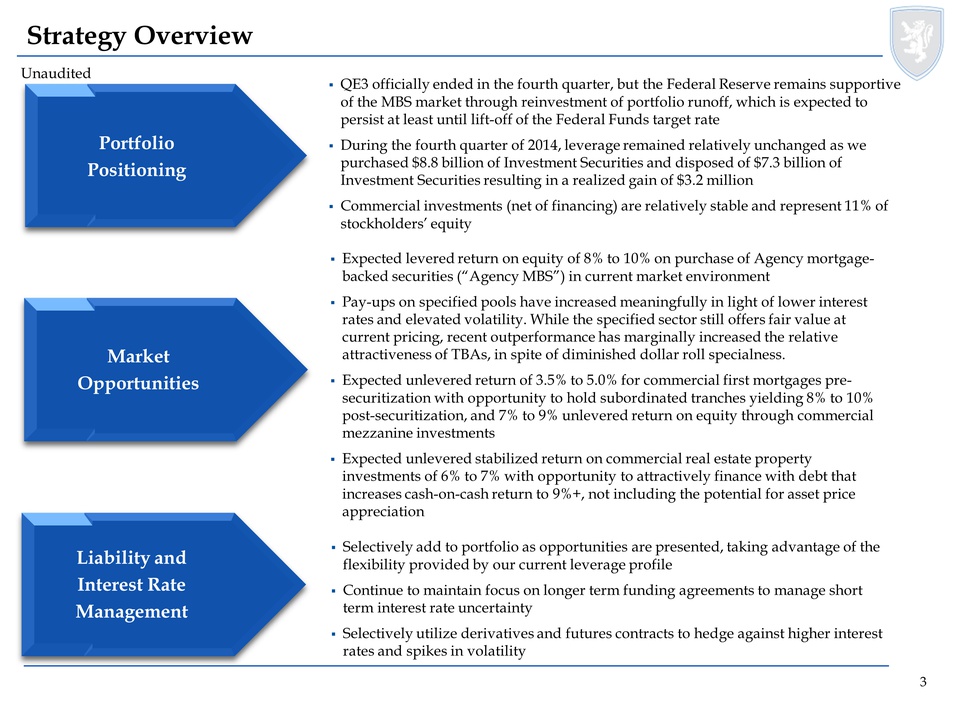
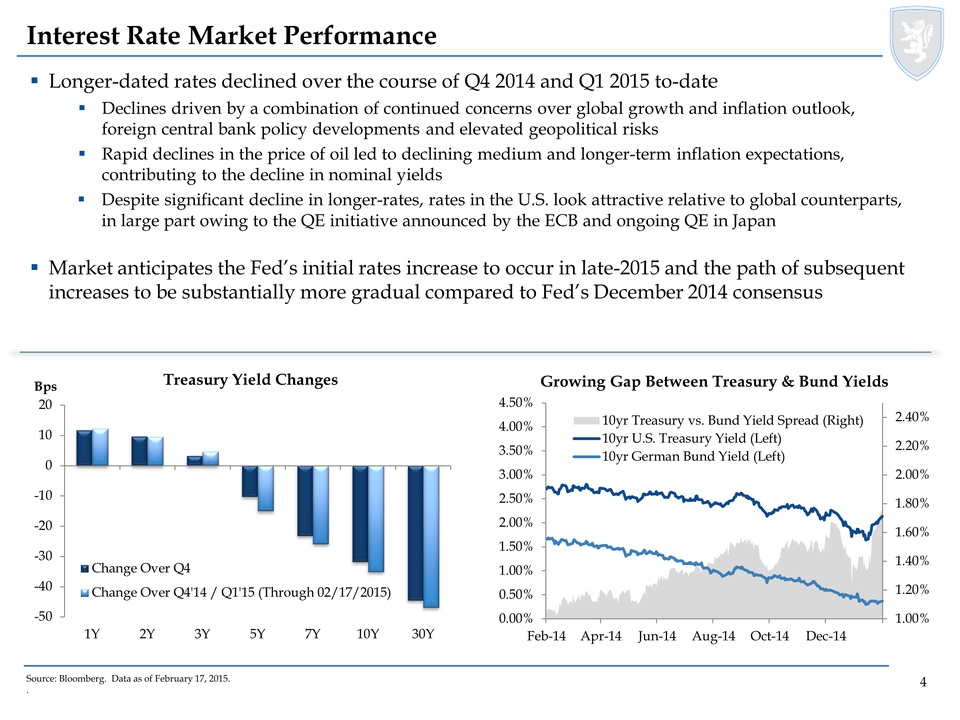
Wellington J. Denahan, Chairman and Chief Executive Officer of Annaly, commented on the Company’s results. “We fully expect the Federal Reserve to adjust policy accommodation sometime this year and the markets to endure higher levels of volatility. We look forward to the opportunities that will accompany that adjustment and remain comfortable in our continued ability to deliver attractive relative returns.”
Kevin Keyes, President of Annaly, added “In addition to our size, liquidity and industry-low leverage, our diversified Agency and Commercial strategies help to insulate the Company from heightened volatility while providing complimentary and more durable earnings over time.”
Asset Portfolio
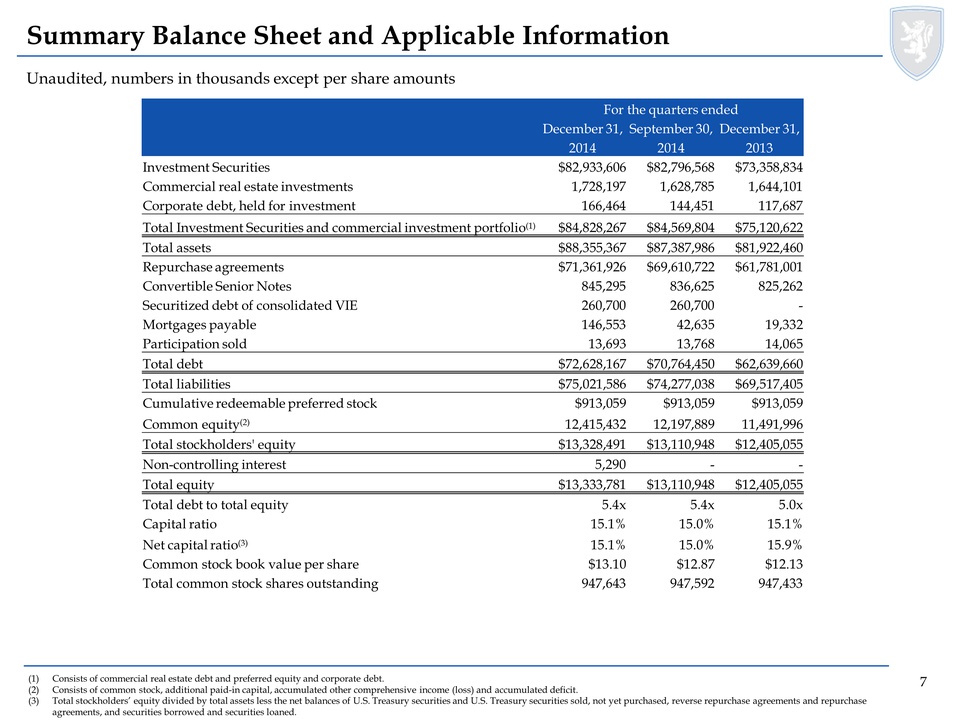
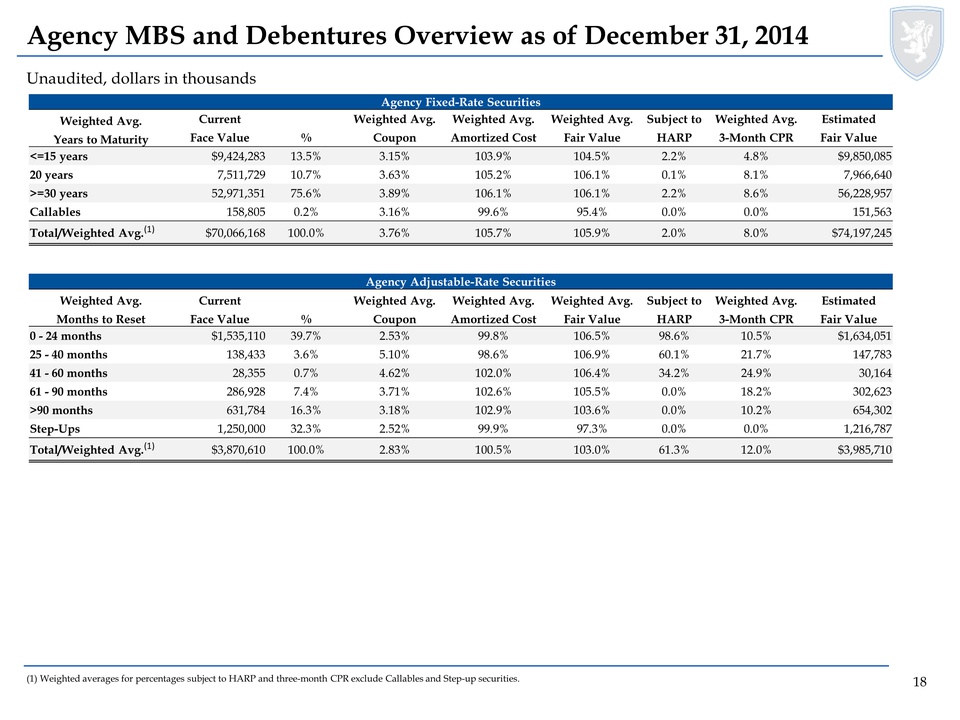
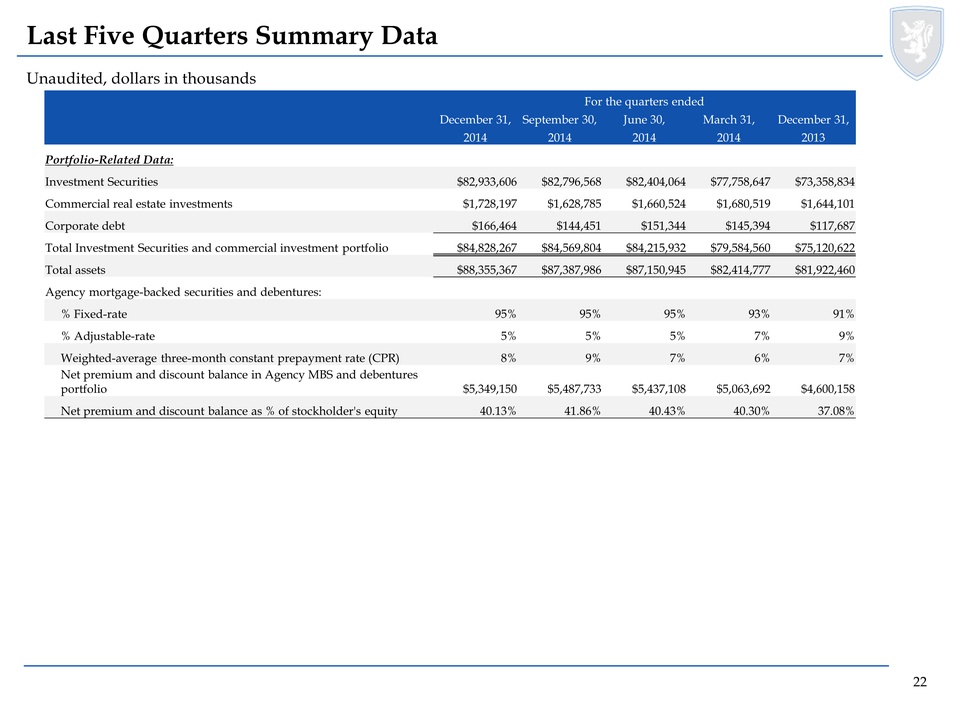
Investment Securities, which are comprised of Agency mortgage-backed securities and Agency debentures, were $82.9 billion at December 31, 2014, compared to $82.8 billion at September 30, 2014 and $73.4 billion at December 31, 2013. As of December 31, 2014, substantially all of the Company’s Investment Securities were Fannie Mae, Freddie Mac and Ginnie Mae mortgage-backed securities and debentures. Fixed-rate Agency mortgage-backed securities and debentures comprised 95% of the Company’s Investment Securities portfolio at December 31, 2014 and adjustable-rate Agency mortgage-backed securities and debentures comprised the remainder of the Company’s Investment Securities portfolio.
1
During the quarter ended December 31, 2014, the Company disposed of $7.3 billion of Investment Securities, resulting in a realized gain of $3.2 million. During the quarter ended September 30, 2014, the Company disposed of $4.2 billion of Investment Securities, resulting in a realized gain of $4.7 million. During the quarter ended December 31, 2013, the Company disposed of $11.9 billion of Investment Securities, resulting in a realized gain of $49.6 million.
During the year ended December 31, 2014, the Company disposed of $22.5 billion of Investment Securities, resulting in a realized gain of $94.5 million. During the year ended December 31, 2013, the Company disposed of $56.8 billion of Investment Securities, resulting in a realized gain of $424.1 million.
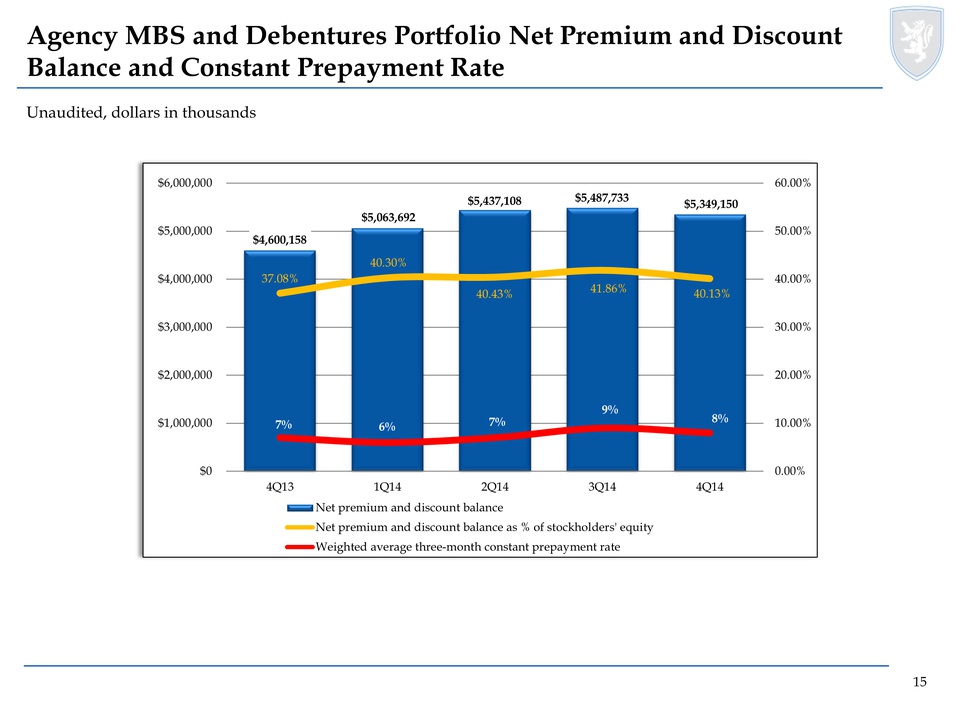
The weighted average experienced constant prepayment rate for the quarters ended December 31, 2014, September 30, 2014, and December 31, 2013, was 8%, 9% and 7%, respectively. The net amortization of premiums and accretion of discounts on Investment Securities for the quarters ended December 31, 2014, September 30, 2014, and December 31, 2013, was $198.0 million, $197.7 million, and $30.7 million, respectively. The total net premium balance on Investment Securities at December 31, 2014, September 30, 2014, and December 31, 2013, was $5.3 billion, $5.5 billion, and $4.6 billion, respectively. The weighted average amortized cost basis of the Company’s non-interest-only Investment Securities at December 31, 2014, September 30, 2014, and December 31, 2013, was 105.3%, 105.4%, and 105.0%, respectively. The weighted average amortized cost basis of the Company’s interest-only Investment Securities at December 31, 2014, September 30, 2014, and December 31, 2013, was 15.4%, 15.2%, and 14.1%, respectively.
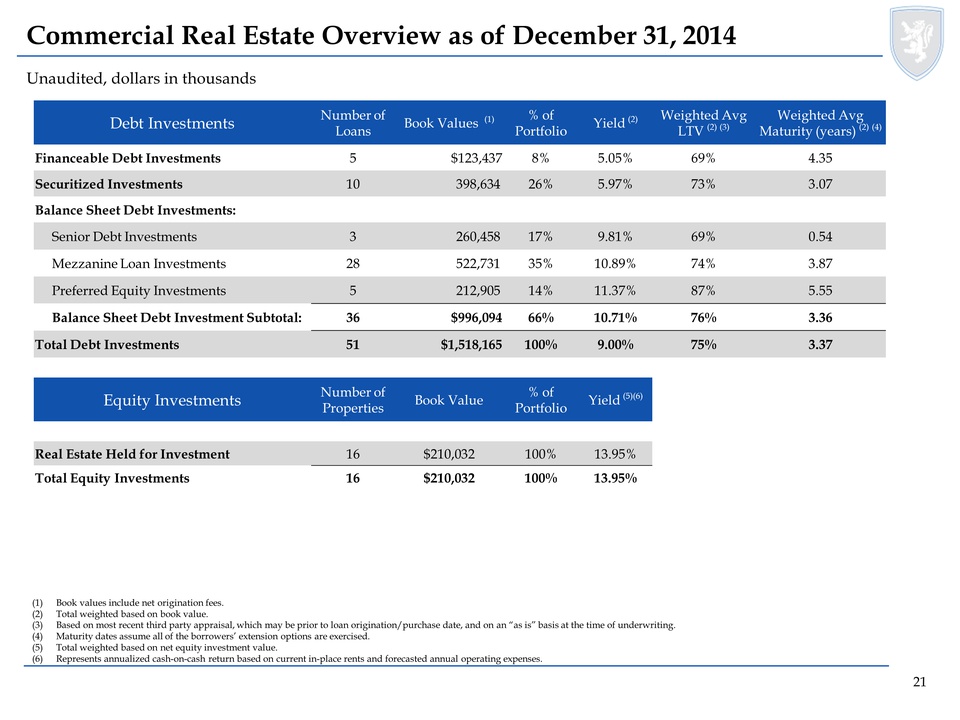
Commercial real estate debt and preferred equity, including securitized loans, totaled $1.5 billion and investments in commercial real estate totaled $210.0 million at December 31, 2014. Commercial real estate debt and preferred equity, including securitized loans, totaled $1.6 billion and investments in commercial real estate totaled $73.8 million at September 30, 2014. The commercial investment portfolio, net of financing, represented 11% of stockholders’ equity at December 31, 2014 and September 30, 2014. The weighted average yield on commercial real estate debt and preferred equity as of December 31, 2014, September 30, 2014, and December 31, 2013, was 9.00%, 9.23% and 9.17%, respectively. The weighted average levered equity yield on investments in commercial real estate, excluding real estate held-for-sale, as of December 31, 2014, September 30, 2014, and December 31, 2013, was 13.95%, 11.46% and 10.80%, respectively.
Capital and Funding
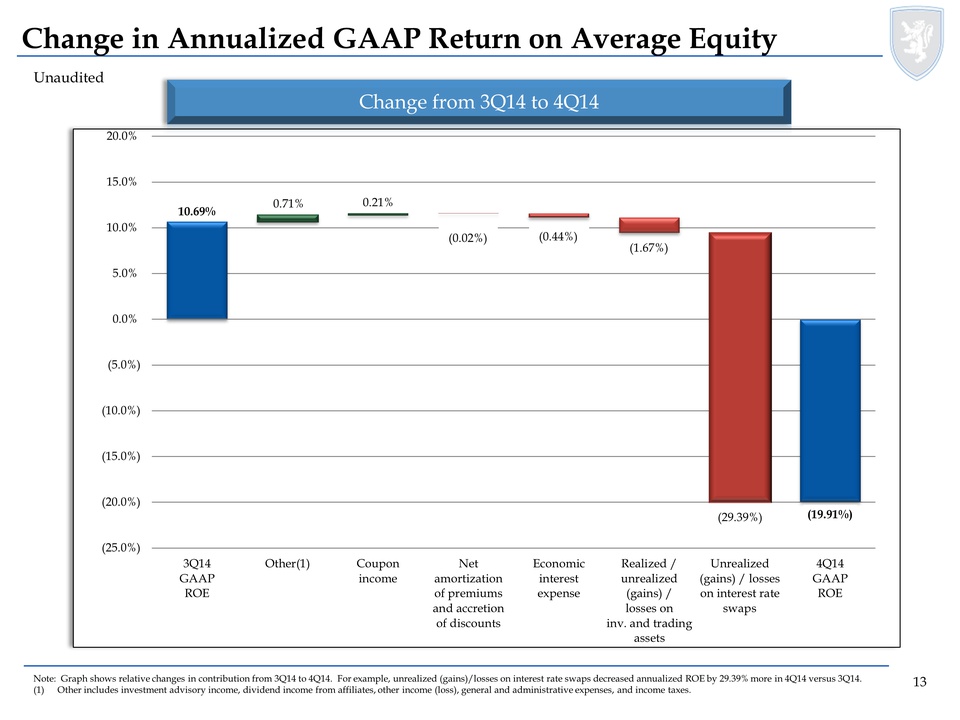
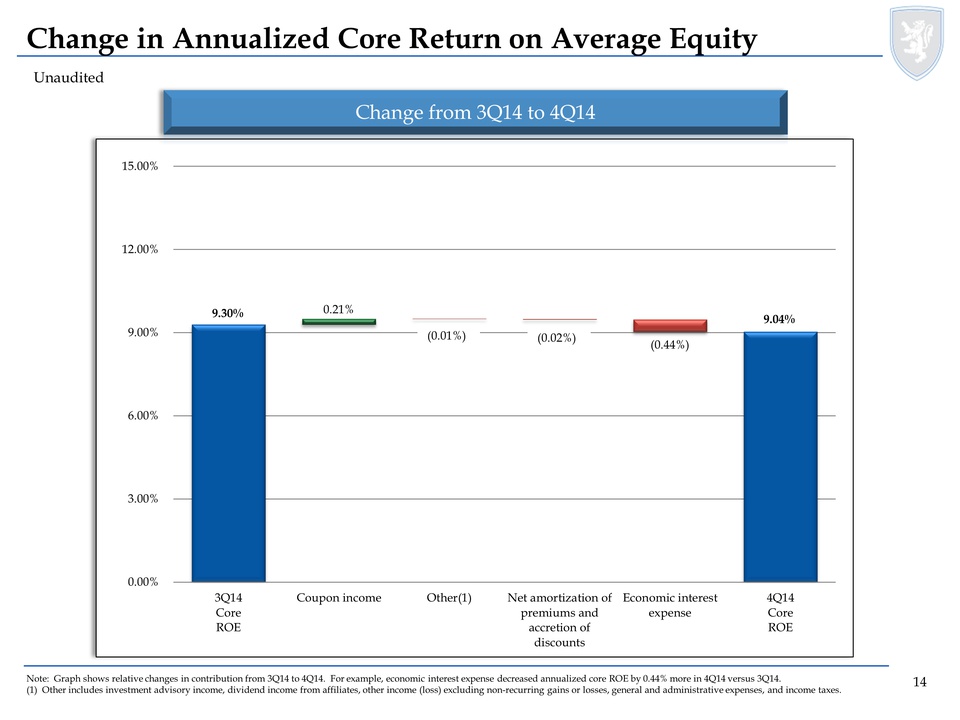
At December 31, 2014, total stockholders’ equity was $13.3 billion. Leverage at December 31, 2014, September 30, 2014, and December 31, 2013, was 5.4:1, 5.4:1 and 5.0:1, respectively. Leverage includes repurchase agreements, Convertible Senior Notes, securitized debt, loan participation and mortgages payable. Securitized debt, loan participation and mortgages payable are non-recourse to the Company. At December 31, 2014, September 30, 2014, and December 31, 2013, the Company’s capital ratio, which represents the ratio of stockholders’ equity to total assets, was 15.1%, 15.0%, and 15.1%, respectively. At December 31, 2014, September 30, 2014, and December 31, 2013, the Company’s net capital ratio was 15.1%, 15.0%, and 15.9%, respectively. The Company’s net capital ratio takes into account the net balances of its reverse repurchase agreements and repurchase agreements, U.S Treasury securities and U.S Treasury securities sold, not yet purchased, and securities borrowed and securities loaned, as applicable. On a GAAP basis, the Company produced an annualized return (loss) on average equity for the quarters ended December 31, 2014, September 30, 2014, and December 31, 2013 of (19.91%), 10.69%, and 32.46%, respectively. On a Core earnings basis, the Company provided an annualized return on average equity for the quarters ended December 31, 2014, September 30, 2014, and December 31, 2013, of 9.04%, 9.30%, and 11.05%, respectively.
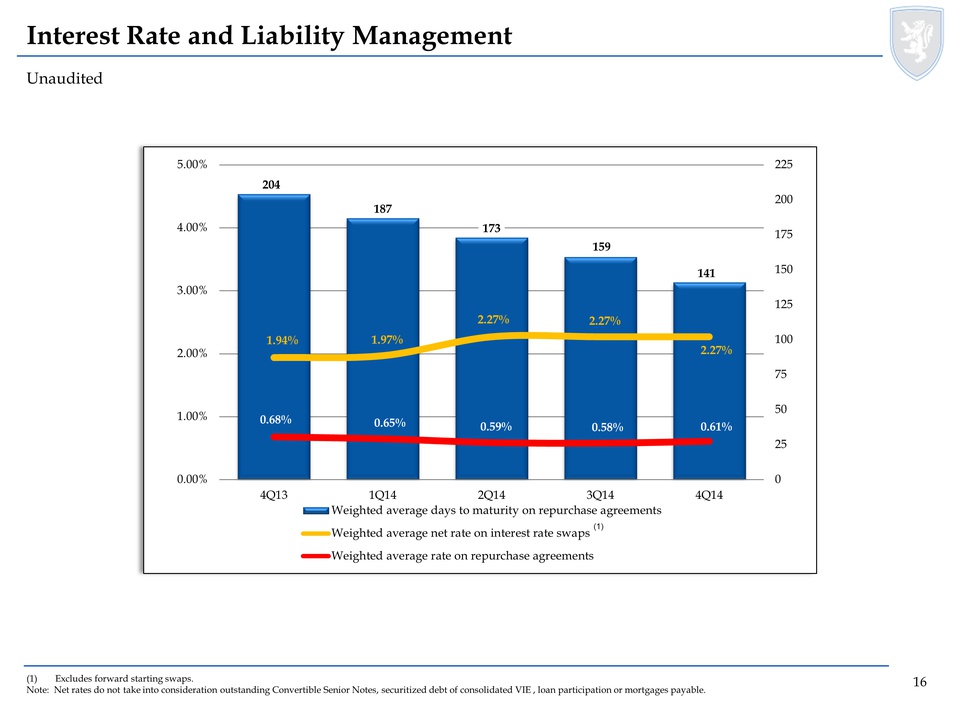
At December 31, 2014, September 30, 2014, and December 31, 2013 the Company had outstanding $71.4 billion, $69.6 billion, and $61.8 billion of repurchase agreements, respectively, with weighted average remaining maturities of 141 days, 159 days, and 204 days, respectively, and with weighted average borrowing rates of 1.62%, 1.61%, and 2.33%, respectively, after giving effect to the Company’s interest rate swaps.
At December 31, 2014, September 30, 2014, and December 31, 2013, the Company had a common stock book value per share of $13.10, $12.87 and $12.13, respectively.
The following table presents the principal balance and weighted average rate of repurchase agreements by maturity at December 31, 2014:
|
Maturity
|
Principal Balance
|
Weighted Average Rate
|
||||||
| (dollars in thousands) | ||||||||
|
Within 30 days
|
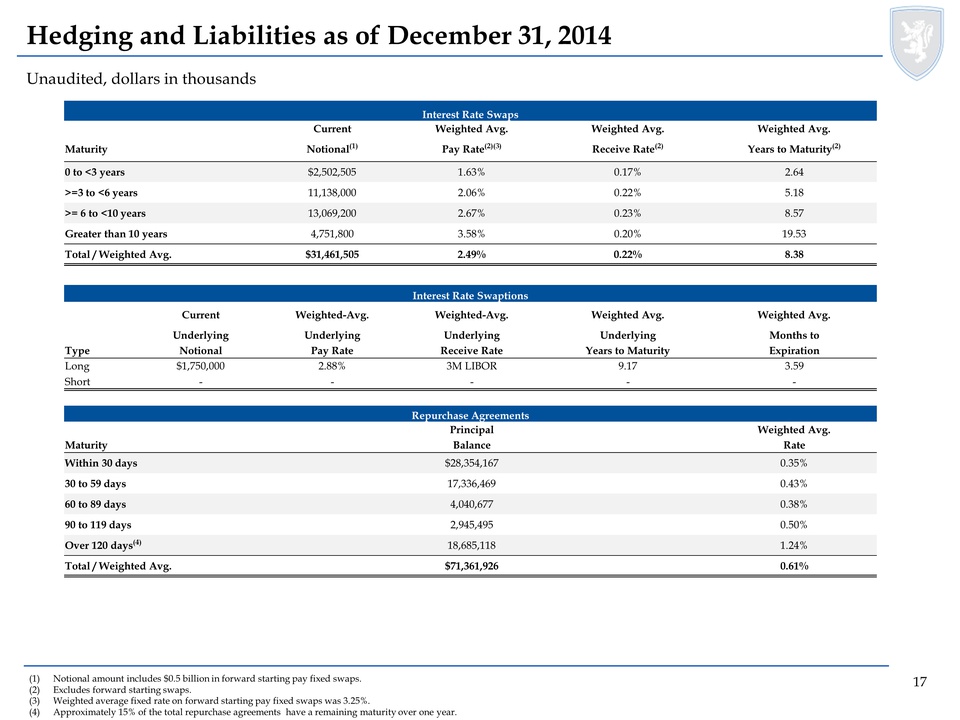
$ | 28,354,167 | 0.35 | % | ||||
|
30 to 59 days
|
17,336,469 | 0.43 | % | |||||
|
60 to 89 days
|
4,040,677 | 0.38 | % | |||||
|
90 to 119 days
|
2,945,495 | 0.50 | % | |||||
|
Over 120 days(1)
|
18,685,118 | 1.24 | % | |||||
|
Total
|
$ | 71,361,926 | 0.61 | % | ||||
(1) Approximately 15% of the total repurchase agreements have a remaining maturity over 1 year.
Hedge Portfolio
At December 31, 2014, the Company had outstanding interest rate swaps with a net notional amount of $31.5 billion and interest rate swaptions with a net notional amount of $1.8 billion, representing 47% of the Company’s repurchase agreements.
2
Interest rate swaps and swaptions represented 48% of the Company’s repurchase agreements at September 30, 2014 and 92% of the Company’s repurchase agreements at December 31, 2013. Changes in the unrealized gains or losses on the interest rate swaps are reflected in the Company’s Consolidated Statements of Comprehensive Income (Loss). The purpose of the interest rate swaps is to mitigate the risk of rising interest rates that affect the Company’s cost of funds. Since the Company pays a fixed rate and receives a floating rate on the notional amount of the swaps, the intended effect of the swaps is to lock in a cost of financing. As of December 31, 2014, the swap portfolio, excluding forward starting swaps, had a weighted average pay rate of 2.49%, a weighted average receive rate of 0.22% and weighted average maturity of 8.38 years.
At December 31, 2014, the Company had outstanding interest rate swaptions with a net notional amount of $1.8 billion. Changes in the unrealized gains or losses on the interest rate swaptions are reflected in the Company’s Consolidated Statements of Comprehensive Income (Loss). The interest rate swaptions provide the Company with the option to enter into an interest rate swap agreement for a specified notional amount, duration, and pay and receive rates. As of December 31, 2014, the long swaption portfolio had a weighted average pay rate of 2.88% and weighted average expiration of 3.59 months. As of December 31, 2014, there were no short swaption positions.
The following table summarizes certain characteristics of the Company’s interest rate swaps at December 31, 2014:
|
Maturity
|
Current Notional (1)
|
Weighted
Average Pay
Rate (2) (3)
|
Weighted
Average Receive
Rate (2)
|
Weighted
Average Years
to Maturity (2)
|
||||||||||||
|
(dollars in thousands)
|
||||||||||||||||
|
0 - 3 years
|
$ | 2,502,505 | 1.63 | % | 0.17 | % | 2.64 | |||||||||
|
3 - 6 years
|
11,138,000 | 2.06 | % | 0.22 | % | 5.18 | ||||||||||
|
6 - 10 years
|
13,069,200 | 2.67 | % | 0.23 | % | 8.57 | ||||||||||
|
Greater than 10 years
|
4,751,800 | 3.58 | % | 0.20 | % | 19.53 | ||||||||||
|
Total / Weighted Average
|
$ | 31,461,505 | 2.49 | % | 0.22 | % | 8.38 | |||||||||
(1) Notional amount includes $0.5 billion in forward starting pay fixed swaps.
(2) Excludes forward starting swaps.
(3) Weighted average fixed rate on forward starting pay fixed swaps was 3.25%.
The following table summarizes certain characteristics of the Company’s interest rate swaptions at December 31, 2014:
|
Current Underlying
Notional
|
Weighted Average Underlying Pay
Rate
|
Weighted Average Underlying Receive
Rate
|
Weighted Average Underlying Years to Maturity
|
Weighted Average Months
to Expiration
|
||||||||||||||||
| (dollars in thousands) | ||||||||||||||||||||
|
Long
|
$ | 1,750,000 | 2.88 | % |
3M LIBOR
|
9.17 | 3.59 | |||||||||||||
|
Short
|
$ | - | - | - | - | - | ||||||||||||||
3
Key Metrics
The following table presents key metrics of the Company’s portfolio, liabilities and hedging positions, and performance as of and for the quarters ended December 31, 2014, September 30, 2014, and December 31, 2013:
|
December 31, 2014
|
September 30, 2014
|
December 31, 2013
|
||||||||||
|
Portfolio Related Metrics:
|
||||||||||||
|
Fixed-rate Agency mortgage-backed securities and debentures as a percentage of Investment Securities
|
95 | % | 95 | % | 91 | % | ||||||
|
Adjustable-rate Agency mortgage-backed securities and debentures as a percentage of Investment Securities
|
5 | % | 5 | % | 9 | % | ||||||
|
Weighted average yield on commercial real estate debt and preferred equity at period-end
|
9.00 | % | 9.23 | % | 9.17 | % | ||||||
|
Weighted average net equity yield on investments in commercial real estate at period-end (1)
|
13.95 | % | 11.46 | % | 10.80 | % | ||||||
|
Liabilities and Hedging Metrics:
|
||||||||||||
|
Weighted average days to maturity on repurchase agreements outstanding at period-end
|
141 | 159 | 204 | |||||||||
|
Notional amount of interest rate swaps and swaptions as a percentage of repurchase agreements
|
47 | % | 48 | % | 92 | % | ||||||
|
Weighted average pay rate on interest rate swaps at period-end (2)
|
2.49 | % | 2.48 | % | 2.14 | % | ||||||
|
Weighted average receive rate on interest rate swaps at period-end (2)
|
0.22 | % | 0.21 | % | 0.20 | % | ||||||
|
Weighted average net rate on interest rate swaps at period-end (2)
|
2.27 | % | 2.27 | % | 1.94 | % | ||||||
|
Leverage at period-end (3)
|
5.4:1
|
5.4:1
|
5.0:1
|
|||||||||
|
Capital ratio at period end
|
15.1 | % | 15.0 | % | 15.1 | % | ||||||
|
Net capital ratio at period end
|
15.1 | % | 15.0 | % | 15.9 | % | ||||||
|
Performance Related Metrics:
|
||||||||||||
|
Net interest margin (4)
|
1.56 | % | 1.61 | % | 1.78 | % | ||||||
|
Average yield on interest earning assets (5)
|
2.98 | % | 2.99 | % | 3.50 | % | ||||||
|
Average cost of interest bearing liabilities (6)
|
1.69 | % | 1.64 | % | 2.07 | % | ||||||
|
Net interest spread
|
1.29 | % | 1.35 | % | 1.43 | % | ||||||
|
Annualized return (loss) on average equity
|
(19.91 | %) | 10.69 | % | 32.46 | % | ||||||
|
Annualized Core return on average equity
|
9.04 | % | 9.30 | % | 11.05 | % | ||||||
|
Common dividend declared during the quarter
|
$ | 0.30 | $ | 0.30 | $ | 0.30 | ||||||
|
Book value per common share
|
$ | 13.10 | $ | 12.87 | $ | 12.13 | ||||||
| (1) |
Excludes real estate held-for-sale.
|
| (2) |
Excludes forward starting swaps.
|
| (3) |
Includes repurchase agreements, Convertible Senior Notes, securitized debt, loan participation and mortgages payable. Securitized debt, loan participation and mortgages payable are non-recourse to the Company.
|
| (4) |
Represents the Company’s annualized economic net interest income, inclusive of interest expense on interest rate swaps, divided by its average interest-earning assets.
|
| (5) |
Average interest earning assets reflects the average amortized cost of our investments during the period.
|
| (6) |
Includes interest expense on interest rate swaps.
|
The following table presents a reconciliation between GAAP net income and Core earnings for the quarters ended December 31, 2014, September 30, 2014, and December 31, 2013:
|
For the quarters ended
|
||||||||||||
|
December 31, 2014
|
September 30, 2014
|
December 31, 2013
|
||||||||||
|
(dollars in thousands)
|
||||||||||||
|
GAAP net income (loss)
|
$ | (658,272 | ) | $ | 354,856 | $ | 1,028,749 | |||||
|
Adjustments:
|
||||||||||||
|
Realized (gains) losses on termination of interest rate swaps
|
- | - | 13,177 | |||||||||
|
Unrealized (gains) losses on interest rate swaps
|
873,468 | (98,593 | ) | (561,101 | ) | |||||||
|
Net (gains) losses on disposal of investments
|
(3,420 | ) | (4,693 | ) | (28,602 | ) | ||||||
|
Net (gains) losses on trading assets
|
57,454 | (4,676 | ) | (41,936 | ) | |||||||
|
Net unrealized (gains) losses on interest-only Agency mortgage-backed securities
|
29,520 | 37,944 | (60,181 | ) | ||||||||
|
Other non-recurring loss (1)
|
- | 23,783 | - | |||||||||
|
GAAP net income attributable to noncontrolling interest
|
196 | - | - | |||||||||
|
Core earnings
|
$ | 298,946 | $ | 308,621 | $ | 350,106 | ||||||
|
GAAP net income (loss) per average common share
|
$ | (0.71 | ) | $ | 0.36 | $ | 1.07 | |||||
|
Core earnings per average common share
|
$ | 0.30 | $ | 0.31 | $ | 0.35 | ||||||
| (1) | Represents a one-time payment made by FIDAC to Chimera Investment Corp. (Chimera) during the quarter ended September 30, 2014 to resolve issues raised in derivative demand letters sent to Chimera’s board of directors. This amount is a component of Other income (loss) in the Company’s Consolidated Statements of Comprehensive Income (Loss). |
4
The following table presents a reconciliation between GAAP net income and Core earnings for the years ended December 31, 2014 and 2013:
|
For the years ended
|
||||||||
|
December 31, 2014
|
December 31, 2013
|
|||||||
|
(dollars in thousands)
|
||||||||
|
GAAP net income (loss)
|
$ | (842,279 | ) | $ | 3,729,698 | |||
|
Adjustments:
|
||||||||
|
Realized (gains) losses on termination of interest rate swaps
|
779,333 | 101,862 | ||||||
|
Unrealized (gains) losses on interest rate swaps
|
948,755 | (2,002,200 | ) | |||||
|
Net (gains) losses on disposal of investments
|
(93,716 | ) | (403,045 | ) | ||||
|
Net (gains) losses on trading assets
|
245,495 | (1,509 | ) | |||||
|
Net unrealized (gains) losses on interest-only Agency mortgage-backed securities
|
86,172 | (244,730 | ) | |||||
|
Impairment of goodwill
|
- | 23,987 | ||||||
|
Loss on previously held equity interest in CreXus
|
- | 18,896 | ||||||
|
Other non-recurring expense (1)
|
23,783 | - | ||||||
|
GAAP net income attributable to noncontrolling interest
|
196 | - | ||||||
|
Core earnings
|
$ | 1,147,739 | $ | 1,222,959 | ||||
|
GAAP net income per average common share
|
$ | (0.96 | ) | $ | 3.86 | |||
|
Core earnings per average common share
|
$ | 1.14 | $ | 1.21 | ||||
(1) Represents a one-time payment made by FIDAC to Chimera Investment Corp. (Chimera) to resolve issues raised in derivative demand letters sent to Chimera’s board of directors. This amount is a component of Other income (loss in the Company’s Consolidated Statements of Comprehensive Income (Loss).
The following table presents the components of the Company’s interest income and interest expense for the quarters ended December 31, 2014, September 30, 2014, and December 31, 2013:
|
For the quarters ended
|
||||||||||||
|
December 31,
|
September 30,
|
December 31,
|
||||||||||
|
2014
|
2014
|
2013
|
||||||||||
|
(dollars in thousands)
|
||||||||||||
|
Interest income:
|
||||||||||||
|
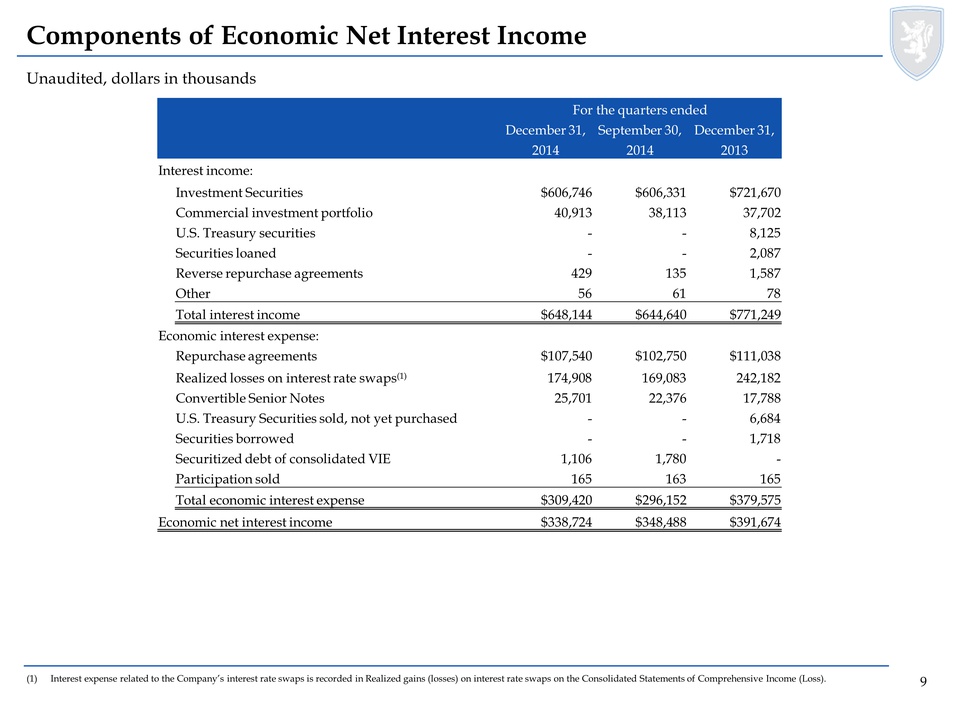
Investment Securities
|
$ | 606,746 | $ | 606,331 | $ | 721,670 | ||||||
|
Commercial investment portfolio(1)
|
40,913 | 38,113 | 37,702 | |||||||||
|
U.S. Treasury securities
|
- | - | 8,125 | |||||||||
|
Securities loaned
|
- | - | 2,087 | |||||||||
|
Reverse repurchase agreements
|
429 | 135 | 1,587 | |||||||||
|
Other
|
56 | 61 | 78 | |||||||||
|
Total interest income
|
648,144 | 644,640 | 771,249 | |||||||||
|
Interest expense:
|
||||||||||||
|
Repurchase agreements
|
107,540 | 102,750 | 111,038 | |||||||||
|
Convertible Senior Notes
|
25,701 | 22,376 | 17,788 | |||||||||
|
U.S. Treasury securities sold, not yet purchased
|
- | - | 6,684 | |||||||||
|
Securities borrowed
|
- | - | 1,718 | |||||||||
|
Securitized debt of consolidated VIE
|
1,106 | 1,780 | - | |||||||||
|
Participation sold
|
165 | 163 | 165 | |||||||||
|
Total interest expense
|
134,512 | 127,069 | 137,393 | |||||||||
|
Net interest income
|
$ | 513,632 | $ | 517,571 | $ | 633,856 | ||||||
(1) Consists of commercial real estate debt and preferred equity and corporate debt.
Dividend Declarations
Common dividends declared for the quarters ended December 31, 2014, September 30, 2014, and December 31, 2013 were $0.30, $0.30, and $0.30 per common share, respectively. The annualized dividend yield on the Company’s common stock for the quarter ended December 31, 2014, based on the December 31, 2014 closing price of $10.81, was 11.10%, compared to 11.24% for the quarter ended September 30, 2014, and 12.04% for the quarter ended December 31, 2013.
5
Other Information
Annaly’s principal business objective is to generate net income for distribution to its shareholders from its investments. Annaly is a Maryland corporation that has elected to be taxed as a real estate investment trust (“REIT”). Annaly is managed and advised by Annaly Management Company LLC.
The Company prepares a supplement to provide additional quarterly information for the benefit of its shareholders. The supplement can be found at the Company’s website in the Investor Relations section under “Quarterly Supplemental Information”.
Conference Call
The Company will hold the fourth quarter 2014 earnings conference call on February 25, 2015 at 9:00 a.m. Eastern Time. The number to call is 888-317-6003 for domestic calls and 412-317-6061 for international calls. The conference passcode is 1590772. There will also be an audio webcast of the call on www.annaly.com. The replay of the call is available for one week following the conference call. The replay number is 877-344-7529 for domestic calls and 412-317-0088 for international calls and the conference passcode is 10060573. If you would like to be added to the e-mail distribution list, please visit www.annaly.com, click on Investor Relations, then select Email Alerts and complete the email notification form.
This news release and our public documents to which we refer contain or incorporate by reference certain forward-looking statements which are based on various assumptions (some of which are beyond our control) and may be identified by reference to a future period or periods or by the use of forward-looking terminology, such as "may," "will," "believe," "expect," "anticipate," "continue," or similar terms or variations on those terms or the negative of those terms. Actual results could differ materially from those set forth in forward-looking statements due to a variety of factors, including, but not limited to, changes in interest rates; changes in the yield curve; changes in prepayment rates; the availability of mortgage-backed securities and other securities for purchase; the availability of financing and, if available, the terms of any financings; changes in the market value of our assets; changes in business conditions and the general economy; our ability to grow the commercial mortgage business; credit risks related to our investments in commercial real estate assets and corporate debt; our ability to consummate any contemplated investment opportunities; changes in government regulations affecting our business; our ability to maintain our qualification as a REIT for federal income tax purposes; our ability to maintain our exemption from registration under the Investment Company Act of 1940, as amended; risks associated with the businesses of our subsidiaries, including the investment advisory business of a wholly-owned subsidiary and the broker-dealer business of a wholly-owned subsidiary. For a discussion of the risks and uncertainties which could cause actual results to differ from those contained in the forward-looking statements, see "Risk Factors" in our most recent Annual Report on Form 10-K and any subsequent Quarterly Reports on Form 10-Q. We do not undertake, and specifically disclaim any obligation, to publicly release the result of any revisions which may be made to any forward-looking statements to reflect the occurrence of anticipated or unanticipated events or circumstances after the date of such statements.
6
|
ANNALY CAPITAL MANAGEMENT, INC. AND SUBSIDIARIES
|
|
CONSOLIDATED STATEMENTS OF FINANCIAL CONDITION
|
|
(dollars in thousands, except per share data)
|
|
December 31,
|
September 30,
|
June 30,
|
March 31,
|
December 31,
|
||||||||||||||||
|
2014
|
2014
|
2014
|
2014
|
2013(1)
|
||||||||||||||||
|
(Unaudited)
|
(Unaudited)
|
(Unaudited)
|
(Unaudited)
|
|||||||||||||||||
|
ASSETS
|
||||||||||||||||||||
|
Cash and cash equivalents
|
$ | 1,741,244 | $ | 1,178,621 | $ | 1,320,666 | $ | 924,197 | $ | 552,436 | ||||||||||
|
Reverse repurchase agreements
|
100,000 | - | - | 444,375 | 100,000 | |||||||||||||||
|
Securities borrowed
|
- | - | - | 513,500 | 2,582,893 | |||||||||||||||
|
Investments, at fair value:
|
||||||||||||||||||||
|
U.S. Treasury securities
|
- | - | - | - | 1,117,915 | |||||||||||||||
|
Agency mortgage-backed securities
|
81,565,256 | 81,462,387 | 81,055,337 | 75,350,388 | 70,388,949 | |||||||||||||||
|
Agency debentures
|
1,368,350 | 1,334,181 | 1,348,727 | 2,408,259 | 2,969,885 | |||||||||||||||
|
Investment in affiliates
|
143,045 | 136,748 | 143,495 | 137,647 | 139,447 | |||||||||||||||
|
Commercial real estate debt and preferred equity (2)
|
1,518,165 | 1,554,958 | 1,586,169 | 1,640,206 | 1,583,969 | |||||||||||||||
|
Investments in commercial real estate
|
210,032 | 73,827 | 74,355 | 40,313 | 60,132 | |||||||||||||||
|
Corporate debt, held for investment
|
166,464 | 144,451 | 151,344 | 145,394 | 117,687 | |||||||||||||||
|
Receivable for investments sold
|
1,010,094 | 855,161 | 856,983 | 19,116 | 1,193,730 | |||||||||||||||
|
Accrued interest and dividends receivable
|
278,489 | 287,231 | 283,423 | 276,007 | 273,079 | |||||||||||||||
|
Receivable for investment advisory income
|
10,402 | 8,369 | 6,380 | 6,498 | 6,839 | |||||||||||||||
|
Goodwill
|
94,781 | 94,781 | 94,781 | 94,781 | 94,781 | |||||||||||||||
|
Interest rate swaps, at fair value
|
75,225 | 198,066 | 170,604 | 340,890 | 559,044 | |||||||||||||||
|
Other derivatives, at fair value
|
5,499 | 19,407 | 7,938 | 40,105 | 146,725 | |||||||||||||||
|
Other assets
|
68,321 | 39,798 | 50,743 | 33,101 | 34,949 | |||||||||||||||
|
Total assets
|
$ | 88,355,367 | $ | 87,387,986 | $ | 87,150,945 | $ | 82,414,777 | $ | 81,922,460 | ||||||||||
|
LIABILITIES AND STOCKHOLDERS’ EQUITY
|
||||||||||||||||||||
|
Liabilities:
|
||||||||||||||||||||
|
U.S. Treasury securities sold, not yet purchased, at fair value
|
$ | - | $ | - | $ | - | $ | - | $ | 1,918,394 | ||||||||||
|
Repurchase agreements
|
71,361,926 | 69,610,722 | 70,372,218 | 64,543,949 | 61,781,001 | |||||||||||||||
|
Securities loaned
|
- | 7 | 7 | 513,510 | 2,527,668 | |||||||||||||||
|
Payable for investments purchased
|
264,984 | 2,153,789 | 781,227 | 1,898,507 | 764,131 | |||||||||||||||
|
Convertible Senior Notes
|
845,295 | 836,625 | 831,167 | 827,486 | 825,262 | |||||||||||||||
|
Securitized debt of consolidated VIE
|
260,700 | 260,700 | 260,700 | 260,700 | - | |||||||||||||||
|
Mortgages payable
|
146,553 | 42,635 | 30,316 | 19,317 | 19,332 | |||||||||||||||
|
Participation sold
|
13,693 | 13,768 | 13,866 | 13,963 | 14,065 | |||||||||||||||
|
Accrued interest payable
|
180,501 | 180,345 | 157,782 | 170,644 | 160,921 | |||||||||||||||
|
Dividends payable
|
284,293 | 284,278 | 284,261 | 284,247 | 284,230 | |||||||||||||||
|
Interest rate swaps, at fair value
|
1,608,286 | 857,658 | 928,789 | 1,272,616 | 1,141,828 | |||||||||||||||
|
Other derivatives, at fair value
|
8,027 | - | 6,533 | 6,045 | 55,518 | |||||||||||||||
|
Accounts payable and other liabilities
|
47,328 | 36,511 | 35,160 | 39,081 | 25,055 | |||||||||||||||
|
Total liabilities
|
75,021,586 | 74,277,038 | 73,702,026 | 69,850,065 | 69,517,405 | |||||||||||||||
|
Stockholders’ Equity:
|
||||||||||||||||||||
|
7.875% Series A Cumulative Redeemable Preferred Stock:
7,412,500 authorized, issued and outstanding
|
177,088 | 177,088 | 177,088 | 177,088 | 177,088 | |||||||||||||||
|
7.625% Series C Cumulative Redeemable Preferred Stock
12,650,000 authorized, 12,000,000 issued and outstanding
|
290,514 | 290,514 | 290,514 | 290,514 | 290,514 | |||||||||||||||
|
7.50% Series D Cumulative Redeemable Preferred Stock:
18,400,000 authorized, issued and outstanding
|
445,457 | 445,457 | 445,457 | 445,457 | 445,457 | |||||||||||||||
|
Common stock, par value $0.01 per share, 1,956,937,500 authorized, 947,643,079, 947,540,823, 947,488,945, 947,432,862 and 947,304,761 issued and outstanding, respectively
|
9,476 | 9,476 | 9,475 | 9,475 | 9,474 | |||||||||||||||
|
Additional paid-in capital
|
14,786,509 | 14,781,308 | 14,776,302 | 14,770,553 | 14,765,761 | |||||||||||||||
|
Accumulated other comprehensive income (loss)
|
204,883 | (967,820 | ) | (572,256 | ) | (2,088,479 | ) | (2,748,933 | ) | |||||||||||
|
Accumulated deficit
|
(2,585,436 | ) | (1,625,075 | ) | (1,677,661 | ) | (1,039,896 | ) | (534,306 | ) | ||||||||||
|
Total stockholders’ equity
|
13,328,491 | 13,110,948 | 13,448,919 | 12,564,712 | 12,405,055 | |||||||||||||||
|
Noncontrolling interest
|
5,290 | - | - | - | - | |||||||||||||||
|
Total equity
|
13,333,781 | 13,110,948 | 13,448,919 | 12,564,712 | 12,405,055 | |||||||||||||||
|
Total liabilities and equity
|
$ | 88,355,367 | $ | 87,387,986 | $ | 87,150,945 | $ | 82,414,777 | $ | 81,922,460 | ||||||||||
(1) Derived from the audited consolidated financial statements at December 31, 2013.
(2) Includes senior securitized mortgages of consolidated VIE with a carrying value of $398.6 million, $398.4 million, $398.3 million, $398.1 million and $0, respectively.
7
|
ANNALY CAPITAL MANAGEMENT, INC. AND SUBSIDIARIES
|
|
CONSOLIDATED STATEMENTS OF COMPREHENSIVE INCOME (LOSS)
|
|
(UNAUDITED)
|
|
(dollars in thousands, except per share data)
|
|
For the quarters ended
|
||||||||||||||||||||
|
December 31,
|
September 30,
|
June 30,
|
March 31,
|
December 31,
|
||||||||||||||||
|
2014
|
2014
|
2014
|
2014
|
2013
|
||||||||||||||||
|
Net interest income:
|
||||||||||||||||||||
|
Interest income
|
$ | 648,144 | $ | 644,640 | $ | 683,962 | $ | 655,901 | $ | 771,249 | ||||||||||
|
Interest expense
|
134,512 | 127,069 | 126,107 | 124,971 | 137,393 | |||||||||||||||
|
Net interest income
|
513,632 | 517,571 | 557,855 | 530,930 | 633,856 | |||||||||||||||
|
Other income (loss):
|
||||||||||||||||||||
|
Realized gains (losses) on interest rate swaps(1)
|
(174,908 | ) | (169,083 | ) | (220,934 | ) | (260,435 | ) | (242,182 | ) | ||||||||||
|
Realized gains (losses) on termination of interest rate swaps
|
- | - | (772,491 | ) | (6,842 | ) | (13,177 | ) | ||||||||||||
|
Unrealized gains (losses) on interest rate swaps
|
(873,468 | ) | 98,593 | 175,062 | (348,942 | ) | 561,101 | |||||||||||||
|
Subtotal
|
(1,048,376 | ) | (70,490 | ) | (818,363 | ) | (616,219 | ) | 305,742 | |||||||||||
|
Investment advisory income
|
10,858 | 8,253 | 6,109 | 6,123 | 8,490 | |||||||||||||||
|
Net gains (losses) on disposal of investments
|
3,420 | 4,693 | 5,893 | 79,710 | 28,602 | |||||||||||||||
|
Dividend income from affiliates
|
4,048 | 4,048 | 4,048 | 13,045 | 4,048 | |||||||||||||||
|
Net gains (losses) on trading assets
|
(57,454 | ) | 4,676 | (46,489 | ) | (146,228 | ) | 41,936 | ||||||||||||
|
Net unrealized gains (losses) on interest-only Agency mortgage-backed securities
|
(29,520 | ) | (37,944 | ) | 2,085 | (20,793 | ) | 60,181 | ||||||||||||
|
Other income (loss)
|
3,365 | (22,249 | ) | 4,687 | 1,460 | 3,945 | ||||||||||||||
|
Subtotal
|
(65,283 | ) | (38,523 | ) | (23,667 | ) | (66,683 | ) | 147,202 | |||||||||||
|
Total other income (loss)
|
(1,113,659 | ) | (109,013 | ) | (842,030 | ) | (682,902 | ) | 452,944 | |||||||||||
|
General and administrative expenses:
|
||||||||||||||||||||
|
Compensation and management fee
|
38,734 | 39,028 | 39,277 | 38,521 | 43,385 | |||||||||||||||
|
Other general and administrative expenses
|
19,720 | 12,289 | 12,912 | 8,857 | 12,909 | |||||||||||||||
|
Total general and administrative expenses
|
58,454 | 51,317 | 52,189 | 47,378 | 56,294 | |||||||||||||||
|
Income (loss) before income taxes
|
(658,481 | ) | 357,241 | (336,364 | ) | (199,350 | ) | 1,030,506 | ||||||||||||
|
Income taxes
|
(209 | ) | 2,385 | (852 | ) | 4,001 | 1,757 | |||||||||||||
|
Net income (loss)
|
(658,272 | ) | 354,856 | (335,512 | ) | (203,351 | ) | 1,028,749 | ||||||||||||
|
Net income (loss) attributable to noncontrolling interest
|
(196 | ) | - | - | - | - | ||||||||||||||
|
Net income (loss) attributable to Annaly
|
(658,076 | ) | 354,856 | (335,512 | ) | (203,351 | ) | 1,028,749 | ||||||||||||
|
Dividends on preferred stock
|
17,992 | 17,992 | 17,992 | 17,992 | 17,992 | |||||||||||||||
|
Net income (loss) available (related) to common stockholders
|
$ | (676,068 | ) | $ | 336,864 | $ | (353,504 | ) | $ | (221,343 | ) | $ | 1,010,757 | |||||||
|
Net income (loss) per share available (related) to common stockholders:
|
||||||||||||||||||||
|
Basic
|
$ | (0.71 | ) | $ | 0.36 | $ | (0.37 | ) | $ | (0.23 | ) | $ | 1.07 | |||||||
|
Diluted
|
$ | (0.71 | ) | $ | 0.35 | $ | (0.37 | ) | $ | (0.23 | ) | $ | 1.03 | |||||||
|
Weighted average number of common shares outstanding:
|
||||||||||||||||||||
|
Basic
|
947,615,793 | 947,565,432 | 947,515,127 | 947,458,813 | 947,386,060 | |||||||||||||||
|
Diluted
|
947,615,793 | 987,315,527 | 947,515,127 | 947,458,813 | 995,625,622 | |||||||||||||||
|
Dividends Declared Per Share of Common Stock
|
||||||||||||||||||||
|
Net income (loss)
|
$ | (658,272 | ) | $ | 354,856 | $ | (335,512 | ) | $ | (203,351 | ) | $ | 1,028,749 | |||||||
|
Other comprehensive income (loss):
|
||||||||||||||||||||
|
Unrealized gains (losses) on available-for-sale securities
|
1,175,864 | (390,871 | ) | 1,522,126 | 741,172 | (1,244,500 | ) | |||||||||||||
|
Reclassification adjustment for net (gains) losses included in net income (loss)
|
(3,161 | ) | (4,693 | ) | (5,903 | ) | (80,718 | ) | (49,643 | ) | ||||||||||
|
Other comprehensive income (loss)
|
1,172,703 | (395,564 | ) | 1,516,223 | 660,454 | (1,294,143 | ) | |||||||||||||
|
Comprehensive income (loss)
|
514,431 | (40,708 | ) | 1,180,711 | 457,103 | (265,394 | ) | |||||||||||||
|
Comprehensive income (loss) attributable to noncontrolling interest
|
(196 | ) | - | - | - | - | ||||||||||||||
|
Comprehensive income (loss) attributable to Annaly
|
$ | 514,627 | $ | (40,708 | ) | $ | 1,180,711 | $ | 457,103 | $ | (265,394 | ) | ||||||||
| (1) | Interest expense related to the Company’s interest rate swaps is recorded in Realized gains (losses) on interest rate swaps on the Consolidated Statements of Comprehensive Income (Loss). |
8
|
ANNALY CAPITAL MANAGEMENT, INC. AND SUBSIDIARIES
|
|
CONSOLIDATED STATEMENTS OF COMPREHENSIVE INCOME (LOSS)
|
|
(dollars in thousands, except per share data)
|
|
(Unaudited)
|
|
For the years ended
|
||||||||
|
December 31,
|
December 31,
|
|||||||
|
2014
|
2013(2)
|
|||||||
|
(Unaudited)
|
||||||||
|
Net interest income:
|
||||||||
|
Interest income
|
$ | 2,632,647 | $ | 2,918,562 | ||||
|
Interest expense
|
512,659 | 624,714 | ||||||
|
Net interest income
|
2,119,988 | 2,293,848 | ||||||
|
Other income (loss):
|
||||||||
|
Realized gains (losses) on interest rate swaps(1)
|
(825,360 | ) | (908,294 | ) | ||||
|
Realized gains (losses) on termination of interest rate swaps
|
(779,333 | ) | (101,862 | ) | ||||
|
Unrealized gains (losses) on interest rate swaps
|
(948,755 | ) | 2,002,200 | |||||
|
Subtotal
|
(2,553,448 | ) | 992,044 | |||||
|
Investment advisory income
|
31,343 | 43,643 | ||||||
|
Net gains (losses) on disposal of investments
|
93,716 | 403,045 | ||||||
|
Dividend income from affiliates
|
25,189 | 18,575 | ||||||
|
Net gains (losses) on trading assets
|
(245,495 | ) | 1,509 | |||||
|
Net unrealized gains (losses) on interest-only Agency mortgage-backed securities
|
(86,172 | ) | 244,730 | |||||
|
Impairment of goodwill
|
- | (23,987 | ) | |||||
|
Loss on previously held equity interest in CreXus
|
- | (18,896 | ) | |||||
|
Other income (loss)
|
(12,737 | ) | 15,481 | |||||
|
Subtotal
|
(194,156 | ) | 684,100 | |||||
|
Total other income (loss)
|
(2,747,604 | ) | 1,676,144 | |||||
|
General and administrative expenses:
|
||||||||
|
Compensation and management fee
|
155,560 | 167,366 | ||||||
|
Other general and administrative expenses
|
53,778 | 64,715 | ||||||
|
Total general and administrative expenses
|
209,338 | 232,081 | ||||||
|
Income (loss) before income taxes
|
(836,954 | ) | 3,737,911 | |||||
|
Income taxes
|
5,325 | 8,213 | ||||||
|
Net income (loss)
|
(842,279 | ) | 3,729,698 | |||||
|
Net income (loss) attributable to noncontrolling interest
|
(196 | ) | - | |||||
|
Net income (loss) attributable to Annaly
|
(842,083 | ) | 3,729,698 | |||||
|
Dividends on preferred stock
|
71,968 | 71,968 | ||||||
|
Net income (loss) available (related) to common stockholders
|
$ | (914,051 | ) | $ | 3,657,730 | |||
|
Net income (loss) per share available (related) to common stockholders:
|
||||||||
|
Basic
|
$ | (0.96 | ) | $ | 3.86 | |||
|
Diluted
|
$ | (0.96 | ) | $ | 3.74 | |||
|
Weighted average number of common shares outstanding:
|
||||||||
|
Basic
|
947,539,294 | 947,337,915 | ||||||
|
Diluted
|
947,539,294 | 995,557,026 | ||||||
|
Net income (loss)
|
$ | (842,279 | ) | $ | 3,729,698 | |||
|
Other comprehensive income (loss):
|
||||||||
|
Unrealized gains (losses) on available-for-sale securities
|
3,048,291 | (5,378,089 | ) | |||||
|
Reclassification adjustment for net (gains) losses included in net income (loss)
|
(94,475 | ) | (424,086 | ) | ||||
|
Other comprehensive income (loss)
|
2,953,816 | (5,802,175 | ) | |||||
|
Comprehensive income (loss)
|
2,111,537 | (2,072,477 | ) | |||||
|
Comprehensive income (loss) attributable to noncontrolling interest
|
(196 | ) | - | |||||
|
Comprehensive income (loss) attributable to Annaly
|
$ | 2,111,733 | $ | (2,072,477 | ) | |||
| (1) |
Interest expense related to the Company’s interest rate swaps is recorded in Realized gains (losses) on interest rate swaps on the Consolidated Statements of Comprehensive Income (Loss).
|
| (2) | Derived from the audited consolidated financial statements at December 31, 2013. |
9