
PROSPECTUS
Investor and Service Class
November 30, 2022
|
|
INVESTOR CLASS |
SERVICE CLASS |
|
Access Flex Bear High Yield
ProFundSM
|
AFBIX |
AFBSX |
|
Access Flex High Yield
ProFundSM
|
FYAIX |
FYASX |
|
Banks UltraSector ProFund |
BKPIX |
BKPSX |
|
Basic Materials UltraSector
ProFund |
BMPIX |
BMPSX |
|
Bear ProFund |
BRPIX |
BRPSX |
|
Biotechnology UltraSector
ProFund |
BIPIX |
BIPSX |
|
Bull ProFund |
BLPIX |
BLPSX |
|
Communication Services
UltraSector ProFund |
WCPIX |
WCPSX |
|
Consumer Goods UltraSector
ProFund |
CNPIX |
CNPSX |
|
Consumer Services
UltraSector ProFund |
CYPIX |
CYPSX |
|
Europe 30 ProFund |
UEPIX |
UEPSX |
|
Falling U.S. Dollar ProFund |
FDPIX |
FDPSX |
|
Financials UltraSector
ProFund |
FNPIX |
FNPSX |
|
Health Care UltraSector
ProFund |
HCPIX |
HCPSX |
|
Industrials UltraSector
ProFund |
IDPIX |
IDPSX |
|
Internet UltraSector ProFund |
INPIX |
INPSX |
|
Large-Cap Growth ProFund |
LGPIX |
LGPSX |
|
Large-Cap Value ProFund |
LVPIX |
LVPSX |
|
Mid-Cap Growth ProFund |
MGPIX |
MGPSX |
|
Mid-Cap ProFund |
MDPIX |
MDPSX |
|
Mid-Cap Value ProFund |
MLPIX |
MLPSX |
|
Nasdaq-100 ProFund |
OTPIX |
OTPSX |
|
Oil & Gas UltraSector
ProFund |
ENPIX |
ENPSX |
|
Oil Equipment & Services
UltraSector ProFund |
OEPIX |
OEPSX |
|
Pharmaceuticals UltraSector
ProFund |
PHPIX |
PHPSX |
|
Precious Metals UltraSector
ProFund |
PMPIX |
PMPSX |
|
Real Estate UltraSector
ProFund |
REPIX |
REPSX |
|
Rising Rates Opportunity
ProFund |
RRPIX |
RRPSX |
|
Rising Rates Opportunity 10
ProFund |
RTPIX |
RTPSX |
|
|
INVESTOR CLASS |
SERVICE CLASS |
|
Rising U.S. Dollar ProFund |
RDPIX |
RDPSX |
|
Semiconductor UltraSector
ProFund |
SMPIX |
SMPSX |
|
Short Nasdaq-100 ProFund |
SOPIX |
SOPSX |
|
Short Oil & Gas ProFund |
SNPIX |
SNPSX |
|
Short Precious Metals
ProFund |
SPPIX |
SPPSX |
|
Short Real Estate ProFund |
SRPIX |
SRPSX |
|
Short Small-Cap ProFund |
SHPIX |
SHPSX |
|
Small-Cap Growth ProFund |
SGPIX |
SGPSX |
|
Small-Cap ProFund |
SLPIX |
SLPSX |
|
Small-Cap Value ProFund |
SVPIX |
SVPSX |
|
Technology UltraSector
ProFund |
TEPIX |
TEPSX |
|
Telecommunications
UltraSector ProFund |
TCPIX |
TCPSX |
|
UltraBear ProFund |
URPIX |
URPSX |
|
UltraBull ProFund |
ULPIX |
ULPSX |
|
UltraChina ProFund |
UGPIX |
UGPSX |
|
UltraDow 30 ProFund |
UDPIX |
UDPSX |
|
UltraEmerging Markets
ProFund |
UUPIX |
UUPSX |
|
UltraInternational ProFund |
UNPIX |
UNPSX |
|
UltraJapan ProFund |
UJPIX |
UJPSX |
|
UltraLatin America ProFund |
UBPIX |
UBPSX |
|
UltraMid-Cap ProFund |
UMPIX |
UMPSX |
|
UltraNasdaq-100 ProFund |
UOPIX |
UOPSX |
|
UltraShort China ProFund |
UHPIX |
UHPSX |
|
UltraShort Dow 30 ProFund |
UWPIX |
UWPSX |
|
UltraShort Emerging Markets
ProFund |
UVPIX |
UVPSX |
|
UltraShort International
ProFund |
UXPIX |
UXPSX |
|
UltraShort Japan ProFund |
UKPIX |
UKPSX |
|
UltraShort Latin America
ProFund |
UFPIX |
UFPSX |
|
UltraShort Mid-Cap ProFund |
UIPIX |
UIPSX |
|
UltraShort Nasdaq-100
ProFund |
USPIX |
USPSX |
|
UltraShort Small-Cap
ProFund |
UCPIX |
UCPSX |
|
UltraSmall-Cap ProFund |
UAPIX |
UAPSX |
|
U.S. Government Plus
ProFund |
GVPIX |
GVPSX |
|
Utilities UltraSector ProFund |
UTPIX |
UTPSX |
Neither the Securities and Exchange Commission, the Commodity Futures Trading Commission, nor any state securities commission has approved or disapproved of these securities or passed upon the accuracy or adequacy of this Prospectus. Any representation to the contrary is a criminal offense.
Table of Contents
|
3 |
|
|
4 |
|
|
10 |
|
|
15 |
|
|
22 |
|
|
30 |
|
|
38 |
|
|
45 |
|
|
50 |
|
|
58 |
|
|
66 |
|
|
73 |
|
|
79 |
|
|
84 |
|
|
92 |
|
|
99 |
|
|
107 |
|
|
115 |
|
|
120 |
|
|
125 |
|
|
130 |
|
|
135 |
|
|
140 |
|
|
145 |
|
|
152 |
|
|
160 |
|
|
168 |
|
|
176 |
|
|
183 |
|
|
190 |
|
|
197 |
|
|
204 |
|
|
211 |
|
|
219 |
|
|
227 |
|
|
235 |
|
243 |
|
|
251 |
|
|
256 |
|
|
262 |
|
|
267 |
|
|
275 |
|
|
282 |
|
|
290 |
|
|
297 |
|
|
306 |
|
|
314 |
|
|
323 |
|
|
331 |
|
|
340 |
|
|
349 |
|
|
356 |
|
|
363 |
|
|
372 |
|
|
380 |
|
|
390 |
|
|
399 |
|
|
408 |
|
|
417 |
|
|
425 |
|
|
433 |
|
|
441 |
|
|
449 |
|
|
456 |
|
|
463 |
|
|
489 |
|
|
490 |
|
|
493 |
|
|
494 |
|
|
498 |
|
|
509 |
4 :: Access Flex Bear High Yield ProFund :: TICKERS :: Investor Class AFBIX :: Service Class AFBSX
Wire Fee $10
|
| ||
|
|
Investor
Class |
Service
Class |
|
Investment Advisory Fees |
|
|
|
Distribution and Service (12b-1) Fees |
|
|
|
Other Expenses |
|
|
|
Total Annual Fund Operating Expenses
Before Fee Waivers and Expense
Reimbursements |
|
|
|
Fee Waivers/Reimbursements1 |
- |
- |
|
Total Annual Fund Operating Expenses
After Fee Waivers and Expense
Reimbursements |
|
|
1
|
|
1 Year |
3 Years |
5 Years |
10 Years |
|
Investor Class |
$ |
$ |
$ |
$ |
|
Service Class |
$ |
$ |
$ |
$ |
•Derivatives — The Fund invests in derivatives, which are financial instruments whose value is derived from the value of an underlying asset or assets, such as stocks, bonds, funds (including exchange-traded funds (“ETFs”)), currencies,
FUND NUMBERS :: Investor Class 111 :: Service Class 141 :: Access Flex Bear High Yield ProFund :: 5
interest rates or indexes. The Fund invests in derivatives as a substitute for directly shorting debt instruments in order to gain inverse exposure to the high yield market. These derivatives principally include:
The Fund seeks to maintain inverse exposure to the high yield market regardless of market conditions and without taking defensive positions in cash or other instruments in anticipation of periods favorable for the high yield market (which would generally be adverse market conditions for this Fund). There is no assurance that the Fund will achieve its investment objective.
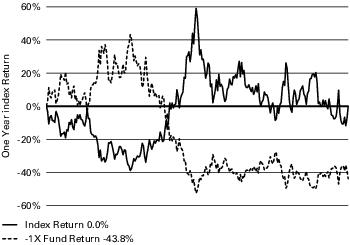
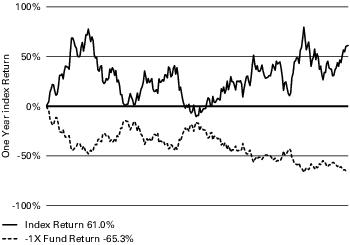
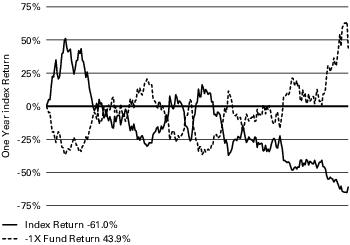
The Fund presents different risks than other types of funds in that it seeks inverse or “short” exposure. This means the Fund should generally lose value as the high yield market (i.e., U.S. corporate high yield debt market) is rallying (gaining value). Conversely, it should generally increase in value as the high yield market is falling (losing value). An investor in the Fund could potentially lose the full principal value of their investment.
6 :: Access Flex Bear High Yield ProFund :: TICKERS :: Investor Class AFBIX :: Service Class AFBSX
•Credit Default Swaps (CDS) Risk — The Fund will normally be a net buyer of credit protection on North American high yield debt issuers through index-based CDS. Upon the occurrence of a credit event, the counterparty to the Fund will have an obligation to pay the full notional value of a defaulted reference entity less recovery value. Recovery values for CDS are generally determined via an auction process to determine the final price for a given reference entity. Although the Fund intends, as practicable, to obtain initial exposure primarily through centrally cleared CDS, an active market may not exist for any of the CDS in which the Fund invests or in the reference entities subject to the CDS. As a result, the Fund’s ability to maximize returns or minimize losses on such CDS may be impaired. Other risks of CDS include difficulty in valuation due to the lack of pricing transparency and the risk that changes in the value of the CDS do not reflect changes in the credit quality of the underlying reference entities or may otherwise perform differently than expected given market conditions.
•Inverse Risk — Investors will lose money when the high yield market gains value — a result that is the opposite from traditional high yield mutual funds.
FUND NUMBERS :: Investor Class 111 :: Service Class 141 :: Access Flex Bear High Yield ProFund :: 7
8 :: Access Flex Bear High Yield ProFund :: TICKERS :: Investor Class AFBIX :: Service Class AFBSX
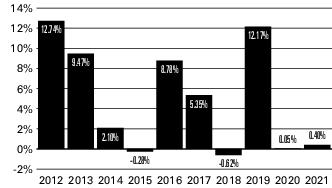
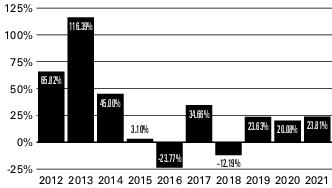
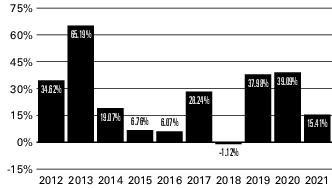
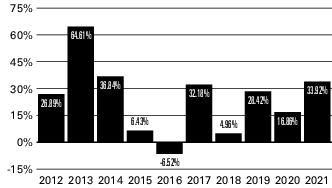
The Fund is the successor to the Access Flex Bear High Yield Fund, a series of Access One Trust (the “Predecessor Fund”), a mutual fund with identical investment objectives, policies, and restrictions, as a result of the reorganization of the Predecessor Fund into the Fund on April 23, 2021 (the “Reorganization Date”). The performance in the bar chart and table for the periods prior to the Reorganization Date is that of the Predecessor Fund.
|
|
|
|
|
|
|
|
|
|
|
|
|
|
|
|
|
|
|
|
One
Year |
Five
Years |
Ten
Years |
Inception
Date |
|
Investor Class Shares |
|
|
|
|
|
– Before Taxes |
- |
- |
- |
|
|
– After Taxes on Distributions |
- |
- |
- |
|
|
– After Taxes on Distributions
and Sale of Shares |
- |
- |
- |
|
|
Service Class Shares |
- |
- |
- |
|
|
Markit iBoxx $ Liquid High Yield
Index1 |
|
|
|
|
1
FUND NUMBERS :: Investor Class 111 :: Service Class 141 :: Access Flex Bear High Yield ProFund :: 9
Management
The Fund is advised by ProFund Advisors. Alexander Ilyasov, Senior Portfolio Manager, and James Linneman, Portfolio Manager, have jointly and primarily managed the Fund since April 2019 and March 2022, respectively.
Purchase and Sale of Fund Shares
The minimum initial investment amounts for all classes, which may be waived at the discretion of the Fund, are:
•$5,000 for accounts that list a financial professional.
•$15,000 for self-directed accounts.
You may purchase, redeem or exchange Fund shares on any day which the New York Stock Exchange is open for business. Depending on where your account is held, you may redeem your
shares by contacting your financial professional or the Fund by mail, telephone, wire transfer or on-line (www.profunds.com).
Tax Information
The Fund’s distributions generally are taxable, and will be taxed as ordinary income, qualified dividend income or capital gains, unless you are investing through a tax-advantaged arrangement, such as a 401(k) plan or an individual retirement account. You may be taxed later upon withdrawal of monies from such tax-advantaged arrangements. The Fund intends to distribute income, if any, and capital gains, if any, at least annually.
Payments to Broker-Dealers and Other Financial Intermediaries
If you purchase Fund shares through a financial intermediary, such as a broker-dealer or investment adviser, the Fund and its distributor may pay the intermediary for the sale of Fund shares and related services. These payments may create a conflict of interest by influencing the broker-dealer or other financial intermediary to recommend the Fund over another investment. Ask your financial intermediary or visit your financial intermediary’s website for more information.
10 :: Access Flex High Yield ProFund :: TICKERS :: Investor Class FYAIX :: Service Class FYASX
Wire Fee $10
|
| ||
|
|
Investor
Class |
Service
Class |
|
Investment Advisory Fees |
|
|
|
Distribution and Service (12b-1) Fees |
|
|
|
Other Expenses |
|
|
|
Recoupment1 |
|
|
|
Other Operating Expenses |
|
|
|
Total Annual Fund Operating Expenses2 |
|
|
1
2
|
|
1 Year |
3 Years |
5 Years |
10 Years |
|
Investor Class |
$ |
$ |
$ |
$ |
|
Service Class |
$ |
$ |
$ |
$ |
The Fund is actively managed and seeks to achieve returns that are not directly correlated to any particular fixed income index. The Fund invests primarily in financial instruments that ProFund Advisors believes, in combination, should provide investment results that correspond generally to the high yield market. The Fund uses the Markit iBoxx $ Liquid High Yield Index as a performance benchmark only, and does not seek to track its performance.
FUND NUMBERS :: Investor Class 110 :: Service Class 140 :: Access Flex High Yield ProFund :: 11
12 :: Access Flex High Yield ProFund :: TICKERS :: Investor Class FYAIX :: Service Class FYASX
FUND NUMBERS :: Investor Class 110 :: Service Class 140 :: Access Flex High Yield ProFund :: 13
14 :: Access Flex High Yield ProFund :: TICKERS :: Investor Class FYAIX :: Service Class FYASX
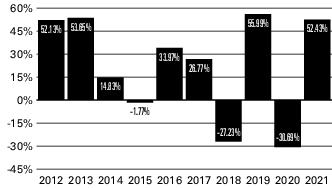
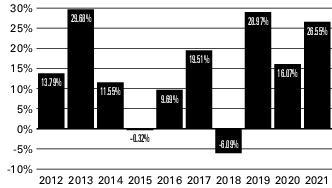
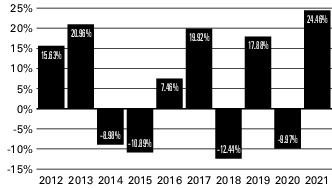
The Fund is the successor to the Access Flex High Yield Fund, a series of Access One Trust (the “Predecessor Fund”), a mutual fund with identical investment objectives, policies, and restrictions, as a result of the reorganization of the Predecessor Fund into the Fund on April 23, 2021 (the “Reorganization Date”). The performance in the bar chart and table for the periods prior to the Reorganization Date is that of the Predecessor Fund.
|
|
|
|
|
|
|
|
|
|
|
|
|
|
|
|
|
|
|
|
One
Year |
Five
Years |
Ten
Years |
Inception
Date |
|
Investor Class Shares |
|
|
|
|
|
– Before Taxes |
|
|
|
|
|
– After Taxes on Distributions |
- |
|
|
|
|
– After Taxes on Distributions
and Sale of Shares |
|
|
|
|
|
Service Class Shares |
- |
|
|
|
|
Markit iBoxx $ Liquid High Yield
Index1 |
|
|
|
|
1
Management
The Fund is advised by ProFund Advisors. Alexander Ilyasov, Senior Portfolio Manager, and James Linneman, Portfolio Manager, have jointly and primarily managed the Fund since April 2019 and March 2022, respectively.
Purchase and Sale of Fund Shares
The minimum initial investment amounts for all classes, which may be waived at the discretion of the Fund, are:
•$5,000 for accounts that list a financial professional.
•$15,000 for self-directed accounts.
You may purchase, redeem or exchange Fund shares on any day which the New York Stock Exchange is open for business. Depending on where your account is held, you may redeem your shares by contacting your financial professional or the Fund by mail, telephone, wire transfer or on-line (www.profunds.com).
Tax Information
The Fund’s distributions generally are taxable, and will be taxed as ordinary income, qualified dividend income or capital gains, unless you are investing through a tax-advantaged arrangement, such as a 401(k) plan or an individual retirement account. You may be taxed later upon withdrawal of monies from such tax-advantaged arrangements. The Fund intends to distribute income, if any, quarterly, and capital gains, if any, at least annually.
Payments to Broker-Dealers and Other Financial Intermediaries
If you purchase Fund shares through a financial intermediary, such as a broker-dealer or investment adviser, the Fund and its distributor may pay the intermediary for the sale of Fund shares and related services. These payments may create a conflict of interest by influencing the broker-dealer or other financial intermediary to recommend the Fund over another investment. Ask your financial intermediary or visit your financial intermediary’s website for more information.
FUND NUMBERS :: Investor Class 059 :: Service Class 089 :: Banks UltraSector ProFund :: 15
Wire Fee $10
|
| ||
|
|
Investor
Class |
Service
Class |
|
Investment Advisory Fees |
|
|
|
Distribution and Service (12b-1) Fees |
|
|
|
Other Expenses |
|
|
|
Total Annual Fund Operating Expenses1 |
|
|
1
|
|
1 Year |
3 Years |
5 Years |
10 Years |
|
Investor Class |
$ |
$ |
$ |
$ |
|
Service Class |
$ |
$ |
$ |
$ |
16 :: Banks UltraSector ProFund :: TICKERS :: Investor Class BKPIX :: Service Class BKPSX
FUND NUMBERS :: Investor Class 059 :: Service Class 089 :: Banks UltraSector ProFund :: 17
18 :: Banks UltraSector ProFund :: TICKERS :: Investor Class BKPIX :: Service Class BKPSX
|
| ||||||
|
|
| |||||
|
|
|
|
|
|
|
|
|
|
|
|
|
|
|
|
|
|
|
|
|
|
|
|
|
|
|
|
|
|
|
|
|
|
|
|
|
|
|
|
|
|
|
|
|
|
|
|
|
|
|
|
|
|
|
|
|
|
|
|
|
|
|
|
|
|
|
|
|
|
|
|
|
|
|
|
|
|
|
|
|
|
|
|
|
|
|
|
|
|
|
|
|
|
|
|
|
|
|
|
|
|
|
|
|
|
|
|
|
|
|
|
FUND NUMBERS :: Investor Class 059 :: Service Class 089 :: Banks UltraSector ProFund :: 19
20 :: Banks UltraSector ProFund :: TICKERS :: Investor Class BKPIX :: Service Class BKPSX
FUND NUMBERS :: Investor Class 059 :: Service Class 089 :: Banks UltraSector ProFund :: 21
|
|
|
|
|
|
|
|
|
|
|
|
|
|
|
|
|
|
|
|
One
Year |
Five
Years |
Ten
Years |
Inception
Date |
|
Investor Class Shares |
|
|
|
|
|
– Before Taxes |
|
|
|
|
|
– After Taxes on Distributions |
|
|
|
|
|
– After Taxes on Distributions
and Sale of Shares |
|
|
|
|
|
Service Class Shares |
|
|
|
|
|
S&P 500®1 |
|
|
|
|
|
Dow Jones U.S. BanksSM
Index1 |
|
|
|
|
1
Management
The Fund is advised by ProFund Advisors. Michael Neches, Senior Portfolio Manager, and Tarak Davé, Portfolio Manager, have jointly and primarily managed the Fund since October 2013 and April 2018, respectively.
Purchase and Sale of Fund Shares
The minimum initial investment amounts for all classes, which may be waived at the discretion of the Fund, are:
•$5,000 for accounts that list a financial professional.
•$15,000 for self-directed accounts.
You may purchase, redeem or exchange Fund shares on any day which the New York Stock Exchange is open for business. Depending on where your account is held, you may redeem your shares by contacting your financial professional or the Fund by mail, telephone, wire transfer or on-line (www.profunds.com).
Tax Information
The Fund’s distributions generally are taxable, and will be taxed as ordinary income, qualified dividend income or capital gains, unless you are investing through a tax-advantaged arrangement, such as a 401(k) plan or an individual retirement account. You may be taxed later upon withdrawal of monies from such tax-advantaged arrangements. The Fund intends to distribute income, if any, and capital gains, if any, at least annually.
Payments to Broker-Dealers and Other Financial Intermediaries
If you purchase Fund shares through a financial intermediary, such as a broker-dealer or investment adviser, the Fund and its distributor may pay the intermediary for the sale of Fund shares and related services. These payments may create a conflict of interest by influencing the broker-dealer or other financial intermediary to recommend the Fund over another investment. Ask your financial intermediary or visit your financial intermediary’s website for more information.
22 :: Basic Materials UltraSector ProFund :: TICKERS :: Investor Class BMPIX :: Service Class BMPSX
Wire Fee $10
|
| ||
|
|
Investor
Class |
Service
Class |
|
Investment Advisory Fees |
|
|
|
Distribution and Service (12b-1) Fees |
|
|
|
Other Expenses |
|
|
|
Recoupment1 |
|
|
|
Other Operating Expenses |
|
|
|
Total Annual Fund Operating Expenses
Before Fee Waivers and Expense
Reimbursements |
|
|
|
Fee Waivers/Reimbursements2 |
- |
- |
|
Total Annual Fund Operating Expenses
After Fee Waivers and Expense
Reimbursements |
|
|
1
2
FUND NUMBERS :: Investor Class 042 :: Service Class 072 :: Basic Materials UltraSector ProFund :: 23
|
|
1 Year |
3 Years |
5 Years |
10 Years |
|
Investor Class |
$ |
$ |
$ |
$ |
|
Service Class |
$ |
$ |
$ |
$ |
24 :: Basic Materials UltraSector ProFund :: TICKERS :: Investor Class BMPIX :: Service Class BMPSX
FUND NUMBERS :: Investor Class 042 :: Service Class 072 :: Basic Materials UltraSector ProFund :: 25
|
| ||||||
|
|
| |||||
|
|
|
|
|
|
|
|
|
|
|
|
|
|
|
|
|
|
|
|
|
|
|
|
|
|
|
|
|
|
|
|
|
|
|
|
|
|
|
|
|
|
|
|
|
|
|
|
|
|
|
|
|
|
|
|
|
|
|
|
|
|
|
|
|
|
|
|
|
|
|
|
|
|
|
|
|
|
|
|
|
|
|
|
|
|
|
|
|
|
|
|
|
|
|
|
|
|
|
|
|
|
|
|
|
|
|
|
|
|
|
|
26 :: Basic Materials UltraSector ProFund :: TICKERS :: Investor Class BMPIX :: Service Class BMPSX
FUND NUMBERS :: Investor Class 042 :: Service Class 072 :: Basic Materials UltraSector ProFund :: 27
28 :: Basic Materials UltraSector ProFund :: TICKERS :: Investor Class BMPIX :: Service Class BMPSX
|
|
|
|
|
|
|
|
|
|
|
|
|
|
|
|
|
|
|
|
One
Year |
Five
Years |
Ten
Years |
Inception
Date |
|
Investor Class Shares |
|
|
|
|
|
– Before Taxes |
|
|
|
|
|
– After Taxes on Distributions |
|
|
|
|
|
– After Taxes on Distributions
and Sale of Shares |
|
|
|
|
|
Service Class Shares |
|
|
|
|
|
S&P 500®1 |
|
|
|
|
|
Dow Jones U.S. Basic
MaterialsSM Index1 |
|
|
|
|
1
Management
The Fund is advised by ProFund Advisors. Michael Neches, Senior Portfolio Manager, and Tarak Davé, Portfolio Manager, have jointly and primarily managed the Fund since October 2013 and April 2018, respectively.
Purchase and Sale of Fund Shares
The minimum initial investment amounts for all classes, which may be waived at the discretion of the Fund, are:
•$5,000 for accounts that list a financial professional.
•$15,000 for self-directed accounts.
You may purchase, redeem or exchange Fund shares on any day which the New York Stock Exchange is open for business. Depending on where your account is held, you may redeem your shares by contacting your financial professional or the Fund by mail, telephone, wire transfer or on-line (www.profunds.com).
FUND NUMBERS :: Investor Class 042 :: Service Class 072 :: Basic Materials UltraSector ProFund :: 29
Tax Information
The Fund’s distributions generally are taxable, and will be taxed as ordinary income, qualified dividend income or capital gains, unless you are investing through a tax-advantaged arrangement, such as a 401(k) plan or an individual retirement account. You may be taxed later upon withdrawal of monies from such tax-advantaged arrangements. The Fund intends to distribute income, if any, and capital gains, if any, at least annually.
Payments to Broker-Dealers and Other Financial Intermediaries
If you purchase Fund shares through a financial intermediary, such as a broker-dealer or investment adviser, the Fund and its
distributor may pay the intermediary for the sale of Fund shares and related services. These payments may create a conflict of interest by influencing the broker-dealer or other financial intermediary to recommend the Fund over another investment. Ask your financial intermediary or visit your financial intermediary’s website for more information.
30 :: Bear ProFund :: TICKERS :: Investor Class BRPIX :: Service Class BRPSX
Wire Fee $10
|
| ||
|
|
Investor
Class |
Service
Class |
|
Investment Advisory Fees |
|
|
|
Distribution and Service (12b-1) Fees |
|
|
|
Other Expenses |
|
|
|
Total Annual Fund Operating Expenses1 |
|
|
1
FUND NUMBERS :: Investor Class 006 :: Service Class 026 :: Bear ProFund :: 31
|
|
1 Year |
3 Years |
5 Years |
10 Years |
|
Investor Class |
$ |
$ |
$ |
$ |
|
Service Class |
$ |
$ |
$ |
$ |
32 :: Bear ProFund :: TICKERS :: Investor Class BRPIX :: Service Class BRPSX
FUND NUMBERS :: Investor Class 006 :: Service Class 026 :: Bear ProFund :: 33
|
| ||||||
|
|
| |||||
|
|
|
|
|
|
|
|
|
|
|
|
|
|
|
|
|
|
|
|
|
|
|
|
|
|
|
|
|
|
|
|
|
|
|
|
|
|
|
|
|
|
|
|
|
|
|
|
|
|
|
|
|
|
|
|
|
|
|
|
|
|
|
|
|
|
|
|
|
|
|
|
|
|
|
|
|
|
|
|
|
|
|
|
|
|
|
|
|
|
|
|
|
|
|
|
|
|
|
|
|
|
|
|
|
|
|
|
|
|
|
|
34 :: Bear ProFund :: TICKERS :: Investor Class BRPIX :: Service Class BRPSX
FUND NUMBERS :: Investor Class 006 :: Service Class 026 :: Bear ProFund :: 35
36 :: Bear ProFund :: TICKERS :: Investor Class BRPIX :: Service Class BRPSX
|
|
|
|
|
|
|
|
|
|
|
|
|
|
|
|
|
|
|
|
One
Year |
Five
Years |
Ten
Years |
Inception
Date |
|
Investor Class Shares |
|
|
|
|
|
– Before Taxes |
- |
- |
- |
|
|
– After Taxes on
Distributions |
- |
- |
- |
|
|
– After Taxes on
Distributions and Sale of
Shares |
- |
- |
- |
|
|
Service Class Shares |
- |
- |
- |
|
|
S&P 500®1 |
|
|
|
|
1
Management
The Fund is advised by ProFund Advisors. Michael Neches, Senior Portfolio Manager, and Devin Sullivan, Portfolio Manager, have jointly and primarily managed the Fund since October 2013 and April 2018, respectively.
Purchase and Sale of Fund Shares
The minimum initial investment amounts for all classes, which may be waived at the discretion of the Fund, are:
•$5,000 for accounts that list a financial professional.
•$15,000 for self-directed accounts.
You may purchase, redeem or exchange Fund shares on any day which the New York Stock Exchange is open for business. Depending on where your account is held, you may redeem your shares by contacting your financial professional or the Fund by mail, telephone, wire transfer or on-line (www.profunds.com).
FUND NUMBERS :: Investor Class 006 :: Service Class 026 :: Bear ProFund :: 37
Tax Information
The Fund’s distributions generally are taxable, and will be taxed as ordinary income, qualified dividend income or capital gains, unless you are investing through a tax-advantaged arrangement, such as a 401(k) plan or an individual retirement account. You may be taxed later upon withdrawal of monies from such tax-advantaged arrangements. The Fund intends to distribute income, if any, and capital gains, if any, at least annually.
Payments to Broker-Dealers and Other Financial Intermediaries
If you purchase Fund shares through a financial intermediary, such as a broker-dealer or investment adviser, the Fund and its
distributor may pay the intermediary for the sale of Fund shares and related services. These payments may create a conflict of interest by influencing the broker-dealer or other financial intermediary to recommend the Fund over another investment. Ask your financial intermediary or visit your financial intermediary’s website for more information.
38 :: Biotechnology UltraSector ProFund :: TICKERS :: Investor Class BIPIX :: Service Class BIPSX
Wire Fee $10
|
| ||
|
|
Investor
Class |
Service
Class |
|
Investment Advisory Fees |
|
|
|
Distribution and Service (12b-1) Fees |
|
|
|
Other Expenses |
|
|
|
Total Annual Fund Operating Expenses1 |
|
|
1
|
|
1 Year |
3 Years |
5 Years |
10 Years |
|
Investor Class |
$ |
$ |
$ |
$ |
|
Service Class |
$ |
$ |
$ |
$ |
FUND NUMBERS :: Investor Class 043 :: Service Class 073 :: Biotechnology UltraSector ProFund :: 39
40 :: Biotechnology UltraSector ProFund :: TICKERS :: Investor Class BIPIX :: Service Class BIPSX
FUND NUMBERS :: Investor Class 043 :: Service Class 073 :: Biotechnology UltraSector ProFund :: 41
|
| ||||||
|
|
| |||||
|
|
|
|
|
|
|
|
|
|
|
|
|
|
|
|
|
|
|
|
|
|
|
|
|
|
|
|
|
|
|
|
|
|
|
|
|
|
|
|
|
|
|
|
|
|
|
|
|
|
|
|
|
|
|
|
|
|
|
|
|
|
|
|
|
|
|
|
|
|
|
|
|
|
|
|
|
|
|
|
|
|
|
|
|
|
|
|
|
|
|
|
|
|
|
|
|
|
|
|
|
|
|
|
|
|
|
|
|
|
|
|
42 :: Biotechnology UltraSector ProFund :: TICKERS :: Investor Class BIPIX :: Service Class BIPSX
FUND NUMBERS :: Investor Class 043 :: Service Class 073 :: Biotechnology UltraSector ProFund :: 43
44 :: Biotechnology UltraSector ProFund :: TICKERS :: Investor Class BIPIX :: Service Class BIPSX
|
|
|
|
|
|
|
|
|
|
|
|
|
|
|
|
|
|
|
|
One
Year |
Five
Years |
Ten
Years |
Inception
Date |
|
Investor Class Shares |
|
|
|
|
|
– Before Taxes |
|
|
|
|
|
– After Taxes on Distributions |
|
|
|
|
|
– After Taxes on Distributions
and Sale of Shares |
|
|
|
|
|
Service Class Shares |
|
|
|
|
|
S&P 500®1 |
|
|
|
|
|
Dow Jones
U.S. BiotechnologySM Index1 |
|
|
|
|
1
Management
The Fund is advised by ProFund Advisors. Michael Neches, Senior Portfolio Manager, and Tarak Davé, Portfolio Manager, have jointly and primarily managed the Fund since October 2013 and April 2018, respectively.
Purchase and Sale of Fund Shares
The minimum initial investment amounts for all classes, which may be waived at the discretion of the Fund, are:
•$5,000 for accounts that list a financial professional.
•$15,000 for self-directed accounts.
You may purchase, redeem or exchange Fund shares on any day which the New York Stock Exchange is open for business. Depending on where your account is held, you may redeem your shares by contacting your financial professional or the Fund by mail, telephone, wire transfer or on-line (www.profunds.com).
Tax Information
The Fund’s distributions generally are taxable, and will be taxed as ordinary income, qualified dividend income or capital gains, unless you are investing through a tax-advantaged arrangement, such as a 401(k) plan or an individual retirement account. You may be taxed later upon withdrawal of monies from such tax-advantaged arrangements. The Fund intends to distribute income, if any, and capital gains, if any, at least annually.
Payments to Broker-Dealers and Other Financial Intermediaries
If you purchase Fund shares through a financial intermediary, such as a broker-dealer or investment adviser, the Fund and its distributor may pay the intermediary for the sale of Fund shares and related services. These payments may create a conflict of interest by influencing the broker-dealer or other financial intermediary to recommend the Fund over another investment. Ask your financial intermediary or visit your financial intermediary’s website for more information.
FUND NUMBERS :: Investor Class 004 :: Service Class 024 :: Bull ProFund :: 45
Wire Fee $10
|
| ||
|
|
Investor
Class |
Service
Class |
|
Investment Advisory Fees |
|
|
|
Distribution and Service (12b-1) Fees |
|
|
|
Other Expenses |
|
|
|
Total Annual Fund Operating Expenses1 |
|
|
1
|
|
1 Year |
3 Years |
5 Years |
10 Years |
|
Investor Class |
$ |
$ |
$ |
$ |
|
Service Class |
$ |
$ |
$ |
$ |
46 :: Bull ProFund :: TICKERS :: Investor Class BLPIX :: Service Class BLPSX
FUND NUMBERS :: Investor Class 004 :: Service Class 024 :: Bull ProFund :: 47
48 :: Bull ProFund :: TICKERS :: Investor Class BLPIX :: Service Class BLPSX
FUND NUMBERS :: Investor Class 004 :: Service Class 024 :: Bull ProFund :: 49
|
|
|
|
|
|
|
|
|
|
|
|
|
|
|
|
|
|
|
|
One
Year |
Five
Years |
Ten
Years |
Inception
Date |
|
Investor Class Shares |
|
|
|
|
|
– Before Taxes |
|
|
|
|
|
– After Taxes on Distributions |
|
|
|
|
|
– After Taxes on Distributions
and Sale of Shares |
|
|
|
|
|
Service Class Shares |
|
|
|
|
|
S&P 500®1 |
|
|
|
|
1
Management
The Fund is advised by ProFund Advisors. Michael Neches, Senior Portfolio Manager, and Devin Sullivan, Portfolio Manager, have jointly and primarily managed the Fund since October 2013 and April 2018, respectively.
Purchase and Sale of Fund Shares
The minimum initial investment amounts for all classes, which may be waived at the discretion of the Fund, are:
•$5,000 for accounts that list a financial professional.
•$15,000 for self-directed accounts.
You may purchase, redeem or exchange Fund shares on any day which the New York Stock Exchange is open for business. Depending on where your account is held, you may redeem your shares by contacting your financial professional or the Fund by mail, telephone, wire transfer or on-line (www.profunds.com).
Tax Information
The Fund’s distributions generally are taxable, and will be taxed as ordinary income, qualified dividend income or capital gains, unless you are investing through a tax-advantaged arrangement, such as a 401(k) plan or an individual retirement account. You may be taxed later upon withdrawal of monies from such tax-advantaged arrangements. The Fund intends to distribute income, if any, and capital gains, if any, at least annually.
Payments to Broker-Dealers and Other Financial Intermediaries
If you purchase Fund shares through a financial intermediary, such as a broker-dealer or investment adviser, the Fund and its distributor may pay the intermediary for the sale of Fund shares and related services. These payments may create a conflict of interest by influencing the broker-dealer or other financial intermediary to recommend the Fund over another investment. Ask your financial intermediary or visit your financial intermediary’s website for more information.
50 :: Communication Services UltraSector ProFund :: TICKERS :: Investor Class WCPIX :: Service Class WCPSX
Wire Fee $10
|
| ||
|
|
Investor
Class |
Service
Class |
|
Investment Advisory Fees |
|
|
|
Distribution and Service (12b-1) Fees |
|
|
|
Other Expenses |
|
|
|
Recoupment1 |
|
|
|
Other Operating Expenses |
|
|
|
Total Annual Fund Operating Expenses
Before Fee Waivers and Expense
Reimbursements |
|
|
|
Fee Waivers/Reimbursements2 |
- |
- |
|
Total Annual Fund Operating Expenses
After Fee Waivers and Expense
Reimbursements |
|
|
1
2
FUND NUMBERS :: Investor Class 053 :: Service Class 083 :: Communication Services UltraSector ProFund :: 51
|
|
1 Year |
3 Years |
5 Years |
10 Years |
|
Investor Class |
$ |
$ |
$ |
$ |
|
Service Class |
$ |
$ |
$ |
$ |
52 :: Communication Services UltraSector ProFund :: TICKERS :: Investor Class WCPIX :: Service Class WCPSX
FUND NUMBERS :: Investor Class 053 :: Service Class 083 :: Communication Services UltraSector ProFund :: 53
|
| ||||||
|
|
| |||||
|
|
|
|
|
|
|
|
|
|
|
|
|
|
|
|
|
|
|
|
|
|
|
|
|
|
|
|
|
|
|
|
|
|
|
|
|
|
|
|
|
|
|
|
|
|
|
|
|
|
|
|
|
|
|
|
|
|
|
|
|
|
|
|
|
|
|
|
|
|
|
|
|
|
|
|
|
|
|
|
|
|
|
|
|
|
|
|
|
|
|
|
|
|
|
|
|
|
|
|
|
|
|
|
|
|
|
|
|
|
|
|
54 :: Communication Services UltraSector ProFund :: TICKERS :: Investor Class WCPIX :: Service Class WCPSX
FUND NUMBERS :: Investor Class 053 :: Service Class 083 :: Communication Services UltraSector ProFund :: 55
56 :: Communication Services UltraSector ProFund :: TICKERS :: Investor Class WCPIX :: Service Class WCPSX
|
|
|
|
|
|
|
|
|
|
|
|
|
|
|
|
|
|
|
|
One
Year |
Five
Years |
Ten
Years |
Inception
Date |
|
Investor Class Shares |
|
|
|
|
|
– Before Taxes |
|
|
|
|
|
– After Taxes on Distributions |
|
|
|
|
|
– After Taxes on Distributions
and Sale of Shares |
|
|
|
|
|
Service Class Shares |
|
|
|
|
|
S&P 500®1 |
|
|
|
|
|
S&P Communication Services
Select Sector® Index1 |
|
|
|
|
1
FUND NUMBERS :: Investor Class 053 :: Service Class 083 :: Communication Services UltraSector ProFund :: 57
Management
The Fund is advised by ProFund Advisors. Michael Neches, Senior Portfolio Manager, and Tarak Davé, Portfolio Manager, have jointly and primarily managed the Fund since October 2013 and April 2018, respectively.
Purchase and Sale of Fund Shares
The minimum initial investment amounts for all classes, which may be waived at the discretion of the Fund, are:
•$5,000 for accounts that list a financial professional.
•$15,000 for self-directed accounts.
You may purchase, redeem or exchange Fund shares on any day which the New York Stock Exchange is open for business. Depending on where your account is held, you may redeem your shares by contacting your financial professional or the Fund by mail, telephone, wire transfer or on-line (www.profunds.com).
Tax Information
The Fund’s distributions generally are taxable, and will be taxed as ordinary income, qualified dividend income or capital gains, unless you are investing through a tax-advantaged arrangement, such as a 401(k) plan or an individual retirement account. You may be taxed later upon withdrawal of monies from such tax-advantaged arrangements. The Fund intends to distribute income, if any, and capital gains, if any, at least annually.
Payments to Broker-Dealers and Other Financial Intermediaries
If you purchase Fund shares through a financial intermediary, such as a broker-dealer or investment adviser, the Fund and its distributor may pay the intermediary for the sale of Fund shares and related services. These payments may create a conflict of interest by influencing the broker-dealer or other financial intermediary to recommend the Fund over another investment. Ask your financial intermediary or visit your financial intermediary’s website for more information.
58 :: Consumer Goods UltraSector ProFund :: TICKERS :: Investor Class CNPIX :: Service Class CNPSX
Wire Fee $10
|
| ||
|
|
Investor
Class |
Service
Class |
|
Investment Advisory Fees |
|
|
|
Distribution and Service (12b-1) Fees |
|
|
|
Other Expenses |
|
|
|
Total Annual Fund Operating Expenses
Before Fee Waivers and Expense
Reimbursements |
|
|
|
Fee Waivers/Reimbursements1
|
- |
- |
|
Total Annual Fund Operating Expenses
After Fee Waivers and Expense
Reimbursements |
|
|
1
FUND NUMBERS :: Investor Class 044 :: Service Class 074 :: Consumer Goods UltraSector ProFund :: 59
|
|
1 Year |
3 Years |
5 Years |
10 Years |
|
Investor Class |
$ |
$ |
$ |
$ |
|
Service Class |
$ |
$ |
$ |
$ |
60 :: Consumer Goods UltraSector ProFund :: TICKERS :: Investor Class CNPIX :: Service Class CNPSX
FUND NUMBERS :: Investor Class 044 :: Service Class 074 :: Consumer Goods UltraSector ProFund :: 61
|
| ||||||
|
|
| |||||
|
|
|
|
|
|
|
|
|
|
|
|
|
|
|
|
|
|
|
|
|
|
|
|
|
|
|
|
|
|
|
|
|
|
|
|
|
|
|
|
|
|
|
|
|
|
|
|
|
|
|
|
|
|
|
|
|
|
|
|
|
|
|
|
|
|
|
|
|
|
|
|
|
|
|
|
|
|
|
|
|
|
|
|
|
|
|
|
|
|
|
|
|
|
|
|
|
|
|
|
|
|
|
|
|
|
|
|
|
|
|
|
62 :: Consumer Goods UltraSector ProFund :: TICKERS :: Investor Class CNPIX :: Service Class CNPSX
FUND NUMBERS :: Investor Class 044 :: Service Class 074 :: Consumer Goods UltraSector ProFund :: 63
64 :: Consumer Goods UltraSector ProFund :: TICKERS :: Investor Class CNPIX :: Service Class CNPSX
|
|
|
|
|
|
|
|
|
|
|
|
|
|
|
|
|
|
|
|
One
Year |
Five
Years |
Ten
Years |
Inception
Date |
|
Investor Class Shares |
|
|
|
|
|
– Before Taxes |
|
|
|
|
|
– After Taxes on Distributions |
|
|
|
|
|
– After Taxes on Distributions
and Sale of Shares |
|
|
|
|
|
Service Class Shares |
|
|
|
|
|
S&P 500®1 |
|
|
|
|
|
Dow Jones U.S. Consumer
GoodsSM Index1 |
|
|
|
|
1
Management
The Fund is advised by ProFund Advisors. Michael Neches, Senior Portfolio Manager, and Tarak Davé, Portfolio Manager, have jointly and primarily managed the Fund since October 2013 and April 2018, respectively.
FUND NUMBERS :: Investor Class 044 :: Service Class 074 :: Consumer Goods UltraSector ProFund :: 65
Purchase and Sale of Fund Shares
The minimum initial investment amounts for all classes, which may be waived at the discretion of the Fund, are:
•$5,000 for accounts that list a financial professional.
•$15,000 for self-directed accounts.
You may purchase, redeem or exchange Fund shares on any day which the New York Stock Exchange is open for business. Depending on where your account is held, you may redeem your shares by contacting your financial professional or the Fund by mail, telephone, wire transfer or on-line (www.profunds.com).
Tax Information
The Fund’s distributions generally are taxable, and will be taxed as ordinary income, qualified dividend income or capital gains, unless you are investing through a tax-advantaged arrangement,
such as a 401(k) plan or an individual retirement account. You may be taxed later upon withdrawal of monies from such tax-advantaged arrangements. The Fund intends to distribute income, if any, and capital gains, if any, at least annually.
Payments to Broker-Dealers and Other Financial Intermediaries
If you purchase Fund shares through a financial intermediary, such as a broker-dealer or investment adviser, the Fund and its distributor may pay the intermediary for the sale of Fund shares and related services. These payments may create a conflict of interest by influencing the broker-dealer or other financial intermediary to recommend the Fund over another investment. Ask your financial intermediary or visit your financial intermediary’s website for more information.
66 :: Consumer Services UltraSector ProFund :: TICKERS :: Investor Class CYPIX :: Service Class CYPSX
Wire Fee $10
|
| ||
|
|
Investor
Class |
Service
Class |
|
Investment Advisory Fees |
|
|
|
Distribution and Service (12b-1) Fees |
|
|
|
Other Expenses |
|
|
|
Total Annual Fund Operating Expenses1 |
|
|
1
|
|
1 Year |
3 Years |
5 Years |
10 Years |
|
Investor Class |
$ |
$ |
$ |
$ |
|
Service Class |
$ |
$ |
$ |
$ |
FUND NUMBERS :: Investor Class 051 :: Service Class 081 :: Consumer Services UltraSector ProFund :: 67
68 :: Consumer Services UltraSector ProFund :: TICKERS :: Investor Class CYPIX :: Service Class CYPSX
FUND NUMBERS :: Investor Class 051 :: Service Class 081 :: Consumer Services UltraSector ProFund :: 69
|
| ||||||
|
|
| |||||
|
|
|
|
|
|
|
|
|
|
|
|
|
|
|
|
|
|
|
|
|
|
|
|
|
|
|
|
|
|
|
|
|
|
|
|
|
|
|
|
|
|
|
|
|
|
|
|
|
|
|
|
|
|
|
|
|
|
|
|
|
|
|
|
|
|
|
|
|
|
|
|
|
|
|
|
|
|
|
|
|
|
|
|
|
|
|
|
|
|
|
|
|
|
|
|
|
|
|
|
|
|
|
|
|
|
|
|
|
|
|
|
70 :: Consumer Services UltraSector ProFund :: TICKERS :: Investor Class CYPIX :: Service Class CYPSX
FUND NUMBERS :: Investor Class 051 :: Service Class 081 :: Consumer Services UltraSector ProFund :: 71
72 :: Consumer Services UltraSector ProFund :: TICKERS :: Investor Class CYPIX :: Service Class CYPSX
|
|
|
|
|
|
|
|
|
|
|
|
|
|
|
|
|
|
|
|
One
Year |
Five
Years |
Ten
Years |
Inception
Date |
|
Investor Class Shares |
|
|
|
|
|
– Before Taxes |
|
|
|
|
|
– After Taxes on Distributions |
|
|
|
|
|
– After Taxes on Distributions
and Sale of Shares |
|
|
|
|
|
Service Class Shares |
|
|
|
|
|
S&P 500®1 |
|
|
|
|
|
Dow Jones U.S. Consumer
ServicesSM Index1 |
|
|
|
|
1
Management
The Fund is advised by ProFund Advisors. Michael Neches, Senior Portfolio Manager, and Tarak Davé, Portfolio Manager, have jointly and primarily managed the Fund since October 2013 and April 2018, respectively.
Purchase and Sale of Fund Shares
The minimum initial investment amounts for all classes, which may be waived at the discretion of the Fund, are:
•$5,000 for accounts that list a financial professional.
•$15,000 for self-directed accounts.
You may purchase, redeem or exchange Fund shares on any day which the New York Stock Exchange is open for business. Depending on where your account is held, you may redeem your shares by contacting your financial professional or the Fund by mail, telephone, wire transfer or on-line (www.profunds.com).
Tax Information
The Fund’s distributions generally are taxable, and will be taxed as ordinary income, qualified dividend income or capital gains, unless you are investing through a tax-advantaged arrangement, such as a 401(k) plan or an individual retirement account. You may be taxed later upon withdrawal of monies from such tax-advantaged arrangements. The Fund intends to distribute income, if any, and capital gains, if any, at least annually.
Payments to Broker-Dealers and Other Financial Intermediaries
If you purchase Fund shares through a financial intermediary, such as a broker-dealer or investment adviser, the Fund and its distributor may pay the intermediary for the sale of Fund shares and related services. These payments may create a conflict of interest by influencing the broker-dealer or other financial intermediary to recommend the Fund over another investment. Ask your financial intermediary or visit your financial intermediary’s website for more information.
FUND NUMBERS :: Investor Class 002 :: Service Class 022 :: Europe 30 ProFund :: 73
Wire Fee $10
|
| ||
|
|
Investor
Class |
Service
Class |
|
Investment Advisory Fees |
|
|
|
Distribution and Service (12b-1) Fees |
|
|
|
Other Expenses |
|
|
|
Total Annual Fund Operating Expenses
Before Fee Waivers and Expense
Reimbursements |
|
|
|
Fee Waivers/Reimbursements1 |
- |
- |
|
Total Annual Fund Operating Expenses
After Fee Waivers and Expense
Reimbursements |
|
|
1
|
|
1 Year |
3 Years |
5 Years |
10 Years |
|
Investor Class |
$ |
$ |
$ |
$ |
|
Service Class |
$ |
$ |
$ |
$ |
74 :: Europe 30 ProFund :: TICKERS :: Investor Class UEPIX :: Service Class UEPSX
FUND NUMBERS :: Investor Class 002 :: Service Class 022 :: Europe 30 ProFund :: 75
76 :: Europe 30 ProFund :: TICKERS :: Investor Class UEPIX :: Service Class UEPSX
FUND NUMBERS :: Investor Class 002 :: Service Class 022 :: Europe 30 ProFund :: 77
|
|
|
|
|
|
|
|
|
|
|
|
|
|
|
|
|
|
|
|
One
Year |
Five
Years |
Ten
Years |
Inception
Date |
|
Investor Class Shares |
|
|
|
|
|
– Before Taxes |
|
|
|
|
|
– After Taxes on Distributions |
|
|
|
|
|
– After Taxes on Distributions and
Sale of Shares |
|
|
|
|
|
Service Class Shares |
|
|
|
|
|
STOXX Europe 50® Index1 |
|
|
|
|
|
ProFunds Europe 30® Index2 |
|
|
|
|
1
2
Management
The Fund is advised by ProFund Advisors. Alexander Ilyasov, Senior Portfolio Manager, and Scott Hanson, Portfolio Manager, have jointly and primarily managed the Fund since August 2020 and August 2016, respectively.
Purchase and Sale of Fund Shares
The minimum initial investment amounts for all classes, which may be waived at the discretion of the Fund, are:
•$5,000 for accounts that list a financial professional.
•$15,000 for self-directed accounts.
You may purchase, redeem or exchange Fund shares on any day which the New York Stock Exchange is open for business. Depending on where your account is held, you may redeem your shares by contacting your financial professional or the Fund by mail, telephone, wire transfer or on-line (www.profunds.com).
78 :: Europe 30 ProFund :: TICKERS :: Investor Class UEPIX :: Service Class UEPSX
Tax Information
The Fund’s distributions generally are taxable, and will be taxed as ordinary income, qualified dividend income or capital gains, unless you are investing through a tax-advantaged arrangement, such as a 401(k) plan or an individual retirement account. You may be taxed later upon withdrawal of monies from such tax-advantaged arrangements. The Fund intends to distribute income, if any, and capital gains, if any, at least annually.
Payments to Broker-Dealers and Other Financial Intermediaries
If you purchase Fund shares through a financial intermediary, such as a broker-dealer or investment adviser, the Fund and its
distributor may pay the intermediary for the sale of Fund shares and related services. These payments may create a conflict of interest by influencing the broker-dealer or other financial intermediary to recommend the Fund over another investment. Ask your financial intermediary or visit your financial intermediary’s website for more information.
FUND NUMBERS :: Investor Class 113 :: Service Class 143 :: Falling U.S. Dollar ProFund :: 79
Wire Fee $10
|
| ||
|
|
Investor
Class |
Service
Class |
|
Investment Advisory Fees |
|
|
|
Distribution and Service (12b-1) Fees |
|
|
|
Other Expenses |
|
|
|
Total Annual Fund Operating Expenses
Before Fee Waivers and Expense
Reimbursements |
|
|
|
Fee Waivers/Reimbursements1 |
- |
- |
|
Total Annual Fund Operating Expenses
After Fee Waivers and Expense
Reimbursements |
|
|
1
|
|
1 Year |
3 Years |
5 Years |
10 Years |
|
Investor Class |
$ |
$ |
$ |
$ |
|
Service Class |
$ |
$ |
$ |
$ |
80 :: Falling U.S. Dollar ProFund :: TICKERS :: Investor Class FDPIX :: Service Class FDPSX
FUND NUMBERS :: Investor Class 113 :: Service Class 143 :: Falling U.S. Dollar ProFund :: 81
82 :: Falling U.S. Dollar ProFund :: TICKERS :: Investor Class FDPIX :: Service Class FDPSX
|
|
|
|
|
|
|
|
|
|
|
|
|
|
|
|
|
|
|
|
One
Year |
Five
Years |
Ten
Years |
Inception
Date |
|
Investor Class Shares |
|
|
|
|
|
– Before Taxes |
- |
- |
- |
|
|
– After Taxes on Distributions |
- |
- |
- |
|
|
– After Taxes on Distributions
and Sale of Shares |
- |
- |
- |
|
|
Service Class Shares |
- |
- |
- |
|
|
S&P 500®1 |
|
|
|
|
|
ICE® U.S. Dollar Index®2 |
|
- |
|
|
1
2
FUND NUMBERS :: Investor Class 113 :: Service Class 143 :: Falling U.S. Dollar ProFund :: 83
Management
The Fund is advised by ProFund Advisors. Alexander Ilyasov, Senior Portfolio Manager, and James Linneman, Portfolio Manager, have jointly and primarily managed the Fund since April 2019 and March 2022, respectively.
Purchase and Sale of Fund Shares
The minimum initial investment amounts for all classes, which may be waived at the discretion of the Fund, are:
•$5,000 for accounts that list a financial professional.
•$15,000 for self-directed accounts.
You may purchase, redeem or exchange Fund shares on any day which the New York Stock Exchange is open for business. Depending on where your account is held, you may redeem your shares by contacting your financial professional or the Fund by mail, telephone, wire transfer or on-line (www.profunds.com).
Tax Information
The Fund’s distributions generally are taxable, and will be taxed as ordinary income, qualified dividend income or capital gains, unless you are investing through a tax-advantaged arrangement, such as a 401(k) plan or an individual retirement account. You may be taxed later upon withdrawal of monies from such tax-advantaged arrangements. The Fund intends to distribute income, if any, and capital gains, if any, at least annually.
Payments to Broker-Dealers and Other Financial Intermediaries
If you purchase Fund shares through a financial intermediary, such as a broker-dealer or investment adviser, the Fund and its distributor may pay the intermediary for the sale of Fund shares and related services. These payments may create a conflict of interest by influencing the broker-dealer or other financial intermediary to recommend the Fund over another investment. Ask your financial intermediary or visit your financial intermediary’s website for more information.
84 :: Financials UltraSector ProFund :: TICKERS :: Investor Class FNPIX :: Service Class FNPSX
Wire Fee $10
|
| ||
|
|
Investor
Class |
Service
Class |
|
Investment Advisory Fees |
|
|
|
Distribution and Service (12b-1) Fees |
|
|
|
Other Expenses |
|
|
|
Total Annual Fund Operating Expenses1 |
|
|
1
|
|
1 Year |
3 Years |
5 Years |
10 Years |
|
Investor Class |
$ |
$ |
$ |
$ |
|
Service Class |
$ |
$ |
$ |
$ |
FUND NUMBERS :: Investor Class 048 :: Service Class 078 :: Financials UltraSector ProFund :: 85
86 :: Financials UltraSector ProFund :: TICKERS :: Investor Class FNPIX :: Service Class FNPSX
FUND NUMBERS :: Investor Class 048 :: Service Class 078 :: Financials UltraSector ProFund :: 87
|
| ||||||
|
|
| |||||
|
|
|
|
|
|
|
|
|
|
|
|
|
|
|
|
|
|
|
|
|
|
|
|
|
|
|
|
|
|
|
|
|
|
|
|
|
|
|
|
|
|
|
|
|
|
|
|
|
|
|
|
|
|
|
|
|
|
|
|
|
|
|
|
|
|
|
|
|
|
|
|
|
|
|
|
|
|
|
|
|
|
|
|
|
|
|
|
|
|
|
|
|
|
|
|
|
|
|
|
|
|
|
|
|
|
|
|
|
|
|
|
88 :: Financials UltraSector ProFund :: TICKERS :: Investor Class FNPIX :: Service Class FNPSX
FUND NUMBERS :: Investor Class 048 :: Service Class 078 :: Financials UltraSector ProFund :: 89
90 :: Financials UltraSector ProFund :: TICKERS :: Investor Class FNPIX :: Service Class FNPSX
|
|
|
|
|
|
|
|
|
|
|
|
|
|
|
|
|
|
|
|
One
Year |
Five
Years |
Ten
Years |
Inception
Date |
|
Investor Class Shares |
|
|
|
|
|
– Before Taxes |
|
|
|
|
|
– After Taxes on Distributions |
|
|
|
|
|
– After Taxes on Distributions
and Sale of Shares |
|
|
|
|
|
Service Class Shares |
|
|
|
|
|
S&P 500®1 |
|
|
|
|
|
Dow Jones U.S. FinancialsSM
Index1 |
|
|
|
|
1
FUND NUMBERS :: Investor Class 048 :: Service Class 078 :: Financials UltraSector ProFund :: 91
Management
The Fund is advised by ProFund Advisors. Michael Neches, Senior Portfolio Manager, and Tarak Davé, Portfolio Manager, have jointly and primarily managed the Fund since October 2013 and April 2018, respectively.
Purchase and Sale of Fund Shares
The minimum initial investment amounts for all classes, which may be waived at the discretion of the Fund, are:
•$5,000 for accounts that list a financial professional.
•$15,000 for self-directed accounts.
You may purchase, redeem or exchange Fund shares on any day which the New York Stock Exchange is open for business.
Depending on where your account is held, you may redeem your shares by contacting your financial professional or the Fund by mail, telephone, wire transfer or on-line (www.profunds.com).
Tax Information
The Fund’s distributions generally are taxable, and will be taxed as ordinary income, qualified dividend income or capital gains, unless you are investing through a tax-advantaged arrangement, such as a 401(k) plan or an individual retirement account. You may be taxed later upon withdrawal of monies from such tax-advantaged arrangements. The Fund intends to distribute income, if any, and capital gains, if any, at least annually.
Payments to Broker-Dealers and Other Financial Intermediaries
If you purchase Fund shares through a financial intermediary, such as a broker-dealer or investment adviser, the Fund and its distributor may pay the intermediary for the sale of Fund shares and related services. These payments may create a conflict of interest by influencing the broker-dealer or other financial intermediary to recommend the Fund over another investment. Ask your financial intermediary or visit your financial intermediary’s website for more information.
92 :: Health Care UltraSector ProFund :: TICKERS :: Investor Class HCPIX :: Service Class HCPSX
Wire Fee $10
|
| ||
|
|
Investor
Class |
Service
Class |
|
Investment Advisory Fees |
|
|
|
Distribution and Service (12b-1) Fees |
|
|
|
Other Expenses |
|
|
|
Total Annual Fund Operating Expenses1 |
|
|
1
|
|
1 Year |
3 Years |
5 Years |
10 Years |
|
Investor Class |
$ |
$ |
$ |
$ |
|
Service Class |
$ |
$ |
$ |
$ |
FUND NUMBERS :: Investor Class 049 :: Service Class 079 :: Health Care UltraSector ProFund :: 93
94 :: Health Care UltraSector ProFund :: TICKERS :: Investor Class HCPIX :: Service Class HCPSX
FUND NUMBERS :: Investor Class 049 :: Service Class 079 :: Health Care UltraSector ProFund :: 95
|
| ||||||
|
|
| |||||
|
|
|
|
|
|
|
|
|
|
|
|
|
|
|
|
|
|
|
|
|
|
|
|
|
|
|
|
|
|
|
|
|
|
|
|
|
|
|
|
|
|
|
|
|
|
|
|
|
|
|
|
|
|
|
|
|
|
|
|
|
|
|
|
|
|
|
|
|
|
|
|
|
|
|
|
|
|
|
|
|
|
|
|
|
|
|
|
|
|
|
|
|
|
|
|
|
|
|
|
|
|
|
|
|
|
|
|
|
|
|
|
96 :: Health Care UltraSector ProFund :: TICKERS :: Investor Class HCPIX :: Service Class HCPSX
FUND NUMBERS :: Investor Class 049 :: Service Class 079 :: Health Care UltraSector ProFund :: 97
98 :: Health Care UltraSector ProFund :: TICKERS :: Investor Class HCPIX :: Service Class HCPSX
|
|
|
|
|
|
|
|
|
|
|
|
|
|
|
|
|
|
|
|
One
Year |
Five
Years |
Ten
Years |
Inception
Date |
|
Investor Class Shares |
|
|
|
|
|
– Before Taxes |
|
|
|
|
|
– After Taxes on Distributions |
|
|
|
|
|
– After Taxes on Distributions
and Sale of Shares |
|
|
|
|
|
Service Class Shares |
|
|
|
|
|
S&P 500®1 |
|
|
|
|
|
Dow Jones U.S. Health CareSM
Index1 |
|
|
|
|
1
Management
The Fund is advised by ProFund Advisors. Michael Neches, Senior Portfolio Manager, and Tarak Davé, Portfolio Manager, have jointly and primarily managed the Fund since October 2013 and April 2018, respectively.
Purchase and Sale of Fund Shares
The minimum initial investment amounts for all classes, which may be waived at the discretion of the Fund, are:
•$5,000 for accounts that list a financial professional.
•$15,000 for self-directed accounts.
You may purchase, redeem or exchange Fund shares on any day which the New York Stock Exchange is open for business. Depending on where your account is held, you may redeem your shares by contacting your financial professional or the Fund by mail, telephone, wire transfer or on-line (www.profunds.com).
Tax Information
The Fund’s distributions generally are taxable, and will be taxed as ordinary income, qualified dividend income or capital gains, unless you are investing through a tax-advantaged arrangement, such as a 401(k) plan or an individual retirement account. You may be taxed later upon withdrawal of monies from such tax-advantaged arrangements. The Fund intends to distribute income, if any, and capital gains, if any, at least annually.
Payments to Broker-Dealers and Other Financial Intermediaries
If you purchase Fund shares through a financial intermediary, such as a broker-dealer or investment adviser, the Fund and its distributor may pay the intermediary for the sale of Fund shares and related services. These payments may create a conflict of interest by influencing the broker-dealer or other financial intermediary to recommend the Fund over another investment. Ask your financial intermediary or visit your financial intermediary’s website for more information.
FUND NUMBERS :: Investor Class 056 :: Service Class 086 :: Industrials UltraSector ProFund :: 99
Wire Fee $10
|
| ||
|
|
Investor
Class |
Service
Class |
|
Investment Advisory Fees |
|
|
|
Distribution and Service (12b-1) Fees |
|
|
|
Other Expenses |
|
|
|
Recoupment1 |
|
|
|
Other Operating Expenses |
|
|
|
Total Annual Fund Operating Expenses
Before Fee Waivers and Expense
Reimbursements |
|
|
|
Fee Waivers/Reimbursements2 |
- |
- |
|
Total Annual Fund Operating Expenses
After Fee Waivers and Expense
Reimbursements |
|
|
1
2
100 :: Industrials UltraSector ProFund :: TICKERS :: Investor Class IDPIX :: Service Class IDPSX
|
|
1 Year |
3 Years |
5 Years |
10 Years |
|
Investor Class |
$ |
$ |
$ |
$ |
|
Service Class |
$ |
$ |
$ |
$ |
FUND NUMBERS :: Investor Class 056 :: Service Class 086 :: Industrials UltraSector ProFund :: 101
102 :: Industrials UltraSector ProFund :: TICKERS :: Investor Class IDPIX :: Service Class IDPSX
|
| ||||||
|
|
| |||||
|
|
|
|
|
|
|
|
|
|
|
|
|
|
|
|
|
|
|
|
|
|
|
|
|
|
|
|
|
|
|
|
|
|
|
|
|
|
|
|
|
|
|
|
|
|
|
|
|
|
|
|
|
|
|
|
|
|
|
|
|
|
|
|
|
|
|
|
|
|
|
|
|
|
|
|
|
|
|
|
|
|
|
|
|
|
|
|
|
|
|
|
|
|
|
|
|
|
|
|
|
|
|
|
|
|
|
|
|
|
|
|
FUND NUMBERS :: Investor Class 056 :: Service Class 086 :: Industrials UltraSector ProFund :: 103
104 :: Industrials UltraSector ProFund :: TICKERS :: Investor Class IDPIX :: Service Class IDPSX
FUND NUMBERS :: Investor Class 056 :: Service Class 086 :: Industrials UltraSector ProFund :: 105
106 :: Industrials UltraSector ProFund :: TICKERS :: Investor Class IDPIX :: Service Class IDPSX
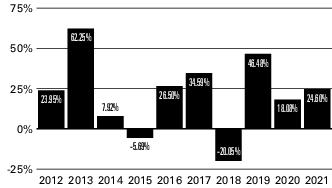
|
|
|
|
|
|
|
|
|
|
|
|
|
|
|
|
|
|
|
|
One
Year |
Five
Years |
Ten
Years |
Inception
Date |
|
Investor Class Shares |
|
|
|
|
|
– Before Taxes |
|
|
|
|
|
– After Taxes on Distributions |
|
|
|
|
|
– After Taxes on Distributions
and Sale of Shares |
|
|
|
|
|
Service Class Shares |
|
|
|
|
|
S&P 500®1 |
|
|
|
|
|
Dow Jones U.S. IndustrialsSM
Index1 |
|
|
|
|
1
Management
The Fund is advised by ProFund Advisors. Michael Neches, Senior Portfolio Manager, and Tarak Davé, Portfolio Manager, have jointly and primarily managed the Fund since October 2013 and April 2018, respectively.
Purchase and Sale of Fund Shares
The minimum initial investment amounts for all classes, which may be waived at the discretion of the Fund, are:
•$5,000 for accounts that list a financial professional.
•$15,000 for self-directed accounts.
You may purchase, redeem or exchange Fund shares on any day which the New York Stock Exchange is open for business. Depending on where your account is held, you may redeem your shares by contacting your financial professional or the Fund by mail, telephone, wire transfer or on-line (www.profunds.com).
Tax Information
The Fund’s distributions generally are taxable, and will be taxed as ordinary income, qualified dividend income or capital gains, unless you are investing through a tax-advantaged arrangement, such as a 401(k) plan or an individual retirement account. You may be taxed later upon withdrawal of monies from such tax-advantaged arrangements. The Fund intends to distribute income, if any, and capital gains, if any, at least annually.
Payments to Broker-Dealers and Other Financial Intermediaries
If you purchase Fund shares through a financial intermediary, such as a broker-dealer or investment adviser, the Fund and its distributor may pay the intermediary for the sale of Fund shares and related services. These payments may create a conflict of interest by influencing the broker-dealer or other financial intermediary to recommend the Fund over another investment. Ask your financial intermediary or visit your financial intermediary’s website for more information.
FUND NUMBERS :: Investor Class 050 :: Service Class 080 :: Internet UltraSector ProFund :: 107
Wire Fee $10
|
| ||
|
|
Investor
Class |
Service
Class |
|
Investment Advisory Fees |
|
|
|
Distribution and Service (12b-1) Fees |
|
|
|
Other Expenses |
|
|
|
Total Annual Fund Operating Expenses1 |
|
|
1
|
|
1 Year |
3 Years |
5 Years |
10 Years |
|
Investor Class |
$ |
$ |
$ |
$ |
|
Service Class |
$ |
$ |
$ |
$ |
108 :: Internet UltraSector ProFund :: TICKERS :: Investor Class INPIX :: Service Class INPSX
FUND NUMBERS :: Investor Class 050 :: Service Class 080 :: Internet UltraSector ProFund :: 109
110 :: Internet UltraSector ProFund :: TICKERS :: Investor Class INPIX :: Service Class INPSX
|
| ||||||
|
|
| |||||
|
|
|
|
|
|
|
|
|
|
|
|
|
|
|
|
|
|
|
|
|
|
|
|
|
|
|
|
|
|
|
|
|
|
|
|
|
|
|
|
|
|
|
|
|
|
|
|
|
|
|
|
|
|
|
|
|
|
|
|
|
|
|
|
|
|
|
|
|
|
|
|
|
|
|
|
|
|
|
|
|
|
|
|
|
|
|
|
|
|
|
|
|
|
|
|
|
|
|
|
|
|
|
|
|
|
|
|
|
|
|
|
FUND NUMBERS :: Investor Class 050 :: Service Class 080 :: Internet UltraSector ProFund :: 111
112 :: Internet UltraSector ProFund :: TICKERS :: Investor Class INPIX :: Service Class INPSX
FUND NUMBERS :: Investor Class 050 :: Service Class 080 :: Internet UltraSector ProFund :: 113
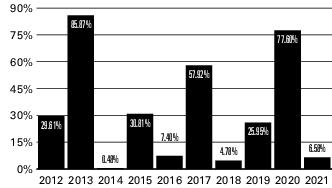
|
|
|
|
|
|
|
|
|
|
|
|
|
|
|
|
|
|
|
|
One
Year |
Five
Years |
Ten
Years |
Inception
Date |
|
Investor Class Shares |
|
|
|
|
|
– Before Taxes |
|
|
|
|
|
– After Taxes on Distributions |
|
|
|
|
|
– After Taxes on Distributions
and Sale of Shares |
|
|
|
|
|
Service Class Shares |
|
|
|
|
|
S&P 500®1 |
|
|
|
|
|
Dow Jones Internet
CompositeSM Index1 |
|
|
|
|
1
114 :: Internet UltraSector ProFund :: TICKERS :: Investor Class INPIX :: Service Class INPSX
Management
The Fund is advised by ProFund Advisors. Michael Neches, Senior Portfolio Manager, and Tarak Davé, Portfolio Manager, have jointly and primarily managed the Fund since October 2013 and April 2018, respectively.
Purchase and Sale of Fund Shares
The minimum initial investment amounts for all classes, which may be waived at the discretion of the Fund, are:
•$5,000 for accounts that list a financial professional.
•$15,000 for self-directed accounts.
You may purchase, redeem or exchange Fund shares on any day which the New York Stock Exchange is open for business.
Depending on where your account is held, you may redeem your shares by contacting your financial professional or the Fund by mail, telephone, wire transfer or on-line (www.profunds.com).
Tax Information
The Fund’s distributions generally are taxable, and will be taxed as ordinary income, qualified dividend income or capital gains, unless you are investing through a tax-advantaged arrangement, such as a 401(k) plan or an individual retirement account. You may be taxed later upon withdrawal of monies from such tax-advantaged arrangements. The Fund intends to distribute income, if any, and capital gains, if any, at least annually.
Payments to Broker-Dealers and Other Financial Intermediaries
If you purchase Fund shares through a financial intermediary, such as a broker-dealer or investment adviser, the Fund and its distributor may pay the intermediary for the sale of Fund shares and related services. These payments may create a conflict of interest by influencing the broker-dealer or other financial intermediary to recommend the Fund over another investment. Ask your financial intermediary or visit your financial intermediary’s website for more information.
FUND NUMBERS :: Investor Class 069 :: Service Class 099 :: Large-Cap Growth ProFund :: 115
Wire Fee $10
|
| ||
|
|
Investor
Class |
Service
Class |
|
Investment Advisory Fees |
|
|
|
Distribution and Service (12b-1) Fees |
|
|
|
Other Expenses |
|
|
|
Total Annual Fund Operating Expenses1 |
|
|
1
|
|
1 Year |
3 Years |
5 Years |
10 Years |
|
Investor Class |
$ |
$ |
$ |
$ |
|
Service Class |
$ |
$ |
$ |
$ |
116 :: Large-Cap Growth ProFund :: TICKERS :: Investor Class LGPIX :: Service Class LGPSX
FUND NUMBERS :: Investor Class 069 :: Service Class 099 :: Large-Cap Growth ProFund :: 117
118 :: Large-Cap Growth ProFund :: TICKERS :: Investor Class LGPIX :: Service Class LGPSX
FUND NUMBERS :: Investor Class 069 :: Service Class 099 :: Large-Cap Growth ProFund :: 119
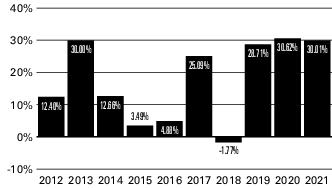
|
|
|
|
|
|
|
|
|
|
|
|
|
|
|
|
|
|
|
|
One
Year |
Five
Years |
Ten
Years |
Inception
Date |
|
Investor Class Shares |
|
|
|
|
|
– Before Taxes |
|
|
|
|
|
– After Taxes on Distributions |
|
|
|
|
|
– After Taxes on Distributions
and Sale of Shares |
|
|
|
|
|
Service Class Shares |
|
|
|
|
|
S&P 500® Growth Index1 |
|
|
|
|
1
Management
The Fund is advised by ProFund Advisors. Michael Neches, Senior Portfolio Manager, and Devin Sullivan, Portfolio Manager, have jointly and primarily managed the Fund since October 2013 and April 2018, respectively.
Purchase and Sale of Fund Shares
The minimum initial investment amounts for all classes, which may be waived at the discretion of the Fund, are:
•$5,000 for accounts that list a financial professional.
•$15,000 for self-directed accounts.
You may purchase, redeem or exchange Fund shares on any day which the New York Stock Exchange is open for business. Depending on where your account is held, you may redeem your shares by contacting your financial professional or the Fund by mail, telephone, wire transfer or on-line (www.profunds.com).
Tax Information
The Fund’s distributions generally are taxable, and will be taxed as ordinary income, qualified dividend income or capital gains, unless you are investing through a tax-advantaged arrangement, such as a 401(k) plan or an individual retirement account. You may be taxed later upon withdrawal of monies from such tax-advantaged arrangements. The Fund intends to distribute income, if any, and capital gains, if any, at least annually.
Payments to Broker-Dealers and Other Financial Intermediaries
If you purchase Fund shares through a financial intermediary, such as a broker-dealer or investment adviser, the Fund and its distributor may pay the intermediary for the sale of Fund shares and related services. These payments may create a conflict of interest by influencing the broker-dealer or other financial intermediary to recommend the Fund over another investment. Ask your financial intermediary or visit your financial intermediary’s website for more information.
120 :: Large-Cap Value ProFund :: TICKERS :: Investor Class LVPIX :: Service Class LVPSX
Wire Fee $10
|
| ||
|
|
Investor
Class |
Service
Class |
|
Investment Advisory Fees |
|
|
|
Distribution and Service (12b-1) Fees |
|
|
|
Other Expenses |
|
|
|
Total Annual Fund Operating Expenses1 |
|
|
1
|
|
1 Year |
3 Years |
5 Years |
10 Years |
|
Investor Class |
$ |
$ |
$ |
$ |
|
Service Class |
$ |
$ |
$ |
$ |
FUND NUMBERS :: Investor Class 068 :: Service Class 098 :: Large-Cap Value ProFund :: 121
122 :: Large-Cap Value ProFund :: TICKERS :: Investor Class LVPIX :: Service Class LVPSX
FUND NUMBERS :: Investor Class 068 :: Service Class 098 :: Large-Cap Value ProFund :: 123
124 :: Large-Cap Value ProFund :: TICKERS :: Investor Class LVPIX :: Service Class LVPSX
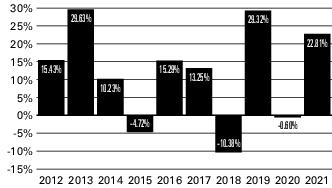
|
|
|
|
|
|
|
|
|
|
|
|
|
|
|
|
|
|
|
|
One
Year |
Five
Years |
Ten
Years |
Inception
Date |
|
Investor Class Shares |
|
|
|
|
|
– Before Taxes |
|
|
|
|
|
– After Taxes on Distributions |
|
|
|
|
|
– After Taxes on Distributions
and Sale of Shares |
|
|
|
|
|
Service Class Shares |
|
|
|
|
|
S&P 500® Value Index1 |
|
|
|
|
1
Management
The Fund is advised by ProFund Advisors. Michael Neches, Senior Portfolio Manager, and Devin Sullivan, Portfolio Manager, have jointly and primarily managed the Fund since October 2013 and April 2018, respectively.
Purchase and Sale of Fund Shares
The minimum initial investment amounts for all classes, which may be waived at the discretion of the Fund, are:
•$5,000 for accounts that list a financial professional.
•$15,000 for self-directed accounts.
You may purchase, redeem or exchange Fund shares on any day which the New York Stock Exchange is open for business. Depending on where your account is held, you may redeem your shares by contacting your financial professional or the Fund by mail, telephone, wire transfer or on-line (www.profunds.com).
Tax Information
The Fund’s distributions generally are taxable, and will be taxed as ordinary income, qualified dividend income or capital gains, unless you are investing through a tax-advantaged arrangement, such as a 401(k) plan or an individual retirement account. You may be taxed later upon withdrawal of monies from such tax-advantaged arrangements. The Fund intends to distribute income, if any, and capital gains, if any, at least annually.
Payments to Broker-Dealers and Other Financial Intermediaries
If you purchase Fund shares through a financial intermediary, such as a broker-dealer or investment adviser, the Fund and its distributor may pay the intermediary for the sale of Fund shares and related services. These payments may create a conflict of interest by influencing the broker-dealer or other financial intermediary to recommend the Fund over another investment. Ask your financial intermediary or visit your financial intermediary’s website for more information.
FUND NUMBERS :: Investor Class 018 :: Service Class 038 :: Mid-Cap Growth ProFund :: 125
Wire Fee $10
|
| ||
|
|
Investor
Class |
Service
Class |
|
Investment Advisory Fees |
|
|
|
Distribution and Service (12b-1) Fees |
|
|
|
Other Expenses |
|
|
|
Total Annual Fund Operating Expenses
Before Fee Waivers and Expense
Reimbursements |
|
|
|
Fee Waivers/Reimbursements1 |
- |
- |
|
Total Annual Fund Operating Expenses
After Fee Waivers and Expense
Reimbursements |
|
|
1
|
|
1 Year |
3 Years |
5 Years |
10 Years |
|
Investor Class |
$ |
$ |
$ |
$ |
|
Service Class |
$ |
$ |
$ |
$ |
126 :: Mid-Cap Growth ProFund :: TICKERS :: Investor Class MGPIX :: Service Class MGPSX
FUND NUMBERS :: Investor Class 018 :: Service Class 038 :: Mid-Cap Growth ProFund :: 127
128 :: Mid-Cap Growth ProFund :: TICKERS :: Investor Class MGPIX :: Service Class MGPSX
FUND NUMBERS :: Investor Class 018 :: Service Class 038 :: Mid-Cap Growth ProFund :: 129
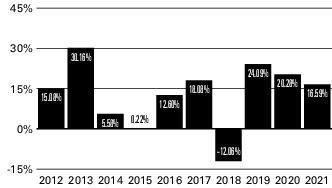
|
|
|
|
|
|
|
|
|
|
|
|
|
|
|
|
|
|
|
|
One
Year |
Five
Years |
Ten
Years |
Inception
Date |
|
Investor Class Shares |
|
|
|
|
|
– Before Taxes |
|
|
|
|
|
– After Taxes on Distributions |
|
|
|
|
|
– After Taxes on Distributions
and Sale of Shares |
|
|
|
|
|
Service Class Shares |
|
|
|
|
|
S&P MidCap 400® Growth
Index1 |
|
|
|
|
1
Management
The Fund is advised by ProFund Advisors. Michael Neches, Senior Portfolio Manager, and Devin Sullivan, Portfolio Manager, have jointly and primarily managed the Fund since October 2013 and April 2018, respectively.
Purchase and Sale of Fund Shares
The minimum initial investment amounts for all classes, which may be waived at the discretion of the Fund, are:
•$5,000 for accounts that list a financial professional.
•$15,000 for self-directed accounts.
You may purchase, redeem or exchange Fund shares on any day which the New York Stock Exchange is open for business. Depending on where your account is held, you may redeem your shares by contacting your financial professional or the Fund by mail, telephone, wire transfer or on-line (www.profunds.com).
Tax Information
The Fund’s distributions generally are taxable, and will be taxed as ordinary income, qualified dividend income or capital gains, unless you are investing through a tax-advantaged arrangement, such as a 401(k) plan or an individual retirement account. You may be taxed later upon withdrawal of monies from such tax-advantaged arrangements. The Fund intends to distribute income, if any, and capital gains, if any, at least annually.
Payments to Broker-Dealers and Other Financial Intermediaries
If you purchase Fund shares through a financial intermediary, such as a broker-dealer or investment adviser, the Fund and its distributor may pay the intermediary for the sale of Fund shares and related services. These payments may create a conflict of interest by influencing the broker-dealer or other financial intermediary to recommend the Fund over another investment. Ask your financial intermediary or visit your financial intermediary’s website for more information.
130 :: Mid-Cap ProFund :: TICKERS :: Investor Class MDPIX :: Service Class MDPSX
Wire Fee $10
|
| ||
|
|
Investor
Class |
Service
Class |
|
Investment Advisory Fees |
|
|
|
Distribution and Service (12b-1) Fees |
|
|
|
Other Expenses |
|
|
|
Total Annual Fund Operating Expenses
Before Fee Waivers and Expense
Reimbursements |
|
|
|
Fee Waivers/Reimbursements1 |
- |
- |
|
Total Annual Fund Operating Expenses
After Fee Waivers and Expense
Reimbursements |
|
|
1
|
|
1 Year |
3 Years |
5 Years |
10 Years |
|
Investor Class |
$ |
$ |
$ |
$ |
|
Service Class |
$ |
$ |
$ |
$ |
FUND NUMBERS :: Investor Class 016 :: Service Class 036 :: Mid-Cap ProFund :: 131
132 :: Mid-Cap ProFund :: TICKERS :: Investor Class MDPIX :: Service Class MDPSX
FUND NUMBERS :: Investor Class 016 :: Service Class 036 :: Mid-Cap ProFund :: 133
134 :: Mid-Cap ProFund :: TICKERS :: Investor Class MDPIX :: Service Class MDPSX
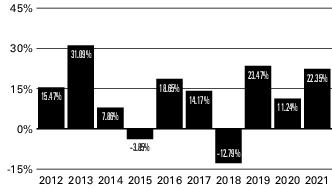
|
|
|
|
|
|
|
|
|
|
|
|
|
|
|
|
|
|
|
|
One
Year |
Five
Years |
Ten
Years |
Inception
Date |
|
Investor Class Shares |
|
|
|
|
|
– Before Taxes |
|
|
|
|
|
– After Taxes on Distributions |
|
|
|
|
|
– After Taxes on Distributions
and Sale of Shares |
|
|
|
|
|
Service Class Shares |
|
|
|
|
|
S&P MidCap 400®1 |
|
|
|
|
1
Management
The Fund is advised by ProFund Advisors. Michael Neches, Senior Portfolio Manager, and Devin Sullivan, Portfolio Manager, have jointly and primarily managed the Fund since October 2013 and April 2018, respectively.
Purchase and Sale of Fund Shares
The minimum initial investment amounts for all classes, which may be waived at the discretion of the Fund, are:
•$5,000 for accounts that list a financial professional.
•$15,000 for self-directed accounts.
You may purchase, redeem or exchange Fund shares on any day which the New York Stock Exchange is open for business. Depending on where your account is held, you may redeem your shares by contacting your financial professional or the Fund by mail, telephone, wire transfer or on-line (www.profunds.com).
Tax Information
The Fund’s distributions generally are taxable, and will be taxed as ordinary income, qualified dividend income or capital gains, unless you are investing through a tax-advantaged arrangement, such as a 401(k) plan or an individual retirement account. You may be taxed later upon withdrawal of monies from such tax-advantaged arrangements. The Fund intends to distribute income, if any, and capital gains, if any, at least annually.
Payments to Broker-Dealers and Other Financial Intermediaries
If you purchase Fund shares through a financial intermediary, such as a broker-dealer or investment adviser, the Fund and its distributor may pay the intermediary for the sale of Fund shares and related services. These payments may create a conflict of interest by influencing the broker-dealer or other financial intermediary to recommend the Fund over another investment. Ask your financial intermediary or visit your financial intermediary’s website for more information.
FUND NUMBERS :: Investor Class 017 :: Service Class 037 :: Mid-Cap Value ProFund :: 135
Wire Fee $10
|
| ||
|
|
Investor
Class |
Service
Class |
|
Investment Advisory Fees |
|
|
|
Distribution and Service (12b-1) Fees |
|
|
|
Other Expenses |
|
|
|
Total Annual Fund Operating Expenses
Before Fee Waivers and Expense
Reimbursements |
|
|
|
Fee Waivers/Reimbursements1 |
- |
- |
|
Total Annual Fund Operating Expenses
After Fee Waivers and Expense
Reimbursements |
|
|
1
|
|
1 Year |
3 Years |
5 Years |
10 Years |
|
Investor Class |
$ |
$ |
$ |
$ |
|
Service Class |
$ |
$ |
$ |
$ |
136 :: Mid-Cap Value ProFund :: TICKERS :: Investor Class MLPIX :: Service Class MLPSX
FUND NUMBERS :: Investor Class 017 :: Service Class 037 :: Mid-Cap Value ProFund :: 137
138 :: Mid-Cap Value ProFund :: TICKERS :: Investor Class MLPIX :: Service Class MLPSX
FUND NUMBERS :: Investor Class 017 :: Service Class 037 :: Mid-Cap Value ProFund :: 139
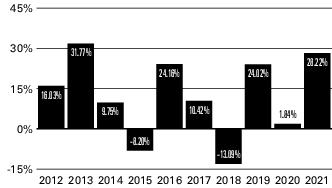
|
|
|
|
|
|
|
|
|
|
|
|
|
|
|
|
|
|
|
|
One
Year |
Five
Years |
Ten
Years |
Inception
Date |
|
Investor Class Shares |
|
|
|
|
|
– Before Taxes |
|
|
|
|
|
– After Taxes on Distributions |
|
|
|
|
|
– After Taxes on Distributions
and Sale of Shares |
|
|
|
|
|
Service Class Shares |
|
|
|
|
|
S&P MidCap 400® Value Index1 |
|
|
|
|
1
Management
The Fund is advised by ProFund Advisors. Michael Neches, Senior Portfolio Manager, and Devin Sullivan, Portfolio Manager, have jointly and primarily managed the Fund since October 2013 and April 2018, respectively.
Purchase and Sale of Fund Shares
The minimum initial investment amounts for all classes, which may be waived at the discretion of the Fund, are:
•$5,000 for accounts that list a financial professional.
•$15,000 for self-directed accounts.
You may purchase, redeem or exchange Fund shares on any day which the New York Stock Exchange is open for business. Depending on where your account is held, you may redeem your shares by contacting your financial professional or the Fund by mail, telephone, wire transfer or on-line (www.profunds.com).
Tax Information
The Fund’s distributions generally are taxable, and will be taxed as ordinary income, qualified dividend income or capital gains, unless you are investing through a tax-advantaged arrangement, such as a 401(k) plan or an individual retirement account. You may be taxed later upon withdrawal of monies from such tax-advantaged arrangements. The Fund intends to distribute income, if any, and capital gains, if any, at least annually.
Payments to Broker-Dealers and Other Financial Intermediaries
If you purchase Fund shares through a financial intermediary, such as a broker-dealer or investment adviser, the Fund and its distributor may pay the intermediary for the sale of Fund shares and related services. These payments may create a conflict of interest by influencing the broker-dealer or other financial intermediary to recommend the Fund over another investment. Ask your financial intermediary or visit your financial intermediary’s website for more information.
140 :: Nasdaq-100 ProFund :: TICKERS :: Investor Class OTPIX :: Service Class OTPSX
Wire Fee $10
|
| ||
|
|
Investor
Class |
Service
Class |
|
Investment Advisory Fees |
|
|
|
Distribution and Service (12b-1) Fees |
|
|
|
Other Expenses |
|
|
|
Total Annual Fund Operating Expenses1 |
|
|
1
|
|
1 Year |
3 Years |
5 Years |
10 Years |
|
Investor Class |
$ |
$ |
$ |
$ |
|
Service Class |
$ |
$ |
$ |
$ |
FUND NUMBERS :: Investor Class 040 :: Service Class 070 :: Nasdaq-100 ProFund :: 141
142 :: Nasdaq-100 ProFund :: TICKERS :: Investor Class OTPIX :: Service Class OTPSX
FUND NUMBERS :: Investor Class 040 :: Service Class 070 :: Nasdaq-100 ProFund :: 143
144 :: Nasdaq-100 ProFund :: TICKERS :: Investor Class OTPIX :: Service Class OTPSX
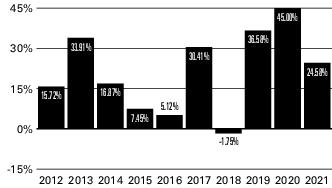
|
|
|
|
|
|
|
|
|
|
|
|
|
|
|
|
|
|
|
|
One
Year |
Five
Years |
Ten
Years |
Inception
Date |
|
Investor Class Shares |
|
|
|
|
|
– Before Taxes |
|
|
|
|
|
– After Taxes on Distributions |
|
|
|
|
|
– After Taxes on Distributions
and Sale of Shares |
|
|
|
|
|
Service Class Shares |
|
|
|
|
|
Nasdaq-100® Index1 |
|
|
|
|
1
Management
The Fund is advised by ProFund Advisors. Michael Neches, Senior Portfolio Manager, and Devin Sullivan, Portfolio Manager, have jointly and primarily managed the Fund since October 2013 and April 2018, respectively.
Purchase and Sale of Fund Shares
The minimum initial investment amounts for all classes, which may be waived at the discretion of the Fund, are:
•$5,000 for accounts that list a financial professional.
•$15,000 for self-directed accounts.
You may purchase, redeem or exchange Fund shares on any day which the New York Stock Exchange is open for business. Depending on where your account is held, you may redeem your shares by contacting your financial professional or the Fund by mail, telephone, wire transfer or on-line (www.profunds.com).
Tax Information
The Fund’s distributions generally are taxable, and will be taxed as ordinary income, qualified dividend income or capital gains, unless you are investing through a tax-advantaged arrangement, such as a 401(k) plan or an individual retirement account. You may be taxed later upon withdrawal of monies from such tax-advantaged arrangements. The Fund intends to distribute income, if any, and capital gains, if any, at least annually.
Payments to Broker-Dealers and Other Financial Intermediaries
If you purchase Fund shares through a financial intermediary, such as a broker-dealer or investment adviser, the Fund and its distributor may pay the intermediary for the sale of Fund shares and related services. These payments may create a conflict of interest by influencing the broker-dealer or other financial intermediary to recommend the Fund over another investment. Ask your financial intermediary or visit your financial intermediary’s website for more information.
FUND NUMBERS :: Investor Class 046 :: Service Class 076 :: Oil & Gas UltraSector ProFund :: 145
Wire Fee $10
|
| ||
|
|
Investor
Class |
Service
Class |
|
Investment Advisory Fees |
|
|
|
Distribution and Service (12b-1) Fees |
|
|
|
Other Expenses |
|
|
|
Total Annual Fund Operating Expenses1 |
|
|
1
|
|
1 Year |
3 Years |
5 Years |
10 Years |
|
Investor Class |
$ |
$ |
$ |
$ |
|
Service Class |
$ |
$ |
$ |
$ |
146 :: Oil & Gas UltraSector ProFund :: TICKERS :: Investor Class ENPIX :: Service Class ENPSX
FUND NUMBERS :: Investor Class 046 :: Service Class 076 :: Oil & Gas UltraSector ProFund :: 147
148 :: Oil & Gas UltraSector ProFund :: TICKERS :: Investor Class ENPIX :: Service Class ENPSX
|
| ||||||
|
|
| |||||
|
|
|
|
|
|
|
|
|
|
|
|
|
|
|
|
|
|
|
|
|
|
|
|
|
|
|
|
|
|
|
|
|
|
|
|
|
|
|
|
|
|
|
|
|
|
|
|
|
|
|
|
|
|
|
|
|
|
|
|
|
|
|
|
|
|
|
|
|
|
|
|
|
|
|
|
|
|
|
|
|
|
|
|
|
|
|
|
|
|
|
|
|
|
|
|
|
|
|
|
|
|
|
|
|
|
|
|
|
|
|
|
FUND NUMBERS :: Investor Class 046 :: Service Class 076 :: Oil & Gas UltraSector ProFund :: 149
On February 24, 2022, Russia commenced a military attack on Ukraine. The outbreak of hostilities between the two countries could result in more widespread conflict and could
150 :: Oil & Gas UltraSector ProFund :: TICKERS :: Investor Class ENPIX :: Service Class ENPSX
FUND NUMBERS :: Investor Class 046 :: Service Class 076 :: Oil & Gas UltraSector ProFund :: 151
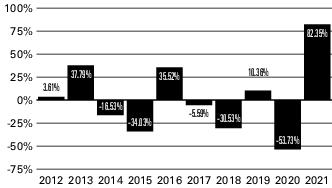
|
|
|
|
|
|
|
|
|
|
|
|
|
|
|
|
|
|
|
|
One
Year |
Five
Years |
Ten
Years |
Inception
Date |
|
Investor Class Shares |
|
|
|
|
|
– Before Taxes |
|
- |
- |
|
|
– After Taxes on Distributions |
|
- |
- |
|
|
– After Taxes on Distributions
and Sale of Shares |
|
- |
- |
|
|
Service Class Shares |
|
- |
- |
|
|
S&P 500®1 |
|
|
|
|
|
Dow Jones U.S. Oil & GasSM
Index1 |
|
- |
|
|
1
Management
The Fund is advised by ProFund Advisors. Michael Neches, Senior Portfolio Manager, and Tarak Davé, Portfolio Manager, have jointly and primarily managed the Fund since October 2013 and April 2018, respectively.
Purchase and Sale of Fund Shares
The minimum initial investment amounts for all classes, which may be waived at the discretion of the Fund, are:
•$5,000 for accounts that list a financial professional.
•$15,000 for self-directed accounts.
You may purchase, redeem or exchange Fund shares on any day which the New York Stock Exchange is open for business. Depending on where your account is held, you may redeem your shares by contacting your financial professional or the Fund by mail, telephone, wire transfer or on-line (www.profunds.com).
Tax Information
The Fund’s distributions generally are taxable, and will be taxed as ordinary income, qualified dividend income or capital gains, unless you are investing through a tax-advantaged arrangement, such as a 401(k) plan or an individual retirement account. You may be taxed later upon withdrawal of monies from such tax-advantaged arrangements. The Fund intends to distribute income, if any, and capital gains, if any, at least annually.
Payments to Broker-Dealers and Other Financial Intermediaries
If you purchase Fund shares through a financial intermediary, such as a broker-dealer or investment adviser, the Fund and its distributor may pay the intermediary for the sale of Fund shares and related services. These payments may create a conflict of interest by influencing the broker-dealer or other financial intermediary to recommend the Fund over another investment. Ask your financial intermediary or visit your financial intermediary’s website for more information.
152 :: Oil Equipment & Services UltraSector ProFund :: TICKERS :: Investor Class OEPIX :: Service Class OEPSX
Wire Fee $10
|
| ||
|
|
Investor
Class |
Service
Class |
|
Investment Advisory Fees |
|
|
|
Distribution and Service (12b-1) Fees |
|
|
|
Other Expenses |
|
|
|
Total Annual Fund Operating Expenses1 |
|
|
1
|
|
1 Year |
3 Years |
5 Years |
10 Years |
|
Investor Class |
$ |
$ |
$ |
$ |
|
Service Class |
$ |
$ |
$ |
$ |
FUND NUMBERS :: Investor Class 061 :: Service Class 091 :: Oil Equipment & Services UltraSector ProFund :: 153
154 :: Oil Equipment & Services UltraSector ProFund :: TICKERS :: Investor Class OEPIX :: Service Class OEPSX
FUND NUMBERS :: Investor Class 061 :: Service Class 091 :: Oil Equipment & Services UltraSector ProFund :: 155
|
| ||||||
|
|
| |||||
|
|
|
|
|
|
|
|
|
|
|
|
|
|
|
|
|
|
|
|
|
|
|
|
|
|
|
|
|
|
|
|
|
|
|
|
|
|
|
|
|
|
|
|
|
|
|
|
|
|
|
|
|
|
|
|
|
|
|
|
|
|
|
|
|
|
|
|
|
|
|
|
|
|
|
|
|
|
|
|
|
|
|
|
|
|
|
|
|
|
|
|
|
|
|
|
|
|
|
|
|
|
|
|
|
|
|
|
|
|
|
|
156 :: Oil Equipment & Services UltraSector ProFund :: TICKERS :: Investor Class OEPIX :: Service Class OEPSX
On February 24, 2022, Russia commenced a military attack
FUND NUMBERS :: Investor Class 061 :: Service Class 091 :: Oil Equipment & Services UltraSector ProFund :: 157
158 :: Oil Equipment & Services UltraSector ProFund :: TICKERS :: Investor Class OEPIX :: Service Class OEPSX
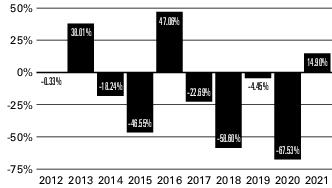
|
|
|
|
|
|
|
|
|
|
|
|
|
|
|
|
|
|
|
|
One
Year |
Five
Years |
Ten
Years |
Inception
Date |
|
Investor Class Shares |
|
|
|
|
|
– Before Taxes |
|
- |
- |
|
|
– After Taxes on Distributions |
|
- |
- |
|
|
– After Taxes on Distributions
and Sale of Shares |
|
- |
- |
|
|
Service Class Shares |
|
- |
- |
|
|
S&P 500®1 |
|
|
|
|
|
Dow Jones U.S. Select Oil
Equipment & ServicesSM
Index1 |
|
- |
- |
|
1
Management
The Fund is advised by ProFund Advisors. Michael Neches, Senior Portfolio Manager, and Tarak Davé, Portfolio Manager, have jointly and primarily managed the Fund since October 2013 and April 2018, respectively.
Purchase and Sale of Fund Shares
The minimum initial investment amounts for all classes, which may be waived at the discretion of the Fund, are:
•$5,000 for accounts that list a financial professional.
•$15,000 for self-directed accounts.
You may purchase, redeem or exchange Fund shares on any day which the New York Stock Exchange is open for business. Depending on where your account is held, you may redeem your shares by contacting your financial professional or the Fund by mail, telephone, wire transfer or on-line (www.profunds.com).
FUND NUMBERS :: Investor Class 061 :: Service Class 091 :: Oil Equipment & Services UltraSector ProFund :: 159
Tax Information
The Fund’s distributions generally are taxable, and will be taxed as ordinary income, qualified dividend income or capital gains, unless you are investing through a tax-advantaged arrangement, such as a 401(k) plan or an individual retirement account. You may be taxed later upon withdrawal of monies from such tax-advantaged arrangements. The Fund intends to distribute income, if any, and capital gains, if any, at least annually.
Payments to Broker-Dealers and Other Financial Intermediaries
If you purchase Fund shares through a financial intermediary, such as a broker-dealer or investment adviser, the Fund and its
distributor may pay the intermediary for the sale of Fund shares and related services. These payments may create a conflict of interest by influencing the broker-dealer or other financial intermediary to recommend the Fund over another investment. Ask your financial intermediary or visit your financial intermediary’s website for more information.
160 :: Pharmaceuticals UltraSector ProFund :: TICKERS :: Investor Class PHPIX :: Service Class PHPSX
Wire Fee $10
|
| ||
|
|
Investor
Class |
Service
Class |
|
Investment Advisory Fees |
|
|
|
Distribution and Service (12b-1) Fees |
|
|
|
Other Expenses |
|
|
|
Total Annual Fund Operating Expenses
Before Fee Waivers and Expense
Reimbursements |
|
|
|
Fee Waivers/Reimbursements1 |
- |
- |
|
Total Annual Fund Operating Expenses
After Fee Waivers and Expense
Reimbursements |
|
|
1
FUND NUMBERS :: Investor Class 047 :: Service Class 077 :: Pharmaceuticals UltraSector ProFund :: 161
|
|
1 Year |
3 Years |
5 Years |
10 Years |
|
Investor Class |
$ |
$ |
$ |
$ |
|
Service Class |
$ |
$ |
$ |
$ |
162 :: Pharmaceuticals UltraSector ProFund :: TICKERS :: Investor Class PHPIX :: Service Class PHPSX
FUND NUMBERS :: Investor Class 047 :: Service Class 077 :: Pharmaceuticals UltraSector ProFund :: 163
|
| ||||||
|
|
| |||||
|
|
|
|
|
|
|
|
|
|
|
|
|
|
|
|
|
|
|
|
|
|
|
|
|
|
|
|
|
|
|
|
|
|
|
|
|
|
|
|
|
|
|
|
|
|
|
|
|
|
|
|
|
|
|
|
|
|
|
|
|
|
|
|
|
|
|
|
|
|
|
|
|
|
|
|
|
|
|
|
|
|
|
|
|
|
|
|
|
|
|
|
|
|
|
|
|
|
|
|
|
|
|
|
|
|
|
|
|
|
|
|
164 :: Pharmaceuticals UltraSector ProFund :: TICKERS :: Investor Class PHPIX :: Service Class PHPSX
FUND NUMBERS :: Investor Class 047 :: Service Class 077 :: Pharmaceuticals UltraSector ProFund :: 165
166 :: Pharmaceuticals UltraSector ProFund :: TICKERS :: Investor Class PHPIX :: Service Class PHPSX
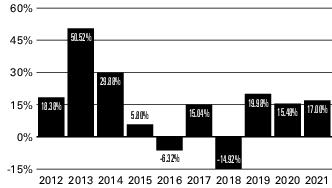
|
|
|
|
|
|
|
|
|
|
|
|
|
|
|
|
|
|
|
|
One
Year |
Five
Years |
Ten
Years |
Inception
Date |
|
Investor Class Shares |
|
|
|
|
|
– Before Taxes |
|
|
|
|
|
– After Taxes on Distributions |
|
|
|
|
|
– After Taxes on Distributions
and Sale of Shares |
|
|
|
|
|
Service Class Shares |
|
|
|
|
|
S&P 500®1 |
|
|
|
|
|
Dow Jones U.S. Select
PharmaceuticalsSM Index1 |
|
|
|
|
1
Management
The Fund is advised by ProFund Advisors. Michael Neches, Senior Portfolio Manager, and Tarak Davé, Portfolio Manager, have jointly and primarily managed the Fund since October 2013 and April 2018, respectively.
Purchase and Sale of Fund Shares
The minimum initial investment amounts for all classes, which may be waived at the discretion of the Fund, are:
•$5,000 for accounts that list a financial professional.
•$15,000 for self-directed accounts.
You may purchase, redeem or exchange Fund shares on any day which the New York Stock Exchange is open for business. Depending on where your account is held, you may redeem your shares by contacting your financial professional or the Fund by mail, telephone, wire transfer or on-line (www.profunds.com).
FUND NUMBERS :: Investor Class 047 :: Service Class 077 :: Pharmaceuticals UltraSector ProFund :: 167
Tax Information
The Fund’s distributions generally are taxable, and will be taxed as ordinary income, qualified dividend income or capital gains, unless you are investing through a tax-advantaged arrangement, such as a 401(k) plan or an individual retirement account. You may be taxed later upon withdrawal of monies from such tax-advantaged arrangements. The Fund intends to distribute income, if any, and capital gains, if any, at least annually.
Payments to Broker-Dealers and Other Financial Intermediaries
If you purchase Fund shares through a financial intermediary, such as a broker-dealer or investment adviser, the Fund and its
distributor may pay the intermediary for the sale of Fund shares and related services. These payments may create a conflict of interest by influencing the broker-dealer or other financial intermediary to recommend the Fund over another investment. Ask your financial intermediary or visit your financial intermediary’s website for more information.
168 :: Precious Metals UltraSector ProFund :: TICKERS :: Investor Class PMPIX :: Service Class PMPSX
Wire Fee $10
|
| ||
|
|
Investor
Class |
Service
Class |
|
Investment Advisory Fees |
|
|
|
Distribution and Service (12b-1) Fees |
|
|
|
Other Expenses |
|
|
|
Total Annual Fund Operating Expenses1 |
|
|
1
|
|
1 Year |
3 Years |
5 Years |
10 Years |
|
Investor Class |
$ |
$ |
$ |
$ |
|
Service Class |
$ |
$ |
$ |
$ |
FUND NUMBERS :: Investor Class 052 :: Service Class 082 :: Precious Metals UltraSector ProFund :: 169
170 :: Precious Metals UltraSector ProFund :: TICKERS :: Investor Class PMPIX :: Service Class PMPSX
FUND NUMBERS :: Investor Class 052 :: Service Class 082 :: Precious Metals UltraSector ProFund :: 171
|
| ||||||
|
|
| |||||
|
|
|
|
|
|
|
|
|
|
|
|
|
|
|
|
|
|
|
|
|
|
|
|
|
|
|
|
|
|
|
|
|
|
|
|
|
|
|
|
|
|
|
|
|
|
|
|
|
|
|
|
|
|
|
|
|
|
|
|
|
|
|
|
|
|
|
|
|
|
|
|
|
|
|
|
|
|
|
|
|
|
|
|
|
|
|
|
|
|
|
|
|
|
|
|
|
|
|
|
|
|
|
|
|
|
|
|
|
|
|
|
172 :: Precious Metals UltraSector ProFund :: TICKERS :: Investor Class PMPIX :: Service Class PMPSX
FUND NUMBERS :: Investor Class 052 :: Service Class 082 :: Precious Metals UltraSector ProFund :: 173
174 :: Precious Metals UltraSector ProFund :: TICKERS :: Investor Class PMPIX :: Service Class PMPSX
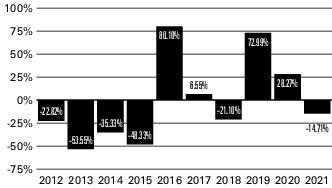
|
|
|
|
|
|
|
|
|
|
|
|
|
|
|
|
|
|
|
|
One
Year |
Five
Years |
Ten
Years |
Inception
Date |
|
Investor Class Shares |
|
|
|
|
|
– Before Taxes |
- |
|
- |
|
|
– After Taxes on Distributions |
- |
|
- |
|
|
– After Taxes on Distributions
and Sale of Shares |
- |
|
- |
|
|
Service Class Shares |
- |
|
- |
|
|
S&P 500®1 |
|
|
|
|
|
Dow Jones Precious MetalsSM
Index1 |
- |
|
- |
|
1
FUND NUMBERS :: Investor Class 052 :: Service Class 082 :: Precious Metals UltraSector ProFund :: 175
Management
The Fund is advised by ProFund Advisors. Michael Neches, Senior Portfolio Manager, and Tarak Davé, Portfolio Manager, have jointly and primarily managed the Fund since October 2013 and April 2018, respectively.
Purchase and Sale of Fund Shares
The minimum initial investment amounts for all classes, which may be waived at the discretion of the Fund, are:
•$5,000 for accounts that list a financial professional.
•$15,000 for self-directed accounts.
You may purchase, redeem or exchange Fund shares on any day which the New York Stock Exchange is open for business. Depending on where your account is held, you may redeem your shares by contacting your financial professional or the Fund by mail, telephone, wire transfer or on-line (www.profunds.com).
Tax Information
The Fund’s distributions generally are taxable, and will be taxed as ordinary income, qualified dividend income or capital gains, unless you are investing through a tax-advantaged arrangement, such as a 401(k) plan or an individual retirement account. You may be taxed later upon withdrawal of monies from such tax-advantaged arrangements. The Fund intends to distribute income, if any, and capital gains, if any, at least annually.
Payments to Broker-Dealers and Other Financial Intermediaries
If you purchase Fund shares through a financial intermediary, such as a broker-dealer or investment adviser, the Fund and its distributor may pay the intermediary for the sale of Fund shares and related services. These payments may create a conflict of interest by influencing the broker-dealer or other financial intermediary to recommend the Fund over another investment. Ask your financial intermediary or visit your financial intermediary’s website for more information.
176 :: Real Estate UltraSector ProFund :: TICKERS :: Investor Class REPIX :: Service Class REPSX
Wire Fee $10
|
| ||
|
|
Investor
Class |
Service
Class |
|
Investment Advisory Fees |
|
|
|
Distribution and Service (12b-1) Fees |
|
|
|
Other Expenses |
|
|
|
Total Annual Fund Operating Expenses1 |
|
|
1
|
|
1 Year |
3 Years |
5 Years |
10 Years |
|
Investor Class |
$ |
$ |
$ |
$ |
|
Service Class |
$ |
$ |
$ |
$ |
FUND NUMBERS :: Investor Class 041 :: Service Class 071 :: Real Estate UltraSector ProFund :: 177
178 :: Real Estate UltraSector ProFund :: TICKERS :: Investor Class REPIX :: Service Class REPSX
FUND NUMBERS :: Investor Class 041 :: Service Class 071 :: Real Estate UltraSector ProFund :: 179
|
| ||||||
|
|
| |||||
|
|
|
|
|
|
|
|
|
|
|
|
|
|
|
|
|
|
|
|
|
|
|
|
|
|
|
|
|
|
|
|
|
|
|
|
|
|
|
|
|
|
|
|
|
|
|
|
|
|
|
|
|
|
|
|
|
|
|
|
|
|
|
|
|
|
|
|
|
|
|
|
|
|
|
|
|
|
|
|
|
|
|
|
|
|
|
|
|
|
|
|
|
|
|
|
|
|
|
|
|
|
|
|
|
|
|
|
|
|
|
|
180 :: Real Estate UltraSector ProFund :: TICKERS :: Investor Class REPIX :: Service Class REPSX
FUND NUMBERS :: Investor Class 041 :: Service Class 071 :: Real Estate UltraSector ProFund :: 181
182 :: Real Estate UltraSector ProFund :: TICKERS :: Investor Class REPIX :: Service Class REPSX
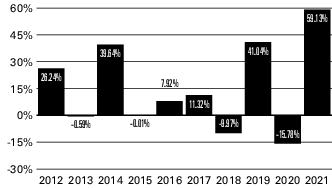
|
|
|
|
|
|
|
|
|
|
|
|
|
|
|
|
|
|
|
|
One
Year |
Five
Years |
Ten
Years |
Inception
Date |
|
Investor Class Shares |
|
|
|
|
|
– Before Taxes |
|
|
|
|
|
– After Taxes on Distributions |
|
|
|
|
|
– After Taxes on Distributions
and Sale of Shares |
|
|
|
|
|
Service Class Shares |
|
|
|
|
|
S&P 500®1 |
|
|
|
|
|
Dow Jones U.S. Real EstateSM
Index1 |
|
|
|
|
1
Management
The Fund is advised by ProFund Advisors. Michael Neches, Senior Portfolio Manager, and Tarak Davé, Portfolio Manager, have jointly and primarily managed the Fund since October 2013 and April 2018, respectively.
Purchase and Sale of Fund Shares
The minimum initial investment amounts for all classes, which may be waived at the discretion of the Fund, are:
•$5,000 for accounts that list a financial professional.
•$15,000 for self-directed accounts.
You may purchase, redeem or exchange Fund shares on any day which the New York Stock Exchange is open for business. Depending on where your account is held, you may redeem your shares by contacting your financial professional or the Fund by mail, telephone, wire transfer or on-line (www.profunds.com).
Tax Information
The Fund’s distributions generally are taxable, and will be taxed as ordinary income, qualified dividend income or capital gains, unless you are investing through a tax-advantaged arrangement, such as a 401(k) plan or an individual retirement account. You may be taxed later upon withdrawal of monies from such tax-advantaged arrangements. The Fund intends to distribute income, if any, and capital gains, if any, at least annually.
Payments to Broker-Dealers and Other Financial Intermediaries
If you purchase Fund shares through a financial intermediary, such as a broker-dealer or investment adviser, the Fund and its distributor may pay the intermediary for the sale of Fund shares and related services. These payments may create a conflict of interest by influencing the broker-dealer or other financial intermediary to recommend the Fund over another investment. Ask your financial intermediary or visit your financial intermediary’s website for more information.
FUND NUMBERS :: Investor Class 065 :: Service Class 095 :: Rising Rates Opportunity ProFund :: 183
Wire Fee $10
|
| ||
|
|
Investor
Class |
Service
Class |
|
Investment Advisory Fees |
|
|
|
Distribution and Service (12b-1) Fees |
|
|
|
Other Expenses |
|
|
|
Total Annual Fund Operating Expenses1 |
|
|
1
|
|
1 Year |
3 Years |
5 Years |
10 Years |
|
Investor Class |
$ |
$ |
$ |
$ |
|
Service Class |
$ |
$ |
$ |
$ |
184 :: Rising Rates Opportunity ProFund :: TICKERS :: Investor Class RRPIX :: Service Class RRPSX
FUND NUMBERS :: Investor Class 065 :: Service Class 095 :: Rising Rates Opportunity ProFund :: 185
186 :: Rising Rates Opportunity ProFund :: TICKERS :: Investor Class RRPIX :: Service Class RRPSX
|
| ||||||
|
|
| |||||
|
|
|
|
|
|
|
|
|
|
|
|
|
|
|
|
|
|
|
|
|
|
|
|
|
|
|
|
|
|
|
|
|
|
|
|
|
|
|
|
|
|
|
|
|
|
|
|
|
|
|
|
|
|
|
|
|
|
|
|
|
|
|
|
|
|
|
|
|
|
|
|
|
|
|
|
|
|
|
|
|
|
|
|
|
|
|
|
|
|
|
|
|
|
|
|
|
|
|
|
|
|
|
|
|
|
|
|
|
|
|
|
FUND NUMBERS :: Investor Class 065 :: Service Class 095 :: Rising Rates Opportunity ProFund :: 187
188 :: Rising Rates Opportunity ProFund :: TICKERS :: Investor Class RRPIX :: Service Class RRPSX
FUND NUMBERS :: Investor Class 065 :: Service Class 095 :: Rising Rates Opportunity ProFund :: 189
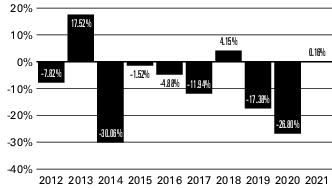
|
|
|
|
|
|
|
|
|
|
|
|
|
|
|
|
|
|
|
|
One
Year |
Five
Years |
Ten
Years |
Inception
Date |
|
Investor Class Shares |
|
|
|
|
|
– Before Taxes |
|
- |
- |
|
|
– After Taxes on Distributions |
|
- |
- |
|
|
– After Taxes on Distributions
and Sale of Shares |
|
- |
- |
|
|
Service Class Shares |
- |
- |
- |
|
|
Ryan Labs Returns Treasury
Yield Curve 30 Year Index1 |
- |
|
|
|
1
Management
The Fund is advised by ProFund Advisors. Alexander Ilyasov, Senior Portfolio Manager, and James Linneman, Portfolio Manager, have jointly and primarily managed the Fund since April 2019 and March 2022, respectively.
Purchase and Sale of Fund Shares
The minimum initial investment amounts for all classes, which may be waived at the discretion of the Fund, are:
•$5,000 for accounts that list a financial professional.
•$15,000 for self-directed accounts.
You may purchase, redeem or exchange Fund shares on any day which the New York Stock Exchange is open for business. Depending on where your account is held, you may redeem your shares by contacting your financial professional or the Fund by mail, telephone, wire transfer or on-line (www.profunds.com).
Tax Information
The Fund’s distributions generally are taxable, and will be taxed as ordinary income, qualified dividend income or capital gains, unless you are investing through a tax-advantaged arrangement, such as a 401(k) plan or an individual retirement account. You may be taxed later upon withdrawal of monies from such tax-advantaged arrangements. The Fund intends to distribute income, if any, and capital gains, if any, at least annually.
Payments to Broker-Dealers and Other Financial Intermediaries
If you purchase Fund shares through a financial intermediary, such as a broker-dealer or investment adviser, the Fund and its distributor may pay the intermediary for the sale of Fund shares and related services. These payments may create a conflict of interest by influencing the broker-dealer or other financial intermediary to recommend the Fund over another investment. Ask your financial intermediary or visit your financial intermediary’s website for more information.
190 :: Rising Rates Opportunity 10 ProFund :: TICKERS :: Investor Class RTPIX :: Service Class RTPSX
Wire Fee $10
|
| ||
|
|
Investor
Class |
Service
Class |
|
Investment Advisory Fees |
|
|
|
Distribution and Service (12b-1) Fees |
|
|
|
Other Expenses |
|
|
|
Total Annual Fund Operating Expenses
Before Fee Waivers and Expense
Reimbursements |
|
|
|
Fee Waivers/Reimbursements1 |
- |
- |
|
Total Annual Fund Operating Expenses
After Fee Waivers and Expense
Reimbursements |
|
|
1
FUND NUMBERS :: Investor Class 108 :: Service Class 138 :: Rising Rates Opportunity 10 ProFund :: 191
|
|
1 Year |
3 Years |
5 Years |
10 Years |
|
Investor Class |
$ |
$ |
$ |
$ |
|
Service Class |
$ |
$ |
$ |
$ |
192 :: Rising Rates Opportunity 10 ProFund :: TICKERS :: Investor Class RTPIX :: Service Class RTPSX
FUND NUMBERS :: Investor Class 108 :: Service Class 138 :: Rising Rates Opportunity 10 ProFund :: 193
|
| ||||||
|
|
| |||||
|
|
|
|
|
|
|
|
|
|
|
|
|
|
|
|
|
|
|
|
|
|
|
|
|
|
|
|
|
|
|
|
|
|
|
|
|
|
|
|
|
|
|
|
|
|
|
|
|
|
|
|
|
|
|
|
|
|
|
|
|
|
|
|
|
|
|
|
|
|
|
|
|
|
|
|
|
|
|
|
|
|
|
|
|
|
|
|
|
|
|
|
|
|
|
|
|
|
|
|
|
|
|
|
|
|
|
|
|
|
|
|
194 :: Rising Rates Opportunity 10 ProFund :: TICKERS :: Investor Class RTPIX :: Service Class RTPSX
FUND NUMBERS :: Investor Class 108 :: Service Class 138 :: Rising Rates Opportunity 10 ProFund :: 195
196 :: Rising Rates Opportunity 10 ProFund :: TICKERS :: Investor Class RTPIX :: Service Class RTPSX
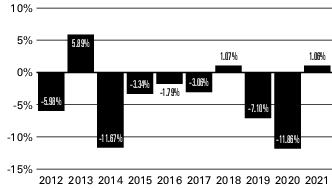
|
|
|
|
|
|
|
|
|
|
|
|
|
|
|
|
|
|
|
|
One
Year |
Five
Years |
Ten
Years |
Inception
Date |
|
Investor Class Shares |
|
|
|
|
|
– Before Taxes |
|
- |
- |
|
|
– After Taxes on Distributions |
|
- |
- |
|
|
– After Taxes on Distributions
and Sale of Shares |
|
- |
- |
|
|
Service Class Shares |
|
- |
- |
|
|
Ryan Labs Returns Treasury
Yield Curve 10 Year Index1 |
- |
|
|
|
1
Management
The Fund is advised by ProFund Advisors. Alexander Ilyasov, Senior Portfolio Manager, and James Linneman, Portfolio Manager, have jointly and primarily managed the Fund since April 2019 and March 2022, respectively.
Purchase and Sale of Fund Shares
The minimum initial investment amounts for all classes, which may be waived at the discretion of the Fund, are:
•$5,000 for accounts that list a financial professional.
•$15,000 for self-directed accounts.
You may purchase, redeem or exchange Fund shares on any day which the New York Stock Exchange is open for business. Depending on where your account is held, you may redeem your shares by contacting your financial professional or the Fund by mail, telephone, wire transfer or on-line (www.profunds.com).
Tax Information
The Fund’s distributions generally are taxable, and will be taxed as ordinary income, qualified dividend income or capital gains, unless you are investing through a tax-advantaged arrangement, such as a 401(k) plan or an individual retirement account. You may be taxed later upon withdrawal of monies from such tax-advantaged arrangements. The Fund intends to distribute income, if any, and capital gains, if any, at least annually.
Payments to Broker-Dealers and Other Financial Intermediaries
If you purchase Fund shares through a financial intermediary, such as a broker-dealer or investment adviser, the Fund and its distributor may pay the intermediary for the sale of Fund shares and related services. These payments may create a conflict of interest by influencing the broker-dealer or other financial intermediary to recommend the Fund over another investment. Ask your financial intermediary or visit your financial intermediary’s website for more information.
FUND NUMBERS :: Investor Class 112 :: Service Class 142 :: Rising U.S. Dollar ProFund :: 197
Wire Fee $10
|
| ||
|
|
Investor
Class |
Service
Class |
|
Investment Advisory Fees |
|
|
|
Distribution and Service (12b-1) Fees |
|
|
|
Other Expenses |
|
|
|
Recoupment1 |
|
|
|
Other Operating Expenses |
|
|
|
Total Annual Fund Operating Expenses
Before Fee Waivers and Expense
Reimbursements |
|
|
|
Fee Waivers/Reimbursements2 |
- |
- |
|
Total Annual Fund Operating Expenses
After Fee Waivers and Expense
Reimbursements |
|
|
1
2
198 :: Rising U.S. Dollar ProFund :: TICKERS :: Investor Class RDPIX :: Service Class RDPSX
|
|
1 Year |
3 Years |
5 Years |
10 Years |
|
Investor Class |
$ |
$ |
$ |
$ |
|
Service Class |
$ |
$ |
$ |
$ |
FUND NUMBERS :: Investor Class 112 :: Service Class 142 :: Rising U.S. Dollar ProFund :: 199
200 :: Rising U.S. Dollar ProFund :: TICKERS :: Investor Class RDPIX :: Service Class RDPSX
|
| ||||||
|
|
| |||||
|
|
|
|
|
|
|
|
|
|
|
|
|
|
|
|
|
|
|
|
|
|
|
|
|
|
|
|
|
|
|
|
|
|
|
|
|
|
|
|
|
|
|
|
|
|
|
|
|
|
|
|
|
|
|
|
|
|
|
|
|
|
|
|
|
|
|
|
|
|
|
|
|
|
|
|
|
|
|
|
|
|
|
|
|
|
|
|
|
|
|
|
|
|
|
|
|
|
|
|
|
|
|
|
|
|
|
|
|
|
|
|
FUND NUMBERS :: Investor Class 112 :: Service Class 142 :: Rising U.S. Dollar ProFund :: 201
202 :: Rising U.S. Dollar ProFund :: TICKERS :: Investor Class RDPIX :: Service Class RDPSX
FUND NUMBERS :: Investor Class 112 :: Service Class 142 :: Rising U.S. Dollar ProFund :: 203
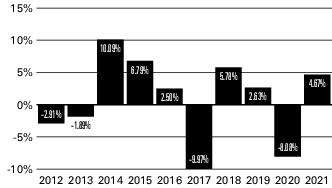
|
|
|
|
|
|
|
|
|
|
|
|
|
|
|
|
|
|
|
|
One
Year |
Five
Years |
Ten
Years |
Inception
Date |
|
Investor Class Shares |
|
|
|
|
|
– Before Taxes |
|
- |
|
|
|
– After Taxes on Distributions |
|
- |
|
|
|
– After Taxes on Distributions
and Sale of Shares |
|
- |
|
|
|
Service Class Shares |
|
- |
- |
|
|
S&P 500®1 |
|
|
|
|
|
ICE® U.S. Dollar Index®2 |
|
- |
|
|
1
2
Management
The Fund is advised by ProFund Advisors. Alexander Ilyasov, Senior Portfolio Manager, and James Linneman, Portfolio Manager, have jointly and primarily managed the Fund since April 2019 and March 2022, respectively.
Purchase and Sale of Fund Shares
The minimum initial investment amounts for all classes, which may be waived at the discretion of the Fund, are:
•$5,000 for accounts that list a financial professional.
•$15,000 for self-directed accounts.
You may purchase, redeem or exchange Fund shares on any day which the New York Stock Exchange is open for business. Depending on where your account is held, you may redeem your shares by contacting your financial professional or the Fund by mail, telephone, wire transfer or on-line (www.profunds.com).
Tax Information
The Fund’s distributions generally are taxable, and will be taxed as ordinary income, qualified dividend income or capital gains, unless you are investing through a tax-advantaged arrangement, such as a 401(k) plan or an individual retirement account. You may be taxed later upon withdrawal of monies from such tax-advantaged arrangements. The Fund intends to distribute income, if any, and capital gains, if any, at least annually.
Payments to Broker-Dealers and Other Financial Intermediaries
If you purchase Fund shares through a financial intermediary, such as a broker-dealer or investment adviser, the Fund and its distributor may pay the intermediary for the sale of Fund shares and related services. These payments may create a conflict of interest by influencing the broker-dealer or other financial intermediary to recommend the Fund over another investment. Ask your financial intermediary or visit your financial intermediary’s website for more information.
204 :: Semiconductor UltraSector ProFund :: TICKERS :: Investor Class SMPIX :: Service Class SMPSX
Wire Fee $10
|
| ||
|
|
Investor
Class |
Service
Class |
|
Investment Advisory Fees |
|
|
|
Distribution and Service (12b-1) Fees |
|
|
|
Other Expenses |
|
|
|
Total Annual Fund Operating Expenses1 |
|
|
1
|
|
1 Year |
3 Years |
5 Years |
10 Years |
|
Investor Class |
$ |
$ |
$ |
$ |
|
Service Class |
$ |
$ |
$ |
$ |
FUND NUMBERS :: Investor Class 045 :: Service Class 075 :: Semiconductor UltraSector ProFund :: 205
206 :: Semiconductor UltraSector ProFund :: TICKERS :: Investor Class SMPIX :: Service Class SMPSX
FUND NUMBERS :: Investor Class 045 :: Service Class 075 :: Semiconductor UltraSector ProFund :: 207
|
| ||||||
|
|
| |||||
|
|
|
|
|
|
|
|
|
|
|
|
|
|
|
|
|
|
|
|
|
|
|
|
|
|
|
|
|
|
|
|
|
|
|
|
|
|
|
|
|
|
|
|
|
|
|
|
|
|
|
|
|
|
|
|
|
|
|
|
|
|
|
|
|
|
|
|
|
|
|
|
|
|
|
|
|
|
|
|
|
|
|
|
|
|
|
|
|
|
|
|
|
|
|
|
|
|
|
|
|
|
|
|
|
|
|
|
|
|
|
|
208 :: Semiconductor UltraSector ProFund :: TICKERS :: Investor Class SMPIX :: Service Class SMPSX
FUND NUMBERS :: Investor Class 045 :: Service Class 075 :: Semiconductor UltraSector ProFund :: 209
210 :: Semiconductor UltraSector ProFund :: TICKERS :: Investor Class SMPIX :: Service Class SMPSX
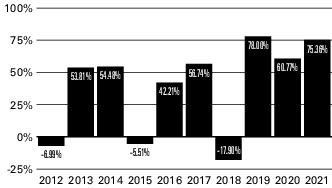
|
|
|
|
|
|
|
|
|
|
|
|
|
|
|
|
|
|
|
|
One
Year |
Five
Years |
Ten
Years |
Inception
Date |
|
Investor Class Shares |
|
|
|
|
|
– Before Taxes |
|
|
|
|
|
– After Taxes on Distributions |
|
|
|
|
|
– After Taxes on Distributions
and Sale of Shares |
|
|
|
|
|
Service Class Shares |
|
|
|
|
|
S&P 500®1 |
|
|
|
|
|
Dow Jones
U.S. SemiconductorsSM Index1 |
|
|
|
|
1
Management
The Fund is advised by ProFund Advisors. Michael Neches, Senior Portfolio Manager, and Tarak Davé, Portfolio Manager, have jointly and primarily managed the Fund since October 2013 and April 2018, respectively.
Purchase and Sale of Fund Shares
The minimum initial investment amounts for all classes, which may be waived at the discretion of the Fund, are:
•$5,000 for accounts that list a financial professional.
•$15,000 for self-directed accounts.
You may purchase, redeem or exchange Fund shares on any day which the New York Stock Exchange is open for business. Depending on where your account is held, you may redeem your shares by contacting your financial professional or the Fund by mail, telephone, wire transfer or on-line (www.profunds.com).
Tax Information
The Fund’s distributions generally are taxable, and will be taxed as ordinary income, qualified dividend income or capital gains, unless you are investing through a tax-advantaged arrangement, such as a 401(k) plan or an individual retirement account. You may be taxed later upon withdrawal of monies from such tax-advantaged arrangements. The Fund intends to distribute income, if any, and capital gains, if any, at least annually.
Payments to Broker-Dealers and Other Financial Intermediaries
If you purchase Fund shares through a financial intermediary, such as a broker-dealer or investment adviser, the Fund and its distributor may pay the intermediary for the sale of Fund shares and related services. These payments may create a conflict of interest by influencing the broker-dealer or other financial intermediary to recommend the Fund over another investment. Ask your financial intermediary or visit your financial intermediary’s website for more information.
FUND NUMBERS :: Investor Class 063 :: Service Class 093 :: Short Nasdaq-100 ProFund :: 211
Wire Fee $10
|
| ||
|
|
Investor
Class |
Service
Class |
|
Investment Advisory Fees |
|
|
|
Distribution and Service (12b-1) Fees |
|
|
|
Other Expenses |
|
|
|
Recoupment1 |
|
|
|
Other Operating Expenses |
|
|
|
Total Annual Fund Operating Expenses
Before Fee Waivers and Expense
Reimbursements |
|
|
|
Fee Waivers/Reimbursements2 |
- |
- |
|
Total Annual Fund Operating Expenses
After Fee Waivers and Expense
Reimbursements |
|
|
1
The “Recoupment” line shows gross recoupment payments made by the Fund during its most recent fiscal year. In addition, at times during the fiscal year amounts were waived or reimbursed to the Fund - the gross amount of this waiver/reimbursement is shown separately in the “Fee Waivers/Reimbursements” line. The recoupment shown did not cause the Fund’s expenses to exceed any expense limitation in place at the time of recoupment or the time the recouped amounts were originally waived/reimbursed.
2
212 :: Short Nasdaq-100 ProFund :: TICKERS :: Investor Class SOPIX :: Service Class SOPSX
|
|
1 Year |
3 Years |
5 Years |
10 Years |
|
Investor Class |
$ |
$ |
$ |
$ |
|
Service Class |
$ |
$ |
$ |
$ |
FUND NUMBERS :: Investor Class 063 :: Service Class 093 :: Short Nasdaq-100 ProFund :: 213
214 :: Short Nasdaq-100 ProFund :: TICKERS :: Investor Class SOPIX :: Service Class SOPSX
|
| ||||||
|
|
| |||||
|
|
|
|
|
|
|
|
|
|
|
|
|
|
|
|
|
|
|
|
|
|
|
|
|
|
|
|
|
|
|
|
|
|
|
|
|
|
|
|
|
|
|
|
|
|
|
|
|
|
|
|
|
|
|
|
|
|
|
|
|
|
|
|
|
|
|
|
|
|
|
|
|
|
|
|
|
|
|
|
|
|
|
|
|
|
|
|
|
|
|
|
|
|
|
|
|
|
|
|
|
|
|
|
|
|
|
|
|
|
|
|
FUND NUMBERS :: Investor Class 063 :: Service Class 093 :: Short Nasdaq-100 ProFund :: 215
216 :: Short Nasdaq-100 ProFund :: TICKERS :: Investor Class SOPIX :: Service Class SOPSX
FUND NUMBERS :: Investor Class 063 :: Service Class 093 :: Short Nasdaq-100 ProFund :: 217
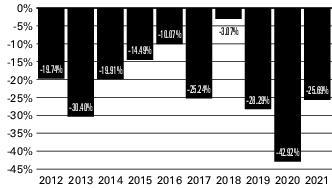
|
|
|
|
|
|
|
|
|
|
|
|
|
|
|
|
|
|
|
|
One
Year |
Five
Years |
Ten
Years |
Inception
Date |
|
Investor Class Shares |
|
|
|
|
|
– Before Taxes |
- |
- |
- |
|
|
– After Taxes on Distributions |
- |
- |
- |
|
|
– After Taxes on Distributions
and Sale of Shares |
- |
- |
- |
|
|
Service Class Shares |
- |
- |
- |
|
|
Nasdaq-100® Index1 |
|
|
|
|
1
218 :: Short Nasdaq-100 ProFund :: TICKERS :: Investor Class SOPIX :: Service Class SOPSX
Management
The Fund is advised by ProFund Advisors. Michael Neches, Senior Portfolio Manager, and Devin Sullivan, Portfolio Manager, have jointly and primarily managed the Fund since October 2013 and April 2018, respectively.
Purchase and Sale of Fund Shares
The minimum initial investment amounts for all classes, which may be waived at the discretion of the Fund, are:
•$5,000 for accounts that list a financial professional.
•$15,000 for self-directed accounts.
You may purchase, redeem or exchange Fund shares on any day which the New York Stock Exchange is open for business. Depending on where your account is held, you may redeem your shares by contacting your financial professional or the Fund by mail, telephone, wire transfer or on-line (www.profunds.com).
Tax Information
The Fund’s distributions generally are taxable, and will be taxed as ordinary income, qualified dividend income or capital gains,
unless you are investing through a tax-advantaged arrangement, such as a 401(k) plan or an individual retirement account. You may be taxed later upon withdrawal of monies from such tax-advantaged arrangements. The Fund intends to distribute income, if any, and capital gains, if any, at least annually.
Payments to Broker-Dealers and Other Financial Intermediaries
If you purchase Fund shares through a financial intermediary, such as a broker-dealer or investment adviser, the Fund and its distributor may pay the intermediary for the sale of Fund shares and related services. These payments may create a conflict of interest by influencing the broker-dealer or other financial intermediary to recommend the Fund over another investment. Ask your financial intermediary or visit your financial intermediary’s website for more information.
FUND NUMBERS :: Investor Class 116 :: Service Class 146 :: Short Oil & Gas ProFund :: 219
Wire Fee $10
|
| ||
|
|
Investor
Class |
Service
Class |
|
Investment Advisory Fees |
|
|
|
Distribution and Service (12b-1) Fees |
|
|
|
Other Expenses |
|
|
|
Total Annual Fund Operating Expenses
Before Fee Waivers and Expense
Reimbursements |
|
|
|
Fee Waivers/Reimbursements1 |
- |
- |
|
Total Annual Fund Operating Expenses
After Fee Waivers and Expense
Reimbursements |
|
|
1
ProFund Advisors LLC (“ProFund Advisors”) has contractually agreed to waive Investment Advisory and Management Services Fees and to reimburse Other Expenses to the extent Total Annual Fund Operating Expenses Before Fee Waivers and Expense Reimbursements, as a percentage of average daily net assets, exceed 1.78% for Investor Class shares and 2.78% for Service Class shares through November 30, 2023 . After such date, the expense limitation may be terminated or revised by ProFund Advisors. Amounts waived or reimbursed in a particular contractual period may be recouped by ProFund Advisors within three years of the end of that contractual period, however, such recoupment will be limited to the lesser of any expense limitation in place at the time of recoupment or the expense limitation in place at the time of waiver or reimbursement.
220 :: Short Oil & Gas ProFund :: TICKERS :: Investor Class SNPIX :: Service Class SNPSX
|
|
1 Year |
3 Years |
5 Years |
10 Years |
|
Investor Class |
$ |
$ |
$ |
$ |
|
Service Class |
$ |
$ |
$ |
$ |
FUND NUMBERS :: Investor Class 116 :: Service Class 146 :: Short Oil & Gas ProFund :: 221
222 :: Short Oil & Gas ProFund :: TICKERS :: Investor Class SNPIX :: Service Class SNPSX
|
| ||||||
|
|
| |||||
|
|
|
|
|
|
|
|
|
|
|
|
|
|
|
|
|
|
|
|
|
|
|
|
|
|
|
|
|
|
|
|
|
|
|
|
|
|
|
|
|
|
|
|
|
|
|
|
|
|
|
|
|
|
|
|
|
|
|
|
|
|
|
|
|
|
|
|
|
|
|
|
|
|
|
|
|
|
|
|
|
|
|
|
|
|
|
|
|
|
|
|
|
|
|
|
|
|
|
|
|
|
|
|
|
|
|
|
|
|
|
|
FUND NUMBERS :: Investor Class 116 :: Service Class 146 :: Short Oil & Gas ProFund :: 223
On February 24, 2022, Russia commenced a military attack on Ukraine. The outbreak of hostilities between the two countries could result in more widespread conflict and could have a severe adverse effect on the region and the markets for securities and commodities, including oil. In addition, sanctions imposed on Russia by the United States and other countries, and any sanctions imposed in the future could have a significant adverse impact on the Russian economy and related markets. How long such conflict and related events will last and whether it will escalate further cannot be predicted. Impacts from the conflict and related events could have significant impact on the Fund’s performance, and the value of an investment in the Fund may decline significantly.
224 :: Short Oil & Gas ProFund :: TICKERS :: Investor Class SNPIX :: Service Class SNPSX
FUND NUMBERS :: Investor Class 116 :: Service Class 146 :: Short Oil & Gas ProFund :: 225
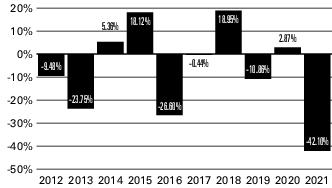
|
|
|
|
|
|
|
|
|
|
|
|
|
|
|
|
|
|
|
|
One
Year |
Five
Years |
Ten
Years |
Inception
Date |
|
Investor Class Shares |
|
|
|
|
|
– Before Taxes |
- |
- |
- |
|
|
– After Taxes on Distributions |
- |
- |
- |
|
|
– After Taxes on Distributions
and Sale of Shares |
- |
- |
- |
|
|
Service Class Shares |
- |
- |
- |
|
|
S&P 500®1 |
|
|
|
|
|
Dow Jones U.S. Oil & GasSM
Index1 |
|
- |
|
|
1
226 :: Short Oil & Gas ProFund :: TICKERS :: Investor Class SNPIX :: Service Class SNPSX
Management
The Fund is advised by ProFund Advisors. Michael Neches, Senior Portfolio Manager, and Tarak Davé, Portfolio Manager, have jointly and primarily managed the Fund since October 2013 and April 2018, respectively.
Purchase and Sale of Fund Shares
The minimum initial investment amounts for all classes, which may be waived at the discretion of the Fund, are:
•$5,000 for accounts that list a financial professional.
•$15,000 for self-directed accounts.
You may purchase, redeem or exchange Fund shares on any day which the New York Stock Exchange is open for business. Depending on where your account is held, you may redeem your
shares by contacting your financial professional or the Fund by mail, telephone, wire transfer or on-line (www.profunds.com).
Tax Information
The Fund’s distributions generally are taxable, and will be taxed as ordinary income, qualified dividend income or capital gains, unless you are investing through a tax-advantaged arrangement, such as a 401(k) plan or an individual retirement account. You may be taxed later upon withdrawal of monies from such tax-advantaged arrangements. The Fund intends to distribute income, if any, and capital gains, if any, at least annually.
Payments to Broker-Dealers and Other Financial Intermediaries
If you purchase Fund shares through a financial intermediary, such as a broker-dealer or investment adviser, the Fund and its distributor may pay the intermediary for the sale of Fund shares and related services. These payments may create a conflict of interest by influencing the broker-dealer or other financial intermediary to recommend the Fund over another investment. Ask your financial intermediary or visit your financial intermediary’s website for more information.
FUND NUMBERS :: Investor Class 117 :: Service Class 147 :: Short Precious Metals ProFund :: 227
Wire Fee $10
|
| ||
|
|
Investor
Class |
Service
Class |
|
Investment Advisory Fees |
|
|
|
Distribution and Service (12b-1) Fees |
|
|
|
Other Expenses |
|
|
|
Total Annual Fund Operating Expenses
Before Fee Waivers and Expense
Reimbursements |
|
|
|
Fee Waivers/Reimbursements1 |
- |
- |
|
Total Annual Fund Operating Expenses
After Fee Waivers and Expense
Reimbursements |
|
|
1
228 :: Short Precious Metals ProFund :: TICKERS :: Investor Class SPPIX :: Service Class SPPSX
|
|
1 Year |
3 Years |
5 Years |
10 Years |
|
Investor Class |
$ |
$ |
$ |
$ |
|
Service Class |
$ |
$ |
$ |
$ |
FUND NUMBERS :: Investor Class 117 :: Service Class 147 :: Short Precious Metals ProFund :: 229
230 :: Short Precious Metals ProFund :: TICKERS :: Investor Class SPPIX :: Service Class SPPSX
|
| ||||||
|
|
| |||||
|
|
|
|
|
|
|
|
|
|
|
|
|
|
|
|
|
|
|
|
|
|
|
|
|
|
|
|
|
|
|
|
|
|
|
|
|
|
|
|
|
|
|
|
|
|
|
|
|
|
|
|
|
|
|
|
|
|
|
|
|
|
|
|
|
|
|
|
|
|
|
|
|
|
|
|
|
|
|
|
|
|
|
|
|
|
|
|
|
|
|
|
|
|
|
|
|
|
|
|
|
|
|
|
|
|
|
|
|
|
|
|
FUND NUMBERS :: Investor Class 117 :: Service Class 147 :: Short Precious Metals ProFund :: 231
232 :: Short Precious Metals ProFund :: TICKERS :: Investor Class SPPIX :: Service Class SPPSX
FUND NUMBERS :: Investor Class 117 :: Service Class 147 :: Short Precious Metals ProFund :: 233
234 :: Short Precious Metals ProFund :: TICKERS :: Investor Class SPPIX :: Service Class SPPSX
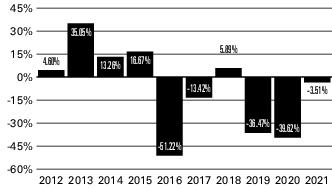
|
|
|
|
|
|
|
|
|
|
|
|
|
|
|
|
|
|
|
|
One
Year |
Five
Years |
Ten
Years |
Inception
Date |
|
Investor Class Shares |
|
|
|
|
|
– Before Taxes |
- |
- |
- |
|
|
– After Taxes on Distributions |
- |
- |
- |
|
|
– After Taxes on Distributions
and Sale of Shares |
- |
- |
- |
|
|
Service Class Shares |
- |
- |
- |
|
|
S&P 500®1 |
|
|
|
|
|
Dow Jones Precious MetalsSM
Index1 |
- |
|
- |
|
1
Management
The Fund is advised by ProFund Advisors. Michael Neches, Senior Portfolio Manager, and Tarak Davé, Portfolio Manager, have jointly and primarily managed the Fund since October 2013 and April 2018, respectively.
Purchase and Sale of Fund Shares
The minimum initial investment amounts for all classes, which may be waived at the discretion of the Fund, are:
•$5,000 for accounts that list a financial professional.
•$15,000 for self-directed accounts.
You may purchase, redeem or exchange Fund shares on any day which the New York Stock Exchange is open for business. Depending on where your account is held, you may redeem your shares by contacting your financial professional or the Fund by mail, telephone, wire transfer or on-line (www.profunds.com).
Tax Information
The Fund’s distributions generally are taxable, and will be taxed as ordinary income, qualified dividend income or capital gains, unless you are investing through a tax-advantaged arrangement, such as a 401(k) plan or an individual retirement account. You may be taxed later upon withdrawal of monies from such tax-advantaged arrangements. The Fund intends to distribute income, if any, and capital gains, if any, at least annually.
Payments to Broker-Dealers and Other Financial Intermediaries
If you purchase Fund shares through a financial intermediary, such as a broker-dealer or investment adviser, the Fund and its distributor may pay the intermediary for the sale of Fund shares and related services. These payments may create a conflict of interest by influencing the broker-dealer or other financial intermediary to recommend the Fund over another investment. Ask your financial intermediary or visit your financial intermediary’s website for more information.
FUND NUMBERS :: Investor Class 118 :: Service Class 148 :: Short Real Estate ProFund :: 235
Wire Fee $10
|
| ||
|
|
Investor
Class |
Service
Class |
|
Investment Advisory Fees |
|
|
|
Distribution and Service (12b-1) Fees |
|
|
|
Other Expenses |
|
|
|
Total Annual Fund Operating Expenses
Before Fee Waivers and Expense
Reimbursements |
|
|
|
Fee Waivers/Reimbursements1 |
- |
- |
|
Total Annual Fund Operating Expenses
After Fee Waivers and Expense
Reimbursements |
|
|
1
236 :: Short Real Estate ProFund :: TICKERS :: Investor Class SRPIX :: Service Class SRPSX
|
|
1 Year |
3 Years |
5 Years |
10 Years |
|
Investor Class |
$ |
$ |
$ |
$ |
|
Service Class |
$ |
$ |
$ |
$ |
FUND NUMBERS :: Investor Class 118 :: Service Class 148 :: Short Real Estate ProFund :: 237
238 :: Short Real Estate ProFund :: TICKERS :: Investor Class SRPIX :: Service Class SRPSX
|
| ||||||
|
|
| |||||
|
|
|
|
|
|
|
|
|
|
|
|
|
|
|
|
|
|
|
|
|
|
|
|
|
|
|
|
|
|
|
|
|
|
|
|
|
|
|
|
|
|
|
|
|
|
|
|
|
|
|
|
|
|
|
|
|
|
|
|
|
|
|
|
|
|
|
|
|
|
|
|
|
|
|
|
|
|
|
|
|
|
|
|
|
|
|
|
|
|
|
|
|
|
|
|
|
|
|
|
|
|
|
|
|
|
|
|
|
|
|
|
FUND NUMBERS :: Investor Class 118 :: Service Class 148 :: Short Real Estate ProFund :: 239
240 :: Short Real Estate ProFund :: TICKERS :: Investor Class SRPIX :: Service Class SRPSX
FUND NUMBERS :: Investor Class 118 :: Service Class 148 :: Short Real Estate ProFund :: 241
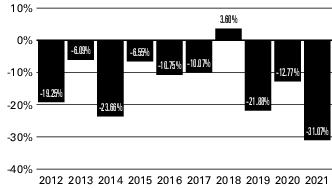
|
|
|
|
|
|
|
|
|
|
|
|
|
|
|
|
|
|
|
|
One
Year |
Five
Years |
Ten
Years |
Inception
Date |
|
Investor Class Shares |
|
|
|
|
|
– Before Taxes |
- |
- |
- |
|
|
– After Taxes on Distributions |
- |
- |
- |
|
|
– After Taxes on Distributions
and Sale of Shares |
- |
- |
- |
|
|
Service Class Shares |
- |
- |
- |
|
|
S&P 500®1 |
|
|
|
|
|
Dow Jones U.S. Real
EstateSM Index1 |
|
|
|
|
1
Management
The Fund is advised by ProFund Advisors. Michael Neches, Senior Portfolio Manager, and Tarak Davé, Portfolio Manager, have jointly and primarily managed the Fund since October 2013 and April 2018, respectively.
242 :: Short Real Estate ProFund :: TICKERS :: Investor Class SRPIX :: Service Class SRPSX
Purchase and Sale of Fund Shares
The minimum initial investment amounts for all classes, which may be waived at the discretion of the Fund, are:
•$5,000 for accounts that list a financial professional.
•$15,000 for self-directed accounts.
You may purchase, redeem or exchange Fund shares on any day which the New York Stock Exchange is open for business. Depending on where your account is held, you may redeem your shares by contacting your financial professional or the Fund by mail, telephone, wire transfer or on-line (www.profunds.com).
Tax Information
The Fund’s distributions generally are taxable, and will be taxed as ordinary income, qualified dividend income or capital gains, unless you are investing through a tax-advantaged arrangement,
such as a 401(k) plan or an individual retirement account. You may be taxed later upon withdrawal of monies from such tax-advantaged arrangements. The Fund intends to distribute income, if any, and capital gains, if any, at least annually.
Payments to Broker-Dealers and Other Financial Intermediaries
If you purchase Fund shares through a financial intermediary, such as a broker-dealer or investment adviser, the Fund and its distributor may pay the intermediary for the sale of Fund shares and related services. These payments may create a conflict of interest by influencing the broker-dealer or other financial intermediary to recommend the Fund over another investment. Ask your financial intermediary or visit your financial intermediary’s website for more information.
FUND NUMBERS :: Investor Class 064 :: Service Class 094 :: Short Small-Cap ProFund :: 243
Wire Fee $10
|
| ||
|
|
Investor
Class |
Service
Class |
|
Investment Advisory Fees |
|
|
|
Distribution and Service (12b-1) Fees |
|
|
|
Other Expenses |
|
|
|
Total Annual Fund Operating Expenses
Before Fee Waivers and Expense
Reimbursements |
|
|
|
Fee Waivers/Reimbursements1 |
- |
- |
|
Total Annual Fund Operating Expenses
After Fee Waivers and Expense
Reimbursements |
|
|
1
244 :: Short Small-Cap ProFund :: TICKERS :: Investor Class SHPIX :: Service Class SHPSX
|
|
1 Year |
3 Years |
5 Years |
10 Years |
|
Investor Class |
$ |
$ |
$ |
$ |
|
Service Class |
$ |
$ |
$ |
$ |
FUND NUMBERS :: Investor Class 064 :: Service Class 094 :: Short Small-Cap ProFund :: 245
246 :: Short Small-Cap ProFund :: TICKERS :: Investor Class SHPIX :: Service Class SHPSX
|
| ||||||
|
|
| |||||
|
|
|
|
|
|
|
|
|
|
|
|
|
|
|
|
|
|
|
|
|
|
|
|
|
|
|
|
|
|
|
|
|
|
|
|
|
|
|
|
|
|
|
|
|
|
|
|
|
|
|
|
|
|
|
|
|
|
|
|
|
|
|
|
|
|
|
|
|
|
|
|
|
|
|
|
|
|
|
|
|
|
|
|
|
|
|
|
|
|
|
|
|
|
|
|
|
|
|
|
|
|
|
|
|
|
|
|
|
|
|
|
FUND NUMBERS :: Investor Class 064 :: Service Class 094 :: Short Small-Cap ProFund :: 247
248 :: Short Small-Cap ProFund :: TICKERS :: Investor Class SHPIX :: Service Class SHPSX
FUND NUMBERS :: Investor Class 064 :: Service Class 094 :: Short Small-Cap ProFund :: 249
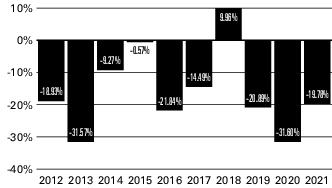
|
|
|
|
|
|
|
|
|
|
|
|
|
|
|
|
|
|
|
|
One
Year |
Five
Years |
Ten
Years |
Inception
Date |
|
Investor Class Shares |
|
|
|
|
|
– Before Taxes |
- |
- |
- |
|
|
– After Taxes on Distributions |
- |
- |
- |
|
|
– After Taxes on Distributions
and Sale of Shares |
- |
- |
- |
|
|
Service Class Shares |
- |
- |
- |
|
|
Russell 2000® Index1 |
|
|
|
|
1
250 :: Short Small-Cap ProFund :: TICKERS :: Investor Class SHPIX :: Service Class SHPSX
Management
The Fund is advised by ProFund Advisors. Michael Neches, Senior Portfolio Manager, and Devin Sullivan, Portfolio Manager, have jointly and primarily managed the Fund since October 2013 and April 2018, respectively.
Purchase and Sale of Fund Shares
The minimum initial investment amounts for all classes, which may be waived at the discretion of the Fund, are:
•$5,000 for accounts that list a financial professional.
•$15,000 for self-directed accounts.
You may purchase, redeem or exchange Fund shares on any day which the New York Stock Exchange is open for business. Depending on where your account is held, you may redeem your shares by contacting your financial professional or the Fund by mail, telephone, wire transfer or on-line (www.profunds.com).
Tax Information
The Fund’s distributions generally are taxable, and will be taxed as ordinary income, qualified dividend income or capital gains,
unless you are investing through a tax-advantaged arrangement, such as a 401(k) plan or an individual retirement account. You may be taxed later upon withdrawal of monies from such tax-advantaged arrangements. The Fund intends to distribute income, if any, and capital gains, if any, at least annually.
Payments to Broker-Dealers and Other Financial Intermediaries
If you purchase Fund shares through a financial intermediary, such as a broker-dealer or investment adviser, the Fund and its distributor may pay the intermediary for the sale of Fund shares and related services. These payments may create a conflict of interest by influencing the broker-dealer or other financial intermediary to recommend the Fund over another investment. Ask your financial intermediary or visit your financial intermediary’s website for more information.
FUND NUMBERS :: Investor Class 015 :: Service Class 035 :: Small-Cap Growth ProFund :: 251
Wire Fee $10
|
| ||
|
|
Investor
Class |
Service
Class |
|
Investment Advisory Fees |
|
|
|
Distribution and Service (12b-1) Fees |
|
|
|
Other Expenses |
|
|
|
Total Annual Fund Operating Expenses
Before Fee Waivers and Expense
Reimbursements |
|
|
|
Fee Waivers/Reimbursements1 |
- |
- |
|
Total Annual Fund Operating Expenses
After Fee Waivers and Expense
Reimbursements |
|
|
1
|
|
1 Year |
3 Years |
5 Years |
10 Years |
|
Investor Class |
$ |
$ |
$ |
$ |
|
Service Class |
$ |
$ |
$ |
$ |
252 :: Small-Cap Growth ProFund :: TICKERS :: Investor Class SGPIX :: Service Class SGPSX
FUND NUMBERS :: Investor Class 015 :: Service Class 035 :: Small-Cap Growth ProFund :: 253
254 :: Small-Cap Growth ProFund :: TICKERS :: Investor Class SGPIX :: Service Class SGPSX
FUND NUMBERS :: Investor Class 015 :: Service Class 035 :: Small-Cap Growth ProFund :: 255
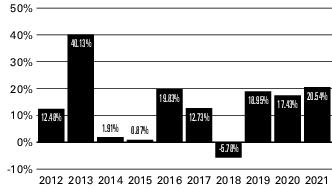
|
|
|
|
|
|
|
|
|
|
|
|
|
|
|
|
|
|
|
|
One
Year |
Five
Years |
Ten
Years |
Inception
Date |
|
Investor Class Shares |
|
|
|
|
|
– Before Taxes |
|
|
|
|
|
– After Taxes on Distributions |
|
|
|
|
|
– After Taxes on Distributions
and Sale of Shares |
|
|
|
|
|
Service Class Shares |
|
|
|
|
|
S&P SmallCap 600® Growth
Index1 |
|
|
|
|
1
Management
The Fund is advised by ProFund Advisors. Michael Neches, Senior Portfolio Manager, and Devin Sullivan, Portfolio Manager, have jointly and primarily managed the Fund since October 2013 and April 2018, respectively.
Purchase and Sale of Fund Shares
The minimum initial investment amounts for all classes, which may be waived at the discretion of the Fund, are:
•$5,000 for accounts that list a financial professional.
•$15,000 for self-directed accounts.
You may purchase, redeem or exchange Fund shares on any day which the New York Stock Exchange is open for business. Depending on where your account is held, you may redeem your shares by contacting your financial professional or the Fund by mail, telephone, wire transfer or on-line (www.profunds.com).
Tax Information
The Fund’s distributions generally are taxable, and will be taxed as ordinary income, qualified dividend income or capital gains, unless you are investing through a tax-advantaged arrangement, such as a 401(k) plan or an individual retirement account. You may be taxed later upon withdrawal of monies from such tax-advantaged arrangements. The Fund intends to distribute income, if any, and capital gains, if any, at least annually.
Payments to Broker-Dealers and Other Financial Intermediaries
If you purchase Fund shares through a financial intermediary, such as a broker-dealer or investment adviser, the Fund and its distributor may pay the intermediary for the sale of Fund shares and related services. These payments may create a conflict of interest by influencing the broker-dealer or other financial intermediary to recommend the Fund over another investment. Ask your financial intermediary or visit your financial intermediary’s website for more information.
256 :: Small-Cap ProFund :: TICKERS :: Investor Class SLPIX :: Service Class SLPSX
Wire Fee $10
|
| ||
|
|
Investor
Class |
Service
Class |
|
Investment Advisory Fees |
|
|
|
Distribution and Service (12b-1) Fees |
|
|
|
Other Expenses |
|
|
|
Total Annual Fund Operating Expenses
Before Fee Waivers and Expense
Reimbursements |
|
|
|
Fee Waivers/Reimbursements1 |
- |
- |
|
Total Annual Fund Operating Expenses
After Fee Waivers and Expense
Reimbursements |
|
|
1
|
|
1 Year |
3 Years |
5 Years |
10 Years |
|
Investor Class |
$ |
$ |
$ |
$ |
|
Service Class |
$ |
$ |
$ |
$ |
FUND NUMBERS :: Investor Class 013 :: Service Class 033 :: Small-Cap ProFund :: 257
258 :: Small-Cap ProFund :: TICKERS :: Investor Class SLPIX :: Service Class SLPSX
FUND NUMBERS :: Investor Class 013 :: Service Class 033 :: Small-Cap ProFund :: 259
260 :: Small-Cap ProFund :: TICKERS :: Investor Class SLPIX :: Service Class SLPSX
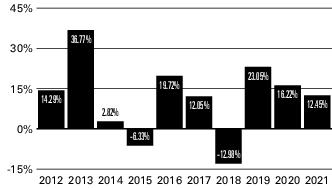
|
|
|
|
|
|
|
|
|
|
|
|
|
|
|
|
|
|
|
|
One
Year |
Five
Years |
Ten
Years |
Inception
Date |
|
Investor Class Shares |
|
|
|
|
|
– Before Taxes |
|
|
|
|
|
– After Taxes on Distributions |
|
|
|
|
|
– After Taxes on Distributions
and Sale of Shares |
|
|
|
|
|
Service Class Shares |
|
|
|
|
|
Russell 2000® Index1 |
|
|
|
|
1
Management
The Fund is advised by ProFund Advisors. Michael Neches, Senior Portfolio Manager, and Devin Sullivan, Portfolio Manager, have jointly and primarily managed the Fund since October 2013 and April 2018, respectively.
Purchase and Sale of Fund Shares
The minimum initial investment amounts for all classes, which may be waived at the discretion of the Fund, are:
•$5,000 for accounts that list a financial professional.
•$15,000 for self-directed accounts.
You may purchase, redeem or exchange Fund shares on any day which the New York Stock Exchange is open for business. Depending on where your account is held, you may redeem your shares by contacting your financial professional or the Fund by mail, telephone, wire transfer or on-line (www.profunds.com).
FUND NUMBERS :: Investor Class 013 :: Service Class 033 :: Small-Cap ProFund :: 261
Tax Information
The Fund’s distributions generally are taxable, and will be taxed as ordinary income, qualified dividend income or capital gains, unless you are investing through a tax-advantaged arrangement, such as a 401(k) plan or an individual retirement account. You may be taxed later upon withdrawal of monies from such tax-advantaged arrangements. The Fund intends to distribute income, if any, and capital gains, if any, at least annually.
Payments to Broker-Dealers and Other Financial Intermediaries
If you purchase Fund shares through a financial intermediary, such as a broker-dealer or investment adviser, the Fund and its
distributor may pay the intermediary for the sale of Fund shares and related services. These payments may create a conflict of interest by influencing the broker-dealer or other financial intermediary to recommend the Fund over another investment. Ask your financial intermediary or visit your financial intermediary’s website for more information.
262 :: Small-Cap Value ProFund :: TICKERS :: Investor Class SVPIX :: Service Class SVPSX
Wire Fee $10
|
| ||
|
|
Investor
Class |
Service
Class |
|
Investment Advisory Fees |
|
|
|
Distribution and Service (12b-1) Fees |
|
|
|
Other Expenses |
|
|
|
Total Annual Fund Operating Expenses1 |
|
|
1
|
|
1 Year |
3 Years |
5 Years |
10 Years |
|
Investor Class |
$ |
$ |
$ |
$ |
|
Service Class |
$ |
$ |
$ |
$ |
FUND NUMBERS :: Investor Class 014 :: Service Class 034 :: Small-Cap Value ProFund :: 263
264 :: Small-Cap Value ProFund :: TICKERS :: Investor Class SVPIX :: Service Class SVPSX
FUND NUMBERS :: Investor Class 014 :: Service Class 034 :: Small-Cap Value ProFund :: 265
266 :: Small-Cap Value ProFund :: TICKERS :: Investor Class SVPIX :: Service Class SVPSX
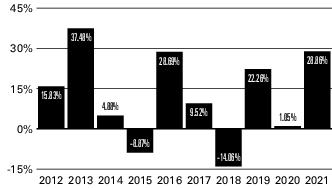
|
|
|
|
|
|
|
|
|
|
|
|
|
|
|
|
|
|
|
|
One
Year |
Five
Years |
Ten
Years |
Inception
Date |
|
Investor Class Shares |
|
|
|
|
|
– Before Taxes |
|
|
|
|
|
– After Taxes on Distributions |
|
|
|
|
|
– After Taxes on Distributions
and Sale of Shares |
|
|
|
|
|
Service Class Shares |
|
|
|
|
|
S&P SmallCap 600® Value
Index1 |
|
|
|
|
1
Management
The Fund is advised by ProFund Advisors. Michael Neches, Senior Portfolio Manager, and Devin Sullivan, Portfolio Manager, have jointly and primarily managed the Fund since October 2013 and April 2018, respectively.
Purchase and Sale of Fund Shares
The minimum initial investment amounts for all classes, which may be waived at the discretion of the Fund, are:
•$5,000 for accounts that list a financial professional.
•$15,000 for self-directed accounts.
You may purchase, redeem or exchange Fund shares on any day which the New York Stock Exchange is open for business. Depending on where your account is held, you may redeem your shares by contacting your financial professional or the Fund by mail, telephone, wire transfer or on-line (www.profunds.com).
Tax Information
The Fund’s distributions generally are taxable, and will be taxed as ordinary income, qualified dividend income or capital gains, unless you are investing through a tax-advantaged arrangement, such as a 401(k) plan or an individual retirement account. You may be taxed later upon withdrawal of monies from such tax-advantaged arrangements. The Fund intends to distribute income, if any, and capital gains, if any, at least annually.
Payments to Broker-Dealers and Other Financial Intermediaries
If you purchase Fund shares through a financial intermediary, such as a broker-dealer or investment adviser, the Fund and its distributor may pay the intermediary for the sale of Fund shares and related services. These payments may create a conflict of interest by influencing the broker-dealer or other financial intermediary to recommend the Fund over another investment. Ask your financial intermediary or visit your financial intermediary’s website for more information.
FUND NUMBERS :: Investor Class 054 :: Service Class 084 :: Technology UltraSector ProFund :: 267
Wire Fee $10
|
| ||
|
|
Investor
Class |
Service
Class |
|
Investment Advisory Fees |
|
|
|
Distribution and Service (12b-1) Fees |
|
|
|
Other Expenses |
|
|
|
Total Annual Fund Operating Expenses1 |
|
|
1
|
|
1 Year |
3 Years |
5 Years |
10 Years |
|
Investor Class |
$ |
$ |
$ |
$ |
|
Service Class |
$ |
$ |
$ |
$ |
268 :: Technology UltraSector ProFund :: TICKERS :: Investor Class TEPIX :: Service Class TEPSX
FUND NUMBERS :: Investor Class 054 :: Service Class 084 :: Technology UltraSector ProFund :: 269
270 :: Technology UltraSector ProFund :: TICKERS :: Investor Class TEPIX :: Service Class TEPSX
|
| ||||||
|
|
| |||||
|
|
|
|
|
|
|
|
|
|
|
|
|
|
|
|
|
|
|
|
|
|
|
|
|
|
|
|
|
|
|
|
|
|
|
|
|
|
|
|
|
|
|
|
|
|
|
|
|
|
|
|
|
|
|
|
|
|
|
|
|
|
|
|
|
|
|
|
|
|
|
|
|
|
|
|
|
|
|
|
|
|
|
|
|
|
|
|
|
|
|
|
|
|
|
|
|
|
|
|
|
|
|
|
|
|
|
|
|
|
|
|
FUND NUMBERS :: Investor Class 054 :: Service Class 084 :: Technology UltraSector ProFund :: 271
272 :: Technology UltraSector ProFund :: TICKERS :: Investor Class TEPIX :: Service Class TEPSX
FUND NUMBERS :: Investor Class 054 :: Service Class 084 :: Technology UltraSector ProFund :: 273
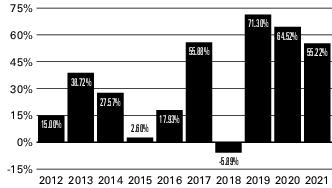
|
|
|
|
|
|
|
|
|
|
|
|
|
|
|
|
|
|
|
|
One
Year |
Five
Years |
Ten
Years |
Inception
Date |
|
Investor Class Shares |
|
|
|
|
|
– Before Taxes |
|
|
|
|
|
– After Taxes on Distributions |
|
|
|
|
|
– After Taxes on Distributions
and Sale of Shares |
|
|
|
|
|
Service Class Shares |
|
|
|
|
|
S&P 500®1 |
|
|
|
|
|
Dow Jones U.S. TechnologySM
Index1 |
|
|
|
|
1
Management
The Fund is advised by ProFund Advisors. Michael Neches, Senior Portfolio Manager, and Tarak Davé, Portfolio Manager, have jointly and primarily managed the Fund since October 2013 and April 2018, respectively.
Purchase and Sale of Fund Shares
The minimum initial investment amounts for all classes, which may be waived at the discretion of the Fund, are:
•$5,000 for accounts that list a financial professional.
•$15,000 for self-directed accounts.
You may purchase, redeem or exchange Fund shares on any day which the New York Stock Exchange is open for business. Depending on where your account is held, you may redeem your shares by contacting your financial professional or the Fund by mail, telephone, wire transfer or on-line (www.profunds.com).
274 :: Technology UltraSector ProFund :: TICKERS :: Investor Class TEPIX :: Service Class TEPSX
Tax Information
The Fund’s distributions generally are taxable, and will be taxed as ordinary income, qualified dividend income or capital gains, unless you are investing through a tax-advantaged arrangement, such as a 401(k) plan or an individual retirement account. You may be taxed later upon withdrawal of monies from such tax-advantaged arrangements. The Fund intends to distribute income, if any, and capital gains, if any, at least annually.
Payments to Broker-Dealers and Other Financial Intermediaries
If you purchase Fund shares through a financial intermediary, such as a broker-dealer or investment adviser, the Fund and its
distributor may pay the intermediary for the sale of Fund shares and related services. These payments may create a conflict of interest by influencing the broker-dealer or other financial intermediary to recommend the Fund over another investment. Ask your financial intermediary or visit your financial intermediary’s website for more information.
FUND NUMBERS :: Investor Class 055 :: Service Class 085 :: Telecommunications UltraSector ProFund :: 275
Wire Fee $10
|
| ||
|
|
Investor
Class |
Service
Class |
|
Investment Advisory Fees |
|
|
|
Distribution and Service (12b-1) Fees |
|
|
|
Other Expenses |
|
|
|
Total Annual Fund Operating Expenses
Before Fee Waivers and Expense
Reimbursements |
|
|
|
Fee Waivers/Reimbursements1 |
- |
- |
|
Total Annual Fund Operating Expenses
After Fee Waivers and Expense
Reimbursements |
|
|
1
276 :: Telecommunications UltraSector ProFund :: TICKERS :: Investor Class TCPIX :: Service Class TCPSX
|
|
1 Year |
3 Years |
5 Years |
10 Years |
|
Investor Class |
$ |
$ |
$ |
$ |
|
Service Class |
$ |
$ |
$ |
$ |
FUND NUMBERS :: Investor Class 055 :: Service Class 085 :: Telecommunications UltraSector ProFund :: 277
278 :: Telecommunications UltraSector ProFund :: TICKERS :: Investor Class TCPIX :: Service Class TCPSX
|
| ||||||
|
|
| |||||
|
|
|
|
|
|
|
|
|
|
|
|
|
|
|
|
|
|
|
|
|
|
|
|
|
|
|
|
|
|
|
|
|
|
|
|
|
|
|
|
|
|
|
|
|
|
|
|
|
|
|
|
|
|
|
|
|
|
|
|
|
|
|
|
|
|
|
|
|
|
|
|
|
|
|
|
|
|
|
|
|
|
|
|
|
|
|
|
|
|
|
|
|
|
|
|
|
|
|
|
|
|
|
|
|
|
|
|
|
|
|
|
FUND NUMBERS :: Investor Class 055 :: Service Class 085 :: Telecommunications UltraSector ProFund :: 279
280 :: Telecommunications UltraSector ProFund :: TICKERS :: Investor Class TCPIX :: Service Class TCPSX
FUND NUMBERS :: Investor Class 055 :: Service Class 085 :: Telecommunications UltraSector ProFund :: 281
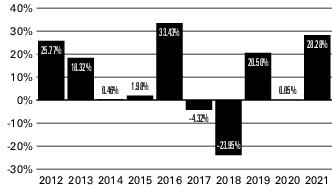
|
|
|
|
|
|
|
|
|
|
|
|
|
|
|
|
|
|
|
|
One
Year |
Five
Years |
Ten
Years |
Inception
Date |
|
Investor Class Shares |
|
|
|
|
|
– Before Taxes |
|
|
|
|
|
– After Taxes on Distributions |
|
|
|
|
|
– After Taxes on Distributions
and Sale of Shares |
|
|
|
|
|
Service Class Shares |
|
|
|
|
|
S&P 500®1 |
|
|
|
|
|
Dow Jones U.S. Select
TelecommunicationsSM Index1 |
|
|
|
|
1
Management
The Fund is advised by ProFund Advisors. Michael Neches, Senior Portfolio Manager, and Tarak Davé, Portfolio Manager, have jointly and primarily managed the Fund since October 2013 and April 2018, respectively.
Purchase and Sale of Fund Shares
The minimum initial investment amounts for all classes, which may be waived at the discretion of the Fund, are:
•$5,000 for accounts that list a financial professional.
•$15,000 for self-directed accounts.
You may purchase, redeem or exchange Fund shares on any day which the New York Stock Exchange is open for business. Depending on where your account is held, you may redeem your shares by contacting your financial professional or the Fund by mail, telephone, wire transfer or on-line (www.profunds.com).
Tax Information
The Fund’s distributions generally are taxable, and will be taxed as ordinary income, qualified dividend income or capital gains, unless you are investing through a tax-advantaged arrangement, such as a 401(k) plan or an individual retirement account. You may be taxed later upon withdrawal of monies from such tax-advantaged arrangements. The Fund intends to distribute income, if any, and capital gains, if any, at least annually.
Payments to Broker-Dealers and Other Financial Intermediaries
If you purchase Fund shares through a financial intermediary, such as a broker-dealer or investment adviser, the Fund and its distributor may pay the intermediary for the sale of Fund shares and related services. These payments may create a conflict of interest by influencing the broker-dealer or other financial intermediary to recommend the Fund over another investment. Ask your financial intermediary or visit your financial intermediary’s website for more information.
282 :: UltraBear ProFund :: TICKERS :: Investor Class URPIX :: Service Class URPSX
Wire Fee $10
|
| ||
|
|
Investor
Class |
Service
Class |
|
Investment Advisory Fees |
|
|
|
Distribution and Service (12b-1) Fees |
|
|
|
Other Expenses |
|
|
|
Total Annual Fund Operating Expenses
Before Fee Waivers and Expense
Reimbursements |
|
|
|
Fee Waivers/Reimbursements1 |
- |
- |
|
Total Annual Fund Operating Expenses
After Fee Waivers and Expense
Reimbursements |
|
|
1
FUND NUMBERS :: Investor Class 007 :: Service Class 027 :: UltraBear ProFund :: 283
|
|
1 Year |
3 Years |
5 Years |
10 Years |
|
Investor Class |
$ |
$ |
$ |
$ |
|
Service Class |
$ |
$ |
$ |
$ |
284 :: UltraBear ProFund :: TICKERS :: Investor Class URPIX :: Service Class URPSX
FUND NUMBERS :: Investor Class 007 :: Service Class 027 :: UltraBear ProFund :: 285
|
|
| |||||
|
|
|
| ||||
|
|
|
|
|
|
|
|
|
|
|
|
|
|
|
|
|
|
|
|
|
|
|
|
|
|
|
|
|
|
|
|
|
|
|
|
|
|
|
|
|
|
|
|
|
|
|
|
|
|
|
|
|
|
|
|
|
|
|
|
|
|
|
|
|
|
|
|
|
|
|
|
|
|
|
|
|
|
|
|
|
|
|
|
|
|
|
|
|
|
|
|
|
|
|
|
|
|
|
|
|
|
|
|
|
|
|
|
|
|
|
|
286 :: UltraBear ProFund :: TICKERS :: Investor Class URPIX :: Service Class URPSX
FUND NUMBERS :: Investor Class 007 :: Service Class 027 :: UltraBear ProFund :: 287
288 :: UltraBear ProFund :: TICKERS :: Investor Class URPIX :: Service Class URPSX
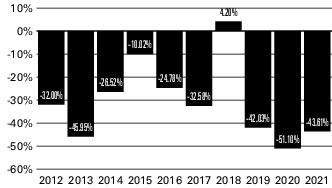
|
|
|
|
|
|
|
|
|
|
|
|
|
|
|
|
|
|
|
|
One
Year |
Five
Years |
Ten
Years |
Inception
Date |
|
Investor Class Shares |
|
|
|
|
|
– Before Taxes |
- |
- |
- |
|
|
– After Taxes on
Distributions |
- |
- |
- |
|
|
– After Taxes on
Distributions and Sale of
Shares |
- |
- |
- |
|
|
Service Class Shares |
- |
- |
- |
|
|
S&P 500®1 |
|
|
|
|
1
Management
The Fund is advised by ProFund Advisors. Michael Neches, Senior Portfolio Manager, and Devin Sullivan, Portfolio Manager, have jointly and primarily managed the Fund since October 2013 and April 2018, respectively.
FUND NUMBERS :: Investor Class 007 :: Service Class 027 :: UltraBear ProFund :: 289
Purchase and Sale of Fund Shares
The minimum initial investment amounts for all classes, which may be waived at the discretion of the Fund, are:
•$5,000 for accounts that list a financial professional.
•$15,000 for self-directed accounts.
You may purchase, redeem or exchange Fund shares on any day which the New York Stock Exchange is open for business. Depending on where your account is held, you may redeem your shares by contacting your financial professional or the Fund by mail, telephone, wire transfer or on-line (www.profunds.com).
Tax Information
The Fund’s distributions generally are taxable, and will be taxed as ordinary income, qualified dividend income or capital gains, unless you are investing through a tax-advantaged arrangement,
such as a 401(k) plan or an individual retirement account. You may be taxed later upon withdrawal of monies from such tax-advantaged arrangements. The Fund intends to distribute income, if any, and capital gains, if any, at least annually.
Payments to Broker-Dealers and Other Financial Intermediaries
If you purchase Fund shares through a financial intermediary, such as a broker-dealer or investment adviser, the Fund and its distributor may pay the intermediary for the sale of Fund shares and related services. These payments may create a conflict of interest by influencing the broker-dealer or other financial intermediary to recommend the Fund over another investment. Ask your financial intermediary or visit your financial intermediary’s website for more information.
290 :: UltraBull ProFund :: TICKERS :: Investor Class ULPIX :: Service Class ULPSX
Wire Fee $10
|
| ||
|
|
Investor
Class |
Service
Class |
|
Investment Advisory Fees |
|
|
|
Distribution and Service (12b-1) Fees |
|
|
|
Other Expenses |
|
|
|
Total Annual Fund Operating Expenses1 |
|
|
1
|
|
1 Year |
3 Years |
5 Years |
10 Years |
|
Investor Class |
$ |
$ |
$ |
$ |
|
Service Class |
$ |
$ |
$ |
$ |
FUND NUMBERS :: Investor Class 005 :: Service Class 025 :: UltraBull ProFund :: 291
292 :: UltraBull ProFund :: TICKERS :: Investor Class ULPIX :: Service Class ULPSX
FUND NUMBERS :: Investor Class 005 :: Service Class 025 :: UltraBull ProFund :: 293
|
| ||||||
|
|
| |||||
|
|
|
|
|
|
|
|
|
|
|
|
|
|
|
|
|
|
|
|
|
|
|
|
|
|
|
|
|
|
|
|
|
|
|
|
|
|
|
|
|
|
|
|
|
|
|
|
|
|
|
|
|
|
|
|
|
|
|
|
|
|
|
|
|
|
|
|
|
|
|
|
|
|
|
|
|
|
|
|
|
|
|
|
|
|
|
|
|
|
|
|
|
|
|
|
|
|
|
|
|
|
|
|
|
|
|
|
|
|
|
|
294 :: UltraBull ProFund :: TICKERS :: Investor Class ULPIX :: Service Class ULPSX
FUND NUMBERS :: Investor Class 005 :: Service Class 025 :: UltraBull ProFund :: 295
296 :: UltraBull ProFund :: TICKERS :: Investor Class ULPIX :: Service Class ULPSX
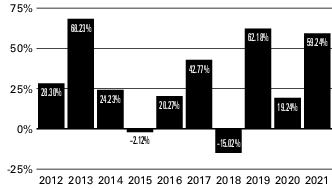
|
|
|
|
|
|
|
|
|
|
|
|
|
|
|
|
|
|
|
|
One
Year |
Five
Years |
Ten
Years |
Inception
Date |
|
Investor Class Shares |
|
|
|
|
|
– Before Taxes |
|
|
|
|
|
– After Taxes on Distributions |
|
|
|
|
|
– After Taxes on Distributions
and Sale of Shares |
|
|
|
|
|
Service Class Shares |
|
|
|
|
|
S&P 500®1 |
|
|
|
|
1
Management
The Fund is advised by ProFund Advisors. Michael Neches, Senior Portfolio Manager, and Devin Sullivan, Portfolio Manager, have jointly and primarily managed the Fund since October 2013 and April 2018, respectively.
Purchase and Sale of Fund Shares
The minimum initial investment amounts for all classes, which may be waived at the discretion of the Fund, are:
•$5,000 for accounts that list a financial professional.
•$15,000 for self-directed accounts.
You may purchase, redeem or exchange Fund shares on any day which the New York Stock Exchange is open for business. Depending on where your account is held, you may redeem your shares by contacting your financial professional or the Fund by mail, telephone, wire transfer or on-line (www.profunds.com).
Tax Information
The Fund’s distributions generally are taxable, and will be taxed as ordinary income, qualified dividend income or capital gains, unless you are investing through a tax-advantaged arrangement, such as a 401(k) plan or an individual retirement account. You may be taxed later upon withdrawal of monies from such tax-advantaged arrangements. The Fund intends to distribute income, if any, and capital gains, if any, at least annually.
Payments to Broker-Dealers and Other Financial Intermediaries
If you purchase Fund shares through a financial intermediary, such as a broker-dealer or investment adviser, the Fund and its distributor may pay the intermediary for the sale of Fund shares and related services. These payments may create a conflict of interest by influencing the broker-dealer or other financial intermediary to recommend the Fund over another investment. Ask your financial intermediary or visit your financial intermediary’s website for more information.
FUND NUMBERS :: Investor Class 168 :: Service Class 198 :: UltraChina ProFund :: 297
Wire Fee $10
|
| ||
|
|
Investor
Class |
Service
Class |
|
Investment Advisory Fees |
|
|
|
Distribution and Service (12b-1) Fees |
|
|
|
Other Expenses |
|
|
|
Total Annual Fund Operating Expenses1 |
|
|
1
|
|
1 Year |
3 Years |
5 Years |
10 Years |
|
Investor Class |
$ |
$ |
$ |
$ |
|
Service Class |
$ |
$ |
$ |
$ |
298 :: UltraChina ProFund :: TICKERS :: Investor Class UGPIX :: Service Class UGPSX
FUND NUMBERS :: Investor Class 168 :: Service Class 198 :: UltraChina ProFund :: 299
300 :: UltraChina ProFund :: TICKERS :: Investor Class UGPIX :: Service Class UGPSX
|
| ||||||
|
|
| |||||
|
|
|
|
|
|
|
|
|
|
|
|
|
|
|
|
|
|
|
|
|
|
|
|
|
|
|
|
|
|
|
|
|
|
|
|
|
|
|
|
|
|
|
|
|
|
|
|
|
|
|
|
|
|
|
|
|
|
|
|
|
|
|
|
|
|
|
|
|
|
|
|
|
|
|
|
|
|
|
|
|
|
|
|
|
|
|
|
|
|
|
|
|
|
|
|
|
|
|
|
|
|
|
|
|
|
|
|
|
|
|
|
FUND NUMBERS :: Investor Class 168 :: Service Class 198 :: UltraChina ProFund :: 301
302 :: UltraChina ProFund :: TICKERS :: Investor Class UGPIX :: Service Class UGPSX
FUND NUMBERS :: Investor Class 168 :: Service Class 198 :: UltraChina ProFund :: 303
304 :: UltraChina ProFund :: TICKERS :: Investor Class UGPIX :: Service Class UGPSX
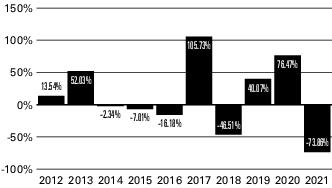
|
|
|
|
|
|
|
|
|
|
|
|
|
|
|
|
|
|
|
|
One
Year |
Five
Years |
Ten
Years |
Inception
Date |
|
Investor Class Shares |
|
|
|
|
|
– Before Taxes |
- |
- |
- |
|
|
– After Taxes on Distributions |
- |
- |
- |
|
|
– After Taxes on Distributions
and Sale of Shares |
- |
- |
- |
|
|
Service Class Shares |
- |
- |
- |
|
|
S&P China Select ADR Index
(USD)1 |
- |
|
|
|
1
FUND NUMBERS :: Investor Class 168 :: Service Class 198 :: UltraChina ProFund :: 305
Management
The Fund is advised by ProFund Advisors. Alexander Ilyasov, Senior Portfolio Manager, and Scott Hanson, Portfolio Manager, have jointly and primarily managed the Fund since August 2020 and August 2016, respectively.
Purchase and Sale of Fund Shares
The minimum initial investment amounts for all classes, which may be waived at the discretion of the Fund, are:
•$5,000 for accounts that list a financial professional.
•$15,000 for self-directed accounts.
You may purchase, redeem or exchange Fund shares on any day which the New York Stock Exchange is open for business. Depending on where your account is held, you may redeem your
shares by contacting your financial professional or the Fund by mail, telephone, wire transfer or on-line (www.profunds.com).
Tax Information
The Fund’s distributions generally are taxable, and will be taxed as ordinary income, qualified dividend income or capital gains, unless you are investing through a tax-advantaged arrangement, such as a 401(k) plan or an individual retirement account. You may be taxed later upon withdrawal of monies from such tax-advantaged arrangements. The Fund intends to distribute income, if any, and capital gains, if any, at least annually.
Payments to Broker-Dealers and Other Financial Intermediaries
If you purchase Fund shares through a financial intermediary, such as a broker-dealer or investment adviser, the Fund and its distributor may pay the intermediary for the sale of Fund shares and related services. These payments may create a conflict of interest by influencing the broker-dealer or other financial intermediary to recommend the Fund over another investment. Ask your financial intermediary or visit your financial intermediary’s website for more information.
306 :: UltraDow 30 ProFund :: TICKERS :: Investor Class UDPIX :: Service Class UDPSX
Wire Fee $10
|
| ||
|
|
Investor
Class |
Service
Class |
|
Investment Advisory Fees |
|
|
|
Distribution and Service (12b-1) Fees |
|
|
|
Other Expenses |
|
|
|
Total Annual Fund Operating Expenses1 |
|
|
1
|
|
1 Year |
3 Years |
5 Years |
10 Years |
|
Investor Class |
$ |
$ |
$ |
$ |
|
Service Class |
$ |
$ |
$ |
$ |
FUND NUMBERS :: Investor Class 067 :: Service Class 097 :: UltraDow 30 ProFund :: 307
308 :: UltraDow 30 ProFund :: TICKERS :: Investor Class UDPIX :: Service Class UDPSX
FUND NUMBERS :: Investor Class 067 :: Service Class 097 :: UltraDow 30 ProFund :: 309
|
| ||||||
|
|
| |||||
|
|
|
|
|
|
|
|
|
|
|
|
|
|
|
|
|
|
|
|
|
|
|
|
|
|
|
|
|
|
|
|
|
|
|
|
|
|
|
|
|
|
|
|
|
|
|
|
|
|
|
|
|
|
|
|
|
|
|
|
|
|
|
|
|
|
|
|
|
|
|
|
|
|
|
|
|
|
|
|
|
|
|
|
|
|
|
|
|
|
|
|
|
|
|
|
|
|
|
|
|
|
|
|
|
|
|
|
|
|
|
|
310 :: UltraDow 30 ProFund :: TICKERS :: Investor Class UDPIX :: Service Class UDPSX
FUND NUMBERS :: Investor Class 067 :: Service Class 097 :: UltraDow 30 ProFund :: 311
312 :: UltraDow 30 ProFund :: TICKERS :: Investor Class UDPIX :: Service Class UDPSX
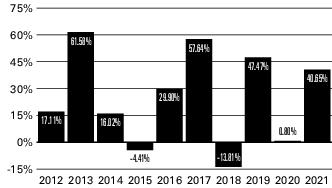
|
|
|
|
|
|
|
|
|
|
|
|
|
|
|
|
|
|
|
|
One
Year |
Five
Years |
Ten
Years |
Inception
Date |
|
Investor Class Shares |
|
|
|
|
|
– Before Taxes |
|
|
|
|
|
– After Taxes on Distributions |
|
|
|
|
|
– After Taxes on Distributions
and Sale of Shares |
|
|
|
|
|
Service Class Shares |
|
|
|
|
|
Dow Jones Industrial
Average®1 |
|
|
|
|
1
Management
The Fund is advised by ProFund Advisors. Michael Neches, Senior Portfolio Manager, and Devin Sullivan, Portfolio Manager, have jointly and primarily managed the Fund since October 2013 and April 2018, respectively.
Purchase and Sale of Fund Shares
The minimum initial investment amounts for all classes, which may be waived at the discretion of the Fund, are:
•$5,000 for accounts that list a financial professional.
•$15,000 for self-directed accounts.
You may purchase, redeem or exchange Fund shares on any day which the New York Stock Exchange is open for business. Depending on where your account is held, you may redeem your shares by contacting your financial professional or the Fund by mail, telephone, wire transfer or on-line (www.profunds.com).
FUND NUMBERS :: Investor Class 067 :: Service Class 097 :: UltraDow 30 ProFund :: 313
Tax Information
The Fund’s distributions generally are taxable, and will be taxed as ordinary income, qualified dividend income or capital gains, unless you are investing through a tax-advantaged arrangement, such as a 401(k) plan or an individual retirement account. You may be taxed later upon withdrawal of monies from such tax-advantaged arrangements. The Fund intends to distribute income, if any, and capital gains, if any, at least annually.
Payments to Broker-Dealers and Other Financial Intermediaries
If you purchase Fund shares through a financial intermediary, such as a broker-dealer or investment adviser, the Fund and its
distributor may pay the intermediary for the sale of Fund shares and related services. These payments may create a conflict of interest by influencing the broker-dealer or other financial intermediary to recommend the Fund over another investment. Ask your financial intermediary or visit your financial intermediary’s website for more information.
314 :: UltraEmerging Markets ProFund :: TICKERS :: Investor Class UUPIX :: Service Class UUPSX
Wire Fee $10
|
| ||
|
|
Investor
Class |
Service
Class |
|
Investment Advisory Fees |
|
|
|
Distribution and Service (12b-1) Fees |
|
|
|
Other Expenses |
|
|
|
Total Annual Fund Operating Expenses
Before Fee Waivers and Expense
Reimbursements |
|
|
|
Fee Waivers/Reimbursements1 |
- |
- |
|
Total Annual Fund Operating Expenses
After Fee Waivers and Expense
Reimbursements |
|
|
1
FUND NUMBERS :: Investor Class 162 :: Service Class 192 :: UltraEmerging Markets ProFund :: 315
|
|
1 Year |
3 Years |
5 Years |
10 Years |
|
Investor Class |
$ |
$ |
$ |
$ |
|
Service Class |
$ |
$ |
$ |
$ |
316 :: UltraEmerging Markets ProFund :: TICKERS :: Investor Class UUPIX :: Service Class UUPSX
FUND NUMBERS :: Investor Class 162 :: Service Class 192 :: UltraEmerging Markets ProFund :: 317
|
| ||||||
|
|
| |||||
|
|
|
|
|
|
|
|
|
|
|
|
|
|
|
|
|
|
|
|
|
|
|
|
|
|
|
|
|
|
|
|
|
|
|
|
|
|
|
|
|
|
|
|
|
|
|
|
|
|
|
|
|
|
|
|
|
|
|
|
|
|
|
|
|
|
|
|
|
|
|
|
|
|
|
|
|
|
|
|
|
|
|
|
|
|
|
|
|
|
|
|
|
|
|
|
|
|
|
|
|
|
|
|
|
|
|
|
|
|
|
|
318 :: UltraEmerging Markets ProFund :: TICKERS :: Investor Class UUPIX :: Service Class UUPSX
FUND NUMBERS :: Investor Class 162 :: Service Class 192 :: UltraEmerging Markets ProFund :: 319
320 :: UltraEmerging Markets ProFund :: TICKERS :: Investor Class UUPIX :: Service Class UUPSX
FUND NUMBERS :: Investor Class 162 :: Service Class 192 :: UltraEmerging Markets ProFund :: 321
322 :: UltraEmerging Markets ProFund :: TICKERS :: Investor Class UUPIX :: Service Class UUPSX
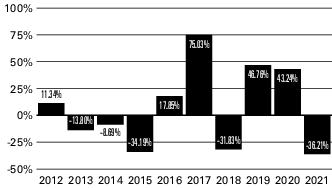
|
|
|
|
|
|
|
|
|
|
|
|
|
|
|
|
|
|
|
|
One
Year |
Five
Years |
Ten
Years |
Inception
Date |
|
Investor Class Shares |
|
|
|
|
|
– Before Taxes |
- |
|
|
|
|
– After Taxes on Distributions |
- |
|
|
|
|
– After Taxes on Distributions
and Sale of Shares |
- |
|
|
|
|
Service Class Shares |
- |
|
- |
|
|
S&P Emerging 50 ADR Index
(USD)1 |
- |
|
|
|
1
Management
The Fund is advised by ProFund Advisors. Alexander Ilyasov, Senior Portfolio Manager, and Scott Hanson, Portfolio Manager, have jointly and primarily managed the Fund since August 2020 and August 2016, respectively.
Purchase and Sale of Fund Shares
The minimum initial investment amounts for all classes, which may be waived at the discretion of the Fund, are:
•$5,000 for accounts that list a financial professional.
•$15,000 for self-directed accounts.
You may purchase, redeem or exchange Fund shares on any day which the New York Stock Exchange is open for business. Depending on where your account is held, you may redeem your shares by contacting your financial professional or the Fund by mail, telephone, wire transfer or on-line (www.profunds.com).
Tax Information
The Fund’s distributions generally are taxable, and will be taxed as ordinary income, qualified dividend income or capital gains, unless you are investing through a tax-advantaged arrangement, such as a 401(k) plan or an individual retirement account. You may be taxed later upon withdrawal of monies from such tax-advantaged arrangements. The Fund intends to distribute income, if any, and capital gains, if any, at least annually.
Payments to Broker-Dealers and Other Financial Intermediaries
If you purchase Fund shares through a financial intermediary, such as a broker-dealer or investment adviser, the Fund and its distributor may pay the intermediary for the sale of Fund shares and related services. These payments may create a conflict of interest by influencing the broker-dealer or other financial intermediary to recommend the Fund over another investment. Ask your financial intermediary or visit your financial intermediary’s website for more information.
FUND NUMBERS :: Investor Class 160 :: Service Class 190 :: UltraInternational ProFund :: 323
Wire Fee $10
|
| ||
|
|
Investor
Class |
Service
Class |
|
Investment Advisory Fees |
|
|
|
Distribution and Service (12b-1) Fees |
|
|
|
Other Expenses |
|
|
|
Total Annual Fund Operating Expenses
Before Fee Waivers and Expense
Reimbursements |
|
|
|
Fee Waivers/Reimbursements1 |
- |
- |
|
Total Annual Fund Operating Expenses
After Fee Waivers and Expense
Reimbursements |
|
|
1
324 :: UltraInternational ProFund :: TICKERS :: Investor Class UNPIX :: Service Class UNPSX
|
|
1 Year |
3 Years |
5 Years |
10 Years |
|
Investor Class |
$ |
$ |
$ |
$ |
|
Service Class |
$ |
$ |
$ |
$ |
FUND NUMBERS :: Investor Class 160 :: Service Class 190 :: UltraInternational ProFund :: 325
326 :: UltraInternational ProFund :: TICKERS :: Investor Class UNPIX :: Service Class UNPSX
|
| ||||||
|
|
| |||||
|
|
|
|
|
|
|
|
|
|
|
|
|
|
|
|
|
|
|
|
|
|
|
|
|
|
|
|
|
|
|
|
|
|
|
|
|
|
|
|
|
|
|
|
|
|
|
|
|
|
|
|
|
|
|
|
|
|
|
|
|
|
|
|
|
|
|
|
|
|
|
|
|
|
|
|
|
|
|
|
|
|
|
|
|
|
|
|
|
|
|
|
|
|
|
|
|
|
|
|
|
|
|
|
|
|
|
|
|
|
|
|
FUND NUMBERS :: Investor Class 160 :: Service Class 190 :: UltraInternational ProFund :: 327
328 :: UltraInternational ProFund :: TICKERS :: Investor Class UNPIX :: Service Class UNPSX
FUND NUMBERS :: Investor Class 160 :: Service Class 190 :: UltraInternational ProFund :: 329
330 :: UltraInternational ProFund :: TICKERS :: Investor Class UNPIX :: Service Class UNPSX
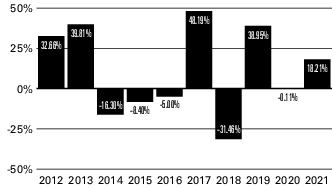
|
|
|
|
|
|
|
|
|
|
|
|
|
|
|
|
|
|
|
|
One
Year |
Five
Years |
Ten
Years |
Inception
Date |
|
Investor Class Shares |
|
|
|
|
|
– Before Taxes |
|
|
|
|
|
– After Taxes on Distributions |
|
|
|
|
|
– After Taxes on Distributions
and Sale of Shares |
|
|
|
|
|
Service Class Shares |
|
|
|
|
|
MSCI EAFE® Index1 |
|
|
|
|
1
Management
The Fund is advised by ProFund Advisors. Alexander Ilyasov, Senior Portfolio Manager, and Scott Hanson, Portfolio Manager, have jointly and primarily managed the Fund since August 2020 and August 2016, respectively.
Purchase and Sale of Fund Shares
The minimum initial investment amounts for all classes, which may be waived at the discretion of the Fund, are:
•$5,000 for accounts that list a financial professional.
•$15,000 for self-directed accounts.
You may purchase, redeem or exchange Fund shares on any day which the New York Stock Exchange is open for business. Depending on where your account is held, you may redeem your shares by contacting your financial professional or the Fund by mail, telephone, wire transfer or on-line (www.profunds.com).
Tax Information
The Fund’s distributions generally are taxable, and will be taxed as ordinary income, qualified dividend income or capital gains, unless you are investing through a tax-advantaged arrangement, such as a 401(k) plan or an individual retirement account. You may be taxed later upon withdrawal of monies from such tax-advantaged arrangements. The Fund intends to distribute income, if any, and capital gains, if any, at least annually.
Payments to Broker-Dealers and Other Financial Intermediaries
If you purchase Fund shares through a financial intermediary, such as a broker-dealer or investment adviser, the Fund and its distributor may pay the intermediary for the sale of Fund shares and related services. These payments may create a conflict of interest by influencing the broker-dealer or other financial intermediary to recommend the Fund over another investment. Ask your financial intermediary or visit your financial intermediary’s website for more information.
FUND NUMBERS :: Investor Class 012 :: Service Class 032 :: UltraJapan ProFund :: 331
Wire Fee $10
|
| ||
|
|
Investor
Class |
Service
Class |
|
Investment Advisory Fees |
|
|
|
Distribution and Service (12b-1) Fees |
|
|
|
Other Expenses |
|
|
|
Recoupment1 |
|
|
|
Other Operating Expenses |
|
|
|
Total Annual Fund Operating Expenses2 |
|
|
1
2
332 :: UltraJapan ProFund :: TICKERS :: Investor Class UJPIX :: Service Class UJPSX
|
|
1 Year |
3 Years |
5 Years |
10 Years |
|
Investor Class |
$ |
$ |
$ |
$ |
|
Service Class |
$ |
$ |
$ |
$ |
FUND NUMBERS :: Investor Class 012 :: Service Class 032 :: UltraJapan ProFund :: 333
334 :: UltraJapan ProFund :: TICKERS :: Investor Class UJPIX :: Service Class UJPSX
|
| ||||||
|
|
| |||||
|
|
|
|
|
|
|
|
|
|
|
|
|
|
|
|
|
|
|
|
|
|
|
|
|
|
|
|
|
|
|
|
|
|
|
|
|
|
|
|
|
|
|
|
|
|
|
|
|
|
|
|
|
|
|
|
|
|
|
|
|
|
|
|
|
|
|
|
|
|
|
|
|
|
|
|
|
|
|
|
|
|
|
|
|
|
|
|
|
|
|
|
|
|
|
|
|
|
|
|
|
|
|
|
|
|
|
|
|
|
|
|
FUND NUMBERS :: Investor Class 012 :: Service Class 032 :: UltraJapan ProFund :: 335
336 :: UltraJapan ProFund :: TICKERS :: Investor Class UJPIX :: Service Class UJPSX
FUND NUMBERS :: Investor Class 012 :: Service Class 032 :: UltraJapan ProFund :: 337
338 :: UltraJapan ProFund :: TICKERS :: Investor Class UJPIX :: Service Class UJPSX
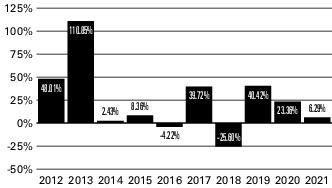
|
|
|
|
|
|
|
|
|
|
|
|
|
|
|
|
|
|
|
|
One
Year |
Five
Years |
Ten
Years |
Inception
Date |
|
Investor Class Shares |
|
|
|
|
|
– Before Taxes |
|
|
|
|
|
– After Taxes on Distributions |
|
|
|
|
|
– After Taxes on Distributions
and Sale of Shares |
|
|
|
|
|
Service Class Shares |
|
|
|
|
|
Nikkei 225 Stock Average - USD
Terms1 |
- |
|
|
|
|
Nikkei 225 Stock Average - Local
(Yen) Terms1 |
|
|
|
|
1
FUND NUMBERS :: Investor Class 012 :: Service Class 032 :: UltraJapan ProFund :: 339
Management
The Fund is advised by ProFund Advisors. Alexander Ilyasov, Senior Portfolio Manager, and Scott Hanson, Portfolio Manager, have jointly and primarily managed the Fund since August 2020 and August 2016, respectively.
Purchase and Sale of Fund Shares
The minimum initial investment amounts for all classes, which may be waived at the discretion of the Fund, are:
•$5,000 for accounts that list a financial professional.
•$15,000 for self-directed accounts.
You may purchase, redeem or exchange Fund shares on any day which the New York Stock Exchange is open for business. Depending on where your account is held, you may redeem your
shares by contacting your financial professional or the Fund by mail, telephone, wire transfer or on-line (www.profunds.com).
Tax Information
The Fund’s distributions generally are taxable, and will be taxed as ordinary income, qualified dividend income or capital gains, unless you are investing through a tax-advantaged arrangement, such as a 401(k) plan or an individual retirement account. You may be taxed later upon withdrawal of monies from such tax-advantaged arrangements. The Fund intends to distribute income, if any, and capital gains, if any, at least annually.
Payments to Broker-Dealers and Other Financial Intermediaries
If you purchase Fund shares through a financial intermediary, such as a broker-dealer or investment adviser, the Fund and its distributor may pay the intermediary for the sale of Fund shares and related services. These payments may create a conflict of interest by influencing the broker-dealer or other financial intermediary to recommend the Fund over another investment. Ask your financial intermediary or visit your financial intermediary’s website for more information.
340 :: UltraLatin America ProFund :: TICKERS :: Investor Class UBPIX :: Service Class UBPSX
Wire Fee $10
|
| ||
|
|
Investor
Class |
Service
Class |
|
Investment Advisory Fees |
|
|
|
Distribution and Service (12b-1) Fees |
|
|
|
Other Expenses |
|
|
|
Total Annual Fund Operating Expenses1 |
|
|
1
|
|
1 Year |
3 Years |
5 Years |
10 Years |
|
Investor Class |
$ |
$ |
$ |
$ |
|
Service Class |
$ |
$ |
$ |
$ |
FUND NUMBERS :: Investor Class 164 :: Service Class 194 :: UltraLatin America ProFund :: 341
342 :: UltraLatin America ProFund :: TICKERS :: Investor Class UBPIX :: Service Class UBPSX
FUND NUMBERS :: Investor Class 164 :: Service Class 194 :: UltraLatin America ProFund :: 343
|
| ||||||
|
|
| |||||
|
|
|
|
|
|
|
|
|
|
|
|
|
|
|
|
|
|
|
|
|
|
|
|
|
|
|
|
|
|
|
|
|
|
|
|
|
|
|
|
|
|
|
|
|
|
|
|
|
|
|
|
|
|
|
|
|
|
|
|
|
|
|
|
|
|
|
|
|
|
|
|
|
|
|
|
|
|
|
|
|
|
|
|
|
|
|
|
|
|
|
|
|
|
|
|
|
|
|
|
|
|
|
|
|
|
|
|
|
|
|
|
344 :: UltraLatin America ProFund :: TICKERS :: Investor Class UBPIX :: Service Class UBPSX
FUND NUMBERS :: Investor Class 164 :: Service Class 194 :: UltraLatin America ProFund :: 345
346 :: UltraLatin America ProFund :: TICKERS :: Investor Class UBPIX :: Service Class UBPSX
FUND NUMBERS :: Investor Class 164 :: Service Class 194 :: UltraLatin America ProFund :: 347
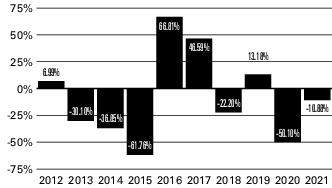
|
|
|
|
|
|
|
|
|
|
|
|
|
|
|
|
|
|
|
|
One
Year |
Five
Years |
Ten
Years |
Inception
Date |
|
Investor Class Shares |
|
|
|
|
|
– Before Taxes |
- |
- |
- |
|
|
– After Taxes on
Distributions |
- |
- |
- |
|
|
– After Taxes on
Distributions and Sale of
Shares |
- |
- |
- |
|
|
Service Class Shares |
- |
- |
- |
|
|
S&P Latin America 35 ADR
Index (USD)1 |
- |
|
- |
|
1
348 :: UltraLatin America ProFund :: TICKERS :: Investor Class UBPIX :: Service Class UBPSX
Management
The Fund is advised by ProFund Advisors. Alexander Ilyasov, Senior Portfolio Manager, and Scott Hanson, Portfolio Manager, have jointly and primarily managed the Fund since August 2020 and August 2016, respectively.
Purchase and Sale of Fund Shares
The minimum initial investment amounts for all classes, which may be waived at the discretion of the Fund, are:
•$5,000 for accounts that list a financial professional.
•$15,000 for self-directed accounts.
You may purchase, redeem or exchange Fund shares on any day which the New York Stock Exchange is open for business. Depending on where your account is held, you may redeem your shares by contacting your financial professional or the Fund by mail, telephone, wire transfer or on-line (www.profunds.com).
Tax Information
The Fund’s distributions generally are taxable, and will be taxed as ordinary income, qualified dividend income or capital gains, unless you are investing through a tax-advantaged arrangement, such as a 401(k) plan or an individual retirement account. You may be taxed later upon withdrawal of monies from such tax-advantaged arrangements. The Fund intends to distribute income, if any, and capital gains, if any, at least annually.
Payments to Broker-Dealers and Other Financial Intermediaries
If you purchase Fund shares through a financial intermediary, such as a broker-dealer or investment adviser, the Fund and its distributor may pay the intermediary for the sale of Fund shares and related services. These payments may create a conflict of interest by influencing the broker-dealer or other financial intermediary to recommend the Fund over another investment. Ask your financial intermediary or visit your financial intermediary’s website for more information.
FUND NUMBERS :: Investor Class 011 :: Service Class 031 :: UltraMid-Cap ProFund :: 349
Wire Fee $10
|
| ||
|
|
Investor
Class |
Service
Class |
|
Investment Advisory Fees |
|
|
|
Distribution and Service (12b-1) Fees |
|
|
|
Other Expenses |
|
|
|
Total Annual Fund Operating Expenses1 |
|
|
1
|
|
1 Year |
3 Years |
5 Years |
10 Years |
|
Investor Class |
$ |
$ |
$ |
$ |
|
Service Class |
$ |
$ |
$ |
$ |
350 :: UltraMid-Cap ProFund :: TICKERS :: Investor Class UMPIX :: Service Class UMPSX
FUND NUMBERS :: Investor Class 011 :: Service Class 031 :: UltraMid-Cap ProFund :: 351
352 :: UltraMid-Cap ProFund :: TICKERS :: Investor Class UMPIX :: Service Class UMPSX
|
| ||||||
|
|
| |||||
|
|
|
|
|
|
|
|
|
|
|
|
|
|
|
|
|
|
|
|
|
|
|
|
|
|
|
|
|
|
|
|
|
|
|
|
|
|
|
|
|
|
|
|
|
|
|
|
|
|
|
|
|
|
|
|
|
|
|
|
|
|
|
|
|
|
|
|
|
|
|
|
|
|
|
|
|
|
|
|
|
|
|
|
|
|
|
|
|
|
|
|
|
|
|
|
|
|
|
|
|
|
|
|
|
|
|
|
|
|
|
|
FUND NUMBERS :: Investor Class 011 :: Service Class 031 :: UltraMid-Cap ProFund :: 353
354 :: UltraMid-Cap ProFund :: TICKERS :: Investor Class UMPIX :: Service Class UMPSX
FUND NUMBERS :: Investor Class 011 :: Service Class 031 :: UltraMid-Cap ProFund :: 355
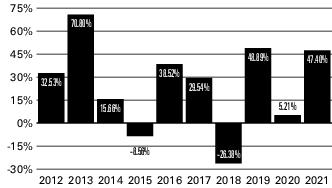
|
|
|
|
|
|
|
|
|
|
|
|
|
|
|
|
|
|
|
|
One
Year |
Five
Years |
Ten
Years |
Inception
Date |
|
Investor Class Shares |
|
|
|
|
|
– Before Taxes |
|
|
|
|
|
– After Taxes on Distributions |
|
|
|
|
|
– After Taxes on Distributions
and Sale of Shares |
|
|
|
|
|
Service Class Shares |
|
|
|
|
|
S&P MidCap 400®1 |
|
|
|
|
1
Management
The Fund is advised by ProFund Advisors. Michael Neches, Senior Portfolio Manager, and Devin Sullivan, Portfolio Manager, have jointly and primarily managed the Fund since October 2013 and April 2018, respectively.
Purchase and Sale of Fund Shares
The minimum initial investment amounts for all classes, which may be waived at the discretion of the Fund, are:
•$5,000 for accounts that list a financial professional.
•$15,000 for self-directed accounts.
You may purchase, redeem or exchange Fund shares on any day which the New York Stock Exchange is open for business. Depending on where your account is held, you may redeem your shares by contacting your financial professional or the Fund by mail, telephone, wire transfer or on-line (www.profunds.com).
Tax Information
The Fund’s distributions generally are taxable, and will be taxed as ordinary income, qualified dividend income or capital gains, unless you are investing through a tax-advantaged arrangement, such as a 401(k) plan or an individual retirement account. You may be taxed later upon withdrawal of monies from such tax-advantaged arrangements. The Fund intends to distribute income, if any, and capital gains, if any, at least annually.
Payments to Broker-Dealers and Other Financial Intermediaries
If you purchase Fund shares through a financial intermediary, such as a broker-dealer or investment adviser, the Fund and its distributor may pay the intermediary for the sale of Fund shares and related services. These payments may create a conflict of interest by influencing the broker-dealer or other financial intermediary to recommend the Fund over another investment. Ask your financial intermediary or visit your financial intermediary’s website for more information.
356 :: UltraNasdaq-100 ProFund :: TICKERS :: Investor Class UOPIX :: Service Class UOPSX
Wire Fee $10
|
| ||
|
|
Investor
Class |
Service
Class |
|
Investment Advisory Fees |
|
|
|
Distribution and Service (12b-1) Fees |
|
|
|
Other Expenses |
|
|
|
Total Annual Fund Operating Expenses1 |
|
|
1
|
|
1 Year |
3 Years |
5 Years |
10 Years |
|
Investor Class |
$ |
$ |
$ |
$ |
|
Service Class |
$ |
$ |
$ |
$ |
FUND NUMBERS :: Investor Class 008 :: Service Class 028 :: UltraNasdaq-100 ProFund :: 357
358 :: UltraNasdaq-100 ProFund :: TICKERS :: Investor Class UOPIX :: Service Class UOPSX
FUND NUMBERS :: Investor Class 008 :: Service Class 028 :: UltraNasdaq-100 ProFund :: 359
|
| ||||||
|
|
| |||||
|
|
|
|
|
|
|
|
|
|
|
|
|
|
|
|
|
|
|
|
|
|
|
|
|
|
|
|
|
|
|
|
|
|
|
|
|
|
|
|
|
|
|
|
|
|
|
|
|
|
|
|
|
|
|
|
|
|
|
|
|
|
|
|
|
|
|
|
|
|
|
|
|
|
|
|
|
|
|
|
|
|
|
|
|
|
|
|
|
|
|
|
|
|
|
|
|
|
|
|
|
|
|
|
|
|
|
|
|
|
|
|
360 :: UltraNasdaq-100 ProFund :: TICKERS :: Investor Class UOPIX :: Service Class UOPSX
FUND NUMBERS :: Investor Class 008 :: Service Class 028 :: UltraNasdaq-100 ProFund :: 361
362 :: UltraNasdaq-100 ProFund :: TICKERS :: Investor Class UOPIX :: Service Class UOPSX
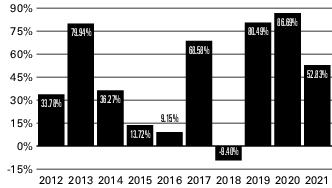
|
|
|
|
|
|
|
|
|
|
|
|
|
|
|
|
|
|
|
|
One
Year |
Five
Years |
Ten
Years |
Inception
Date |
|
Investor Class Shares |
|
|
|
|
|
– Before Taxes |
|
|
|
|
|
– After Taxes on Distributions |
|
|
|
|
|
– After Taxes on Distributions
and Sale of Shares |
|
|
|
|
|
Service Class Shares |
|
|
|
|
|
Nasdaq-100® Index1 |
|
|
|
|
1
Management
The Fund is advised by ProFund Advisors. Michael Neches, Senior Portfolio Manager, and Devin Sullivan, Portfolio Manager, have jointly and primarily managed the Fund since October 2013 and April 2018, respectively.
Purchase and Sale of Fund Shares
The minimum initial investment amounts for all classes, which may be waived at the discretion of the Fund, are:
•$5,000 for accounts that list a financial professional.
•$15,000 for self-directed accounts.
You may purchase, redeem or exchange Fund shares on any day which the New York Stock Exchange is open for business. Depending on where your account is held, you may redeem your shares by contacting your financial professional or the Fund by mail, telephone, wire transfer or on-line (www.profunds.com).
Tax Information
The Fund’s distributions generally are taxable, and will be taxed as ordinary income, qualified dividend income or capital gains, unless you are investing through a tax-advantaged arrangement, such as a 401(k) plan or an individual retirement account. You may be taxed later upon withdrawal of monies from such tax-advantaged arrangements. The Fund intends to distribute income, if any, and capital gains, if any, at least annually.
Payments to Broker-Dealers and Other Financial Intermediaries
If you purchase Fund shares through a financial intermediary, such as a broker-dealer or investment adviser, the Fund and its distributor may pay the intermediary for the sale of Fund shares and related services. These payments may create a conflict of interest by influencing the broker-dealer or other financial intermediary to recommend the Fund over another investment. Ask your financial intermediary or visit your financial intermediary’s website for more information.
FUND NUMBERS :: Investor Class 169 :: Service Class 199 :: UltraShort China ProFund :: 363
Wire Fee $10
|
| ||
|
|
Investor
Class |
Service
Class |
|
Investment Advisory Fees |
|
|
|
Distribution and Service (12b-1) Fees |
|
|
|
Other Expenses |
|
|
|
Total Annual Fund Operating Expenses
Before Fee Waivers and Expense
Reimbursements |
|
|
|
Fee Waivers/Reimbursements1 |
- |
- |
|
Total Annual Fund Operating Expenses
After Fee Waivers and Expense
Reimbursements |
|
|
1
364 :: UltraShort China ProFund :: TICKERS :: Investor Class UHPIX :: Service Class UHPSX
|
|
1 Year |
3 Years |
5 Years |
10 Years |
|
Investor Class |
$ |
$ |
$ |
$ |
|
Service Class |
$ |
$ |
$ |
$ |
FUND NUMBERS :: Investor Class 169 :: Service Class 199 :: UltraShort China ProFund :: 365
366 :: UltraShort China ProFund :: TICKERS :: Investor Class UHPIX :: Service Class UHPSX
|
|
| |||||
|
|
|
| ||||
|
|
|
|
|
|
|
|
|
|
|
|
|
|
|
|
|
|
|
|
|
|
|
|
|
|
|
|
|
|
|
|
|
|
|
|
|
|
|
|
|
|
|
|
|
|
|
|
|
|
|
|
|
|
|
|
|
|
|
|
|
|
|
|
|
|
|
|
|
|
|
|
|
|
|
|
|
|
|
|
|
|
|
|
|
|
|
|
|
|
|
|
|
|
|
|
|
|
|
|
|
|
|
|
|
|
|
|
|
|
|
|
FUND NUMBERS :: Investor Class 169 :: Service Class 199 :: UltraShort China ProFund :: 367
368 :: UltraShort China ProFund :: TICKERS :: Investor Class UHPIX :: Service Class UHPSX
FUND NUMBERS :: Investor Class 169 :: Service Class 199 :: UltraShort China ProFund :: 369
370 :: UltraShort China ProFund :: TICKERS :: Investor Class UHPIX :: Service Class UHPSX
FUND NUMBERS :: Investor Class 169 :: Service Class 199 :: UltraShort China ProFund :: 371
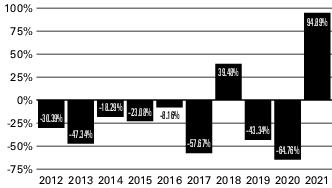
|
|
|
|
|
|
|
|
|
|
|
|
|
|
|
|
|
|
|
|
One
Year |
Five
Years |
Ten
Years |
Inception
Date |
|
Investor Class Shares |
|
|
|
|
|
– Before Taxes |
|
- |
- |
|
|
– After Taxes on Distributions |
|
- |
- |
|
|
– After Taxes on Distributions
and Sale of Shares |
|
- |
- |
|
|
Service Class Shares |
|
- |
- |
|
|
S&P China Select ADR Index
(USD)1 |
- |
|
|
|
1
Management
The Fund is advised by ProFund Advisors. Alexander Ilyasov, Senior Portfolio Manager, and Scott Hanson, Portfolio Manager, have jointly and primarily managed the Fund since August 2020 and August 2016, respectively.
Purchase and Sale of Fund Shares
The minimum initial investment amounts for all classes, which may be waived at the discretion of the Fund, are:
•$5,000 for accounts that list a financial professional.
•$15,000 for self-directed accounts.
You may purchase, redeem or exchange Fund shares on any day which the New York Stock Exchange is open for business. Depending on where your account is held, you may redeem your shares by contacting your financial professional or the Fund by mail, telephone, wire transfer or on-line (www.profunds.com).
Tax Information
The Fund’s distributions generally are taxable, and will be taxed as ordinary income, qualified dividend income or capital gains, unless you are investing through a tax-advantaged arrangement, such as a 401(k) plan or an individual retirement account. You may be taxed later upon withdrawal of monies from such tax-advantaged arrangements. The Fund intends to distribute income, if any, and capital gains, if any, at least annually.
Payments to Broker-Dealers and Other Financial Intermediaries
If you purchase Fund shares through a financial intermediary, such as a broker-dealer or investment adviser, the Fund and its distributor may pay the intermediary for the sale of Fund shares and related services. These payments may create a conflict of interest by influencing the broker-dealer or other financial intermediary to recommend the Fund over another investment. Ask your financial intermediary or visit your financial intermediary’s website for more information.
372 :: UltraShort Dow 30 ProFund :: TICKERS :: Investor Class UWPIX :: Service Class UWPSX
Wire Fee $10
|
| ||
|
|
Investor
Class |
Service
Class |
|
Investment Advisory Fees |
|
|
|
Distribution and Service (12b-1) Fees |
|
|
|
Other Expenses |
|
|
|
Total Annual Fund Operating Expenses
Before Fee Waivers and Expense
Reimbursements |
|
|
|
Fee Waivers/Reimbursements1 |
- |
- |
|
Total Annual Fund Operating Expenses
After Fee Waivers and Expense
Reimbursements |
|
|
1
FUND NUMBERS :: Investor Class 103 :: Service Class 133 :: UltraShort Dow 30 ProFund :: 373
|
|
1 Year |
3 Years |
5 Years |
10 Years |
|
Investor Class |
$ |
$ |
$ |
$ |
|
Service Class |
$ |
$ |
$ |
$ |
374 :: UltraShort Dow 30 ProFund :: TICKERS :: Investor Class UWPIX :: Service Class UWPSX
FUND NUMBERS :: Investor Class 103 :: Service Class 133 :: UltraShort Dow 30 ProFund :: 375
|
|
| |||||
|
|
|
| ||||
|
|
|
|
|
|
|
|
|
|
|
|
|
|
|
|
|
|
|
|
|
|
|
|
|
|
|
|
|
|
|
|
|
|
|
|
|
|
|
|
|
|
|
|
|
|
|
|
|
|
|
|
|
|
|
|
|
|
|
|
|
|
|
|
|
|
|
|
|
|
|
|
|
|
|
|
|
|
|
|
|
|
|
|
|
|
|
|
|
|
|
|
|
|
|
|
|
|
|
|
|
|
|
|
|
|
|
|
|
|
|
|
376 :: UltraShort Dow 30 ProFund :: TICKERS :: Investor Class UWPIX :: Service Class UWPSX
FUND NUMBERS :: Investor Class 103 :: Service Class 133 :: UltraShort Dow 30 ProFund :: 377
378 :: UltraShort Dow 30 ProFund :: TICKERS :: Investor Class UWPIX :: Service Class UWPSX
FUND NUMBERS :: Investor Class 103 :: Service Class 133 :: UltraShort Dow 30 ProFund :: 379
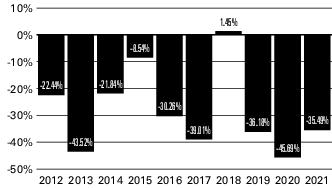
|
|
|
|
|
|
|
|
|
|
|
|
|
|
|
|
|
|
|
|
One
Year |
Five
Years |
Ten
Years |
Inception
Date |
|
Investor Class Shares |
|
|
|
|
|
– Before Taxes |
- |
- |
- |
|
|
– After Taxes on Distributions |
- |
- |
- |
|
|
– After Taxes on Distributions
and Sale of Shares |
- |
- |
- |
|
|
Service Class Shares |
- |
- |
- |
|
|
Dow Jones Industrial
Average®1 |
|
|
|
|
1
Management
The Fund is advised by ProFund Advisors. Michael Neches, Senior Portfolio Manager, and Devin Sullivan, Portfolio Manager, have jointly and primarily managed the Fund since October 2013 and April 2018, respectively.
Purchase and Sale of Fund Shares
The minimum initial investment amounts for all classes, which may be waived at the discretion of the Fund, are:
•$5,000 for accounts that list a financial professional.
•$15,000 for self-directed accounts.
You may purchase, redeem or exchange Fund shares on any day which the New York Stock Exchange is open for business. Depending on where your account is held, you may redeem your shares by contacting your financial professional or the Fund by mail, telephone, wire transfer or on-line (www.profunds.com).
Tax Information
The Fund’s distributions generally are taxable, and will be taxed as ordinary income, qualified dividend income or capital gains, unless you are investing through a tax-advantaged arrangement, such as a 401(k) plan or an individual retirement account. You may be taxed later upon withdrawal of monies from such tax-advantaged arrangements. The Fund intends to distribute income, if any, and capital gains, if any, at least annually.
Payments to Broker-Dealers and Other Financial Intermediaries
If you purchase Fund shares through a financial intermediary, such as a broker-dealer or investment adviser, the Fund and its distributor may pay the intermediary for the sale of Fund shares and related services. These payments may create a conflict of interest by influencing the broker-dealer or other financial intermediary to recommend the Fund over another investment. Ask your financial intermediary or visit your financial intermediary’s website for more information.
380 :: UltraShort Emerging Markets ProFund :: TICKERS :: Investor Class UVPIX :: Service Class UVPSX
Wire Fee $10
|
| ||
|
|
Investor
Class |
Service
Class |
|
Investment Advisory Fees |
|
|
|
Distribution and Service (12b-1) Fees |
|
|
|
Other Expenses |
|
|
|
Total Annual Fund Operating Expenses
Before Fee Waivers and Expense
Reimbursements |
|
|
|
Fee Waivers/Reimbursements1 |
- |
- |
|
Total Annual Fund Operating Expenses
After Fee Waivers and Expense
Reimbursements |
|
|
1
FUND NUMBERS :: Investor Class 163 :: Service Class 193 :: UltraShort Emerging Markets ProFund :: 381
|
|
1 Year |
3 Years |
5 Years |
10 Years |
|
Investor Class |
$ |
$ |
$ |
$ |
|
Service Class |
$ |
$ |
$ |
$ |
382 :: UltraShort Emerging Markets ProFund :: TICKERS :: Investor Class UVPIX :: Service Class UVPSX
FUND NUMBERS :: Investor Class 163 :: Service Class 193 :: UltraShort Emerging Markets ProFund :: 383
|
|
| |||||
|
|
|
| ||||
|
|
|
|
|
|
|
|
|
|
|
|
|
|
|
|
|
|
|
|
|
|
|
|
|
|
|
|
|
|
|
|
|
|
|
|
|
|
|
|
|
|
|
|
|
|
|
|
|
|
|
|
|
|
|
|
|
|
|
|
|
|
|
|
|
|
|
|
|
|
|
|
|
|
|
|
|
|
|
|
|
|
|
|
|
|
|
|
|
|
|
|
|
|
|
|
|
|
|
|
|
|
|
|
|
|
|
|
|
|
|
|
384 :: UltraShort Emerging Markets ProFund :: TICKERS :: Investor Class UVPIX :: Service Class UVPSX
FUND NUMBERS :: Investor Class 163 :: Service Class 193 :: UltraShort Emerging Markets ProFund :: 385
386 :: UltraShort Emerging Markets ProFund :: TICKERS :: Investor Class UVPIX :: Service Class UVPSX
FUND NUMBERS :: Investor Class 163 :: Service Class 193 :: UltraShort Emerging Markets ProFund :: 387
388 :: UltraShort Emerging Markets ProFund :: TICKERS :: Investor Class UVPIX :: Service Class UVPSX
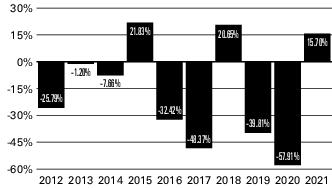
|
|
|
|
|
|
|
|
|
|
|
|
|
|
|
|
|
|
|
|
One
Year |
Five
Years |
Ten
Years |
Inception
Date |
|
Investor Class Shares |
|
|
|
|
|
– Before Taxes |
|
- |
- |
|
|
– After Taxes on Distributions |
|
- |
- |
|
|
– After Taxes on Distributions
and Sale of Shares |
|
- |
- |
|
|
Service Class Shares |
|
- |
- |
|
|
S&P Emerging 50 ADR Index
(USD)1 |
- |
|
|
|
1
Management
The Fund is advised by ProFund Advisors. Alexander Ilyasov, Senior Portfolio Manager, and Scott Hanson, Portfolio Manager, have jointly and primarily managed the Fund since August 2020 and August 2016, respectively.
Purchase and Sale of Fund Shares
The minimum initial investment amounts for all classes, which may be waived at the discretion of the Fund, are:
•$5,000 for accounts that list a financial professional.
•$15,000 for self-directed accounts.
You may purchase, redeem or exchange Fund shares on any day which the New York Stock Exchange is open for business. Depending on where your account is held, you may redeem your shares by contacting your financial professional or the Fund by mail, telephone, wire transfer or on-line (www.profunds.com).
FUND NUMBERS :: Investor Class 163 :: Service Class 193 :: UltraShort Emerging Markets ProFund :: 389
Tax Information
The Fund’s distributions generally are taxable, and will be taxed as ordinary income, qualified dividend income or capital gains, unless you are investing through a tax-advantaged arrangement, such as a 401(k) plan or an individual retirement account. You may be taxed later upon withdrawal of monies from such tax-advantaged arrangements. The Fund intends to distribute income, if any, and capital gains, if any, at least annually.
Payments to Broker-Dealers and Other Financial Intermediaries
If you purchase Fund shares through a financial intermediary, such as a broker-dealer or investment adviser, the Fund and its
distributor may pay the intermediary for the sale of Fund shares and related services. These payments may create a conflict of interest by influencing the broker-dealer or other financial intermediary to recommend the Fund over another investment. Ask your financial intermediary or visit your financial intermediary’s website for more information.
390 :: UltraShort International ProFund :: TICKERS :: Investor Class UXPIX :: Service Class UXPSX
Wire Fee $10
|
| ||
|
|
Investor
Class |
Service
Class |
|
Investment Advisory Fees |
|
|
|
Distribution and Service (12b-1) Fees |
|
|
|
Other Expenses |
|
|
|
Total Annual Fund Operating Expenses
Before Fee Waivers and Expense
Reimbursements |
|
|
|
Fee Waivers/Reimbursements1 |
- |
- |
|
Total Annual Fund Operating Expenses
After Fee Waivers and Expense
Reimbursements |
|
|
1
FUND NUMBERS :: Investor Class 161 :: Service Class 191 :: UltraShort International ProFund :: 391
|
|
1 Year |
3 Years |
5 Years |
10 Years |
|
Investor Class |
$ |
$ |
$ |
$ |
|
Service Class |
$ |
$ |
$ |
$ |
392 :: UltraShort International ProFund :: TICKERS :: Investor Class UXPIX :: Service Class UXPSX
FUND NUMBERS :: Investor Class 161 :: Service Class 191 :: UltraShort International ProFund :: 393
|
|
| |||||
|
|
|
| ||||
|
|
|
|
|
|
|
|
|
|
|
|
|
|
|
|
|
|
|
|
|
|
|
|
|
|
|
|
|
|
|
|
|
|
|
|
|
|
|
|
|
|
|
|
|
|
|
|
|
|
|
|
|
|
|
|
|
|
|
|
|
|
|
|
|
|
|
|
|
|
|
|
|
|
|
|
|
|
|
|
|
|
|
|
|
|
|
|
|
|
|
|
|
|
|
|
|
|
|
|
|
|
|
|
|
|
|
|
|
|
|
|
394 :: UltraShort International ProFund :: TICKERS :: Investor Class UXPIX :: Service Class UXPSX
FUND NUMBERS :: Investor Class 161 :: Service Class 191 :: UltraShort International ProFund :: 395
396 :: UltraShort International ProFund :: TICKERS :: Investor Class UXPIX :: Service Class UXPSX
FUND NUMBERS :: Investor Class 161 :: Service Class 191 :: UltraShort International ProFund :: 397
398 :: UltraShort International ProFund :: TICKERS :: Investor Class UXPIX :: Service Class UXPSX
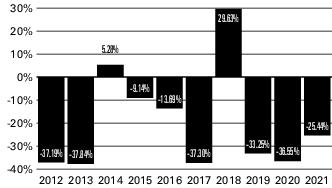
|
|
|
|
|
|
|
|
|
|
|
|
|
|
|
|
|
|
|
|
One
Year |
Five
Years |
Ten
Years |
Inception
Date |
|
Investor Class Shares |
|
|
|
|
|
– Before Taxes |
- |
- |
- |
|
|
– After Taxes on Distributions |
- |
- |
- |
|
|
– After Taxes on Distributions
and Sale of Shares |
- |
- |
- |
|
|
Service Class Shares |
- |
- |
- |
|
|
MSCI EAFE® Index1 |
|
|
|
|
1
Management
The Fund is advised by ProFund Advisors. Alexander Ilyasov, Senior Portfolio Manager, and Scott Hanson, Portfolio Manager, have jointly and primarily managed the Fund since August 2020 and August 2016, respectively.
Purchase and Sale of Fund Shares
The minimum initial investment amounts for all classes, which may be waived at the discretion of the Fund, are:
•$5,000 for accounts that list a financial professional.
•$15,000 for self-directed accounts.
You may purchase, redeem or exchange Fund shares on any day which the New York Stock Exchange is open for business. Depending on where your account is held, you may redeem your shares by contacting your financial professional or the Fund by mail, telephone, wire transfer or on-line (www.profunds.com).
Tax Information
The Fund’s distributions generally are taxable, and will be taxed as ordinary income, qualified dividend income or capital gains, unless you are investing through a tax-advantaged arrangement, such as a 401(k) plan or an individual retirement account. You may be taxed later upon withdrawal of monies from such tax-advantaged arrangements. The Fund intends to distribute income, if any, and capital gains, if any, at least annually.
Payments to Broker-Dealers and Other Financial Intermediaries
If you purchase Fund shares through a financial intermediary, such as a broker-dealer or investment adviser, the Fund and its distributor may pay the intermediary for the sale of Fund shares and related services. These payments may create a conflict of interest by influencing the broker-dealer or other financial intermediary to recommend the Fund over another investment. Ask your financial intermediary or visit your financial intermediary’s website for more information.
FUND NUMBERS :: Investor Class 019 :: Service Class 039 :: UltraShort Japan ProFund :: 399
Wire Fee $10
|
| ||
|
|
Investor
Class |
Service
Class |
|
Investment Advisory Fees |
|
|
|
Distribution and Service (12b-1) Fees |
|
|
|
Other Expenses |
|
|
|
Total Annual Fund Operating Expenses
Before Fee Waivers and Expense
Reimbursements |
|
|
|
Fee Waivers/Reimbursements1 |
- |
- |
|
Total Annual Fund Operating Expenses
After Fee Waivers and Expense
Reimbursements |
|
|
1
400 :: UltraShort Japan ProFund :: TICKERS :: Investor Class UKPIX :: Service Class UKPSX
|
|
1 Year |
3 Years |
5 Years |
10 Years |
|
Investor Class |
$ |
$ |
$ |
$ |
|
Service Class |
$ |
$ |
$ |
$ |
FUND NUMBERS :: Investor Class 019 :: Service Class 039 :: UltraShort Japan ProFund :: 401
402 :: UltraShort Japan ProFund :: TICKERS :: Investor Class UKPIX :: Service Class UKPSX
|
|
| |||||
|
|
|
| ||||
|
|
|
|
|
|
|
|
|
|
|
|
|
|
|
|
|
|
|
|
|
|
|
|
|
|
|
|
|
|
|
|
|
|
|
|
|
|
|
|
|
|
|
|
|
|
|
|
|
|
|
|
|
|
|
|
|
|
|
|
|
|
|
|
|
|
|
|
|
|
|
|
|
|
|
|
|
|
|
|
|
|
|
|
|
|
|
|
|
|
|
|
|
|
|
|
|
|
|
|
|
|
|
|
|
|
|
|
|
|
|
|
FUND NUMBERS :: Investor Class 019 :: Service Class 039 :: UltraShort Japan ProFund :: 403
404 :: UltraShort Japan ProFund :: TICKERS :: Investor Class UKPIX :: Service Class UKPSX
FUND NUMBERS :: Investor Class 019 :: Service Class 039 :: UltraShort Japan ProFund :: 405
406 :: UltraShort Japan ProFund :: TICKERS :: Investor Class UKPIX :: Service Class UKPSX
FUND NUMBERS :: Investor Class 019 :: Service Class 039 :: UltraShort Japan ProFund :: 407
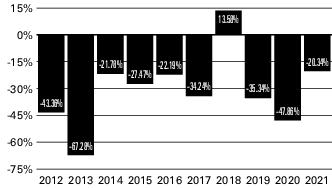
|
|
|
|
|
|
|
|
|
|
|
|
|
|
|
|
|
|
|
|
One
Year |
Five
Years |
Ten
Years |
Inception
Date |
|
Investor Class Shares |
|
|
|
|
|
– Before Taxes |
- |
- |
- |
|
|
– After Taxes on Distributions |
- |
- |
- |
|
|
– After Taxes on Distributions
and Sale of Shares |
- |
- |
- |
|
|
Service Class Shares |
- |
- |
- |
|
|
Nikkei 225 Stock Average -
USD Terms1 |
- |
|
|
|
|
Nikkei 225 Stock Average -
Local (Yen) Terms1 |
|
|
|
|
1
Management
The Fund is advised by ProFund Advisors. Alexander Ilyasov, Senior Portfolio Manager, and Scott Hanson, Portfolio Manager, have jointly and primarily managed the Fund since August 2020 and August 2016, respectively.
Purchase and Sale of Fund Shares
The minimum initial investment amounts for all classes, which may be waived at the discretion of the Fund, are:
•$5,000 for accounts that list a financial professional.
•$15,000 for self-directed accounts.
You may purchase, redeem or exchange Fund shares on any day which the New York Stock Exchange is open for business. Depending on where your account is held, you may redeem your shares by contacting your financial professional or the Fund by mail, telephone, wire transfer or on-line (www.profunds.com).
Tax Information
The Fund’s distributions generally are taxable, and will be taxed as ordinary income, qualified dividend income or capital gains, unless you are investing through a tax-advantaged arrangement, such as a 401(k) plan or an individual retirement account. You may be taxed later upon withdrawal of monies from such tax-advantaged arrangements. The Fund intends to distribute income, if any, and capital gains, if any, at least annually.
Payments to Broker-Dealers and Other Financial Intermediaries
If you purchase Fund shares through a financial intermediary, such as a broker-dealer or investment adviser, the Fund and its distributor may pay the intermediary for the sale of Fund shares and related services. These payments may create a conflict of interest by influencing the broker-dealer or other financial intermediary to recommend the Fund over another investment. Ask your financial intermediary or visit your financial intermediary’s website for more information.
408 :: UltraShort Latin America ProFund :: TICKERS :: Investor Class UFPIX :: Service Class UFPSX
Wire Fee $10
|
| ||
|
|
Investor
Class |
Service
Class |
|
Investment Advisory Fees |
|
|
|
Distribution and Service (12b-1) Fees |
|
|
|
Other Expenses |
|
|
|
Total Annual Fund Operating Expenses
Before Fee Waivers and Expense
Reimbursements |
|
|
|
Fee Waivers/Reimbursements1 |
- |
- |
|
Total Annual Fund Operating Expenses
After Fee Waivers and Expense
Reimbursements |
|
|
1
FUND NUMBERS :: Investor Class 165 :: Service Class 195 :: UltraShort Latin America ProFund :: 409
|
|
1 Year |
3 Years |
5 Years |
10 Years |
|
Investor Class |
$ |
$ |
$ |
$ |
|
Service Class |
$ |
$ |
$ |
$ |
410 :: UltraShort Latin America ProFund :: TICKERS :: Investor Class UFPIX :: Service Class UFPSX
FUND NUMBERS :: Investor Class 165 :: Service Class 195 :: UltraShort Latin America ProFund :: 411
|
|
| |||||
|
|
|
| ||||
|
|
|
|
|
|
|
|
|
|
|
|
|
|
|
|
|
|
|
|
|
|
|
|
|
|
|
|
|
|
|
|
|
|
|
|
|
|
|
|
|
|
|
|
|
|
|
|
|
|
|
|
|
|
|
|
|
|
|
|
|
|
|
|
|
|
|
|
|
|
|
|
|
|
|
|
|
|
|
|
|
|
|
|
|
|
|
|
|
|
|
|
|
|
|
|
|
|
|
|
|
|
|
|
|
|
|
|
|
|
|
|
412 :: UltraShort Latin America ProFund :: TICKERS :: Investor Class UFPIX :: Service Class UFPSX
FUND NUMBERS :: Investor Class 165 :: Service Class 195 :: UltraShort Latin America ProFund :: 413
414 :: UltraShort Latin America ProFund :: TICKERS :: Investor Class UFPIX :: Service Class UFPSX
FUND NUMBERS :: Investor Class 165 :: Service Class 195 :: UltraShort Latin America ProFund :: 415
416 :: UltraShort Latin America ProFund :: TICKERS :: Investor Class UFPIX :: Service Class UFPSX
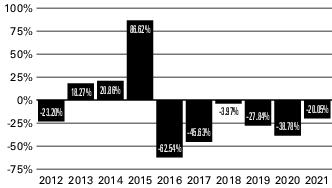
|
|
|
|
|
|
|
|
|
|
|
|
|
|
|
|
|
|
|
|
One
Year |
Five
Years |
Ten
Years |
Inception
Date |
|
Investor Class Shares |
|
|
|
|
|
– Before Taxes |
- |
- |
- |
|
|
– After Taxes on
Distributions |
- |
- |
- |
|
|
– After Taxes on
Distributions and Sale of
Shares |
- |
- |
- |
|
|
Service Class Shares |
- |
- |
- |
|
|
S&P Latin America 35 ADR
Index (USD)1 |
- |
|
- |
|
1
Management
The Fund is advised by ProFund Advisors. Alexander Ilyasov, Senior Portfolio Manager, and Scott Hanson, Portfolio Manager, have jointly and primarily managed the Fund since August 2020 and August 2016, respectively.
Purchase and Sale of Fund Shares
The minimum initial investment amounts for all classes, which may be waived at the discretion of the Fund, are:
•$5,000 for accounts that list a financial professional.
•$15,000 for self-directed accounts.
You may purchase, redeem or exchange Fund shares on any day which the New York Stock Exchange is open for business. Depending on where your account is held, you may redeem your shares by contacting your financial professional or the Fund by mail, telephone, wire transfer or on-line (www.profunds.com).
Tax Information
The Fund’s distributions generally are taxable, and will be taxed as ordinary income, qualified dividend income or capital gains, unless you are investing through a tax-advantaged arrangement, such as a 401(k) plan or an individual retirement account. You may be taxed later upon withdrawal of monies from such tax-advantaged arrangements. The Fund intends to distribute income, if any, and capital gains, if any, at least annually.
Payments to Broker-Dealers and Other Financial Intermediaries
If you purchase Fund shares through a financial intermediary, such as a broker-dealer or investment adviser, the Fund and its distributor may pay the intermediary for the sale of Fund shares and related services. These payments may create a conflict of interest by influencing the broker-dealer or other financial intermediary to recommend the Fund over another investment. Ask your financial intermediary or visit your financial intermediary’s website for more information.
FUND NUMBERS :: Investor Class 104 :: Service Class 134 :: UltraShort Mid-Cap ProFund :: 417
Wire Fee $10
|
| ||
|
|
Investor
Class |
Service
Class |
|
Investment Advisory Fees |
|
|
|
Distribution and Service (12b-1) Fees |
|
|
|
Other Expenses |
|
|
|
Total Annual Fund Operating Expenses
Before Fee Waivers and Expense
Reimbursements |
|
|
|
Fee Waivers/Reimbursements1 |
- |
- |
|
Total Annual Fund Operating Expenses
After Fee Waivers and Expense
Reimbursements |
|
|
1
418 :: UltraShort Mid-Cap ProFund :: TICKERS :: Investor Class UIPIX :: Service Class UIPSX
|
|
1 Year |
3 Years |
5 Years |
10 Years |
|
Investor Class |
$ |
$ |
$ |
$ |
|
Service Class |
$ |
$ |
$ |
$ |
FUND NUMBERS :: Investor Class 104 :: Service Class 134 :: UltraShort Mid-Cap ProFund :: 419
420 :: UltraShort Mid-Cap ProFund :: TICKERS :: Investor Class UIPIX :: Service Class UIPSX
|
|
| |||||
|
|
|
| ||||
|
|
|
|
|
|
|
|
|
|
|
|
|
|
|
|
|
|
|
|
|
|
|
|
|
|
|
|
|
|
|
|
|
|
|
|
|
|
|
|
|
|
|
|
|
|
|
|
|
|
|
|
|
|
|
|
|
|
|
|
|
|
|
|
|
|
|
|
|
|
|
|
|
|
|
|
|
|
|
|
|
|
|
|
|
|
|
|
|
|
|
|
|
|
|
|
|
|
|
|
|
|
|
|
|
|
|
|
|
|
|
|
FUND NUMBERS :: Investor Class 104 :: Service Class 134 :: UltraShort Mid-Cap ProFund :: 421
422 :: UltraShort Mid-Cap ProFund :: TICKERS :: Investor Class UIPIX :: Service Class UIPSX
FUND NUMBERS :: Investor Class 104 :: Service Class 134 :: UltraShort Mid-Cap ProFund :: 423
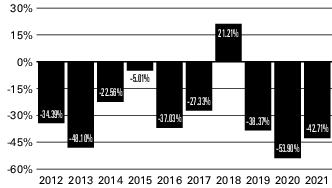
|
|
|
|
|
|
|
|
|
|
|
|
|
|
|
|
|
|
|
|
One
Year |
Five
Years |
Ten
Years |
Inception
Date |
|
Investor Class Shares |
|
|
|
|
|
– Before Taxes |
- |
- |
- |
|
|
– After Taxes on Distributions |
- |
- |
- |
|
|
– After Taxes on Distributions
and Sale of Shares |
- |
- |
- |
|
|
Service Class Shares |
- |
- |
- |
|
|
S&P MidCap 400®1 |
|
|
|
|
1
424 :: UltraShort Mid-Cap ProFund :: TICKERS :: Investor Class UIPIX :: Service Class UIPSX
Management
The Fund is advised by ProFund Advisors. Michael Neches, Senior Portfolio Manager, and Devin Sullivan, Portfolio Manager, have jointly and primarily managed the Fund since October 2013 and April 2018, respectively.
Purchase and Sale of Fund Shares
The minimum initial investment amounts for all classes, which may be waived at the discretion of the Fund, are:
•$5,000 for accounts that list a financial professional.
•$15,000 for self-directed accounts.
You may purchase, redeem or exchange Fund shares on any day which the New York Stock Exchange is open for business. Depending on where your account is held, you may redeem your shares by contacting your financial professional or the Fund by mail, telephone, wire transfer or on-line (www.profunds.com).
Tax Information
The Fund’s distributions generally are taxable, and will be taxed as ordinary income, qualified dividend income or capital gains, unless you are investing through a tax-advantaged arrangement, such as a 401(k) plan or an individual retirement account. You may be taxed later upon withdrawal of monies from such tax-advantaged arrangements. The Fund intends to distribute income, if any, and capital gains, if any, at least annually.
Payments to Broker-Dealers and Other Financial Intermediaries
If you purchase Fund shares through a financial intermediary, such as a broker-dealer or investment adviser, the Fund and its distributor may pay the intermediary for the sale of Fund shares and related services. These payments may create a conflict of interest by influencing the broker-dealer or other financial intermediary to recommend the Fund over another investment. Ask your financial intermediary or visit your financial intermediary’s website for more information.
FUND NUMBERS :: Investor Class 009 :: Service Class 029 :: UltraShort Nasdaq-100 ProFund :: 425
Wire Fee $10
|
| ||
|
|
Investor
Class |
Service
Class |
|
Investment Advisory Fees |
|
|
|
Distribution and Service (12b-1) Fees |
|
|
|
Other Expenses |
|
|
|
Total Annual Fund Operating Expenses1 |
|
|
1
|
|
1 Year |
3 Years |
5 Years |
10 Years |
|
Investor Class |
$ |
$ |
$ |
$ |
|
Service Class |
$ |
$ |
$ |
$ |
426 :: UltraShort Nasdaq-100 ProFund :: TICKERS :: Investor Class USPIX :: Service Class USPSX
FUND NUMBERS :: Investor Class 009 :: Service Class 029 :: UltraShort Nasdaq-100 ProFund :: 427
428 :: UltraShort Nasdaq-100 ProFund :: TICKERS :: Investor Class USPIX :: Service Class USPSX
|
|
| |||||
|
|
|
| ||||
|
|
|
|
|
|
|
|
|
|
|
|
|
|
|
|
|
|
|
|
|
|
|
|
|
|
|
|
|
|
|
|
|
|
|
|
|
|
|
|
|
|
|
|
|
|
|
|
|
|
|
|
|
|
|
|
|
|
|
|
|
|
|
|
|
|
|
|
|
|
|
|
|
|
|
|
|
|
|
|
|
|
|
|
|
|
|
|
|
|
|
|
|
|
|
|
|
|
|
|
|
|
|
|
|
|
|
|
|
|
|
|
FUND NUMBERS :: Investor Class 009 :: Service Class 029 :: UltraShort Nasdaq-100 ProFund :: 429
430 :: UltraShort Nasdaq-100 ProFund :: TICKERS :: Investor Class USPIX :: Service Class USPSX
FUND NUMBERS :: Investor Class 009 :: Service Class 029 :: UltraShort Nasdaq-100 ProFund :: 431
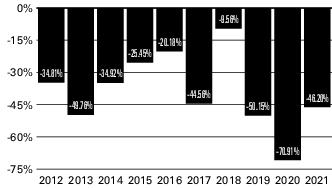
|
|
|
|
|
|
|
|
|
|
|
|
|
|
|
|
|
|
|
|
One
Year |
Five
Years |
Ten
Years |
Inception
Date |
|
Investor Class Shares |
|
|
|
|
|
– Before Taxes |
- |
- |
- |
|
|
– After Taxes on Distributions |
- |
- |
- |
|
|
– After Taxes on Distributions
and Sale of Shares |
- |
- |
- |
|
|
Service Class Shares |
- |
- |
- |
|
|
Nasdaq-100® Index1 |
|
|
|
|
1
Management
The Fund is advised by ProFund Advisors. Michael Neches, Senior Portfolio Manager, and Devin Sullivan, Portfolio Manager, have jointly and primarily managed the Fund since October 2013 and April 2018, respectively.
432 :: UltraShort Nasdaq-100 ProFund :: TICKERS :: Investor Class USPIX :: Service Class USPSX
Purchase and Sale of Fund Shares
The minimum initial investment amounts for all classes, which may be waived at the discretion of the Fund, are:
•$5,000 for accounts that list a financial professional.
•$15,000 for self-directed accounts.
You may purchase, redeem or exchange Fund shares on any day which the New York Stock Exchange is open for business. Depending on where your account is held, you may redeem your shares by contacting your financial professional or the Fund by mail, telephone, wire transfer or on-line (www.profunds.com).
Tax Information
The Fund’s distributions generally are taxable, and will be taxed as ordinary income, qualified dividend income or capital gains, unless you are investing through a tax-advantaged arrangement,
such as a 401(k) plan or an individual retirement account. You may be taxed later upon withdrawal of monies from such tax-advantaged arrangements. The Fund intends to distribute income, if any, and capital gains, if any, at least annually.
Payments to Broker-Dealers and Other Financial Intermediaries
If you purchase Fund shares through a financial intermediary, such as a broker-dealer or investment adviser, the Fund and its distributor may pay the intermediary for the sale of Fund shares and related services. These payments may create a conflict of interest by influencing the broker-dealer or other financial intermediary to recommend the Fund over another investment. Ask your financial intermediary or visit your financial intermediary’s website for more information.
FUND NUMBERS :: Investor Class 105 :: Service Class 135 :: UltraShort Small-Cap ProFund :: 433
Wire Fee $10
|
| ||
|
|
Investor
Class |
Service
Class |
|
Investment Advisory Fees |
|
|
|
Distribution and Service (12b-1) Fees |
|
|
|
Other Expenses |
|
|
|
Total Annual Fund Operating Expenses
Before Fee Waivers and Expense
Reimbursements |
|
|
|
Fee Waivers/Reimbursements1 |
- |
- |
|
Total Annual Fund Operating Expenses
After Fee Waivers and Expense
Reimbursements |
|
|
1
434 :: UltraShort Small-Cap ProFund :: TICKERS :: Investor Class UCPIX :: Service Class UCPSX
|
|
1 Year |
3 Years |
5 Years |
10 Years |
|
Investor Class |
$ |
$ |
$ |
$ |
|
Service Class |
$ |
$ |
$ |
$ |
FUND NUMBERS :: Investor Class 105 :: Service Class 135 :: UltraShort Small-Cap ProFund :: 435
436 :: UltraShort Small-Cap ProFund :: TICKERS :: Investor Class UCPIX :: Service Class UCPSX
|
|
| |||||
|
|
|
| ||||
|
|
|
|
|
|
|
|
|
|
|
|
|
|
|
|
|
|
|
|
|
|
|
|
|
|
|
|
|
|
|
|
|
|
|
|
|
|
|
|
|
|
|
|
|
|
|
|
|
|
|
|
|
|
|
|
|
|
|
|
|
|
|
|
|
|
|
|
|
|
|
|
|
|
|
|
|
|
|
|
|
|
|
|
|
|
|
|
|
|
|
|
|
|
|
|
|
|
|
|
|
|
|
|
|
|
|
|
|
|
|
|
FUND NUMBERS :: Investor Class 105 :: Service Class 135 :: UltraShort Small-Cap ProFund :: 437
438 :: UltraShort Small-Cap ProFund :: TICKERS :: Investor Class UCPIX :: Service Class UCPSX
FUND NUMBERS :: Investor Class 105 :: Service Class 135 :: UltraShort Small-Cap ProFund :: 439
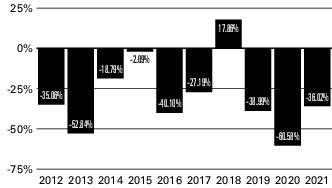
|
|
|
|
|
|
|
|
|
|
|
|
|
|
|
|
|
|
|
|
One
Year |
Five
Years |
Ten
Years |
Inception
Date |
|
Investor Class Shares |
|
|
|
|
|
– Before Taxes |
- |
- |
- |
|
|
– After Taxes on Distributions |
- |
- |
- |
|
|
– After Taxes on Distributions
and Sale of Shares |
- |
- |
- |
|
|
Service Class Shares |
- |
- |
- |
|
|
Russell 2000® Index1 |
|
|
|
|
1
440 :: UltraShort Small-Cap ProFund :: TICKERS :: Investor Class UCPIX :: Service Class UCPSX
Management
The Fund is advised by ProFund Advisors. Michael Neches, Senior Portfolio Manager, and Devin Sullivan, Portfolio Manager, have jointly and primarily managed the Fund since October 2013 and April 2018, respectively.
Purchase and Sale of Fund Shares
The minimum initial investment amounts for all classes, which may be waived at the discretion of the Fund, are:
•$5,000 for accounts that list a financial professional.
•$15,000 for self-directed accounts.
You may purchase, redeem or exchange Fund shares on any day which the New York Stock Exchange is open for business. Depending on where your account is held, you may redeem your shares by contacting your financial professional or the Fund by mail, telephone, wire transfer or on-line (www.profunds.com).
Tax Information
The Fund’s distributions generally are taxable, and will be taxed as ordinary income, qualified dividend income or capital gains, unless you are investing through a tax-advantaged arrangement, such as a 401(k) plan or an individual retirement account. You may be taxed later upon withdrawal of monies from such tax-advantaged arrangements. The Fund intends to distribute income, if any, and capital gains, if any, at least annually.
Payments to Broker-Dealers and Other Financial Intermediaries
If you purchase Fund shares through a financial intermediary, such as a broker-dealer or investment adviser, the Fund and its distributor may pay the intermediary for the sale of Fund shares and related services. These payments may create a conflict of interest by influencing the broker-dealer or other financial intermediary to recommend the Fund over another investment. Ask your financial intermediary or visit your financial intermediary’s website for more information.
FUND NUMBERS :: Investor Class 010 :: Service Class 030 :: UltraSmall-Cap ProFund :: 441
Wire Fee $10
|
| ||
|
|
Investor
Class |
Service
Class |
|
Investment Advisory Fees |
|
|
|
Distribution and Service (12b-1) Fees |
|
|
|
Other Expenses |
|
|
|
Total Annual Fund Operating Expenses1 |
|
|
1
|
|
1 Year |
3 Years |
5 Years |
10 Years |
|
Investor Class |
$ |
$ |
$ |
$ |
|
Service Class |
$ |
$ |
$ |
$ |
442 :: UltraSmall-Cap ProFund :: TICKERS :: Investor Class UAPIX :: Service Class UAPSX
FUND NUMBERS :: Investor Class 010 :: Service Class 030 :: UltraSmall-Cap ProFund :: 443
444 :: UltraSmall-Cap ProFund :: TICKERS :: Investor Class UAPIX :: Service Class UAPSX
|
| ||||||
|
|
| |||||
|
|
|
|
|
|
|
|
|
|
|
|
|
|
|
|
|
|
|
|
|
|
|
|
|
|
|
|
|
|
|
|
|
|
|
|
|
|
|
|
|
|
|
|
|
|
|
|
|
|
|
|
|
|
|
|
|
|
|
|
|
|
|
|
|
|
|
|
|
|
|
|
|
|
|
|
|
|
|
|
|
|
|
|
|
|
|
|
|
|
|
|
|
|
|
|
|
|
|
|
|
|
|
|
|
|
|
|
|
|
|
|
FUND NUMBERS :: Investor Class 010 :: Service Class 030 :: UltraSmall-Cap ProFund :: 445
446 :: UltraSmall-Cap ProFund :: TICKERS :: Investor Class UAPIX :: Service Class UAPSX
FUND NUMBERS :: Investor Class 010 :: Service Class 030 :: UltraSmall-Cap ProFund :: 447
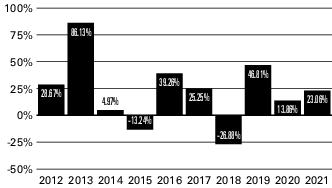
|
|
|
|
|
|
|
|
|
|
|
|
|
|
|
|
|
|
|
|
One
Year |
Five
Years |
Ten
Years |
Inception
Date |
|
Investor Class Shares |
|
|
|
|
|
– Before Taxes |
|
|
|
|
|
– After Taxes on Distributions |
|
|
|
|
|
– After Taxes on Distributions
and Sale of Shares |
|
|
|
|
|
Service Class Shares |
|
|
|
|
|
Russell 2000® Index1 |
|
|
|
|
1
448 :: UltraSmall-Cap ProFund :: TICKERS :: Investor Class UAPIX :: Service Class UAPSX
Management
The Fund is advised by ProFund Advisors. Michael Neches, Senior Portfolio Manager, and Devin Sullivan, Portfolio Manager, have jointly and primarily managed the Fund since October 2013 and April 2018, respectively.
Purchase and Sale of Fund Shares
The minimum initial investment amounts for all classes, which may be waived at the discretion of the Fund, are:
•$5,000 for accounts that list a financial professional.
•$15,000 for self-directed accounts.
You may purchase, redeem or exchange Fund shares on any day which the New York Stock Exchange is open for business. Depending on where your account is held, you may redeem your shares by contacting your financial professional or the Fund by mail, telephone, wire transfer or on-line (www.profunds.com).
Tax Information
The Fund’s distributions generally are taxable, and will be taxed as ordinary income, qualified dividend income or capital gains,
unless you are investing through a tax-advantaged arrangement, such as a 401(k) plan or an individual retirement account. You may be taxed later upon withdrawal of monies from such tax-advantaged arrangements. The Fund intends to distribute income, if any, and capital gains, if any, at least annually.
Payments to Broker-Dealers and Other Financial Intermediaries
If you purchase Fund shares through a financial intermediary, such as a broker-dealer or investment adviser, the Fund and its distributor may pay the intermediary for the sale of Fund shares and related services. These payments may create a conflict of interest by influencing the broker-dealer or other financial intermediary to recommend the Fund over another investment. Ask your financial intermediary or visit your financial intermediary’s website for more information.
FUND NUMBERS :: Investor Class 062 :: Service Class 092 :: U.S. Government Plus ProFund :: 449
Wire Fee $10
|
| ||
|
|
Investor
Class |
Service
Class |
|
Investment Advisory Fees |
|
|
|
Distribution and Service (12b-1) Fees |
|
|
|
Other Expenses |
|
|
|
Total Annual Fund Operating Expenses1 |
|
|
1
|
|
1 Year |
3 Years |
5 Years |
10 Years |
|
Investor Class |
$ |
$ |
$ |
$ |
|
Service Class |
$ |
$ |
$ |
$ |
450 :: U.S. Government Plus ProFund :: TICKERS :: Investor Class GVPIX :: Service Class GVPSX
FUND NUMBERS :: Investor Class 062 :: Service Class 092 :: U.S. Government Plus ProFund :: 451
452 :: U.S. Government Plus ProFund :: TICKERS :: Investor Class GVPIX :: Service Class GVPSX
|
| ||||||
|
|
| |||||
|
|
|
|
|
|
|
|
|
|
|
|
|
|
|
|
|
|
|
|
|
|
|
|
|
|
|
|
|
|
|
|
|
|
|
|
|
|
|
|
|
|
|
|
|
|
|
|
|
|
|
|
|
|
|
|
|
|
|
|
|
|
|
|
|
|
|
|
|
|
|
|
|
|
|
|
|
|
|
|
|
|
|
|
|
|
|
|
|
|
|
|
|
|
|
|
|
|
|
|
|
|
|
|
|
|
|
|
|
|
|
|
FUND NUMBERS :: Investor Class 062 :: Service Class 092 :: U.S. Government Plus ProFund :: 453
454 :: U.S. Government Plus ProFund :: TICKERS :: Investor Class GVPIX :: Service Class GVPSX
FUND NUMBERS :: Investor Class 062 :: Service Class 092 :: U.S. Government Plus ProFund :: 455
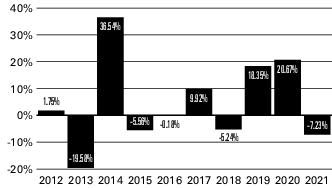
|
|
|
|
|
|
|
|
|
|
|
|
|
|
|
|
|
|
|
|
One
Year |
Five
Years |
Ten
Years |
Inception
Date |
|
Investor Class Shares |
|
|
|
|
|
– Before Taxes |
- |
|
|
|
|
– After Taxes on Distributions |
- |
|
|
|
|
– After Taxes on Distributions and
Sale of Shares |
- |
|
|
|
|
Service Class Shares |
- |
|
|
|
|
Ryan Labs Returns Treasury Yield
Curve 30 Year Index1 |
- |
|
|
|
1
Management
The Fund is advised by ProFund Advisors. Alexander Ilyasov, Senior Portfolio Manager, and James Linneman, Portfolio Manager, have jointly and primarily managed the Fund since April 2019 and March 2022, respectively.
Purchase and Sale of Fund Shares
The minimum initial investment amounts for all classes, which may be waived at the discretion of the Fund, are:
•$5,000 for accounts that list a financial professional.
•$15,000 for self-directed accounts.
You may purchase, redeem or exchange Fund shares on any day which the New York Stock Exchange is open for business. Depending on where your account is held, you may redeem your shares by contacting your financial professional or the Fund by mail, telephone, wire transfer or on-line (www.profunds.com).
Tax Information
The Fund’s distributions generally are taxable, and will be taxed as ordinary income, qualified dividend income or capital gains, unless you are investing through a tax-advantaged arrangement, such as a 401(k) plan or an individual retirement account. You may be taxed later upon withdrawal of monies from such tax-advantaged arrangements. The Fund intends to distribute income, if any, and capital gains, if any, at least annually.
Payments to Broker-Dealers and Other Financial Intermediaries
If you purchase Fund shares through a financial intermediary, such as a broker-dealer or investment adviser, the Fund and its distributor may pay the intermediary for the sale of Fund shares and related services. These payments may create a conflict of interest by influencing the broker-dealer or other financial intermediary to recommend the Fund over another investment. Ask your financial intermediary or visit your financial intermediary’s website for more information.
456 :: Utilities UltraSector ProFund :: TICKERS :: Investor Class UTPIX :: Service Class UTPSX
Wire Fee $10
|
| ||
|
|
Investor
Class |
Service
Class |
|
Investment Advisory Fees |
|
|
|
Distribution and Service (12b-1) Fees |
|
|
|
Other Expenses |
|
|
|
Total Annual Fund Operating Expenses1 |
|
|
1
|
|
1 Year |
3 Years |
5 Years |
10 Years |
|
Investor Class |
$ |
$ |
$ |
$ |
|
Service Class |
$ |
$ |
$ |
$ |
FUND NUMBERS :: Investor Class 057 :: Service Class 087 :: Utilities UltraSector ProFund :: 457
458 :: Utilities UltraSector ProFund :: TICKERS :: Investor Class UTPIX :: Service Class UTPSX
FUND NUMBERS :: Investor Class 057 :: Service Class 087 :: Utilities UltraSector ProFund :: 459
|
| ||||||
|
|
| |||||
|
|
|
|
|
|
|
|
|
|
|
|
|
|
|
|
|
|
|
|
|
|
|
|
|
|
|
|
|
|
|
|
|
|
|
|
|
|
|
|
|
|
|
|
|
|
|
|
|
|
|
|
|
|
|
|
|
|
|
|
|
|
|
|
|
|
|
|
|
|
|
|
|
|
|
|
|
|
|
|
|
|
|
|
|
|
|
|
|
|
|
|
|
|
|
|
|
|
|
|
|
|
|
|
|
|
|
|
|
|
|
|
460 :: Utilities UltraSector ProFund :: TICKERS :: Investor Class UTPIX :: Service Class UTPSX
FUND NUMBERS :: Investor Class 057 :: Service Class 087 :: Utilities UltraSector ProFund :: 461
462 :: Utilities UltraSector ProFund :: TICKERS :: Investor Class UTPIX :: Service Class UTPSX
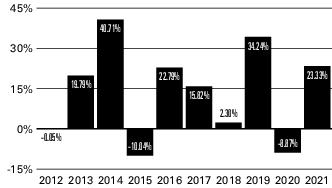
|
|
|
|
|
|
|
|
|
|
|
|
|
|
|
|
|
|
|
|
One
Year |
Five
Years |
Ten
Years |
Inception
Date |
|
Investor Class Shares |
|
|
|
|
|
– Before Taxes |
|
|
|
|
|
– After Taxes on Distributions |
|
|
|
|
|
– After Taxes on Distributions
and Sale of Shares |
|
|
|
|
|
Service Class Shares |
|
|
|
|
|
S&P 500®1 |
|
|
|
|
|
Dow Jones U.S. UtilitiesSM
Index1 |
|
|
|
|
1
Management
The Fund is advised by ProFund Advisors. Michael Neches, Senior Portfolio Manager, and Tarak Davé, Portfolio Manager, have jointly and primarily managed the Fund since October 2013 and April 2018, respectively.
Purchase and Sale of Fund Shares
The minimum initial investment amounts for all classes, which may be waived at the discretion of the Fund, are:
•$5,000 for accounts that list a financial professional.
•$15,000 for self-directed accounts.
You may purchase, redeem or exchange Fund shares on any day which the New York Stock Exchange is open for business. Depending on where your account is held, you may redeem your shares by contacting your financial professional or the Fund by mail, telephone, wire transfer or on-line (www.profunds.com).
Tax Information
The Fund’s distributions generally are taxable, and will be taxed as ordinary income, qualified dividend income or capital gains, unless you are investing through a tax-advantaged arrangement, such as a 401(k) plan or an individual retirement account. You may be taxed later upon withdrawal of monies from such tax-advantaged arrangements. The Fund intends to distribute income, if any, and capital gains, if any, at least annually.
Payments to Broker-Dealers and Other Financial Intermediaries
If you purchase Fund shares through a financial intermediary, such as a broker-dealer or investment adviser, the Fund and its distributor may pay the intermediary for the sale of Fund shares and related services. These payments may create a conflict of interest by influencing the broker-dealer or other financial intermediary to recommend the Fund over another investment. Ask your financial intermediary or visit your financial intermediary’s website for more information.
464 :: Investment Objectives, Principal Investment Strategies and Related Risks
For ease of use, each fund has been categorized as indicated in the table below. An investor may find it helpful to review the categorizations before reading the Prospectus.
|
Classic ProFunds |
Bull ProFund, Europe 30 ProFund, Large-Cap Growth ProFund, Large-Cap Value ProFund, Mid-Cap
Growth ProFund, Mid-Cap ProFund, Mid-Cap Value ProFund, Nasdaq-100 ProFund, Small-Cap Growth
ProFund, Small-Cap ProFund and Small-Cap Value ProFund |
|
Ultra ProFunds |
UltraBull ProFund, UltraChina ProFund, UltraDow 30 ProFund, UltraEmerging Markets ProFund, Ultra-
International ProFund, UltraJapan ProFund, UltraLatin America ProFund, UltraMid-Cap ProFund,
UltraNasdaq-100 ProFund and UltraSmall-Cap ProFund |
|
Inverse ProFunds |
Bear ProFund, Short Nasdaq-100 ProFund, Short Small-Cap ProFund, UltraBear ProFund, UltraShort
China ProFund, UltraShort Dow 30 ProFund, UltraShort Emerging Markets ProFund, UltraShort Inter-
national ProFund, UltraShort Japan ProFund, UltraShort Latin America ProFund, UltraShort Mid-Cap
ProFund, UltraShort Nasdaq-100 ProFund and UltraShort Small-Cap ProFund |
|
UltraSector ProFunds |
Banks UltraSector ProFund, Basic Materials UltraSector ProFund, Biotechnology UltraSector ProFund,
Communication Services UltraSector ProFund, Consumer Goods UltraSector ProFund, Consumer Ser-
vices UltraSector ProFund, Financials UltraSector ProFund, Health Care UltraSector ProFund, Industrials
UltraSector ProFund, Internet UltraSector ProFund, Oil & Gas UltraSector ProFund, Oil Equipment &
Services UltraSector ProFund, Pharmaceuticals UltraSector ProFund, Precious Metals UltraSector
ProFund, Real Estate UltraSector ProFund, Semiconductor UltraSector ProFund, Technology UltraSector
ProFund, Telecommunications UltraSector Pro-Fund and Utilities UltraSector ProFund |
|
Inverse Sector ProFunds |
Short Oil & Gas ProFund, Short Precious Metals ProFund and Short Real Estate ProFund |
|
Non-Equity ProFunds |
Falling U.S. Dollar ProFund, Rising Rates Opportunity ProFund, Rising Rates Opportunity 10 ProFund,
Rising U.S. Dollar ProFund and U.S. Government Plus ProFund |
|
Actively Managed ProFunds |
Access Flex Bear High Yield ProFund and Access Flex High Yield ProFund |
|
Geared ProFunds |
Each of the Ultra ProFunds, Inverse ProFunds, UltraSector ProFunds, Inverse Sector ProFunds, and Non-
Equity ProFunds, except Falling U.S. Dollar ProFund. |
The Classic ProFunds, Ultra ProFunds, Inverse ProFunds, UltraSector ProFunds, Inverse Sector ProFunds, Non-Equity ProFunds, and Actively Managed ProFunds are each a “ProFund” or “Fund” and collectively, the “ProFunds” or “Funds”.
This section contains additional details about each Fund’s investment objectives, principal investment strategies and related risks.
Investment Objectives
Each ProFund offered herein is a series of ProFunds (the “Trust”) and, except for Classic ProFunds, Actively Managed ProFunds, and Falling U.S. Dollar ProFund, is “geared” in the sense that each is designed to seek daily investment results, before fees and expenses, that correspond to the inverse (-1x), a multiple (i.e., 1.25x, 1.5x or 2x) or an inverse multiple (i.e., -1.25x or -2x) of the daily performance of an index or security (each such index or security, a “benchmark”). Specifically, the Ultra ProFunds (including Ultra- Sector ProFunds) seek to provide daily investment results, before fees and expenses, that correspond to a multiple (i.e., 1.5x or 2x) of the daily performance of its benchmark. The Inverse ProFunds (including Inverse Sector ProFunds) seek to provide daily investment results, before fees and expenses, that correspond to the inverse (-1x) or an inverse multiple (-2x) of the daily performance of its benchmark. The Non-Equity ProFunds, except for Falling U.S. Dollar ProFund, seek to provide daily investment results, before fees and expenses, that correspond to a multiple (1.25x), the inverse (-1x) or an inverse multiple (-1.25x) of the daily performance of its benchmark. Each Fund, except for Classic ProFunds, Actively Managed ProFunds and Falling U.S. Dollar ProFund, does not seek to achieve its stated investment objective over a period of time greater than a single day.
The Classic ProFunds and Falling U.S. Dollar ProFund seek investment results, before fees and expenses, that correspond to the daily performance of a benchmark. These Funds seek to achieve their stated investment objective both on a single day and over time.
The Actively Managed ProFunds offered herein are designed to correspond generally to the total return, or the inverse of the total return, of the high yield market consistent with maintaining reasonable liquidity.
Each Fund’s investment objective is non-fundamental, meaning it may be changed by the Board of Trustees (“Board”), without the approval of Fund shareholders.
Each Fund reserves the right to substitute a different index or security for its current benchmark.
Principal Investment Strategies
Geared ProFunds
In seeking to achieve each Fund’s investment objective, ProFund Advisors (“ProFund Advisors” or the “Advisor”) follows a passive approach to investing that is designed to correspond to the inverse (-1x), multiple (i.e., 1.25x, 1.5x or 2x), or inverse multiple (i.e., -1.25x, -1.5x or -2x) of the daily performance of its index. Each Fund attempts to achieve its investment objective
Investment Objectives, Principal Investment Strategies and Related Risks :: 465
by investing all, or substantially all, of its assets in investments that make up its index or in financial instruments that provide similar exposure.
Each Fund employs various investment techniques designed to achieve their respective investment objectives. These techniques are intended to enhance liquidity, maintain a tax-efficient portfolio and reduce transaction costs to maintain a high correlation with, and similar aggregate characteristics (e.g., with respect to equity funds, market capitalization and industry weightings) to, the index or inverse of the index, or multiple thereof, as applicable. For example, a Fund may invest in or gain exposure to only a representative sample of the securities in the index, which exposure is intended to have aggregate characteristics similar to those of the index. In addition, under certain circumstances, a Fund may invest in or obtain exposure to components not included in the index or overweight or underweight certain components of the index with the intent of obtaining exposure with aggregate characteristics similar to the index, including, as applicable, the general credit profile of the index.
ProFund Advisors does not invest the assets of a Fund in securities or financial instruments based on ProFund Advisors’ view of the investment merit of a particular security, instrument, or company, other than for cash management purposes, nor does it conduct conventional investment research or analysis (other than in determining counterparty creditworthiness), or forecast market movement or trends, in managing the assets of a Fund. Each Fund generally seeks to remain fully invested at all times in securities and/or financial instruments that, in combination, provide exposure to its index consistent with its investment objective, without regard to market conditions, trends, direction, or the financial condition of a particular issuer. The Funds do not take temporary defensive positions.
On a daily basis, each Fund will seek to position its portfolio so that such Fund’s investment exposure is consistent with its investment objective. In general, changes to the level of a Fund’s index each day will determine whether such Fund’s portfolio needs to be repositioned. For example, if a Short ProFund’s index has risen on a given day, net assets of the Fund should fall (assuming there were no Creation Units Issued). As a result, the Fund’s short exposure will need to be decreased. Conversely, if the index has fallen on a given day, net assets of the Short Fund should rise (assuming there were no Creation Unit redemptions). As a result, the Fund’s short exposure will need to be increased. Similarly, if an Ultra ProFund’s index has risen on a given day, net assets of the Fund should rise. As a result, the Fund’s exposure will need to be increased. Conversely, if the index has fallen on a given day, net assets of the Ultra Fund should fall. As a result, the Fund’s exposure will need to be decreased.
The time and manner in which a Fund rebalances its portfolio may vary from day to day at the sole discretion of ProFund Advisors depending upon market conditions and other circumstances. If for any reason a Fund is unable to rebalance all
or a portion of its portfolio, or if all or a portion of the portfolio is rebalanced incorrectly, the Fund’s investment exposure may not be consistent with the Fund’s investment objective. In these instances, a Fund may have investment exposure to its underlying index that is significantly greater or less than its stated multiple. As a result, a Fund may be more or less exposed to leverage risk than if it had been properly rebalanced and may not achieve its investment objective.
Each Fund subject to a policy adopted pursuant to Rule 35d-1 under the 1940 Act (the so-called “names rule”) commits to invest at least 80% of its assets (i.e., net assets plus borrowings for investment purposes), under normal circumstances, in the types of securities suggested by its name and/or investments with similar economic characteristics. Each such Fund will provide Investors with at least 60 days’ written notice prior to changing its 80% policy.
For purposes of such an investment policy, “assets” includes not only the amount of a Fund’s net assets attributable to investments providing direct investment exposure to the type of investments suggested by its name (e.g., the value of stocks, or the value of derivative instruments such as futures, options or options on futures), but also cash and cash equivalents that are segregated on the Fund’s books and records or being used as collateral, as required by applicable regulatory guidance, or otherwise available to cover such investment exposure.
Classic ProFunds and Falling U.S. Dollar ProFund
In seeking to achieve each Fund’s investment objective, ProFund Advisors follows a passive approach to investing that is designed to track the performance of the Index.
Each Fund attempts to achieve its investment objective by investing all, or substantially all, of its assets in the component securities of the Index. Each Fund employs various investment techniques that ProShare Advisors believes should, in the aggregate, simulate the movement of the Index.
ProFund Advisors does not invest the assets of a Fund in securities or financial instruments based on ProFund Advisors’ view of the investment merit of a particular security, or company, other than for cash management purposes, nor does it conduct conventional investment research or analysis (other than in determining counterparty creditworthiness), or forecast market movement or trends, in managing the assets of the Fund. Each Fund generally seeks to remain fully invested at all times in securities that, in combination, provide exposure to the Index without regard to market conditions, trends, direction, or the financial condition of a particular issuer.
Actively Managed ProFunds
In seeking to achieve each Fund’s investment objective, ProFund Advisors LLC takes into consideration, among other things, the relative liquidity of and transaction costs associated with a particular investment and industry diversification of a Fund’s overall portfolio. The Advisor does not conduct fundamental analysis in managing each Fund.
466 :: Investment Objectives, Principal Investment Strategies and Related Risks
Each Fund is not a traditional index fund and each Fund seeks to provide investment results that correspond to the high-yield market, or the inverse thereof, but does not attempt to replicate the performance of a specific index, including the index shown in the performance table. The investment techniques utilized are intended to maintain high correlation with, and similar aggregate characteristics to those of high yield debt securities (“junk bonds”) and/or the high yield debt securities market (“high yield market”), or the inverse thereof. For example, a Fund may gain exposure to only a representative sample of securities which is intended to have aggregate characteristics similar to those of the high yield market. In addition, a Fund may obtain exposure to components not included in the high yield market or overweight or underweight certain components contained in the high yield market.
In managing the assets of each Fund, ProFund Advisors does not invest the assets of a Fund in securities or financial instruments based on ProFund Advisors’ view of the investment merit of a particular security, instrument, or company, other than for cash management purposes, nor does it conduct conventional investment research or analysis (other than in determining counterparty creditworthiness), or forecast market movement or trends. Each Fund generally seeks to remain fully invested at all times in securities and/or financial instruments that, in combination, provide exposure to the high yield market without regard to market conditions, trends, direction, or the financial condition of a particular issuer. Each Fund does not take temporary defensive positions.
Please see “Principal Investment Strategies” in each Fund’s Summary Prospectus for more detail about the financial instruments in which each Fund invests.
Each Fund subject to a policy adopted pursuant to Rule 35d-1 under the 1940 Act (the so-called “names rule”) commits to invest at least 80% of its assets (i.e., net assets plus borrowings for investment purposes), under normal circumstances, in the types of securities suggested by its name and/or investments with similar economic characteristics. Each such Fund will provide Investors with at least 60 days’ written notice prior to changes in its 80% policy.
For purposes of such an investment policy, “assets” includes not only the amount of a Fund’s net assets attributable to investments providing direct investment exposure to the type of investments suggested by its name (e.g., the value of stocks, or the value of derivative instruments such as futures, options or options on futures), but also cash and cash equivalents that are segregated on the Fund’s books and records or being used as collateral, as required by applicable regulatory guidance, or otherwise available to cover such investment exposure.
Understanding the Risks and Long-Term Performance of Daily Objective Funds — the Impact of Compounding
Geared ProFunds are designed to provide leveraged (i.e., 1.25x, 1.5x or 2x), inverse (i.e., -1x) or inverse leveraged (i.e., -1.25x
or -2x) results on a daily basis (before fees and expenses). The Funds, however, are unlikely to provide a simple multiple (i.e., 2x, 1.5x, 1.25x, -1x, -1.25x, -2x) of a benchmark’s performance over periods longer than one day.
•Why? The hypothetical example below illustrates how daily Geared Fund returns can behave for periods longer than a single day.
○Take a hypothetical fund XYZ that seeks to double the daily performance of index XYZ. On each day, fund XYZ performs in line with its objective (2x the index’s daily performance before fees and expenses). Notice that over the entire five-day period, the fund’s total return is considerably less than double that of the period return of the index. For the five-day period, index XYZ gained 5.1% while fund XYZ gained 9.8% (versus 2 x 5.1% or 10.2%). In other scenarios, the return of a daily rebalanced fund could be greater than two times (2x) the index’s return.
|
|
Index XYZ |
Fund XYZ | ||
|
|
Level |
Daily
Performance |
Daily
Performance |
Net Asset
Value |
|
Start |
100.0 |
— |
— |
$100.00 |
|
Day 1 |
103.0 |
3.0% |
6.0% |
$106.00 |
|
Day 2 |
99.9 |
-3.0% |
-6.0% |
$99.64 |
|
Day 3 |
103.9 |
4.0% |
8.0% |
$107.61 |
|
Day 4 |
101.3 |
-2.5% |
-5.0% |
$102.23 |
|
Day 5 |
105.1 |
3.7% |
7.4% |
$109.80 |
|
Total
Return |
5.1% |
9.8% | ||
•Why does this happen? This effect is caused by compounding, which exists in all investments, but has a more significant impact on a Geared Fund. In general, during periods of higher benchmark volatility, compounding will cause longer term results to be less than the multiple (or inverse multiple) of the return of the benchmark. This effect becomes more pronounced as volatility increases. Conversely, in periods of lower benchmark volatility, fund returns over longer periods can be higher than a multiple (or inverse multiple) of the return of the benchmark. Actual results for a particular period, before fees and expenses, are also dependent on the following factors: a) the benchmark’s volatility; b) the benchmark’s performance; c) period of time; d) financing rates associated with leverage; e) other Fund expenses; and f) dividends or interest paid with respect to the securities in the benchmark. The examples herein illustrate the impact of two principal factors — benchmark volatility and benchmark performance — on Fund performance. Similar effects exist for the Funds that seek daily returns that correlate to the inverse (-1x) of a benchmark. Please see the SAI for additional details.
○The graphs that follow illustrate this point. Each of the graphs shows a simulated hypothetical one year
Investment Objectives, Principal Investment Strategies and Related Risks :: 467
performance of a benchmark compared with the performance of a fund that perfectly achieves its investment objective. The graphs demonstrate that, for periods greater than a single day, a Geared Fund is likely to underperform or overperform (but not match) the benchmark performance (or the inverse of the benchmark performance) times the stated multiple in the fund’s investment objective. Investors should understand the consequences of holding daily rebalanced funds for periods longer than a single day and should actively manage and monitor their investments, as frequently as daily. A one-year period is used for illustrative purposes only. Deviations from the benchmark return times the fund multiple can occur over periods as short as two days (each day as measured from one day’s NAV to the next day’s NAV).
To isolate the impact of leverage, inverse or inverse leveraged exposure, these graphs assume a) no dividends paid with respect to the securities included in the benchmark; b) no fund expenses; and c) borrowing/lending rates (to obtain required leveraged, inverse or inverse leveraged exposure) of zero percent. If these were reflected, the fund’s performance would be different than that shown. Each of the graphs also assumes a volatility rate of 24%, which is an approximate average of the five-year historical annualized volatility rate of the S&P 500®, S&P MidCap 400®, Russell 2000® Index, Nasdaq-100® Index and Dow Jones Industrial Average™. A benchmark’s volatility rate is a statistical measure of the magnitude of fluctuations in the returns of the benchmark. Some Funds are benchmarked to different indexes that have different historical volatility rates; certain of the Funds’ historical volatility rates are substantially in excess of 24%.
One-Year Simulation; Index Return 0%
(Annualized Index Volatility 24%)
(Annualized Index Volatility 24%)
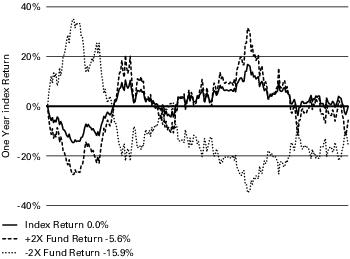
The graph above shows a scenario where the index, which exhibits day-to-day volatility, is flat or trendless over the year (i.e., begins and ends the year at 0%), but the Ultra (+2x) Fund and the UltraShort (-2x) Fund are both down.
One-Year Simulation; Index Return 19%
(Annualized Index Volatility 24%)
(Annualized Index Volatility 24%)
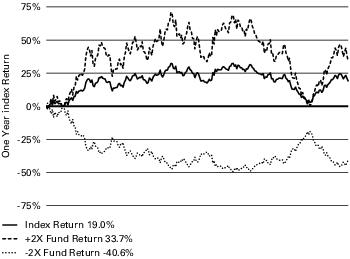
The graph above shows a scenario where the index, which exhibits day-to-day volatility, is up over the year, but the Ultra (+2x) Fund is up less than two times the index and the UltraShort (-2x) Fund is down more than two times the inverse of the index.
One-Year Simulation; Index Return -19%
(Annualized Index Volatility 24%)
(Annualized Index Volatility 24%)
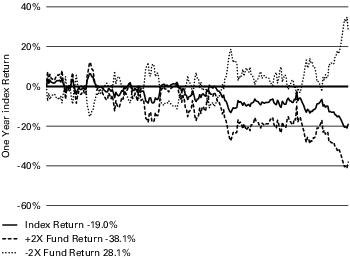
The graph above shows a scenario where the index, which exhibits day-to-day volatility, is down over the year, the Ultra (+2x) Fund is down approximately two times the index, and the UltraShort (-2x) Fund is up less than two times the inverse of the index.
468 :: Investment Objectives, Principal Investment Strategies and Related Risks
One-Year Simulation; Index Return 0%
(Annualized Index Volatility 24%)
(Annualized Index Volatility 24%)
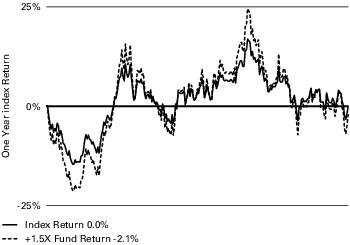
The graph above shows a scenario where the index, which exhibits day-to-day volatility, is flat or trendless over the year (i.e., begins and ends the year at 0%), but the Ultra (+1.5x) Fund is down.
One-Year Simulation; Index Return 19%
(Annualized Index Volatility 24%)
(Annualized Index Volatility 24%)
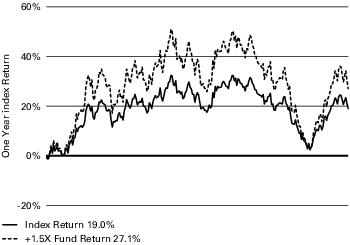
The graph above shows a scenario where the index, which exhibits day-to-day volatility, is up over the year, but the Ultra (+1.5x) Fund is up less than one and one-half times the index.
One-Year Simulation; Index Return -19%
(Annualized Index Volatility 24%)
(Annualized Index Volatility 24%)
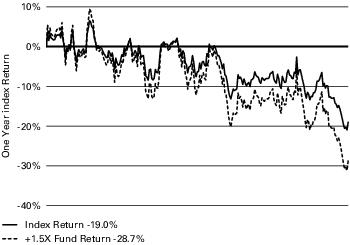
The graph above shows a scenario where the index, which exhibits day-to-day volatility, is down over the year, the Ultra (+1.5x) Fund is down more than one and one-half times the Index.
One-Year Simulation; Index Return 0%
(Annualized Index Volatility 24%)
(Annualized Index Volatility 24%)
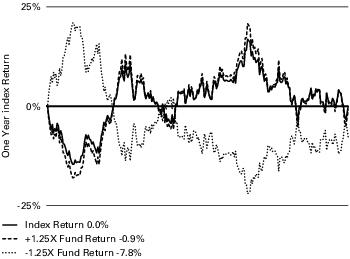
The graph above shows a scenario where the index, which exhibits day-to-day volatility, is flat or trendless over the year (i.e., begins and ends the year at 0%), but the Ultra (+1.25x) Fund and the UltraShort (-1.25x) Fund are both down.
Investment Objectives, Principal Investment Strategies and Related Risks :: 469
One-Year Simulation; Index Return 19%
(Annualized Index Volatility 24%)
(Annualized Index Volatility 24%)
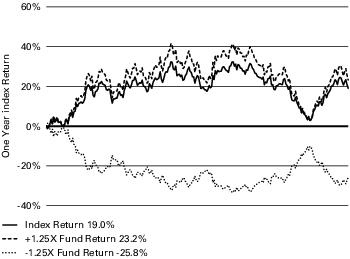
The graph above shows a scenario where the index, which exhibits day-to-day volatility, is up over the year, but the Ultra (+1.25x) Fund is up less than one and one-quarter times the index and the UltraShort (-1.25x) Fund is down more than one and one-quarter times the inverse of the index.
One-Year Simulation; Index Return -19%
(Annualized Index Volatility 24%)
(Annualized Index Volatility 24%)
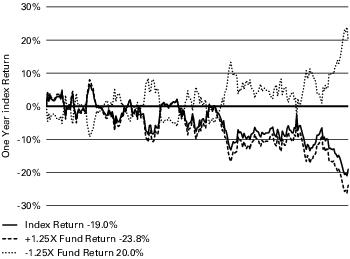
The graph above shows a scenario where the index, which exhibits day-to-day volatility, is down over the year, the Ultra (+1.25x) Fund is down more than one and one-quarter times the Index, and the UltraShort (-1.25x) Fund is up less than one and one-quarter times the inverse of the index.
One-Year Simulation; Index Return 0%
(Annualized Index Volatility 24%)
(Annualized Index Volatility 24%)
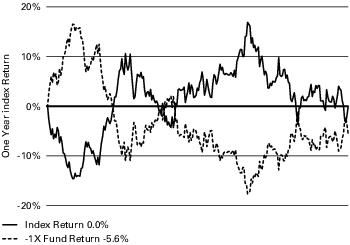
The graph above shows a scenario where the index, which exhibits day to day volatility, is flat or trendless over the year (i.e., begins and ends the year at 0%), but the Short (-1x) Fund is down.
One-Year Simulation; Index Return 19%
(Annualized Index Volatility 24%)
(Annualized Index Volatility 24%)
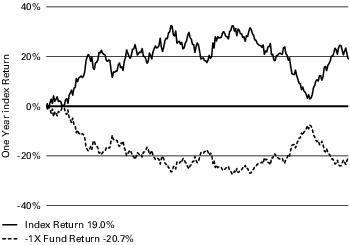
The graph above shows a scenario where the index, which exhibits day to day volatility, is up over the year, and the Short (-1x) Fund is down more than the inverse of the index.
470 :: Investment Objectives, Principal Investment Strategies and Related Risks
One-Year Simulation; Index Return -19%
(Annualized Index Volatility 24%)
(Annualized Index Volatility 24%)
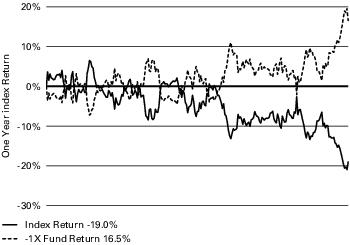
The graph above shows a scenario where the index, which exhibits day-to-day volatility, is down over the year, and the Short (-1x) Fund is up less than the inverse of the index.
The table below shows the historical annualized volatility rate for the five-year period ended July 31, 2022 of each Geared Fund’s indices.
|
Index |
Historical Five-
Year Annualized
Volatility Rate |
|
BONY Mellon China Select |
35.58% |
|
BONY Mellon Emerging Index |
25.41% |
|
BONY Mellon Latin America 35 |
32.38% |
|
Dow Jones Composite Internet Index |
28.53% |
|
Dow Jones Industrial Average (DJIA) Index |
21.20% |
|
Dow Jones Precious Metals Index |
33.66% |
|
Dow Jones U.S. Banks Index |
32.56% |
|
Dow Jones U.S. Basic Materials Index |
24.81% |
|
Dow Jones U.S. Biotechnology Index |
22.46% |
|
Dow Jones U.S. Consumer Goods Index |
19.91% |
|
Dow Jones U.S. Consumer Services Index |
21.71% |
|
Dow Jones U.S. Financials Index |
24.42% |
|
Dow Jones U.S. Health Care Index |
19.32% |
|
Dow Jones U.S. Industrials Index |
23.06% |
|
Dow Jones U.S. Oil & Gas Index |
35.58% |
|
Dow Jones U.S. Real Estate Index |
23.50% |
|
Dow Jones U.S. Select Oil Equipment &
Services Index |
49.72% |
|
Dow Jones U.S. Select Pharmaceuticals
Index |
19.47% |
|
Dow Jones U.S. Select
Telecommunications Index |
19.87% |
|
Dow Jones U.S. Semiconductors Index |
35.02% |
|
Dow Jones U.S. Technology Index |
27.45% |
|
Dow Jones U.S. Utilities Index |
21.67% |
|
MSCI EAFE Index® |
15.29% |
|
NASDAQ-100® Index |
25.29% |
|
Nikkei 225 Stock Average |
19.50% |
|
Index |
Historical Five-
Year Annualized
Volatility Rate |
|
Russell 2000® Index |
26.31% |
|
Ryan Labs Index Returns Treasury Yield
Curve 10 Year |
7.56% |
|
Ryan Labs Index Returns Treasury Yield
Curve 30 Year |
18.61% |
|
S&P 500® Index |
20.94% |
|
S&P Communication Services Select
Sector Index |
23.35% |
|
S&P MidCap 400 Index |
24.11% |
|
U.S. Dollar Index |
5.97% |
For additional details about fund performance over periods longer than a single day for the Geared ProFunds, please see the SAI.
•What it means to you
Daily objective Geared Funds, if used properly and in conjunction with the investor’s view on the future direction and volatility of the markets, can be useful tools for investors who want to manage their exposure to various markets and market segments and who are willing to monitor and/or periodically rebalance their portfolios (which will possibly trigger transaction costs and tax consequences). However, investors considering these Funds should understand that they are designed to provide a positive or negative multiple of a benchmark on a daily basis and not for greater periods of time. As a result, Fund returns will likely not be a simple multiple, inverse or inverse multiple (e.g., 2x, -1x, -2x) of a benchmark’s return for time periods longer than a single day.
Additionally, investors should recognize that the degree of volatility of a Fund’s benchmark can have a dramatic effect on a Fund’s longer-term performance. The more volatile a benchmark, the more a Fund’s longer-term performance will negatively deviate from a simple multiple, inverse or inverse multiple (e.g., 2x, -1x, -2x) of its benchmark’s longer-term return. It is even possible that, over periods longer than a single day, a Fund’s performance may move in a different direction than the benchmark’s performance.
Additional Information Regarding Principal Risks
Like all investments, investing in a Fund entails risks. The factors most likely to have a significant impact on a Fund’s portfolio are called “principal risks.” The principal risks for each Fund are described in each Fund’s Summary Prospectus and additional information regarding certain of these risks, as well as information related to other potential risks to which a Fund may be subjected, is provided below. The principal risks are intended to provide information about the factors likely to have a significant adverse impact on a Fund’s returns and consequently the value of an investment in a Fund. The risks are presented in an order intended to facilitate readability and their order does not imply that the realization of one risk is more likely to occur
Investment Objectives, Principal Investment Strategies and Related Risks :: 471
than another risk or likely to have a greater adverse impact than another risk.
Some of the risks described below apply to all Funds, while others are specific to the investment strategies of certain Funds. Please see “Principal Investment Risks” in each Fund’s Summary Prospectus for more detail about the principal risks applicable to each Fund. The Statement of Additional Information (“SAI”) contains additional information about each Fund, investment strategies and related risks. Each Fund may be subject to other risks in addition to those identified as principal risks.
•Risks Associated with the Use of Derivatives — A Fund may obtain exposure through derivatives (including investing in: swap agreements; futures contracts; options on futures contracts; securities and indexes; forward contracts; and similar instruments). Investing in derivatives may be considered aggressive and may expose a Fund to risks different from, or possibly greater than, the risks associated with investing directly in the reference asset(s) underlying the derivative (e.g., the securities contained in a Fund’s index). The use of derivatives may result in larger losses or smaller gains than directly investing in securities. The risks of using derivatives include: 1) the risk that there may be imperfect correlation between the price of the financial instruments and movements in the prices of the reference asset(s); 2) the risk that an instrument is mispriced; 3) credit or counterparty risk on the amount a Fund expects to receive from a counterparty; 4) the risk that securities prices, interest rates and currency markets will move adversely and a Fund will incur significant losses; 5) the risk that the cost of holding a financial instrument might exceed its total return; and 6) the possible absence of a liquid secondary market for a particular instrument and possible exchange imposed price fluctuation limits, either of which may make it difficult or impossible to adjust a Fund’s position in a particular instrument when desired. Each of these factors may prevent a Fund from achieving its investment objective and may increase the volatility (i.e., fluctuations) of the Fund’s returns. Because derivatives often require limited initial investment, the use of derivatives also may expose a Fund to losses in excess of those amounts initially invested.
In addition, a Fund may use a combination of swaps on an underlying index and swaps on an ETF that is designed to track the performance of that index. The performance of an ETF may not track the performance of its underlying index due to embedded costs and other factors. Thus, to the extent a Fund invests in swaps that use an ETF as the reference asset, the Fund may be subject to greater correlation risk and may not achieve as high a degree of correlation with its index as it would if the Fund only used swaps on the underlying index.
Moreover, with respect to the use of swap agreements, if an index has a dramatic intraday move that causes a material decline in a Fund’s net assets, the terms of a swap agreement between the Fund and its counterparty may permit the counterparty to immediately close out the transaction with the
Fund. In that event, the Fund may be unable to enter into another swap agreement or invest in other derivatives to achieve the desired exposure consistent with the Fund’s investment objective. This, in turn, may prevent the Fund from achieving its investment objective, even if the index reverses all or a portion of its intraday move by the end of the day. Any costs associated with using derivatives will also have the effect of lowering the Fund’s return.
•Leverage Risk — Funds may utilize leverage (i.e., obtain investment exposure in excess of their assets) in seeking to achieve their investment objective and will lose more money in market environments adverse to their daily objective than similar funds that do not employ leverage. Because certain Funds include either a -2x or 2x multiplier, a 1.5x multiplier or a -1.25x or 1.25x multiplier, a single day adverse price movement of more than 50%, 67% or 80%, respectively, in a relevant benchmark, could result in the total loss of an investor’s investment.
•Compounding Risk — Most of the Funds are “geared” funds (each a “Geared Fund,” and collectively the “Geared Funds”) in the sense that each has an investment objective to match a multiple, the inverse, or an inverse multiple of the performance of a benchmark on a single day. A “single day” is measured from the time a Fund calculates its NAV to the time of the Fund’s next NAV calculation. These Funds are subject to all of the correlation risks described above. In addition, because the Funds have a single day investment objective, for periods greater than one day, the effect of compounding may cause each Fund’s performance to vary from the benchmark performance (or the inverse of the benchmark performance) times the stated multiple in the Fund’s investment objective, as applicable, before accounting for fees and Fund expenses. As explained in greater detail in the following section, as a result of compounding, Geared Funds are unlikely to provide a simple multiple (i.e., 2x, 1.5x, 1.25x, -1x, -1.25x, -2x) of a benchmark’s return over periods longer than a single day.
For additional graphs and charts demonstrating the effects of Index or Benchmark volatility and Index or Benchmark performance on the long-term performance of the Fund, see “Understanding the Risk and Long-Term Performance of Daily Objective Funds — The Impact of Compounding” above and “Special Note Regarding the Correlation Risks of Geared Funds” in the Fund’s Statement of Additional Information.
•Correlation Risk — There is no guarantee that a Fund will achieve a high degree of correlation with its benchmark. Failure to achieve a high degree of correlation may prevent a Fund from achieving its investment objective, and the percentage change of the Fund’s net asset value (“NAV”) each day may differ, perhaps significantly, from the percentage change of the Fund’s benchmark on such day. This may be due, among other reasons, to the impact of a limited trading market in the underlying component securities on the calculation of the benchmark. A number of other factors may
472 :: Investment Objectives, Principal Investment Strategies and Related Risks
adversely affect a Fund’s correlation with its benchmark, including material over- or underexposure, fees, expenses, transaction costs, financing costs associated with the use of derivatives, income items, valuation methodology, infrequent trading in the securities underlying its benchmark, accounting standards and disruptions or illiquidity in the markets for the financial instruments in which the Fund invests. The Fund may not have investment exposure to all financial instruments in the Index, or its weighting of investment exposure to financial instruments may be different from that of the Index. In addition, the Fund may invest in financial instruments not included in the Index. Each Fund may take or refrain from taking positions in order to improve tax efficiency or comply with regulatory restrictions, either of which may negatively affect the Fund’s correlation with its benchmark. A Fund may be subject to large movements of assets into and out of the Fund, potentially resulting in the Fund being over- or underexposed to its benchmark and may be impacted by index reconstitutions and index rebalancing events. Additionally, a Fund’s underlying holdings or reference assets may trade on markets that may not be open on the same day as the Fund, which may cause a difference between the changes in the daily performance of the Fund and changes in the level of the Index.
Each Fund (other than the Classic ProFunds, Actively Managed ProFunds and Falling U.S. Dollar ProFund) seeks to rebalance its portfolio daily to keep its leveraged, inverse or inverse leveraged exposure to the benchmark consistent with its daily investment objective. In addition, for UltraJapan ProFund and UltraShort Japan ProFund, each Fund’s currency hedging strategy may also be unable to perfectly match its benchmark and will introduce additional costs, both sources of additional correlation risk. Any of these factors could decrease correlation between the performance of a Fund and its benchmark, and may hinder a Fund’s ability to meet its investment objective.
•Counterparty Risk — A Fund will be subject to credit risk (i.e., the risk that a counterparty is unwilling or unable to make timely payments or otherwise meet its contractual obligations) with respect to the amount the Fund expects to receive from counterparties to financial instruments (including derivatives and repurchase agreements) entered into by the Fund. A Fund generally structures the agreements such that either party can terminate the contract without penalty prior to the termination date. If a counterparty terminates a contract, a Fund may not be able to invest in other derivatives to achieve the desired exposure, or achieving such exposure may be more expensive. A Fund may be negatively impacted if a counterparty becomes bankrupt or otherwise fails to perform its obligations under such an agreement. A Fund may experience significant delays in obtaining any recovery in a bankruptcy or other reorganization proceeding and a Fund may obtain only limited recovery or may obtain no recovery in such circumstances. In
order to attempt to mitigate potential counterparty credit risk, a Fund typically enters into transactions with major financial institutions. A Fund also seeks to mitigate risks by generally requiring that the counterparties agree to post collateral for the benefit of the Fund, marked to market daily, in an amount approximately equal to what the counterparty owes the Fund, subject to certain minimum thresholds. To the extent any such collateral is insufficient or there are delays in accessing the collateral, a Fund will be exposed to the risks described above, including possible delays in recovering amounts as a result of bankruptcy proceedings.
The counterparty to a cleared swap agreement and/or exchange-traded futures contract is subject to the credit risk of the clearing house and the futures commission merchant (“FCM”) through which it holds its position. Specifically, the FCM or the clearing house could fail to perform its obligations, causing significant losses to the Fund. For example, a Fund could lose margin payments it has deposited with an FCM as well as any gains owed but not paid to the Fund, if the FCM or clearing house becomes insolvent or otherwise fails to perform its obligations. Credit risk of market participants with respect to derivatives that are centrally cleared is concentrated in a few clearing houses and it is not clear how an insolvency proceeding of a clearing house would be conducted and what impact an insolvency of a clearing house would have on the financial system. Under current Commodity Futures Trading Commission (“CFTC”) regulations, a FCM maintains customers’ assets in a bulk segregated account. If a FCM fails to do so, or is unable to satisfy a substantial deficit in a customer account, its other customers may be subject to risk of loss of their funds in the event of that FCM’s bankruptcy. In that event, in the case of futures and options on futures, the FCM’s customers are entitled to recover, even in respect of property specifically traceable to them, only a proportional share of all property available for distribution to all of that FCM’s customers. In addition, if the FCM does not comply with the applicable regulations, or in the event of a fraud or misappropriation of customer assets by the FCM, a Fund could have only an unsecured creditor claim in an insolvency of the FCM with respect to the margin held by the FCM. FCMs are also required to transfer to the clearing house the amount of margin required by the clearing house, which amount is generally held in an omnibus account at the clearing house for all customers of the FCM. In certain cases with respect to cleared swaps, the FCM may also transfer any excess initial margin posted by a Fund to the clearing house. Regulations promulgated by the CFTC require that the FCM notify the clearing house of the excess initial margin provided by the FCM to the clearing house that is attributable to each customer. However, if the FCM does not accurately report a Fund’s initial margin, the Fund is subject to the risk that a clearing house will use the assets attributable to it in the
Investment Objectives, Principal Investment Strategies and Related Risks :: 473
clearing house’s omnibus account to satisfy payment obligations a defaulting customer of the FCM has to the clearing house.
In addition, a Fund may enter into agreements with a limited number of counterparties, which may increase the Fund’s exposure to counterparty credit risk. A Fund does not specifically limit its counterparty risk with respect to any single counterparty. Further, there is a risk that no suitable counterparties are willing to enter into, or continue to enter into, transactions with a Fund and, as a result, a Fund may not be able to achieve its investment objective. Contractual provisions and applicable law may prevent or delay a Fund from exercising its rights to terminate an investment or transaction with a financial institution experiencing financial difficulties, or to realize on collateral, and another institution may be substituted for that financial institution without the consent of the Fund. If the credit rating of a derivatives counterparty declines, a Fund may nonetheless choose or be required to keep existing transactions in place with the counterparty, in which event the Fund would be subject to any increased credit risk associated with those transactions. Also, in the event of a counterparty’s (or its affiliate’s) insolvency, the possibility exists that a Fund’s ability to exercise remedies, such as the termination of transactions, netting of obligations and realization on collateral, could be stayed or eliminated under special resolution regimes adopted in the United States, the European Union, United Kingdom and various other jurisdictions. Such regimes provide government authorities with broad authority to intervene when a financial institution is experiencing financial difficulty. In particular, the regulatory authorities could reduce, eliminate, or convert to equity the liabilities to a Fund of a counterparty who is subject to such proceedings in the European Union or United Kingdom (sometimes referred to as a “bail in”).
•Concentration and Focused Investing — An index may concentrate (i.e., may be composed of securities that represent 25 percent or more of the value of the index) or focus (i.e., may be composed of securities that represent a substantial portion of its value, but less than 25 percent) in an industry or group of industries. A Fund will allocate its investments to approximately the same extent as its index. As a result, a Fund may be subject to greater market fluctuations than a fund that is more broadly invested across industries. Financial, economic, business, regulatory conditions, and other developments affecting issuers in a particular industry or group of industries will have a greater effect on a Fund, and if securities of the particular industry or group of industries fall out of favor, a Fund could underperform, or its net asset value may be more volatile than, funds that have greater industry diversification.
•Automobiles & Components Industry Risk — The risks of investments in the industry include: cyclicality of revenues and earnings, with potential of periodic operating losses;
labor relations and fluctuating component prices; significant capital expenditures in automotive technologies (e.g., autonomous vehicle technologies) that may not generate profits for several years, if ever; and adverse effects from governmental policies, such as taxes, tariffs, duties, subsidies, and import and export restrictions. While most of the major automotive manufacturers are large companies, certain others may be non-diversified in both product line and customer base and may be more vulnerable to certain events that may negatively impact the industry.
•Banks Industry Risk — The risks of investments in the industry include: extensive governmental regulation and/or nationalization that affects the scope of their activities, the prices they can charge and the amount of capital they must maintain; adverse effects on profitability due to increases in interest rates or loan losses (which usually increase in economic downturns, which could lead to insolvency or other negative consequences); severe price competition; economic conditions; credit rating downgrades; and increased inter-sector consolidation and competition. This sector has experienced significant losses in the recent past, and the impact of more stringent capital requirements and of recent or future regulation on any individual bank or on the sector as a whole cannot be predicted. The banks industry may also be affected by risks that affect the broader financial services industry.
•Capital Goods Industry Risk — The risks of investments in the industry include: fluctuations in the business cycle, heavy dependence on corporate spending and by other factors affecting manufacturing demands. The capital goods industry may perform well during times of economic expansion, and as economic conditions worsen, the demand for capital goods may decrease due to weakening demand, worsening business cash flows, tighter credit controls and deteriorating profitability. During times of economic volatility, corporate spending may fall and adversely affect the capital goods industry. The capital goods industry may also be affected by changes in interest rates, corporate tax rates and other government policies. Many capital goods are sold internationally, and such companies are subject to market conditions in other countries and regions.
•Communication Services Industry Risk — The risk of investments in the industry include: the potential obsolescence of products and services due to increasing competition from the innovation of competitors; increased research and development costs and capital requirements to formulate new products and services that utilize new technology; pricing new and existing products to match or beat industry competitors, shifting demographics and changes to consumer taste, which can negatively impact profitability; and regulation by the Federal Communications Commission, and various state regulatory authorities. Companies in the communication services industry may be more susceptible to
474 :: Investment Objectives, Principal Investment Strategies and Related Risks
cybersecurity issues than companies in other industries, including hacking, theft of proprietary or consumer information, and disruptions in service.
•Consumer Discretionary Industry Risk — The risks of investments in the industry include: the fact that securities prices and profitability may be tied closely to the performance of the domestic and international economy, interest rates, competition and consumer confidence; heavy dependence on disposable household income and consumer spending; severe competition; and changes in demographics and consumer tastes, which can affect the success of consumer products.
•Consumer Goods Industry Risk — The risks of investments in the industry include: the fact that securities prices and profitability may be affected by competition and consumer confidence; heavy dependence on disposable household income and consumer spending; severe competition; and changes in demographics and consumer tastes, which can affect the success of consumer products. Many consumer goods are sold internationally, and companies that sell such products may be affected by market conditions in other countries and regions.
•Consumer Durables and Apparel Industry Risk — The risks of investments in the industry include: performance of the economy overall, interest rates, competition, consumer confidence and spending, cyclicality of revenues and earnings, changing consumer demands, regulatory restrictions, product liability, litigation, environmental regulation and transportation and distribution costs. Companies in this industry are subject to heavy dependence on disposable household income and consumer spending, changes in consumer demographics and consumer tastes.
•Consumer Services Industry Risk — The risks of investments in the industry include: the fact that securities prices and profitability may be tied closely to the performance of the domestic and international economy, interest rates, competition and consumer confidence; heavy dependence on disposable household income and consumer spending; severe competition; and changes in demographics and consumer tastes.
•Diversified Financials Industry Risk — The risks of investments in the industry include: changes in credit ratings, interest rates, loan losses, the performance of credit and financial markets and the availability and cost of capital funds; and adverse effects from governmental regulation and oversight. The diversified financials industry may also be affected by risks that affect the broader financials industry.
•Energy Industry Risk — The risks of investments in the industry include: adverse effects on profitability from changes in worldwide energy prices and exploration, and production spending; adverse effects from changes in exchange rates, government regulation, world events, international conflicts or threat of conflicts and economic conditions; market, economic and political risks of the countries where energy
companies are located or do business; the fact that the value of regulated utility debt instruments (and, to a lesser extent, equity securities) tends to have an inverse relationship to the movement of interest rates; and risk for environmental damage claims. The energy industry has recently experienced significant volatility due to dramatic changes in the prices of energy commodities, and it is possible that such volatility will continue in the future.
On February 24, 2022, Russia commenced a military attack on Ukraine. The outbreak of hostilities between the two countries could result in more widespread conflict and could have a severe adverse effect on the region and the markets for securities and commodities, including oil. In addition, sanctions imposed on Russia by the United States and other countries, and any sanctions imposed in the future could have a significant adverse impact on the Russian economy and related markets. How long such conflict and related events will last and whether it will escalate further cannot be predicted. Impacts from the conflict and related events could have significant impact on the Fund’s performance, and the value of an investment in the Fund may decline significantly.
On February 24, 2022, Russia commenced a military attack on Ukraine. The outbreak of hostilities between the two countries could result in more widespread conflict and could have a severe adverse effect on the region and the markets for securities and commodities, including oil. In addition, sanctions imposed on Russia by the United States and other countries, and any sanctions imposed in the future could have a significant adverse impact on the Russian economy and related markets. How long such conflict and related events will last and whether it will escalate further cannot be predicted. Impacts from the conflict and related events could have significant impact on the Fund’s performance, and the value of an investment in the Fund may decline significantly.
•Financials Industry Risk — The risks of investments in the industry include: extensive governmental regulation and/or nationalization that affects the scope of their activities, the prices they can charge and the amount of capital they must maintain; adverse effects from increases in interest rates; adverse effects on profitability by loan losses, which usually increase in economic downturns; the severe competition to which banks, insurance, and financial services companies may be subject; and increased inter-sector consolidation and competition in the financials industry. The impact of more stringent capital requirements, recent or future regulation on any individual financial company or recent or future regulation on the financials industry as a whole cannot be predicted.
•Food, Beverage and Tobacco Industry Risk — The risks of investments in the industry include: changes in demand for products, demographic and product trends and general economic conditions; effects of competitive pricing, environmental factors, marketing campaigns and consumer boycotts; and adverse effects from governmental regulation and oversight. The tobacco industry may also be affected by additional risks, including: smoking and health litigation; governmental and private bans and restrictions on smoking; and actual and proposed price controls on tobacco products. The food, beverage and tobacco industry may also be affected by risks that affect the broader consumer staples industry.
•Health Care Industry Risk — The risks of investments in the industry include: heavy dependence on patent protection, with profitability affected by the expiration of patents; expenses and losses from extensive litigation based on product liability and similar claims; competitive forces that may make it difficult to raise prices and, in fact, may result in price discounting; the long and costly process for obtaining
Investment Objectives, Principal Investment Strategies and Related Risks :: 475
new product approval by the Food and Drug Administration; the difficulty health care providers may have obtaining staff to deliver service; susceptibility to product obsolescence; and thin capitalization and limited product lines, markets and financial resources or personnel.
•Health Care Equipment and Services Industry Risk — The risks of investments in the industry include: increased emphasis on the delivery of health care through outpatient services, limited product lines for health care equipment may cause companies to increase expenditures for the research and development of new products, technological advances, new market developments and regulatory changes in the health care industry can increase research and development, marketing and sales costs.
•Household and Personal Products Industry Risk — The risks of investments in the industry include: performance of the economy overall, interest rates, competition, consumer confidence and spending, cyclicality of revenues and earnings, changing consumer demands, regulatory restrictions, product liability, litigation, environmental regulation and transportation and distribution costs. Companies in this industry can perform differently than the overall market and their success may depend significantly on disposable household income and consumer spending. Changes in demographics and consumer tastes can also affect the demand for and success of, consumer products.
•Industrials Industry Risk — The risks of investments in the industry include: adverse effects on stock prices by supply and demand both for their specific product or service and for industrials industry products in general; decline in demand for products due to rapid technological developments and frequent new product introduction; adverse effects on securities prices and profitability from government regulation, world events and economic conditions; and risks for environmental damage and product liability claims.
•Information Technology Industry Risk — Securities of information technology companies may be subject to greater volatility than stocks of companies in other market sectors. Like other technology companies, information technology companies may be affected by intense competition, obsolescence of existing technology, general economic conditions and government regulation and may have limited product lines, markets, financial resources or personnel. Information technology companies may experience dramatic and often unpredictable changes in growth rates and competition for qualified personnel. These companies also are heavily dependent on patent and intellectual property rights, the loss or impairment of which may adversely affect profitability. A small number of companies represent a large portion of the information technology industry as a whole.
•Materials Industry Risk — The risks of investments in the industry include: adverse effects from commodity price volatility, exchange rates, import controls and increased
competition; the possibility that production of industrial materials will exceed demand as a result of overbuilding or economic downturns, leading to poor investment returns; risk for environmental damage and product liability claims; and adverse effects from depletion of resources, technical progress, labor relations and government regulations.
•Media and Entertainment Industry Risk — Media and entertainment companies within the Communication Services industry are impacted by the high costs of research and development of new content and services in an effort to stay relevant in a highly competitive industry. In addition, media and entertainment companies are challenged by the changing tastes, topical interests and discretionary income of their targeted consumers. With the advancement of streaming technology, sales of content through physical formats (such as DVD and Blu-ray) and traditional content delivery services (such as cable TV providers and satellite dish operators) are declining in popularity as consumers increasingly opt to purchase digital content that is customizable, less expensive and takes up less physical space. The media and entertainment industry is regulated and changes to rules regarding advertising and the content produced by media and entertainment companies can increase overall production and distribution costs.
•Pharmaceuticals, Biotechnology, and Life Sciences Industry Risk — The risks of investments in the industry include: heavy dependence on patents and intellectual property rights, with profitability affected by the loss or impairment of such rights; risks of new technologies and competitive pressures; large expenditures on research and development of products or services that may not prove commercially successful or may become obsolete quickly; regulations and restrictions imposed by the Food and Drug Administration, the Environmental Protection Agency, state and local governments, and foreign regulatory authorities; and thin capitalization and limited product lines, markets, financial resources or personnel. Moreover, stock prices of biotechnology companies are very volatile, particularly when their products are up for regulatory approval and/or under regulatory scrutiny. The biotechnology sector may also be affected by risks that affect the broader health care industry, including expenses and losses from extensive litigation on product liability and similar claims. The pharmaceuticals sector may also be affected by risks that affect the broader health care industry, including: heavy dependence on patent protection, with profitability affected by the expiration of patents; competitive forces that may make it difficult to raise prices and, in fact, may result in price discounts; and thin capitalization and limited product lines, markets and financial resources or personnel.
•Real Estate Industry Risk — Investing in securities of real estate companies includes risks such as: fluctuations in the value of the underlying properties; periodic overbuilding and
476 :: Investment Objectives, Principal Investment Strategies and Related Risks
market saturation; changes in general and local economic conditions; changes in demographic trends, such as population shifts or changing tastes and values; concentration in a particular geographic region or property type; catastrophic events such as earthquakes, hurricanes and terrorist acts; casualty or condemnation losses; decreases in market rates for rents; increased competition; increases in property taxes, interest rates, capital expenditures, or operating expenses; changes in the availability, cost and terms of mortgage funds; defaults by borrowers or tenants; and other economic, political or regulatory occurrences, including the impact of changes in environmental laws, that may affect the real estate industry.
•Retailing Industry Risk — The risks of investments in the industry include: changes in domestic and international economies, consumer confidence, disposable household income and spending, and consumer tastes and preferences; intense competition; changing demographics; marketing and public perception; dependence on third-party suppliers and distribution systems; intellectual property infringement; legislative or regulatory changes and increased government supervision; thin capitalization; dependence on a relatively few number of business days to achieve overall results; and dependence on outside financing, which may be difficult to obtain.
•Semiconductors and Semiconductor Equipment Industry Risk — The risks of investments in the industry include: intense competition, both domestically and internationally, including competition from subsidized foreign competitors with lower production costs; wide fluctuations in securities prices due to risks of rapid obsolescence of products; economic performance of the customers of semiconductor companies; their research costs and the risks that their products may not prove commercially successful; capital equipment expenditures that could be substantial and suffer from rapid obsolescence; and thin capitalization and limited product lines, markets, financial resources or personnel. The semiconductors sector may also be affected by risks that affect the broader technology sector, including: government regulation; dramatic and often unpredictable changes in growth rates and competition for qualified personnel; heavy dependence on patent and intellectual property rights, the loss or impairment of which may adversely affect profitability; and a small number of companies representing a large portion of the technology sector as a whole.
•Software and Services Industry Risk — The risks of investments in the industry include: competitive pressures, such as aggressive pricing (including fixed-rate pricing), technological developments (including product-specific technological change), changing domestic demand, and the ability to attract and retain skilled employees; availability and price of components; dependence on intellectual property rights, and potential loss or impairment of those rights; research and development costs; rapid product obsolescence;
cyclical market patterns; evolving industry standards; and frequent new product introductions requiring timely and successful introduction of new products and the ability to service such products. The software and services industry may also be affected by risks that affect the broader information technology industry.
•Technology Hardware and Equipment Industry Risk — The risks of investments in the industry include: effects from industry competition, evolving industry standards and obsolescence of products; government regulation; changes in costs of components and ability to attract and maintain skilled employees; and dependence on intellectual property rights. Stocks of technology companies and companies that rely heavily on technology, especially those of smaller, less-seasoned companies, tend to be more volatile than the overall market. The technology hardware and equipment industry may also be affected by risks that affect the broader information technology industry.
•Telecommunication Services Industry Risk — The risks of investments in the industry include: a telecommunications market characterized by increasing competition and regulation by the Federal Communications Commission and various state regulatory authorities; the need to commit substantial capital to meet increasing competition, particularly in formulating new products and services using new technology; and technological innovations that may make various products and services obsolete.
•Utilities Industry Risk — The risks of investments in the industry include: review and limitation of rates by governmental regulatory commissions; the fact that the value of regulated utility debt instruments (and, to a lesser extent, equity securities) tends to have an inverse relationship to the movement of interest rates; the risk that utilities may engage in riskier ventures where they have little or no experience; as deregulation allows utilities to diversify outside of their original geographic regions and their traditional lines of business and greater competition as a result of deregulation, which may adversely affect profitability due to lower operating margins, higher costs and diversification into unprofitable business lines.
•Debt Instrument Risk — Debt instruments may have varying levels of sensitivity to changes in interest rates and other factors. Typically, the prices of outstanding debt instruments fall when interest rates rise. Without taking into account other factors, the prices of debt instruments with longer maturities may fluctuate more in response to interest rate changes than those of debt instruments with shorter maturities. In addition, changes in the credit quality of the issuer of a debt instrument (including a default) can also affect the price of a debt instrument. Many types of debt instruments are subject to prepayment risk, which is the risk that the issuer of the security will repay principal (in part or in whole) prior to the maturity date. Debt instruments allowing prepayment may
Investment Objectives, Principal Investment Strategies and Related Risks :: 477
offer less potential for gains during a period of declining interest rates, as a Fund may be required to reinvest the proceeds received at lower interest rates. Callable bonds may also have lower sensitivity to interest rate declines than non-callable bonds or Treasury Securities. Such factors may cause the value of an investment in the Fund to change. Debt markets can be volatile and the value of instruments correlated with these markets may fluctuate dramatically from day to day. Debt instruments in the Index may underperform other debt instruments that track other markets, segments and sectors.
•Foreign Investments Risk — Certain factors related to investment in securities of foreign issuers or other investments that provide a Fund with exposure to foreign issuers (collectively, “foreign investments”) may prevent a Fund from achieving its goals. These factors may include the effects of: (i) fluctuations in the value of the local currency versus the U.S. dollar and the uncertainty associated with the cost of converting between various currencies, even if a Fund attempts to hedge against its currency exposure; (ii) differences in settlement practices, as compared to U.S. investments, or delayed settlements in some foreign markets; (iii) the uncertainty associated with evidence of ownership of investments in many foreign countries, which may lack the centralized custodial services and rigorous proofs of ownership required by many U.S. investments; (iv) possible regulation of, or other limitations on, investments by U.S. investors in foreign investments; (v) brokerage commissions and fees and other investment related costs that may be higher than those applicable to U.S. investments; (vi) the possibility that a foreign government may withhold portions of interest and dividends at the source; (vii) taxation of income earned in foreign nations or other taxes imposed with respect to investments in foreign nations; (viii) changes in the denomination currency of a foreign investment, (ix) foreign exchange controls, which may include suspension of the ability to transfer currency from a given country; (x) less publicly available information about foreign issuers; and (xi) less certain legal systems in which the Fund may encounter difficulties or be unable to pursue legal remedies.
In addition, markets for foreign investments are usually less liquid, more volatile and significantly smaller than markets for U.S. securities, which may affect, among other things, a Fund’s ability to obtain exposure to those foreign investments at appropriate times and prices. Because of differences in settlement times and/or foreign market holidays, transactions in a foreign market may take place one or more days after the necessary exposure to these investments is determined. Until the transactions are effected, the Fund is exposed to increased foreign currency risk and market risk and, ultimately, increased correlation risk.
A Fund’s performance also may be affected by factors related to its ability to obtain information about foreign investments. In many foreign countries, there is less publicly available information about issuers than is available in reports about
U.S. issuers. Markets for foreign investments are usually not subject to the degree of government supervision and regulation that exists for U.S. investments. Foreign issuers are not generally subject to uniform accounting, auditing and financial reporting standards, and auditing practices and requirements may not be comparable to those applicable to U.S. issuers. The Public Company Accounting Oversight Board, which regulates auditors of U.S. public companies, is unable to inspect audit work papers in certain foreign countries. Furthermore, the issuers of foreign investments may be closely controlled by a small number of families, institutional investors or foreign governments whose investment decisions might be difficult to predict. To the extent a Fund’s assets are exposed to contractual and other legal obligations in a foreign country, (e.g., swap agreements with foreign counterparties), these factors may affect the Fund’s ability to achieve its investment objective. A Fund may encounter difficulties or be unable to pursue legal remedies and obtain judgments in foreign courts. In some countries, information about decisions of the judiciary, other government branches, regulatory agencies and tax authorities may be less transparent than decisions by comparable institutions in the U.S., particularly in countries that are politically dominated by a single party or individual. Moreover, enforcement of such decisions may be inconsistent or uncertain. Investors in foreign countries often have limited rights and few practical remedies to pursue shareholder claims, including class actions or fraud claims and the ability of the U.S. Securities and Exchange Commission, the U.S. Department of Justice and other authorities to bring and enforce actions against foreign issuers or foreign persons is limited.
Foreign investments also may be more susceptible to political, social, economic and regional factors than may be the case for U.S. securities. These factors include the effect of: (i) expropriation, nationalization or confiscatory taxation of foreign investments; (ii) changes in credit conditions related to foreign counterparties, including foreign governments and foreign financial institutions; (iii) trade barriers, exchange controls, managed adjustments in relative currency values and other protectionist measures; and (iv) issues related to multi-national currency arrangements; and (v) increased correlation between the value of foreign investments and changes in the commodities markets.
•Special Considerations About Emerging Market Countries — Because foreign investments of a Fund may include issuers domiciled in developing or “emerging market” countries, the aforementioned factors are heightened and foreign investments risk is higher. Economic, business, political or social instability may adversely affect the value of emerging market securities more acutely than securities tied to developed foreign market countries. Emerging markets are riskier than more developed markets because they may develop unevenly or may never fully develop. Investments in emerging market countries are considered speculative.
478 :: Investment Objectives, Principal Investment Strategies and Related Risks
○Political and Social Risk — Some governments in emerging markets countries are authoritarian in nature or have been installed or removed as a result of military coups, and some governments have periodically used force to suppress civil dissent. Disparities of wealth, the pace and success of democratization, and ethnic, religious and racial disaffection, have also led to social unrest, violence and/or labor unrest in some emerging market countries. Unanticipated political or social developments may result in sudden and significant investment losses. Also, investing in emerging market countries involves a great risk of loss due to expropriation, nationalization, confiscation of assets and property or the imposition of restrictions on foreign investments and repatriation of capital invested by certain emerging market countries.
○Economic Risk — Some emerging market countries have experienced currency devaluations and substantial (and, in some cases, extremely high) rates of inflation, while others have experienced economic recessions causing a negative effect on the economies and securities markets of such emerging countries. Further, economies in emerging market countries generally are dependent heavily upon commodity prices and international trade and, accordingly, may be affected adversely by the economies of their trading partners, trade barriers, exchange controls, managed adjustments in relative currency values, and may suffer from extreme and volatile debt burdens or inflation rates.
○Market Risk – Some emerging market countries may have inefficient and underdeveloped financial markets and therefore may lack the infrastructure necessary to attract large amounts of foreign trade and investment. As a result, emerging market issuers may have limited access to reliable sources of capital. Inefficient markets combined with less sophisticated regulatory oversight may also mean that securities traded in emerging markets are more susceptible to market manipulation by other market participants. Furthermore, legal principles relating to standards of corporate governance and directors’ fiduciary duties may differ from and/or not be as extensive or protective as those that apply in the U.S.
•Geographic Concentration Risk — Funds that focus their investments in companies economically tied to particular foreign countries or geographic regions may be particularly susceptible to economic, political or regulatory events affecting those countries or regions. In addition, currency devaluations or other declines in the value of their currency could occur in foreign countries that have not yet experienced currency devaluation or declines to date, or could continue to occur in foreign countries that have already experienced such devaluations or declines. As a result, funds that focus their
investments in companies economically tied to a particular foreign geographic region or country may be more volatile than a more geographically diversified fund.
•Exposure to Brazilian Investments Risk — The Brazilian economy is sensitive to fluctuations in commodity prices and commodity markets, and is heavily dependent on trading with key partners. Any changes in the volume of this trading, in taxes or tariffs, or in political relationships between nations may adversely affect the Brazilian economy and, as a result, the Fund’s investments. The Brazilian economy has historically been exposed to high rates of inflation and a high level of debt, each of which may reduce and/or prevent economic growth. The Brazilian government currently imposes significant taxes on the transfer of currency. While the Brazilian economy has experienced growth in recent years, there is no guarantee that this growth will continue.
•Exposure to Chinese Investments Risk — Investments in securities of issuers in China (including variable interest entities (“VIEs”) associated with an underlying Chinese operating company) include risks such as, but are not limited to, less developed or less efficient trading markets; heightened risk of inefficiency, volatility and pricing anomalies of portfolio holdings resulting from government control of markets; currency fluctuations or blockage; nationalization of assets; limits on repatriation; uncertainty surrounding trading suspensions; a lack of publicly available information (as compared to many other countries); and natural disasters particularly likely to occur in China. Changes in Chinese government policy and economic growth rates could significantly affect local markets and the entire Greater China region. China has yet to develop comprehensive securities, corporate, or commercial laws, and its economy is experiencing a relative slowdown. China is an emerging market and demonstrates significantly higher volatility from time to time in comparison to developed markets. Internal social unrest or confrontations with neighboring countries may also disrupt economic development in China and result in a greater risk of currency fluctuations, currency non-convertibility, interest rate fluctuations, and higher rates of inflation. Investments in securities of Chinese companies are subject to China’s heavy dependence on exports. Reductions in spending on Chinese products and services, institution of tariffs or other trade barriers, including as a result of heightened trade tensions between China and the United States, or a downturn in any of the economies of China’s key trading partners may have an adverse impact on the Chinese economy and the values of Chinese companies. Significant portions of the Chinese securities markets may become rapidly illiquid, as Chinese issuers have the ability to suspend the trading of their equity securities and have shown a willingness to exercise that option in response to market volatility and other events. The liquidity of Chinese securities
Investment Objectives, Principal Investment Strategies and Related Risks :: 479
may shrink or disappear suddenly and without warning as a result of adverse economic, market or political events, or adverse investor perceptions, whether or not accurate.
Investments in issuers in China may include investments through legal structures known as VIEs. In China, ownership of companies in certain sectors by foreign individuals and entities (including U.S. persons and entities such as a Fund) is prohibited. In order to facilitate foreign investment in these businesses, many Chinese companies have created VIEs. In these arrangements, a China-based operating company typically establishes an offshore shell company in another jurisdiction, such as the Cayman Islands. That shell company enters into service and other contracts with the China-based operating company, then issues shares on a foreign exchange, such as the New York Stock Exchange. Foreign investors hold stock in the shell company (i.e., the U.S.-listed company) rather than directly in the China-based operating company. This arrangement allows U.S. investors to obtain economic exposure to the China-based company through contractual means rather than through formal equity ownership.
Intervention by the Chinese government with respect to VIEs could significantly affect the Chinese operating company’s performance (and, in turn, a Fund’s performance) and the enforceability of the VIE’s contractual arrangements with the Chinese company.
VIEs are a longstanding industry practice and well known to officials and regulators in China; however, VIEs are not formally recognized under Chinese law. Recently, the government of China provided new guidance to and placed restrictions on China-based companies raising capital offshore, including through VIE structures. Investors face uncertainty about future actions by the government of China that could significantly affect an operating company’s financial performance and the enforceability of the shell company’s contractual arrangements. A breach of a contractual arrangement between a U.S.-listed company and a China-based VIE would likely be subject to Chinese law and jurisdiction and, as such, could result in a lack of recourse in the event the U.S.-listed company receives an adverse ruling. There may also be conflicts of interest between the legal owners of the VIE and investors of the U.S.-listed companies.
It is uncertain whether Chinese officials or regulators will withdraw their implicit acceptance of the VIE structure, or whether any new laws, rules or regulations relating to VIE structures will be adopted or, if adopted, what impact they would have on the interests of foreign shareholders. Under extreme circumstances, China might prohibit the existence of VIEs, or sever their ability to transmit economic and governance rights to foreign individuals and entities; if so, the market value of a Fund’s associated portfolio holdings would likely suffer significant, detrimental, and possibly permanent effects, which could result in substantial investment losses.
•Exposure to European Investments Risk — Many countries are members of the European Union (the “EU”) and all European countries may be significantly affected by EU policies and may be highly dependent on the economies of their fellow members. The European financial markets have experienced significant volatility and several European countries have been adversely affected by unemployment, budget deficits and economic downturns. In addition, several European countries (including the United Kingdom) have experienced credit rating downgrades, rising government debt levels and, for certain European countries (including Spain, Portugal, Ireland and Italy), weaknesses in sovereign debt. These events, along with decreasing imports or exports, changes in governmental or EU regulations on trade, the default or threat of default by a European country on its sovereign debt, an economic recession in a European country, or the threat of a European country to leave the EU may have a significant adverse effect on the affected European country, issuers in the affected European country, the economies of other European countries, or their trading partners. Such events, or even the threat of these events, may cause the value of securities issued by issuers in such European countries to fall, in some cases drastically. These events may also cause further volatility in the European financial markets. To the extent that a Fund’s assets are exposed to investments from issuers in European countries or denominated in euro, their trading partners, or other European countries, these events may negatively impact the performance of the Fund.
On February 24, 2022, Russia commenced a military attack on Ukraine. The military incursion has led to, and may lead to additional sanctions being levied by the United States, European Union, United Kingdom and other countries against Russia. Russia’s military incursion and the resulting sanctions and other rapidly evolving measures in response could adversely affect global energy and financial markets and thus could affect the value of a Fund’s investments. The severity, extent and duration of the military conflict, sanctions and resulting market disruptions are impossible to predict, but could have a material adverse effect on the European region and beyond, including significant negative impacts on the economy and the markets for certain securities and commodities, such as oil and natural gas. How long such tensions and related events will last cannot be predicted. These tensions and any related events could have significant impact on a Fund’s performance and the value of an investment in a Fund.
•Exposure to Japanese Investments Risk — Investments in Japan are subject to risks including, but not limited to (i) political, economic, or social instability in Japan; (ii) risks associated with Japan’s large government deficit; (iii) natural disasters particularly likely to occur in Japan; (iv) risks associated with an increasingly aging and declining population that is likely to strain Japan’s social welfare and
480 :: Investment Objectives, Principal Investment Strategies and Related Risks
pension systems; and (v) relatively high unemployment. Since the year 2000, Japan’s economic growth rate has remained relatively low. As an island nation, Japan has limited natural resources and land area, and the Japanese economy is heavily dependent on international trade and reliant on imports for its commodity needs. Fluctuations or shortages in the commodity markets may negatively impact the Japanese economy. Slowdowns in the U.S. and/or China and other Southeast Asian countries, including economic, political or social instability in such countries, could have a negative impact on Japan. Because of its trade dependence, the Japanese economy is particularly exposed to the risks of currency fluctuation, foreign trade policy and regional and global economic disruption, including the risk of increased tariffs, embargoes, and other trade limitations. Strained relationships between Japan and its neighboring countries, including China, South Korea and North Korea, based on historical grievances, territorial disputes, and defense concerns, may also inject uncertainty into Japanese markets. As a result, additional tariffs, other trade barriers, or boycotts may have an adverse impact on the Japanese economy.
•Exposure to Latin American Investments Risk—The Fund is exposed, to a greater extent than more geographically diversified funds, to risks associated with investments in Latin American countries. Such risks include, but are not limited to (i) political, economic, or social instability in certain Latin American countries; (ii) a heightened risk of high inflation and government deficits in certain Latin American countries; (iii) natural disasters particularly likely to occur in Latin America; (iv) heightened risk of currency devaluations; (v) risks associated with Latin American countries’ significant dependence on the health of the U.S. economy; and (vi) risks associated with Latin American economies’ sensitivity to fluctuations in the price of commodities such as oil and gas, minerals, and metals (resulting from those economies’ heavy reliance on the export of such commodities).
•Exposure to Mexican Investments Risk — Investments in Mexico are subject to risks that are specific to Mexico, including but not limited to fluctuations in commodity prices and commodity markets as well as heavy dependence on trading with key economies, including the U.S. economy and certain Latin American economies. Any increases or decreases in the volume of this trading, changes in taxes or tariffs, or variance in political relationships between those nations may impact the Mexican economy. For example, lower oil prices have negatively impacted Petróleos Mexicanos, the Mexican State-owned petroleum company, which accounts for a significant percentage of the Mexican government’s tax revenue. Additionally, agricultural and mining sectors of Mexico’s economy account for a large portion of Mexico’s exports. Any changes in these sectors or fluctuations in the commodity markets could have an adverse impact on the Mexican economy. Historically, Mexico has also experienced substantial economic instability resulting from, among other things, periods of high inflation and significant devaluations
of the Mexican currency, the peso, as well as high interest rates, economic volatility, and high unemployment rates. Recently, Mexico has experienced adverse economic impacts as a result of earthquakes and hurricanes, as well as outbreaks of violence.
•Exposure to The Netherlands Investments Risk — Investment in the Netherlands are subject to risks including: regulatory, political, currency, security, and economic risk specific to the Netherlands and the countries that use the euro. Among other things, the Netherlands’ economy is heavily dependent on trading relationships with certain key trading partners, including Germany, Belgium, the U.K., France, and Italy. Future changes in the price or the demand for Dutch products or services by these countries or changes in these countries’ economies, trade regulations or currency exchange rates could adversely impact the Dutch economy and the issuers to which the Fund has exposure. The Dutch economy relies on export of financial services to other European countries.
•Exposure to Taiwan Investment Risk — Investments in Taiwan are subject to risks, including, but not limited to, legal, regulatory, political, currency and economic risks that are specific to Taiwan. Specifically, Taiwan’s geographic proximity and history of political contention with China have resulted in ongoing tensions between the two countries, which may materially affect the Taiwanese companies. Investments in securities of Taiwanese companies are subject to Taiwan’s heavy dependence on exports. Reductions in spending on Taiwanese products and services, labor shortages, institution of tariffs or other trade barriers, or a downturn in any of the economies of Taiwan’s key trading partners, including the United States, may have an adverse impact on the Taiwanese economy and the values of Taiwanese companies.
•Exposure to United Kingdom Investments Risk — The United Kingdom has one of the largest economies in Europe, and the United States and other European countries are substantial trading partners of the United Kingdom. As a result, the British economy may be impacted by changes to the economic condition of the United States and other European countries. The British economy relies heavily on the export of financial services to the United States and other European countries and, therefore, a prolonged slowdown in the financial services sector may have a negative impact on the British economy. Continued governmental involvement or control in certain sectors may stifle competition in certain sectors or cause adverse effects on economic growth. On January 31, 2020, the United Kingdom left the European Union (referred to as “Brexit”) and on this date the United Kingdom entered a transition period that ended on December 31, 2020. During this time, the United Kingdom negotiated its future relationship with the European Union. Following the transition period, the United Kingdom’s post-Brexit trade agreement with the European Union passed into law in December 2020 and went into effect January 1, 2021.
Investment Objectives, Principal Investment Strategies and Related Risks :: 481
The Trade and Cooperation Agreement does not provide the United Kingdom with the same level of rights or access to all goods and services in the European Union as the United Kingdom previously maintained as a member of the European Union and during the transition period. In particular, the Trade and Cooperation Agreement does not include an agreement on financial services which is yet to be agreed. Given the size and importance of the United Kingdom’s economy, uncertainty about its legal, political, and economic relationship with the remaining member states of the European Union may continue to be a source of instability. Brexit could lead to legal and tax uncertainty and potentially divergent national laws and regulations, as the United Kingdom determines which European Union laws to replace or replicate.
The United Kingdom is experiencing rapid increases in inflation and the cost of living, termed by many as a “cost of living crisis” (the cost of living in the United Kingdom having risen at its fastest rate in 30 years) which could lead to further economic stress as consumers reduce their household expenditure leading to a negative impact on businesses (in particular those in the retail and service sectors). The United Kingdom is in a rising interest rate environment (in part to curb inflationary rises) and such rises in interest rates are likely to be passed on to consumers leading to an increase in their cost of debt as well as further discouraging expenditure. The United Kingdom bond and currency markets experienced turmoil following the government’s announcement of its “mini-budget” on September 23, 2022, including tax cuts and a cap on energy prices (much of which was subsequently retracted).
•Short Sale Exposure Risk — A Fund may seek inverse or “short” exposure through financial instruments, which would cause the Fund to be exposed to certain risks associated with selling short. These risks include, under certain market conditions, an increase in the volatility and decrease in the liquidity of the instruments underlying the short position, which may lower a Fund’s return, result in a loss, have the effect of limiting the Fund’s ability to obtain inverse exposure through financial instruments, or require the Fund to seek inverse exposure through alternative investment strategies that may be less desirable or more costly to implement. To the extent that, at any particular point in time, the instruments underlying the short position may be thinly traded or have a limited market, including due to regulatory action, a Fund may be unable to meet its investment objective due to a lack of available instruments or counterparties. During such periods, a Fund’s ability to issue additional shares may be adversely affected. Obtaining inverse exposure through these instruments may be considered an aggressive investment technique. Any income, dividends or payment by the assets underlying a Fund’s short positions will negatively impact the Fund.
•Tax Risk — In order to qualify for the special tax treatment accorded a regulated investment company (“RIC”) and its shareholders, a Fund must derive at least 90% of its gross income for each taxable year from “qualifying income,” meet certain asset diversification tests at the end of each taxable quarter, and meet annual distribution requirements. A Fund’s pursuit of its investment strategies will potentially be limited by the Fund’s intention to qualify for such treatment and could adversely affect the Fund’s ability to so qualify. A Fund may make certain investments, the treatment of which for these purposes is unclear. If, in any year, a Fund were to fail to qualify for the special tax treatment accorded a RIC and its shareholders, and were ineligible to or were not to cure such failure, the Fund would be taxed in the same manner as an ordinary corporation subject to U.S. federal income tax on all its income at the fund level. The resulting taxes could substantially reduce a Fund’s net assets and the amount of income available for distribution. In addition, in order to requalify for taxation as a RIC, a Fund could be required to recognize unrealized gains, pay substantial taxes and interest, and make certain distributions. Please see the section entitled “Taxation” in the Statement of Additional Information for more information.
•Valuation Risk — In certain circumstances (e.g., if ProFund Advisors believes market quotations are not reliable, or a trading halt closes an exchange or market early), ProFund Advisors may, pursuant to procedures approved by the Board of Trustees of the Fund, choose to determine a fair value price as the basis for determining the value of such investment for such day. The fair value of an investment determined by ProFund Advisors may be different from other value determinations of the same investment. Portfolio investments that are valued using techniques other than market quotations, including “fair valued” investments, may be subject to greater fluctuation in their value from one day to the next than would be the case if market quotations were used. In addition, there is no assurance that the Fund could sell a portfolio investment for the value established for it at any time, and it is possible that the Fund would incur a loss because a portfolio investment is sold at a discount to its established value.
Other Risks
In addition to the risks noted above, many other factors may also affect the value of an investment in a Fund, such as market conditions, interest rates and other economic, political or financial developments. The impact of these developments on a Fund will depend upon the types of investments in which the Fund invests, the Fund’s level of investment in particular issuers and other factors, including the financial condition, industry, economic sector and location of such issuers. The SAI contains additional information about each Fund, its investment strategies and related risks. Each Fund may be subject to other risks in addition to those identified as principal risks.
482 :: Investment Objectives, Principal Investment Strategies and Related Risks
•Cybersecurity Risk — With the increased use of technologies such as the Internet and the dependence on computer systems to perform necessary business functions, each Fund, financial intermediaries, service providers and the relevant listing exchange are susceptible to operational, information security and related “cyber” risks. In general, cyber incidents can result from deliberate attacks or unintentional events. Cyber attacks include, but are not limited to gaining unauthorized access to digital systems for purposes of misappropriating assets or sensitive information, corrupting data, or causing operational disruption. Cyber attacks may also be carried out in a manner that does not require gaining unauthorized access, such as causing among other behaviors, stealing or corrupting data maintained online or digitally, and denial of service attacks on websites. Cybersecurity failures or breaches of a Fund’s third party service provider (including, but not limited to, index providers, the administrator and transfer agent) or the issuers of securities and/or financial instruments in which the Fund invests, have the ability to cause disruptions and impact business operations, potentially resulting in financial losses, the inability of Fund shareholders to transact business, violations of applicable privacy and other laws. For instance, cyber attacks may interfere with the processing of shareholder transactions, impact the Fund’s ability to calculate its NAV, cause the release of private shareholder information or confidential Fund information, impede trading, cause reputational damage, and subject the Fund to regulatory fines, reputational damage, penalties or financial losses, reimbursement or other compensation costs, and/or additional compliance costs. In addition, substantial costs may be incurred in order to prevent any cyber incidents in the future. A Fund and its shareholders could be negatively impacted as a result. While a Fund or its service providers may have established business continuity plans and systems designed to guard against such cyber attacks or adverse effects of such attacks, there are inherent limitations in such plans and systems including the possibility that certain risks have not been identified, in large part because different unknown threats may emerge in the future. Similar types of cybersecurity risks also are present for issuers of securities in which a Fund invests, which could result in material adverse consequences for such issuers, and may cause the Fund’s investments in such securities to lose value. In addition, cyber attacks involving a counterparty to a Fund could affect such a counterparty’s ability to meets it obligations to the Fund, which may result in losses to the Fund and its shareholders. ProFund Advisors and the Trust do not control the cybersecurity plans and systems put in place by third party service providers, and such third party service providers may have no or limited indemnification obligations to ProFund Advisors or a Fund.
•Natural Disaster/Epidemic Risk — Natural or environmental disasters, such as earthquakes, fires, floods, hurricanes, tsunamis and other severe weather-related phenomena generally, and widespread disease, including
pandemics and epidemics (for example, the novel coronavirus COVID-19), have been and can be highly disruptive to economies and markets and have recently led, and may continue to lead, to increased market volatility and significant market losses. Such natural disaster and health crises could exacerbate political, social, and economic risks, and result in significant breakdowns, delays, shutdowns, social isolation, and other disruptions to important global, local and regional supply chains affected, with potential corresponding results on the operating performance of the Fund and its investments. A climate of uncertainty and panic, including the contagion of infectious viruses or diseases, may adversely affect global, regional, and local economies and reduce the availability of potential investment opportunities, and increases the difficulty of performing due diligence and modeling market conditions, potentially reducing the accuracy of financial projections. Under these circumstances, the Fund may have difficulty achieving its investment objectives which may adversely impact Fund performance. Further, such events can be highly disruptive to economies and markets, significantly disrupt the operations of individual companies (including, but not limited to, the Fund’s investment advisor, third party service providers, and counterparties), sectors, industries, markets, securities and commodity exchanges, currencies, interest and inflation rates, credit ratings, investor sentiment, and other factors affecting the value of the Fund’s investments. These factors can cause substantial market volatility, exchange trading suspensions and closures, changes in the availability of and the margin requirements for certain instruments, and can impact the ability of the Fund to complete redemptions and otherwise affect Fund performance and Fund trading in the secondary market. A widespread crisis would also affect the global economy in ways that cannot necessarily be foreseen. How long such events will last and whether they will continue or recur cannot be predicted. Impacts from these events could have a significant impact on the Fund’s performance, resulting in losses to your investment.
•Risk that Current Assumptions and Expectations Could Become Outdated as a Result of Global Economic Shock — The onset of the novel coronavirus (COVID-19) has caused significant shocks to global financial markets and economies, with many governments taking extreme actions to slow and contain the spread of COVID-19 (including any variants). These actions have had, and likely will continue to have, a severe economic impact on global economies as economic activity in some instances has essentially ceased. The global economic shocks being experienced as of the date hereof may cause the underlying assumptions and expectations of a Fund to quickly become outdated or inaccurate, resulting in significant losses.
Additionally, other public health issues, war, military conflicts, sanctions, acts of terrorism, sustained elevated inflation, supply chain issues or other events could have a significant
Investment Objectives, Principal Investment Strategies and Related Risks :: 483
negative impact on global financial markets and economies. Russia’s recent military incursions in Ukraine have led to, and may lead to additional sanctions being levied by the United States, European Union and other countries against Russia. Russia’s military incursion and the resulting sanctions could adversely affect global energy and financial markets and thus could affect the value of a Fund’s investments, even beyond any direct exposure a Fund may have to the region or to adjoining geographic regions. The extent and duration of the military action, sanctions and resulting market disruptions are impossible to predict, but could have a severe adverse effect on the region, including significant negative impacts on the economy and the markets for certain securities and commodities, such as oil and natural gas. How long such tensions and related events will last cannot be predicted. These tensions and any related events could have significant impact on a Fund performance and the value of an investment in a Fund.
•Operational Risk — A Fund, its service providers and financial intermediaries are subject to operational risks arising from, among other things, human error, systems and technology errors and disruptions, failed or inadequate controls, and fraud. These errors may adversely affect a Fund’s operations, including its ability to execute its investment process, calculate or disseminate its NAV or intraday indicative value in a timely manner, and process creations or redemptions. While a Fund seeks to minimize such events through controls and oversight, there may still be failures and a Fund may be unable to recover any damages associated with such failures. These failures may have a material adverse effect on a Fund’s returns. Each Fund relies on order information provided by financial intermediaries to determine the net inflows and outflows. As a result, each Fund is subject to operational risks associated with reliance on those financial intermediaries and their data sources. In particular, errors in the order information may result in the purchase or sale of the instruments in which a Fund invests in a manner that may be disadvantageous to a Fund.
•Securities Lending Risk — A Fund may engage in securities lending. Securities lending involves the risk, as with other extensions of credit, that the Fund may lose money because (a) the borrower of the loaned securities fails to return the securities in a timely manner or at all or (b) it loses its rights in the collateral should the borrower fail financially. A Fund could also lose money in the event of a decline in the value of collateral provided for loaned securities or a decline in the value of any investments made with cash collateral. These events could also trigger adverse tax consequences for the Fund. In determining whether to lend securities, ProFund Advisors or the Fund’s securities lending agent will consider relevant facts and circumstances, including the creditworthiness of the borrower.
Additional Securities, Instruments and Strategies
This section describes additional securities, instruments and strategies that may be utilized by a Fund that are not principal investment strategies of a Fund unless otherwise noted in the Fund’s description of principal strategies in the Fund’s Summary Prospectus. Additional Information about the types of investments that a Fund may make is set forth in the SAI.
In certain circumstances, a Fund may gain exposure to only a representative sample of the securities in the index, which exposure is intended to have aggregate characteristics similar to the index. In addition, a Fund may overweight or underweight certain components contained in its underlying index, or invest in investments not contained in the index but that are designed to provide the requisite exposure to the index.
•Debt Securities are fixed income securities, which may include foreign sovereign, sub-sovereign and supranational bonds, as well as any other obligations of any rating or maturity such as foreign and domestic investment grade corporate debt securities and lower-rated corporate debt securities.
○Corporate Debt Securities are debt instruments issued by a corporation that represent the obligation of the corporation to repay a loan face amount with interest within a set period of time. These securities may be of any credit quality and may include junk bonds and securities that are not rated by any rating agency.
•Depositary Receipts include American Depositary Receipts (ADRs) and Global Depositary Receipts (GDRs).
○ADRs represent the right to receive securities of foreign issuers deposited in a bank or trust company. ADRs are an alternative to purchasing the underlying securities in their national markets and currencies. Investment in ADRs has certain advantages over direct investment in the underlying foreign securities because: (i) ADRs are U.S. dollar-denominated investments that are easily transferable and for which market quotations are readily available; and (ii) issuers whose securities are represented by ADRs are generally subject to auditing, accounting and financial reporting standards similar to those applied to domestic issuers.
○GDRs are receipts for shares in a foreign-based corporation traded in capital markets around the world. While ADRs permit foreign corporations to offer shares to American citizens, GDRs allow companies in Europe, Asia, the United States and Latin America to offer shares in many markets around the world.
•Credit Default Swaps (CDS) Risk — While the Access Flex Bear High Yield ProFund will normally be a net “buyer” of
484 :: Investment Objectives, Principal Investment Strategies and Related Risks
CDS and while the Access Flex High Yield ProFund will normally be a net “seller” of CDS, at times the Access Flex Bear High Yield ProFund may be a net “seller” and the Access Flex High Yield ProFund may be a net “buyer” of CDS. When a Fund is a seller of credit protection, upon the occurrence of a credit event, the Fund will have an obligation to pay the full notional value of a defaulted reference entity less recovery value. When a Fund is a buyer of credit protection, upon the occurrence of a credit event, the counterparty to the Fund will have an obligation to pay the full notional value of a defaulted reference entity less recovery value. Recovery values for CDS are generally determined via an auction process to determine the final price for a given reference entity. Although the Funds intend, as practicable, to obtain exposure through centrally cleared CDS, an active market may not exist for any of the CDS in which a Fund invests or in the reference entities subject to the CDS. As a result, a Fund’s ability to maximize returns or minimize losses on such CDS may be impaired. Other risks of CDS include difficulty in valuation due to the lack of pricing transparency and the risk that changes in the value of the CDS do not reflect changes in the credit quality of the underlying reference entities or may otherwise perform differently than expected given market conditions. Because a Fund may use a single counterparty or a small number of counterparties to achieve the requisite exposure to underlying reference entities and there are no limitations on the notional amount established for the CDS, a CDS may involve many reference entities. In such cases, counterparty risk may be amplified.
•Other Investment Companies — A Fund may invest in the securities of other investment companies, including exchange-traded funds (ETFs), to the extent that such an investment would be consistent with the requirements of the 1940 Act. If a Fund invests in, and, thus, is a shareholder of, another investment company, the Fund’s shareholders will indirectly bear the Fund’s proportionate share of the fees and expenses paid by such other investment company, including advisory fees, in addition to both the management fees payable directly by the Fund to the Fund’s own investment advisor and the other expenses that the Fund bears directly in connection with the Fund’s own operations.
Because most ETFs are investment companies, absent reliance on Rule 12d1-4 under the 1940 Act, a Fund’s investments in such investment companies generally would be limited under applicable federal statutory provisions. Those provisions typically restrict a Fund’s investment in the shares of another investment company to up to 5% of its assets (which may represent no more than 3% of the securities of such other investment company) and limit aggregate investments in all investment companies to 10% of assets. A Fund may invest in certain ETFs in excess of the statutory limit in reliance on Rule 12d1-4. Rule 12d1-4 outlines the requirements of Fund of Funds Agreements and specifies the responsibilities of the Board related to “fund of fund“ arrangements.
•Money Market Instruments are short-term debt instruments that have a remaining maturity of 397 days or less and exhibit high quality credit profiles. Money market instruments may include U.S. government securities, securities issued by governments of other developed countries and repurchase agreements.
○Repurchase Agreements are contracts in which a seller of securities, usually U.S. government securities or other money market instruments, agrees to buy the securities back at a specified time and price. Repurchase agreements are primarily used as short-term investments for cash positions.
○U.S. Government Securities are issued by the U.S. government or one of its agencies or instrumentalities. Some, but not all, U.S. government securities are backed by the full faith and credit of the federal government. Other U.S. government securities are backed by the issuer’s right to borrow from the U.S. Treasury and some are backed only by the credit of the issuing organization.
•Options on Securities and Stock Indexes and Investments Covering such Positions Option contracts grant one party a right, for a price, either to buy or sell a security or futures contract at a fixed price during a specified period or on a specified day. A call option gives one the right to buy a security at an agreed-upon price on or before a certain date. A put option gives one the right to sell a security at an agreed-upon price on or before a certain date.
•Reverse Repurchase Agreements involve the sale of a security by a Fund to another party (generally a bank or dealer) in return for cash and an agreement by the Fund to buy the securities back at a specified price and time. Reverse repurchase agreements may be considered a form of borrowing for some purposes and may create leverage.
•Securities Lending — A Fund may lend securities to brokers, dealers and financial organizations under guidelines adopted by the Board. A Fund may loan up to one-third of the value of the Fund’s total assets (including the value of any collateral received). Each loan may be secured by collateral in the form of cash, Money Market Instruments or U.S. Government securities.
•Short Sales Rising Rates Opportunity ProFund and Rising Rates Opportunity 10 ProFund also may engage in short sale transactions with respect to equity securities (including shares of exchange-traded funds) to the extent permitted by the 1940 Act. A short sale is a transaction in which a Fund sells a security it does not own in anticipation that the market price of that security will decline. To complete such a transaction, a Fund must borrow the security to make delivery to the buyer. The Fund is then obligated to replace the security borrowed by borrowing the same security from another lender, purchasing it at the market price at the time of replacement or
Investment Objectives, Principal Investment Strategies and Related Risks :: 485
paying the lender an amount equal to the cost of purchasing the security. The price at such time may be more or less than the price at which the security was sold by the Fund. Until the security is replaced, the Fund is required to repay the lender any dividends it receives or interest which accrues on the security during the period of the loan. To borrow the security, the Fund also may be required to pay a premium, which would increase the cost of the security sold. The net proceeds of the short sale will be retained by the broker, to the extent necessary to meet the margin requirements, until the short position is closed out. The Fund also will incur transaction costs in effecting short sales.
The Non-Equity ProFunds also may make short sales “against the box,” i.e., when a security identical to or convertible or exchangeable into one owned by a Fund is borrowed and sold short. Whenever a Fund engages in short sales, it earmarks or segregates cash or liquid securities in an amount that, when combined with the amount of collateral deposited with the broker in connection with the short sale, equals the current market value of the security sold short. The earmarked or segregated assets are marked to market daily.
•Structured Notes are debt obligations which may include components such as swaps, forwards, options, caps or floors which change their return patterns. Structured notes may be used to alter the risks to a portfolio, or alternatively may be used to expose a portfolio to asset classes or markets in which one does not desire to invest directly.
Precautionary Notes
A Precautionary Note to Investment Companies — For purposes of the Investment Company Act of 1940 (the “1940 Act”), each Fund is a registered investment company, and the acquisition of a Fund’s shares by other investment companies is subject to the restrictions of Section 12(d)(1) thereof. Any investment company considering purchasing shares of a Fund in amounts that would cause it to exceed the restrictions of Section 12(d)(1) should contact the Trust. Rule 12d1-4 under the 1940 Act permits investments in acquired funds in excess of the limits of Section 12(d)(1) subject to certain conditions. Among these conditions, prior to a fund acquiring securities of another fund exceeding the limits of Section 12(d)(1), the acquiring fund must enter into a “Fund of Funds Investment Agreement” with the acquired fund setting forth the material terms of the arrangement.
A Precautionary Note Regarding Regulatory Initiatives — There is a possibility of future regulatory changes altering, perhaps to a material extent, the nature of an investment in a Fund or the ability of a Fund to continue to implement its investment strategies.
The futures markets are subject to comprehensive statutes, regulations, and margin requirements. In addition, the CFTC and the exchanges are authorized to take extraordinary actions in the event of a market emergency, including, for example, the implementation of higher margin requirements, the
establishment of daily price limits and the suspension of trading. The regulation of derivative transactions (including swaps and futures transactions) is a rapidly changing area of law and is subject to modification by government and judicial action. The effect of any future regulatory change on a Fund is impossible to predict, but could be substantial and adverse.
In particular, the Dodd-Frank Wall Street Reform and Consumer Protection Act (the “Dodd-Frank Act”) was signed into law on July 21, 2010. The Dodd-Frank Act has changed and will continue to change the way in which the U.S. financial system is supervised and regulated. Title VII of the Dodd-Frank Act sets forth a legislative framework for OTC derivatives, including financial instruments, such as swaps, in which a Fund may invest. Title VII of the Dodd-Frank Act made broad changes to the OTC derivatives market and granted significant authority to the SEC and CFTC to regulate OTC derivatives and market participants. The European Union, the United Kingdom, and some other countries have implemented and continue to implement similar requirements that will affect a Fund when it enters into derivatives transactions with a counterparty organized in those jurisdictions or otherwise subject to applicable derivatives regulations.
Under rules adopted under the Dodd-Frank Act, transactions in some types of swaps (including interest rate swaps and credit default swaps on North American and European indices) are required to be centrally cleared. Some types of cleared derivatives are required to be executed on an exchange or on a swap execution facility. A swap execution facility is a trading platform where multiple market participants can execute derivatives by accepting bids and offers made by multiple other participants in the platform. While this execution requirement is designed to increase transparency and liquidity in the cleared derivatives market, trading on a swap execution facility can create additional costs and risks for a Fund. The CFTC, SEC and other federal regulators may adopt additional regulations enacting the provisions of the Dodd-Frank Act.
The U.S. government, the United Kingdom, and the European Union have adopted mandatory minimum margin requirements for bilateral derivatives. Variation margin requirements are already effective and new initial margin requirements will become effective on a phased in compliance schedule that began in 2020. Such requirements could increase the amount of margin a Fund needs to provide in connection with its derivatives transactions and, therefore, make derivatives transactions more expensive.
In addition, the SEC has adopted new Rule 18f-4 under the 1940 Act providing for the regulation of registered investment companies’ use of derivatives and certain related instruments. The new rule, among other things, limits derivatives exposure through one of two value-at-risk tests and eliminates the asset segregation framework for covering derivatives and certain financial instruments arising from the SEC’s Release 10666 and ensuing staff guidance. Limited derivatives users (as determined
486 :: Investment Objectives, Principal Investment Strategies and Related Risks
by Rule 18f-4) are not, however, subject to the full requirements under the rule.
Regulations can, among other things, adversely affect the value of the investments held by a Fund, restrict a Fund’s ability to engage in derivatives transactions (for example, by making certain derivatives transactions no longer available to that Fund) and/or increase the costs of such derivatives transactions (for example, by increasing margin or capital requirements), which could adversely affect investors. It is also unclear how regulatory changes will affect counterparty risk. In particular, new position limits imposed on a Fund or its counterparties may impact that Fund’s ability to invest in a manner that efficiently meets its investment objective, and new requirements, including capital and mandatory clearing for certain swaps, may increase the cost of a Fund’s investments and cost of doing business, which could adversely affect investors. Because these requirements are new and evolving (and some of the rules are not yet final), their ultimate impact remains unclear.
A Note Regarding the Diversification of Certain of the Classic ProFunds – Certain of the Classic ProFunds (Europe 30 ProFund, Large-Cap Growth ProFund, Large-Cap Value ProFund, Mid-Cap Growth ProFund, Mid-Cap Value ProFund, Small-Cap Growth ProFund and Small-Cap Value ProFund, each an “Affected Fund” and together the “Affected Funds”) are currently “diversified” as that term is defined in the 1940 Act and have been operating as diversified investment companies for more than three years.
Although the Affected Funds had previously designated themselves as “non-diversified” companies, the staff of the Securities and Exchange Commission takes the position that any fund that registers itself as a non-diversified company but that operates as a diversified company for more than three years must obtain shareholder approval before it can once again operate as a non-diversified company. As a diversified fund, at least 75% of the value of each Affected Fund’s total assets must be represented by cash and cash items (including receivables), U.S. Government securities, securities of other investment companies, and other securities for the purposes of this calculation limited in respect of any one issuer (i) to an amount not greater in value than 5% of the value of the total assets of such Affected Fund and (ii) to not more than 10% of the outstanding voting securities of such issuer.
Additional Information About the Indexes, the Index Providers and the Index Calculation Agent
A Fund operates pursuant to licensing agreements for the use of the relevant index. A brief description of a Fund’s index is included in each Summary Prospectus, as supplemented below:
Information About the Index Licensors
“Dow Jones,” “Dow 30,” “Dow Jones Industrial Average,” “DJIA” and the name of each Dow Jones sector index are trademarks of Dow Jones & Company, Inc. and have been licensed for use for certain purposes by ProFunds. “ICE Futures U.S.®” and
“IntercontinentalExchange®” are registered trademarks of the IntercontinentalExchange, Inc. The “ICE® U.S. Dollar Index®” and “USDX®” are registered trademarks of ICE Futures U.S., Inc. and have been licensed for use by ProFunds. “MSCI® EAFE®” is a trademark of Morgan Stanley Capital International, Inc. “Nasdaq-100® Index” is a trademark of The Nasdaq Stock Market, Inc. (“Nasdaq”). The “Nikkei 225 Stock Index” is a trademark of Nihon Keizai Shimbun, Inc. “Russell 2000®” and “Russell 3000®” are a trademark of the Frank Russell Company. “Standard & Poor’s®,” “S&P®,” “S&P 500®,” “Standard & Poor’s 500,” “S&P MidCap 400®,” “Standard & Poor’s MidCap 400,” “S&P SmallCap 600®,” “Standard & Poor’s SmallCap 600,” “S&P MidCap 400® Growth Index,” “S&P MidCap 400® Value Index,” “S&P SmallCap 600® Growth Index”, S&P Emerging Markets 50 ADR Index (USD), S&P China Select ADR Index (USD), S&P Latin America 35 ADR Index (USD), and “S&P Small-Cap 600® Value Index” are trademarks of The McGraw-Hill Companies, Inc. and have been licensed for use by ProFunds.
The ProFunds are not sponsored, endorsed, sold or promoted by these organizations and the organizations make no representations regarding the advisability of investing in ProFunds.
ICE Futures U.S., Inc.
NEITHER THE INDICATION THAT SECURITIES OR OTHER FINANCIAL PRODUCTS OFFERED HEREIN ARE BASED ON DATA PROVIDED BY ICE FUTURES U.S., INC. NOR THE PUBLICATION OF THE USDX NOR THE LICENSING OF DATA OR THE USDX TRADEMARKS BY ICE FUTURES U.S., INC. OR ITS AFFILIATES FOR USE IN CONNECTION WITH SECURITIES OR OTHER FINANCIAL PRODUCTS DERIVED FROM SUCH DATA OR INDEX IN ANY WAY SUGGESTS OR IMPLIES A REPRESENTATION OR OPINION BY ICE FUTURES U.S., INC. OR ANY SUCH AFFILIATES AS TO THE ATTRACTIVENESS OR INVESTMENT IN ANY SECURITIES OR OTHER FINANCIAL PRODUCTS BASED UPON OR DERIVED FROM SUCH DATA OR INDEX. ICE FUTURES U.S., INC. IS NOT THE ISSUER OF ANY SUCH SECURITIES OR OTHER FINANCIAL PRODUCTS AND MAKES NO EXPRESS OR IMPLIED WARRANTIES OF MERCHANTABILITY OR FITNESS FOR ANY PARTICULAR PURPOSE WITH RESPECT TO SUCH INDEX OR ANY DATA INCLUDED OR REFLECTED THEREIN, NOR AS TO RESULTS TO BE OBTAINED BY ANY PERSON OR ANY ENTITY FROM THE USE OF THE INDEX OR ANY DATA INCLUDED OR REFLECTED THEREIN.
Nasdaq
The Nasdaq-100 ProFund, the UltraNasdaq-100 ProFund, the Short Nasdaq-100 ProFund and the UltraShort Nasdaq-100 ProFund (the “Nasdaq Funds)”) each is not sponsored, endorsed, sold or promoted by The Nasdaq OMX Group, Inc. or its affiliates (Nasdaq OMX, with its affiliates, are referred to as the “Corporations”). The Corporations have not passed on the legality or suitability of, or the accuracy or adequacy of descriptions and disclosures relating to, the Nasdaq Funds. The
Investment Objectives, Principal Investment Strategies and Related Risks :: 487
Corporations make no representation or warranty, express or implied to the owners of the Nasdaq Funds or any member of the public regarding the advisability of investing in securities generally or in the Nasdaq Funds particularly, or the ability of the Nasdaq-100 Index® to track general stock market performance. The Corporations’ only relationship to E Fund Management Co. (“Licensee”) is in the licensing of the Nasdaq®, OMX®, NasdaqOMX®, Nasdaq-100®, and Nasdaq-100 Index® registered trademarks and certain trade names of the Corporations and the use of the Nasdaq-100 Index® which is determined, composed and calculated by Nasdaq OMX without regard to Licensee or the Nasdaq Funds. Nasdaq OMX has no obligation to take the needs of the Licensee or the owners of the Nasdaq Funds into consideration in determining, composing or calculating the Nasdaq-100 Index®. The Corporations are not responsible for and have not participated in the determination of the timing of, prices at, or quantities of the Nasdaq Funds to be issued or in the determination or calculation of the equation by which the Nasdaq Funds is to be converted into cash. The Corporations have no liability in connection with the administration, marketing or trading of the Nasdaq Funds.
THE CORPORATIONS DO NOT GUARANTEE THE ACCURACY AND/OR UNINTERRUPTED CALCULATION OF THE NASDAQ-100 INDEX® OR ANY DATA INCLUDED THEREIN. THE CORPORATIONS MAKE NO WARRANTY, EXPRESS OR IMPLIED, AS TO RESULTS TO BE OBTAINED BY LICENSEE, OWNERS OF THE NASDAQ FUNDS, OR ANY OTHER PERSON OR ENTITY FROM THE USE OF THE NASDAQ-100 INDEX® OR ANY DATA INCLUDED THEREIN. THE CORPORATIONS MAKE NO EXPRESS OR IMPLIED WARRANTIES, AND EXPRESSLY DISCLAIM ALL WARRANTIES OF MERCHANTABILITY OR FITNESS FOR A PARTICULAR PURPOSE OR USE WITH RESPECT TO THE NASDAQ-100 INDEX® OR ANY DATA INCLUDED THEREIN. WITHOUT LIMITING ANY OF THE FOREGOING, IN NO EVENT SHALL THE CORPORATIONS HAVE ANY LIABILITY FOR ANY LOST PROFITS OR SPECIAL, INCIDENTAL, PUNITIVE, INDIRECT, OR CONSEQUENTIAL DAMAGES, EVEN IF NOTIFIED OF THE POSSIBILITY OF SUCH DAMAGES.
S&P Dow Jones Indices
The Dow Jones Industrial AverageSM, the Dow Jones Internet Composite Index, the Dow Jones Precious MetalsSM Index, the Dow Jones U.S. BanksSM Index, the Dow Jones U.S. Basic MaterialsSM Index, the Dow Jones U.S. BiotechnologySM Index, the Dow Jones U.S. Consumer GoodsSM Index, the Dow Jones U.S. Consumer ServicesSM Index, the Dow Jones U.S. FinancialsSM Index, the Dow Jones U.S. Health CareSM Index, the Dow Jones U.S. IndustrialsSM Index, the Dow Jones U.S. Oil & GasSM Index, the Dow Jones U.S. Real EstateSM Index, the Dow Jones U.S. Select Oil Equipment & ServicesSM Index, the Dow Jones U.S. Select PharmaceuticalsSM Index, the Dow Jones U.S. Select TelecommunicationsSM Index, the Dow Jones U.S. SemiconductorSM Index, the Dow Jones U.S. TechnologySM
Index, the Dow Jones U.S. UtilitiesSM Index, the S&P 500® Growth Index, the S&P 500® Index, the S&P 500® Value Index, the S&P China Select ADR Index (USD), the S&P Communication Services Select Sector Index, the S&P Emerging 50 ADR Index (USD), the S&P Latin America 35 ADR Index (USD), the S&P MidCap 400® Growth Index, the S&P MidCap 400® Index, the S&P MidCap 400® Value Index, the S&P SmallCap 600® Growth Index, and the S&P SmallCap 600® Value Index (collectively, ”Indexes“) are products of S&P Dow Jones Indices LLC or its affiliates (”SPDJI“) and have been licensed for use by ProFunds. S&P® and S&P 500® are a registered trademarks of S&P Global, Inc. or its affiliates (”S&P“); Dow Jones® is a registered trademark of Dow Jones Trademark Holdings LLC (”Dow Jones“); and these trademarks have been sublicensed for certain purposes by ProFunds. The Funds are not sponsored, endorsed, sold or promoted by SPDJI, Dow Jones, S&P, or their respective affiliates and none of such parties make any representation regarding the advisability of investing in such products nor do they have any liability for any errors, omissions, or interruptions of the Indexes. It is not possible to invest directly in an index. The Funds are not sponsored, endorsed, sold or promoted by SPDJI, Dow Jones, S&P, or their respective affiliates (collectively, ”S&P Dow Jones Indices“). S&P Dow Jones Indices makes no representation or warranty, express or implied, to the owners of the Funds or any member of the public regarding the advisability of investing in securities generally or in the Funds particularly or the ability of the Indexes to track general market performance. Past performance of an index is not an indication or guarantee of future results. S&P Dow Jones Indices’ only relationship to ProFunds with respect to the Indexes is the licensing of the Indexes and certain trademarks, service marks and/or trade names of S&P Dow Jones Indices and/or its licensors. The Indexes are determined, composed and calculated by S&P Dow Jones Indices without regard to ProFunds or the Funds. S&P Dow Jones Indices has no obligation to take the needs of ProFunds or the owners of the Funds into consideration in determining, composing or calculating the Indexes. S&P Dow Jones Indices is not responsible for and has not participated in the determination of the prices, and amount of the Funds or the timing of the issuance or sale of the Funds or in the determination or calculation of the equation by which the Funds are to be converted into cash, surrendered or redeemed, as the case may be. S&P Dow Jones Indices has no obligation or liability in connection with the administration, marketing or trading of the Funds. There is no assurance that investment products based on the Indexes will accurately track index performance or provide positive investment returns. S&P Dow Jones Indices LLC is not an investment adviser, commodity trading advisory, commodity pool operator, broker dealer, fiduciary, ”promoter“ (as defined in the Investment Company Act of 1940, as amended), ”expert“ as enumerated within 15 U.S.C. § 77k(a) or tax advisor. Inclusion of a security, commodity, crypto currency or other asset within an index is not a recommendation by S&P Dow
488 :: Investment Objectives, Principal Investment Strategies and Related Risks
Jones Indices to buy, sell, or hold such security, commodity, crypto currency or other asset, nor is it considered to be investment advice or commodity trading advice.
NEITHER S&P DOW JONES INDICES NOR ITS THIRD-PARTY LICENSOR GUARANTEES THE ADEQUACY, ACCURACY, TIMELINESS AND/OR THE COMPLETENESS OF THE INDEXES OR ANY DATA RELATED THERETO OR ANY COMMUNICATION, INCLUDING BUT NOT LIMITED TO, ORAL OR WRITTEN COMMUNICATION (INCLUDING ELECTRONIC COMMUNICATIONS) WITH RESPECT THERETO. S&P DOW JONES INDICES SHALL NOT BE SUBJECT TO ANY DAMAGES OR LIABILITY FOR ANY ERRORS, OMISSIONS, OR DELAYS THEREIN. S&P DOW JONES INDICES MAKES NO EXPRESS OR IMPLIED WARRANTIES, AND EXPRESSLY DISCLAIMS ALL WARRANTIES, OF MERCHANTABILITY OR FITNESS FOR A PARTICULAR PURPOSE OR USE OR AS TO RESULTS TO BE OBTAINED BY PROFUNDS, OWNERS OF THE FUNDS, OR ANY OTHER PERSON OR ENTITY FROM THE USE OF THE INDEXES OR WITH RESPECT TO ANY DATA RELATED THERETO. WITHOUT LIMITING ANY OF THE FOREGOING, IN NO EVENT WHATSOEVER SHALL S&P DOW JONES INDICES BE LIABLE FOR ANY INDIRECT, SPECIAL, INCIDENTAL, PUNITIVE, OR
CONSEQUENTIAL DAMAGES INCLUDING BUT NOT LIMITED TO, LOSS OF PROFITS, TRADING LOSSES, LOST TIME OR GOODWILL, EVEN IF THEY HAVE BEEN ADVISED OF THE POSSIBILITY OF SUCH DAMAGES, WHETHER IN CONTRACT, TORT, STRICT LIABILITY, OR OTHERWISE. S&P DOW JONES INDICES HAS NOT REVIEWED, PREPARED AND/OR CERTIFIED ANY PORTION OF, NOR DOES S&P DOW JONES INDICES HAVE ANY CONTROL OVER, THE FUNDS’ REGISTRATION STATEMENT, PROSPECTUS OR OTHER OFFERING MATERIALS. THERE ARE NO THIRD-PARTY BENEFICIARIES OF ANY AGREEMENTS OR ARRANGEMENTS BETWEEN S&P DOW JONES INDICES AND PROFUNDS, OTHER THAN THE LICENSORS OF S&P DOW JONES INDICES.
Please see the SAI, which sets forth certain additional disclaimers and limitations of liabilities.
Portfolio Holdings Information
A description of the Trust’s policies and procedures with respect to the disclosure of each Fund’s portfolio holdings is available in the SAI. Each Fund’s portfolio holdings are posted on a quarterly basis to the Fund’s website (www.profunds.com).
490 :: Fund Management
Board of Trustees and Officers
The Board is responsible for the general supervision of each Fund. The officers of the Trust are responsible for the day-to-day operations of each Fund.
Investment Advisor
ProFund Advisors, located at 7272 Wisconsin Avenue, 21st Floor, Bethesda, Maryland 20814, serves as the investment adviser to each Fund and provides investment advice and management services to each Fund. ProFund Advisors oversees the investment and reinvestment of the assets in each Fund. For its investment advisory services, ProFund Advisors is entitled to receive annual fees equal to 0.75% of the average daily net assets of each fund, except Nasdaq-100 ProFund, UltraJapan ProFund and UltraShort Japan ProFund and U.S. Government Plus ProFund, for which it is entitled to receive annual fees equal to 0.70%, 0.90%, 0.90% and 0.50% respectively, of the average daily net assets of each such ProFund. ProFund Advisors bears the costs of providing advisory services. A discussion regarding the basis for the Board approving the investment advisory agreement for each Fund is in the Trust’s most recent semi-annual report to shareholders dated January 31, 2022, or in the Trust’s most recent annual report to shareholders dated July 31, 2022 or in the Trust’s semi-annual or annual report to shareholders that covers the period during which the approval occurred. Subject to the condition that the aggregate daily net assets of the Trust be equal to or greater than $10 billion, ProFund Advisors has agreed to reduce each Fund’s annual investment advisory fee by 0.025% on assets in excess of $500 million up to $1 billion, 0.05% on assets in excess of $1 billion up to $2 billion and 0.075% on assets in excess of $2 billion. During the year ended July 31, 2022, no Fund’s annual investment advisory fee was subject to such reductions. During the year ended July 31, 2022, each Fund paid ProFund Advisors fees in the following amounts (fees paid reflect the effects of any expense limitation arrangements in place for the period):
|
Access Flex Bear High Yield ProFund |
0.00% |
|
Access Flex High Yield ProFund |
0.77% |
|
Banks UltraSector ProFund |
0.75% |
|
Basic Materials UltraSector ProFund |
0.78% |
|
Bear ProFund |
0.75% |
|
Biotechnology UltraSector ProFund |
0.75% |
|
Bull ProFund |
0.75% |
|
Communication Services UltraSector ProFund |
0.68% |
|
Consumer Goods UltraSector ProFund |
0.67% |
|
Consumer Services UltraSector ProFund |
0.75% |
|
Europe 30 ProFund |
0.30% |
|
Falling U.S. Dollar ProFund |
0.00% |
|
Financials UltraSector ProFund |
0.74% |
|
Health Care UltraSector ProFund |
0.75% |
|
Industrials UltraSector ProFund |
0.74% |
|
Internet UltraSector ProFund |
0.75% |
|
Large-Cap Growth ProFund |
0.75% |
|
Large-Cap Value ProFund |
0.75% |
|
Mid-Cap Growth ProFund |
0.49% |
|
Mid-Cap ProFund |
0.64% |
|
Mid-Cap Value ProFund |
0.69% |
|
Nasdaq-100 ProFund |
0.70% |
|
Oil & Gas UltraSector ProFund |
0.75% |
|
Oil Equipment & Services UltraSector ProFund |
0.75% |
|
Pharmaceuticals UltraSector ProFund |
0.46% |
|
Precious Metals UltraSector ProFund |
0.75% |
|
Real Estate UltraSector ProFund |
0.75% |
|
Rising Rates Opportunity ProFund |
0.75% |
|
Rising Rates Opportunity 10 ProFund |
0.05% |
|
Rising U.S. Dollar ProFund |
0.84% |
|
Semiconductor UltraSector ProFund |
0.75% |
|
Short Nasdaq-100 ProFund |
0.83% |
|
Short Oil & Gas ProFund |
0.00% |
|
Short Precious Metals ProFund |
0.00% |
|
Short Real Estate ProFund |
0.00% |
|
Short Small-Cap ProFund |
0.35% |
|
Small-Cap Growth ProFund |
0.73% |
|
Small-Cap ProFund |
0.41% |
|
Small-Cap Value ProFund |
0.75% |
|
Technology UltraSector ProFund |
0.75% |
|
Telecommunications UltraSector ProFund |
0.00% |
|
UltraBear ProFund |
0.59% |
|
UltraBull ProFund |
0.75% |
|
UltraChina ProFund |
0.75% |
|
UltraDow 30 ProFund |
0.75% |
|
UltraEmerging Markets ProFund |
0.69% |
|
UltraInternational ProFund |
0.00% |
|
UltraJapan ProFund |
0.93% |
|
UltraLatin America ProFund |
0.75% |
|
UltraMid-Cap ProFund |
0.75% |
|
UltraNasdaq-100 ProFund |
0.75% |
|
UltraShort China ProFund |
0.10% |
|
UltraShort Dow 30 ProFund |
0.03% |
|
UltraShort Emerging Markets ProFund |
0.00% |
|
UltraShort International ProFund |
0.07% |
|
UltraShort Japan ProFund |
0.00% |
|
UltraShort Latin America ProFund |
0.00% |
|
UltraShort Mid-Cap ProFund |
0.00% |
|
UltraShort Nasdaq-100 ProFund |
0.75% |
|
UltraShort Small-Cap ProFund |
0.30% |
|
UltraSmall-Cap ProFund |
0.75% |
|
U.S. Government Plus ProFund |
0.50% |
|
Utilities UltraSector ProFund |
0.78% |
Amounts shown that exceed the contractual fee rate reflect recoupment of a fee waiver as permitted by the expense limitation agreement.
Portfolio Management
The following individuals have responsibility for the day-to-day management of each Fund as set forth in the Summary Prospectus relating to each Fund. The Portfolio Managers’ business experience for the past five years is listed below. Additional information about the Portfolio Managers’ compensation, other accounts managed by the Portfolio Managers and their ownership of other investment companies can be found in the SAI.
Alexander Ilyasov, ProShare Advisors: Senior Portfolio Manager since October 2013 and Portfolio Manager from November 2009 through September 2013. ProFund Advisors LLC: Senior
Fund Management :: 491
Portfolio Manager since October 2013 and Portfolio Manager from November 2009 through September 2013. ProShare Capital Management LLC: Senior Portfolio Manager since August 2016.
Michael Neches, ProShare Advisors: Senior Portfolio Manager since November 2010. ProFunds Advisors LLC: Senior Portfolio Manager since October. ProShare Capital Management LLC: Senior Portfolio Manager from June 2012 through September 2013.
Scott Hanson, ProShare Advisors: Portfolio Manager since August 2016, Associate Portfolio Manager from May 2012 to August 2016 and Senior Portfolio Analyst from August 2010 to May 2012. ProFund Advisors LLC: Portfolio Manager since August 2016, Associate Portfolio Manager from May 2012 to August 2016 and Senior Portfolio Analyst from August 2010 to May 2012.
James Linneman, ProShare Advisors: Portfolio Manager since April 2019, Associate Portfolio Manager from August 2016 to April 2019 and Portfolio Analyst from February 2014 to August 2016. ProFund Advisors: Portfolio Manager since July 2021. Mr. Linneman is a registered associated person and an NFA associate member since 2015.
Devin Sullivan, ProShare Advisors: Portfolio Manager since September 2016 and Associate Portfolio Manager from December 2011 to August 2016. ProFund Advisors: Portfolio Manager since September 2016 and Associate Portfolio Manager from December 2011 to August 2016.
Tarak Davé, ProShare Advisors: Portfolio Manager since April 2018, Associate Portfolio Manager from November 2015 to April 2018, Senior Portfolio Analyst from May 2014 to October 2015 and Portfolio Analyst from April 2011 to April 2014. ProFund Advisors: Portfolio Manager since April 2018, Associate Portfolio Manager from November 2015 to April 2018, Senior Portfolio Analyst from May 2014 to October 2015 and Portfolio Analyst from April 2011 to April 2014.
Other Service Providers
ProFunds Distributors, Inc. (the “Distributor”), located at 7272 Wisconsin Avenue, 21st Floor, Bethesda, Maryland 20814, acts as the distributor of Fund shares and is a wholly-owned subsidiary of ProFund Advisors. Citi Fund Services Ohio, Inc. (“Citi”), located at 4400 Easton Commons, Suite 200, Columbus, Ohio 43219, acts as the administrator to each Fund, providing operations, compliance and administrative services. FIS Investor Services LLC (“FIS”), located at 4249 Easton Way, Suite 400, Columbus, OH 43219, acts as transfer agent for each Fund, maintaining shareholder account records for each Fund, distributing distributions payable by each Fund, and producing statements with respect to account activity for each Fund and their shareholders.
ProFund Advisors also performs certain management services, including client support and other administrative services, for the Funds under a Management Services Agreement. ProFund
Advisors is entitled to receive annual fees equal to 0.15% of the average daily net assets of the Funds for such services. During the year ended July 31, 2022, each Fund paid the Advisor management services fees in the following amounts (fees paid reflect the effects of any expense limitation arrangements in place for the period):
|
Access Flex Bear High Yield ProFund |
0.00% |
|
Access Flex High Yield ProFund |
0.15% |
|
Banks UltraSector ProFund |
0.15% |
|
Basic Materials UltraSector ProFund |
0.16% |
|
Bear ProFund |
0.15% |
|
Biotechnology UltraSector ProFund |
0.15% |
|
Bull ProFund |
0.15% |
|
Communication Services UltraSector ProFund |
0.14% |
|
Consumer Goods UltraSector ProFund |
0.13% |
|
Consumer Services UltraSector ProFund |
0.15% |
|
Europe 30 ProFund |
0.06% |
|
Falling U.S. Dollar ProFund |
0.00% |
|
Financials UltraSector ProFund |
0.15% |
|
Health Care UltraSector ProFund |
0.15% |
|
Industrials UltraSector ProFund |
0.15% |
|
Internet UltraSector ProFund |
0.15% |
|
Large-Cap Growth ProFund |
0.15% |
|
Large-Cap Value ProFund |
0.15% |
|
Mid-Cap Growth ProFund |
0.10% |
|
Mid-Cap ProFund |
0.13% |
|
Mid-Cap Value ProFund |
0.14% |
|
Nasdaq-100 ProFund |
0.15% |
|
Oil & Gas UltraSector ProFund |
0.15% |
|
Oil Equipment & Services UltraSector ProFund |
0.15% |
|
Pharmaceuticals UltraSector ProFund |
0.09% |
|
Precious Metals UltraSector ProFund |
0.15% |
|
Real Estate UltraSector ProFund |
0.15% |
|
Rising Rates Opportunity ProFund |
0.15% |
|
Rising Rates Opportunity 10 ProFund |
0.01% |
|
Rising U.S. Dollar ProFund |
0.17% |
|
Semiconductor UltraSector ProFund |
0.15% |
|
Short Nasdaq-100 ProFund |
0.17% |
|
Short Oil & Gas ProFund |
0.00% |
|
Short Precious Metals ProFund |
0.00% |
|
Short Real Estate ProFund |
0.00% |
|
Short Small-Cap ProFund |
0.07% |
|
Small-Cap Growth ProFund |
0.15% |
|
Small-Cap ProFund |
0.08% |
|
Small-Cap Value ProFund |
0.15% |
|
Technology UltraSector ProFund |
0.15% |
|
Telecommunications UltraSector ProFund |
0.00% |
|
UltraBear ProFund |
0.12% |
|
UltraBull ProFund |
0.15% |
|
UltraChina ProFund |
0.15% |
|
UltraDow 30 ProFund |
0.15% |
|
UltraEmerging Markets ProFund |
0.14% |
|
UltraInternational ProFund |
0.00% |
|
UltraJapan ProFund |
0.15% |
|
UltraLatin America ProFund |
0.15% |
|
UltraMid-Cap ProFund |
0.15% |
|
UltraNasdaq-100 ProFund |
0.15% |
|
UltraShort China ProFund |
0.02% |
492 :: Fund Management
|
UltraShort Dow 30 ProFund |
0.01% |
|
UltraShort Emerging Markets ProFund |
0.00% |
|
UltraShort International ProFund |
0.01% |
|
UltraShort Japan ProFund |
0.00% |
|
UltraShort Latin America ProFund |
0.00% |
|
UltraShort Mid-Cap ProFund |
0.00% |
|
UltraShort Nasdaq-100 ProFund |
0.15% |
|
UltraShort Small-Cap ProFund |
0.06% |
|
UltraSmall-Cap ProFund |
0.15% |
|
U.S. Government Plus ProFund |
0.15% |
|
Utilities UltraSector ProFund |
0.16% |
Amounts shown that exceed the contractual fee rate reflect recoupment of a fee waiver as permitted by the expense limitation agreement.
494 :: General Information
Determination of NAV
The price at which you purchase, redeem and exchange shares is the NAV per share next determined after your transaction request is received by the transfer agent in good order (i.e., required forms are complete and, in the case of a purchase, correct payment is received). Each Fund calculates its NAV by taking the value of the assets attributed to the class, subtracting any liabilities attributed to the class, and dividing that amount by the number of that class’ outstanding shares.
Each Fund’s assets are valued primarily on the basis of information furnished by a pricing service or market quotations. Securities that are listed or traded on a stock exchange or the Nasdaq or National Market System are generally valued at the closing price, if available, on the exchange or market where the security is principally traded (including the Nasdaq Official Closing Price). Short-term securities are valued on the basis of amortized cost or based on market prices. Securities traded regularly in the over-the-counter market are generally valued on the basis of the mean between the bid and asked quotes furnished by dealers actively trading those securities. Futures contracts purchased and held by a Fund are generally valued at the last sale price prior to the time the Fund determines its NAV or at the official futures settlement price on the relevant exchange. Routine valuation of certain derivatives is performed using procedures approved by the Board. In addition, certain derivatives linked to a benchmark may be valued based on the performance of one or more U.S. ETFs or instruments that reflect the values of the securities in such benchmark, when the level of the benchmark is not computed as of the close of the U.S. securities markets. Investments initially valued in currencies other than the U.S. dollar are converted to U.S. dollars using exchange rates obtained from pricing services. As a result, the NAV of a Fund’s shares may be affected by changes in the value of currencies in relation to the U.S. dollar. The value of securities traded in markets outside the United States or denominated in currencies other than the U.S. dollar (and, therefore, the NAV of Funds that hold these securities) may be affected significantly on a day that the New York Stock Exchange (“NYSE”) is closed and an investor is not able to purchase, redeem or exchange shares. In particular, calculation of the NAV of the Funds may not take place contemporaneously with the determination of the prices of foreign securities used in NAV calculations.
If market quotations are not readily available, an investment may be valued by a method that the Board of Trustees believes accurately reflects fair value. The use of such a fair valuation method may be appropriate if, for example: (i) ProFund Advisors believes market quotations do not accurately reflect fair value of an investment; (ii) ProFund Advisors believes an investment’s value has been materially affected by events occurring after the close of the exchange or market on which the investment is principally traded (for example, a foreign exchange or market); (iii) a trading halt closes an exchange or market early; or (iv) other events result in an exchange or market delaying its normal close. Any such fair valuations will be conducted pursuant to
Board approved fair valuation procedures. At times, each Fund may, pursuant to Board-approved procedures, write down the value of an investment or other asset to reflect, among other things, decreases in the value of the asset or decreases in the likelihood that a Fund will be able to collect on the asset. These write downs will reduce the value of the asset and, ultimately, the value of a Fund. Fair valuation procedures involve the risk that a Fund’s valuation of an investment may be higher or lower than the price the investment might actually command if a Fund sold it.
Each Fund (other than Rising Rates Opportunity ProFund, Rising Rates Opportunity 10 ProFund and U.S. Government Plus ProFund) normally calculates its daily share price for each class of shares at the close of trading on the NYSE (normally 4:00 p.m. Eastern Time) every day the NYSE is open for business.
Rising Rates Opportunity ProFund, Rising Rates Opportunity 10 ProFund and U.S. Government Plus ProFund normally calculate their daily share prices for each class of shares at the close of trading on the NYSE (normally 4:00 p.m. Eastern Time) every day the NYSE is open for business, except for Columbus Day and Veterans’ Day.
For example, the bond markets or other primary trading markets for certain Funds may close early on the day before certain holidays and the day after Thanksgiving Day. Rising Rates Opportunity ProFund, Rising Rates Opportunity 10 ProFund and U.S. Government Plus ProFund may also close early when the Securities Industry and Financial Markets Association recommends an early close of the bond markets. On such days, Rising Rates Opportunity ProFund, Rising Rates Opportunity 10 ProFund and U.S. Government Plus ProFund will cease taking transaction requests including requests to exchange to or from other Funds.
NYSE Holiday Schedule:The NYSE is open every week, Monday through Friday, except when the following holidays are celebrated: New Year’s Day, Martin Luther King, Jr. Day (the third Monday in January), Washington’s Birthday (observed), Good Friday, Memorial Day (the last Monday in May), Juneteenth National Independence Day, Independence Day, Labor Day (the first Monday in September), Thanksgiving Day (the fourth Thursday in November) and Christmas Day. Exchange holiday schedules are subject to change without notice.
To the extent a Fund’s portfolio investments trade in markets on days or at times when a Fund is not open for business or when the primary exchange for the shares is not open, the value of a Fund’s assets may vary on those days. In addition, trading in certain portfolio investments may not occur on days or at times a Fund is open for business. In particular, calculation of the NAV of a Funds may not take place contemporaneously with the determination of the prices of foreign securities used in NAV calculations. If the exchange or market on which a Fund’s underlying investments are primarily traded closes early, the NAV may be calculated prior to its normal calculation time.
General Information :: 495
The NYSE will close early (1:00 p.m. Eastern Time) on the day before Christmas Day and on the day after Thanksgiving Day.
Securities Industry and Financial Markets Association’s (“SIFMA”) Proposed Close and Early Close Schedule: On the following days in 2022 and 2023 SIFMA has recommended that the U.S. bond markets close: December 26, 2022, January 2, 2023, January 16, 2023, February 20, 2023, May 29, 2023, June 19, 2023, July 4, 2023, September 4, 2023, October 9, 2023, November 23, 2023 and December 25, 2023. SIFMA has recommended that the U.S. bond markets close early at 12:00 p.m. (Eastern Time) on April 7, 2023. SIFMA has recommended that the U.S. bond markets close early at 2:00 p.m. (Eastern Time) on December 23, 2022, December 30, 2022, May 26, 2023, July 3, 2023, November 24, 2023, December 22, 2023 and December 29, 2023.
On such days, the Rising Rates Opportunity ProFund, Rising Rates Opportunity 10 ProFund and U.S. Government Plus ProFund will close as of the close of open auction of the U.S. Treasury futures on the Chicago Board of Trade (typically one hour before SIFMA’s proposed early close). SIFMA may announce changes to this schedule or other early close dates from time to time.
A Fund may cease taking transaction requests, including requests to exchange to or from other funds managed by ProFund Advisors or affiliates of ProFund Advisors, on such days at the cut-off time. See “Transaction Cut-Off Times” in the Shareholder Services Guide in this Prospectus for more details.
Form of Redemption Proceeds
You may receive redemption proceeds of your sale of shares of a Fund in a check, ACH, or federal wire transfer. The Funds typically expect that it will take one to three days following the receipt of your redemption request made in “good order” to pay out redemption proceeds; however, while not expected, payment of redemption proceeds may take up to seven days. Each Fund maintains a cash balance that serves as a primary source of liquidity for meeting redemption requests. The Funds may also use the proceeds from the sale of portfolio securities to meet redemption requests if consistent with the management of a Fund. The Funds reserve the right to redeem in-kind. Each of these redemption methods may be used regularly and in stressed market conditions in conformity with applicable rules of the SEC.
Cost Basis Reporting: Upon the redemption or exchange of your shares in a Fund, the Fund or, if you purchase your shares through a financial intermediary, your financial intermediary generally will be required to provide you and the Internal Revenue Service (“IRS”) with cost basis and certain other related tax information about a Fund shares you redeemed or exchanged. This cost basis reporting requirement is effective for shares purchased, including through dividend reinvestment, on or after January 1, 2012. Please see the Funds’ website (www.profunds.com) or consult your financial intermediary, as appropriate, for more information regarding available methods
for cost basis reporting and how to select or change a particular method. Please consult your tax advisor to determine which available cost basis method is best for you.
Dividends and Distributions
Each intends to distribute its net investment income and capital gains, if any, to shareholders at least annually to qualify for treatment as a RIC for U.S. federal income tax purposes, as follows:
|
ProFund Name |
Dividends |
Capital
Gains | |
|
Accrued |
Paid |
Paid | |
|
Access Flex High Yield
ProFund |
Quarterly |
Quarterly |
Annually |
|
U.S. Government Plus |
Daily |
Monthly |
Annually |
|
Real Estate UltraSector |
Quarterly |
Quarterly |
Annually |
|
All other ProFunds
Offered in this Prospectus |
Annually |
Annually |
Annually |
The Funds do not announce dividend distribution dates in advance. Certain investment strategies employed by certain Funds may produce income or net short-term capital gains which a Funds may seek to distribute more frequently. Each Fund may declare additional capital gains distributions during a year. Each Fund will reinvest distributions in additional shares of the Fund making the distribution, unless a shareholder has written to request distributions in cash (by check, wire or Automated Clearing House (“ACH”)).
By selecting the distribution by check or wire option, a shareholder agrees to the following conditions:
•If a shareholder elects to receive distributions by check or wire, a Fund will, nonetheless, automatically reinvest such distributions in additional shares of the Fund if they are $10 or less (and payable by check) or $25 or less (and payable by wire). A shareholder may elect to receive distributions via ACH or reinvest such distribution in shares of another Fund regardless of amount.
•Any dividend or distribution check, which has been returned to a Fund or has remained uncashed for a period of six months from the issuance date, will be cancelled, and the funds will be reinvested (net of any bank charges) on the date of cancellation into the appropriate class of the Fund from which such distribution was paid or, if the account is closed or only the Government Money Market ProFund is open, the funds will be reinvested into the Government Money Market ProFund (information about the Government Money Market ProFund is contained in a separate prospectus, which may be obtained by calling (888) 776-5717 or (240) 497-6552); and
•Any account on which a dividend or distribution check was returned or remained uncashed for a period of six months will automatically have the dividend and distribution payment election adjusted so that all future dividends or distributions are reinvested into the appropriate class of the Fund from
496 :: General Information
which such dividend or distribution would have been paid, unless subsequent distribution checks have been cashed.
Earning Dividends
•Shares purchased in an exchange transaction begin earning dividends the day after the exchange is processed. Shares continue to earn dividends through the business day on which the Funds’ transfer agent has processed a redemption of those shares.
•U.S. Government Plus ProFund shares begin to earn dividends on the first business day following the day that the Fund’s transfer agent receives a federal funds wire payment for a purchase in good order.
•U.S. Government Plus ProFund shares purchased by check begin to earn dividends the first business day following the day the check is received in good order by the Fund’s transfer agent
Taxes
The following information is a general summary of the U.S. federal income tax consequences of an investment in a Fund and does not address any foreign, state, or local tax consequences. Please see the Statement of Additional Information for more information.
Each Fund intends to qualify for treatment as a “regulated investment company” (“RIC”) for federal income tax purposes. As such, a Fund does not ordinarily pay federal income tax on its net investment income and net realized capital gains that it timely distributes to shareholders. In order for each Fund to so qualify, each Fund must meet certain tests with respect to the sources and types of its income, the nature and diversification of its assets, and the timing and amount of its distributions.
•Each Fund intends to distribute all or substantially all of its net investment income and capital gains to shareholders every year.
•Distributions from investment income by a Fund are generally taxable to shareholders as ordinary income for federal income tax purposes.
•Whether a distribution from capital gains by a Fund is taxable to shareholders as ordinary income or at the rates applicable to net capital gains depends on how long the Fund owned (or is treated as having owned) the investments generating the distribution, not on how long an investor has owned shares of the Fund.
•Distributions from capital gains on investments that a Fund has owned (or is treated as having owned) for more than 12 months and that are properly reported by the Fund as capital gain dividends will be treated as long-term capital gains includible in a shareholder’s net capital gain and taxed to individuals at reduced rates. Distributions from capital gains on investments that a Fund has owned (or is treated as having owned) for 12 months or less will be taxable to shareholders as ordinary income.
•Distributions from investment income reported by a Fund as derived from “qualified dividend income” will be taxed in the hands of individuals at the rates applicable to net capital gains, provided that holding period and other requirements are met at both the shareholder and the Fund level. It is unclear whether a Fund will be able to report a significant portion of its distributions to shareholders as qualified dividend income.
•Shareholders will generally be subject to tax on Fund distributions regardless of whether they receive cash or choose to have the distributions reinvested.
•Distributions are taxable even if they are paid from income or gains earned by a Fund prior to the shareholder’s purchase of Fund shares (which income or gains were thus included in the price paid for the Fund shares).
•Dividends declared by a Fund in October, November or December of one year and paid in January of the next year are generally taxable to shareholders in the calendar year in which the distributions are declared, rather than the calendar year in which the distributions are received.
•If shareholders redeem their Fund shares, they may have a capital gain or loss, which will be long-term or short-term depending upon how long they have held the shares. Net gains resulting from redemptions or sales of shares held for more than one year generally are taxed at net capital gain rates, while those resulting from redemptions or sales of shares held for one year or less generally are taxed at ordinary income rates.
•If shareholders exchange shares of one Fund for shares of a different Fund, this will be treated as a sale of the Fund’s shares and any gain on the transaction may be subject to federal income tax.
•The Code generally imposes a 3.8% Medicare contribution tax on the “net investment income” of individuals, estates and trusts to the extent their income exceeds certain threshold amounts. Net investment income generally includes for this purpose, among other things, dividends paid by a Fund, including any capital gain dividends, and net capital gains recognized on the sale, redemption or exchange of Fund shares. Shareholders are advised to consult their tax advisors regarding the possible implications of this additional tax on their investment in a Fund.
•Distributions by a Fund to retirement plans that qualify for tax-exempt treatment under federal income tax laws and net gains on the redemption or sale of Fund shares by such plans will generally not be taxable. Special tax rules apply to investments through such plans. Shareholders should consult their tax advisors to determine the suitability of a Fund as an investment through such a plan and the tax treatment of distributions (including distributions of amounts attributable to an investment in a Fund) from such a plan.
•Income and gains from a Fund’s investments in securities of foreign issuers, if any, may be subject to foreign withholding
General Information :: 497
or other taxes. In such a case, a Fund’s yield on those securities would decrease. It is not anticipated that Fund shareholders will be able to claim a credit or deduction with respect to such foreign taxes. In addition, a Fund’s investments in foreign securities or foreign currencies may increase or accelerate a Fund’s recognition of ordinary income and may affect the timing or amount of a Fund’s distributions.
•A Fund’s investment in certain debt instruments and a Fund’s use of derivatives may cause the Fund to recognize taxable income in excess of the cash generated by such instruments. As a result, a Fund could be required at times to liquidate other investments (including when otherwise disadvantageous to do so) in order to satisfy its distribution requirements under the Code. A Fund’s use of derivatives will also affect the amount, timing, and character of the Fund’s distributions.
•As discussed above, in order to qualify for the special tax treatment accorded a RIC and its shareholders, a Fund must derive at least 90% of its gross income for each taxable year from “qualifying income,” meet certain asset diversification tests at the end of each taxable quarter, and meet annual distribution requirements. A Fund’s pursuit of its investment strategies will potentially be limited by the Fund’s intention to qualify for such treatment and could adversely affect the Fund’s ability to so qualify. A Fund can make certain investments, the treatment of which for these purposes is unclear. If, in any year, a Fund were to fail to qualify for the special tax treatment accorded a RIC and its shareholders, and were ineligible to or otherwise did not cure such failure, the Fund would be taxed in the same manner as an ordinary corporation subject to U.S. federal income tax on all its income at the fund level. The resulting taxes could substantially reduce the Fund’s net assets and the amount of income available for distribution. In addition, in order to requalify for taxation as a RIC, the Fund could be required to recognize unrealized gains, pay substantial taxes and interest, and make certain distributions.
•Each Fund is required to withhold U.S. federal income tax from all taxable distributions and redemption proceeds to shareholders who fail to provide the Fund with correct taxpayer identification numbers or to make required certifications, or who have been notified by the IRS that they are subject to backup withholding. Backup withholding is not an additional tax; rather, it is a way in which the IRS ensures it will collect taxes otherwise due. Any amounts withheld may be credited against the shareholder’s U.S. federal income tax liability.
•In general, dividends paid to a shareholder that is not a “United States person” within the meaning of the Code (such a shareholder, a “foreign person”) that a Fund properly reports as capital gain dividends, short-term capital gain dividends, or interest-related dividends, each as further defined in the SAI, are not subject to withholding of U.S. federal income tax, provided that certain other requirements are met. A Fund (or intermediary, as applicable) is permitted, but is not required, to report any part of its dividends as are eligible for such treatment. A Fund’s dividends other than those a Fund so reports as capital gain dividends, short-term capital gain dividends, or interest-related dividends generally will be subject to withholding of U.S. federal income tax at a rate of 30% (or lower applicable treaty rate).
•Special tax considerations may apply to foreign persons investing in a Fund. Please see the SAI for further information. Because each shareholder’s tax circumstances are unique and because the tax laws are subject to change, it is recommended that shareholders consult their own tax advisors about the federal, state, local and foreign tax consequences of investing in the Funds.
Contractual Arrangement
The Trust enters into contractual arrangements with various parties, including, among others, the Advisor, administrator, custodian, transfer agent, and Distributor, who provide services to each Fund. Shareholders are not parties to, or intended (or “third party”) beneficiaries of, any of these contractual arrangements, and those contractual arrangements are not intended to create in any individual shareholder or group of shareholders and right to enforce them against the service providers or to seek any remedy under them against the service providers, either directly or on behalf of the Trust.
This Prospectus provides information concerning the Trust and each Fund that you should consider in determining whether to purchase shares of a Fund. None of this Prospectus, the SAI or any contract that is an exhibit to the Trust’s registration statements, is intended to, nor does it, give rise to an agreement or contract between the Trust or each Fund and any investor, or give rise to any contract or other rights in any individual shareholder, group of shareholders or other person than any rights conferred explicitly by federal or state securities laws that may not be waived.
Shareholder Services Guide :: 499
Opening a New Account
ProFunds offers two classes of shares: Investor Class Shares and Service Class Shares, except that Bitcoin Strategy ProFund and Short Bitcoin Strategy ProFund (the “Bitcoin ProFunds”) only offer Investor Class Shares. Investor Class Shares may be purchased directly through ProFunds Distributors, Inc. or through authorized financial professionals. Service Class Shares may only be purchased through authorized financial professionals and have service and distribution expenses not applicable to Investor Class Shares. There is a separate New Account Form for each class of shares available. Please ensure you have the correct New Account Form before completing it.
|
You may purchase
shares using any of the
following methods. |
HOW TO MAKE AN
INITIAL PURCHASE |
HOW TO PURCHASE
ADDITIONAL SHARES |
|
Please note: Purchases must be made according to the transaction cut-off times stated within the Shareholder Services Guide. | ||
|
Account Minimums
(all account types) |
All ProFunds (except Bitcoin ProFunds) – The
minimum initial investment* amounts are: ˃ $5,000 for accounts that list a financial professional. ˃ $15,000 for self-directed accounts.
Bitcoin ProFunds – The minimum initial investment*
amounts are: ˃ $1,000 for all accounts |
Not Applicable. |
|
By Mail |
Step 1:
Complete a New Account Form (see “Completing
your New Account Form”). |
Step 1:
Complete a ProFunds’ investment slip, which is
attached to your transaction confirmation statement.
If an investment slip is not readily available, you may
send written instructions which include your name,
account number, name and share class of the
ProFund you wish to purchase and the purchase
amount. |
|
Step 2:
Make your check payable to ProFunds. Write the name of the ProFund in which you wish to invest and your
account number, if known, on the check. | ||
|
Step 3:
Send the signed New Account Form and check to:
ProFunds • P.O. Box 182800 • Columbus, OH
43218-2800 |
Step 3:
Send the investment slip and check to:
ProFunds • P.O. Box 182800 • Columbus, OH
43218-2800 | |
500 :: Shareholder Services Guide
|
You may purchase
shares using any of the
following methods. |
HOW TO MAKE AN
INITIAL PURCHASE |
HOW TO PURCHASE
ADDITIONAL SHARES |
|
By Phone via Wire |
Step 1:
Complete a New Account Form (see “Completing
your New Account Form”). |
Step 1:
Call ProFunds to inform us of: ˃ your account number, ˃ the amount to be wired, ˃ the ProFund(s) in which you wish to invest
You will be provided: ˃ a confirmation number for your purchase order
(your trade is not effective until you have received a
confirmation number from ProFunds and the
funding is received in good order by the transfer
agent), ˃ bank wire instructions |
|
Step 2:
Fax the New Account Form to (800) 782-4797
(toll-free). |
Step 2:
Contact your bank to initiate your wire transfer. | |
|
Step 3:
Call ProFunds at 888-776-3637 to: ˃ confirm receipt of the faxed New Account Form, ˃ request your new account number.
You will be provided: ˃ a confirmation number for your purchase order
(your trade is not effective until you have received a
confirmation number from ProFunds), and ˃ bank wire instructions.
Instructions given to ProFunds for wire transfer
requests do not constitute a transaction request
received in “good order” until the wire transfer has
been received by ProFunds. |
| |
|
Step 4:
Call your bank to initiate your wire transfer. |
| |
|
Step 5:
Send the original, signed New Account Form to:
ProFunds • P.O. Box 182800 • Columbus, OH
43218-2800 |
|
* Under certain circumstances, ProFunds may waive minimum initial investment amounts.
|
You may purchase
shares using any of the
following methods. |
HOW TO MAKE AN
INITIAL PURCHASE |
HOW TO PURCHASE
ADDITIONAL SHARES |
|
By Phone via ACH
Please note: the
maximum ACH purchase
amount is $50,000 |
Initial purchase via ACH not available. |
Step 1:
Establish bank instructions on your account by
completing an Account Options Form (if not already
established). |
|
Step 2:
Call ProFunds to inform us of: ˃ the fact that you want to make an ACH purchase, ˃ your account number, ˃ the purchase amount, ˃ the ProFund(s) in which you wish to invest,
You will be provided a confirmation number for your
purchase order (your trade is not effective until you
have received a confirmation number from
ProFunds). |
Shareholder Services Guide :: 501
|
You may purchase
shares using any of the
following methods. |
HOW TO MAKE AN
INITIAL PURCHASE |
HOW TO PURCHASE
ADDITIONAL SHARES |
|
By Internet via
check or wire |
Step 1:
Go to ProFunds.com. |
Step 1:
Go to ProFunds.com. |
|
Step 2:
Click on “Open Account.” |
Step 2:
Click on the “Access Account” button. | |
|
Step 3:
Complete an on-line New Account Form. |
Step 3:
Enter User Name and Password. | |
|
Step 4:
If funding with check:
Mail check payable to ProFunds to: P.O. Box 182800
Columbus, OH 43218-2800
Call ProFunds at 888-776-3637 to: ˃ confirm receipt of the faxed New Account Form, ˃ request your new account number.
You will be provided: ˃ a confirmation number for your purchase order
(your trade is not effective until you have received a
confirmation number from ProFunds), and ˃ bank wire instructions.
Instructions given to ProFunds for wire transfer
requests do not constitute a transaction request
received in “good order” until the wire transfer has
been received by ProFunds. |
Step 4:
Follow transaction instructions for making a
purchase. | |
|
Through a Financial
Professional |
Contact your financial professional with your
instructions. |
Contact your financial professional with your
instructions. |
502 :: Shareholder Services Guide
|
You may
purchase
shares using any
of the
following
methods. |
HOW TO EXCHANGE
OR REDEEM SHARES |
|
By Mail |
To redeem shares using ProFund form:
Complete and mail the appropriate
Withdrawal Request or IRA Distribution
Request Form
located at profunds.com
To exchange or redeem shares by letter:
Send a signed letter to:
ProFunds
P.O. Box 182800
Columbus, OH 43218-2800
The letter should include information
necessary to process your request (see
“Exchanging Shares”). ProFunds may
require a signature guarantee in certain
circumstances. See “Signature Guarantees”
under “Additional Shareholder Information”
or call ProFunds for additional information. |
|
By Telephone |
Individual Investors:
(888) 776-3637 or (614) 470-8122
Financial Professionals and Institutions:
(888) 776-5717 or (240) 497-6552
Interactive Voice Response System (“IVR”):
Call (888) 776-3637 (toll-free) or (614)
470-8122 and follow the step-by-step
instructions. |
|
By Internet |
ProFunds.com
Select the “Access Account” navigation bar,
enter your User Name and Password and
follow the step-by-step instructions. Please
make sure you receive and record your
confirmation number for later reference.
(Your transaction is not effective until you
have received a confirmation number from
ProFunds.) |
|
Through a
Financial
Professional |
Contact your financial professional with
your instructions. |
|
Contact Information | |
|
By Telephone |
Individual Investors:
(888) 776-3637 or (614) 470-8122
Financial Professionals and Institutions:
(888) 776-5717 or (240) 497-6552 |
|
Fax |
(800) 782-4797 (toll-free) |
|
Internet |
ProFunds.com |
|
Regular mail |
ProFunds
P.O. Box 182800
Columbus, OH 43218-2800 |
|
Overnight mail |
ProFunds
c/o Transfer Agency
4249 Easton Way, Suite 400
Columbus, OH 43219 |
ProFunds Accounts
To open a mutual fund account, you will need to complete a New Account Form. You should also read the relevant prospectus carefully prior to opening your account. Contact ProFunds to request a New Account Form or download a New Account Form from ProFunds’ website. For guidelines to help you complete the Form, see the instructions below. You may also open certain new accounts online. Go to (www.profunds.com), select “Open Account” and follow the instructions. Please note that new accounts opened online must be funded by check or wire purchase.
Retirement Plan Accounts
Several types of Individual Retirement Accounts (“IRAs”) are available. Please visit (www.profunds.com) or contact ProFunds for a retirement plan account application. The IRA custodian charges an annual fee of $15 per social security number for all types of IRAs. The annual fee may be waived in certain circumstances. Other types of retirement accounts, such as profit sharing, money purchase and 401(k) accounts may be established; however, ProFunds does not sponsor these plans nor does ProFunds provide retirement reporting for these types of plans.
Accounts through Financial Professionals
Contact your financial professional for information on opening an account to invest in ProFunds.
Completing Your New Account Form
˃You must provide each account holder’s social security number or tax identification number and date of birth on the New Account Form.
˃Attach the trust documents when establishing a trust account. Contact ProFunds for specific requirements.
˃When establishing an account for your corporation, partnership or self-directed retirement plan, please check the appropriate box to indicate the correct account type to ensure proper tax reporting, and provide a certified corporate resolution or other documentation evidencing your authority to open the account and engage in transactions.
˃You must provide a street address (ProFunds does not accept P.O. Box-only addresses, but APO and FPO Armed Forces mailing addresses are acceptable). If account holders have different addresses, each address must be provided.
˃You must designate the ProFund(s) to which your initial investment will be directed or the investment will be made in Government Money Market ProFund.
˃Be sure all parties named on the account sign the New Account Form.
Federal law requires all financial institutions to obtain, verify and record information that identifies each person or entity who opens an account. Some or all of the information provided will
Shareholder Services Guide :: 503
be used by ProFunds and/or its agents to verify the identity of the persons opening an account. If this information is not provided, ProFunds may not be able to open your account. Accounts may be restricted or closed, and monies withheld, pending verification of this information or as otherwise required under federal regulations. You may be asked to provide additional information to verify your identity consistent with the requirements under anti-money laundering regulations. In addition, transaction orders, including orders for purchases, exchanges and redemptions may be suspended, restricted, canceled or processed and the proceeds may be withheld.
Purchasing Shares
You have the option to send purchase orders by mail or Internet and to send purchase proceeds by check, ACH or wire. Initial purchases via ACH are not accepted. All purchases must be made in U.S. dollars drawn on a U.S. bank. Cash, starter checks, Internet-based checks, credit cards, travelers’ checks, money orders and credit card checks are not accepted. Third-party checks are generally not accepted to open an account.
Each ProFund prices shares you purchase at the price per share next computed after it (or an authorized financial intermediary) receives your purchase request in good order. To be in good order, a purchase request must include a wire or check or the processing of an ACH initiated (as applicable) by stated cut-off times, and for new accounts, a properly completed New Account Form. ProFunds cannot accept wire or ACH purchases on bank holidays. ProFunds and ProFunds Distributors, Inc. may reject any purchase request for any reason.
Important Information You Should Know When You Purchase Shares:
˃Instructions, written or by telephone, given to ProFunds for wire transfer requests do not constitute a transaction request received in “good order” until the wire transfer has been received by ProFunds. A wire purchase will be considered in good order if (i) you have completed and faxed a New Account Form; (ii) you have contacted ProFunds and received a confirmation number, and (iii) ProFunds receives and accepts your wire during ProFunds wire processing times noted in the chart under “Transaction Cut-Off Times.”
˃Although ProFunds does not charge for wire receipt, your bank may charge a fee to send wires. Please be sure that the wire is sufficient to cover your purchase and any such bank fees.
˃Any New Account Form, check or wire order received that does not designate a specific ProFund will be used to purchase shares (i) in the ProFund in your existing account if you have an investment in only one ProFund, or (ii) in Investor Class or Service Class Shares, as applicable, of the Government Money Market ProFund, if you are initially opening an account or have more than one ProFund investment. Neither ProFunds nor ProFunds Distributors, Inc. will be responsible for investment opportunities lost as a result of investments being directed to Government Money
Market ProFund, to an existing active ProFund account. ProFunds is not responsible for transfer errors by sending or receiving bank and will not be liable for any loss incurred due to a wire transfer or ACH not having been received. If the check, ACH or wire cannot be identified, it may be returned or rejected. Checks submitted to ProFunds will be automatically deposited upon receipt at our administrative office in Columbus, Ohio.
˃If it is determined that account information is not in good order, any amount deposited will be refunded by check no earlier than ten business days from receipt of such payment to allow adequate time for the original check to clear through the banking system.
˃ProFunds will ordinarily cancel your purchase order if your bank does not honor your check or ACH for any reason, or your wire transfer is not received by the designated cut-off time. If your purchase transaction is cancelled, you will be responsible for any losses that may result from any decline in the value of the cancelled purchase. ProFunds (or its agents) have the authority to redeem shares in your account(s) to cover any losses. Any profit on a cancelled transaction will accrue to the applicable ProFund.
˃ProFunds may reject or cancel any purchase orders for any reason.
˃The minimum for initial purchases may be waived in certain circumstances.
Exchanging Shares
Shareholders can, free of charge and without a limit on frequency or maximum amount, exchange Investor or Service Class Shares of any publicly available ProFund for Investor or Service Class Shares, respectively, of another publicly available series of ProFunds that offers such shares as long as the shareholder’s account meets the minimum initial investment requirements of the ProFund into which the shareholder is exchanging. Exchange requests, like any other share transaction, are subject to ProFunds transaction cut-off times described under “Transaction Cut-Off Times.”
ProFunds will need the following information to process your exchange:
˃the account number applicable to the exchange transaction request;
˃the number of shares, percentage, or dollar value of the shares you wish to exchange; and
˃the share class and name of the ProFund you are exchanging from and the share class and name of the ProFund you are exchanging into.
Please note that the transaction cut-off times of one Fund may differ from those of another Fund. In an exchange between funds with different cut-off times, you will receive the price next computed after the exchange request is made for both the redemption and the purchase transactions involved in the
504 :: Shareholder Services Guide
exchange. You will be responsible for any losses if sufficient redemption proceeds are not available to pay the purchase price of shares purchased. Please consult the prospectus of the Fund into which you are exchanging for the applicable cut-off times. Contact an Authorized Financial Professional to initiate an exchange. You can perform exchanges by mail, phone and online at (www.profunds.com).
Important Information You Should Know When You Exchange Shares:
˃An exchange involves redeeming shares of one fund and purchasing shares of another fund. Exchanges are taxable transactions. Exchanges within a retirement account may not be taxable. Please contact your tax advisor for more information.
˃If your account does not meet the minimum initial investment requirements of the ProFund you are exchanging into, your exchange will be treated as a redemption from the ProFund you are exchanging from and a purchase that was not in good order of the ProFund you wish to exchange into. Consequently, the proceeds from the redemption will be used to purchase Investor Class or Service Class Shares, as applicable, of the Government Money Market ProFund. Neither ProFunds nor ProFunds Distributors, Inc. will be responsible for investment opportunities lost as a result of investments being directed to Government Money Market ProFund.
˃ProFunds can only honor exchanges between accounts registered in the same name and having the same address and taxpayer identification number.
˃None of ProFunds, ProFunds Distributors, Inc. or the ProFunds’ transfer agent is required to verify that there is a sufficient balance in the account to cover the exchange. You will be responsible for any loss if there are insufficient funds available to cover the exchange due to insufficient shares or due to a decline in the value of the ProFund from which you are exchanging.
˃The redemption and purchase will be processed at the next calculated NAVs of the respective ProFund after a Fund has received your exchange request in good order.
˃The exchange privilege may be modified or discontinued at any time.
˃Before exchanging into a ProFund, please read such fund’s prospectus.
˃Financial intermediaries may have their own rules about exchanges or transfers and may impose limits on the number of such transactions you are permitted to make during a given time period.
Redeeming Shares
You may redeem all or part of your shares at the NAV next determined after your redemption request is received in good order. Only the registered owner(s) of the account or persons
authorized in writing by the registered owner(s) may redeem shares.
ProFunds will need the following information to process your redemption request:
˃name(s) of account owners;
˃account number(s);
˃the name of the ProFund(s);
˃your daytime telephone number;
˃the dollar amount, percentage or number of shares being redeemed; and
˃how you would like to receive your redemption proceeds (see options below). Unless otherwise requested, your redemption proceeds will be sent by check to the registered account owner’s address of record by U.S. mail.
You may receive your redemption proceeds:
By Check: Normally, redemption proceeds will be sent by check to the address listed on the account. ProFunds may charge a fee associated with overnight mailings or Saturday delivery of redemption proceeds.
By Wire: You may have your redemption proceeds wired directly into a designated bank account by establishing a wire redemption option on your account. ProFunds may charge a $10 service fee for a wire transfer of redemption proceeds under certain circumstances, and your bank may charge an additional fee to receive the wire. If you would like to establish this option on an existing account, please call ProFunds.
By ACH: You may have your redemption proceeds sent to your bank account via ACH by establishing this option on your account. Funds sent through ACH should reach your bank in approximately two business days. While there is no fee charged by ProFunds for this service, your bank may charge a fee. If you would like to establish this option on an existing account, please call ProFunds.
Important Information You Should Know When You Sell Shares:
˃ProFund shareholders automatically have telephone redemption privileges unless they elect not to have these privileges on the New Account Form. Redemptions requested via telephone must be made payable to the name on the account and sent to the address or bank account listed on the account.
˃To redeem shares from a retirement account, you may make this request in writing by completing an IRA Distribution Request Form. In certain cases, distributions may be requested via telephone with proceeds sent to the address or bank on record on the account. Financial professionals may not request a redemption from an IRA on your behalf. You should consult a tax advisor before redeeming shares and making distributions from your tax qualified account because doing
Shareholder Services Guide :: 505
so may have adverse tax consequences for you. Call ProFunds to request an IRA Distribution Request Form or download the form from the ProFunds’ website, (www.profunds.com).
˃If you request that redemption proceeds be sent to a bank account or an address other than the bank account or address you have previously established on your ProFunds account, you must make the request in writing. The signatures of all registered owners must be guaranteed (see “Signature Guarantees”).
˃If you are selling some, but not all, of your shares, your remaining account balance should be above the minimum investment amount to keep your ProFund position open.
˃ProFunds normally remits redemption proceeds within seven days of redemption. For redemption of shares purchased by check, ACH or through ProFunds’ automatic investment plan, ProFunds may wait up to 10 business days before sending redemption proceeds to ensure that its transfer agent has collected the original purchase payment.
˃Your right of redemption may be suspended, or the date of payment postponed for any period during which: (i) the NYSE or the Federal Reserve Bank of New York is closed (other than customary weekend or holiday closings); (ii) trading on the NYSE, or other securities exchanges or markets as appropriate, is restricted, as determined by the SEC; (iii) an emergency exists, as determined by the SEC; or (iv) for such other periods as the SEC, by order, may permit for protection of ProFunds’ investors. Proceeds cannot be sent by wire or ACH on bank holidays.
Additional Shareholder Information
Account Minimums
Account minimums apply to all initial investments with ProFunds, including retirement plans, and apply to the total initial value of an account. These minimums may be different for investments made through certain financial intermediaries. In addition, ProFunds reserves the right to modify its minimum account requirements at any time with or without prior notice.
ProFunds reserves the right to involuntarily redeem an investor’s account, including a retirement account, if the account holder’s aggregate account balance falls below the applicable minimum initial investment amount due to transaction activity. You will be given at least 30 days’ notice to reestablish the minimum balance if your ProFund balance falls below the applicable account minimum. If you do not increase your balance during the notice period, the ProFund may sell all of your shares and send the proceeds to you. Your shares will be sold at the NAV on the day your ProFund position is closed.
Transaction Cut-Off Times
All shareholder transaction orders are processed at the NAV next determined after your transaction order is received in good order by ProFunds’ transfer agent, distributor, or financial intermediary designated by the ProFunds as an authorized agent.
Transaction orders in ProFund accounts must be received in good order by the ProFunds’ transfer agent or distributor before the cut-off times detailed in the table below to be processed at that business day’s NAV. A completed New Account Form does not constitute a purchase order until the transfer agent deems it to be in good order, processes the New Account Form and receives correct payment by check or wire transfer on any business day prior to the designated cut-off time. Trades placed via telephone must be initiated (i.e., the call must be received and in queue) by the cut-off time and communicated in good order by the close of the NYSE (normally 4:00 p.m. Eastern Time). When the NYSE closes early, all cut-off times are adjusted for the early close. When the bond markets close early, the cut-off times for the U.S. Government Plus ProFund, Rising Rates Opportunity 10 ProFund and Rising Rates Opportunity ProFund, Access Flex Bear High Yield ProFund, and Access Flex High Yield ProFund are adjusted for the early close. Certain financial intermediaries may impose cut-off times different from those described below.
|
Method |
Fund/Trust |
Normal
Cut-Off Time
(Eastern Time) |
Additional
Transaction
Information
(Eastern Time) |
|
By Mail |
All (except
Government
Money
Market
ProFund) |
4:00 p.m. |
|
|
Government
Money
Market
ProFund |
5:00 p.m. |
| |
|
By Telephone
and Wire |
All (except
Bitcoin
ProFunds) |
3:30 p.m. (wire
purchases)
3:50 p.m.
(exchanges
and
redemptions) |
ProFunds
accepts all
Transactions
starting at
8:00 a.m.
through the
Transaction
cut-off time
and from
5:00 p.m.
through
6:00 p.m. |
|
Bitcoin
ProFunds |
3:00 p.m. (wire
purchases)
3:00 p.m.
(exchanges
and
redemptions) | ||
|
By Internet,
Fund/SERV and
Interactive Voice
Response
System (“IVR”) |
All (except
Bitcoin
ProFunds) |
3:55 p.m. |
ProFunds
accepts
transactions at
any time
except
between
3:55 p.m. and
5:00 p.m. |
|
Bitcoin
ProFunds |
3:00 p.m. |
About Telephone and Internet Transactions
Telephone and Internet transactions, whether initiated by a shareholder or a shareholder’s agent, are extremely convenient but are not free from risk. None of ProFunds, ProFunds
506 :: Shareholder Services Guide
Distributors, Inc. nor ProFunds’ agents will be responsible for any losses resulting from unauthorized telephone or Internet transactions if reasonable security procedures are followed. Telephone conversations may be recorded or monitored for verification, recordkeeping and quality-assurance purposes. For transactions over the Internet, we recommend the use of a secure internet browser. In addition, you should verify the accuracy of your confirmation statements immediately upon receipt. If you do not want the ability to initiate transactions by telephone or Internet, call ProFunds for instructions.
During periods of heavy market activity or other times, it may be difficult to reach ProFunds by telephone or to transact business over the Internet. Technological irregularities may also make the use of the Internet slow or unavailable at times. If you are unable to reach us by telephone or unable to transact business over the Internet, consider sending written instructions.
The ProFunds may terminate the receipt of redemption or exchange orders by telephone or the Internet at any time, in which case you may redeem or exchange shares in writing.
Exchanges or Redemptions in Excess of Share Balances
If you initiate exchange or redemption transactions that, in total, exceed the balance of your shares in a ProFund, some transactions may be processed while others may not. This may result in ProFund positions that you did not anticipate. None of ProFunds, ProFunds’ transfer agent nor ProFunds Distributors, Inc. will be responsible for transactions that did not process in this circumstance. You may be liable for losses resulting from exchanges canceled due to insufficient balances.
Signature Verification for Certain Transactions
Signature Guarantee Program — Financial Transactions
Certain redemption requests must include a signature guarantee if any of the following apply:
•Your account address has changed within the last 10 business days;
•A check is being mailed to an address different than the one on your account;
•A check or wire is being made payable to someone other than the account owner;
•Redemption proceeds are being transferred to an account with a different registration;
•A wire or ACH transfer is being sent to a financial institution other than the one that has been established on your ProFunds account; or
•Other unusual situations as determined by ProFunds’ transfer agent.
ProFunds reserves the right to waive signature guarantee requirements, require a signature guarantee under other circumstances or reject or delay a redemption if the signature guarantee is not in good form. Faxed signature guarantees are generally not accepted.
Signature guarantees may be provided by an eligible financial institution such as a commercial bank, a Financial Industry Regulatory Authority, Inc. (“FINRA”) member firm such as a stock broker, a savings association or a national securities exchange. A notary public cannot provide a signature guarantee. ProFunds reserves the right to reject a signature guarantee if it is not provided by a STAMP 2000 Medallion guarantor.
Signature Validation Program — Non-Financial Transactions
The Fund may require a Signature Validation Program (“SVP”) stamp or a Signature Guarantee stamp for certain non-financial transactions. The SVP is intended to provide validation of authorized signatures for those transactions considered non-financial (i.e., do not involve the sale, redemption or transfer of securities). The purpose of the SVP stamp on a document is to authenticate your signature and to confirm that you have the authority to provide the instructions in the document. This stamp may be obtained from eligible members of a Medallion Signature Guarantee Program (see above) or other eligible guarantor institutions in accordance with SVP.
Eligible guarantor institutions generally include banks, broker/dealers, credit unions, members of national securities exchanges, registered securities associations, clearing agencies and savings associations. You should verify with the institution that they are an eligible guarantor institution prior to signing. A notary public cannot provide an SVP stamp.
Uncashed Redemption Check
Generally, redemption checks which have been returned to ProFunds, or have remained uncashed for a period of six months from the issuance date, will be deposited into the shareholder’s account in the Government Money Market ProFund.
Frequent Purchases and Redemptions of ProFund Shares
It is the general policy of ProFunds to permit frequent purchases and redemptions of ProFund shares. The ProFunds impose no restrictions and charge no redemption fees to prevent or minimize frequent purchases and redemptions of ProFund shares other than a $10 wire fee under certain circumstances. Notwithstanding the provisions of this Policy, ProFunds may reject any purchase request for any reason.
As noted under “Investment Objectives, Principal Investment Strategies and Related Risks — Other Principal Risks — Active Investor Risk,” frequent purchases and redemptions of Fund shares could increase the rate of portfolio turnover. A high level of portfolio turnover may negatively affect performance by
Shareholder Services Guide :: 507
increasing transaction costs and generating greater tax liabilities for shareholders. In addition, large movements of assets into and out of a ProFund may negatively affect a ProFund’s ability to achieve its investment objective or maintain a consistent level of operating expenses. In certain circumstances, a ProFund’s expense ratio may vary from current estimates or the historical ratio disclosed in this Prospectus.
Additional Shareholder Services
Automatic Investment Plans (AIP) and Systematic Withdrawal Plans (SWP)
Shareholders may purchase and/or redeem shares automatically on a monthly, bimonthly, quarterly or annual basis. You may sign up for these services on the New Account Form, or you may download or request an Account Options Form to add these services to an existing account. Requests to add an Automatic Investment Plan (AIP) to an account should be received in good order at least three business days prior to the first date in which the AIP is to run.
Account Statements and Confirmations
Shareholders with ProFund accounts will receive quarterly ProFund statements showing the market value of their ProFund account at the close of the statement period in addition to any transaction information for the period. Shareholders will also receive transaction confirmations for most Fund transactions. Shareholders should review their account statements and confirmations as soon as they are received. You may also receive statements and confirmations electronically. See “Electronic Document Delivery Program — PaperFree™.”
Tax Statements
Each year, ProFunds will send tax information to assist you in preparing your income tax returns. These statements will report the previous year’s dividend and capital gains distributions, proceeds from the sales of shares, and distributions from, and contributions to, IRAs and other retirement plans.
Cost Basis
Shares purchased on or after January 1, 2012: The Emergency Economic Stabilization Act of 2008 included tax reporting rules that change the information ProFunds reports on Form 1099-B for mutual fund shares purchased on or after January 1, 2012, and subsequently sold. The law expands the information reported to the IRS and to shareholders to include the adjusted cost basis, whether any gain or loss is short- or long-term, and whether any loss is disallowed by the wash sale rules.
Generally, the rules apply to those accounts that currently receive Form 1099-B tax reporting, such as individual, joint, partnership and Uniform Gifts to Minors Act/Uniform Transfers to Minors Act registrations. S Corporations are also covered by the new rules. Accounts held by retirement accounts and C Corporations are not subject to the new reporting requirements.
For shares purchased on or after January 1, 2012, investors who purchase shares directly from ProFunds have the opportunity to choose which method ProFunds uses to calculate cost basis or to use the ProFunds default method — Average Cost. ProFunds will use the Average Cost method if a shareholder does not instruct it to use an alternate method. Investors should consult a qualified tax advisor to determine the method most suitable for their situation. For shares purchased through a financial intermediary, the intermediary’s default method will apply in the absence of an election by the investor to use a different method. Investors that purchase shares through a financial intermediary should consult their intermediary for information regarding available methods and how to select or change a particular method.
Electronic Document Delivery Program — PaperFree™
You may elect to receive your account statements and confirmations electronically through PaperFree™, ProFunds’ electronic document delivery service. You may also choose to receive your ProFunds Prospectus, shareholder reports, and other documents electronically. To enroll for this service, please register on ProFunds’ website. You may elect the PaperFree™ service by completing the appropriate section on the New Account Form. ProFunds will then send you a link to the enrollment site.
Financial Intermediaries
Certain financial intermediaries may accept purchase and redemption orders on ProFunds’ behalf. Such purchase and redemption orders will be deemed to have been received by ProFunds at the time an authorized financial intermediary accepts the orders. Your financial intermediary has the responsibility to transmit your orders and payment promptly and may specify transaction order cut-off times and different share transaction policies and limitations, including limitations on the number of exchanges, than those described in this Prospectus. In addition, the financial intermediary may impose additional restrictions or charge fees not described in this Prospectus. Furthermore, such financial intermediaries are authorized to designate other intermediaries to receive purchase and redemption orders on a ProFund’s behalf. If your order and payment is not received from your financial intermediary timely, your order may be cancelled and the financial intermediary could be liable for resulting fees or losses. Although the ProFunds may effect portfolio transactions through broker dealers who sell Fund shares, ProFunds does not consider the sale of ProFund shares as a factor when selecting broker dealers to effect portfolio transactions.
Investor Class Shares and Service Class Shares bear fees payable to certain intermediaries or financial institutions for provision of recordkeeping, sub-accounting services, transfer agency and other administrative services. The expenses paid by each ProFund are included in “Other Expenses” under “Annual Fund Operating Expenses” in this Prospectus.
508 :: Shareholder Services Guide
Distribution and Service (12b-1) Fees
Under Rule 12b-1 Distribution and Shareholder Services Plans (the “Plans”) adopted by the Trustees and administered by ProFunds Distributors, Inc. (the “Distributor”), each ProFund may pay the Distributor, financial intermediaries, such as broker-dealers and investment advisers, up to 1.00% on an annualized basis of the average daily net assets attributable to Service Class Shares and with respect to the Bitcoin ProFunds only, up to 0.25% on an annualized basis of the average daily net asset attributable to Investor Class Shares as reimbursement or compensation for service and distribution related activities with respect to each Fund and/or shareholder services. Over time, fees paid under the Plans will increase the cost of a shareholder’s investment and may cost more than other types of sales charges. With respect to the Bitcoin ProFunds, no payments have yet been authorized by the Board, nor are any such expected to be made by the Fund under the Plan during the current fiscal year.
Payments to Financial Firms
ProFund Advisors or other service providers may utilize their own resources to finance distribution or service activities on behalf of the ProFunds, including compensating the Distributor and other third parties, including financial firms, for distribution-related activities or the provision of shareholder services. These payments are not reflected in the fees and expenses section of the fee table for the ProFunds contained in this Prospectus.
A financial firm is one that, in exchange for compensation, sells, among other products, mutual fund shares (including the shares offered in this Prospectus) or provides services for mutual fund shareholders. Financial firms include registered investment advisers, brokers, dealers, insurance companies and banks. In addition to the payments described above, the Distributor and ProFund Advisors from time to time provide other incentives to selected financial firms as compensation for services (including preferential services) such as, without limitation, paying for active asset allocation services provided to investors in the ProFunds, providing the ProFunds with “shelf space” or a higher profile for the financial firms’ financial consultants and their customers, placing the ProFunds on the financial firms’ preferred or recommended fund list, granting the Distributor or ProFund Advisors access to the financial firms’ financial consultants, providing assistance in training and educating the financial firms’ personnel, and furnishing marketing support and other specified services. These payments may be significant to the financial firms and may also take the form of sponsorship of seminars or informational meetings or payment for
attendance by persons associated with the financial firms at seminars or informational meetings.
A number of factors will be considered in determining the amount of these additional payments to financial firms. On some occasions, such payments may be conditioned upon levels of sales, including the sale of a specified minimum dollar amount of the shares of a ProFund, all other ProFunds, other funds sponsored by ProFund Advisors and/or a particular class of shares, during a specified period of time. The Distributor and ProFund Advisors may also make payments to one or more participating financial firms based upon factors such as the amount of assets a financial firm’s clients have invested in the ProFunds and the quality of the financial firm’s relationship with the Distributor or ProFund Advisors. The additional payments described above are made at the Distributor’s or ProFund Advisors’ expense, as applicable. These payments may be made at the discretion of the Distributor or ProFund Advisors to some of the financial firms that have sold the greatest amounts of shares of the ProFunds. In certain cases, the payments described in the preceding sentence may be subject to certain minimum payment levels.
Representatives of the Distributor and ProFund Advisors visit financial firms on a regular basis to educate financial advisors about the ProFunds and to encourage the sale of ProFund shares to their clients. The costs and expenses associated with these efforts may include travel, lodging, sponsorship at educational seminars and conferences, entertainment and meals to the extent permitted by law and Rules of FINRA.
If investment advisers, distributors or affiliates of mutual funds other than ProFunds make payments (including, without limitation, sub-transfer agency fees, platform fees, bonuses and incentives) in differing amounts, financial firms and their financial consultants may have financial incentives for recommending a particular mutual fund (including ProFunds) over other mutual funds. In addition, depending on the arrangements in place at any particular time, a financial firm and its financial consultants may also have a financial incentive for recommending a particular share class over other share classes. You should consult your financial advisor and review carefully any disclosure by the financial firm as to compensation received by that firm and/or your financial advisor.
For further details about payments made by the Distributor or ProFund Advisors to financial firms, please see the SAI.
509
Financial Highlights
The following tables are intended to help you understand the financial history of each Fund for the past five years (or since inception, if shorter). Certain information reflects financial results of a single share. The total return information represents the rate of return and the per share operating performance that an investor would have earned (or lost) on an investment in a Fund, assuming reinvestment of all dividends and distributions. This information has been derived from information audited by KPMG LLP, an independent registered public accounting firm, whose report, along with the financial statements of a Fund, appears in the Annual Report of each Fund and is available upon request.
510 :: Financial Highlights
ProFunds Financial Highlights FOR THE PERIODS INDICATED
Selected data for a share of beneficial interest outstanding throughout the periods indicated.
Selected data for a share of beneficial interest outstanding throughout the periods indicated.
|
|
|
Investment Activities |
Distributions to
Shareholders From |
|
|
Ratios to Average Net Assets |
Supplemental Data | ||||||||
|
|
Net Asset
Value,
Beginning
of Period |
Net
Investment
Income
(Loss)(a)
|
Net Realized
and
Unrealized
Gains
(Losses) on
Investments |
Total from
Investment
Activities |
Net
Investment
Income |
In excess
of net
investment
income |
Return
of Capital |
Total
Distributions |
Net
Asset
Value,
End of
Period |
Total
Return |
Gross
Expenses |
Net
Expenses |
Net
Investment
Income
(Loss) |
Net Assets,
End of Period
(000’s) |
Portfolio
Turnover
Rate(b)
|
|
Access Flex Bear High Yield ProFund
Investor Class | |||||||||||||||
|
Year Ended July 31, 2022 |
$29.93 |
(0.43) |
2.21 |
1.78 |
— |
— |
— |
— |
$31.71 |
5.95% |
3.15% |
1.78% |
(1.36)% |
$2,189 |
— |
|
Nine Months Ended July 31, 2021
(unaudited) |
$33.20 |
(0.41) |
(2.86) |
(3.27) |
— |
— |
— |
— |
$29.93 |
(9.80)% |
9.92%(c) |
1.78%(c) |
(1.78)%(c) |
$445 |
— |
|
Year Ended October 31, 2020 |
$33.78 |
(0.53) |
(0.05) |
(0.58) |
— |
— |
— |
— |
$33.20 |
(1.72)% |
5.56% |
1.78% |
(1.56)% |
$845 |
— |
|
Year Ended October 31, 2019 |
$37.85 |
(0.21) |
(3.86) |
(4.07) |
— |
— |
— |
— |
$33.78 |
(10.75)% |
5.99% |
1.78% |
(0.60)% |
$807 |
— |
|
Year Ended October 31, 2018 |
$38.27 |
(0.35) |
(0.07) |
(0.42) |
— |
— |
— |
— |
$37.85 |
(1.10)% |
5.42% |
1.78% |
(0.92)% |
$591 |
— |
|
Year Ended October 31, 2017(d) |
$40.76 |
(0.50) |
(1.99) |
(2.49) |
— |
— |
— |
— |
$38.27 |
(6.09)%(e) |
4.18% |
1.78% |
(1.30)% |
$671 |
— |
|
Service Class | |||||||||||||||
|
Year Ended July 31, 2022 |
$25.68 |
(0.69) |
1.95 |
1.26 |
— |
— |
— |
— |
$26.94 |
4.86% |
4.15% |
2.78% |
(2.36)% |
$28 |
— |
|
Nine Months Ended July 31, 2021
(unaudited) |
$28.71 |
(0.61) |
(2.42) |
(3.03) |
— |
— |
— |
— |
$25.68 |
(10.45)% |
10.92%(c) |
2.78%(c) |
(2.78)%(c) |
$11 |
— |
|
Year Ended October 31, 2020 |
$29.49 |
(0.82) |
0.04 |
(0.78) |
— |
— |
— |
— |
$28.71 |
(2.64)% |
6.56% |
2.78% |
(2.56)% |
$14 |
— |
|
Year Ended October 31, 2019 |
$33.40 |
(0.53) |
(3.38) |
(3.91) |
— |
— |
— |
— |
$29.49 |
(11.70)% |
6.99% |
2.78% |
(1.60)% |
$33 |
— |
|
Year Ended October 31, 2018 |
$34.11 |
(0.69) |
(0.02) |
(0.07) |
— |
— |
— |
— |
$33.40 |
(2.05)% |
6.42% |
2.78% |
(1.92)% |
$38 |
— |
|
Year Ended October 31, 2017(d) |
$36.49 |
(0.85) |
(1.53) |
(2.38) |
— |
— |
— |
— |
$34.11 |
(6.55)%(e) |
5.18% |
2.78% |
(2.30)% |
$116 |
— |
|
Access Flex High Yield ProFund
Investor Class | |||||||||||||||
|
Year Ended July 31, 2022 |
$32.91 |
(0.25) |
(2.65) |
(2.90) |
— |
(0.13) |
— |
(0.13) |
$29.88 |
(8.85)% |
1.78% |
1.78% |
(0.81)% |
$9,819 |
1,259% |
|
Nine Months Ended July 31, 2021
(unaudited) |
$31.65 |
(0.34) |
2.41 |
2.07 |
— |
(0.81) |
— |
(0.81) |
$32.91 |
6.63% |
1.97%(c) |
1.78%(c) |
(1.39)%(c) |
$13,252 |
944%(f) |
|
Year Ended October 31, 2020 |
$34.28 |
(0.39) |
(0.98) |
(1.37) |
— |
(1.14) |
(0.12) |
(1.26) |
$31.65 |
(4.05)% |
2.07% |
1.88% |
(1.17)% |
$17,557 |
1,534% |
|
Year Ended October 31, 2019 |
$32.40 |
0.06 |
3.20 |
3.26 |
(0.06) |
(1.32) |
— |
(1.38) |
$34.28 |
10.26% |
1.90% |
1.90% |
0.19% |
$19,823 |
1,362% |
|
Year Ended October 31, 2018 |
$33.54 |
0.11 |
(0.18) |
(0.07) |
(0.11) |
(0.69) |
(0.27) |
(1.07) |
$32.40 |
(0.21)% |
1.77% |
1.77% |
0.35% |
$25,909 |
1,334% |
|
Year Ended October 31, 2017 |
$32.66 |
(0.16) |
2.27 |
2.11 |
— |
(1.23) |
— |
(1.23) |
$33.54 |
6.58%(g) |
1.81% |
1.81% |
(0.49)% |
$25,367 |
1,517% |
|
Service Class | |||||||||||||||
|
Year Ended July 31, 2022 |
$32.53 |
(0.56) |
(2.61) |
(3.17) |
— |
(0.05) |
— |
(0.05) |
$29.31 |
(9.77)% |
2.78% |
2.78% |
(1.81)% |
$3,259 |
1,259% |
|
Nine Months Ended July 31, 2021
(unaudited) |
$31.33 |
(0.59) |
2.40 |
1.81 |
— |
(0.61) |
— |
(0.61) |
$32.53 |
5.81% |
2.97%(c) |
2.78%(c) |
(2.39)%(c) |
$3,527 |
944%(f) |
|
Year Ended October 31, 2020 |
$33.80 |
(0.71) |
(0.96) |
(1.67) |
— |
(0.72) |
(0.08) |
(0.80) |
$31.33 |
(4.98)% |
3.07% |
2.88% |
(2.17)% |
$2,806 |
1,534% |
|
Year Ended October 31, 2019 |
$32.03 |
(0.27) |
3.15 |
2.88 |
— |
(1.11) |
— |
(1.11) |
$33.80 |
9.12% |
2.90% |
2.90% |
(0.81)% |
$4,820 |
1,362% |
|
Year Ended October 31, 2018 |
$32.80 |
(0.21) |
(0.17) |
(0.38) |
— |
(0.29) |
(0.10) |
(0.39) |
$32.03 |
(1.15)% |
2.77% |
2.77% |
(0.65)% |
$2,648 |
1,334% |
|
Year Ended October 31, 2017 |
$31.89 |
(0.48) |
2.22 |
1.74 |
— |
(0.83) |
— |
(0.83) |
$32.80 |
5.54%(g) |
2.81% |
2.81% |
(1.49)% |
$5,326 |
1,517% |
(a)
Per share net investment income (loss) has been calculated using the average daily shares method.
(b)
Portfolio turnover rate is calculated without regard to instruments having a maturity of less than one year from acquisition or derivative instruments (including swap agreements and futures contracts.) The portfolio turnover rate can be high and volatile due to the amount and timing of sales and purchases of fund shares during the period. Portfolio turnover rate is calculated on the basis of the Fund as a whole without distinguishing between classes of shares issued.
(c)
Annualized for periods less than one year.
(d)
As described in Note 9 of the Notes to Financial Statements in the most recent Annual Report, adjusted for 1:5 reverse share split that occurred on December 5, 2016.
(e)
During the year ended October 31, 2017, the Fund received monies related to certain nonrecurring litigation settlements. The corresponding impact to the total return was an increase of 3.30%.
(f)
Not annualized for periods less than one year.
Financial Highlights :: 511
ProFunds Financial Highlights FOR THE PERIODS INDICATED
Selected data for a share of beneficial interest outstanding throughout the periods indicated.
Selected data for a share of beneficial interest outstanding throughout the periods indicated.
(g)
During the year ended October 31, 2017, the Fund received monies related to certain nonrecurring litigation settlements. The corresponding impact to the total return was an increase of 0.76%.
512 :: Financial Highlights
ProFunds Financial Highlights FOR THE PERIODS INDICATED
Selected data for a share of beneficial interest outstanding throughout the periods indicated.
Selected data for a share of beneficial interest outstanding throughout the periods indicated.
|
|
|
Investment Activities |
Distributions to
Shareholders From |
|
|
Ratios to Average Net Assets |
Supplemental Data | |||||||
|
|
Net Asset
Value,
Beginning
of Period |
Net
Investment
Income
(Loss)(a)
|
Net Realized
and
Unrealized
Gains
(Losses) on
Investments |
Total from
Investment
Activities |
Net
Investment
Income |
Net
Realized
Gain on
Investments |
Total
Distributions |
Net
Asset
Value,
End of
Period |
Total
Return |
Gross
Expenses |
Net
Expenses |
Net
Investment
Income
(Loss) |
Net Assets,
End of Period
(000’s) |
Portfolio
Turnover
Rate(b)
|
|
Banks UltraSector ProFund
Investor Class | ||||||||||||||
|
Year Ended July 31, 2022 |
$56.72 |
0.08 |
(11.46) |
(11.38) |
— |
— |
— |
$45.34 |
(20.05)% |
1.71% |
1.71% |
0.13% |
$7,788 |
73% |
|
Year Ended July 31, 2021 |
$28.48 |
0.23 |
28.01 |
28.24 |
— |
— |
— |
$56.72 |
99.16% |
1.53% |
1.53% |
0.43% |
$122,655 |
144% |
|
Year Ended July 31, 2020 |
$50.38 |
0.47 |
(22.14) |
(21.67) |
(0.23) |
— |
(0.23) |
$28.48 |
(43.26)% |
1.72% |
1.72% |
1.00% |
$7,348 |
260% |
|
Year Ended July 31, 2019 |
$54.83 |
0.42 |
(4.28) |
(3.86) |
(0.59) |
— |
(0.59) |
$50.38 |
(6.69)% |
1.80% |
1.80% |
0.88% |
$9,484 |
75% |
|
Year Ended July 31, 2018 |
$44.79 |
0.16 |
9.88 |
10.04 |
— |
— |
— |
$54.83 |
22.39% |
1.54% |
1.54% |
0.30% |
$18,887 |
293% |
|
Service Class | ||||||||||||||
|
Year Ended July 31, 2022 |
$51.99 |
(0.48) |
(10.37) |
(10.85) |
— |
— |
— |
$41.14 |
(20.85)% |
2.71% |
2.71% |
(0.87)% |
$452 |
73% |
|
Year Ended July 31, 2021 |
$26.38 |
(0.19) |
25.80 |
25.61 |
— |
— |
— |
$51.99 |
97.08% |
2.53% |
2.53% |
(0.57)% |
$925 |
144% |
|
Year Ended July 31, 2020 |
$46.98 |
0.13 |
(20.73) |
(20.60) |
— |
— |
— |
$26.38 |
(43.84)% |
2.72% |
2.72% |
—(c) |
$300 |
260% |
|
Year Ended July 31, 2019 |
$50.85 |
(0.03) |
(3.84) |
(3.87) |
— |
— |
— |
$46.98 |
(7.63)% |
2.80% |
2.80% |
(0.12)% |
$769 |
75% |
|
Year Ended July 31, 2018 |
$41.95 |
(0.33) |
9.23 |
8.90 |
— |
— |
— |
$50.85 |
21.22% |
2.54% |
2.54% |
(0.70)% |
$964 |
293% |
|
Basic Materials UltraSector ProFund
Investor Class | ||||||||||||||
|
Year Ended July 31, 2022 |
$101.46 |
(0.29) |
(8.88) |
(9.17) |
— |
— |
— |
$92.29 |
(9.03)% |
1.93% |
1.89% |
(0.28)% |
$4,652 |
194% |
|
Year Ended July 31, 2021 |
$63.17 |
(0.16) |
38.67 |
38.51 |
(0.01) |
(0.21) |
(0.22) |
$101.46 |
61.04% |
1.82% |
1.78% |
(0.19)% |
$10,709 |
698% |
|
Year Ended July 31, 2020 |
$63.98 |
0.08 |
(0.89) |
(0.81) |
— |
— |
— |
$63.17 |
(1.25)% |
2.43% |
1.85% |
0.15% |
$2,897 |
62% |
|
Year Ended July 31, 2019 |
$74.26 |
0.12 |
(10.40) |
(10.28) |
— |
— |
— |
$63.98 |
(13.84)% |
2.15% |
2.05%(d) |
0.19% |
$4,637 |
179% |
|
Year Ended July 31, 2018 |
$63.66 |
(0.11) |
10.71 |
10.60 |
— |
— |
— |
$74.26 |
16.65% |
1.67% |
1.67% |
(0.15)% |
$7,427 |
460% |
|
Service Class | ||||||||||||||
|
Year Ended July 31, 2022 |
$88.60 |
(1.18) |
(7.60) |
(8.78) |
— |
— |
— |
$79.82 |
(9.91)% |
2.93% |
2.89% |
(1.28)% |
$510 |
194% |
|
Year Ended July 31, 2021 |
$55.74 |
(0.92) |
33.99 |
33.07 |
— |
(0.21) |
(0.21) |
$88.60 |
59.44% |
2.82% |
2.78% |
(1.19)% |
$983 |
698% |
|
Year Ended July 31, 2020 |
$57.02 |
(0.44) |
(0.84) |
(1.28) |
— |
— |
— |
$55.74 |
(2.24)% |
3.43% |
2.85% |
(0.85)% |
$278 |
62% |
|
Year Ended July 31, 2019 |
$66.85 |
(0.45) |
(9.38) |
(9.83) |
— |
— |
— |
$57.02 |
(14.72)% |
3.15% |
3.05%(d) |
(0.81)% |
$316 |
179% |
|
Year Ended July 31, 2018 |
$57.88 |
(0.77) |
9.74 |
8.97 |
— |
— |
— |
$66.85 |
15.49% |
2.67% |
2.67% |
(1.15)% |
$601 |
460% |
(a)
Per share net investment income (loss) has been calculated using the average daily shares method.
(b)
Portfolio turnover rate is calculated without regard to instruments having a maturity of less than one year from acquisition or derivative instruments (including swap agreements and futures contracts.) The portfolio turnover rate can be high and volatile due to the amount and timing of sales and purchases of fund shares during the period. Portfolio turnover rate is calculated on the basis of the Fund as a whole without distinguishing between classes of shares issued.
(c)
Amount is less than 0.005%.
(d)
The expense ratio does not correlate to the applicable expense limits in place during the period given that the annual contractual expense limitation is applied for the one year periods ended November 30th of each year, instead of coinciding with the July 31st year end. Details of the current expense limitation in effect can be found in the Trust’s annual report dated July 31, 2022.
Financial Highlights :: 513
ProFunds Financial Highlights FOR THE PERIODS INDICATED
Selected data for a share of beneficial interest outstanding throughout the periods indicated.
Selected data for a share of beneficial interest outstanding throughout the periods indicated.
|
|
|
Investment Activities |
Distributions to
Shareholders From |
|
|
Ratios to Average Net Assets |
Supplemental Data | |||||||
|
|
Net Asset
Value,
Beginning
of Period |
Net
Investment
Income
(Loss)(a)
|
Net Realized
and
Unrealized
Gains
(Losses) on
Investments |
Total from
Investment
Activities |
Net
Investment
Income |
Net
Realized
Gain on
Investments |
Total
Distributions |
Net
Asset
Value,
End of
Period |
Total
Return |
Gross
Expenses |
Net
Expenses |
Net
Investment
Income
(Loss) |
Net Assets,
End of Period
(000’s) |
Portfolio
Turnover
Rate(b)
|
|
Bear ProFund
Investor Class | ||||||||||||||
|
Year Ended July 31, 2022 |
$16.01 |
(0.18) |
0.18 |
—(c)
|
— |
— |
— |
$16.01 |
—(d)
|
1.64% |
1.64% |
(1.13)% |
$12,126 |
— |
|
Year Ended July 31, 2021 |
$22.67 |
(0.33) |
(6.32) |
(6.65) |
(0.01) |
— |
(0.01) |
$16.01 |
(29.33)% |
1.74% |
1.74% |
(1.73)% |
$9,799 |
— |
|
Year Ended July 31, 2020 |
$28.37 |
(0.25) |
(5.38) |
(5.63) |
(0.07) |
— |
(0.07) |
$22.67 |
(19.87)% |
1.86% |
1.86% |
(0.95)% |
$15,698 |
— |
|
Year Ended July 31, 2019 |
$30.45 |
0.14 |
(2.22) |
(2.08) |
— |
— |
— |
$28.37 |
(6.83)% |
1.77% |
1.77% |
0.48% |
$19,388 |
— |
|
Year Ended July 31, 2018 |
$35.46 |
(0.11) |
(4.90) |
(5.01) |
— |
— |
— |
$30.45 |
(14.13)% |
1.59% |
1.59% |
(0.34)% |
$12,790 |
— |
|
Service Class | ||||||||||||||
|
Year Ended July 31, 2022 |
$14.56 |
(0.33) |
0.19 |
(0.14) |
— |
— |
— |
$14.42 |
(0.96)% |
2.64% |
2.64% |
(2.13)% |
$564 |
— |
|
Year Ended July 31, 2021 |
$20.82 |
(0.51) |
(5.75) |
(6.26) |
— |
— |
— |
$14.56 |
(30.07)% |
2.74% |
2.74% |
(2.73)% |
$789 |
— |
|
Year Ended July 31, 2020 |
$26.23 |
(0.50) |
(4.91) |
(5.41) |
— |
— |
— |
$20.82 |
(20.63)% |
2.86% |
2.86% |
(1.95)% |
$677 |
— |
|
Year Ended July 31, 2019 |
$28.44 |
(0.14) |
(2.07) |
(2.21) |
— |
— |
— |
$26.23 |
(7.77)% |
2.77% |
2.77% |
(0.52)% |
$761 |
— |
|
Year Ended July 31, 2018 |
$33.46 |
(0.42) |
(4.60) |
(5.02) |
— |
— |
— |
$28.44 |
(15.00)% |
2.59% |
2.59% |
(1.34)% |
$659 |
— |
|
Biotechnology UltraSector ProFund
Investor Class | ||||||||||||||
|
Year Ended July 31, 2022 |
$85.26 |
(0.24) |
(15.49) |
(15.73) |
— |
(12.79) |
(12.79) |
$56.74 |
(20.96)% |
1.49% |
1.49% |
(0.37)% |
$119,791 |
28% |
|
Year Ended July 31, 2021 |
$72.23 |
(0.27) |
21.37 |
21.10 |
— |
(8.07) |
(8.07) |
$85.26 |
32.02% |
1.55% |
1.55% |
(0.37)% |
$168,280 |
62% |
|
Year Ended July 31, 2020 |
$51.90 |
(0.06) |
22.42 |
22.36 |
— |
(2.03) |
(2.03) |
$72.23 |
43.62% |
1.61% |
1.61% |
(0.10)% |
$188,065 |
52% |
|
Year Ended July 31, 2019 |
$66.16 |
0.11 |
(11.50) |
(11.39) |
— |
(2.87) |
(2.87) |
$51.90 |
(17.10)% |
1.52% |
1.52% |
0.19% |
$161,970 |
23% |
|
Year Ended July 31, 2018 |
$63.85 |
(0.05) |
6.85 |
6.80 |
— |
(4.49) |
(4.49) |
$66.16 |
10.94% |
1.43% |
1.43% |
(0.08)% |
$246,238 |
11% |
|
Service Class | ||||||||||||||
|
Year Ended July 31, 2022 |
$61.86 |
(0.71) |
(10.53) |
(11.24) |
— |
(12.79) |
(12.79) |
$37.83 |
(21.75)% |
2.49% |
2.49% |
(1.37)% |
$3,734 |
28% |
|
Year Ended July 31, 2021 |
$55.00 |
(0.80) |
15.73 |
14.93 |
— |
(8.07) |
(8.07) |
$61.86 |
30.74% |
2.54% |
2.54% |
(1.36)% |
$5,358 |
62% |
|
Year Ended July 31, 2020 |
$40.29 |
(0.52) |
17.26 |
16.74 |
— |
(2.03) |
(2.03) |
$55.00 |
42.20% |
2.60% |
2.60% |
(1.09)% |
$5,999 |
52% |
|
Year Ended July 31, 2019 |
$52.66 |
(0.35) |
(9.15) |
(9.50) |
— |
(2.87) |
(2.87) |
$40.29 |
(17.93)% |
2.52% |
2.52% |
(0.80)% |
$5,559 |
23% |
|
Year Ended July 31, 2018 |
$52.18 |
(0.58) |
5.55 |
4.97 |
— |
(4.49) |
(4.49) |
$52.66 |
9.83% |
2.43% |
2.43% |
(1.08)% |
$9,183 |
11% |
(a)
Per share net investment income (loss) has been calculated using the average daily shares method.
(b)
Portfolio turnover rate is calculated without regard to instruments having a maturity of less than one year from acquisition or derivative instruments (including swap agreements and futures contracts.) The portfolio turnover rate can be high and volatile due to the amount and timing of sales and purchases of fund shares during the period. Portfolio turnover rate is calculated on the basis of the Fund as a whole without distinguishing between classes of shares issued.
(c)
Amount is less than $0.005.
(d)
Amount is less than 0.005%.
514 :: Financial Highlights
ProFunds Financial Highlights FOR THE PERIODS INDICATED
Selected data for a share of beneficial interest outstanding throughout the periods indicated.
Selected data for a share of beneficial interest outstanding throughout the periods indicated.
|
|
|
Investment Activities |
Distributions to
Shareholders From |
|
|
Ratios to Average Net Assets |
Supplemental Data | |||||||
|
|
Net Asset
Value,
Beginning
of Period |
Net
Investment
Income
(Loss)(a)
|
Net Realized
and
Unrealized
Gains
(Losses) on
Investments |
Total from
Investment
Activities |
Net
Investment
Income |
Net
Realized
Gain on
Investments |
Total
Distributions |
Net
Asset
Value,
End of
Period |
Total
Return |
Gross
Expenses |
Net
Expenses |
Net
Investment
Income
(Loss) |
Net Assets,
End of Period
(000’s) |
Portfolio
Turnover
Rate(b)
|
|
Bull ProFund
Investor Class | ||||||||||||||
|
Year Ended July 31, 2022 |
$61.91 |
(0.27) |
(3.27) |
(3.54) |
— |
(5.48) |
(5.48) |
$52.89 |
(6.39)% |
1.50% |
1.50% |
(0.49)% |
$33,168 |
58% |
|
Year Ended July 31, 2021 |
$48.91 |
(0.24) |
16.31 |
16.07 |
(0.16) |
(2.91) |
(3.07) |
$61.91 |
34.03% |
1.55% |
1.55% |
(0.45)% |
$56,064 |
15% |
|
Year Ended July 31, 2020(c)
|
$45.33 |
(0.01) |
4.39 |
4.38 |
(0.18) |
(0.62) |
(0.80) |
$48.91 |
9.68% |
1.63% |
1.63% |
(0.01)% |
$72,210 |
84% |
|
Year Ended July 31, 2019(c) |
$42.99 |
0.23 |
2.35 |
2.58 |
— |
(0.24) |
(0.24) |
$45.33 |
5.99% |
1.54% |
1.54% |
0.54% |
$61,121 |
3% |
|
Year Ended July 31, 2018(c) |
$37.65 |
0.08 |
5.26 |
5.34 |
— |
— |
— |
$42.99 |
14.20% |
1.44% |
1.44% |
0.21% |
$47,074 |
26% |
|
Service Class | ||||||||||||||
|
Year Ended July 31, 2022 |
$49.77 |
(0.72) |
(2.48) |
(3.20) |
— |
(5.48) |
(5.48) |
$41.09 |
(7.32)% |
2.50% |
2.50% |
(1.49)% |
$10,669 |
58% |
|
Year Ended July 31, 2021 |
$40.09 |
(0.68) |
13.27 |
12.59 |
— |
(2.91) |
(2.91) |
$49.77 |
32.73% |
2.55% |
2.55% |
(1.45)% |
$7,148 |
15% |
|
Year Ended July 31, 2020(c) |
$37.50 |
(0.38) |
3.59 |
3.21 |
— |
(0.62) |
(0.62) |
$40.09 |
8.57% |
2.63% |
2.63% |
(1.01)% |
$5,327 |
84% |
|
Year Ended July 31, 2019(c) |
$35.96 |
(0.12) |
1.90 |
1.78 |
— |
(0.24) |
(0.24) |
$37.50 |
4.93% |
2.54% |
2.54% |
(0.45)% |
$4,232 |
3% |
|
Year Ended July 31, 2018(c) |
$31.80 |
(0.25) |
4.41 |
4.16 |
— |
— |
— |
$35.96 |
13.08% |
2.43% |
2.43% |
(0.78)% |
$4,676 |
26% |
|
Communication Services UltraSector ProFund
Investor Class | ||||||||||||||
|
Year Ended July 31, 2022 |
$172.73 |
(1.45) |
(76.75) |
(78.20) |
— |
(1.17) |
(1.17) |
$93.36 |
(45.54)% |
1.94% |
1.78% |
(1.04)% |
$4,623 |
63% |
|
Year Ended July 31, 2021 |
$104.67 |
(1.61) |
69.67 |
68.06 |
— |
— |
— |
$172.73 |
65.05% |
1.91% |
1.82% |
(1.17)% |
$11,327 |
138% |
|
Year Ended July 31, 2020 |
$92.86 |
(0.99) |
15.68 |
14.69 |
(2.88) |
— |
(2.88) |
$104.67 |
16.07% |
2.37% |
2.11%(d) |
(1.08)% |
$5,587 |
82% |
|
Year Ended July 31, 2019 |
$72.76 |
2.15 |
17.95 |
20.10 |
— |
— |
— |
$92.86 |
27.62% |
1.62% |
1.62% |
2.51% |
$10,109 |
805% |
|
Year Ended July 31, 2018 |
$72.31 |
0.03 |
0.42 |
0.45 |
— |
— |
— |
$72.76 |
0.62% |
2.22% |
1.78% |
0.05% |
$5,680 |
818% |
|
Service Class | ||||||||||||||
|
Year Ended July 31, 2022 |
$140.52 |
(2.58) |
(61.74) |
(64.32) |
— |
(1.17) |
(1.17) |
$75.03 |
(46.09)% |
2.94% |
2.78% |
(2.04)% |
$106 |
63% |
|
Year Ended July 31, 2021 |
$85.98 |
(2.72) |
57.26 |
54.54 |
— |
— |
— |
$140.52 |
63.43% |
2.91% |
2.82% |
(2.17)% |
$205 |
138% |
|
Year Ended July 31, 2020 |
$76.53 |
(1.74) |
12.99 |
11.25 |
(1.80) |
— |
(1.80) |
$85.98 |
14.89% |
3.37% |
3.11%(d) |
(2.08)% |
$153 |
82% |
|
Year Ended July 31, 2019 |
$60.55 |
1.45 |
14.53 |
15.98 |
— |
— |
— |
$76.53 |
26.35% |
2.62% |
2.62% |
1.51% |
$166 |
805% |
|
Year Ended July 31, 2018 |
$60.80 |
(0.54) |
0.29 |
(0.25) |
— |
— |
— |
$60.55 |
(0.38)% |
3.22% |
2.78% |
(0.95)% |
$123 |
818% |
(a)
Per share net investment income (loss) has been calculated using the average daily shares method.
(b)
Portfolio turnover rate is calculated without regard to instruments having a maturity of less than one year from acquisition or derivative instruments (including swap agreements and futures contracts.) The portfolio turnover rate can be high and volatile due to the amount and timing of sales and purchases of fund shares during the period. Portfolio turnover rate is calculated on the basis of the Fund as a whole without distinguishing between classes of shares issued.
(c)
As described in Note 9 of the Notes to Financial Statements in the most recent Annual Report, share amounts have been adjusted for 3:1 share split that occurred on November 18, 2019.
(d)
The expense ratio does not correlate to the applicable expense limits in place during the period given that the annual contractual expense limitation is applied for the one year periods ended November 30th of each year, instead of coinciding with the July 31st year end. Details of the current expense limitation in effect can be found in the Trust’s annual report dated July 31, 2022.
Financial Highlights :: 515
ProFunds Financial Highlights FOR THE PERIODS INDICATED
Selected data for a share of beneficial interest outstanding throughout the periods indicated.
Selected data for a share of beneficial interest outstanding throughout the periods indicated.
|
|
|
Investment Activities |
Distributions to
Shareholders From |
|
|
Ratios to Average Net Assets |
Supplemental Data | |||||||
|
|
Net Asset
Value,
Beginning
of Period |
Net
Investment
Income
(Loss)(a)
|
Net Realized
and
Unrealized
Gains
(Losses) on
Investments |
Total from
Investment
Activities |
Net
Investment
Income |
Net
Realized
Gain on
Investments |
Total
Distributions |
Net
Asset
Value,
End of
Period |
Total
Return |
Gross
Expenses |
Net
Expenses |
Net
Investment
Income
(Loss) |
Net Assets,
End of Period
(000’s) |
Portfolio
Turnover
Rate(b)
|
|
Consumer Goods UltraSector ProFund
Investor Class | ||||||||||||||
|
Year Ended July 31, 2022 |
$91.85 |
(0.44) |
(3.77) |
(4.21) |
— |
(4.39) |
(4.39) |
$83.25 |
(5.34)% |
1.88% |
1.78% |
(0.48)% |
$3,965 |
142% |
|
Year Ended July 31, 2021(c) |
$59.24 |
(0.31) |
32.92 |
32.61 |
— |
— |
— |
$91.85 |
55.06% |
1.88% |
1.78% |
(0.40)% |
$4,950 |
209% |
|
Year Ended July 31, 2020(c) |
$53.09 |
0.23 |
7.52 |
7.75 |
— |
(1.60) |
(1.60) |
$59.24 |
14.68% |
2.08% |
1.78% |
0.44% |
$7,596 |
162% |
|
Year Ended July 31, 2019(c) |
$51.20 |
0.07 |
2.51 |
2.58 |
(0.69) |
— |
(0.69) |
$53.09 |
5.40% |
2.11% |
1.91% |
0.15% |
$4,495 |
46% |
|
Year Ended July 31, 2018(c)
|
$53.04 |
0.23 |
(1.15) |
(0.92) |
(0.04) |
(0.88) |
(0.92) |
$51.20 |
(1.87)% |
1.89% |
1.83% |
0.44% |
$5,321 |
155% |
|
Service Class | ||||||||||||||
|
Year Ended July 31, 2022 |
$81.66 |
(1.27) |
(3.13) |
(4.40) |
— |
(4.39) |
(4.39) |
$72.87 |
(6.25)% |
2.88% |
2.78% |
(1.48)% |
$241 |
142% |
|
Year Ended July 31, 2021(c) |
$53.19 |
(1.01) |
29.48 |
28.47 |
— |
— |
— |
$81.66 |
53.53% |
2.88% |
2.78% |
(1.40)% |
$441 |
209% |
|
Year Ended July 31, 2020(c) |
$48.29 |
(0.25) |
6.75 |
6.50 |
— |
(1.60) |
(1.60) |
$53.19 |
13.53% |
3.08% |
2.78% |
(0.56)% |
$457 |
162% |
|
Year Ended July 31, 2019(c) |
$46.44 |
(0.37) |
2.36 |
1.99 |
(0.14) |
— |
(0.14) |
$48.29 |
4.38% |
3.09% |
2.89% |
(0.83)% |
$391 |
46% |
|
Year Ended July 31, 2018(c) |
$48.62 |
(0.25) |
(1.05) |
(1.30) |
— |
(0.88) |
(0.88) |
$46.44 |
(2.85)% |
2.89% |
2.83% |
(0.56)% |
$699 |
155% |
|
Consumer Services UltraSector ProFund
Investor Class | ||||||||||||||
|
Year Ended July 31, 2022 |
$72.77 |
(0.53) |
(20.66) |
(21.19) |
— |
(5.74) |
(5.74) |
$45.84 |
(31.68)% |
1.54% |
1.54% |
(0.86)% |
$30,510 |
31% |
|
Year Ended July 31, 2021 |
$54.08 |
(0.64) |
21.74 |
21.10 |
— |
(2.41) |
(2.41) |
$72.77 |
39.66% |
1.56% |
1.56% |
(0.97)% |
$76,287 |
130% |
|
Year Ended July 31, 2020(d) |
$46.43 |
(0.24) |
7.89 |
7.65 |
— |
— |
— |
$54.08 |
16.47% |
1.67% |
1.67% |
(0.53)% |
$44,827 |
80% |
|
Year Ended July 31, 2019(d) |
$43.14 |
(0.06) |
5.21 |
5.15 |
— |
(1.86) |
(1.86) |
$46.43 |
13.46% |
1.57% |
1.57% |
(0.13)% |
$90,523 |
106% |
|
Year Ended July 31, 2018(d) |
$34.40 |
(0.09) |
9.58 |
9.49 |
— |
(0.75) |
(0.75) |
$43.14 |
27.92% |
1.52% |
1.52% |
(0.22)% |
$131,835 |
35% |
|
Service Class | ||||||||||||||
|
Year Ended July 31, 2022 |
$60.86 |
(1.04) |
(16.76) |
(17.80) |
— |
(5.74) |
(5.74) |
$37.32 |
(32.37)% |
2.54% |
2.54% |
(1.86)% |
$615 |
31% |
|
Year Ended July 31, 2021 |
$45.99 |
(1.19) |
18.47 |
17.28 |
— |
(2.41) |
(2.41) |
$60.86 |
38.29% |
2.56% |
2.56% |
(1.97)% |
$1,594 |
130% |
|
Year Ended July 31, 2020(d) |
$39.89 |
(0.63) |
6.73 |
6.10 |
— |
— |
— |
$45.99 |
15.30% |
2.67% |
2.67% |
(1.53)% |
$1,595 |
80% |
|
Year Ended July 31, 2019(d) |
$37.73 |
(0.43) |
4.45 |
4.02 |
— |
(1.86) |
(1.86) |
$39.89 |
12.34% |
2.57% |
2.57% |
(1.13)% |
$2,524 |
106% |
|
Year Ended July 31, 2018(d) |
$30.47 |
(0.43) |
8.44 |
8.01 |
— |
(0.75) |
(0.75) |
$37.73 |
26.64% |
2.52% |
2.52% |
(1.22)% |
$5,163 |
35% |
(a)
Per share net investment income (loss) has been calculated using the average daily shares method.
(b)
Portfolio turnover rate is calculated without regard to instruments having a maturity of less than one year from acquisition or derivative instruments (including swap agreements and futures contracts.) The portfolio turnover rate can be high and volatile due to the amount and timing of sales and purchases of fund shares during the period. Portfolio turnover rate is calculated on the basis of the Fund as a whole without distinguishing between classes of shares issued.
(c)
As described in Note 9 of the Notes to Financial Statements in the most recent Annual Report, share amounts have been adjusted for 2:1 share split that occurred on December 14, 2020.
(d)
As described in Note 9 of the Notes to Financial Statements in the most recent Annual Report, share amounts have been adjusted for 3:1 share split that occurred on November 18, 2019.
516 :: Financial Highlights
ProFunds Financial Highlights FOR THE PERIODS INDICATED
Selected data for a share of beneficial interest outstanding throughout the periods indicated.
Selected data for a share of beneficial interest outstanding throughout the periods indicated.
|
|
|
Investment Activities |
Distributions to
Shareholders From |
|
|
Ratios to Average Net Assets |
Supplemental Data | ||||||
|
|
Net Asset
Value,
Beginning
of Period |
Net
Investment
Income
(Loss)(a)
|
Net Realized
and
Unrealized
Gains
(Losses) on
Investments |
Total from
Investment
Activities |
Net
Investment
Income |
Total
Distributions |
Net
Asset
Value,
End of
Period |
Total
Return |
Gross
Expenses |
Net
Expenses |
Net
Investment
Income
(Loss) |
Net Assets,
End of Period
(000’s) |
Portfolio
Turnover
Rate(b)
|
|
Europe 30 ProFund
Investor Class | |||||||||||||
|
Year Ended July 31, 2022 |
$13.97 |
0.23 |
(1.10) |
(0.87) |
(0.12) |
(0.12) |
$12.98 |
(6.25)% |
2.32% |
1.78% |
1.68% |
$4,540 |
954% |
|
Year Ended July 31, 2021 |
$10.91 |
0.13 |
3.23 |
3.36 |
(0.30) |
(0.30) |
$13.97 |
31.39% |
2.15% |
1.78% |
1.03% |
$3,190 |
522% |
|
Year Ended July 31, 2020 |
$12.56 |
0.16 |
(1.70) |
(1.54) |
(0.11) |
(0.11) |
$10.91 |
(12.42)% |
2.20% |
1.78% |
1.35% |
$4,306 |
1,122% |
|
Year Ended July 31, 2019 |
$14.58 |
0.25 |
(0.86) |
(0.61) |
(1.41) |
(1.41) |
$12.56 |
(3.95)%(c)
|
2.23% |
1.78% |
1.96% |
$4,997 |
1,311% |
|
Year Ended July 31, 2018 |
$13.99 |
0.17 |
0.56 |
0.73 |
(0.14) |
(0.14) |
$14.58 |
5.30%(d)
|
1.87% |
1.75% |
1.19% |
$3,109 |
540% |
|
Service Class | |||||||||||||
|
Year Ended July 31, 2022 |
$15.25 |
0.08 |
(1.16) |
(1.08) |
(0.12) |
(0.12) |
$14.05 |
(7.11)% |
3.32% |
2.78% |
0.68% |
$187 |
954% |
|
Year Ended July 31, 2021 |
$11.90 |
(0.01) |
3.54 |
3.53 |
(0.18) |
(0.18) |
$15.25 |
30.05% |
3.15% |
2.78% |
0.03% |
$212 |
522% |
|
Year Ended July 31, 2020 |
$13.74 |
0.03 |
(1.87) |
(1.84) |
— |
— |
$11.90 |
(13.46)% |
3.20% |
2.78% |
0.35% |
$159 |
1,122% |
|
Year Ended July 31, 2019 |
$15.32 |
0.11 |
(0.83) |
(0.72) |
(0.86) |
(0.86) |
$13.74 |
(4.80)%(c)
|
3.23% |
2.78% |
0.96% |
$265 |
1,311% |
|
Year Ended July 31, 2018 |
$14.72 |
0.02 |
0.58 |
0.60 |
— |
— |
$15.32 |
4.14%(d) |
2.87% |
2.75% |
0.19% |
$328 |
540% |
|
Falling U.S. Dollar ProFund
Investor Class | |||||||||||||
|
Year Ended July 31, 2022 |
$16.23 |
(0.23) |
(2.19) |
(2.42) |
— |
— |
$13.81 |
(14.85)% |
4.94% |
1.78% |
(1.53)% |
$750 |
— |
|
Year Ended July 31, 2021 |
$16.41 |
(0.29) |
0.11(e) |
(0.18) |
— |
— |
$16.23 |
(1.10)% |
3.20% |
1.78% |
(1.77)% |
$1,240 |
— |
|
Year Ended July 31, 2020 |
$15.97 |
(0.12) |
0.56 |
0.44 |
— |
— |
$16.41 |
2.76% |
5.66% |
1.78% |
(0.78)% |
$1,230 |
— |
|
Year Ended July 31, 2019 |
$17.03 |
0.08 |
(1.14) |
(1.06) |
— |
— |
$15.97 |
(6.22)% |
2.98% |
1.78% |
0.48% |
$1,000 |
— |
|
Year Ended July 31, 2018 |
$17.77 |
(0.08) |
(0.66) |
(0.74) |
— |
— |
$17.03 |
(4.16)% |
2.96% |
1.78% |
(0.44)% |
$1,255 |
— |
|
Service Class | |||||||||||||
|
Year Ended July 31, 2022 |
$14.71 |
(0.37) |
(1.90) |
(2.27) |
— |
— |
$12.44 |
(15.80)% |
5.94% |
2.78% |
(2.53)% |
$3 |
— |
|
Year Ended July 31, 2021 |
$15.05 |
(0.44) |
0.10(e) |
(0.34) |
— |
— |
$14.71 |
(2.12)% |
4.20% |
2.78% |
(2.77)% |
$2 |
— |
|
Year Ended July 31, 2020 |
$14.81 |
(0.27) |
0.51 |
0.24 |
— |
— |
$15.05 |
1.82% |
6.66% |
2.78% |
(1.78)% |
$2 |
— |
|
Year Ended July 31, 2019 |
$15.93 |
(0.08) |
(1.04) |
(1.12) |
— |
— |
$14.81 |
(7.09)% |
3.98% |
2.78% |
(0.52)% |
$7 |
— |
|
Year Ended July 31, 2018 |
$16.78 |
(0.24) |
(0.61) |
(0.85) |
— |
— |
$15.93 |
(5.07)% |
3.96% |
2.78% |
(1.44)% |
$744 |
— |
(a)
Per share net investment income (loss) has been calculated using the average daily shares method.
(b)
Portfolio turnover rate is calculated without regard to instruments having a maturity of less than one year from acquisition or derivative instruments (including swap agreements and futures contracts.) The portfolio turnover rate can be high and volatile due to the amount and timing of sales and purchases of fund shares during the period. Portfolio turnover rate is calculated on the basis of the Fund as a whole without distinguishing between classes of shares issued.
(c)
During the year ended July 31, 2019, the ProFund received monies related to certain nonrecurring litigation settlements. The corresponding impact to the total return was an increase of 2.65%.
(d)
During the year ended July 31, 2018, the ProFund received monies related to certain nonrecurring litigation settlements. The corresponding impact to the total return was an increase of 0.44%.
(e)
The amount shown for a share outstanding throughout the period does not accord with the change in aggregate gains and losses in the portfolio of securities during the period because of the timing of sales and purchases of fund shares in relation to fluctuating market values during the period.
Financial Highlights :: 517
ProFunds Financial Highlights FOR THE PERIODS INDICATED
Selected data for a share of beneficial interest outstanding throughout the periods indicated.
Selected data for a share of beneficial interest outstanding throughout the periods indicated.
|
|
|
Investment Activities |
Distributions to
Shareholders From |
|
|
Ratios to Average Net Assets |
Supplemental Data | |||||||
|
|
Net Asset
Value,
Beginning
of Period |
Net
Investment
Income
(Loss)(a)
|
Net Realized
and
Unrealized
Gains
(Losses) on
Investments |
Total from
Investment
Activities |
Net
Investment
Income |
Net
Realized
Gain on
Investments |
Total
Distributions |
Net
Asset
Value,
End of
Period |
Total
Return |
Gross
Expenses |
Net
Expenses |
Net
Investment
Income
(Loss) |
Net Assets,
End of Period
(000’s) |
Portfolio
Turnover
Rate(b)
|
|
Financials UltraSector ProFund
Investor Class | ||||||||||||||
|
Year Ended July 31, 2022 |
$32.99 |
(0.13) |
(3.52) |
(3.65) |
— |
(2.40) |
(2.40) |
$26.94 |
(12.30)% |
1.73% |
1.72% |
(0.41)% |
$5,211 |
306% |
|
Year Ended July 31, 2021 |
$19.18 |
(0.11) |
13.92 |
13.81 |
— |
— |
— |
$32.99 |
72.00% |
1.79% |
1.75% |
(0.38)% |
$11,499 |
650% |
|
Year Ended July 31, 2020 |
$24.82 |
0.03 |
(5.21) |
(5.18) |
(0.46) |
— |
(0.46) |
$19.18 |
(21.40)% |
1.87% |
1.84% |
0.13% |
$4,239 |
271% |
|
Year Ended July 31, 2019 |
$23.18 |
0.13 |
1.51 |
1.64 |
— |
— |
— |
$24.82 |
7.07% |
1.72% |
1.72% |
0.56% |
$39,881 |
394% |
|
Year Ended July 31, 2018 |
$19.90 |
0.01 |
3.27 |
3.28 |
— |
— |
— |
$23.18 |
16.48% |
1.66% |
1.66% |
0.06% |
$9,238 |
360% |
|
Service Class | ||||||||||||||
|
Year Ended July 31, 2022 |
$27.76 |
(0.40) |
(2.82) |
(3.22) |
— |
(2.40) |
(2.40) |
$22.14 |
(13.15)% |
2.73% |
2.72% |
(1.41)% |
$535 |
306% |
|
Year Ended July 31, 2021 |
$16.31 |
(0.33) |
11.78 |
11.45 |
— |
— |
— |
$27.76 |
70.20% |
2.79% |
2.75% |
(1.38)% |
$675 |
650% |
|
Year Ended July 31, 2020 |
$21.11 |
(0.16) |
(4.48) |
(4.64) |
(0.16) |
— |
(0.16) |
$16.31 |
(22.20)% |
2.87% |
2.84% |
(0.87)% |
$443 |
271% |
|
Year Ended July 31, 2019 |
$19.91 |
(0.07) |
1.27 |
1.20 |
— |
— |
— |
$21.11 |
5.97% |
2.72% |
2.72% |
(0.44)% |
$1,326 |
394% |
|
Year Ended July 31, 2018 |
$17.27 |
(0.18) |
2.82 |
2.64 |
— |
— |
— |
$19.91 |
15.34% |
2.66% |
2.66% |
(0.94)% |
$811 |
360% |
|
Health Care UltraSector ProFund
Investor Class | ||||||||||||||
|
Year Ended July 31, 2022 |
$106.01 |
(0.51) |
(5.70) |
(6.21) |
— |
— |
— |
$99.80 |
(5.85)% |
1.61% |
1.61% |
(0.50)% |
$16,631 |
110% |
|
Year Ended July 31, 2021 |
$75.52 |
(0.50) |
30.99 |
30.49 |
— |
— |
— |
$106.01 |
40.37% |
1.73% |
1.73% |
(0.59)% |
$40,753 |
226% |
|
Year Ended July 31, 2020 |
$61.57 |
(0.19) |
14.17 |
13.98 |
(0.03) |
— |
(0.03) |
$75.52 |
22.71% |
1.78% |
1.78% |
(0.28)% |
$46,004 |
201% |
|
Year Ended July 31, 2019 |
$60.66 |
0.10 |
0.83 |
0.93 |
(0.02) |
— |
(0.02) |
$61.57 |
1.54% |
1.58% |
1.58% |
0.16% |
$14,650 |
226% |
|
Year Ended July 31, 2018 |
$56.25 |
(0.05) |
10.27 |
10.22 |
— |
(5.81) |
(5.81) |
$60.66 |
19.30% |
1.56% |
1.56% |
(0.09)% |
$39,320 |
151% |
|
Service Class | ||||||||||||||
|
Year Ended July 31, 2022 |
$86.59 |
(1.35) |
(4.53) |
(5.88) |
— |
— |
— |
$80.71 |
(6.79)% |
2.61% |
2.61% |
(1.50)% |
$1,075 |
110% |
|
Year Ended July 31, 2021 |
$62.29 |
(1.19) |
25.49 |
24.30 |
— |
— |
— |
$86.59 |
39.03% |
2.71% |
2.71% |
(1.57)% |
$1,213 |
226% |
|
Year Ended July 31, 2020 |
$51.25 |
(0.73) |
11.77 |
11.04 |
— |
— |
— |
$62.29 |
21.54% |
2.74% |
2.74% |
(1.24)% |
$1,180 |
201% |
|
Year Ended July 31, 2019 |
$50.97 |
(0.40) |
0.68 |
0.28 |
— |
— |
— |
$51.25 |
0.55% |
2.55% |
2.55% |
(0.81)% |
$1,328 |
226% |
|
Year Ended July 31, 2018 |
$48.57 |
(0.53) |
8.74 |
8.21 |
— |
(5.81) |
(5.81) |
$50.97 |
18.14% |
2.55% |
2.55% |
(1.08)% |
$2,230 |
151% |
(a)
Per share net investment income (loss) has been calculated using the average daily shares method.
(b)
Portfolio turnover rate is calculated without regard to instruments having a maturity of less than one year from acquisition or derivative instruments (including swap agreements and futures contracts.) The portfolio turnover rate can be high and volatile due to the amount and timing of sales and purchases of fund shares during the period. Portfolio turnover rate is calculated on the basis of the Fund as a whole without distinguishing between classes of shares issued.
518 :: Financial Highlights
ProFunds Financial Highlights FOR THE PERIODS INDICATED
Selected data for a share of beneficial interest outstanding throughout the periods indicated.
Selected data for a share of beneficial interest outstanding throughout the periods indicated.
|
|
|
Investment Activities |
Distributions to
Shareholders From |
|
|
Ratios to Average Net Assets |
Supplemental Data | ||||||
|
|
Net Asset
Value,
Beginning
of Period |
Net
Investment
Income
(Loss)(a)
|
Net Realized
and
Unrealized
Gains
(Losses) on
Investments |
Total from
Investment
Activities |
Net
Realized
Gain on
Investments |
Total
Distributions |
Net
Asset
Value,
End of
Period |
Total
Return |
Gross
Expenses |
Net
Expenses |
Net
Investment
Income
(Loss) |
Net Assets,
End of Period
(000’s) |
Portfolio
Turnover
Rate(b)
|
|
Industrials UltraSector ProFund
Investor Class | |||||||||||||
|
Year Ended July 31, 2022 |
$61.05 |
(0.40) |
(11.73) |
(12.13) |
(2.07) |
(2.07) |
$46.85 |
(20.49)% |
1.88% |
1.75% |
(0.70)% |
$3,354 |
174% |
|
Year Ended July 31, 2021 |
$36.50 |
(0.44) |
24.99 |
24.55 |
— |
— |
$61.05 |
67.26% |
1.86% |
1.78% |
(0.84)% |
$19,362 |
427% |
|
Year Ended July 31, 2020(c) |
$39.16 |
(0.09) |
(2.57) |
(2.66) |
— |
— |
$36.50 |
(6.78)% |
2.12% |
1.87% |
(0.23)% |
$4,033 |
57% |
|
Year Ended July 31, 2019(c) |
$36.86 |
(0.04) |
2.34 |
2.30 |
— |
— |
$39.16 |
6.22% |
1.84% |
1.84% |
(0.10)% |
$9,520 |
485% |
|
Year Ended July 31, 2018(c)
|
$31.94 |
(0.04) |
6.39 |
6.35 |
(1.43) |
(1.43) |
$36.86 |
20.04% |
1.63% |
1.63% |
(0.12)% |
$7,850 |
240% |
|
Service Class | |||||||||||||
|
Year Ended July 31, 2022 |
$52.23 |
(0.85) |
(9.86) |
(10.71) |
(2.07) |
(2.07) |
$39.45 |
(21.29)% |
2.88% |
2.75% |
(1.70)% |
$276 |
174% |
|
Year Ended July 31, 2021 |
$31.55 |
(0.89) |
21.57 |
20.68 |
— |
— |
$52.23 |
65.58% |
2.86% |
2.78% |
(1.84)% |
$404 |
427% |
|
Year Ended July 31, 2020(c) |
$34.18 |
(0.42) |
(2.21) |
(2.63) |
— |
— |
$31.55 |
(7.69)% |
3.12% |
2.87% |
(1.23)% |
$226 |
57% |
|
Year Ended July 31, 2019(c) |
$32.50 |
(0.35) |
2.03 |
1.68 |
— |
— |
$34.18 |
5.16% |
2.84% |
2.84% |
(1.10)% |
$962 |
485% |
|
Year Ended July 31, 2018(c)
|
$28.59 |
(0.35) |
5.69 |
5.34 |
(1.43) |
(1.43) |
$32.50 |
18.83% |
2.63% |
2.63% |
(1.12)% |
$510 |
240% |
|
Internet UltraSector ProFund
Investor Class | |||||||||||||
|
Year Ended July 31, 2022 |
$79.79 |
(0.68) |
(39.88) |
(40.56) |
(10.63) |
(10.63) |
$28.60 |
(57.90)% |
1.48% |
1.48% |
(1.28)% |
$76,762 |
26% |
|
Year Ended July 31, 2021(d)
|
$66.20 |
(0.95) |
28.88 |
27.93 |
(14.34) |
(14.34) |
$79.79 |
45.51% |
1.52% |
1.52% |
(1.34)% |
$224,716 |
55% |
|
Year Ended July 31, 2020(d)
|
$49.72 |
(0.46) |
17.00 |
16.54 |
(0.06) |
(0.06) |
$66.20 |
33.31% |
1.60% |
1.60% |
(0.97)% |
$206,228 |
59% |
|
Year Ended July 31, 2019(d) |
$46.29 |
(0.34) |
3.78 |
3.44 |
— |
— |
$49.72 |
7.43% |
1.50% |
1.50% |
(0.75)% |
$209,745 |
61% |
|
Year Ended July 31, 2018(d)
|
$32.50 |
(0.38) |
17.40 |
17.02 |
(3.23) |
(3.23) |
$46.29 |
55.54% |
1.42% |
1.42% |
(0.94)% |
$275,914 |
69% |
|
Service Class | |||||||||||||
|
Year Ended July 31, 2022 |
$56.65 |
(1.05) |
(26.32) |
(27.37) |
(10.63) |
(10.63) |
$18.65 |
(58.32)% |
2.48% |
2.48% |
(2.28)% |
$3,642 |
26% |
|
Year Ended July 31, 2021(d)
|
$50.74 |
(1.49) |
21.74 |
20.25 |
(14.34) |
(14.34) |
$56.65 |
44.07% |
2.52% |
2.52% |
(2.34)% |
$14,190 |
55% |
|
Year Ended July 31, 2020(d)
|
$38.50 |
(0.83) |
13.13 |
12.30 |
(0.06) |
(0.06) |
$50.74 |
32.01% |
2.60% |
2.60% |
(1.97)% |
$9,906 |
59% |
|
Year Ended July 31, 2019(d) |
$36.20 |
(0.70) |
3.00 |
2.30 |
— |
— |
$38.50 |
6.35% |
2.50% |
2.50% |
(1.75)% |
$10,311 |
61% |
|
Year Ended July 31, 2018(d)
|
$26.25 |
(0.70) |
13.88 |
13.18 |
(3.23) |
(3.23) |
$36.20 |
54.00% |
2.42% |
2.42% |
(1.94)% |
$16,652 |
69% |
(a)
Per share net investment income (loss) has been calculated using the average daily shares method.
(b)
Portfolio turnover rate is calculated without regard to instruments having a maturity of less than one year from acquisition or derivative instruments (including swap agreements and futures contracts.) The portfolio turnover rate can be high and volatile due to the amount and timing of sales and purchases of fund shares during the period. Portfolio turnover rate is calculated on the basis of the Fund as a whole without distinguishing between classes of shares issued.
(c)
As described in Note 9 of the Notes to Financial Statements in the most recent Annual Report, share amounts have been adjusted for 3:1 share split that occurred on November 18, 2019.
(d)
As described in Note 9 of the Notes to Financial Statements in the most recent Annual Report, share amounts have been adjusted for 2:1 share split that occurred on December 14, 2020.
Financial Highlights :: 519
ProFunds Financial Highlights FOR THE PERIODS INDICATED
Selected data for a share of beneficial interest outstanding throughout the periods indicated.
Selected data for a share of beneficial interest outstanding throughout the periods indicated.
|
|
|
Investment Activities |
Distributions to
Shareholders From |
|
|
Ratios to Average Net Assets |
Supplemental Data | |||||||
|
|
Net Asset
Value,
Beginning
of Period |
Net
Investment
Income
(Loss)(a)
|
Net Realized
and
Unrealized
Gains
(Losses) on
Investments |
Total from
Investment
Activities |
Net
Investment
Income |
Net
Realized
Gain on
Investments |
Total
Distributions |
Net
Asset
Value,
End of
Period |
Total
Return |
Gross
Expenses |
Net
Expenses |
Net
Investment
Income
(Loss) |
Net Assets,
End of Period
(000’s) |
Portfolio
Turnover
Rate(b)
|
|
Large Cap Growth ProFund
Investor Class | ||||||||||||||
|
Year Ended July 31, 2022 |
$146.04 |
(1.19) |
(14.13) |
(15.32) |
— |
(1.56) |
(1.56) |
$129.16 |
(10.69)%(c)
|
1.57% |
1.57% |
(0.84)% |
$11,048 |
756% |
|
Year Ended July 31, 2021 |
$111.89 |
(0.81) |
39.10 |
38.29 |
— |
(4.14) |
(4.14) |
$146.04 |
34.95% |
1.59% |
1.59% |
(0.66)% |
$31,409 |
297% |
|
Year Ended July 31, 2020 |
$95.94 |
(0.33) |
20.61 |
20.28 |
— |
(4.33) |
(4.33) |
$111.89 |
21.78% |
1.69% |
1.69% |
(0.34)% |
$50,145 |
358% |
|
Year Ended July 31, 2019 |
$90.85 |
(0.12) |
6.68 |
6.56 |
— |
(1.47) |
(1.47) |
$95.94 |
7.56% |
1.61% |
1.61% |
(0.14)% |
$22,113 |
536% |
|
Year Ended July 31, 2018 |
$77.09 |
(0.15) |
15.06 |
14.91 |
— |
(1.15) |
(1.15) |
$90.85 |
19.47% |
1.57% |
1.57% |
(0.18)% |
$33,364 |
380% |
|
Service Class | ||||||||||||||
|
Year Ended July 31, 2022 |
$118.11 |
(2.33) |
(11.04) |
(13.37) |
— |
(1.56) |
(1.56) |
$103.18 |
(11.56)%(c) |
2.56% |
2.56% |
(1.83)% |
$1,234 |
756% |
|
Year Ended July 31, 2021 |
$92.09 |
(1.83) |
31.99 |
30.16 |
— |
(4.14) |
(4.14) |
$118.11 |
33.61% |
2.58% |
2.58% |
(1.66)% |
$1,467 |
297% |
|
Year Ended July 31, 2020 |
$80.47 |
(1.14) |
17.09 |
15.95 |
— |
(4.33) |
(4.33) |
$92.09 |
20.53% |
2.69% |
2.69% |
(1.34)% |
$1,014 |
358% |
|
Year Ended July 31, 2019 |
$77.22 |
(0.89) |
5.61 |
4.72 |
— |
(1.47) |
(1.47) |
$80.47 |
6.50% |
2.61% |
2.61% |
(1.14)% |
$3,894 |
536% |
|
Year Ended July 31, 2018 |
$66.34 |
(0.85) |
12.88 |
12.03 |
— |
(1.15) |
(1.15) |
$77.22 |
18.28% |
2.57% |
2.57% |
(1.18)% |
$1,307 |
380% |
|
Large Cap Value ProFund
Investor Class | ||||||||||||||
|
Year Ended July 31, 2022 |
$84.34 |
0.38 |
(1.79) |
(1.41) |
(0.59) |
— |
(0.59) |
$82.34 |
(1.72)% |
1.65% |
1.65% |
0.45% |
$18,196 |
1,059% |
|
Year Ended July 31, 2021 |
$63.28 |
0.47 |
20.59 |
21.06 |
— |
— |
— |
$84.34 |
33.28% |
1.71% |
1.71% |
0.63% |
$4,334 |
769% |
|
Year Ended July 31, 2020 |
$66.30 |
0.64 |
(3.66) |
(3.02) |
— |
— |
— |
$63.28 |
(4.55)% |
1.75% |
1.75% |
0.94% |
$4,704 |
481% |
|
Year Ended July 31, 2019 |
$66.02 |
0.45 |
2.05 |
2.50 |
— |
(2.22) |
(2.22) |
$66.30 |
4.38% |
1.80% |
1.77% |
0.71% |
$11,810 |
1,011% |
|
Year Ended July 31, 2018 |
$61.42 |
0.40 |
4.84 |
5.24 |
(0.42) |
(0.22) |
(0.64) |
$66.02 |
8.55% |
1.85% |
1.78% |
0.64% |
$5,296 |
788% |
|
Service Class | ||||||||||||||
|
Year Ended July 31, 2022 |
$73.84 |
(0.36) |
(1.64) |
(2.00) |
— |
— |
— |
$71.84 |
(2.69)% |
2.65% |
2.65% |
(0.55)% |
$1,784 |
1,059% |
|
Year Ended July 31, 2021 |
$55.95 |
(0.19) |
18.08 |
17.89 |
— |
— |
— |
$73.84 |
31.97% |
2.71% |
2.71% |
(0.37)% |
$1,855 |
769% |
|
Year Ended July 31, 2020 |
$59.23 |
0.05 |
(3.33) |
(3.28) |
— |
— |
— |
$55.95 |
(5.54)% |
2.75% |
2.75% |
(0.06)% |
$1,421 |
481% |
|
Year Ended July 31, 2019 |
$59.82 |
(0.12) |
1.75 |
1.63 |
— |
(2.22) |
(2.22) |
$59.23 |
3.37% |
2.80% |
2.77% |
(0.29)% |
$1,233 |
1,011% |
|
Year Ended July 31, 2018 |
$55.88 |
(0.18) |
4.34 |
4.16 |
— |
(0.22) |
(0.22) |
$59.82 |
7.44% |
2.85% |
2.78% |
(0.36)% |
$635 |
788% |
(a)
Per share net investment income (loss) has been calculated using the average daily shares method.
(b)
Portfolio turnover rate is calculated without regard to instruments having a maturity of less than one year from acquisition or derivative instruments (including swap agreements and futures contracts.) The portfolio turnover rate can be high and volatile due to the amount and timing of sales and purchases of fund shares during the period. Portfolio turnover rate is calculated on the basis of the Fund as a whole without distinguishing between classes of shares issued.
(c)
During the year ended July 31, 2022, the Fund received monies related to certain nonrecurring litigation settlements. The corresponding impact to the total return was 0.03%.
520 :: Financial Highlights
ProFunds Financial Highlights FOR THE PERIODS INDICATED
Selected data for a share of beneficial interest outstanding throughout the periods indicated.
Selected data for a share of beneficial interest outstanding throughout the periods indicated.
|
|
|
Investment Activities |
Distributions to
Shareholders From |
|
|
Ratios to Average Net Assets |
Supplemental Data | |||||||
|
|
Net Asset
Value,
Beginning
of Period |
Net
Investment
Income
(Loss)(a)
|
Net Realized
and
Unrealized
Gains
(Losses) on
Investments |
Total from
Investment
Activities |
Net
Investment
Income |
Net
Realized
Gain on
Investments |
Total
Distributions |
Net
Asset
Value,
End of
Period |
Total
Return |
Gross
Expenses |
Net
Expenses |
Net
Investment
Income
(Loss) |
Net Assets,
End of Period
(000’s) |
Portfolio
Turnover
Rate(b)
|
|
Mid Cap Growth ProFund
Investor Class | ||||||||||||||
|
Year Ended July 31, 2022 |
$128.38 |
(1.19) |
(11.75) |
(12.94) |
— |
(26.94) |
(26.94) |
$88.50 |
(13.02)% |
2.35% |
2.04%(c)
|
(1.19)% |
$2,708 |
197% |
|
Year Ended July 31, 2021 |
$96.99 |
(0.78) |
35.25 |
34.47 |
— |
(3.08) |
(3.08) |
$128.38 |
35.95% |
1.69% |
1.69% |
(0.74)% |
$3,719 |
233% |
|
Year Ended July 31, 2020 |
$94.01 |
(0.79) |
3.77 |
2.98 |
— |
— |
— |
$96.99 |
3.17% |
1.77% |
1.77% |
(0.88)% |
$38,215 |
457% |
|
Year Ended July 31, 2019 |
$93.83 |
(0.40) |
0.58 |
0.18 |
— |
— |
— |
$94.01 |
0.19% |
1.73% |
1.73% |
(0.44)% |
$17,792 |
385% |
|
Year Ended July 31, 2018 |
$82.27 |
(0.50) |
12.06 |
11.56 |
— |
— |
— |
$93.83 |
14.05% |
1.70% |
1.70% |
(0.56)% |
$19,895 |
384% |
|
Service Class | ||||||||||||||
|
Year Ended July 31, 2022 |
$104.06 |
(2.01) |
(8.52) |
(10.53) |
— |
(26.94) |
(26.94) |
$66.59 |
(13.90)% |
3.35% |
3.04%(c) |
(2.19)% |
$522 |
197% |
|
Year Ended July 31, 2021 |
$79.88 |
(1.74) |
29.00 |
27.26 |
— |
(3.08) |
(3.08) |
$104.06 |
34.61% |
2.69% |
2.69% |
(1.74)% |
$782 |
233% |
|
Year Ended July 31, 2020 |
$78.22 |
(1.56) |
3.22 |
1.66 |
— |
— |
— |
$79.88 |
2.12% |
2.77% |
2.77% |
(1.88)% |
$780 |
457% |
|
Year Ended July 31, 2019 |
$78.84 |
(1.15) |
0.53 |
(0.62) |
— |
— |
— |
$78.22 |
(0.79)% |
2.73% |
2.73% |
(1.44)% |
$2,315 |
385% |
|
Year Ended July 31, 2018 |
$69.82 |
(1.25) |
10.27 |
9.02 |
— |
— |
— |
$78.84 |
12.92% |
2.70% |
2.70% |
(1.56)% |
$950 |
384% |
|
Mid Cap ProFund
Investor Class | ||||||||||||||
|
Year Ended July 31, 2022 |
$112.82 |
(0.80) |
(7.51) |
(8.31) |
— |
(2.51) |
(2.51) |
$102.00 |
(7.57)%(d) |
1.95% |
1.82% |
(0.76)% |
$3,106 |
18% |
|
Year Ended July 31, 2021 |
$78.62 |
(1.05) |
35.48 |
34.43 |
— |
(0.23) |
(0.23) |
$112.82 |
43.91% |
1.83% |
1.83% |
(1.06)% |
$6,198 |
107% |
|
Year Ended July 31, 2020 |
$87.39 |
(0.41) |
(4.01) |
(4.42) |
(0.08) |
(4.27) |
(4.35) |
$78.62 |
(5.52)% |
1.97% |
1.97%(c)
|
(0.52)% |
$4,207 |
238% |
|
Year Ended July 31, 2019 |
$91.18 |
0.02 |
(1.59) |
(1.57) |
(0.05) |
(2.17) |
(2.22) |
$87.39 |
(1.25)% |
1.67% |
1.67% |
0.03% |
$7,025 |
43% |
|
Year Ended July 31, 2018 |
$87.31 |
(0.20) |
10.73 |
10.53 |
— |
(6.66) |
(6.66) |
$91.18 |
12.38% |
1.54% |
1.54% |
(0.23)% |
$19,933 |
21% |
|
Service Class | ||||||||||||||
|
Year Ended July 31, 2022 |
$90.61 |
(1.66) |
(5.77) |
(7.43) |
— |
(2.51) |
(2.51) |
$80.67 |
(8.47)%(d) |
2.95% |
2.82% |
(1.76)% |
$795 |
18% |
|
Year Ended July 31, 2021 |
$63.84 |
(1.86) |
28.86 |
27.00 |
— |
(0.23) |
(0.23) |
$90.61 |
42.47% |
2.83% |
2.83% |
(2.06)% |
$816 |
107% |
|
Year Ended July 31, 2020 |
$72.34 |
(1.07) |
(3.16) |
(4.23) |
— |
(4.27) |
(4.27) |
$63.84 |
(6.45)% |
2.97% |
2.97%(c) |
(1.52)% |
$556 |
238% |
|
Year Ended July 31, 2019 |
$76.62 |
(0.69) |
(1.42) |
(2.11) |
— |
(2.17) |
(2.17) |
$72.34 |
(2.23)% |
2.67% |
2.67% |
(0.97)% |
$2,655 |
43% |
|
Year Ended July 31, 2018 |
$75.06 |
(0.96) |
9.18 |
8.22 |
— |
(6.66) |
(6.66) |
$76.62 |
11.26% |
2.54% |
2.54% |
(1.23)% |
$783 |
21% |
(a)
Per share net investment income (loss) has been calculated using the average daily shares method.
(b)
Portfolio turnover rate is calculated without regard to instruments having a maturity of less than one year from acquisition or derivative instruments (including swap agreements and futures contracts.) The portfolio turnover rate can be high and volatile due to the amount and timing of sales and purchases of fund shares during the period. Portfolio turnover rate is calculated on the basis of the Fund as a whole without distinguishing between classes of shares issued.
(c)
The expense ratio does not correlate to the applicable expense limits in place during the period given that the annual contractual expense limitation is applied for the one year periods ended November 30th of each year, instead of coinciding with the July 31st year end. Details of the current expense limitation in effect can be found in the Trust’s annual report dated July 31, 2022.
(d)
During the year ended July 31, 2022, the Fund received monies related to certain nonrecurring litigation settlements. The corresponding impact to the total return was 0.04%.
Financial Highlights :: 521
ProFunds Financial Highlights FOR THE PERIODS INDICATED
Selected data for a share of beneficial interest outstanding throughout the periods indicated.
Selected data for a share of beneficial interest outstanding throughout the periods indicated.
|
|
|
Investment Activities |
Distributions to
Shareholders From |
|
|
Ratios to Average Net Assets |
Supplemental Data | |||||||
|
|
Net Asset
Value,
Beginning
of Period |
Net
Investment
Income
(Loss)(a)
|
Net Realized
and
Unrealized
Gains
(Losses) on
Investments |
Total from
Investment
Activities |
Net
Investment
Income |
Net
Realized
Gain on
Investments |
Total
Distributions |
Net
Asset
Value,
End of
Period |
Total
Return |
Gross
Expenses |
Net
Expenses |
Net
Investment
Income
(Loss) |
Net Assets,
End of Period
(000’s) |
Portfolio
Turnover
Rate(b)
|
|
Mid Cap Value ProFund
Investor Class | ||||||||||||||
|
Year Ended July 31, 2022 |
$95.91 |
0.19 |
(1.93)(c)
|
(1.74) |
— |
(0.89) |
(0.89) |
$93.28 |
(1.86)%(d)
|
1.85% |
1.78% |
0.21% |
$21,740 |
512% |
|
Year Ended July 31, 2021 |
$62.48 |
0.10 |
33.50 |
33.60 |
(0.17) |
— |
(0.17) |
$95.91 |
53.86% |
1.86% |
1.78% |
0.13% |
$4,856 |
772% |
|
Year Ended July 31, 2020 |
$73.65 |
0.20 |
(11.06) |
(10.86) |
(0.31)(e) |
— |
(0.31) |
$62.48 |
(14.82)%(f) |
2.10% |
1.78% |
0.29% |
$4,189 |
322% |
|
Year Ended July 31, 2019 |
$78.08 |
0.08 |
(2.04) |
(1.96) |
(0.11) |
(2.36) |
(2.47) |
$73.65 |
(1.94)% |
1.78% |
1.78% |
0.11% |
$5,554 |
708% |
|
Year Ended July 31, 2018 |
$78.19 |
(0.11) |
8.25 |
8.14 |
— |
(8.25) |
(8.25) |
$78.08 |
10.85% |
1.94% |
1.78% |
(0.15)% |
$7,731 |
312% |
|
Service Class | ||||||||||||||
|
Year Ended July 31, 2022 |
$77.37 |
(0.57) |
(1.58)(c) |
(2.15) |
— |
(0.89) |
(0.89) |
$74.33 |
(2.84)%(d) |
2.85% |
2.78% |
(0.79)% |
$620 |
512% |
|
Year Ended July 31, 2021 |
$50.79 |
(0.57) |
27.15 |
26.58 |
— |
— |
— |
$77.37 |
52.35% |
2.86% |
2.78% |
(0.87)% |
$649 |
772% |
|
Year Ended July 31, 2020 |
$60.23 |
(0.36) |
(9.08) |
(9.44) |
— |
— |
— |
$50.79 |
(15.67)%(f) |
3.10% |
2.78% |
(0.71)% |
$417 |
322% |
|
Year Ended July 31, 2019 |
$64.88 |
(0.52) |
(1.77) |
(2.29) |
— |
(2.36) |
(2.36) |
$60.23 |
(2.89)% |
2.78% |
2.78% |
(0.89)% |
$587 |
708% |
|
Year Ended July 31, 2018 |
$66.90 |
(0.76) |
6.99 |
6.23 |
— |
(8.25) |
(8.25) |
$64.88 |
9.73% |
2.94% |
2.78% |
(1.15)% |
$562 |
312% |
|
Nasdaq 100 ProFund
Investor Class | ||||||||||||||
|
Year Ended July 31, 2022 |
$139.20 |
(1.27) |
(19.08) |
(20.35) |
— |
(3.69) |
(3.69) |
$115.16 |
(15.20)% |
1.46% |
1.46% |
(0.97)% |
$48,382 |
635% |
|
Year Ended July 31, 2021 |
$104.21 |
(1.20) |
37.52 |
36.32 |
— |
(1.33) |
(1.33) |
$139.20 |
35.07% |
1.48% |
1.48% |
(1.01)% |
$153,313 |
440% |
|
Year Ended July 31, 2020 |
$76.83 |
(0.54) |
28.66 |
28.12 |
— |
(0.74) |
(0.74) |
$104.21 |
36.83% |
1.56% |
1.56% |
(0.65)% |
$108,633 |
39% |
|
Year Ended July 31, 2019 |
$71.37 |
0.02 |
5.44 |
5.46 |
— |
— |
— |
$76.83 |
7.65% |
1.52% |
1.52% |
0.03% |
$101,799 |
15% |
|
Year Ended July 31, 2018 |
$58.96 |
(0.19) |
13.07 |
12.88 |
— |
(0.47) |
(0.47) |
$71.37 |
21.94% |
1.44% |
1.44% |
(0.30)% |
$83,056 |
3% |
|
Service Class | ||||||||||||||
|
Year Ended July 31, 2022 |
$111.10 |
(2.30) |
(14.70) |
(17.00) |
— |
(3.69) |
(3.69) |
$90.41 |
(16.03)% |
2.46% |
2.46% |
(1.97)% |
$6,964 |
635% |
|
Year Ended July 31, 2021 |
$84.23 |
(2.15) |
30.35 |
28.20 |
— |
(1.33) |
(1.33) |
$111.10 |
33.74% |
2.48% |
2.48% |
(2.01)% |
$7,473 |
440% |
|
Year Ended July 31, 2020 |
$62.84 |
(1.22) |
23.35 |
22.13 |
— |
(0.74) |
(0.74) |
$84.23 |
35.48% |
2.55% |
2.55% |
(1.64)% |
$8,412 |
39% |
|
Year Ended July 31, 2019 |
$58.96 |
(0.56) |
4.44 |
3.88 |
— |
— |
— |
$62.84 |
6.58% |
2.51% |
2.51% |
(0.96)% |
$5,884 |
15% |
|
Year Ended July 31, 2018 |
$49.27 |
(0.74) |
10.90 |
10.16 |
— |
(0.47) |
(0.47) |
$58.96 |
20.75% |
2.44% |
2.44% |
(1.30)% |
$8,137 |
3% |
(a)
Per share net investment income (loss) has been calculated using the average daily shares method.
(b)
Portfolio turnover rate is calculated without regard to instruments having a maturity of less than one year from acquisition or derivative instruments (including swap agreements and futures contracts.) The portfolio turnover rate can be high and volatile due to the amount and timing of sales and purchases of fund shares during the period. Portfolio turnover rate is calculated on the basis of the Fund as a whole without distinguishing between classes of shares issued.
(c)
The amount shown for a share outstanding throughout the period does not accord with the change in aggregate gains and losses in the portfolio of securities during the period because of the timing of sales and purchases of fund shares in relation to fluctuating market values during the period.
(d)
During the year ended July 31, 2022, the Fund received monies related to certain nonrecurring litigation settlements. The corresponding impact to the total return was 0.06%.
(e)
Subsequent to the issuance of the July 31, 2020 financial statements, $0.05 of the distribution was determined to be a return of capital.
(f)
During the year ended July 31, 2022, the ProFund received monies related to certain nonrecurring litigation settlements. The corresponding impact to the total return was 0.22%.
522 :: Financial Highlights
ProFunds Financial Highlights FOR THE PERIODS INDICATED
Selected data for a share of beneficial interest outstanding throughout the periods indicated.
Selected data for a share of beneficial interest outstanding throughout the periods indicated.
|
|
|
Investment Activities |
Distributions to
Shareholders From |
|
|
Ratios to Average Net Assets |
Supplemental Data | ||||||
|
|
Net Asset
Value,
Beginning
of Period |
Net
Investment
Income
(Loss)(a)
|
Net Realized
and
Unrealized
Gains
(Losses) on
Investments |
Total from
Investment
Activities |
Net
Investment
Income |
Total
Distributions |
Net
Asset
Value,
End of
Period |
Total
Return |
Gross
Expenses |
Net
Expenses |
Net
Investment
Income
(Loss) |
Net Assets,
End of Period
(000’s) |
Portfolio
Turnover
Rate(b)
|
|
Oil & Gas UltraSector ProFund
Investor Class | |||||||||||||
|
Year Ended July 31, 2022 |
$19.35 |
0.44 |
18.84 |
19.28 |
(0.37) |
(0.37) |
$38.26 |
100.88% |
1.51% |
1.51% |
1.47% |
$42,754 |
117% |
|
Year Ended July 31, 2021 |
$11.97 |
0.23 |
7.38 |
7.61 |
(0.23) |
(0.23) |
$19.35 |
64.47% |
1.64% |
1.64% |
1.36% |
$29,753 |
239% |
|
Year Ended July 31, 2020 |
$29.28 |
0.29 |
(17.22) |
(16.93) |
(0.38) |
(0.38) |
$11.97 |
(58.57)% |
1.87% |
1.87% |
1.61% |
$11,544 |
40% |
|
Year Ended July 31, 2019 |
$42.24 |
0.37 |
(12.87) |
(12.50) |
(0.46) |
(0.46) |
$29.28 |
(29.45)% |
1.74% |
1.74% |
1.11% |
$13,402 |
53% |
|
Year Ended July 31, 2018 |
$33.39 |
0.29 |
8.88 |
9.17 |
(0.32) |
(0.32) |
$42.24 |
27.56% |
1.56% |
1.56% |
0.78% |
$43,157 |
152% |
|
Service Class | |||||||||||||
|
Year Ended July 31, 2022 |
$16.49 |
0.18 |
16.02 |
16.20 |
(0.17) |
(0.17) |
$32.52 |
98.87% |
2.51% |
2.51% |
0.47% |
$2,284 |
117% |
|
Year Ended July 31, 2021 |
$10.27 |
0.09 |
6.27 |
6.36 |
(0.14) |
(0.14) |
$16.49 |
62.71% |
2.64% |
2.64% |
0.36% |
$1,395 |
239% |
|
Year Ended July 31, 2020 |
$25.07 |
0.14 |
(14.88) |
(14.74) |
(0.06) |
(0.06) |
$10.27 |
(58.92)% |
2.87% |
2.87% |
0.61% |
$626 |
40% |
|
Year Ended July 31, 2019 |
$36.03 |
0.08 |
(10.96) |
(10.88) |
(0.08) |
(0.08) |
$25.07 |
(30.16)% |
2.74% |
2.74% |
0.11% |
$730 |
53% |
|
Year Ended July 31, 2018 |
$28.53 |
(0.02) |
7.52 |
7.50 |
— |
— |
$36.03 |
26.29% |
2.56% |
2.56% |
(0.22)% |
$1,651 |
152% |
|
Oil Equipment & Services UltraSector ProFund
Investor Class | |||||||||||||
|
Year Ended July 31, 2022 |
$61.47 |
(0.51) |
16.33 |
15.82 |
— |
— |
$77.29 |
25.74% |
1.65% |
1.65% |
(0.69)% |
$13,020 |
218% |
|
Year Ended July 31, 2021(c)
|
$36.47 |
(0.47) |
25.55(d)
|
25.08 |
(0.08) |
(0.08) |
$61.47 |
68.77% |
1.73% |
1.71% |
(0.80)% |
$15,229 |
727% |
|
Year Ended July 31, 2020(c)(e) |
$166.00 |
0.20 |
(129.73) |
(129.53) |
— |
— |
$36.47 |
(78.03)% |
2.12% |
1.86% |
0.73% |
$9,408 |
396% |
|
Year Ended July 31, 2019(c)(e)
|
$403.70 |
(1.28) |
(232.26) |
(233.54) |
(4.16) |
(4.16) |
$166.00 |
(57.83)% |
2.09% |
2.09%(f)
|
(0.61)% |
$6,205 |
248% |
|
Year Ended July 31, 2018(c)(e)
|
$401.13 |
3.20 |
8.65 |
11.85 |
(9.28) |
(9.28) |
$403.70 |
3.02% |
1.60% |
1.60% |
0.83% |
$8,203 |
316% |
|
Service Class | |||||||||||||
|
Year Ended July 31, 2022 |
$54.96 |
(1.20) |
14.65 |
13.45 |
— |
— |
$68.41 |
24.49% |
2.65% |
2.65% |
(1.69)% |
$1,247 |
218% |
|
Year Ended July 31, 2021(c) |
$32.90 |
(0.95) |
23.01(d) |
22.06 |
— |
— |
$54.96 |
67.15% |
2.73% |
2.71% |
(1.80)% |
$621 |
727% |
|
Year Ended July 31, 2020(c)(e) |
$151.47 |
(0.04) |
(118.53) |
(118.57) |
— |
— |
$32.90 |
(78.28)% |
3.12% |
2.86% |
(0.27)% |
$353 |
396% |
|
Year Ended July 31, 2019(c)(e) |
$362.87 |
(3.20) |
(208.20) |
(211.40) |
—(g) |
—(g) |
$151.47 |
(58.27)% |
3.09% |
3.09%(f) |
(1.61)% |
$373 |
248% |
|
Year Ended July 31, 2018(c)(e)
|
$359.98 |
(0.32) |
7.37 |
7.05 |
(4.16) |
(4.16) |
$362.87 |
1.99% |
2.60% |
2.60% |
(0.17)% |
$318 |
316% |
(a)
Per share net investment income (loss) has been calculated using the average daily shares method.
(b)
Portfolio turnover rate is calculated without regard to instruments having a maturity of less than one year from acquisition or derivative instruments (including swap agreements and futures contracts.) The portfolio turnover rate can be high and volatile due to the amount and timing of sales and purchases of fund shares during the period. Portfolio turnover rate is calculated on the basis of the Fund as a whole without distinguishing between classes of shares issued.
(c)
As described in Note 9 of the Notes to Financial Statements in the most recent Annual Report, share amounts have been adjusted for 1:4 reverse share split that occurred on December 14, 2020.
(d)
The amount shown for a share outstanding throughout the period does not accord with the change in aggregate gains and losses in the portfolio of securities during the period because of the timing of sales and purchases of fund shares in relation to fluctuating market values during the period.
(e)
As described in Note 9 of the Notes to Financial Statements in the most recent Annual Report, share amounts have been adjusted for 1:8 reverse share split that occurred on November 18, 2019.
(f)
The expense ratio does not correlate to the applicable expense limits in place during the period given that the annual contractual expense limitation is applied for the one year periods ended November 30th of each year, instead of coinciding with the July 31st year end. Details of the current expense limitation in effect can be found in the Trust’s annual report dated July 31, 2022.
(g)
Amount is less than $0.005.
Financial Highlights :: 523
ProFunds Financial Highlights FOR THE PERIODS INDICATED
Selected data for a share of beneficial interest outstanding throughout the periods indicated.
Selected data for a share of beneficial interest outstanding throughout the periods indicated.
|
|
|
Investment Activities |
Distributions to
Shareholders From |
|
|
Ratios to Average Net Assets |
Supplemental Data | |||||||
|
|
Net Asset
Value,
Beginning
of Period |
Net
Investment
Income
(Loss)(a)
|
Net Realized
and
Unrealized
Gains
(Losses) on
Investments |
Total from
Investment
Activities |
Net
Investment
Income |
Net
Realized
Gain on
Investments |
Total
Distributions |
Net
Asset
Value,
End of
Period |
Total
Return |
Gross
Expenses |
Net
Expenses |
Net
Investment
Income
(Loss) |
Net Assets,
End of Period
(000’s) |
Portfolio
Turnover
Rate(b)
|
|
Pharmaceuticals UltraSector ProFund
Investor Class | ||||||||||||||
|
Year Ended July 31, 2022 |
$30.56 |
(0.06) |
(0.41)(c)
|
(0.47) |
— |
(1.23) |
(1.23) |
$28.86 |
(1.71)% |
2.13% |
1.78% |
(0.20)% |
$3,828 |
185% |
|
Year Ended July 31, 2021 |
$22.94 |
(0.09) |
7.81 |
7.72 |
— |
(0.10) |
(0.10) |
$30.56 |
33.74% |
2.27% |
1.78% |
(0.33)% |
$3,961 |
204% |
|
Year Ended July 31, 2020 |
$20.75 |
(0.04) |
2.23 |
2.19 |
— |
— |
— |
$22.94 |
10.55% |
2.32% |
1.84% |
(0.18)% |
$3,735 |
137% |
|
Year Ended July 31, 2019 |
$26.29 |
0.01 |
(4.71) |
(4.70) |
(0.04) |
(0.80) |
(0.84) |
$20.75 |
(17.69)% |
1.97% |
1.86% |
0.06% |
$5,039 |
223% |
|
Year Ended July 31, 2018 |
$25.66 |
0.12 |
1.61 |
1.73 |
— |
(1.10) |
(1.10) |
$26.29 |
6.97% |
1.78% |
1.78% |
0.48% |
$7,173 |
192% |
|
Service Class | ||||||||||||||
|
Year Ended July 31, 2022 |
$26.02 |
(0.31) |
(0.34)(c) |
(0.65) |
— |
(1.23) |
(1.23) |
$24.14 |
(2.69)% |
3.13% |
2.78% |
(1.20)% |
$289 |
185% |
|
Year Ended July 31, 2021 |
$19.74 |
(0.32) |
6.70 |
6.38 |
— |
(0.10) |
(0.10) |
$26.02 |
32.41% |
3.27% |
2.78% |
(1.33)% |
$318 |
204% |
|
Year Ended July 31, 2020 |
$18.03 |
(0.23) |
1.94 |
1.71 |
— |
— |
— |
$19.74 |
9.48% |
3.32% |
2.84% |
(1.18)% |
$300 |
137% |
|
Year Ended July 31, 2019 |
$23.16 |
(0.20) |
(4.13) |
(4.33) |
— |
(0.80) |
(0.80) |
$18.03 |
(18.53)% |
2.97% |
2.86% |
(0.94)% |
$435 |
223% |
|
Year Ended July 31, 2018 |
$22.96 |
(0.10) |
1.40 |
1.30 |
— |
(1.10) |
(1.10) |
$23.16 |
5.88% |
2.78% |
2.78% |
(0.52)% |
$822 |
192% |
|
Precious Metals UltraSector ProFund
Investor Class | ||||||||||||||
|
Year Ended July 31, 2022 |
$65.60 |
0.19 |
(25.43) |
(25.24) |
— |
— |
— |
$40.36 |
(38.48)% |
1.53% |
1.53% |
0.33% |
$18,455 |
94% |
|
Year Ended July 31, 2021 |
$89.95 |
(0.28) |
(24.07) |
(24.35) |
— |
— |
— |
$65.60 |
(27.07)% |
1.59% |
1.59% |
(0.39)% |
$35,750 |
128% |
|
Year Ended July 31, 2020 |
$41.21 |
(0.38) |
49.12 |
48.74 |
— |
— |
— |
$89.95 |
118.27% |
1.64% |
1.64% |
(0.73)% |
$43,584 |
148% |
|
Year Ended July 31, 2019 |
$32.32 |
(0.02) |
8.91 |
8.89 |
— |
— |
— |
$41.21 |
27.51% |
1.62% |
1.62% |
(0.07)% |
$29,785 |
228% |
|
Year Ended July 31, 2018 |
$39.29 |
(0.22) |
(6.75) |
(6.97) |
— |
— |
— |
$32.32 |
(17.74)% |
1.52% |
1.52% |
(0.60)% |
$23,965 |
192% |
|
Service Class | ||||||||||||||
|
Year Ended July 31, 2022 |
$55.73 |
(0.32) |
(21.47) |
(21.79) |
— |
— |
— |
$33.94 |
(39.08)% |
2.53% |
2.53% |
(0.67)% |
$1,280 |
94% |
|
Year Ended July 31, 2021 |
$77.19 |
(0.88) |
(20.58) |
(21.46) |
— |
— |
— |
$55.73 |
(27.80)% |
2.59% |
2.59% |
(1.39)% |
$1,755 |
128% |
|
Year Ended July 31, 2020 |
$35.72 |
(0.83) |
42.30 |
41.47 |
— |
— |
— |
$77.19 |
116.10% |
2.64% |
2.64% |
(1.73)% |
$1,557 |
148% |
|
Year Ended July 31, 2019 |
$28.31 |
(0.29) |
7.70 |
7.41 |
— |
— |
— |
$35.72 |
26.17% |
2.62% |
2.62% |
(1.07)% |
$1,131 |
228% |
|
Year Ended July 31, 2018 |
$34.75 |
(0.54) |
(5.90) |
(6.44) |
— |
— |
— |
$28.31 |
(18.53)% |
2.52% |
2.52% |
(1.60)% |
$1,465 |
192% |
(a)
Per share net investment income (loss) has been calculated using the average daily shares method.
(b)
Portfolio turnover rate is calculated without regard to instruments having a maturity of less than one year from acquisition or derivative instruments (including swap agreements and futures contracts.) The portfolio turnover rate can be high and volatile due to the amount and timing of sales and purchases of fund shares during the period. Portfolio turnover rate is calculated on the basis of the Fund as a whole without distinguishing between classes of shares issued.
(c)
The amount shown for a share outstanding throughout the period does not accord with the change in aggregate gains and losses in the portfolio of securities during the period because of the timing of sales and purchases of fund shares in relation to fluctuating market values during the period.
524 :: Financial Highlights
ProFunds Financial Highlights FOR THE PERIODS INDICATED
Selected data for a share of beneficial interest outstanding throughout the periods indicated.
Selected data for a share of beneficial interest outstanding throughout the periods indicated.
|
|
|
Investment Activities |
Distributions to
Shareholders From |
|
|
Ratios to Average Net Assets |
Supplemental Data | |||||||
|
|
Net Asset
Value,
Beginning
of Period |
Net
Investment
Income
(Loss)(a)
|
Net Realized
and
Unrealized
Gains
(Losses) on
Investments |
Total from
Investment
Activities |
Net
Investment
Income |
Net
Realized
Gain on
Investments |
Total
Distributions |
Net
Asset
Value,
End of
Period |
Total
Return |
Gross
Expenses |
Net
Expenses |
Net
Investment
Income
(Loss) |
Net Assets,
End of Period
(000’s) |
Portfolio
Turnover
Rate(b)
|
|
Real Estate UltraSector ProFund
Investor Class | ||||||||||||||
|
Year Ended July 31, 2022 |
$63.02 |
(0.20) |
(4.17) |
(4.37) |
(0.56) |
(7.57) |
(8.13) |
$50.52 |
(8.99)%(c) |
1.55% |
1.55% |
(0.32)% |
$6,793 |
253% |
|
Year Ended July 31, 2021 |
$42.23 |
(0.18) |
20.97 |
20.79 |
— |
— |
— |
$63.02 |
49.23% |
1.86% |
1.81% |
(0.33)% |
$34,877 |
175% |
|
Year Ended July 31, 2020 |
$51.60 |
(0.10) |
(7.77) |
(7.87) |
(1.50)(d) |
— |
(1.50) |
$42.23 |
(15.54)% |
1.80% |
1.79% |
(0.20)% |
$4,991 |
217% |
|
Year Ended July 31, 2019 |
$45.14 |
0.81 |
6.47 |
7.28 |
(0.82) |
— |
(0.82) |
$51.60 |
16.49% |
1.62% |
1.62% |
1.71% |
$25,665 |
345% |
|
Year Ended July 31, 2018 |
$43.65 |
0.22 |
1.27 |
1.49 |
— |
— |
— |
$45.14 |
3.41% |
1.92% |
1.89% |
0.52% |
$6,197 |
374% |
|
Service Class | ||||||||||||||
|
Year Ended July 31, 2022 |
$59.52 |
(0.75) |
(3.90) |
(4.65) |
(0.09) |
(7.57) |
(7.66) |
$47.21 |
(9.89)%(c) |
2.55% |
2.55% |
(1.32)% |
$534 |
253% |
|
Year Ended July 31, 2021 |
$40.28 |
(0.66) |
19.90 |
19.24 |
— |
— |
— |
$59.52 |
47.77% |
2.86% |
2.81% |
(1.33)% |
$964 |
175% |
|
Year Ended July 31, 2020 |
$49.28 |
(0.58) |
(7.38) |
(7.96) |
(1.04)(d) |
— |
(1.04) |
$40.28 |
(16.39)% |
2.80% |
2.79% |
(0.12)% |
$341 |
217% |
|
Year Ended July 31, 2019 |
$42.78 |
0.37 |
6.19 |
6.56 |
(0.06) |
— |
(0.06) |
$49.28 |
15.35% |
2.62% |
2.62% |
0.71% |
$1,007 |
345% |
|
Year Ended July 31, 2018 |
$41.77 |
(0.18) |
1.19 |
1.01 |
— |
— |
— |
$42.78 |
2.42% |
2.92% |
2.89% |
(0.48)% |
$737 |
374% |
|
Rising Rates Opportunity ProFund
Investor Class | ||||||||||||||
|
Year Ended July 31, 2022 |
$25.21 |
(0.28) |
6.50 |
6.22 |
— |
— |
— |
$31.43 |
24.67% |
1.52% |
1.52% |
(0.96)% |
$44,874 |
— |
|
Year Ended July 31, 2021 |
$21.80 |
(0.43) |
3.84 |
3.41 |
— |
— |
— |
$25.21 |
15.64% |
1.71% |
1.69% |
(1.68)% |
$9,091 |
— |
|
Year Ended July 31, 2020 |
$35.49 |
(0.17) |
(13.10) |
(13.27) |
(0.42) |
— |
(0.42) |
$21.80 |
(37.79)% |
1.89% |
1.88% |
(0.60)% |
$6,105 |
— |
|
Year Ended July 31, 2019 |
$41.55 |
0.27 |
(6.33) |
(6.06) |
— |
— |
— |
$35.49 |
(14.58)% |
1.56% |
1.56% |
0.67% |
$30,192 |
— |
|
Year Ended July 31, 2018 |
$41.26 |
(0.08) |
0.37 |
0.29 |
— |
— |
— |
$41.55 |
0.70% |
1.50% |
1.50% |
(0.21)% |
$26,114 |
— |
|
Service Class | ||||||||||||||
|
Year Ended July 31, 2022 |
$22.15 |
(0.53) |
5.74 |
5.21 |
— |
— |
— |
$27.36 |
23.47% |
2.52% |
2.52% |
(1.96)% |
$1,173 |
— |
|
Year Ended July 31, 2021 |
$19.35 |
(0.67) |
3.47 |
2.80 |
— |
— |
— |
$22.15 |
14.52% |
2.71% |
2.69% |
(2.68)% |
$680 |
— |
|
Year Ended July 31, 2020 |
$31.42 |
(0.44) |
(11.63) |
(12.07) |
— |
— |
— |
$19.35 |
(38.41)% |
2.89% |
2.88% |
(1.60)% |
$87 |
— |
|
Year Ended July 31, 2019 |
$37.17 |
(0.09) |
(5.66) |
(5.75) |
— |
— |
— |
$31.42 |
(15.47)% |
2.56% |
2.56% |
(0.33)% |
$209 |
— |
|
Year Ended July 31, 2018 |
$37.27 |
(0.45) |
0.35 |
(0.10) |
— |
— |
— |
$37.17 |
(0.27)% |
2.50% |
2.50% |
(1.21)% |
$1,031 |
— |
(a)
Per share net investment income (loss) has been calculated using the average daily shares method.
(b)
Portfolio turnover rate is calculated without regard to instruments having a maturity of less than one year from acquisition or derivative instruments (including swap agreements and futures contracts.) The portfolio turnover rate can be high and volatile due to the amount and timing of sales and purchases of fund shares during the period. Portfolio turnover rate is calculated on the basis of the Fund as a whole without distinguishing between classes of shares issued.
(c)
During the year ended July 31, 2022, the Fund received monies related to certain nonrecuring litigation settlements. The corresponding impact to the total return was 0.03%.
(d)
Subsequent to the issuance of the July 31, 2020 financial statements, $0.60 and $0.42 of the distribution for the Investor class and Service class respectively was determined to be a return of capital.
Financial Highlights :: 525
ProFunds Financial Highlights FOR THE PERIODS INDICATED
Selected data for a share of beneficial interest outstanding throughout the periods indicated.
Selected data for a share of beneficial interest outstanding throughout the periods indicated.
|
|
|
Investment Activities |
Distributions to
Shareholders From |
|
|
Ratios to Average Net Assets |
Supplemental Data | |||||||
|
|
Net Asset
Value,
Beginning
of Period |
Net
Investment
Income
(Loss)(a)
|
Net Realized
and
Unrealized
Gains
(Losses) on
Investments |
Total from
Investment
Activities |
Net
Investment
Income |
Net
Realized
Gain on
Investments |
Total
Distributions |
Net
Asset
Value,
End of
Period |
Total
Return |
Gross
Expenses |
Net
Expenses |
Net
Investment
Income
(Loss) |
Net Assets,
End of Period
(000’s) |
Portfolio
Turnover
Rate(b)
|
|
Rising Rates Opportunity 10 ProFund
Investor Class | ||||||||||||||
|
Year Ended July 31, 2022 |
$12.32 |
(0.17) |
1.30 |
1.13 |
— |
— |
— |
$13.45 |
9.17% |
2.62% |
1.78% |
(1.31)% |
$2,933 |
— |
|
Year Ended July 31, 2021 |
$12.02 |
(0.22) |
0.52 |
0.30 |
— |
— |
— |
$12.32 |
2.50% |
2.69% |
1.78% |
(1.77)% |
$1,832 |
— |
|
Year Ended July 31, 2020 |
$14.16 |
(0.09) |
(1.97) |
(2.06) |
(0.08) |
— |
(0.08) |
$12.02 |
(14.62)% |
2.66% |
1.85% |
(0.71)% |
$1,773 |
— |
|
Year Ended July 31, 2019 |
$15.46 |
0.06 |
(1.36) |
(1.30) |
— |
— |
— |
$14.16 |
(8.41)% |
1.79% |
1.74% |
0.38% |
$2,683 |
— |
|
Year Ended July 31, 2018 |
$14.91 |
(0.06) |
0.61 |
0.55 |
— |
— |
— |
$15.46 |
3.69% |
1.73% |
1.73% |
(0.37)% |
$16,172 |
— |
|
Service Class | ||||||||||||||
|
Year Ended July 31, 2022 |
$11.34 |
(0.29) |
1.21 |
0.92 |
— |
— |
— |
$12.26 |
8.11% |
3.62% |
2.78% |
(2.31)% |
$762 |
— |
|
Year Ended July 31, 2021 |
$11.18 |
(0.34) |
0.50 |
0.16 |
— |
— |
— |
$11.34 |
1.43% |
3.69% |
2.78% |
(2.77)% |
$121 |
— |
|
Year Ended July 31, 2020 |
$13.22 |
(0.22) |
(1.82) |
(2.04) |
— |
— |
— |
$11.18 |
(15.43)% |
3.66% |
2.85% |
(1.71)% |
$82 |
— |
|
Year Ended July 31, 2019 |
$14.57 |
(0.08) |
(1.27) |
(1.35) |
— |
— |
— |
$13.22 |
(9.27)% |
2.79% |
2.74% |
(0.62)% |
$288 |
— |
|
Year Ended July 31, 2018 |
$14.20 |
(0.20) |
0.57 |
0.37 |
— |
— |
— |
$14.57 |
2.61% |
2.73% |
2.73% |
(1.37)% |
$350 |
— |
|
Rising U.S. Dollar ProFund
Investor Class | ||||||||||||||
|
Year Ended July 31, 2022 |
$27.16 |
(0.38) |
3.87 |
3.49 |
— |
— |
— |
$30.65 |
12.85% |
1.82% |
1.78% |
(1.32)% |
$46,695 |
— |
|
Year Ended July 31, 2021 |
$27.99 |
(0.48) |
(0.35) |
(0.83) |
— |
— |
— |
$27.16 |
(2.97)% |
2.13% |
1.78% |
(1.77)% |
$6,264 |
— |
|
Year Ended July 31, 2020 |
$29.59 |
(0.24) |
(1.28) |
(1.52) |
(0.08) |
— |
(0.08) |
$27.99 |
(5.15)% |
1.97% |
1.78% |
(0.82)% |
$7,263 |
— |
|
Year Ended July 31, 2019 |
$27.81 |
0.08 |
1.82 |
1.90 |
— |
(0.12) |
(0.12) |
$29.59 |
6.85% |
1.87% |
1.81% |
0.28% |
$12,437 |
— |
|
Year Ended July 31, 2018 |
$27.10 |
(0.15) |
0.86 |
0.71 |
— |
— |
— |
$27.81 |
2.62% |
1.80% |
1.80% |
(0.57)% |
$14,793 |
— |
|
Service Class | ||||||||||||||
|
Year Ended July 31, 2022 |
$23.77 |
(0.63) |
3.42 |
2.79 |
— |
— |
— |
$26.56 |
11.70% |
2.82% |
2.78% |
(2.32)% |
$182 |
— |
|
Year Ended July 31, 2021 |
$24.74 |
(0.72) |
(0.25) |
(0.97) |
— |
— |
— |
$23.77 |
(3.92)% |
3.13% |
2.78% |
(2.77)% |
$52 |
— |
|
Year Ended July 31, 2020 |
$26.34 |
(0.50) |
(1.10) |
(1.60) |
— |
— |
— |
$24.74 |
(6.07)% |
2.97% |
2.78% |
(1.82)% |
$63 |
— |
|
Year Ended July 31, 2019 |
$25.02 |
(0.18) |
1.62 |
1.44 |
— |
(0.12) |
(0.12) |
$26.34 |
5.77% |
2.87% |
2.81% |
(0.72)% |
$144 |
— |
|
Year Ended July 31, 2018 |
$24.59 |
(0.40) |
0.83 |
0.43 |
— |
— |
— |
$25.02 |
1.67% |
2.80% |
2.80% |
(1.57)% |
$1,002 |
— |
(a)
Per share net investment income (loss) has been calculated using the average daily shares method.
(b)
Portfolio turnover rate is calculated without regard to instruments having a maturity of less than one year from acquisition or derivative instruments (including swap agreements and futures contracts.) The portfolio turnover rate can be high and volatile due to the amount and timing of sales and purchases of fund shares during the period. Portfolio turnover rate is calculated on the basis of the Fund as a whole without distinguishing between classes of shares issued.
526 :: Financial Highlights
ProFunds Financial Highlights FOR THE PERIODS INDICATED
Selected data for a share of beneficial interest outstanding throughout the periods indicated.
Selected data for a share of beneficial interest outstanding throughout the periods indicated.
|
|
|
Investment Activities |
Distributions to
Shareholders From |
|
|
Ratios to Average Net Assets |
Supplemental Data | |||||||
|
|
Net Asset
Value,
Beginning
of Period |
Net
Investment
Income
(Loss)(a)
|
Net Realized
and
Unrealized
Gains
(Losses) on
Investments |
Total from
Investment
Activities |
Net
Investment
Income |
Net
Realized
Gain on
Investments |
Total
Distributions |
Net
Asset
Value,
End of
Period |
Total
Return |
Gross
Expenses |
Net
Expenses |
Net
Investment
Income
(Loss) |
Net Assets,
End of Period
(000’s) |
Portfolio
Turnover
Rate(b)
|
|
Semiconductor UltraSector ProFund
Investor Class | ||||||||||||||
|
Year Ended July 31, 2022 |
$118.09 |
(0.68) |
(17.85) |
(18.53) |
— |
(6.62) |
(6.62) |
$92.94 |
(17.93)% |
1.49% |
1.49% |
(0.59)% |
$64,313 |
53% |
|
Year Ended July 31, 2021 |
$63.61 |
(0.58) |
55.06 |
54.48 |
— |
— |
— |
$118.09 |
85.65% |
1.58% |
1.58% |
(0.63)% |
$79,845 |
70% |
|
Year Ended July 31, 2020 |
$46.14 |
0.06 |
18.69 |
18.75 |
(0.02) |
(1.26) |
(1.28) |
$63.61 |
42.27% |
1.65% |
1.65% |
0.11% |
$51,355 |
169% |
|
Year Ended July 31, 2019 |
$61.56 |
0.34 |
(2.58) |
(2.24) |
(0.53) |
(12.65) |
(13.18) |
$46.14 |
5.55% |
1.55% |
1.55% |
0.69% |
$64,715 |
106% |
|
Year Ended July 31, 2018 |
$48.20 |
0.04 |
19.14 |
19.18 |
(0.06) |
(5.76) |
(5.82) |
$61.56 |
40.36% |
1.44% |
1.44% |
0.07% |
$245,143 |
56% |
|
Service Class | ||||||||||||||
|
Year Ended July 31, 2022 |
$88.98 |
(1.57) |
(12.45) |
(14.02) |
— |
(6.62) |
(6.62) |
$68.34 |
(18.76)% |
2.49% |
2.49% |
(1.59)% |
$4,254 |
53% |
|
Year Ended July 31, 2021 |
$48.41 |
(1.29) |
41.86 |
40.57 |
— |
— |
— |
$88.98 |
83.81% |
2.58% |
2.58% |
(1.63)% |
$5,376 |
70% |
|
Year Ended July 31, 2020 |
$35.79 |
(0.34) |
14.22 |
13.88 |
— |
(1.26) |
(1.26) |
$48.41 |
40.81% |
2.65% |
2.65% |
(0.89)% |
$2,187 |
169% |
|
Year Ended July 31, 2019 |
$51.46 |
(0.04) |
(2.98) |
(3.02) |
— |
(12.65) |
(12.65) |
$35.79 |
4.49% |
2.55% |
2.55% |
(0.31)% |
$1,984 |
106% |
|
Year Ended July 31, 2018 |
$41.34 |
(0.47) |
16.35 |
15.88 |
— |
(5.76) |
(5.76) |
$51.46 |
38.97% |
2.44% |
2.44% |
(0.93)% |
$4,691 |
56% |
|
Short Nasdaq 100 ProFund
Investor Class | ||||||||||||||
|
Year Ended July 31, 2022 |
$14.29 |
(0.17) |
0.69(c) |
0.52 |
— |
— |
— |
$14.81 |
3.64% |
1.81% |
1.78% |
(1.13)% |
$79,796 |
— |
|
Year Ended July 31, 2021 |
$20.87 |
(0.31) |
(6.27)(c) |
(6.58) |
— |
— |
— |
$14.29 |
(31.63)% |
2.02% |
1.78% |
(1.76)% |
$1,764 |
— |
|
Year Ended July 31, 2020(d) |
$33.46 |
(0.18) |
(12.32) |
(12.50) |
(0.09) |
— |
(0.09) |
$20.87 |
(37.32)% |
2.01% |
1.78% |
(1.00)% |
$2,400 |
— |
|
Year Ended July 31, 2019(d) |
$37.30 |
0.16 |
(4.00) |
(3.84) |
— |
— |
— |
$33.46 |
(10.40)% |
2.37% |
1.78% |
0.46% |
$4,429 |
— |
|
Year Ended July 31, 2018(d) |
$47.10 |
(0.20) |
(9.60) |
(9.80) |
— |
— |
— |
$37.30 |
(20.66)% |
2.42% |
1.78% |
(0.44)% |
$2,572 |
— |
|
Service Class | ||||||||||||||
|
Year Ended July 31, 2022 |
$12.68 |
(0.30) |
0.59(c) |
0.29 |
— |
— |
— |
$12.97 |
2.29% |
2.81% |
2.78% |
(2.13)% |
$241 |
— |
|
Year Ended July 31, 2021 |
$18.67 |
(0.46) |
(5.53)(c) |
(5.99) |
— |
— |
— |
$12.68 |
(32.26)% |
3.02% |
2.78% |
(2.76)% |
$111 |
— |
|
Year Ended July 31, 2020(d) |
$30.15 |
(0.33) |
(11.15) |
(11.48) |
— |
— |
— |
$18.67 |
(37.93)% |
3.01% |
2.78% |
(2.00)% |
$320 |
— |
|
Year Ended July 31, 2019(d) |
$33.96 |
(0.16) |
(3.65) |
(3.81) |
— |
— |
— |
$30.15 |
(11.19)% |
3.37% |
2.78% |
(0.54)% |
$788 |
— |
|
Year Ended July 31, 2018(d) |
$43.27 |
(0.56) |
(8.75) |
(9.31) |
— |
— |
— |
$33.96 |
(21.46)% |
3.42% |
2.78% |
(1.44)% |
$360 |
— |
(a)
Per share net investment income (loss) has been calculated using the average daily shares method.
(b)
Portfolio turnover rate is calculated without regard to instruments having a maturity of less than one year from acquisition or derivative instruments (including swap agreements and futures contracts.) The portfolio turnover rate can be high and volatile due to the amount and timing of sales and purchases of fund shares during the period. Portfolio turnover rate is calculated on the basis of the Fund as a whole without distinguishing between classes of shares issued.
(c)
The amount shown for a share outstanding throughout the period does not accord with the change in aggregate gains and losses in the portfolio of securities during the period because of the timing of sales and purchases of fund shares in relation to fluctuating market values during the period.
(d)
As described in Note 9 of the Notes to Financial Statements in the most recent Annual Report, share amounts have been adjusted for 1:4 reverse share split that occurred on November 18, 2019.
Financial Highlights :: 527
ProFunds Financial Highlights FOR THE PERIODS INDICATED
Selected data for a share of beneficial interest outstanding throughout the periods indicated.
Selected data for a share of beneficial interest outstanding throughout the periods indicated.
|
|
|
Investment Activities |
Distributions to
Shareholders From |
|
|
Ratios to Average Net Assets |
Supplemental Data | ||||||
|
|
Net Asset
Value,
Beginning
of Period |
Net
Investment
Income
(Loss)(a)
|
Net Realized
and
Unrealized
Gains
(Losses) on
Investments |
Total from
Investment
Activities |
Net
Investment
Income |
Total
Distributions |
Net
Asset
Value,
End of
Period |
Total
Return |
Gross
Expenses |
Net
Expenses |
Net
Investment
Income
(Loss) |
Net Assets,
End of Period
(000’s) |
Portfolio
Turnover
Rate(b)
|
|
Short Oil & Gas ProFund
Investor Class | |||||||||||||
|
Year Ended July 31, 2022 |
$32.82 |
(0.29) |
(14.96) |
(15.25) |
— |
— |
$17.57 |
(46.47)% |
3.74% |
1.78% |
(1.28)% |
$2,135 |
— |
|
Year Ended July 31, 2021 |
$55.89 |
(0.85) |
(22.22) |
(23.07) |
— |
— |
$32.82 |
(41.28)% |
3.16% |
1.78% |
(1.76)% |
$418 |
— |
|
Year Ended July 31, 2020 |
$46.83 |
(0.46) |
9.65 |
9.19 |
(0.13) |
(0.13) |
$55.89 |
19.69% |
2.84% |
1.78% |
(0.84)% |
$2,804 |
— |
|
Year Ended July 31, 2019 |
$39.19 |
0.19 |
7.45 |
7.64 |
— |
— |
$46.83 |
19.49% |
3.34% |
1.78% |
0.43% |
$2,115 |
— |
|
Year Ended July 31, 2018 |
$48.45 |
(0.21) |
(9.05) |
(9.26) |
— |
— |
$39.19 |
(19.11)% |
2.62% |
1.78% |
(0.48)% |
$1,636 |
— |
|
Service Class | |||||||||||||
|
Year Ended July 31, 2022 |
$30.52 |
(0.53) |
(13.79) |
(14.32) |
— |
— |
$16.20 |
(46.97)% |
4.74% |
2.78% |
(2.28)% |
$12 |
— |
|
Year Ended July 31, 2021 |
$52.45 |
(1.25) |
(20.68) |
(21.93) |
— |
— |
$30.52 |
(41.81)% |
4.15% |
2.77% |
(2.75)% |
$25 |
— |
|
Year Ended July 31, 2020 |
$44.39 |
(0.99) |
9.05 |
8.06 |
— |
— |
$52.45 |
18.63% |
3.84% |
2.78% |
(1.84)% |
$32 |
— |
|
Year Ended July 31, 2019 |
$37.27 |
(0.24) |
7.36 |
7.12 |
— |
— |
$44.39 |
18.39% |
4.34% |
2.78% |
(0.57)% |
$3 |
— |
|
Year Ended July 31, 2018 |
$46.66 |
(0.68) |
(8.71) |
(9.39) |
— |
— |
$37.27 |
(19.95)% |
3.62% |
2.78% |
(1.48)% |
$3 |
— |
|
Short Precious Metals ProFund
Investor Class | |||||||||||||
|
Year Ended July 31, 2022 |
$14.83 |
(0.22) |
2.84 |
2.62 |
— |
— |
$17.45 |
17.67% |
2.79% |
1.78% |
(1.45)% |
$2,072 |
— |
|
Year Ended July 31, 2021 |
$14.53 |
(0.27) |
0.57 |
0.30 |
— |
— |
$14.83 |
2.06% |
2.86% |
1.78% |
(1.76)% |
$2,144 |
— |
|
Year Ended July 31, 2020 |
$32.94 |
(0.12) |
(18.02) |
(18.14) |
(0.27) |
(0.27) |
$14.53 |
(55.43)% |
2.97% |
1.78% |
(0.47)% |
$1,564 |
— |
|
Year Ended July 31, 2019 |
$42.91 |
0.20 |
(10.17) |
(9.97) |
— |
— |
$32.94 |
(23.23)% |
2.13% |
1.78% |
0.47% |
$4,649 |
— |
|
Year Ended July 31, 2018 |
$40.33 |
(0.21) |
2.79 |
2.58 |
— |
— |
$42.91 |
6.40% |
2.18% |
1.78% |
(0.53)% |
$6,552 |
— |
|
Service Class | |||||||||||||
|
Year Ended July 31, 2022 |
$14.43 |
(0.37) |
2.74 |
2.37 |
— |
— |
$16.80 |
16.35% |
3.79% |
2.78% |
(2.45)% |
$17 |
— |
|
Year Ended July 31, 2021 |
$14.31 |
(0.42) |
0.54 |
0.12 |
— |
— |
$14.43 |
0.84% |
3.86% |
2.78% |
(2.76)% |
$14 |
— |
|
Year Ended July 31, 2020 |
$32.41 |
(0.36) |
(17.74) |
(18.10) |
— |
— |
$14.31 |
(55.85)% |
3.97% |
2.78% |
(1.47)% |
$65 |
— |
|
Year Ended July 31, 2019 |
$42.65 |
(0.22) |
(10.02) |
(10.24) |
— |
— |
$32.41 |
(24.01)% |
3.13% |
2.78% |
(0.53)% |
$26 |
— |
|
Year Ended July 31, 2018 |
$40.48 |
(0.61) |
2.78 |
2.17 |
— |
— |
$42.65 |
5.36% |
3.18% |
2.78% |
(1.53)% |
$42 |
— |
(a)
Per share net investment income (loss) has been calculated using the average daily shares method.
(b)
Portfolio turnover rate is calculated without regard to instruments having a maturity of less than one year from acquisition or derivative instruments (including swap agreements and futures contracts.) The portfolio turnover rate can be high and volatile due to the amount and timing of sales and purchases of fund shares during the period. Portfolio turnover rate is calculated on the basis of the Fund as a whole without distinguishing between classes of shares issued.
528 :: Financial Highlights
ProFunds Financial Highlights FOR THE PERIODS INDICATED
Selected data for a share of beneficial interest outstanding throughout the periods indicated.
Selected data for a share of beneficial interest outstanding throughout the periods indicated.
|
|
|
Investment Activities |
Distributions to
Shareholders From |
|
|
Ratios to Average Net Assets |
Supplemental Data | ||||||
|
|
Net Asset
Value,
Beginning
of Period |
Net
Investment
Income
(Loss)(a)
|
Net Realized
and
Unrealized
Gains
(Losses) on
Investments |
Total from
Investment
Activities |
Net
Investment
Income |
Total
Distributions |
Net
Asset
Value,
End of
Period |
Total
Return |
Gross
Expenses |
Net
Expenses |
Net
Investment
Income
(Loss) |
Net Assets,
End of Period
(000’s) |
Portfolio
Turnover
Rate(b)
|
|
Short Real Estate ProFund
Investor Class | |||||||||||||
|
Year Ended July 31, 2022 |
$8.19 |
(0.10) |
0.01(c)
|
(0.09) |
— |
— |
$8.10 |
(1.10)% |
5.81% |
1.78% |
(1.28)% |
$1,875 |
— |
|
Year Ended July 31, 2021 |
$11.45 |
(0.19) |
(3.07) |
(3.26) |
— |
— |
$8.19 |
(28.47)% |
4.69% |
1.78% |
(1.76)% |
$515 |
— |
|
Year Ended July 31, 2020 |
$12.89 |
(0.14) |
(1.30) |
(1.44) |
— |
— |
$11.45 |
(11.17)% |
4.05% |
1.78% |
(1.09)% |
$1,720 |
— |
|
Year Ended July 31, 2019 |
$14.61 |
0.06 |
(1.78) |
(1.72) |
— |
— |
$12.89 |
(11.77)% |
3.76% |
1.78% |
0.40% |
$1,199 |
— |
|
Year Ended July 31, 2018 |
$15.43 |
(0.06) |
(0.76) |
(0.82) |
— |
— |
$14.61 |
(5.31)% |
3.16% |
1.78% |
(0.38)% |
$1,453 |
— |
|
Service Class | |||||||||||||
|
Year Ended July 31, 2022 |
$7.19 |
(0.17) |
0.01(c) |
(0.16) |
— |
— |
$7.03 |
(2.23)% |
6.81% |
2.78% |
(2.28)% |
$14 |
— |
|
Year Ended July 31, 2021 |
$10.15 |
(0.28) |
(2.68) |
(2.96) |
— |
— |
$7.19 |
(29.16)% |
5.69% |
2.78% |
(2.76)% |
$14 |
— |
|
Year Ended July 31, 2020 |
$11.53 |
(0.25) |
(1.13) |
(1.38) |
— |
— |
$10.15 |
(12.05)% |
5.05% |
2.78% |
(2.09)% |
$20 |
— |
|
Year Ended July 31, 2019 |
$13.20 |
(0.07) |
(1.60) |
(1.67) |
— |
— |
$11.53 |
(12.58)% |
4.76% |
2.78% |
(0.60)% |
$15 |
— |
|
Year Ended July 31, 2018 |
$14.08 |
(0.20) |
(0.68) |
(0.88) |
— |
— |
$13.20 |
(6.25)% |
4.16% |
2.78% |
(1.38)% |
$364 |
— |
|
Short Small Cap ProFund
Investor Class | |||||||||||||
|
Year Ended July 31, 2022 |
$6.94 |
(0.11) |
0.58(c) |
0.47 |
— |
— |
$7.41 |
6.77% |
2.26% |
1.78% |
(1.56)% |
$1,412 |
— |
|
Year Ended July 31, 2021 |
$11.43 |
(0.15) |
(4.34) |
(4.49) |
— |
— |
$6.94 |
(39.23)% |
3.63% |
1.78% |
(1.77)% |
$1,089 |
— |
|
Year Ended July 31, 2020 |
$13.10 |
(0.13) |
(1.44) |
(1.57) |
(0.10) |
(0.10) |
$11.43 |
(12.09)% |
3.28% |
1.78% |
(0.98)% |
$1,802 |
— |
|
Year Ended July 31, 2019 |
$12.68 |
0.06 |
0.36 |
0.42 |
— |
— |
$13.10 |
3.31% |
2.76% |
1.78% |
0.44% |
$1,138 |
— |
|
Year Ended July 31, 2018 |
$15.29 |
(0.09) |
(2.52) |
(2.61) |
— |
— |
$12.68 |
(17.07)% |
2.73% |
1.86% |
(0.61)% |
$3,456 |
— |
|
Service Class | |||||||||||||
|
Year Ended July 31, 2022 |
$6.59 |
(0.18) |
0.54(c) |
0.36 |
— |
— |
$6.95 |
5.46% |
3.26% |
2.78% |
(2.56)% |
$162 |
— |
|
Year Ended July 31, 2021 |
$10.96 |
(0.23) |
(4.14) |
(4.37) |
— |
— |
$6.59 |
(39.87)% |
4.63% |
2.78% |
(2.77)% |
$24 |
— |
|
Year Ended July 31, 2020 |
$12.60 |
(0.26) |
(1.38) |
(1.64) |
— |
— |
$10.96 |
(13.02)% |
4.28% |
2.78% |
(1.98)% |
$33 |
— |
|
Year Ended July 31, 2019 |
$12.31 |
(0.07) |
0.36 |
0.29 |
— |
— |
$12.60 |
2.27% |
3.75% |
2.77% |
(0.55)% |
$33 |
— |
|
Year Ended July 31, 2018 |
$15.01 |
(0.22) |
(2.48) |
(2.70) |
— |
— |
$12.31 |
(17.92)% |
3.73% |
2.86% |
(1.61)% |
$155 |
— |
(a)
Per share net investment income (loss) has been calculated using the average daily shares method.
(b)
Portfolio turnover rate is calculated without regard to instruments having a maturity of less than one year from acquisition or derivative instruments (including swap agreements and futures contracts.) The portfolio turnover rate can be high and volatile due to the amount and timing of sales and purchases of fund shares during the period. Portfolio turnover rate is calculated on the basis of the Fund as a whole without distinguishing between classes of shares issued.
(c)
The amount shown for a share outstanding throughout the period does not accord with the change in aggregate gains and losses in the portfolio of securities during the period because of the timing of sales and purchases of fund shares in relation to fluctuating market values during the period.
Financial Highlights :: 529
ProFunds Financial Highlights FOR THE PERIODS INDICATED
Selected data for a share of beneficial interest outstanding throughout the periods indicated.
Selected data for a share of beneficial interest outstanding throughout the periods indicated.
|
|
|
Investment Activities |
Distributions to
Shareholders From |
|
|
Ratios to Average Net Assets |
Supplemental Data | ||||||
|
|
Net Asset
Value,
Beginning
of Period |
Net
Investment
Income
(Loss)(a)
|
Net Realized
and
Unrealized
Gains
(Losses) on
Investments |
Total from
Investment
Activities |
Net
Realized
Gain on
Investments |
Total
Distributions |
Net
Asset
Value,
End of
Period |
Total
Return |
Gross
Expenses |
Net
Expenses |
Net
Investment
Income
(Loss) |
Net Assets,
End of Period
(000’s) |
Portfolio
Turnover
Rate(b)
|
|
Small-Cap Growth ProFund
Investor Class | |||||||||||||
|
Year Ended July 31, 2022 |
$126.49 |
(0.96) |
(13.02) |
(13.98) |
(10.08) |
(10.08) |
$102.43 |
(12.08)%(c)
|
1.95% |
1.92% |
(0.87)% |
$9,587 |
462% |
|
Year Ended July 31, 2021 |
$86.21 |
(0.88) |
41.16 |
40.28 |
— |
— |
$126.49 |
46.72% |
1.60% |
1.60% |
(0.81)% |
$9,062 |
659% |
|
Year Ended July 31, 2020 |
$89.25 |
(0.66) |
(2.38) |
(3.04) |
— |
— |
$86.21 |
(3.41)% |
1.83% |
1.83% |
(0.80)% |
$7,867 |
442% |
|
Year Ended July 31, 2019 |
$99.63 |
(0.61) |
(6.40) |
(7.01) |
(3.37) |
(3.37) |
$89.25 |
(6.53)% |
1.65% |
1.65% |
(0.67)% |
$10,121 |
474% |
|
Year Ended July 31, 2018 |
$80.84 |
(0.72) |
19.51 |
18.79 |
— |
— |
$99.63 |
23.24% |
1.68% |
1.68% |
(0.81)% |
$28,543 |
629% |
|
Service Class | |||||||||||||
|
Year Ended July 31, 2022 |
$101.09 |
(1.86) |
(9.87) |
(11.73) |
(10.08) |
(10.08) |
$79.28 |
(12.94)%(c) |
2.95% |
2.92% |
(1.87)% |
$1,235 |
462% |
|
Year Ended July 31, 2021 |
$69.60 |
(1.76) |
33.25 |
31.49 |
— |
— |
$101.09 |
45.24% |
2.60% |
2.60% |
(1.81)% |
$833 |
659% |
|
Year Ended July 31, 2020 |
$72.78 |
(1.36) |
(1.82) |
(3.18) |
— |
— |
$69.60 |
(4.36)% |
2.83% |
2.83% |
(1.80)% |
$782 |
442% |
|
Year Ended July 31, 2019 |
$82.80 |
(1.37) |
(5.28) |
(6.65) |
(3.37) |
(3.37) |
$72.78 |
(7.46)% |
2.65% |
2.65% |
(1.67)% |
$1,905 |
474% |
|
Year Ended July 31, 2018 |
$67.86 |
(1.44) |
16.38 |
14.94 |
— |
— |
$82.80 |
22.02% |
2.68% |
2.68% |
(1.81)% |
$1,751 |
629% |
|
Small-Cap ProFund
Investor Class | |||||||||||||
|
Year Ended July 31, 2022 |
$117.00 |
(1.20) |
(17.78)(d) |
(18.98) |
— |
— |
$98.02 |
(16.22)%(e) |
2.18% |
1.78% |
(1.10)% |
$2,627 |
137% |
|
Year Ended July 31, 2021 |
$78.58 |
(1.51) |
39.93 |
38.42 |
— |
— |
$117.00 |
48.89% |
2.03% |
1.81% |
(1.40)% |
$9,241 |
115% |
|
Year Ended July 31, 2020 |
$85.23 |
(0.78) |
(5.87) |
(6.65) |
— |
— |
$78.58 |
(7.80)%(f) |
2.42% |
2.07%(g) |
(0.98)% |
$3,030 |
109% |
|
Year Ended July 31, 2019 |
$90.80 |
(0.04) |
(5.53) |
(5.57) |
— |
— |
$85.23 |
(6.13)% |
1.77% |
1.77% |
(0.05)% |
$8,261 |
11% |
|
Year Ended July 31, 2018 |
$78.18 |
(0.28) |
12.90 |
12.62 |
— |
— |
$90.80 |
16.14% |
1.58% |
1.58% |
(0.34)% |
$43,292 |
63% |
|
Service Class | |||||||||||||
|
Year Ended July 31, 2022 |
$95.85 |
(2.09) |
(14.25)(d) |
(16.34) |
— |
— |
$79.51 |
(17.05)%(e) |
3.18% |
2.78% |
(2.10)% |
$320 |
137% |
|
Year Ended July 31, 2021 |
$65.02 |
(2.40) |
33.23 |
30.83 |
— |
— |
$95.85 |
47.43% |
3.03% |
2.81% |
(2.40)% |
$668 |
115% |
|
Year Ended July 31, 2020 |
$71.24 |
(1.45) |
(4.77) |
(6.22) |
— |
— |
$65.02 |
(8.74)%(f) |
3.42% |
3.07%(g) |
(1.98)% |
$237 |
109% |
|
Year Ended July 31, 2019 |
$76.65 |
(0.77) |
(4.64) |
(5.41) |
— |
— |
$71.24 |
(7.05)% |
2.77% |
2.77% |
(1.05)% |
$408 |
11% |
|
Year Ended July 31, 2018 |
$66.62 |
(1.01) |
11.04 |
10.03 |
— |
— |
$76.65 |
15.06% |
2.58% |
2.58% |
(1.34)% |
$2,705 |
63% |
(a)
Per share net investment income (loss) has been calculated using the average daily shares method.
(b)
Portfolio turnover rate is calculated without regard to instruments having a maturity of less than one year from acquisition or derivative instruments (including swap agreements and futures contracts.) The portfolio turnover rate can be high and volatile due to the amount and timing of sales and purchases of fund shares during the period. Portfolio turnover rate is calculated on the basis of the Fund as a whole without distinguishing between classes of shares issued.
(c)
During the year ended July 31, 2022, the Fund received monies related to certain nonrecurring litigation settlements. The corresponding impact to the total return was 0.04%.
(d)
The amount shown for a share outstanding throughout the period does not accord with the change in aggregate gains and losses in the portfolio of securities during the period because of the timing of sales and purchases of fund shares in relation to fluctuating market values during the period.
(e)
During the year ended July 31, 2022, the Fund received monies related to certain nonrecurring litigation settlements. The corresponding impact to the total return was 0.06%.
(f)
During the year ended July 31, 2020, the Fund received monies related to certain nonrecurring litigation settlements. The corresponding impact to the total return was 0.15%.
(g)
The expense ratio does not correlate to the applicable expense limits in place during the period given that the annual contractual expense limitation is applied for the one year periods ended November 30th of each year, instead of coinciding with the July 31st year end. Details of the current expense limitation in effect can be found in the Trust’s annual report dated July 31, 2022.
530 :: Financial Highlights
ProFunds Financial Highlights FOR THE PERIODS INDICATED
Selected data for a share of beneficial interest outstanding throughout the periods indicated.
Selected data for a share of beneficial interest outstanding throughout the periods indicated.
|
|
|
Investment Activities |
Distributions to
Shareholders From |
|
|
Ratios to Average Net Assets |
Supplemental Data | |||||||
|
|
Net Asset
Value,
Beginning
of Period |
Net
Investment
Income
(Loss)(a)
|
Net Realized
and
Unrealized
Gains
(Losses) on
Investments |
Total from
Investment
Activities |
Net
Investment
Income |
Net
Realized
Gain on
Investments |
Total
Distributions |
Net
Asset
Value,
End of
Period |
Total
Return |
Gross
Expenses |
Net
Expenses |
Net
Investment
Income
(Loss) |
Net Assets,
End of Period
(000’s) |
Portfolio
Turnover
Rate(b)
|
|
Small-Cap Value ProFund
Investor Class | ||||||||||||||
|
Year Ended July 31, 2022 |
$104.97 |
(0.02) |
(4.11) |
(4.13) |
(0.20) |
— |
(0.20) |
$100.64 |
(3.94)% |
1.68% |
1.68% |
(0.02)% |
$8,441 |
638% |
|
Year Ended July 31, 2021 |
$64.53 |
0.11 |
40.33 |
40.44 |
— |
— |
— |
$104.97 |
62.67% |
1.61% |
1.61% |
0.12% |
$14,775 |
547% |
|
Year Ended July 31, 2020 |
$78.32 |
(0.16) |
(13.57) |
(13.73) |
(0.06) |
— |
(0.06) |
$64.53 |
(17.55)% |
2.02% |
2.02%(c) |
(0.22)% |
$4,232 |
624% |
|
Year Ended July 31, 2019 |
$98.51 |
(0.23) |
(10.96) |
(11.19) |
— |
(9.00) |
(9.00) |
$78.32 |
(9.96)% |
1.74% |
1.74% |
(0.27)% |
$5,380 |
427% |
|
Year Ended July 31, 2018 |
$83.05 |
(0.19) |
15.65 |
15.46 |
— |
— |
— |
$98.51 |
18.61% |
1.75% |
1.75% |
(0.21)% |
$32,670 |
447% |
|
Service Class | ||||||||||||||
|
Year Ended July 31, 2022 |
$84.68 |
(0.86) |
(3.31) |
(4.17) |
— |
— |
— |
$80.51 |
(4.90)% |
2.68% |
2.68% |
(1.02)% |
$790 |
638% |
|
Year Ended July 31, 2021 |
$52.57 |
(0.67) |
32.78 |
32.11 |
— |
— |
— |
$84.68 |
61.08% |
2.61% |
2.61% |
(0.88)% |
$770 |
547% |
|
Year Ended July 31, 2020 |
$64.40 |
(0.74) |
(11.09) |
(11.83) |
— |
— |
— |
$52.57 |
(18.37)% |
3.02% |
3.02%(c) |
(1.22)% |
$320 |
624% |
|
Year Ended July 31, 2019 |
$83.80 |
(0.92) |
(9.48) |
(10.40) |
— |
(9.00) |
(9.00) |
$64.40 |
(10.83)% |
2.74% |
2.74% |
(1.27)% |
$429 |
427% |
|
Year Ended July 31, 2018 |
$71.35 |
(0.96) |
13.41 |
12.45 |
— |
— |
— |
$83.80 |
17.45% |
2.75% |
2.75% |
(1.21)% |
$480 |
447% |
|
Technology UltraSector ProFund
Investor Class | ||||||||||||||
|
Year Ended July 31, 2022 |
$124.76 |
(1.07) |
(24.11) |
(25.18) |
— |
(9.14) |
(9.14) |
$90.44 |
(22.70)% |
1.48% |
1.48% |
(0.93)% |
$44,187 |
51% |
|
Year Ended July 31, 2021 |
$75.45 |
(0.90) |
52.38 |
51.48 |
— |
(2.17) |
(2.17) |
$124.76 |
69.21% |
1.55% |
1.55% |
(0.97)% |
$95,384 |
114% |
|
Year Ended July 31, 2020(d) |
$49.47 |
(0.29) |
26.27 |
25.98 |
— |
— |
— |
$75.45 |
52.51% |
1.65% |
1.65% |
(0.51)% |
$86,988 |
177% |
|
Year Ended July 31, 2019(d) |
$42.49 |
0.03 |
7.03 |
7.06 |
— |
(0.08) |
(0.08) |
$49.47 |
16.70% |
1.58% |
1.58% |
0.06% |
$83,112 |
332% |
|
Year Ended July 31, 2018(d) |
$32.01 |
(0.07) |
12.23 |
12.16 |
— |
(1.68) |
(1.68) |
$42.49 |
38.70% |
1.49% |
1.49% |
(0.19)% |
$96,683 |
174% |
|
Service Class | ||||||||||||||
|
Year Ended July 31, 2022 |
$101.80 |
(2.00) |
(18.72) |
(20.72) |
— |
(9.14) |
(9.14) |
$71.94 |
(23.48)% |
2.48% |
2.48% |
(1.93)% |
$3,393 |
51% |
|
Year Ended July 31, 2021 |
$62.48 |
(1.70) |
43.19 |
41.49 |
— |
(2.17) |
(2.17) |
$101.80 |
67.57% |
2.55% |
2.55% |
(1.97)% |
$6,454 |
114% |
|
Year Ended July 31, 2020(d) |
$41.38 |
(0.75) |
21.85 |
21.10 |
— |
— |
— |
$62.48 |
50.97% |
2.65% |
2.65% |
(1.51)% |
$2,858 |
177% |
|
Year Ended July 31, 2019(d) |
$35.92 |
(0.34) |
5.88 |
5.54 |
— |
(0.08) |
(0.08) |
$41.38 |
15.53% |
2.58% |
2.58% |
(0.94)% |
$3,082 |
332% |
|
Year Ended July 31, 2018(d) |
$27.54 |
(0.40) |
10.46 |
10.06 |
— |
(1.68) |
(1.68) |
$35.92 |
37.31% |
2.49% |
2.49% |
(1.19)% |
$5,780 |
174% |
(a)
Per share net investment income (loss) has been calculated using the average daily shares method.
(b)
Portfolio turnover rate is calculated without regard to instruments having a maturity of less than one year from acquisition or derivative instruments (including swap agreements and futures contracts.) The portfolio turnover rate can be high and volatile due to the amount and timing of sales and purchases of fund shares during the period. Portfolio turnover rate is calculated on the basis of the Fund as a whole without distinguishing between classes of shares issued.
(c)
The expense ratio does not correlate to the applicable expense limits in place during the period given that the annual contractual expense limitation is applied for the one year periods ended November 30th of each year, instead of coinciding with the July 31st year end. Details of the current expense limitation in effect can be found in the Trust’s annual report dated July 31, 2022.
(d)
As described in Note 9 of the Notes to Financial Statements in the most recent Annual Report, share amounts have been adjusted for 3:1 share split that occurred on November 18, 2019.
Financial Highlights :: 531
ProFunds Financial Highlights FOR THE PERIODS INDICATED
Selected data for a share of beneficial interest outstanding throughout the periods indicated.
Selected data for a share of beneficial interest outstanding throughout the periods indicated.
|
|
|
Investment Activities |
Distributions to
Shareholders From |
|
|
Ratios to Average Net Assets |
Supplemental Data | ||||||
|
|
Net Asset
Value,
Beginning
of Period |
Net
Investment
Income
(Loss)(a)
|
Net Realized
and
Unrealized
Gains
(Losses) on
Investments |
Total from
Investment
Activities |
Net
Investment
Income |
Total
Distributions |
Net
Asset
Value,
End of
Period |
Total
Return |
Gross
Expenses |
Net
Expenses |
Net
Investment
Income
(Loss) |
Net Assets,
End of Period
(000’s) |
Portfolio
Turnover
Rate(b)
|
|
Telecommunications UltraSector ProFund
Investor Class | |||||||||||||
|
Year Ended July 31, 2022 |
$25.43 |
0.11 |
(4.72) |
(4.61) |
(0.13) |
(0.13) |
$20.69 |
(18.25)% |
4.57% |
1.78% |
0.45% |
$800 |
229% |
|
Year Ended July 31, 2021 |
$19.67 |
0.10 |
5.78 |
5.88 |
(0.12) |
(0.12) |
$25.43 |
30.01% |
4.54% |
1.78% |
0.47% |
$1,118 |
286% |
|
Year Ended July 31, 2020 |
$21.80 |
0.12 |
(1.88) |
(1.76) |
(0.37) |
(0.37) |
$19.67 |
(8.22)% |
5.13% |
1.78% |
0.63% |
$862 |
132% |
|
Year Ended July 31, 2019 |
$21.33 |
0.07 |
0.92 |
0.99 |
(0.52) |
(0.52) |
$21.80 |
5.18% |
2.16% |
1.80% |
0.36% |
$1,468 |
1,449% |
|
Year Ended July 31, 2018 |
$24.17 |
0.39 |
(2.30) |
(1.91) |
(0.93) |
(0.93) |
$21.33 |
(8.45)% |
2.64% |
1.95% |
1.74% |
$1,900 |
412% |
|
Service Class | |||||||||||||
|
Year Ended July 31, 2022 |
$24.41 |
(0.13) |
(4.52) |
(4.65) |
— |
— |
$19.76 |
(19.05)% |
5.57% |
2.78% |
(0.55)% |
$21 |
229% |
|
Year Ended July 31, 2021 |
$18.96 |
(0.11) |
5.56 |
5.45 |
— |
— |
$24.41 |
28.74% |
5.54% |
2.78% |
(0.53)% |
$56 |
286% |
|
Year Ended July 31, 2020 |
$20.99 |
(0.07) |
(1.86) |
(1.93) |
(0.10) |
(0.10) |
$18.96 |
(9.22)% |
6.13% |
2.78% |
(0.37)% |
$44 |
132% |
|
Year Ended July 31, 2019 |
$20.24 |
(0.13) |
0.96 |
0.83 |
(0.08) |
(0.08) |
$20.99 |
4.17% |
3.16% |
2.80% |
(0.64)% |
$75 |
1,449% |
|
Year Ended July 31, 2018 |
$22.78 |
0.18 |
(2.26) |
(2.08) |
(0.46) |
(0.46) |
$20.24 |
(9.41)% |
3.64% |
2.95% |
0.74% |
$91 |
412% |
|
UltraBear ProFund
Investor Class | |||||||||||||
|
Year Ended July 31, 2022 |
$21.42 |
(0.29) |
(0.43)(c) |
(0.72) |
— |
— |
$20.70 |
(3.36)% |
1.97% |
1.78% |
(1.40)% |
$11,191 |
— |
|
Year Ended July 31, 2021(d) |
$43.58 |
(0.53) |
(21.48) |
(22.01) |
(0.15) |
(0.15) |
$21.42 |
(50.64)% |
2.08% |
1.78% |
(1.77)% |
$5,438 |
— |
|
Year Ended July 31, 2020(d) |
$76.76 |
(0.52) |
(32.66) |
(33.18) |
— |
— |
$43.58 |
(43.20)% |
2.04% |
1.78% |
(0.80)% |
$9,880 |
— |
|
Year Ended July 31, 2019(d) |
$91.23 |
0.40 |
(14.87) |
(14.47) |
— |
— |
$76.76 |
(15.87)% |
1.95% |
1.84% |
0.44% |
$8,869 |
— |
|
Year Ended July 31, 2018(d) |
$125.67 |
(0.56) |
(33.88) |
(34.44) |
— |
— |
$91.23 |
(27.40)% |
1.89% |
1.87% |
(0.54)% |
$8,335 |
— |
|
Service Class | |||||||||||||
|
Year Ended July 31, 2022 |
$19.19 |
(0.48) |
(0.38)(c) |
(0.86) |
— |
— |
$18.33 |
(4.43)% |
2.97% |
2.78% |
(2.40)% |
$10 |
— |
|
Year Ended July 31, 2021(d) |
$39.25 |
(0.81) |
(19.25) |
(20.06) |
— |
— |
$19.19 |
(51.07)% |
3.08% |
2.78% |
(2.77)% |
$14 |
— |
|
Year Ended July 31, 2020(d) |
$69.86 |
(1.12) |
(29.49) |
(30.61) |
— |
— |
$39.25 |
(43.81)% |
3.04% |
2.78% |
(1.80)% |
$72 |
— |
|
Year Ended July 31, 2019(d) |
$83.88 |
(0.44) |
(13.58) |
(14.02) |
— |
— |
$69.86 |
(16.74)% |
2.95% |
2.84% |
(0.56)% |
$265 |
— |
|
Year Ended July 31, 2018(d) |
$116.67 |
(1.48) |
(31.31) |
(32.79) |
— |
— |
$83.88 |
(28.11)% |
2.89% |
2.87% |
(1.54)% |
$3,607 |
— |
(a)
Per share net investment income (loss) has been calculated using the average daily shares method.
(b)
Portfolio turnover rate is calculated without regard to instruments having a maturity of less than one year from acquisition or derivative instruments (including swap agreements and futures contracts.) The portfolio turnover rate can be high and volatile due to the amount and timing of sales and purchases of fund shares during the period. Portfolio turnover rate is calculated on the basis of the Fund as a whole without distinguishing between classes of shares issued.
(c)
The amount shown for a share outstanding throughout the period does not accord with the change in aggregate gains and losses in the portfolio of securities during the period because of the timing of sales and purchases of fund shares in relation to fluctuating market values during the period.
(d)
As described in Note 9 of the Notes to Financial Statements in the most recent Annual Report, share amounts have been adjusted for 1:4 reverse share split that occurred on December 14, 2020.
532 :: Financial Highlights
ProFunds Financial Highlights FOR THE PERIODS INDICATED
Selected data for a share of beneficial interest outstanding throughout the periods indicated.
Selected data for a share of beneficial interest outstanding throughout the periods indicated.
|
|
|
Investment Activities |
Distributions to
Shareholders From |
|
|
Ratios to Average Net Assets |
Supplemental Data | |||||||
|
|
Net Asset
Value,
Beginning
of Period |
Net
Investment
Income
(Loss)(a)
|
Net Realized
and
Unrealized
Gains
(Losses) on
Investments |
Total from
Investment
Activities |
Net
Investment
Income |
Net
Realized
Gain on
Investments |
Total
Distributions |
Net
Asset
Value,
End of
Period |
Total
Return |
Gross
Expenses |
Net
Expenses |
Net
Investment
Income
(Loss) |
Net Assets,
End of Period
(000’s) |
Portfolio
Turnover
Rate(b)
|
|
UltraBull ProFund
Investor Class | ||||||||||||||
|
Year Ended July 31, 2022 |
$112.96 |
(0.33) |
(15.63) |
(15.96) |
— |
(6.97) |
(6.97) |
$90.03 |
(14.96)% |
1.46% |
1.46% |
(0.31)% |
$101,714 |
16% |
|
Year Ended July 31, 2021 |
$72.03 |
(0.46) |
51.97 |
51.51 |
(0.41) |
(10.17) |
(10.58) |
$112.96 |
77.44% |
1.51% |
1.51% |
(0.51)% |
$128,079 |
31% |
|
Year Ended July 31, 2020 |
$67.93 |
0.06 |
4.37 |
4.43 |
(0.33) |
— |
(0.33) |
$72.03 |
6.48% |
1.60% |
1.60% |
0.09% |
$99,875 |
151% |
|
Year Ended July 31, 2019 |
$62.85 |
0.33 |
5.03 |
5.36 |
(0.06) |
(0.22) |
(0.28) |
$67.93 |
8.54% |
1.50% |
1.50% |
0.54% |
$174,947 |
159% |
|
Year Ended July 31, 2018(c) |
$49.15 |
0.18 |
13.52 |
13.70 |
— |
— |
— |
$62.85 |
27.89% |
1.40% |
1.40% |
0.31% |
$185,706 |
174% |
|
Service Class | ||||||||||||||
|
Year Ended July 31, 2022 |
$90.15 |
(1.15) |
(12.11) |
(13.26) |
— |
(6.97) |
(6.97) |
$69.92 |
(15.80)% |
2.46% |
2.46% |
(1.31)% |
$2,036 |
16% |
|
Year Ended July 31, 2021 |
$59.40 |
(1.20) |
42.12 |
40.92 |
— |
(10.17) |
(10.17) |
$90.15 |
75.68% |
2.51% |
2.51% |
(1.51)% |
$2,785 |
31% |
|
Year Ended July 31, 2020 |
$56.36 |
(0.49) |
3.53 |
3.04 |
— |
— |
— |
$59.40 |
5.39% |
2.60% |
2.60% |
(0.91)% |
$1,808 |
151% |
|
Year Ended July 31, 2019 |
$52.65 |
(0.17) |
4.10 |
3.93 |
— |
(0.22) |
(0.22) |
$56.36 |
7.46% |
2.50% |
2.50% |
(0.46)% |
$1,389 |
159% |
|
Year Ended July 31, 2018(c) |
$41.58 |
(0.30) |
11.37 |
11.07 |
— |
— |
— |
$52.65 |
26.62% |
2.40% |
2.40% |
(0.69)% |
$1,838 |
174% |
|
UltraChina ProFund
Investor Class | ||||||||||||||
|
Year Ended July 31, 2022 |
$11.80 |
(0.02) |
(8.35) |
(8.37) |
— |
— |
— |
$3.43 |
(70.93)% |
1.74% |
1.74% |
(0.37)% |
$15,352 |
243% |
|
Year Ended July 31, 2021 |
$17.31 |
(0.23) |
(5.28) |
(5.51) |
— |
— |
— |
$11.80 |
(31.83)% |
1.67% |
1.67% |
(1.05)% |
$17,626 |
255% |
|
Year Ended July 31, 2020 |
$11.42 |
(0.05) |
5.95 |
5.90 |
(0.01) |
— |
(0.01) |
$17.31 |
51.69% |
1.79% |
1.79% |
(0.42)% |
$14,973 |
314% |
|
Year Ended July 31, 2019 |
$17.79 |
(0.01) |
(6.36) |
(6.37) |
— |
— |
— |
$11.42 |
(35.81)% |
1.70% |
1.70% |
(0.05)% |
$21,723 |
360% |
|
Year Ended July 31, 2018 |
$16.41 |
(0.01) |
1.53 |
1.52 |
(0.14) |
— |
(0.14) |
$17.79 |
9.24% |
1.51% |
1.51% |
(0.07)% |
$27,453 |
312% |
|
Service Class | ||||||||||||||
|
Year Ended July 31, 2022 |
$10.37 |
(0.06) |
(7.32) |
(7.38) |
— |
— |
— |
$2.99 |
(71.17)% |
2.74% |
2.74% |
(1.37)% |
$788 |
243% |
|
Year Ended July 31, 2021 |
$15.36 |
(0.42) |
(4.57) |
(4.99) |
— |
— |
— |
$10.37 |
(32.49)% |
2.67% |
2.67% |
(2.05)% |
$423 |
255% |
|
Year Ended July 31, 2020 |
$10.23 |
(0.17) |
5.30 |
5.13 |
— |
— |
— |
$15.36 |
50.15% |
2.79% |
2.79% |
(1.42)% |
$2,654 |
314% |
|
Year Ended July 31, 2019 |
$16.11 |
(0.12) |
(5.76) |
(5.88) |
— |
— |
— |
$10.23 |
(36.50)% |
2.70% |
2.70% |
(1.05)% |
$405 |
360% |
|
Year Ended July 31, 2018 |
$14.97 |
(0.19) |
1.41 |
1.22 |
(0.08) |
— |
(0.08) |
$16.11 |
8.10% |
2.51% |
2.51% |
(1.07)% |
$1,006 |
312% |
(a)
Per share net investment income (loss) has been calculated using the average daily shares method.
(b)
Portfolio turnover rate is calculated without regard to instruments having a maturity of less than one year from acquisition or derivative instruments (including swap agreements and futures contracts.) The portfolio turnover rate can be high and volatile due to the amount and timing of sales and purchases of fund shares during the period. Portfolio turnover rate is calculated on the basis of the Fund as a whole without distinguishing between classes of shares issued.
(c)
As described in Note 9 of the Notes to Financial Statements in the most recent Annual Report, share amounts have been adjusted for 3:1 share split that occurred on January 22, 2018.
Financial Highlights :: 533
ProFunds Financial Highlights FOR THE PERIODS INDICATED
Selected data for a share of beneficial interest outstanding throughout the periods indicated.
Selected data for a share of beneficial interest outstanding throughout the periods indicated.
|
|
|
Investment Activities |
Distributions to
Shareholders From |
|
|
Ratios to Average Net Assets |
Supplemental Data | |||||||
|
|
Net Asset
Value,
Beginning
of Period |
Net
Investment
Income
(Loss)(a)
|
Net Realized
and
Unrealized
Gains
(Losses) on
Investments |
Total from
Investment
Activities |
Net
Investment
Income |
Net
Realized
Gain on
Investments |
Total
Distributions |
Net
Asset
Value,
End of
Period |
Total
Return |
Gross
Expenses |
Net
Expenses |
Net
Investment
Income
(Loss) |
Net Assets,
End of Period
(000’s) |
Portfolio
Turnover
Rate(b)
|
|
UltraDow 30 ProFund
Investor Class | ||||||||||||||
|
Year Ended July 31, 2022 |
$66.90 |
(0.08) |
(7.91) |
(7.99) |
— |
(4.27) |
(4.27) |
$54.64 |
(13.07)% |
1.54% |
1.54% |
(0.14)% |
$32,075 |
10% |
|
Year Ended July 31, 2021 |
$39.32 |
(0.24) |
28.83 |
28.59 |
— |
(1.01) |
(1.01) |
$66.90 |
73.58% |
1.59% |
1.59% |
(0.45)% |
$39,210 |
16% |
|
Year Ended July 31, 2020(c)
|
$47.25 |
0.11 |
(7.02) |
(6.91) |
(0.30) |
(0.72) |
(1.02) |
$39.32 |
(15.15)% |
1.72% |
1.72% |
0.26% |
$26,124 |
6% |
|
Year Ended July 31, 2019(c) |
$43.77 |
0.30 |
3.52 |
3.82 |
(0.34) |
— |
(0.34) |
$47.25 |
8.97% |
1.62% |
1.62% |
0.68% |
$38,924 |
1% |
|
Year Ended July 31, 2018(c)
|
$33.52 |
0.12 |
10.90 |
11.02 |
(0.01) |
(0.76) |
(0.77) |
$43.77 |
32.94% |
1.51% |
1.51% |
0.29% |
$37,484 |
59% |
|
Service Class | ||||||||||||||
|
Year Ended July 31, 2022 |
$57.42 |
(0.62) |
(6.60) |
(7.22) |
— |
(4.27) |
(4.27) |
$45.93 |
(13.94)% |
2.54% |
2.54% |
(1.14)% |
$738 |
10% |
|
Year Ended July 31, 2021 |
$34.20 |
(0.71) |
24.94 |
24.23 |
— |
(1.01) |
(1.01) |
$57.42 |
71.85% |
2.59% |
2.59% |
(1.45)% |
$1,203 |
16% |
|
Year Ended July 31, 2020(c) |
$41.33 |
(0.27) |
(6.14) |
(6.41) |
— |
(0.72) |
(0.72) |
$34.20 |
(15.95)% |
2.72% |
2.72% |
(0.74)% |
$648 |
6% |
|
Year Ended July 31, 2019(c) |
$38.31 |
(0.09) |
3.11 |
3.02 |
— |
— |
— |
$41.33 |
7.87% |
2.62% |
2.62% |
(0.32)% |
$732 |
1% |
|
Year Ended July 31, 2018(c) |
$29.70 |
(0.24) |
9.61 |
9.37 |
— |
(0.76) |
(0.76) |
$38.31 |
31.62% |
2.51% |
2.51% |
(0.71)% |
$1,584 |
59% |
|
UltraEmerging Markets ProFund
Investor Class | ||||||||||||||
|
Year Ended July 31, 2022 |
$79.62 |
0.57 |
(38.41) |
(37.84) |
— |
— |
— |
$41.78 |
(47.53)%(d) |
1.99% |
1.92% |
1.00% |
$5,666 |
265% |
|
Year Ended July 31, 2021 |
$62.20 |
(0.56) |
17.98 |
17.42 |
— |
— |
— |
$79.62 |
28.02% |
1.78% |
1.77% |
(0.64)% |
$8,976 |
211% |
|
Year Ended July 31, 2020 |
$51.58 |
—(e) |
10.62 |
10.62 |
— |
— |
— |
$62.20 |
20.59%(f) |
1.94% |
1.85% |
—(g) |
$13,176 |
240% |
|
Year Ended July 31, 2019 |
$63.07 |
0.05 |
(11.25) |
(11.20) |
(0.29) |
— |
(0.29) |
$51.58 |
(17.70)% |
1.84% |
1.84% |
0.10% |
$12,846 |
137% |
|
Year Ended July 31, 2018 |
$61.63 |
0.25 |
1.30 |
1.55 |
(0.11) |
— |
(0.11) |
$63.07 |
2.50% |
1.52% |
1.52% |
0.37% |
$22,713 |
125% |
|
Service Class | ||||||||||||||
|
Year Ended July 31, 2022 |
$72.13 |
0.02 |
(34.67) |
(34.65) |
— |
— |
— |
$37.48 |
(48.05)%(d) |
2.99% |
2.92% |
—(g) |
$95 |
265% |
|
Year Ended July 31, 2021 |
$56.90 |
(1.36) |
16.59 |
15.23 |
— |
— |
— |
$72.13 |
26.78% |
2.78% |
2.77% |
(1.64)% |
$345 |
211% |
|
Year Ended July 31, 2020 |
$47.65 |
(0.47) |
9.72 |
9.25 |
— |
— |
— |
$56.90 |
19.41%(f) |
2.94% |
2.85% |
(1.00)% |
$353 |
240% |
|
Year Ended July 31, 2019 |
$58.50 |
(0.44) |
(10.41) |
(10.85) |
— |
— |
— |
$47.65 |
(18.55)% |
2.84% |
2.84% |
(0.90)% |
$213 |
137% |
|
Year Ended July 31, 2018 |
$57.67 |
(0.38) |
1.21 |
0.83 |
— |
— |
— |
$58.50 |
1.44% |
2.52% |
2.52% |
(0.63)% |
$623 |
125% |
(a)
Per share net investment income (loss) has been calculated using the average daily shares method.
(b)
Portfolio turnover rate is calculated without regard to instruments having a maturity of less than one year from acquisition or derivative instruments (including swap agreements and futures contracts.) The portfolio turnover rate can be high and volatile due to the amount and timing of sales and purchases of fund shares during the period. Portfolio turnover rate is calculated on the basis of the Fund as a whole without distinguishing between classes of shares issued.
(c)
As described in Note 9 of the Notes to Financial Statements in the most recent Annual Report, share amounts have been adjusted for 3:1 share split that occurred on November 18, 2019.
(d)
During the year ended July 31, 2022, the Fund received monies related to certain nonrecurring litigation settlements. The corresponding impact to the total return was 0.06%.
(e)
Amount is less than $0.005.
(f)
During the year ended July 31, 2020, the Fund received monies related to certain nonrecurring litigation settlements. The corresponding impact to the total return was 1.01%.
(g)
Amount is less than 0.005%.
534 :: Financial Highlights
ProFunds Financial Highlights FOR THE PERIODS INDICATED
Selected data for a share of beneficial interest outstanding throughout the periods indicated.
Selected data for a share of beneficial interest outstanding throughout the periods indicated.
|
|
|
Investment Activities |
Distributions to
Shareholders From |
|
|
Ratios to Average Net Assets |
Supplemental Data | ||||||
|
|
Net Asset
Value,
Beginning
of Period |
Net
Investment
Income
(Loss)(a)
|
Net Realized
and
Unrealized
Gains
(Losses) on
Investments |
Total from
Investment
Activities |
Net
Realized
Gain on
Investments |
Total
Distributions |
Net
Asset
Value,
End of
Period |
Total
Return |
Gross
Expenses |
Net
Expenses |
Net
Investment
Income
(Loss) |
Net Assets,
End of Period
(000’s) |
Portfolio
Turnover
Rate(b)
|
|
UltraInternational ProFund
Investor Class | |||||||||||||
|
Year Ended July 31, 2022 |
$21.26 |
(0.29) |
(6.26) |
(6.55) |
— |
— |
$14.71 |
(30.81)% |
2.82% |
1.78% |
(1.55)% |
$2,322 |
— |
|
Year Ended July 31, 2021 |
$13.16 |
(0.32) |
8.42 |
8.10 |
— |
— |
$21.26 |
61.55% |
2.31% |
1.78% |
(1.76)% |
$3,101 |
— |
|
Year Ended July 31, 2020 |
$15.58 |
(0.09) |
(2.33) |
(2.42) |
— |
— |
$13.16 |
(15.53)% |
2.61% |
1.87% |
(0.60)% |
$4,078 |
— |
|
Year Ended July 31, 2019 |
$17.99 |
0.03 |
(2.44) |
(2.41) |
— |
— |
$15.58 |
(13.40)% |
2.30% |
2.04%(c) |
0.16% |
$2,989 |
— |
|
Year Ended July 31, 2018 |
$17.10 |
(0.07) |
0.96 |
0.89 |
— |
— |
$17.99 |
5.20% |
1.62% |
1.62% |
(0.40)% |
$9,114 |
— |
|
Service Class | |||||||||||||
|
Year Ended July 31, 2022 |
$18.65 |
(0.46) |
(5.43) |
(5.89) |
— |
— |
$12.76 |
(31.53)% |
3.82% |
2.78% |
(2.55)% |
$25 |
— |
|
Year Ended July 31, 2021 |
$11.64 |
(0.48) |
7.49 |
7.01 |
— |
— |
$18.65 |
60.22% |
3.31% |
2.78% |
(2.76)% |
$51 |
— |
|
Year Ended July 31, 2020 |
$13.92 |
(0.22) |
(2.06) |
(2.28) |
— |
— |
$11.64 |
(16.38)% |
3.61% |
2.87% |
(1.60)% |
$70 |
— |
|
Year Ended July 31, 2019 |
$16.23 |
(0.11) |
(2.20) |
(2.31) |
— |
— |
$13.92 |
(14.23)% |
3.29% |
3.03%(c) |
(0.83)% |
$47 |
— |
|
Year Ended July 31, 2018 |
$15.59 |
(0.24) |
0.88 |
0.64 |
— |
— |
$16.23 |
4.11% |
2.62% |
2.62% |
(1.40)% |
$184 |
— |
|
UltraJapan ProFund
Investor Class | |||||||||||||
|
Year Ended July 31, 2022 |
$31.75 |
(0.45) |
1.09 |
0.64 |
(4.34) |
(4.34) |
$28.05 |
(0.05)% |
1.81% |
1.78% |
(1.56)% |
$12,750 |
— |
|
Year Ended July 31, 2021 |
$20.81 |
(0.56) |
11.50 |
10.94 |
— |
— |
$31.75 |
52.57% |
1.80% |
1.78% |
(1.77)% |
$14,600 |
— |
|
Year Ended July 31, 2020 |
$21.87 |
(0.17) |
(0.89) |
(1.06) |
— |
— |
$20.81 |
(4.85)% |
1.94% |
1.86% |
(0.77)% |
$10,556 |
— |
|
Year Ended July 31, 2019 |
$24.93 |
0.04 |
(2.61) |
(2.57) |
(0.49) |
(0.49) |
$21.87 |
(10.75)% |
1.83% |
1.83% |
0.16% |
$13,423 |
— |
|
Year Ended July 31, 2018 |
$19.76 |
(0.11) |
5.28 |
5.17 |
— |
— |
$24.93 |
26.16% |
1.66% |
1.66% |
(0.45)% |
$20,993 |
— |
|
Service Class | |||||||||||||
|
Year Ended July 31, 2022 |
$26.53 |
(0.69) |
1.10 |
0.41 |
(4.34) |
(4.34) |
$22.60 |
(1.04)% |
2.81% |
2.78% |
(2.56)% |
$115 |
— |
|
Year Ended July 31, 2021 |
$17.56 |
(0.82) |
9.79 |
8.97 |
— |
— |
$26.53 |
51.08% |
2.80% |
2.78% |
(2.77)% |
$143 |
— |
|
Year Ended July 31, 2020 |
$18.64 |
(0.36) |
(0.72) |
(1.08) |
— |
— |
$17.56 |
(5.79)% |
2.94% |
2.86% |
(1.77)% |
$109 |
— |
|
Year Ended July 31, 2019 |
$21.52 |
(0.16) |
(2.23) |
(2.39) |
(0.49) |
(0.49) |
$18.64 |
(11.63)% |
2.83% |
2.83% |
(0.84)% |
$258 |
— |
|
Year Ended July 31, 2018 |
$17.23 |
(0.31) |
4.60 |
4.29 |
— |
— |
$21.52 |
24.90% |
2.66% |
2.66% |
(1.45)% |
$237 |
— |
(a)
Per share net investment income (loss) has been calculated using the average daily shares method.
(b)
Portfolio turnover rate is calculated without regard to instruments having a maturity of less than one year from acquisition or derivative instruments (including swap agreements and futures contracts.) The portfolio turnover rate can be high and volatile due to the amount and timing of sales and purchases of fund shares during the period. Portfolio turnover rate is calculated on the basis of the Fund as a whole without distinguishing between classes of shares issued.
(c)
The expense ratio does not correlate to the applicable expense limits in place during the period given that the annual contractual expense limitation is applied for the one year periods ended November 30th of each year, instead of coinciding with the July 31st year end. Details of the current expense limitation in effect can be found in the Trust’s annual report dated July 31, 2022.
Financial Highlights :: 535
ProFunds Financial Highlights FOR THE PERIODS INDICATED
Selected data for a share of beneficial interest outstanding throughout the periods indicated.
Selected data for a share of beneficial interest outstanding throughout the periods indicated.
|
|
|
Investment Activities |
Distributions to
Shareholders From |
|
|
Ratios to Average Net Assets |
Supplemental Data | |||||||
|
|
Net Asset
Value,
Beginning
of Period |
Net
Investment
Income
(Loss)(a)
|
Net Realized
and
Unrealized
Gains
(Losses) on
Investments |
Total from
Investment
Activities |
Net
Investment
Income |
Net
Realized
Gain on
Investments |
Total
Distributions |
Net
Asset
Value,
End of
Period |
Total
Return |
Gross
Expenses |
Net
Expenses |
Net
Investment
Income
(Loss) |
Net Assets,
End of Period
(000’s) |
Portfolio
Turnover
Rate(b)
|
|
UltraLatin America ProFund
Investor Class | ||||||||||||||
|
Year Ended July 31, 2022 |
$19.08 |
1.13 |
(4.70) |
(3.57) |
(0.83) |
— |
(0.83) |
$14.68 |
(18.44)%(c)
|
1.73% |
1.73% |
6.86% |
$9,583 |
141% |
|
Year Ended July 31, 2021 |
$10.61 |
0.18 |
8.38 |
8.56 |
(0.09) |
— |
(0.09) |
$19.08 |
80.78% |
1.72% |
1.72% |
1.22% |
$15,939 |
163% |
|
Year Ended July 31, 2020 |
$31.86 |
0.28 |
(21.10) |
(20.82) |
(0.43) |
— |
(0.43) |
$10.61 |
(66.27)%(d) |
1.71% |
1.71% |
1.46% |
$15,724 |
237% |
|
Year Ended July 31, 2019 |
$33.55 |
0.44 |
(1.66) |
(1.22) |
(0.47) |
— |
(0.47) |
$31.86 |
(3.51)% |
1.69% |
1.69% |
1.34% |
$31,560 |
132% |
|
Year Ended July 31, 2018 |
$35.83 |
0.28 |
(2.47) |
(2.19) |
(0.09) |
— |
(0.09) |
$33.55 |
(6.15)% |
1.53% |
1.53% |
0.72% |
$37,611 |
315% |
|
Service Class | ||||||||||||||
|
Year Ended July 31, 2022 |
$18.34 |
0.97 |
(4.54) |
(3.57) |
(0.57) |
— |
(0.57) |
$14.20 |
(19.32)%(c) |
2.73% |
2.73% |
5.86% |
$108 |
141% |
|
Year Ended July 31, 2021 |
$10.26 |
0.04 |
8.06 |
8.10 |
(0.02) |
— |
(0.02) |
$18.34 |
78.96% |
2.72% |
2.72% |
0.22% |
$148 |
163% |
|
Year Ended July 31, 2020 |
$30.71 |
0.12 |
(20.57) |
(20.45) |
— |
— |
— |
$10.26 |
(66.59)%(d) |
2.70% |
2.70% |
0.47% |
$98 |
237% |
|
Year Ended July 31, 2019 |
$32.16 |
0.13 |
(1.58) |
(1.45) |
— |
— |
— |
$30.71 |
(4.51)% |
2.69% |
2.69% |
0.34% |
$81 |
132% |
|
Year Ended July 31, 2018 |
$34.61 |
(0.10) |
(2.35) |
(2.45) |
— |
— |
— |
$32.16 |
(7.08)% |
2.53% |
2.53% |
(0.28)% |
$436 |
315% |
|
UltraMid-Cap ProFund
Investor Class | ||||||||||||||
|
Year Ended July 31, 2022 |
$66.78 |
(0.23) |
(10.83) |
(11.06) |
— |
(3.25) |
(3.25) |
$52.47 |
(17.57)% |
1.51% |
1.51% |
(0.38)% |
$43,761 |
28% |
|
Year Ended July 31, 2021 |
$32.83 |
(0.33) |
34.28 |
33.95 |
— |
— |
— |
$66.78 |
103.44% |
1.53% |
1.53% |
(0.62)% |
$61,650 |
40% |
|
Year Ended July 31, 2020 |
$44.23 |
(0.05) |
(10.37) |
(10.42) |
(0.14) |
(0.84) |
(0.98) |
$32.83 |
(24.24)% |
1.66% |
1.66% |
(0.12)% |
$30,383 |
63% |
|
Year Ended July 31, 2019 |
$46.93 |
0.07 |
(2.72) |
(2.65) |
(0.01) |
(0.04) |
(0.05) |
$44.23 |
(5.62)% |
1.53% |
1.53% |
0.16% |
$80,404 |
52% |
|
Year Ended July 31, 2018(e) |
$40.56 |
(0.01) |
9.46(f) |
9.45 |
— |
(3.08) |
(3.08) |
$46.93 |
23.80% |
1.43% |
1.43% |
(0.01)% |
$91,844 |
28% |
|
Service Class | ||||||||||||||
|
Year Ended July 31, 2022 |
$53.58 |
(0.72) |
(8.44) |
(9.16) |
— |
(3.25) |
(3.25) |
$41.17 |
(18.40)% |
2.51% |
2.51% |
(1.38)% |
$859 |
28% |
|
Year Ended July 31, 2021 |
$26.59 |
(0.75) |
27.74 |
26.99 |
— |
— |
— |
$53.58 |
101.47% |
2.53% |
2.53% |
(1.61)% |
$1,231 |
40% |
|
Year Ended July 31, 2020 |
$36.24 |
(0.34) |
(8.47) |
(8.81) |
— |
(0.84) |
(0.84) |
$26.59 |
(24.99)% |
2.66% |
2.66% |
(1.12)% |
$636 |
63% |
|
Year Ended July 31, 2019 |
$38.86 |
(0.28) |
(2.30) |
(2.58) |
— |
(0.04) |
(0.04) |
$36.24 |
(6.61)% |
2.53% |
2.53% |
(0.84)% |
$847 |
52% |
|
Year Ended July 31, 2018(e) |
$34.37 |
(0.37) |
7.94(f) |
7.57 |
— |
(3.08) |
(3.08) |
$38.86 |
22.58% |
2.43% |
2.43% |
(1.01)% |
$2,154 |
28% |
(a)
Per share net investment income (loss) has been calculated using the average daily shares method.
(b)
Portfolio turnover rate is calculated without regard to instruments having a maturity of less than one year from acquisition or derivative instruments (including swap agreements and futures contracts.) The portfolio turnover rate can be high and volatile due to the amount and timing of sales and purchases of fund shares during the period. Portfolio turnover rate is calculated on the basis of the Fund as a whole without distinguishing between classes of shares issued.
(c)
During the year ended July 31, 2022, the ProFund received monies related to certain nonrecurring litigation settlements. The corresponding impact to the total return was 0.22%.
(d)
During the year ended July 31, 2020, the Fund received monies related to certain nonrecurring litigation settlements. The corresponding impact to the total return was 0.68%.
(e)
As described in Note 9 of the Notes to Financial Statements in the most recent Annual Report, share amounts have been adjusted for 3:1 share split that occurred on January 22, 2018.
(f)
Subsequent to the issuance of the July 31, 2018 and 2019 financial statements, it was discovered that the distributions per share of $9.24 from Net Realized Gains on Investments from the year ended July 31, 2018 had not been adjusted for the 3:1 share split on January 22, 2018. The per-share amounts for both “Net Realized and Unrealized Gains (Losses) on Investments” as well as “Distributions to Shareholders from Net Realized Gains on Investments” have been revised to reflect the correct amounts.
536 :: Financial Highlights
ProFunds Financial Highlights FOR THE PERIODS INDICATED
Selected data for a share of beneficial interest outstanding throughout the periods indicated.
Selected data for a share of beneficial interest outstanding throughout the periods indicated.
|
|
|
Investment Activities |
Distributions to
Shareholders From |
|
|
Ratios to Average Net Assets |
Supplemental Data | |||||||
|
|
Net Asset
Value,
Beginning
of Period |
Net
Investment
Income
(Loss)(a)
|
Net Realized
and
Unrealized
Gains
(Losses) on
Investments |
Total from
Investment
Activities |
Net
Investment
Income |
Net
Realized
Gain on
Investments |
Total
Distributions |
Net
Asset
Value,
End of
Period |
Total
Return |
Gross
Expenses |
Net
Expenses |
Net
Investment
Income
(Loss) |
Net Assets,
End of Period
(000’s) |
Portfolio
Turnover
Rate(b)
|
|
UltraNasdaq-100 ProFund
Investor Class | ||||||||||||||
|
Year Ended July 31, 2022 |
$99.86 |
(0.71) |
(26.13) |
(26.84) |
— |
(14.34) |
(14.34) |
$58.68 |
(31.91)% |
1.47% |
1.47% |
(0.87)% |
$569,545 |
51% |
|
Year Ended July 31, 2021(c) |
$62.28 |
(0.82) |
45.88 |
45.06 |
— |
(7.48) |
(7.48) |
$99.86 |
76.50% |
1.51% |
1.51% |
(1.05)% |
$1,096,713 |
29% |
|
Year Ended July 31, 2020(c) |
$39.32 |
(0.26) |
25.83 |
25.57 |
— |
(2.61) |
(2.61) |
$62.28 |
67.62% |
1.59% |
1.59% |
(0.58)% |
$627,805 |
20% |
|
Year Ended July 31, 2019(c) |
$37.54 |
0.01 |
3.55 |
3.56 |
— |
(1.78) |
(1.78) |
$39.32 |
9.42% |
1.50% |
1.50% |
0.01% |
$504,777 |
9% |
|
Year Ended July 31, 2018(c)(d) |
$26.05 |
(0.09) |
11.58 |
11.49 |
— |
— |
— |
$37.54 |
44.15% |
1.41% |
1.41% |
(0.29)% |
$497,460 |
3% |
|
Service Class | ||||||||||||||
|
Year Ended July 31, 2022 |
$76.18 |
(1.31) |
(18.41) |
(19.72) |
— |
(14.34) |
(14.34) |
$42.12 |
(32.60)% |
2.47% |
2.47% |
(1.87)% |
$14,120 |
51% |
|
Year Ended July 31, 2021(c) |
$49.32 |
(1.43) |
35.77 |
34.34 |
— |
(7.48) |
(7.48) |
$76.18 |
74.78% |
2.51% |
2.51% |
(2.05)% |
$23,558 |
29% |
|
Year Ended July 31, 2020(c) |
$31.89 |
(0.61) |
20.65 |
20.04 |
— |
(2.61) |
(2.61) |
$49.32 |
65.95% |
2.59% |
2.59% |
(1.58)% |
$15,438 |
20% |
|
Year Ended July 31, 2019(c) |
$31.05 |
(0.28) |
2.90 |
2.62 |
— |
(1.78) |
(1.78) |
$31.89 |
8.33% |
2.50% |
2.50% |
(0.99)% |
$12,014 |
9% |
|
Year Ended July 31, 2018(c)(d) |
$21.76 |
(0.36) |
9.65 |
9.29 |
— |
— |
— |
$31.05 |
42.70% |
2.41% |
2.41% |
(1.29)% |
$14,914 |
3% |
|
UltraShort China ProFund
Investor Class | ||||||||||||||
|
Year Ended July 31, 2022 |
$17.80 |
(0.29) |
(4.87) |
(5.16) |
— |
— |
— |
$12.64 |
(28.99)% |
2.57% |
1.78% |
(1.53)% |
$1,470 |
— |
|
Year Ended July 31, 2021 |
$20.11 |
(0.22) |
(2.09)(e) |
(2.31) |
— |
— |
— |
$17.80 |
(11.49)% |
4.54% |
1.78% |
(1.77)% |
$2,341 |
— |
|
Year Ended July 31, 2020 |
$47.15 |
(0.14) |
(26.71) |
(26.85) |
(0.19) |
— |
(0.19) |
$20.11 |
(57.12)% |
2.83% |
1.78% |
(0.37)% |
$625 |
— |
|
Year Ended July 31, 2019 |
$40.80 |
0.24 |
6.11 |
6.35 |
— |
— |
— |
$47.15 |
15.56% |
2.45% |
1.78% |
0.50% |
$3,534 |
— |
|
Year Ended July 31, 2018(f) |
$54.15 |
(0.14) |
(13.21) |
(13.35) |
— |
— |
— |
$40.80 |
(24.67)% |
2.34% |
1.78% |
(0.34)% |
$2,038 |
— |
|
Service Class | ||||||||||||||
|
Year Ended July 31, 2022 |
$15.63 |
(0.46) |
(4.15) |
(4.61) |
— |
— |
— |
$11.02 |
(29.58)% |
3.57% |
2.78% |
(2.53)% |
$10 |
— |
|
Year Ended July 31, 2021 |
$17.88 |
(0.34) |
(1.91)(e) |
(2.25) |
— |
— |
— |
$15.63 |
(12.52)% |
5.54% |
2.78% |
(2.77)% |
$6 |
— |
|
Year Ended July 31, 2020 |
$42.12 |
(0.48) |
(23.76) |
(24.24) |
— |
— |
— |
$17.88 |
(57.53)% |
3.83% |
2.78% |
(1.37)% |
$10 |
— |
|
Year Ended July 31, 2019 |
$36.81 |
(0.19) |
5.50 |
5.31 |
— |
— |
— |
$42.12 |
14.43% |
3.45% |
2.78% |
(0.50)% |
$44 |
— |
|
Year Ended July 31, 2018(f) |
$49.35 |
(0.52) |
(12.02) |
(12.54) |
— |
— |
— |
$36.81 |
(25.43)% |
3.34% |
2.78% |
(1.34)% |
$70 |
— |
(a)
Per share net investment income (loss) has been calculated using the average daily shares method.
(b)
Portfolio turnover rate is calculated without regard to instruments having a maturity of less than one year from acquisition or derivative instruments (including swap agreements and futures contracts.) The portfolio turnover rate can be high and volatile due to the amount and timing of sales and purchases of fund shares during the period. Portfolio turnover rate is calculated on the basis of the Fund as a whole without distinguishing between classes of shares issued.
(c)
As described in Note 9 of the Notes to Financial Statements in the most recent Annual Report, share amounts have been adjusted for 2:1 share split that occurred on December 14, 2020.
(d)
As described in Note 9 of the Notes to Financial Statements in the most recent Annual Report, share amounts have been adjusted for 3:1 share split that occurred on January 22, 2018.
(e)
The amount shown for a share outstanding throughout the period does not accord with the change in aggregate gains and losses in the portfolio of securities during the period because of the timing of sales and purchases of fund shares in relation to fluctuating market values during the period.
(f)
As described in Note 9 of the Notes to Financial Statements in the most recent Annual Report, share amounts have been adjusted for 1:8 reverse share split that occurred on January 22, 2018.
Financial Highlights :: 537
ProFunds Financial Highlights FOR THE PERIODS INDICATED
Selected data for a share of beneficial interest outstanding throughout the periods indicated.
Selected data for a share of beneficial interest outstanding throughout the periods indicated.
|
|
|
Investment Activities |
Distributions to
Shareholders From |
|
|
Ratios to Average Net Assets |
Supplemental Data | ||||||
|
|
Net Asset
Value,
Beginning
of Period |
Net
Investment
Income
(Loss)(a)
|
Net Realized
and
Unrealized
Gains
(Losses) on
Investments |
Total from
Investment
Activities |
Net
Investment
Income |
Total
Distributions |
Net
Asset
Value,
End of
Period |
Total
Return |
Gross
Expenses |
Net
Expenses |
Net
Investment
Income
(Loss) |
Net Assets,
End of Period
(000’s) |
Portfolio
Turnover
Rate(b)
|
|
UltraShort Dow 30 ProFund
Investor Class | |||||||||||||
|
Year Ended July 31, 2022 |
$20.44 |
(0.30) |
0.22(c)
|
(0.08) |
— |
— |
$20.36 |
(0.39)% |
2.65% |
1.78% |
(1.48)% |
$2,491 |
— |
|
Year Ended July 31, 2021(d) |
$40.04 |
(0.49) |
(19.11) |
(19.60) |
— |
— |
$20.44 |
(48.95)% |
2.47% |
1.78% |
(1.77)% |
$2,916 |
— |
|
Year Ended July 31, 2020(d) |
$60.15 |
(0.56) |
(19.35) |
(19.91) |
(0.20) |
(0.20) |
$40.04 |
(33.21)% |
2.17% |
1.78% |
(1.01)% |
$5,293 |
— |
|
Year Ended July 31, 2019(d) |
$71.69 |
0.32 |
(11.86) |
(11.54) |
— |
— |
$60.15 |
(16.07)% |
2.25% |
1.78% |
0.47% |
$4,491 |
— |
|
Year Ended July 31, 2018(d) |
$104.12 |
(0.36) |
(32.07) |
(32.43) |
— |
— |
$71.69 |
(31.16)% |
2.18% |
1.78% |
(0.44)% |
$3,874 |
— |
|
Service Class | |||||||||||||
|
Year Ended July 31, 2022 |
$17.86 |
(0.47) |
0.23(c) |
(0.24) |
— |
— |
$17.62 |
(1.34)% |
3.65% |
2.78% |
(2.48)% |
$156 |
— |
|
Year Ended July 31, 2021(d) |
$35.34 |
(0.74) |
(16.74) |
(17.48) |
— |
— |
$17.86 |
(49.43)% |
3.47% |
2.78% |
(2.77)% |
$111 |
— |
|
Year Ended July 31, 2020(d) |
$53.45 |
(1.00) |
(17.11) |
(18.11) |
— |
— |
$35.34 |
(33.91)% |
3.17% |
2.78% |
(2.01)% |
$316 |
— |
|
Year Ended July 31, 2019(d) |
$64.34 |
(0.28) |
(10.61) |
(10.89) |
— |
— |
$53.45 |
(16.92)% |
3.25% |
2.78% |
(0.53)% |
$179 |
— |
|
Year Ended July 31, 2018(d) |
$94.36 |
(1.12) |
(28.90) |
(30.02) |
— |
— |
$64.34 |
(31.84)% |
3.18% |
2.78% |
(1.44)% |
$268 |
— |
|
UltraShort Emerging Markets ProFund
Investor Class | |||||||||||||
|
Year Ended July 31, 2022 |
$23.19 |
(0.39) |
6.13 |
5.74 |
— |
— |
$28.93 |
24.75% |
3.73% |
1.78% |
(1.43)% |
$1,247 |
— |
|
Year Ended July 31, 2021(d) |
$39.50 |
(0.45) |
(15.86) |
(16.31) |
— |
— |
$23.19 |
(41.26)% |
5.39% |
1.78% |
(1.77)% |
$562 |
— |
|
Year Ended July 31, 2020(d) |
$75.75 |
(0.40) |
(35.57) |
(35.97) |
(0.28) |
(0.28) |
$39.50 |
(47.64)% |
2.90% |
1.78% |
(0.60)% |
$974 |
— |
|
Year Ended July 31, 2019(d) |
$73.65 |
0.36 |
1.74 |
2.10 |
— |
— |
$75.75 |
2.88% |
2.70% |
1.78% |
0.43% |
$2,865 |
— |
|
Year Ended July 31, 2018(d) |
$86.96 |
(0.28) |
(13.03) |
(13.31) |
— |
— |
$73.65 |
(15.32)% |
2.35% |
1.78% |
(0.40)% |
$2,958 |
— |
|
Service Class | |||||||||||||
|
Year Ended July 31, 2022 |
$20.93 |
(0.63) |
5.53 |
4.90 |
— |
— |
$25.83 |
23.52% |
4.73% |
2.78% |
(2.43)% |
$31 |
— |
|
Year Ended July 31, 2021(d) |
$35.98 |
(0.69) |
(14.36) |
(15.05) |
— |
— |
$20.93 |
(41.89)% |
6.39% |
2.78% |
(2.77)% |
$31 |
— |
|
Year Ended July 31, 2020(d) |
$69.37 |
(1.00) |
(32.39) |
(33.39) |
— |
— |
$35.98 |
(48.10)% |
3.90% |
2.78% |
(1.60)% |
$62 |
— |
|
Year Ended July 31, 2019(d) |
$68.11 |
(0.40) |
1.66 |
1.26 |
— |
— |
$69.37 |
1.82% |
3.70% |
2.78% |
(0.57)% |
$98 |
— |
|
Year Ended July 31, 2018(d) |
$81.20 |
(1.00) |
(12.09) |
(13.09) |
— |
— |
$68.11 |
(16.11)% |
3.35% |
2.78% |
(1.40)% |
$108 |
— |
(a)
Per share net investment income (loss) has been calculated using the average daily shares method.
(b)
Portfolio turnover rate is calculated without regard to instruments having a maturity of less than one year from acquisition or derivative instruments (including swap agreements and futures contracts.) The portfolio turnover rate can be high and volatile due to the amount and timing of sales and purchases of fund shares during the period. Portfolio turnover rate is calculated on the basis of the Fund as a whole without distinguishing between classes of shares issued.
(c)
The amount shown for a share outstanding throughout the period does not accord with the change in aggregate gains and losses in the portfolio of securities during the period because of the timing of sales and purchases of fund shares in relation to fluctuating market values during the period.
(d)
As described in Note 9 of the Notes to Financial Statements in the most recent Annual Report, share amounts have been adjusted for 1:4 reverse share split that occurred on December 14, 2020.
538 :: Financial Highlights
ProFunds Financial Highlights FOR THE PERIODS INDICATED
Selected data for a share of beneficial interest outstanding throughout the periods indicated.
Selected data for a share of beneficial interest outstanding throughout the periods indicated.
|
|
|
Investment Activities |
Distributions to
Shareholders From |
|
|
Ratios to Average Net Assets |
Supplemental Data | ||||||
|
|
Net Asset
Value,
Beginning
of Period |
Net
Investment
Income
(Loss)(a)
|
Net Realized
and
Unrealized
Gains
(Losses) on
Investments |
Total from
Investment
Activities |
Net
Investment
Income |
Total
Distributions |
Net
Asset
Value,
End of
Period |
Total
Return |
Gross
Expenses |
Net
Expenses |
Net
Investment
Income
(Loss) |
Net Assets,
End of Period
(000’s) |
Portfolio
Turnover
Rate(b)
|
|
UltraShort International ProFund
Investor Class | |||||||||||||
|
Year Ended July 31, 2022 |
$22.38 |
(0.34) |
4.48(c)
|
4.14 |
— |
— |
$26.52 |
18.50% |
2.60% |
1.78% |
(1.41)% |
$2,640 |
— |
|
Year Ended July 31, 2021(d) |
$42.06 |
(0.51) |
(19.17) |
(19.68) |
— |
— |
$22.38 |
(46.82)% |
3.13% |
1.78% |
(1.77)% |
$1,631 |
— |
|
Year Ended July 31, 2020(d) |
$54.21 |
(0.48) |
(11.27) |
(11.75) |
(0.40) |
(0.40) |
$42.06 |
(21.67)% |
2.83% |
1.78% |
(0.95)% |
$2,445 |
— |
|
Year Ended July 31, 2019(d) |
$51.63 |
0.28 |
2.30 |
2.58 |
— |
— |
$54.21 |
4.96% |
2.43% |
1.78% |
0.50% |
$2,156 |
— |
|
Year Ended July 31, 2018(d) |
$59.47 |
(0.28) |
(7.56) |
(7.84) |
— |
— |
$51.63 |
(13.18)% |
2.53% |
1.84% |
(0.51)% |
$2,120 |
— |
|
Service Class | |||||||||||||
|
Year Ended July 31, 2022 |
$20.04 |
(0.57) |
4.04(c) |
3.47 |
— |
— |
$23.51 |
17.30% |
3.60% |
2.78% |
(2.41)% |
$6 |
— |
|
Year Ended July 31, 2021(d) |
$38.07 |
(0.78) |
(17.25) |
(18.03) |
— |
— |
$20.04 |
(47.32)% |
4.14% |
2.79% |
(2.78)% |
$5 |
— |
|
Year Ended July 31, 2020(d) |
$49.12 |
(0.96) |
(10.09) |
(11.05) |
— |
— |
$38.07 |
(22.48)% |
3.83% |
2.78% |
(1.95)% |
$10 |
— |
|
Year Ended July 31, 2019(d) |
$47.26 |
(0.24) |
2.10 |
1.86 |
— |
— |
$49.12 |
3.89% |
3.42% |
2.77% |
(0.49)% |
$14 |
— |
|
Year Ended July 31, 2018(d) |
$54.95 |
(0.76) |
(6.93) |
(7.69) |
— |
— |
$47.26 |
(13.97)% |
3.52% |
2.83% |
(1.50)% |
$29 |
— |
|
UltraShort Japan ProFund
Investor Class | |||||||||||||
|
Year Ended July 31, 2022 |
$12.53 |
(0.18) |
(2.17) |
(2.35) |
— |
— |
$10.18 |
(18.75)% |
10.76% |
1.78% |
(1.54)% |
$199 |
— |
|
Year Ended July 31, 2021 |
$22.23 |
(0.26) |
(9.44) |
(9.70) |
— |
— |
$12.53 |
(43.63)% |
8.91% |
1.78% |
(1.77)% |
$233 |
— |
|
Year Ended July 31, 2020 |
$32.34 |
(0.18) |
(9.93) |
(10.11) |
— |
— |
$22.23 |
(31.26)% |
4.87% |
1.78% |
(0.64)% |
$842 |
— |
|
Year Ended July 31, 2019 |
$32.76 |
0.06 |
(0.48) |
(0.42) |
— |
— |
$32.34 |
(1.28)% |
5.49% |
1.78% |
0.18% |
$1,010 |
— |
|
Year Ended July 31, 2018(e) |
$47.18 |
(0.23) |
(14.19) |
(14.42) |
— |
— |
$32.76 |
(30.59)% |
3.66% |
1.78% |
(0.60)% |
$709 |
— |
|
Service Class | |||||||||||||
|
Year Ended July 31, 2022 |
$11.16 |
(0.28) |
(1.92) |
(2.20) |
— |
— |
$8.96 |
(19.71)% |
11.76% |
2.78% |
(2.54)% |
$1 |
— |
|
Year Ended July 31, 2021 |
$19.96 |
(0.37) |
(8.43) |
(8.80) |
— |
— |
$11.16 |
(44.23)% |
9.91% |
2.78% |
(2.77)% |
$29 |
— |
|
Year Ended July 31, 2020 |
$29.45 |
(0.44) |
(9.05) |
(9.49) |
— |
— |
$19.96 |
(31.87)% |
5.87% |
2.78% |
(1.64)% |
$2 |
— |
|
Year Ended July 31, 2019 |
$30.00 |
(0.23) |
(0.32) |
(0.55) |
— |
— |
$29.45 |
(2.26)% |
6.49% |
2.78% |
(0.82)% |
$4 |
— |
|
Year Ended July 31, 2018(e) |
$43.73 |
(0.61) |
(13.12) |
(13.73) |
— |
— |
$30.00 |
(31.31)% |
4.66% |
2.78% |
(1.60)% |
$5 |
— |
(a)
Per share net investment income (loss) has been calculated using the average daily shares method.
(b)
Portfolio turnover rate is calculated without regard to instruments having a maturity of less than one year from acquisition or derivative instruments (including swap agreements and futures contracts.) The portfolio turnover rate can be high and volatile due to the amount and timing of sales and purchases of fund shares during the period. Portfolio turnover rate is calculated on the basis of the Fund as a whole without distinguishing between classes of shares issued.
(c)
The amount shown for a share outstanding throughout the period does not accord with the change in aggregate gains and losses in the portfolio of securities during the period because of the timing of sales and purchases of fund shares in relation to fluctuating market values during the period.
(d)
As described in Note 9 of the Notes to Financial Statements in the most recent Annual Report, share amounts have been adjusted for 1:4 reverse share split that occurred on December 14, 2020.
(e)
As described in Note 9 of the Notes to Financial Statements in the most recent Annual Report, share amounts have been adjusted for 1:5 reverse share split that occurred on January 22, 2018.
Financial Highlights :: 539
ProFunds Financial Highlights FOR THE PERIODS INDICATED
Selected data for a share of beneficial interest outstanding throughout the periods indicated.
Selected data for a share of beneficial interest outstanding throughout the periods indicated.
|
|
|
Investment Activities |
Distributions to
Shareholders From |
|
|
Ratios to Average Net Assets |
Supplemental Data | ||||||
|
|
Net Asset
Value,
Beginning
of Period |
Net
Investment
Income
(Loss)(a)
|
Net Realized
and
Unrealized
Gains
(Losses) on
Investments |
Total from
Investment
Activities |
Net
Investment
Income |
Total
Distributions |
Net
Asset
Value,
End of
Period |
Total
Return |
Gross
Expenses |
Net
Expenses |
Net
Investment
Income
(Loss) |
Net Assets,
End of Period
(000’s) |
Portfolio
Turnover
Rate(b)
|
|
UltraShort Latin America ProFund
Investor Class | |||||||||||||
|
Year Ended July 31, 2022 |
$10.27 |
(0.15) |
(0.94) |
(1.09) |
— |
— |
$9.18 |
(10.61)% |
4.14% |
1.78% |
(1.48)% |
$1,796 |
— |
|
Year Ended July 31, 2021 |
$27.67 |
(0.32) |
(17.08) |
(17.40) |
— |
— |
$10.27 |
(62.88)% |
3.28% |
1.78% |
(1.77)% |
$804 |
— |
|
Year Ended July 31, 2020 |
$27.71 |
(0.30) |
0.35 |
0.05 |
(0.09) |
(0.09) |
$27.67 |
0.22% |
2.31% |
1.78% |
(0.87)% |
$3,138 |
— |
|
Year Ended July 31, 2019 |
$35.01 |
0.16 |
(7.46) |
(7.30) |
— |
— |
$27.71 |
(20.85)% |
2.42% |
1.78% |
0.53% |
$4,681 |
— |
|
Year Ended July 31, 2018(c) |
$40.03 |
(0.21) |
(4.81) |
(5.02) |
— |
— |
$35.01 |
(12.58)% |
2.05% |
1.78% |
(0.60)% |
$3,711 |
— |
|
Service Class | |||||||||||||
|
Year Ended July 31, 2022 |
$9.00 |
(0.25) |
(0.78) |
(1.03) |
— |
— |
$7.97 |
(11.44)% |
5.14% |
2.78% |
(2.48)% |
$8 |
— |
|
Year Ended July 31, 2021 |
$24.48 |
(0.47) |
(15.01) |
(15.48) |
— |
— |
$9.00 |
(63.24)% |
4.28% |
2.78% |
(2.77)% |
$9 |
— |
|
Year Ended July 31, 2020 |
$24.69 |
(0.69) |
0.48 |
(0.21) |
— |
— |
$24.48 |
(0.85)% |
3.31% |
2.78% |
(1.87)% |
$35 |
— |
|
Year Ended July 31, 2019 |
$31.51 |
(0.12) |
(6.70) |
(6.82) |
— |
— |
$24.69 |
(21.67)% |
3.42% |
2.78% |
(0.47)% |
$61 |
— |
|
Year Ended July 31, 2018(c) |
$36.45 |
(0.55) |
(4.39) |
(4.94) |
— |
— |
$31.51 |
(13.53)% |
3.05% |
2.78% |
(1.60)% |
$74 |
— |
|
UltraShort Mid-Cap ProFund
Investor Class | |||||||||||||
|
Year Ended July 31, 2022 |
$5.36 |
(0.08) |
(0.16) |
(0.24) |
— |
— |
$5.12 |
(4.48)% |
3.56% |
1.78% |
(1.50)% |
$1,424 |
— |
|
Year Ended July 31, 2021 |
$13.16 |
(0.14) |
(7.66) |
(7.80) |
— |
— |
$5.36 |
(59.27)% |
3.22% |
1.78% |
(1.77)% |
$1,443 |
— |
|
Year Ended July 31, 2020 |
$19.82 |
(0.20) |
(6.38) |
(6.58) |
(0.08) |
(0.08) |
$13.16 |
(33.28)% |
2.94% |
1.78% |
(1.04)% |
$2,728 |
— |
|
Year Ended July 31, 2019 |
$20.73 |
0.11 |
(1.02) |
(0.91) |
— |
— |
$19.82 |
(4.39)% |
3.04% |
1.78% |
0.50% |
$1,475 |
— |
|
Year Ended July 31, 2018 |
$27.77 |
(0.11) |
(6.93) |
(7.04) |
— |
— |
$20.73 |
(25.35)% |
3.12% |
1.78% |
(0.45)% |
$1,067 |
— |
|
Service Class | |||||||||||||
|
Year Ended July 31, 2022 |
$4.73 |
(0.13) |
(0.12) |
(0.25) |
— |
— |
$4.48 |
(5.29)% |
4.56% |
2.78% |
(2.50)% |
$53 |
— |
|
Year Ended July 31, 2021 |
$11.71 |
(0.21) |
(6.77) |
(6.98) |
— |
— |
$4.73 |
(59.61)% |
4.22% |
2.78% |
(2.77)% |
$20 |
— |
|
Year Ended July 31, 2020 |
$17.72 |
(0.37) |
(5.64) |
(6.01) |
— |
— |
$11.71 |
(33.92)% |
3.94% |
2.78% |
(2.04)% |
$21 |
— |
|
Year Ended July 31, 2019 |
$18.73 |
(0.08) |
(0.93) |
(1.01) |
— |
— |
$17.72 |
(5.39)% |
4.04% |
2.78% |
(0.50)% |
$16 |
— |
|
Year Ended July 31, 2018 |
$25.30 |
(0.32) |
(6.25) |
(6.57) |
— |
— |
$18.73 |
(26.00)% |
4.12% |
2.78% |
(1.45)% |
$11 |
— |
(a)
Per share net investment income (loss) has been calculated using the average daily shares method.
(b)
Portfolio turnover rate is calculated without regard to instruments having a maturity of less than one year from acquisition or derivative instruments (including swap agreements and futures contracts.) The portfolio turnover rate can be high and volatile due to the amount and timing of sales and purchases of fund shares during the period. Portfolio turnover rate is calculated on the basis of the Fund as a whole without distinguishing between classes of shares issued.
(c)
As described in Note 9 of the Notes to Financial Statements in the most recent Annual Report, share amounts have been adjusted for 1:5 reverse share split that occurred on January 22, 2018.
540 :: Financial Highlights
ProFunds Financial Highlights FOR THE PERIODS INDICATED
Selected data for a share of beneficial interest outstanding throughout the periods indicated.
Selected data for a share of beneficial interest outstanding throughout the periods indicated.
|
|
|
Investment Activities |
Distributions to
Shareholders From |
|
|
Ratios to Average Net Assets |
Supplemental Data | ||||||
|
|
Net Asset
Value,
Beginning
of Period |
Net
Investment
Income
(Loss)(a)
|
Net Realized
and
Unrealized
Gains
(Losses) on
Investments |
Total from
Investment
Activities |
Net
Investment
Income |
Total
Distributions |
Net
Asset
Value,
End of
Period |
Total
Return |
Gross
Expenses |
Net
Expenses |
Net
Investment
Income
(Loss) |
Net Assets,
End of Period
(000’s) |
Portfolio
Turnover
Rate(b)
|
|
UltraShort Nasdaq-100 ProFund
Investor Class | |||||||||||||
|
Year Ended July 31, 2022 |
$15.70 |
(0.18) |
0.28(c)
|
0.10 |
— |
— |
$15.80 |
0.64% |
1.68% |
1.68% |
(1.09)% |
$100,824 |
— |
|
Year Ended July 31, 2021(d) |
$35.80 |
(0.41) |
(19.67)(c) |
(20.08) |
(0.02) |
(0.02) |
$15.70 |
(55.87)% |
1.78% |
1.78% |
(1.76)% |
$9,281 |
— |
|
Year Ended July 31, 2020(d) |
$101.55 |
(0.56) |
(64.87) |
(65.43) |
(0.32) |
(0.32) |
$35.80 |
(64.81)% |
1.82% |
1.82% |
(0.84)% |
$9,454 |
— |
|
Year Ended July 31, 2019(d) |
$130.89 |
0.64 |
(29.98) |
(29.34) |
— |
— |
$101.55 |
(22.43)% |
1.77% |
1.77% |
0.51% |
$14,948 |
— |
|
Year Ended July 31, 2018(d) |
$213.53 |
(0.72) |
(81.92) |
(82.64) |
— |
— |
$130.89 |
(38.70)% |
1.76% |
1.76% |
(0.44)% |
$12,427 |
— |
|
Service Class | |||||||||||||
|
Year Ended July 31, 2022 |
$14.85 |
(0.32) |
0.26(c) |
(0.06) |
— |
— |
$14.79 |
(0.40)% |
2.68% |
2.68% |
(2.09)% |
$168 |
— |
|
Year Ended July 31, 2021(d) |
$34.20 |
(0.64) |
(18.71)(c) |
(19.35) |
— |
— |
$14.85 |
(56.43)% |
2.78% |
2.78% |
(2.76)% |
$184 |
— |
|
Year Ended July 31, 2020(d) |
$97.63 |
(1.28) |
(62.15) |
(63.43) |
— |
— |
$34.20 |
(65.08)% |
2.82% |
2.82% |
(1.84)% |
$174 |
— |
|
Year Ended July 31, 2019(d) |
$126.93 |
(0.48) |
(28.82) |
(29.30) |
— |
— |
$97.63 |
(23.13)% |
2.77% |
2.77% |
(0.49)% |
$516 |
— |
|
Year Ended July 31, 2018(d) |
$208.94 |
(2.24) |
(79.77) |
(82.01) |
— |
— |
$126.93 |
(39.24)% |
2.76% |
2.76% |
(1.44)% |
$91 |
— |
|
UltraShort Small-Cap ProFund
Investor Class | |||||||||||||
|
Year Ended July 31, 2022 |
$7.27 |
(0.11) |
0.90 |
0.79 |
— |
— |
$8.06 |
10.87% |
2.32% |
1.78% |
(1.46)% |
$4,194 |
— |
|
Year Ended July 31, 2021 |
$20.12 |
(0.18) |
(12.67) |
(12.85) |
— |
— |
$7.27 |
(63.87)% |
2.10% |
1.78% |
(1.77)% |
$8,081 |
— |
|
Year Ended July 31, 2020 |
$30.78 |
(0.30) |
(10.28) |
(10.58) |
(0.08) |
(0.08) |
$20.12 |
(34.44)% |
2.16% |
1.78% |
(1.04)% |
$7,746 |
— |
|
Year Ended July 31, 2019 |
$29.84 |
0.16 |
0.78 |
0.94 |
— |
— |
$30.78 |
3.22% |
3.14% |
1.78% |
0.50% |
$4,541 |
— |
|
Year Ended July 31, 2018(e) |
$43.84 |
(0.10) |
(13.90) |
(14.00) |
— |
— |
$29.84 |
(31.98)% |
2.03% |
1.76% |
(0.29)% |
$4,058 |
— |
|
Service Class | |||||||||||||
|
Year Ended July 31, 2022 |
$6.71 |
(0.18) |
0.83 |
0.65 |
— |
— |
$7.36 |
9.69% |
3.32% |
2.78% |
(2.46)% |
$159 |
— |
|
Year Ended July 31, 2021 |
$18.74 |
(0.28) |
(11.75) |
(12.03) |
— |
— |
$6.71 |
(64.19)% |
3.10% |
2.78% |
(2.77)% |
$508 |
— |
|
Year Ended July 31, 2020 |
$28.86 |
(0.57) |
(9.55) |
(10.12) |
— |
— |
$18.74 |
(35.07)% |
3.16% |
2.78% |
(2.04)% |
$174 |
— |
|
Year Ended July 31, 2019 |
$28.27 |
(0.16) |
0.75 |
0.59 |
— |
— |
$28.86 |
2.16% |
4.14% |
2.78% |
(0.50)% |
$158 |
— |
|
Year Ended July 31, 2018(e) |
$41.92 |
(0.45) |
(13.20) |
(13.65) |
— |
— |
$28.27 |
(32.61)% |
3.03% |
2.76% |
(1.29)% |
$111 |
— |
(a)
Per share net investment income (loss) has been calculated using the average daily shares method.
(b)
Portfolio turnover rate is calculated without regard to instruments having a maturity of less than one year from acquisition or derivative instruments (including swap agreements and futures contracts.) The portfolio turnover rate can be high and volatile due to the amount and timing of sales and purchases of fund shares during the period. Portfolio turnover rate is calculated on the basis of the Fund as a whole without distinguishing between classes of shares issued.
(c)
The amount shown for a share outstanding throughout the period does not accord with the change in aggregate gains and losses in the portfolio of securities during the period because of the timing of sales and purchases of fund shares in relation to fluctuating market values during the period.
(d)
As described in Note 9 of the Notes to Financial Statements in the most recent Annual Report, share amounts have been adjusted for 1:8 reverse share split that occurred on December 14, 2020.
(e)
As described in Note 9 of the Notes to Financial Statements in the most recent Annual Report, share amounts have been adjusted for 1:4 reverse share split that occurred on January 22, 2018.
Financial Highlights :: 541
ProFunds Financial Highlights FOR THE PERIODS INDICATED
Selected data for a share of beneficial interest outstanding throughout the periods indicated.
Selected data for a share of beneficial interest outstanding throughout the periods indicated.
|
|
|
Investment Activities |
Distributions to
Shareholders From |
|
|
Ratios to Average Net Assets |
Supplemental Data | |||||||
|
|
Net Asset
Value,
Beginning
of Period |
Net
Investment
Income
(Loss)(a)
|
Net Realized
and
Unrealized
Gains
(Losses) on
Investments |
Total from
Investment
Activities |
Net
Investment
Income |
Net
Realized
Gain on
Investments |
Total
Distributions |
Net
Asset
Value,
End of
Period |
Total
Return |
Gross
Expenses |
Net
Expenses |
Net
Investment
Income
(Loss) |
Net Assets,
End of Period
(000’s) |
Portfolio
Turnover
Rate(b)
|
|
UltraSmall-Cap ProFund
Investor Class | ||||||||||||||
|
Year Ended July 31, 2022 |
$89.55 |
(0.55) |
(28.92) |
(29.47) |
— |
— |
— |
$60.08 |
(32.91)% |
1.60% |
1.60% |
(0.72)% |
$52,577 |
46% |
|
Year Ended July 31, 2021 |
$41.81 |
(0.81) |
48.55 |
47.74 |
— |
— |
— |
$89.55 |
114.21% |
1.62% |
1.62% |
(1.04)% |
$100,147 |
27% |
|
Year Ended July 31, 2020 |
$57.95 |
(0.25) |
(15.89) |
(16.14) |
— |
— |
— |
$41.81 |
(27.85)% |
1.80% |
1.80% |
(0.52)% |
$33,767 |
143% |
|
Year Ended July 31, 2019 |
$68.79 |
0.13 |
(10.91) |
(10.78) |
(0.05) |
(0.01) |
(0.06) |
$57.95 |
(15.64)% |
1.60% |
1.60% |
0.23% |
$62,102 |
77% |
|
Year Ended July 31, 2018 |
$52.24 |
(0.16) |
17.14 |
16.98 |
— |
(0.43) |
(0.43) |
$68.79 |
32.65% |
1.49% |
1.49% |
(0.26)% |
$68,965 |
29% |
|
Service Class | ||||||||||||||
|
Year Ended July 31, 2022 |
$72.53 |
(1.19) |
(23.16) |
(24.35) |
— |
— |
— |
$48.18 |
(33.56)% |
2.60% |
2.60% |
(1.72)% |
$235 |
46% |
|
Year Ended July 31, 2021 |
$34.20 |
(1.46) |
39.79 |
38.33 |
— |
— |
— |
$72.53 |
112.08% |
2.62% |
2.62% |
(2.04)% |
$994 |
27% |
|
Year Ended July 31, 2020 |
$47.88 |
(0.64) |
(13.04) |
(13.68) |
— |
— |
— |
$34.20 |
(28.57)% |
2.80% |
2.80% |
(1.52)% |
$263 |
143% |
|
Year Ended July 31, 2019 |
$57.34 |
(0.35) |
(9.10) |
(9.45) |
— |
(0.01) |
(0.01) |
$47.88 |
(16.47)% |
2.60% |
2.60% |
(0.77)% |
$460 |
77% |
|
Year Ended July 31, 2018 |
$44.08 |
(0.63) |
14.32 |
13.69 |
— |
(0.43) |
(0.43) |
$57.34 |
31.20% |
2.49% |
2.49% |
(1.26)% |
$1,847 |
29% |
|
U.S. Government Plus ProFund
Investor Class | ||||||||||||||
|
Year Ended July 31, 2022 |
$69.24 |
(0.77) |
(17.75) |
(18.52) |
— |
— |
— |
$50.72 |
(26.76)% |
1.41% |
1.41% |
(1.24)% |
$8,264 |
—(c) |
|
Year Ended July 31, 2021 |
$85.98 |
(0.83) |
(15.91) |
(16.74) |
— |
— |
— |
$69.24 |
(19.47)% |
1.51% |
1.51% |
(1.17)% |
$24,182 |
99% |
|
Year Ended July 31, 2020 |
$60.08 |
0.06 |
26.01 |
26.07 |
(0.17) |
— |
(0.17) |
$85.98 |
43.48% |
1.40% |
1.40% |
0.09% |
$21,927 |
392% |
|
Year Ended July 31, 2019 |
$52.14 |
0.61 |
7.94 |
8.55 |
(0.61) |
— |
(0.61) |
$60.08 |
16.53% |
1.34% |
1.34% |
1.14% |
$23,791 |
503% |
|
Year Ended July 31, 2018 |
$53.83 |
0.20 |
(1.78) |
(1.58) |
(0.11) |
— |
(0.11) |
$52.14 |
(2.95)% |
1.35% |
1.35% |
0.38% |
$14,497 |
714% |
|
Service Class | ||||||||||||||
|
Year Ended July 31, 2022 |
$62.71 |
(1.36) |
(15.87) |
(17.23) |
— |
— |
— |
$45.48 |
(27.49)% |
2.41% |
2.41% |
(2.24)% |
$587 |
—(c) |
|
Year Ended July 31, 2021 |
$78.67 |
(1.50) |
(14.46) |
(15.96) |
— |
— |
— |
$62.71 |
(20.29)% |
2.51% |
2.51% |
(2.17)% |
$1,839 |
99% |
|
Year Ended July 31, 2020 |
$55.37 |
(0.62) |
23.92 |
23.30 |
—(d) |
— |
—(d) |
$78.67 |
42.11% |
2.40% |
2.40% |
(0.91)% |
$2,385 |
392% |
|
Year Ended July 31, 2019 |
$48.09 |
0.12 |
7.24 |
7.36 |
(0.08) |
— |
(0.08) |
$55.37 |
15.31% |
2.34% |
2.34% |
0.14% |
$2,605 |
503% |
|
Year Ended July 31, 2018 |
$50.07 |
(0.29) |
(1.68) |
(1.97) |
(0.01) |
— |
(0.01) |
$48.09 |
(3.94)% |
2.35% |
2.35% |
(0.62)% |
$4,374 |
714% |
(a)
Per share net investment income (loss) has been calculated using the average daily shares method.
(b)
Portfolio turnover rate is calculated without regard to instruments having a maturity of less than one year from acquisition or derivative instruments (including swap agreements and futures contracts.) The portfolio turnover rate can be high and volatile due to the amount and timing of sales and purchases of fund shares during the period. Portfolio turnover rate is calculated on the basis of the Fund as a whole without distinguishing between classes of shares issued.
(c)
The portfolio turnover rate significantly decreased due to there being no sales or purchases of U.S Treasury Obligations during the year.
(d)
Amount is less than $0.005.
542 :: Financial Highlights
ProFunds Financial Highlights FOR THE PERIODS INDICATED
Selected data for a share of beneficial interest outstanding throughout the periods indicated.
Selected data for a share of beneficial interest outstanding throughout the periods indicated.
|
|
|
Investment Activities |
Distributions to
Shareholders From |
|
|
Ratios to Average Net Assets |
Supplemental Data | ||||||
|
|
Net Asset
Value,
Beginning
of Period |
Net
Investment
Income
(Loss)(a)
|
Net Realized
and
Unrealized
Gains
(Losses) on
Investments |
Total from
Investment
Activities |
Net
Investment
Income |
Total
Distributions |
Net
Asset
Value,
End of
Period |
Total
Return |
Gross
Expenses |
Net
Expenses |
Net
Investment
Income
(Loss) |
Net Assets,
End of Period
(000’s) |
Portfolio
Turnover
Rate(b)
|
|
Utilities UltraSector ProFund
Investor Class | |||||||||||||
|
Year Ended July 31, 2022 |
$58.73 |
0.28 |
11.29 |
11.57 |
(0.13) |
(0.13) |
$70.17 |
19.73%(c)
|
1.73% |
1.73% |
0.44% |
$12,518 |
113% |
|
Year Ended July 31, 2021 |
$51.44 |
0.09 |
7.52 |
7.61 |
(0.32)(d) |
(0.32) |
$58.73 |
14.85% |
2.06% |
2.02%(e) |
0.17% |
$8,418 |
95% |
|
Year Ended July 31, 2020 |
$54.09 |
0.55 |
(2.16) |
(1.61) |
(1.04) |
(1.04) |
$51.44 |
(3.25)% |
1.73% |
1.73% |
0.95% |
$8,717 |
368% |
|
Year Ended July 31, 2019 |
$45.64 |
0.71 |
8.04 |
8.75 |
(0.30) |
(0.30) |
$54.09 |
19.30% |
1.72% |
1.72% |
1.41% |
$31,558 |
406% |
|
Year Ended July 31, 2018 |
$45.01 |
0.48 |
0.48 |
0.96 |
(0.33) |
(0.33) |
$45.64 |
2.15% |
1.69% |
1.69% |
1.07% |
$8,208 |
314% |
|
Service Class | |||||||||||||
|
Year Ended July 31, 2022 |
$54.53 |
(0.32) |
10.43 |
10.11 |
— |
— |
$64.64 |
18.54%(c) |
2.73% |
2.73% |
(0.56)% |
$1,069 |
113% |
|
Year Ended July 31, 2021 |
$47.93 |
(0.39) |
6.99 |
6.60 |
— |
— |
$54.53 |
13.77% |
3.01% |
2.97%(e) |
(0.78)% |
$368 |
95% |
|
Year Ended July 31, 2020 |
$50.80 |
0.06 |
(2.01) |
(1.95) |
(0.92) |
(0.92) |
$47.93 |
(4.09)% |
2.65% |
2.65% |
0.03% |
$348 |
368% |
|
Year Ended July 31, 2019 |
$42.98 |
0.26 |
7.56 |
7.82 |
— |
— |
$50.80 |
18.19% |
2.67% |
2.67% |
0.46% |
$1,265 |
406% |
|
Year Ended July 31, 2018 |
$42.79 |
0.07 |
0.41 |
0.48 |
(0.29) |
(0.29) |
$42.98 |
1.14% |
2.67% |
2.67% |
0.09% |
$635 |
314% |
(a)
Per share net investment income (loss) has been calculated using the average daily shares method.
(b)
Portfolio turnover rate is calculated without regard to instruments having a maturity of less than one year from acquisition or derivative instruments (including swap agreements and futures contracts.) The portfolio turnover rate can be high and volatile due to the amount and timing of sales and purchases of fund shares during the period. Portfolio turnover rate is calculated on the basis of the Fund as a whole without distinguishing between classes of shares issued.
(c)
During the year ended July 31, 2022, the Fund received monies related to certain nonrecurring litigation settlements. The corresponding impact to the total return was 0.16%.
(d)
Subsequent to the issuance of the July 31, 2021 financial statements, $0.10 of the distribution was determined to be a return of capital.
(e)
The expense ratio does not correlate to the applicable expense limits in place during the period given that the annual contractual expense limitation is applied for the one year periods ended November 30th of each year, instead of coinciding with the July 31st year end. Details of the current expense limitation in effect can be found in the Trust’s annual report dated July 31, 2022.
Additional information about ProFunds is available in the annual and semi-annual reports to shareholders of ProFunds. In the annual report you will find a discussion of the market conditions and investment strategies that significantly affected performance during the fiscal year covered by the report.
You can find additional information about each Fund in its current SAI, dated November 30, 2022, as may be amended from time to time, and most recent annual report to shareholders, dated July 31, 2022, which have been filed electronically with the SEC and which are incorporated by reference into, and are legally a part of, this Prospectus. In each Fund’s annual report, you will find a discussion of the market conditions and investment strategies that significantly affected the Fund’s performance during its last fiscal year. Copies of the SAI, and each Fund’s annual and semi-annual reports are available, free of charge, online at each Fund’s website (www.profunds.com). You may also request a free copy of the SAI or make inquiries to ProFunds® by writing us at the address set forth above or calling us toll-free at the telephone number set forth below.
You can find other information about ProFunds® on the SEC’s website (www.sec.gov) or you can get copies of this information after payment of a duplicating fee via email to publicinfo@sec.gov.
ProFunds®
Post Office Mailing Address for Investments
P.O. Box 182800
Columbus, OH 43218-2800
P.O. Box 182800
Columbus, OH 43218-2800
Phone Numbers
For Financial Professionals: (888) PRO-5717 (888) 776-5717 or (240) 497-6552
For All Others: (888) PRO-FNDS (888) 776-3637 or (614) 470-8122
Fax Number: (800) 782-4797
For Financial Professionals: (888) PRO-5717 (888) 776-5717 or (240) 497-6552
For All Others: (888) PRO-FNDS (888) 776-3637 or (614) 470-8122
Fax Number: (800) 782-4797
Website Address: www.profunds.com
ProFunds and the Bull & Bear design, Rising Rates Opportunity ProFund and Not just funds, ProFunds are trademarks of ProFund Advisors LLC.
ProFunds Executive Offices
Bethesda, MD
Bethesda, MD
Investment Company Act File No. 811-08239
PRO1122
PRO1122