UNITED STATES
SECURITIES AND EXCHANGE COMMISSION
Washington, D.C. 20549
FORM N-CSR
CERTIFIED SHAREHOLDER REPORT OF
REGISTERED
MANAGEMENT INVESTMENT COMPANIES
Investment Company Act File Number: 811-08203
| T. Rowe Price Diversified Small-Cap Growth Fund, Inc. |
| (Exact name of registrant as specified in charter) |
| 100 East Pratt Street, Baltimore, MD 21202 |
| (Address of principal executive offices) |
| David Oestreicher |
| 100 East Pratt Street, Baltimore, MD 21202 |
| (Name and address of agent for service) |
Registrant’s telephone number, including
area code: (410) 345-2000
Date of fiscal year end:
December 31
Date of reporting period: June 30, 2012
Item 1. Report to Shareholders
 |
|
Diversified Small-Cap Growth Fund |
June 30,
2012 |
The views and opinions in this report were current as of June 30, 2012. They are not guarantees of performance or investment results and should not be taken as investment advice. Investment decisions reflect a variety of factors, and the managers reserve the right to change their views about individual stocks, sectors, and the markets at any time. As a result, the views expressed should not be relied upon as a forecast of the fund’s future investment intent. The report is certified under the Sarbanes-Oxley Act, which requires mutual funds and other public companies to affirm that, to the best of their knowledge, the information in their financial reports is fairly and accurately stated in all material respects.
REPORTS ON THE WEB
Sign up for our E-mail Program, and you can begin to receive updated fund reports and prospectuses online rather than through the mail. Log in to your account at troweprice.com for more information.
Manager’s Letter
Fellow Shareholders
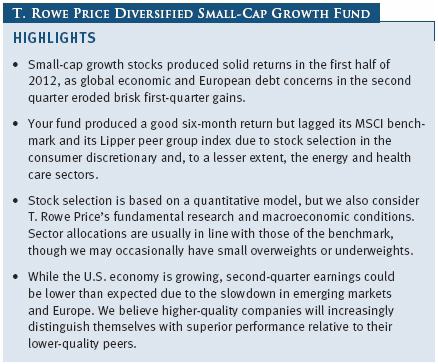
Small-cap growth stocks produced solid gains in the first half of 2012, extending the rebound that started last October. Market volatility was high, driven by global economic uncertainty and European sovereign debt concerns. Stocks rose briskly in the first quarter amid optimism about U.S. economic growth, particularly employment trends, and as the European debt crisis temporarily became less acute. However, equities surrendered some of their gains in the second quarter as U.S. job growth moderated, the Chinese economy decelerated, and the situation in the eurozone deteriorated.
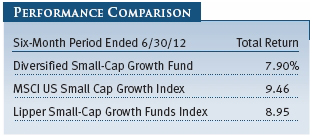
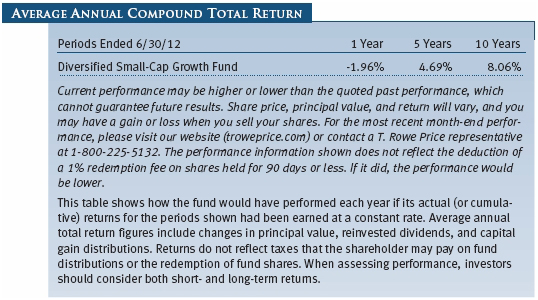
Your fund returned 7.90% in the first half of 2012. As shown in the Performance Comparison table, the fund lagged its MSCI benchmark and its Lipper peer group index. Fund performance was hurt by stock selection in the consumer discretionary and, to a lesser extent, the energy and health care sectors. On the plus side, stock selection in information technology, financials, and industrials and business services helped our results. Our sector allocations usually have little impact on the fund’s relative results. In the last six months, however, our lack of utilities investments was advantageous, as the few utilities that are in the MSCI index fared poorly.
We are pleased to report that Lipper ranked the Diversified Small-Cap Growth Fund in the top 10% of the small-cap growth funds universe for the three- and five-year periods ended June 30, 2012, and in the top quartile for the 1- and 10-year periods ended June 30, 2012. Based on cumulative total return, Lipper ranked the fund 106 of 513, 23 of 447, 24 of 394, and 44 of 258 small-cap growth funds for the 1-, 3-, 5-, and 10-year periods ended June 30, 2012, respectively. (Results may vary for other periods. Past performance cannot guarantee future results.)
MARKET ENVIRONMENT
The U.S. economy expanded in the first half of the year, albeit at a modest pace compared with what is typically seen in the years following a deep recession. The manufacturing sector is fairly healthy, and job growth accelerated in the early months of 2012 before moderating in the second quarter. The housing market remains depressed, but it is beginning to recover. To stimulate the economy, the Federal Reserve maintained highly accommodative monetary policies, keeping the fed funds target rate in its 0.00% to 0.25% range established at the end of 2008. Also, central bank officials indicated that they would likely keep short-term interest rates very low until late 2014.
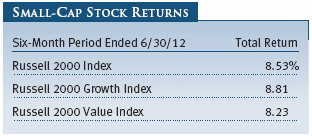
Small-cap shares lagged large-caps in the last six months. The Russell 2000 Index returned 8.53% versus 9.49% for the S&P 500 Index. As measured by Russell style indexes, growth stocks outpaced value stocks across all market capitalizations.
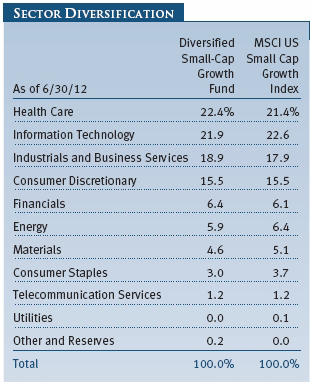
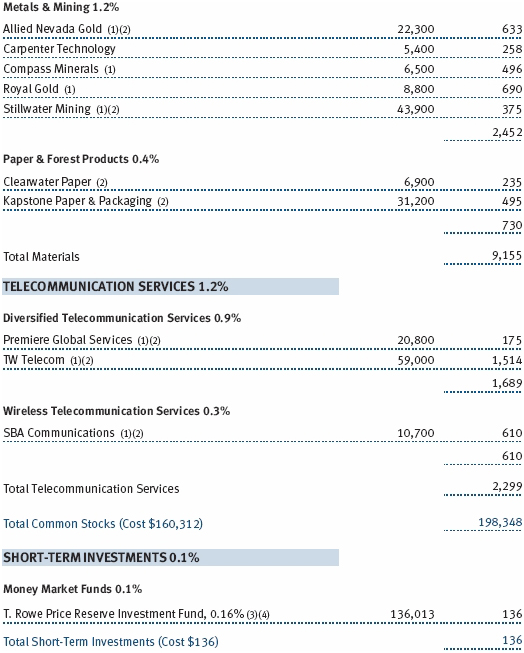
Most sectors of the small-cap growth universe, as measured by the MSCI US Small Cap Growth Index, produced positive returns in our reporting period. Health care stocks far outpaced other sectors, driven by brisk gains among biotechnology stocks. Telecommunication services, financials, and the consumer staples and discretionary sectors performed very well. Materials, information technology, and industrials and business services stocks trailed the index. Energy stocks slumped as prices of energy commodities, especially oil, fell sharply in recent months.
PORTFOLIO CHARACTERISTICS
Although our six-month results trailed those of our benchmarks, we would like to note that the fund’s time horizon for investing is much longer than our reporting period, so it usually takes some time before our investments bear fruit. We remain committed to our strategy and investment process. We believe these will help us navigate through the years ahead and reward patient investors with long-term capital growth:
- We favor companies that have a high return on
capital and use cash flows wisely in a
manner that benefits shareholders. We
prefer companies that generate substantial free cash flow and tend to avoid those with high earnings and cash
flow variability relative to industry
peers.
- We seek companies with good earnings quality
and sustainable growth
characteristics.
- We look for companies with attractive
valuations relative to other firms in the
same industry and relative to the small-cap growth universe as a whole. We like companies with reasonable valuations relative to their earnings
and sales growth rates.
- While stock selection is based on a
quantitative model, we do take into
consideration the fundamental research done by T. Rowe Price’s equity analysts. Given the unusual economic
environment, we are also taking macroeconomic
conditions into account.
- The fund’s sector allocations are usually in line with those of the MSCI US Small Cap Growth Index, as shown in the Sector Diversification table on page 6, but the portfolio may occasionally have small overweights or underweights.
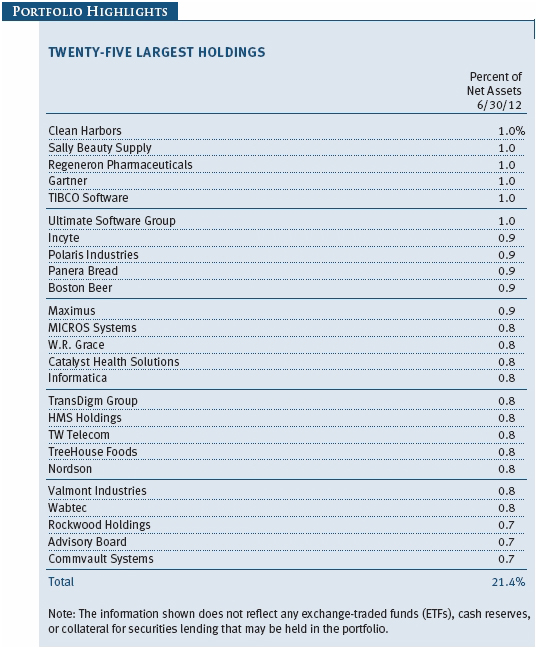
Our strategy is to try to outperform our benchmark by owning a large number of good stocks instead of making large investments in a small number of stocks. The portfolio currently holds more than 300 names, and very few of our positions represent 1.0% or more of the fund’s net assets at any given time. This level of diversification should help manage the risk of investing in small-cap growth stocks. Our goal is to provide steady outperformance over time with lower risk than that of the small-cap market. We believe preventing losses in down markets can help relative performance over time.
Cash reserves are a drag on long-term performance in a rising market, so we try to keep our cash position low and deploy cash flows quickly to stay fully invested. Trading is another cost that reduces returns, so we trade electronically and in low-cost venues when possible. The fund tends to have a fairly low annual turnover rate because our time horizon is longer than that of other small-cap growth portfolios.
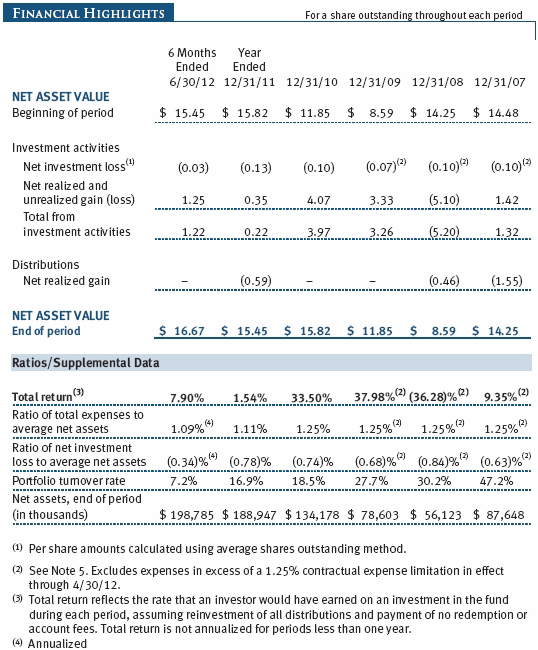
Our portfolio turnover rate over the last 12 months was 15%, which is substantially less than the 2011 average of about 97.3% for small-cap growth funds, according to data from Morningstar Direct. (Morningstar only calculates portfolio turnover for its averages at year-end, using the most recent year-end portfolio turnover figures provided to Morningstar by each of the underlying funds in the average. The Morningstar figure was quoted as of July 16, 2012.) This means our holding period for a typical stock is more than six years, whereas our average competitor holds a given stock for roughly one year.
PORTFOLIO REVIEW
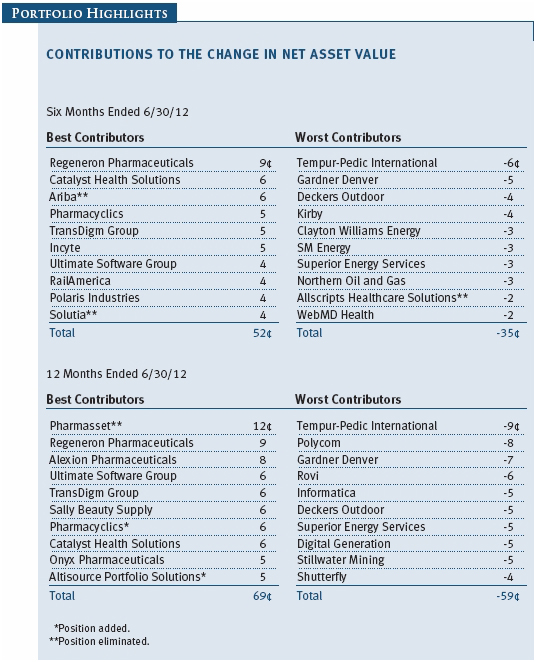
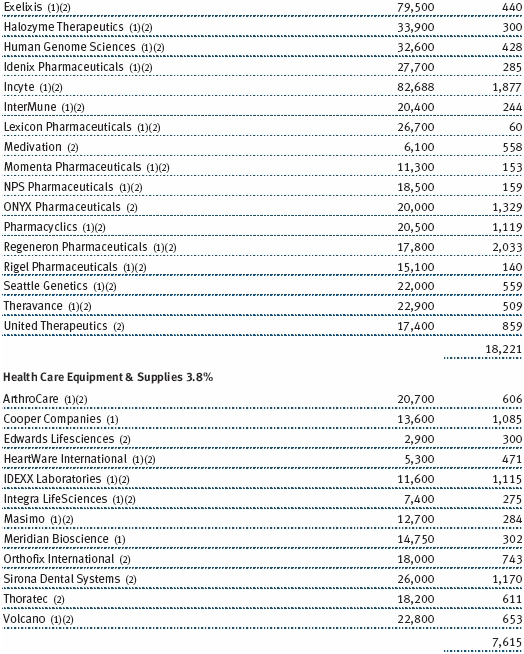
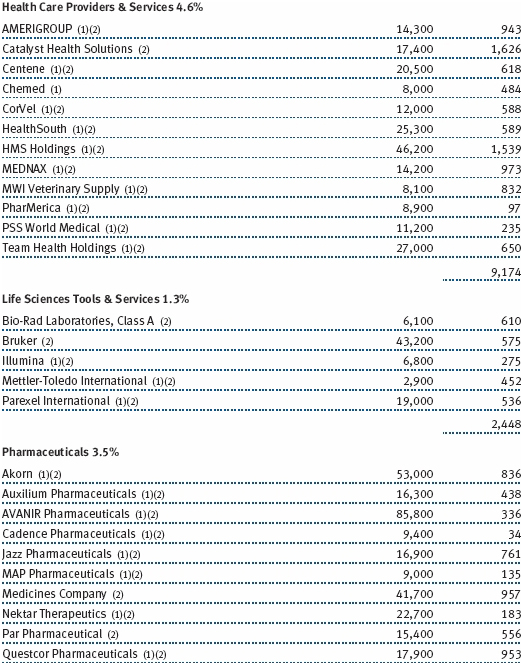
Stocks in the health care sector, our largest allocation at the end of June, contributed the most to absolute fund performance in the last six months but detracted slightly from results versus the MSCI benchmark. Biotechnology shares fared best, and several holdings were among the portfolio’s top performance contributors, including Regeneron Pharmaceuticals, Alexion Pharmaceuticals, and Incyte. All three companies appreciated due to promising new drugs. Gains among our health care providers and services companies were concentrated in MWI Veterinary Supply, HealthSouth, and Catalyst Health Solutions, which was the fund’s second-largest contributor to performance. Shares surged in April after SXC Health Solutions announced that it was acquiring Catalyst to become the country’s fourth-largest pharmacy benefits manager in terms of market share. Pharmaceuticals and equipment and supply companies trailed with mild gains. Our only health care technology company, Allscripts Healthcare Solutions, reported disappointing first-quarter earnings, and we eliminated it in favor of better long-term growth opportunities. (Please refer to the fund’s portfolio of investments for a complete list of holdings and the amount each represents in the portfolio.)
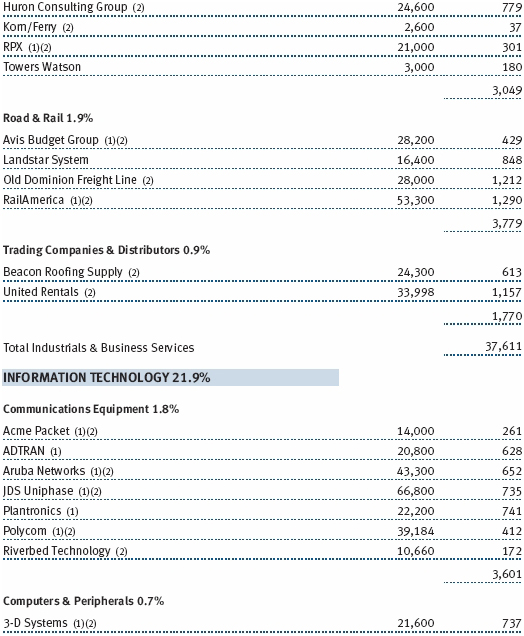
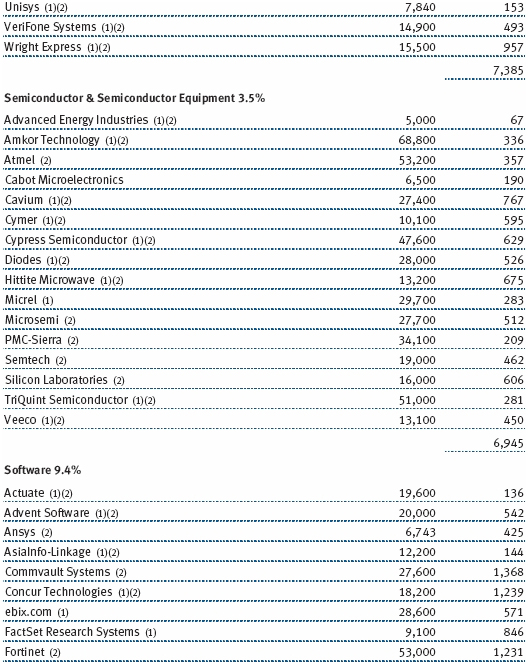
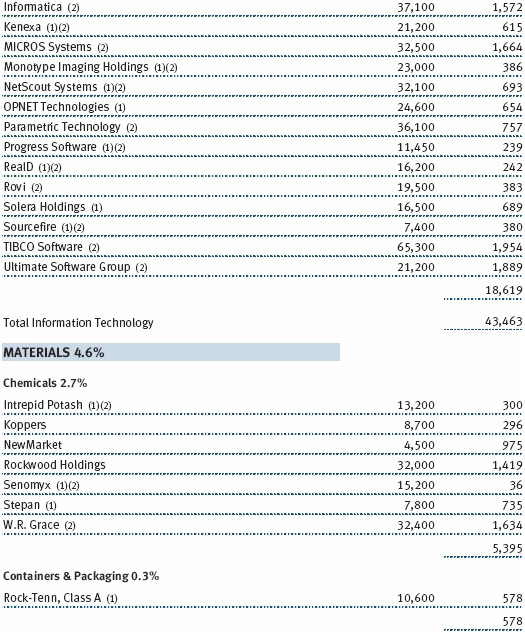
Information technology shares contributed significantly to fund performance in the first half of 2012, primarily because of great strength among software companies. Ariba, a leader in cloud computing—the gathering and storage of data for companies into a central network that can be delivered over the Internet—was the fund’s third-largest contributor to performance. The company’s value was boosted by German software giant SAP’s announcement in May that it would acquire Ariba at a sizable premium. Our IT services companies were generally less robust, but gains were concentrated among Gartner, Maximus, and Heartland Payment Express, all of which reported favorable earnings in the last six months. We own very few computer and peripheral companies, but one holding, 3D Systems, produced outstanding results. The company is a global leader in 3-D custom printing through the use of computers and resins or powders. This technique is increasingly used in manufacturing, and its revenue growth for the next few years could be brisk. Semiconductor-related companies in aggregate added little value to the fund. Our communications equipment stocks fared worst in the tech sector, especially Aruba Networks, a leading manufacturer of enterprise wireless equipment and a beneficiary of tablet and smartphone growth. Recent earnings were disappointing, but we believe Aruba will benefit over time from increased telecom infrastructure investments.
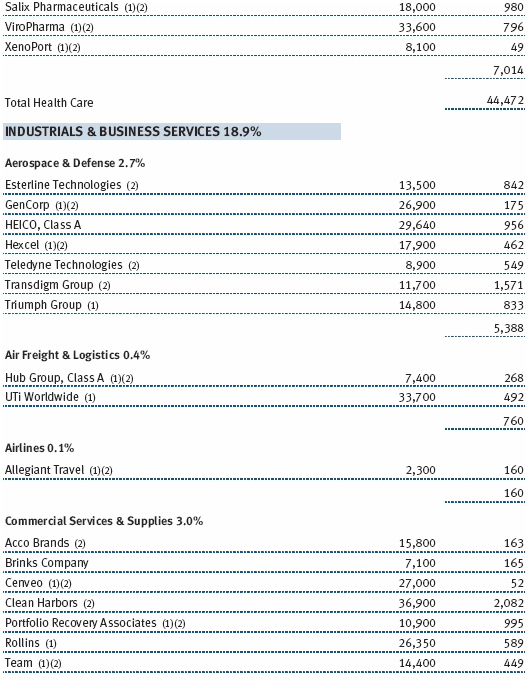
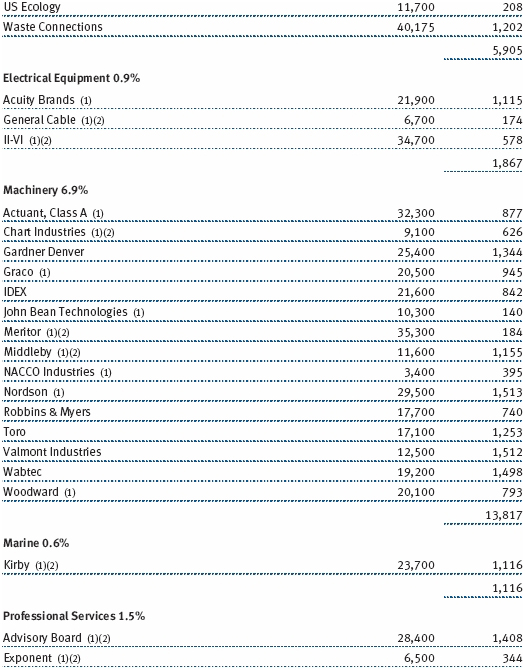
Industrials and business services stocks produced good returns for the fund in the last six months, and our stock selection helped relative results. Machinery stocks paced the advance, and several of our holdings did very well, led by Valmont Industries, which vaulted ahead on the back of solid results in its irrigation and power structures segments. Gardner Denver was one of the fund’s largest detractors, however. The company sells industrial and energy-related products throughout the world, and shares weakened due to concerns over its exposure to Europe, where the company derives almost one-third of its sales. Road and rail stocks did well. Aerospace and defense companies were lackluster, except for aircraft component maker TransDigm Group, which continued to produce stellar gains. Commercial services and supply companies sagged due to the poor performance of waste management companies Clean Harbors and Waste Connections. On the plus side, Portfolio Recovery Associates performed very well in the last six months, particularly in June. The company acquires delinquent or defaulted consumer debts at a deep discount and attempts to recover as much as possible for profit.
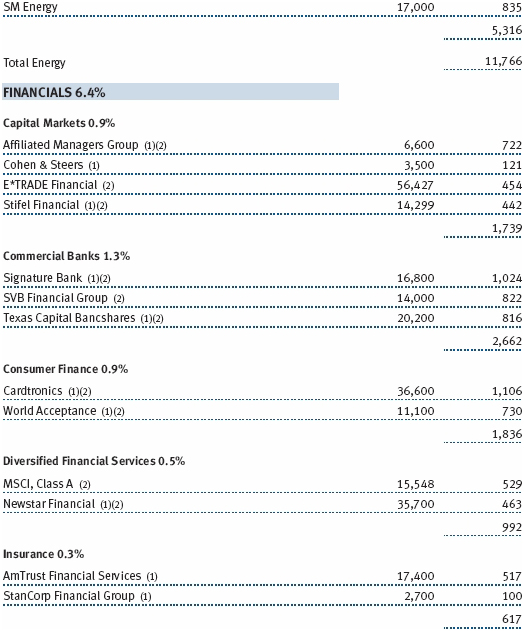
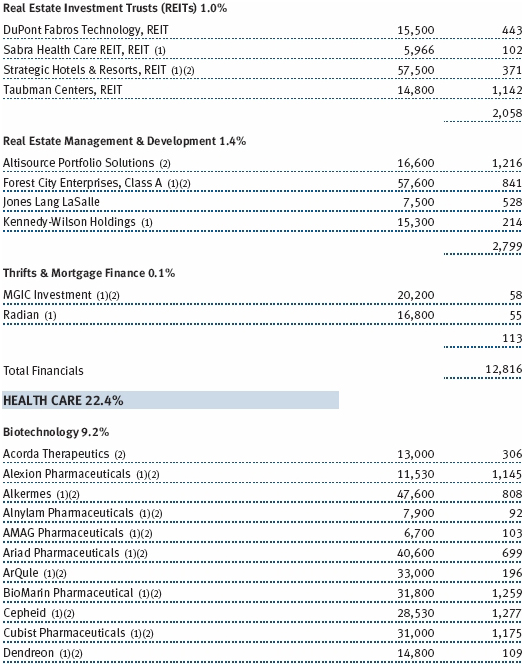
Our financials stocks produced excellent returns in the last six months, and our stock selection helped relative results. Financials is a fairly small part of the small-cap growth universe, so the impact was somewhat limited. Still, several of our holdings benefited from an improved environment for the sector. Altisource Portfolio Solutions, which provides services related to real estate and mortgage portfolio management, benefited from better conditions in the U.S. real estate market. Taubman Centers, a real estate investment trust and an owner and operator of regional malls, was lifted by signs that retail real estate is bottoming after several years of weakness. Regional banks Texas Capital Bancshares, which has a strong balance sheet and good loan growth, and SVB Financial Group, which services small technology start-up companies in Silicon Valley and is beginning to add larger tech firms to its client base, also did well. Capital markets companies lagged, hurt by market weakness in the second quarter.
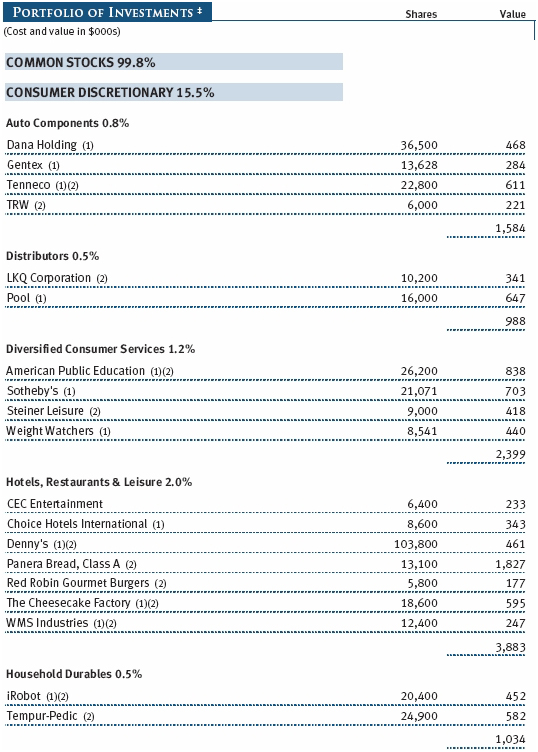
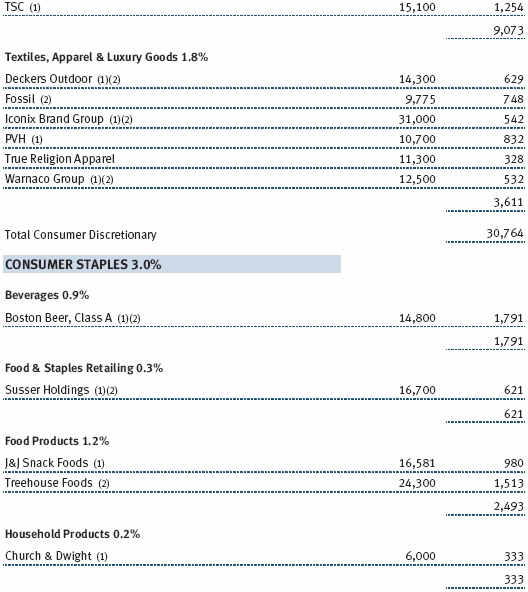
Our consumer discretionary investments in aggregate produced mild gains in the last six months. However, several of our holdings performed poorly, which hurt the fund’s performance relative to the benchmark. Shares of American Public Education, an online provider of education that targets military personnel and those in public service, skidded after the company projected weak second-quarter earnings due to decreased new student enrollment. Deckers Outdoor, which makes the popular UGG branded boots, fell sharply after posting disappointing sales and earnings due to one of the warmest winters on record. Also, mattress-maker Tempur-Pedic International plunged as the company slashed its sales and earnings projections amid intense competition from its peers. We maintained our position because we have confidence in its management team, the stock is very attractively valued, and its balance sheet and brand are strong. On the plus side, specialty retailers did best for us, led by Sally Beauty Supply and TSC (Tractor Supply Company). Media companies were generally lackluster, but shares of the famed New York City entertainment arena Madison Square Garden did quite well. Hotel, restaurant, and leisure stocks were tepid.
Materials stocks produced mild gains in the last six months. Our holdings in the sector are primarily in the chemicals and metals and mining industries. In fact, most of the gains were concentrated in chemical companies Solutia, Rockwood Holdings, W.R. Grace, and Stepan. We eliminated Solutia—a big gainer for the fund—after Eastman Chemical announced that it would acquire the company. Our metals and mining stocks were narrowly mixed, and our two paper and forest products companies edged lower.
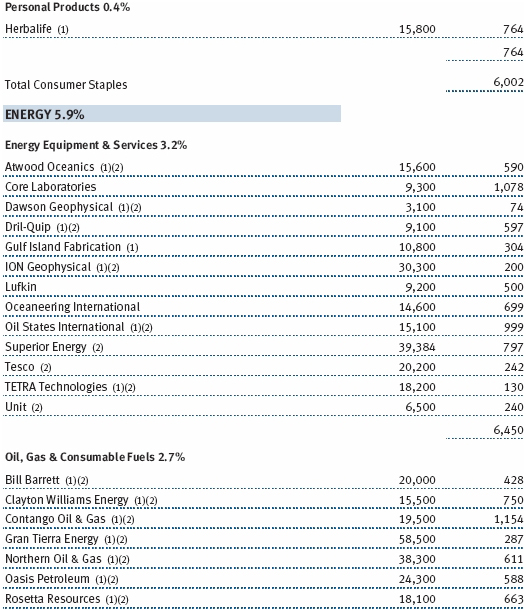
Energy stocks declined moderately in the last six months, and, as mentioned earlier, our stock selection hurt our relative performance. The energy sector has been hit by a double-whammy of reduced global demand, especially from the slowing Chinese economy, and increased U.S. energy production stemming from new uses of an old extraction method called fracking, or fracturing hard rock through hydraulic stimulation. Many of our oil, gas, and consumable fuel companies were among the portfolio’s largest detractors, especially Clayton Williams Energy, SM Energy, and Northern Oil and Gas. Energy equipment and services companies held up somewhat better, but Superior Energy Services and Oil States International still struggled.
OUTLOOK
U.S. equities declined during the second quarter in large part due to worries about the situation in Europe and the U.S. and Chinese economic slowdowns. Although European governments and the European Central Bank have taken some steps to stabilize the sovereign debt crisis, much more needs to be done to solve the underlying issues. We think this will be a multiyear process and will continue to create volatility in stock markets over the intermediate term. We also expect to see more interest rate cuts and other actions by central banks around the world to support economic growth.
U.S. job creation was fairly strong in late 2011 and in the first quarter of 2012, but it has decelerated in the past three months, and a number of other macroeconomic indicators have recently started weakening. We expect growth to remain relatively slow for the foreseeable future. In China, the current slowdown could signal a transition to slower growth in the future compared with the past three decades. This would have implications for companies that supply certain sectors in China and for global commodity prices. Indeed, oil prices have declined recently due to slowing global growth and increased production, as mentioned earlier. A decline in oil and other commodity prices should benefit the U.S. economy.
Despite the sluggish recovery of the last few years, many firms in various sectors have produced robust profits and have been accumulating cash while limiting capital expenditures. Second-quarter earnings, however, could be lower than expected due to the slowdown in emerging markets and Europe. Ultimately, we cannot expect stronger economic growth before firms start seeing permanent increases in demand and boost capital expenditures and hiring.
In this environment, we believe higher-quality companies will increasingly distinguish themselves with superior performance relative to their lower-quality peers. We also believe that concentrating on companies that generate healthy free cash flows and are judicious in deploying capital will provide good risk-adjusted returns.
Although global financial news often seems gloomy, we are encouraged that the U.S. economy is growing and monetary policy remains highly accommodative. While we are taking macroeconomic events into account in the course of monitoring portfolio risks, our strategy of having neutral sector weights versus our benchmark helps us avoid risks due to large moves in any one sector. Many of the characteristics we seek when identifying attractive stocks, such as a bias toward high-quality stocks that generate good cash flows, have helped the fund’s relative performance over the last few years. We plan to continue investing in a similar manner and would like to thank our shareholders for their confidence in our investment management abilities.
Respectfully submitted,
Sudhir Nanda
Chairman of the fund’s Investment Advisory
Committee
July 25, 2012
The committee chairman has day-to-day responsibility for managing the portfolio and works with committee members in developing and executing the fund’s investment program.
RISKS OF INVESTING
As with all stock mutual funds, the fund’s share price can fall because of weakness in the stock market, a particular industry, or specific holdings. Stock markets can decline for many reasons, including adverse political or economic developments, changes in investor psychology, or heavy institutional selling. The prospects for an industry or company may deteriorate because of a variety of factors, including disappointing earnings or changes in the competitive environment. In addition, the investment manager’s assessment of companies held in a fund may prove incorrect, resulting in losses or poor performance even in rising markets.
Growth stocks can be volatile for several reasons. Since these companies usually invest a high portion of earnings in their businesses, they may lack the dividends of value stocks that can cushion stock prices in a falling market. Also, earnings disappointments often lead to sharply falling prices because investors buy growth stocks in anticipation of superior earnings growth.
Investing in small companies involves greater risk than is customarily associated with larger companies. Stocks of smaller companies are subject to more abrupt or erratic price movements than larger-company stocks. Small companies often have limited product lines, markets, or financial resources, and their managements may lack depth and experience. Such companies seldom pay significant dividends that could cushion returns in a falling market.
GLOSSARY
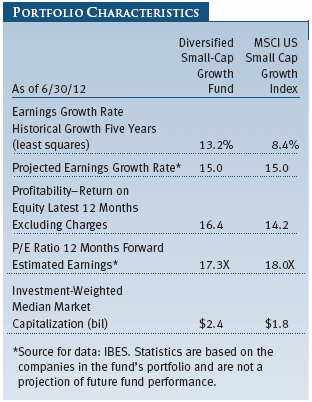
Earnings growth rate – current fiscal year: Measures the annualized percent change in earnings per share from the prior fiscal year to the current fiscal year.
Lipper indexes: Fund benchmarks that consist of a small number (10 to 30) of the largest mutual funds in a particular category as tracked by Lipper Inc.
MSCI US Small Cap Growth Index: Tracks the performance of domestic small-cap growth stocks as defined by MSCI.
Price-to-earnings (P/E) ratio – 12 months forward: A valuation measure calculated by dividing the price of a stock by the analysts’ forecast of the next 12 months’ expected earnings. The ratio is a measure of how much investors are willing to pay for the company’s future earnings. The higher the P/E, the more investors are paying for a company’s earnings growth in the next 12 months.
Projected earnings growth rate (IBES): A company’s expected earnings per share growth rate for a given time period based on the forecast from the Institutional Brokers’ Estimate System, which is commonly referred to as IBES.
Return on equity (ROE) – current fiscal year: A valuation measure calculated by dividing the company’s current fiscal year net income by shareholders’ equity (i.e., the company’s book value). ROE measures how much the company earns on each dollar that common stock investors have put into the company. It indicates how effectively and efficiently the company and its management are using stockholder investments.
Russell 2000 Growth Index: An index that tracks the performance of small-cap stocks with higher price-to-book ratios and higher forecasted growth values.
Russell 2000 Index: An unmanaged index that tracks the stocks of 2,000 small U.S. companies.
Russell 2000 Value Index: An index that tracks the performance of small-cap stocks with lower price-to-book ratios and lower forecasted growth values.
S&P 500 Index: An unmanaged index that tracks the stocks of 500 primarily large U.S. companies.
Performance and Expenses
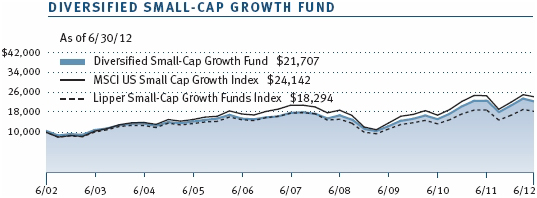
| Growth of $10,000 |
This chart shows the value of a hypothetical $10,000 investment in the fund over the past 10 fiscal year periods or since inception (for funds lacking 10-year records). The result is compared with benchmarks, which may include a broad-based market index and a peer group average or index. Market indexes do not include expenses, which are deducted from fund returns as well as mutual fund averages and indexes.
| Fund Expense Example |
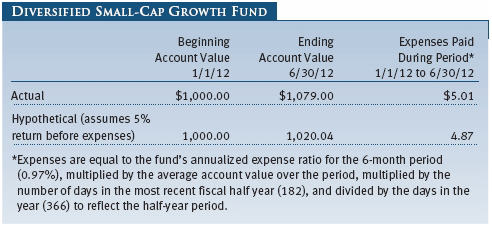
As a mutual fund shareholder, you may incur two types of costs: (1) transaction costs, such as redemption fees or sales loads, and (2) ongoing costs, including management fees, distribution and service (12b-1) fees, and other fund expenses. The following example is intended to help you understand your ongoing costs (in dollars) of investing in the fund and to compare these costs with the ongoing costs of investing in other mutual funds. The example is based on an investment of $1,000 invested at the beginning of the most recent six-month period and held for the entire period.
Actual
Expenses
The first line of the
following table (Actual) provides information about actual account values and
expenses based on the fund’s actual returns. You may use the information on this
line, together with your account balance, to estimate the expenses that you paid
over the period. Simply divide your account value by $1,000 (for example, an
$8,600 account value divided by $1,000 = 8.6), then multiply the result by the
number on the first line under the heading “Expenses Paid During Period” to
estimate the expenses you paid on your account during this period.
Hypothetical Example for
Comparison Purposes
The information
on the second line of the table (Hypothetical) is based on hypothetical account
values and expenses derived from the fund’s actual expense ratio and an assumed
5% per year rate of return before expenses (not the fund’s actual return). You
may compare the ongoing costs of investing in the fund with other funds by
contrasting this 5% hypothetical example and the 5% hypothetical examples that
appear in the shareholder reports of the other funds. The hypothetical account
values and expenses may not be used to estimate the actual ending account
balance or expenses you paid for the period.
Note: T. Rowe Price charges an annual account service fee of $20, generally for accounts with less than $10,000. The fee is waived for any investor whose T. Rowe Price mutual fund accounts total $50,000 or more; accounts electing to receive electronic delivery of account statements, transaction confirmations, prospectuses, and shareholder reports; or accounts of an investor who is a T. Rowe Price Preferred Services, Personal Services, or Enhanced Personal Services client (enrollment in these programs generally requires T. Rowe Price assets of at least $100,000). This fee is not included in the accompanying table. If you are subject to the fee, keep it in mind when you are estimating the ongoing expenses of investing in the fund and when comparing the expenses of this fund with other funds.
You should also be aware that the expenses shown in the table highlight only your ongoing costs and do not reflect any transaction costs, such as redemption fees or sales loads. Therefore, the second line of the table is useful in comparing ongoing costs only and will not help you determine the relative total costs of owning different funds. To the extent a fund charges transaction costs, however, the total cost of owning that fund is higher.
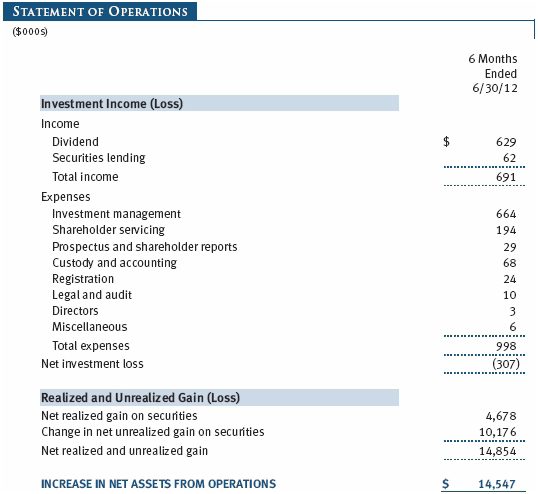
Unaudited
The accompanying notes are an integral part of these financial statements.
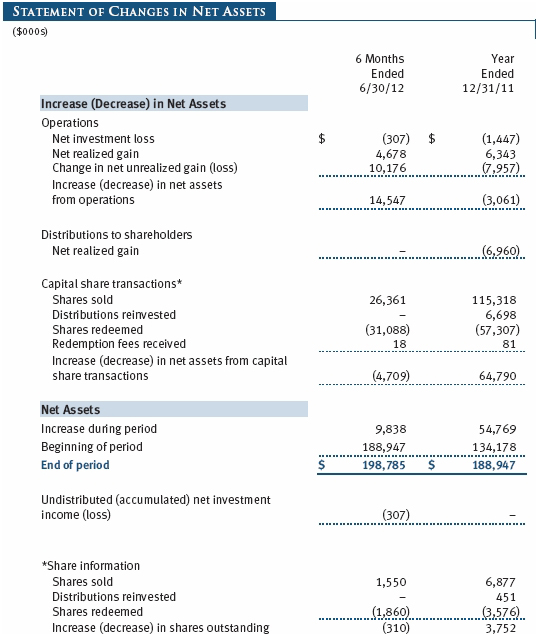
Unaudited
The accompanying notes are an integral part of these financial statements.
Unaudited
The accompanying notes are an integral part of these financial statements.
Unaudited
The accompanying notes are an integral part of these financial statements.
Unaudited
The accompanying notes are an integral part of these financial statements.
Unaudited
| Notes to Financial Statements |
T. Rowe Price Diversified Small-Cap Growth Fund, Inc. (the fund), is registered under the Investment Company Act of 1940 (the 1940 Act) as a diversified, open-end management investment company. The fund commenced operations on June 30, 1997. The fund seeks long-term growth of capital by investing primarily in common stocks of small growth companies.
NOTE 1 - SIGNIFICANT ACCOUNTING POLICIES
Basis of Preparation The accompanying financial statements were prepared in accordance with accounting principles generally accepted in the United States of America (GAAP), which require the use of estimates made by management. Management believes that estimates and valuations are appropriate; however, actual results may differ from those estimates, and the valuations reflected in the accompanying financial statements may differ from the value ultimately realized upon sale or maturity.
Investment Transactions, Investment Income, and Distributions Income and expenses are recorded on the accrual basis. Dividends received from mutual fund investments are reflected as dividend income; capital gain distributions are reflected as realized gain/loss. Dividend income and capital gain distributions are recorded on the ex-dividend date. Income tax-related interest and penalties, if incurred, would be recorded as income tax expense. Investment transactions are accounted for on the trade date. Realized gains and losses are reported on the identified cost basis. Distributions to shareholders are recorded on the ex-dividend date. Income distributions are declared and paid annually. Capital gain distributions, if any, are generally declared and paid by the fund annually.
Rebates and Credits Subject to best execution, the fund may direct certain security trades to brokers who have agreed to rebate a portion of the related brokerage commission to the fund in cash. Commission rebates are reflected as realized gain on securities in the accompanying financial statements. Additionally, the fund earns credits on temporarily uninvested cash balances held at the custodian, which reduce the fund’s custody charges. Custody expense in the accompanying financial statements is presented before reduction for credits.
Redemption Fees A 1% fee is assessed on redemptions of fund shares held for 90 days or less to deter short-term trading and to protect the interests of long-term shareholders. Redemption fees are withheld from proceeds that shareholders receive from the sale or exchange of fund shares. The fees are paid to the fund and are recorded as an increase to paid-in capital. The fees may cause the redemption price per share to differ from the net asset value per share.
New Accounting Pronouncements In May 2011, the Financial Accounting Standards Board (FASB) issued amended guidance to align fair value measurement and disclosure requirements in U.S. GAAP with International Financial Reporting Standards. The guidance is effective for fiscal years and interim periods beginning on or after December 15, 2011. Adoption had no effect on net assets or results of operations.
In December 2011, the FASB issued amended guidance to enhance disclosure for offsetting assets and liabilities. The guidance is effective for fiscal years and interim periods beginning on or after January 1, 2013. Adoption will have no effect on the fund’s net assets or results of operations.
NOTE 2 - VALUATION
The fund’s financial instruments are reported at fair value as defined by GAAP. The fund determines the values of its assets and liabilities and computes its net asset value per share at the close of the New York Stock Exchange (NYSE), normally 4 p.m. ET, each day that the NYSE is open for business.
Valuation Methods Equity securities listed or regularly traded on a securities exchange or in the over-the-counter (OTC) market are valued at the last quoted sale price or, for certain markets, the official closing price at the time the valuations are made, except for OTC Bulletin Board securities, which are valued at the mean of the latest bid and asked prices. A security that is listed or traded on more than one exchange is valued at the quotation on the exchange determined to be the primary market for such security. Listed securities not traded on a particular day are valued at the mean of the latest bid and asked prices for domestic securities and the last quoted sale price for international securities.
Investments in mutual funds are valued at the mutual fund’s closing net asset value per share on the day of valuation.
Other investments, including restricted securities and private placements, and those financial instruments for which the above valuation procedures are inappropriate or are deemed not to reflect fair value, are stated at fair value as determined in good faith by the T. Rowe Price Valuation Committee, established by the fund’s Board of Directors (the Board). Subject to oversight by the Board, the Valuation Committee develops pricing-related policies and procedures and approves all fair-value determinations. The Valuation Committee regularly makes good faith judgments, using a wide variety of sources and information, to establish and adjust valuations of certain securities as events occur and circumstances warrant. For instance, in determining the fair value of private-equity instruments, the Valuation Committee considers a variety of factors, including the company’s business prospects, its financial performance, strategic events impacting the company, relevant valuations of similar companies, new rounds of financing, and any negotiated transactions of significant size between other investors in the company. Because any fair-value determination involves a significant amount of judgment, there is a degree of subjectivity inherent in such pricing decisions.
Valuation Inputs Various inputs are used to determine the value of the fund’s financial instruments. These inputs are summarized in the three broad levels listed below:
Level 1 – quoted prices in active markets for identical financial instruments
Level 2 – observable inputs other than Level 1 quoted prices (including, but not limited to, quoted prices for similar financial instruments, interest rates, prepayment speeds, and credit risk)
Level 3 – unobservable inputs
Observable inputs are those based on market data obtained from sources independent of the fund, and unobservable inputs reflect the fund’s own assumptions based on the best information available. The input levels are not necessarily an indication of the risk or liquidity associated with financial instruments at that level. On June 30, 2012, all of the fund’s financial instruments were classified as Level 1, based on the inputs used to determine their values.
NOTE 3 - OTHER INVESTMENT TRANSACTIONS
Consistent with its investment objective, the fund engages in the following practices to manage exposure to certain risks and/or to enhance performance. The investment objective, policies, program, and risk factors of the fund are described more fully in the fund’s prospectus and Statement of Additional Information.
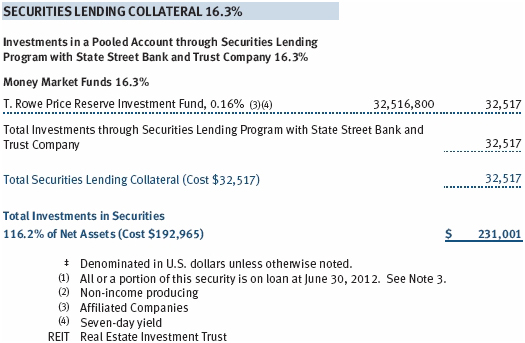
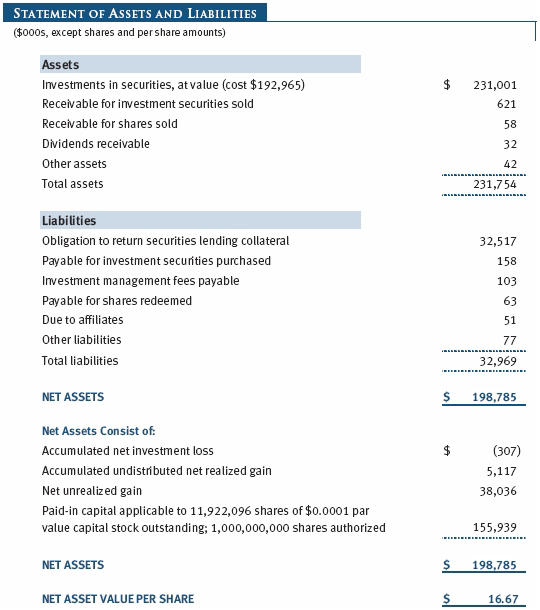
Securities Lending The fund lends its securities to approved brokers to earn additional income. It receives as collateral cash and U.S. government securities valued at 102% to 105% of the value of the securities on loan. Collateral is maintained over the life of the loan in an amount not less than the value of loaned securities as determined at the close of fund business each day; any additional collateral required due to changes in security values is delivered to the fund the next business day. Cash collateral is invested by the fund’s lending agent(s) in accordance with investment guidelines approved by management. Although risk is mitigated by the collateral, the fund could experience a delay in recovering its securities and a possible loss of income or value if the borrower fails to return the securities or if collateral investments decline in value. Securities lending revenue recognized by the fund consists of earnings on invested collateral and borrowing fees, net of any rebates to the borrower and compensation to the lending agent. In accordance with GAAP, investments made with cash collateral are reflected in the accompanying financial statements, but collateral received in the form of securities are not. On June 30, 2012, the value of cash collateral investments was $32,517,000, and the value of loaned securities was $32,634,000.
Other Purchases and sales of portfolio securities other than short-term securities aggregated $14,596,000 and $19,560,000, respectively, for the six months ended June 30, 2012.
NOTE 4 - FEDERAL INCOME TAXES
No provision for federal income taxes is required since the fund intends to continue to qualify as a regulated investment company under Subchapter M of the Internal Revenue Code and distribute to shareholders all of its taxable income and gains. Distributions determined in accordance with federal income tax regulations may differ in amount or character from net investment income and realized gains for financial reporting purposes. Financial reporting records are adjusted for permanent book/tax differences to reflect tax character but are not adjusted for temporary differences. The amount and character of tax-basis distributions and composition of net assets are finalized at fiscal year-end; accordingly, tax-basis balances have not been determined as of the date of this report.
The fund intends to retain realized gains to the extent of available capital loss carryforwards. Net realized capital losses may be carried forward indefinitely to offset future realized capital gains.
At June 30, 2012, the cost of investments for federal income tax purposes was $193,027,000. Net unrealized gain aggregated $37,974,000 at period-end, of which $51,568,000 related to appreciated investments and $13,594,000 related to depreciated investments.
NOTE 5 - RELATED PARTY TRANSACTIONS
The fund is managed by T. Rowe Price Associates, Inc. (Price Associates), a wholly owned subsidiary of T. Rowe Price Group, Inc. (Price Group). The investment management agreement between the fund and Price Associates provides for an annual investment management fee, which is computed daily and paid monthly. The fee consists of an individual fund fee, equal to 0.35% of the fund’s average daily net assets, and a group fee. The group fee rate is calculated based on the combined net assets of certain mutual funds sponsored by Price Associates (the group) applied to a graduated fee schedule, with rates ranging from 0.48% for the first $1 billion of assets to 0.28% for assets in excess of $300 billion. The fund’s group fee is determined by applying the group fee rate to the fund’s average daily net assets. At June 30, 2012, the effective annual group fee rate was 0.30%.
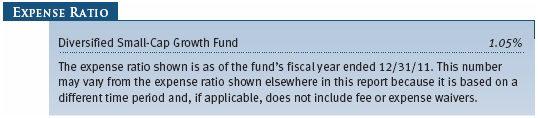
The fund was also subject to a contractual expense limitation through April 30, 2012. During the limitation period, Price Associates was required to waive its management fee and reimburse the fund for any expenses, excluding interest, taxes, brokerage commissions, and extraordinary expenses, that would otherwise cause the fund’s ratio of annualized total expenses to average net assets (expense ratio) to exceed its expense limitation of 1.25%. The fund is required to repay Price Associates for expenses previously reimbursed and management fees waived to the extent the fund’s net assets have grown or expenses have declined sufficiently to allow repayment without causing the fund’s expense ratio to exceed its expense limitation. However, no repayment will be made more than three years after the date of any reimbursement or waiver or later than April 30, 2014. At June 30, 2012, there were no amounts subject to repayment by the fund. For the six months ended June 30, 2012, the fund operated below its expense limitation.
In addition, the fund has entered into service agreements with Price Associates and two wholly owned subsidiaries of Price Associates (collectively, Price). Price Associates computes the daily share price and provides certain other administrative services to the fund. T. Rowe Price Services, Inc., provides shareholder and administrative services in its capacity as the fund’s transfer and dividend disbursing agent. T. Rowe Price Retirement Plan Services, Inc., provides subaccounting and recordkeeping services for certain retirement accounts invested in the fund. For the six months ended June 30, 2012, expenses incurred pursuant to these service agreements were $51,000 for Price Associates; $127,000 for T. Rowe Price Services, Inc.; and $10,000 for T. Rowe Price Retirement Plan Services, Inc. The total amount payable at period-end pursuant to these service agreements is reflected as Due to Affiliates in the accompanying financial statements.
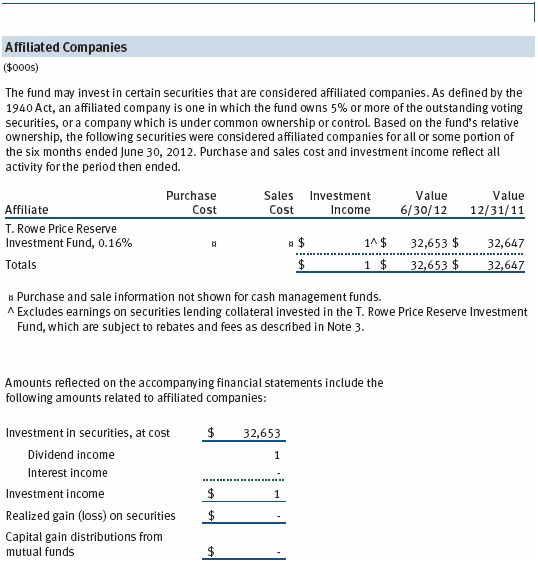
The fund may invest in the T. Rowe Price Reserve Investment Fund and the T. Rowe Price Government Reserve Investment Fund (collectively, the T. Rowe Price Reserve Investment Funds), open-end management investment companies managed by Price Associates and considered affiliates of the fund. The T. Rowe Price Reserve Investment Funds are offered as cash management options to mutual funds, trusts, and other accounts managed by Price Associates and/or its affiliates and are not available for direct purchase by members of the public. The T. Rowe Price Reserve Investment Funds pay no investment management fees.
| Information on Proxy Voting Policies, Procedures, and Records |
A description of the policies and procedures used by T. Rowe Price funds and portfolios to determine how to vote proxies relating to portfolio securities is available in each fund’s Statement of Additional Information, which you may request by calling 1-800-225-5132 or by accessing the SEC’s website, sec.gov. The description of our proxy voting policies and procedures is also available on our website, troweprice.com. To access it, click on the words “Our Company” at the top of our corporate homepage. Then, when the next page appears, click on the words “Proxy Voting Policies” on the left side of the page.
Each fund’s most recent annual proxy voting record is available on our website and through the SEC’s website. To access it through our website, follow the directions above, then click on the words “Proxy Voting Records” on the right side of the Proxy Voting Policies page.
| How to Obtain Quarterly Portfolio Holdings |
The fund files a complete schedule of portfolio holdings with the Securities and Exchange Commission for the first and third quarters of each fiscal year on Form N-Q. The fund’s Form N-Q is available electronically on the SEC’s website (sec.gov); hard copies may be reviewed and copied at the SEC’s Public Reference Room, 100 F St. N.E., Washington, DC 20549. For more information on the Public Reference Room, call 1-800-SEC-0330.
| Approval of Investment Management Agreement |
On March 6, 2012, the fund’s Board of Directors (Board), including a majority of the fund’s independent directors, approved the continuation of the investment management agreement (Advisory Contract) between the fund and its investment advisor, T. Rowe Price Associates, Inc. (Advisor). In connection with its deliberations, the Board requested, and the Advisor provided, such information as the Board (with advice from independent legal counsel) deemed reasonably necessary. The Board considered a variety of factors in connection with its review of the Advisory Contract, also taking into account information provided by the Advisor during the course of the year, as discussed below:
Services Provided by the
Advisor
The Board considered the
nature, quality, and extent of the services provided to the fund by the Advisor.
These services included, but were not limited to, directing the fund’s
investments in accordance with its investment program and the overall management
of the fund’s portfolio, as well as a variety of related activities such as
financial, investment operations, and administrative services; compliance;
maintaining the fund’s records and registrations; and shareholder
communications. The Board also reviewed the background and experience of the
Advisor’s senior management team and investment personnel involved in the
management of the fund, as well as the Advisor’s compliance record. The Board
concluded that it was satisfied with the nature, quality, and extent of the
services provided by the Advisor.
Investment Performance of the
Fund
The Board reviewed the fund’s
average annual total returns over the three-month and 1-, 3-, 5-, and 10-year
periods, as well as the fund’s year-by-year returns, and compared these returns
with a wide variety of previously agreed upon comparable performance measures
and market data, including those supplied by Lipper and Morningstar, which are
independent providers of mutual fund data.
On the basis of this evaluation and the Board’s ongoing review of investment results, and factoring in the relative market conditions during certain of the performance periods, the Board concluded that the fund’s performance was satisfactory.
Costs, Benefits, Profits, and
Economies of Scale
The Board reviewed
detailed information regarding the revenues received by the Advisor under the
Advisory Contract and other benefits that the Advisor (and its affiliates) may
have realized from its relationship with the fund, including any research
received under “soft dollar” agreements and commission-sharing arrangements with
broker-dealers. The Board considered that the Advisor may receive some benefit
from soft-dollar arrangements pursuant to which research is received from
broker-dealers that execute the applicable fund’s portfolio transactions. The
Board received information on the estimated costs incurred and profits realized
by the Advisor from managing T. Rowe Price mutual funds. The Board also reviewed
estimates of the profits realized from managing the fund in particular, and the
Board concluded that the Advisor’s profits were reasonable in light of the
services provided to the fund.
The Board also considered whether the fund benefits under the fee levels set forth in the Advisory Contract from any economies of scale realized by the Advisor. Under the Advisory Contract, the fund pays a fee to the Advisor for investment management services composed of two components—a group fee rate based on the combined average net assets of most of the T. Rowe Price mutual funds (including the fund) that declines at certain asset levels and an individual fund fee rate based on the fund’s average daily net assets—and the fund pays its own expenses of operations (subject to an expense limitation agreed to by the Advisor). The Board concluded that the advisory fee structure for the fund continued to provide for a reasonable sharing of benefits from any economies of scale with the fund’s investors.
Fees
The Board was provided with information regarding
industry trends in management fees and expenses, and the Board reviewed the
fund’s management fee rate, operating expenses, and total expense ratio in
comparison with fees and expenses of other comparable funds based on information
and data supplied by Lipper. The information provided to the Board indicated
that the fund’s management fee rate (after including increases to the management
fee that resulted from the recapture of fees that were previously waived or
expenses that were previously paid by the Advisor pursuant to the expense
limitation) was above the median for certain groups of comparable funds but at
or below the median for other groups of comparable funds. The information also
indicated that the fund’s total expense ratio was above the median for certain
groups of comparable funds but below the median for other groups of comparable
funds.
The Board also reviewed the fee schedules for institutional accounts and private accounts with similar mandates that are advised or subadvised by the Advisor and its affiliates. Management provided the Board with information about the Advisor’s responsibilities and services provided to institutional account clients, including information about how the requirements and economics of the institutional business are fundamentally different from those of the mutual fund business. The Board considered information showing that the mutual fund business is generally more complex from a business and compliance perspective than the institutional business and that the Advisor generally performs significant additional services and assumes greater risk in managing the fund and other T. Rowe Price mutual funds than it does for institutional account clients.
On the basis of the information provided and the factors considered, the Board concluded that the fees paid by the fund under the Advisory Contract are reasonable.
Approval of the Advisory
Contract
As noted, the Board approved
the continuation of the Advisory Contract. No single factor was considered in
isolation or to be determinative to the decision. Rather, the Board concluded,
in light of a weighting and balancing of all factors considered, that it was in
the best interests of the fund and its shareholders for the Board to approve the
continuation of the Advisory Contract (including the fees to be charged for
services thereunder). The independent directors were advised throughout the
process by independent legal counsel.
Item 2. Code of Ethics.
A code of ethics, as defined in Item 2 of Form N-CSR, applicable to its principal executive officer, principal financial officer, principal accounting officer or controller, or persons performing similar functions is filed as an exhibit to the registrant’s annual Form N-CSR. No substantive amendments were approved or waivers were granted to this code of ethics during the registrant’s most recent fiscal half-year.
Item 3. Audit Committee Financial Expert.
Disclosure required in registrant’s annual Form N-CSR.
Item 4. Principal Accountant Fees and Services.
Disclosure required in registrant’s annual Form N-CSR.
Item 5. Audit Committee of Listed Registrants.
Not applicable.
Item 6. Investments.
(a) Not applicable. The complete schedule of investments is included in Item 1 of this Form N-CSR.
(b) Not applicable.
Item 7. Disclosure of Proxy Voting Policies and Procedures for Closed-End Management Investment Companies.
Not applicable.
Item 8. Portfolio Managers of Closed-End Management Investment Companies.
Not applicable.
Item 9. Purchases of Equity Securities by Closed-End Management Investment Company and Affiliated Purchasers.
Not applicable.
Item 10. Submission of Matters to a Vote of Security Holders.
Not applicable.
Item 11. Controls and Procedures.
(a) The registrant’s principal executive officer and principal financial officer have evaluated the registrant’s disclosure controls and procedures within 90 days of this filing and have concluded that the registrant’s disclosure controls and procedures were effective, as of that date, in ensuring that information required to be disclosed by the registrant in this Form N-CSR was recorded, processed, summarized, and reported timely.
(b) The registrant’s principal executive officer and principal financial officer are aware of no change in the registrant’s internal control over financial reporting that occurred during the registrant’s second fiscal quarter covered by this report that has materially affected, or is reasonably likely to materially affect, the registrant’s internal control over financial reporting.
Item 12. Exhibits.
(a)(1) The registrant’s code of ethics pursuant to Item 2 of Form N-CSR is filed with the registrant’s annual Form N-CSR.
(2) Separate certifications by the registrant's principal executive officer and principal financial officer, pursuant to Section 302 of the Sarbanes-Oxley Act of 2002 and required by Rule 30a-2(a) under the Investment Company Act of 1940, are attached.
(3) Written solicitation to repurchase securities issued by closed-end companies: not applicable.
(b) A certification by the registrant's principal executive officer and principal financial officer, pursuant to Section 906 of the Sarbanes-Oxley Act of 2002 and required by Rule 30a-2(b) under the Investment Company Act of 1940, is attached.
SIGNATURES
Pursuant to the requirements of the Securities Exchange Act of 1934 and the Investment Company Act of 1940, the registrant has duly caused this report to be signed on its behalf by the undersigned, thereunto duly authorized.
T. Rowe Price Diversified Small-Cap Growth Fund, Inc.
| By | /s/ Edward C. Bernard | |
| Edward C. Bernard | ||
| Principal Executive Officer | ||
| Date August 16, 2012 | ||
Pursuant to the
requirements of the Securities Exchange Act of 1934 and the Investment Company
Act of 1940, this report has been signed below by the following persons on
behalf of the registrant and in the capacities and on the dates indicated.
| By | /s/ Edward C. Bernard | |
| Edward C. Bernard | ||
| Principal Executive Officer | ||
| Date August 16, 2012 | ||
| By | /s/ Gregory K. Hinkle | |
| Gregory K. Hinkle | ||
| Principal Financial Officer | ||
| Date August 16, 2012 | ||