Exhibit 99.1

|
News Release |
Pioneer Natural Resources Reports Fourth Quarter 2012
Financial and Operating Results and Announces 2013 Capital Budget
Dallas, Texas, February 13, 2013 — Pioneer Natural Resources Company (NYSE:PXD) (“Pioneer” or “the Company”) today announced financial and operating results for the quarter ended December 31, 2012, and announced its 2013 capital budget.
Pioneer reported fourth quarter net income attributable to common stockholders of $29 million, or $0.22 per diluted share (see attached schedule for a description of the net income per diluted share calculation). Without the effect of noncash derivative mark-to-market gains and other unusual items, adjusted income for the fourth quarter was $107 million after tax, or $0.83 per diluted share.
Fourth quarter and other recent highlights included:
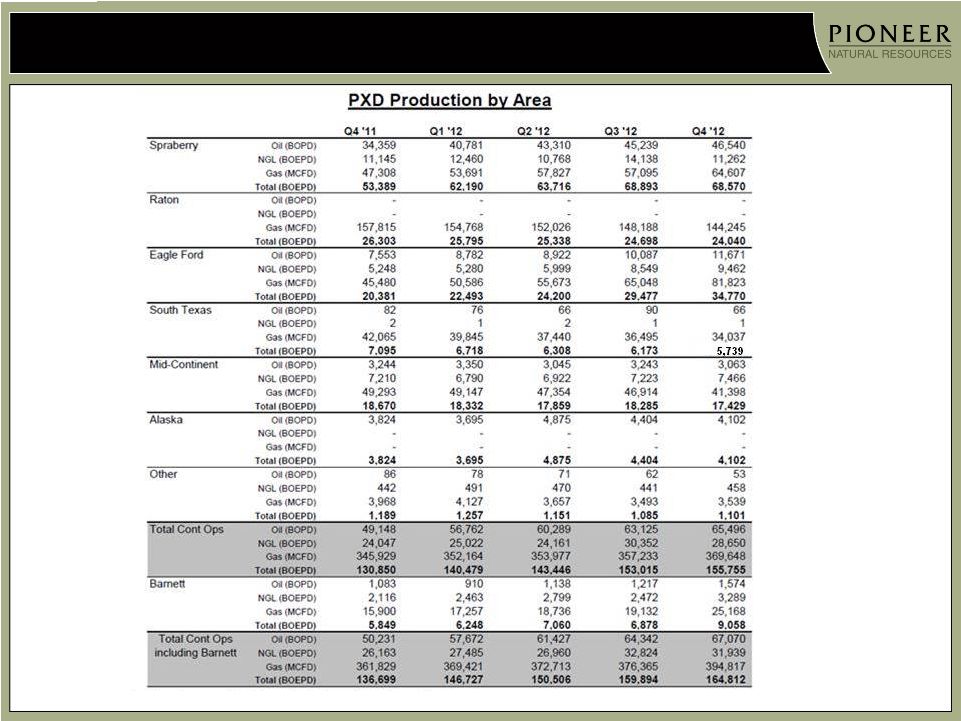
| • | producing 165 thousand barrels oil equivalent per day (MBOEPD) in the fourth quarter, including Barnett Shale production (the Barnett Shale properties were reclassified from discontinued operations to continuing operations after the decision was made to discontinue efforts to divest of these properties), |
| • | producing 156 MBOEPD in the fourth quarter, excluding Barnett Shale production, which was in the middle of the Company’s fourth quarter guidance range of 154 MBOEPD to 158 MBOEPD (fourth quarter guidance excluded Barnett Shale production since it was classified as discontinued operations when the fourth quarter guidance was provided), |
| • | producing 156 MBOEPD from continuing operations in 2012 (includes Barnett Shale production), an increase of 29% compared to 2011 and at the top end of Pioneer’s full-year 2012 guidance; the strong production growth in 2012 was driven by the Company’s drilling programs in the Spraberry vertical, horizontal Wolfcamp Shale, Eagle Ford Shale and Barnett Shale Combo areas, |
| • | delivering 264% drillbit reserve replacement (161 million barrels oil equivalent) at a drillbit finding and development cost, excluding pricing revisions, of $17.72 per barrel oil equivalent (BOE), |
| • | placing on production Pioneer’s first horizontal Wolfcamp Shale well in the B interval in Midland County, Texas, (24-hour peak initial flow rate of 1,693 barrels oil equivalent per day (BOEPD) and peak 20-day average natural flow rate of 1,510 BOEPD with approximately 75% oil content), which demonstrates the prospectivity of Pioneer’s northern Wolfcamp/Spraberry acreage that encompasses more than 600,000 gross acres, |
| • | initiating a two-year $1.0 billion horizontal drilling appraisal program of Pioneer’s northern Wolfcamp/Spraberry acreage, of which $0.4 billion is included in the 2013 drilling budget of $2.75 billion and the remainder is expected to be spent in 2014, |
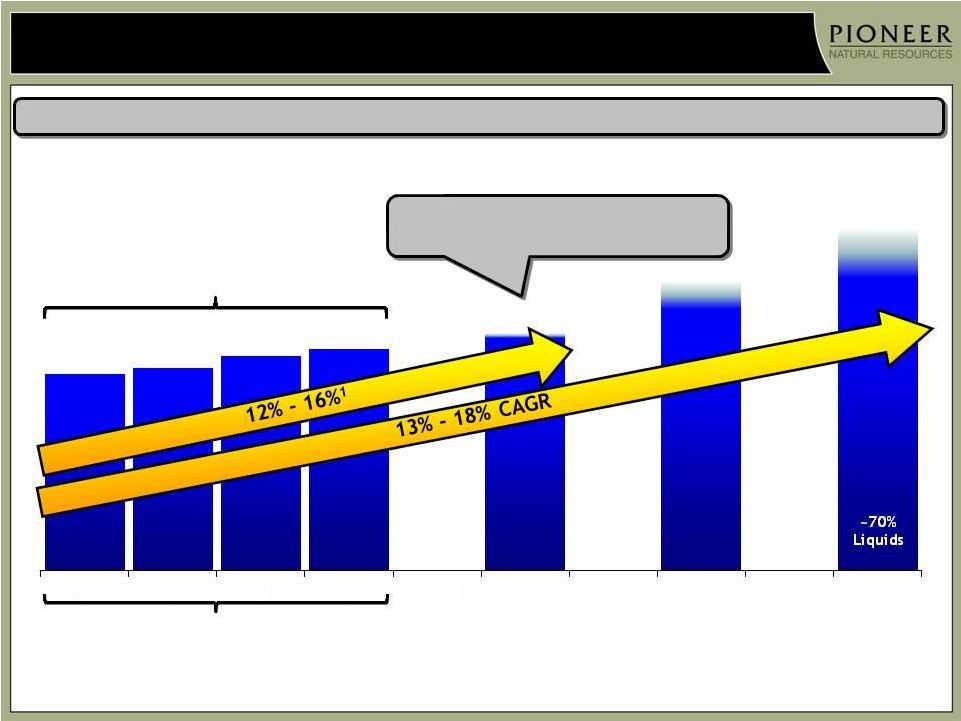
| • | forecasting annual production growth of 12% to 16% from 2012 to 2013, |
| • | targeting 13% to 18% compound annual production growth for 2013 to 2015, |
| • | signing a $1.74 billion horizontal Wolfcamp Shale joint interest agreement with Sinochem, which equates to $21,000 per acre for approximately 10% of Pioneer’s aggregate Wolfcamp/Spraberry gross acreage position, |
| • | continuing to deliver improving horizontal Wolfcamp Shale results in the joint interest area, including: |
| • | placing on production Pioneer’s first horizontal Wolfcamp Shale well with a 10,000-foot lateral in the Upper B interval in Reagan County (24-hour peak flow rate of 1,203 BOEPD and peak 20-day average flow rate of 1,022 BOEPD with approximately 80% oil content); |
| • | placing on production Pioneer’s first Wolfcamp Shale Lower B interval well and a successful Wolfcamp Shale A interval well in Reagan County (both currently producing above type curve expectations); |
| • | well performance from existing wells continuing to meet type curve expectations; and |
| • | achieving targeted year-end 2012 horizontal Wolfcamp Shale production exit rate of 5 MBOEPD; and |
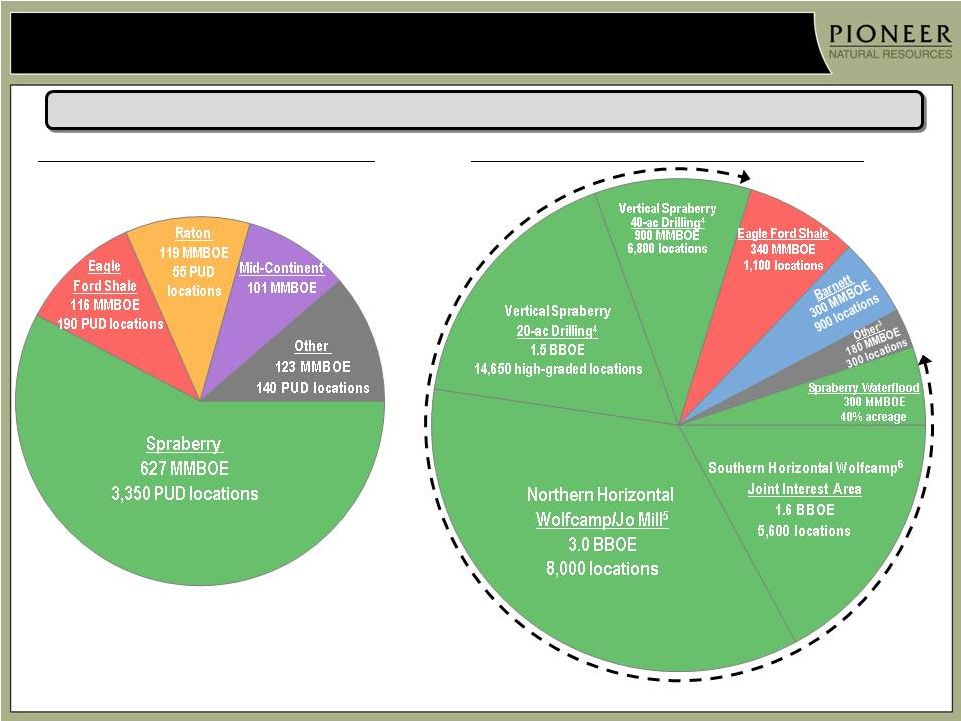
| • | increasing the Company’s estimated net resource potential from 6.7 billion barrels oil equivalent (BBOE) to greater than 8.0 BBOE, which includes 1.6 BBOE from the southern horizontal Wolfcamp Shale joint interest area and 3.0 BBOE from Pioneer’s northern Wolfcamp/Spraberry acreage. |
Scott Sheffield, Chairman and CEO, stated, “Pioneer had another great year in 2012. We delivered strong production and reserve growth, while continuing to be among the top performers in our peer group in total shareholder return. Our extensive Midland Basin geologic analysis has identified multiple prospective horizontal targets throughout Pioneer’s extensive 900,000-acre Wolfcamp/Spraberry leasehold position with an aggregate estimated resource potential of more than 4.6 BBOE. During 2012, we focused on appraising and developing the southern 200,000 acres of the play. This culminated in the signing of the joint interest agreement with Sinochem that will allow horizontal development of the Wolfcamp Shale in this area to be accelerated. We were also able to begin drilling horizontal wells on our northern acreage to appraise the potential of the horizontal Wolfcamp Shale in this area. Early results are extremely encouraging, and we are initiating a $1 billion dollar appraisal program for 2013 and 2014 to confirm the estimated 3.0 BBOE of resource potential we believe exists in our northern acreage, which should add substantial net asset value to the Company.”
Mark-To-Market Derivative Gains and Unusual Items Included in Fourth Quarter 2012 Earnings
Pioneer’s fourth quarter earnings included unrealized mark-to-market gains on derivatives of $14 million after tax, or $0.11 per diluted share.
Fourth quarter earnings also included a net charge of $92 million after tax, or $0.72 per diluted share, related to the following unusual items:
| • | a noncash impairment charge of $101 million after tax, or $0.78 per diluted share, to reduce the proved and unproved property basis of the Company’s Barnett Shale assets in Texas that were previously held for sale, partially offset by |
| • | Alaska production tax credit recoveries of $9 million after tax, or $0.06 per diluted share. |
Operations Update and Drilling Program
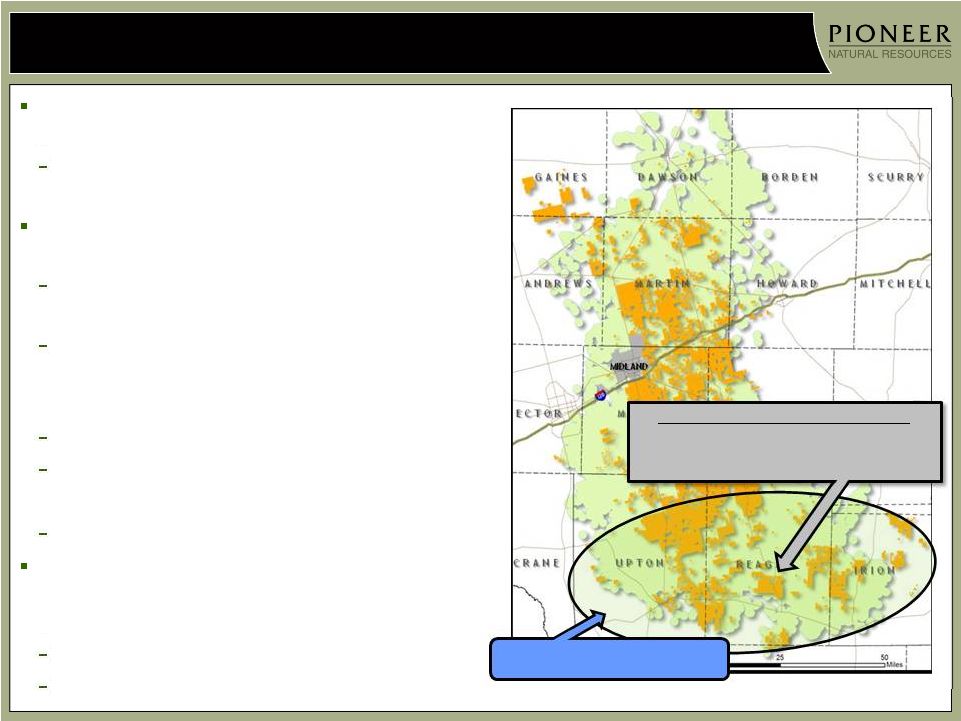
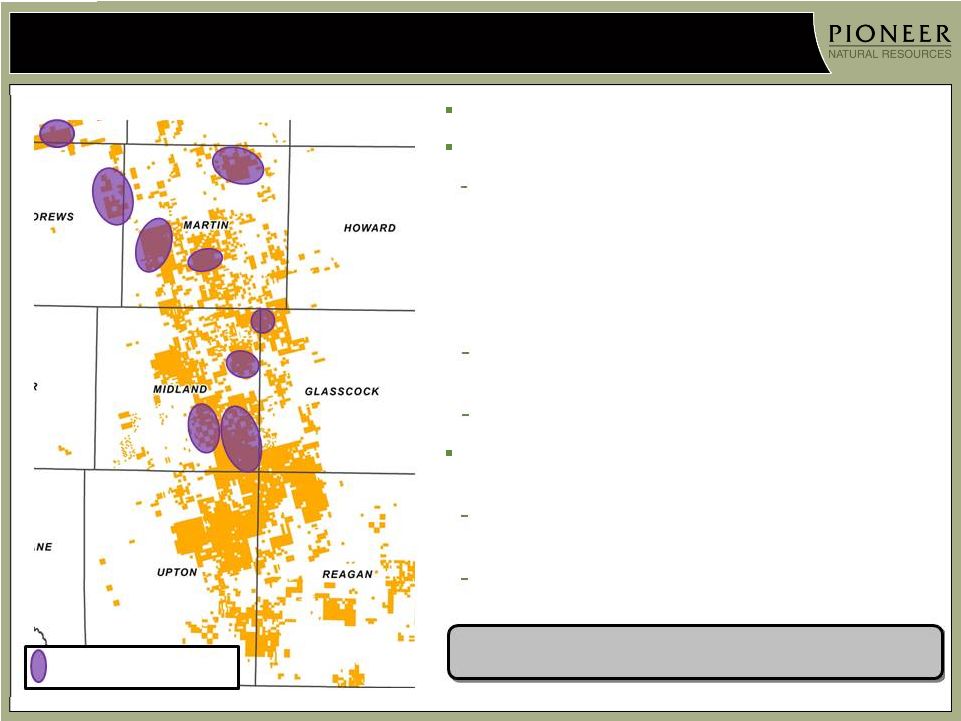
Pioneer’s successful horizontal Wolfcamp Shale and Jo Mill drilling results in the Spraberry Trend Area field have led the Company to shift a significant portion of its 2013 drilling activity from vertical drilling to more capital efficient horizontal drilling. Pioneer is the largest acreage holder in the Spraberry Trend Area field, where the Company believes it has greater than 4.6 BBOE of estimated resource potential from horizontal drilling based on its extensive geologic data and its successful drilling results to date.
The Company recently signed an agreement with Sinochem to sell 40% of Pioneer’s interest in 207,000 net acres leased by the Company in the southern portion of the Spraberry Trend Area field for total consideration of $1.74 billion. At closing, Sinochem will pay $522 million in cash to Pioneer, before normal closing adjustments, and will pay the remaining $1.2 billion by carrying a portion of Pioneer’s share of future drilling and facilities costs. The transaction is estimated to close by June 1, 2013, subject to governmental and third-party approvals.
Under the agreement, Sinochem will acquire 82,800 net acres of leasehold held by Pioneer in the Wolfcamp horizon. Pioneer retains 60% of its interest in the Wolfcamp depths and deeper horizons, with Sinochem receiving 40% of Pioneer’s interest. Pioneer will continue as operator and will conduct all leasing, drilling, operations and marketing activities in the joint interest area. The joint interest area covers defined portions of Upton, Reagan, Irion, Crockett and Tom Green Counties in Texas. Pioneer retains its current working interests in all horizons shallower than the Wolfcamp horizon.
In addition to funding its own drilling obligations for the horizontal Wolfcamp Shale, Sinochem has agreed to fund 75% of Pioneer’s portion of drilling and facilities costs after closing until the $1.2 billion of drilling carry is fully utilized. At closing, Sinochem will pay its 40% share of net expenditures in the joint interest area from the December 1, 2012 effective date of the transaction to the closing date. Pioneer and Sinochem have agreed to a development plan which forecasts the drilling of 86 horizontal Wolfcamp Shale wells during 2013, increasing to 120 wells in 2014 and 165 wells in 2015.
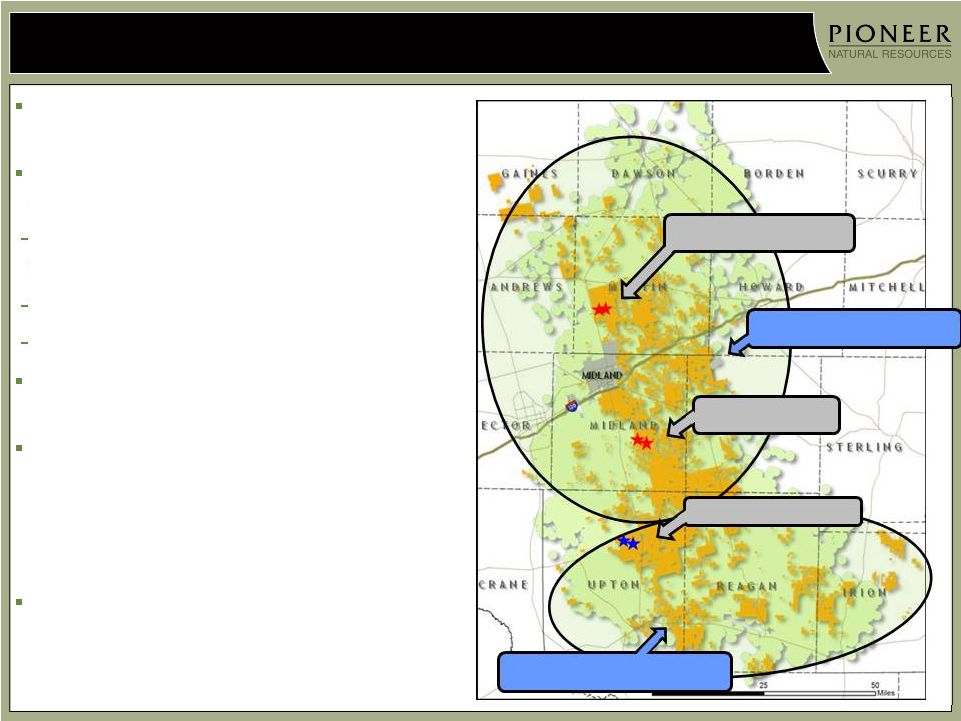
Pioneer successfully drilled and completed 39 horizontal wells in the Wolfcamp Shale joint interest area during 2012, of which 26 wells were placed on production. Of the 26 wells on production, 22 wells were completed in the B interval and 4 wells were completed in the A interval. Pioneer’s net horizontal Wolfcamp Shale production in the joint interest area averaged 2 MBOEPD in 2012, with a year-end exit rate of 5 MBOEPD.
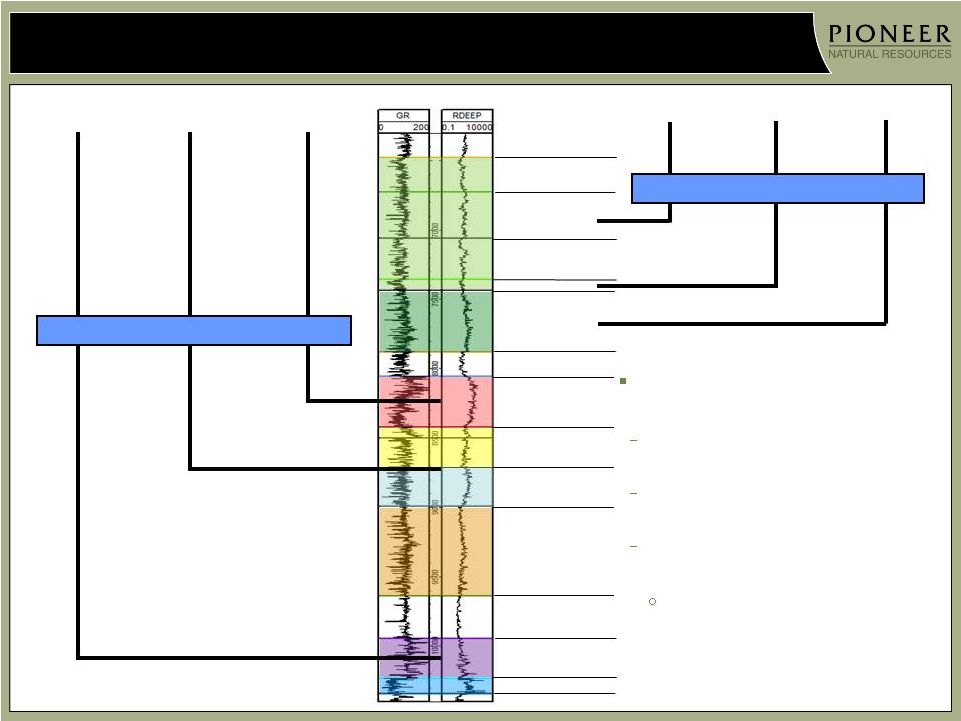
The thickness of the Wolfcamp B interval in the southern joint interest area provides the opportunity to complete two stacked laterals in the interval (referred to as Upper B interval and Lower B interval). The Company placed its first Lower B interval well on production in the fourth quarter, which had an initial 24-hour peak flow rate of 696 BOEPD. A Wolfcamp A interval well was also placed on production in the fourth quarter with initial 24-hour peak flow rate of 442 BOEPD. Both wells had an oil content of approximately 80% and continue to produce above the 575 thousand barrel oil equivalent (MBOE) average estimated ultimate recovery (EUR) type curve for horizontal Wolfcamp Shale wells in the southern joint interest area.
Pioneer also placed its first horizontal Wolfcamp Shale well with a 10,000-foot lateral on production during January 2013. It had an initial peak 24-hour production rate of 1,203 BOEPD and an average peak 20-day flow rate of 1,022 BOEPD. The oil content of this well is approximately 80%. The performance of this well is substantially above the 650 MBOE EUR type curve that reflects the performance of the two horizontal Wolfcamp Shale B interval wells that were drilled in the Giddings area of Upton County by Pioneer in 2011.
Pioneer expects to run 7 rigs in the southern joint interest area during 2013, with an increase of 3 rigs per year expected in 2014 and 2015. The 2013 drilling program will continue to focus on delineating acreage and testing the Wolfcamp A, Upper B, Lower B and D intervals, while the program in 2014 and beyond will primarily focus on development drilling and accelerating production growth. Approximately 50% of the wells drilled in this area during 2013 will be from pads, increasing to approximately 75% in 2014. The Company has included $20 million in the 2013 southern joint interest area drilling budget for coring, open-hole logging, micro-seismic and 3-D seismic (“science”). The cost for drilling development wells is targeted at $7.5 million to $8.0 million for a 7,800-foot lateral well. The Company expects to continue testing laterals as long as 10,000 feet at an additional cost of approximately $1.5 million. Completion techniques will continue to be optimized and downspacing opportunities will be evaluated. In particular, slickwater fracture stimulations will be tested, which could save approximately $1.0 million per well when compared to gel-conveyed fracture stimulations.
During the fourth quarter of 2012, Pioneer completed two highly successful horizontal Jo Mill wells. The two wells had an average 24-hour initial production rate of 503 BOEPD with short laterals of approximately 2,500 feet. The peak 30-day rates for these two wells averaged 434 BOEPD, with approximately 80% oil content, and when normalized to 5,000 feet, the wells have outperformed the 650 MBOE EUR type curve since being placed on production.
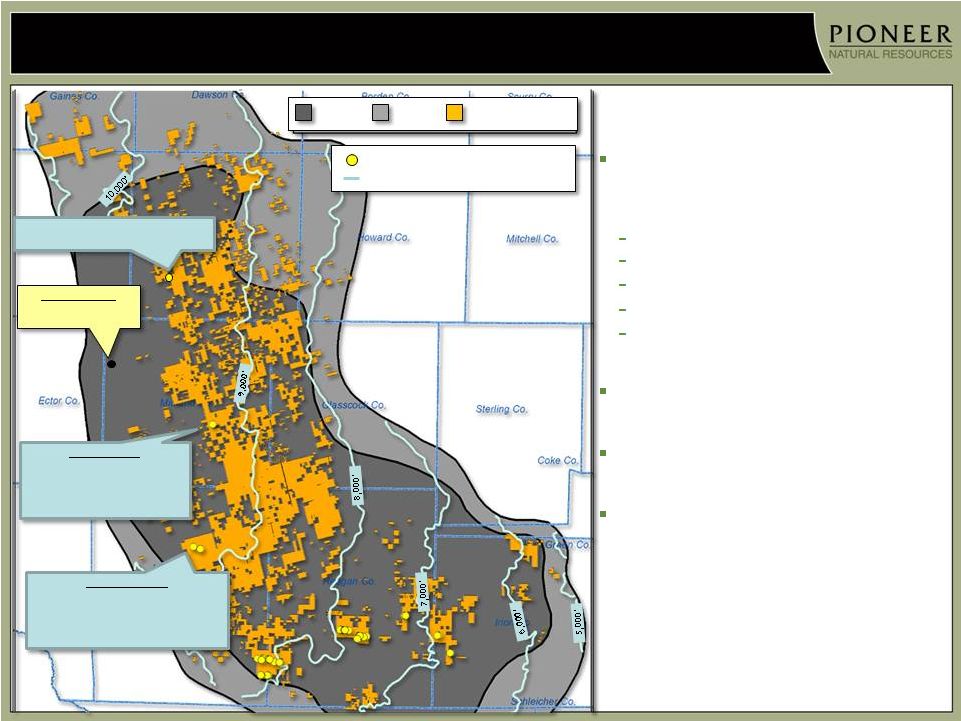
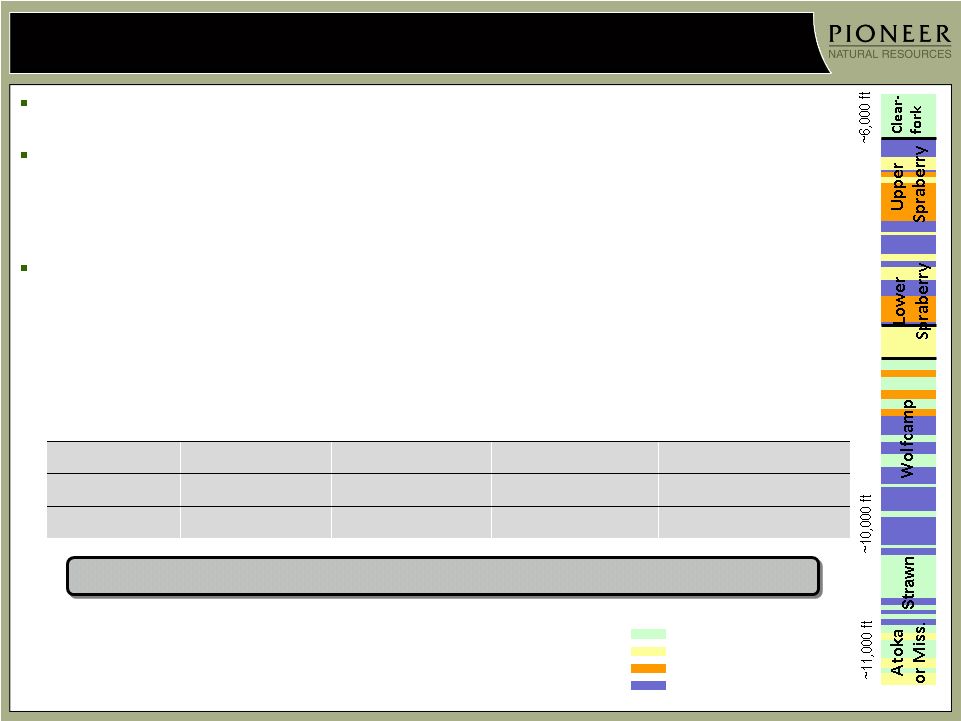
Pioneer’s extensive Midland Basin geologic analysis, based upon data from thousands of wells, has identified multiple prospective horizontal targets with substantial oil in place throughout the Company’s northern Wolfcamp/Spraberry acreage position of more than 600,000 gross acres. These horizontal targets include the Jo Mill interval and the Wolfcamp and Spraberry Shales. Prospectivity is defined by several geologic properties, including original oil in place, kerogen content, thermal maturity, porosity and brittle mineral fraction (increased fracability due to reduced clay content). The depth of the targets is also important as reservoir pressure increases with depth. Pioneer’s northern Wolfcamp/Spraberry acreage is located in the deepest part of the Midland Basin, which should make this area very prospective for horizontal targets.
The Company is currently operating one horizontal rig focused on delineating its northern acreage position. The rig recently drilled the Company’s first two horizontal Wolfcamp Shale wells in Midland County. The first well (DL Hutt C #1H) was completed in the Wolfcamp B interval and had a lateral length of 7,380 feet. It had an initial peak 24-hour production rate of 1,693 BOEPD and an average peak 20-day rate flowing naturally of 1,510 BOEPD. The oil content of this well is approximately 75%. The performance of this well is substantially above the 650 MBOE EUR type curve.
The second well in Midland County is scheduled to be completed in the Wolfcamp A interval later in February. The rig is now drilling the first of two horizontal Wolfcamp Shale delineation wells targeting the B interval in Martin County.
To accelerate the delineation and appraisal of the northern Wolfcamp/Spraberry acreage, the Company is initiating a $1 billion capital program over the next two years to confirm the estimated 3.0 BBOE of resource potential that the Company believes exists in its northern acreage, which has the potential to add substantial net asset value. The 2013 drilling program, which is expected to cost $400 million, is scheduled to ramp up to four rigs early in the second quarter and drill a total of 30 to 40 wells targeting six different “stacked” intervals. The six “stacked” intervals across the Company’s 600,000 prospective gross acres equates to greater than 3 million prospective gross acres. Fifteen wells to 20 wells will be completed in the Wolfcamp A, B and D intervals. Another 15 wells to 20 wells will be completed in the Jo Mill, Middle Spraberry Shale and the Lower Spraberry Shale. The drilling cost for these wells is expected to range from $7.5 million per well to $8.5 million per well assuming 7,000-foot laterals. This cost excludes $80 million of estimated “science” and infrastructure costs. The 2013 horizontal drilling program is expected to deliver a year-end exit rate for horizontal production from the northern acreage ranging from 5 MBOEPD to 7 MBOEPD.
Pioneer expects to increase the rig count on its northern Wolfcamp/Spraberry acreage to 6 rigs to 8 rigs in 2014 and invest another $600 million to fund the remainder of the two-year appraisal program. The 2014 program may also include testing horizontal drilling in deeper intervals below the Wolfcamp Shale.
Pioneer reduced its vertical drilling program in the Spraberry field from 40 rigs in the first quarter of 2012 to 20 rigs at the end of the year as horizontal drilling activity increased. The Company drilled 132 vertical wells in the fourth quarter and 631 wells over the entire year. Over the second half of 2012, the number of vertical wells awaiting completion increased by 57 wells as the Company shifted its expenditures to more horizontal drilling.
Pioneer continued to successfully drill vertically to deeper intervals in the Spraberry field below the Wolfcamp interval during 2012 (vertical Wolfcamp 40-acre type curve EUR of 140 MBOE with typical 24-hour initial production (IP) rate of 90 BOEPD). Production from this deeper drilling has exceeded expectations and is the primary contributor to the production outperformance by this asset during 2012. The deeper drilling includes the Strawn, Atoka and Mississippian intervals. The original 2012 drilling program called for the Wolfcamp to be the deepest interval completed in approximately 50% of the wells, with the remaining 50% of the wells to be drilled deeper to intervals below the Wolfcamp interval. Approximately 65% of the wells drilled in 2012 were actually deepened below the Wolfcamp interval.
Pioneer placed 208 vertical commingled Strawn wells on production during 2012, with an average 24-hour IP rate of 145 BOEPD. Production data continues to support an incremental gross EUR per well from the Strawn interval of 30 MBOE. Pioneer estimates that 85% of its Spraberry acreage position is prospective for the Strawn interval, up from the previous estimate of 70%.
The Company placed 134 commingled vertical Atoka wells on production during 2012, with an average 24-hour IP rate of 180 BOEPD. Results from well tests continue to support an incremental gross EUR of 50 MBOE to 70 MBOE for wells completed in the Atoka interval. Pioneer continues to believe the Atoka interval is prospective in 40% to 50% of its Spraberry acreage position.
The Company also placed 55 commingled vertical wells on production through the Mississippian interval during 2012, with an average initial 24-hour IP rate of 140 BOEPD. Data from Mississippian wells drilled to date continues to support an incremental gross EUR per well of 15 MBOE to 40 MBOE from this interval. Pioneer continues to believe the Mississippian interval is prospective in 20% of its Spraberry acreage.
Fourth quarter production from the Spraberry field averaged 69 MBOEPD. This included production from the Strawn, Atoka and Mississippian intervals in vertical Spraberry wells and horizontal production from the Wolfcamp Shale and Jo Mill intervals. Fourth quarter production was negatively impacted by 1,700 BOEPD due to reduced ethane recoveries resulting from Spraberry gas processing facilities operating above capacity due to greater-than-anticipated industry production growth.
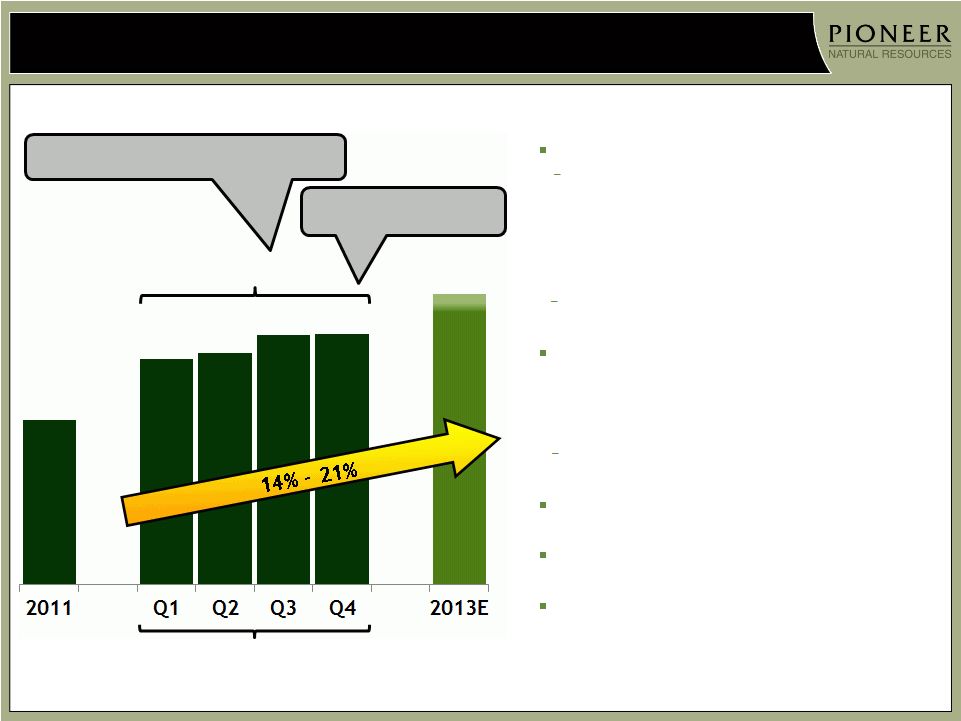
Spraberry production for 2012 averaged 66 MBOEPD, an increase of 46% compared to 2011. Horizontal production averaged 2 MBOEPD during 2012 and exited the year at 5 MBOEPD. For 2013, Spraberry production is forecasted to grow to 75 MBOEPD to 80 MBOEPD, an increase of 14% to 21% compared to 2012. This reflects the vertical rig count decreasing from an average of 32 rigs in 2012 to 15 rigs in 2013, while the horizontal rig count is expected to increase from an average of 3 rigs in 2012 to 11 rigs in 2013. This shift to more horizontal and less vertical drilling is in response to the capital efficiencies that Pioneer is gaining from drilling more horizontal wells. Pioneer expects horizontal production to increase from an average of 2 MBOEPD in 2012 to 11 MBOEPD to 14 MBOEPD in 2013. This forecast assumes that more than 4 MBOEPD of horizontal production on an annualized basis will be conveyed to Sinochem after the closing of the joint interest transaction which is assumed to occur on June 1, 2013.
Pioneer’s 2013 production forecast assumes that the inventory of vertical wells awaiting completion will be drawn down by 60 wells to 70 wells over the year. It also takes into account that the gas processing capacity shortfall in the Spraberry area will continue into the second quarter until the new Driver gas processing plant comes online in April and provides an additional 200 million cubic feet per day of processing capacity, thereby alleviating the current bottleneck that is impacting ethane recoveries. Pioneer estimates that the ongoing processing capacity limitations will continue to negatively impact ethane recoveries and will decrease the Company’s first quarter production by 2 MBOEPD to 3 MBOEPD.
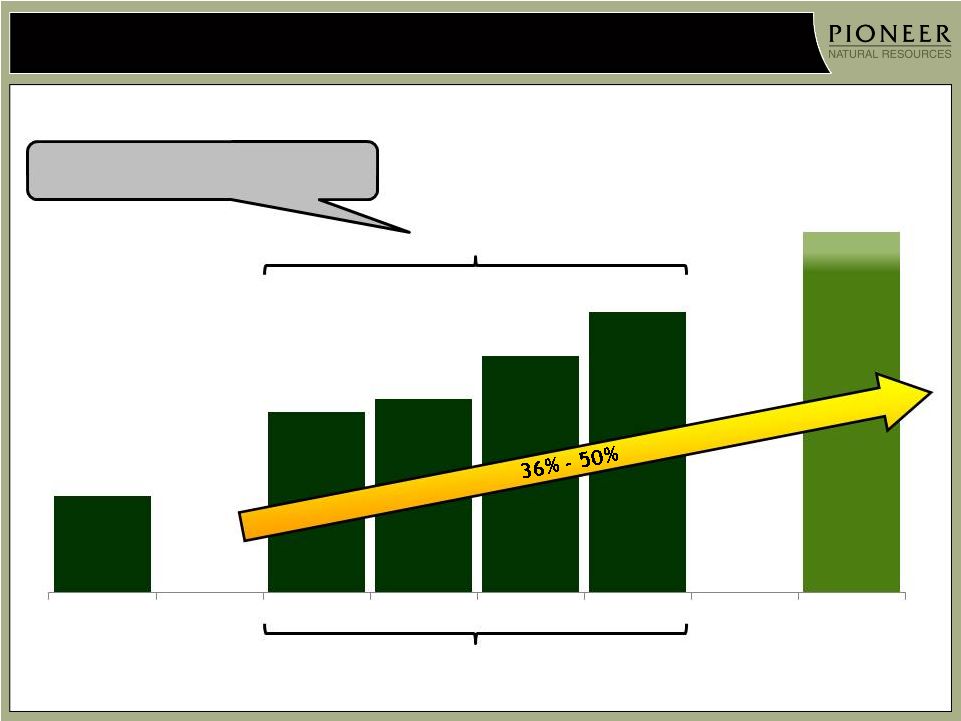
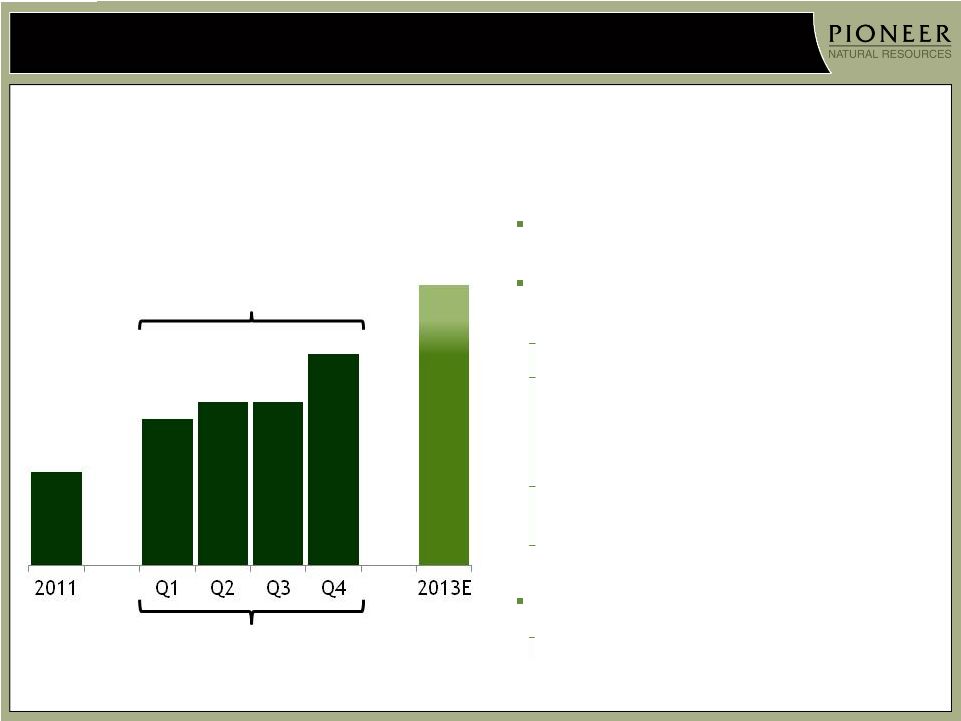
In the liquids-rich Eagle Ford Shale in South Texas, the Company drilled 30 wells in the fourth quarter and placed 37 wells on production. Pioneer increased its Eagle Ford Shale production from 29 MBOEPD in the third quarter of 2012 to 35 MBOEPD in the fourth quarter, achieving another record production level. Strong well performance continues to drive this growth. Full-year 2012 production averaged 28 MBOEPD. The Company expects 2013 production to range from 38 MBOEPD to 42 MBOEPD, an increase of 36% to 50% compared to 2012.
Pioneer expects to drill approximately 130 Eagle Ford Shale wells in 2013 at a cost of $7 million to $8 million per well. Essentially all of these wells will be liquids-rich wells, with minimal dry gas drilling expected during the year. Pioneer’s drilling operations in the Eagle Ford Shale continue to become more
efficient. The number of wells drilled from pads, as opposed to single-well locations, is expected to increase from 45% of the wells drilled in 2012 to 80% of the wells drilled in 2013, reflecting that most of Pioneer’s acreage is now held by production. Pad drilling saves $600 thousand to $700 thousand per well and will result in Pioneer being able to drill 130 wells with 10 rigs in 2013 compared to drilling essentially the same number of wells in 2012 with 12 rigs.
Pioneer has been using lower-cost white sand instead of ceramic proppant to fracture stimulate wells drilled in shallower areas of the field. The Company is now expanding the use of white sand proppant to deeper areas of the field to further define its performance limits. The Company tested 97 wells with white sand proppant in 2011 and 2012, with a savings of approximately $700 thousand per well. Early well performance has been similar to direct offset ceramic-stimulated wells. Pioneer is continuing to monitor the performance of these wells and expects that greater than 50% of its 2013 drilling program will use the lower-cost white sand proppant. The Company also expects to improve well performance, EURs and well economics by increasing the average lateral length of its wells from 5,700 feet in 2012 to 6,200 feet in 2013, which will add approximately $500 thousand to the cost of drilling and completing a well.
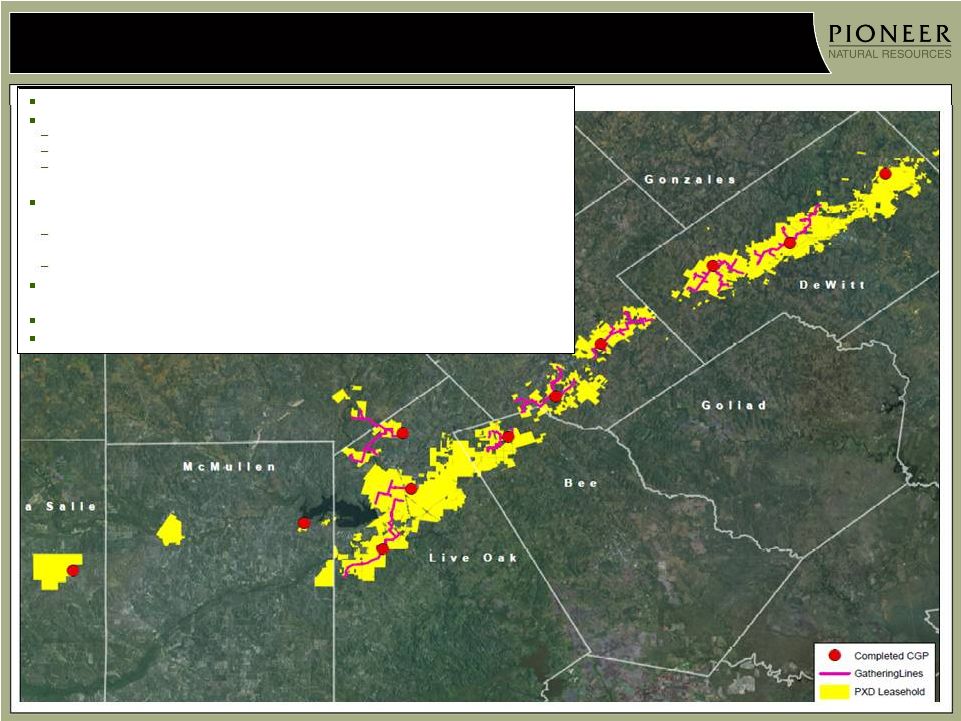
Eleven central gathering plants (CGPs) are now operational as part of the joint venture’s Eagle Ford Shale midstream business. One additional CGP is scheduled to be on line by the end of 2013. Pioneer’s share of its Eagle Ford Shale joint venture midstream activities is conducted through a partially-owned, unconsolidated entity. Operating cash flow from the midstream business is expected to be able to fund ongoing midstream infrastructure build-out costs. Cash flow from the services provided by the midstream operations is not included in Pioneer’s forecasted operating cash flow.
In the liquids-rich Barnett Shale Combo play, Pioneer drilled 8 wells in the fourth quarter and placed 8 wells on production. Pioneer is operating one rig in the play but plans to increase to two rigs in the second quarter to hold acreage in the highest-return areas of the Company’s 82 thousand net acreage position. These areas have been identified from drilling data and petrophysical and seismic analysis. Pioneer currently holds approximately 20% of its acreage position by production, or 16 thousand net acres, and expects to hold an additional 45 thousand net acres by production over the next three years with a two-rig drilling program.
Production in the fourth quarter for the Barnett Shale Combo play was 9 MBOEPD, up from 7 MBOEPD in the third quarter. The Company expects production to increase from an average of 7 MBOEPD in 2012 to 9 MBOEPD to 12 MBOEPD in 2013. Production is comprised of approximately 60% liquids (oil and natural gas liquids) and 40% gas.
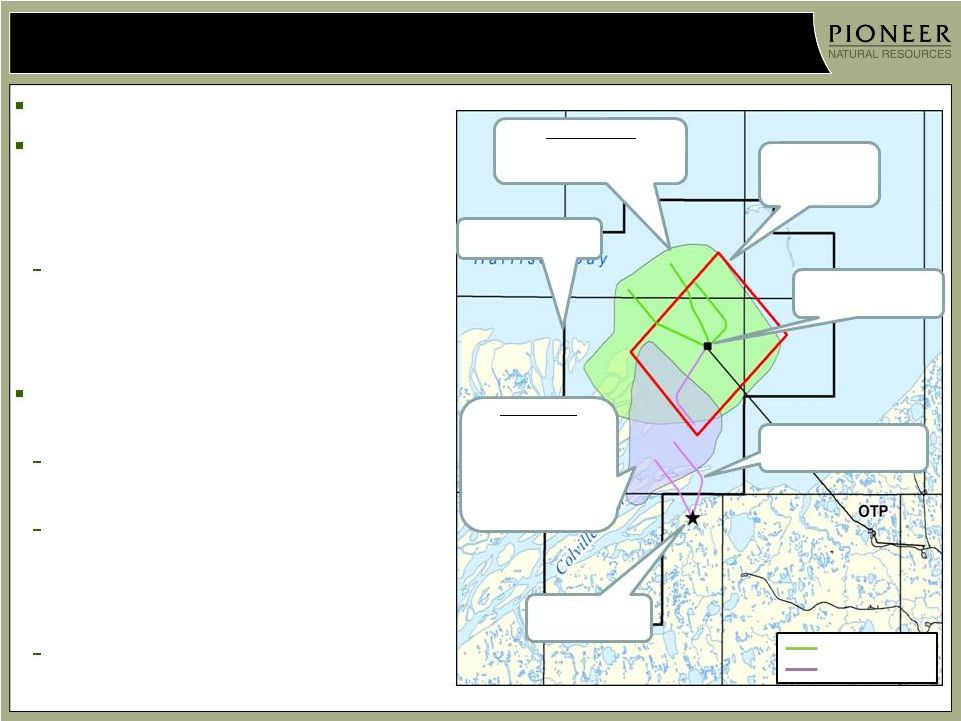
On the North Slope of Alaska, Pioneer continues to operate one rig and drill development wells from its island drill site targeting the Nuiqsut and Torok intervals. The Company’s fourth quarter production was four thousand barrels oil per day (BOPD). During the first quarter of 2012, the Company completed its first successful mechanically diverted fracture stimulation of a Nuiqsut interval well. Based on the success of this mechanically diverted fracture stimulation, the Company has drilled four more wells and is planning similar stimulations during the current winter drilling season. Three of these wells will be in the Nuiqsut interval and one will be in the Torok interval.
During the first quarter of 2012, the Company also drilled a successful onshore appraisal well to test the southern extent of the Torok interval. The production and subsurface data provided by this successful well supported the addition of 50 million barrels of oil to the resource potential of the Torok interval within Pioneer’s acreage. The well has been flow tested for the second time and produced at a facility-limited rate of 2,800 BOPD, significantly higher than the rates achieved in 2012. The well has been shut in until permanent onshore production facilities are constructed for which an onshore development FEED study is being progressed. Pioneer is currently drilling a second onshore Torok well to further appraise this interval.
2013 Capital Budget
Pioneer’s capital program for 2013 of $3.0 billion (excludes acquisitions, asset retirement obligations, capitalized interest and geological and geophysical G&A) includes $2.75 billion for drilling, $25 million for vertical integration, $70 million for the expansion of the Brady, Texas sand mine and $145 million for Pioneer’s new Midland office building and several new field buildings.
The following provides a breakdown of the drilling capital by asset:
| • | Northern Wolfcamp/Spraberry area—$1,225 million (includes $400 million for the horizontal drilling program, $625 million for the vertical drilling program and $200 million for infrastructure additions and automation projects) |
| • | Southern Wolfcamp joint interest area—$425 million |
| • | Eagle Ford Shale—$575 million |
| • | Barnett Shale Combo—$185 million |
| • | Alaska—$190 million |
| • | Other—$150 million, including land capital for existing assets |
The 2013 capital budget is expected to be funded from forecasted operating cash flow of $2.0 billion, assuming commodity prices of $85 per barrel for oil and $3.25 per thousand cubic feet (MCF) for gas, proceeds of $600 million from Pioneer’s joint interest transaction with Sinochem (includes reimbursement by Sinochem of capital expenditures less operating cash flow from the December 1, 2012 effective date to the estimated June 1, 2013 closing date) and $400 million from capital market activities.
Pioneer’s year-end 2012 net debt was $3.5 billion and net debt-to-book capitalization was 37%. The Company will continue to target a net debt-to-book capitalization below 35% and net debt-to-operating cash flow below 1.75 times.
Fourth Quarter 2012 Financial Review
The following financial results from continuing operations for the fourth quarter of 2012 include the Barnett Shale assets that were reclassified to continuing operations in the fourth quarter after the decision was made to discontinue efforts to divest of these properties.
Liquids and gas sales averaged 165 MBOEPD, consisting of oil sales averaging 67 thousand barrels per day (MBPD), natural gas liquids (NGL) sales averaging 32 MBPD and gas sales averaging 395 million cubic feet per day.
The average price for oil was $85.60 per barrel including $1.71 per barrel related to deferred revenue from volumetric production payments (VPPs) for which production was not recorded. The Company’s remaining VPP expired on its own terms at the end of 2012. The average reported price for NGLs was $30.69 per barrel and the average reported price for gas was $3.20 per MCF.
Production costs from continuing operations averaged $14.62 per BOE. Depreciation, depletion and amortization (DD&A) expense averaged $14.54 per BOE. An impairment charge of $88 million was recorded to reduce the carrying value of the Barnett Shale proved properties to their estimated fair value as part of the reclassification of the assets to continuing operations. Exploration and abandonment costs were $89 million, principally comprised of $72 million associated with the impairment of unproved Barnett Shale acreage and $14 million for personnel costs. General and administrative expense totaled $68 million, including performance-based compensation awards for 2012. Interest expense was $54 million, and other expense was $27 million.
First Quarter 2013 Financial Outlook
The Company’s first quarter 2013 outlook for certain operating and financial items is provided below.
Production is forecasted to average 165 MBOEPD to 170 MBOEPD. This forecast assumes that first quarter production will be negatively impacted by 2,000 BOEPD to 3,000 BOEPD as a result of continuing reduced ethane recoveries associated with gas processing facilities in the Spraberry field operating above capacity as described above. New gas processing capacity of 200 million cubic feet per day is expected to come on line during April and eliminate the reduced ethane recoveries thereafter. The guidance for the first quarter excludes the effects of potential ethane rejection to the extent the Company decides to do so in the future.
Production costs are expected to average $14.00 to $16.00 per BOE. DD&A expense is expected to average $13.50 to $15.50 per BOE. Total exploration and abandonment expense is forecasted to be $25 million to $35 million.
General and administrative expense is expected to be $60 million to $65 million, interest expense is expected to be $53 million to $58 million and other expense is expected to be $25 million to $35 million. Accretion of discount on asset retirement obligations is expected to be $2 million to $4 million.
Noncontrolling interest in consolidated subsidiaries’ income, excluding unrealized derivative mark-to-market adjustments, is expected to be $8 million to $11 million, primarily reflecting the public ownership in Pioneer Southwest Energy Partners L.P.
The Company’s effective income tax rate is expected to range from 35% to 40%, based on current capital spending plans and the assumption of no significant unrealized derivative mark-to-market changes in the Company’s derivative position. Current income taxes are expected to be $2 million to $7 million and are primarily attributable to state taxes.
The Company’s financial and derivative mark-to-market results and open derivatives positions are outlined on the attached schedules.
Earnings Conference Call
On Thursday, February 14, 2013, at 9:00 a.m. Central Time, Pioneer will discuss its financial and operating results for the quarter ended December 31, 2012, and its 2013 capital budget, with an accompanying presentation. Instructions for listening to the call and viewing the accompanying presentation are shown below.
Internet: www.pxd.com
Select “Investors,” then “Earnings & Webcasts” to listen to the discussion, view the presentation and see other related material.
Telephone: Dial (877) 718-5108 confirmation code: 7431932 five minutes before the call. View the presentation via Pioneer’s internet address above.
A replay of the webcast will be archived on Pioneer’s website. A telephone replay will be available through March 11, 2013, by dialing (888) 203-1112 confirmation code: 7431932.
Pioneer is a large independent oil and gas exploration and production company, headquartered in Dallas, Texas, with operations in the United States. For more information, visit Pioneer’s website at www.pxd.com.
Except for historical information contained herein, the statements in this news release are forward-looking statements that are made pursuant to the Safe Harbor Provisions of the Private Securities Litigation Reform Act of 1995. Forward-looking statements and the business prospects of Pioneer are subject to a number of risks and uncertainties that may cause Pioneer’s actual results in future periods to differ materially from the forward-looking statements. These risks and uncertainties include, among other things, volatility of commodity prices, product supply and demand, competition, the ability to obtain environmental and other permits and the timing thereof, other government regulation or action, the ability to obtain approvals from third parties and negotiate agreements with third parties on mutually acceptable terms, the receipt of approvals required to consummate the Company’s Southern Wolfcamp joint venture transaction, litigation, the costs and results of drilling and operations, availability of equipment, services, resources and personnel required to complete the Company’s operating activities, access to and availability of transportation, processing, fractionation and refining facilities, Pioneer’s ability to replace reserves, implement its business plans or complete its development activities as scheduled, access to and cost of capital, the financial strength of counterparties to Pioneer’s credit facility and derivative contracts and the purchasers of Pioneer’s oil, NGL and gas production, uncertainties about estimates of reserves and resource potential and the ability to add proved reserves in the future, the assumptions underlying production forecasts, quality of technical data, environmental and weather risks, including the possible impacts of climate change, the risks associated with the ownership and operation of an industrial sand mining business and acts of war or terrorism. These and other risks are described in Pioneer’s 10-K and 10-Q Reports and other filings with the U.S. Securities and Exchange Commission (SEC). In addition, Pioneer may be subject to currently unforeseen risks that may have a materially adverse impact on it. Pioneer undertakes no duty to publicly update these statements except as required by law.
Cautionary Note to U.S. Investors —The SEC prohibits oil and gas companies, in their filings with the SEC, from disclosing estimates of oil or gas resources other than “reserves,” as that term is defined by the SEC. In this news release, Pioneer includes estimates of quantities of oil and gas using certain terms, such as “resource potential,” “estimated ultimate recovery,” “EUR” or other descriptions of volumes of reserves, which terms include quantities of oil and gas that may not meet the SEC’s definitions of proved, probable and possible reserves, and which the SEC’s guidelines strictly prohibit Pioneer from including in filings with the SEC. These estimates are by their nature more speculative than estimates of proved reserves and accordingly are subject to substantially greater risk of being recovered by Pioneer. U.S. investors are urged to consider closely the disclosures in the Company’s periodic filings with the SEC. Such filings are available from the Company at 5205 N. O’Connor Blvd., Suite 200, Irving, Texas 75039, Attention: Investor Relations, and the Company’s website at www.pxd.com. These filings also can be obtained from the SEC by calling 1-800-SEC-0330.
An audit of proved reserves follows the general principles set forth in the standards pertaining to the estimating and auditing of oil and gas reserve information promulgated by the Society of Petroleum Engineers (“SPE”). A reserve audit as defined by the SPE is not the same as a financial audit. Please see the Company’s Annual Report on Form 10-K for a general description of the concepts included in the SPE’s definition of a reserve audit.
“Drillbit finding and development cost per BOE,” or “drillbit F&D cost per BOE,” means the summation of exploration and development costs incurred divided by the summation of annual proved reserves, on a BOE basis, attributable to technical revisions of previous estimates, discoveries and extensions and improved recovery. Consistent with industry practice, future capital costs to develop proved undeveloped reserves are not included in costs incurred.
“Drillbit reserve replacement” is the summation of annual proved reserves, on a BOE basis, attributable to technical revisions of previous estimates, discoveries and extensions and improved recovery divided by annual production of oil, NGLs and gas, on a BOE basis.
Pioneer Natural Resources Contacts:
Investors
Frank Hopkins – 972-969-4065
Eric Pregler – 972-969-5756
Josh Jones – 972-969-5822
Media and Public Affairs
Susan Spratlen – 972-969-4018
Suzanne Hicks – 972-969-4020
PIONEER NATURAL RESOURCES COMPANY
UNAUDITED CONDENSED CONSOLIDATED BALANCE SHEETS
(in thousands)
| December 31, 2012 |
December 31, 2011 |
|||||||
| ASSETS | ||||||||
| Current assets: |
||||||||
| Cash and cash equivalents |
$ | 229,396 | $ | 537,484 | ||||
| Accounts receivable, net |
320,153 | 283,813 | ||||||
| Income taxes receivable |
7,447 | 3 | ||||||
| Inventories |
197,056 | 241,609 | ||||||
| Prepaid expenses |
13,438 | 14,263 | ||||||
| Discontinued operations held for sale |
— | 73,349 | ||||||
| Derivatives |
279,119 | 238,835 | ||||||
| Other current assets, net |
3,746 | 12,936 | ||||||
|
|
|
|
|
|||||
| Total current assets |
1,050,355 | 1,402,292 | ||||||
|
|
|
|
|
|||||
| Property, plant and equipment, at cost: |
||||||||
| Oil and gas properties, using the successful efforts method of accounting |
14,491,263 | 12,249,332 | ||||||
| Accumulated depletion, depreciation and amortization |
(4,412,913 | ) | (3,648,465 | ) | ||||
|
|
|
|
|
|||||
| Total property, plant and equipment |
10,078,350 | 8,600,867 | ||||||
|
|
|
|
|
|||||
| Goodwill |
298,142 | 298,142 | ||||||
| Other property and equipment, net |
1,217,694 | 573,075 | ||||||
| Investment in unconsolidated affiliate |
204,129 | 169,532 | ||||||
| Derivatives |
55,257 | 243,240 | ||||||
| Other assets, net |
165,103 | 160,008 | ||||||
|
|
|
|
|
|||||
| $ | 13,069,030 | $ | 11,447,156 | |||||
|
|
|
|
|
|||||
| LIABILITIES AND EQUITY | ||||||||
| Current liabilities: |
||||||||
| Accounts payable |
$ | 826,877 | $ | 716,211 | ||||
| Interest payable |
68,083 | 57,240 | ||||||
| Income taxes payable |
208 | 9,788 | ||||||
| Current deferred income taxes |
86,481 | 57,713 | ||||||
| Discontinued operations held for sale |
— | 75,901 | ||||||
| Deferred revenue |
— | 42,069 | ||||||
| Derivatives |
13,416 | 74,415 | ||||||
| Other current liabilities |
39,725 | 36,174 | ||||||
|
|
|
|
|
|||||
| Total current liabilities |
1,034,790 | 1,069,511 | ||||||
|
|
|
|
|
|||||
| Long-term debt |
3,721,193 | 2,528,905 | ||||||
| Deferred income taxes |
2,140,416 | 1,942,446 | ||||||
| Derivatives |
12,307 | 33,561 | ||||||
| Other liabilities |
293,016 | 221,595 | ||||||
| Equity |
5,867,308 | 5,651,138 | ||||||
|
|
|
|
|
|||||
| $ | 13,069,030 | $ | 11,447,156 | |||||
|
|
|
|
|
|||||
PIONEER NATURAL RESOURCES COMPANY
UNAUDITED CONDENSED CONSOLIDATED STATEMENTS OF OPERATIONS
(in thousands, except per share data)
| Three Months Ended December 31, |
Twelve Months Ended December 31, |
|||||||||||||||
| 2012 | 2011 | 2012 | 2011 | |||||||||||||
| Revenues and other income: |
||||||||||||||||
| Oil and gas |
$ | 734,640 | $ | 664,776 | $ | 2,811,660 | $ | 2,294,063 | ||||||||
| Interest and other |
(3,140 | ) | 19,962 | 28,310 | 66,880 | |||||||||||
| Derivative gains, net |
86,683 | 6,634 | 330,251 | 392,752 | ||||||||||||
| Hurricane activity, net |
— | 36 | — | 1,454 | ||||||||||||
| Gain (loss) on disposition of assets, net |
503 | (2,205 | ) | 58,087 | (3,644 | ) | ||||||||||
|
|
|
|
|
|
|
|
|
|||||||||
| 818,686 | 689,203 | 3,228,308 | 2,751,505 | |||||||||||||
|
|
|
|
|
|
|
|
|
|||||||||
| Costs and expenses: |
||||||||||||||||
| Oil and gas production |
174,095 | 130,038 | 635,644 | 447,142 | ||||||||||||
| Production and ad valorem taxes |
47,687 | 39,962 | 187,757 | 147,664 | ||||||||||||
| Depletion, depreciation and amortization |
220,454 | 171,921 | 810,191 | 578,268 | ||||||||||||
| Impairment of oil and gas properties |
87,709 | 354,408 | 532,589 | 354,408 | ||||||||||||
| Exploration and abandonments |
88,787 | 64,078 | 206,291 | 121,320 | ||||||||||||
| General and administrative |
67,691 | 55,347 | 248,282 | 193,215 | ||||||||||||
| Accretion of discount on asset retirement obligations |
2,516 | 2,092 | 9,887 | 8,256 | ||||||||||||
| Interest |
53,915 | 45,878 | 204,222 | 181,660 | ||||||||||||
| Other |
27,119 | 16,195 | 113,388 | 63,166 | ||||||||||||
|
|
|
|
|
|
|
|
|
|||||||||
| 769,973 | 879,919 | 2,948,251 | 2,095,099 | |||||||||||||
|
|
|
|
|
|
|
|
|
|||||||||
| Income (loss) from continuing operations before income taxes |
48,713 | (190,716 | ) | 280,057 | 656,406 | |||||||||||
| Income tax benefit (provision) |
(9,153 | ) | 75,272 | (92,384 | ) | (197,644 | ) | |||||||||
|
|
|
|
|
|
|
|
|
|||||||||
| Income (loss) from continuing operations |
39,560 | (115,444 | ) | 187,673 | 458,762 | |||||||||||
| Income from discontinued operations, net of tax |
142 | 2,256 | 55,149 | 423,152 | ||||||||||||
|
|
|
|
|
|
|
|
|
|||||||||
| Net income (loss) |
39,702 | (113,188 | ) | 242,822 | 881,914 | |||||||||||
| Net (income) loss attributable to noncontrolling interests |
(10,868 | ) | 2,042 | (50,537 | ) | (47,425 | ) | |||||||||
|
|
|
|
|
|
|
|
|
|||||||||
| Net income (loss) attributable to common stockholders |
$ | 28,834 | $ | (111,146 | ) | $ | 192,285 | $ | 834,489 | |||||||
|
|
|
|
|
|
|
|
|
|||||||||
| Basic earnings per share: |
||||||||||||||||
| Income (loss) from continuing operations attributable to common stockholders |
$ | 0.23 | $ | (0.95 | ) | $ | 1.10 | $ | 3.45 | |||||||
| Income from discontinued operations attributable to common stockholders |
— | 0.02 | 0.44 | 3.56 | ||||||||||||
|
|
|
|
|
|
|
|
|
|||||||||
| Net income (loss) attributable to common stockholders |
$ | 0.23 | $ | (0.93 | ) | $ | 1.54 | $ | 7.01 | |||||||
|
|
|
|
|
|
|
|
|
|||||||||
| Diluted earnings per share: |
||||||||||||||||
| Income (loss) from continuing operations attributable to common stockholders |
$ | 0.22 | $ | (0.95 | ) | $ | 1.07 | $ | 3.39 | |||||||
| Income from discontinued operations attributable to common stockholders |
— | 0.02 | 0.43 | 3.49 | ||||||||||||
|
|
|
|
|
|
|
|
|
|||||||||
| Net income (loss) attributable to common stockholders |
$ | 0.22 | $ | (0.93 | ) | $ | 1.50 | $ | 6.88 | |||||||
|
|
|
|
|
|
|
|
|
|||||||||
| Weighted average shares outstanding: |
||||||||||||||||
| Basic |
123,240 | 119,223 | 122,966 | 116,904 | ||||||||||||
|
|
|
|
|
|
|
|
|
|||||||||
| Diluted |
126,945 | 119,223 | 126,320 | 119,215 | ||||||||||||
|
|
|
|
|
|
|
|
|
|||||||||
PIONEER NATURAL RESOURCES COMPANY
UNAUDITED CONDENSED CONSOLIDATED STATEMENTS OF CASH FLOWS
(in thousands)
| Three Months Ended December 31, |
Twelve Months Ended December 31, |
|||||||||||||||
| 2012 | 2011 | 2012 | 2011 | |||||||||||||
| Cash flows from operating activities: |
||||||||||||||||
| Net income (loss) |
$ | 39,702 | $ | (113,188 | ) | $ | 242,822 | $ | 881,914 | |||||||
| Adjustments to reconcile net income (loss) to net cash provided by operating activities: |
||||||||||||||||
| Depletion, depreciation and amortization |
220,454 | 171,921 | 810,191 | 578,268 | ||||||||||||
| Impairment of oil and gas properties |
87,709 | 354,408 | 532,589 | 354,408 | ||||||||||||
| Exploration expenses, including dry holes |
72,749 | 41,223 | 125,376 | 47,231 | ||||||||||||
| Deferred income taxes |
9,279 | (76,423 | ) | 85,459 | 188,579 | |||||||||||
| (Gain) loss on disposition of assets, net |
(503 | ) | 2,205 | (58,087 | ) | 3,644 | ||||||||||
| Accretion of discount on asset retirement obligations |
2,516 | 2,092 | 9,887 | 8,256 | ||||||||||||
| Discontinued operations |
(46 | ) | 9,436 | (19,344 | ) | (376,717 | ) | |||||||||
| Interest expense |
8,751 | 8,071 | 35,563 | 31,483 | ||||||||||||
| Derivative related activity |
(24,485 | ) | 47,847 | 68,604 | (221,899 | ) | ||||||||||
| Amortization of stock-based compensation |
15,668 | 9,917 | 62,567 | 41,442 | ||||||||||||
| Amortization of deferred revenue |
(10,575 | ) | (11,331 | ) | (42,069 | ) | (44,951 | ) | ||||||||
| Other noncash items |
(18,600 | ) | 3,245 | (39,599 | ) | 6,725 | ||||||||||
| Change in operating assets and liabilities, net of effects from acquisitions and dispositions: |
||||||||||||||||
| Accounts receivable, net |
(20,260 | ) | (12,079 | ) | (28,206 | ) | (47,331 | ) | ||||||||
| Income taxes receivable |
2,679 | 818 | (5,953 | ) | 29,406 | |||||||||||
| Inventories |
39,406 | (21,440 | ) | 33,059 | (137,401 | ) | ||||||||||
| Prepaid expenses |
8,219 | 4,143 | 1,447 | (3,415 | ) | |||||||||||
| Other current assets |
6,393 | (6,563 | ) | 14,291 | 1,957 | |||||||||||
| Accounts payable |
22,484 | 52,664 | 46,038 | 136,296 | ||||||||||||
| Interest payable |
27,144 | 23,285 | 10,842 | (1,768 | ) | |||||||||||
| Income taxes payable |
(14 | ) | (5,816 | ) | (9,580 | ) | (7,623 | ) | ||||||||
| Other current liabilities |
(8,563 | ) | 15,241 | (38,320 | ) | 61,210 | ||||||||||
|
|
|
|
|
|
|
|
|
|||||||||
| Net cash provided by operating activities |
480,107 | 499,676 | 1,837,577 | 1,529,714 | ||||||||||||
| Net cash used in investing activities |
(740,321 | ) | (705,934 | ) | (3,256,410 | ) | (1,560,787 | ) | ||||||||
| Net cash provided by financing activities |
155,724 | 533,177 | 1,110,745 | 457,397 | ||||||||||||
|
|
|
|
|
|
|
|
|
|||||||||
| Net increase (decrease) in cash and cash equivalents |
(104,490 | ) | 326,919 | (308,088 | ) | 426,324 | ||||||||||
| Cash and cash equivalents, beginning of period |
333,886 | 210,565 | 537,484 | 111,160 | ||||||||||||
|
|
|
|
|
|
|
|
|
|||||||||
| Cash and cash equivalents, end of period |
$ | 229,396 | $ | 537,484 | $ | 229,396 | $ | 537,484 | ||||||||
|
|
|
|
|
|
|
|
|
|||||||||
PIONEER NATURAL RESOURCES COMPANY
UNAUDITED SUMMARY PRODUCTION AND PRICE DATA
| Three Months Ended December 31, |
Twelve Months Ended December 31, |
|||||||||||||||||
| 2012 | 2011 | 2012 | 2011 | |||||||||||||||
| Average Daily Sales Volumes from Continuing Operations: |
||||||||||||||||||
| Oil (Bbls) |
U.S. | 67,070 | 50,231 | 62,645 | 40,618 | |||||||||||||
| Natural gas liquids (“NGL”) (Bbls) |
U.S. | 31,939 | 26,163 | 29,816 | 22,487 | |||||||||||||
| Gas (Mcf) |
U.S. | 394,817 | 361,829 | 378,369 | 343,879 | |||||||||||||
| Total (BOE) |
U.S. | 164,812 | 136,699 | 155,522 | 120,418 | |||||||||||||
| Average Daily Sales Volumes from Discontinued Operations: |
||||||||||||||||||
| Oil (Bbls) |
South Africa | — | 452 | 428 | 530 | |||||||||||||
| Tunisia | — | — | — | 547 | ||||||||||||||
|
|
|
|
|
|
|
|
|
|||||||||||
| Total | — | 452 | 428 | 1,077 | ||||||||||||||
|
|
|
|
|
|
|
|
|
|||||||||||
| Gas (Mcf) |
South Africa | — | 15,186 | 10,340 | 20,570 | |||||||||||||
| Tunisia | — | — | — | 496 | ||||||||||||||
|
|
|
|
|
|
|
|
|
|||||||||||
| Total | — | 15,186 | 10,340 | 21,066 | ||||||||||||||
|
|
|
|
|
|
|
|
|
|||||||||||
| Total (BOE) |
South Africa | — | 2,983 | 2,151 | 3,958 | |||||||||||||
| Tunisia | — | — | — | 630 | ||||||||||||||
|
|
|
|
|
|
|
|
|
|||||||||||
| Total | — | 2,983 | 2,151 | 4,588 | ||||||||||||||
|
|
|
|
|
|
|
|
|
|||||||||||
| Average Reported Prices (a): |
||||||||||||||||||
| Oil (per Bbl) |
U.S. | $ | 85.60 | $ | 95.75 | $ | 90.89 | $ | 96.60 | |||||||||
| NGL (per Bbl) |
U.S. | $ | 30.69 | $ | 45.70 | $ | 33.75 | $ | 46.27 | |||||||||
| Gas (per Mcf) |
U.S. | $ | 3.20 | $ | 3.37 | $ | 2.60 | $ | 3.84 | |||||||||
| Total (BOE) |
U.S. | $ | 48.45 | $ | 52.86 | $ | 49.40 | $ | 52.19 | |||||||||
| (a) | Average reported prices are attributable to continuing operations and include the results of hedging activities and amortization of VPP deferred revenue. |
PIONEER NATURAL RESOURCES COMPANY
UNAUDITED SUPPLEMENTARY EARNINGS PER SHARE INFORMATION
The Company uses the two-class method of calculating basic and diluted earnings per share. Under the two-class method of calculating earnings per share, generally acceptable accounting principles (“GAAP”) provides that share- and unit-based awards with guaranteed dividend or distribution participation rights qualify as “participating securities” during their vesting periods. The Company’s basic net income (loss) per share attributable to common stockholders is computed as (i) net income (loss) attributable to common stockholders, (ii) less participating share- and unit-based basic earnings (iii) divided by weighted average basic shares outstanding. The Company’s diluted net income (loss) per share attributable to common stockholders is computed as (i) basic net income (loss) attributable to common stockholders, (ii) plus the reallocation of participating earnings (iii) divided by weighted average diluted shares outstanding. During periods in which the Company realizes a loss from continuing operations attributable to common stockholders, securities or other contracts to issue common stock would be dilutive to loss per share; therefore, conversion into common stock is assumed not to occur.
The following table is a reconciliation of the Company’s net income (loss) attributable to common stockholders to basic net income (loss) attributable to common stockholders and to diluted net income (loss) attributable to common stockholders for the three and twelve months ended December 31, 2012 and 2011:
| Three Months Ended December 31, |
Twelve Months Ended December 31, |
|||||||||||||||
| 2012 | 2011 | 2012 | 2011 | |||||||||||||
| (in thousands) | ||||||||||||||||
| Net income (loss) attributable to common stockholders |
$ | 28,834 | $ | (111,146 | ) | $ | 192,285 | $ | 834,489 | |||||||
| Participating basic earnings |
(516 | ) | (116 | ) | (3,029 | ) | (15,178 | ) | ||||||||
|
|
|
|
|
|
|
|
|
|||||||||
| Basic net income (loss) attributable to common stockholders |
28,318 | (111,262 | ) | 189,256 | 819,311 | |||||||||||
| Reallocation of participating earnings |
24 | — | 161 | 385 | ||||||||||||
|
|
|
|
|
|
|
|
|
|||||||||
| Diluted net income (loss) attributable to common stockholders |
$ | 28,342 | $ | (111,262 | ) | $ | 189,417 | $ | 819,696 | |||||||
|
|
|
|
|
|
|
|
|
|||||||||
The following table is a reconciliation of basic weighted average common shares outstanding to diluted weighted average common shares outstanding for the three and twelve months ended December 31, 2012 and 2011:
| Three Months Ended December 31, |
Twelve Months Ended December 31, |
|||||||||||||||
| 2012 | 2011 | 2012 | 2011 | |||||||||||||
| (in thousands) | ||||||||||||||||
| Weighted average common shares outstanding: |
||||||||||||||||
| Basic |
123,240 | 119,223 | 122,966 | 116,904 | ||||||||||||
| Dilutive common stock options (a) |
143 | — | 183 | 190 | ||||||||||||
| Contingently issuable performance unit shares |
196 | — | 180 | 424 | ||||||||||||
| Convertible senior notes dilution |
3,366 | — | 2,991 | 1,697 | ||||||||||||
|
|
|
|
|
|
|
|
|
|||||||||
| Diluted |
126,945 | 119,223 | 126,320 | 119,215 | ||||||||||||
|
|
|
|
|
|
|
|
|
|||||||||
| (a) | Options to purchase 98,819 shares and 129,918 shares of the Company’s common stock were excluded from the diluted income per share calculations for the quarter and year ended December 31, 2012, respectively, because they would have been anti-dilutive to the calculation. |
PIONEER NATURAL RESOURCES COMPANY
UNAUDITED SUPPLEMENTAL NON-GAAP FINANCIAL MEASURES
(in thousands)
EBITDAX and discretionary cash flow (“DCF”) (as defined below) are presented herein, and reconciled to the GAAP measures of net income (loss) and net cash provided by operating activities because of their wide acceptance by the investment community as financial indicators of a company’s ability to internally fund exploration and development activities and to service or incur debt. The Company also views the non-GAAP measures of EBITDAX and DCF as useful tools for comparisons of the Company’s financial indicators with those of peer companies that follow the full cost method of accounting. EBITDAX and DCF should not be considered as alternatives to net income (loss) or net cash provided by operating activities, as defined by GAAP.
| Three Months Ended December 31, |
Twelve Months Ended December 31, |
|||||||||||||||
| 2012 | 2011 | 2012 | 2011 | |||||||||||||
| Net income (loss) |
$ | 39,702 | $ | (113,188 | ) | $ | 242,822 | $ | 881,914 | |||||||
| Depletion, depreciation and amortization |
220,454 | 171,921 | 810,191 | 578,268 | ||||||||||||
| Exploration and abandonments |
88,787 | 64,078 | 206,291 | 121,320 | ||||||||||||
| Impairment of oil and gas properties |
87,709 | 354,408 | 532,589 | 354,408 | ||||||||||||
| Hurricane activity, net |
— | (36 | ) | — | (1,454 | ) | ||||||||||
| Accretion of discount on asset retirement obligations |
2,516 | 2,092 | 9,887 | 8,256 | ||||||||||||
| Interest expense |
53,915 | 45,878 | 204,222 | 181,660 | ||||||||||||
| Income tax (benefit) provision |
9,153 | (75,272 | ) | 92,384 | 197,644 | |||||||||||
| (Gain) loss on disposition of assets, net |
(503 | ) | 2,205 | (58,087 | ) | 3,644 | ||||||||||
| Income from discontinued operations |
(142 | ) | (2,256 | ) | (55,149 | ) | (423,152 | ) | ||||||||
| Derivative related activity |
(24,485 | ) | 47,847 | 68,604 | (221,899 | ) | ||||||||||
| Amortization of stock-based compensation |
15,668 | 9,917 | 62,567 | 41,442 | ||||||||||||
| Amortization of deferred revenue |
(10,575 | ) | (11,331 | ) | (42,069 | ) | (44,951 | ) | ||||||||
| Other noncash items |
(18,600 | ) | 3,245 | (39,599 | ) | 6,725 | ||||||||||
|
|
|
|
|
|
|
|
|
|||||||||
| EBITDAX (a) |
463,599 | 499,508 | 2,034,653 | 1,683,825 | ||||||||||||
| Cash interest expense |
(45,164 | ) | (37,807 | ) | (168,659 | ) | (150,177 | ) | ||||||||
| Current income tax benefit (provision) |
126 | (1,151 | ) | (6,925 | ) | (9,065 | ) | |||||||||
|
|
|
|
|
|
|
|
|
|||||||||
| Discretionary cash flow (b) |
418,561 | 460,550 | 1,859,069 | 1,524,583 | ||||||||||||
| Cash hurricane activity |
— | 36 | — | 1,454 | ||||||||||||
| Discontinued operations cash activity |
96 | 11,692 | 35,805 | 46,435 | ||||||||||||
| Cash exploration expense |
(16,038 | ) | (22,855 | ) | (80,915 | ) | (74,089 | ) | ||||||||
| Changes in operating assets and liabilities |
77,488 | 50,253 | 23,618 | 31,331 | ||||||||||||
|
|
|
|
|
|
|
|
|
|||||||||
| Net cash provided by operating activities |
$ | 480,107 | $ | 499,676 | $ | 1,837,577 | $ | 1,529,714 | ||||||||
|
|
|
|
|
|
|
|
|
|||||||||
| (a) | “EBITDAX” represents earnings before depletion, depreciation and amortization expense; exploration and abandonments; impairment of oil and gas properties; net hurricane activity; accretion of discount on asset retirement obligations; interest expense; income taxes; net gain or loss on the disposition of assets, net; income from discontinued operations; noncash derivative related activity; amortization of stock-based compensation; amortization of deferred revenue and other noncash items. |
| (b) | Discretionary cash flow equals cash flows from operating activities before changes in operating assets and liabilities and cash activity reflected in discontinued operations, hurricane activity and exploration expense. |
PIONEER NATURAL RESOURCES COMPANY
UNAUDITED SUPPLEMENTAL NON-GAAP FINANCIAL MEASURES (continued)
(in thousands, except per share data)
Adjusted income excluding unrealized mark-to-market (“MTM”) derivative gains, and adjusted income excluding unrealized MTM derivative gains and unusual items, as presented in this press release, are presented and reconciled to Pioneer’s net income attributable to common stockholders and diluted common shares outstanding (determined in accordance with GAAP) because Pioneer believes that these non-GAAP financial measures reflect an additional way of viewing aspects of Pioneer’s business that, when viewed together with its financial results computed in accordance with GAAP, provides a more complete understanding of factors and trends affecting its historical financial performance and future operating results, greater transparency of underlying trends and greater comparability of results across periods. In addition, management believes that these non-GAAP measures may enhance investors’ ability to assess Pioneer’s historical and future financial performance. These non-GAAP financial measures are not intended to be substitutes for the comparable GAAP measure and should be read only in conjunction with Pioneer’s consolidated financial statements prepared in accordance with GAAP. Unrealized MTM derivative gains and losses and unusual items will recur in future periods; however, the amount and frequency can vary significantly from period to period. The tables below reconcile Pioneer’s net income attributable to common stockholders and diluted shares outstanding for the three months ended December 31, 2012, as determined in accordance with GAAP, to income adjusted for unrealized MTM derivative gains and adjusted income excluding unrealized MTM derivative gains and unusual items for that quarter.
| After-tax Amounts |
Amounts Per Share |
|||||||
| Net income attributable to common stockholders |
$ | 28,834 | $ | 0.22 | ||||
| Unrealized MTM derivative gains |
(13,835 | ) | (0.11 | ) | ||||
|
|
|
|
|
|||||
| Income adjusted for unrealized MTM derivative gains |
14,999 | 0.11 | ||||||
| Income from discontinued operations |
(142 | ) | — | |||||
| Impairment of Barnett shale assets previously held for sale |
100,511 | 0.78 | ||||||
| Alaska petroleum production tax credit income |
(8,516 | ) | (0.06 | ) | ||||
|
|
|
|
|
|||||
| Adjusted income excluding unrealized MTM derivative gains and unusual items |
$ | 106,852 | $ | 0.83 | ||||
|
|
|
|
|
|||||
PIONEER NATURAL RESOURCES COMPANY
SUPPLEMENTAL INFORMATION
Open Commodity Derivative Positions as of February 8, 2013
(Volumes are average daily amounts)
| Twelve Months Ending December 31, | ||||||||||||
| 2013 | 2014 | 2015 | ||||||||||
| Average Daily Oil Production Associated with Derivatives (Bbls): |
||||||||||||
| Collar contracts with short puts: |
||||||||||||
| Volume |
71,029 | 69,000 | 26,000 | |||||||||
| NYMEX price: |
||||||||||||
| Ceiling |
$ | 119.76 | $ | 114.05 | $ | 104.45 | ||||||
| Floor |
$ | 92.27 | $ | 93.70 | $ | 95.00 | ||||||
| Short put |
$ | 74.28 | $ | 77.61 | $ | 80.00 | ||||||
| Swap contracts: |
||||||||||||
| Volume |
3,000 | — | — | |||||||||
| NYMEX price |
$ | 81.02 | $ | — | $ | — | ||||||
| Rollfactor swap contracts: |
||||||||||||
| Volume |
6,000 | 15,000 | — | |||||||||
| NYMEX roll price (a) |
$ | 0.43 | $ | 0.38 | $ | — | ||||||
| Basis swap contracts: |
||||||||||||
| Midland-Cushing index swap volume |
2,055 | — | — | |||||||||
| Price (b) |
$ | (5.75 | ) | $ | — | $ | — | |||||
| Cushing-LLS index swap volume |
252 | — | — | |||||||||
| Price (c) |
$ | (7.60 | ) | $ | — | $ | — | |||||
| Average Daily NGL Production Associated with Derivatives (Bbls): |
||||||||||||
| Collar contracts with short puts: |
||||||||||||
| Volume |
1,064 | 1,000 | — | |||||||||
| Index price |
||||||||||||
| Ceiling |
$ | 105.28 | $ | 109.50 | $ | — | ||||||
| Floor |
$ | 89.30 | $ | 95.00 | $ | — | ||||||
| Short put |
$ | 75.20 | $ | 80.00 | $ | — | ||||||
| Average Daily Gas Production Associated with Derivatives (MMBtu): |
||||||||||||
| Collar contracts with short puts: |
||||||||||||
| Volume |
— | 25,000 | 225,000 | |||||||||
| NYMEX price: |
||||||||||||
| Ceiling |
$ | — | $ | 4.70 | $ | 5.09 | ||||||
| Floor |
$ | — | $ | 4.00 | $ | 4.00 | ||||||
| Short put |
$ | — | $ | 3.00 | $ | 3.00 | ||||||
| Collar contracts: |
||||||||||||
| Volume |
150,000 | — | — | |||||||||
| NYMEX price: |
||||||||||||
| Ceiling |
$ | 6.25 | $ | — | $ | — | ||||||
| Floor |
$ | 5.00 | $ | — | $ | — | ||||||
| Swap contracts: |
||||||||||||
| Volume |
162,500 | 105,000 | — | |||||||||
| NYMEX price (d) |
$ | 5.13 | $ | 4.03 | $ | — | ||||||
| Basis swap contracts: |
||||||||||||
| Permian Basin index swap volume (e) |
52,500 | — | — | |||||||||
| Price differential ($/MMBtu) |
$ | (0.23 | ) | $ | — | $ | — | |||||
| Mid-Continent index swap volume (e) |
50,000 | 10,000 | — | |||||||||
| Price differential ($/MMBtu) |
$ | (0.30 | ) | $ | (0.19 | ) | $ | — | ||||
| Gulf Coast index swap volume (e) |
60,000 | — | — | |||||||||
| Price differential ($/MMBtu) |
$ | (0.14 | ) | $ | — | $ | — | |||||
| (a) | Represent swaps that fix the difference between (i) each day’s price per Bbl of West Texas Intermediate oil “WTI” for the first nearby month less (ii) the price per Bbl of WTI for the second nearby NYMEX month, multiplied by .6667; plus (iii) each day’s price per Bbl of WTI for the first nearby month less (iv) the price per Bbl of WTI for the third nearby NYMEX month, multiplied by .3333. |
| (b) | Represent swaps that fix the basis differential between Midland WTI and Cushing WTI. |
| (c) | Represent swaps that fix the basis differential between Cushing WTI and Louisiana Light Sweet crude “LLS”. |
| (d) | Represents the NYMEX Henry Hub index price on the derivative trade date. |
| (e) | Represent swaps that fix the basis differentials between the indices price at which the Company sells its Permian Basin, Mid-Continent and Gulf Coast gas and the NYMEX Henry Hub index price used in gas swap and collar contracts. |
Interest rate derivatives. As of February 8, 2013, the Company had interest rate derivative contracts that lock in a fixed forward annual interest rate of 3.21 percent, for a 10-year period ending in December 2025, on a notional amount of $250 million. These derivative contracts mature and settle by their terms during December 2015.
Marketing and basis transfer derivatives. Periodically, the Company enters into gas buy and sell marketing arrangements to fulfill firm pipeline transportation commitments. Associated with these gas marketing arrangements, the Company may enter into gas index swaps to mitigate price risk. The following table presents Pioneer’s open marketing derivative positions as of February 8, 2013:
| 2013 | ||||||||
| First Quarter | Second Quarter | |||||||
| Average Daily Gas Production Associated with Marketing Derivatives (MMBtu): |
||||||||
| Basis swap contracts: |
||||||||
| Index swap volume |
40,000 | 8,242 | ||||||
| Price differential ($/MMBtu) |
$ | 0.25 | $ | 0.35 | ||||
Derivative Gains, Net
(in thousands)
| Three Months Ended December 31, |
Twelve Months Ended December 31, |
|||||||
| Noncash changes in fair value: |
||||||||
| Oil derivative gains |
$ | 23,921 | $ | 217,765 | ||||
| NGL derivative gains (losses) |
(3,886 | ) | 1,209 | |||||
| Gas derivative gains (losses) |
2,553 | (290,058 | ) | |||||
| Diesel derivative losses |
— | (270 | ) | |||||
| Marketing derivative gains (losses) |
88 | (22 | ) | |||||
| Interest rate derivative gains |
1,809 | 5,930 | ||||||
|
|
|
|
|
|||||
| Total noncash derivative gains (losses), net (a) |
24,485 | (65,446 | ) | |||||
|
|
|
|
|
|||||
| Cash settled changes in fair value: |
||||||||
| Oil derivative gains |
13,462 | 4,139 | ||||||
| NGL derivative gains |
2,311 | 13,403 | ||||||
| Gas derivative gains (b) |
46,578 | 402,981 | ||||||
| Diesel derivative gains (b) |
— | 3,497 | ||||||
| Marketing derivative gains (losses) |
(153 | ) | 36 | |||||
| Interest rate derivative losses (b) |
— | (28,359 | ) | |||||
|
|
|
|
|
|||||
| Total cash derivative gains, net |
62,198 | 395,697 | ||||||
|
|
|
|
|
|||||
| Total derivative gains, net |
$ | 86,683 | $ | 330,251 | ||||
|
|
|
|
|
|||||
| (a) | Total noncash derivative gains (losses), net includes $2.5 million and $16.2 million of net gains attributable to noncontrolling interests in consolidated subsidiaries during the three and twelve months ended December 31, 2012, respectively. |
| (b) | During the twelve months ended December 31, 2012, the Company terminated (i) swap, collar, three-way and basis swap derivative contracts for 2014 and 2015 gas production, (ii) swap derivative contracts for 2013 diesel fuel and (iii) $200 million notional amount of interest rate derivative contracts. As a result of these transactions, the Company realized $116.4 million of net proceeds during the twelve months ended December 31, 2012. |