Exhibit 99.1
|
|
Mac Mac-Gray Gray Corporation Corporation May, 2008 May, 2008 |

|
|
2 Safe Safe-Harbor Statement Harbor Statement This presentation contains certain forward-looking statements within the meaning of Section 27A of the Securities Act of 1933, as amended, and Section 21E of the Securities Exchange Act of 1934, as amended. Mac-Gray intends such forward looking statements to be covered by the Safe Harbor provisions for forward-looking statements contained in the Private Securities Litigation Reform Act of 1995, and is including this statement for purposes of complying with these Safe Harbor provisions. Forward-looking statements, which are based on certain assumptions and describe future plans, strategies and expectations of Mac-Gray, may be identified by use of the words "believe," "expect," "intend," "anticipate," "estimate," "project," or similar expressions. Investors should not rely on forward-looking statements because they are subject to a variety of risks, uncertainties and other factors that could cause actual results to differ materially from such forward-looking statements. Certain factors which could cause actual results to differ materially from the forward-looking statements include, but are not limited to, Mac-Gray's ability to identify and successfully acquire laundry facility business, successfully integrate acquired assets and operations, and service the increased debt incurred to finance acquisitions, as well as the risks that Mac-Gray will incur unanticipated costs related to the acquired operations or not realize expected revenues, synergies and cost savings, and those risks set forth in Mac-Gray's Annual Report on Form 10-K for the year ended December 31, 2007 under "Management's Discussion and Analysis of Financial Condition and Results of Operations" and in other reports subsequently filed with the Securities and Exchange Commission. |

|
|
3 Presentation Outline Presentation Outline 1. Acquisition of ALC 2. Overview of Businesses 3. Financial Results 4. Corporate Strategy 5. Appendix |

|
|
4 1. ALC Acquisition 1. ALC Acquisition On April 1, 2008 Mac-Gray acquired Automatic Laundry Co., of Denver (“ALC”) $116M purchase price $106M senior, secured bank financing $10M seller note $65M of revenue in 2007 80% overlap of contracts & operations: Seattle, Denver, Phoenix, Dallas, Birmingham 20% new markets for Mac-Gray: Colorado Springs, El Paso, Memphis |

|
|
5 Presentation Outline Presentation Outline 1. ALC Acquisition 2. Overview of Businesses a) Laundry Facilities Management b) Product Sales a) MicroFridge© (Intirion) b) Commercial Laundry Equipment 3. Financial Results 4. Corporate Strategy 5. Appendix |

|
|
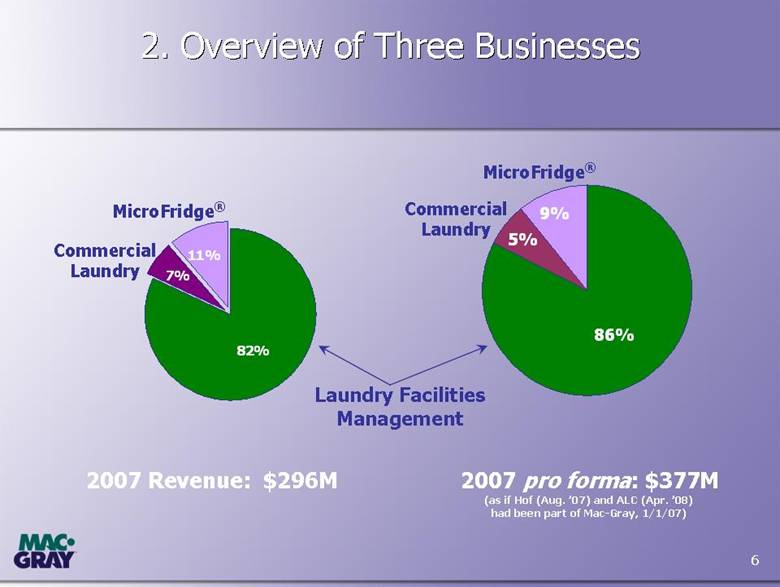
6 2. Overview of Three Businesses 2. Overview of Three Businesses 82% 7% 11% Laundry Facilities Management MicroFridge® Commercial Laundry 2007 Revenue: $296M 9% 86% 5% 2007 proforma: $377M (as if Hof (Aug. ’07) and ALC (Apr. ’08) had been part of Mac-Gray, 1/1/07) MicroFridge® Commercial Laundry |
|
|
7 Laundry Facilities Management: Laundry Facilities Management: Colleges & Apartment Buildings Colleges & Apartment Buildings |

|
|
8 A Mac-Gray Apartment Building Laundry Room |

|
|
9 Laundry Facilities Management Laundry Facilities Management |

|
|
10 Laundry Facilities Management Providers Laundry Facilities Management Providers Estimates of market share, (post ALC) Estimates of market share, (post ALC) 33% 33% 13% 20% Local & Regional Coinmach Mac-Gray Self-Operated Company Estimates: A $2.3B market Two national providers Hundreds of Local & Regional providers from $500K to $40M |

|
|
11 % of Machines, by Contract Expiration % of Machines, by Contract Expiration 0% 2% 4% 6% 8% 10% 12% '08 '09 '10 '11 '12 beyond • 93% of Mac 93% of Mac-Gray Gray’s account base is under multi account base is under multi-year contracts year contracts |

|
|
12 Product Sales Product Sales MicroFridge (50 states, 11 countries) MicroFridge combination products for the Military Housing, Hospitality & Senior Living, and Academic markets Maytag Direct™: A full line of domestic appliances for multi-unit housing Commercial Sales (select geographic territories, including international) Commercial laundry equipment, primarily for the retail Laundromat market |

|
|
13 Original 3-in-1 combination appliance Patented SafePlug® Technology Significant brand equity 10.7 9.5 12.5 4.2 3.2 10.9 11.7 11.8 3.0 2.4 7.3 6.1 7.0 1.6 3.1 2.1 $0 $7 $14 $21 $28 $35 '05 '06 '07 Q1 '07 Q1 '08 Retail & Other Academic Hospitality & Senior Living Government Sales, in millions |

|
|
14 Commercial Laundry Equipment Sales: Commercial Laundry Equipment Sales: Selling to Laundromats & other Self Selling to Laundromats & other Self-Operators Operators $15.3 $16.7 $19.7 $3.3 $3.9 $0 $5 $10 $15 $20 '05 '06 '07 Q1 '07 Q1 '08 (millions) |

|
|
15 Commercial Laundry Equipment Sales A Retail Laundromat |

|
|
16 Products & Services by Market Products & Services by Market Markets Laundry Facilities Management Commercial Laundry Equipment Kitchen Appliances “MaytagDirect” MicroFridge Products Apartment Buildings & Condos Colleges & Universities Hotels & Motels Military Housing Assisted Living Retail Laundromats |

|
|
17 Sources of EBITDA, as Adjusted Sources of EBITDA, as Adjusted $54.5 $57.4 $13.2 $14.6 $50.7 $0 $20 $40 $60 '05 '06 '07 Q1 '07 Q1'08 Facilities Mgmt Product Sales millions See the Appendix to this presentation for a reconciliation of non-GAAP measures (including net income, as adjusted, EBITDA, EBITDA, as adjusted, and free cash flow) to net income. |

|
|
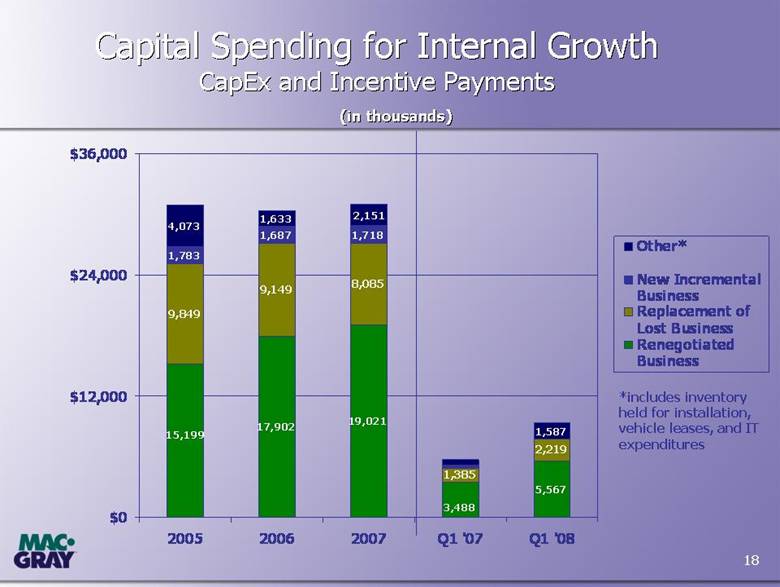
18 Capital Spending for Internal Growth Capital Spending for Internal Growth CapEx and Incentive Payments CapEx and Incentive Payments 17,902 19,021 5,567 9,849 9,149 8,085 1,385 2,219 1,783 1,687 4,073 1,633 1,587 15,199 3,488 1,718 2,151 $0 $12,000 $24,000 $36,000 2005 2006 2007 Q1 '07 Q1 '08 Other* New Incremental Business Replacement of Lost Business Renegotiated Business (in thousands) (in thousands) *includes inventory held for installation, vehicle leases, and IT expenditures |
|
|
19 Presentation Outline Presentation Outline 1. ALC Acquisition 2. Overview of Businesses 3. Financial Results 4. Corporate Strategy 5. Appendix |

|
|
20 3. Financial Performance: Income Statement 3. Financial Performance: Income Statement 19.9% 21,324 18,474 19,895 12,474 10,328 EBIT (as adjusted) 48.8% 13,745 13,653 10,939 4,312 2,807 Interest Expense* 2,925 1,861 3,457 3,151 2,903 Income Tax provision (adj.) 78 510 2,558 646 319 Income Taxes paid 0.2% 4,654 2,960 5,499 5,011 4,618 Net Income (as adjusted) (1.0%) $0.34 58.2% $0.22 (46.8%) $0.41 7.6% $0.38 6.1% $0.36 EPS, (as adjusted) % change 1.8% 35.7% 20.2% 13,680 $13.85 $11.26 13,448 $11.83 $11.92 13,283 $10.20 $11.65 13,028 $6.85 $8.09 12,741 $4.09 $5.40 Shares, fully diluted Share Price – 12 mo. Avg. Share Price – Year-end 21.6% 39,021 36,745 32,526 21,794 17,823 Depreciation & Amortization 21.0% 60,345 9.3% 55,219 5.3% 52,421 53.0% 34,268 21.7% 28,151 EBITDA, (as adjusted) % change 18.6% 295,902 5.9% 279,327 7.2% 260,623 42.7% 182,694 22.1% 149,656 REVENUE % change CAGR 2007 2006 2005 2004 2003 See the Appendix to this presentation for a reconciliation of non-GAAP measures (including net income, as adjusted, EBITDA, EBITDA, as adjusted, and free cash flow) to net income. *reflects the effect of $330M in acquisitions since Jan., ‘04 |

|
|
21 Financial Performance: Balance Sheet Financial Performance: Balance Sheet 150 150 17 27 59 28 51 73 150 150 150 150 63 175 $0 $50 $100 $150 $200 $250 $300 $350 '03 '04 '05 '06 '07 Q1 '07 Q1 '08 01-Apr-08 Acquisition CapEx: $1 $41 $106 $19 $47 $3 $0 $116 Bonds Funded Debt Levels, in millions, including capital leases (not adjusted for cash-on-hand) |

|
|
22 Financial Performance: Free Cash Flow Financial Performance: Free Cash Flow 21.0% 60,345 9.3% 55,219 5.3% 52,421 53.0% 34,268 21.7% 28,151 EBITDA, (as adjusted) % change 48.8% 13,745 13,653 10,939 4,312 2,807 Interest Expense 78 510 2,558 646 319 Income Taxes paid 16.5% 30,977 30,104 30,897 21,329 16,809 CapEx (incl. incentives) 17.3% 15,545 41.9% 10,952 36.4% 8,027 0.6% 7,981 (2.9%) 8,216 Free Cash Flow (as adjusted) % change 1.8% 13,680 13,448 13,283 13,028 12,741 Shares, fully diluted 18.6% 295,902 5.9% 279,327 7.2% 260,623 42.7% 182,694 22.1% 149,656 REVENUE % change CAGR 2007 2006 2005 2004 2003 As the company reduces debt, and as shares outstanding is controlled, Free Cash Flow per share and Earnings per share increase. See the Appendix to this presentation for a reconciliation of non-GAAP measures (including net income, as adjusted, EBITDA, EBITDA, as adjusted, and free cash flow) to net income. |

|
|
23 Presentation Outline Presentation Outline 1. ALC Acquisition 2. Overview of Businesses 3. Financial Results 4. Corporate Strategy 5. Appendix |

|
|
24 4. Our Corporate Strategy 4. Our Corporate Strategy Organic Growth in the Core Business Increase operating efficiency and leverage by pursuing market density Shed marginally profitable accounts Focus on EBITDA, EBIT, and free cash-flow Development of Technology Innovations for Competitive Differentiation Leverage Product Sales for Economies of Scale and Cross-Selling Opportunities Accretive Acquisitions in the Core Business Maintain Industry Leadership Role Reduce Funded Debt |

|
|
25 Organic Growth Opportunities Organic Growth Opportunities Societal trend toward outsourcing Attract New Accounts Incremental Locations with Existing Clients Renegotiated Accounts with improved margins Coin to card conversion, and other value-added Intelligent Laundry™ Systems Appropriate price increases Building market density & improving EBITDA margin |

|
|
26 Increasing Expectations on Our Capital Spending: Increasing Expectations on Our Capital Spending: projected internal rate of return projected internal rate of return 14.5% 16.3% 17.6% 18.0% 0% 5% 10% 15% 20% '04 '05 '06 '07 ( new and renewed contracts) |

|
|
27 Technology Opportunities Technology Opportunities Debit-Card systems Magnetic stripe: Academic environment Computer chip: Multi-Housing environment Intelligent Laundry™ Systems Client Resource Center --------- Transparent Account Info. LaundryView® ------------------ eMonitoring System PrecisionWash™ ------------------ Detergent On Demand LaundryLinx™ ------------------ eService System TechLinx™ ------------------ Automated Dispatch CollectorLinx™ ------------------ Optimal Routing Systems VentSnake™ ------------------ Advanced Vent Cleaning |

|
|
28 The Advantage of Card v. Coin The Advantage of Card v. Coin Conversion from coin to card operation Increases revenue at most locations by >10% Supports higher vends over the long term, by enabling smaller more frequent increases Convenience generates increased usage Creates breakage (e.g. unused value left on cards) Decreases shrinkage Reduces service calls Provides a durable benefit to both the client and the residents, and client commitment and loyalty |

|
|
29 17,902 19,021 9,849 9,149 8,085 106,244 19,356 46,626 116,500 15,199 $0 $50,000 $100,000 $150,000 2005 2006 2007 2008, y-t-d Acquisitions Other* New Incremental Business Replacement of Lost Business Renegotiated Business Capital Spending: Capital Spending: Internal Growth Internal Growth and and Acquisitions Acquisitions ( in thousands) *includes inventory held for installation, vehicle leases, and IT expenditures |

|
|
30 Acquisition Growth Acquisition Growth Evaluation Criteria Length and renewal likelihood of contracts Age, manufacturer & condition of equipment Net per machine (Vend price minus rent expense) In-market v. Out of market Upside potential Coin to card conversion Price increases Market expansion Reputation of seller Investment Criteria Return on capital Accretive to earnings |

|
|
31 Recent Acquisitions in the Core Business Recent Acquisitions in the Core Business (in thousands) ‘04 ‘05 ‘06 ‘07 ‘08 Mid-Atlantic & $41,454 Southeast Western U.S. $106,244 $86 $116,500 Eastern New England 11,701 Upstate NY $2,660 Conn / NYC 4 ,054 271 Mid-Atlantic 3,025 41,047 Tennessee 2,578 South Carolina 70 Florida 490 TOTALS $41,454 $106,244 $19,356 $46,626 $116,500 |

|
|
32 Acquisitions: Integration Processes Acquisitions: Integration Processes The Integration of an Acquisition consists of: Phase 1: Initial cost savings (elimination of initial redundant costs) Phase 2: Re-training Sales personnel for greater profitability Phase 3: Rework each acquired contract Jan ’04 Jan ’05 Aug ’07 Apr ‘08 2004 2005 2006 2007 2008 2009 2010 2011 2012 2013 2014 2015 2016 |

|
|
33 Relative Densities of Facilities Management Portfolio Year-End 2007 |

|
|
34 Branch Profitability: Branch Profitability: Near Near-Term Effects of an In Term Effects of an In-Market Acquisition Market Acquisition ( in thousands) BRANCH A BRANCH B 2003 2005 2003 2005 Revenue 3,680 7,353 4,537 7,582 Rent Exp. 1,582 (43%) 3,162 (43%) 2,269 (50%) 3,791 (50%) Net Rev. 2,098 4,191 2,268 3,791 Direct Op.Ex. 769 (21%) 1,371 (19%) 1,013 (22%) 1,258 (17%) Gross Profit 1,329 (36%) 2,820 (38%) 1,255 (28%) 2,533 (33%) Facility Management profitability at these branches was positively affected by our January 2004 acquisition of assets in the Southeastern region of the U.S. Direct Operating Expense excludes SG&A. Of the contracts acquired in 2004, approximately 50% have, in the 4+ years since, become available for renegotiation. |

|
|
35 Laundry Route Business / Model Laundry Route Business / Model 93% of accounts being governed by long-term leases means stable, contractually protected, predictable cash flow Route revenue = # Machines x # Cycles x Vend price Increase any of the multipliers and you increase revenue Less: Rent = 49% of revenue* Less: Operating Exp. = 18% of revenue* (Warehousing + Delivery + Service + Collection+ Processing) = 20% - 35% EBITDA* (before allocation of SG&A) *Differs by branch, and region |

|
|
36 Investment Highlights Investment Highlights Stable, recurring revenue stream Strong cash flow 2nd largest provider in a highly fragmented, $2B market Technology innovator with strong brand Environmentally focused Seasoned management with large ownership stake |

|
|
37 Presentation Outline Presentation Outline 1. ALC Acquisition 2. Overview of Businesses 3. Financial Results 4. Corporate Strategy 5. Appendix |

|
|
38 Non Non-GAAP Measures GAAP Measures In this presentation we use certain non-GAAP financial measures, including net income, as adjusted, EBITDA, EBITDA, as adjusted, EBIT, as adjusted, and free cash flow, as adjusted. EBITDA is defined as net income before interest expense, provision for income taxes, and depreciation and amortization expense. EBITDA, as adjusted, is EBITDA further adjusted to exclude certain items that we believe are not reflective of our ongoing operating performance. EBIT, as adjusted, is the same as EBITDA, as adjusted, except it is reduced by depreciation and amortization expense. Free cash flow is EBITDA, as adjusted, less capital expenditures (including incentive payments), interest expense and cash income taxes paid. EBITDA, EBIT and free cash flow are not measures of our liquidity or financial performance under generally accepted accounting principles (GAAP) and should not be considered as alternatives to net income or any other performance measure derived in accordance with GAAP, or as an alternative to cash flows from operating activities as a measure of our liquidity. Our management believes these non-GAAP measures are useful to investors because they help enable investors to evaluate our business in the same manner as our management. Management uses these non-GAAP measures: (a) to evaluate the Company’s historical and prospective financial performance, (b) to set internal revenue targets and spending budgets, (c) to measure operational profitability and the accuracy of forecasting, and (d) as an important factor in determining variable compensation for management. In addition, these measures are frequently used by securities analysts, investors and other interested parties in the evaluation of companies with substantial financial leverage. Moreover, investors have historically requested and the Company has historically reported certain of these non-GAAP financial measures as a means of providing consistent and comparable information with past reports of financial results. While management believes that these non-GAAP financial measures provide useful supplemental information to investors, there are limitations associated with their use. These measures are not prepared in accordance with GAAP and may not be directly comparable to similarly titled measures of other companies due to potential differences in the exact method of calculation. Further, the EBITDA and free cash flow measures exclude depreciation and amortization expense and EBITDA also excludes interest expense, all of which represent significant and unavoidable operating costs given the level of indebtedness and the capital expenditures needed to maintain our business. In addition, our measures of EBITDA and free cash flow are different from those used in the covenants contained in our senior credit facilities and the indenture governing our 7 5/8% senior notes. Management compensates for these limitations by relying primarily on our GAAP results and by using non-GAAP measures only supplementally and by reviewing the reconciliations of the non-GAAP financial measures to their most comparable GAAP financial measures. Non-GAAP financial measures are not in accordance with, or an alternative for, generally accepted accounting principles in the United States. The Company’s non-GAAP financial measures are not meant to be considered in isolation or as a substitute for comparable GAAP financial measures, and should be read only in conjunction with the Company’s consolidated financial statements prepared in accordance with GAAP. For a reconciliation of all non-GAAP measures used in this presentation to the comparable GAAP measures, please refer to the appendix at the end of this presentation. Further, page 15 of our Annual Report on Form 10-K for the year ended December 31, 2007 includes a reconciliation of net income to EBITDA and EBITDA, as adjusted. |

|
|
39 Appendix (1) Appendix (1) 2003 2004 2005 2006 2007 Net Income 4,104 $ 5,263 $ 12,052 $ 856 $ 2,519 $ Provision for income taxes 3,036 $ 3,934 $ 8,563 $ 147 $ 1,509 $ Net Income before income taxes 7,140 $ 9,197 $ 20,615 $ 1,003 $ 4,028 $ Add (subtract): Gain on sale of certain assets (net) (1,218) $ (10,767) $ Stock compensation expense 1,147 $ 1,814 $ Impairments of ass ets 2,502 $ (Gain) loss related to derivative instruments (1,876) $ 96 $ 1,737 $ Loss related to 2005 hurricanes 316 $ (Gain) loss on early extinguishment of debt 381 $ 183 $ 668 $ 73 $ Net Income, as adjusted, before income tax provision 7,521 $ 8,162 $ 8,956 $ 4,821 $ 7,579 $ Provision for income taxes, at 38.6% 2,903 $ 3,151 $ 3,457 $ 1,861 $ 2,925 $ Net Income, as adjusted 4,618 $ 5,011 $ 5,499 $ 2,960 $ 4,654 $ Shares, fully diluted / year end 12,741 13,028 13,283 13,448 13,680 Earnings per share, as adjusted 0.36 $ 0.38 $ 0.41 $ 0.22 $ 0.34 $ |

|
|
40 Appendix (2) Appendix (2) 2003 2004 2005 2006 2007 Net Income 4,104 $ 5,263 $ 12,052 $ 856 $ 2,519 $ Add: Provision for income taxes 3,036 $ 3,934 $ 8,563 $ 147 $ 1,509 $ Cost of revenue depreciation and amoritzation expense 16,723 $ 20,747 $ 31,337 $ 35,156 $ 37,410 $ Operating expense depreciation and amortization expense 1,100 $ 1,047 $ 1,189 $ 1,589 $ 1,611 $ Interest expense, net 2,807 $ 4,312 $ 10,939 $ 13,653 $ 13,745 $ EBITDA 27,770 $ 35,303 $ 64,080 $ 51,401 $ 56,794 $ Add (subtract): Gain on sale of certain assets, net (1,218) $ (10,767) $ Stock compensation expense 1,147 $ 1,814 $ Impairments of assets 2,502 $ (Gain) loss related to derivative instruments (1,876) $ 96 $ 1,737 $ Loss related to 2005 hurricanes 316 $ Loss on early extinguishment of debt 381 $ 183 $ 668 $ 73 $ EBITDA, as adjusted 28,151 $ 34,268 $ 52,421 $ 55,219 $ 60,345 $ |

|
|
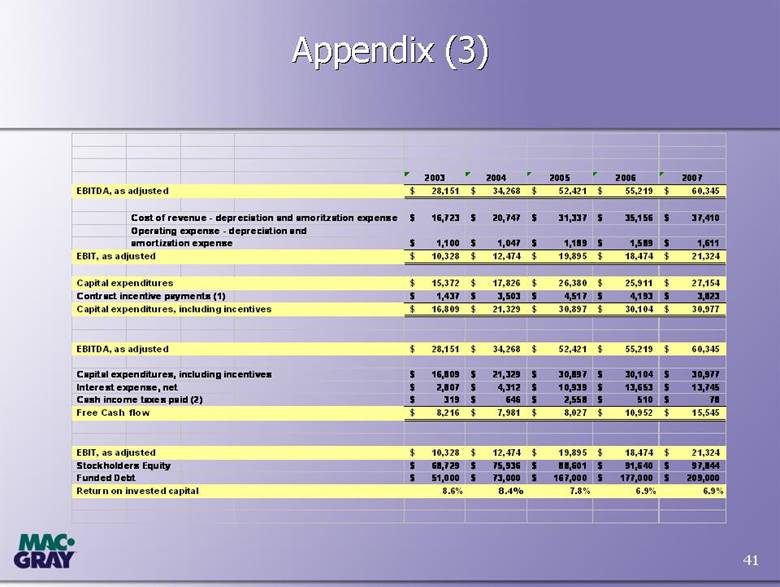
41 Appendix (3) Appendix (3) 2003 2004 2005 2006 2007 EBITDA, as adjusted 28,151 $ 34,268 $ 52,421 $ 55,219 $ 60,345 $ Cost of revenue - depreciation and amoritzation expense 16,723 $ 20,747 $ 31,337 $ 35,156 $ 37,410 $ Operating expense - depreciation and amortization expense 1,100 $ 1,047 $ 1,189 $ 1,589 $ 1,611 $ EBIT, as adjusted 10,328 $ 12,474 $ 19,895 $ 18,474 $ 21,324 $ Capital expenditures 15,372 $ 17,826 $ 26,380 $ 25,911 $ 27,154 $ Contract incentive payments (1) 1,437 $ 3,503 $ 4,517 $ 4,193 $ 3,823 $ Capital expenditures, including incentives 16,809 $ 21,329 $ 30,897 $ 30,104 $ 30,977 $ EBITDA, as adjusted 28,151 $ 34,268 $ 52,421 $ 55,219 $ 60,345 $ Capital expenditures, including incentives 16,809 $ 21,329 $ 30,897 $ 30,104 $ 30,977 $ Interest expense , net 2,807 $ 4,312 $ 10,939 $ 13,653 $ 13,745 $ Cash income taxes paid (2) 319 $ 646 $ 2,558 $ 510 $ 78 $ Free Cash flow 8,216 $ 7,981 $ 8,027 $ 10,952 $ 15,545 $ EBIT, as adjusted 10,328 $ 12,474 $ 19,895 $ 18,474 $ 21,324 $ Stockholders Equity 68,729 $ 75,936 $ 88,601 $ 91,640 $ 97,844 $ Funded Debt 51,000 $ 73,000 $ 167,000 $ 177,000 $ 209,000 $ Return on invested capital 8.6% 8.4% 7.8% 6.9% 6.9% |
|
|
since 1927 since 1927 |
