Table of Contents

2013 Annual Report
www.fairchildsemi.com
Table of Contents
To our stockholders:
Fairchild is focused on enabling two great technology trends of our time – the use of technology to increase energy efficiency and the “Internet of Things” or pervasive use of connected mobile devices in all facets of our life. At the heart of these megatrends is the need for highly efficient power management solutions that reduce energy consumption, improve the environment, increase battery life and enable exciting new features. Fairchild is a leader in creating these power management solutions which resulted in strong 2013 sales growth into the industrial, appliance and automotive markets. We also reported continued sales growth into mobile applications with a wide range of power and interface solutions. Total company sales were up 2 percent in 2013 after adjusting for an extra week in 2012. Demand was strong exiting 2013 and we expect continued sales growth during 2014 while we make numerous improvements in our capabilities to delight customers and increase the flexibility of our operations.
We grew sales in a number of key end markets during 2013. In the industrial and appliance end markets we increased sales 14% from the prior year due to strong demand for our advanced power management solutions. Fairchild offers customers a wide range of power technologies from discrete products to highly integrated power modules. A key technology trend driving growth in these markets is the adoption of highly efficient, variable-speed electric motors and pumps. This new technology, enabled by Fairchild’s power management solutions, typically provides more than a 50 percent improvement in efficiency compared to the current single-speed AC versions. We enter 2014 with strong demand momentum as customers pursue greater energy efficiency in their products.
Fairchild reported 10% sales growth into the automotive market by enabling greater fuel efficiency in the power train. We are a leader in providing advanced power solutions for ignition and fuel injection systems. Fairchild also is the industry leader in providing power management solutions to support the transition to electronic pumps and motors such as the electronic power steering systems which are replacing hydraulic versions. We expect continued solid sales growth for these products as customers strive for greater fuel efficiency through advanced technology.
We increased our sales into mobile applications again in 2013 with a broad portfolio of power management and interface solutions. We are also a leader in power conversion solutions that enable efficient, small, light battery chargers. Fairchild is on the forefront of adaptive or rapid charging technology and expects to begin shipping these innovative products in 2014. While the top customers saw slower high-end smart phone sales growth in 2013, we expect continued modest growth for this market in 2014. Fairchild is also working closely with leading customers on our new motion sensing solutions for smart phone and wearable applications. These solutions offer substantially less power consumption than the current technology enabling “always on” performance even in wearable applications that have small batteries. We expect to report our first design wins in 2014 for these products.
Sales into the computing end market continued its multi-year decline in 2013 as more personal computing is done with tablets and smart phones. This business has declined from nearly a quarter of Fairchild’s total sales 5 years ago to now a more stable range of 8 to 10 percent. We are investing in new technologies and capabilities to capitalize on the growing demand for cloud computing. We expect steady sales growth as these new technologies ramp in 2014 and beyond.
In addition to the numerous exciting new technologies we are developing to drive future sales, Fairchild is also focused on significantly improving our manufacturing flexibility and capability. In 2013 we opened our new 8 inch wafer fabrication line in Korea which enables us to transition more of our products from older, less capable, smaller diameter production lines to this new facility. We also plan to increase our use of foundries to improve our flexibility to better support customers. There are similar opportunities to increase flexibility in our assembly and test operations. We expect to complete this first phase of operational transformation by the middle of 2015.
Fairchild reported 2013 sales of $1.4 billion and gross margin of 29.6% or 30.3% when adjusted for accelerated depreciation related to line closures, compared to 31.4% in 2012. Gross margin decreased from the prior year due
Table of Contents
primarily to higher manufacturing costs associated with qualifying and ramping production at the new 8 inch wafer fabrication facility in Korea as well as some pricing and product mix impacts. We increased R&D spending 12 percent in 2013, after adjusting for an extra week in 2012, to invest in a variety of new technologies including cloud computing and sensors. Fairchild now uses a rigorous end market segment-based approach to assessing where to invest R&D which focuses on providing higher value, more differentiated power management system solutions. We expect this to significantly improve our return on R&D spending. We reduced SG&A spending again in 2013 compared to 2012. Fairchild will continue to invest in new technologies to drive future sales growth while tightly controlling our SG&A spending.
Fairchild ended 2013 with the strongest balance sheet in our history. We paid off another $50 million in debt bringing our total debt down to $200 million. We exited 2013 with $420 million of cash and investments for a record high net cash position of $220 million. We also announced an enhanced share repurchase program that authorizes the company to buy back up to $100 million worth of Fairchild stock during the next year.
In closing, Fairchild has a clear strategy to capitalize on the growing use of technology to increase energy efficiency as well as the explosion of mobile connected devices. We are a leader in providing the advanced power management solutions needed by our customers to create more efficient and exciting products. We delivered solid sales growth in our core businesses in 2013 and are well positioned to accelerate our performance in 2014 and beyond. At the same time, Fairchild is intensely focused on increasing our manufacturing flexibility to better serve customers and reduce costs. We expect to make significant progress on improving our operational capabilities and flexibility in 2014 and plan to complete the first phase of this effort by mid-2015. We have a strong balance sheet and expect to accelerate cash flow as we improve profitability while maintaining modest capital spending. We were pleased to announce the $100 million share repurchase program which illustrates Fairchild’s confidence in its ability to grow sales and earnings as well as our commitment to shareholders.
Finally, I want to thank our employees for all their hard work and significant progress in improving our capabilities during 2013. We enter 2014 with a great team of Fairchild employees dedicated to delighting our customers with truly amazing solutions to their toughest challenges!
Sincerely,
Mark Thompson
Chairman and CEO
Table of Contents
UNITED STATES
SECURITIES AND EXCHANGE COMMISSION
WASHINGTON, D.C. 20549
FORM 10-K
| x | ANNUAL REPORT PURSUANT TO SECTION 13 OR 15(d) OF THE SECURITIES EXCHANGE ACT OF 1934 |
For the fiscal year ended December 29, 2013
OR
| ¨ | TRANSITION REPORT PURSUANT TO SECTION 13 OR 15(d) OF THE SECURITIES EXCHANGE ACT OF 1934 |
For the transition period from to
Commission File Number 001-15181
Fairchild Semiconductor International, Inc.
(Exact name of Registrant as specified in its charter)
| Delaware | 04-3363001 | |
| (State or other jurisdiction of incorporation or organization) |
(I.R.S. Employer Identification No.) | |
| 3030 Orchard Parkway, San Jose, CA | 95134 | |
| (Address of principal executive offices) | (Zip Code) | |
Registrant’s telephone number, including area code: (408) 822-2000
Securities registered pursuant to Section 12(b) of the Act:
Common Stock, par value $.01 per share
(Title of each class)
NASDAQ Stock Market
(Name of each exchange on which registered)
Securities registered pursuant to Section 12(g) of the Act: None
Indicate by check mark if the registrant is a well-known seasoned issuer, as defined in Rule 405 of the Securities Act. Yes x No ¨
Indicate by check mark if the registrant is not required to file reports pursuant to Section 13 or 15(d) of the Act. Yes ¨ No x
Indicate by check mark whether the registrant (1) has filed all reports required to be filed by Section 13 or 15(d) of the Securities Exchange Act of 1934 during the preceding 12 months (or for such shorter period that the registrant was required to file such reports), and (2) has been subject to such filing requirements for the past 90 days. Yes x No ¨
Indicate by check mark whether the registrant has submitted electronically and posted on its corporate Web site, if any, every Interactive Data File required to be submitted and posted pursuant to Rule 405 of Regulation S-T (§232.405 of this chapter) during the preceding 12 months (or for such shorter period that the registrant was required to submit and post such files). Yes x No ¨
Indicate by check mark if disclosure of delinquent filers pursuant to Item 405 of Regulation S-K is not contained herein, and will not be contained, to the best of registrant’s knowledge in definitive proxy or information statements incorporated by reference in Part III of this Form 10-K or any amendment to this Form 10-K. x
Indicate by check mark whether the registrant is a large accelerated filer, an accelerated filer, a non-accelerated filer, or a smaller reporting company (as defined in Rule 12b-2 of the Exchange Act).
| Large accelerated filer x | Accelerated filer ¨ | Non-accelerated filer ¨ | Smaller reporting company ¨ |
Indicate by check mark whether the registrant is a shell company (as defined in Rule 12b-2 of the Exchange Act). Yes ¨ No x
The aggregate market value of the voting stock held by non-affiliates of the registrant as of June 30, 2013 was $1,748,529,925
The number of shares outstanding of the Registrant’s Common Stock as of February 20, 2014 was 124,743,564.
DOCUMENTS INCORPORATED BY REFERENCE
Portions of the definitive Proxy Statement for the Annual Meeting of Stockholders to be held on May 7, 2014 are incorporated by reference into Part III.
Table of Contents
2
Table of Contents
PART I
| ITEM 1. | BUSINESS |
Except as otherwise indicated in this Annual Report on Form 10-K, the terms “we,” “our,” the “company,” “Fairchild” and “Fairchild International” refer to Fairchild Semiconductor International, Inc. and its consolidated subsidiaries, including Fairchild Semiconductor Corporation, our principal operating subsidiary. We refer to individual subsidiaries where appropriate.
The company’s fiscal year ends on the last Sunday in December. The years ended December 29, 2013, December 30, 2012, and December 25, 2011 consist of 52 weeks, 53 weeks, and 52 weeks, respectively.
General
We are focused on developing, manufacturing and selling power analog, power discrete and certain non-power semiconductor solutions to a wide range of end market customers. We are a leading supplier of power analog products, power discrete products and energy-efficient solutions, according to iSuppli. Our products are used in a wide variety of electronic applications, including sophisticated computers and internet hardware; communications including wireless phones and tablets; networking and storage equipment; industrial power supply and instrumentation equipment; consumer electronics such as digital cameras, displays, audio/video devices and household appliances; and automotive applications. We believe that our focus on the power market, our diverse end market exposure, and our strong penetration into the growing Asian region provide us with excellent opportunities to expand our business.
With a history dating back approximately 50 years, the original Fairchild was one of the founders of the semiconductor industry. Established in 1959 as a provider of memory and logic semiconductors, the Fairchild Semiconductor business was acquired by Schlumberger Limited in 1979 and by National Semiconductor Corporation in 1987. In March 1997, as part of its recapitalization, much of the Fairchild Semiconductor business was sold to a new, independent company—Fairchild Semiconductor Corporation.
Products and Technology
Two of our product segments are organized by the end markets they support and include: (1) Mobile, Computing, Consumer and Communication (MCCC), (2) Power Conversion, Industrial and Automotive (PCIA). Our third reportable segment is Standard Discrete and Standard Linear (SDT), which contains a wide array of mature, standard products.
We develop a wide range of power and signal path products that are primarily focused on enabling greater energy efficiency in industrial, appliance, cloud computing, and automotive applications. The mobile applications market including smart phones and tablets are also a key area of product design for us. We invest in wafer fabrication and packaging technology to support the development of these innovative products. In 2013, we opened our new 8 inch wafer fabrication site in Bucheon, Korea and expect to gradually load this plant with a combination of new products and existing devices transferred from older, less efficient factories.
Mobile, Computing, Consumer and Communication (MCCC)
We design, manufacture and market high-performance analog components, mixed signal integrated circuits, and low voltage power MOSFETs for mobile, consumer, computing, and communication applications. We have a leadership position in the power MOSFET market with our portfolio of PowerTrench® technology products. Our analog and mixed signal products are focused on the mobile endmarkets and are the primary growth engine for the MCCC group.
3
Table of Contents
We offer analog and mixed signal devices in a number of proprietary part types with an emphasis on serving the mobile market. The development of proprietary parts is largely driven by evolving end-system requirements such as extending battery life, improving audio quality, and USB connections. The drive for more features and capabilities in smart phones drives the demand for higher performance of our products in the smallest form factor possible. Major competitors include Analog Devices, Inc., Linear Technology Corporation, Maxim Integrated Products, Inc., Micrel Inc, ON Semiconductor Corporation, ST Microelectronics N.V., Intersil Corporation, International Rectifier Corporation, Infineon Technologies AG, and Texas Instruments Incorporated.
Analog products monitor, interpret, and control continuously variable functions such as light, color, sound, and energy. Frequently, they form the interface with the digital world. We provide a wide range of analog products that perform such tasks as voltage regulation, audio amplification, power and signal switching and system management. Analog voltage regulation circuits are used to provide constant voltages as well as step up or step down voltage levels on a circuit board. These products enable improvements in power efficiency, lighting management, and improve charge times in ultraportable products. These products are used in a variety of mobile, computing, communications, and consumer applications.
In addition to the power analog and interface products we also offer signal path products. These include analog and digital switches, USB switches, video filters and high performance audio amplifiers. The analog switch functions are typically found in cellular handsets and other ultra portable applications. The video products provide a single chip solution to video filtering and amplification. Video filtering applications include set top boxes and digital televisions.
We believe our analog and mixed signal product portfolio is further enhanced by a broad offering of packaging solutions that we have developed. These solutions include surface mount devices, tiny packages, chip scale packages, and leadless carriers.
We also design, manufacture, and market power semiconductor solutions for computing, communications, mobile, consumer and industrial applications. Power semiconductor solutions include power discrete MOSFETs, analog integrated circuits, and fully integrated multi-chip and monolithic power solutions.
Our power MOSFETs are primarily used in power delivery and power control applications. Power delivery and control applications are ubiquitous across computing, mobile, consumer electronic and communication infrastructure markets. We produce advanced low voltage and medium voltage MOSFETs under our PowerTrench® brands. Examples of applications where our advanced power MOSFETs are used include smartphones, tablets, notebook PCs, high performance gaming, home entertainment systems, servers, data communication, and routers where our products enable efficient power delivery. This enables longer battery life, lower power consumption and better thermal performance of our customers products.
Power Conversion, Industrial and Automotive (PCIA)
We design, manufacture and market power discrete semiconductors, analog and mixed signal integrated circuits (ICs) and multi-chip smart power modules for broad power conversion/power management, industrial, and automotive applications. Our power solutions typically convert a semi-regulated energy source (AC—alternating current or DC—direct current) to a regulated output for electronic systems (AC-DC, DC-AC, and DC-DC conversion). Our discrete devices are individual diodes or transistors that perform power switching, power conditioning and signal amplification functions in electronic circuits. Our analog and mixed signal ICs are used to control discrete semiconductors in applications such as power switching, conditioning, signal amplification, power distribution, and power consumption. Driving the demand and growth of our business is the increasing need for higher efficiency and higher power density for space savings. We are also seeing strong demand for our solutions which reduce the consumption of power when electronic devices are in standby mode. We manufacture discrete products using state of the art vertical Diffusion Metal Oxide Semiconductor (DMOS) MOSFETs, Insulated Gate Bipolar Transistors (IGBT), Bipolar and ultrafast rectifier technologies. We manufacture analog and mixed signal ICs using a variety of bipolar (Bi), complementary metal oxide (CMOS), BiCMOS, and
4
Table of Contents
bipolar/CMOS/DMOS (BCDMOS) state of the art processes up to 1200V and down to 0.35µm (microns) minimum geometry. Major competitors include Infineon Technologies AG, ST Microelectronics N.V., International Rectifier Corporation, Toshiba Corporation, Mitsubishi Corporation, Texas Instruments Incorporated, Power Integrations, Inc., ON Semiconductor Corporation, NXP Semiconductors N.V., Alpha & Omega Semiconductor, Ltd. and Vishay Intertechnology, Inc.
Power MOSFETs are used in applications to switch, shape or transfer energy. These products are used in a variety of high-growth applications including solar inverters, uninterruptible power supplies (UPS), data centers & communications, motors, lighting, automotive, computing, displays, and industrial supplies. We produce advanced power MOSFETs under our SupreMOS®, SuperFET®, PowerTrench®, UniFET™ and QFET® brands. MOSFETs enable various end applications to achieve their design needs and efficiency goals.
IGBTs are high-voltage power discrete devices. They are used in switching applications for solar inverters, UPS, data centers & communications, motors, power supplies, displays, TVs, and automotive ignition systems. These applications require lower switching frequencies, higher power, and/or higher voltages than a power MOSFET can provide. We are a leading supplier of IGBTs. We have developed various planar and trench IGBT technologies for these applications.
Rectifier products work with IGBTs and MOSFETs in many applications to provide power conversion and conditioning. Our premier product is the STEALTH™ rectifier, providing industry leading performance and efficiencies in data communications, industrial power supply, displays, TVs, and motor applications.
Leveraging our power MOSFET and IGBT technologies, we also design and manufacture modules for the industrial, automotive, and home appliance end markets which are growing with the worldwide need to improve efficiency, increase power density, and conserve energy.
We design and develop a line of proprietary, high-performance SPM® brand smart power module products targeted at various end applications in consumer white goods and industrial applications: room air conditioners, industrial power supplies, solar inverters, pumps, and industrial motors. These are multi-chip modules containing up to 28 components in a single package that includes diodes, power discrete IGBTs or MOSFETs, high voltage power management driver ICs, and current and temperature sensors. Similar modules, called Automotive Power Modules (APMs), are used in automotive applications. These innovative products provide customers with a fully integrated power management solution designed to increase power efficiency, power density, system reliability, system functionality, and reduce engineering development time.
We sell custom and standard analog and mixed signal ICs to enable management of power systems. We design and manufacture power management semiconductors for line-powered and off-line powered systems that integrate or complement our Power MOSFETs to simplify engineering challenges to increase efficiency, increase power density for space savings, and reduce energy consumption. The integration improves system reliability by reducing the total number of components, while offering comparable robustness. We sell and market off-line and isolated DC-DC ICs, MOSFET and IGBT gate driver ICs, and power factor correction ICs to the consumer, computing, display, TV, lighting, and industrial markets.
Off-line and isolated DC to DC IC products address power conversion from less than one watt output up to 1 kilowatt. The solutions target circuit board space saving by improving overall system efficiency and reducing the total number of components. Additionally, our devices help the designer conserve system power. These products primarily target the high volume consumer and computing markets with a smaller percentage aimed towards the lower volume, diversified industrial markets.
MOSFET and IGBT Gate Driver IC products complement our off-line and isolated DC to DC, power MOSFETs, and IGBTs for applications from less than one hundred watts output to greater than 2 kilowatts. These gate drivers are often required for higher power MOSFET and IGBT applications where there is a need for higher efficiency, additional system functionality, and reduced design complexity.
5
Table of Contents
Power Factor Correction (PFC) ICs complement our off-line and isolated DC to DC, power MOSFETs, rectifiers, and IGBTs for applications from less than one hundred watts output to 2 kilowatts. Undesired by-products of electronic equipment include inefficient power usage from an AC source, higher AC noise and undesired harmonics. PFC ICs are needed to improve the power efficiency and to lower noise or harmonics to government and industry mandated levels.
Optoelectronics covers a wide range of semiconductor devices that emit and sense both visible and infrared light. We participate in the optocoupler segment of the optoelectronics market. Optocouplers incorporate infrared emitter and detector combinations in a single package. These products are used to transmit signals between two electronic circuits while maintaining a safe electrical isolation between them. Major applications for these devices include power supplies, UPS, solar inverters, motor controls and power modules & industrial control system. Our focus in optoelectronics is aligned with our power management business, as these products are used extensively in power supplies and AC to DC power conversion applications. Major competitors for this business include Avago Technologies Ltd., Vishay Intertechnology, Inc and Liteon, Inc.
Standard Products (SDT)
SDT combines the management of mature and multiple market products which provide generic solutions from the product lines discussed below.
Standard Diodes and Transistors products cover a wide range of semiconductor products including: MOSFET, junction field effect transistors (JFETs), high power bipolar, discrete small signal transistors, TVS, Zeners, rectifiers, bridge rectifiers, Schottky devices and diodes. Our parts can be found in almost every circuit with our portfolio focus geared towards meeting the needs of general power switching, power conditioning, circuit protection, and signal amplification functions in electronic circuits of computing, industrial, mobile, ultraportable, and consumer markets. The portfolio is enhanced with single and multichip solutions in industry leading small packages that add value with performance and minimal footprint on the PCB. Major competitors include International Rectifier Corporation, Diodes Incorporated, NXP Semiconductors N.V., ST Microelectronics N.V., ON Semiconductor Corporation and Vishay Intertechnology, Inc.
We design, manufacture and market analog integrated circuits for computing, consumer, communications, ultra-portable and industrial applications. These products are manufactured using bipolar, CMOS and BiCMOS technologies. Standard Linear solutions range from bipolar regulators, shunt regulators, low drop out regulators, standard op-amp/comparators, low voltage op-amps, and others. Analog voltage regulator circuits are used to provide constant voltages as well as to step up or step down voltage levels on a circuit board. Op-amps/comparators are designed specifically to operate from a single power supply over a wide range of voltages. We also offer low-voltage op-amps that provide a combination of low power, rail-to-rail performance, low voltage operation, and tiny package options which are well suited for use in personal electronics equipment.
There is continued growth for analog solutions as digital solutions require a bridge between real world signals and digital signals. Our product portfolio is further enhanced by a broad offering of packaging solutions that we have developed. These solutions include surface mount devices, tiny packages and leadless carriers. Major competitors include ST Microelectronics N.V., ON Semiconductor Corporation and Texas Instruments Incorporated.
Infrared products consist of a variety of surface mount and thru-hole Sensors, Detectors and Emitters typically used in most major market segments with telecom and industrial applications presenting the largest opportunities. Historically our focus has been on customized solutions specializing in alignment and media sensing as well as industrial/medical applications. Key competitors are: Vishay Intertechnology, Inc, Osram Opto Semiconductors, OPTEK Technology, OMRON Corporation, Avago Technologies Ltd., and Kodenshi Corp.
6
Table of Contents
Sales, Marketing and Distribution
For the year ended December 29, 2013, Samsung Electronics was our largest customer and accounted for more than 10% of our net revenue. In 2013 we derived approximately 61%, 32% and 7% of our net sales from distributors, original equipment manufacturers (OEMs), and electronic design and manufacturing services (EMS) customers, respectively, through our regional sales organizations. We operate regional sales organizations in Europe, with principal offices in Munich, Germany; the Americas, with principal offices in San Jose, CA; the Asia/Pacific region (which for these purposes excludes Japan and South Korea), with principal offices in Hong Kong; Japan, with principal offices in Tokyo; and South Korea, with principal offices in Seoul. A discussion of revenue by geographic region for each of the last three years can be found in Item 8, Note 17 of this report. Each of the regional sales organizations is supported by the supply chain organization, which manages independently operated warehouses. Product orders flow to our manufacturing facilities, where products are made. Products are then shipped either directly to customers or indirectly to customers through warehouses that are owned and operated by us or by a third party provider.
We have dedicated direct sales organizations operating in Europe, the Americas, the Asia/Pacific region, Japan and Korea that serve our major original equipment manufacturer and electronic design and manufacturing services customers. We also have a large network of distributors and independent manufacturer’s representatives to distribute and sell our products around the world. We believe that using a combination of our highly focused, direct sales force selling products for all of our businesses, combined with an extensive network of distributors and manufacturer’s representatives, is the most efficient way to serve our multi-market customer base. Our dedicated marketing organization consists of a central marketing group that coordinates marketing, advertising, and media activities for all products within the company. Additionally, product line marketing specifically focuses on tactical and strategic marketing for their product and application focus, and marketing personnel located in each of the sales regions provides regional direction and support for products and end applications as applicable for their region.
Typically, distributors handle a wide variety of products and fill orders for many customers. Some of our sales to distributors are made under agreements allowing for market price fluctuations and the right of return on unsold merchandise, subject to time and volume limitations. Many of these distribution agreements contain a standard stock rotation provision allowing for maximum levels of inventory returns. In our experience, these inventory returns can usually be resold, although often at a discount. Manufacturer’s representatives generally do not offer products that compete directly with our products, but may carry complementary items manufactured by others. Manufacturer’s representatives, who are compensated on a commission basis, do not maintain a product inventory; instead, their customers place larger quantity orders directly with us and are referred to distributors for smaller orders.
Research and Development
Our expenditures for research and development for 2013, 2012 and 2011 were $171.6 million, $156.9 million and $153.4 million, respectively. These expenditures represented 12.2%, 11.2%, and 9.7% of sales for 2013, 2012 and 2011, respectively. Advanced silicon processing technology is a key determinant in the improvement of semiconductor products. Each new generation of process technology has resulted in products with higher speed, higher power density and greater performance, produced at lower cost. We expect infrastructure investments made in recent years to enable us to continue to achieve high volume, high reliability and low-cost production using leading edge process technology for our classes of products. Our R&D efforts continue to be focused in part on innovative packaging solutions that make use of new assembly methods and high performance packaging materials, as well as in exclusive and patent protected transistor structure development. We are also using our R&D resources to characterize and apply new materials in both our packaging and semiconductor device processing efforts.
Each of our product groups maintains independent product, process and package research and development organizations, which work closely with our manufacturing groups to bring new technologies to market. These
7
Table of Contents
groups are located throughout the world in our factories and research centers. We work closely with our major customers in many research and development situations in order to increase the likelihood that our products will be designed directly into customers’ products and achieve rapid and lasting market acceptance.
Manufacturing
We operate seven manufacturing facilities, four of which are “front-end” wafer fabrication plants in the U.S. and South Korea, and three of which are “back-end” assembly and test facilities in Asia. Information about our property, plant and equipment by geographic region for each of the last three years can be found in Item 8, Note 17 of this report.
Our products are manufactured and designed using a broad range of manufacturing processes and certain proprietary design methods. We use all of the prevalent function-oriented process technologies for wafer fabrication, including CMOS, Bipolar, BiCMOS, and DMOS. We use primarily mature through-hole and advanced surface mount technologies in our assembly and test operations. We have fully implemented a lead free packaging initiative and all products currently manufactured use a lead free finish in full compliance with RoHS industry environmental requirements.
8
Table of Contents
The table below provides information about our manufacturing facilities and products.
Manufacturing Facilities
| Location |
Products | |
| Front-End Facilities: |
||
| Mountaintop, Pennsylvania |
Discrete Power Semiconductors | |
| South Portland, Maine |
Analog Switches, USB, Interface SerDes, Converters, Logic Gates, Buffers, Counters, Opto Detectors, Ground Fault Interrupters, Power Management ICs | |
| West Jordan, Utah |
Discrete Power Semiconductors | |
| Bucheon, South Korea |
Discrete Power Semiconductors, Standard Analog Integrated Circuits, Power Management ICs | |
| Back-End Facilities: |
||
| Penang, Malaysia |
Power Management ICs (AC-DC, Isolated DC-DC, Non-isolated DC-DC, Power Drivers, Supervisory/ Monitor ICs, Voltage Regulators, Pulse width Modulation, Rectifiers) Power Semiconductors (Integrated Power Solutions, MOSFETs, Transistors) Automotive Products (Automotive ICs and Drivers, Discrete Power Semiconductors) Signal Path Products ( Logic, Switching and interface solution, Video filter, Class -G audio amplifier) | |
| Cebu, Philippines |
Power Management ICs (Isolated DC-DC) Power Semiconductors (Diodes & Rectifiers, IGBTs, Integrated Power Solutions, MOSFETs, Transistors) Logic Products Signal Path Products (Switches) Optoelectronics (micro-couplers) Automotive products (Discrete Power) | |
| Suzhou, China |
Power Semiconductors (Diodes & Rectifiers, IGBTs, Integrated Power Solutions (SPM), MOSFETs, Transistors) Power Management ICs (AC-DC: PWM (Combo) Controllers) Automotive Products (Automotive Modules, Discrete Power Semiconductors, Intelligent Power Semiconductors) | |
We subcontract a minority portion of our wafer fabrication needs, primarily to Taiwan Semiconductor Manufacturing Company, Macronix International Co. Ltd., Phenitec Semiconductor, Showa Denko Singapore (PTE) Ltd, and CSMC Manufacturing Company. In order to maximize our production capacity, some of our back-end assembly and testing operations are also subcontracted. Primary back-end subcontractors include, Liteon Inc, Hana Microelectronics Ltd, AUK Semiconductor PTE, Ltd, Taiwan Semiconductor Co. Ltd, and Panjit International Inc.
Our manufacturing processes use many raw materials, including silicon wafers, gold, copper and aluminum wire, Alloy 42/Copper lead frames, mold compound, ceramic and other substrate material and some chemicals and gases. We obtain our raw materials and supplies from a large number of sources.
9
Table of Contents
Backlog
Backlog at December 29, 2013 was approximately $371 million, down from approximately $458 million at December 30, 2012. We define backlog as firm orders or customer-provided forecasts with a customer requested delivery date within 26 weeks. In periods of depressed demand, customers tend to rely on shorter lead times. In periods of increased demand, there is a tendency towards longer lead times which has the effect of increasing backlog and, in some instances we may not have manufacturing capacity sufficient to fulfill all orders. Some of our products are currently in a period of decreased demand. Additionally, backlog is impacted by our manufacturing lead times, which have decreased on average from December 30, 2012 to December 29, 2013. As is customary in the semiconductor industry, we may allow our customers to cancel orders or delay deliveries within agreed upon parameters. Accordingly, our backlog at any time should not be used as an indication of future revenues. For further information on our backlog, see Risk Factors under the heading “We maintain a backlog of customer orders that is subject to cancellation, reduction or delay in delivery schedules, which may result in lower than expected revenues”.
Seasonality
Overall, our sales are closely linked to semiconductor and related electronics industry supply chain and channel inventory trends. We typically experience sequentially lower sales in our first and fourth quarters, with sales reaching a seasonal peak in the second or third quarter. However, economic events and the cyclical nature of the industry can alter these quarterly fluctuations.
Competition
Markets for our products are highly competitive. Although only a few companies compete with us in all of our product lines, we face significant competition within each of our product lines from major international semiconductor companies. Some of our competitors may have substantially greater financial and other resources with which to pursue engineering, manufacturing, marketing and distribution of their products. Competitors include manufacturers of standard semiconductors, application-specific integrated circuits and fully customized integrated circuits.
We compete in different product lines to various degrees on the basis of price, technical performance, product features, product system compatibility, customized design, availability, quality and sales and technical support. Our ability to compete successfully depends on elements both within and outside of our control, including successful and timely development of new products and manufacturing processes, product performance and quality, manufacturing yields and product availability, capacity availability, customer service, pricing, industry trends and general economic trends.
Trademarks and Patents
As of December 29, 2013, we held 1,523 issued U.S. patents and 1,652 issued non-U.S. patents with expiration dates ranging from 2013 through 2033. We also have trademarks that are used in the conduct of our business to distinguish genuine Fairchild products. We believe that while our patents may provide some advantage, our competitive position is largely determined by such factors as system and application knowledge, ability and experience of our personnel, the range and number of new products being developed by us, our market brand recognition, ongoing sales and marketing efforts, customer service, technical support and our manufacturing capabilities.
It is generally our policy to seek patent protection for significant inventions that may be patented, though we may elect, in certain cases, not to seek patent protection even for significant inventions, if other protection, such as maintaining the invention as a trade secret, is considered more advantageous. Also, the laws of countries in which we design, manufacture and market our products may afford little or no effective protection of our proprietary technology.
10
Table of Contents
Environmental Matters
Our operations are subject to environmental laws and regulations in the countries in which we operate that regulate, among other things, air and water emissions and discharges at or from our manufacturing facilities; the generation, storage, treatment, transportation and disposal of hazardous materials by our company; the investigation and remediation of environmental contamination; and the release of hazardous materials into the environment at or from properties operated by our company and at other sites. As with other companies engaged in like businesses, the nature of our operations exposes our company to the risk of liabilities and claims, regardless of fault, with respect to such matters, including personal injury claims and civil and criminal fines.
Our facilities in South Portland, Maine, and, to a lesser extent, West Jordan, Utah, have ongoing remediation projects to respond to releases of hazardous materials that occurred prior to our separation from National Semiconductor Corporation. National Semiconductor has agreed to indemnify Fairchild for the future costs of these projects and other environmental liabilities that existed at the time of our acquisition of those facilities from National Semiconductor in 1997. The terms of the indemnification are without time limit and without maximum amount. The costs incurred to respond to these conditions were not material to the consolidated financial statements for any period presented. National Semiconductor Corporation was acquired by Texas Instruments Incorporated during the fourth quarter of 2011.
Although we believe that our Bucheon, South Korea operations, which we acquired in 1999 from Samsung Electronics, have no significant environmental liabilities, Samsung Electronics agreed to indemnify us for remediation costs and other liabilities related to historical contamination, up to $150 million, arising out of the business we acquired, including the Bucheon facilities. We are unable to estimate the potential amounts of future payments, if any; however, we do not expect any future payments to have a material impact on our earnings or financial condition.
We believe that our operations are in substantial compliance with applicable environmental laws and regulations. Our costs to comply with environmental regulations were nominal for 2013, 2012 and 2011. Future laws or regulations and changes in existing environmental laws or regulations, however, may subject our operations to different, additional or more stringent standards. While historically the cost of compliance with environmental laws has not had a material adverse effect on our results of operations, business or financial condition, we cannot predict with certainty our future costs of compliance because of changing standards and requirements.
Employees
Our worldwide workforce consisted of 8,659 full and part-time employees as of December 29, 2013. We believe that our relations with our employees are satisfactory.
At December 29, 2013, 95 employees at our Mountain Top, Pa., manufacturing facility, were covered by a collective bargaining agreement. These employees are members of the Communication Workers of America/International Union of Electronic, Electrical, Salaried Machine and Furniture Workers, AFL-CIO, Local 88177. The current agreement with the union ends June 1, 2015 and provides for guaranteed wage and benefit levels as well as employment security for union members. If a work stoppage were to occur, it could impact our ability to operate our Mountain Top facility. Also, our profitability could be adversely affected if increased costs associated with any future contracts are not recoverable through productivity improvements or price increases. We believe that relations with our unionized employees are satisfactory.
Our wholly owned Korean subsidiary, which we refer to as Fairchild Korea, sponsors a Korean Labor Council consisting of seven representatives from the non-management workforce and seven members of the management workforce. The Labor Council, under Korean law, is recognized as a representative of the workforce for the purposes of consultation and cooperation. The Labor Council has no right to take a work action or to strike and is not party to any labor or collective bargaining agreements with Fairchild Korea. We believe that relations with Fairchild Korea employees and the Labor Council are satisfactory.
11
Table of Contents
On November 26, 2010, the employees in our facility in Suzhou, China approved the creation of a labor union that was officially established on January 26, 2011 under applicable local law. While the All China Federal Trade Union (ACFTU) has indicated its desire that local unions should work towards the goal of executing collective bargaining agreements at companies that have established labor unions, there is currently no collective bargaining agreement between the company and the employees in Suzhou.
Executive Officers
The following table provides information about the executive officers of our company. There is no family relationship among any of the named executive officers.
| Name |
Age | Title | ||||
| Mark S. Thompson |
57 | Chairman of the Board of Directors and Chief Executive Officer | ||||
| Vijay Ullal |
55 | President and Chief Operating Officer | ||||
| Mark S. Frey |
60 | Executive Vice President, Chief Financial Officer and Treasurer | ||||
| Paul D. Delva |
51 | Senior Vice President, General Counsel and Corporate Secretary | ||||
| Kevin B. London |
56 | Senior Vice President, Human Resources and Administration | ||||
Available Information
We file annual, quarterly and special reports, proxy statements and other information with the Securities and Exchange Commission (SEC). You may read and copy any reports, statements and other information we file at the SEC’s Public Reference Room at 100 F Street, N.E., Washington, D.C. 20549. Please call (800) SEC-0330 for further information on the Public Reference Room. The SEC maintains an Internet web site that contains reports, proxy and information statements and other information regarding issuers that file electronically with the SEC. Our filings are also available to the public at the web site maintained by the SEC, http://www.sec.gov.
The address for our company website is http://www.fairchildsemi.com. We make available, free of charge, through our investor relations web site, our reports on Forms 10-K, 10-Q and 8-K, amendments to those reports, and other SEC filings, as soon as reasonably practicable after they are filed with the SEC. The address for our investor relations web site is http://investor.fairchildsemi.com (click on “All SEC filings”).
We also make available, free of charge, through our corporate governance website, our corporate charter, bylaws, corporate governance guidelines, charters of the committees of our board of directors, code of business conduct and ethics and other information and materials, including information about how to contact our board of directors, its committees and their members. To find this information and materials, visit our corporate governance website at http://governance.fairchildsemi.com.
| ITEM 1A. | RISK FACTORS |
A description of the risk factors associated with our business is set forth below. The risks described below are not the only ones facing us. Additional risks not currently known to us or that we currently believe are immaterial also may impair our business operations and financial condition.
The price of our common stock has fluctuated widely in the past and may fluctuate widely in the future.
Our common stock is traded on the NASDAQ Stock Market and its price has fluctuated significantly in recent years. Additionally, our stock has experienced and may continue to experience significant price and volume fluctuations that could adversely affect its market price without regard to our operating performance. We believe that factors such as quarterly fluctuations in financial results, earnings below analysts’ estimates and financial performance and other activities of other publicly traded companies in the semiconductor industry could
12
Table of Contents
cause the price of our common stock to fluctuate substantially. In addition, our common stock, the stock market in general and the market for shares of semiconductor industry-related stocks in particular have experienced extreme price fluctuations which have often been unrelated to the operating performance of the affected companies. Similar fluctuations in the future could adversely affect the market price of our common stock.
We maintain a backlog of customer orders that is subject to cancellation, reduction or delay in delivery schedules, which may result in lower than expected revenues.
We manufacture products primarily pursuant to purchase orders for current delivery or to forecast, rather than pursuant to long-term supply contracts. The semiconductor industry is occasionally subject to double booking and rapid changes in customer outlooks or unexpected build ups of inventory in the supply channel as a result of shifts in end market demand and macro economic conditions. Accordingly, many of these purchase orders or forecasts may be revised or canceled without penalty. As a result, we must commit resources to the manufacture of products without binding purchase commitments from customers. Even in cases where our standard terms and conditions of sale or other contractual arrangements do not permit a customer to cancel an order without penalty, we may from time to time accept cancellations to maintain customer relationships or because of industry practice, custom or other factors. Our inability to sell products after we devote significant resources to them could have a material adverse effect on both our levels of inventory and revenues. Additionally, fluctuations in demand may cause our inventories to increase or decrease more than we have anticipated. While we currently believe our inventory levels are appropriate for the current economic environment, continued global economic uncertainty may result in lower than expected demand. When we anticipate increasing demand in our markets, lower than anticipated demand may impact our customers’ target inventory levels. While we focused on reducing channel inventories during 2013; our current business forecasting is still qualified by the risk that our backlog may deteriorate as a result of customer cancellations.
Downturns in the highly cyclical semiconductor industry or changes in end user market demands could reduce the profitability and overall value of our business, which could cause the trading price of our stock to decline or have other adverse effects on our financial position.
The semiconductor industry is highly cyclical, and the value of our business may decline as a result of market response to this cyclicality. As we have experienced in the past, uncertainty in global economic conditions may continue to negatively affect us and the rest of the semiconductor industry, by causing us to experience backlog cancellations, higher inventory levels and reduced demand for our products. We may experience renewed, possibly severe and prolonged, downturns in the future as a result of this cyclicality. Even as demand increases following such downturns, our profitability may not increase because of price competition and supply shortages that historically accompany recoveries in demand. In addition, we may experience significant fluctuations in our profitability as a result of variations in sales, product mix, end user markets, the costs associated with the introduction of new products, and our efforts to reduce excess inventories that may have built up as a result of any of these factors. The markets for our products depend on continued demand for consumer electronics such as personal computers, cellular telephones, tablet devices, digital cameras, and automotive, household and industrial goods. Deteriorating global economic conditions may cause these end user markets to experience decreases in demand that could adversely affect our business and future prospects.
Our failure to execute on our cost reduction initiatives and the impact of such initiatives could adversely affect our business.
We continue to implement cost reduction initiatives to keep pace with the evolving economic and competitive conditions. These actions include closing our four-inch manufacturing line in South Korea and converting to eight-inch wafers in Bucheon, South Korea and South Portland, Maine. Additionally, we initiated several insourcing programs to replace higher-cost outside subcontractors with internal manufacturing, we lowered our materials costs and implemented workforce reductions in an effort to simplify operations, improve productivity and reduce costs.
13
Table of Contents
We cannot guarantee that we will successfully implement any of these actions, or if these actions and other actions we may take will help reduce costs. Because restructuring activities involve changes to many aspects of our business, the cost reductions could adversely impact productivity and sales to an extent we have not anticipated. Even if we fully execute and implement these activities and they generate the anticipated cost savings, there may be other unforeseeable and unintended factors or consequences that could adversely impact our profitability and business.
We may not be able to develop new products to satisfy changing customer demands or we may develop the wrong products.
Our success is largely dependent upon our ability to innovate and create revenues from new product introductions. Failure to develop new technologies, or react to changes in existing technologies, could materially delay development of new products and lead to decreased revenues and a loss of market share to our competitors. The semiconductor industry is characterized by rapidly changing technologies and industry standards, together with frequent new product introductions. Our financial performance depends on our ability to identify important new technology advances and to design, develop, manufacture, assemble, test, market and support new products and enhancements on a timely and cost-effective basis. While new products often command higher prices and higher profit margins, we may not successfully identify new product opportunities and develop and bring new products to market or succeed in selling them for use in new customer applications in a timely and cost-effective manner. Products or technologies developed by other companies may render our products or technologies obsolete or noncompetitive. Many of our competitors are larger and more established companies with greater engineering and research and development resources than us. If we fail to identify a fundamental shift in technologies or in our product markets such failure could have material adverse effects on our competitive position within the industry. In addition, to remain competitive, we must continue our efforts to reduce die sizes, develop new packages and improve manufacturing yields. We cannot assure you that we can accomplish these goals.
If some original equipment manufacturers do not design our products into their equipment, our revenue may be adversely affected.
We depend on our ability to have original equipment manufacturers (OEMs), or their contract manufacturers, choose our products. Frequently, an OEM will incorporate or specifically design our products into the products it produces. In such cases the OEM may identify our products, with the products of a limited number of other vendors, as approved for use in particular OEM applications. Without “design wins,” we may only be able to sell our products to customers as a secondary source, if at all. If an OEM designs another supplier’s product into one of its applications, it is more difficult for us to achieve future design wins for that application because changing suppliers involves significant cost, time, effort and risk for the OEM. Even if a customer designs in our products, we are not guaranteed to receive future sales from that customer. We may be unable to achieve these “design wins” because of competition or a product’s functionality, size, electrical characteristics or other aspect of its design or price. Additionally, we may be unable to service expected demand from the customer. In addition, achieving a design win with a customer does not ensure that we will receive significant revenue from that customer and we may be unable to convert design into actual sales.
We depend on demand from the consumer, original equipment manufacturer, contract manufacturing, industrial, automotive and other markets we serve for the end market applications which incorporate our products. Reduced consumer or corporate spending due to increased energy and commodity prices or other economic factors could affect our revenues.
If we provide revenue, margin or earnings per share guidance, it is generally based on certain assumptions we make concerning the health of the overall economy and our projections of future consumer and corporate spending. If our projections of these expenditures are inaccurate or based upon erroneous assumptions, our revenues, margins and earnings per share could be adversely affected. For example, reduced demand for
14
Table of Contents
automobiles and appliances reduced our revenue during 2011 and 2012 while weakness in the high-end smart phone market negatively impacted earnings in 2013. We cannot be certain that a change in macroeconomic conditions will not have an adverse effect on our business.
We have lengthy product development cycles that may cause us to incur significant expenses without realizing meaningful sales, the occurrence of which would harm our business.
Designing and manufacturing semiconductors is a long process that requires the investment of significant resources with no guarantee that the process will ultimately result in sales to customers. In 2013 and in prior years, we have made significant investments in new product designs and technologies. The lengthy front end of our development cycle creates a risk that we may incur significant expenses which we are unable to offset with meaningful sales. Additionally, customers may decide to cancel their products or change production specifications, which may require us to modify product specifications and further increase our cost of production. Failure to meet such specifications may also delay the launch of our products or result in lost sales.
Research and development investments may not yield profitable or commercially viable products and thus will not necessarily result in increases in our revenues.
We invest significant resources in our research and development. In 2013 alone, we invested $171.6 million in research and development. Despite such efforts, we may not be successful in developing commercially viable products. Additionally, there is a substantial risk that we may decide to abandon a potential product that is no longer marketable, despite our investment or significant resources in its development.
Our failure to protect our intellectual property rights could adversely affect our future performance and growth.
Failure to protect our intellectual property rights may result in the loss of valuable technologies. We rely on patent, trade secret, trademark and copyright law to protect such technologies. These laws are subject to legislative and regulatory change or through changes in court interpretations of those laws and regulations. For example, there have been recent developments in the laws and regulations governing the issuance and assertion of patents in the U.S., including modifications to the rules governing patent prosecution. There have also been court rulings on the issues of willfulness, obviousness and injunctions, that may affect our ability to obtain patents and/or enforce our patents against others. Some of our technologies are not covered by any patent or patent application. With respect to our intellectual property generally, we cannot assure you that:
| • | the patents owned by us or numerous other patents which third parties license to us will not be invalidated, circumvented, challenged or licensed to other companies; or |
| • | any of our pending or future patent applications will be issued within the scope of the claims sought by us, if at all. |
In addition, effective patent, trademark, copyright and trade secret protection may be unavailable, limited or not applied for in some countries. We cannot assure that we will be able to effectively enforce our intellectual property rights in every country in which our products are sold or manufactured.
We also seek to protect our proprietary technologies, including technologies that may not be patented or patentable, in part by confidentiality agreements and, if applicable, inventors’ rights agreements with our collaborators, advisors, employees and consultants. We cannot assure you that these agreements will not be breached, that we will have adequate remedies for any breach or that such persons or institutions will not assert rights to intellectual property arising out of such research. We have non-exclusive licenses to some of our technology from National Semiconductor, Infineon, Samsung Electronics and other companies. These companies may license such technologies to others, including our competitors or may compete with us directly. In addition, National Semiconductor and Infineon have limited royalty-free, worldwide license rights to some of our
15
Table of Contents
technologies. National Semiconductor was purchased by Texas Instruments in 2011. If necessary or desirable, we may seek licenses under patents or intellectual property rights claimed by others. However, we cannot assure you that we will obtain such licenses or that the terms of any offered licenses will be acceptable to us. The failure to obtain a license from a third party for technologies we use could cause us to incur substantial liabilities and to suspend the manufacture or shipment of products or our use of processes requiring the technologies.
Our failure to obtain or maintain the right to use some technologies may negatively affect our financial results.
Our future success and competitive position depend in part upon our ability to obtain or maintain proprietary technologies used in our principal products. From time to time we are required to defend against claims by competitors and others of intellectual property infringement. Claims of intellectual property infringement and litigation regarding patent and other intellectual property rights are commonplace in the semiconductor industry and are frequently time consuming and costly. From time to time, we may be notified of claims that we may be infringing patents issued to other companies. Such claims may relate both to products and manufacturing processes. We may engage in license negotiations regarding these claims from time to time. Even though we maintain procedures to avoid infringing others’ rights as part of our product and process development efforts, it is impossible to be aware of every possible patent which our products may infringe, and we cannot assure you that we will be successful in our efforts to avoid infringement claims. Furthermore, even if we conclude our products do not infringe another’s patents, others may not agree. We have been and are involved in lawsuits, and could become subject to other lawsuits, in which it is alleged that we have infringed upon the patent or other intellectual property rights of other companies. For example, since October 2004, we have been in litigation with Power Integrations, Inc. See Item 3, Legal Proceedings. Our involvement in this litigation and future intellectual property litigation, or the costs of avoiding or settling litigation by purchasing licenses rights or by other means, could result in significant expense to our company, adversely affecting sales of the challenged products or technologies and diverting the efforts and attention of our technical and management personnel, whether or not such litigation is resolved in our favor. We may decide to settle patent infringement claims or litigation by purchasing license rights from the claimant, even if we believe we are not infringing, in order to reduce the expense of continuing the dispute or because we are not sufficiently confident that we would eventually prevail. In the event of an adverse outcome as a defendant in any such litigation, we may be required to:
| • | pay substantial damages; |
| • | indemnify our customers for damages they might suffer if the products they purchase from us violate the intellectual property rights of others; |
| • | stop our manufacture, use, sale or importation of infringing products; |
| • | expend significant resources to develop or acquire non-infringing technologies; |
| • | discontinue manufacturing processes; or |
| • | obtain licenses to the intellectual property we are found to have infringed. |
We cannot assure you that we would be successful in such development or acquisition or that such licenses would be available under reasonable terms. Any such development, acquisition or license could require the expenditure of substantial time and other resources.
We may not be able to consummate future acquisitions or successfully integrate acquisitions into our business.
We have made numerous acquisitions of various sizes since we became an independent company in 1997 and we plan to pursue additional acquisitions of related businesses. The costs of acquiring and integrating related businesses, or our failure to integrate them successfully into our existing businesses, could result in our company incurring unanticipated expenses and losses. In addition, we may not be able to identify or finance additional acquisitions or realize any anticipated benefits from acquisitions we do complete.
16
Table of Contents
We are constantly evaluating acquisition opportunities and consolidation possibilities and are frequently conducting due diligence or holding preliminary discussions with respect to possible acquisition transactions, some of which could be significant.
If we acquire another business, the process of integrating an acquired business into our existing operations may result in unforeseen operating difficulties and may require us to use significant financial resources on the acquisition that may otherwise be needed for the ongoing development or expansion of existing operations. Some of the risks associated with acquisitions include:
| • | unexpected losses of key employees, customers or suppliers of the acquired company; |
| • | conforming the acquired company’s standards, processes, procedures and controls with our operations; |
| • | coordinating new product and process development; |
| • | hiring additional management and other critical personnel; |
| • | inability to realize anticipated synergies; |
| • | negotiating with labor unions; and |
| • | increasing the scope, geographic diversity and complexity of our operations. |
| • | In addition, we may encounter unforeseen obstacles or costs in the integration of other businesses we acquire. |
Possible future acquisitions could result in the incurrence of additional debt, contingent liabilities and amortization expenses related to intangible assets, all of which could have a material adverse effect on our financial condition and operating results.
We may face risks associated with dispositions of assets and businesses.
From time to time we may dispose of assets and businesses in an effort to grow our more profitable product lines. When we do so, we face certain risks associated with these exit activities, including but not limited the risk that we will disrupt service to our customers, the risk of inadvertently losing other business not related to the exit activities, the risk that we will be unable to effectively continue, terminate, modify and manage supplier and vendor relationships, and the risk that we may be subject to consequential claims from customers or vendors as a result of eliminating, or transferring the production of affected products or the renegotiation of commitments related to those products.
We depend on suppliers for timely deliveries of raw materials of acceptable quality. Production time and product costs could increase if we were to lose a primary supplier or if we experience a significant increase in the prices of our raw materials. Product performance could be affected and quality issues could develop as a result of a significant degradation in the quality of raw materials we use in our products.
Our manufacturing processes use many raw materials, including silicon wafers, gold, copper lead frames, mold compound, ceramic packages and various chemicals and gases. Our manufacturing operations depend upon our ability to obtain adequate supplies of raw materials on a timely basis. Our results of operations could be adversely affected if we were unable to obtain adequate supplies of raw materials in a timely manner or if the costs of raw materials increased significantly. If the prices of these raw materials rise significantly we may be unable to pass on our increased operating expenses to our customers. This could result in decreased profit margins for the products in which the materials are used. Results could also be adversely affected if there is a significant degradation in the quality of raw materials used in our products, or if the raw materials give rise to compatibility or performance issues in our products, any of which could lead to an increase in customer returns or product warranty claims. Although we maintain rigorous quality control systems, errors or defects may arise from a supplied raw material and be beyond our detection or control. For example, some phosphorus-containing
17
Table of Contents
mold compound received from one supplier and incorporated into our products in the past resulted in a number of claims for damages from customers. We purchase some of our raw materials such as silicon wafers, lead frames, mold compound, ceramic packages and chemicals and gases from a limited number of suppliers on a just-in-time basis. From time to time, suppliers may extend lead times, limit supplies or increase prices due to capacity constraints or other factors. We subcontract a minority of our wafer fabrication needs, primarily to Taiwan Semiconductor Manufacturing Company, Advanced Semiconductor Manufacturing Corporation, Central Semiconductor Manufacturing Corporation, Jilin Magic Semiconductor, Macronix International Co. Ltd., and Phenitec Semiconductor. In order to maximize our production capacity, some of our back-end assembly and testing operations are also subcontracted. Primary back-end subcontractors include , Advance Semiconductor Engineering, Inc., AIC Semicondutor Sdn Bhd, Amkor Technology, AUK Semiconductor PTE, Ltd, GEM Services, Inc., Greatek Electronics, Inc., Hana Microelectronics Ltd, Liteon, Inc., Tak Cheong Electronics (Holdings) Co. Ltd, and United Test and Assembly Center Thai Ltd. Our operations and ability to satisfy customer obligations could be adversely affected if our relationships with these subcontractors were disrupted or terminated.
Delays in expanding capacity at existing facilities, implementing new production techniques, or incurring problems associated with technical equipment malfunctions, all could adversely affect our manufacturing efficiencies.
Our manufacturing efficiency is an important factor in determining our profitability, and we cannot assure you that we will be able to maintain or increase manufacturing efficiency to the same extent as our competitors. Our manufacturing processes are highly complex, require advanced and costly equipment and are continuously being modified in an effort to improve yields and product performance. Impurities or other difficulties in the manufacturing process can lower yields and cause defects in the final product. We are constantly looking for ways to expand capacity or improve efficiency at our manufacturing facilities. For example, we are in the process of rationalizing our global manufacturing footprint and increasing our reliance on external foundries, a process that may require us to reduce and/or transfer internal capacities into another existing internal facility or to an external foundry. As is common in the semiconductor industry, we may experience difficulty in completing the transitions. As a consequence, we have suffered delays in product deliveries or reduced yields in the past and may experience such delays again in the future.
We may experience delays or problems in bringing new manufacturing capacity to full production. Such delays, as well as possible problems in achieving acceptable yields, or product delivery delays relating to existing or planned new capacity could result from, among other things, capacity constraints, construction delays, upgrading or expanding existing facilities or changing our process technologies, any of which could result in a loss of future revenues. Our operating results could also be adversely affected by the increase in fixed costs and operating expenses related to increases in production capacity if revenues do not increase proportionately.
We depend on efficient use of our manufacturing capacity because low utilization rates could have a material adverse effect on our business, financial condition and the results of our operations.
Our ability to efficiently manage the available capacity in our fabrication facilities is a key element of our success. As a result of our high fixed costs, a reduction in capacity utilization, as well as reduced yields or unfavorable product mix, could reduce our profit margins and adversely affect our operating results. Utilization rates may be reduced by many factors including: periods of industry overcapacity, low levels of customer orders, operating inefficiencies, mechanical failures and disruption of operations due to expansion or relocation of operations, power interruptions and fire, flood or other natural disasters or calamities. Potential delays and cost increases that result from these events could have a material adverse effect on our business, financial condition and results of operations.
18
Table of Contents
We rely on subcontractors to reduce production costs and to meet manufacturing demands, which may adversely affect our results of operations.
Many of the processes we use in manufacturing our products are complex requiring, among other things, a high degree of technical skill and significant capital investment in advanced equipment. In some circumstances, we may decide that it is more cost effective to have some of these processes performed by qualified third party subcontractors. In addition, we may utilize a subcontractor to fill unexpected customer demand for a particular product or process or to guaranty supply of a particular product that may be in great demand. More significantly, as a result of the expense incurred in qualifying multiple subcontractors to perform the same function, we may designate a subcontractor as a single source for supplying a key product or service. If a single source subcontractor were to fail to meet our contractual requirements, our business could be adversely affected and we could incur production delays and customer cancellations as a result. We would also be required to qualify other subcontractors, which would be time consuming and cause us to incur additional costs. In addition, even if we qualify alternate subcontractors, those subcontractors may not be able to meet our delivery, quality or yield requirements, which could adversely affect our results of operations. In addition to these operational risks, some of these subcontractors are smaller businesses that may not have the financial ability to acquire the advanced tools and equipment necessary to fulfill our requirements. In some circumstances, we may find it necessary to provide financial support to our subcontractors in the form of advance payments, loans, loan guarantees, equipment financing and similar financial arrangements. In those situations, we could be adversely impacted if the subcontractor failed to comply with its financial obligations to us.
Compliance with new regulations regarding the use of “conflict minerals could limit the supply and increase the cost of certain metals used in manufacturing our products.
Section 1502 of the Dodd-Frank Wall Street Reform and Consumer Protection Act of 2010 (the Dodd-Frank Act), requires the SEC to promulgate new disclosure requirements for manufacturers of products containing certain minerals which are mined from the Democratic Republic of Congo and adjoining countries. These “conflict minerals” are commonly found in metals used in the manufacture of semiconductors. Manufacturers are also required to disclose their efforts to prevent the sourcing of such minerals and metals produced from them. The new disclosure rules will take effect in May of 2014, one year after the promulgation of the SEC’s final rules. The implementation of these new regulations may limit the sourcing and availability of some of the metals used in the manufacture of our products. The regulations may also reduce the number of suppliers who provide conflict-free metals, and may affect our ability to obtain products in sufficient quantities or at competitive prices. Finally, some of our customers may elect to disqualify us as a supplier if we are unable to verify that the metals used in our products are free of conflict minerals.
A significant portion of our sales are made to distributors who can terminate their relationships with us with little or no notice. The termination of a distributor could reduce sales and result in inventory returns.
Distributors accounted for 61% of our net sales for the twelve months ended December 29, 2013. We anticipate that this percentage may decrease as we begin to sell more products directly to our customers. Our top five distributors worldwide accounted for 20% of our net sales for the twelve months ended December 29, 2013. As a general rule, we do not have long-term agreements with our distributors, and they may terminate their relationships with us with little or no advance notice. Additionally, because distributors may offer competing products, certain distributors may be less inclined to sell our products as our direct sales increase. The loss of one or more of our distributors, or the decision by one or more of them to reduce the number of our products they offer or to carry the product lines of our competitors, could have a material adverse effect on our business, financial condition and results of operations. The termination of a significant distributor, whether at our or the distributor’s initiative, or a disruption in the operations of one or more of our distributors, could reduce our net sales in a given quarter and could result in an increase in inventory returns.
19
Table of Contents
The semiconductor business is very competitive, especially in the markets we serve, and increased competition could reduce the value of an investment in our company.
We participate in the standard component or “multi-market” segment of the semiconductor industry. While the semiconductor industry is generally highly competitive, the “multi-market” segment is particularly so. Our competitors offer equivalent or similar versions of many of our products, and customers may switch from our products to our competitors’ products on the basis of price, delivery terms, product performance, quality, reliability and customer service or a combination of any of these factors. Competition is especially intense in the multi-market semiconductor segment because it is relatively easy for customers to switch between suppliers of more standardized, multi-market products like ours. In the past we have experienced decreases in prices during “down” cycles in the semiconductor industry, and this may occur again as a result of the recent downturn in global economic conditions. Even in strong markets, price pressures may emerge as competitors attempt to gain a greater market share by lowering prices. We compete in a global market and our competitors are companies of various sizes in various countries around the world. Many of our competitors are larger than us and have greater financial resources available to them. As such, they tend to have a greater ability to pursue acquisition candidates and can better withstand adverse economic or market conditions. Additionally, companies with whom we do not currently compete may introduce new products that may cause them to compete with us in the future.
We may not be able to attract or retain the technical or management employees necessary to remain competitive in our industry.
Our continued success depends on our ability to attract, motivate and retain skilled personnel, including technical, marketing, management and staff personnel. In the semiconductor industry, the competition for qualified personnel, particularly experienced design engineers and other technical employees, is intense, particularly when the business cycle is improving. During such periods competitors may try to recruit our most valuable technical employees. While we devote a great deal of our attention to designing competitive compensation programs aimed at accomplishing this goal, specific elements of our compensation programs may not be competitive with those of our competitors and there can be no assurance that we will be able to retain our current personnel or recruit the key personnel we require.
If we must reduce our use of equity awards to compensate our employees, our competitiveness in the employee marketplace could be adversely affected. Our results of operations could vary as a result of changes in our stock-based compensation programs.
Like most technology companies, we have a history of using employee stock based incentive programs to recruit and retain our workforce in a competitive employment marketplace. Our success will depend in part upon the continued use of stock options, restricted stock units, deferred stock units and performance-based equity awards as a compensation tool. While this is a routine practice in many parts of the world, foreign exchange and income tax regulations in some countries make this practice more and more difficult. Such regulations tend to diminish the value of equity compensation to our employees in those countries. With regard to all equity based compensation, our current practice is to seek stockholder approval for increases in the number of shares available for grant under the Fairchild Semiconductor 2007 Stock Plan as well as other amendments that may be adopted from time to time which require stockholder approval. If these proposals do not receive stockholder approval, we may not be able to grant stock options and other equity awards to employees at the same levels as in the past, which could adversely affect our ability to attract, retain and motivate qualified personnel, and we may need to increase cash compensation in order to attract, retain and motivate employees, which could adversely affect our results of operations. Additionally, since 2009 we have relied almost exclusively on grants of restricted stock units and performance based equity awards in place of stock options. While we believe that our compensation policies are competitive with our peers, we cannot provide any assurance that we have not, and will not continue in the future to lose opportunities to recruit and retain key employees as a result of these changes.
Changes in forecasted stock-based compensation expense could impact our gross margin percentage, research and development expenses, marketing, general and administrative expenses and our tax rate.
20
Table of Contents
We may face product warranty or product liability claims that are disproportionately higher than the value of the products involved.
Our products are typically sold at prices that are significantly lower than the cost of the equipment or other goods in which they are incorporated. For example, our products that are incorporated into a personal computer may be sold for several dollars, whereas the personal computer might be sold by the computer maker for several hundred dollars. Although we maintain rigorous quality control systems, we manufacture and sell approximately 16 billion individual semiconductor devices per year to customers around the world, and in the ordinary course of our business we receive warranty claims for some of these products that are defective or that do not perform to published specifications. Additionally, while we attempt to contractually limit our customers’ use of our products, we cannot be certain that our distributors will not sell our products to customers who intend to use them in applications for which we did not intend them to be used. Since a defect or failure in one of our products could give rise to failures in the goods that incorporate them (and consequential claims for damages against our customers from their customers), we may face claims for damages that are disproportionate to the revenues and profits we receive from the products involved. For example, in December of 2013, the customer of one of our distributors filed suit against us claiming damages of $30 million arising out of the purchase of $20,000 of our products. Furthermore, even though we attempt, through our standard terms and conditions of sale and other customer contracts, to contractually limit our liability to replace the defective goods or refund the purchase price, we cannot be certain that these claims will not expose us to potential product liability, warranty liability, personal injury or property damage claims relating to the use of those products. In the past, we have received claims for charges, such as for labor and other costs of replacing defective parts or repairing the products into which the defective products are incorporated, lost profits and other damages. In addition, our ability to reduce such liabilities, whether by contracts or otherwise, may be limited by the laws or the customary business practices of the countries where we do business. And, even in cases where we do not believe we have legal liability for such claims, we may choose to pay for them to retain a customer’s business or goodwill or to settle claims to avoid protracted litigation. Our results of operations and business could be adversely affected as a result of a significant quality or performance issue in our products, if we are required or choose to pay for the damages that result.
Our operations and business could be significantly harmed by natural disasters.
Our manufacturing facilities in China, South Korea, Malaysia, the Philippines and many of the third party contractors and suppliers that we currently use are located in countries that are in seismically active regions of the world where earthquakes and other natural disasters, such as floods and typhoons may occur. For example, on October 15, 2013, our manufacturing facility in the Philippines experienced a magnitude 7.2 earthquake. While we take precautions to mitigate these risks, we cannot be certain that they will be adequate to protect our facilities in the event of a major earthquake, flood, typhoon or other natural disaster. Although we maintain insurance for some of the damage that may be caused by natural disasters, our insurance coverage may not be sufficient to cover all of our potential losses and may not cover us for lost business. As a result, a natural disaster in one of these regions could severely disrupt the operation of our business and have a material adverse effect on our financial condition and results of operations.
Natural disasters could affect our supply chain or our customer base which, in turn, could have a negative impact on our business, the cost of and demand for our products and our results of operations.
While the earthquake and tsunami in Japan, flooding in Thailand and the recent earthquake in the Philippines did not materially impact us, the occurrence of natural disasters in certain regions, could have a negative impact on our supply chain, our ability to deliver products, the cost of our products and the demand for our products. These events could cause consumer confidence and spending to decrease or result in increased volatility to the U.S. and worldwide economies. Any such occurrences could have a material adverse effect on our business, our results of operations and our financial condition.
21
Table of Contents
Our international operations subject our company to risks not faced by domestic competitors
Through our subsidiaries we maintain significant operations and facilities in the Philippines, Malaysia, China, South Korea and Singapore. We have sales offices and customers around the world. Approximately 75% of our revenues in the twelve months ended December 29, 2013 were from Asia. The following are some of the risks inherent in doing business on an international level:
| • | economic and political instability; |
| • | foreign currency fluctuations; |
| • | transportation delays; |
| • | trade restrictions; |
| • | changes in laws and regulations relating to, amongst other things, import and export tariffs, taxation, environmental regulations, land use rights and property, |
| • | work stoppages; and |
| • | the laws, including tax laws, and the policies of the U.S. toward, countries in which we manufacture our products. |
We acquired significant operations and revenues when we acquired a business from Samsung Electronics and, as a result, are subject to risks inherent in doing business in Korea, including political risk, labor risk and currency risk.
We have significant operations and sales in South Korea and are subject to risks associated with doing business there. Korea accounted for approximately 7% of our revenue for the twelve months ended December 29, 2013.
Relations between South Korea and North Korea have been tense over most of South Korea’s history, and more recent concerns over North Korea’s nuclear capability, and relations between the U.S. and North Korea, have created a global security issue that may adversely affect Korean business and economic conditions. We cannot assure you as to whether or when this situation will be resolved or change abruptly as a result of current or future events. An adverse change in economic or political conditions in South Korea or in its relations with North Korea could have a material adverse effect on our Korean subsidiary and our company. In addition to other risks disclosed relating to international operations, some businesses in South Korea are subject to labor unrest.
Our Korean sales are denominated primarily in U.S. dollars while a significant portion of our Korean operations’ costs of goods sold and operating expenses are denominated in South Korean won. Although we have taken steps to fix the costs subject to currency fluctuations and to balance won revenues and won costs as much as possible, a significant change in this balance, coupled with a significant change in the value of the won relative to the dollar, could have a material adverse effect on our financial performance and results of operations.
Increases in our effective tax rate may have a negative impact on our business.
A number of factors may increase our effective tax rates, which could reduce our net income, including: the locations where our profits are determined to be earned and taxed; the outcome of certain tax audits, changes in the valuation of our deferred tax assets or liabilities, increases in non-deductible expenses, changes in available tax credits, changes in tax laws or their interpretation, including changes in the U.S. taxation of non-U.S. income and expenses; changes in U.S. generally accepted accounting principles and our decision to repatriate non U.S. earnings.
A change in foreign tax laws or a difference in the construction of current foreign tax laws by relevant foreign authorities could result in us not recognizing any anticipated benefits.
Some of our foreign subsidiaries have been granted preferential income tax or other tax holidays as an incentive for locating in those jurisdictions. A change in the foreign tax laws or in the construction of the foreign
22
Table of Contents
tax laws governing these tax holidays, or our failure to comply with the terms and conditions governing the tax holidays, could result in us not recognizing the anticipated benefits we derive from them, which would decrease our profitability in those jurisdictions. While we continue to monitor the tax holidays, the income tax laws governing the tax holidays, and our compliance with the terms and conditions of the tax holidays there is still a risk that we may not be able to recognize the anticipated benefits of these tax holidays.
We have significantly expanded our manufacturing operations in China and, as a result, will be increasingly subject to risks inherent in doing business in China, which may adversely affect our financial performance.
We expect a significant portion of our production from our Suzhou, China facility will be exported out of China, however, we are hopeful that a significant portion of our future revenue will result from the Chinese markets in which our products are sold, and from demand in China for goods that include our products. For 2013, approximately 23% of the company’s total production is from the Suzhou facility. Our ability to operate in China may be adversely affected by changes in that country’s laws and regulations, including those relating to taxation, foreign exchange restrictions, import and export tariffs, environmental regulations, land use rights, property and other matters. In addition, our results of operations in China are subject to the economic and political situation there. We believe that our operations in China are in compliance with all applicable legal and regulatory requirements. However, there can be no assurance that China’s central or local governments will not impose new, stricter regulations or interpretations of existing regulations that would require additional expenditures. Changes in the political environment or government policies could result in revisions to laws or regulations or their interpretation and enforcement, increased taxation, restrictions on imports, import duties or currency revaluations. In addition, a significant destabilization of relations between China and the U.S. could result in restrictions or prohibitions on our operations or the sale of our products in China. The legal system of China relating to foreign trade is relatively new and continues to evolve. There can be no certainty as to the application of its laws and regulations in particular instances. Enforcement of existing laws or agreements may be sporadic and implementation and interpretation of laws inconsistent. Moreover, there is a high degree of fragmentation among regulatory authorities resulting in uncertainties as to which authorities have jurisdiction over particular parties or transactions.
We are subject to fluctuations in the value of foreign and domestic currency and interest rates.
We are exposed to financial market risks, including changes in interest rates and foreign currency exchange rates. To mitigate these risks and to protect against reductions in the value and volatility of future cash flows caused by changes in foreign exchange rates, we have established hedging programs. These hedging programs may utilize certain derivative financial instruments. For example, we use a combination of currency forward and option contracts to hedge a portion of our forecasted foreign exchange denominated revenues and expenses. Gains and losses on these foreign currency exposures would generally be offset by corresponding losses and gains on the related hedging instruments, resulting in negligible net exposure to us. A majority of our revenue, expense and capital purchasing activities are transacted in U.S. dollars. However, we do conduct these activities by way of transactions denominated in other currencies, primarily the Korean won, Malaysian ringgit, Philippine peso, Chinese yuan, Japanese yen, Taiwanese dollar, British pound and the Euro. Our hedging programs reduce, but do not always entirely eliminate, the short-term impact of foreign currency exchange rate movements. For example, during the twelve months ended December 29, 2013, an adverse change (defined as a 20% unfavorable move in every currency where we have exposure) in the exchange rates of all currencies over the course of the year would have resulted in an adverse impact on income before taxes of approximately $13.4 million. While we have established hedging policies and procedures to monitor and prevent unauthorized trading and to maintain substantial balance between purchases and sales or future delivery obligations, we can provide no assurance, however, that these steps will detect and/or prevent all violations of such risk management policies and procedures, particularly if deception or other intentional misconduct is involved.
In addition to our currency exposure, we have interest rate exposure with respect to our credit facility due to its variable pricing. For example, for the year ended December 29, 2013, a 50 basis point increase in interest
23
Table of Contents
rates would have resulted in increased annual interest expense of $1.13 million. The increased annual interest expense due to a 50 basis point increase in LIBOR rates would have been offset by an increase in interest income of $1.15 million on the cash and investment balances during 2013. We do not currently hedge our interest rate exposure and we can provide no assurance that a sudden increase in interest rates would not have a material impact on our financial performance.
We are subject to many environmental laws and regulations that could affect our operations or result in significant expenses.
Increasingly stringent environmental regulations restrict the amount and types of pollutants that can be released from our operations into the environment. While the cost of compliance with environmental laws has not had a material adverse effect on our results of operations historically, compliance with these and any future regulations could require significant capital investments in pollution control equipment or changes in the way we make our products. In addition, because we use hazardous and other regulated materials in our manufacturing processes, we are subject to risks of liabilities and claims, regardless of fault, resulting from our use, transportation, emission, discharge, storage, recycling or disposal of hazardous materials, including personal injury claims and civil and criminal fines, any of which could be material to our cash flow or earnings. For example:
| • | we currently are remediating contamination at some of our operating plant sites; |
| • | we have been identified as a potentially responsible party at a number of Superfund sites where we (or our predecessors) disposed of wastes in the past; and |
| • | significant regulatory and public attention on the impact of semiconductor operations on the environment may result in more stringent regulations, further increasing our costs. |
Although most of our known environmental liabilities are covered by indemnification agreements with Raytheon Company, National Semiconductor Corporation, Samsung Electronics and Intersil Corporation, these indemnities are limited to conditions that occurred prior to the consummation of the transactions through which we acquired facilities from those companies. National Semiconductor was purchased by Texas Instruments in 2011. Moreover, we cannot assure you that their indemnity obligations to us for the covered liabilities will be available, or, if available, adequate to protect us.
Our senior credit facility limits our flexibility and places restrictions on the manner in which we run our operations.
At December 29, 2013, we had total debt of $200.1 million and the ratio of this debt to equity was approximately 0.2 to 1. As of December 29, 2013, our credit facility consists of a $400 million revolving line of credit. Adjusted for outstanding letters of credit, we had up to $199.5 million available under the revolving loan portion of the senior credit facility. In addition, there is a $300 million uncommitted incremental revolving loan feature. Despite the significant reductions we have made in our long-term debt, we continue to carry indebtedness which could have significant consequences on our operations. For example, it could:
| • | require us to dedicate a portion of our cash flow from operations to payments on our indebtedness, thereby reducing the availability of our cash flow to fund working capital, capital expenditures, research and development efforts and other general corporate purposes; |
| • | increase the amount of our interest expense, because our borrowings are at variable rates of interest, which, if interest rates increase, could result in higher interest expense; |
| • | increase our vulnerability to general adverse economic and industry conditions; |
| • | limit our flexibility in planning for, or reacting to, changes in our business and the industry in which we operate; |
| • | restrict us from making strategic acquisitions, introducing new technologies or exploiting business opportunities; |
24
Table of Contents
| • | make it more difficult for us to satisfy our obligations with respect to the instruments governing our indebtedness; |
| • | place us at a competitive disadvantage compared to our competitors that have less indebtedness; or |
| • | limit, along with the financial and other restrictive covenants in our debt instruments, our ability to borrow additional funds, dispose of assets, repurchase stock or pay cash dividends. Failing to comply with those covenants could result in an event of default which, if not cured or waived, could have a material adverse effect on our business, financial condition and results of operations. |
We may not be able to generate the necessary amount of cash to service our indebtedness, which may require us to refinance our indebtedness or default on our scheduled debt payments. Our ability to generate cash depends on many factors beyond our control.
Our historical financial results have been, and we anticipate that our future financial results may be subject to substantial fluctuations. While we currently have sufficient cash flow to satisfy all of our current obligations, we cannot assure you that our business will continue to generate sufficient cash flow from operations to enable us to pay our indebtedness or to fund our other liquidity needs in the future. Further, we can make no assurances that our currently anticipated cost savings and operating improvements will be realized on schedule or at all, or that future borrowings will be available to us under our senior credit facility in an amount sufficient to satisfy our liquidity needs. In addition, because our senior credit facility has a variable interest rate, our cost of borrowing will increase if market interest rates increase. If we are unable to meet our expenses and debt obligations, we may need to refinance all or a portion of our indebtedness on or before maturity, sell assets or raise equity. We cannot assure you that we would be able to renew or refinance any of our indebtedness, sell assets or raise equity on commercially reasonable terms or at all, which could cause us to default on our obligations and impair our liquidity. Restrictions imposed by the credit agreement relating to our senior credit facility restrict or prohibit our ability to engage in or enter into some business operating and financing arrangements, which could adversely affect our ability to take advantage of potentially profitable business opportunities.
The operating and financial restrictions and covenants in the credit agreement relating to our senior credit facility may limit our ability to finance our future operations or capital needs or engage in other business activities that may be in our interests. The credit agreement imposes significant operating and financial restrictions on us that affect our ability to incur additional indebtedness or create liens on our assets, pay dividends, sell assets, engage in mergers or acquisitions, make investments or engage in other business activities. These restrictions could place us at a disadvantage relative to our competitors many of which are not subject to such limitations.
In addition, the senior credit facility also requires us to maintain specified financial ratios. Our ability to meet those financial ratios can be affected by events beyond our control, and we cannot assure you that we will meet those ratios. As of December 29, 2013, we were in compliance with these ratios. A breach of any of these covenants, ratios or restrictions could result in an event of default under the senior credit facility. Upon the occurrence of an event of default under the senior credit facility, the lenders could elect to declare all amounts outstanding under the senior credit facility, together with accrued interest, to be immediately due and payable. If we were unable to repay those amounts, the lenders could proceed against our assets, including any collateral granted to them to secure the indebtedness. If the lenders under the senior credit facility accelerate the payment of the indebtedness, we cannot assure you that our assets would be sufficient to repay in full that indebtedness and our other indebtedness.
Security breaches and other disruptions could compromise the integrity of our information and expose us to liability, which would cause our business and reputation to suffer.
We routinely collect and store sensitive data, including intellectual property and other proprietary information about our business and that of our customers, suppliers and business partners. The secure processing,
25
Table of Contents
maintenance and transmission of this information is critical to our operations and business strategy. Despite our security measures, our information technology and infrastructure may be vulnerable to attacks by hackers or breached due to employee error, malfeasance or other disruptions. Any such breach could compromise our networks and the information stored there could be accessed, publicly disclosed, lost or stolen. Any such access, disclosure or other loss of information could result in legal claims or proceedings and liability under laws that protect the privacy of personal information. It could also result in regulatory penalties, disrupt our operations and the services we provide to customers, damage our reputation and cause a loss of confidence in our products and services, which could adversely affect our business/operating margins, revenues and competitive position.
| ITEM 1B. | UNRESOLVED STAFF COMMENTS |
We have no unresolved comments from the Securities and Exchange Commission as of February 27, 2014.
| ITEM 2. | PROPERTIES |
We maintain manufacturing and office facilities around the world including the U.S., Asia and Europe. The following table provides information about these facilities at December 29, 2013.
| Location |
Owned |
Leased |
Use |
Business Segment | ||||
| Bucheon, South Korea |
X | X | Manufacturing, office facilities and design center. |
PCIA and SDT | ||||
| Cebu, Philippines |
X | X | Manufacturing, warehouse and office facilities. |
MCCC, PCIA and SDT | ||||
| Hwasung City, South Korea |
X | Warehouse space. | ||||||
| Kowloon, Hong Kong |
X | Office facilities. | ||||||
| Colorado Springs, Colorado |
X | Office facilities and design center. | MCCC | |||||
| Mountaintop, Pennsylvania |
X | Manufacturing and office facilities. |
MCCC and PCIA | |||||
| Munich, Germany |
X | Office facilities and design center. | PCIA | |||||
| Oulu, Finland |
X | Office facilities and design center. | MCCC | |||||
| Penang, Malaysia |
X | X | Manufacturing, warehouse and office facilities. |
MCCC, PCIA and SDT | ||||
| San Jose, California |
X | Office facilities and design center. | MCCC and PCIA | |||||
| Irvine, California |
X | Office facilities and design center. | MCCC | |||||
| Hayward, California |
Office facilities and design center. | MCCC | ||||||
| Seoul, South Korea |
X | Office facilities. | ||||||
| Shanghai, China |
X | Office facilities and design center. | ||||||
| Bejing, China |
X | Office facilities and design center. | ||||||
| Shenzen, China |
X | Office facilities. | ||||||
| Singapore |
X | Office facilities. | ||||||
| South Portland, Maine |
X | Office facilities. | ||||||
| South Portland, Maine |
X | X | Manufacturing, office facilities and design center. |
MCCC, PCIA and SDT | ||||
| Pune, India |
X | Design center. | MCCC | |||||
| Suzhou, China |
X | Manufacturing, warehouse and office facilities. |
MCCC, PCIA and SDT | |||||
| Taipei, Taiwan |
X | Office facilities, warehouse and design center. |
PCIA | |||||
| Tokyo, Japan |
X | Office facilities. | ||||||
| West Jordan, Utah |
X | Manufacturing and office facilities. |
MCCC | |||||
| Wooton-Bassett, England |
X | Office facilities. |
26
Table of Contents
Leases affecting the Penang, Suzhou and Cebu facilities are generally in the form of long-term ground leases, while we own improvements on the land. In some cases we have the option to renew the lease term, while in others we have the option to purchase the leased premises. We also have the ability to cancel these leases at any time. In addition to the facilities listed above, we maintain smaller offices in leased spaces around the world.
We believe that our facilities around the world, whether owned or leased, are well maintained and are generally suitable and adequate to carry on the company’s business. Our manufacturing facilities contain sufficient productive capacity to meet our needs for the foreseeable future.
| ITEM 3. | LEGAL PROCEEDINGS |
There are five outstanding proceedings with Power Integrations.
POWI 1: On October 20, 2004, we and our wholly owned subsidiary, Fairchild Semiconductor Corporation, were sued by Power Integrations, Inc. in the U.S. District Court for the District of Delaware. Power Integrations alleged that certain of our products infringed four Power Integrations U.S. patents, and sought a permanent injunction preventing us from manufacturing, selling or offering the products for sale in the U.S., or from importing the products into the U.S., as well as money damages for past infringement.
The trial in the case was divided into three phases. In the first phase of the trial that occurred in October of 2006, a jury returned a verdict finding that thirty-three of our PWM products willfully infringed one or more of seven claims asserted in the four patents and assessed damages against us. We voluntarily stopped U.S. sales and importation of those products in 2007 and have been offering replacement products since 2006. Subsequent phases of the trial conducted during 2007 and 2008 focused on the validity and enforceability of the patents. In December of 2008, the judge overseeing the case reduced the jury’s 2006 damages award from $34 million to approximately $6.1 million and ordered a new trial on the issue of willfulness. Following the new trial held in June of 2009, the court found our infringement to have been willful, and in January 2011 the court awarded Power Integrations final damages in the amount of $12.2 million. We appealed the final damages award, willfulness finding, and other issues to the U.S. Court of Appeals for the Federal Circuit. On March 26, 2013, the court of appeals vacated almost the entire damages award, ruling that there was no basis upon which a reasonable jury could find us liable for induced infringement. The court also vacated the earlier ruling of willful patent infringement by us. While the appeals court instructed the lower court to conduct further proceedings to determine damages based upon approximately $500,000 to $750,000 worth of sales and imports of affected products, we believe that damages on the basis of that level of infringing activity would not be material to us. Accordingly, we released $12.6 million from our reserves relating to this case during the first quarter of 2013. The court of appeals denied Power Integrations’ motions to rehear the case. On August 23, 2013, Power Integrations filed a Petition for a Writ of Certiorari with the Supreme Court of the United States, seeking review of various aspects of the ruling. On January 13, 2014, the Supreme Court denied Power Integrations’ Petition for a Writ of Certiorari.
POWI 2: On May 23, 2008, Power Integrations filed another lawsuit against us, Fairchild Semiconductor Corporation and our wholly owned subsidiary System General Corporation in the U.S. District Court for the District of Delaware, alleging infringement of three patents. Of the three patents asserted in that lawsuit, two were asserted against us and Fairchild Semiconductor Corporation in the October 2004 lawsuit described above. In 2011, Power Integrations added a fourth patent to this case.
On October 14, 2008, Fairchild Semiconductor Corporation and System General Corporation filed a patent infringement lawsuit against Power Integrations in the U.S. District Court for the District of Delaware, alleging that certain PWM integrated circuit products infringe one or more claims of two U.S. patents owned by System General. The lawsuit seeks monetary damages and an injunction preventing the manufacture, use, sale, offer for sale or importation of Power Integrations products found to infringe the asserted patents.
27
Table of Contents
Both lawsuits were consolidated and heard together in a jury trial in April of 2012. On April 27, 2012, the jury found that Power Integrations infringed one of the two U.S. patents owned by System General and upheld the validity of both System General patents. In the same case, the jury found that we infringed two of four U.S. patents asserted by Power Integrations and that we had induced our customers to infringe the asserted patents. The jury also upheld the validity of the asserted Power Integrations patents. The verdict concluded the first phase of trial in the litigation. Willfulness and damages in the case will be determined in a second phase, which has yet to be scheduled and may occur after appeals of the first phase.
POWI 3: On November 4, 2009, Power Integrations filed a complaint for patent infringement against us and two of our subsidiaries in the U.S. District Court for the Northern District of California alleging that several of our products infringe three of Power Integrations’ patents. Fairchild has filed counterclaims asserting that Power Integrations infringes two Fairchild patents. The trial began in February 2014 and is ongoing.
POWI 4: On February 10, 2010, Fairchild and System General filed a lawsuit in Suzhou, China against four Power Integrations entities and seven vendors. The lawsuit claims that Power Integrations violates certain Fairchild/System General patents. Fairchild is seeking an injunction against the Power Integrations products and over $17.0 million in damages. Hearings comparable to a trial in U.S. litigation were held in January, May and July 2012. In December of 2012, the Suzhou court ruled in favor of Power Integrations and denied our claims. We are appealing the trial court’s judgment to the appeals court in Nanjing, China.
POWI 5: On May 1, 2012, we sued Power Integrations in U.S. District Court for the District of Delaware. The lawsuit accuses Power Integration’s LinkSwitch-PH LED power conversion products of violating three of our patents. Power Integrations has filed counterclaims of patent infringement against us asserting five Power Integrations patents. Trial is expected in 2014.
Other Legal Claims. From time to time we are involved in legal proceedings in the ordinary course of business. We believe that there is no such ordinary-course litigation pending that could have, individually or in the aggregate, a material adverse effect on our business, financial condition, results of operations or cash flows.
We analyze potential outcomes from current litigation in accordance with the Contingency Topic of the FASB ASC. Accordingly, we analyze such outcomes as loss contingencies, and divide them into three categories based on the possibility that the contingency will give rise to an actual loss. The first category represents contingencies for which we believe the possibility of a loss is remote. For contingencies in this category, we do not record a reserve or assess the range of possible losses. The second category represents contingencies for which losses are believed to be reasonably possible. For this category, we assess the range of possible losses but do not record a reserve. There are currently no contingencies in this category. The third category represents contingencies for which losses are believed to be probable. For this category, we determine the range of probable losses and record a reserve reflecting the best estimate within the range. For contingencies within this category, we currently believe the range of probable losses is approximately $1.5 million to $4.0 million. We believe the best estimate of losses within this range to be $1.5 million as of September 29, 2013 and have recorded this amount as a reserve. The amount reserved is based upon assessments of the potential liabilities using analysis of claims and historical experience in defending and resolving such claims.
| ITEM 4. | MINE SAFETY DISCLOSURES |
Not applicable.
28
Table of Contents
PART II
| ITEM 5. | MARKET FOR REGISTRANT’S COMMON EQUITY, RELATED STOCKHOLDER MATTERS AND ISSUER PURCHASES OF EQUITY SECURITIES |
Our common stock trades on the NASDAQ Stock Market under the trading symbol “FCS”. The following table sets forth, for the periods indicated, the high and low intraday sales prices per share of Fairchild Semiconductor International, Inc. Common Stock.
| High | Low | |||||||
| 2013 |
||||||||
| Fourth Quarter (from September 30, 2013 to December 29, 2013) |
$ | 14.18 | $ | 12.01 | ||||
| Third Quarter (from July 1, 2013 to September 29, 2013) |
$ | 14.99 | $ | 11.55 | ||||
| Second Quarter (from April 1, 2013 to June 30, 2013) |
$ | 14.79 | $ | 11.48 | ||||
| First Quarter (from December 31, 2012 to March 31, 2013) |
$ | 15.75 | $ | 13.64 | ||||
| 2012 |
||||||||
| Fourth Quarter (from October 1, 2012 to December 30, 2012) |
$ | 14.58 | $ | 11.30 | ||||
| Third Quarter (from July 2, 2012 to September 30, 2012) |
$ | 15.54 | $ | 12.53 | ||||
| Second Quarter (from April 2, 2012 to July 1, 2012) |
$ | 14.61 | $ | 12.41 | ||||
| First Quarter (from December 26, 2011 to April 1, 2012) |
$ | 15.88 | $ | 11.94 | ||||
As of February 20, 2014, there were approximately 110 holders of record of our Common Stock. We have not paid dividends on our common stock in any of the years presented above. Certain agreements, pursuant to which we have borrowed funds, contain provisions that limit the amount of dividends and stock repurchases that we may make. See Item 7, Liquidity and Capital Resources and Note 7 to our Consolidated Financial Statements contained in Item 8 of this report, for further information about restrictions to our ability to pay dividends.
Securities Authorized for Issuance Under Equity Compensation Programs
The following table provides information about the number of stock options, deferred stock units (DSUs), restricted stock units (RSUs) and performance units (PUs) outstanding and authorized for issuance under all equity compensation plans of the company on December 29, 2013. The notes under the table provide important additional information.
| Number of Shares of Common Stock Issuable Upon the Exercise of Outstanding Options, DSUs, RSUs and PUs (1) |
Weighted-Average Exercise Price of Outstanding Options (2) |
Number of Shares Remaining Available for Future Issuance (Excluding Shares Underlying Outstanding Options, DSUs, RSUs and PUs) (3) |
||||||||||
| Equity compensation plans approved by stockholders (4) |
7,083,283 | $ | 15.13 | 9,369,222 | ||||||||
| Equity compensation plans not approved by stockholders (5) |
75,000 | $ | 17.81 | 0 | ||||||||
|
|
|
|
|
|
|
|||||||
| Total |
7,158,283 | $ | 15.16 | 9,369,222 | ||||||||
|
|
|
|
|
|
|
|||||||
| (1) | Other than as described here, the company had no warrants or rights outstanding or available for issuance under any equity compensation plan at December 29, 2013. |
| (2) | Does not include shares subject to DSUs, RSUs or PUs, which do not have an exercise price. |
| (3) | Represents 9,369,222 shares under the Fairchild Semiconductor 2007 Stock Plan (2007 Stock Plan). There were no shares remaining available for future issuance under the Fairchild Semiconductor Stock Plan (Stock Plan) and the 2000 Executive Stock Plan (2000 Executive Plan) on December 29, 2013. |
| (4) | Shares issuable include 22,350 options under the 2000 Executive Plan, 489,552 options under the Stock Plan and 501,249 options, 396,143 DSUs, 4,703,701 RSUs, and 970,288 PUs under the 2007 Stock Plan. |
29
Table of Contents
| (5) | Represents 75,000 options granted to Mr. Frey, in March 2006, as recruitment-related grants. This equity award was made under the NYSE exemption for employment inducement awards. The equity award is covered by a separate award agreement. The options vest in equal installments over the four-year period following their grant date, have an eight-year term and have an exercise price per share equal to the fair market value of the company’s common stock on the grant date. |
The material terms of the 2000 Executive Plan, the Stock Plan and the 2007 Stock Plan are described in Note 9 to the company’s Consolidated Financial Statements contained in Item 8 of this report, and the three plans are included as exhibits to this report.
Unregistered Sales of Equity Securities and Use of Proceeds
There were no sales of unregistered equity securities in the fourth quarter of 2013. The following table provides information with respect to purchases made by the company of its own common stock during the fourth quarter of 2013.
| Period |
Total Number of Shares (or Units) Purchased |
Average Price Paid per Share |
Total Number of Shares Purchased as Part of Publicly Announced Plans or Programs |
Maximum Number (or Approximate Dollar Value) of Shares that May Yet Be Purchased Under the Plans or Programs |
||||||||||||
| September 30, 2013—October 27, 2013 |
178,061 | $ | 12.45 | — | — | |||||||||||
| October 28, 2013—November 24, 2013 |
475,201 | 12.41 | — | — | ||||||||||||
| November 25, 2013—December 29, 2013 |
247,465 | 12.66 | — | — | ||||||||||||
|
|
|
|
|
|
|
|
|
|||||||||
| Total |
900,727 | $ | 12.49 | — | — | |||||||||||
|
|
|
|
|
|
|
|
|
|||||||||
30
Table of Contents
Stockholder Return Performance
The following graph compares the change in the return on the company’s common stock against the return of the Standard & Poor’s 500 Index and the Philadelphia Stock Exchange Semiconductor Index from December 24, 2009 to December 27, 2013, the last trading day in our fiscal year ended December 29, 2013. Return to stockholders is measured by dividing the per-share price change for the period by the share price at the beginning of the period. The graph assumes that $100 investments in our common stock and each of the indexes were made.
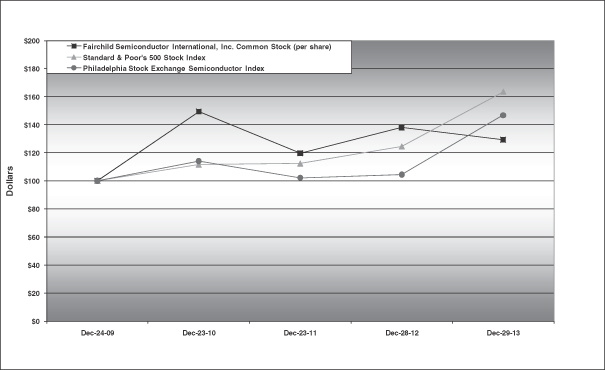
31
Table of Contents
| ITEM 6. | SELECTED FINANCIAL DATA |
The following table sets forth our selected historical consolidated financial data. The historical consolidated financial data as of December 29, 2013 and December 30, 2012 and for the years ended December 29, 2013, December 30, 2012, and December 25, 2011 are derived from our audited Consolidated Financial Statements, contained in Item 8 of this report. The historical consolidated financial data as of December 25, 2011, December 26, 2010 and December 27, 2009 and for the years ended December 27, 2009 and December 26, 2010 are derived from our audited Consolidated Financial Statements, which are not included in this report. This information should be read in conjunction with our audited Consolidated Financial Statements and Management’s Discussion and Analysis of Financial Condition and Results of Operations.
Adjusted net income (loss), adjusted gross margin, and free cash flow are also included in the table below. These are unaudited non-GAAP financial measures and should not be considered a replacement for GAAP results. We present adjusted results because we use these measures, together with GAAP measures, for internal managerial purposes and as a means to evaluate period-to-period comparisons. However, we do not, and you should not, rely on non-GAAP financial measures alone as measures of our performance. We believe that non-GAAP results and the reconciliations to corresponding GAAP financial measures that we also provide in our press releases—provide additional insight to understanding of factors and trends affecting our business. We strongly encourage you to review all of our financial statements and publicly-filed reports in their entirety and to not rely on any single financial measure. Our criteria for adjusted results may differ from methods used by other companies and may not be comparable and should not be considered as alternatives to net income or loss, gross margin, or other measures of consolidated operations and cash flow data prepared in accordance with US GAAP as indicators of our operating performance or as alternatives to cash flow as a measure of liquidity.
The results for the year ended December 29, 2013 consist of 52 weeks. The results for the year ended December 30, 2012 consist of 53 weeks. The results for the years ended December 25, 2011, December 26, 2010, and December 27, 2009 each consist of 52 weeks.
| Year Ended | ||||||||||||||||||||
| December 29, 2013 |
December 30, 2012 |
December 25, 2011 |
December 26, 2010 |
December 27, 2009 |
||||||||||||||||
| (In millions, except per share data) | ||||||||||||||||||||
| Consolidated Statements of Operations Data: |
||||||||||||||||||||
| Total revenue |
$ | 1,405.4 | $ | 1,405.9 | $ | 1,588.8 | $ | 1,599.7 | $ | 1,187.5 | ||||||||||
| Total gross margin |
416.5 | 442.0 | 559.2 | 563.0 | 290.3 | |||||||||||||||
| % of total revenue |
29.6 | % | 31.4 | % | 35.2 | % | 35.2 | % | 24.4 | % | ||||||||||
| Net income (loss) |
5.0 | 24.6 | 145.5 | 153.2 | (60.2 | ) | ||||||||||||||
| Net income (loss) per common share: |
||||||||||||||||||||
| Basic |
$ | 0.04 | $ | 0.19 | $ | 1.15 | $ | 1.23 | $ | (0.49 | ) | |||||||||
| Diluted |
$ | 0.04 | $ | 0.19 | $ | 1.12 | $ | 1.20 | $ | (0.49 | ) | |||||||||
| Consolidated Balance Sheet Data (End of Period): |
||||||||||||||||||||
| Inventories |
$ | 228.1 | $ | 236.7 | $ | 234.2 | $ | 232.7 | $ | 189.5 | ||||||||||
| Total assets |
1,796.0 | 1,883.9 | 1,936.9 | 1,849.1 | 1,762.4 | |||||||||||||||
| Current portion of long-term debt |
— | — | — | 3.8 | 5.3 | |||||||||||||||
| Long-term debt, less current portion |
200.1 | 250.1 | 300.1 | 316.9 | 466.9 | |||||||||||||||
| Stockholders’ equity |
1,360.5 | 1,367.1 | 1,322.2 | 1,176.3 | 1,026.6 | |||||||||||||||
| Other Financial Data: |
||||||||||||||||||||
| Research and development |
$ | 171.6 | $ | 156.9 | $ | 153.4 | $ | 120.2 | $ | 99.7 | ||||||||||
| Depreciation and other amortization |
145.2 | 135.3 | 150.5 | 156.3 | 160.4 | |||||||||||||||
| Amortization of acquisition-related intangibles |
15.5 | 18.2 | 19.7 | 22.4 | 22.3 | |||||||||||||||
| Interest (income) expense, net |
5.8 | 5.6 | 4.6 | 7.2 | 18.0 | |||||||||||||||
| Capital expenditures |
75.2 | 151.9 | 186.4 | 158.0 | 59.8 | |||||||||||||||
| Adjusted net income |
34.6 | 70.5 | 169.7 | 193.2 | 1.2 | |||||||||||||||
| Adjusted gross margin |
425.2 | 442.0 | 561.4 | 565.7 | 299.5 | |||||||||||||||
| % of total revenue |
30.3 | % | 31.4 | % | 35.3 | % | 35.4 | % | 25.2 | % | ||||||||||
| Free cash flow |
100.9 | 31.3 | 82.1 | 174.5 | 128.6 | |||||||||||||||
32
Table of Contents
| Year Ended | ||||||||||||||||||||
| December 29, 2013 |
December 30, 2012 |
December 25, 2011 |
December 26, 2010 |
December 27, 2009 |
||||||||||||||||
| Reconciliation of Net Income (Loss) to Adjusted Net Income |
||||||||||||||||||||
| Net Income (Loss) |
$ | 5.0 | $ | 24.6 | $ | 145.5 | $ | 153.2 | $ | (60.2 | ) | |||||||||
| Adjustments to reconcile net income (loss) to adjusted net income: |
||||||||||||||||||||
| Restructuring and impairments, net |
15.9 | 14.1 | 2.8 | 7.0 | 27.9 | |||||||||||||||
| VAT expense on internal IP sale |
— | 2.1 | — | — | — | |||||||||||||||
| Write-off of equity investments |
3.0 | — | ||||||||||||||||||
| Impairment on equity investment |
— | — | — | — | 2.1 | |||||||||||||||
| Gain associated with debt buyback |
— | — | — | — | (2.0 | ) | ||||||||||||||
| Accelerated depreciation on assets related to fab closure |
8.7 | — | 0.7 | 2.9 | 8.8 | |||||||||||||||
| Write-off of deferred financing fees |
— | — | 2.1 | 2.1 | — | |||||||||||||||
| Inventory write-off associated with fab closure |
— | — | (0.2 | ) | (0.2 | ) | 0.4 | |||||||||||||
| Charge (release) for litigation |
(12.6 | ) | 1.3 | — | 8.0 | 6.0 | ||||||||||||||
| Realized loss on sale of securities |
— | 12.9 | — | — | — | |||||||||||||||
| Change in retirement plans |
— | — | 2.7 | — | — | |||||||||||||||
| Amortization of acquisition-related intangibles |
15.5 | 18.2 | 19.7 | 22.4 | 22.3 | |||||||||||||||
| Less associated tax effects of the above and other acquistion-related intangibles |
(0.9 | ) | (2.7 | ) | (3.6 | ) | (2.2 | ) | (4.1 | ) | ||||||||||
|
|
|
|
|
|
|
|
|
|
|
|||||||||||
| Adjusted net income |
$ | 34.6 | $ | 70.5 | $ | 169.7 | $ | 193.2 | $ | 1.2 | ||||||||||
|
|
|
|
|
|
|
|
|
|
|
|||||||||||
| Year Ended | ||||||||||||||||||||
| December 29, 2013 |
December 30, 2012 |
December 25, 2011 |
December 26, 2010 |
December 27, 2009 |
||||||||||||||||
| Reconciliation of Gross Margin to Adjusted Gross Margin |
||||||||||||||||||||
| Gross margin |
$ | 416.5 | $ | 442.0 | $ | 559.2 | $ | 563.0 | $ | 290.3 | ||||||||||
| Adjustments to reconcile gross margin to adjusted gross margin: |
||||||||||||||||||||
| Change in retirement plans |
— | — | 1.7 | — | — | |||||||||||||||
| Accelerated depreciation on assets related to fab closure |
8.7 | — | 0.7 | 2.9 | 8.8 | |||||||||||||||
| Inventory write-off associated with fab closure |
— | — | (0.2 | ) | (0.2 | ) | 0.4 | |||||||||||||
|
|
|
|
|
|
|
|
|
|
|
|||||||||||
| Adjusted gross margin |
$ | 425.2 | $ | 442.0 | $ | 561.4 | $ | 565.7 | $ | 299.5 | ||||||||||
|
|
|
|
|
|
|
|
|
|
|
|||||||||||
33
Table of Contents
| Year Ended | ||||||||||||||||||||
| December 29, 2013 |
December 30, 2012 |
December 25, 2011 |
December 26, 2010 |
December 27, 2009 |
||||||||||||||||
| Reconciliation of R&D and SG&A to Adjusted R&D and SG&A |
||||||||||||||||||||
| R&D and SG&A |
$ | 377.3 | $ | 363.7 | $ | 371.8 | $ | 341.0 | $ | 279.0 | ||||||||||
| Adjustments to reconcile R&D and SG&A to adjusted R&D and SG&A: |
||||||||||||||||||||
| Change in retirement plans |
— | — | (1.0 | ) | — | — | ||||||||||||||
|
|
|
|
|
|
|
|
|
|
|
|||||||||||
| Adjusted R&D and SG&A |
$ | 377.3 | $ | 363.7 | $ | 370.8 | $ | 341.0 | $ | 279.0 | ||||||||||
|
|
|
|
|
|
|
|
|
|
|
|||||||||||
| Year Ended | ||||||||||||||||||||
| December 29, 2013 |
December 30, 2012 |
December 25, 2011 |
December 26, 2010 |
December 27, 2009 |
||||||||||||||||
| Reconciliation of Operating Cash Flow to Free Cash Flow |
||||||||||||||||||||
| Cash provided by operating activities |
$ | 176.1 | $ | 183.2 | $ | 268.5 | $ | 332.5 | $ | 188.4 | ||||||||||
| Capital Expeditures |
75.2 | 151.9 | 186.4 | 158.0 | 59.8 | |||||||||||||||
|
|
|
|
|
|
|
|
|
|
|
|||||||||||
| Free Cash Flow |
$ | 100.9 | $ | 31.3 | $ | 82.1 | $ | 174.5 | $ | 128.6 | ||||||||||
|
|
|
|
|
|
|
|
|
|
|
|||||||||||
| ITEM 7. | MANAGEMENT’S DISCUSSION AND ANALYSIS OF FINANCIAL CONDITION AND RESULTS OF OPERATIONS |
Introduction
This discussion and analysis of financial condition and results of operations is intended to provide investors with an understanding of our past performance, financial condition and prospects. We will discuss and provide our analysis of the following:
| • | Overview |
| • | Results of Operations |
| • | Liquidity and Capital Resources |
| • | Liquidity and Capital Resources of Fairchild International, Excluding Subsidiaries |
| • | Critical Accounting Policies and Estimates |
| • | Forward Looking Statements |
| • | New Policy on Business Outlook Disclosure |
| • | Status of First Quarter Business |
| • | Recently Issued Financial Accounting Standards |
Overview
Fairchild reported solid sales growth into industrial, appliance and automotive end markets during 2013 while demand from the mobile sector was weaker than expected. Demand from the consumer and notebook PC markets continued to be weak due to economic pressure on consumer spending, lack of compelling new TV or notebook products and competition from tablets and smart phones. Overall Fairchild sales were flat compared to 2012 at $1.4 billion.
34
Table of Contents
The Mobile, Computing, Consumer and Communication (MCCC) group’s main focus is to supply the mobile, computing, consumer and communication end market segments with innovative power and signal path solutions including our low voltage metal oxide semiconductor field effect transistors (MOSFETs), Power Management integrated circuits (IC’s), Mixed Signal Analog and Logic products. We seek to deliver exceptional product performance by optimizing silicon processes and application specific design to satisfy specific requirements for our customers. This enables us to deliver solutions with greater energy efficiency in a smaller footprint than is commonly available. We expect a steady acceleration of new product sales especially for solutions addressing the smart phone and ultraportable market.
The Power Conversion, Industrial, and Automotive (PCIA) group’s focus is to capitalize on the growing demand for greater energy efficiency and higher power density for space savings in power supplies, consumer electronics, battery chargers, electric motors, industrial electronics and automobiles. We are a leader in power semiconductor devices, low standby power consumption designs, and power module technology that enable greater efficiency, higher power density, and better performance. Improving the efficiency of our customers’ products is vital to meeting new energy efficiency regulations. Effectively managing power conversion and distribution in power supplies is one of the greatest opportunities we have to improve overall system efficiency. We believe the growing global focus on energy efficiency will continue to drive growth in this product segment.
Standard Discrete and Standard Linear (SDT) products are core building block components for many electronic applications. This segment uses a simplified and focused operating model to make the selling and support of these products easier and more profitable. The current operational structure and part portfolio should enable our standard products group to continue to generate solid cash flow with minimal investment.
In 2013, we invested in our business to upgrade technologies, acquire new capabilities, and to fund R&D. Capital spending included significant investments in our new 8 inch wafer fab in Korea. We expect the transition to 8 inch wafer manufacturing for a greater percentage of our production will enable lower costs and improved margins for years to come. In addition, we have increased our focus on streamlining operations, creating greater manufacturing flexibility and having a more balanced internal versus external production mix. We expect this process to enable significant improvements in manufacturing and financial performance beginning in mid-2015.
In addition to investing in the business, we also repurchased more than two million shares of our stock and reduced our debt, ending the year with the highest net cash (cash minus debt) level in the history of the company. In December of 2013, the Fairchild Board of Directors authorized an enhanced stock repurchase program allowing the company to buy back up to $100 million in shares.
We strive to keep inventory as lean as possible while maintaining customer service. We prefer to maintain maximum flexibility by adjusting internal inventories in response to higher demand before adding more inventory to our distribution channels. At the end of the fourth quarter, our channel inventories were at 10 weeks after adjusting for end of life inventory which is within our target range of 10 to 11 weeks. At the end of the fourth quarter of 2013 internal inventories were at $228.1 million, a 4 percent reduction from the end of 2012. We believe Fairchild is in a strong position to take advantage of anticipated improvements in demand in 2014.
35
Table of Contents
Results of Operations
The following table summarizes certain information relating to our operating results as derived from our audited consolidated financial statements as well as certain unaudited non-GAAP financial measures.
| Year Ended | ||||||||||||||||||||||||
| December 29, 2013 |
December 30, 2012 |
December 25, 2011 |
||||||||||||||||||||||
| (Dollars in millions) | ||||||||||||||||||||||||
| Total revenues |
$ | 1,405.4 | 100.0 | % | $ | 1,405.9 | 100.0 | % | $ | 1,588.8 | 100.0 | % | ||||||||||||
| Gross margin |
416.5 | 29.6 | % | 442.0 | 31.4 | % | 559.2 | 35.2 | % | |||||||||||||||
| Operating Expenses: |
||||||||||||||||||||||||
| Research and development |
171.6 | 12.2 | % | 156.9 | 11.2 | % | 153.4 | 9.7 | % | |||||||||||||||
| Selling, general and administrative |
205.7 | 14.6 | % | 206.8 | 14.7 | % | 218.4 | 13.7 | % | |||||||||||||||
| Amortization of acquisition-related intangibles |
15.5 | 1.1 | % | 18.2 | 1.3 | % | 19.7 | 1.2 | % | |||||||||||||||
| Restructuring and impairments |
15.9 | 1.1 | % | 14.1 | 1.0 | % | 2.8 | 0.2 | % | |||||||||||||||
| Charge for litigation |
(12.6 | ) | -0.9 | % | 1.3 | 0.1 | % | — | 0.0 | % | ||||||||||||||
|
|
|
|
|
|
|
|||||||||||||||||||
| Total operating expenses |
396.1 | 28.2 | % | 397.3 | 28.3 | % | 394.3 | 24.8 | % | |||||||||||||||
| Operating income |
20.4 | 1.5 | % | 44.7 | 3.2 | % | 164.9 | 10.4 | % | |||||||||||||||
| Realized loss on sale of securities |
— | 0.0 | % | 12.9 | 0.9 | % | — | 0.0 | % | |||||||||||||||
| Other expense, net |
9.2 | 0.7 | % | 8.1 | 0.6 | % | 7.2 | 0.5 | % | |||||||||||||||
|
|
|
|
|
|
|
|||||||||||||||||||
| Income before income taxes |
11.2 | 0.8 | % | 23.7 | 1.7 | % | 157.7 | 9.9 | % | |||||||||||||||
| Provision (benefit) for income taxes |
6.2 | 0.4 | % | (0.9 | ) | -0.1 | % | 12.2 | 0.8 | % | ||||||||||||||
|
|
|
|
|
|
|
|||||||||||||||||||
| Net income |
$ | 5.0 | 0.4 | % | $ | 24.6 | 1.7 | % | $ | 145.5 | 9.2 | % | ||||||||||||
|
|
|
|
|
|
|
|||||||||||||||||||
| Unaudited NonGAAP Measures |
||||||||||||||||||||||||
| Adjusted net income |
$ | 34.6 | $ | 70.5 | $ | 169.7 | ||||||||||||||||||
| Adjusted Gross margin |
425.2 | 30.3 | % | 442.0 | 31.4 | % | 561.4 | 35.3 | % | |||||||||||||||
| Adjusted R&D and SG&A |
377.3 | 363.7 | 370.8 | |||||||||||||||||||||
| Free Cash Flow |
100.9 | 31.3 | 82.1 | |||||||||||||||||||||
Year Ended December 29, 2013 Compared to Year Ended December 30, 2012
Total Revenues
| Year Ended | ||||||||||||||||
| December 29, 2013 |
December 30, 2012 |
$ Change Inc (Dec) |
% Change Inc (Dec) |
|||||||||||||
| Total revenues |
$ | 1,405.4 | $ | 1,405.9 | $ | (0.5 | ) | 0.0 | % | |||||||
Revenue was flat on a nominal basis in 2013 compared to 2012, however 2012 contained 53 weeks. Sales in 2013 increased 2% from 2012 when adjusted for the extra week. Revenue in 2012 also included $8.5 million of insurance proceeds related to business interruption claims for the company’s optoelectronics supply issues resulting from the Thailand floods in the fourth quarter of 2011.
36
Table of Contents
Geographic revenue information is based on the customer location within the indicated geographic region. The following table presents, as a percentage of sales, geographic sales for the Americas, Europe, China, Taiwan, Korea, and Other Asia/Pacific (which for our geographic reporting purposes includes Japan and Singapore) for 2013 and 2012.
| Year Ended | ||||||||
| December 29, 2013 |
December 30, 2012 |
|||||||
| United States |
9 | % | 9 | % | ||||
| Other Americas |
2 | 2 | ||||||
| Europe |
14 | 13 | ||||||
| China |
36 | 35 | ||||||
| Taiwan |
11 | 14 | ||||||
| Korea |
7 | 9 | ||||||
| Other Asia/Pacific |
21 | 18 | ||||||
|
|
|
|
|
|||||
| Total |
100 | % | 100 | % | ||||
|
|
|
|
|
|||||
The decrease in Taiwan was due primarily to lower sales into the PC market. Lower Korean sales reflect weaker demand from Samsung and another large Korean manufacturer primarily in the mobile and LCD TV sector. The increase in Other Asia/Pacific revenue was due to continued strong demand for mobile products including smart phones and tablets.
Gross Margin
| Year Ended | ||||||||||||||||
| December 29, 2013 |
December 30, 2012 |
$ Change Inc (Dec) |
% Change Inc (Dec) |
|||||||||||||
| Gross Margin $ |
$ | 416.5 | $ | 442.0 | $ | (25.5 | ) | -5.8 | % | |||||||
| Gross Margin % |
29.6 | % | 31.4 | % | — | — | ||||||||||
Gross margin declined $25.5 million or 180 basis points in 2013 compared to 2012 due primarily to mix/pricing impacts and to higher manufacturing costs associated with qualifying and ramping the new 8 inch wafer fab in Korea. We expect the efforts related to the new fab in Korea to improve manufacturing flexibility, provide better support to our customers as well as reduce costs.
Adjusted Gross Margin
| Year Ended | ||||||||||||||||
| December 29, 2013 |
December 30, 2012 |
$ Change Inc (Dec) |
% Change Inc (Dec) |
|||||||||||||
| Adjusted Gross Margin $ |
$ | 425.2 | $ | 442.0 | $ | (16.8 | ) | -3.8 | % | |||||||
| Adjusted Gross Margin % |
30.3 | % | 31.4 | % | — | 0.1 | % | |||||||||
Adjusted gross margin dollars decreased when compared to 2012 for the same reasons listed above. Adjusted gross margin for 2013 does not include the accelerated depreciation due to the 8 inch line closure at our Salt Lake City fab. There were no adjustments to 2012 gross margin. See reconciliation of gross margin to adjusted gross margin in Item 6.
37
Table of Contents
Operating Expenses
| Year Ended | ||||||||||||||||
| December 29, 2013 |
December 30, 2012 |
$ Change Inc (Dec) |
% Change Inc (Dec) |
|||||||||||||
| Research and development |
$ | 171.6 | $ | 156.9 | $ | 14.7 | 9.4 | % | ||||||||
| Selling, general and administrative |
$ | 205.7 | $ | 206.8 | $ | (1.1 | ) | -0.5 | % | |||||||
Research and development expenses increased 9.4% in 2013 compared to 2012 due to higher spending on a variety of new technologies including silicon carbide and advanced sensors. Selling, general and administrative expenses were down slightly from the prior year due to ongoing cost reductions and one less week of costs in 2013 offset by higher variable compensation expense. Operating expenses included an additional week of costs in 2012.
Adjusted Operating Expenses
| Year Ended | ||||||||||||||||
| December 29, 2013 |
December 30, 2012 |
$ Change Inc (Dec) |
% Change Inc (Dec) |
|||||||||||||
| Adjusted R&D and SG&A |
$ | 377.3 | $ | 363.7 | $ | 13.6 | 3.7 | % | ||||||||
Adjusted operating expenses increased for the same reasons listed above. There were no adjustments to 2012 R&D and SG&A.
Restructuring and Impairments
| Year Ended | ||||||||||||||||
| December 29, 2013 |
December 30, 2012 |
$ Change Inc (Dec) |
% Change Inc (Dec) |
|||||||||||||
| Restructuring and impairments |
$ | 15.9 | $ | 14.1 | $ | 1.8 | 12.8 | % | ||||||||
During 2013, we recorded restructuring and impairment charges, net of releases, totaling $15.9 million. The charges included $11.0 million in employee separation costs, $3.0 million in line closure costs, $1.6 million in asset impairment charges, $0.6 million in lease termination costs, and $0.1 million in reserve releases associated with the 2013 Infrastructure Realignment Program. In addition during 2013, we recorded $0.1 million in employee separation costs, and $0.3 million in reserve releases associated with the 2012 Infrastructure Realignment Program.
The 2013 Infrastructure Realignment Program includes costs to close the 8-inch line at the company’s Salt Lake wafer fab facility and transfer the manufacturing to the 8-inch lines in Korea and Mountaintop, as well as organizational changes in the company’s mobile product group, manufacturing support organizations, executive management, and sales organizations.
During 2012, we recorded restructuring and impairment charges, net of releases, totaling $14.1 million. The charges included $12.5 million in employee separation costs and $0.4 million in facility closure costs and $0.6 million in lease termination costs, all associated with the 2012 Infrastructure Realignment Program. In addition during 2012, we recorded $1.0 million in employee separation costs, $0.4 million in reserve releases, and $0.1 million in asset impairment charges associated with the 2011 Infrastructure Realignment Program. We also recognized $0.1 million in reserve releases in 2012 associated with the 2010 Infrastructure Realignment Program.
The 2012 Infrastructure Realignment Program includes costs for organizational changes in the company’s sales organization, manufacturing sites and manufacturing support organizations, the human resources function, executive management levels, and the MCCC and PCIA product lines as well as the termination of an IT systems lease and the final closure of a warehouse in Korea.
38
Table of Contents
The 2011 Infrastructure Realignment Program includes costs for organizational changes in the company’s supply chain management group, the website technology group, the quality organization, and other administrative groups. The 2011 program also includes costs to further improve the company’s manufacturing strategy and changes in both the PCIA and MCCC groups.
The 2010 Infrastructure Realignment Program includes costs to simplify and realign some activities within the MCCC segment, costs for the continued refinement of the company’s manufacturing strategy, and costs associated with centralizing the company’s accounting functions.
The 2009 Infrastructure Realignment Program includes costs associated with the previously planned closure of the Mountaintop, Pennsylvania manufacturing facility and the four-inch manufacturing line in Bucheon, South Korea, both of which were announced in the first quarter of 2009. The 2009 Program also includes charges for a smaller worldwide cost reduction plan to further right-size our company and remain financially healthy. The consolidation of the South Korea fabrication processes was completed in 2011
Charge for Litigation In 2013, we released $12.6 million from the reserves as a result of ongoing developments with the POWI 1 litigation.
Realized Loss on Sale of Securities In 2012, we sold our auction rate security portfolio for $23.3 million and incurred a realized loss of approximately $12.9 million on the sale.
Other Expense, net The following table presents a summary of Other expense, net for 2013 and 2012, respectively.
| Year Ended | ||||||||
| December 29, 2013 |
December 30, 2012 |
|||||||
| (In millions) | ||||||||
| Interest expense |
$ | 6.4 | $ | 7.6 | ||||
| Interest income |
(0.6 | ) | (2.0 | ) | ||||
| Other (income) expense, net |
3.4 | 2.5 | ||||||
|
|
|
|
|
|||||
| Other expense, net |
$ | 9.2 | $ | 8.1 | ||||
|
|
|
|
|
|||||
Interest expense Interest expense in 2013 decreased $1.2 million as compared to 2012, primarily due to repayment of debt.
Interest income Interest income in 2013 decreased $1.4 million as compared to 2012, primarily driven by the loss of interest income on our auction rate security portfolio and very low interest rates.
Income Taxes
| Year Ended | ||||||||||||||||
| December 29, 2013 |
December 30, 2012 |
$ Change Inc (Dec) |
% Change Inc (Dec) |
|||||||||||||
| Income before income taxes |
$ | 11.2 | $ | 23.7 | $ | (12.5 | ) | -52.7 | % | |||||||
| Provision (benefit) for income taxes |
$ | 6.2 | $ | (0.9 | ) | $ | 7.1 | 788.9 | % | |||||||
The effective tax rate for 2013 was 55.4% compared to (3.8%) for 2012. The change in effective tax rate while impacted by foreign exchange rates, was primarily driven by changes in profits among legal jurisdictions with differing tax rates. In 2013, the valuation allowance on the company’s deferred tax assets decreased by $6.9 million as deferred tax assets decreased primarily due to U.S. profits before tax as well as $2.8 million decrease to the valuation allowance related to the company’s Malaysian cumulative reinvestment allowance and manufacturing incentives. The overall decrease did not impact our results of operations.
39
Table of Contents
In accordance with the Income Taxes Topic in the FASB Accounting Standards Codification (ASC), deferred taxes have not been provided on undistributed earnings of foreign subsidiaries which are reinvested indefinitely. Certain non-U.S. earnings, which have been taxed in the U.S. but earned offshore, have and continue to be part of our repatriation plan. As of December 29, 2013, we have recorded a deferred tax liability of $2.5 million, with no impact to the consolidated statement of operations as we have a full valuation allowance against our net U.S. deferred tax assets.
Free Cash Flow
| Year Ended | ||||||||||||||||
| December 29, 2013 |
December 30, 2012 |
$ Change Inc (Dec) |
% Change Inc (Dec) |
|||||||||||||
| Free Cash Flow |
$ | 100.9 | $ | 31.3 | $ | 69.6 | 222.4 | % | ||||||||
Free cash flow is a non-GAAP financial measure. To determine free cash flow, we subtract capital expenditures from cash provided by operating activities. Free cash flow increased in 2013 primarily due to lower capital expenditures. See Free cash flow reconciliation in Item 6.
Reportable Segments The following table represents comparative disclosures of revenue and gross margin of our reportable segments.
| Year Ended | ||||||||||||||||||||||||||||||||||||||||
| December 29, 2013 | December 30, 2012 | |||||||||||||||||||||||||||||||||||||||
| Revenue | % of total |
Gross Margin |
Gross Margin % |
Operating Income (loss) |
Revenue | % of total |
Gross Margin |
Gross Margin % |
Operating Income (loss) |
|||||||||||||||||||||||||||||||
| (Dollars in millions) | ||||||||||||||||||||||||||||||||||||||||
| MCCC |
$ | 534.1 | 38.0 | % | $ | 195.6 | 36.6 | % | $ | 84.7 | $ | 570.2 | 40.5 | % | $ | 214.9 | 37.7 | % | $ | 103.5 | ||||||||||||||||||||
| PCIA |
733.4 | 52.2 | % | 210.6 | 28.7 | % | 115.8 | 694.0 | 49.4 | % | 204.1 | 29.4 | % | 120.2 | ||||||||||||||||||||||||||
| SDT |
137.9 | 9.8 | % | 24.1 | 17.5 | % | 16.5 | 141.7 | 10.1 | % | 26.9 | 19.0 | % | 18.6 | ||||||||||||||||||||||||||
| Corporate (1,2) |
— | — | (13.8 | ) | — | (196.6 | ) | — | — | (3.9 | ) | — | (197.6 | ) | ||||||||||||||||||||||||||
|
|
|
|
|
|
|
|
|
|
|
|
|
|
|
|
|
|
|
|
|
|||||||||||||||||||||
| Total |
$ | 1,405.4 | 100.0 | % | $ | 416.5 | 29.6 | % | $ | 20.4 | $ | 1,405.9 | 100.0 | % | $ | 442.0 | 31.4 | % | $ | 44.7 | ||||||||||||||||||||
|
|
|
|
|
|
|
|
|
|
|
|
|
|
|
|
|
|
|
|
|
|||||||||||||||||||||
| (1) |
| Year Ended | ||||||||
| December 29, 2013 |
December 30, 2012 |
|||||||
| Non-cash stock based compensation expense |
$ | 4.9 | $ | 4.4 | ||||
| Accelerated depreciation on assets related to line closure |
8.7 | — | ||||||
| Other |
0.2 | (0.5 | ) | |||||
|
|
|
|
|
|||||
| Total |
$ | 13.8 | $ | 3.9 | ||||
|
|
|
|
|
|||||
| (2) |
| Year Ended | ||||||||
| December 29, 2013 |
December 30, 2012 |
|||||||
| Non-cash stock based compensation expense |
$ | 27.9 | $ | 22.6 | ||||
| Restructuring and impairments expense |
15.9 | 14.1 | ||||||
| Accelerated depreciation on assets related to line closure |
8.7 | — | ||||||
| Charge for (release of) litigation |
(12.6 | ) | 1.3 | |||||
| Selling, general and administrative expense |
156.5 | 159.8 | ||||||
| Other |
0.2 | (0.2 | ) | |||||
|
|
|
|
|
|||||
| Total |
$ | 196.6 | $ | 197.6 | ||||
|
|
|
|
|
|||||
40
Table of Contents
MCCC
| Year Ended | ||||||||||||||||
| December 29, 2013 |
December 30, 2012 |
$ Change Inc (Dec) |
% Change Inc (Dec) |
|||||||||||||
| Revenue |
$ | 534.1 | $ | 570.2 | $ | (36.1 | ) | -6.3 | % | |||||||
| Gross Margin $ |
$ | 195.6 | $ | 214.9 | $ | (19.3 | ) | -9.0 | % | |||||||
| Gross Margin % |
36.6 | % | 37.7 | % | -1.1 | % | ||||||||||
| Operating Income |
$ | 84.7 | $ | 103.5 | $ | (18.8 | ) | -18.2 | % | |||||||
MCCC 2013 revenue decreased from the prior year due primarily to lower demand for MOSFETs supporting the computing and consumer end markets and one less week in 2013 compared to 2012. Gross margin and operating income decreased in 2013 compared to 2012 due primarily to underutilization charges associated with the lower sales level and higher variable compensation spending. Operating income was also impacted by higher R&D spending primarily for mobile applications.
PCIA
| Year Ended | ||||||||||||||||
| December 29, 2013 |
December 30, 2012 |
$ Change Inc (Dec) |
% Change Inc (Dec) |
|||||||||||||
| Revenue |
$ | 733.4 | $ | 694.0 | $ | 39.4 | 5.7 | % | ||||||||
| Gross Margin $ |
$ | 210.6 | $ | 204.1 | $ | 6.5 | 3.2 | % | ||||||||
| Gross Margin % |
28.7 | % | 29.4 | % | -0.7 | % | ||||||||||
| Operating Income |
$ | 115.8 | $ | 120.2 | $ | (4.4 | ) | -3.7 | % | |||||||
PCIA revenue increased in 2013 compared to 2012 due to higher high voltage sales into the industrial, appliance and automotive end markets. PCIA revenue in 2012 included $8.5 million of insurance proceeds related to the business interruption claims for the company’s optoelectronics supply issues resulting from flooding in Thailand in the fourth quarter of 2011. 2012 also included one additional week of sales. Gross margin percent decreased 70 basis points due to higher costs associated with the start up costs associated with the new 8 inch wafer fab in Korea partially offset by better utilization in other plants driven by higher sales. Lower operating income was mainly due to lower gross margin combined with higher variable compensation expenses in 2013 compared to 2012.
SDT
| Year Ended | ||||||||||||||||
| December 29, 2013 |
December 30, 2012 |
$ Change Inc (Dec) |
% Change Inc (Dec) |
|||||||||||||
| Revenue |
$ | 137.9 | $ | 141.7 | $ | (3.8 | ) | -2.7 | % | |||||||
| Gross Margin $ |
$ | 24.1 | $ | 26.9 | $ | (2.8 | ) | -10.4 | % | |||||||
| Gross Margin % |
17.5 | % | 19.0 | % | -1.5 | % | ||||||||||
| Operating Income |
$ | 16.5 | $ | 18.6 | $ | (2.1 | ) | -11.3 | % | |||||||
SDT revenue in 2013 decreased as compared to 2012 as a result of one less week. The decrease in gross margin and operating income was due primarily to changes in mix and higher variable compensation expense in 2013 compared to 2012.
41
Table of Contents
Year Ended December 30, 2012 Compared to Year Ended December 25, 2011
Total Revenues
| Year Ended | ||||||||||||||||
| December 30, 2012 |
December 25, 2011 |
$ Change Inc (Dec) |
% Change Inc (Dec) |
|||||||||||||
| Total revenues |
$ | 1,405.9 | $ | 1,588.8 | $ | (182.9 | ) | -11.5 | % | |||||||
Revenue in 2012 included $8.5 million of insurance proceeds related to business interruption claims for the company’s optoelectronics supply issues resulting from the Thailand floods in the fourth quarter of 2011. Revenue decreased in 2012 when compared to 2011, despite an extra week in 2012. The decrease in revenue was driven primarily by a decrease in average selling price, with decreases in unit volumes sold contributing an additional 1% of the change.
Geographic revenue information is based on the customer location within the indicated geographic region. The following table presents, as a percentage of sales, geographic sales for the Americas, Europe, China, Taiwan, Korea and Other Asia/Pacific (which for our geographic reporting purposes includes Japan and Singapore) for 2012 and 2011.
| Year Ended | ||||||||
| December 30, 2012 |
December 25, 2011 |
|||||||
| United States |
9 | % | 10 | % | ||||
| Other Americas |
2 | 2 | ||||||
| Europe |
13 | 13 | ||||||
| China |
35 | 33 | ||||||
| Taiwan |
14 | 14 | ||||||
| Korea |
9 | 11 | ||||||
| Other Asia/Pacific |
18 | 17 | ||||||
|
|
|
|
|
|||||
| Total |
100 | % | 100 | % | ||||
|
|
|
|
|
|||||
The increase in Other Asia/Pacific revenue was due to continued strong demand for mobile products including smart phones and tablets. There was also a shift in sales to a major customer from their Korea location to an Other Asia/Pacific location, which decreased our Korea sales and also contributed to the increase in Other Asia Pacific. The increase in China revenue was driven by growth in automotive sales as well as strong demand for mobile products. All other locations had minimal percentage changes.
Gross Margin
| Year Ended | ||||||||||||||||
| December 30, 2012 |
December 25, 2011 |
$ Change Inc (Dec) |
% Change Inc (Dec) |
|||||||||||||
| Gross Margin $ |
$ | 442.0 | $ | 559.2 | $ | (117.2 | ) | -21.0 | % | |||||||
| Gross Margin % |
31.4 | % | 35.2 | % | — | 0.0 | % | |||||||||
Effective the first day of 2012, expected asset lives and amortization schedules for certain factory equipment was adjusted to better reflect actual performance of the tools, favorably impacting gross margin by approximately $17.2 million in 2012 when compared to depreciation expense under the previous useful life policy. In addition, we reassessed the lives of our molds and tooling equipment which caused an increase in depreciation expense of $0.7 million in 2012 when compared to depreciation expense under the previous useful life policies.
42
Table of Contents
The net favorable impact to gross margin was offset by decreased revenue and higher unit costs of inventory due to lower production rates in 2012. Increased expenses from 8-inch conversion costs and 8-inch start up costs, higher inventory write downs in 2012, unfavorable foreign exchange impacts from the strengthening of the Korean Won and Malaysian Ringgit, increased depreciation expenses from 2011 capital expenditures, and increased payroll costs from 2012 annual merit increases also contributed to the increase in costs of sales and decrease in gross margin. These additional costs were partially offset by reduced variable compensation in 2012 as we did not meet our targets. These changes resulted in a net overall decrease in gross margin for 2012 as compared to 2011.
Adjusted Gross Margin
| Year Ended | ||||||||||||||||
| December 30, 2012 |
December 25, 2011 |
$ Change Inc (Dec) |
% Change Inc (Dec) |
|||||||||||||
| Adjusted Gross Margin $ |
$ | 442.0 | $ | 561.4 | $ | (119.4 | ) | -21.3 | % | |||||||
| Adjusted Gross Margin % |
31.4 | % | 35.3 | % | — | 0.1 | % | |||||||||
Adjusted gross margin dollars decreased when compared to 2011 for the same reasons listed above. Adjusted gross margin for 2011 does not include the accelerated depreciation and inventory write-offs due to the previously planned closure of the Mountaintop facility and the expense associated with a change in retirement plans at two of our Asian locations. There were no adjustments to 2012 gross margin. See reconciliation of gross margin to adjusted gross margin in Item 6.
Operating Expenses
| Year Ended | ||||||||||||||||
| December 30, 2012 |
December 25, 2011 |
$ Change Inc (Dec) |
% Change Inc (Dec) |
|||||||||||||
| Research and development |
$ | 156.9 | $ | 153.4 | $ | 3.5 | 2.3 | % | ||||||||
| Selling, general and administrative |
$ | 206.8 | $ | 218.4 | $ | (11.6 | ) | -5.3 | % | |||||||
Operating expenses included an additional week of costs in 2012 as compared to 2011. Overall R&D expenses increased slightly in 2012 when compared to 2011. Increases in R&D project spending were partially offset by decreases in variable compensation as we did not meet the associated targets for 2012. Selling and general and administration expenses (SG&A) expense decreased in 2012 when compared to 2011 driven primarily by decreases in variable compensation and equity compensation as we did not meet our performance targets for 2012.
Adjusted Operating Expenses
| Year Ended | ||||||||||||||||
| December 30, 2012 |
December 25, 2011 |
$ Change Inc (Dec) |
% Change Inc (Dec) |
|||||||||||||
| Adjusted R&D and SG&A |
$ | 363.7 | $ | 370.8 | $ | (7.1 | ) | -1.9 | % | |||||||
Adjusted operating expenses increased for the same reasons listed above. 2011 Adjusted operating expenses do not include the expense associated with a change in retirement plans at two of our Asian locations. There were no adjustments to 2012 R&D and SG&A.
43
Table of Contents
Restructuring and Impairments
| Year Ended | ||||||||||||||||
| December 30, 2012 |
December 25, 2011 |
$ Change Inc (Dec) |
% Change Inc (Dec) |
|||||||||||||
| Restructuring and impairments |
$ | 14.1 | $ | 2.8 | $ | 11.3 | 403.6 | % | ||||||||
During 2012, we recorded restructuring and impairment charges, net of releases, totaling $14.1 million. The charges included $12.5 million in employee separation costs and $0.4 million in facility closure costs and $0.6 million in lease termination costs, all associated with the 2012 Infrastructure Realignment Program. In addition during 2012, we recorded $1.0 million in employee separation costs, $0.4 million in reserve releases, and $0.1 million in asset impairment charges associated with the 2011 Infrastructure Realignment Program. We also recognized $0.1 million in reserve releases in 2012 associated with the 2010 Infrastructure Realignment Program.
The 2012 Infrastructure Realignment Program includes costs for organizational changes in the company’s sales organization, manufacturing sites and manufacturing support organizations, the human resources function, executive management levels, and the MCCC and PCIA product lines as well as the termination of an IT systems lease and the final closure of a warehouse in Korea.
During 2011, we recorded restructuring and impairment charges, net of releases, totaling $2.8 million. The charges included $5.4 million in employee separation costs and $0.2 million in reserve releases, all associated with the 2011 Infrastructure Realignment Program. In addition during 2011, we recorded $3.6 million in employee separation costs and $0.4 million in reserve releases associated with the 2010 Infrastructure Realignment Program. We also recorded $1.9 million of employee separation costs, $0.7 million of fab closure costs, and $8.2 million in reserve releases in 2011, all associated with the 2009 Infrastructure Realignment Program. This large release was driven by our decision to keep open the Mountain Top facility reversing the March 2009 announcement to close the site. Since the original announcement, we have experienced strong growth and profitability in the High Voltage and Automotive businesses. The company expects to continue the expansion of these businesses and determined that retaining the Mountain Top facility will be essential to our automotive customers’ current and future needs. As a result of this decision, we released the reserves related to Mountain Top restructuring action and paid out previously accrued employee stay-on bonuses.
The 2011 Infrastructure Realignment Program includes costs for organizational changes in the company’s supply chain management group, the website technology group, the quality organization, and other administrative groups. The 2011 program also includes costs to further improve the company’s manufacturing strategy and changes in both the PCIA and MCCC groups.
The 2010 Infrastructure Realignment Program includes costs to simplify and realign some activities within the MCCC segment, costs for the continued refinement of the company’s manufacturing strategy, and costs associated with centralizing the company’s accounting functions.
The 2009 Infrastructure Realignment Program includes costs associated with the previously planned closure of the Mountaintop, Pennsylvania manufacturing facility and the four-inch manufacturing line in Bucheon, South Korea, both of which were announced in the first quarter of 2009. The 2009 Program also includes charges for a smaller worldwide cost reduction plan to further right-size our company and remain financially healthy. The consolidation of the South Korea fabrication processes was completed in 2011
Charge for Litigation In 2012, we increased our reserves for potential litigation outcomes by $1.0 million as a result of the ongoing developments in the POWI 2 litigation. In addition, we accrued $0.3 million for an unrelated legal settlement.
Realized Loss on Sale of Securities In 2012, we sold our auction rate security portfolio for $23.3 million and incurred a realized loss of approximately $12.9 million on the sale.
44
Table of Contents
Other Expense, net The following table presents a summary of Other expense, net for 2012 and 2011, respectively.
| Year Ended | ||||||||
| December 30, 2012 |
December 25, 2011 |
|||||||
| (In millions) | ||||||||
| Interest expense |
$ | 7.6 | $ | 7.3 | ||||
| Interest income |
(2.0 | ) | (2.7 | ) | ||||
| Other (income) expense, net |
2.5 | 2.6 | ||||||
|
|
|
|
|
|||||
| Other expense, net |
$ | 8.1 | $ | 7.2 | ||||
|
|
|
|
|
|||||
Interest expense Interest expense in 2012 increased $0.3 million as compared to 2011, primarily due to higher net interest rates.
Interest income Interest income in 2012 decreased $0.7 million as compared to 2011, primarily driven by the loss of interest income on our auction rate security portfolio and slightly lower cash and investment balances.
Income Taxes
| Year Ended | ||||||||||||||||
| December 30, 2012 |
December 25, 2011 |
$ Change Inc (Dec) |
% Change Inc (Dec) |
|||||||||||||
| Income (loss) before income taxes |
$ | 23.7 | $ | 157.7 | $ | (134.0 | ) | -85.0 | % | |||||||
| Provision (benefit) for income taxes |
$ | (0.9 | ) | $ | 12.2 | $ | (13.1 | ) | -107.4 | % | ||||||
The effective tax rate for 2012 was (3.8)% compared to 7.7% for 2011. The change in effective tax rate is primarily due to shifts of income and loss among jurisdictions with differing tax rates and foreign currency revaluations of tax assets and liabilities. In 2012, the valuation allowance on the company’s deferred tax assets decreased by $16.6 million as deferred tax assets decreased due to the expiration of credit carry forwards and adjustments to other comprehensive income. The overall decrease did not impact our results of operations.
In accordance with the Income Taxes Topic in the FASB Accounting Standards Codification (ASC), deferred taxes have not been provided on undistributed earnings of foreign subsidiaries which are reinvested indefinitely. Certain non-U.S. earnings, which have been taxed in the U.S. but earned offshore, have and continue to be part of our repatriation plan. As of December 30, 2012, we have recorded a deferred tax liability of $1.8 million, with no impact to the consolidated statement of operations as we have a full valuation allowance against our net U.S. deferred tax assets.
Free Cash Flow
| Year Ended | ||||||||||||||||
| December 30, 2012 |
December 25, 2011 |
$ Change Inc (Dec) |
% Change Inc (Dec) |
|||||||||||||
| Free Cash Flow |
$ | 31.3 | $ | 82.1 | $ | (50.8 | ) | -61.9 | % | |||||||
Free cash flow is a non-GAAP financial measure. To determine free cash flow, we subtract capital expenditures from cash provided by operating activities. Free cash flow decreased in 2012 as a result of decreased cash provided by operating activities primarily driven by reduced net income. This was partially offset by a decrease in capital expenditures of $34.5 million. See free cash flow reconciliation in Item 6.
45
Table of Contents
Reportable Segments The following table represents comparative disclosures of revenue and gross margin of our reportable segments.
| Year Ended | ||||||||||||||||||||||||||||||||||||||||
| December 30, 2012 | December 25, 2011 | |||||||||||||||||||||||||||||||||||||||
| Revenue | % of total |
Gross Margin |
Gross Margin % |
Operating Income (loss) |
Revenue | % of total |
Gross Margin |
Gross Margin % |
Operating Income (loss) |
|||||||||||||||||||||||||||||||
| (Dollars in millions) | ||||||||||||||||||||||||||||||||||||||||
| MCCC |
$ | 570.2 | 40.5 | % | $ | 214.9 | 37.7 | % | $ | 103.5 | $ | 579.1 | 36.5 | % | $ | 215.1 | 37.2 | % | $ | 100.4 | ||||||||||||||||||||
| PCIA |
694.0 | 49.4 | % | 204.1 | 29.4 | % | 120.2 | 807.4 | 50.8 | % | 296.4 | 36.7 | % | 211.9 | ||||||||||||||||||||||||||
| SDT |
141.7 | 10.1 | % | 26.9 | 19.0 | % | 18.6 | 202.3 | 12.7 | % | 54.3 | 26.8 | % | 46.3 | ||||||||||||||||||||||||||
| Corporate (1,2) |
— | — | (3.9 | ) | — | (197.6 | ) | — | — | (6.6 | ) | — | (193.7 | ) | ||||||||||||||||||||||||||
|
|
|
|
|
|
|
|
|
|
|
|
|
|
|
|
|
|
|
|
|
|||||||||||||||||||||
| Total |
$ | 1,405.9 | 100.0 | % | $ | 442.0 | 31.4 | % | $ | 44.7 | $ | 1,588.8 | 100.0 | % | $ | 559.2 | 35.2 | % | $ | 164.9 | ||||||||||||||||||||
|
|
|
|
|
|
|
|
|
|
|
|
|
|
|
|
|
|
|
|
|
|||||||||||||||||||||
(1)
| Year Ended | ||||||||
| December 30, 2012 |
December 25, 2011 |
|||||||
| Non-cash stock based compensation expense |
$ | 4.4 | $ | 4.3 | ||||
| Accelerated depreciation on assets related to fab closure |
— | 0.7 | ||||||
| Retirement plan changes |
— | 1.7 | ||||||
| Other |
(0.5 | ) | (0.1 | ) | ||||
|
|
|
|
|
|||||
| Total |
$ | 3.9 | $ | 6.6 | ||||
|
|
|
|
|
|||||
(2)
| Year Ended | ||||||||
| December 30, 2012 |
December 25, 2011 |
|||||||
| Non-cash stock based compensation expense |
$ | 22.6 | $ | 24.8 | ||||
| Restructuring and impairments expense |
14.1 | 2.8 | ||||||
| Charge for litigation |
1.3 | — | ||||||
| Selling, general and administrative expense |
159.8 | 162.8 | ||||||
| Other |
(0.2 | ) | 3.3 | |||||
|
|
|
|
|
|||||
| Total |
$ | 197.6 | $ | 193.7 | ||||
|
|
|
|
|
|||||
MCCC
| Year Ended | ||||||||||||||||
| December 30, 2012 |
December 25, 2011 |
$ Change Inc (Dec) |
% Change Inc (Dec) |
|||||||||||||
| Revenue |
$ | 570.2 | $ | 579.1 | $ | (8.9 | ) | -1.5 | % | |||||||
| Gross Margin $ |
$ | 214.9 | $ | 215.1 | $ | (0.2 | ) | -0.1 | % | |||||||
| Gross Margin % |
37.7 | % | 37.2 | % | 0.5 | % | ||||||||||
| Operating Income |
$ | 103.5 | $ | 100.4 | $ | 3.1 | 3.1 | % | ||||||||
MCCC’s 2012 revenue was slightly lower when compared to 2011 due to a decline in average selling prices which was attributable to competitive pricing pressure on existing products, offset slightly by increased prices on newly introduced products. The decline in overall average selling prices was offset by increased unit sales on mobile products in 2012. Gross margin dollars were flat when compared to 2011, while gross margin percent improved slightly. Improvement in gross margin percent was driven by reduced variable compensation as well as cost savings programs in the low voltage group. These improvements were offset in part by higher inventory reserves and increased subcontractor qualification costs for mobile products.
46
Table of Contents
MCCC operating income increased slightly in 2012 as compared to 2011 as a result of reduced variable compensation expense and lower general and administrative expense (G&A) even with an additional week of costs during 2012. These decreases were offset in part by additional R&D investment in our mobile business.
PCIA
| Year Ended | ||||||||||||||||
| December 30, 2012 |
December 25, 2011 |
$ Change Inc (Dec) |
% Change Inc (Dec) |
|||||||||||||
| Revenue |
$ | 694.0 | $ | 807.4 | $ | (113.4 | ) | -14.0 | % | |||||||
| Gross Margin $ |
$ | 204.1 | $ | 296.4 | $ | (92.3 | ) | -31.1 | % | |||||||
| Gross Margin % |
29.4 | % | 36.7 | % | -7.3 | % | ||||||||||
| Operating Income |
$ | 120.2 | $ | 211.9 | $ | (91.7 | ) | -43.3 | % | |||||||
PCIA revenue in 2012 included $8.5 million of insurance proceeds related to the business interruption claims for the company’s optoelectronics supply issues resulting from flooding in Thailand in the fourth quarter of 2011. The 14% revenue decrease in 2012 as compared to 2011 was driven by a 7% decrease in average selling prices and a 7% decrease in overall unit sales. The decrease in average selling prices and units was primarily driven by our high voltage group and was attributable to reduced market demand for these products and efforts to reduce channel inventory. The decreased revenue from high voltage products was mitigated in part by increased revenue for our automotive and power conversion products. Favorable gross margin impacts in 2012 from lower variable compensation were offset by decreased high voltage revenue, increased 8 inch conversion costs, and unfavorable foreign exchange impacts in 2012.
Lower operating income was mainly due to decreased gross margin as well as increased R&D expense in high voltage and auto product lines. In addition, operating expenses included an additional week of costs in 2012 as compared to 2011. These increases were offset in part by lower selling, general and administrative expenses (SG&A) and reduced variable compensation expenses.
SDT
| Year Ended | ||||||||||||||||
| December 30, 2012 |
December 25, 2011 |
$ Change Inc (Dec) |
% Change Inc (Dec) |
|||||||||||||
| Revenue |
$ | 141.7 | $ | 202.3 | $ | (60.6 | ) | -30.0 | % | |||||||
| Gross Margin $ |
$ | 26.9 | $ | 54.3 | $ | (27.4 | ) | -50.5 | % | |||||||
| Gross Margin % |
19.0 | % | 26.8 | % | -7.8 | % | ||||||||||
| Operating Income |
$ | 18.6 | $ | 46.3 | $ | (27.7 | ) | -59.8 | % | |||||||
SDT revenue in 2012 decreased as compared to 2011 as a result of strategic efforts to eliminate lower margin products and also reduced overall market demand. Lower average selling prices also contributed to the decrease in SDT revenue as compared to 2011. Lower gross margin was due to lower revenue and higher overhead costs.
The decrease in operating income was primarily due to lower gross margin. R&D and sales and marketing expenses were also higher in 2012 as a result of increased investment in R&D and sales and marketing. In addition operating expenses included an additional week of costs in 2012 as compared to 2011. This increase was offset in part by reduced variable compensation costs.
Liquidity and Capital Resources
Our main sources of liquidity are our cash flows from operations, cash and cash equivalents and revolving credit facility.
47
Table of Contents
The Credit Facility consists of a $400.0 million revolving loan agreement, of which $200.0 million was drawn as of December 29, 2013. Additionally, we have the ability to incrementally increase the commitments under the agreement up to $300 million. The Credit Facility imposes various restrictions upon us that could limit our ability to respond to market conditions, to provide for unanticipated capital investments or to take advantage of business opportunities. It also includes restrictive covenants that limit our ability to consolidate, merge or enter into acquisitions, create liens, pay dividends or make similar restricted payments, sell assets, invest in capital expenditures and incur indebtedness. The Credit Facility also limits our ability to modify our certificate of incorporation and bylaws, or enter into shareholder agreements, voting trusts or similar arrangements. In addition, the affirmative covenants in the Credit Facility also require the company’s financial performance to comply with certain financial measures, as defined by the credit agreement. These financial covenants require us to maintain a minimum interest coverage ratio of 3.0 to 1.0 and a maximum leverage ratio of 3.25 to 1.0. It defines the interest coverage ratio as the ratio of the cumulative four quarter trailing consolidated earnings before interest, taxes, depreciation and amortization (EBITDA) to consolidated cash interest expense and defines the maximum leverage ratio as the ratio of total consolidated debt to the cumulative four quarter trailing consolidated EBITDA. Consolidated EBITDA, as defined by the credit agreement excludes restructuring, non-cash equity compensation and certain other adjustments.
At December 29, 2013, we were in compliance with these covenants and we expect to remain in compliance. This expectation is subject to various risks and uncertainties discussed more thoroughly in Item 1A, and include, among others, the risk that our assumptions and expectations about business conditions, expenses and cash flows for the remainder of the year may be inaccurate.
Under the Credit Facility, borrowing may be in the form of either Eurocurrency Loans or Alternate Base Rate (ABR) loans. Eurocurrency Loans accrue interest at the London Interbank Offered Rate (LIBOR) plus 1.75%. The ABR is the highest of JP Morgan Chase Bank’s prime rate, the federal funds effective rate plus 0.5 percent, or adjusted LIBOR, as defined by the credit agreement, plus 1%. ABR loans accrue interest at the ABR rate plus 0.75%. The company also pays a commitment fee of 0.35% per annum on the unutilized commitments.
While our Credit Facility places restrictions on the payment of dividends under certain conditions, it does not restrict the subsidiaries of Fairchild Semiconductor Corporation, except to a limited extent, from paying dividends or making advances to Fairchild Semiconductor Corporation. As a result, we believe that funds generated from operations, together with existing cash and funds from our Credit Facility will be sufficient to meet our debt obligations, operating requirements, capital expenditures and research and development funding needs over the next twelve months. In 2013, we incurred capital expenditures of $75 million.
At December 29, 2013, under our Credit Facility, we have borrowing capacity of $200.0 million for working capital and general corporate purposes, including acquisitions. There are also outstanding letters of credit under the Credit Facility totaling $516 thousand. These outstanding letters of credit reduce the amount available under the Credit Facility to $199.5 million. We had additional outstanding letters of credit of $765 thousand that do not fall under the Credit Facility. We also had $3.5 million of undrawn credit facilities at certain of our foreign subsidiaries. These outstanding amounts do not impact available borrowings under the senior credit facility. Borrowings under the Credit Facility are secured by a pledge of common stock of the company’s first tier domestic subsidiaries and 65% of the stock of the company’s first tier foreign subsidiaries. The payment of principal and interest on the Credit Facility is fully and unconditionally guaranteed by Fairchild Semiconductor International, Inc. and each of its domestic subsidiaries.
We frequently evaluate opportunities to sell additional equity or debt securities, obtain credit facilities from lenders or restructure our long-term debt to further strengthen our financial position. Additional borrowing or equity investment may be required to fund future acquisitions. The sale of additional equity securities could result in additional dilution to our stockholders. In December 2013, the Board of Directors authorized the purchase of common stock up to $100 million. Purchases are authorized through December 2014.
48
Table of Contents
As of December 29, 2013, we had $3.0 million of net unrecognized tax benefits recorded in non-current taxes payable. As of December 30, 2012, we had $3.0 million of net unrecognized tax benefits recorded in non-current taxes payable. The timing of the expected cash outflow relating to the balance is not reliably determinable at this time.
As of December 29, 2013, our cash, cash equivalents and short-term and long-term securities were $420.1 million, an increase of $11.5 million from December 30, 2012. $208.3 million of the cash and cash equivalents balance is located in the United States.
During 2013, our cash provided by operating activities was $176.1 million compared to $183.2 million in 2012. The following table presents a summary of net cash provided by operating activities during 2013 and 2012, respectively.
| Year Ended | ||||||||
| December 29, 2013 |
December 30, 2012 |
|||||||
| (In millions) | ||||||||
| Net income |
$ | 5.0 | $ | 24.6 | ||||
| Depreciation and amortization |
145.2 | 135.3 | ||||||
| Non-cash stock-based compensation |
27.9 | 22.6 | ||||||
| Non-cash realized loss on sale of investments |
— | 12.9 | ||||||
| Non-cash restructuring |
1.5 | 0.1 | ||||||
| Deferred income taxes, net |
(4.8 | ) | (11.2 | ) | ||||
| Release of Litigation Charge |
(12.6 | ) | ||||||
| Other, net |
5.2 | 2.5 | ||||||
| Change in other working capital accounts |
8.7 | (3.6 | ) | |||||
|
|
|
|
|
|||||
| Net cash provided by operating activities |
$ | 176.1 | $ | 183.2 | ||||
|
|
|
|
|
|||||
Cash provided by operating activities in 2013 decreased by $7.1 million compared to 2012 primarily due to a decrease in net income which was partially offset by favorable changes is other working capital accounts.
Cash used in investing activities during 2013 totaled $77.0 million compared to $131 million in 2012. There were no acquisitions in 2013. Capital expenditures were $75.2 million in 2013 compared to $151.9 million in 2012.
Cash used in financing activities totaled $87.2 million in 2013 as compared to $69.6 million in 2012. The increase in cash used in 2013 was driven by an increased amount of treasury shares purchased as shown in the table below.
| Year Ended | ||||||||
| December 29, 2013 |
December 30, 2012 |
|||||||
| (In millions) | ||||||||
| Cash flows from financing activities |
||||||||
| Repayment of long term debt |
(50.0 | ) | (50.0 | ) | ||||
| Issuance of long term debt |
— | — | ||||||
| Proceeds from issuance of common stock and from exercise of stock options |
1.1 | 5.0 | ||||||
| Purchase of treasury stock |
(29.0 | ) | (13.9 | ) | ||||
| Shares withheld for employee taxes |
(9.3 | ) | (10.7 | ) | ||||
|
|
|
|
|
|||||
| Net cash used in financing activites |
$ | (87.2 | ) | $ | (69.6 | ) | ||
|
|
|
|
|
|||||
49
Table of Contents
The table below summarizes our significant contractual obligations as of December 29, 2013 and the effect such obligations are expected to have on our liquidity and cash flows in future periods.
| Contractual Obligations |
Total | Less than 1 year |
1-3 years |
4-5 years |
After 5 years |
|||||||||||||||
| (In millions) | ||||||||||||||||||||
| Debt Obligations - Principle |
$ | 200.0 | $ | 200.0 | ||||||||||||||||
| Debt Obligations - Interest (1) |
10.6 | 4.0 | 6.6 | |||||||||||||||||
| Operating Lease Obligations (2) |
41.5 | 18.1 | 20.7 | 2.7 | — | |||||||||||||||
| Letters of Credit |
3.5 | 3.5 | ||||||||||||||||||
| Capital Purchase Obligations (3) |
4.5 | 4.5 | ||||||||||||||||||
| Other Purchase Obligations and Commitments (4) |
35.1 | 26.3 | 4.5 | 1.1 | 3.2 | |||||||||||||||
| Royalty Obligations |
3.8 | 1.0 | 2.0 | 0.8 | ||||||||||||||||
| Executive Compensation Agreements |
2.5 | 0.1 | 0.2 | 0.3 | 1.9 | |||||||||||||||
|
|
|
|
|
|
|
|
|
|
|
|||||||||||
| Total (5) |
$ | 301.5 | $ | 57.5 | $ | 234.0 | $ | 4.9 | $ | 5.1 | ||||||||||
|
|
|
|
|
|
|
|
|
|
|
|||||||||||
| (1) | Interest rate on debt is variable. Interest payments were estimated using the 2.1% interest rate in effect currently (see Item 8, Note 7 for additional information |
| (2) | Represents future minimum lease payments under noncancelable operating leases. |
| (3) | Capital purchase obligations represent commitments for purchase of plant and equipment. They are not recorded as liabilities on our balance sheet as of December 29, 2013, as we have not yet received the related goods or taken title to the property. |
| (4) | For the purposes of this table, contractual obligations for purchase of goods or services are defined as agreements that are enforceable and legally binding and that specify all significant terms, including: fixed or minimum quantities to be purchased; fixed, minimum or variable price provisions; and the approximate timing of the transaction. Our purchase orders are based on our current manufacturing needs and are fulfilled by our vendors within short time horizons. |
| (5) | We had $3.3 million of unrecognized tax benefits at December 29, 2013. The timing of the expected cash outflow relating to the balance is not reliably determinable at this time. In addition, the total does not include any contractual obligations recorded on the balance sheet as current liabilities other than certain purchase obligations as discussed below. |
It is customary practice in the semiconductor industry to enter into guaranteed purchase commitments or “take or pay” arrangements for purchases of certain equipment and raw materials. Obligations under these arrangements are included in (4) above.
Contractual obligations that are contingent upon the achievement of certain milestones are not included in the table above. These obligations include contingent funding/payment obligations and milestone-based equity compensation funding. These arrangements are not considered contractual obligations until the milestone is met.
We also enter into contracts for outsourced services; however, the obligations under these contracts were not significant at December 29, 2013 and the contracts generally contain clauses allowing for cancellation without significant penalty.
The expected timing of payment of the obligations discussed above is estimated based on current information. Timing of payments and actual amounts paid may be different depending on the time of receipt of goods or services or changes to agreed-upon amounts for some obligations.
Critical Accounting Policies and Estimates
The discussion and analysis of our financial condition and results of operations is based upon our consolidated financial statements, which have been prepared in accordance with accounting principles generally accepted in the U.S. The preparation of these financial statements requires us to make estimates and judgments
50
Table of Contents
that affect the reported amounts of assets, liabilities, revenues and expenses, and related disclosure of contingent assets and liabilities. The U.S. Securities and Exchange Commission has defined critical accounting policies as those that are both most important to the portrayal of our financial condition and results and which require our most difficult, complex or subjective judgments or estimates. Based on this definition, we believe our critical accounting policies include the policies of revenue recognition, sales reserves, inventory valuation, fair value of financial instruments, impairment of long-lived assets, income taxes and loss contingencies. For all financial statement periods presented, there have been no material modifications to the application of these critical accounting policies.
On an ongoing basis, we evaluate the judgments and estimates underlying all of our critical accounting policies. These estimates and the underlying assumptions affect the amounts of assets and liabilities reported, disclosures, and reported amounts of revenues and expenses. These estimates and assumptions are based on our best estimates and judgment. We evaluate our estimates and assumptions using historical experience and other factors, including the current economic environment, which we believe to be reasonable under the circumstances. We adjust such estimates and assumptions when facts and circumstances dictate. Illiquid credit markets, volatile equity, foreign currency, and energy markets, and declines in consumer spending have combined to increase the uncertainty inherent in such estimates and assumptions. As future events and their effects cannot be determined with precision, actual results could differ significantly from these estimates. Changes in those estimates resulting from continuing changes in the economic environment will be reflected in the financial statements in future periods.
Revenue Recognition and Sales Reserves No revenue is recognized unless there is persuasive evidence of an arrangement, the price to the buyer is fixed or determinable, delivery has occurred and collectability of the sales price is reasonably assured. Revenue from the sale of semiconductor products is recognized when title and risk of loss transfers to the customer, which is generally when the product is received by the customer. In some cases, title and risk of loss do not pass to the customer when the product is received by them. In these cases, we recognize revenue at the time when title and risk of loss is transferred, assuming all other revenue recognition criteria have been satisfied. These cases include several inventory locations where we manage consigned inventory for our customers, some of which is at customer facilities. In such cases, revenue is not recognized when products are received at these locations; rather, revenue is recognized when customers take the inventory from the location for their use. Shipping costs billed to our customers are included within revenue with associated costs classified in cost of goods sold.
Approximately 61% of our revenue in 2013 is generated through sales to distributors. Distributor payments are due under agreed terms and are not contingent upon resale or any other matter other than the passage of time. We have agreements with some distributors and customers for various programs, including prompt payment discounts, pricing protection, scrap allowances and stock rotation. Sales to these distributors and customers, as well as the existence of sales incentive programs, are in accordance with terms set forth in written agreements with these distributors and customers. In general, credits allowed under these programs are capped based upon individual distributor agreements. We record charges associated with these programs as a reduction of revenue based upon historical activity and our expectation of future activity. We also have volume based incentives with certain distributors to encourage stronger resales of our products. Reserves are recorded as a reduction to revenue as they are earned by the distributor. Our policy is to use both a three to six month rolling historical experience rate as well as a prospective view of products in the distributor channel for distributors who participate in an incentive program in order to estimate the necessary allowance to be recorded. In addition, the products sold by us are subject to a limited product quality warranty. We accrue for estimated incurred but unidentified quality issues based upon historical activity and known quality issues if a loss is probable and can be reasonably estimated. The standard limited warranty period is one year. Quality returns are accounted for as a reduction of revenue. Historically, we have not experienced material differences between our estimated sales reserves and actual results.
51
Table of Contents
Inventory Valuation In determining the net realizable value of our inventories, we review the valuations of inventory considered excessively old, and therefore subject to, obsolescence and inventory in excess of customer backlog and historical rates of demand. We also value inventory at the lower of cost or market. Once established, write-downs of inventory are considered permanent adjustments to the cost basis of inventory.
Fair Value of Financial Instrument Securities and derivatives are financial instruments that are recorded at fair value on a recurring basis. The Fair Value Measurements and Disclosures Topic of the FASB ASC, defines fair value as the exchange price that would be received for an asset or paid to transfer a liability in the principal or most advantageous market in an orderly transaction between market participants at the measurement date.
In accordance with the requirements of the Fair Value Measurements and Disclosures Topic of the FASB ASC, we group our financial assets and liabilities measured at fair value on a recurring basis in three levels, based on the markets in which the assets and liabilities are traded and the reliability of the assumptions used to determine fair value. These levels are:
| • | Level 1—Valuation is based upon quoted market price for identical instruments traded in active markets. |
| • | Level 2—Valuation is based on quoted market prices for similar instruments in active markets, quoted prices for identical or similar instruments in markets that are not active, and model-based valuation techniques for which all significant assumptions are observable in the market. |
| • | Level 3—Valuation is generated from model-based techniques that use significant assumptions not observable in the market. Valuation techniques include use of discounted cash flow models and similar techniques. |
It is our policy to maximize the use of observable inputs and minimize the use of unobservable inputs when developing fair value measurements. When available, we use quoted market prices to measure fair value. If market prices are not available, fair value measurements are based on models that use primarily market based parameters including interest rate yield curves, option volatilities, and currency rates. In certain cases where market rate assumptions are not available, we are required to make judgments about assumptions market participants would use to estimate the fair value of a financial instrument. The only financial instruments which have not been classified as either Level 1 or Level 2 are auction rate securities. All auction rate securities were sold in the fourth quarter of 2012. In the past, there was insufficient demand for these types of investments and as a result the investments were not considered liquid. Since observable market prices and parameters were not available in previous years for the auction rate securities, judgment was required to estimate fair value. A discounted cash flow (DCF) calculation was used to determine the estimated fair value. The assumptions used in preparing the DCF model included estimates for the amount and timing of future interest and principal payments and the rate of return required by investors to own these securities in the current environment. In making these assumptions, relevant factors that were considered included: the formula applicable to each security which defines the interest rate paid to investors in the event of a failed auction; forward projections of the interest rate benchmarks specified in such formulas; the likely timing of principal repayments; the probability of full repayment considering guarantees by third parties and additional credit enhancements provided through other means. The estimate of the rate of return required by investors to own these securities also considered the reduced liquidity for auction rate securities. The primary unobservable input to the valuation was the maturity assumption which ranged from six to twelve years depending on the individual auction rate security. The maturity assumptions were based on the terms of the underlying instrument and the potential for restructuring the auction rate security. The results of these fair value calculations were imprecise. The actual sale was for 90% of the third quarter of 2012 fair value estimate.
In the valuation of our derivative instruments, we consider our credit risk and the credit risk of our counterparties. Based on our current credit standing and the credit standing of our counterparties credit risk has not had a material impact in the valuation of our derivatives.
52
Table of Contents
See Item 8, Note 3 for a complete discussion on our use of fair valuation of financial instruments, our related measurement techniques, and its impact to our financial statements.
Impairment of Long-Lived Assets We assess the impairment of long-lived assets, including goodwill, on an ongoing basis and whenever events or changes in circumstances indicate that the carrying value may not be recoverable.
Goodwill is also subject to an annual impairment test, or more frequently, if indicators of potential impairment arise. During 2011, we adopted Accounting Standards Update (ASU) 2011-08, Intangibles—Goodwill and Other—Testing Goodwill for Impairment. ASU 2011-08 intends to simplify goodwill impairment testing by permitting assessment of qualitative factors to determine whether events and circumstances lead to the conclusion that it is necessary to perform the two-step goodwill impairment test currently required under ASU 350, Intangibles Goodwill and Other. We performed the qualitative analysis in 2012 and concluded that our reporting units would not be subject to the two-step goodwill impairment test. In 2013, we conducted step I of the quantitative goodwill impairment test, and concluded that there was no goodwill impairment and that the performance of the step II testing was not necessary.
When the two-step impairment test is performed, the fair value of our reporting units is determined using a combination of the income approach, which estimates the fair value of our reporting units based on a discounted cash flow approach, and the market approach which estimates the fair value of our reporting units based on comparable market multiples. The comparable companies are primarily the major competitors listed in Item 1 of this report. The discount rates utilized in the discounted cash flows ranged from approximately 9.9% to 12.7%, reflecting market based estimates of capital costs and discount rates adjusted for a market participants view with respect to execution, concentration, and other risks associated with the projected cash flows of the individual segments. The average fair value is reconciled to our market capitalization with an appropriate control premium. Moreover, management performed various sensitivity analysis based on several key input variables, which further supported the conclusion that there was no goodwill impairment.
The determination of the fair value of the reporting units requires us to make significant estimates and assumptions. These estimates and assumptions primarily include but are not limited to; the selection of appropriate peer group companies, control premiums appropriate for acquisitions in the industries in which we compete, the discount rate, terminal growth rates, forecasts of revenue and expense growth rates, changes in working capital, depreciation and amortization, and capital expenditures. Due to the inherent uncertainty involved in making these estimates, actual financial results could differ from those estimates. Changes in assumptions concerning future financial results or other underlying assumptions would have a significant impact on either the fair value of the reporting unit or the amount of the goodwill impairment charge. We use judgment in assessing whether assets may have become impaired between annual impairment tests. Indicators such as unexpected adverse business conditions, economic factors, unanticipated technological change or competitive activities, loss of key personnel and acts by governments and courts, may signal that an asset has become impaired.
In 2013, 2012 and 2011, there were no goodwill impairments and the fair values of the reporting units with goodwill were substantially in excess of book values.
For all other long-lived assets, our impairment review process is based upon an estimate of future undiscounted cash flows. Factors we consider that could trigger an impairment review include the following:
| • | significant underperformance relative to expected historical or projected future operating results, |
| • | significant changes in the manner of our use of the acquired assets or the strategy for our overall business, |
53
Table of Contents
| • | significant negative industry or economic trends, and |
| • | significant technological changes, which would render equipment and manufacturing processes obsolete. |
Recoverability of assets that will continue to be used in our operations is measured by comparing the carrying value to the future net undiscounted cash flows expected to be generated by the asset or asset group. Future undiscounted cash flows include estimates of future revenues, driven by market growth rates, and estimated future costs. There were no trigger events in 2013, 2012 or 2011 that caused us to evaluate our other long lived assets for impairment.
Income Taxes Income taxes are accounted for under the asset and liability method. Under this method, deferred tax assets and liabilities are recognized for the future tax consequences attributable to differences between the financial statement carrying amounts of existing assets and liabilities and their respective tax bases. Deferred tax assets and liabilities are measured using enacted tax rates expected to apply to taxable income in the years in which those temporary differences are expected to be recovered or settled. The effect on deferred tax assets and liabilities of a change in tax rates is recognized in income in the period that includes the enactment date. Deferred taxes are not provided for the undistributed earnings of our foreign subsidiaries that are considered to be indefinitely reinvested outside of the U.S. We plan to repatriate certain non-U.S. earnings which have been taxed in the U.S. but earned offshore as well as any non-U.S. earnings that are not considered to be indefinitely invested outside the U.S.
We make judgments regarding the realizability of our deferred tax assets. In accordance with the Income Tax topic of the ASC, the carrying value of the net deferred tax assets is based on the belief that it is more likely than not that we will generate sufficient future taxable income in certain jurisdictions to realize these deferred tax assets after consideration of all available positive and negative evidence. Future realization of the tax benefit of existing deductible temporary differences or carryforwards ultimately depends on the existence of sufficient taxable income of the appropriate character within the carryback and carryforward period available under the tax law. Future reversals of existing taxable temporary differences, projections of future taxable income excluding reversing temporary differences and carryforwards, taxable income in prior carryback years, and prudent and feasible tax planning strategies that would, if necessary, be implemented to preserve the deferred tax asset may be considered to identify possible sources of taxable income.
Valuation allowances have been established for deferred tax assets, which we believe do not meet the “more likely than not” criteria established by the Income Tax topic of the ASC. In 2005, we established a full valuation allowance against our net U.S. deferred tax assets excluding certain deferred tax liabilities related to indefinite-lived goodwill. We recorded a valuation allowance in 2005 and continue to carry the valuation allowance in 2013 as our trend of positive evidence does not currently support such a release. In 2008, a deferred tax asset and full valuation allowance was recorded in the amount of $24.8 million relating to our Malaysian cumulative reinvestment allowance and manufacturing incentives. Based on an update of the jurisdictional financial history and current forecast, it was management’s belief that we did meet the standard of “more likely than not” that is required for measuring the likelihood of a realization of net deferred tax assets, and was reflected in the partial release. In 2013, the Malaysian deferred tax asset decreased to $32.2 million while the ending valuation allowance decreased to $26.3 million. The partial valuation release decreased by $0.2 million. We will continue to evaluate book and taxable income trends, and their impact on the amount and timing of valuation allowance adjustments.
If we are able to utilize all or a portion of the deferred tax assets for which a valuation allowance has been established, the related portion of the valuation allowance is released to income from continuing operations, additional paid-in capital or to other comprehensive income.
The calculation of our tax liabilities includes addressing uncertainties in the application of complex tax regulations in a multitude of jurisdictions. The Income Tax topic of the ASC clarifies the accounting for
54
Table of Contents
uncertainty in income taxes recognized in an enterprise’s financial statements. The topic prescribes a recognition threshold and measurement attribute for the financial statement recognition and measurement of a tax position taken or expected to be taken in a tax return.
We recognize liabilities for anticipated tax audit issues in the U.S. and other tax jurisdictions based on our recognition threshold and measurement attribute of whether it is more likely than not that the positions we have taken in tax filings will be sustained upon tax audit, and the extent to which, additional taxes would be due. If payment of these amounts ultimately proves to be unnecessary, the reversal of the liabilities would result in tax benefits being recognized in the period in which it is determined the liabilities are no longer necessary. If the estimate of tax liabilities proves to be less than the ultimate assessment, a further charge to expense would result.
Loss Contingencies The outcomes of legal proceedings and claims brought against us are subject to significant uncertainty. The Contingency topic of the ASC requires that an estimated loss from a loss contingency such as a legal proceeding or claim should be accrued by a charge to income if it is probable that an asset has been impaired or a liability has been incurred and the amount of the loss can be reasonably estimated. Disclosure of a contingency is required if there is at least a reasonable possibility that a loss has been incurred. In determining whether a loss should be accrued we evaluate, among other factors, the degree of probability of an unfavorable outcome and the ability to make a reasonable estimate of the amount of loss. We regularly evaluate current information available to us to determine whether such accruals should be adjusted. Changes in our evaluation could materially impact our financial position or our results of operations.
Forward Looking Statements
This annual report, including but not limited to the section entitled “Status of First Quarter Business”, contains “forward-looking statements” as that term is defined in Section 21E of the Securities Exchange Act of 1934. Forward-looking statements can be identified by the use of forward-looking terminology such as “we believe,” “we expect,” “we intend,” “may,” “will,” “should,” “seeks,” “approximately,” “plans,” “estimates,” “anticipates,” or “hopeful,” or the negative of those terms or other comparable terms, or by discussions of our strategy, plans or future performance. For Example, the Status of First Quarter Business below contains numerous forward-looking statements. All forward-looking statements in this report are made based on management’s current expectations and estimates, which involve risks and uncertainties, including those described below and more specifically in the Risk Factors section. Among these factors are the following: current economic uncertainty, including disruptions in the credit markets, as well as future economic conditions; changes in demand for our products; changes in inventories at our customers and distributors; changes in regional or global economic or political conditions (including as a result of terrorist attacks and responses to them); technological and product development risks, including the risks of failing to maintain the right to use some technologies or failing to adequately protect our own intellectual property against misappropriation or infringement; availability of manufacturing capacity; the risk of production delays; the inability to attract and retain key management and other employees; risks related to warranty and product liability claims; risks inherent in doing business internationally; changes in tax regulations or the migration of profits from low tax jurisdictions to higher tax jurisdictions; availability and cost of raw materials; competitors’ actions; loss of key customers, including but not limited to distributors; order cancellations or reduced bookings; changes in manufacturing yields or output; and significant litigation. Factors that may affect our operating results are described in the Risk Factors section in the quarterly and annual reports we file with the Securities and Exchange Commission. Such risks and uncertainties could cause actual results to be materially different from those in the forward-looking statements. Readers are cautioned not to place undue reliance on the forward-looking statements.
Policy on Business Outlook Disclosure
Financial information relating to any current quarter should be considered to be speaking as of the date of the press release or other announcement only. Following the date of the press release or other announcement, the information should be considered to be historical and not subject to update. We undertake no obligation to update
55
Table of Contents
any such information, although we may choose to do so by press release, SEC filing or other public announcement. Consistent with this policy, Fairchild Semiconductor representatives will not comment about the business outlook or our financial results or expectations for the quarter in question.
Status of First Quarter Business
We expect sales to be in the range of $340 to $355 million for the first quarter. We expect adjusted gross margin to be in the range of 28.0 to 29.0% plus due primarily to lower factory loadings from the prior quarter. We have increased factory loadings this quarter and expect to recover the underutilization impact to gross margin in the second quarter. We anticipate R&D and SG&A spending to be in the range of $93 to $95 million due to resumption of FICA and other payroll-related taxes and the lack of non-recurring favorable items from the prior quarter. The adjusted tax rate is forecast at 15 percent plus or minus 3 percentage points for the quarter. In accordance with our policy on disclosure described above, we are not assuming any obligation to update this information, although we may choose to do so before we announce first quarter results.
Recently Issued Financial Accounting Standards
There were no new standards issued in 2013 that had an impact on our financials or disclosures.
| ITEM 7A. | QUANTITATIVE AND QUALITATIVE DISCLOSURES ABOUT MARKET RISK |
We are exposed to financial market risks, including changes in interest rates and foreign currency exchange rates. To mitigate these risks, we utilize derivative financial instruments. We do not use derivative financial instruments for speculative or trading purposes. All of the potential changes noted below are based on sensitivity analyses performed on our financial position at December 30, 2013. Actual results may differ materially.
We use a combination of currency forward and option contracts to hedge a portion of our forecasted foreign exchange denominated revenues and expenses. Gains and losses on these foreign currency exposures would generally be offset by corresponding losses and gains on the related hedging instruments, resulting in negligible net exposure to us. A majority of our revenue, expense and capital purchasing activities are transacted in U.S. dollars. However, we do conduct these activities by way of transactions denominated in other currencies, primarily the Korean won, Malaysian ringgit, Philippine peso, Chinese yuan, Japanese yen, Taiwanese dollar, British pound and the Euro. To protect against reductions in value and the volatility of future cash flows caused by changes in foreign exchange rates, we have established hedging programs. Our hedging programs reduce, but do not always entirely eliminate, the short-term impact of foreign currency exchange rate movements. For example, during the twelve months ended December 29, 2013, an adverse change (defined as a 20% unfavorable move in every currency where we have exposure) in the exchange rates of all currencies over the course of the year would have resulted in an adverse impact on income before taxes of approximately $13.4 million.
We have interest rate exposure with respect to our credit facility due to its variable pricing. For the year ended 2013, a 50 basis point increase in interest rates would have resulted in increased annual interest expense of $1.13 million. The increased annual interest expense due to a 50 basis point increase in LIBOR rates would have been offset by an increase in interest income of $1.15 million on the cash and investment balances during 2013.
56
Table of Contents
| ITEM 8. | CONSOLIDATED FINANCIAL STATEMENTS AND SUPPLEMENTARY DATA |
FAIRCHILD SEMICONDUCTOR INTERNATIONAL, INC. AND SUBSIDIARIES
INDEX TO CONSOLIDATED FINANCIAL STATEMENTS
| Page | ||||
| 58 | ||||
| 60 | ||||
| 61 | ||||
| 62 | ||||
| 63 | ||||
| 64 | ||||
| 65 | ||||
57
Table of Contents
Report of Independent Registered Public Accounting Firm
The Board of Directors and Stockholders
Fairchild Semiconductor International, Inc.:
We have audited the accompanying consolidated balance sheets of Fairchild Semiconductor International, Inc. and subsidiaries as of December 29, 2013 and December 30, 2012, and the related consolidated statements of operations, comprehensive income, cash flows and stockholders’ equity for each of the years in the three-year period ended December 29, 2013. In connection with our audits of the consolidated financial statements, we also have audited the financial statement schedule listed in Item 15(b) of the 2013 Form 10-K. We also have audited Fairchild Semiconductor International, Inc.’s internal control over financial reporting as of December 29, 2013, based on criteria established in Internal Control—Integrated Framework (1992) issued by the Committee of Sponsoring Organizations of the Treadway Commission (COSO). Fairchild Semiconductor International, Inc. management is responsible for these consolidated financial statements, financial statement schedule, for maintaining effective internal control over financial reporting, and for its assessment of the effectiveness of internal control over financial reporting, included in the accompanying Management Report on Internal Control over Financial Reporting. Our responsibility is to express an opinion on these consolidated financial statements and financial statement schedule and an opinion on the Company’s internal control over financial reporting based on our audits.
We conducted our audits in accordance with the standards of the Public Company Accounting Oversight Board (United States). Those standards require that we plan and perform the audits to obtain reasonable assurance about whether the financial statements are free of material misstatement and whether effective internal control over financial reporting was maintained in all material respects. Our audits of the consolidated financial statements included examining, on a test basis, evidence supporting the amounts and disclosures in the financial statements, assessing the accounting principles used and significant estimates made by management, and evaluating the overall financial statement presentation. Our audit of internal control over financial reporting included obtaining an understanding of internal control over financial reporting, assessing the risk that a material weakness exists, and testing and evaluating the design and operating effectiveness of internal control based on the assessed risk. Our audits also included performing such other procedures as we considered necessary in the circumstances. We believe that our audits provide a reasonable basis for our opinions.
A company’s internal control over financial reporting is a process designed to provide reasonable assurance regarding the reliability of financial reporting and the preparation of financial statements for external purposes in accordance with generally accepted accounting principles. A company’s internal control over financial reporting includes those policies and procedures that (1) pertain to the maintenance of records that, in reasonable detail, accurately and fairly reflect the transactions and dispositions of the assets of the company; (2) provide reasonable assurance that transactions are recorded as necessary to permit preparation of financial statements in accordance with generally accepted accounting principles, and that receipts and expenditures of the company are being made only in accordance with authorizations of management and directors of the company; and (3) provide reasonable assurance regarding prevention or timely detection of unauthorized acquisition, use, or disposition of the company’s assets that could have a material effect on the financial statements.
Because of its inherent limitations, internal control over financial reporting may not prevent or detect misstatements. Also, projections of any evaluation of effectiveness to future periods are subject to the risk that controls may become inadequate because of changes in conditions, or that the degree of compliance with the policies or procedures may deteriorate.
In our opinion, the consolidated financial statements referred to above present fairly, in all material respects, the financial position of Fairchild Semiconductor International, Inc. and subsidiaries as of December 29, 2013 and December 30, 2012, and the results of its operations and its cash flows for each of the years in the three-year period ended December 29, 2013, in conformity with U.S. generally accepted accounting principles. In our
58
Table of Contents
opinion, the related financial statement schedule, when considered in relation to the basic consolidated financial statements taken as a whole, present fairly, in all material respects, the information set forth therein. Also in our opinion, Fairchild Semiconductor International, Inc. maintained, in all material respects, effective internal control over financial reporting as of December 29, 2013, based on criteria established in Internal Control—Integrated Framework (1992) issued by the Committee of Sponsoring Organizations of the Treadway Commission.
/s/ KPMG LLP
Boston, Massachusetts
February 27, 2014
59
Table of Contents
FAIRCHILD SEMICONDUCTOR INTERNATIONAL, INC. AND SUBSIDIARIES
CONSOLIDATED BALANCE SHEETS
(In millions, except share data)
| December 29, 2013 |
December 30, 2012 |
|||||||
| ASSETS |
||||||||
| Current assets: |
||||||||
| Cash and cash equivalents |
$ | 417.8 | $ | 405.9 | ||||
| Short-term marketable securities |
0.1 | 0.1 | ||||||
| Accounts receivable, net of allowances of $25.3 and $21.1 at December 29, 2013 and December 30, 2012, respectively |
127.4 | 136.7 | ||||||
| Inventories |
228.1 | 236.7 | ||||||
| Deferred income taxes, net of allowances |
18.6 | 16.0 | ||||||
| Other current assets |
32.6 | 36.6 | ||||||
|
|
|
|
|
|||||
| Total current assets |
824.6 | 832.0 | ||||||
| Property, plant and equipment, net |
707.9 | 764.9 | ||||||
| Deferred income taxes, net of allowances |
30.9 | 28.6 | ||||||
| Intangible assets, net |
31.7 | 47.3 | ||||||
| Goodwill |
169.3 | 169.3 | ||||||
| Long-term securities |
2.2 | 2.6 | ||||||
| Other assets |
29.4 | 39.2 | ||||||
|
|
|
|
|
|||||
| Total assets |
$ | 1,796.0 | $ | 1,883.9 | ||||
|
|
|
|
|
|||||
| LIABILITIES, TEMPORARY EQUITY AND STOCKHOLDERS’ EQUITY |
||||||||
| Current liabilities: |
||||||||
| Current portion of long-term debt |
$ | — | $ | — | ||||
| Accounts payable |
95.8 | 115.7 | ||||||
| Accrued expenses and other current liabilities |
88.0 | 89.2 | ||||||
|
|
|
|
|
|||||
| Total current liabilities |
183.8 | 204.9 | ||||||
| Long-term debt, less current portion |
200.1 | 250.1 | ||||||
| Deferred income taxes |
27.7 | 27.6 | ||||||
| Other liabilities |
20.3 | 31.3 | ||||||
|
|
|
|
|
|||||
| Total liabilities |
431.9 | 513.9 | ||||||
| Commitments and contingencies (Note 15) |
||||||||
| Temporary equity—deferred stock units |
3.6 | 2.9 | ||||||
| Stockholders’ equity: |
||||||||
| Common stock, $.01 par value, voting; 340,000,000 shares authorized; 138,498,696 and 136,888,065 shares issued and 126,195,375 and 126,924,850 shares outstanding at December 29, 2013 and December 30, 2012, respectively |
1.4 | 1.4 | ||||||
| Additional paid-in capital |
1,517.8 | 1,498.5 | ||||||
| Accumulated deficit |
(12.4 | ) | (17.4 | ) | ||||
| Accumulated other comprehensive income |
3.1 | 5.1 | ||||||
| Less treasury stock (at cost) |
(149.4 | ) | (120.5 | ) | ||||
|
|
|
|
|
|||||
| Total stockholders’ equity |
1,360.5 | 1,367.1 | ||||||
|
|
|
|
|
|||||
| Total liabilities, temporary equity and stockholders’ equity |
$ | 1,796.0 | $ | 1,883.9 | ||||
|
|
|
|
|
|||||
See accompanying notes to consolidated financial statements.
60
Table of Contents
FAIRCHILD SEMICONDUCTOR INTERNATIONAL, INC. AND SUBSIDIARIES
CONSOLIDATED STATEMENTS OF OPERATIONS
(In millions, except per share data)
| Year Ended | ||||||||||||
| December 29, 2013 |
December 30, 2012 |
December 25, 2011 |
||||||||||
| Total revenue |
$ | 1,405.4 | $ | 1,405.9 | $ | 1,588.8 | ||||||
| Cost of sales |
988.9 | 963.9 | 1,029.6 | |||||||||
|
|
|
|
|
|
|
|||||||
| Gross margin |
416.5 | 442.0 | 559.2 | |||||||||
|
|
|
|
|
|
|
|||||||
| Operating expenses: |
||||||||||||
| Research and development |
171.6 | 156.9 | 153.4 | |||||||||
| Selling, general and administrative |
205.7 | 206.8 | 218.4 | |||||||||
| Amortization of acquisition-related intangibles |
15.5 | 18.2 | 19.7 | |||||||||
| Restructuring and impairments |
15.9 | 14.1 | 2.8 | |||||||||
| Charge for (release of) litigation |
(12.6 | ) | 1.3 | — | ||||||||
|
|
|
|
|
|
|
|||||||
| Total operating expenses |
396.1 | 397.3 | 394.3 | |||||||||
|
|
|
|
|
|
|
|||||||
| Operating income |
20.4 | 44.7 | 164.9 | |||||||||
| Realized loss on sale of securites |
— | 12.9 | — | |||||||||
| Other expense, net |
9.2 | 8.1 | 7.2 | |||||||||
|
|
|
|
|
|
|
|||||||
| Income before income taxes |
11.2 | 23.7 | 157.7 | |||||||||
| Provision (benefit) for income taxes |
6.2 | (0.9 | ) | 12.2 | ||||||||
|
|
|
|
|
|
|
|||||||
| Net income |
$ | 5.0 | $ | 24.6 | $ | 145.5 | ||||||
|
|
|
|
|
|
|
|||||||
| Net income per common share: |
||||||||||||
| Basic |
$ | 0.04 | $ | 0.19 | $ | 1.15 | ||||||
|
|
|
|
|
|
|
|||||||
| Diluted |
$ | 0.04 | $ | 0.19 | $ | 1.12 | ||||||
|
|
|
|
|
|
|
|||||||
| Weighted average common shares: |
||||||||||||
| Basic |
127.2 | 126.7 | 126.7 | |||||||||
|
|
|
|
|
|
|
|||||||
| Diluted |
128.7 | 129.0 | 130.3 | |||||||||
|
|
|
|
|
|
|
|||||||
See accompanying notes to consolidated financial statements.
61
Table of Contents
FAIRCHILD SEMICONDUCTOR INTERNATIONAL, INC. AND SUBSIDIARIES
CONSOLIDATED STATEMENTS OF COMPREHENSIVE INCOME
(In millions)
| Year Ended | ||||||||||||
| December 29, 2013 |
December 30, 2012 |
December 25, 2011 |
||||||||||
| Net income |
$ | 5.0 | $ | 24.6 | $ | 145.5 | ||||||
| Other comprehensive income (loss), net of tax: |
||||||||||||
| Net change associated with hedging transactions |
2.2 | 15.8 | (5.4 | ) | ||||||||
| Net amount reclassified to earnings for hedging (1) |
(4.9 | ) | (3.2 | ) | (2.5 | ) | ||||||
| Net change associated with fair value of marketable securities |
(0.2 | ) | (4.4 | ) | 1.6 | |||||||
| Net amount reclassified to earnings for marketable securities |
— | 10.4 | — | |||||||||
| Net change associated with pension transactions |
1.0 | (1.1 | ) | (0.5 | ) | |||||||
|
|
|
|
|
|
|
|||||||
| Comprehensive income |
$ | 3.1 | $ | 42.1 | $ | 138.7 | ||||||
|
|
|
|
|
|
|
|||||||
(1)
| Year Ended | ||||||||||||
| December 29, 2013 |
December 30, 2012 |
December 25, 2011 |
||||||||||
| Net amount reclassified for cash flow hedges included in net revenue |
$ | (0.2 | ) | $ | (1.2 | ) | $ | 2.9 | ||||
| Net amount reclassified for cash flow hedges included in cost of goods sold |
(3.7 | ) | (1.8 | ) | (4.4 | ) | ||||||
| Net amount reclassified for cash flow hedges included in SG&A |
(1.1 | ) | (0.2 | ) | (1.0 | ) | ||||||
| Net amount reclassified for cash flow hedges included in R&D |
0.1 | — | — | |||||||||
|
|
|
|
|
|
|
|||||||
| Total net amount reclassified to earnings for hedging |
$ | (4.9 | ) | $ | (3.2 | ) | $ | (2.5 | ) | |||
|
|
|
|
|
|
|
|||||||
See accompanying notes to consolidated financial statements
62
Table of Contents
FAIRCHILD SEMICONDUCTOR INTERNATIONAL, INC. AND SUBSIDIARIES
CONSOLIDATED STATEMENTS OF CASH FLOWS
(In millions)
| Year Ended | ||||||||||||
| December 29, 2013 |
December 30, 2012 |
December 25, 2011 |
||||||||||
| Cash flows from operating activities: |
||||||||||||
| Net income |
$ | 5.0 | $ | 24.6 | $ | 145.5 | ||||||
| Adjustments to reconcile net income to cash provided by operating activities: |
||||||||||||
| Depreciation and amortization |
145.2 | 135.3 | 150.5 | |||||||||
| Non-cash stock-based compensation expense |
27.9 | 22.6 | 24.8 | |||||||||
| Non-cash restructuring and impairments expense |
1.5 | 0.1 | — | |||||||||
| Non-cash write-off of deferred financing fees |
— | — | 2.1 | |||||||||
| Non-cash interest income |
(0.1 | ) | (0.4 | ) | (0.5 | ) | ||||||
| Non-cash financing expense |
0.9 | 1.0 | 1.0 | |||||||||
| Non-cash realized loss on sale of investments |
— | 12.9 | — | |||||||||
| Non-cash write-off of equity investment |
3.0 | — | — | |||||||||
| Non-cash acquisition tax impact |
— | — | 0.1 | |||||||||
| Loss on disposal of property, plant and equipment |
1.4 | 1.9 | 1.7 | |||||||||
| Deferred income taxes, net |
(4.8 | ) | (11.2 | ) | (12.5 | ) | ||||||
| Release of litigation accrual |
(12.6 | ) | — | — | ||||||||
| Changes in operating assets and liabilities, net of effects of acquisitions: |
||||||||||||
| Accounts receivable |
9.3 | 6.2 | 13.5 | |||||||||
| Inventories |
9.0 | (2.5 | ) | (1.2 | ) | |||||||
| Other current assets |
4.2 | 6.2 | (1.5 | ) | ||||||||
| Accounts payable |
(15.6 | ) | 14.4 | (28.5 | ) | |||||||
| Accrued expenses and other current liabilities |
(2.3 | ) | (30.5 | ) | (20.5 | ) | ||||||
| Other assets and liabilities, net |
4.1 | 2.6 | (6.0 | ) | ||||||||
|
|
|
|
|
|
|
|||||||
| Net cash provided by operating activities |
$ | 176.1 | $ | 183.2 | $ | 268.5 | ||||||
|
|
|
|
|
|
|
|||||||
| Cash flows from investing activities: |
||||||||||||
| Purchase of marketable securities |
$ | — | $ | (0.5 | ) | $ | (0.1 | ) | ||||
| Sale of marketable securities |
— | 23.6 | — | |||||||||
| Maturity of marketable securities |
0.3 | 0.2 | 0.1 | |||||||||
| Capital expenditures |
(75.2 | ) | (151.9 | ) | (186.4 | ) | ||||||
| Purchase of molds and tooling |
(2.1 | ) | (2.4 | ) | (3.5 | ) | ||||||
| Acquisitions and divestitures, net of cash acquired |
— | — | (16.5 | ) | ||||||||
|
|
|
|
|
|
|
|||||||
| Net cash used in investing activities |
$ | (77.0 | ) | $ | (131.0 | ) | $ | (206.4 | ) | |||
|
|
|
|
|
|
|
|||||||
| Cash flows from financing activities: |
||||||||||||
| Repayment of long-term debt |
$ | (50.0 | ) | $ | (50.0 | ) | $ | (320.6 | ) | |||
| Issuance of long-term debt |
— | — | 300.0 | |||||||||
| Proceeds from issuance of common stock and from exercise of stock options, net |
1.1 | 5.0 | 35.5 | |||||||||
| Purchase of treasury stock |
(29.0 | ) | (13.9 | ) | (42.3 | ) | ||||||
| Shares withheld for employee taxes |
(9.3 | ) | (10.7 | ) | (10.8 | ) | ||||||
| Debt financing costs |
— | — | (5.2 | ) | ||||||||
|
|
|
|
|
|
|
|||||||
| Net cash used in financing activities |
$ | (87.2 | ) | $ | (69.6 | ) | $ | (43.4 | ) | |||
|
|
|
|
|
|
|
|||||||
| Net change in cash and cash equivalents |
11.9 | (17.4 | ) | 18.7 | ||||||||
| Cash and cash equivalents at beginning of period |
405.9 | 423.3 | 404.6 | |||||||||
|
|
|
|
|
|
|
|||||||
| Cash and cash equivalents at end of period |
$ | 417.8 | $ | 405.9 | $ | 423.3 | ||||||
|
|
|
|
|
|
|
|||||||
| Supplemental Cash Flow Information: |
||||||||||||
| Cash paid during the period for: |
||||||||||||
| Income taxes, net |
$ | 12.1 | $ | 20.1 | $ | 27.0 | ||||||
| Interest |
$ | 4.7 | $ | 6.1 | $ | 5.5 | ||||||
See accompanying notes to consolidated financial statements.
63
Table of Contents
FAIRCHILD SEMICONDUCTOR INTERNATIONAL, INC. AND SUBSIDIARIES
CONSOLIDATED STATEMENTS OF STOCKHOLDERS’ EQUITY
(In millions)
| Common Stock | Accumulated Other Comprehensive Income (Loss) |
|||||||||||||||||||||||||||||||||||
| Number of Shares |
At Par Value |
Additional Paid-in Capital |
Accumulated Deficit |
Securities | Hedging Transactions |
Pensions | Treasury Stock |
Total | ||||||||||||||||||||||||||||
| Balances at December 26, 2010 |
124.5 | $ | 1.3 | $ | 1,432.4 | $ | (187.5 | ) | $ | (7.3 | ) | $ | 2.5 | $ | (0.8 | ) | $ | (64.3 | ) | $ | 1,176.3 | |||||||||||||||
| Net income |
145.5 | 145.5 | ||||||||||||||||||||||||||||||||||
| Exercise or settlement of plan awards |
4.1 | 35.5 | 35.5 | |||||||||||||||||||||||||||||||||
| Stock-based compensation expense |
24.8 | 24.8 | ||||||||||||||||||||||||||||||||||
| Purchase of treasury stock |
(2.8 | ) | (42.3 | ) | (42.3 | ) | ||||||||||||||||||||||||||||||
| Cash flow hedges |
(7.9 | ) | (7.9 | ) | ||||||||||||||||||||||||||||||||
| Unrealized holding loss on marketable securities |
1.6 | 1.6 | ||||||||||||||||||||||||||||||||||
| Pension transactions |
(0.5 | ) | (0.5 | ) | ||||||||||||||||||||||||||||||||
| Shares withheld for employee taxes |
(10.8 | ) | (10.8 | ) | ||||||||||||||||||||||||||||||||
|
|
|
|
|
|
|
|
|
|
|
|
|
|
|
|
|
|
|
|||||||||||||||||||
| Balance as December 25, 2011 |
125.8 | $ | 1.3 | $ | 1,481.9 | $ | (42.0 | ) | $ | (5.7 | ) | $ | (5.4 | ) | $ | (1.3 | ) | $ | (106.6 | ) | $ | 1,322.2 | ||||||||||||||
| Net income |
24.6 | 24.6 | ||||||||||||||||||||||||||||||||||
| Exercise or settlement of plan awards |
2.2 | 0.1 | 5.0 | 5.1 | ||||||||||||||||||||||||||||||||
| Stock-based compensation expense |
22.9 | 22.9 | ||||||||||||||||||||||||||||||||||
| Purchase of treasury stock |
(1.1 | ) | (13.9 | ) | (13.9 | ) | ||||||||||||||||||||||||||||||
| Cash flow hedges |
12.6 | 12.6 | ||||||||||||||||||||||||||||||||||
| Net amount reclassified to earnings for sale of marketable securities |
10.4 | 10.4 | ||||||||||||||||||||||||||||||||||
| Unrealized holding loss on marketable securities |
(4.4 | ) | (4.4 | ) | ||||||||||||||||||||||||||||||||
| Pension transactions |
(1.1 | ) | (1.1 | ) | ||||||||||||||||||||||||||||||||
| Shares withheld for employee taxes |
(10.7 | ) | (10.7 | ) | ||||||||||||||||||||||||||||||||
| Temporary equity reclassification, deferred stock units |
(0.6 | ) | (0.6 | ) | ||||||||||||||||||||||||||||||||
|
|
|
|
|
|
|
|
|
|
|
|
|
|
|
|
|
|
|
|||||||||||||||||||
| Balance as December 30, 2012 |
126.9 | $ | 1.4 | $ | 1,498.5 | $ | (17.4 | ) | $ | 0.3 | $ | 7.2 | $ | (2.4 | ) | $ | (120.5 | ) | $ | 1,367.1 | ||||||||||||||||
| Net income |
5.0 | 5.0 | ||||||||||||||||||||||||||||||||||
| Exercise or settlement of plan awards |
1.6 | 1.4 | 1.4 | |||||||||||||||||||||||||||||||||
| Stock-based compensation expense |
27.9 | 27.9 | ||||||||||||||||||||||||||||||||||
| Purchase of treasury stock |
(2.3 | ) | (28.9 | ) | (28.9 | ) | ||||||||||||||||||||||||||||||
| Cash flow hedges |
(2.8 | ) | (2.8 | ) | ||||||||||||||||||||||||||||||||
| Net amount reclassified to earnings for sale of marketable securities |
||||||||||||||||||||||||||||||||||||
| Unrealized holding loss on marketable securities |
(0.2 | ) | (0.2 | ) | ||||||||||||||||||||||||||||||||
| Pension transactions |
1.0 | 1.0 | ||||||||||||||||||||||||||||||||||
| Shares withheld for employee taxes |
(9.3 | ) | (9.3 | ) | ||||||||||||||||||||||||||||||||
| Temporary equity reclassification, deferred stock units |
(0.7 | ) | (0.7 | ) | ||||||||||||||||||||||||||||||||
|
|
|
|
|
|
|
|
|
|
|
|
|
|
|
|
|
|
|
|||||||||||||||||||
| Balance as December 29, 2013 |
126.2 | $ | 1.4 | $ | 1,517.8 | $ | (12.4 | ) | $ | 0.1 | $ | 4.4 | $ | (1.4 | ) | $ | (149.4 | ) | $ | 1,360.5 | ||||||||||||||||
|
|
|
|
|
|
|
|
|
|
|
|
|
|
|
|
|
|
|
|||||||||||||||||||
See accompanying notes to consolidated financial statements.
64
Table of Contents
FAIRCHILD SEMICONDUCTOR INTERNATIONAL, INC. AND SUBSIDIARIES
NOTES TO CONSOLIDATED FINANCIAL STATEMENTS
NOTE 1—BACKGROUND AND BASIS OF PRESENTATION
Background
Fairchild Semiconductor International, Inc. (“Fairchild International” or the “ the company”) designs, develops, manufactures and markets power analog, power discrete and certain non-power semiconductor solutions through its wholly-owned subsidiary Fairchild Semiconductor Corporation (“Fairchild”). The company delivers energy-efficient, easy-to-use and value-added semiconductor solutions for power and mobile designs. The company helps our customers differentiate their products and solve difficult technical challenges with our expertise in power and signal path products. The company’s products have a wide range of applications and are sold to customers in the mobile, industrial, appliance, automotive, consumer electronics, and computing markets.
The company is headquartered in San Jose, California and has manufacturing operations in South Portland, Maine, West Jordan, Utah, Mountaintop, Pennsylvania, Cebu, the Philippines, Penang, Malaysia, Bucheon, South Korea, and Suzhou, China. The company sells its products to customers worldwide.
The accompanying financial statements of the company have been prepared in conformity with accounting principles generally accepted in the United States of America (U.S.). Certain amounts for prior periods have been reclassified to conform to current presentation.
NOTE 2—SUMMARY OF SIGNIFICANT ACCOUNTING POLICIES
Fiscal Year
The company’s fiscal year ends on the last Sunday in December. The company’s fiscal calendar, in which each quarter ends on a Sunday, contains 53 weeks every seven years. This additional week is included in the first quarter of the year. The company’s results for the years ended December 29, 2013, December 30, 2012, and December 25, 2011 consist of 52 weeks, 53 weeks, and 52 weeks, respectively.
Principles of Consolidation
The consolidated financial statements include the accounts and operations of the company and its wholly-owned subsidiaries. Significant intercompany accounts and transactions have been eliminated.
Use of Estimates in Preparation of Financial Statements
The preparation of financial statements in conformity with accounting principles generally accepted in the U.S. requires management to make estimates and assumptions about future events. These estimates and the underlying assumptions affect the amounts of assets and liabilities reported, disclosures about contingent assets and liabilities, and reported amounts of revenues and expenses. Such estimates include the valuation of accounts receivable, inventories, goodwill, investments, share based compensation, property plant and equipment, intangible assets, and other long-lived assets, legal contingencies, and assumptions used in the calculation of income taxes and customer incentives, among others. These estimates and assumptions are based on management’s best estimates and judgment. Management evaluates its estimates and assumptions on an ongoing basis using historical experience and other factors, including the current economic environment, which management believes to be reasonable under the circumstances. The company adjusts such estimates and assumptions when facts and circumstances dictate. Illiquid credit markets, volatile equity, and foreign currency markets, and declines in consumer spending have combined to increase the uncertainty inherent in such estimates and assumptions. As future events and their effects cannot be determined with precision, actual results could differ significantly from these estimates. Changes in those estimates resulting from continuing changes in the economic environment will be reflected in the financial statements in future periods.
65
Table of Contents
Revenue Recognition
Revenue is recognized when there is persuasive evidence of an arrangement, the price to the buyer is fixed or determinable, delivery has occurred and collectability of the sales price is reasonably assured. Revenue from the sale of semiconductor products is recognized when title and risk of loss transfers to the customer, which is generally when the product is received by the customer. Shipping costs billed to customers are included within revenue. Associated costs are classified in cost of goods sold.
In 2013, approximately 61% of the company’s revenues were from distributors. Distributor payments are due under agreed terms and are not contingent upon resale or any other matter other than the passage of time. The company has agreements with some distributors and customers for various programs, including prompt payment discounts, pricing protection, scrap allowances and stock rotation. Sales to these distributors and customers, as well as the existence of sales incentive programs, are in accordance with terms set forth in written agreements with these distributors and customers. In general, credits allowed under these programs are capped based upon individual distributor agreements. The company records charges associated with these programs as a reduction of revenue at the time of sale based upon historical activity. The company’s policy is to use both a three to six month rolling historical experience rate as well as a prospective view of products in the distributor channel for distributors who participate in an incentive program in order to estimate the necessary allowance to be recorded. In addition, under the company’s standard terms and conditions of sale, the products sold by the company are subject to a limited product quality warranty. The standard limited warranty period is one year. The company accrues for the estimated cost of incurred but unidentified quality issues based upon historical activity and known quality issues if a loss is probable and can be reasonably estimated. Quality returns are accounted for as a reduction of revenue.
In some cases, title and risk of loss do not pass to the customer when the product is received by them. In these cases, the company recognizes revenue at the time when title and risk of loss is transferred, assuming all other revenue recognition criteria have been satisfied. These cases include several inventory locations where the company manages consigned inventory for the company’s customers, including some for which the inventory is at customer facilities. In such cases, revenue is not recognized when products are received at these locations; rather, revenue is recognized when customers take the inventory from the location for their use.
Advertising
Advertising expenditures are charged to expense as incurred. Advertising expenses for the years ended December 29, 2013, December 30, 2012 and December 25, 2011 were not material to the consolidated financial statements.
Research and Development Costs
The company’s research and development expenditures are charged to expense as incurred.
Fair Value Measurements
The Fair Value Measurements and Disclosures Topic of the FASB Accounting Standards Codification (ASC) defines fair value as the exchange price that would be received for an asset or paid to transfer a liability in the principal or most advantageous market in an orderly transaction between market participants at the measurement date. In accordance with this ASC topic, the company groups its assets and liabilities measured at fair value on a recurring basis in three levels, based on the markets in which the assets and liabilities are traded and the reliability of the assumptions used to determine fair value. These levels are:
| • | Level 1—Valuation is based upon quoted market price for identical instruments traded in active markets. |
| • | Level 2—Valuation is based on quoted market prices for similar instruments in active markets, quoted prices for identical or similar instruments in markets that are not active, and model-based valuation techniques for which all significant assumptions are observable in the market. |
66
Table of Contents
| • | Level 3—Valuation is generated from model-based techniques that use significant assumptions not observable in the market. Valuation techniques include use of discounted cash flow models and similar techniques. |
It is the company’s policy to maximize the use of observable inputs and minimize the use of unobservable inputs when developing fair value measurements. When available, the company uses quoted market prices to measure fair value. If market prices are not available, the fair value measurement is based on models that use primarily market based parameters including interest rate yield curves, option volatilities and currency rates. In certain cases where market rate assumptions are not available, the company is required to make judgments about assumptions market participants would use to estimate the fair value of a financial instrument. Changes in the underlying assumptions used, including discount rates and estimates of future cash flows could significantly affect the results of current or future values. The results may not be realized in an actual sale or immediate settlement of an asset or liability. See Note 3 for further discussion of the fair value of the company’s financial instruments.
The carrying values of cash and cash equivalents, accounts receivable and payable, and accrued liabilities approximate fair value due to the short-term maturities of these assets and liabilities.
Cash, Cash Equivalents and Other Securities
The company invests excess cash in marketable securities consisting primarily of money markets, commercial paper, corporate notes and bonds, and U.S. government securities.
The company considers all highly liquid investments with a maturity of three months or less when purchased to be cash equivalents. Highly liquid investments with maturities greater than three months and less than one year are classified as short-term marketable securities. All other investments with maturities that exceed one year are classified as long-term securities. At December 29, 2013 and December 30, 2012, all of the company’s securities are classified as available-for-sale. In accordance with the Investments—Debt and Equity Securities Topic of the FASB ASC, available-for-sale securities are carried at fair value with unrealized gains and losses included as a component of other comprehensive income (OCI) within stockholders’ equity, net of any related tax effect, if such gains and losses are considered temporary. Realized gains and losses on these investments are included in interest income and expense. Declines in value judged by management to be other-than-temporary and credit related are included in impairment of investments in the statement of operations. The noncredit component of impairment is included in accumulated other comprehensive income (AOCI.) For the purpose of computing realized gains and losses, cost is identified on a specific identification basis. For further discussion of the company’s securities see Note 3 and Note 4.
Cash, cash equivalents and other securities as of December 29, 2013 and December 30, 2012 are as follows:
| December 29, 2013 |
December 30, 2012 |
|||||||
| (In millions) | ||||||||
| Cash and cash equivalents |
417.8 | 405.9 | ||||||
| Short-term marketable securities |
0.1 | 0.1 | ||||||
| Long-term securities |
2.2 | 2.6 | ||||||
|
|
|
|
|
|||||
| Total cash, cash equivalents and other securities |
420.1 | 408.6 | ||||||
|
|
|
|
|
|||||
Derivatives
The company utilizes various derivative financial instruments to manage market risks associated with the fluctuations in foreign currency exchange rates. It is the company’s policy to use derivative financial instruments to protect against market risk arising from transactions occurring in normal course of business. The criteria the
67
Table of Contents
company uses for designating an instrument as a hedge is the instrument’s effectiveness in risk reduction. To receive hedge accounting treatment, hedges must be highly effective at offsetting the impact of the hedged transaction.
All derivatives, whether designated as hedging relationships or not, are recorded at fair value and are included in either other current assets or other current liabilities on the balance sheet.
The company utilizes cash flow hedges to hedge certain foreign currency forecasted revenue and expense streams. For derivatives designated as cash flow hedges, the effective portions of changes in fair value of the derivative are recorded in OCI and are recognized in the income statement when the hedged item affects earnings, and within the same income statement line as the impact of the hedged transaction. Ineffective portions of changes in the fair value of cash flow hedges are recognized in earnings. Effectiveness is assessed at the hedge’s inception and on an ongoing basis. If the hedge fails to meet the requirements for using hedge accounting treatment or the hedged transaction is no longer likely to occur by the end of the originally specified time period or within an additional two-month period of time thereafter, the changes in fair value of the hedge would be included in earnings. The maturities of the cash flow hedges are twelve months or less as of December 29, 2013.
The company also uses currency forward and combination option contracts to offset the foreign currency impact of balance sheet translation. These derivatives have one month terms and the initial fair value, if any, and the subsequent gains or losses on the change in fair value are reported in earnings within the same income statement line as the impact of the foreign currency translation. From time to time, the company will also hedge the liability for an expected cash payment in foreign currency. These derivatives have terms that match the expected payment timing. The initial fair value, if any, and the subsequent gains or losses on the change in fair value are reported in earnings within the same income statement line as the change in value of the liability due to changes in currency value.
Concentration of Credit Risk
The company is subject to concentrations of credit risk in their investments, derivatives, and trade accounts receivable. The company maintains cash, cash equivalents and other securities with high credit quality financial institutions based upon the company’s analysis of that financial institution’s relative credit standing. The company’s investment policy is designed to limit exposure to any one institution. The company also is exposed to credit-related losses in the event of non-performance by counterparties to hedging instruments. The counterparties to all derivative transactions are major financial institutions. However, this does not eliminate the company’s exposure to credit risk with these institutions. This credit risk is generally limited to the unrealized gains in such contracts should any of these counterparties fail to perform as contracted. The company considers the risk of counterparty default to be minimal.
The company sells its products to distributors and original equipment manufacturers involved in a variety of industries including computing, consumer, communications, automotive and industrial. The company has adopted credit policies and standards to accommodate industry growth and inherent risk. The company performs continuing credit evaluations of its customers’ financial condition and requires collateral as deemed necessary. Reserves are provided for estimated amounts of accounts receivable that may not be collected.
Inventories
Inventories are stated at the lower of actual cost on a first-in, first-out basis, or market.
Property, Plant and Equipment
Property, plant and equipment are recorded at cost and are generally depreciated based upon the following estimated useful lives: buildings and improvements, ten to thirty years, machinery and equipment and software, three to ten years. Depreciation is principally provided under the straight-line method.
68
Table of Contents
Prior to December 26, 2011, the company depreciated much of its machinery and equipment over an eight-year period. During the first quarter of 2012, the company completed an analysis of the useful life assumptions. In performing this analysis, the company examined the historical usage patterns for machinery and equipment at its wafer fabrication and assembly and test manufacturing facilities. As a result of this analysis, the company determined that, while the useful life of its assembly and test equipment was consistent with the eight year depreciation assumption, the wafer fabrication equipment remained in use beyond the eight-year life assigned to that asset category. The typical life was approximately ten years. At the time the analysis was performed, the company was unaware of any events which would result in a change from this historical pattern. Accordingly, the company determined that it would prospectively adjust the estimated useful life assumptions for machinery and equipment at the company’s wafer fabrication facilities from eight years to ten years to better align its depreciation expense with its actual historical experience. As a result, the company realized a reduction in its depreciation expense of approximately $17.2 million in the year ended December 30, 2012, when compared to depreciation expense under the previous useful life assumption.
In addition, the company reassessed the useful lives, which ranged from one to eight years, of its molds and tooling equipment in the first quarter. The historical patterns of molds and tooling usage at its assembly and test manufacturing facilities were examined. Based upon the analysis, it was determined three to five years, depending on if the asset was refurbished or new, was the most appropriate life for these assets. This resulted in a net increase to depreciation expense of $0.7 million in the first quarter of 2012. Impacts on the rest of the year were not material.
The impact of these change in estimates increased net income by $15.0 million or $ 0.12 per share in the year ended December 30, 2012.
Investments
The company has certain strategic investments that are typically accounted for on a cost basis as they are less than 20% owned, and the company does not exercise significant influence over the operating and financial policies of the investee. Under the cost method, investments are held at historical cost, less impairments. The company periodically assesses the need to record impairment losses on investments and records such losses when the impairment of an investment is determined to be other-than-temporary in nature. A variety of factors are considered when determining if a decline in fair value below book value is other-than-temporary, including, among others, the financial condition and prospects of the investee.
The total cost basis for strategic investments, which are included in other assets on the balance sheet, was $0.7 million, net of impairments, as of December 29, 2013 and December 30, 2012.
Other Assets
Other assets include deferred financing costs, which represent costs incurred related to the issuance of the company’s long-term debt. The costs are being amortized using the straight-line method, which approximates the effective interest method, over the related term of the borrowing and are included in interest expense. Also included in other assets are mold and tooling costs. Molds and tools are amortized over their expected useful lives, generally one to five years.
Goodwill, Intangible Assets, and Long-Lived Assets
Goodwill is recorded when the consideration paid for acquisitions exceeds the fair value of net tangible and intangible assets acquired. Goodwill and other intangible assets with indefinite useful lives are not amortized, but rather are tested at least annually for impairment. Intangible assets with estimable lives are amortized over one to fifteen years.
69
Table of Contents
Goodwill and intangible assets with indefinite lives are tested annually for impairment as of the last day of the fiscal year or more frequently if there is an indication that impairment may have occurred. During 2011, the company adopted Accounting Standards Update (ASU) 2011-08, Intangibles- Goodwill and Other—Testing Goodwill for Impairment. ASU 2011-08 intends to simplify goodwill impairment testing by permitting assessment of qualitative factors to determine whether events and circumstances lead to the conclusion that it is necessary to perform the two-step goodwill impairment test currently required under ASU 350, Intangibles Goodwill and Other.
The fair value of the company’s reporting units is based on a combination of the income approach, which estimates the fair value of the company’s reporting units based on a discounted cash flow approach, and the market approach which estimates the fair value of the company’s reporting units based on comparable market multiples. This fair value is then reconciled to the company’s market capitalization with an appropriate control premium. The determination of the fair value of the reporting units requires the company to make significant estimates and assumptions. These estimates and assumptions primarily include but are not limited to; the selection of appropriate peer group companies, control premiums appropriate for acquisitions in the industries in which the company competes, the discount rate, terminal growth rates, forecasts of revenue and expense growth rates, changes in working capital, depreciation and amortization, and capital expenditures. Due to the inherent uncertainty involved in making these estimates, actual financial results could differ from those estimates. Changes in assumptions concerning future financial results or other underlying assumptions would have a significant impact on either the fair value of the reporting unit or the amount of the goodwill impairment charge. The company uses its judgment in assessing whether assets may have become impaired between annual impairment tests. Indicators such as unexpected adverse business conditions, economic factors, unanticipated technological change or competitive activities, loss of key personnel and acts by governments and courts, may signal that an asset has become impaired. See Note 6 for the results of goodwill testing.
Intangible assets with estimable lives and other long-lived assets are reviewed for impairment whenever events or changes in circumstances indicate that the carrying amount of an asset or asset group may not be recoverable. Recoverability of intangible assets with estimable lives and other long-lived assets is measured by a comparison of the carrying amount of an asset or asset group to future net undiscounted pretax cash flows expected to be generated by the asset or asset group. If these comparisons indicate that an asset or asset group is not recoverable, the impairment loss recognized is the amount by which the carrying amount of the asset or asset group exceeds the related estimated fair value. Estimated fair value is based on either discounted future pretax operating cash flows or appraised values, depending on the nature of the asset or asset group. The company determines the discount rate for this analysis based on the expected internal rate of return for the related business and does not allocate interest charges to the asset or asset group being measured. Considerable judgment is required to estimate discounted future operating cash flows.
Currencies
The company’s functional currency for all operations worldwide is the U.S. dollar. Accordingly, gains and losses from translation of foreign currency financial statements are included in current results. In addition, conversion of foreign currency cash and foreign currency transactions are included in current results. Realized foreign currency gains (losses) were $2.2 million, $2.8 million and $2.6 million for the years ended December 29, 2013, December 30, 2012 and December 25, 2011, respectively.
Income Taxes
Income taxes are accounted for under the asset and liability method. Under this method, deferred tax assets and liabilities are recognized for the future tax consequences attributable to differences between the financial statement carrying amounts of existing assets and liabilities and their respective tax bases. Deferred tax assets and liabilities are measured using enacted tax rates expected to apply to taxable income in the years in which those temporary differences are expected to be recovered or settled. The effect on deferred tax assets and
70
Table of Contents
liabilities of a change in tax rates is recognized in income in the period that includes the enactment date. The realizability of deferred tax assets must also be assessed. The ultimate realization of deferred tax assets is dependent upon the generation of future taxable income during the periods in which the associated temporary differences become deductible. A valuation allowance must be established for deferred tax assets which the company does not believe will more likely than not be realized in the future. Deferred taxes are not provided for the undistributed earnings of the company’s foreign subsidiaries that are considered to be indefinitely reinvested outside of the U.S. in accordance with the Income Tax Topic of the ASC. The company plans to repatriate certain non-U.S. earnings which have been taxed in the U.S. but earned offshore as well as any non-U.S. earnings which are not considered to be indefinitely reinvested outside the U.S.
The Income Tax Topic of the ASC prescribes a recognition threshold and measurement attribute for the financial statement recognition and measurement of a tax position taken or expected to be taken in a tax return. This topic also provides guidance on derecognition, classification, interest and penalties, accounting in the interim periods, disclosure, and transition. Penalties and interest relating to uncertain tax positions are recognized as a component of income tax expense. To the extent penalties and interest are not assessed with respect to uncertain tax positions, amounts accrued will be reduced and reflected as a reduction of the overall income tax provision.
Computation of Net Income Per Share
Basic net income per share is computed using the weighted-average number of common shares outstanding during the period. Diluted net income per share is computed using the weighted-average number of common shares outstanding during the period, plus the dilutive effect of potential future issuances of common stock relating to potentially dilutive securities using the treasury stock method. Potentially dilutive common equivalent securities consist of stock options, deferred stock units (DSUs), restricted stock units (RSUs) and performance units (PUs). In calculating diluted earnings per share, the dilutive effect of stock options is computed using the average market price for the respective period. Certain potential shares of the company’s outstanding stock options were excluded because they were anti-dilutive, but could be dilutive in the future. The following table sets forth the computation of basic and diluted earnings per share.
| Year Ended | ||||||||||||
| December 29, 2013 |
December 30, 2012 |
December 25, 2011 |
||||||||||
| (In millions, except per share data) | ||||||||||||
| Basic: |
||||||||||||
| Net income |
$ | 5.0 | $ | 24.6 | $ | 145.5 | ||||||
|
|
|
|
|
|
|
|||||||
| Weighted average shares outstanding |
127.2 | 126.7 | 126.7 | |||||||||
|
|
|
|
|
|
|
|||||||
| Net income per share |
$ | 0.04 | $ | 0.19 | $ | 1.15 | ||||||
|
|
|
|
|
|
|
|||||||
| Diluted: |
||||||||||||
| Net income |
$ | 5.0 | $ | 24.6 | $ | 145.5 | ||||||
|
|
|
|
|
|
|
|||||||
| Basic weighted average shares outstanding |
127.2 | 126.7 | 126.7 | |||||||||
| Assumed exercise of common stock equivalents |
1.5 | 2.3 | 3.6 | |||||||||
|
|
|
|
|
|
|
|||||||
| Diluted weighted-average common and common equivalent shares |
128.7 | 129.0 | 130.3 | |||||||||
|
|
|
|
|
|
|
|||||||
| Net income per share |
$ | 0.04 | $ | 0.19 | $ | 1.12 | ||||||
|
|
|
|
|
|
|
|||||||
| Anti-dilutive common stock equivalents, non-vested stock, |
||||||||||||
| DSUs, RSUs, and PUs |
1.9 | 3.8 | 6.7 | |||||||||
|
|
|
|
|
|
|
|||||||
71
Table of Contents
NOTE 3—Fair Value
The company groups its financial assets and liabilities measured at fair value on a recurring basis in three levels, based on the markets in which the assets and liabilities are traded and the reliability of the assumptions used to determine fair value. These levels are:
| • | Level 1—Valuation is based upon quoted market price for identical instruments traded in active markets. |
| • | Level 2—Valuation is based on quoted market prices for similar instruments in active markets, quoted prices for identical or similar instruments in markets that are not active, and model-based valuation techniques for which all significant assumptions are observable in the market. |
| • | Level 3—Valuation is generated from model-based techniques that use significant assumptions not observable in the market. Valuation techniques include use of discounted cash flow models and similar techniques. |
The assets and liabilities measured at fair value on a recurring basis include securities and derivatives. Financial instruments classified as Level 1 are securities traded on an active exchange as well as U.S. Treasury, and other U.S. government and agency-backed securities that are traded by dealers or brokers in active over-the-counter markets. Derivatives are classified as Level 2 financial instruments. The only financial instruments classified as Level 3 were auction rate securities. All auction rate securities were sold in the fourth quarter of 2012.
The fair value of securities is based on quoted market prices at the date of measurement, except the 2011 fair values for auction rate securities. The auction rate security market was no longer active and as a result there was no observable market data for these assets. Fair value estimates were based on judgments regarding current economic conditions, liquidity discounts and interest rate risks. These estimates involved significant uncertainties and judgments and could not be determined with precision.
A discounted cash flow (DCF) calculation was performed to determine the 2011 estimated fair value of the auction rate securities. The assumptions used in preparing the DCF model included estimates for the amount and timing of future interest and principal payments and the rate of return required by investors to own these securities in the current environment. In making these assumptions, relevant factors that were considered included: the formula applicable to each security which defines the interest rate paid to investors in the event of a failed auction; forward projections of the interest rate benchmarks specified in such formulas; the likely timing of principal repayments; the probability of full repayment considering guarantees by third parties and additional credit enhancements provided through other means. The estimate of the rate of return required by investors to own these securities also considers the current reduced liquidity for auction rate securities. The inputs for the DCF are based upon publicly available data as well as the company’s own estimates. The primary unobservable input to the valuation was the maturity assumption which ranged from four to twenty-four years depending on the individual auction rate security. The maturity assumptions were based on the terms of the underlying instrument and the potential for restructuring the auction rate security.
All of the company’s derivatives are traded in over-the-counter markets where quoted market prices are not readily available. For those derivatives, the company measures fair value using prices obtained from the counterparties with whom the company has traded. The counterparties price the derivatives based on models that use primarily market observable inputs, such as yield curves and option volatilities. Accordingly, the company classifies these derivatives as Level 2.
The company is exposed to credit-related losses in the event of non-performance by counterparties to hedging instruments. The counterparties to all derivative transactions are major financial institutions with investment grade credit ratings. However, this does not eliminate the company’s exposure to credit risk with these institutions. This credit risk is generally limited to the unrealized gains in such contracts should any of these counterparties fail to perform as contracted. The company considers the risk of counterparty default to be minimal.
72
Table of Contents
The following table presents the balances of assets and liabilities measured at fair value on a recurring basis as of December 29, 2013.
| Fair Value Measurements | ||||||||||||||||
| Total | Quoted Prices in Active Markets (Level 1) |
Significant Other Observable Inputs (Level 2) |
Significant Unobservable Inputs (Level 3) |
|||||||||||||
| (In millions) | ||||||||||||||||
| Foreign Currency Derivatives |
||||||||||||||||
| Assets |
$ | 6.2 | $ | — | $ | 6.2 | $ | — | ||||||||
| Liabilities |
(1.9 | ) | — | (1.9 | ) | — | ||||||||||
|
|
|
|
|
|
|
|
|
|||||||||
| $ | 4.3 | $ | — | $ | 4.3 | $ | — | |||||||||
|
|
|
|
|
|
|
|
|
|||||||||
| Securities |
||||||||||||||||
| Marketable securities |
$ | 2.3 | $ | 2.3 | $ | — | $ | — | ||||||||
|
|
|
|
|
|
|
|
|
|||||||||
| $ | 2.3 | $ | 2.3 | $ | — | $ | — | |||||||||
|
|
|
|
|
|
|
|
|
|||||||||
The following table presents the balances of assets and liabilities measured at fair value on a recurring basis as of December 30, 2012.
| Fair Value Measurements | ||||||||||||||||
| Total | Quoted Prices in Active Markets (Level 1) |
Significant Other Observable Inputs (Level 2) |
Significant Unobservable Inputs (Level 3) |
|||||||||||||
| (In millions) | ||||||||||||||||
| Foreign Currency Derivatives |
||||||||||||||||
| Assets |
$ | 7.9 | $ | — | $ | 7.9 | $ | — | ||||||||
| Liabilities |
(0.9 | ) | — | (0.9 | ) | — | ||||||||||
|
|
|
|
|
|
|
|
|
|||||||||
| $ | 7.0 | $ | — | $ | 7.0 | $ | — | |||||||||
|
|
|
|
|
|
|
|
|
|||||||||
| Securities |
||||||||||||||||
| Marketable securities |
$ | 2.7 | $ | 2.7 | $ | — | $ | — | ||||||||
|
|
|
|
|
|
|
|
|
|||||||||
| $ | 2.7 | $ | 2.7 | $ | — | $ | — | |||||||||
|
|
|
|
|
|
|
|
|
|||||||||
Long term debt is carried at amortized cost. However, the company is required to estimate the fair value of long term debt under the Financial Instrument Topic of the FASB ASC. The carrying amount of the revolving facility is considered to approximate fair value as the interest rate on the loan is in line with current market rates. See Note 7 for more information on the credit facility.
| December 29, 2013 | December 30, 2012 | |||||||||||||||
| Carrying Amount |
Estimated Fair Value |
Carrying Amount |
Estimated Fair Value |
|||||||||||||
| (In millions) | ||||||||||||||||
| Long-Term Debt: |
||||||||||||||||
| Revolving Credit Facility |
$ | 200.0 | $ | 200.0 | $ | 250.0 | $ | 250.0 | ||||||||
73
Table of Contents
NOTE 4—SECURITIES
Securities are categorized as available-for-sale and are summarized as follows as of December 29, 2013:
| Amortized Cost |
Gross Unrealized Gains |
Gross Unrealized Losses |
Market Value |
|||||||||||||
| (In millions) | ||||||||||||||||
| Short-term available for sale securities: |
||||||||||||||||
| U.S. Treasury securities and obligations of U.S. government agencies |
$ | 0.1 | $ | — | $ | — | $ | 0.1 | ||||||||
| Corporate debt securities |
— | — | — | — | ||||||||||||
|
|
|
|
|
|
|
|
|
|||||||||
| Total marketable securities |
$ | 0.1 | $ | — | $ | — | $ | 0.1 | ||||||||
|
|
|
|
|
|
|
|
|
|||||||||
| Amortized Cost |
Gross Unrealized Gains |
Gross Unrealized Losses |
Market Value |
|||||||||||||
| (In millions) | ||||||||||||||||
| Long-term available for sale securities: |
||||||||||||||||
| U.S. Treasury securities and obligations of U.S. government agencies |
$ | 2.0 | $ | 0.1 | $ | — | $ | 2.1 | ||||||||
| Corporate debt securities |
0.1 | — | — | $ | 0.1 | |||||||||||
|
|
|
|
|
|
|
|
|
|||||||||
| Total securities |
$ | 2.1 | $ | 0.1 | $ | — | $ | 2.2 | ||||||||
|
|
|
|
|
|
|
|
|
|||||||||
Securities are categorized as available-for-sale and are summarized as follows as of December 30, 2012:
| Amortized Cost |
Gross Unrealized Gains |
Gross Unrealized Losses |
Market Value |
|||||||||||||
| (In millions) | ||||||||||||||||
| Short-term available for sale securities: |
||||||||||||||||
| U.S. Treasury securities and obligations of U.S. government agencies |
$ | 0.1 | $ | — | $ | — | $ | 0.1 | ||||||||
| Corporate debt securities |
— | — | — | — | ||||||||||||
|
|
|
|
|
|
|
|
|
|||||||||
| Total marketable securities |
$ | 0.1 | $ | — | $ | — | $ | 0.1 | ||||||||
|
|
|
|
|
|
|
|
|
|||||||||
| Amortized Cost |
Gross Unrealized Gains |
Gross Unrealized Losses |
Market Value |
|||||||||||||
| (In millions) | ||||||||||||||||
| Long-term available for sale securities: |
||||||||||||||||
| U.S. Treasury securities and obligations of U.S. government agencies |
$ | 2.1 | $ | 0.3 | $ | — | $ | 2.4 | ||||||||
| Corporate debt securities |
0.2 | — | — | $ | 0.2 | |||||||||||
|
|
|
|
|
|
|
|
|
|||||||||
| Total securities |
$ | 2.3 | $ | 0.3 | $ | — | $ | 2.6 | ||||||||
|
|
|
|
|
|
|
|
|
|||||||||
The following table presents the amortized cost and estimated fair market value of available-for-sale securities by contractual maturity as of December 29, 2013.
| Amortized Cost |
Market Value |
|||||||
| (In millions) | ||||||||
| Due in one year or less |
$ | 0.1 | $ | 0.1 | ||||
| Due after one year through three years |
0.3 | 0.4 | ||||||
| Due after three years through ten years |
1.1 | 1.2 | ||||||
| Due after ten years |
0.6 | 0.6 | ||||||
|
|
|
|
|
|||||
| $ | 2.1 | $ | 2.3 | |||||
|
|
|
|
|
|||||
74
Table of Contents
In the fourth quarter of 2008, the company concluded that the impairment of its auction rate securities was other-than-temporary and recognized a loss of $19.0 million in the income statement. In the second quarter of 2009, based on the requirements of the Investments—Debt and Equity Securities Topic of the FASB ASC, the company analyzed the $19.0 million other-than-temporary loss that was recognized in the income statement to determine the noncredit component. It was determined that $15.5 million of the loss was attributable to credit loss. As a result, in the second quarter of 2009, a cumulative adjustment of the remaining $3.5 million, which was attributable to changes in interest rates, was reclassified from retained earnings to AOCI. The auction rate securities were sold in the fourth quarter of 2012.
NOTE 5—FINANCIAL STATEMENT DETAILS
| December 29, 2013 |
December 30, 2012 |
|||||||
| (In millions) | ||||||||
| Inventories, net |
||||||||
| Raw materials |
$ | 39.0 | $ | 36.8 | ||||
| Work in process |
122.6 | 136.6 | ||||||
| Finished goods |
66.5 | 63.3 | ||||||
|
|
|
|
|
|||||
| $ | 228.1 | $ | 236.7 | |||||
|
|
|
|
|
|||||
| December 29, 2013 |
December 30, 2012 |
|||||||
| (In millions) | ||||||||
| Property, plant and equipment |
||||||||
| Land and improvements |
$ | 24.8 | $ | 24.8 | ||||
| Buildings and improvements |
399.1 | 394.1 | ||||||
| Machinery and equipment |
1,881.4 | 1,786.3 | ||||||
| Construction in progress |
63.8 | 133.1 | ||||||
|
|
|
|
|
|||||
| Total property, plant and equipment |
2,369.1 | 2,338.3 | ||||||
| Less accumulated depreciation |
1,661.2 | 1,573.4 | ||||||
|
|
|
|
|
|||||
| $ | 707.9 | $ | 764.9 | |||||
|
|
|
|
|
|||||
| December 29, 2013 |
December 30, 2012 |
|||||||
| (In millions) | ||||||||
| Accrued expenses and other current liabilities |
||||||||
| Payroll and employee related accruals |
$ | 55.4 | $ | 45.8 | ||||
| Accrued interest |
0.3 | 0.4 | ||||||
| Taxes payable |
9.9 | 20.5 | ||||||
| Restructuring and impairments |
4.2 | 4.1 | ||||||
| Other |
18.2 | 18.4 | ||||||
|
|
|
|
|
|||||
| $ | 88.0 | $ | 89.2 | |||||
|
|
|
|
|
|||||
| Year Ended | ||||||||||||
| December 29, 2013 |
December 30, 2012 |
December 25, 2011 |
||||||||||
| (in millions) | ||||||||||||
| Other expense, net |
||||||||||||
| Interest expense |
$ | 6.4 | $ | 7.6 | $ | 7.3 | ||||||
| Interest income |
(0.6 | ) | (2.0 | ) | (2.7 | ) | ||||||
| Other (income) expense, net |
3.4 | 2.5 | 2.6 | |||||||||
|
|
|
|
|
|
|
|||||||
| Other expense, net |
$ | 9.2 | $ | 8.1 | $ | 7.2 | ||||||
|
|
|
|
|
|
|
|||||||
75
Table of Contents
NOTE 6—GOODWILL AND INTANGIBLE ASSETS
In order to evaluate goodwill for impairment, the company identifies its reporting units and determines the carrying value of each reporting unit by assigning the assets and liabilities, including the existing goodwill and intangible assets, to those reporting units. In accordance with the provisions of the Intangibles—Goodwill and Other Topic of the ASC, the company designates reporting units for purposes of assessing goodwill impairment. A reporting unit is defined as the lowest level of an entity that is a business and that can be distinguished, physically and operationally and for internal reporting purposes, from the other activities, operations, and assets of the entity. Goodwill is assigned to reporting units of the company that are expected to benefit from the synergies of the acquisition. The company has determined that it has three reporting units for purposes of goodwill impairment testing: Mobile, Computing, Consumer and Communications (MCCC), Power Conversion, Industrial and Automotive (PCIA) and Standard Discrete and Standard Linear (SDT). The company’s policy is to evaluate goodwill for impairment for all reporting units in the fourth quarter of each fiscal year. The company evaluated goodwill for impairment as of December 29, 2013 and December 30, 2012 for the past two fiscal years.
During 2011, the company adopted Accounting Standards Update (ASU) 2011-08, Intangibles—Goodwill and Other—Testing Goodwill for Impairment. ASU 2011-08 intends to simplify goodwill impairment testing by permitting assessment of qualitative factors to determine whether events and circumstances lead to the conclusion that it is necessary to perform the two-step goodwill impairment test currently required under ASU 350, Intangibles Goodwill and Other. This analysis was completed for 2012, and based on the results of the analysis; the company concluded that the reporting units would not be subject to the two-step goodwill impairment test. For 2013, the company conducted step I of the quantitative goodwill impairment test, and concluded that there was no goodwill impairment and that the performance of the step II testing was not necessary. Moreover, the company performed various sensitivity analysis based on several key input variables, which further supported the conclusion that there was no goodwill impairment.
When the company performs the two-step impairment test the impairment review is based on a combination of the income approach, which estimates the fair value of the company’s reporting units based on a discounted cash flow approach, and the market approach which estimates the fair value of the company’s reporting units based on comparable market multiples. The average fair value is then reconciled to the company’s market capitalization with an appropriate control premium. The discount rates utilized in the discounted cash flows ranged from approximately 9.9% to 12.7%, reflecting market based estimates of capital costs and discount rates adjusted for a market participants view with respect to execution, concentration, and other risks associated with the projected cash flows of the individual segments. The peer companies used in the market approach are primarily the major competitors of each segment. The company’s valuation methodology requires management to make judgments and assumptions based on historical experience and projections of future operating performance. If these assumptions differ materially from future results, the company may record impairment charges in the future.
As of December 29, 2013 and December 30, 2012, the company concluded that goodwill was not impaired. There were no events to trigger an impairment review of other long lived assets for the years ended December 29, 2013 and December 30, 2012.
During the first quarter of 2012, the company moved two small product groups from the MCCC organization to the PCIA and SDT organizations. Since this changed the company’s reporting units, goodwill was assigned to the reporting units affected using a relative fair value allocation. There was no impairment noted as a result of this realignment.
76
Table of Contents
The following table presents the carrying amount of goodwill by reporting unit.
| MCCC | PCIA | SDT | Total | |||||||||||||
| (In millions) | ||||||||||||||||
| Balance as of December 30, 2012 and December 29, 2013 |
||||||||||||||||
| Goodwill |
$ | 162.0 | $ | 156.1 | $ | 54.5 | $ | 372.6 | ||||||||
| Accumulated Impairment Losses |
— | (148.8 | ) | (54.5 | ) | (203.3 | ) | |||||||||
|
|
|
|
|
|
|
|
|
|||||||||
| $ | 162.0 | $ | 7.3 | $ | — | $ | 169.3 | |||||||||
|
|
|
|
|
|
|
|
|
|||||||||
The following table presents a summary of acquired intangible assets.
| As of December 29, 2013 | As of December 30, 2012 | |||||||||||||||||||
| Period of Amortization |
Gross Carrying Amount |
Accumulated Amortization |
Gross Carrying Amount |
Accumulated Amortization |
||||||||||||||||
| (In millions) | ||||||||||||||||||||
| Identifiable intangible assets: |
||||||||||||||||||||
| Developed technology |
2-15 years | $ | 250.8 | $ | (240.0 | ) | $ | 250.8 | $ | (228.4 | ) | |||||||||
| Customer base |
8-10 years | 81.6 | (73.6 | ) | 81.6 | (71.1 | ) | |||||||||||||
| Core technology |
10 years | 15.7 | (5.1 | ) | 15.7 | (3.9 | ) | |||||||||||||
| In Process R&D |
10 years | 2.8 | (0.5 | ) | 2.8 | (0.2 | ) | |||||||||||||
| Patents |
4 years | 5.9 | (5.9 | ) | 5.9 | (5.9 | ) | |||||||||||||
|
|
|
|
|
|
|
|
|
|||||||||||||
| Subtotal |
356.8 | (325.1 | ) | 356.8 | (309.5 | ) | ||||||||||||||
|
|
|
|
|
|
|
|
|
|||||||||||||
| Goodwill |
169.3 | — | 169.3 | — | ||||||||||||||||
|
|
|
|
|
|
|
|
|
|||||||||||||
| Total |
$ | 526.1 | $ | (325.1 | ) | $ | 526.1 | $ | (309.5 | ) | ||||||||||
|
|
|
|
|
|
|
|
|
|||||||||||||
Amortization expense for intangible assets was $15.5 million, $18.2 million and $19.7 million for 2013, 2012 and 2011, respectively.
The estimated amortization expense for intangible assets for each of the five succeeding fiscal years is as follows:
| Estimated Amortization Expense: |
(In millions) | |||
| Fiscal 2014 |
7.5 | |||
| Fiscal 2015 |
5.2 | |||
| Fiscal 2016 |
5.2 | |||
| Fiscal 2017 |
2.5 | |||
| Fiscal 2018 |
2.2 | |||
NOTE 7—LONG-TERM DEBT
Long-term debt consists of the following at:
| December 29, 2013 |
December 30, 2012 |
|||||||
| (In millions) | ||||||||
| Revolving Credit Facility borrowings |
$ | 200.0 | $ | 250.0 | ||||
| Other debt |
0.1 | 0.1 | ||||||
|
|
|
|
|
|||||
| Total debt |
$ | 200.1 | $ | 250.1 | ||||
| Current portion of long-term debt |
— | — | ||||||
|
|
|
|
|
|||||
| Long-term debt, less current portion |
$ | 200.1 | $ | 250.1 | ||||
|
|
|
|
|
|||||
77
Table of Contents
Revolving Credit Facility
On May 20, 2011, the company entered into a new senior secured revolving credit facility (Credit Facility.) Proceeds from the Credit Facility and an additional $18.8 million in cash were used to extinguish all outstanding obligations under the previous credit facility, which consisted of a term loan and an undrawn revolving credit facility. The Credit Facility consists of a $400.0 million revolving loan agreement, of which $200.0 million and $250.0 million was drawn as of December 29, 2013 and December 30, 2012, respectively. The company has no current intention to pay down any further debt in the next twelve months. In addition, the new Credit Facility includes an incremental revolving commitment that enables the company to increase the size of the facility in an aggregate amount not to exceed $300 million. The maturity date of the Credit Facility is May 20, 2016. The company incurred cash charges of $5.2 million related to this financing, all of which was deferred and will be amortized over the term of the debt. Additionally, the company wrote off $2.1 million of the remaining deferred financing fees related to the prior facility.
Under the Credit Facility, borrowing may be in the form of either Eurocurrency Loans or Alternate Base Rate (ABR) loans. Eurocurrency Loans accrue interest at the London Interbank Offered Rate (LIBOR) plus 1.75%. The ABR is the highest of JP Morgan Chase Bank prime rate, the federal funds effective rate plus 1/2 of 1 percent, or adjusted LIBOR, as defined by the credit agreement, plus 1%. ABR loans accrue interest at the ABR rate plus 0.75%. As of December 29, 2013, the Eurocurrency rate would have been 1.92% and the ABR rate would have been 4.0%. The company also pays a commitment fee of 0.35% per annum on the unutilized commitments. There are also outstanding letters of credit under the Credit Facility totaling $0.5 million. These outstanding letters of credit reduce the amount available under the Credit Facility to $199.5 million. Borrowings under the Credit Facility are secured by a pledge of common stock of the company’s first tier domestic subsidiaries and 65% of the stock of the company’s first tier foreign subsidiaries. The payment of principal and interest on the Credit Facility is fully and unconditionally guaranteed by Fairchild Semiconductor International, Inc. and each of its domestic subsidiaries.
The Credit Facility includes restrictive covenants that place limitations on the company’s ability to consolidate, merge, or enter into acquisitions, create liens or pay dividends, or make similar restricted payments, sell assets, invest in capital expenditures, and incur indebtedness. It also places limitations on the company’s ability to modify its certificate of incorporation and bylaws, or enter into shareholder agreements, voting trusts or similar arrangements. In addition, the affirmative covenants in the Credit Facility also require the company’s financial performance to comply with certain financial measures, as defined by the credit agreement. These financial covenants require us to maintain a minimum interest coverage ratio of 3.0 to 1.0 and a maximum leverage ratio of 3.25 to 1.0. It defines the interest coverage ratio as the ratio of the cumulative four quarter trailing consolidated earnings before interest, taxes, depreciation and amortization (EBITDA) to consolidated cash interest expense and defines the maximum leverage ratio as the ratio of total consolidated debt to the cumulative four quarter trailing consolidated EBITDA. Consolidated EBITDA, as defined by the credit agreement excludes restructuring, non-cash equity compensation and other certain adjustments. At December 29, 2013, the company was in compliance with these covenants.
Aggregate maturities of long-term debt for each of the next five years and thereafter are as follows:
| (In millions) | ||||
| 2014 |
— | |||
| 2015 |
— | |||
| 2016 |
200.1 | |||
| 2017 |
— | |||
| 2018 |
— | |||
| Thereafter |
— | |||
|
|
|
|||
| 200.1 | ||||
|
|
|
|||
78
Table of Contents
At December 29, 2013, the company also has approximately $3.5 million of undrawn credit facilities at certain of its foreign subsidiaries.
NOTE 8—INCOME TAXES
Total income tax provision (benefit) was allocated as follows:
| Year Ended | ||||||||||||
| December 29, 2013 |
December 30, 2012 |
December 25, 2011 |
||||||||||
| (In millions) | ||||||||||||
| Income tax provision (benefit) attributable to income before income taxes |
$ | 6.2 | $ | (0.9 | ) | $ | 12.2 | |||||
| Other comprehensive income |
— | — | — | |||||||||
|
|
|
|
|
|
|
|||||||
| $ | 6.2 | $ | (0.9 | ) | $ | 12.2 | ||||||
|
|
|
|
|
|
|
|||||||
Income before income taxes for the years ended December 29, 2013, December 30, 2012, and December 25, 2011 consisted of the following:
| Year Ended | ||||||||||||
| December 29, 2013 |
December 30, 2012 |
December 25, 2011 |
||||||||||
| (In millions) | ||||||||||||
| Income (loss) before income taxes: |
||||||||||||
| U.S. |
$ | 18.1 | $ | 6.2 | $ | 44.7 | ||||||
| Foreign |
(6.9 | ) | 17.5 | 113.0 | ||||||||
|
|
|
|
|
|
|
|||||||
| $ | 11.2 | $ | 23.7 | $ | 157.7 | |||||||
|
|
|
|
|
|
|
|||||||
Income tax provision (benefit) for the years ended December 29, 2013, December 30, 2012, and December 25, 2011 consisted of the following:
| Year Ended | ||||||||||||
| December 29, 2013 |
December 30, 2012 |
December 25, 2011 |
||||||||||
| (In millions) | ||||||||||||
| Income tax provision (benefit): |
||||||||||||
| Current: |
||||||||||||
| U.S. federal |
$ | — | $ | — | $ | 0.1 | ||||||
| U.S. state and local |
0.1 | (0.2 | ) | 0.1 | ||||||||
| Foreign |
10.9 | 9.4 | 24.5 | |||||||||
|
|
|
|
|
|
|
|||||||
| 11.0 | 9.2 | 24.7 | ||||||||||
| Deferred: |
||||||||||||
| U.S. federal |
2.0 | 1.9 | 1.8 | |||||||||
| U.S. state and local |
(0.3 | ) | 0.2 | (1.4 | ) | |||||||
| Foreign |
(6.5 | ) | (12.2 | ) | (12.9 | ) | ||||||
|
|
|
|
|
|
|
|||||||
| (4.8 | ) | (10.1 | ) | (12.5 | ) | |||||||
| Total income tax provision (benefit): |
||||||||||||
| U.S. federal |
2.1 | 1.9 | 1.9 | |||||||||
| U.S. state and local |
(0.3 | ) | — | (1.3 | ) | |||||||
| Foreign |
4.4 | (2.8 | ) | 11.6 | ||||||||
|
|
|
|
|
|
|
|||||||
| $ | 6.2 | $ | (0.9 | ) | $ | 12.2 | ||||||
|
|
|
|
|
|
|
|||||||
79
Table of Contents
The reconciliation between the income tax rate computed by applying the U.S. federal statutory rate and the reported worldwide effective tax rate on net income before income taxes is as follows:
| Year Ended | ||||||||||||
| December 29, 2013 |
December 30, 2012 |
December 25, 2011 |
||||||||||
| U.S. federal statutory rate |
35.0 | % | 35.0 | % | 35.0 | % | ||||||
| U.S. state and local taxes, net of federal benefit |
(1.5 | ) | (2.4 | ) | 2.9 | |||||||
| Foreign tax rate differential |
77.3 | (15.1 | ) | (13.5 | ) | |||||||
| Tax credits |
(34.8 | ) | (9.3 | ) | (3.8 | ) | ||||||
| Foreign withholding taxes |
(17.5 | ) | 1.5 | (0.1 | ) | |||||||
| Non-deductible expenses |
45.5 | 28.5 | 0.2 | |||||||||
| Change in valuation allowance |
(62.4 | ) | (6.4 | ) | (13.0 | ) | ||||||
| Foreign exchange differences |
(7.9 | ) | (22.4 | ) | — | |||||||
| Deferred Change |
7.0 | (13.2 | ) | — | ||||||||
| Tax Rate Changes |
14.7 | — | — | |||||||||
|
|
|
|
|
|
|
|||||||
| 55.4 | % | (3.8 | %) | 7.7 | % | |||||||
|
|
|
|
|
|
|
|||||||
We operate in multiple foreign jurisdictions with lower statutory tax rates than the United States. The reported effective tax rate and income tax provision reflects the shift in the geographical mix of taxable income and losses and relevant statutory rates.
In 2013, a current provision for income taxes was provided for Fairchild Semiconductor Pte. Ltd at the concessionary holiday tax rate of 10% on qualifying income. Fairchild Semiconductor Pte. Ltd is entitled to a concessionary tax rate of 10% through 2019 at which time it will revert to Singapore’s enacted statutory tax rate which is currently 17%.
The tax holidays increased net income by $0.5 million, or less than $0.01 per basic and diluted common share for the year ended December 29, 2013. The tax holidays increased net income by $1.3 million, or $0.01 per basic and diluted common share for the year ended December 30, 2012. The tax holidays increased net income by $3.0 million, or $0.02 per basic and diluted common share for the year ended December 25, 2011.
80
Table of Contents
The tax effects of temporary differences in the recognition of income and expense for tax and financial reporting purposes that give rise to significant portions of the deferred tax assets and the deferred tax liabilities at December 29, 2013 and December 30, 2012 are presented below:
| December 29, 2013 |
December 30, 2012 |
|||||||
| (In millions) | ||||||||
| Deferred tax assets: |
||||||||
| Net operating loss carryforwards |
$ | 50.4 | $ | 51.3 | ||||
| Reserves and accruals |
37.6 | 39.0 | ||||||
| Tax credit and capital allowance carryovers |
88.2 | 87.4 | ||||||
| Plant and equipment |
1.4 | — | ||||||
| Unrealized loss in other comprehensive income |
— | — | ||||||
|
|
|
|
|
|||||
| Total gross deferred tax assets |
177.6 | 177.7 | ||||||
| Valuation allowance |
(147.6 | ) | (154.5 | ) | ||||
|
|
|
|
|
|||||
| Net deferred tax assets |
30.0 | 23.2 | ||||||
| Deferred tax liabilities: |
||||||||
| Plant and equipment |
— | (0.4 | ) | |||||
| Unrealized gain in other comprehensive income |
(1.7 | ) | (2.7 | ) | ||||
| Capitalized research expenses and intangibles |
(6.5 | ) | (3.1 | ) | ||||
|
|
|
|
|
|||||
| Total deferred tax liabilities |
(8.2 | ) | (6.2 | ) | ||||
|
|
|
|
|
|||||
| Net deferred tax assets (liabilities) |
$ | 21.8 | $ | 17.0 | ||||
|
|
|
|
|
|||||
Net deferred tax assets (liabilities) by jurisdiction are as follows:
| December 29, | December 30, | |||||||
| 2013 | 2012 | |||||||
| (In millions) | ||||||||
| U.S. |
$ | (27.7 | ) | $ | (25.9 | ) | ||
| Europe |
1.2 | 1.1 | ||||||
| Japan |
0.5 | 0.5 | ||||||
| China |
14.1 | 9.9 | ||||||
| Hong Kong |
1.9 | 1.5 | ||||||
| Malaysia |
— | (1.3 | ) | |||||
| Singapore |
0.1 | 0.2 | ||||||
| Korea |
31.2 | 30.2 | ||||||
| Taiwan |
0.5 | 0.3 | ||||||
| Foreign—other |
— | 0.5 | ||||||
|
|
|
|
|
|||||
| Net deferred tax assets (liabilities) |
$ | 21.8 | $ | 17.0 | ||||
|
|
|
|
|
|||||
Deferred tax assets and liabilities are generally classified in the consolidated balance sheet based on the classification of the related asset or liability. The deferred tax valuation allowance for the year ended December 29, 2013 and December 30, 2012 was $147.6 million and $154.5 million, respectively.
Gross carry forwards as of December 29, 2013 for U.S. net operating losses (NOL) totaled $98.9 million, for foreign tax credits totaled $30.5 million, and for research and development credits totaled $21.1 million. The net operating losses expire in 2024 through 2032. The foreign tax credits expire in 2014 through 2024. The research and development credits expire in varying amounts through 2032. As of December 29, 2013, the company has net operating loss carry forwards in Korea of $29.0 million. The Korean net operating losses expire in 2023.
81
Table of Contents
The company’s ability to utilize its U.S. net operating loss and credit carry forwards may be limited in the future if the company experiences an ownership change, as defined in the Internal Revenue Code. An ownership change occurs when the ownership percentage of 5% or more stockholders changes by more than 50% over a three year period. In August 1999, the company experienced an ownership change as a result of its initial public offering. This ownership change did not result in a material limitation on the utilization of the loss and credit carry forwards. As of December 29, 2013, the company has not undergone a second ownership change.
Significant management judgment is required in determining the company’s provision for income taxes and in determining whether deferred tax assets will be realized. When it is more likely than not that all or some portion of specific deferred tax assets will not be realized, a valuation allowance must be established for the amount of the deferred tax assets that are determined not likely to be realizable. Realization is based on the company’s ability to generate sufficient future taxable income. A valuation allowance is determined in accordance with the Income Taxes Topic of the ASC, which requires an assessment of both positive and negative evidence when determining whether it is more likely than not that deferred tax assets are recoverable. Such assessment is required on a jurisdiction-by-jurisdiction basis. In 2005, a full valuation allowance on net U.S. deferred tax assets was recorded. While the results of 2013 represent positive evidence, the company continues to maintain a full valuation allowance on its net U.S. deferred tax assets as the underlying source of income relates to certain intercompany transactions with a non-taxed jurisdiction, which is excluded from determining whether the DTA will be realized. Until such time that some or all of the valuation allowance is reversed, future income tax expense or benefit in the U.S., excluding any tax expense generated by the company’s indefinite life intangibles, will be offset by adjustments to the valuation allowance to effectively eliminate any income tax expense or benefit in the U.S. Income taxes will continue to be recorded for other tax jurisdictions subject to the need for valuation allowances in those jurisdictions.
As of December 29, 2013, the company’s valuation allowance for U.S. deferred tax assets totaled $119.2 million, which consists of the beginning of the year allowance of $123.8 million, a 2013 benefit of $5.6 million to income from operations and a charge of $1.0 million to OCI. The valuation allowance reduces the carrying value of temporary differences generated by capital losses, capitalized research and development expenses, foreign tax credits, reserves and accruals, and NOL carry forwards, which would require sufficient future capital gains and future ordinary income in order to realize the tax benefits. If the company is ultimately able to utilize all or a portion of the deferred tax assets for which a valuation allowance has been established, then the related portion of the valuation allowance will be released to income from continuing operations, additional paid in capital or OCI.
In 2008, a deferred tax asset and full valuation allowance was recorded in the amount of $24.8 million related to the company’s Malaysian cumulative reinvestment allowance and manufacturing incentives. As of December 27, 2009, the valuation allowance was $26.3 million. In 2010, the valuation allowance increased by $3.5 million to $29.8 million. In 2011, the valuation allowance decreased by $2.5 million to $27.3 million. In 2012, the valuation allowance increased by $1.8 million to $29.1 million. In 2013, the valuation allowance decreased by $2.8 million to $26.3 million.
Deferred income taxes have not been provided for the undistributed earnings of the company’s foreign subsidiaries that are reinvested indefinitely. Deferred income taxes have been provided for the undistributed earnings of the company’s foreign subsidiaries that are part of the repatriation plan, which were immaterial at December 29, 2013. In addition, certain non-U.S. earnings, which have been taxed in the U.S. but earned offshore have and will continue to be part of the company’s repatriation plan. At December 29, 2013, the undistributed earnings of the company’s subsidiaries approximated $375.3 million. The amount of taxes attributable to these undistributed earnings is not practicably determinable.
The Income Tax Topic of the ASC prescribes a recognition threshold and measurement attribute for the financial statement recognition and measurement of a tax position taken or expected to be taken in a tax return. This statement also provides guidance on derecognition, classification, interest and penalties, accounting in the
82
Table of Contents
interim periods, disclosure, and transition. The company adopted the current standard on January 1, 2007. The unrecognized tax benefits at December 29, 2013 and December 30, 2012 total $58.9 million and $58.6 million respectively. Of the total unrecognized tax benefits at December 29, 2013 and December 30, 2012, $3.3 million and $3.0, respectively would impact the effective tax rate, if recognized. The remaining unrecognized tax benefits would not impact the effective tax rate, if recognized, as the company has a full valuation allowance against its U.S. deferred taxes. The timing of the expected cash outflow relating to $3.3 million is not reliably determinable at this time.
A reconciliation of the beginning and ending amount of unrecognized tax benefits is as follows (in millions):
| Year Ended | ||||||||||||
| December 29, 2013 |
December 30, 2012 |
December 25, 2011 |
||||||||||
| Beginning Balance |
$ | 58.6 | $ | 58.4 | $ | 56.5 | ||||||
| Increases related to prior year tax positions |
0.3 | 0.2 | — | |||||||||
| Decreases related to prior year tax positions |
— | — | (0.9 | ) | ||||||||
| Increases related to current year tax positions |
— | — | 2.8 | |||||||||
| Settlements |
— | — | — | |||||||||
|
|
|
|
|
|
|
|||||||
| Ending Balance |
$ | 58.9 | $ | 58.6 | $ | 58.4 | ||||||
|
|
|
|
|
|
|
|||||||
The company’s major tax jurisdictions are the U.S. and Korea. For the U.S., the company has open tax years dating back to 1999 due to the carryforward of tax attributes. In Korea, the company has five open tax years dating back to 2008.
As of December 29, 2013, the company had accrued for penalties and interest relating to uncertain tax positions totaling $0.8 million.
As of December 30, 2012, the company had accrued for penalties and interest relating to uncertain tax positions totaling $0.5 million. The increase of $0.3 million during the year was recognized as a component of income tax expense.
NOTE 9 — STOCK-BASED COMPENSATION
The Stock Compensation Topic of the ASC requires all share-based payments to employees, including grants of employee stock options, to be recognized in the income statement based on their fair values at the date of grant.
The company grants equity awards under the Fairchild Semiconductor 2007 Stock Plan. The company also maintains the 2000 Executive Stock Option Plan and the Fairchild Semiconductor Stock Plan. Fairchild Semiconductor 2007 Stock Plan replaced the Fairchild Semiconductor Stock Plan when the company’s stockholders approved the new plan on May 2, 2007. On that date the shares that remained available for grant under the Fairchild Semiconductor Stock Plan were assumed by the new plan and no further awards were granted under the Fairchild Semiconductor Stock Plan after that date. In addition, the company has occasionally granted equity awards outside its equity compensation plans when necessary.
Fairchild Semiconductor 2007 Stock Plan. Under this plan, officers, employees, non-employee directors, and certain consultants may be granted stock options, stock appreciation rights, restricted stock including restricted stock units (RSUs), performance units (PUs), deferred stock units (DSUs), and other stock-based awards. The plan has been approved by stockholders. The maximum number of shares of common stock that may be delivered under the plan is equal to 22,639,619 shares, plus shares available for issuance as of May 2, 2007,
83
Table of Contents
under the Fairchild Semiconductor Stock Plan and shares subject to outstanding awards under the Fairchild Semiconductor Stock Plan as of May 2, 2007, that cease for any reason to be subject to such awards. The maximum life of any option is ten years from the date of grant for incentive stock options and non-qualified stock options. Actual terms for outstanding non-qualified stock options are eight years, although options may be granted under the plan with up to ten year terms. Options granted under the plan are exercisable at the determination of the compensation committee, generally vesting ratably over four years. PUs are contingently granted depending on the achievement of certain predetermined performance goals. DSUs, RSUs and PUs entitle participants to receive one share of common stock for each DSU, RSU or PU awarded. For RSUs and PUs, the settlement date is the vesting date. For DSUs, the settlement date is selected by the participant at the time of the grant. Grants of PUs generally vest under the plan over a period of three years, and DSUs and RSUs generally vest over a period of three or four years.
Fairchild Semiconductor Stock Plan. The Fairchild Semiconductor Stock Plan authorizes shares of common stock to be issued upon the exercise of equity awards granted under the plan. The plan has been approved by stockholders. The plan was frozen when the Fairchild Semiconductor 2007 Stock Plan was approved on May 2, 2007, and awards are no longer granted under this plan. Under this plan, executives, key employees, non-employee directors and certain consultants were granted non-qualified stock options and RSUs, PUs, and DSUs. Options generally vest over four years with maximum terms ranging from eight to ten years. DSUs, RSUs and PUs entitle participants to receive one share of common stock for each DSU, RSU or PU awarded. For RSUs and PUs, the settlement date is the vesting date. For DSUs, the settlement date is selected by the participant at the time of the grant. Grants of PUs generally vest under the plan over a period of three years, and DSUs and RSUs generally vest over a period of three or four years.
The 2000 Executive Stock Option Plan. The 2000 Executive Stock Option Plan authorizes up to 1,671,669 shares of common stock to be issued upon the exercise of options under the plan. The plan has been approved by stockholders. Individuals receiving options under the plan may not receive in any one year options to purchase more than 1,500,000 shares of common stock. Options generally vest over four years with a maximum term of ten years.
Equity Awards Made Outside Stockholder-Approved Plans. The company has granted equity awards representing a total of 820,000 shares outside its equity compensation plans. As of December 29, 2013, equity awards representing 75,000 shares remain outstanding, all of which are options.
The following table presents a summary of the company’s stock options for the year ended December 29, 2013.
| Year Ended | ||||||||||||||||
| December 29, 2013 | ||||||||||||||||
| Shares | Weighted Average Exercise Price |
Weighted Average Remaining Contractual Life |
Aggregate Intrinsic Value |
|||||||||||||
| (000’s) | (In years) | (In millions) | ||||||||||||||
| Outstanding at beginning of period |
1,933 | $ | 15.42 | |||||||||||||
| Granted |
50 | 14.11 | ||||||||||||||
| Exercised |
(100 | ) | 11.09 | |||||||||||||
| Expired |
(795 | ) | 16.02 | |||||||||||||
|
|
|
|
|
|
|
|
|
|||||||||
| Outstanding at end of period |
1,088 | $ | 15.32 | 1.6 | 0.7 | |||||||||||
|
|
|
|
|
|
|
|
|
|||||||||
| Exercisable at end of period |
1,019 | $ | 15.40 | 1.2 | 0.7 | |||||||||||
There were 25,000 options granted during 2012 and no options granted during 2011.
84
Table of Contents
The following table presents a summary of the company’s DSUs for the year ended December 29, 2013.
| Year Ended | ||||||||
| December 29, 2013 | ||||||||
| Shares | Weighted Average Grant-date Fair Value |
|||||||
| (000’s) | ||||||||
| Outstanding at beginning of period |
349 | $ | 13.27 | |||||
| Granted |
97 | 13.98 | ||||||
| Vested and released |
(50 | ) | 11.46 | |||||
| Forfeited |
— | — | ||||||
|
|
|
|
|
|||||
| Outstanding at end of period |
396 | $ | 13.02 | |||||
|
|
|
|
|
|||||
The weighted average grant-date fair value for DSUs granted during the years ended December 30, 2012 and December 25, 2011 was $14.30 and $19.80, respectively. The total grant-date fair value for DSUs vested during the years ended December 29, 2013, December 30, 2012, and December 25, 2011 was $0.6 million, $0.6 million and $0.8 million, respectively. The number, weighted-average exercise price, aggregate intrinsic value and weighted average remaining contractual term for DSUs vested and outstanding is 215,675 units, zero (as these are zero strike price awards), $2.8 million and 1.59 years, respectively.
The company’s plan documents governing DSUs contain contingent cash settlement provisions upon a change of control. Accordingly, the company presents previously recorded expense associated with unvested and unsettled DSUs under the balance sheet caption “Temporary equity-deferred stock units” as required by Securities and Exchange Commission (SEC) Accounting Series Release 268 and the Distinguishing Liabilities from Equity Topic in the ASC.
The following table presents a summary of the company’s RSUs for the year ended December 29, 2013.
| Year Ended | ||||||||
| December 29, 2013 | ||||||||
| Shares | Weighted Average Grant-date Fair Value |
|||||||
| (000’s) | ||||||||
| Nonvested at beginning of period |
4,265 | $ | 13.17 | |||||
| Granted |
3,049 | 13.94 | ||||||
| Vested |
(1,721 | ) | 11.02 | |||||
| Forfeited |
(889 | ) | 14.24 | |||||
|
|
|
|
|
|||||
| Nonvested at end of period |
4,704 | $ | 14.21 | |||||
|
|
|
|
|
|||||
The weighted average grant-date fair value for RSUs granted during the years ended December 30, 2012 and December 25, 2011 was $14.40 and $17.14, respectively. The total grant-date fair value for RSUs vested during the year ended December 29, 2013, December 30, 2012, and, December 25, 2011 was $19.0 million, $16.0 million and $11.0 million, respectively.
85
Table of Contents
The following table presents a summary of the company’s PUs for the year ended December 29, 2013.
| Year Ended | ||||||||
| December 29, 2013 | ||||||||
| Shares | Weighted Average Grant-date Fair Value |
|||||||
| (000’s) | ||||||||
| Nonvested at beginning of period |
583 | $ | 14.48 | |||||
| Granted |
991 | 13.99 | ||||||
| Vested |
(356 | ) | 13.99 | |||||
| Forfeited |
(248 | ) | 14.48 | |||||
|
|
|
|
|
|||||
| Nonvested at end of period |
970 | $ | 14.39 | |||||
|
|
|
|
|
|||||
The weighted average grant-date fair value for PUs granted during the years ended December 30, 2012 and December 25, 2011 was $15.77 and $17.38, respectively. The total grant-date fair value for PUs vested during the year ended December 29, 2013, December 30, 2012 and December 25, 2011 was $5.0 million, $7.4 million and $4.4 million, respectively.
The following table summarizes the total intrinsic value for stock options exercised and DSUs, RSUs and PUs vested (i.e. the difference between the market price at exercise and the price paid by employees to exercise the award) for 2013, 2012 and 2011, respectively.
| Year Ended | ||||||||||||
| December 29, 2013 |
December 30, 2012 |
December 25, 2011 |
||||||||||
| (In millions) | ||||||||||||
| Options |
$ | 0.3 | $ | 0.8 | $ | 10.8 | ||||||
| DSUs |
$ | 0.7 | $ | 0.5 | $ | 0.8 | ||||||
| RSUs |
$ | 24.1 | $ | 23.5 | $ | 24.0 | ||||||
| PUs |
$ | 5.0 | $ | 12.3 | $ | 12.4 | ||||||
The company’s practice is to issue shares of common stock upon exercise or settlement of options, DSUs, RSUs and PUs from previously unissued shares. For the year ended December 29, 2013 and December 30, 2012, $1.1 million and $5.0 million, respectively, was received from exercises of stock-based awards.
Valuation and Expense Information
The following table summarizes stock-based compensation expense by financial statement caption, for the years ended December 29, 2013, December 30, 2012 and December 25, 2011.
| Year Ended | ||||||||||||
| December 29, 2013 |
December 30, 2012 |
December 25, 2011 |
||||||||||
| (In millions) | ||||||||||||
| Cost of Sales |
$ | 4.9 | $ | 4.5 | $ | 4.3 | ||||||
| Research and Development |
7.5 | 5.7 | 4.8 | |||||||||
| Selling, General and Administrative |
15.5 | 12.4 | 15.7 | |||||||||
|
|
|
|
|
|
|
|||||||
| $ | 27.9 | $ | 22.6 | $ | 24.8 | |||||||
|
|
|
|
|
|
|
|||||||
The company also capitalized $1.0, $0.6 and $0.6 million of stock-based compensation into inventory for the years ended December 29, 2013, December 30, 2012 and December 25, 2011, respectively. In addition, due to the valuation allowance for U.S. deferred income tax assets recorded by the company, no tax benefit on U.S.
86
Table of Contents
based stock compensation expense was recognized in the years ended December 29, 2013, December 30, 2012 and December 25, 2011. No material income tax benefit was recognized by foreign tax jurisdictions for the year ended December 29, 2013, December 30, 2012 and December 25, 2011.
The following table summarizes total compensation cost related to unvested awards not yet recognized and the weighted average period over which it is expected to be recognized at December 29, 2013.
| December 29, 2013 | ||||||||
| Unrecognized Compensation Cost for Unvested Awards |
Weighted Average Remaining Recognition Period |
|||||||
| (In millions) | (In years) | |||||||
| Options |
0.4 | 3.2 | ||||||
| DSUs |
0.4 | 2.1 | ||||||
| RSUs |
50.3 | 2.7 | ||||||
| PUs |
4.8 | 2.2 | ||||||
The fair value of each option grant for the company’s plans is estimated on the date of the grant using the Black-Scholes option pricing model. There were four option grants in 2013, one option grant in 2012 and no options were granted in 2011. The fair value of each DSU, RSU and PU is equal to the closing market price of the company’s common stock on the date of grant.
| Year Ended | ||||
| December 29, 2013 |
||||
| Expected volatility |
50.1 | % | ||
| Dividend yield |
— | |||
| Risk-free interest rate |
0.7 | % | ||
| Expected life, in years |
5.33 | |||
Expected volatility. The company utilizes an average of implied volatility and the most recent historical volatility commensurate with expected life.
Dividend yield. The company does not pay a dividend, therefore this input is not applicable.
Risk-free interest rate. The company estimated the risk-free interest rate based on zero-coupon U.S. Treasury securities for a period that is commensurate with the expected life assumption.
Expected life. The company has evaluated expected life based on history and exercise patterns across its demographic population. The company believes that this historical data is the best estimate of the expected life of a new option, and that generally all groups of the company’s employees exhibit similar exercise behavior.
Due to the performance criteria, the company’s performance units will be expensed over the service period for each separately vesting tranche.
NOTE 10—RETIREMENT PLANS
The company sponsors the Fairchild Personal Savings and Retirement Plan (the “Retirement Plan”), a contributory savings plan which qualifies under section 401(k) of the Internal Revenue Code. The Retirement Plan covers substantially all employees in the U.S. As of January 1, 2007, the company provided a discretionary matching contribution equal to 100% of employee elective deferrals on the first 3% of pay that is contributed to the Retirement Plan and 50% of the next 2% of pay contributed. The company also maintains a non-qualified
87
Table of Contents
Benefit Restoration Plan, under which certain eligible employees who have otherwise exceeded annual IRS limitations for elective deferrals can continue to contribute to their retirement savings. The company matched employee elective deferrals to the Benefit Restoration Plan on the same basis as the Retirement Plan. Total expense recognized under these plans was $5.8 million, $5.3 million and $5.0 million for 2013, 2012 and 2011, respectively.
Prior to the fourth quarter of 2011, employees in Korea who have been with the company for over one year were entitled by Korean law to receive lump-sum payments upon termination of their employment. The payments were based on current rates of pay and length of service through the date of termination. It was the company’s policy to accrue for this estimated liability as of each balance sheet date. Amount recognized as expense was $9.0 million for 2011. Due to a change in Korean tax laws impacting deductibility the company converted the retirement plan to a funded defined contribution plan in December of 2011. As a result of this change, the company paid out $17.7 million in cash to fund the plan, inclusive of one-time incentive payment and incurred a $2.7 million expense. Contribution expense for the defined contribution plan was $6.5 million and $7.2 million in 2013 and 2012, respectively.
Employees in Malaysia participate in a defined contribution plan. The company has funded accruals for this plan in accordance with statutory regulations in Malaysia. Amounts recognized as expense for contributions made by the company under this plan were $2.4 million, $2.2 million and $2.1 million for 2013, 2012 and 2011, respectively.
Employees in the United Kingdom, Italy, Germany, Finland, China, Hong Kong, the Philippines, Japan and Taiwan are also covered by a variety of defined benefit or defined contribution pension plans that are administered consistent with local statutes and practices. The expense under each of the respective plans for 2013, 2012 and 2011 was not material to the consolidated financial statements.
In accordance with the Compensation – Retirement Benefits Topic of the ASC the company recognizes the over-funded or under-funded status of its defined postretirement plans as an asset or liability in its statement of financial position. The company currently has defined benefit pension plans in Germany, the Philippines, and Taiwan. The net funded status for the company’s foreign defined benefit plans was $7.8 million and $6.1 million at December 29, 2013 and December 30, 2012, respectively, and was recognized as a liability in the consolidated statements of financial position. The company measures plan assets and benefit obligations as of the date of the fiscal year-end.
NOTE 11—LEASE COMMITMENTS
Rental expense related to certain facilities and equipment of the company’s plants was $19.5 million, $18.2 million and $18.4 million, for 2013, 2012 and 2011, respectively.
Certain facility and land leases contain renewal provisions. Future minimum lease payments under non-cancelable operating leases as of December 29, 2013 are as follows:
| Year ending December, |
(In millions) | |||
| 2014 |
18.1 | |||
| 2015 |
14.4 | |||
| 2016 |
6.3 | |||
| 2017 |
1.9 | |||
| 2018 |
0.8 | |||
| Thereafter |
0.0 | |||
|
|
|
|||
| $ | 41.5 | |||
|
|
|
|||
88
Table of Contents
NOTE 12—STOCKHOLDERS’ EQUITY
Preferred Stock
Under the company’s restated certificate of incorporation, the company’s Board of Directors has the authority to issue up to 100,000 shares of $0.01 par value preferred stock, but only in connection with the adoption of a stockholder rights plan. At December 29, 2013 and December 30, 2012, no shares were issued.
Common Stock
The company has authorized 340,000,000 shares of Common Stock at a par value of $.01 per share.
The company accounts for treasury stock acquisitions using the cost method. At December 29, 2013 and December 30, 2012, there were approximately 12.3 million and 10.0 million treasury shares, respectively held by the company.
NOTE 13—RESTRUCTURING AND IMPAIRMENTS
The company assesses the need to record restructuring and impairment charges in accordance with the following Topics in the ASC; Exit and Disposal Cost Obligations, Compensation—Retirement Benefits, Compensation—Non Retirement Postemployment Benefits, and Property Plant and Equipment.
2008 Infrastructure Realignment Program
The 2008 Infrastructure Realignment Program includes costs related to several asset impairments for non-industry standard packaging capacity and simplification of our supply chain planning systems. The company also adjusted the workforce mix in our Maine fab as the company converted to a more automated and technologically advanced eight-inch wafer production process. In addition, headcount was reduced in certain sales and marketing activities to further streamline selling, general and administration costs.
The company has completed payment of the employee severance accruals related to the 2008 Infrastructure Realignment Program. Payouts associated with the 2008 lease impairment were made on a regular basis and were completed in the fourth quarter of 2011.
2009 Infrastructure Realignment Program
The 2009 Infrastructure Realignment Program includes costs associated with the previously planned closure of the Mountaintop, Pennsylvania manufacturing facility and the closure of the four-inch manufacturing line in Bucheon, South Korea. The 2009 Program also includes charges for a smaller worldwide cost reduction plan to further right-size our company and remain financially healthy.
The consolidation of the South Korea fabrication processes was completed in 2011. During 2011, the company decided to keep open the Mountain Top facility reversing the March 2009 announcement to close the site. The company determined the Mountain Top facility was essential to supporting the automotive customers’ current and future needs. As a result of this decision the reserves related to Mountain Top restructuring action were released and previously accrued employee stay-on bonuses were paid out prior to the end of 2011.
2010 Infrastructure Realignment Program
During 2010, the company recorded restructuring and impairment charges, net of releases, totaling $7.0 million. The charges are detailed in the table below.
The 2010 Infrastructure Realignment Program includes costs to simplify and realign some activities within the MCCC segment, costs for the continued refinement of the company’s manufacturing strategy, and costs associated with centralizing the company’s accounting functions.
89
Table of Contents
2011 Infrastructure Realignment Program
During 2011, the company recorded restructuring and impairment charges, net of releases, totaling $2.8 million. The charges are detailed in the table below.
The 2011 Infrastructure Realignment Program includes costs for organizational changes in the company’s supply chain management group, the website technology group, the quality organization, and other administrative groups. The 2011 program also includes costs to further improve the company’s manufacturing strategy and changes in both the PCIA and MCCC groups.
2012 Infrastructure Realignment Program
During 2012, the company recorded restructuring and impairment charges, net of releases, totaling $14.1 million. The charges are detailed in the table below.
The 2012 Infrastructure Realignment Program includes costs for organizational changes in the company’s sales organization, manufacturing sites and manufacturing support organizations, the human resources function, executive management levels, and the MCCC and PCIA product lines as well as the termination of an IT systems lease and the final closure of a warehouse in Korea.
2013 Infrastructure Realignment Program
During 2013, the company recorded restructuring and impairment charges, net of releases, totaling $15.9 million. The charges are detailed in the table below.
The 2013 Infrastructure Realignment Program includes costs to close the 8-inch line at the company’s Salt Lake wafer fab facility and transfer the manufacturing to the 8-inch lines in Korea and Mountaintop, as well as organizational changes in the company’s mobile product group, manufacturing support organizations, executive management, and sales organizations
| Accrual Balance at 12/26/2010 |
New Charges |
Cash Paid |
Reserve Release |
Non-Cash Items |
Accrual Balance at 12/25/2011 |
|||||||||||||||||||
| 2008 Infrastructure Realignment Program: |
||||||||||||||||||||||||
| Employee Separation Costs |
$ | — | $ | — | $ | — | $ | — | $ | — | $ | — | ||||||||||||
| Lease Impairment Costs |
$ | 0.7 | $ | — | $ | (0.7 | ) | $ | — | $ | — | $ | — | |||||||||||
| 2009 Infrastructure Realignment Program: |
||||||||||||||||||||||||
| Employee Separation Costs |
8.1 | 1.9 | (1.8 | ) | (8.2 | ) | — | $ | — | |||||||||||||||
| Fab Closure Costs |
— | 0.7 | (0.7 | ) | — | — | — | |||||||||||||||||
| 2010 Infrastructure Realignment Program: |
||||||||||||||||||||||||
| Employee Separation Costs |
2.2 | 3.6 | (4.4 | ) | (0.4 | ) | — | 1.0 | ||||||||||||||||
| 2011 Infrastructure Realignment Program: |
||||||||||||||||||||||||
| Employee Separation Costs |
$ | — | 5.4 | (3.5 | ) | (0.2 | ) | — | $ | 1.7 | ||||||||||||||
|
|
|
|
|
|
|
|
|
|
|
|
|
|||||||||||||
| $ | 11.0 | $ | 11.6 | $ | (11.1 | ) | $ | (8.8 | ) | $ | — | $ | 2.7 | |||||||||||
|
|
|
|
|
|
|
|
|
|
|
|
|
|||||||||||||
90
Table of Contents
| Accrual Balance at 12/25/2011 |
New Charges |
Cash Paid |
Reserve Release |
Non-Cash Items |
Accrual Balance at 12/30/2012 |
|||||||||||||||||||
| 2010 Infrastructure Realignment Program: |
||||||||||||||||||||||||
| Employee Separation Costs |
$ | 1.0 | $ | — | $ | (0.7 | ) | $ | (0.1 | ) | $ | — | $ | 0.2 | ||||||||||
| 2011 Infrastructure Realignment Program: |
||||||||||||||||||||||||
| Employee Separation Costs |
1.7 | 1.0 | (1.7 | ) | (0.4 | ) | — | 0.6 | ||||||||||||||||
| Asset Impairment Costs |
— | 0.1 | — | — | (0.1 | ) | — | |||||||||||||||||
| 2012 Infrastructure Realignment Program: |
||||||||||||||||||||||||
| Employee Separation Costs |
— | 12.5 | (9.8 | ) | — | — | 2.8 | |||||||||||||||||
| Facility Closure Costs |
— | 0.4 | (0.4 | ) | — | — | — | |||||||||||||||||
| Lease Termination Costs |
— | 0.6 | (0.1 | ) | — | — | 0.5 | |||||||||||||||||
|
|
|
|
|
|
|
|
|
|
|
|
|
|||||||||||||
| $ | 2.7 | $ | 14.6 | $ | (12.7 | ) | $ | (0.5 | ) | $ | (0.1 | ) | $ | 4.1 | ||||||||||
|
|
|
|
|
|
|
|
|
|
|
|
|
|||||||||||||
| Accrual Balance at 12/30/2012 |
New Charges |
Cash Paid |
Reserve Release |
Non-Cash Items |
Accrual Balance at 12/29/2013 |
|||||||||||||||||||
| 2010 Infrastructure Realignment Program: |
||||||||||||||||||||||||
| Employee Separation Costs |
$ | 0.2 | $ | — | $ | (0.2 | ) | $ | — | $ | — | $ | — | |||||||||||
| 2011 Infrastructure Realignment Program: |
||||||||||||||||||||||||
| Employee Separation Costs |
0.6 | — | (0.3 | ) | — | — | 0.3 | |||||||||||||||||
| 2012 Infrastructure Realignment Program: |
||||||||||||||||||||||||
| Employee Separation Costs |
2.8 | 0.1 | (2.5 | ) | (0.2 | ) | — | 0.2 | ||||||||||||||||
| Lease Termination Costs |
0.5 | — | (0.3 | ) | (0.1 | ) | — | 0.1 | ||||||||||||||||
| 2013 Infrastructure Realignment Program: |
||||||||||||||||||||||||
| Employee Separation Costs |
— | 11.0 | (7.7 | ) | (0.1 | ) | — | 3.2 | ||||||||||||||||
| Asset Impairment, Other |
— | 1.6 | — | — | (1.6 | ) | — | |||||||||||||||||
| Line closure costs |
— | 3.0 | (3.0 | ) | — | — | — | |||||||||||||||||
| Lease Termination Costs |
— | 0.6 | (0.2 | ) | — | — | 0.4 | |||||||||||||||||
|
|
|
|
|
|
|
|
|
|
|
|
|
|||||||||||||
| $ | 4.1 | $ | 16.3 | $ | (14.2 | ) | $ | (0.4 | ) | $ | (1.6 | ) | $ | 4.2 | ||||||||||
|
|
|
|
|
|
|
|
|
|
|
|
|
|||||||||||||
NOTE 14—RELATED PARTY TRANSACTIONS
On September 8, 2004, the company entered into a trust agreement with a third party, as Trustee, to secure the funding of post-retirement health insurance benefits previously granted under the employment agreements executed in 2000 with three former executive officers who retired from the company in 2005. The company contributed $2.25 million to the trust upon its creation. Each former executive is entitled to health care benefits for himself and his eligible dependents until the later of his or his spouse’s death. The trust will be used to pay health insurance premiums and reimbursable related expenses to satisfy these obligations. Upon a change in control, the company or its successor is obligated to contribute additional funds to the trust, if and to the extent necessary to provide all remaining health care benefits required under the employment agreements. The trust will terminate when the company’s obligation to provide the health care benefits ends, at which time any remaining trust assets will be returned to the company.
NOTE 15—COMMITMENTS AND CONTINGENCIES
The company has future commitments to purchase chemicals for certain wafer fabrication facilities. In the event the company was to end the agreements, the company would be required to pay future minimum payments of approximately $12.6 million. The company does not accrue for this liability as we expect to use these chemicals in the ordinary course of business.
The company’s facilities in South Portland, Maine and West Jordan, Utah have ongoing environmental remediation projects to respond to certain releases of hazardous substances that occurred prior to the leveraged
91
Table of Contents
recapitalization of the company from National Semiconductor. Pursuant to the Asset Purchase Agreement with National Semiconductor Corporation, National Semiconductor has agreed to indemnify the company for the future costs of these projects. The terms of the indemnification are without time limit and without maximum amount. The costs incurred to respond to these conditions were not material to the consolidated financial statements for any period presented. National Semiconductor Corporation was purchased by Texas Instruments Incorporated during the fourth quarter of 2011.
Pursuant to the 1999 asset agreement to purchase the power device business of Samsung Electronics Co., Ltd., Samsung agreed to indemnify the company for remediation costs and other liabilities related to historical contamination, up to $150 million. The company is unable to estimate the potential amounts of future payments, if any; however, any future payments are not expected to have a material impact on the company’s earnings or financial condition.
Patent Litigation with Power Integrations, Inc. There are five outstanding proceedings with Power Integrations.
POWI 1: On October 20, 2004, the company and its wholly owned subsidiary, Fairchild Semiconductor Corporation, were sued by Power Integrations, Inc. in the U.S. District Court for the District of Delaware. Power Integrations alleged that certain of the company’s pulse width modulation (PWM) integrated circuit products infringed four Power Integrations U.S. patents, and sought a permanent injunction preventing the company from manufacturing, selling or offering the products for sale in the U.S., or from importing the products into the U.S., as well as money damages for past infringement.
The trial in the case was divided into three phases. In the first phase of the trial that occurred in October of 2006, a jury returned a verdict finding that thirty-three of the company’s PWM products willfully infringed one or more of seven claims asserted in the four patents and assessed damages against the company. The company voluntarily stopped U.S. sales and importation of those products in 2007 and has been offering replacement products since 2006. Subsequent phases of the trial conducted during 2007 and 2008 focused on the validity and enforceability of the patents. In December of 2008, the judge overseeing the case reduced the jury’s 2006 damages award from $34 million to approximately $6.1 million and ordered a new trial on the issue of willfulness. Following the new trial held in June of 2009, the court found the company’s infringement to have been willful and in January 2011 the court awarded Power Integrations final damages in the amount of $12.2 million. The company appealed the final damages award, willfulness finding, and other issues to the U.S. Court of Appeals for the Federal Circuit. On March 26, 2013, the court of appeals vacated almost the entire damages award, ruling that there was no basis upon which a reasonable jury could find Fairchild liable for induced infringement. The court also vacated the earlier ruling of willful patent infringement by Fairchild. While the appeals court instructed the lower court to conduct further proceedings to determine damages based upon approximately $500,000 to $750,000 worth of sales and imports of affected products, Fairchild believes that damages on the basis of that level of infringing activity would not be material to Fairchild. Accordingly, the company released $12.6 million from the reserves relating to this case during the first quarter of 2013. The appeals court denied Power Integrations’ motions to rehear the case. On August 23, 2013, Power Integrations filed a Petition for a Writ of Certiorari with the Supreme Court of the United States, seeking review of various aspects of the court of appeals ruling. On January 13, 2014, the Supreme Court denied Power Integrations’ Petition for a Writ of Certiorari.
POWI 2: On May 23, 2008, Power Integrations filed another lawsuit against the company, Fairchild Semiconductor Corporation and our wholly owned subsidiary System General Corporation in the U.S. District Court for the District of Delaware, alleging infringement of three patents. Of the three patents asserted in that lawsuit, two were asserted against the company and Fairchild Semiconductor Corporation in the October 2004 lawsuit described above. In 2011, Power Integrations added a fourth patent to this case.
On October 14, 2008, Fairchild Semiconductor Corporation and System General Corporation filed a patent infringement lawsuit against Power Integrations in the U.S. District Court for the District of Delaware, alleging
92
Table of Contents
that certain PWM integrated circuit products infringe one or more claims of two U.S. patents owned by System General. The lawsuit seeks monetary damages and an injunction preventing the manufacture, use, sale, offer for sale or importation of Power Integrations products found to infringe the asserted patents.
Both lawsuits were consolidated and heard together in a jury trial in April of 2012. On April 27, 2012, the jury found that Power Integrations infringed one of the two U.S. patents owned by System General and upheld the validity of both System General patents. In the same case, the jury found that the company infringed two of four U.S. patents asserted by Power Integrations and that the company had induced its customers to infringe the asserted patents. The jury also upheld the validity of the asserted Power Integrations patents. The verdict concluded the first phase of trial in the litigation. Willfulness and damages in the case will be determined in a second phase, which has yet to be scheduled and may occur after appeals of the first phase.
POWI 3: On November 4, 2009, Power Integrations filed a complaint for patent infringement against the company and two of the company’s subsidiaries in the U.S. District Court for the Northern District of California alleging that several of our products infringe three of Power Integrations’ patents. Fairchild has filed counterclaims asserting that Power Integrations infringes two Fairchild patents. The trial began in February 2014 and is ongoing.
POWI 4: On February 10, 2010, Fairchild and System General filed a lawsuit in Suzhou, China against four Power Integrations entities and seven vendors. The lawsuit claims that Power Integrations violates certain Fairchild/System General patents. Fairchild is seeking an injunction against the Power Integrations products and over $17.0 million in damages. Hearings comparable to a trial in U.S. litigation were held in January, May and July 2012. In December of 2012, the Suzhou court ruled in favor of Power Integrations and denied the claims. The company is appealing the trial court’s judgment to the appeals court in Nanjing, China.
POWI 5: On May 1, 2012, Fairchild sued Power Integrations in U.S. District Court for the District of Delaware. The lawsuit accuses Power Integration’s LinkSwitch-PH LED power conversion products of violating three Fairchild patents. Power Integrations has filed counterclaims of patent infringement against Fairchild asserting five Power Integrations patents. Trial is expected in 2014.
Other Legal Claims. From time to time the company is involved in legal proceedings in the ordinary course of business. For example, in December 2013, the customer of one of its distributors filed suit against the company claiming damages of $30 million arising out of the purchase of $20,000 of its products. The company believes that there are no other such ordinary-course pending litigation that could have, individually or in the aggregate, a material adverse effect on its business, financial condition, results of operations, or cash flows. Legal costs are expensed as incurred.
The company analyzes potential outcomes from current litigation in accordance with the Contingency Topic of the FASB ASC. Accordingly, the company analyzes such outcomes as loss contingencies, and divides them into three categories based on the possibility that the contingency will give rise to an actual loss. The first category represents contingencies for which management believes the possibility of loss is remote. For contingencies in this category, the company does not record a reserve or assess the range of possible losses. The second category represents contingencies for which losses are believed to be reasonably possible. For this category, the company assesses the range of possible losses but does not record a reserve. There are currently no contingencies in this category. The third category represents contingencies for which losses are believed to be probable. For this category, the company determines the range of probable losses and records a reserve reflecting the best estimate within the range. For contingencies within this category, the company currently believes the range of probable losses is approximately $1.5 million to $4.0 million and the best estimate of losses within this range to be $1.5 million as of September 29, 2013 and has recorded this amount as a reserve. The amount reserved is based upon assessments of the potential liabilities using analysis of claims and historical experience in defending and resolving such claims.
93
Table of Contents
NOTE 16—DERIVATIVES
The company uses derivative instruments to manage exposures to changes in foreign currency exchange rates and interest rates. In accordance with the requirements of the Derivatives and Hedging Topic of the FASB ASC, the fair value of these hedges is recorded on the balance sheet. For the fair value of derivatives, see Note 3.
Foreign Currency Derivatives. The company uses currency forward and combination option contracts to hedge a portion of its forecasted foreign exchange denominated revenues and expenses. The company monitors its foreign currency exposures to maximize the overall effectiveness of its foreign currency hedge positions. Currencies hedged include the euro, Japanese yen, Philippine peso, Malaysian ringgit, Korean won, Taiwan dollar and Chinese yuan. The company’s objectives for holding derivatives are to minimize the risks using the most effective methods to eliminate or reduce the impacts of these exposures. The maturities of the cash flow hedges are 12 months or less as of the end of December 29, 2013.
Changes in the fair value of derivative instruments related to time value are included in the assessment of hedge effectiveness. Hedge ineffectiveness, determined in accordance the Derivatives and Hedging Topic of the FASB ASC, did not have a material impact on earnings for the years ended December 29, 2013, December 30, 2012, and December 25, 2011. No cash flow hedges were derecognized or discontinued in 2013, 2012 and 2011.
Derivative gains and losses included in AOCI are reclassified into earnings at the time the forecasted transaction is recognized. The company estimates that $6.3 million of net unrealized derivative gains included in AOCI will be reclassified into earnings within the next twelve months.
The company also uses currency forward and combination option contracts to offset the foreign currency impact of balance sheet translation. These derivatives have one month terms and the initial fair value, if any, and the subsequent gains or losses on the change in fair value are reported in earnings within the same income statement line as the impact of the foreign currency translation.
The table below shows the notional principal and the location and amounts of the derivative fair values in the statement of operations and the consolidated balance sheet as of and for the periods ended December 29, 2013 and December 30, 2012. Pursuant to the Derivatives and Hedging Topic of the FASB ASC, the company nets the fair value of all derivative financial instruments with counterparties for which a master netting arrangement is utilized. The notional principal amounts for these instruments provide one measure of the transaction volume outstanding as of year-end and do not represent the amount of the company’s exposure to credit or market loss. The estimates of fair value are based on applicable and commonly used pricing models using prevailing financial market information as of December 29, 2013 and December 30, 2012. Although the following table reflects the notional principal and fair value of amounts of derivative financial instruments, it does not reflect the gains or losses associated with the exposures and transactions that these financial instruments are intended to hedge. The amounts ultimately realized upon settlement of these financial instruments, together with the gains and losses on the underlying exposures will depend on actual market conditions during the remaining life of the instruments.
94
Table of Contents
The following tables present derivatives designated as hedging instruments under the Derivatives and Hedging Topic of the FASB ASC.
| As of December 29, 2013 | As of December 30, 2012 | |||||||||||||||||||||||||||
| Balance Sheet Classification |
Notional Amount |
Fair Value |
Amount of Gain (Loss) Recognized In AOCI |
Balance Sheet Classification |
Notional Amount |
Fair Value |
Amount of Gain (Loss) Recognized In AOCI |
|||||||||||||||||||||
| (In millions) | (In millions) | |||||||||||||||||||||||||||
| Derivatives in Cash Flow Hedges |
||||||||||||||||||||||||||||
| Foreign exchange contracts |
||||||||||||||||||||||||||||
| Derivatives for forecasted revenues |
Current assets |
$ | 6.3 | $ | 0.3 | $ | 0.3 | Current assets |
$ | 6.4 | $ | 0.3 | $ | 0.3 | ||||||||||||||
| Derivatives for forecasted revenues |
Current liabilities |
44.5 | (1.1 | ) | (1.1 | ) | Current liabilities |
51.7 | (0.9 | ) | (0.9 | ) | ||||||||||||||||
| Derivatives for forecasted expenses |
Current assets |
136.1 | 5.9 | 5.9 | Current assets |
213.3 | 7.6 | 7.6 | ||||||||||||||||||||
| Derivatives for forecasted expenses |
Current liabilities |
44.2 | (0.8 | ) | (0.8 | ) | Current liabilities |
2.8 | — | — | ||||||||||||||||||
|
|
|
|
|
|
|
|
|
|
|
|
|
|||||||||||||||||
| Total foreign exchange contract derivatives |
$ | 231.1 | $ | 4.3 | $ | 4.3 | $ | 274.2 | $ | 7.0 | $ | 7.0 | ||||||||||||||||
|
|
|
|
|
|
|
|
|
|
|
|
|
|||||||||||||||||
| For the Twelve Months Ended December 29, 2013 |
For the Twelve Months Ended December 30, 2012 |
|||||||||||||||||||||||
| Income Statement Classification of Gain (Loss) |
Amount of Gain (Loss) Recognized In Income |
Amount of Gain (Loss) Reclassified from AOCI |
Income Statement Classification of Gain (Loss) |
Amount of Gain (Loss) Recognized In Income |
Amount of Gain (Loss) Reclassified from AOCI |
|||||||||||||||||||
| Derivatives in Cash Flow Hedges |
||||||||||||||||||||||||
| Foreign Currency contracts |
Revenue | $ | 0.2 | $ | 0.2 | Revenue | $ | 1.2 | $ | 1.2 | ||||||||||||||
| Foreign Currency contracts |
Expenses | 4.7 | 4.7 | Expenses | 2.0 | 2.0 | ||||||||||||||||||
|
|
|
|
|
|
|
|
|
|||||||||||||||||
| $ | 4.9 | $ | 4.9 | $ | 3.2 | $ | 3.2 | |||||||||||||||||
|
|
|
|
|
|
|
|
|
|||||||||||||||||
The company nets the fair value of all derivative financial instruments with counterparties for which a master netting arrangement is utilized. The gross amounts of the above assets and liabilities are as follows:
| As of December 29, 2013 |
As of December 30, 2012 |
|||||||||
| (In millions) | (In millions) | |||||||||
| Gross Assets |
$ | 6.3 | Gross Assets | $ | 8.1 | |||||
| Gross Liabilities |
(0.1 | ) | Gross Liabilities | (0.2 | ) | |||||
|
|
|
|
|
|||||||
| Current Assets |
$ | 6.2 | Current Assets | $ | 7.9 | |||||
|
|
|
|
|
|||||||
| Gross Assets |
$ | — | Gross Assets | $ | 0.5 | |||||
| Gross Liabilities |
(1.9 | ) | Gross Liabilities | (1.4 | ) | |||||
|
|
|
|
|
|||||||
| Current Liabilities |
$ | (1.9 | ) | Current Liabilities | $ | (0.9 | ) | |||
|
|
|
|
|
|||||||
| Gain (Loss) Recognized in OCI for Derivative Instruments (1) | ||||||||||||
| Year Ended | ||||||||||||
| December 29, 2013 | December 30, 2012 | December 25, 2011 | ||||||||||
| Interest rate contract |
$ | — | $ | — | $ | — | ||||||
| Foreign exchange contracts |
(2.7 | ) | 12.6 | (7.9 | ) | |||||||
|
|
|
|
|
|
|
|||||||
| $ | (2.7 | ) | $ | 12.6 | $ | (7.9 | ) | |||||
|
|
|
|
|
|
|
|||||||
| (1) | This amount is inclusive of both realized and unrealized gains and losses recognized in OCI. |
95
Table of Contents
The following tables present derivatives not designated as hedging instruments under Derivatives and Hedging Topic of the FASB ASC.
| As of December 29, 2013 | As of December 30, 2012 | |||||||||||||||||||
| Balance Sheet Classification |
Notional Amount |
Fair Value |
Balance Sheet Classification |
Notional Amount |
Fair Value |
|||||||||||||||
| (In millions) | (In millions) | |||||||||||||||||||
| Derivatives Not Designated as Hedging Instruments |
||||||||||||||||||||
| Foreign Exchange Contracts |
Current assets | $ | 2.3 | $ | — | Current assets | $ | — | $ | — | ||||||||||
| Foreign Exchange Contracts |
Current liabilities | 11.0 | — | Current liabilities | 12.1 | — | ||||||||||||||
|
|
|
|
|
|
|
|
|
|||||||||||||
| Total derivatives, net |
$ | 13.3 | $ | — | $ | 12.1 | $ | — | ||||||||||||
|
|
|
|
|
|
|
|
|
|||||||||||||
| For the Twelve Months Ended December 29, 2013 |
For the Twelve Months Ended December 30, 2012 |
|||||||||||||||
| Income Statement Classification of Gain (Loss) |
Amount of Gain (Loss) Recognized In Income |
Income Statement Classification of Gain (Loss) |
Amount of Gain (Loss) Recognized In Income |
|||||||||||||
| (In millions) | (In millions) | |||||||||||||||
| Derivatives Not Designated as Hedging Instruments |
||||||||||||||||
| Foreign Exchange Contracts |
Revenue | $ | 0.1 | Revenue | $ | 0.1 | ||||||||||
| Foreign Exchange Contracts |
Expenses | (0.8 | ) | Expenses | 0.6 | |||||||||||
|
|
|
|
|
|||||||||||||
| Net gain (loss) recognized in income |
$ | (0.7 | ) | $ | 0.7 | |||||||||||
|
|
|
|
|
|||||||||||||
NOTE 17—OPERATING SEGMENT AND GEOGRAPHIC INFORMATION
The company is currently organized into three reportable segments. The organization is an application based structure which corresponds with the way the company manages the business. The majority of the company’s activities are aligned into two focus areas; The Mobile, Computing, Consumer, and Communication (MCCC) business, which focuses on mobile, computing and multimedia applications with typically lower power requirements, and the Power Conversion, Industrial, and Automotive (PCIA) business, which focuses on the higher power requirements for motor control solutions, power supplies, power conversion and automotive drive train applications. Each of these segments has a relatively small set of leading customers, common technology requirements and similar design cycles. The Standard Discrete and Standard Linear (SDT) business is managed separately as a third segment.
In addition to the operating segments mentioned above, the company also operates global operations, sales and marketing, information systems, finance and administration groups that are led by vice presidents who report to the Chief Executive Officer. Also in 2009, as a result of a company-wide simplification effort, the allocation of selling, general and administrative (SG&A) expenses to the reporting segments was changed. Only dedicated, direct SG&A spending by the segments is included in the calculation of their operating income. All other corporate level SG&A spending is included in the corporate category. The company does not allocate income taxes or interest expense to its operating segments as the operating segments are principally evaluated on operating profit before interest and taxes.
The company does not specifically identify and allocate all assets by operating segment. It is the company’s policy to fully allocate depreciation and amortization to its operating segments. Operating segments do not sell products to each other, and accordingly, there are no inter-segment revenues to be reported. The accounting policies for segment reporting are the same as for the company as a whole.
96
Table of Contents
The following table presents selected statement of operations information on reportable segments for 2013, 2012 and 2011.
| Year Ended | ||||||||||||
| December 29, 2013 |
December 30, 2012 |
December 25, 2011 |
||||||||||
| (In millions) | ||||||||||||
| Revenue and Operating Income: |
||||||||||||
| MCCC |
||||||||||||
| Total revenue |
$ | 534.1 | $ | 570.2 | $ | 579.1 | ||||||
| Operating income |
84.7 | 103.5 | 100.4 | |||||||||
|
|
|
|
|
|
|
|||||||
| PCIA |
||||||||||||
| Total revenue |
733.4 | 694.0 | 807.4 | |||||||||
| Operating income |
115.8 | 120.2 | 211.9 | |||||||||
|
|
|
|
|
|
|
|||||||
| SDT |
||||||||||||
| Total revenue |
137.9 | 141.7 | 202.3 | |||||||||
| Operating income |
16.5 | 18.6 | 46.3 | |||||||||
|
|
|
|
|
|
|
|||||||
| Corporate |
||||||||||||
| Restructuring and impairments expense |
(15.9 | ) | (14.1 | ) | (2.8 | ) | ||||||
| Stock-based compensation expense |
(27.9 | ) | (22.6 | ) | (24.8 | ) | ||||||
| Selling, general and administrative expense |
(156.5 | ) | (159.8 | ) | (162.8 | ) | ||||||
| Release (charge) for litigation charge |
12.6 | (1.3 | ) | — | ||||||||
| Other |
(8.9 | ) | 0.2 | (3.3 | ) | |||||||
|
|
|
|
|
|
|
|||||||
| Total Consolidated |
||||||||||||
| Total revenue |
$ | 1,405.4 | $ | 1,405.9 | $ | 1,588.8 | ||||||
| Operating income |
$ | 20.4 | $ | 44.7 | $ | 164.9 | ||||||
| Realized loss on sale of securities |
$ | — | $ | 12.9 | $ | — | ||||||
| Other expense, net |
$ | 9.2 | $ | 8.1 | $ | 7.2 | ||||||
|
|
|
|
|
|
|
|||||||
| Income before income taxes |
$ | 11.2 | $ | 23.7 | $ | 157.7 | ||||||
|
|
|
|
|
|
|
|||||||
PCIA revenue for the year ended 2012 includes $8.5 million of insurance proceeds related to business interruption claims for the company’s optoelectronics supply issues resulting from the Thailand floods in the fourth quarter of 2011.
Revenue from one customer represents approximately 11.4% and 11.9% of the Company’s total 2013 and 2012 revenue. Revenue from this customer is included in all reportable segments revenue.
In 2011, Other consists of $2.7 million associated with a change to defined contribution plans in Korea and Japan, $0.7 million in accelerated depreciation related to the previously planned closure of the Mountaintop facility, and $0.1 million of other expenses.
Depreciation and amortization by reportable operating segment were as follows:
| Year Ended | ||||||||||||
| December 29, 2013 |
December 30, 2012 |
December 25, 2011 |
||||||||||
| (In millions) | ||||||||||||
| MCCC |
$ | 61.9 | $ | 58.6 | $ | 56.7 | ||||||
| PCIA |
71.2 | 65.6 | 83.2 | |||||||||
| SDT |
12.1 | 11.1 | 10.6 | |||||||||
|
|
|
|
|
|
|
|||||||
| Total |
$ | 145.2 | $ | 135.3 | $ | 150.5 | ||||||
|
|
|
|
|
|
|
|||||||
97
Table of Contents
Geographic revenue information is based on the customer location within the indicated geographic region. Revenue by geographic region was as follows:
| Year Ended | ||||||||||||
| December 29, 2013 |
December 30, 2012 |
December 25, 2011 |
||||||||||
| (In millions) | ||||||||||||
| Total Revenue: |
||||||||||||
| U.S. |
$ | 126.5 | $ | 126.5 | $ | 158.9 | ||||||
| Other Americas |
28.1 | 28.1 | 31.8 | |||||||||
| Europe |
196.8 | 182.8 | 206.5 | |||||||||
| China |
505.9 | 492.1 | 524.3 | |||||||||
| Taiwan |
154.6 | 196.8 | 222.4 | |||||||||
| Korea |
98.4 | 126.5 | 174.8 | |||||||||
| Other Asia/Pacific |
295.1 | 253.1 | 270.1 | |||||||||
|
|
|
|
|
|
|
|||||||
| Total |
$ | 1,405.4 | $ | 1,405.9 | $ | 1,588.8 | ||||||
|
|
|
|
|
|
|
|||||||
Other Asia/Pacific includes Japan, Singapore, and Malaysia.
Geographic property, plant and equipment balances as of December 29, 2013 and December 30, 2012 are based on the physical locations within the indicated geographic areas and are as follows:
| December 29, 2013 |
December 30, 2012 |
|||||||
| (In millions) | ||||||||
| Property, Plant & Equipment, Net: |
||||||||
| U.S. |
$ | 221.2 | $ | 259.1 | ||||
| Korea |
251.3 | 249.2 | ||||||
| Philippines |
57.7 | 59.8 | ||||||
| Malaysia |
67.0 | 81.1 | ||||||
| China |
107.2 | 110.2 | ||||||
| All Others |
3.5 | 5.5 | ||||||
|
|
|
|
|
|||||
| Total |
$ | 707.9 | $ | 764.9 | ||||
|
|
|
|
|
|||||
NOTE 18—UNAUDITED QUARTERLY FINANCIAL INFORMATION
The following is a summary of unaudited quarterly financial information for 2013 and 2012 (in millions, except per share amounts):
| 2013 | ||||||||||||||||
| First | Second | Third | Fourth | |||||||||||||
| Total revenue |
$ | 343.2 | $ | 356.5 | $ | 364.6 | $ | 341.1 | ||||||||
| Gross margin |
92.4 | 103.7 | 114.9 | 105.5 | ||||||||||||
| Net income (loss) |
(0.5 | ) | (7.5 | ) | 12.1 | 0.9 | ||||||||||
| Basic income (loss) per common share |
$ | — | $ | (0.06 | ) | $ | 0.10 | $ | 0.01 | |||||||
| Diluted income (loss) per common share |
$ | — | $ | (0.06 | ) | $ | 0.09 | $ | 0.01 | |||||||
| 2012 | ||||||||||||||||
| First | Second | Third | Fourth | |||||||||||||
| Total revenue |
$ | 352.2 | $ | 361.5 | $ | 358.8 | $ | 333.4 | ||||||||
| Gross margin |
104.9 | 117.7 | 120.1 | 99.3 | ||||||||||||
| Net income |
1.6 | 11.9 | 24.7 | (13.6 | ) | |||||||||||
| Basic income per common share |
$ | 0.01 | $ | 0.09 | $ | 0.19 | $ | (0.11 | ) | |||||||
| Diluted income per common share |
$ | 0.01 | $ | 0.09 | $ | 0.19 | $ | (0.11 | ) | |||||||
NOTE 19—SUBSEQUENT EVENTS
In January 2014, the company completed the acquisition of a privately held, high-performance sensor company for approximately $60.0 million.
98
Table of Contents
| ITEM 9. | CHANGES IN AND DISAGREEMENTS WITH ACCOUNTANTS ON ACCOUNTING AND FINANCIAL DISCLOSURE |
Not applicable.
| ITEM 9A. | CONTROLS AND PROCEDURES |
Disclosure Controls and Procedures
Our management, with participation of our Chief Executive Officer and Chief Financial Officer, evaluated the effectiveness of our disclosure controls and procedures (as defined in Rules 13a-15(e) and 15d-15(e) under the Securities Exchange Act of 1934, as amended (the “Exchange Act”)) as of December 29, 2013, the end of the period covered by this report. Based on their evaluation, our Chief Executive Officer and Chief Financial Officer concluded that our disclosure controls and procedures are designed and operating effectively as of December 29, 2013 at a reasonable assurance level.
Management Report on Internal Control over Financial Reporting
Management, including the Chief Executive Officer and Chief Financial Officer, is responsible for establishing and maintaining adequate internal control over financial reporting (as defined in Exchange Act Rule 13a-15(f)) to provide reasonable assurance regarding the reliability of our financial reporting and the preparation of financial statements for external purposes in accordance with generally accepted accounting principles.
Fairchild Semiconductor’s management assessed the effectiveness of the company’s internal control over financial reporting as of December 29, 2013. In making this assessment, management used the criteria set forth in Internal Control—Integrated Framework issued by the Committee of Sponsoring Organizations of the Treadway Commission (COSO) in 1992. Based on that assessment, management believes that, as of December 29, 2013, the company’s internal control over financial reporting was effective.
KPMG LLP, our independent registered public accounting firm, has audited the effectiveness of Fairchild’s internal control over financial reporting as of December 29, 2013, and has issued a report which is included herein.
Changes in Internal Control over Financial Reporting
There were no changes in the company’s internal controls over financial reporting during our year ended December 29, 2013 that have materially affected, or are reasonably likely to materially affect, the company’s internal control over financial reporting.
| ITEM 9B. | OTHER INFORMATION |
Not Applicable.
99
Table of Contents
PART III
| ITEM 10. | DIRECTORS, EXECUTIVE OFFICERS AND CORPORATE GOVERNANCE |
Code of Business Conduct and Ethics
The information regarding our Code of Business Conduct and Ethics set forth under the caption “Governance at Fairchild Semiconductor—Senior Officer Code of Business Conduct and Ethics” appearing in our definitive proxy statement for the Annual Meeting of Stockholders to be held on May 7, 2014, which will be filed with the Securities and Exchange Commission not later than 120 days after December 29, 2013 (the “2013 Proxy Statement”), is incorporated by reference.
The information regarding directors set forth under the caption “Proposal 1—Election of Directors” appearing in the 2014 Proxy Statement, is incorporated by reference.
The information regarding executive officers set forth under the caption “Executive Officers” in Item 1 of this Annual Report on Form 10-K is incorporated by reference.
The information set forth under the caption “Section 16(a) Beneficial Ownership Reporting Compliance” in the 2014 Proxy Statement is incorporated by reference.
The information regarding our Audit Committee, and its members, as set forth under the heading “Corporate Governance, Board Meetings and Committees” in the 2014 Proxy Statement is incorporated by reference.
| ITEM 11. | EXECUTIVE COMPENSATION |
The information set forth under the captions “Executive Compensation,” “Compensation Discussion and Analysis and “Director Compensation” in the 2014 Proxy Statement is incorporated by reference.
The information regarding our Compensation Committee, and its members, as set forth under the heading “Corporate Governance, Board Meetings and Committees” in the 2014 Proxy Statement is incorporated by reference.
| ITEM 12. | SECURITY OWNERSHIP OF CERTAIN BENEFICIAL OWNERS AND MANAGEMENT AND RELATED STOCKHOLDER MATTERS |
The information set forth under the caption “Stock Ownership by 5% Stockholders, Directors and Certain Executive Officers” in the 2014 Proxy Statement is incorporated by reference.
The information regarding our equity compensation plans as set forth under the caption “Securities Authorized for Issuance Under Equity Compensation Programs” in Item 5 of this annual report on Form 10-K is incorporated by reference.
| ITEM 13. | CERTAIN RELATIONSHIPS AND RELATED TRANSACTIONS, AND DIRECTOR INDEPENDENCE |
The information set forth under the captions “Transactions with Related Persons, Promoters and Certain Control Persons” and “Policies and Procedures for Approval of Related Party Transactions” in the 2014 Proxy Statement is incorporated by reference.
The information regarding director independence set forth under the caption “Corporate Governance, Board Meetings and Committees” in the 2014 Proxy Statement is incorporated by reference.
100
Table of Contents
| ITEM 14. | PRINCIPAL ACCOUNTANT’S FEES AND SERVICES |
The information set forth under the caption “Independent Registered Public Accounting Firm” included under the proposal entitled “Proposal 4—Ratify Appointment of KPMG LLP as Independent Registered Public Accounting Firm of the Company for 2014” in the 2014 Proxy Statement is incorporated by reference.
| ITEM 15. | EXHIBITS AND FINANCIAL STATEMENT SCHEDULES |
| (a) | (1) Financial Statements. Financial Statements included in this annual report are listed under Item 8. |
| (2) | Financial Statement Schedules. Financial Statement schedules included in this report are listed under Item 15(b). |
| (3) | List of Exhibits. See the Exhibit Index beginning on page 103 of this annual report. |
| (b) | Financial Statement Schedules. |
Schedule II—Valuation and Qualifying Accounts
101
Table of Contents
Schedule II—Valuation and Qualifying Accounts.
All other schedules are omitted because of the absence of the conditions under which they are required or because the information required by such omitted schedules are set forth in the financial statements or the notes thereto.
| Description |
Price Protection |
Product Returns |
Other
Returns and Allowances |
Deferred
Tax Valuation Allowance |
Total | |||||||||||||||
| (In millions) | ||||||||||||||||||||
| Balances at December 26, 2010 |
$ | 9.4 | $ | 11.9 | $ | 5.6 | $ | 205.7 | $ | 232.6 | ||||||||||
| Charged to costs and expenses, or revenues |
37.6 | 20.9 | 14.3 | — | 72.8 | |||||||||||||||
| Deductions |
(37.0 | ) | (21.7 | ) | (17.1 | ) | (36.8 | ) | (112.6 | ) | ||||||||||
| Charged to other accounts |
— | 0.1 | — | 2.2 | 2.3 | |||||||||||||||
|
|
|
|
|
|
|
|
|
|
|
|||||||||||
| Balances at December 25, 2011 |
$ | 10.0 | $ | 11.2 | $ | 2.8 | $ | 171.1 | $ | 195.1 | ||||||||||
|
|
|
|
|
|
|
|
|
|
|
|||||||||||
| Charged to costs and expenses, or revenues |
39.1 | 19.2 | 13.9 | — | 72.2 | |||||||||||||||
| Deductions |
(40.4 | ) | (21.6 | ) | (13.1 | ) | (9.8 | ) | (84.9 | ) | ||||||||||
| Charged to other accounts |
— | (1.4 | ) | 1.4 | (6.8 | ) | (6.8 | ) | ||||||||||||
|
|
|
|
|
|
|
|
|
|
|
|||||||||||
| Balances at December 30, 2012 |
$ | 8.7 | $ | 7.4 | $ | 5.0 | $ | 154.5 | $ | 175.6 | ||||||||||
|
|
|
|
|
|
|
|
|
|
|
|||||||||||
| Charged to costs and expenses, or revenues |
51.8 | 19.4 | 11.7 | 0.0 | 82.9 | |||||||||||||||
| Deductions |
(48.2 | ) | (17.6 | ) | (12.8 | ) | (7.9 | ) | (86.5 | ) | ||||||||||
| Charged to other accounts |
0.0 | (0.1 | ) | — | 1.0 | 0.9 | ||||||||||||||
|
|
|
|
|
|
|
|
|
|
|
|||||||||||
| Balances at December 29, 2013 |
$ | 12.3 | $ | 9.1 | $ | 3.9 | $ | 147.6 | $ | 172.9 | ||||||||||
|
|
|
|
|
|
|
|
|
|
|
|||||||||||
102
Table of Contents
| Exhibit No. |
Description | |
| 3.01(i) | Second Restated Certificate of Incorporation. (5) | |
| 3.01(i) | Certificate of Amendment to the Second Restated Certificate of Incorporation (18) | |
| 3.01(i) | Third Amended and Restated Certificate of Incorporation (26) | |
| 3.01(ii) | Bylaws, as amended through August 15, 2012. (21) | |
| 10.01 | Credit Agreement, dated as of June 26, 2006. (13) | |
| 10.02* | Executive Severance Policy. (14) | |
| 10.03* | Form of Executive Severance Policy Designation and Agreement (Non-California Employees). (17) | |
| 10.04* | Form of Executive Severance Policy Designation and Agreement (California Employees). (17) | |
| 10.05 | Technology Licensing and Transfer Agreement, dated March 11, 1997, between National Semiconductor Corporation and Fairchild Semiconductor Corporation. (3) | |
| 10.06 | Environmental Side Letter, dated March 11, 1997, between National Semiconductor Corporation and Fairchild Semiconductor Corporation. (1) | |
| 10.07* | Fairchild Benefit Restoration Plan. (1) | |
| 10.08* | Fairchild Incentive Plan. (22) | |
| 10.09* | Fairchild Semiconductor International, Inc. 2000 Executive Stock Option Plan. (4) | |
| 10.10 | Incremental Term Loan Commitment Agreement dated as of May 16, 2008. (19) | |
| 10.11* | Fairchild Enhanced Incentive Plan (22) | |
| 10.13* | Fairchild Semiconductor International, Inc. Employees Stock Purchase Plan. (25) | |
| 10.14* | Non-Qualified Stock Option Agreement, dated December 1, 2004, between Fairchild Semiconductor International, Inc. and Mark S. Thompson. (7) | |
| 10.15* | Non-Qualified Stock Option Agreement under the Fairchild Semiconductor Stock Plan dated July 15, 2005, between Fairchild Semiconductor International, Inc. and Mark S. Thompson. (9) | |
| 10.16* | Fairchild Semiconductor Stock Plan. (11) | |
| 10.17* | Form of Non-Qualified Stock Option Agreement under the Fairchild Semiconductor Stock Plan. (6) | |
| 10.18* | Form of Deferred Stock Unit Agreement under the Fairchild Semiconductor Stock Plan. (6) | |
| 10.19* | Form of Deferred Stock Unit Agreement for non-employee directors under the Fairchild Semiconductor Stock Plan. (18) | |
| 10.20* | Form of Performance Unit Award Agreement under the Fairchild Semiconductor Stock Plan. (9) | |
| 10.21* | Form of Restricted Stock Unit Award Agreement under the Fairchild Semiconductor Stock Plan. (12) | |
| 10.22* | Restricted Stock Unit Award Agreement under the Fairchild Semiconductor Stock Plan dated February 10, 2006, between Fairchild Semiconductor International, Inc. and Mark S. Thompson. (12) | |
| 10.23* | Restricted Stock Unit Award Agreement under the Fairchild Semiconductor Stock Plan dated February 27, 2006, between Fairchild Semiconductor International, Inc. and Mark S. Frey. (12) | |
103
Table of Contents
| Exhibit No. |
Description | |
| 10.24 | Employment Agreement, dated as of December 9, 2009 between Mark S. Thompson, Fairchild Semiconductor International, Inc. and Fairchild Semiconductor Corporation. (21) | |
| 10.25 | Intellectual Property License Agreement, dated April 13, 1999, between Samsung Electronics Co. Ltd. and Fairchild Korea Semiconductor Ltd. (2) | |
| 10.26 | Intellectual Property Assignment and License Agreement, dated December 29, 1997, between Raytheon Semiconductor, Inc. and Raytheon Company. (20) | |
| 10.27* | Fairchild Semiconductor 2007 Stock Plan. (28) | |
| 10.28* | Fairchild Semiconductor Corporation Restated Severance Benefit Plan. (15) | |
| 10.29* | Form of Restricted Stock Unit Award Agreement under the Fairchild Semiconductor 2007 Stock Plan. (27) | |
| 10.30* | Form of Performance Unit Award Agreement under the Fairchild Semiconductor 2007 Stock Plan. (27) | |
| 10.31* | Form of Non-Qualified Stock Option Agreement under the Fairchild Semiconductor 2007 Stock Plan. (15) | |
| 10.32* | Form of Deferred Stock Unit Agreement for non-employee directors under the Fairchild Semiconductor 2007 Stock Plan. (15) | |
| 10.33 | Second Amendment to Credit Agreement (18) | |
| 10.34* | Long-Term Incentive Compensation Award Agreement dated December 22, 2010 between Mark S. Thompson and Fairchild Semiconductor International, Inc. (23) | |
| 10.35 | Credit Agreement dated as of May 20, 2011 (24) | |
| 10.36* | Employment Agreement, dated as of August 31, 2012 between Vijay Ullal and Fairchild Semiconductor International, Inc. (14) | |
| 14.01 | Code of Business Conduct and Ethics. (10) | |
| 21.01 | List of Subsidiaries. | |
| 23.01 | Consent of KPMG LLP. | |
| 31.01 | Section 302 Certification of the Chief Executive Officer. | |
| 31.02 | Section 302 Certification of the Chief Financial Officer. | |
| 32.01 | Certification, pursuant to 18 U.S.C. 1350, as adopted pursuant to Section 906 of the Sarbanes-Oxley Act of 2002, by Mark S. Thompson. | |
| 32.02 | Certification, pursuant to 18 U.S.C. 1350, as adopted pursuant to Section 906 of the Sarbanes-Oxley Act of 2002, by Mark S. Frey. | |
| 101.INS | XBRL Instance Document | |
| 101.SCH | XBRL Taxonomy Extension Schema Document | |
| 101.CAL | XBRL Taxonomy Extension Calculation Linkbase Document | |
| 101.DEF | XBRL Taxonomy Definition Linkbase Document | |
| 101.LAB | XBRL Taxonomy Extension Label Linkbase Document | |
| 101.PRE | XBRL Taxonomy Extension Presentation Linkbase Document | |
| * | Management contracts or compensation plans or arrangements in which directors or executive officers are eligible to participate |
| (1) | Incorporated by reference from Fairchild Semiconductor Corporation’s Registration Statement on Form S-4, filed May 12, 1997 (File No. 333-26897). |
| (2) | Incorporated by reference from Amendment No. 1 to Fairchild Semiconductor International, Inc.’s Registration Statement on Form S-1, filed June 30, 1999 (File No. 333-78557). |
104
Table of Contents
| (3) | Incorporated by reference from Amendment No. 3 to Fairchild Semiconductor Corporation’s Registration Statement on Form S-4, filed July 9, 1997 (File No. 333-28697). |
| (4) | Incorporated by reference from Fairchild Semiconductor International, Inc.’s Quarterly Report on Form 10-Q for the quarter ended July 2, 2000, filed August 16, 2000. |
| (5) | Incorporated by reference from Fairchild Semiconductor International, Inc.’s Quarterly Report on Form 10-Q for the quarter ended March 28, 2004, filed May 7, 2004. |
| (6) | Incorporated by reference from Fairchild Semiconductor International Inc.’s Registration Statement on Form S-8, filed October 7, 2004 (File No. 333-119595). |
| (7) | Incorporated by reference from Fairchild Semiconductor International, Inc.’s current report on Form 8-K, filed December 3, 2004. |
| (8) | Incorporated by reference from Fairchild Semiconductor International, Inc.’s Quarterly Report on Form 10-Q for the quarter ended June 26, 2005, filed August 5, 2005. |
| (9) | Incorporated by reference from Fairchild Semiconductor International, Inc.’s Quarterly Report on Form 10-Q for the quarter ended September 25, 2005, filed November 4, 2005. |
| (10) | Incorporated by reference from Fairchild Semiconductor International, Inc.’s current report on Form 8-K, filed December 17, 2013. |
| (11) | Incorporated by reference from Fairchild Semiconductor International, Inc.’s current report on Form 8-K, filed May 5, 2006. |
| (12) | Incorporated by reference from Fairchild Semiconductor International, Inc.’s Quarterly Report on Form 10-Q for the quarter ended April 2, 2006, filed May 12, 2006. |
| (13) | Incorporated by reference from Fairchild Semiconductor International, Inc.’s Quarterly Report on Form 10-Q for the quarter ended July 2, 2006, filed August 9, 2006. |
| (14) | Incorporated by reference from Fairchild Semiconductor International, Inc.’s Quarterly Report on Form 10-Q for the quarter ended September 30, 2012 filed on November 9, 2012. |
| (15) | Incorporated by reference from Fairchild Semiconductor International, Inc.’s Quarterly Report on Form 10-Q for the quarter ended July 1, 2007, filed August 9, 2007. |
| (16) | Incorporated by reference from Fairchild Semiconductor International, Inc.’s current report on Form 8-K, filed December 11, 2007. |
| (17) | Incorporated by reference from Fairchild Semiconductor International, Inc.’s Annual Report on Form 10-K for the fiscal year ended December 30, 2007, filed February 28, 2008. |
| (18) | Incorporated by reference from Fairchild Semiconductor International, Inc.’s Quarterly Report on Form 10-Q for the quarter ended June 27, 2010 filed August 4, 2010. |
| (19) | Incorporated by reference from Fairchild Semiconductor International, Inc.’s Quarterly Report on Form 10-Q for the quarter ended June 29, 2008, filed on August 8, 2008. |
| (20) | Incorporated by reference from Fairchild Semiconductor International, Inc.’s Current Report on Form 8-K, dated December 31, 1997, filed January 13, 1998. |
| (21) | Incorporated by reference from Fairchild Semiconductor International, Inc.’s current report on Form 8-K, filed August 15, 2012. |
| (22) | Incorporated by reference from Fairchild Semiconductor International, Inc.’s Quarterly Report on Form 10-Q for the quarter ended June 28, 2009, filed on August 7, 2009. |
| (23) | Incorporated by reference from Fairchild Semiconductor International, Inc.’s Annual Report on Form 10-K for the fiscal year ended December 26, 2010, filed on February 24, 2011. |
| (24) | Incorporated by reference from Fairchild Semiconductor International, Inc.’s Quarterly Report on Form 10-Q for the quarter ended June 26, 2011, filed on August 5, 2011. |
| (25) | Incorporated by reference from Fairchild Semiconductor International, Inc.'s Report filed on Form 8-K on May 7, 2009. |
| (26) | Incorporated by reference from Fairchild Semiconductor International Inc.’s current report on Form 8-K filed May 3, 2012. |
| (27) | Incorporated by reference from Fairchild Semiconductor International Inc.'s Annual Report on Form 10-K for the fiscal year ended December 30, 2012. |
| (28) | Incorporated by reference from Fairchild Semiconductor International Inc.’s current report on Form 8-K filed May 8, 2013. |
105
Table of Contents
Pursuant to the requirements of Section 13 or 15 (d) of the Securities Exchange Act of 1934, the Registrant has duly caused this report to be signed on its behalf by the undersigned, thereunto duly authorized.
| FAIRCHILD SEMICONDUCTOR INTERNATIONAL, INC. |
| /S/ MARK S. THOMPSON |
| Mark S. Thompson |
| Chairman and Chief Executive Officer |
Date: February 27, 2014
Pursuant to the requirements of the Securities Exchange Act of 1934, this report has been signed below by the following persons on behalf of the Registrant and in the capacities and on the dates indicated.
| Signature |
Title |
Date | ||
| /S/ MARK S. THOMPSON Mark S. Thompson |
Chairman of the Board of Directors, Chairman and Chief Executive Officer (principal executive officer) |
February 27, 2014 | ||
| /S/ MARK S. FREY Mark S. Frey |
Executive Vice President, Chief Financial Officer and Treasurer (principal financial officer) |
February 27, 2014 | ||
| /S/ GREGORY J. MARSHALL Gregory J. Marshall |
Vice President, Corporate Controller |
February 27, 2014 | ||
| /S/ RONALD W. SHELLY Ronald W. Shelly |
Director |
February 27, 2014 | ||
| /S/ CHARLES P. CARINALLI Charles P. Carinalli |
Director |
February 27, 2014 | ||
| /S/ THOMAS L. MAGNANTI Thomas L. Magnanti |
Director |
February 27, 2014 | ||
| /S/ BRYAN R. ROUB Bryan R. Roub |
Director |
February 27, 2014 | ||
| /S/ KEVIN J. MCGARITY Kevin J. McGarity |
Director |
February 27, 2014 | ||
| /S/ ANTHONY LEAR Anthony Lear |
Director |
February 27, 2014 | ||
| /S/ RANDY W. CARSON Randy W. Carson |
Director |
February 27, 2014 | ||
| /S/ TERRY A. KLEBE Terry A. Klebe |
Director |
February 27, 2014 | ||
| /S/ CATHERINE P. LEGO Catherine P. Lego |
Director |
February 27, 2014 | ||
106
Table of Contents
Exhibit 31.01
CERTIFICATION
I, Mark S. Thompson, certify that:
| 1. | I have reviewed this annual report on Form 10-K of Fairchild Semiconductor International, Inc.; |
| 2. | Based on my knowledge, this report does not contain any untrue statement of a material fact or omit to state a material fact necessary to make the statements made, in light of the circumstances under which such statements were made, not misleading with respect to the period covered by this report; |
| 3. | Based on my knowledge, the financial statements, and other financial information included in this report, fairly present in all material respects the financial condition, results of operations and cash flows of the registrant as of, and for, the periods presented in this report; |
| 4. | The registrant’s other certifying officer and I are responsible for establishing and maintaining disclosure controls and procedures (as defined in Exchange Act Rules 13a-15(e) and 15d-15(e)) and internal control over financial reporting (as defined in Exchange Act Rules 13a-15(f) and 15d-15(f)) for the registrant and have: |
| a) | Designed such disclosure controls and procedures, or caused such disclosure controls and procedures to be designed under our supervision, to ensure that material information relating to the registrant, including its consolidated subsidiaries, is made known to us by others within those entities, particularly during the period in which this report is being prepared; |
| b) | Designed such internal control over financial reporting, or caused such internal control over financial reporting to be designed under our supervision, to provide reasonable assurance regarding the reliability of financial reporting and the preparation of financial statements for external purposes in accordance with generally accepted accounting principles; |
| c) | Evaluated the effectiveness of the registrant’s disclosure controls and procedures and presented in this report our conclusions about the effectiveness of the disclosure controls and procedures, as of the end of the period covered by this report based on such evaluation; and |
| d) | Disclosed in this report any change in the registrant’s internal control over financial reporting that occurred during the registrant’s most recent fiscal quarter (the registrant’s fourth fiscal quarter in the case of an annual report) that has materially affected, or is reasonably likely to materially affect, the registrant’s internal control over financial reporting; and |
| 5. | The registrant’s other certifying officer and I have disclosed, based on our most recent evaluation of internal control over financial reporting, to the registrant’s auditors and the audit committee of the registrant’s board of directors: |
| a) | All significant deficiencies and material weaknesses in the design or operation of internal control over financial reporting which are reasonably likely to adversely affect the registrant’s ability to record, process, summarize and report financial information; and |
| b) | Any fraud, whether or not material, that involves management or other employees who have a significant role in the registrant’s internal control over financial reporting. |
| Date: February 27, 2014 | /S/ MARK S. THOMPSON | |||||
| Mark S. Thompson | ||||||
| Chairman and Chief Executive Officer |
Table of Contents
Exhibit 31.02
CERTIFICATION
I, Mark S. Frey, certify that:
| 1. | I have reviewed this annual report on Form 10-K of Fairchild Semiconductor International, Inc.; |
| 2. | Based on my knowledge, this report does not contain any untrue statement of a material fact or omit to state a material fact necessary to make the statements made, in light of the circumstances under which such statements were made, not misleading with respect to the period covered by this report; |
| 3. | Based on my knowledge, the financial statements, and other financial information included in this report, fairly present in all material respects the financial condition, results of operations and cash flows of the registrant as of, and for, the periods presented in this report; |
| 4. | The registrant’s other certifying officer and I are responsible for establishing and maintaining disclosure controls and procedures (as defined in Exchange Act Rules 13a-15(e) and 15d-15(e)) and internal control over financial reporting (as defined in Exchange Act Rules 13a-15(f) and 15d-15(f)) for the registrant and have: |
| a) | Designed such disclosure controls and procedures, or caused such disclosure controls and procedures to be designed under our supervision, to ensure that material information relating to the registrant, including its consolidated subsidiaries, is made known to us by others within those entities, particularly during the period in which this report is being prepared; |
| b) | Designed such internal control over financial reporting, or caused such internal control over financial reporting to be designed under our supervision, to provide reasonable assurance regarding the reliability of financial reporting and the preparation of financial statements for external purposes in accordance with generally accepted accounting principles; |
| c) | Evaluated the effectiveness of the registrant’s disclosure controls and procedures and presented in this report our conclusions about the effectiveness of the disclosure controls and procedures, as of the end of the period covered by this report based on such evaluation; and |
| d) | Disclosed in this report any change in the registrant’s internal control over financial reporting that occurred during the registrant’s most recent fiscal quarter (the registrant’s fourth fiscal quarter in the case of an annual report) that has materially affected, or is reasonably likely to materially affect, the registrant’s internal control over financial reporting; and |
| 5. | The registrant’s other certifying officer and I have disclosed, based on our most recent evaluation of internal control over financial reporting, to the registrant’s auditors and the audit committee of the registrant’s board of directors: |
| a) | All significant deficiencies and material weaknesses in the design or operation of internal control over financial reporting which are reasonably likely to adversely affect the registrant’s ability to record, process, summarize and report financial information; and |
| b) | Any fraud, whether or not material, that involves management or other employees who have a significant role in the registrant’s internal control over financial reporting. |
| Date: February 27, 2014 | /S/ MARK S. FREY | |||||
| Mark S. Frey | ||||||
| Executive Vice President, Chief Financial Officer and Treasurer |
Table of Contents

