Cresud Sociedad Anónima, Comercial, Inmobiliaria, Financiera y
Agropecuaria
Unaudited Condensed Interim Consolidated Financial Statements as of
December 31, 2019 and for the six-month period ended as of that
date, presented comparatively.
|
Denomination: Cresud Sociedad
Anónima, Comercial, Inmobiliaria, Financiera y
Agropecuaria
|
||
|
|
||
|
Fiscal year N°: 87,
beginning on July 1, 2019
|
||
|
|
||
|
Legal address: Moreno 877, 23rd
floor – Autonomous City of Buenos Aires,
Argentina
|
||
|
|
||
|
Company activity: Real estate,
agricultural, commercial and financial
activities
|
||
|
|
||
|
Date of registration of the by-laws in the Public Registry of
Commerce: February 19,
1937
|
||
|
|
||
|
Date of registration of last amendment of the by-laws in the Public
Registry of Commerce: October
31, 2014 and its reinstatement on November 14,
2014
|
||
|
|
||
|
Expiration of Company charter: June 6, 2082
|
||
|
|
||
|
Registration number with the Supervisory Board of Companies:
26, folio 2, book 45, Stock
Companies
|
||
|
|
||
|
Stock: 501,642,804 common
shares
|
||
|
|
||
|
Common stock subscribed, issued and paid up nominal value (millions
of Ps.): 502
|
||
|
|
||
|
Parent Companies: Inversiones
Financieras del Sur S.A. and Agroinvestment
S.A.
|
||
|
|
||
|
Legal addresses: Road 8, km
17,500, Zonamérica Building 1, store 106, Montevideo, Uruguay
(IFISA) - Cambara 1620, 2nd floor, office 202, Carrasco, 11000
Montevideo, Uruguay (Agroinvesment S.A.)
|
||
|
|
||
|
Parent companies' activity:
Investment
|
||
|
|
||
|
Direct ownership interest:
186,453,604 shares
|
||
|
|
||
|
Voting stock (direct and indirect equity interest):
37.34% (*)
|
||
|
|
||
|
|
||
|
Type of stock
|
CAPITAL STATUS
|
|
|
Authorized to be offered publicly (Shares)
|
Subscribed, Issued and Paid-in (millions of Ps.)
|
|
|
Ordinary certified shares of Ps. 1 face value and 1 vote
each
|
501,642,804 (**)
|
502
|
|
|
||
|
|
||
|
(*) For computation purposes, treasury shares have been
subtracted.
|
||
|
(**) Company not included in the Optional Statutory System of
Public Offer of Compulsory Acquisition.
|
||
Index
|
Glossary of terms
|
1
|
|
Unaudited Condensed Interim Consolidated Statements of Financial
Position
|
2
|
|
Unaudited Condensed Interim Consolidated Statements of Income and
Other Comprehensive Income
|
3
|
|
Unaudited Condensed Interim Consolidated Statements of Changes in
Shareholders' Equity
|
4
|
|
Unaudited Condensed Interim Consolidated Statements of Cash
Flows
|
6
|
|
Notes to the Unaudited Condensed Interim Consolidated Financial
Statements:
|
|
|
Note
1 - The Group's business and general information
|
7
|
|
Note
2 - Summary of significant accounting policies
|
8
|
|
Note
3 - Seasonal effects on operations
|
10
|
|
Note
4 - Acquisitions and disposals
|
11
|
|
Note
5 - Financial risk management and fair value estimates
|
14
|
|
Note
6 - Segment information
|
14
|
|
Note
7 - Investments in associates and joint ventures
|
19
|
|
Note
8 - Investment properties
|
20
|
|
Note
9 - Property, plant and equipment
|
20
|
|
Note
10 - Trading properties
|
21
|
|
Note
11 - Intangible assets
|
21
|
|
Note
12 - Right-of-use assets
|
21
|
|
Note
13 - Biological assets
|
22
|
|
Note
14 - Inventories
|
22
|
|
Note
15 - Financial instruments by category
|
23
|
|
Note
16 - Trade and other receivables
|
25
|
|
Note
17 - Cash flow information
|
26
|
|
Note
18 - Trade and other payables
|
27
|
|
Note
19 - Equity
|
27
|
|
Note
20 - Provisions
|
28
|
|
Note
21 - Borrowings
|
28
|
|
Note
22 - Taxation
|
29
|
|
Note
23 - Revenues
|
30
|
|
Note
24 - Costs
|
30
|
|
Note
25 - Expenses by nature
|
30
|
|
Note
26 - Other operating results, net
|
31
|
|
Note
27 - Financial results, net
|
31
|
|
Note
28 - Related parties transactions
|
31
|
|
Note
29 - CNV General Resolution N° 622
|
33
|
|
Note
30 - Cost of sales and services provided
|
33
|
|
Note
31 - Foreign currency assets and liabilities
|
34
|
|
Note
32 - Groups of assets and liabilities held for sale
|
34
|
|
Note
33 - Result from discontinued operations
|
35
|
|
Note
34 - Other subsequent events of the period
|
35
|
|
Note
35 - Subsequent Events
|
37
|
Glossary of terms
The
following are not technical definitions but help the reader to
understand certain terms used in the wording of the notes to the
Group’s Financial Statements.
|
Terms
|
|
Definitions
|
|
BACS
|
|
Banco de Crédito y Securitización S.A.
|
|
BCRA
|
|
Central Bank of the Argentine Republic
|
|
BHSA
|
|
Banco Hipotecario S.A.
|
|
Brasilagro
|
|
Brasilagro-Companhia Brasileira de Propriedades
Agrícolas
|
|
CAMSA
|
|
Consultores Assets Management S.A.
|
|
Clal
|
|
Clal Holdings Insurance Enterprises Ltd.
|
|
CNV
|
|
National Securities Commission
|
|
Condor
|
|
Condor Hospitality Trust Inc.
|
|
Cresud, “the Company”, “us”
|
|
Cresud S.A.C.I.F. y A.
|
|
DFL
|
|
Dolphin Fund Ltd.
|
|
DIC
|
|
Discount Investment Corporation Ltd.
|
|
Dolphin
|
|
Dolphin Fund Ltd. and Dolphin Netherlands B.V.
|
|
Financial Statements
|
|
Unaudited Condensed Interim Consolidated Financial
Statements
|
|
Annual Financial Statements
|
|
Consolidated Financial Statements as of June 30, 2019
|
|
CPF
|
|
Collective Promotion Funds
|
|
Gav-Yam
|
|
Gav-Yam, Bayside Land Corporation Ltd
|
|
IDBD
|
|
IDB Development Corporation Ltd.
|
|
IFISA
|
|
Inversiones Financieras del Sur S.A.
|
|
IRSA
|
|
IRSA Inversiones y Representaciones S.A.
|
|
IRSA CP
|
|
IRSA Propiedades Comerciales S.A.
|
|
IASB
|
|
International Accounting Standards Board
|
|
Israir
|
|
Israir Airlines & Tourism Ltd.
|
|
LRSA
|
|
La Rural S.A.
|
|
Metropolitan
|
|
Metropolitan 885 Third Avenue Leasehold LLC
|
|
MPIT
|
|
Minimum Presummed Income Tax
|
|
NFSA
|
|
Nuevas Fronteras S.A.
|
|
IAS
|
|
International Accounting Standards
|
|
NIS
|
|
New Israeli Shekel
|
|
PBC
|
|
Property & Building Corporation Ltd.
|
|
PBEL
|
|
PBEL Real Estate Ltd.
|
|
Quality
|
|
Quality Invest S.A.
|
|
Shufersal
|
|
Shufersal Ltd.
|
|
Tarshop
|
|
Tarshop S.A.
|
|
|
|
|
1
Cresud Sociedad Anónima,
Comercial, Inmobiliaria, Financiera y Agropecuaria
Unaudited Condensed Interim Consolidated Statements of Financial
Position
as of December 31, 2019 and June 30, 2019
(All
amounts in millions, except otherwise indicated)
Free
translation from the original prepared in Spanish for publication
in Argentina
|
|
|
Note
|
|
12.31.19
|
|
06.30.19
|
|
ASSETS
|
|
|
|
|
|
|
|
Non-current assets
|
|
|
|
|
|
|
|
Investment properties
|
|
8
|
|
171,214
|
|
294,925
|
|
Property, plant and equipment
|
|
9
|
|
47,537
|
|
47,632
|
|
Trading properties
|
|
10
|
|
4,336
|
|
6,915
|
|
Intangible assets
|
|
11
|
|
23,845
|
|
22,904
|
|
Right-of-use
assets
|
|
12
|
|
15,374
|
|
-
|
|
Biological assets
|
|
13
|
|
1,502
|
|
1,589
|
|
Other assets
|
|
|
|
33
|
|
28
|
|
Investment in associates and joint ventures
|
|
7
|
|
64,288
|
|
39,501
|
|
Deferred income tax assets
|
|
22
|
|
623
|
|
681
|
|
Income tax and MPIT credits
|
|
|
|
52
|
|
239
|
|
Restricted assets
|
|
15
|
|
820
|
|
4,002
|
|
Trade and other receivables
|
|
16
|
|
20,908
|
|
19,130
|
|
Investment in financial assets
|
|
15
|
|
3,969
|
|
3,635
|
|
Financial assets held for sale
|
|
15
|
|
-
|
|
5,257
|
|
Derivative financial instruments
|
|
15
|
|
96
|
|
134
|
|
Total non-current assets
|
|
|
|
354,597
|
|
446,572
|
|
Current assets
|
|
|
|
|
|
|
|
Trading properties
|
|
10
|
|
1,923
|
|
461
|
|
Biological assets
|
|
13
|
|
4,528
|
|
3,341
|
|
Inventories
|
|
14
|
|
4,356
|
|
5,637
|
|
Restricted assets
|
|
15
|
|
5,615
|
|
5,512
|
|
Income tax and MPIT credits
|
|
|
|
450
|
|
491
|
|
Group of assets held for sale
|
|
32
|
|
36,488
|
|
10,122
|
|
Trade and other receivables
|
|
16
|
|
33,974
|
|
33,851
|
|
Investment in financial assets
|
|
15
|
|
31,394
|
|
39,733
|
|
Financial assets held for sale
|
|
15
|
|
7,337
|
|
14,672
|
|
Derivative financial instruments
|
|
15
|
|
239
|
|
142
|
|
Cash and cash equivalents
|
|
15
|
|
67,666
|
|
78,617
|
|
Total current assets
|
|
|
|
193,970
|
|
192,579
|
|
TOTAL ASSETS
|
|
|
|
548,567
|
|
639,151
|
|
SHAREHOLDERS’ EQUITY
|
|
|
|
|
|
|
|
Shareholders' equity (according to corresponding
statement)
|
|
|
|
14,951
|
|
21,163
|
|
Non-controlling interest
|
|
|
|
68,689
|
|
90,817
|
|
TOTAL SHAREHOLDERS' EQUITY
|
|
|
|
83,640
|
|
111,980
|
|
LIABILITIES
|
|
|
|
|
|
|
|
Non-current liabilities
|
|
|
|
|
|
|
|
Borrowings
|
|
21
|
|
267,417
|
|
349,857
|
|
Deferred income tax liabilities
|
|
22
|
|
38,374
|
|
50,348
|
|
Trade and other payables
|
|
18
|
|
2,094
|
|
2,491
|
|
Provisions
|
|
20
|
|
11,474
|
|
10,105
|
|
Employee benefits
|
|
|
|
182
|
|
166
|
|
Derivative financial instruments
|
|
15
|
|
89
|
|
1,293
|
|
Lease liabilities
|
|
|
|
12,303
|
|
-
|
|
Payroll and social security liabilities
|
|
|
|
199
|
|
174
|
|
Total non-current liabilities
|
|
|
|
332,132
|
|
414,434
|
|
Current liabilities
|
|
|
|
|
|
|
|
Trade and other payables
|
|
18
|
|
24,847
|
|
28,434
|
|
Borrowings
|
|
21
|
|
76,110
|
|
70,765
|
|
Provisions
|
|
20
|
|
2,086
|
|
2,180
|
|
Group of liabilities held for sale
|
|
32
|
|
19,726
|
|
7,163
|
|
Payroll and social security liabilities
|
|
|
|
3,919
|
|
3,347
|
|
Income tax and MPIT liabilities
|
|
|
|
581
|
|
615
|
|
Lease liabilities
|
|
|
|
4,622
|
|
-
|
|
Derivative financial instruments
|
|
15
|
|
904
|
|
233
|
|
Total Current liabilities
|
|
|
|
132,795
|
|
112,737
|
|
TOTAL LIABILITIES
|
|
|
|
464,927
|
|
527,171
|
|
TOTAL SHAREHOLDERS' EQUITY AND LIABILITIES
|
|
|
|
548,567
|
|
639,151
|
|
PRICE WATERHOUSE & CO. S.R.L.
(Socio)
|
|
)
|
|
)
|
|
C.P.C.E.C.A.B.A. T° 1 F° 17
Dr. Mariano C. Tomatis
Contador Público (UBA)
C.P.C.E.C.A.B.A. T° 241 F° 118
|
|
Marcelo H. Fuxman
Síndico Titular
Por Comisión Fiscalizadora
|
|
Alejandro G.
Elsztain
Vicepresident
II acting
as
President
|
2
Cresud Sociedad Anónima,
Comercial, Inmobiliaria, Financiera y Agropecuaria
Unaudited Condensed Interim Consolidated Statements of Income and
Other Comprehensive Income
for the six and six-month periods ended December 31, 2019 and
2018
(All
amounts in millions, except otherwise indicated)
Free
translation from the original prepared in Spanish for publication
in Argentina
|
|
|
|
|
Six months
|
|
Three months
|
||||
|
|
|
Note
|
|
12.31.19
|
|
12.31.18
|
|
12.31.19
|
|
12.31.18
|
|
Revenues
|
|
23
|
|
55,158
|
|
47,795
|
|
27,352
|
|
25,233
|
|
Costs
|
|
24
|
|
(37,032)
|
|
(31,624)
|
|
(17,800)
|
|
(16,328)
|
|
Initial recognition and changes in the fair value of biological
assets and agricultural products at the point of
harvest
|
|
|
|
1,249
|
|
708
|
|
832
|
|
370
|
|
Changes in the net realizable value of agricultural products after
harvest
|
|
|
|
422
|
|
52
|
|
(12)
|
|
(310)
|
|
Gross profit
|
|
|
|
19,797
|
|
16,931
|
|
10,372
|
|
8,965
|
|
Net gain from fair value adjustment of investment
properties
|
|
|
|
3,623
|
|
(9,186)
|
|
(6,289)
|
|
(20,269)
|
|
Gain from disposal of farmlands
|
|
|
|
299
|
|
81
|
|
62
|
|
79
|
|
General and administrative expenses
|
|
25
|
|
(5,301)
|
|
(5,331)
|
|
(2,644)
|
|
(2,823)
|
|
Selling expenses
|
|
25
|
|
(7,065)
|
|
(6,042)
|
|
(3,770)
|
|
(3,076)
|
|
Other operating results, net
|
|
26
|
|
(2,402)
|
|
1,218
|
|
(2,656)
|
|
(130)
|
|
Management fees
|
|
|
|
-
|
|
-
|
|
-
|
|
413
|
|
Profit / (Loss) from operations
|
|
|
|
8,951
|
|
(2,329)
|
|
(4,925)
|
|
(16,841)
|
|
Share of loss of associates and joint ventures
|
|
7
|
|
(1,502)
|
|
(1,230)
|
|
(1,698)
|
|
(1,436)
|
|
Profit / (loss) before financial results and income
tax
|
|
|
|
7,449
|
|
(3,559)
|
|
(6,623)
|
|
(18,277)
|
|
Finance income
|
|
27
|
|
558
|
|
765
|
|
262
|
|
442
|
|
Finance cost
|
|
27
|
|
(12,035)
|
|
(11,162)
|
|
(4,846)
|
|
(5,888)
|
|
Other financial results
|
|
27
|
|
(7,972)
|
|
(907)
|
|
5,745
|
|
5,296
|
|
Inflation adjustment
|
|
27
|
|
124
|
|
(181)
|
|
478
|
|
(341)
|
|
Financial results, net
|
|
27
|
|
(19,325)
|
|
(11,485)
|
|
1,639
|
|
(491)
|
|
Loss before income tax
|
|
|
|
(11,876)
|
|
(15,044)
|
|
(4,984)
|
|
(18,768)
|
|
Income tax
|
|
22
|
|
(3,090)
|
|
3,375
|
|
(867)
|
|
1,555
|
|
Loss for the period from continuing operations
|
|
|
|
(14,966)
|
|
(11,669)
|
|
(5,851)
|
|
(17,213)
|
|
Profit for the period from discontinued operations
|
|
33
|
|
16,639
|
|
3,042
|
|
(239)
|
|
2,577
|
|
Profit / (loss) for the period
|
|
|
|
1,673
|
|
(8,627)
|
|
(6,090)
|
|
(14,636)
|
|
|
|
|
|
|
|
|
|
|
|
|
|
|
|
|
|
|
|
|
|
|
|
|
|
Other comprehensive income
/ (loss):
|
|
|
|
|
|
|
|
|
|
|
|
Items that may be reclassified subsequently to profit or
loss:
|
|
|
|
|
|
|
|
|
|
|
|
Currency translation adjustment
|
|
|
|
4,960
|
|
3,819
|
|
(6,005)
|
|
(13,090)
|
|
Change in the fair value of hedging instruments net of income
taxes
|
|
|
|
(74)
|
|
43
|
|
(59)
|
|
50
|
|
Items that may not be reclassified subsequently to profit or
loss:
|
|
|
|
|
|
|
|
|
|
|
|
Revaluation of fixed assets transferred to investment
properties
|
|
|
|
-
|
|
880
|
|
-
|
|
-
|
|
Actuarial loss from defined benefit plans
|
|
|
|
(102)
|
|
-
|
|
(45)
|
|
-
|
|
Other comprehensive income for the period from continuing
operations
|
|
|
|
4,784
|
|
4,742
|
|
(6,109)
|
|
(13,040)
|
|
Other comprehensive income / (loss) for the period from
discontinued operations
|
|
|
|
4,210
|
|
(2,081)
|
|
(51)
|
|
(10,215)
|
|
Total other comprehensive income for the period
|
|
|
|
8,994
|
|
2,661
|
|
(6,160)
|
|
(23,255)
|
|
Total comprehensive income / (loss) for the period
|
|
|
|
10,667
|
|
(5,966)
|
|
(12,250)
|
|
(37,891)
|
|
Total comprehensive loss from continuing operations
|
|
|
|
(10,182)
|
|
(6,927)
|
|
(11,960)
|
|
(30,253)
|
|
Total comprehensive income from discontinued
operations
|
|
|
|
20,849
|
|
961
|
|
(290)
|
|
(7,638)
|
|
Total comprehensive income / (loss) from the period
|
|
|
|
10,667
|
|
(5,966)
|
|
(12,250)
|
|
(37,891)
|
|
Profit for the period attributable to:
|
|
|
|
|
|
|
|
|
|
|
|
Equity holders of the parent
|
|
|
|
(4,746)
|
|
(6,027)
|
|
(2,136)
|
|
(7,055)
|
|
Non-controlling interest
|
|
|
|
6,419
|
|
(2,600)
|
|
(3,954)
|
|
(7,581)
|
|
Loss from continuing operations attributable to:
|
|
|
|
|
|
|
|
|
|
|
|
Equity holders of the parent
|
|
|
|
(10,285)
|
|
(7,063)
|
|
(2,997)
|
|
(8,048)
|
|
Non-controlling interest
|
|
|
|
(4,681)
|
|
(4,606)
|
|
(2,854)
|
|
(9,165)
|
|
Total comprehensive income attributable to:
|
|
|
|
|
|
|
|
|
|
|
|
Equity holders of the parent
|
|
|
|
(5,459)
|
|
(5,258)
|
|
(3,527)
|
|
(11,583)
|
|
Non-controlling interest
|
|
|
|
16,126
|
|
(708)
|
|
(8,723)
|
|
(26,308)
|
|
Loss for the period per share attributable to equity holders of the
parent:
|
|
|
|
|
|
|
|
|
|
|
|
Basic
|
|
|
|
(9.69)
|
|
(12.40)
|
|
(4.36)
|
|
(14.52)
|
|
Diluted
|
|
|
|
(9.69)
|
|
(12.40)
|
|
(4.36)
|
|
(14.52)
|
|
Loss per share from continuing operations attributable to equity
holders of the parent:
|
|
|
|
|
|
|
|
|
|
|
|
Basic
|
|
|
|
(21.00)
|
|
(14.53)
|
|
(6.12)
|
|
(16.56)
|
|
Diluted
|
|
|
|
(21.00)
|
|
(14.53)
|
|
(6.12)
|
|
(16.56)
|
The
accompanying notes are an integral part of these Financial
Statements.
|
PRICE WATERHOUSE & CO. S.R.L.
(Socio)
|
|
)
|
|
)
|
|
C.P.C.E.C.A.B.A. T° 1 F° 17
Dr. Mariano C. Tomatis
Contador Público (UBA)
C.P.C.E.C.A.B.A. T° 241 F° 118
|
|
Marcelo H. Fuxman
Síndico Titular
Por Comisión Fiscalizadora
|
|
Alejandro G.
Elsztain
Vicepresident
II acting
as
President
|
3
Cresud Sociedad Anónima,
Comercial, Inmobiliaria, Financiera y Agropecuaria
Unaudited Condensed Interim Consolidated Statements of Changes in
Shareholders’ Equity
for the six-month period ended December 31, 2019
(All
amounts in millions, except otherwise indicated)
Free
translation from the original prepared in Spanish for publication
in Argentina
|
|
|
Attributable to equity holders of the parent
|
|
|
||||||||||
|
|
|
Share capital
|
Treasury shares
|
Inflation adjustment of share capital and treasury
shares (i)
|
Share premium
|
Additional paid-in capital from treasury shares
|
Legal reserve
|
Special reserve (ii)
|
Other reserves (iii)
|
Retained earnings
|
Subtotal
|
Non-controlling interest
|
Total Shareholders' equity
|
|
|
Balance as of June 30, 2019
|
|
486
|
16
|
8,555
|
9,324
|
81
|
327
|
4,560
|
32,075
|
(34,261)
|
21,163
|
90,817
|
111,980
|
|
|
Adjustments previous periods (IFRS 16 and IAS 28) (Note
2.2)
|
|
-
|
-
|
-
|
-
|
-
|
-
|
-
|
-
|
(637)
|
(637)
|
(1,142)
|
(1,779)
|
|
|
Adjusted balance as of June 30, 2019
|
|
486
|
16
|
8,555
|
9,324
|
81
|
327
|
4,560
|
32,075
|
(34,898)
|
20,526
|
89,675
|
110,201
|
|
|
(Loss) / profit for the period
|
|
-
|
-
|
-
|
-
|
-
|
-
|
-
|
-
|
(4,746)
|
(4,746)
|
6,419
|
1,673
|
|
|
Other comprehensive (loss) / income for the period
|
|
-
|
-
|
-
|
-
|
-
|
-
|
-
|
(713)
|
-
|
(713)
|
9,707
|
8,994
|
|
|
Total comprehensive (loss) / profit for the period
|
|
-
|
-
|
-
|
-
|
-
|
-
|
-
|
(713)
|
(4,746)
|
(5,459)
|
16,126
|
10,667
|
|
|
Assignment of results - Shareholders’ meeting
|
|
-
|
-
|
-
|
-
|
-
|
-
|
-
|
-
|
-
|
-
|
(129)
|
(129)
|
|
|
Treasury shares distribution
|
|
13
|
(13)
|
-
|
-
|
-
|
-
|
-
|
1,331
|
(1,331)
|
-
|
(195)
|
(195)
|
|
|
Issuance of shares
|
|
-
|
-
|
-
|
-
|
-
|
-
|
-
|
-
|
-
|
-
|
75
|
75
|
|
|
Reserve for share-based payments
|
|
-
|
-
|
-
|
-
|
-
|
-
|
-
|
(2)
|
-
|
(2)
|
-
|
(2)
|
|
|
Changes in non-controlling interest
|
|
-
|
-
|
-
|
-
|
-
|
-
|
-
|
(126)
|
-
|
(126)
|
2,444
|
2,318
|
|
|
Distribution of dividends
|
|
-
|
-
|
-
|
-
|
-
|
-
|
-
|
-
|
-
|
-
|
(1,387)
|
(1,387)
|
|
|
Decrease due to loss of control
|
|
-
|
-
|
-
|
-
|
-
|
-
|
-
|
-
|
-
|
-
|
(38,099)
|
(38,099)
|
|
|
Other changes in shareholders' equity
|
|
-
|
-
|
-
|
-
|
-
|
-
|
-
|
-
|
12
|
12
|
156
|
168
|
|
|
Capitalized contributions
|
|
-
|
-
|
-
|
-
|
-
|
-
|
-
|
-
|
-
|
-
|
23
|
23
|
|
|
Loss absorption
|
|
-
|
-
|
-
|
-
|
-
|
-
|
(3,882)
|
(30,808)
|
34,690
|
-
|
-
|
-
|
|
|
Balance as of December 31, 2019
|
|
499
|
3
|
8,555
|
9,324
|
81
|
327
|
678
|
1,757
|
(6,273)
|
14,951
|
68,689
|
83,640
|
|
(i)
Includes Ps. 1 of Inflation adjustment of treasury shares. See Note
18 to the Annual Financial Statements.
(ii)
Related to CNV
General Resolution N° 609/12.
(iii)
Group’s other
reserves for the period ended December 31, 2019 are comprised as
follows:
|
|
|
Cost of treasury shares
|
Changes in non-controlling interest
|
Revaluation surplus
|
Reserve for currency translation adjustment
|
Reserve shared-based compensation
|
Special reserve
|
Other comprehensive results from subsidiaries
|
Other reserves from subsidiaries
|
Reserve for the acquisition of securities issued by the
Company
|
Total other reserves
|
|
Balance as of June 30, 2019
|
|
(1,465)
|
(2,443)
|
145
|
4,005
|
423
|
30,808
|
507
|
8
|
87
|
32,075
|
|
Other comprehensive loss for the period
|
|
-
|
-
|
-
|
(624)
|
-
|
-
|
(89)
|
-
|
-
|
(713)
|
|
Total comprehensive loss for the period
|
|
-
|
-
|
-
|
(624)
|
-
|
-
|
(89)
|
-
|
-
|
(713)
|
|
Treasury shares distribution
|
|
1,331
|
-
|
-
|
-
|
-
|
-
|
-
|
-
|
-
|
1,331
|
|
Reserve for share-based payments
|
|
-
|
-
|
-
|
-
|
-
|
-
|
-
|
(2)
|
-
|
(2)
|
|
Changes in non-controlling interest
|
|
-
|
(126)
|
-
|
-
|
-
|
-
|
-
|
-
|
-
|
(126)
|
|
Loss absorption
|
|
-
|
-
|
-
|
-
|
-
|
(30,808)
|
-
|
-
|
-
|
(30,808)
|
|
Balance as of December 31, 2019
|
|
(134)
|
(2,569)
|
145
|
3,381
|
423
|
-
|
418
|
6
|
87
|
1,757
|
The
accompanying notes are an integral part of these Financial
Statements.
|
PRICE WATERHOUSE & CO. S.R.L.
(Socio)
|
|
)
|
|
)
|
|
C.P.C.E.C.A.B.A. T° 1 F° 17
Dr. Mariano C. Tomatis
Contador Público (UBA)
C.P.C.E.C.A.B.A. T° 241 F° 118
|
|
Marcelo H. Fuxman
Síndico Titular
Por Comisión Fiscalizadora
|
|
Alejandro
G. Elsztain
Vicepresident II
acting
as
President
|
4
Cresud Sociedad Anónima,
Comercial, Inmobiliaria, Financiera y Agropecuaria
Unaudited Condensed Interim Consolidated Statements of Changes in
Shareholders’ Equity
for the six-month period ended December 31, 2018
(All
amounts in millions, except otherwise indicated)
Free
translation from the original prepared in Spanish for publication
in Argentina
|
|
|
Attributable to equity holders of the parent
|
|
|
|||||||||
|
|
|
Share capital
|
Treasury shares
|
Inflation adjustment of share capital and treasury
shares (i)
|
Share premium
|
Additional paid-in capital from treasury shares
|
Legal reserve
|
Special reserve (ii)
|
Other reserves (iii)
|
Retained earnings
|
Subtotal
|
Non-controlling interest
|
Total Shareholders' equity
|
|
Balance as of June 30, 2018
|
|
482
|
20
|
8,555
|
9,324
|
81
|
327
|
4,559
|
5,395
|
18,130
|
46,873
|
108,469
|
155,342
|
|
Adjustments previous periods (IFRS 9 and 15) (Note
2.2)
|
|
-
|
-
|
-
|
-
|
-
|
-
|
-
|
-
|
(186)
|
(186)
|
(107)
|
(293)
|
|
Adjusted balance as of June 30, 2018
|
|
482
|
20
|
8,555
|
9,324
|
81
|
327
|
4,559
|
5,395
|
17,944
|
46,687
|
108,362
|
155,049
|
|
Loss for the period
|
|
-
|
-
|
-
|
-
|
-
|
-
|
-
|
-
|
(6,027)
|
(6,027)
|
(2,600)
|
(8,627)
|
|
Other comprehensive income for the period
|
|
-
|
-
|
-
|
-
|
-
|
-
|
-
|
769
|
-
|
769
|
1,892
|
2,661
|
|
Total comprehensive loss for the period
|
|
-
|
-
|
-
|
-
|
-
|
-
|
-
|
769
|
(6,027)
|
(5,258)
|
(708)
|
(5,966)
|
|
Results distribution
|
|
-
|
-
|
-
|
-
|
-
|
-
|
-
|
28,638
|
(28,638)
|
-
|
-
|
-
|
|
Treasury shares distribution
|
|
21
|
(21)
|
-
|
-
|
-
|
-
|
-
|
-
|
-
|
-
|
-
|
-
|
|
Reversal by sale of investment properties
|
|
-
|
-
|
-
|
-
|
-
|
-
|
-
|
(32)
|
32
|
-
|
-
|
-
|
|
Reserve for share-based payments
|
|
-
|
-
|
-
|
-
|
-
|
-
|
-
|
6
|
-
|
6
|
37
|
43
|
|
Acquisition of treasury stock
|
|
(6)
|
6
|
-
|
-
|
-
|
-
|
-
|
(435)
|
-
|
(435)
|
-
|
(435)
|
|
Changes in non-controlling interest
|
|
-
|
-
|
-
|
-
|
-
|
-
|
-
|
(153)
|
-
|
(153)
|
(515)
|
(668)
|
|
Dividends distribution to non-controlling interest
|
|
-
|
-
|
-
|
-
|
-
|
-
|
-
|
-
|
-
|
-
|
(1,514)
|
(1,514)
|
|
Capitalized contributions
|
|
-
|
-
|
-
|
-
|
-
|
-
|
-
|
-
|
-
|
-
|
(9)
|
(9)
|
|
Incorporation by business combination
|
|
-
|
-
|
-
|
-
|
-
|
-
|
-
|
-
|
-
|
-
|
(14)
|
(14)
|
|
Balance as of December 31, 2018
|
|
497
|
5
|
8,555
|
9,324
|
81
|
327
|
4,559
|
34,188
|
(16,689)
|
40,847
|
105,639
|
146,486
|
(i)
Includes Ps. 1 of
Inflation adjustment of treasury shares. See Note 18 to the Annual
Financial Statements.
(ii)
Related to CNV
General Resolution N° 609/12.
(iii)
Group’s other
reserves for the period ended December 31, 2018 are comprised as
follows:
|
|
|
Cost of treasury shares
|
Changes in non-controlling interest
|
Revaluation surplus
|
Reserve for currency translation adjustment
|
Reserve shared-based compensation
|
Special reserve
|
Other comprehensive results from subsidiaries
|
Other reserves from subsidiaries
|
Reserve for the acquisition of securities issued by the
Company
|
Total other reserves
|
|
Balance as of June 30, 2018
|
|
(1,687)
|
(1,827)
|
172
|
4,805
|
412
|
3,475
|
(43)
|
11
|
77
|
5,395
|
|
Adjustments previous periods (IFRS 9 and 15) (Note
2.2)
|
|
-
|
-
|
-
|
-
|
-
|
-
|
-
|
-
|
-
|
-
|
|
Adjusted balance as of June 30, 2018
|
|
(1,687)
|
(1,827)
|
172
|
4,805
|
412
|
3,475
|
(43)
|
11
|
77
|
5,395
|
|
Profit for the period
|
|
-
|
-
|
-
|
-
|
-
|
-
|
-
|
-
|
-
|
-
|
|
Other comprehensive income for the period
|
|
-
|
-
|
513
|
256
|
-
|
-
|
-
|
-
|
-
|
769
|
|
Total comprehensive profit for the period
|
|
-
|
-
|
513
|
256
|
-
|
-
|
-
|
-
|
-
|
769
|
|
Results distribution
|
|
-
|
-
|
-
|
-
|
-
|
28,638
|
-
|
-
|
-
|
28,638
|
|
Treasury shares distribution
|
|
1,304
|
-
|
-
|
-
|
-
|
(1,304)
|
-
|
-
|
-
|
-
|
|
Reversal by sale of investment
properties
|
|
-
|
-
|
(32)
|
-
|
-
|
-
|
-
|
-
|
-
|
(32)
|
|
Reserve for share-based payments
|
|
-
|
-
|
-
|
-
|
-
|
-
|
-
|
6
|
-
|
6
|
|
Acquisition of treasury stock
|
|
(435)
|
-
|
-
|
-
|
-
|
-
|
-
|
-
|
-
|
(435)
|
|
Changes in non-controlling
interest
|
|
-
|
(153)
|
-
|
-
|
-
|
-
|
-
|
-
|
-
|
(153)
|
|
Balance as of December 31, 2018
|
|
(818)
|
(1,980)
|
653
|
5,061
|
412
|
30,809
|
(43)
|
17
|
77
|
34,188
|
The
accompanying notes are an integral part of these Financial
Statements.
|
PRICE WATERHOUSE & CO. S.R.L.
(Socio)
|
|
)
|
|
)
|
|
C.P.C.E.C.A.B.A. T° 1 F° 17
Dr. Mariano C. Tomatis
Contador Público (UBA)
C.P.C.E.C.A.B.A. T° 241 F° 118
|
|
Marcelo H. Fuxman
Síndico Titular
Por Comisión Fiscalizadora
|
|
Alejandro G.
Elsztain
Vicepresident
II acting
as
President
|
5
Cresud Sociedad Anónima,
Comercial, Inmobiliaria, Financiera y Agropecuaria
Unaudited Condensed Interim Consolidated Statements of Cash
Flows
for the six-month periods ended December 31, 2019 and
2018
(All
amounts in millions, except otherwise indicated)
Free
translation from the original prepared in Spanish for publication
in Argentina
|
|
|
Note
|
|
12.31.19
|
|
12.31.18
|
|
Operating activities:
|
|
|
|
|
|
|
|
Net cash generated from operating activities before income tax
paid
|
|
17
|
|
17,706
|
|
5,473
|
|
Income tax paid
|
|
|
|
(346)
|
|
(327)
|
|
Net cash generated from continuing operating
activities
|
|
|
|
17,360
|
|
5,146
|
|
Net cash generated from discontinued operating
activities
|
|
|
|
2,105
|
|
2,931
|
|
Net cash generated from operating activities
|
|
|
|
19,465
|
|
8,077
|
|
Investing activities:
|
|
|
|
|
|
|
|
Acquisition of participation in associates and joint
ventures
|
|
|
|
(653)
|
|
(18)
|
|
Decrease in cash due to deconsolidation of
subsidiaries
|
|
|
|
-
|
|
(9)
|
|
Capital contributions to associates and joint ventures
|
|
|
|
(251)
|
|
(34)
|
|
Proceeds from sales of intangible assets
|
|
|
|
25
|
|
-
|
|
Payment for non-controlling interest acquisition
|
|
|
|
-
|
|
(349)
|
|
Acquisition and improvement of investment properties
|
|
|
|
(1,404)
|
|
(2,009)
|
|
Proceeds from sales of investment properties
|
|
|
|
9,018
|
|
310
|
|
Acquisitions and improvements of property, plant and
equipment
|
|
|
|
(2,709)
|
|
(3,034)
|
|
Financial advances
|
|
|
|
(20)
|
|
(31)
|
|
Acquisition of intangible assets
|
|
|
|
(1,717)
|
|
(1,635)
|
|
Proceeds from sales of property, plant and equipment
|
|
|
|
2,908
|
|
20
|
|
Net increase of restricted deposits
|
|
|
|
-
|
|
(636)
|
|
Dividends collected from associates and joint ventures
|
|
|
|
453
|
|
260
|
|
Proceeds from sales of interest held in associates and joint
ventures
|
|
|
|
43
|
|
7,288
|
|
Proceeds from loans granted
|
|
|
|
27
|
|
104
|
|
Acquisitions of investments in financial assets
|
|
|
|
(10,924)
|
|
(29,540)
|
|
Proceeds from disposal of investments in financial
assets
|
|
|
|
14,661
|
|
35,290
|
|
Interest charged on financial assets
|
|
|
|
554
|
|
-
|
|
Dividends received from financial assets
|
|
|
|
79
|
|
31
|
|
Acquisition of subsidiaries, net of funds acquired
|
|
|
|
(71)
|
|
(60)
|
|
Loans granted to related parties
|
|
|
|
(202)
|
|
35
|
|
Loans granted
|
|
|
|
(3,195)
|
|
-
|
|
Increase in securities
|
|
|
|
4,477
|
|
-
|
|
Net cash generated from continuing investing
activities
|
|
|
|
11,099
|
|
5,983
|
|
Net cash generated from (used in) discontinued investing
activities
|
|
|
|
2,485
|
|
(6,276)
|
|
Net cash generated from (used in) investing activities
|
|
|
|
13,584
|
|
(293)
|
|
Financing activities:
|
|
|
|
|
|
|
|
Borrowings and issuance of non-convertible notes
|
|
|
|
13,790
|
|
29,306
|
|
Payment of borrowings and non-convertible notes
|
|
|
|
(35,739)
|
|
(21,538)
|
|
(Payment) Obtaining of short term loans, net
|
|
|
|
(106)
|
|
1,578
|
|
Interest paid
|
|
|
|
(8,671)
|
|
(7,861)
|
|
Repurchase of own shares
|
|
|
|
-
|
|
(435)
|
|
Repurchase of non-convertible notes
|
|
|
|
(11,961)
|
|
(3,019)
|
|
Capital contributions from non-controlling interest in
subsidiaries
|
|
|
|
-
|
|
144
|
|
Acquisition of non-controlling interest in
subsidiaries
|
|
|
|
(252)
|
|
(1,720)
|
|
Charge for issuance of shares and other equity
instruments
|
|
|
|
2,417
|
|
-
|
|
Proceeds from sales of non-controlling interest in
subsidiaries
|
|
|
|
-
|
|
8
|
|
Loans received from associates and joint ventures, net
|
|
|
|
80
|
|
80
|
|
Payment of borrowings to related parties
|
|
|
|
-
|
|
(2)
|
|
Dividends paid
|
|
|
|
(1,173)
|
|
840
|
|
Dividends paid to non-controlling interest in
subsidiaries
|
|
|
|
(203)
|
|
(459)
|
|
Proceeds from derivative financial instruments, net
|
|
|
|
(1,502)
|
|
223
|
|
Payment of seller financing
|
|
|
|
-
|
|
(3)
|
|
Net cash used in continuing financing activities
|
|
|
|
(43,320)
|
|
(2,858)
|
|
Net cash (used in) generated from discontinued financing
activities
|
|
|
|
(4,766)
|
|
6,844
|
|
Net cash (used in) generated from financing activities
|
|
|
|
(48,086)
|
|
3,986
|
|
Net (Decrease) Increase in cash and cash equivalents from
continuing activities
|
|
|
|
(14,861)
|
|
8,271
|
|
Net (Decrease) Increase in cash and cash equivalents from
discontinued activities
|
|
|
|
(176)
|
|
3,499
|
|
Net (Decrease) Increase in cash and cash equivalents
|
|
|
|
(15,037)
|
|
11,770
|
|
Cash and cash equivalents at beginning of the period
|
|
15
|
|
78,617
|
|
75,652
|
|
Cash and cash equivalents reclassified to held for
sale
|
|
|
|
(522)
|
|
(974)
|
|
Foreign exchange gain on cash and changes in fair value of cash
equivalents
|
|
|
|
4,608
|
|
(2,408)
|
|
Cash and cash equivalents at the end of the period
|
|
|
|
67,666
|
|
84,040
|
|
PRICE WATERHOUSE & CO. S.R.L.
(Socio)
|
|
)
|
|
)
|
|
C.P.C.E.C.A.B.A. T° 1 F° 17
Dr. Mariano C. Tomatis
Contador Público (UBA)
C.P.C.E.C.A.B.A. T° 241 F° 118
|
|
Marcelo H. Fuxman
Síndico Titular
Por Comisión Fiscalizadora
|
|
Alejandro G.
Elsztain
Vicepresident
II acting
as
President
|
6
Cresud Sociedad Anónima,
Comercial, Inmobiliaria, Financiera y Agropecuaria
Notes to the Unaudited Condensed Interim Consolidated Financial
Statements
(Amounts
in millions, except otherwise indicated)
1.
The
Group’s business and general information
Cresud
was founded in 1936 as a subsidiary of Credit Foncier, a Belgian
company primarily engaged in providing rural and urban loans in
Argentina and administering real estate holdings foreclosed by
Credit Foncier. Credit Foncier was liquidated in 1959, and as part
of such liquidation, the shares of Cresud were distributed to
Credit Foncier’s shareholders. From the 1960s through the end
of the 1970s, the business of Cresud shifted exclusively to
agricultural activities.
In
2002, Cresud acquired a 19.85% interest in IRSA, a real estate
company related to certain shareholders of Cresud. In 2009, Cresud
increased its ownership percentage in IRSA to 55.64% and IRSA
became Cresud’s direct principal subsidiary.
Cresud
and its subsidiaries are collectively referred to hereinafter as
the Group.
Main
shareholders of the Company are jointly Inversiones Financieras del
Sur S.A. and Agroinvestment S.A. Both entities are companies
incorporated in Uruguay and belong to the same controlling group
and ultimate beneficiary.
The
Board of Directors has approved these Financial Statements for
issuance on February 10, 2020.
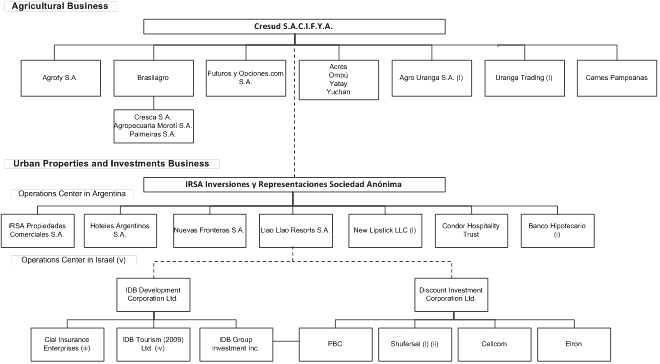
As of
December 31, 2019, the Group operates in two major lines of
business: (i) agricultural business and (ii) urban properties and
investments business, which is divided into two operations centers:
(a) Operations Center in Argentina and (b) Operations Center in
Israel. They are developed through several operating companies and
the main ones are listed below:
(i)
See Note 4 to the
Annual Financial Statements for more information about the
Operations Center in Israel.
Operations Center in Israel
IDBD
and DIC have certain restrictions and financial agreements in
relation to their financial debt, including their debentures and
loans with banks and financial institutions. Regarding IDBD's
financial position, its cash flow and its ability to meet its
financial debt commitments, it should be considered that certain
bondholders have hired representative and legal advisors, over the
last months to evaluate potential courses of actions including
procedures for declaring IDBD’s insolvency.
7
Cresud Sociedad Anónima,
Comercial, Inmobiliaria, Financiera y Agropecuaria
Besides
IDBD’s financial situation, its negative equity, negative
operating cash flows and low credit rating of its debentures which
resulted in its bondholders hiring representative and legal
advisors to evaluate a potential procedure for declaring the
insolvency of IDBD, the cash flow forecast for the next 24 months
presented to the Board of Directors includes the current price of
Clal’s shares and its implications in the swap transactions
deposits (see note 31) and considers the assumption that IDBD will
receive, inter alia, proceeds from the sale of private investments
which are directly owned by IDBD, while the implementation of these
plans does not depend entirely on factors under its
control.
Additionally,
IRSA’s Board of Directors has approved a commitment with
Dolphin to make capital contributions in Dolphin for up to NIS 210
(approximately Ps. 3,360 as of the date of these financial
statements), described in Note 1 to the Annual Financial
Statements.
In
preparation for its 2019 annual financial statements, IDBD is
currently evaluating its financial position, including, among
others, its updated cash flow projection and its net assets value.
At this stage, IDBD did not finalize its assessment.
The
commitments and other restrictions that result from IDBD and
DIC’s indebtedness do not have effect over IRSA since such
indebtedness has no recourse against IRSA, nor has IRSA guaranteed
it with its assets, except for the commitment to make contributions
to Dolphin as mentioned above.
Considering the
above, as of December 31, 2019, the financial risk of IRSA with
respect to the Operations Center in Israel is limited to the
abovementioned commitments and the equity risk, as a result of the
pledges granted over DIC shares to certain bondholders of IDBD, is
limited to the value of IRSA’s net assets in the Operation
Center in Israel, which amounted to NIS 588 (Ps. 9,737) as of
December 31, 2019.
2.
Summary
of significant accounting policies
2.1.
Basis
of preparation
These
financial statements have been prepared in accordance with IAS 34
“Interim financial reporting” and should therefore be
read in conjunction with the Group's annual Consolidated Financial
Statements as of June 30, 2019 prepared in accordance with IFRS.
Also, these financial statements include additional information
required by Law No. 19,550 and / or regulations of the CNV. Such
information is included in the notes to these financial statements,
as accepted by IFRS.
These
financial statements for the interim periods of six months ended
December 31, 2019 and 2018 have not been audited. Management
considers that they include all the necessary adjustments to fairly
present the results of each period. Intermediate period results do
not necessarily reflect the proportion of the Group's results for
the entire fiscal years.
IAS 29
"Financial Reporting in Hyperinflationary Economies" requires that
the financial statements of an entity whose functional currency is
one of a hyperinflationary economy be expressed in terms of the
current unit of measurement at the closing date of the reporting
period, regardless of whether they are based on the historical cost
method or the current cost method. To do so, in general terms, the
inflation produced from the date of acquisition or from the
revaluation date, as applicable, must be calculated by non-monetary
items. This requirement also includes the comparative information
of the financial statements.
In
order to conclude on whether an economy is categorized as highly
inflationary in the terms of IAS 29, the standard details a series
of factors to be considered, including the existence of an
accumulated inflation rate in three years that is approximates or
exceed 100%. For that reason, in accordance with IAS 29, Argentina
must be considered a country with a highly inflationary economy
starting July 1, 2018.
In
relation to the inflation index to be used and in accordance with
FACPCE Resolution No. 539/18, it will be determined based on the
Wholesale Price Index (IPIM) until 2016, considering for the months
of November and December 2015 the average variation of the Consumer
Price Index (CPI) of the Autonomous City of Buenos Aires, because
during those two months there were no national IPIM measurements.
Then, from January 2017, the National Consumer Price Index
(National CPI) will be considered. The table below presents the
index for the period ended December 31, 2019, according to official
statistics (INDEC) and following the guidelines described in
Resolution 539/18.
|
|
Quarter ended
September 30, 2019
|
Quarter ended
December 31, 2019
|
As of December 31, 2019 (accumulated six months)
|
|
Price variation
|
13%
|
12%
|
25%
|
As a
consequence of the aforementioned, these financial statements as of
December 31, 2019 were restated in accordance with IAS
29.
8
Cresud Sociedad Anónima,
Comercial, Inmobiliaria, Financiera y Agropecuaria
2.2
Accounting
policies
The
accounting policies applied in the presentation of these Financial
Statements are consistent with those applied in the preparation of
the Annual Financial Statements, as described in Note 2 to those
Financial Statements.
As
described in Note 2.2 to the annual financial statements, the Group
has adapted IFRS 16: “Leases” and Amendment to IAS 28
“Investment in associates and joint ventures” in the
current year applying the cumulative effect approach, therefore,
accumulated impact was recognized in retained earnings as of July
1, 2018. Comparative figures were not restated
The
main changes were the following:
●
IFRS 16: Leases
The
standard establishes the criteria for recognition and valuation of
leases for lessees and lessors. The changes incorporated mainly
impact the tenant's accounting. IFRS 16 provides that the lessee
recognizes an asset for the right of use and a liability at present
value with respect to those contracts that meet the definition of
lease agreements according to IFRS 16. In accordance with the
standard, a lease agreement is one that provides the right to
control the use of an identified asset for a specific period. In
order for a company to have control over the use of an identified
asset: a) it must have the right to substantially obtain all the
economic benefits of the identified asset and b) it must have the
right to direct the use of the identified asset.
The
standard allows to exclude short-term contracts (under 12 months)
and those in which the underlying asset has low value.
●
Amendment to IAS 28 “Investment in associates and joint
ventures”
In
accordance with the amendment to IAS 28, an entity shall implement
the provisions of IFRS 9 to Long-term Investments that are
essentially part of the entity's net investment in the associate or
in the joint venture according to the definitions of said standard.
The provisions of IFRS 9 shall apply to such investments with
respect to the interest in the losses of an associate or a joint
venture, as well as with respect to the recognition of the
impairment of an investment in an associate or joint venture. In
addition, when applying IFRS 9 to such long-term investments, the
entity will make it prior to the adjustments made to the carrying
amount of the investment in accordance with IAS 28.
Additionally, the
Company opted for an accounting policy where the currency
translation adjustments arising from these loans are recorded as
part of other comprehensive income.
The
effect on retained earnings as of July 1, 2019 for the first
implementation of IFRS 16 and IAS 28 is the following:
|
|
|
IFRS 16 impact
|
|
IAS 28 impact
|
|
Adjusted statement of financial position
|
|
ASSETS
|
|
|
|
|
|
|
|
Non-current assets
|
|
|
|
|
|
|
|
Investment properties
|
|
375
|
|
-
|
|
375
|
|
Right-of-use assets
|
|
14,380
|
|
-
|
|
14,380
|
|
Investments in associates and joint ventures
|
|
-
|
|
(1,787)
|
|
(1,787)
|
|
Trade and other receivables
|
|
106
|
|
-
|
|
106
|
|
Total non-current assets
|
|
14,861
|
|
(1,787)
|
|
13,074
|
|
|
|
|
|
|
|
|
|
Income tax and MPIT credit
|
|
15
|
|
-
|
|
15
|
|
Group of assets held for sale
|
|
(150)
|
|
-
|
|
(150)
|
|
Trade and other receivables
|
|
2,748
|
|
-
|
|
2,748
|
|
Total current assets
|
|
2,613
|
|
-
|
|
2,613
|
|
TOTAL ASSETS
|
|
17,474
|
|
(1,787)
|
|
15,687
|
|
SHAREHOLDERS’ EQUITY
|
|
|
|
|
|
|
|
Shareholders' equity attributable to equity holders of the
parent
|
|
|
|
|
|
|
|
Retained earnings
|
|
5
|
|
(642)
|
|
(637)
|
|
Non-controlling interest
|
|
3
|
|
(1,145)
|
|
(1,142)
|
|
TOTAL SHAREHOLDERS’ EQUITY
|
|
8
|
|
(1,787)
|
|
(1,779)
|
|
LIABILITIES
|
|
|
|
|
|
|
|
Non-current liabilities
|
|
|
|
|
|
|
|
Lease liabilities
|
|
10,759
|
|
-
|
|
10,759
|
|
Total non-current liabilities
|
|
10,759
|
|
-
|
|
10,759
|
|
Current liabilities
|
|
|
|
|
|
|
|
Lease liabilities
|
|
4,028
|
|
-
|
|
4,028
|
|
Trade and other payables
|
|
(81)
|
|
-
|
|
(81)
|
|
Group of liabilities held for sale
|
|
2,760
|
|
-
|
|
2,760
|
|
Total current liabilities
|
|
6,707
|
|
-
|
|
6,707
|
|
TOTAL LIABILITIES
|
|
17,466
|
|
-
|
|
17,466
|
|
TOTAL SHAREHOLDERS’ EQUITY AND LIABILITIES
|
|
17,474
|
|
(1,787)
|
|
15,687
|
9
Cresud Sociedad Anónima,
Comercial, Inmobiliaria, Financiera y Agropecuaria
2.3
Comparability
of information
Balance
items as of June 30, 2019 and December 31, 2018 presented in these
Financial Statements for comparative purposes arise from the
financial statements as of and for such period, restated in
accordance with IAS 29 (See Note 2.1).Certain items from prior
periods have been reclassified for consistency purposes regarding
the loss of control in Gav-Yam. See note 4.(l) to Annual Financial
Statements.
2.4
Use
of estimates
The
preparation of Financial Statements at a certain date requires
Management to make estimations and evaluations affecting the amount
of assets and liabilities recorded and contingent assets and
liabilities disclosed at such date, as well as income and expenses
recorded during the period. Actual results might differ from the
estimates and evaluations made at the date of preparation of these
financial statements. In the preparation of these financial
statements, the significant judgments made by Management in
applying the Group’s accounting policies and the main sources
of uncertainty were the same as the ones applied by the Group in
the preparation of the Annual Financial Statements described in
Note 3 to those Financial Statements.
3.
Seasonal
effects on operations
Agricultural business
Some of
the Group’s businesses are more affected by seasonal effects
than others. The operations of the Group’s agricultural
business are subject to seasonal effects. The harvests and sale of
grains in Argentina generally take place each year since March in
the case of corn and soybean, since October in the case of wheat,
and since December in the case of sunflower. In Brazil, the harvest
and sale of soybean take place since February, and in the case of
corn weather conditions make it possible to have two seasons,
therefore the harvest take place between March and July. In
Bolivia, weather conditions also make it possible to have two
soybean, corn and sorghum seasons and, therefore, these crops are
harvested in July and May, whereas wheat is harvested in August and
September, respectively. In the case of sugarcane, harvest and sale
take place between April and November of each year. Other segments
of the agricultural business, such as beef cattle production tend
to be more stable. However, beef cattle production is generally
larger during the second quarter, when conditions are more
favorable. As a result, there may be material fluctuations in the
agricultural business results across quarters.
Urban properties and investments business
Operations
Center in Argentina
The
operations of the Group’s shopping malls are subject to
seasonal effects, which affect the level of sales recorded by
lessees. During summertime in Argentina (January and February), the
lessees of shopping malls experience the lowest sales levels in
comparison with the winter holidays (July) and Christmas and
year-end holidays celebrated in December, when they tend to record
peaks of sales. Apparel stores generally change their collections
during the spring and the fall, which impacts positively on
shopping malls sales. Sale discounts at the end of each season also
affect the business. As a consequence, for shopping mall
operations, a higher level of business activity is expected in the
period ranging between July and December, compared to the period
between January and June.
Operations
Center in Israel
The
results of operations of telecommunications and tourism are usually
affected by seasonality in summer months in Israel and by the
Jewish New Year, given a higher consumption due to internal and
external tourism.
Véase nuestro informe de fecha 09/11/18
PRICE WATERHOUSE & Co. S.R.L.
C.P.C.E.C.A.B.A. T° 1 F
10
Cresud Sociedad
Anónima,
Comercial, Inmobiliaria,
Financiera y Agropecuaria
4.
Acquisitions and
disposals
Significant acquisitions and disposals for the
six-month period ended December 31, 2019 are detailed below.
Significant acquisitions and disposals for the fiscal year ended
June 30, 2019, are detailed in Note 4 to the Annual Financial
Statements.
Agricultural
business
Sale of Alto
Taquarí
On October 29, 2019, the Group through its
subsidiary Brasilagro has entered into a purchase-sale agreement
for an area of 85 hectares (65 arable hectares) of Alto Taquari
Farm, located in in Alto Taquari, Mato Grosso state. The total
amount of the sale is Ps. 83. The buyer made the initial payment of
14,300 soybean bags, totaling Ps. 16. The remaining balance will be
paid in four annual installments. The result of the transaction was
recognized for Ps. 61.
Sale of
Jatobá
On July 2019, the Group through its subsidiary
Brasilagro has entered into a purchase-sale agreement for an area
of 1,134 hectares (893 arable hectares) of Jatobá Farm,
located in Jaborandi, Bahia state. The total amount of the sale is
302 soybean bags per arable hectare equivalent to Ps. 347. The
buyer already made an initial payment of Ps. 40. The remaining
balance will be paid in six annual installments. The result of the
transaction was recognized for Ps. 238.
Urban
properties and investments business
Operations Center
Argentina
Condor merger
agreement
On July 19, 2019, Condor signed an agreement and
merger plan with a company not related to the Group. The agreement
set that each ordinary share, whose nominal value is US$ 0.01 per
share will be canceled before the merger and will be replaced by
the right to receive a cash amount equivalent to US$ 11.10 per
ordinary share. Additionally, in accordance with the terms and
conditions of the merger agreement, each Series E convertible share
will be automatically canceled, and shareholders will become
entitled to receive a cash amount equal to US$ 10.00 per
share.
It is estimated that the operation will be
completed before February 29, 2020. At the date of issuance of
these financial statements, the Group held 2,197,023 ordinary
shares and 325,752 Series E shares.
TGLT –
Recapitalization agreement
On August 8, 2019, we entered into certain
arrangements with TGLT S.A. (“TGLT”) providing for
collaboration in TGLT’s financial restructuring and
recapitalization. Through the recapitalization agreement TGLT
committed to: (i) make a public offering to subscribe Class A
preferred shares at a subscription price of US$1.00 per TGLT share;
(ii) make a public offering of new Class B preferred shares which
may be subscribed by (a) the exchange for ordinary shares of TGLT,
at an exchange ratio of one Class B preferred share for every 6.94
ordinary shares of the Company and / or (b) the exchange for
convertible notes, at an exchange ratio of a Class B preferred
share for each US$1.00 of convertible notes (including accumulated
and unpaid interests under the existing convertible notes); and
(iii) grant an option to subscribe new Class C preferred shares in
a public offer for cash to be carried out if: (a) the public offer
of Class A and Class B preferred shares is completed and (b) a
minimum number of option holders have exercised that option at a
subscription price of US$1.00 per Class C preferred share (or its
equivalent in pesos).
Finally, supporting the recapitalization plan,
IRSA CP signed a subscription commitment with TGLT for Class A
preferred shares under the Class A Public Offering to make a
contribution in kind of shares of the company La Maltería
S.A., 100% of its ownership, for an amount of up to US$ 24 million
and promised to exchange its convertible notes into Class B
preferred shares.
In turn, on November 22, 2019, TGLT held a
meeting with bondholders of convertible notes in order to consider
the amendment to different clauses of the indenture in force at
that date, and in line with what was agreed in the recapitalization
agreement, IRSA CP approved the amendments.
Véase nuestro
informe de fecha 09/11/18
PRICE WATERHOUSE
& Co. S.R.L.
C.P.C.E.C.A.B.A.
T° 1 F° 17
11
Cresud Sociedad
Anónima,
Comercial, Inmobiliaria,
Financiera y Agropecuaria
Under the agreements described above, the
successful consummation of the offer by TGLT, and having reached
the thresholds of consent from the bondholders of convertible notes
of TGLT, on December 11, 2019, the Company concluded the process
scheduled in the recapitalization agreement and related documents
through the subscription of Class A preferred shares, integrating
them in kind through the contribution of the shares of the company
La Maltería S.A., 100% of their ownership and, moreover,
proceeded to the exchange of the convertible note - including
deferred interest and accrued interest from August 15, 2019 to
December 11, 2019 - in preferred class B
shares.
Operations Center
Israel
Sale of
Gav-Yam
On July 1, 2019, PBC sold approximately 11.7% of
its equity interest in Gav-Yam's through private agreements. After
this transaction, the holding of PBC in Gav-Yam changed from 51.7%
to 40.0%. The consideration received for said sale was NIS 456
(approximately $ 6,118 restated as of the date of these financial
statements).
Additionally, on September 1, 2019, PBC sold
approximately an additional 5.14% of Gav-Yam, therefore the stake
of PBC in Gav-Yam went from 40.0% to 34.9%. as a consequence of the
aforementioned sales, PBC has lost the right to nominate the
majority of the members of the Board of Directors, and to appoint
or remove the key members of management. Consequently, PBC has lost
control of Gav-Yam and has deconsolidated such investment since
that date.
Below is a detail of the
sale:
|
|
09.30.2019
|
|
Cash
received
|
12,555
|
|
Remeasurement of the fair
value of the remaining investment
|
28,315
|
|
Total
|
40,870
|
|
Net assets written off
including goodwill
|
(24,596)
|
|
Gain from sale of
subsidiary, net of taxes (*)
|
16,247
|
Below is a detail of the net assets
deconsolidated:
|
|
09.30.2019
|
|
Investment
properties
|
138,688
|
|
Property, plant and
equipment
|
934
|
|
Intangible
assets
|
2,992
|
|
Right-of-use
assets
|
37
|
|
Investments in associates
and joint ventures
|
3,870
|
|
Restricted
assets
|
333
|
|
Trade and other
receivables
|
1,019
|
|
Investments in financial
assets
|
11,759
|
|
Trading
properties
|
136
|
|
Income tax
credit
|
167
|
|
Cash and cash
equivalents
|
9,352
|
|
TOTAL
ASSETS
|
169,287
|
|
Borrowings
|
88,224
|
|
Lease
liabilities
|
37
|
|
Deferred income tax
liabilities
|
16,124
|
|
Trade and other
payables
|
2,111
|
|
Employee
benefits
|
19
|
|
Salaries and social
security liabilities
|
56
|
|
Income tax and MPIT
liabilities
|
111
|
|
TOTAL
LIABILITIES
|
106,682
|
|
Non-controlling
interest
|
38,009
|
|
Net
assets written off including goodwill
|
24,596
|
Agreement for sale
of a plot of land in the US
As mentioned in Note 4. D of the Operations
Center in Israel, the agreement for the sale of the land attached
to the Tivoli project has been breached and terminated. In July
2019, the Group signed a new agreement for the sale of the
aforementioned land, for a total amount of US$ 18 million. At this
stage, there is no certainty that the sale transaction will be
completed.
12
Cresud Sociedad
Anónima,
Comercial, Inmobiliaria,
Financiera y Agropecuaria
IDBD financing
agreement
On August 31, 2019, IDBD’s Board of
Directors gave its approval to accept a commitment by Dolphin to
make a capital contribution ("the Commitment"), whose main points
are the following:
Dolphin irrevocably undertook the commitment to
make capital contributions to IDBD for a total amount of NIS 210 in
three equal annual payments (NIS 70 each) on September 2, in each
of the years 2019-2021 ("Payments" and "payment dates",
respectively). The aforementioned payments will be made in exchange
for the company’s shares or as a subordinated loan in similar
terms to the subordinated loan that Dolphin advanced in the past to
IDBD. On September 2, 2019, the first payment for NIS 70 million
was made.
IRSA committed unilaterally and irrevocably to
transfer to Dolphin the amounts it needs to comply with the
Commitment ("IRSA Commitment"). If Dolphin does not make the
capital contributions in accordance with the Commitment, then
Dolphin's rights in accordance with the IRSA Commitment will be
automatically assigned to IDBD, and IDBD will have the right to act
to carry out the IRSA Commitment.
The Commitment will automatically expire in each
of the following cases: (a) if motions are filed to decree
insolvency against IDBD (whether voluntarily or involuntarily
filed) in the courts of Israel and they are valid in any of the
Payment Dates, in which case the corresponding Payment Date will be
postponed for a period of 90 days and the corresponding payment
will be transferred to IDBD only if the procedures are canceled
during the mentioned period of 90 days. If the procedures for
declaring insolvency are not canceled within 90 days as mentioned
above, the entire commitment will expire; (b) if an insolvency
decree is given as set forth in section 3 of the Israel Insolvency
and Economic Recovery Act, 5778-2018; and (c) a trustee, fiduciary,
special manager or any officer of this type (temporary or
permanent) is appointed in IDBD, or the court will issue a similar
order (with respect to the insolvency of IDBD).
Advance payment of
Ispro debentures
In August 2019, the Audit Committee and Ispro
Board approved the full advance payment of the debentures (Series
B), which were quoted in the TASE, the total amount was NIS 131.
The early repayment of these debentures will make Ispro an unlisted
company for the TASE.
Sale of Clal
shares
On August 28, 2019, the second buyer of the
transaction described in Note 4.A. notified the decision to
exercise the option for the remaining 3% at a price of NIS 50 per
share for a total of NIS 83 million. These shares were delivered
through a swap contract.
On September 3, 2019, IDB concluded an agreement
for the sale of an additional 6% of Clal shares, of which 1% would
be collected in cash (approximately NIS 29) and the remaining 5%
through the receipt of IDBD’s own debentures for a nominal
value of approximately NIS 190 million. The agreed price of Clal
share was NIS 52.5 and the discount value applied to the IDBD
debentures was between 25% - 21% discount with respect to the
nominal value.
As mentioned in Note 4.A. to the annual
financial statements, IDBD was looking for different ways of
financing the purchase of Clal's to the third buyer. On October 27,
2019, IDBD signed an agreement with a financial entity which
offered to buy all rights and obligations related to the financing
of said purchase.
On November 7, the sale transaction has been
completed and the loan has been granted by a financial entity. It
should be clarified that the amount of 2,771,309 of Clal Insurance
Enterprises shares sold was subject to a swap transaction between
IDBD and a financial entity, that ended with the Company's notice
to that entity.
On December 16, Clal made a public capital
increase of 12,066,000 shares at a price of NIS/share 53.87 in
which IDBD did not take part.
Additionally, on the same date, IDBD sold
200,000 shares of Clal at a price of NIS/share 53.95,
representative of 0.3% of the new share
capital.
On December 18, IDBD sold 617,017 shares of Clal
at a price of NIS/share 53.77, representative of 0.9% of the share
capital.
Additionally, during December 2019, a swap
transaction, which IDBD had agreed for 2.771.309 shares, expired.
The price per share was of NIS 52.25.
As a result of said transaction, as of December
31, 2019, IDBD’s equity interest in Clal Insurance
Enterprises was 8.5% and it owned an additional 8.2% through swap
transactions.
13
Cresud Sociedad
Anónima,
Comercial, Inmobiliaria,
Financiera y Agropecuaria
Capital Increase in
Cellcom
On December 5, 2019, Cellcom made a tender offer
for the issuance of shares, of which DIC participated and acquired
50% of the issuance. The amount received for the shares was of NIS
307 (approximately Ps. 5,320 as of that date) and Cellcom issued a
total amount of 30,600,000 ordinary shares, 7,038,000 share options
(Series 3) and 6,426,000 share options (Series 4) for an amount of
NIS 1.021 per unit (each unit will consist of 100 ordinary shares,
23 share options Series 3 and 21 share options Series
4).
After this transaction, DIC holds 46.2% of the
issued capital and approximately 48.5% of the voting rights of
Cellcom (directly and over agreements with other shareholders of
Cellcom).
PBC distribution of
dividends in kind
On December 10, 2019 PBC distributed all its
interest in Mehadrin as a dividend in kind. As a result DIC holds a
direct interest in Mehadrin of 31.4%. As of December 2019, Mehadrin
is classified as an associate.
5.
Financial risk management and
fair value estimates
These Financial Statements
do not include all the information and disclosures on financial
risk management; therefore, they should be read along with Note 5
to the Annual Financial Statements. There have been no changes in
risk management or risk management policies applied by the Group
since year-end.
Since June 30, 2019 and up
to the date of issuance of these Financial Statements, there have
been no significant changes in business or economic circumstances
affecting the fair value of the Group's assets or liabilities,
(either measured at fair value or amortized cost). Furthermore,
there have been no transfers between the different hierarchies used
to assess the fair value of the Group’s financial
instruments, except as mentioned in Note 34.
6.
Segment
information
As explained in Note 6 to
the Annual Consolidated Financial Statements, segment information
is reported from the perspective of products and services: (i)
agricultural business and (ii) urban properties and investment
business. In addition, this last segment is reported divided from
the geographic point of view in two Operations Centers to manage
its global interests: Argentina and Israel. As described in Note
4.(l) to the Annual Financial Statements, the Group lost control of
Gav-Yam as of June 30, 2019 and has reclassified its results to
discontinued operations. Segment information for the period ended
December 31, 2018 has been recast for the purposes of comparability
with the present period
Below is a summary of the
Group’s business units and a reconciliation between the
operating income according to segment information and the operating
income of the statement of income and other comprehensive income of
the Group for the periods ended December 31, 2019 and
2018:
Véase nuestro
informe de fecha 09/11/18
PRICE WATERHOUSE
& Co. S.R.L.
C.P.C.E.C.A.B.A.
T° 1 F° 17
14
Cresud Sociedad
Anónima,
Comercial, Inmobiliaria,
Financiera y Agropecuaria
Below is a summarized
analysis of the lines of business of the Group for the year ended
December 31, 2019:
|
|
|
12.31.19
|
||||||||||||||||
|
|
|
|
|
Urban Properties and
Investment business (II)
|
|
|
|
|
|
|
|
|
|
|
||||
|
|
|
Agricultural business
(I)
|
|
Operations Center in
Argentina
|
|
Operations Center in
Israel
|
|
Subtotal
|
|
Total segment
information
|
|
Joint ventures
(i)
|
|
Adjustments
(ii)
|
|
Elimination of
inter-segment transactions and non-reportable assets / liabilities
(iii)
|
|
Total Statement of
Income / Financial Position
|
|
Revenues
|
|
12,821
|
|
6,531
|
|
34,767
|
|
41,298
|
|
54,119
|
|
(40)
|
|
1,540
|
|
(461)
|
|
55,158
|
|
Costs
|
|
(10,841)
|
|
(1,378)
|
|
(23,498)
|
|
(24,876)
|
|
(35,717)
|
|
21
|
|
(1,611)
|
|
275
|
|
(37,032)
|
|
Initial recognition and changes in the fair
value of biological assets and agricultural products at the point
of harvest
|
|
1,104
|
|
-
|
|
-
|
|
-
|
|
1,104
|
|
-
|
|
-
|
|
145
|
|
1,249
|
|
Changes in the net realizable value of
agricultural products after harvest
|
|
422
|
|
-
|
|
-
|
|
-
|
|
422
|
|
-
|
|
-
|
|
-
|
|
422
|
|
Gross
profit
|
|
3,506
|
|
5,153
|
|
11,269
|
|
16,422
|
|
19,928
|
|
(19)
|
|
(71)
|
|
(41)
|
|
19,797
|
|
Gain from disposal of
farmlands
|
|
299
|
|
-
|
|
-
|
|
-
|
|
299
|
|
-
|
|
-
|
|
-
|
|
299
|
|
Net gain / (loss) from fair value adjustment of
investment properties
|
|
12
|
|
4,028
|
|
(164)
|
|
3,864
|
|
3,876
|
|
(253)
|
|
-
|
|
-
|
|
3,623
|
|
General and administrative
expenses
|
|
(671)
|
|
(1,133)
|
|
(3,528)
|
|
(4,661)
|
|
(5,332)
|
|
7
|
|
-
|
|
24
|
|
(5,301)
|
|
Selling expenses
|
|
(1,291)
|
|
(536)
|
|
(5,229)
|
|
(5,765)
|
|
(7,056)
|
|
4
|
|
(25)
|
|
12
|
|
(7,065)
|
|
Other operating results, net
|
|
149
|
|
(42)
|
|
(2,594)
|
|
(2,636)
|
|
(2,487)
|
|
14
|
|
71
|
|
-
|
|
(2,402)
|
|
Profit /
(Loss) from operations
|
|
2,004
|
|
7,470
|
|
(246)
|
|
7,224
|
|
9,228
|
|
(247)
|
|
(25)
|
|
(5)
|
|
8,951
|
|
Share profit / (loss) of associates and joint
ventures
|
|
155
|
|
(1,289)
|
|
(563)
|
|
(1,852)
|
|
(1,697)
|
|
181
|
|
-
|
|
14
|
|
(1,502)
|
|
Segment
profit / (loss)
|
|
2,159
|
|
6,181
|
|
(809)
|
|
5,372
|
|
7,531
|
|
(66)
|
|
(25)
|
|
9
|
|
7,449
|
|
|
|
|
|
|
|
|
|
|
|
|
|
|
|
|
|
|
|
|
|
Reportable assets
|
|
32,115
|
|
102,248
|
|
374,349
|
|
476,597
|
|
508,712
|
|
(579)
|
|
-
|
|
40,434
|
|
548,567
|
|
Reportable liabilities
|
|
-
|
|
-
|
|
(331,885)
|
|
(331,885)
|
|
(331,885)
|
|
-
|
|
-
|
|
(133,042)
|
|
(464,927)
|
|
Net reportable
assets
|
|
32,115
|
|
102,248
|
|
42,464
|
|
144,712
|
|
176,827
|
|
(579)
|
|
-
|
|
(92,608)
|
|
83,640
|
Véase nuestro
informe de fecha 09/11/18
PRICE WATERHOUSE
& Co. S.R.L.
C.P.C.E.C.A.B.A.
T° 1 F° 17
15
Cresud Sociedad
Anónima,
Comercial, Inmobiliaria,
Financiera y Agropecuaria
Below is a summarized
analysis of the lines of business of the Group for the year ended
December 31, 2018:
|
|
|
12.31.18
|
||||||||||||||||
|
|
|
|
|
Urban
Properties and Investment business (II)
|
|
|
|
|
|
|
|
|
|
|
||||
|
|
|
Agricultural
business (I)
|
|
Operations
Center in Argentina
|
|
Operations
Center in Israel
|
|
Subtotal
|
|
Total
segment information
|
|
Joint ventures
(i)
|
|
Adjustments
(ii)
|
|
Elimination of
inter-segment transactions and non-reportable assets / liabilities
(iii)
|
|
Total Statement of
Income / Financial Position
|
|
Revenues
|
|
8,403
|
|
7,100
|
|
30,920
|
|
38,020
|
|
46,423
|
|
(45)
|
|
1,754
|
|
(337)
|
|
47,795
|
|
Costs
|
|
(6,978)
|
|
(1,235)
|
|
(21,744)
|
|
(22,979)
|
|
(29,957)
|
|
28
|
|
(1,832)
|
|
137
|
|
(31,624)
|
|
Initial recognition and
changes in the fair value of biological assets and agricultural
products at the point of harvest
|
|
527
|
|
-
|
|
-
|
|
-
|
|
527
|
|
-
|
|
-
|
|
181
|
|
708
|
|
Changes in the net
realizable value of agricultural products after
harvest
|
|
52
|
|
-
|
|
-
|
|
-
|
|
52
|
|
-
|
|
-
|
|
-
|
|
52
|
|
Gross
profit
|
|
2,004
|
|
5,865
|
|
9,176
|
|
15,041
|
|
17,045
|
|
(17)
|
|
(78)
|
|
(19)
|
|
16,931
|
|
Net (loss) / profit from fair value adjustment
of investment properties
|
|
(34)
|
|
(9,641)
|
|
487
|
|
(9,154)
|
|
(9,188)
|
|
2
|
|
-
|
|
-
|
|
(9,186)
|
|
Gain from disposal of
farmlands
|
|
81
|
|
-
|
|
-
|
|
-
|
|
81
|
|
-
|
|
-
|
|
-
|
|
81
|
|
General and administrative
expenses
|
|
(616)
|
|
(1,311)
|
|
(3,430)
|
|
(4,741)
|
|
(5,357)
|
|
11
|
|
-
|
|
15
|
|
(5,331)
|
|
Selling
expenses
|
|
(749)
|
|
(501)
|
|
(4,797)
|
|
(5,298)
|
|
(6,047)
|
|
2
|
|
-
|
|
3
|
|
(6,042)
|
|
Other operating results,
net
|
|
323
|
|
(308)
|
|
966
|
|
658
|
|
981
|
|
161
|
|
78
|
|
(2)
|
|
1,218
|
|
Profit /
(Loss) from operations
|
|
1,009
|
|
(5,896)
|
|
2,402
|
|
(3,494)
|
|
(2,485)
|
|
159
|
|
-
|
|
(3)
|
|
(2,329)
|
|
Share loss of associates and joint
ventures
|
|
(20)
|
|
(396)
|
|
(622)
|
|
(1,018)
|
|
(1,038)
|
|
(192)
|
|
-
|
|
-
|
|
(1,230)
|
|
Segment
profit / (loss)
|
|
989
|
|
(6,292)
|
|
1,780
|
|
(4,512)
|
|
(3,523)
|
|
(33)
|
|
-
|
|
(3)
|
|
(3,559)
|
|
|
|
|
|
|
|
|
|
|
|
|
|
|
|
|
|
|
|
|
|
Reportable
assets
|
|
30,216
|
|
126,938
|
|
503,648
|
|
630,586
|
|
660,802
|
|
(652)
|
|
-
|
|
39,564
|
|
699,714
|
|
Reportable
liabilities
|
|
-
|
|
-
|
|
(432,060)
|
|
(432,060)
|
|
(432,060)
|
|
-
|
|
-
|
|
(121,166)
|
|
(553,226)
|
|
Net
reportable assets
|
|
30,216
|
|
126,938
|
|
71,588
|
|
198,526
|
|
228,742
|
|
(652)
|
|
-
|
|
(81,602)
|
|
146,488
|
(i)
Represents the equity value of joint ventures
that were proportionately consolidated for information by segment
purposes.
(ii)
Includes Ps. (71) and Ps. (78) corresponding to
Expenses and FPC as of December 31, 2019 and 2018,
respectively.
(iii)
Includes deferred income tax assets, income tax
and MPIT credits, trade and other receivables, investment in
financial assets, cash and cash equivalents and intangible assets
except for rights to receive future units under barter agreements,
net of investments in associates with negative equity which are
included in provisions in the amount of Ps. 8,913 as of December
31, 2019.
Véase nuestro
informe de fecha 09/11/18
PRICE WATERHOUSE
& Co. S.R.L.
C.P.C.E.C.A.B.A.
T° 1 F° 17
16
Cresud Sociedad
Anónima,
Comercial, Inmobiliaria,
Financiera y Agropecuaria
(I)
Agriculture line of
business
The following tables present the reportable
segments of the agriculture line of business:
|
|
|
12.31.19
|
||||||||
|
|
|
Agricultural
production
|
|
Land transformation and
sales
|
|
Corporate
|
|
Others
|
|
Total Agricultural
business
|
|
Revenues
|
|
8,347
|
|
-
|
|
-
|
|
4,474
|
|
12,821
|
|
Costs
|
|
(7,102)
|
|
(12)
|
|
-
|
|
(3,727)
|
|
(10,841)
|
|
Initial recognition and changes in the fair
value of biological assets and agricultural products at the point
of harvest
|
|
1,085
|
|
-
|
|
-
|
|
19
|
|
1,104
|
|
Changes in the net realizable value of
agricultural products after harvest
|
|
422
|
|
-
|
|
-
|
|
-
|
|
422
|
|
Gross profit /
(loss)
|
|
2,752
|
|
(12)
|
|
-
|
|
766
|
|
3,506
|
|
Gain from disposal of
farmlands
|
|
-
|
|
299
|
|
-
|
|
-
|
|
299
|
|
Net gain from fair value adjustment of
investment properties
|
|
-
|
|
12
|
|
-
|
|
-
|
|
12
|
|
General and administrative
expenses
|
|
(434)
|
|
(1)
|
|
(101)
|
|
(135)
|
|
(671)
|
|
Selling expenses
|
|
(913)
|
|
-
|
|
-
|
|
(378)
|
|
(1,291)
|
|
Other operating results, net
|
|
109
|
|
(49)
|
|
-
|
|
89
|
|
149
|
|
Profit / (loss) from
operations
|
|
1,514
|
|
249
|
|
(101)
|
|
342
|
|
2,004
|
|
Share of profit of associates and joint
ventures
|
|
28
|
|
-
|
|
-
|
|
127
|
|
155
|
|
Segment profit /
(loss)
|
|
1,542
|
|
249
|
|
(101)
|
|
469
|
|
2,159
|
|
|
|
|
|
|
|
|
|
|
|
|
|
Investment properties
|
|
2,377
|
|
-
|
|
-
|
|
-
|
|
2,377
|
|
Property, plant and
equipment
|
|
19,117
|
|
157
|
|
-
|
|
653
|
|
19,927
|
|
Investments in associates
|
|
350
|
|
-
|
|
-
|
|
330
|
|
680
|
|
Other reportable assets
|
|
6,965
|
|
-
|
|
-
|
|
2,166
|
|
9,131
|
|
Reportable
assets
|
|
28,809
|
|
157
|
|
-
|
|
3,149
|
|
32,115
|
|
|
|
12.31.18
|
||||||||
|
|
|
Agricultural
production
|
|
Land transformation and
sales
|
|
Corporate
|
|
Others
|
|
Total Agricultural
business
|
|
Revenues
|
|
4,739
|
|
-
|
|
-
|
|
3,664
|
|
8,403
|
|
Costs
|
|
(4,057)
|
|
(15)
|
|
-
|
|
(2,906)
|
|
(6,978)
|
|
Initial recognition and
changes in the fair value of biological assets and agricultural
products at the point of harvest
|
|
551
|
|
-
|
|
-
|
|
(24)
|
|
527
|
|
Changes in the net
realizable value of agricultural products after
harvest
|
|
52
|
|
-
|
|
-
|
|
-
|
|
52
|
|
Gross profit /
(loss)
|
|
1,285
|
|
(15)
|
|
-
|
|
734
|
|
2,004
|
|
Net gain from fair value adjustment of
investment properties
|
|
-
|
|
(34)
|
|
-
|
|
-
|
|
(34)
|
|
Gain from disposal of
farmlands
|
|
-
|
|
81
|
|
-
|
|
-
|
|
81
|
|
General and administrative
expenses
|
|
(381)
|
|
(2)
|
|
(109)
|
|
(124)
|
|
(616)
|
|
Selling
expenses
|
|
(441)
|
|
(2)
|
|
-
|
|
(306)
|
|
(749)
|
|
Other operating results,
net
|
|
255
|
|
43
|
|
-
|
|
25
|
|
323
|
|
Profit / (loss) from
operations
|
|
718
|
|
71
|
|
(109)
|
|
329
|
|
1,009
|
|
Share of loss of associates and joint
ventures
|
|
(2)
|
|
-
|
|
-
|
|
(18)
|
|
(20)
|
|
Segment profit /
(loss)
|
|
716
|
|
71
|
|
(109)
|
|
311
|
|
989
|
|
|
|
|
|
|
|
|
|
|
|
|
|
Investment
properties
|
|
2,071
|
|
-
|
|
-
|
|
-
|
|
2,071
|
|
Property, plant and
equipment
|
|
18,545
|
|
64
|
|
-
|
|
638
|
|
19,247
|
|
Investments in
associates
|
|
292
|
|
-
|
|
-
|
|
58
|
|
350
|
|
Other reportable
assets
|
|
6,963
|
|
-
|
|
-
|
|
1,585
|
|
8,548
|
|
Reportable
assets
|
|
27,871
|
|
64
|
|
-
|
|
2,281
|
|
30,216
|
(II)
Urban properties and
investments line of business
Below is a summarized analysis of the lines of
business of Group’s operations center in
Argentina:
|
|
|
12.31.19
|
||||||||||||||
|
|
|
Shopping
Malls
|
|
Offices
|
|
Sales
and developments
|
|
Hotels
|
|
International
|
|
Corporate
|
|
Others
|
|
Total
|
|
Revenues
|
|
3,644
|
|
1,095
|
|
460
|
|
1,268
|
|
5
|
|
-
|
|
59
|
|
6,531
|
|
Costs
|
|
(287)
|
|
(64)
|
|
(273)
|
|
(706)
|
|
(5)
|
|
-
|
|
(43)
|
|
(1,378)
|
|
Gross
profit
|
|
3,357
|
|
1,031
|
|
187
|
|
562
|
|
-
|
|
-
|
|
16
|
|
5,153
|
|
Net (loss) / profit from fair value adjustment
of investment properties
|
(1,876)
|
|
3,213
|
|
2,544
|
|
-
|
|
-
|
|
-
|
|
147
|
|
4,028
|
|
|
General and administrative
expenses
|
|
(440)
|
|
(115)
|
|
(108)
|
|
(177)
|
|
(60)
|
|
(177)
|
|
(56)
|
|
(1,133)
|
|
Selling
expenses
|
|
(254)
|
|
(43)
|
|
(98)
|
|
(135)
|
|
-
|
|
-
|
|
(6)
|
|
(536)
|
|
Other operating results,
net
|
|
(85)
|
|
(24)
|
|
(3)
|
|
(9)
|
|
(1)
|
|
-
|
|
80
|
|
(42)
|
|
Profit /
(Loss) from operations
|
|
702
|
|
4,062
|
|
2,522
|
|
241
|
|
(61)
|
|
(177)
|
|
181
|
|
7,470
|
|
Share of profit / (loss) of associates and joint
ventures
|
|
-
|
|
-
|
|
-
|
|
-
|
|
(381)
|
|
-
|
|
(908)
|
|
(1,289)
|
|
Segment
profit / (loss)
|
|
702
|
|
4,062
|
|
2,522
|
|
241
|
|
(442)
|
|
(177)
|
|
(727)
|
|
6,181
|
|
|
|
|
|
|
|
|
|
|
|
|
|
|
|
|
|
|
|
Investment and trading
properties
|
|
42,867
|
|
30,029
|
|
25,868
|
|
-
|
|
89
|
|
-
|
|
1,082
|
|
99,935
|
|
Property, plant and
equipment
|
|
208
|
|
921
|
|
-
|
|
1,736
|
|
179
|
|
-
|
|
-
|
|
3,044
|
|
Investment in associates
and joint ventures
|
|
-
|
|
-
|
|
456
|
|
-
|
|
(7,530)
|
|
-
|
|
5,315
|
|
(1,759)
|
|
Other reportable
assets
|
|
97
|
|
107
|
|
719
|
|
26
|
|
-
|
|
-
|
|
79
|
|
1,028
|
|
Reportable
assets
|
|
43,172
|
|
31,057
|
|
27,043
|
|
1,762
|
|
(7,262)
|
|
-
|
|
6,476
|
|
102,248
|
Véase nuestro
informe de fecha 09/11/18
PRICE WATERHOUSE
& Co. S.R.L.
C.P.C.E.C.A.B.A.
T° 1 F° 17
17
Cresud Sociedad
Anónima,
Comercial, Inmobiliaria,
Financiera y Agropecuaria
For the six-month period ended December 31,
2019, the net gain from fair value adjustments of shopping malls
was Ps. 4,141 million. The net impact of the values in pesos of our
properties was mainly a consequence of the change in macroeconomic
conditions:
(a)
positive result of Ps.19,638.8 million as a
consequence of an increase in the projected inflation rate plus
GDP, with the resulting increase in the cash flow of shopping malls
revenues;
(b)
negative result of Ps.21,592.6 million due to
the conversion to dollars of the projected cash flow in pesos
according to the exchange rate estimates used in the cash
flow;
(c)
an
increase of 72 basis points in the discount rate, mainly due to an
increase in the country-risk rate component of the WACC discount
rate used to discount the cash flow, which led to a decrease in the
value of the shopping malls of Ps.2,244.0
million.
(d)
positive impact of Ps.11,560.7 million resulting
from the conversion into pesos of the value of the shopping malls
in dollars based on the exchange rate at the end of the
period;
(e)
additional effect due to the suspension of the
income tax rate applicable to companies for one year, which
resulted in a reduction in the value of shopping centers of Ps.
209.0 million
The value of our office buildings and other
rental properties measured in real terms increased by 12.0% during
the six-month period ended as of December 31, 2019, due to a
devaluation of the peso which exceeded the period's inflation
rate.
Additionally, due to the impact of the inflation
adjustment, part of the gain from fair value adjustments was
reclassified due to exposure to changes in the purchasing power of
the currency.
|
|
|
12.31.18
|
||||||||||||||
|
|
|
Shopping
Malls
|
|
Offices
|
|
Sales
and developments
|
|
Hotels
|
|
International
|
|
Corporate
|
|
Others
|
|
Total
|
|
Revenues
|
|
4,209
|
|
838
|
|
514
|
|
1,454
|
|
8
|
|
-
|
|
77
|
|
7,100
|
|
Costs
|
|
(318)
|
|
(45)
|
|
(68)
|
|
(719)
|
|
(3)
|
|
-
|
|
(82)
|
|
(1,235)
|
|
Gross
profit / (loss)
|
|
3,891
|
|
793
|
|
446
|
|
735
|
|
5
|
|
-
|
|
(5)
|
|
5,865
|
|
Net (loss) / profit from fair value adjustment
of investment properties
|
(13,664)
|
|
3,796
|
|
197
|
|
-
|
|
3
|
|
-
|
|
27
|
|
(9,641)
|
|
|
General and administrative
expenses
|
|
(454)
|
|
(104)
|
|
(94)
|
|
(227)
|
|
(54)
|
|
(326)
|
|
(52)
|
|
(1,311)
|
|
Selling
expenses
|
|
(269)
|
|
(52)
|
|
(20)
|
|
(152)
|
|
-
|
|
-
|
|
(8)
|
|
(501)
|
|
Other operating results,
net
|
|
32
|
|
(15)
|
|
(186)
|
|
40
|
|
3
|
|
-
|
|
(182)
|
|
(308)
|
|
(Loss) /
Profit from operations
|
|
(10,464)
|
|
4,418
|
|
343
|
|
396
|
|
(43)
|
|
(326)
|
|
(220)
|
|
(5,896)
|
|
Share of profit of associates and joint
ventures
|
|
-
|
|
-
|
|
(21)
|
|
-
|
|
(299)
|
|
-
|
|
(76)
|
|
(396)
|
|
Segment
(loss) / profit
|
|
(10,464)
|
|
4,418
|
|
322
|
|
396
|
|
(342)
|
|
(326)
|
|
(296)
|
|
(6,292)
|
|
|
|
|
|
|
|
|
|
|
|
|
|
|
|
|
|
|
|
Investment and trading
properties
|
|
66,040
|
|
30,346
|
|
23,328
|
|
-
|
|
92
|
|
-
|
|
291
|
|
120,097
|
|
Property, plant and
equipment
|
|
178
|
|
100
|
|
-
|
|
1,841
|
|
174
|
|
-
|
|
801
|
|
3,094
|
|
Investment in associates
and joint ventures
|
|
2
|
|
-
|
|
375
|
|
-
|
|
(3,840)
|
|
-
|
|
6,682
|
|
3,219
|
|
Other reportable
assets
|
|
50
|
|
53
|
|
163
|
|
21
|
|
-
|
|
-
|
|
241
|
|
528
|
|
Reportable
assets
|
|
66,270
|
|
30,499
|
|
23,866
|
|
1,862
|
|
(3,574)
|
|
-
|
|
8,015
|
|
126,938
|
Below is a summarized analysis of the lines of
business of Group’s operations center in
Israel:
|
|
|
12.31.19
|
||||||||||||
|
|
|
Real
Estate
|
|
Supermarkets
|
|
Telecommunications
|
|
Insurance
|
|
Corporate
|
|
Others
|
|
Total
|
|
Revenues
|
|
6,277
|
|
-
|
|
27,595
|
|
-
|
|
-
|
|
895
|
|
34,767
|
|
Costs
|
|
(3,364)
|
|
-
|
|
(19,885)
|
|
-
|
|
-
|
|
(249)
|
|
(23,498)
|
|
Gross
profit / (loss)
|
|
2,913
|
|
-
|
|
7,710
|
|
-
|
|
-
|
|
646
|
|
11,269
|
|
Net loss from fair value adjustment of
investment properties
|
|
(164)
|
|
-
|
|
-
|
|
-
|
|
-
|
|
-
|
|
(164)
|
|
General and administrative
expenses
|
|
(378)
|
|
-
|
|
(2,297)
|
|
-
|
|
(440)
|
|
(413)
|
|
(3,528)
|
|
Selling expenses
|
|
(117)
|
|
-
|
|
(4,924)
|
|
-
|
|
-
|
|
(188)
|
|
(5,229)
|
|
Other operating results, net
|
|
(1,644)
|
|
-
|
|
(657)
|
|
-
|
|
(58)
|
|
(235)
|
|
(2,594)
|
|
Profit /
(Loss) from operations
|
|
610
|
|
-
|
|
(168)
|
|
-
|
|
(498)
|
|
(190)
|
|
(246)
|
|
Share of loss of associates and joint
ventures
|
|
(404)
|
|
-
|
|
(89)
|
|
-
|
|
-
|
|
(70)
|
|
(563)
|
|
Segment
profit / (loss)
|
|
206
|
|
-
|
|
(257)
|
|
-
|
|
(498)
|
|
(260)
|
|
(809)
|
|
|
|
|
|
|
|
|
|
|
|
|
|
|
|
|
|
Reportable assets
|
|
133,810
|
|
22,442
|
|
115,160
|
|
7,337
|
|
29,114
|
|
66,486
|
|
374,349
|
|
Reportable liabilities
|
|
(123,193)
|
|
-
|
|
(89,968)
|
|
-
|
|
(98,434)
|
|
(20,290)
|
|
(331,885)
|
|
Net reportable
assets
|
|
10,617
|
|
22,442
|
|
25,192
|
|
7,337
|
|
(69,320)
|
|
46,196
|
|
42,464
|
|
|
|
12.31.18
|
||||||||||||
|
|
|
Real
Estate
|
|
Supermarkets
|
|
Telecommunications
|
|
Insurance
|
|
Corporate
|
|
Others
|
|
Total
|
|
Revenues
|
|
6,153
|
|
-
|
|
24,018
|
|
-
|
|
-
|
|
749
|
|
30,920
|
|
Costs
|
|
(3,857)
|
|
-
|
|
(17,488)
|
|
-
|
|
-
|
|
(399)
|
|
(21,744)
|
|
Gross
profit
|
|
2,296
|
|
-
|
|
6,530
|
|
-
|
|
-
|
|
350
|
|
9,176
|
|
Net gain from fair value adjustment of
investment properties
|
|
487
|
|
-
|
|
-
|
|
-
|
|
-
|
|
-
|
|
487
|
|
General and administrative
expenses
|
|
(281)
|
|
-
|
|
(2,114)
|
|
-
|
|
(422)
|
|
(613)
|
|
(3,430)
|
|
Selling expenses
|
|
(103)
|
|
-
|
|
(4,554)
|
|
-
|
|
-
|
|
(140)
|
|
(4,797)
|
|
Other operating results, net
|
|
-
|
|
-
|
|
181
|
|
-
|
|
413
|
|
372
|
|
966
|
|
Profit / (Loss) from
operations
|
|
2,399
|
|
-
|
|
43
|
|
-
|
|
(9)
|
|
(31)
|
|
2,402
|
|
Share of (loss) / profit of associates and joint
ventures
|
|
(470)
|
|
252
|
|
-
|
|
-
|
|
-
|
|
(404)
|
|
(622)
|
|
Segment profit /
(loss)
|
|
1,929
|
|
252
|
|
43
|
|
-
|
|
(9)
|
|
(435)
|
|
1,780
|
|
|
|
|
|
|
|
|
|
|
|
|
|
|
|
|
|
Reportable assets
|
|
271,236
|
|
21,126
|
|
103,239
|
|
24,773
|
|
54,408
|
|
28,866
|
|
503,648
|
|
Reportable liabilities
|
|
(210,798)
|
|
-
|
|
(80,053)
|
|
-
|
|
(126,264)
|
|
(14,945)
|
|
(432,060)
|
|
Net reportable
assets
|
|
60,438
|
|
21,126
|
|
23,186
|
|
24,773
|
|
(71,856)
|
|
13,921
|
|
71,588
|
Véase nuestro
informe de fecha 09/11/18
PRICE WATERHOUSE
& Co. S.R.L.
C.P.C.E.C.A.B.A.
T° 1 F° 17
18
Cresud Sociedad
Anónima,
Comercial, Inmobiliaria,
Financiera y Agropecuaria
7.
Investments in associates and
joint ventures
Changes in the Group’s investments in
associates and joint ventures for the six-month period ended
December 31, 2019 and for the year ended June 30, 2019 were as
follows:
|
|
|
12.31.19
|
|
06.30.19
|
|
Beginning
of the period / year
|
|
31,879
|
|
46,428
|
|
Adjustments of previous
years (IFRS 9 and IAS 28)
|
|
(1,787)
|
|
(135)
|
|
Issuance of capital and
contributions
|
|
312
|
|
143
|
|
Capital
reduction
|
|
(29)
|
|
(591)
|
|
Increase of interest in
associates and joint ventures
|
|
2,569
|
|
614
|
|
Share of profit /
(loss)
|
|
(1,462)
|
|
(6,265)
|
|
Other comprehensive
income
|
|
148
|
|
-
|
|
Currency translation
adjustment
|
|
(461)
|
|
(377)
|
|
Dividends
(i)
|
|
(89)
|
|
(1,526)
|
|
Sale of
associates
|
|
-
|
|
(6,319)
|
|
Deconsolidation
|
|
24,445
|
|
-
|
|
Reclassification to
held-for-sale
|
|
(159)
|
|
-
|
|
Others
|
|
9
|
|
(93)
|
|
End of
the period / year (ii)
|
|
55,375
|
|
31,879
|
(i)
See
Note 28.
(ii)
As of
December 31, 2019, and June 30, 2019 includes Ps. (8,913) and
(7,662) reflecting interests in companies with negative equity,
which were disclosed in “Provisions” (see Note
20)
Below is additional information about the
Group’s investments in associates and joint
ventures:
|
Name of
the entity
|
|
%
ownership interest
|
|
Value of
Group's interest in equity
|
|
Group's
interest in comprehensive income / (loss)
|
|||||||
|
|
12.31.19
|
|
06.30.19
|
|
12.31.19
|
|
06.30.19
|
|
12.31.19
|
|
12.31.18
|
|
|
|
Associates
|
|
|
|
|
|
|
|
|
|
|
|
|
|
|
New Lipstick
(1)
|
|
49.96%
|
|
49.96%
|
|
(8,912)
|
|
(7,622)
|
|
(368)
|
|
(455)
|
|
|
BHSA
|
|
29.91%
|
|
29.91%
|
|
2,927
|
|
3,918
|
|
(993)
|
|
(121)
|
|
|
Condor
|
|
18.89%
|
|
18.89%
|
|
1,331
|
|
1,225
|
|
(13)
|
|
79
|
|
|
PBEL
|
|
45.00%
|
|
45.40%
|
|
-
|
|
1,743
|
|
-
|
|
(2)
|
|
|
Shufersal
|
|
26.02%
|
|
26.02%
|
|
22,442
|
|
20,260
|
|
1,952
|
|
439
|
|
|
Mehadrin
|
|
31.40%
|
|
45.41%
|
|
4,174
|
|
4,265
|
|
(58)
|
|
(606)
|
|
|
Gav-Yam
|
|
34.90%
|
|
N/A
|
|
25,457
|
|
N/A
|
|
163
|
|
N/A
|
|
|
TGLT S.A.
(2)
|
|
30.50%
|
|
N/A
|
|
1,915
|
|
N/A
|
|
-
|
|
N/A
|
|
|
Other
associates
|
|
-
|
|
-
|
|
699
|
|
3,311
|
|
122
|
|
(324)
|
|
|
|
|
|
|
|
|
|
|
|
|
|
|
|
|
|
Joint ventures
|
|
|
|
|
|
|
|
|
|
|
|
|
|
|
Quality
|
|
50.00%
|
|
50.00%
|
|
1,857
|
|
1,646
|
|
185
|
|
32
|
|
|
La Rural
S.A.
|
|
50.00%
|
|
50.00%
|
|
184
|
|
89
|
|
94
|
|
26
|
|
|
Cresca
S.A.
|
|
50.00%
|
|
50.00%
|
|
-
|
|
18
|
|
(1)
|
|
-
|
|
|
Other joint
ventures
|
|
-
|
|
-
|
|
3,301
|
|
3,026
|
|
(3,006)
|
|
(177)
|
|
|
Total
associates and joint ventures
|
|
|
|
|
|
55,375
|
|
31,879
|
|
(1,923)
|
|
(1,109)
|
|
|
Name of
the entity
|
|
Location
of business / Country of incorporation
|
|
Main
activity
|
|
Common
shares 1 vote
|
|
Last
financial statement issued
|
||||
|
|
|
|
|
Share
capital (nominal value)
|
|
Profit /
(loss) for the period
|
|
Shareholders'
equity
|
||||
|
Associates
|
|
|
|
|
|
|
|
|
|
|
|
|
|
New Lipstick
(1)
|
|
U.S.
|
|
Real
estate
|
|
N/A
|
|
N/A
|
|
(*) (8)
|
|
(*) (217)
|
|
BHSA
|
|
Argentina
|
|
Financing
|
|
448,689,072
|
|
(***) 1,500
|
|
(***) 3,321
|
|
(***) 9,407
|
|
Condor
|
|
U.S.
|
|
Hotel
|
|
2,245,100
|
|
N/A
|
|
(*) (2)
|
|
(*) 92
|
|
PBEL
|
|
India
|
|
Real
estate
|
|
450
|
|
(**) 1
|
|
(**) 144
|
|
(**) 3,254
|
|
Shufersal
|
|
Israel
|
|
Retail
|
|
79,282,087
|
|
(**) 242
|
|
(**)242
|
|
(**) 1,795
|
|
Mehadrin
|
|
Israel
|
|
Agricultural
|
|
N/A
|
|
N/A
|
|
-
|
|
12,276
|
|
Gav-Yam
|
|
Israel
|
|
Real
estate
|
|
N/A
|
|
N/A
|
|
(**) 149
|
|
(**) 3,254
|
|
TGLT S.A.
(2)
|
|
Argentina
|
|
Real
estate
|
|
1,509,889
|
|
80
|
|
-
|
|
(3,237)
|
|
|
|
|
|
|
|
|
|
|
|
|
|
|
|
Joint ventures
|
|
|
|
|
|
|
|
|
|
|
|
|
|
Quality
|
|
Argentina
|
|
Real estate
|
|
120,827,022
|
|
326
|
|
369
|
|
3,659
|
|
La Rural
S.A.
|
|
Argentina
|
|
Organization of events
|
|
714,498
|
|
1
|
|
199
|
|
289
|
(1)
On March 4th 2019,
Metropolitan a subsidiary of New Lipstick, has renegotiated its
non-recourse debt with IRSA, for an amount of USD 11 plus a
contingent amount over the option price on part of the parcel of
the land where the Lipstick building is built. The debt is due on
April 30, 2021.
(2)
Additionally, 21,600,000 preferred class A
shares and 24,948,798 preferred class B shares were subscribed,
subject to conversion. As of the date of issuance of these
financial statements, these preferred shares have not yet been
converted.
(*)
Amounts in millions of US Dollars under USGAAP.
Condor’s year-end falls on December 31, so the Group
estimates their interest with a three-monthlag, including material
adjustments, if any.
(**)
Amounts in millions of NIS.
(***)
Information as of December 31, 2019 according to
BCRA's standards.
Puerto
Retiro (joint venture):
There have been no changes to what was informed
in Note 8 to the Annual Financial Statements.
Véase nuestro
informe de fecha 09/11/18
PRICE WATERHOUSE
& Co. S.R.L.
C.P.C.E.C.A.B.A.
T° 1 F° 17
19
Cresud Sociedad
Anónima,
Comercial, Inmobiliaria,
Financiera y Agropecuaria
8.
Investment
properties
Changes in the Group’s investment
properties for the six-month period ended December 31, 2019 and for
the year ended June 30, 2019 were as follows:
|
|
|
Leased
out farmland
|
|
Rental
properties
|
|
Underdeveloped
parcels of land
|
|
Properties
under development
|
|
Others
|
|
Total
as of 12.31.19
|
|
Total
as of 06.30.19
|
|
Fair
value at the beginning of the period / year
|
|
2,319
|
|
257,367
|
|
25,096
|
|
9,957
|
|
186
|
|
294,925
|
|
320,155
|
|
Adjustments of previous
years (IFRS 15)
|
|
-
|
|
375
|
|
-
|
|
-
|
|
-
|
|
375
|
|
-
|
|
Additions
|
|
-
|
|
577
|
|
1
|
|
1,556
|
|
1
|
|
2,135
|
|
10,221
|
|
Capitalized finance
costs
|
|
-
|
|
-
|
|
-
|
|
-
|
|
-
|
|
-
|
|
205
|
|
Capitalized leasing
costs
|
|
-
|
|
13
|
|
-
|
|
-
|
|
-
|
|
13
|
|
14
|
|
Amortization of capitalized
leasing costs (i)
|
|
-
|
|
(9)
|
|
-
|
|
-
|
|
-
|
|
(9)
|
|
(12)
|
|
Transfers
|
|
(133)
|
|
(19,719)
|
|
(680)
|
|
(553)
|
|
-
|
|
(21,085)
|
|
1,746
|
|
Deconsolidation
|
|
-
|
|
(127,270)
|
|
(7,213)
|
|
(4,205)
|
|
-
|
|
(138,688)
|
|
-
|
|
Disposals
|
|
-
|
|
(9,494)
|
|
(343)
|
|
-
|
|
-
|
|
(9,837)
|
|
(5,104)
|
|
Currency translation
adjustment
|
|
179
|
|
37,017
|
|
1,476
|
|
1,090
|
|
-
|
|
39,762
|
|
(2,589)
|
|
Net gain from fair value
adjustment
|
|
12
|
|
1,260
|
|
2,070
|
|
228
|
|
53
|
|
3,623
|
|
(29,711)
|
|
Fair
value at the end of the period / year
|
|
2,377
|
|
140,117
|
|
20,407
|
|
8,073
|
|
240
|
|
171,214
|
|
294,925
|
(i)
Amortization charges of capitalized leasing
costs were included in “Costs” in the Statements of
Income (Note 25).
The following amounts have been recognized in
the Statements of Income:
|
|
|
12.31.19
|
|
12.31.18
|
|
Rental and services
income
|
|
9,903
|
|
10,341
|
|
Direct operating
expenses
|
|
(3,425)
|
|
(3,552)
|
|
Development
expenses
|
|
(46)
|
|
(2,864)
|
|
Net realized gain from fair
value adjustment of investment properties
|
|
3
|
|
1,651
|
|
Net unrealized gain from
fair value adjustment of investment properties
|
|
3,620
|
|
(10,837)
|
Valuation techniques are described in Note 9 to
the Annual Financial Statements. There were no changes to such
techniques. The Company has reassessed the assumptions at the end
of the period, incorporating the effect of the variation in the
exchange rate in other assets denominated in US
Dollars.
9.
Property, plant and
equipment
Changes in the Group’s property, plant and
equipment for the six-month period ended December 31, 2019 and for
the year ended June 30, 2019 were as follows:
|
|
|
Owner occupied
farmland
|
|
Bearer
plant
|
|
Buildings and
facilities
|
|
Machinery and
equipment
|
|
Communication
networks
|
|
Others
|
|
Total
as of 12.31.19
|
|
Total
as of 06.30.19
|
|
Costs
|
|
18,045
|
|
1,741
|
|
11,689
|
|
2,272
|
|
83,351
|
|
8,380
|
|
125,478
|
|
117,723
|
|
Accumulated depreciation
|
|
(1,818)
|
|
(509)
|
|
(6,427)
|
|
(1,496)
|
|
(61,375)
|
|
(6,221)
|
|
(77,846)
|
|
(71,882)
|
|
Net book amount at the
beginning of the period / year
|
16,227
|
|
1,232
|
|
5,262
|
|
776
|
|
21,976
|
|
2,159
|
|
47,632
|
|
45,841
|
|
|
|
|
|
|
|
|
|
|
|
|
|
|
|
|
|
|
|
|
Adjustments of previous
years (IFRS 15)
|
|
-
|
|
-
|
|
-
|
|
(6)
|
|
-
|
|
-
|
|
(6)
|
|
7,943
|
|
Additions
|
|
248
|
|
105
|
|
182
|
|
58
|
|
2,012
|
|
551
|
|
3,156
|
|
(447)
|
|
Disposals
|
|
(51)
|
|
-
|
|
(18)
|
|
(1)
|
|
(2,799)
|
|
(15)
|
|
(2,884)
|
|
-
|
|
Deconsolidation
|
|
-
|
|
-
|
|
(372)
|
|
(523)
|
|
-
|
|
(39)
|
|
(934)
|
|
-
|
|
Currency translation
adjustment
|
|
1,099
|
|
103
|
|
256
|
|
131
|
|
2,961
|
|
(484)
|
|
4,066
|
|
(1,168)
|
|
Transfers
|
|
133
|
|
(2)
|
|
(241)
|
|
(30)
|
|
-
|
|
-
|
|
(140)
|
|
1,427
|
|
Depreciation charges (i)
|
|
(107)
|
|
(172)
|
|
(219)
|
|
(54)
|
|
(2,188)
|
|
(613)
|
|
(3,353)
|
|
(5,964)
|
|
Balances at the end of the
period / year
|
|
17,549
|
|
1,266
|
|
4,850
|
|
351
|
|
21,962
|
|
1,559
|
|
47,537
|
|
47,632
|
|
|
|
|
|
|
|
|
|
|
|
|
|
|
|
|
|
|
|
Costs
|
|
18,985
|
|
1,800
|
|
9,096
|
|
1,930
|
|
89,422
|
|
4,174
|
|
125,407
|
|
125,478
|
|
Accumulated depreciation
|
|
(1,436)
|
|
(534)
|
|
(4,246)
|
|
(1,579)
|
|
(67,460)
|
|
(2,615)
|
|
(77,870)
|
|
(77,846)
|
|
Net book amount at the end of
the period / year
|
|
17,549
|
|
1,266
|
|
4,850
|
|
351
|
|
21,962
|
|
1,559
|
|
47,537
|
|
47,632
|
(i)
Amortization charge was recognized in the amount
of Ps. 2,555 under "Costs", in the amount of Ps. 366 under "General
and administrative expenses" and Ps. 76 under "Selling expenses" as
of December 31, 2019, in the Statements of Income (Note 25) and Ps.
356 were capitalized as part of the cost of the biological
assets
Véase nuestro
informe de fecha 09/11/18
PRICE WATERHOUSE
& Co. S.R.L.
C.P.C.E.C.A.B.A.
T° 1 F° 17
20
Cresud Sociedad
Anónima,
Comercial, Inmobiliaria,
Financiera y Agropecuaria
10.
Trading
properties
Changes in the Group’s trading properties
for the six-month period ended December 31, 2019 and for the year
ended June 30, 2019 were as follows:
|
|
|
Completed
properties
|
|
Properties under
development
|
|
Undeveloped
sites
|
|
Total as of
12.31.19
|
|
Total as of
06.30.19
|
|
Beginning of the period /
year
|
|
2,760
|
|
1,711
|
|
2,905
|
|
7,376
|
|
19,443
|
|
Adjustment previous periods
(IFRS 15)
|
|
-
|
|
-
|
|
-
|
|
-
|
|
(7,329)
|
|
Additions
|
|
24
|
|
915
|
|
28
|
|
967
|
|
3,226
|
|
Capitalized finance costs
|
|
-
|
|
64
|
|
-
|
|
64
|
|
15
|
|
Currency translation
adjustment
|
|
140
|
|
95
|
|
228
|
|
463
|
|
(1,188)
|
|
Transfers
|
|
159
|
|
(130)
|
|
(29)
|
|
-
|
|
47
|
|
Impairment
|
|
-
|
|
-
|
|
-
|
|
-
|
|
(40)
|
|
Deconsolidation
|
|
-
|
|
(136)
|
|
-
|
|
(136)
|
|
-
|
|
Disposals
|
|
(301)
|
|
(2,127)
|
|
(47)
|
|
(2,475)
|
|
(6,798)
|
|
End of the period /
year
|
|
2,782
|
|
392
|
|
3,085
|
|
6,259
|
|
7,376
|
|
|
|
|
|
|
|
|
|
|
|
|
|
Non-current
|
|
|
|
|
|
|
|
4,336
|
|
6,915
|
|
Current
|
|
|
|
|
|
|
|
1,923
|
|
461
|
|
Total
|
|
|
|
|
|
|
|
6,259
|
|
7,376
|
11.
Intangible
assets
Changes in the Group’s intangible assets
for the six-month period ended December 31, 2019 and for the year
ended June 30, 2019 were as follows:
|
|
|
Goodwill
|
|
Trademarks
|
|
Licenses
|
|
Customer
relations
|
|
Information systems and
software
|
|
Contracts and
others
|
|
Total as of
12.31.19
|
|
Total as of
06.30.19
|
|
Costs
|
|
5,926
|
|
6,219
|
|
8,470
|
|
13,295
|
|
7,404
|
|
7,918
|
|
49,232
|
|
46,865
|
|
Accumulated amortization
|
|
-
|
|
(482)
|
|
(6,443)
|
|
(10,521)
|
|
(4,012)
|
|
(4,870)
|
|
(26,328)
|
|
(22,219)
|
|
Net book amount at the
beginning of the period / year
|
5,926
|
|
5,737
|
|
2,027
|
|
2,774
|
|
3,392
|
|
3,048
|
|
22,904
|
|
24,646
|
|
|
Additions
|
|
-
|
|
-
|
|
-
|
|
-
|
|
690
|
|
1,538
|
|
2,228
|
|
3,289
|
|
Disposals
|
|
-
|
|
-
|
|
-
|
|
-
|
|
(84)
|
|
-
|
|
(84)
|
|
(54)
|
|
Deconsolidation
|
|
(3,057)
|
|
-
|
|
-
|
|
-
|
|
(19)
|
|
-
|
|
(3,076)
|
|
-
|
|
Transfers
|
|
1
|
|
-
|
|
-
|
|
-
|
|
12
|
|
-
|
|
13
|
|
-
|
|
Assets incorporated by business
combination
|
|
-
|
|
-
|
|
-
|
|
-
|
|
-
|
|
-
|
|
-
|
|
28
|
|
Currency translation
adjustment
|
|
2,095
|
|
584
|
|
193
|
|
227
|
|
340
|
|
284
|
|
3,723
|
|
(734)
|
|
Impairment
|
|
-
|
|
-
|
|
-
|
|
-
|
|
-
|
|
-
|
|
-
|
|
(162)
|
|
Amortization charges (i)
|
|
-
|
|
(44)
|
|
(117)
|
|
(527)
|
|
(626)
|
|
(549)
|
|
(1,863)
|
|
(4,109)
|
|
Balances at the end of the
period / year
|
|
4,965
|
|
6,277
|
|
2,103
|
|
2,474
|
|
3,705
|
|
4,321
|
|
23,845
|
|
22,904
|
|
|
|
|
|
|
|
|
|
|
|
|
|
|
|
|
|
|
|
Costs
|
|
4,965
|
|
6,857
|
|
9,192
|
|
19,699
|
|
6,540
|
|
10,187
|
|
57,440
|
|
49,232
|
|
Accumulated amortization
|
|
-
|
|
(580)
|
|
(7,089)
|
|
(17,225)
|
|
(2,835)
|
|
(5,866)
|
|
(33,595)
|
|
(26,328)
|
|
Net book amount at the end of
the period / year
|
|
4,965
|
|
6,277
|
|
2,103
|
|
2,474
|
|
3,705
|
|
4,321
|
|
23,845
|
|
22,904
|
(i)
Amortization charge was recognized in the amount
of Ps. 120 under "Costs", in the amount of Ps. 569 under "General
and administrative expenses" and Ps. 1,174 under "Selling expenses"
as of December 31, 2019 in the Statements of Income (Note
25).
12.
Right-of-use
assets
The Group’s right-of-use assets as of
December 31, 2019 and June 30, 2019 are the
following:
|
|
|
12.31.19
|
|
06.30.19
|
|
Farmland
|
|
2,147
|
|
-
|
|
Offices, shopping malls and other
buildings
|
|
2,939
|
|
-
|
|
Communication networks
|
|
9,027
|
|
-
|
|
Machinery and equipment
|
|
61
|
|
-
|
|
Others
|
|
1,200
|
|
-
|
|
Right-of-use
assets
|
|
15,374
|
|
-
|
|
|
|
|
|
|
|
Non-current
|
|
15,374
|
|
|
|
Total
|
|
15,374
|
|
|
Véase nuestro
informe de fecha 09/11/18
PRICE WATERHOUSE
& Co. S.R.L.
C.P.C.E.C.A.B.A.
T° 1 F° 17
21
Cresud Sociedad
Anónima,
Comercial, Inmobiliaria,
Financiera y Agropecuaria
The depreciation charge of the right-of
use-assets is detailed below:
|
|
|
12.31.19
|
|
12.31.18
|
|
Farmland
|
|
181
|
|
-
|
|
Offices, shopping malls and other
buildings
|
|
1,450
|
|
-
|
|
Communication networks
|
|
472
|
|
-
|
|
Others
|
|
131
|
|
-
|
|
Depreciation charge of
right-of-use assets
|
|
2,234
|
|
-
|
13.
Biological
assets
Changes in the Group’s biological assets
and their allocation to the fair value hierarchy six-month period
ended December 31, 2019 and for the year ended June 30, 2019 were
as follows:
|
|
|
Agricultural
business
|
||||||||||||||
|
|
|
Sown
land-crops
|
|
Sugarcane
fields
|
|
Breeding
cattle and cattle for sale
|
|
Other
cattle
|
|
Others
|
|
Total as
of 12.31.19
|
|
Total as
of 06.30.19
|
||
|
|
|
Level 1
|
|
Level 3
|
|
Level 3
|
|
Level 2
|
|
Level 2
|
|
Level 1
|
|
|
||
|
Net book amount at the
beginning of the period / year
|
123
|
|
1,550
|
|
963
|
|
2,087
|
|
177
|
|
30
|
|
4,930
|
|
3,558
|
|
|
Purchases
|
|
-
|
|
-
|
|
-
|
|
94
|
|
87
|
|
-
|
|
181
|
|
414
|
|
Changes by
transformation
|
|
(96)
|
|
96
|
|
-
|
|
-
|
|
-
|
|
-
|
|
-
|
|
-
|
|
Initial recognition and
changes in the fair value of biological assets
(i)
|
|
-
|
|
195
|
|
1,070
|
|
(84)
|
|
57
|
|
-
|
|
1,238
|
|
2,014
|
|
Decrease due to
harvest
|
|
-
|
|
(2,449)
|
|
(2,386)
|
|
-
|
|
-
|
|
-
|
|
(4,835)
|
|
(8,604)
|
|
Sales
|
|
-
|
|
-
|
|
-
|
|
(653)
|
|
(1)
|
|
-
|
|
(654)
|
|
(625)
|
|
Consumes
|
|
-
|
|
-
|
|
-
|
|
(2)
|
|
(214)
|
|
(3)
|
|
(219)
|
|
(347)
|
|
Costs for the period /
year
|
|
2,531
|
|
684
|
|
1,475
|
|
529
|
|
-
|
|
2
|
|
5,221
|
|
8,575
|
|
Foreign exchange
gain
|
|
15
|
|
25
|
|
80
|
|
48
|
|
-
|
|
-
|
|
168
|
|
(55)
|
|
Balances at the end of the
period / year
|
|
2,573
|
|
101
|
|
1,202
|
|
2,019
|
|
106
|
|
29
|
|
6,030
|
|
4,930
|
|
|
|
-
|
|
|
|
|
|
|
|
|
|
|
|
|
|
-
|
|
Non-current
(Production)
|
|
-
|
|
-
|
|
-
|
|
1,453
|
|
20
|
|
29
|
|
1,502
|
|
1,589
|
|
Current
(Consumable)
|
|
2,573
|
|
101
|
|
1,202
|
|
566
|
|
86
|
|
-
|
|
4,528
|
|
3,341
|
|
Net book amount at the end of
the period / year
|
|
2,573
|
|
101
|
|
1,202
|
|
2,019
|
|
106
|
|
29
|
|
6,030
|
|
4,930
|
(i)
Biological assets with a production cycle of
more than one year (that is, cattle) generated “Initial
recognition and changes in fair value of biological assets”
amounting to Ps. (27) and Ps. 89 for the six-month periods ended
December 31, 2019 and for the fiscal year ended June 30, 2019,
respectively; amounts of Ps. 165 and Ps. (84), was attributable to
price changes, and amounts of Ps. (192) and Ps. 173, was
attributable to physical changes, respectively.
During the six-month period ended December 31,
2019, there were transfers between the fair value hierarchies 1 and
3 of grain seeding (due to the degree of phenological growth of the
crop) for Ps. 96. There were also no reclassifications between
categories thereof.
The fair value less estimated point of sale
costs of agricultural produce at the point of harvest (which have
been harvested during the period) amount to Ps. (4,835) and Ps.
(8,604) for the six-month period ended December 31, 2019 and the
year ended June 30, 2019, respectively.
See information on valuation processes used by
the entity in Note 13 to the Annual Financial
Statements.
As of December 31, 2019, and June 30, 2019, the
better and maximum use of biological assets shall not significantly
differ from the current use.
14.
Inventories
Breakdown of Group’s inventories as of
December 31, 2019 and June 30, 2019 are as
follows:
|
|
|
12.31.19
|
|
06.30.19
|
|
Crops
|
|
924
|
|
2,578
|
|
Materials and supplies
|
|
1,934
|
|
1,256
|
|
Seeds and fodders
|
|
-
|
|
264
|
|
Beef
|
|
230
|
|
131
|
|
Agricultural
inventories
|
|
3,088
|
|
4,229
|
|
Good for resale and supplies
|
|
-
|
|
3
|
|
Telephones and other communication
equipment
|
|
1,242
|
|
1,382
|
|
Others
|
|
26
|
|
23
|
|
Total
inventories
|
|
4,356
|
|
5,637
|
Véase nuestro
informe de fecha 09/11/18
PRICE WATERHOUSE
& Co. S.R.L.
C.P.C.E.C.A.B.A.
T° 1 F° 17
22
Cresud Sociedad
Anónima,
Comercial, Inmobiliaria,
Financiera y Agropecuaria
15.
Financial instruments by
category
Determining
fair values
The present note shows the financial assets and
financial liabilities by category of financial instrument and a
reconciliation to the corresponding line in the Consolidated
Statements of Financial Position, as appropriate. Financial assets
and liabilities measured at fair value are assigned based on their
different levels in the fair value hierarchy. For further
information related to fair value hierarchy see Note 15 to the
Annual Financial Statements.
Financial assets and financial liabilities as of
December 31, 2019 are as follows:
|
|
|
Financial assets at
amortized cost
|
|
Financial assets at
fair value through profit or loss
|
|
Subtotal financial
assets
|
|
Non-financial
assets
|
|
Total
|
||||
|
|
|
|
Level
1
|
|
Level
2
|
|
Level
3
|
|
|
|
||||
|
December 31,
2019
|
|
|
|
|
|
|
|
|
|
|
|
|
|
|
|
Assets as per Statement of
Financial Position
|
|
|
|
|
|
|
|
|
|
|
|
|
|
|
|
Trade and other receivables (excluding the
allowance for doubtful accounts and other receivables) (Note
16)
|
|
45,284
|
|
-
|
|
-
|
|
-
|
|
45,284
|
|
12,400
|
|
57,684
|
|
Investment in financial
assets:
|
|
|
|
|
|
|
|
|
|
|
|
|
|
|
|
- Public companies’
securities
|
|
-
|
|
891
|
|
195
|
|
-
|
|
1,086
|
|
-
|
|
1,086
|
|
- Private companies’
securities
|
|
-
|
|
-
|
|
-
|
|
2,468
|
|
2,468
|
|
-
|
|
2,468
|
|
- Deposits
|
|
573
|
|
50
|
|
-
|
|
-
|
|
623
|
|
-
|
|
623
|
|
- Bonds
|
|
-
|
|
17,448
|
|
1,887
|
|
-
|
|
19,335
|
|
-
|
|
19,335
|
|
- Mutual funds
|
|
-
|
|
8,671
|
|
-
|
|
-
|
|
8,671
|
|
-
|
|
8,671
|
|
-Others
|
|
-
|
|
2,042
|
|
645
|
|
493
|
|
3,180
|
|
-
|
|
3,180
|
|
Derivative financial
instruments:
|
|
|
|
|
|
|
|
|
|
|
|
|
|
|
|
- Crops options
contracts
|
|
-
|
|
-
|
|
-
|
|
-
|
|
-
|
|
-
|
|
-
|
|
- Crops futures
contracts
|
|
-
|
|
31
|
|
-
|
|
-
|
|
31
|
|
-
|
|
31
|
|
- Foreign-currency options
contracts
|
|
-
|
|
45
|
|
-
|
|
-
|
|
45
|
|
-
|
|
45
|
|
- Foreign-currency future
contracts
|
|
-
|
|
68
|
|
38
|
|
-
|
|
106
|
|
-
|
|
106
|
|
- Swaps
|
|
-
|
|
-
|
|
53
|
|
-
|
|
53
|
|
-
|
|
53
|
|
-
Warrants
|
|
-
|
|
-
|
|
-
|
|
82
|
|
82
|
|
-
|
|
82
|
|
- Others
|
|
-
|
|
-
|
|
18
|
|
-
|
|
18
|
|
-
|
|
18
|
|
Restricted assets (i)
|
|
6,435
|
|
-
|
|
-
|
|
-
|
|
6,435
|
|
-
|
|
6,435
|
|
Financial assets held for
sale
|
|
|
|
|
|
|
|
|
|
|
|
|
|
|
|
- Clal
|
|
-
|
|
7,337
|
|
-
|
|
-
|
|
7,337
|
|
-
|
|
7,337
|
|
Cash and cash equivalents (excluding bank
overdrafts):
|
|
|
|
|
|
|
|
|
|
|
|
|
|
|
|
- Cash on hand and at
bank
|
|
17,203
|
|
-
|
|
-
|
|
-
|
|
17,203
|
|
-
|
|
17,203
|
|
- Short-term
investments
|
|
46,962
|
|
3,501
|
|
-
|
|
-
|
|
50,463
|
|
-
|
|
50,463
|
|
Total
assets
|
|
116,457
|
|
40,084
|
|
2,836
|
|
3,043
|
|
162,420
|
|
12,400
|
|
174,820
|
|
|
|
Financial liabilities at
amortized cost
|
|
Financial liabilities at fair
value through profit or loss
|
|
Subtotal financial
liabilities
|
|
Non-financial
liabilities
|
|
Total
|
||||
|
|
|
|
Level
1
|
|
Level
2
|
|
Level
3
|
|
|
|
||||
|
December 31,
2019
|
|
|
|
|
|
|
|
|
|
|
|
|
|
|
|
Liabilities as per Statement
of Financial Position
|
|
|
|
|
|
|
|
|
|
|
|
|
|
|
|
Trade and other payables (Note
18)
|
|
19,957
|
|
-
|
|
-
|
|
-
|
|
19,957
|
|
6,984
|
|
26,941
|
|
Borrowings (excluding finance lease liabilities)
(Note 21)
|
|
343,527
|
|
-
|
|
-
|
|
-
|
|
343,527
|
|
-
|
|
343,527
|
|
Derivative financial
instruments:
|
|
|
|
|
|
|
|
|
|
|
|
|
|
|
|
- Crops options
contracts
|
|
-
|
|
73
|
|
-
|
|
-
|
|
73
|
|
-
|
|
73
|
|
- Crops futures
contracts
|
|
-
|
|
77
|
|
-
|
|
-
|
|
77
|
|
-
|
|
77
|
|
- Foreign-currency options
contracts
|
|
-
|
|
14
|
|
-
|
|
-
|
|
14
|
|
-
|
|
14
|
|
- Foreign-currency
contracts
|
|
-
|
|
1
|
|
51
|
|
-
|
|
52
|
|
-
|
|
52
|
|
- Swaps
|
|
-
|
|
78
|
|
599
|
|
-
|
|
677
|
|
-
|
|
677
|
|
- Forwards
|
|
-
|
|
-
|
|
33
|
|
-
|
|
33
|
|
-
|
|
33
|
|
- Others
|
|
-
|
|
-
|
|
-
|
|
67
|
|
67
|
|
-
|
|
67
|
|
Total
liabilities
|
|
363,484
|
|
243
|
|
683
|
|
67
|
|
364,477
|
|
6,984
|
|
371,461
|
23
Cresud Sociedad
Anónima,
Comercial, Inmobiliaria,
Financiera y Agropecuaria
Financial assets and financial liabilities as of
June 30, 2019 were as follows:
|
|
|
Financial assets at
amortized cost (i)
|
|
Financial assets at
fair value through profit or loss
|
|
Subtotal financial
assets
|
|
Non-financial
assets
|
|
Total
|
||||
|
|
|
|
Level
1
|
|
Level
2
|
|
Level
3
|
|
|
|
||||
|
June 30,
2019
|
|
|
|
|
|
|
|
|
|
|
|
|
|
|
|
Assets as per Statement of
Financial Position
|
|
|
|
|
|
|
|
|
|
|
|
|
|
|
|
Trade and other receivables (excluding the
allowance for doubtful accounts and other receivables) (Note
16)
|
|
43,438
|
|
-
|
|
-
|
|
-
|
|
43,438
|
|
11,925
|
|
55,363
|
|
Investment in financial
assets:
|
|
|
|
|
|
|
|
|
|
|
|
|
|
|
|
- Equity securities in public
companies
|
|
-
|
|
1,203
|
|
174
|
|
-
|
|
1,377
|
|
-
|
|
1,377
|
|
- Equity securities in private
companies
|
|
-
|
|
-
|
|
-
|
|
2,297
|
|
2,297
|
|
-
|
|
2,297
|
|
- Deposits
|
|
4,667
|
|
45
|
|
-
|
|
-
|
|
4,712
|
|
-
|
|
4,712
|
|
- Bonds
|
|
-
|
|
19,746
|
|
1,336
|
|
851
|
|
21,933
|
|
-
|
|
21,933
|
|
- Mutual funds
|
|
-
|
|
9,058
|
|
-
|
|
-
|
|
9,058
|
|
-
|
|
9,058
|
|
- Others
|
|
-
|
|
3,002
|
|
549
|
|
440
|
|
3,991
|
|
-
|
|
3,991
|
|
Derivative financial
instruments:
|
|
|
|
|
|
|
|
|
|
|
|
|
|
|
|
- Crops futures
contracts
|
|
-
|
|
11
|
|
-
|
|
-
|
|
11
|
|
-
|
|
11
|
|
- Swaps
|
|
-
|
|
-
|
|
14
|
|
-
|
|
14
|
|
-
|
|
14
|
|
-
Warrants
|
|
-
|
|
-
|
|
-
|
|
120
|
|
120
|
|
-
|
|
120
|
|
- Crops options
contracts
|
|
-
|
|
40
|
|
-
|
|
-
|
|
40
|
|
-
|
|
40
|
|
- Foreign-currency options
contracts
|
|
-
|
|
38
|
|
-
|
|
-
|
|
38
|
|
-
|
|
38
|
|
- Foreign-currency future
contracts
|
|
-
|
|
2
|
|
36
|
|
-
|
|
38
|
|
-
|
|
38
|
|
- Others
|
|
-
|
|
-
|
|
15
|
|
-
|
|
15
|
|
-
|
|
15
|
|
Restricted assets (ii)
|
|
9,514
|
|
-
|
|
-
|
|
-
|
|
9,514
|
|
-
|
|
9,514
|
|
Financial assets held for
sale
|
|
|
|
|
|
|
|
|
|
|
|
|
|
|
|
- Clal
|
|
-
|
|
19,929
|
|
-
|
|
-
|
|
19,929
|
|
-
|
|
19,929
|
|
Cash and cash equivalents (excluding bank
overdrafts):
|
|
|
|
|
|
|
|
|
|
|
|
|
|
|
|
- Cash on hand and at
bank
|
|
8,928
|
|
-
|
|
-
|
|
-
|
|
8,928
|
|
-
|
|
8,928
|
|
- Short-term
investments
|
|
65,913
|
|
3,776
|
|
-
|
|
-
|
|
69,689
|
|
-
|
|
69,689
|
|
Total
assets
|
|
132,460
|
|
56,850
|
|
2,124
|
|
3,708
|
|
195,142
|
|
11,925
|
|
207,067
|
|
|
|
Financial liabilities at
amortized cost
|
|
Financial liabilities at fair
value through profit or loss
|
|
Subtotal financial
liabilities
|
|
Non-financial
liabilities
|
|
Total
|
||||
|
|
|
|
Level
1
|
|
Level
2
|
|
Level
3
|
|
|
|
||||
|
June 30,
2019
|
|
|
|
|
|
|
|
|
|
|
|
|
|
|
|
Liabilities as per Statement
of Financial Position
|
|
|
|
|
|
|
|
|
|
|
|
|
|
|
|
Trade and other payables (Note
18)
|
|
23,279
|
|
-
|
|
-
|
|
-
|
|
23,279
|
|
7,646
|
|
30,925
|
|
Borrowings (excluding finance lease liabilities)
(Note 21)
|
|
420,622
|
|
-
|
|
-
|
|
-
|
|
420,622
|
|
-
|
|
420,622
|
|
Derivative financial
instruments:
|
|
|
|
|
|
|
|
|
|
|
|
|
|
|
|
- Crops futures
contracts
|
|
-
|
|
91
|
|
-
|
|
-
|
|
91
|
|
-
|
|
91
|
|
- Foreign-currency
contracts
|
|
-
|
|
31
|
|
-
|
|
-
|
|
31
|
|
-
|
|
31
|
|
- Crops options
contracts
|
|
-
|
|
78
|
|
-
|
|
-
|
|
78
|
|
-
|
|
78
|
|
- Swaps
|
|
-
|
|
-
|
|
169
|
|
-
|
|
169
|
|
-
|
|
169
|
|
- Others
|
|
-
|
|
-
|
|
1,097
|
|
60
|
|
1,157
|
|
-
|
|
1,157
|
|
Total
liabilities
|
|
443,901
|
|
200
|
|
1,266
|
|
60
|
|
445,427
|
|
7,646
|
|
453,073
|
(i)
Corresponds to deposits in guarantee and
escrows
The fair value of financial assets and
liabilities at their amortized cost does not differ significantly
from their book value, except for borrowings (Note 21). The fair
value of payables approximates their respective carrying amounts
because, due to their short-term nature, the effect of discounting
is not considered significant. Fair values are based on discounted
cash flows (Level 3).
The valuation models used by the Group for the
measurement of Level 2 and Level 3 instruments are no different
from those used as of June 30, 2019.
As of December 31, 2019, there have been no
changes to the economic or business circumstances affecting the
fair value of the financial assets and liabilities of the
Group.
V
24
Cresud Sociedad
Anónima,
Comercial, Inmobiliaria,
Financiera y Agropecuaria
The Group uses a range of valuation models for
the measurement of Level 2 and Level 3 instruments, details of
which may be obtained from the following table. When no quoted
prices are available in an active market, fair values (particularly
with derivatives) are based on recognized valuation
methods.
|
Description
|
|
Pricing
model / method
|
|
Parameters
|
|
Fair
value hierarchy
|
|
Range
|
|
Foreign currency
put
|
|
Theoretical
price
|
|
Underlying price (Market
price) and currency volatility (historical)
|
|
Level 2
|
|
-
|
|
Promissory
note
|
|
Discounted cash flows -
Theoretical price
|
|
Underlying asset price
(Market price); share price volatility (historical) and market
interest rate (Libor rate curve).
|
|
Level 3
|
|
Underlying asset price 10.5
to 11.5
Share price volatility 58%
to 78%
Market
interest-rate
1.5% to
3%
|
|
Investments in financial
assets - Other private companies’
securities
|
|
Cash flow / NAV -
Theoretical price
|
|
Projected revenue discounted at the discount
rate /
The value is calculated in accordance with
shares in the equity funds on the basis of their Financial
Statements, based on fair value or investments
assessments.
|
|
Level 3
|
|
1 - 3.5
|
|
Investments in financial
assets - Others
|
|
Discounted cash flow -
Theoretical price
|
|
Projected revenue discounted at the discount
rate /
The value is calculated in accordance with
shares in the equity funds on the basis of their Financial
Statements, based on fair value or investment
assessments.
|
|
Level 3
|
|
1 - 3.5
|
|
Derivative financial
instruments – Forwards
|
|
Theoretical
price
|
|
Underlying asset price and
volatility
|
|
Level 2 and 3
|
|
-
|
The following table presents the changes in
Level 3 instruments as of December 31, 2019 and June 30,
2019:
|
|
|
Derivative
financial instruments – Others
|
|
Investments
in financial assets - Private companies
|
|
Investments
in financial assets - Others
|
|
Derivative
financial instruments – Warrants
|
|
Total
as of 12.31.19
|
|
Total
as of 06.30.19
|
|
Balances
at beginning of the period / year
|
|
(60)
|
|
2,297
|
|
1,291
|
|
120
|
|
3,648
|
|
4,058
|
|
Additions and
acquisitions
|
|
-
|
|
15
|
|
-
|
|
-
|
|
15
|
|
151
|
|
Transfer to level
1
|
|
-
|
|
-
|
|
-
|
|
(3)
|
|
(3)
|
|
52
|
|
Currency translation
adjustment
|
|
(7)
|
|
200
|
|
61
|
|
(20)
|
|
234
|
|
(67)
|
|
Write
off
|
|
-
|
|
-
|
|
(851)
|
|
-
|
|
(851)
|
|
-
|
|
Gain / (loss) for the
period / year (i)
|
|
-
|
|
(44)
|
|
(8)
|
|
(15)
|
|
(67)
|
|
(546)
|
|
Balances
at the end of the period / year
|
|
(67)
|
|
2,468
|
|
493
|
|
82
|
|
2,976
|
|
3,648
|
(i) Included within “Financial results,
net” in the Statements of Income.
16.
Trade and other
receivables
Group’s trade and other receivables as of
December 31, 2019 and June 30, 2019 are as
follows:
|
|
|
12.31.19
|
|
06.30.19
|
|
Trade, leases and services
receivable
|
|
38,553
|
|
37,673
|
|
Less: allowance for doubtful
accounts
|
|
(2,802)
|
|
(2,382)
|
|
Total trade
receivables
|
|
35,751
|
|
35,291
|
|
Prepayments
|
|
7,586
|
|
7,450
|
|
Borrowings, deposits and other debit
balances
|
|
4,709
|
|
3,690
|
|
Guarantee deposits
|
|
2
|
|
3
|
|
Tax receivables
|
|
1,485
|
|
1,437
|
|
Others
|
|
5,349
|
|
5,110
|
|
Total other
receivables
|
|
19,131
|
|
17,690
|
|
Total trade and other
receivables
|
|
54,882
|
|
52,981
|
|
|
|
|
|
|
|
Non-current
|
|
20,908
|
|
19,130
|
|
Current
|
|
33,974
|
|
33,851
|
|
Total
|
|
54,882
|
|
52,981
|
The fair value of current trade and other
receivables approximate their respective carrying amounts due to
their short-term nature, as the impact of discounting is not
considered significant. Fair values are based on discounted cash
flows (Level 3).
Véase nuestro
informe de fecha 09/11/18
PRICE WATERHOUSE
& Co. S.R.L.
C.P.C.E.C.A.B.A.
T° 1 F° 17
25
Cresud Sociedad
Anónima,
Comercial, Inmobiliaria,
Financiera y Agropecuaria
Movements on the Group’s allowance for
doubtful accounts were as follows:
|
|
|
12.31.19
|
|
06.30.19
|
|
Beginning of the period /
year
|
|
2,382
|
|
1,638
|
|
Adjustments previous periods (IFRS
9)
|
|
-
|
|
171
|
|
Additions (i)
|
|
377
|
|
710
|
|
Recoveries (i)
|
|
(23)
|
|
(82)
|
|
Currency translation
adjustment
|
|
548
|
|
570
|
|
Deconsolidation
|
|
(17)
|
|
-
|
|
Receivables written off during the period / year
as uncollectable
|
|
(352)
|
|
(415)
|
|
Inflation adjustment
|
|
(96)
|
|
(210)
|
|
Transfers from / to assets avaliable for
sale
|
|
(17)
|
|
-
|
|
End of the period /
year
|
|
2,802
|
|
2,382
|
(i)
The
creation and release of the allowance for doubtful accounts have
been included in “Selling expenses” in the Statement of
Income (Note 25).
17.
Cash flow
information
Following is a detailed description of cash
flows generated by the Group’s operations for the six-month
periods ended December 31, 2019 and 2018:
|
|
|
Note
|
|
12.31.19
|
|
12.31.18
|
|
Profit /
(Loss) for the period
|
|
|
|
1,673
|
|
(8,627)
|
|
Profit
from discontinued operations
|
|
|
|
(16,639)
|
|
(3,042)
|
|
Adjustments
for:
|
|
|
|
|
|
|
|
Income
tax
|
|
22
|
|
3,090
|
|
(3,375)
|
|
Amortization and
depreciation
|
|
25
|
|
6,970
|
|
4,679
|
|
Net (gain) / loss from fair
value adjustment of investment properties
|
|
|
|
(3,623)
|
|
9,186
|
|
Share-based
compensation
|
|
|
|
58
|
|
29
|
|
Changes in the fair value
of investments in financial assets
|
|
|
|
(322)
|
|
-
|
|
Gain from disposal of
intangible assets
|
|
|
|
-
|
|
(12)
|
|
Gain from disposal of
subsidiary and associates
|
|
|
|
-
|
|
(1,069)
|
|
Gain from disposal of
trading properties
|
|
|
|
-
|
|
(455)
|
|
Impairment of other
assets
|
|
|
|
1,513
|
|
236
|
|
Impairment in associates
and joint ventures
|
|
|
|
-
|
|
200
|
|
Financial results,
net
|
|
|
|
20,632
|
|
8,717
|
|
Provisions and
allowances
|
|
|
|
343
|
|
627
|
|
Share of loss / (profit) of
associates and joint ventures
|
|
|
|
1,502
|
|
1,230
|
|
Loss from revaluation of
receivables arising from the sale of farmland
|
|
|
|
-
|
|
2
|
|
(Gain) / Loss from
repurchase of Non-convertible Notes
|
|
|
|
1
|
|
(81)
|
|
Changes in net realizable
value of agricultural products after harvest
|
|
|
|
(422)
|
|
(52)
|
|
Unrealized initial
recognition and changes in fair value of biological assets and
agricultural products at the point of harvest
|
|
|
|
(1,405)
|
|
(670)
|
|
Unrealized gain from
derivative financial instruments
|
|
|
|
(212)
|
|
(45)
|
|
Other operating
results
|
|
|
|
23
|
|
2
|
|
Gain from disposal of
farmlands
|
|
|
|
(299)
|
|
(81)
|
|
|
|
|
|
|
|
|
|
Changes
in operating assets and liabilities:
|
|
|
|
|
|
|
|
Decrease in
inventories
|
|
|
|
1,339
|
|
505
|
|
Decrease in trading
properties
|
|
|
|
1,345
|
|
106
|
|
Decrease / (Increase) in
biological assets
|
|
|
|
1,038
|
|
(932)
|
|
Increase in
restricted assets
|
|
|
|
-
|
|
(180)
|
|
Decrease in trade and other
receivables
|
|
|
|
4,090
|
|
1,144
|
|
Decrease in trade and other
payables
|
|
|
|
(3,072)
|
|
(2,185)
|
|
Increase / (Decrease) in
salaries and social security liabilities
|
|
|
|
554
|
|
(447)
|
|
Decrease in
provisions
|
|
|
|
(465)
|
|
(97)
|
|
Increase in lease
liabilities
|
|
|
|
(57)
|
|
-
|
|
Net variation in derivative
financial instruments
|
|
|
|
51
|
|
160
|
|
|
|
|
|
|
|
|
|
Net cash
generated by continuing operating activities before income tax
paid
|
|
|
|
17,706
|
|
5,473
|
|
Net cash
generated by discontinued operating activities before income tax
paid
|
|
|
|
2,105
|
|
2,931
|
|
Net cash
generated by operating activities before income tax
paid
|
|
|
|
19,811
|
|
8,404
|
Véase nuestro
informe de fecha26
Cresud Sociedad
Anónima,
Comercial, Inmobiliaria,
Financiera y Agropecuaria
The following table presents a detail of
significant non-cash transactions occurred in the six-month periods
ended December 31, 2019 and 2018:
|
|
|
|
|
12.31.19
|
|
12.31.18
|
|
Dividends not
collected
|
|
|
|
(28)
|
|
(6)
|
|
Increase in investment
properties through an increase in borrowings
|
|
|
|
-
|
|
35
|
|
Increase in participation
in subsidiaries, associates and joint ventures due to transient
conversion differences
|
|
|
|
(623)
|
|
(256)
|
|
Increase in trade and other
receivables through a decrease in investments in associates and
joint ventures
|
|
|
|
-
|
|
9
|
|
Increase in property, plant
and equipment through an increase in trade and other
payables
|
|
|
|
447
|
|
465
|
|
Increase in investment
properties through an increase in trade and other
payables
|
|
|
|
483
|
|
6
|
|
Increase in investments in
associates and joint ventures through a decrease in
borrowings
|
|
|
|
-
|
|
8
|
|
Increase in intangible
assets through an increase in trade and other
payables
|
|
|
|
-
|
|
270
|
|
Increase of properties for
sale through an increase in borrowings
|
|
|
|
64
|
|
43
|
|
Increase in investment
properties through a decrease in trade and other
receivables
|
|
|
|
-
|
|
267
|
|
Increase of trading
properties for sale through a decrease in investment
properties
|
|
|
|
-
|
|
852
|
|
Distribution of dividends
at non-controlling interest pending payment
|
|
|
|
1,012
|
|
-
|
|
Increase in investments in
associates and joint ventures through a decrease in investments in
financial assets
|
|
|
|
723
|
|
-
|
|
Decrease of investment
properties through the acquisition of investments in
associates
|
|
|
|
1,192
|
|
-
|
|
Increase in investment
properties through a decrease in financial
assets
|
|
|
|
245
|
|
-
|
|
Increase in intangible
assets through an increase in trade and other
payables
|
|
|
|
511
|
|
-
|
|
Increase in investments in
financial assets through a decrease in investments in associates
and joint ventures
|
|
|
|
19
|
|
-
|
|
Decrease in borrowings
through a decrease in financial assets
|
|
|
|
2,161
|
|
-
|
|
Increase of rights of use
through a decrease of property, plant and
equipment
|
|
|
|
19
|
|
-
|
|
Distribution of dividends
in shares
|
|
|
|
519
|
|
-
|
|
Increase in investments in
associates and joint ventures from an increase in trade and other
payables
|
|
|
|
61
|
|
-
|
18.
Trade and other
payables
Group’s trade and other payables as of
December 31, 2019 and June 30, 2019 were as
follows:
|
|
|
12.31.19
|
|
06.30.19
|
|
Trade payables
|
|
15,274
|
|
17,318
|
|
Sales, rental and services payments received in
advance
|
|
1,931
|
|
5,641
|
|
Construction obligations
|
|
629
|
|
1,171
|
|
Accrued invoices
|
|
1,513
|
|
1,501
|
|
Deferred income
|
|
83
|
|
-
|
|
Admission fees
|
|
1,077
|
|
-
|
|
Deposits in guarantee
|
|
157
|
|
-
|
|
Total trade
payables
|
|
20,664
|
|
25,631
|
|
Dividends payable to non-controlling
shareholders
|
|
199
|
|
501
|
|
Taxes payable
|
|
961
|
|
1,193
|
|
Construction obligations
|
|
1,015
|
|
1,277
|
|
Others
|
|
4,102
|
|
2,323
|
|
Total other
payables
|
|
6,277
|
|
5,294
|
|
Total trade and other
payables
|
|
26,941
|
|
30,925
|
|
|
|
|
|
|
|
Non-current
|
|
2,094
|
|
2,491
|
|
Current
|
|
24,847
|
|
28,434
|
|
Total
|
|
26,941
|
|
30,925
|
19.
Equity
Shareholders’
meeting
On October 30, 2019, the annual meeting of
shareholders of Cresud was held, which has approved:
(i) absorb
accumulated losses as of June 30, 2019 with the special reserve and
the special reserve RG 609/12 and (ii) approve the distribution of
up to 13,000,000 treasury shares ratably according to the
shareholders’ shareholding interests.
On the other hand, resolved among other points,
approve:
-
a
stock capital increase for up to a par value of Ps.180,000,000,
through the issuance of up to 180,000,000 common book-entry shares
of Ps.1 par value each and entitled to one vote per share,
equivalent to 33.49% of the current stock
capital,
-
implementation of incentive plan for employees,
management and directors, without issue premium, for up to 1% of
the stock capital in effect as of the time of execution of the
plan.
- Delegate to the Board the implementation of the
measures mentioned above.
Véase nuestro
informe de fecha 09/11/18
PRICE WATERHOUSE
& Co. S.R.L.
C.P.C.E.C.A.B.A.
T° 1 F° 17
27
Cresud Sociedad
Anónima,
Comercial, Inmobiliaria,
Financiera y Agropecuaria
Buyback plan of
Cresud shares
On August 21, 2019, the Board of Directors of
Cresud approved a new repurchase of the securities issued by the
Company and established the terms and conditions for the
acquisition of own shares issued by the Company, under the terms of
Article 64 of the Law Nº 26,831 and CNV regulations, for up to
a maximum amount of Ps. 300 million and up to 10% of the share
capital in the form of ordinary shares or ADS, up to a daily limit
of up to 25% of the average volume of transactions Daily that the
shares of the Company have experienced, jointly in the markets that
it quotes, during the previous 90 business days, and a maximum of
up to US $ 10.00 per ADS and up to a maximum value in pesos
equivalent to the maximum price per ADS divided by 10 and
multiplied by the value of the quotation at the buyer's exchange
rate of the Banco de la Nación Argentina in force at the time
of each purchase. Likewise, the repurchase term was set, up to 120
days, beginning the day following the date of publication of the
information in the Daily Bulletin of the Buenos Aires Stock
Exchange.
As of the date of issuance of these financial
statements, the Company has not repurchased shares through this
plan.
20.
Provisions
The table below shows the movements in the
Group's provisions categorized by type:
|
|
|
Legal claims
(i)
|
|
Investments in
associates and joint ventures (ii)
|
|
Sited dismantling and
remediation
|
|
Other
provisions
|
|
Total as of
12.31.19
|
|
Total as of
06.30.19
|
|
Beginning of period /
year
|
|
2,139
|
|
7,623
|
|
300
|
|
2,223
|
|
12,285
|
|
9,055
|
|
Additions
|
|
100
|
|
-
|
|
29
|
|
-
|
|
129
|
|
834
|
|
Transfers
|
|
(3)
|
|
-
|
|
-
|
|
-
|
|
(3)
|
|
-
|
|
Inflation
adjustment
|
|
(45)
|
|
-
|
|
-
|
|
-
|
|
(45)
|
|
(93)
|
|
Recovery
|
|
-
|
|
-
|
|
-
|
|
-
|
|
-
|
|
(98)
|
|
Share of loss in associates and joint
ventures
|
|
-
|
|
372
|
|
-
|
|
-
|
|
372
|
|
3,286
|
|
Currency translation
adjustment
|
|
179
|
|
917
|
|
35
|
|
41
|
|
1,172
|
|
(387)
|
|
Used during the period /
year
|
|
(206)
|
|
-
|
|
-
|
|
(144)
|
|
(350)
|
|
(312)
|
|
End of period /
year
|
|
2,164
|
|
8,912
|
|
364
|
|
2,120
|
|
13,560
|
|
12,285
|
|
|
|
|
|
|
|
|
|
|
|
|
|
|
|
Non-current
|
|
|
|
|
|
|
|
|
|
11,474
|
|
10,105
|
|
Current
|
|
|
|
|
|
|
|
|
|
2,086
|
|
2,180
|
|
Total
|
|
|
|
|
|
|
|
|
|
13,560
|
|
12,285
|
(i)
Additions and recoveries are included in "Other
operating results, net".
(ii)
Corresponds to investments in New Lipstick and
Puerto Retiro, companies that have negative net worth. The
increases and recoveries are included in "Share of profit of
associates and joint ventures ".
There were no significant changes to the
processes mentioned in Note 20 to the Annual Financial
Statements.
21.
Borrowings
The breakdown and fair value of the
Group’s borrowings as of December 31, 2019 and June 30, 2019
was as follows:
|
|
|
Book
value
|
|
|
Fair
value
|
||||
|
|
|
12.31.19
|
|
06.30.19
|
|
|
12.31.19
|
|
06.30.19
|
|
NCN
|
|
281,109
|
|
348,218
|
|
|
239,234
|
|
343,056
|
|
Bank loans
|
|
56,531
|
|
65,268
|
|
|
54,160
|
|
63,945
|
|
Bank overdrafts
|
|
4,663
|
|
1,259
|
|
|
4,663
|
|
1,259
|
|
Other borrowings (i)
|
|
1,224
|
|
5,877
|
|
|
1,224
|
|
8,132
|
|
Total borrowings
(ii)
|
|
343,527
|
|
420,622
|
|
|
299,281
|
|
416,392
|
|
|
|
|
|
|
|
|
|
|
|
|
Non-current
|
|
267,417
|
|
349,857
|
|
|
|
|
|
|
Current
|
|
76,110
|
|
70,765
|
|
|
|
|
|
|
Total
|
|
343,527
|
|
420,622
|
|
|
|
|
|
(i)
Includes finance leases in the amount of Ps. 393
as of June 30, 2019.
(ii)
Includes Ps. 286,104 and Ps. 389,956 as of
December 31, 2019 and June 30, 2019, respectively, corresponding to
the Operations Center in Israel.
V
28
Cresud Sociedad
Anónima,
Comercial, Inmobiliaria,
Financiera y Agropecuaria
The following table describes the Group’s
issuance of debt during the present period:
|
Entity
|
Class
|
Issuance
/ expansion date
|
Amount
in original currency
|
Maturity
date
|
Interest
rate
|
Principal
payment
|
Interest
payment
|
|
|
Cresud
|
Class
XXV
|
Jul-19
|
USD
59.5
|
07/03/2021
|
9.00%
n.a
|
At
expiration
|
biannual
|
|
|
IRSA
|
Class I tranche
2
|
Aug-19
|
USD 85
|
11/15/2020
|
10.00%
e.a..
|
At
expiration
|
quarterly
|
(1)
|
|
IRSA
|
Class
II
|
Aug-19
|
CLP 31
(2)
|
08/06/2020
|
10.00%
e.a..
|
At
expiration
|
quarterly
|
|
|
IDBD
|
Serie
15
|
Nov-19
|
NIS 237
|
06/30/2022
|
4.70%
e.a.
|
2
payments
|
quarterly
|
|
(1)
Corresponds to an expansion of the
series.
(2)
Equivalent to USD 45 as of the issuance
date.
22.
Taxation
The details of the Group’s income tax, is
as follows:
|
|
|
12.31.19
|
|
12.31.18
|
|
Current income
tax
|
|
(240)
|
|
(786)
|
|
Deferred income
tax
|
|
(2,717)
|
|
4,161
|
|
Minimum Presumed Income
Tax
|
|
(133)
|
|
-
|
|
Income
tax from continuing operations
|
|
(3,090)
|
|
3,375
|
Below is a reconciliation between income tax
recognized and the amount which would result from applying the
prevailing tax rate on profit before income tax for the six-month
periods ended December 31, 2019 and 2018:
|
|
|
12.31.19
|
|
12.31.18
|
|
Tax calculated at the tax
rates applicable to profits in the respective
countries
|
|
3,283
|
|
4,504
|
|
Permanent
differences:
|
|
|
|
|
|
Share of (loss) / profit of
joint ventures and associates
|
|
(458)
|
|
(293)
|
|
Tax rate
differential
|
|
804
|
|
456
|
|
Provision for
unrecoverability of tax loss carry-forwards / Unrecognized tax loss
carry-forwards
|
|
(3,291)
|
|
(1,929)
|
|
Changes in fair value of
financial instruments
|
|
(626)
|
|
143
|
|
Non-taxable profit,
non-deductible expenses and others
|
|
(1,609)
|
|
124
|
|
Tax inflation
adjustment
|
|
(3,677)
|
|
-
|
|
Fiscal
transparency
|
|
86
|
|
(69)
|
|
Permanent inflation
adjustment
|
|
2,398
|
|
439
|
|
Income
tax from continuing operations
|
|
(3,090)
|
|
3,375
|
The gross movement in the deferred income tax
account is as follows:
|
|
|
12.31.19
|
|
06.30.19
|
|
Beginning
of period / year
|
|
(49,667)
|
|
(50,489)
|
|
Deconsolidation
|
|
16,447
|
|
-
|
|
Use of tax
losses
|
|
(47)
|
|
-
|
|
Currency translation
adjustment
|
|
(1,767)
|
|
1,652
|
|
Revaluation
surplus
|
|
-
|
|
(887)
|
|
Reserve for changes of
non-controlling interest
|
|
-
|
|
310
|
|
Charged to the Statement of
Income
|
|
(2,717)
|
|
(253)
|
|
End of
the period / year
|
|
(37,751)
|
|
(49,667)
|
|
|
|
|
|
|
|
Deferred income tax
assets
|
|
623
|
|
681
|
|
Deferred income tax
liabilities
|
|
(38,374)
|
|
(50,348)
|
|
Deferred
income tax liabilities, net
|
|
(37,751)
|
|
(49,667)
|
Tax
law modifications in Argentina
Law No. 27,541 of social solidarity and
productive recovery, published on December 23, 2019 introduced
certain amendments to different taxes and the creation of the Tax
for an Inclusive and Selfless Argentina (PAIS).
The main modifications affecting the Group in
relation to income tax are the following:
1)
In the first and second fiscal year
beginning after January 1, 2018 (namely, for the Group’s
fiscal years beginning on July 1, 2019 and 2020), the gain or loss
resulting from tax inflation adjustment will be charged by one
sixth in the determination exercise and the remaining five sixths
in the following fiscal years;
2)
The
tax rate applicable to companies for the third fiscal year
beginning after January 1, 2018 was increased from 25% to 30%
(namely, for the Group’s fiscal years beginning on July 1,
2019)
29
Cresud Sociedad
Anónima,
Comercial, Inmobiliaria,
Financiera y Agropecuaria
23.
Revenues
|
|
|
12.31.19
|
|
12.31.18
|
|
Beef
|
|
3,136
|
|
2,504
|
|
Crops
|
|
5,289
|
|
2,451
|
|
Sugarcane
|
|
2,180
|
|
1,672
|
|
Cattle
|
|
493
|
|
256
|
|
Supplies
|
|
603
|
|
355
|
|
Consignment
|
|
194
|
|
442
|
|
Advertising and brokerage
fees
|
|
315
|
|
243
|
|
Agricultural rental and
other services
|
|
77
|
|
64
|
|
Other
|
|
98
|
|
89
|
|
Income
from sales and services from agricultural
business
|
|
12,385
|
|
8,076
|
|
Trading properties and
developments
|
|
3,190
|
|
3,541
|
|
Communication
services
|
|
20,831
|
|
18,330
|
|
Sale of communication
equipment
|
|
6,763
|
|
5,688
|
|
Rental and
services
|
|
9,826
|
|
10,277
|
|
Hotel operations, tourism
services and others
|
|
2,163
|
|
1,883
|
|
Income
from sales and services from urban properties and investment
business
|
|
42,773
|
|
39,719
|
|
Total
revenues
|
|
55,158
|
|
47,795
|
24.
Costs
|
|
|
12.31.19
|
|
12.31.18
|
|
Other operative
costs
|
|
12
|
|
15
|
|
Cost of
property operations
|
|
12
|
|
15
|
|
Beef
|
|
2,512
|
|
2,170
|
|
Crops
|
|
4,348
|
|
2,305
|
|
Sugarcane
|
|
2,039
|
|
1,356
|
|
Cattle
|
|
654
|
|
339
|
|
Supplies
|
|
505
|
|
276
|
|
Consignment
|
|
91
|
|
45
|
|
Advertising and brokerage
fees
|
|
186
|
|
166
|
|
Agricultural rental and
other services
|
|
222
|
|
58
|
|
Others
|
|
-
|
|
111
|
|
Cost of
sales and services from agricultural business
|
|
10,557
|
|
6,826
|
|
Trading properties and
developments
|
|
2,420
|
|
2,838
|
|
Communication
services
|
|
14,908
|
|
13,427
|
|
Sale of communication
equipment
|
|
4,976
|
|
4,063
|
|
Rental and
services
|
|
3,203
|
|
3,343
|
|
Hotel operations, tourism
services and others
|
|
956
|
|
1,112
|
|
Cost of
sales and services from sales and services from urban properties
and investment business
|
|
26,463
|
|
24,783
|
|
Total
costs
|
|
37,032
|
|
31,624
|
25.
Expenses by
nature
The Group discloses expenses in the statements
of income by function as part of the line items
“Costs”, “General and administrative
expenses” and “Selling expenses”. The following
table provides additional disclosures regarding expenses by nature
and their relationship to the function within the
Group.
|
|
|
Production
costs
|
|
Costs
(i)
|
|
General and
administrative expenses
|
|
Selling
expenses
|
|
Total as of
12.31.19
|
|
Total as of
12.31.18
|
|
|
|
|
|
|
|
|
|
|
|
|
|
|
|
Cost of sale of goods and
services
|
|
-
|
|
7,627
|
|
-
|
|
-
|
|
7,627
|
|
7,021
|
|
Supplies and labors
|
|
3,796
|
|
2,698
|
|
1
|
|
32
|
|
6,527
|
|
5,972
|
|
Change in agricultural products and biological
assets
|
|
-
|
|
5,677
|
|
-
|
|
-
|
|
5,677
|
|
3,268
|
|
Salaries, social security costs and other
personnel expenses
|
|
269
|
|
3,150
|
|
2,124
|
|
2,357
|
|
7,900
|
|
8,217
|
|
Depreciation and
amortization
|
|
547
|
|
4,443
|
|
1,151
|
|
1,376
|
|
7,517
|
|
4,923
|
|
Fees and payments for
services
|
|
13
|
|
2,485
|
|
874
|
|
59
|
|
3,431
|
|
4,195
|
|
Maintenance, security, cleaning, repairs and
others
|
|
35
|
|
2,027
|
|
292
|
|
182
|
|
2,536
|
|
2,532
|
|
Advertising and other selling
expenses
|
|
-
|
|
295
|
|
6
|
|
1,092
|
|
1,393
|
|
1,362
|
|
Taxes, rates and
contributions
|
|
21
|
|
312
|
|
60
|
|
621
|
|
1,014
|
|
947
|
|
Interaction and roaming
expenses
|
|
-
|
|
2,950
|
|
-
|
|
-
|
|
2,950
|
|
2,572
|
|
Fees to other operators
|
|
-
|
|
4,274
|
|
-
|
|
-
|
|
4,274
|
|
3,578
|
|
Director's fees
|
|
-
|
|
-
|
|
411
|
|
-
|
|
411
|
|
478
|
|
Leases and service charges
|
|
3
|
|
72
|
|
15
|
|
10
|
|
100
|
|
267
|
|
Allowance for doubtful accounts,
net
|
|
-
|
|
5
|
|
-
|
|
354
|
|
359
|
|
396
|
|
Freights
|
|
38
|
|
39
|
|
-
|
|
630
|
|
707
|
|
293
|
|
Bank expenses
|
|
-
|
|
3
|
|
47
|
|
1
|
|
51
|
|
92
|
|
Conditioning and clearance
|
|
-
|
|
-
|
|
-
|
|
106
|
|
106
|
|
54
|
|
Travel, library expenses and
stationery
|
|
19
|
|
27
|
|
39
|
|
14
|
|
99
|
|
38
|
|
Other expenses
|
|
480
|
|
948
|
|
281
|
|
231
|
|
1,940
|
|
2,199
|
|
Total as of
12.31.19
|
|
5,221
|
|
37,032
|
|
5,301
|
|
7,065
|
|
54,619
|
|
|
|
Total as of
12.31.18
|
|
5,407
|
|
31,624
|
|
5,331
|
|
6,042
|
|
-
|
|
48,404
|
(i)
Includes Ps. 12 and Ps. 15 of other agricultural
operating costs as of December 31, 2019 and 2018,
respectively.
Véase nuestro
informe de fecha 09/11/18
PRICE WATERHOUSE
& Co. S.R.L.
C.P.C.E.C.A.B.A.
T° 1 F° 17
30
Cresud Sociedad
Anónima,
Comercial, Inmobiliaria,
Financiera y Agropecuaria
26.
Other operating results,
net
|
|
|
12.31.19
|
|
12.31.18
|
|
Gain from commodity
derivative financial instruments
|
|
107
|
|
270
|
|
Gain from disposal of
subsidiaries and associates (i)
|
|
(6)
|
|
1,069
|
|
Impairment of associates
and joint ventures
|
|
(1,621)
|
|
(200)
|
|
Donations
|
|
(96)
|
|
(64)
|
|
Lawsuits and other
contingencies
|
|
(67)
|
|
(38)
|
|
Interest earned on
operating assets
|
|
403
|
|
402
|
|
Others
(ii)
|
|
(1,122)
|
|
(221)
|
|
Total
other operating results, net
|
|
(2,402)
|
|
1,218
|
(i)
As of
December 31, 2019 and 2018 includes the result from the sale of the
Group’s equity interest in Cyber Secdo and Rimon,
respectively.
(ii)
As of
December 31, 2019, includes Ps. 970 of the Cellcom voluntary
retirement plan
27.
Financial results,
net
|
|
|
12.31.19
|
|
12.31.18
|
|
Financial
income
|
|
|
|
|
|
Interest
income
|
|
466
|
|
473
|
|
Dividends
income
|
|
75
|
|
66
|
|
Other financial
income
|
|
17
|
|
226
|
|
Total
financial income
|
|
558
|
|
765
|
|
Financial
costs
|
|
|
|
|
|
Interest
expenses
|
|
(11,416)
|
|
(10,792)
|
|
Result for debt
swap
|
|
(4)
|
|
-
|
|
Other financial
costs
|
|
(679)
|
|
(454)
|
|
Total
financial costs
|
|
(12,099)
|
|
(11,246)
|
|
Capitalized finance
costs
|
|
64
|
|
84
|
|
Total
finance costs
|
|
(12,035)
|
|
(11,162)
|
|
Other
financial results:
|
|
|
|
|
|
Foreign exchange,
net
|
|
(7,681)
|
|
(2,859)
|
|
Fair value gains of
financial assets and liabilities at fair value through profit or
loss
|
|
(2,703)
|
|
1,533
|
|
Gain / (Loss) from
repurchase of Non-convertible notes
|
|
2,505
|
|
81
|
|
(Loss) / Gain from
derivative financial instruments (except
commodities)
|
|
(93)
|
|
338
|
|
Total
other financial results
|
|
(7,972)
|
|
(907)
|
|
Inflation
adjustment
|
|
124
|
|
(181)
|
|
Total
financial results, net
|
|
(19,325)
|
|
(11,485)
|
28.
Related party
transactions
The following is a summary
of the balances with related parties as of December 31, 2019 and
June 30, 2019:
|
Item
|
|
12.31.19
|
|
06.30.19
|
|
Trade and other
receivables
|
|
1,778
|
|
1,531
|
|
Investments in financial
assets
|
|
-
|
|
209
|
|
Trade and other
payables
|
|
(185)
|
|
(308)
|
|
Borrowings
|
|
(73)
|
|
(65)
|
|
Total
|
|
1,520
|
|
1,367
|
Véase nuestro
informe de fecha 09/11/18
PRICE WATERHOUSE
& Co. S.R.L.
C.P.C.E.C.A.B.A.
T° 1 F° 17
31
Cresud Sociedad
Anónima,
Comercial, Inmobiliaria,
Financiera y Agropecuaria
|
Related
party
|
|
12.31.19
|
|
06.30.19
|
|
Description
of transaction
|
|
Rubro
|
|
Agro Uranga
S.A.
|
|
4
|
|
11
|
|
Sale of goods and / or
services receivable
|
|
Trade and other
receivables
|
|
Condor
|
|
-
|
|
209
|
|
Public companies'
securities
|
|
Investments in financial
assets
|
|
|
|
-
|
|
19
|
|
Dividends
receivable
|
|
Trade and other
receivables
|
|
Cresca
S.A.
|
|
(20)
|
|
-
|
|
Other
liabilities
|
|
Trade and other
payables
|
|
New Lipstick
LLC
|
|
14
|
|
13
|
|
Reimbursement of expenses
receivable
|
|
Trade and other
receivables
|
|
|
|
(64)
|
|
(55)
|
|
Loans
payable
|
|
Borrowings
|
|
|
|
1,253
|
|
1,107
|
|
Loans
granted
|
|
Trade and other
receivables
|
|
Other associates and joint
ventures (i)
|
|
11
|
|
14
|
|
Leases and/or rights of use
receivable
|
|
Trade and other
receivables
|
|
|
|
204
|
|
-
|
|
Dividends
receivables
|
|
Trade and other
receivables
|
|
|
|
5
|
|
-
|
|
Management fees
receivable
|
|
Trade and other
receivables
|
|
|
|
(20)
|
|
-
|
|
Purchase of goods and / or
services payable
|
|
Trade and other
payables
|
|
|
|
-
|
|
1
|
|
Shared-based compensation
receivable
|
|
Trade and other
receivables
|
|
|
|
-
|
|
1
|
|
Loans
granted
|
|
Trade and other
receivables
|
|
|
|
(9)
|
|
(10)
|
|
Loans
payable
|
|
Borrowings
|
|
|
|
-
|
|
10
|
|
Reimbursement of expenses
receivable
|
|
Trade and other
receivables
|
|
|
|
(2)
|
|
(5)
|
|
Reimbursement of expenses
payable
|
|
Trade and other
payables
|
|
Total
associates and joint ventures
|
|
1,376
|
|
1,315
|
|
|
|
|
|
CAMSA and its
subsidiaries
|
|
1
|
|
38
|
|
Reimbursement of
expenses
receivable
|
|
Trade and other
payables
|
|
Taaman
|
|
-
|
|
(15)
|
|
Leases and/or rights of use
receivable
|
|
Trade and other
payables
|
|
Other related parties
(ii)
|
|
-
|
|
(81)
|
|
Other
liabilities
|
|
Trade and other
payables
|
|
|
|
-
|
|
3
|
|
Other
receivables
|
|
Trade and other
receivables
|
|
|
|
-
|
|
30
|
|
Leases and/or rights of use
receivable
|
|
Trade and other
receivables
|
|
|
|
-
|
|
321
|
|
Dividends
receivable
|
|
Trade and other
receivables
|
|
|
|
82
|
|
-
|
|
Loans
granted
|
|
Trade and other
receivables
|
|
|
|
(8)
|
|
-
|
|
Reimbursement of expenses
payable
|
|
Trade and other
payables
|
|
|
|
109
|
|
1
|
|
Reimbursement of expenses
receivable
|
|
Trade and other
receivables
|
|
|
|
(1)
|
|
(3)
|
|
Legal services
payable
|
|
Trade and other
payables
|
|
|
|
96
|
|
-
|
|
Leases and/or rights of use
receivable
|
|
Trade and other
receivables
|
|
Total
other related parties
|
|
279
|
|
294
|
|
|
|
|
|
Directors and Senior
Management
|
|
(135)
|
|
(242)
|
|
Fees for services
received
|
|
Trade and other
payables
|
|
Total
Directors and Senior Management
|
|
(135)
|
|
(242)
|
|
|
|
|
|
Total
|
|
1,520
|
|
1,367
|
|
|
|
|
(i)
Includes Agrofy Global,
Lipstick Management LLC, Mehadrin, Banco Hipotecario S.A., Tarshop
S.A., BACS, Puerto Retiro S.A., Austral Gold Ltd., Cyrsa S.A.,
Nuevo Puerto Santa Fe S.A.and Quality Invest
S.A.
(ii)
Includes Estudio Zang,
Bergel & Viñes, Museo de los Niños, Hamonet S.A., CAM
Communication L.P., Gary Goldstein, Fundación IRSA,
Lartiyrigoyen and SAMSA.
The following is a summary
of the results with related parties for the six-month periods ended
December 31, 2019 and 2018:
|
Related
party
|
|
12.31.19
|
|
12.31.18
|
|
Description
of transaction
|
|
Agrofy
S.A.
|
|
-
|
|
3
|
|
Management fees /
Directory
|
|
|
|
3
|
|
-
|
|
Financial
operations
|
|
BACS
|
|
26
|
|
25
|
|
Leases and/or rights of
use
|
|
Other associates and joint
ventures
|
|
13
|
|
34
|
|
Leases and/or rights of
use
|
|
|
|
13
|
|
40
|
|
Corporate
services
|
|
|
|
-
|
|
2
|
|
Comissions
|
|
|
|
(4)
|
|
11
|
|
Financial
operations
|
|
Total
associates and joint ventures
|
|
51
|
|
115
|
|
|
|
Other related parties
(i)
|
|
2
|
|
32
|
|
Leases and/or rights of
use
|
|
|
|
(17)
|
|
(11)
|
|
Fees and
remunerations
|
|
|
|
-
|
|
5
|
|
Corporate
services
|
|
|
|
2
|
|
(2)
|
|
Legal
services
|
|
|
|
(117)
|
|
8
|
|
Financial
operations
|
|
|
|
-
|
|
2
|
|
Comissions
|
|
|
|
(13)
|
|
(12)
|
|
Donations
|
|
Total
other related parties
|
|
(143)
|
|
22
|
|
|
|
IFISA
|
|
2
|
|
-
|
|
Financial
operations
|
|
Total
Parent Company
|
|
2
|
|
-
|
|
|
|
Directors
|
|
-
|
|
(20)
|
|
Compensation of Directors
and senior management
|
|
|
|
(227)
|
|
(392)
|
|
Fees and
remunerations
|
|
Senior
Management
|
|
12
|
|
(21)
|
|
Compensation of Directors
and senior management
|
|
Total
Directors and Senior Management
|
|
(215)
|
|
(433)
|
|
|
|
Total
|
|
(305)
|
|
(296)
|
|
|
(i)
Includes Estudio Zang,
Bergel & Viñes, Fundación IRSA, Ramat Hanassi,
Austral Gold Argentina S.A., Isaac Elsztain e Hijos, Hamonet S.A.,
LRSA, New Lipstick, BHN Vida S.A, TGLT S.A. and
BHSA.
Véase nuestro
informe de fecha 09/11/18
PRICE WATERHOUSE
& Co. S.R.L.
C.P.C.E.C.A.B.A.
T° 1 F° 17
32
Cresud Sociedad
Anónima,
Comercial, Inmobiliaria,
Financiera y Agropecuaria
The following is a summary
of the transactions with related parties for the six-month periods
ended December 31, 2019 and 2018:
|
Related
party
|
|
12.31.19
|
|
12.31.18
|
|
Description
of transaction
|
|
Agrofy
Global
|
|
194
|
|
-
|
|
Irrevocable
contributions
|
|
Uranga Trading
S.A.
|
|
-
|
|
35
|
|
Irrevocable
contributions
|
|
Quality
|
|
26
|
|
29
|
|
Irrevocable
contributions
|
|
Manibil
|
|
77
|
|
-
|
|
Irrevocable
contributions
|
|
Others
|
|
77
|
|
-
|
|
Irrevocable
contributions
|
|
Total
contributions
|
|
374
|
|
64
|
|
|
|
Agro-Uranga
S.A.
|
|
23
|
|
20
|
|
Dividends
received
|
|
Condor
|
|
26
|
|
58
|
|
Dividends
received
|
|
Emco
|
|
15
|
|
12
|
|
Dividends
received
|
|
Manaman
|
|
-
|
|
35
|
|
Dividends
received
|
|
Mehadrin
|
|
-
|
|
83
|
|
Dividends
received
|
|
Nuevo Puerto Santa Fe
S.A.
|
|
25
|
|
14
|
|
Dividends
received
|
|
Nave by the
sea
|
|
-
|
|
43
|
|
Dividends
received
|
|
Total
dividends received
|
|
89
|
|
265
|
|
|
|
Inversiones Financieras del
Sur S.A.
|
|
3,107
|
|
-
|
|
Buy and change of
shares
|
|
Total
other transactions
|
|
3,107
|
|
-
|
|
|
Stock loan granted
On October 18, 2019, the
Board of Directors of Cresud approved the granting of a loan of
3,235,000 American Depositary Receipts ("ADRs") from IRSA
Inversiones y Representaciones Sociedad Anónima, owned by the
Company to Inversiones Financieras del Sur S.A., Company controlled
by the president of our Company. The loan has been guaranteed by
Inversiones Financieras del Sur S.A. with stocks of equivalent
value.
29.
CNV General Resolution
N° 622
As required by Section 1°, Chapter III,
Title IV of CNV General Resolution N° 622, below there is a
detail of the notes to this Financial Statements that disclose the
information required by the Resolution in
Exhibits.
|
Exhibit A - Property, plant
and equipment
|
|
Note 8 - Investment
properties
|
|
|
|
Note 9 - Property, plant
and equipment
|
|
Exhibit B - Intangible
assets
|
|
Note 11 - Intangible
assets
|
|
Exhibit C - Equity
investments
|
|
Note 7 - Investments in
associates and joint ventures
|
|
Exhibit D - Other
investments
|
|
Note 15 - Financial
instruments by category
|
|
Exhibit E -
Provisions
|
|
Note 20 -
Provisions
|
|
Exhibit F - Cost of sales
and services provided
|
|
Note 30 - Cost of sales and
services provided
|
|
Exhibit G - Foreign
currency assets and liabilities
|
|
Note 31 - Foreign currency
assets and liabilities
|
30.
Cost of goods sold and
services provided
|
Description
|
|
Cost of
sales and services from agricultural business
(i)
|
|
Cost of
sales and services from sales and services from urban properties
and investment business (ii) (iii)
|
|
Total as
of 12.31.19
|
|
Total as
of 12.31.18
|
|
Inventories
at the beginning of the period / year
|
|
6,307
|
|
8,818
|
|
15,125
|
|
26,080
|
|
Adjustment previous periods (IFRS
15 and 9)
|
|
-
|
|
-
|
|
-
|
|
(7,377)
|
|
Initial recognition and
changes in the fair value of biological assets and agricultural
products at the point of harvest
|
|
660
|
|
-
|
|
660
|
|
35
|
|
Changes in the net
realizable value of agricultural products after
harvest
|
|
422
|
|
-
|
|
422
|
|
(86)
|
|
Capitalized finance
costs
|
|
-
|
|
64
|
|
64
|
|
43
|
|
Currency translation
adjustment
|
|
(48)
|
|
3,890
|
|
3,842
|
|
(1,354)
|
|
Transfers
|
|
-
|
|
-
|
|
-
|
|
852
|
|
Harvest
|
|
3,684
|
|
-
|
|
3,684
|
|
2,489
|
|
Acquisitions and
classifications
|
|
4,482
|
|
23,627
|
|
28,109
|
|
38,731
|
|
Consume
|
|
(1,234)
|
|
-
|
|
(1,234)
|
|
(1,735)
|
|
Disposals due to
sales
|
|
-
|
|
(2,459)
|
|
(2,459)
|
|
-
|
|
Disposals due to work
in progress
|
|
-
|
|
-
|
|
-
|
|
(212)
|
|
Deconsolidation
|
|
-
|
|
(136)
|
|
(136)
|
|
-
|
|
Expenses
incurred
|
|
1,380
|
|
19
|
|
1,399
|
|
1,052
|
|
Inventories
at the end of the period / year
|
|
(5,096)
|
|
(7,577)
|
|
(12,673)
|
|
(17,303)
|
|
Cost as
of 12.31.19
|
|
10,557
|
|
26,246
|
|
36,803
|
|
-
|
|
Cost as
of 12.31.18
|
|
6,826
|
|
34,389
|
|
-
|
|
41,215
|
(i)
Includes biological assets (see Note
13).
(ii)
Includes trading properties (see Note
10).
(i)
As of
December 31, 2018 includes the cost of selling goods sold from
Gav-Yam which was reclassified to discontinued.
33
Cresud Sociedad
Anónima,
Comercial, Inmobiliaria,
Financiera y Agropecuaria
31.
Foreign currency assets and
liabilities
Book amounts of foreign
currency assets and liabilities are as follows:
|
Item (3)
/ Currency
|
|
Amount
of foreign currency (2)
|
|
Prevailing
exchange rate (1)
|
|
Total
as of 12.31.19
|
|
Total
as of 06.30.19
|
|
Assets
|
|
|
|
|
|
|
|
|
|
Trade
and other receivables
|
|
|
|
|
|
|
|
|
|
US
Dollar
|
|
72
|
|
59.69
|
|
4,283
|
|
4,035
|
|
Euros
|
|
1
|
|
66.85
|
|
36
|
|
172
|
|
Trade
and other receivables related parties
|
|
|
|
|
|
|
|
|
|
US
Dollar
|
|
4
|
|
59.69
|
|
220
|
|
191
|
|
Total
Trade and other receivables
|
|
|
|
|
|
4,539
|
|
4,398
|
|
Investment
in financial assets
|
|
|
|
|
|
|
|
|
|
US
Dollar
|
|
21
|
|
59.69
|
|
1,244
|
|
4,779
|
|
Pounds
|
|
-
|
|
-
|
|
-
|
|
60
|
|
Total
Investment in financial assets
|
|
|
|
|
|
1,244
|
|
4,839
|
|
Derivative
financial instruments
|
|
|
|
|
|
|
|
|
|
US
Dollar
|
|
1
|
|
59.69
|
|
71
|
|
54
|
|
Total
Derivative financial instruments
|
|
|
|
|
|
71
|
|
54
|
|
Cash and
cash equivalents
|
|
|
|
|
|
|
|
|
|
US
Dollar
|
|
90
|
|
59.69
|
|
5,353
|
|
15,022
|
|
Euros
|
|
-
|
|
66.85
|
|
1
|
|
91
|
|
Brazilian
Reais
|
|
-
|
|
13.80
|
|
3
|
|
-
|
|
Chilean
Pesos
|
|
-
|
|
-
|
|
-
|
|
1
|
|
Total
Cash and cash equivalents
|
|
|
|
|
|
5,357
|
|
15,114
|
|
Total
Assets
|
|
|
|
|
|
11,211
|
|
24,405
|
|
|
|
|
|
|
|
|
|
|
|
Liabilities
|
|
|
|
|
|
|
|
|
|
Trade
and other payables
|
|
|
|
|
|
|
|
|
|
US
Dollar
|
|
26
|
|
59.89
|
|
1,544
|
|
9,923
|
|
Euros
|
|
-
|
|
67.23
|
|
3
|
|
45
|
|
Total
Trade and other payables
|
|
|
|
|
|
1,547
|
|
9,968
|
|
Borrowings
|
|
|
|
|
|
|
|
|
|
US
Dollar
|
|
958
|
|
59.89
|
|
57,401
|
|
69,950
|
|
Borrowings
with related parties
|
|
|
|
|
|
|
|
|
|
US
Dollar
|
|
1
|
|
59.89
|
|
64
|
|
-
|
|
Total
Borrowings
|
|
|
|
|
|
57,465
|
|
69,950
|
|
Derivative
financial instruments
|
|
|
|
|
|
|
|
|
|
US
Dollar
|
|
1
|
|
59.89
|
|
78
|
|
84
|
|
Total
Derivative financial instruments
|
|
|
|
|
|
78
|
|
84
|
|
Total
Liabilities
|
|
|
|
|
|
59,090
|
|
80,002
|
(1)
Exchange rates as of
December 31, 2019 and June 30, 2019, respectively according to
Banco Nación Argentina.
(2)
Considering foreign
currencies those that differ from each Group’s subsidiaries
functional currency at each period/year-end.
(3)
The Company uses
derivative instruments as a complement in order to reduce its
exposure to exchange rate movements (Note 14).
32.
Groups of assets and
liabilities held for sale
As mentioned in Note 4 to the Annual Financial
Statements, the Group has certain assets and liabilities classified
as held for sale. The following table shows the main
ones:
|
|
|
12.31.19
|
|
06.30.19
|
|
Property, plant and
equipment
|
|
10,370
|
|
5,571
|
|
Intangible
assets
|
|
629
|
|
120
|
|
Investments in
associates
|
|
149
|
|
526
|
|
Deferred income tax
assets
|
|
348
|
|
255
|
|
Investment
properties
|
|
20,056
|
|
106
|
|
Income tax
credit
|
|
66
|
|
-
|
|
Trade and other
receivables
|
|
3,362
|
|
2,643
|
|
Cash and cash
equivalents
|
|
1,508
|
|
901
|
|
Total
group of assets held for sale
|
|
36,488
|
|
10,122
|
|
Trade and other
payables
|
|
10,020
|
|
4,266
|
|
Employee
benefits
|
|
331
|
|
254
|
|
Deferred and current income
tax liability
|
|
1,640
|
|
45
|
|
Borrowings
|
|
7,735
|
|
2,598
|
|
Total
group of liabilities held for sale
|
|
19,726
|
|
7,163
|
|
Total
net financial assets held for sale
|
|
16,762
|
|
2,959
|
34
Cresud Sociedad
Anónima,
Comercial, Inmobiliaria,
Financiera y Agropecuaria
33.
Results from discontinued
operations
The results from operations of Gav-Yam for the
period ended December 31, 2019 and the results from Israir and IDB
Tourism for both periods; have been reclassified in the Statements
of Income under discontinued operations.
|
|
|
|
|
|
|
|
|
12.31.19
|
|
12.31.18
|
|
Revenues
|
|
11,817
|
|
13,848
|
|
Costs
|
|
(8,714)
|
|
(9,606)
|
|
Gross
profit
|
|
3,103
|
|
4,242
|
|
Net gain from fair value
adjustment of investment properties
|
|
-
|
|
711
|
|
General and administrative
expenses
|
|
(526)
|
|
(545)
|
|
Selling
expenses
|
|
(396)
|
|
(456)
|
|
Other operating results,
net (i)
|
|
15,414
|
|
451
|
|
(Loss) /
Profit from operations
|
|
17,595
|
|
4,403
|
|
Share of profit of joint
ventures and associates
|
|
116
|
|
170
|
|
(Loss) /
Profit from operations before financing and
taxation
|
|
17,711
|
|
4,573
|
|
Financial
income
|
|
73
|
|
154
|
|
Finance
costs
|
|
(1,212)
|
|
(1,301)
|
|
Other financial
results
|
|
100
|
|
40
|
|
Financial
results, net
|
|
(1,039)
|
|
(1,107)
|
|
(Loss) /
Profit before income tax
|
|
16,672
|
|
3,466
|
|
Income
tax
|
|
(33)
|
|
(424)
|
|
(Loss) /
Profit for the period from discontinued
operations
|
|
16,639
|
|
3,042
|
|
|
|
|
|
|
|
(Loss) /
Profit for the period from discontinued operations attributable
to:
|
|
|
|
|
|
Equity holders of the
parent
|
|
5,539
|
|
1,036
|
|
Non-controlling
interest
|
|
11,100
|
|
2,006
|
|
|
|
|
|
|
|
(Loss) /
Profit per share from discontinued operations attributable to
equity holders of the parent:
|
|
|
|
|
|
Basic
|
|
11.310
|
|
2.132
|
|
Diluted
|
|
10.831
|
|
2.049
|
As of December 31, 2019 and 2018, Ps. 3,019 and
Ps. 1,971 of the total revenues from discontinued operations and
Ps. 16,678 and Ps.1,939 of the total profit from discontinued
operations correspond to Gav-Yam.
34.
Other relevant events of the
period
Economic
context in which the company operates
The Company operates in a complex economic
context, whose main economic variables have recently had strong
volatility, both nationally and
internationally.
At a local level, the following was
observed:
●
Year-on-year inflation as of December 31, 2019,
was 53.8%, and projected inflation for the next 12 months has been
estimated at 42.2% according to the survey on market expectations
made by the Argentine Central Bank for 2020.
●
After
the outcome of the 2019 primary elections, concerns have been
raised in the international markets regarding the sustainability of
the Argentine debt. For such reason, country-risk indicators
reached 2,200 points, resulting in a depreciation of sovereign
bonds. This trend has continued even after the general elections of
October 2019. It should be noted that from January to December
2019, the Peso depreciated 59% vis-à-vis the U.S. Dollar,
according to the average wholesale exchange rate quoted by Banco de
la Nación Argentina.
●
Pursuant to the report filed by the Argentine
Central Bank at the end of 2019, entitled “Objectives and plans for the
development of the currency, foreign exchange, financial, and
credit policies for 2020”, Argentina ended 2019 with a
drop in activity levels in the whereabouts of 3%, and an annual
inflation rate in excess of 50%, the highest one in the past 28
years. In terms of foreign exchange flows, in 2019 the capital and
financial account deficit exceeded U.S. Dollars 35,000 million.
Capital inflows, which had been driven by high domestic interest
rates and were not backed by productive investments, were withdrawn
when not even the soaring domestic interest rates were able to
offset the growing devaluation expectation. Once again, Argentina
experienced a high level of external debt, which accounted for
40.1% of the GDP in the second quarter of 2019, as compared to
13.9% of the GDP at the end of 2015.
35
Cresud Sociedad
Anónima,
Comercial, Inmobiliaria,
Financiera y Agropecuaria
●
In
this scenario, the Government decided to implement various
measures, including emergency executive decree No. 609/2019,
which imposed several foreign exchange restrictions, and Law No.
27,541 on Social Solidarity and Productive Recovery in the Public
Emergency Framework (the “Solidarity Law”),
promulgated on December 23, 2019, which among other issues, seeks
to create the conditions required for the fiscal accounts and debt
to be sustainable, with a solidary approach that includes the
imposition of progressive tax schemes. In addition, it aims to
promote the reactivation of the economy by strengthening the income
of the more vulnerable sectors, increasing their consumption levels
and alleviating the tax debts of small and medium sized companies
in an attempt to facilitate business
continuity.
●
Below
is a description of the principal measures
adopted:
-
Foreign
exchange market restrictions: The scope of Emergency
Executive Decree No. 609/2019, published in the Official
Gazette on September 1, 2019, which had reinstated restrictions on
the foreign exchange market, was ratified and broadened. Some of
these restrictions include:
o
specific terms and conditions for settling
export proceeds were established by the Argentine Central
Bank;
o
new
financial indebtedness with foreign creditors disbursed from
September 1, 2019 onwards must be settled in the local foreign
exchange market, and deposited in a local bank
account;
o
the
Argentine Central Bank’s prior consent is required for the
repayment of debts for imports of goods and
services;
o
the
Argentine Central Bank’s consent is required for Argentine
companies to remit profits or pay dividends;
o
repayment of loans abroad may be settled through
the local foreign exchange market on their maturity dates, subject
to (i) the previous settlement of the funds; and (ii) the previous
satisfaction of certain reporting obligations imposed by the
Argentine Central Bank;
-
the Argentine Central
Bank’s previous consent is required for the payment of debts
to offshore related companies. To access the foreign exchange
market, residents are required to submit documents evidencing the
validity of the transactions in respect of which foreign currency
is being purchased to remit funds abroad;
-
swap and arbitrage
transactions may be made by customers without the Argentine Central
Bank’s previous consent, always provided that they are
implemented as individual transactions in Argentine
Pesos;
-
cash withdrawals may be made
abroad by debiting local bank accounts, always provided that the
relevant foreign currency has been already deposited in the
referred account;
-
payment of certain public
debt instruments was deferred;
-
fuel price controls were
established.
-
Severance
payment duplication: On December 13, 2019, under Executive
Decree 34/2019, an occupational public emergency was declared for a
term of six months, and the obligation to pay twice the applicable
severance payment in case of no-cause dismissal was established for
a term of 180 days.
-
Corporations: The application of
paragraph 5), Article 94 of the Argentine Companies Law, which
established that the loss of capital qualified as a mandatory
corporate dissolution event, was suspended until December 31, 2020,
as was also Article 206, which required corporations to reduce
their stock capital when losses had depleted the amount of reserves
and 50% of their stock capital.
-
Declaration of
public emergency: The Solidarity Law declared the public
emergency in economic, financial, tax, administrative, social
security, public utility, energy, health, and social matters, and
the Argentine Executive Branch was delegated several powers under
the scope of the Solidarity Law.
-
Sovereign debt
sustainability: The Argentine Executive Branch has been
empowered to take all such actions as necessary to recover and
ensure the sustainability of the Argentine sovereign
debt.
-
Energy
system: The Argentine Executive Branch has been empowered to
freeze electricity and natural gas utility rates under federal
jurisdiction and to start a renegotiation process under the current
comprehensive tariff review scheme, or to implement a new
extraordinary review, from the effective date of this law for a
term of up to one hundred and eighty (180) days, aimed at achieving
a reduction in the actual tariff burden on households, stores, and
industries for 2020.
Véase nuestro
informe de fecha 09/11/18
PRICE WATERHOUSE
& Co. S.R.L.
C.P.C.E.C.A.B.A.
T° 1 F° 17
36
Cresud Sociedad
Anónima,
Comercial, Inmobiliaria,
Financiera y Agropecuaria
-
Employer
contributions: The differential contribution scheme for SMEs
(18%) vs. large corporations (20.40%) has been reinstated, as well
as the possibility to consider the applicable percentages according
to the employer’s jurisdiction as VAT fiscal credit, and
Executive Decree 814/2001 was repealed. The current employer
contribution deduction continues in effect.
-
Tax inflation
adjustment: The positive or negative inflation adjustment
for the first and second fiscal years starting on January 1, 2019,
calculated pursuant to current regulations, shall be allocated as
follows: one-sixth in such fiscal period, and the remaining
five-sixths, in equal parts, over the immediately following 5
fiscal periods.
-
Personal
Assets: Tax rates were increased, and the tax thresholds
were not modified. A higher rate was imposed on assets located
abroad, and a tax benefit was established for repatriated
assets.
-
Tax on
Financial Income: Interest accrued on fixed term deposits in
domestic currency, and third-party deposits or other methods for
raising capitals from the public, as determined by the Central
Bank, were exempted from this tax for fiscal period 2019. The tax
on financial income for fiscal period 2020 was
repealed.
-
Income Tax. Tax
rate on corporations and dividends: The changes in tax rates
were suspended until the fiscal year starting on January 1, 2021;
therefore, the following tax rates have been maintained in effect:
Legal entities’ income: 30%; and dividends:
7%.
-
Tax for an
Inclusive and Selfless Argentina: For a term of 5 years,
foreign currency purchase transactions made for no specific
purpose, including purchases of banknotes and purchases made
through wire transfers, are subject to a 30% tax rate, and this tax
may not be credited against other tax
liabilities.
-
Tax on debits
and credits on bank accounts: Cash withdraws from bank
accounts are subject to twice the tax rate previously in effect.
This increase shall not apply to accounts held by individuals or
legal entities evidencing their condition as small or medium-sized
companies.
-
Employment
benefits: The Argentine Executive Branch is empowered to: a)
require private employers to pay minimum salary rises to their
workers; b) temporarily release them from the obligation to pay
dues and contributions to the Argentine Social Security System
(SIPA) on the salary rises resulting from the enforcement these
powers or collective bargaining; and c) reduce dues and/or
contributions to the SIPA for certain specific jurisdictions and
industries or in critical situations.
-
Minimum general
salary rise: On January 2020, under Executive Decree
14/2020, the Argentine Executive Branch approved a salary rise for
private employees of Ps. 3,000, effective as of January 2020.
From February 2020 onwards, an additional sum of Ps.1,000 will
apply.
The volatility and uncertainty scenario
described above subsists as of the date of these financial
statements.
The Company’s Management continuously
monitors the development of the variables that affect its business,
to define its course of action and identify potential impacts on
its equity and financial condition. The Company’s financial
statements should be read in light of these
circumstances.
35.
Subsequent
events
Loss
of control of Gav-Yam
On January 12, 2019, PBC received a letter from
the Ministry of Justice of Israel, in which it questioned that PBC
no longer holds control of Gav Yam. Therefore, the Ministry of
Justice believes that PBC may be considered as breaching the
provisions of the Concentration Law.
The management of PBC sustains its position that
as of September 30, 2019 it no longer holds control of Gav Yam,
considering the facts and circumstances described in Note 4 to
theses financial statements. Currently PBC is preparing a response
to the Ministry of Justice of Israel
Véase nuestro
informe de fecha 09/11/18
PRICE WATERHOUSE
& Co. S.R.L.
C.P.C.E.C.A.B.A.
T° 1 F° 17
37
Cresud Sociedad
Anónima,
Comercial, Inmobiliaria,
Financiera y Agropecuaria
Sale of Brasilagro
shares and merger
On January 20, Cresud sold on the market the
amount of 3,400,000 ordinary shares of its subsidiary Brasilagro
representing 5.98% of its share capital for an amount of US$
15.6.
On January 27, 2020, the suspensive conditions
set forth in the Merger Agreement were consummated and entered into
force, so that Agrifirma Holding merged with Brasilagro and was
extinguished for all legal purposes. Brasilagro became the owner of
100% of Agrifirma's share capital and now controls
it.
The merger was carried out through the exchange
of shares, through the issuance of new common shares of Brasilagro,
registered, accounting and without nominal value, which were
subscribed and paid by the shareholders of Agrifirma
Holding.
As a result of the sale and merger, mentioned
previously, the company reduced its shareholding in Brasilagro to
33.62% of the share capital.
Agreement for the
sale of ISPRO
On January 27, 2020, PBC
signed an agreement to sell all its equity interest in Ispro for an
amount of NIS 885. Such agreement is expected to finalize in March
2020. This transaction is subject to the approval of the Competence
Regulatory Agency in accordance to the Economic Competence Act,
which will have to rule within 150 days of the agreement date.
Therefore, the assets and liabilities of Ispro were classified as
available for sale.
Cresud –
Non-convertible notes
On January 30, 2020, Cresud issued the fifteenth
series of non-convertible notes for an equivalent amount of US$
51.4, which consisted of three classes:
●
Non-convertible notes Class XXVI for an amount
of nominal value Ps. 1,095.2 (equivalent to US$ 18.2, calculated at
an exchange rate of Ps. / US$ 60.1025) maturing 12 months from the
issuance date, which accrue a variable rate (private BADLAR +
6.5%) with interest payable quarterly. The capital will be
amortized in a principal installment at maturity. The issuance
price was 100.0% face value.
●
Non-convertible notes Class XXVII for an amount
of nominal value US$ 5,7 maturing 18 months from the issuance date
which accrue a fixed interest of 7.45% per annum, with interest
payable quarterly. The capital will be amortized in a principal
installment at maturity. The issuance price was 100.0% face
value.
●
Non-convertible notes Class XXVII for an amount
of nominal value US$ 27,5 maturing 15 months from the issuance date
which accrue a fixed interest of 9.00% per annum, with interest
payable quarterly. The capital will be amortized in a principal
installment at maturity. The issuance price was 100.0% face
value.
Dolphin Netherland
guarantee to IDBD
On February 4, 2020 after approval received from
IDBD’s Audit Committee and Board of Directors, Dolphin
Netherlands, committed towards the Company to provide to the
financing entities through whom swap transactions were performed by
the Company in connection with shares of Clal in August 2018 and in
November 2018, autonomous and unconditional guarantees in a
cumulative total of approximately NIS 11, which will constitute a
part of the pledged deposits which IDBD undertook as part of the
terms of the aforementioned swap transactions.
It is noted that the banks will be entitled to
forfeit the guarantees only in case any of the swap transactions
have concluded (in accordance with its terms, including in case of
early termination), and on the aforementioned termination date,
there is a deficit in the amount of the pledged deposits which were
provided by the Company to the banks.
Regarding the commitment of Dolphin Netherlands
to inject capital into IDBD in equal annual payments of NIS 70
million each on September 2, of the years 2019, 2020 and 2021,
which was reported in Note 4 of the annual consolidated financial
statements, in case any of the swap transactions has concluded
before the deadline for execution of the second payment, on
September 2, 2020, the unrealized parts of the guarantees will be
returned to Dolphin Netherlands, while each part of the guarantees
exercised until September 2, 2020, will be considered as part of
the second payment, whereby the balance of the second payment will
be transferred by Dolphin Netherlands to IDBD. As long as the swap
transactions are still in effect on September 2, 2020, Dolphin
Netherlands will make the second payment to IDBD, in accordance
with and subject to the terms of the aforementioned commitment, and
the guarantees will be returned to Dolphin
Netherlands.
Véase nuestro
informe de fecha 09/11/18
PRICE WATERHOUSE
& Co. S.R.L.
C.P.C.E.C.A.B.A.
T° 1 F° 17
38
Free translation
from the original prepared in Spanish for publication in
Argentina
REVIEW REPORT ON THE UNAUDITED CONDENSED
INTERIM CONSOLIDATED FINANCIAL STATEMENTS
To the Shareholders, President and Directors of
Cresud Sociedad Anónima, Comercial, Inmobiliaria, Financiera y
Agropecuaria
Legal address: Moreno 877 – 23°floor
Autonomous City Buenos Aires
Tax Code No. 30-50930070-0
Introduction
We have reviewed the unaudited condensed interim consolidated
financial statements of Cresud Sociedad Anónima, Comercial,
Inmobiliaria, Financiera y Agropecuaria and its subsidiaries
(hereinafter “the Company”) which included the
unaudited condensed interim consolidated statements of financial
position as of December 31, 2019 and the unaudited condensed
interim consolidated statements of income and other comprehensive
income for the six and three-month period ended December 31, 2019,
the unaudited condensed interim consolidated statements of changes
in shareholders’ equity and the unaudited condensed interim
consolidated statements of cash flows for the six-month period then
ended and selected explanatory notes.
The balances and other information corresponding to the fiscal year
ended June 30, 2019 and the interim periods within that fiscal year
are an integral part of these financial statements and, therefore,
they should be considered in relation to those financial
statements.
Management responsibility
The Board of Directors of the Company is responsible for the
preparation and presentation of these unaudited condensed interim
consolidated financial statements in accordance with the accounting
framework established by the National Securities Commission (CNV).
As indicated in Note 2.1 to the accompanying financial statements,
such accounting framework is based in the application of
International Financial Reporting Standards (IFRS) and, in
particular, of International Accounting Standard No 34 "Interim
Financial Reporting" (IAS 34). Those standards have been adopted by
the Argentine Federation of Professional Councils in Economic
Sciences (FACPCE), and were used for the preparation of these
unaudited condensed interim consolidated financial
statements.
Véase nuestro informe de fecha 09/11/18
PRICE WATERHOUSE & Co. S.R.L.
C.P.C.E.C.A.B.A. T° 1 F° 17
Free
translation from the original prepared in Spanish for publication
in Argentina
REVIEW REPORT ON THE UNAUDITED CONDENSED
INTERIM CONSOLIDATED FINANCIAL STATEMENTS
(Continued)
Scope of our review
Our review was limited to the application of the procedures
established in the International Standard on Review Engagements
ISRE 2410 "Review of interim financial information performed by the
independent auditor of the entity", which was adopted as a review
standard in Argentina in Technical Resolution No. 33 of the FACPCE,
without modification as approved by the International Auditing and
Assurance Standards Board (IAASB). A review of interim financial
information consists of making inquiries of persons responsible for
the preparation of the information included in the unaudited
condensed interim consolidated financial statements, and applying
analytical and other review procedures. A review is substantially
less in scope than an audit conducted in accordance with
International Standards on Auditing and consequently does not
enable us to obtain assurance that we would become aware of all
significant matters that might be identified in an audit.
Accordingly, we do not express an audit opinion on the consolidated
statements of financial position, the consolidated statements
of income and other comprehensive income and the
consolidated statements of cash flows of the Company.
Conclusion
Based
on our review, nothing has come to our attention that causes us to
believe that the accompanying unaudited condensed interim
consolidated financial information is not prepared, in all material
respects, in accordance with International Accounting Standard 34,
'Interim financial reporting'.
Emphasis of paragraph
Without qualifying our conclusion, we draw attention to Note 1 to
these unaudited condensed interim consolidated financial
statements.
Report on compliance with current regulations
In accordance with current regulations, we report about Cresud
Sociedad Anónima, Comercial, Inmobiliaria, Financiera y
Agropecuaria that:
a) the unaudited condensed interim consolidated financial
statements of Cresud Sociedad Anónima, Comercial,
Inmobiliaria, Financiera y Agropecuaria are being processed for
recording in the "Inventory and Balance Sheet Book", and comply, as
regards those matters that are within our competence, with the
provisions set forth in the Commercial Companies Law and in the
corresponding resolutions of the National Securities
Commission;
Véase nuestro informe de fecha 09/11/18
PRICE WATERHOUSE & Co. S.R.L.
C.P.C.E.C.A.B.A. T° 1 F° 17
Free
translation from the original prepared in Spanish for publication
in Argentina
REVIEW REPORT ON THE UNAUDITED CONDENSED
INTERIM CONSOLIDATED FINANCIAL STATEMENTS
(Continued)
b) the unaudited condensed interim consolidated financial
statements of Cresud Sociedad Anónima, Comercial,
Inmobiliaria, Financiera y Agropecuaria arise from accounting
records carried in all formal respects in accordance with
applicable legal provisions;
c) we have read the Business Summary (“Reseña
Informativa”) on which, as regards those matters that are
within our competence, we have no observations to
make;
d) at December 31, 2019, the debt of Cresud Sociedad Anónima,
Comercial, Inmobiliaria, Financiera y Agropecuaria owed in favor of
the Argentina Integrated Pension System which arises from
accounting records amounted to Ps. 19,718,032, which was not claimable at that
date.
Autonomous City of Buenos Aires, February 10,
2020.
|
PRICE
WATERHOUSE & CO. S.R.L.
(Partner)
C.P.C.E.C.A.B.A. Tº 1 Fº 17
Dr. Mariano C. Tomatis
Public Accountant (UBA)
C.P.C.E.C.A.B.A. Tº 241 Fº 118
|
|
|
|
|
|
|
|
|
|
|
Véase nuestro informe de fecha 09/11/18
PRICE WATERHOUSE & Co. S.R.L.
C.P.C.E.C.A.B.A. T° 1 F° 17
Cresud Sociedad Anónima, Comercial, Inmobiliaria, Financiera y
Agropecuaria
Unaudited Condensed Interim Separate Financial Statements as of
December 31, 2019 and for the period of six months ending on that
date, presented in comparative form.
Véase nuestro informe de fecha 09/11/18
PRICE WATERHOUSE & Co. S.R.L.
C.P.C.E.C.A.B.A. T° 1 F° 17
Cresud Sociedad Anónima,
Comercial, Inmobiliaria, Financiera y Agropecuaria
Unaudited Condensed Interim Separate Statements of Financial
Position
as of December 31, 2019 and June 30, 2019
(All
amounts in millions of Argentine Pesos, except as otherwise
indicated)
Free
translation from the original prepared in Spanish for publication
in Argentina
|
|
|
Note
|
|
12.31.19
|
|
06.30.19
|
|
ASSETS
|
|
|
|
|
|
|
|
Non-current assets
|
|
|
|
|
|
|
|
Investment properties
|
|
7
|
|
106
|
|
94
|
|
Property, plant and equipment
|
|
8
|
|
5,338
|
|
5,273
|
|
Intangible assets
|
|
9
|
|
181
|
|
184
|
|
Right of use assets
|
|
10
|
|
458
|
|
-
|
|
Biological assets
|
|
11
|
|
1,157
|
|
1,264
|
|
Investments in subsidiaries, associates and joint
ventures
|
|
6
|
|
34,377
|
|
36,066
|
|
Income tax and minimum presumed income tax credit
|
|
|
|
38
|
|
49
|
|
Trade and other receivables
|
|
14
|
|
765
|
|
700
|
|
Total Non-current assets
|
|
|
|
42,420
|
|
43,630
|
|
Current assets
|
|
|
|
|
|
|
|
Biological assets
|
|
11
|
|
1,351
|
|
1,675
|
|
Inventories
|
|
12
|
|
1,682
|
|
2,300
|
|
Trade and other receivables
|
|
14
|
|
2,335
|
|
1,948
|
|
Investment in financial assets
|
|
13
|
|
23
|
|
54
|
|
Derivative financial instruments
|
|
13
|
|
52
|
|
-
|
|
Cash and cash equivalents
|
|
13
|
|
308
|
|
128
|
|
Total Current assets
|
|
|
|
5,751
|
|
6,105
|
|
TOTAL ASSETS
|
|
|
|
48,171
|
|
49,735
|
|
SHAREHOLDERS’ EQUITY
|
|
|
|
|
|
|
|
Shareholders´ equity (according to corresponding
statements)
|
|
|
|
14,388
|
|
20,874
|
|
TOTAL SHAREHOLDERS' EQUITY
|
|
|
|
14,388
|
|
20,874
|
|
LIABILITIES
|
|
|
|
|
|
|
|
Non-current liabilities
|
|
|
|
|
|
|
|
Borrowings
|
|
18
|
|
11,850
|
|
12,206
|
|
Deferred tax liabilities
|
|
19
|
|
3,145
|
|
2,822
|
|
Provisions
|
|
17
|
|
9
|
|
11
|
|
Lease Liabilities
|
|
|
|
99
|
|
-
|
|
Total Non-current liabilities
|
|
|
|
15,103
|
|
15,039
|
|
Current liabilities
|
|
|
|
|
|
|
|
Trade and other payables
|
|
16
|
|
1,644
|
|
1,121
|
|
Payroll and social security liabilities
|
|
|
|
141
|
|
267
|
|
Borrowings
|
|
18
|
|
16,629
|
|
12,402
|
|
Derivative financial instruments
|
|
13
|
|
9
|
|
28
|
|
Provisions
|
|
17
|
|
4
|
|
4
|
|
Lease Liabilities
|
|
|
|
253
|
|
-
|
|
Total Current liabilities
|
|
|
|
18,680
|
|
13,822
|
|
TOTAL LIABILITIES
|
|
|
|
33,783
|
|
28,861
|
|
TOTAL SHAREHOLDERS' EQUITY AND LIABILITIES
|
|
|
|
48,171
|
|
49,735
|
|
|
|
|
|
|
|
|
|
|
|
Alejandro
G. Elsztain
Vice
President II
acting
as President
|
1
Cresud Sociedad Anónima,
Comercial, Inmobiliaria, Financiera y Agropecuaria
Unaudited Condensed Interim
Separate Statements of Income and Other Comprehensive
Income
for
six and three month periods ended December 31, 2019 and
2018
(All
amounts in millions of Argentine Pesos, except as otherwise
indicated)
Free
translation from the original prepared in Spanish for publication
in Argentina
|
|
|
|
|
Six months
|
|
Three months
|
|
||||
|
|
|
Note
|
|
12.31.19
|
|
12.31.18
|
|
12.31.19
|
|
12.31.18
|
|
|
Revenues
|
|
20
|
|
4,436
|
|
1,923
|
|
1,935
|
|
1,024
|
|
|
Costs
|
|
21
|
|
(3,489)
|
|
(1,732)
|
|
(1,486)
|
|
(964)
|
|
|
Initial recognition and changes in the fair value of biological
assets and agricultural products at the point of
harvest
|
|
|
|
(165)
|
|
(147)
|
|
25
|
|
(18)
|
|
|
Changes in the net realizable value of agricultural products after
harvest
|
|
|
|
465
|
|
89
|
|
11
|
|
(264)
|
|
|
Gross profit / (loss)
|
|
|
|
1,247
|
|
133
|
|
485
|
|
(222)
|
|
|
Net gain from fair value adjustment of investment
properties
|
|
|
|
12
|
|
3
|
|
(8)
|
|
(23)
|
|
|
General and administrative expenses
|
|
22
|
|
(238)
|
|
(232)
|
|
(136)
|
|
(111)
|
|
|
Selling expenses
|
|
22
|
|
(747)
|
|
(319)
|
|
(360)
|
|
(147)
|
|
|
Other operating results, net
|
|
23
|
|
76
|
|
58
|
|
(4)
|
|
(177)
|
|
|
Management fees
|
|
|
|
-
|
|
-
|
|
-
|
|
413
|
|
|
Profit / (Loss) from operations
|
|
|
|
350
|
|
(357)
|
|
(23)
|
|
(267)
|
|
|
Share of profit / (loss) of subsidiaries, associates and joint
ventures
|
6
|
|
62
|
|
(4,588)
|
|
(3,104)
|
|
(10,816)
|
|
|
|
Profit / (loss) before financing and taxation
|
|
|
|
412
|
|
(4,945)
|
|
(3,127)
|
|
(11,083)
|
|
|
Finance income
|
|
24
|
|
7
|
|
5
|
|
4
|
|
3
|
|
|
Finance costs
|
|
24
|
|
(1,411)
|
|
(841)
|
|
(633)
|
|
(470)
|
|
|
Other financial results
|
|
24
|
|
(3,422)
|
|
(977)
|
|
1,971
|
|
5,150
|
|
|
Inflation Adjustment
|
|
24
|
|
(37)
|
|
439
|
|
(39)
|
|
144
|
|
|
Financial results, net
|
|
24
|
|
(4,863)
|
|
(1,374)
|
|
1,303
|
|
4,827
|
|
|
Loss before income tax
|
|
|
|
(4,451)
|
|
(6,319)
|
|
(1,824)
|
|
(6,256)
|
|
|
Income tax
|
|
19
|
|
(323)
|
|
69
|
|
(336)
|
|
(1,012)
|
|
|
Loss for the period
|
|
|
|
(4,774)
|
|
(6,250)
|
|
(2,160)
|
|
(7,268)
|
|
|
|
|
|
|
|
|
|
|
|
|
|
|
|
Other comprehensive (loss)
/ income:
|
|
|
|
|
|
|
|
|
|
|
|
|
Items that may be reclassified subsequently to profit or
loss:
|
|
|
|
|
|
|
|
|
|
|
|
|
Currency translation adjustment from subsidiaries and
associates
|
|
|
|
(624)
|
|
256
|
|
(1,341)
|
|
(4,495)
|
|
|
Participation in other comprehensive results of subsidiaries and
associates
|
|
|
|
(89)
|
|
513
|
|
(50)
|
|
(32)
|
|
|
Other comprehensive income for the period
|
|
|
|
(713)
|
|
769
|
|
(1,391)
|
|
(4,527)
|
|
|
(Loss) / Income and Other Comprehensive (Loss) / Income for the
period
|
|
|
|
(5,487)
|
|
(5,481)
|
|
(3,551)
|
|
(11,795)
|
|
|
|
|
|
|
|
|
|
|
|
|
|
|
|
(Loss) / Profit per share attributable to equity holders of the
parent during the period:
|
|
|
|
|
|
|
|
|
|
|
|
|
Basic
|
|
|
|
(9.748)
|
|
(12.859)
|
|
(4.412)
|
|
(14.956)
|
|
|
Diluted
|
|
|
|
(9.748)
|
(i)
|
(12.859)
|
|
(4.412)
|
(i)
|
(14.956)
|
(i)
|
|
|
|
|
|
)
|
|
|
|
|
|
Alejandro
G. Elsztain
Vice
President II
acting
as President
|
2
Cresud Sociedad Anónima,
Comercial, Inmobiliaria, Financiera y Agropecuaria
Unaudited Condensed Interim Separate Statements of Changes in
Shareholders’ Equity
for the six-month period ended December 31, 2019
(All
amounts in millions, except as otherwise indicated)
Free
translation from the original prepared in Spanish for publication
in Argentina
|
|
|
Share capital
|
Treasury shares
|
Inflation adjustment of share capital and treasury
shares (i)
|
Share premium
|
Additional paid-in capital from treasury shares
|
Legal reserve
|
Special reserve RG 609/12 (ii)
|
Other reserves (iii)
|
Retained earnings
|
Total Shareholders' equity
|
|
Balance as of June 30, 2019
|
|
486
|
16
|
8,555
|
9,324
|
81
|
327
|
5,191
|
31,585
|
(34,691)
|
20,874
|
|
Adjustments previous periods (NIIF 16) (Note 2.2)
|
|
-
|
-
|
-
|
-
|
-
|
-
|
-
|
-
|
(637)
|
(637)
|
|
Adjusted balance as of June 30, 2019
|
|
486
|
16
|
8,555
|
9,324
|
81
|
327
|
5,191
|
31,585
|
(35,328)
|
20,237
|
|
Loss for the period
|
|
-
|
-
|
-
|
-
|
-
|
-
|
-
|
-
|
(4,774)
|
(4,774)
|
|
Other comprehensive income for the period
|
|
-
|
-
|
-
|
-
|
-
|
-
|
-
|
(713)
|
-
|
(713)
|
|
Total comprehensive loss for the period
|
|
-
|
-
|
-
|
-
|
-
|
-
|
-
|
(713)
|
(4,774)
|
(5,487)
|
|
As provided by Ordinary and Extraordinary Shareholders´
Meeting held on October 30, 2019:
|
|
|
|
|
|
|
|
|
|
|
|
|
- Absorption of losses
|
|
-
|
-
|
-
|
-
|
-
|
-
|
(3,882)
|
(30,808)
|
34,690
|
-
|
|
- Treasury shares distribution
|
|
13
|
(13)
|
-
|
-
|
-
|
-
|
-
|
1,331
|
(1,331)
|
-
|
|
Reserve for share-based payments
|
|
-
|
-
|
-
|
-
|
-
|
-
|
-
|
(2)
|
-
|
(2)
|
|
Acquisition of treasury stock
|
|
-
|
-
|
-
|
-
|
-
|
-
|
-
|
-
|
12
|
12
|
|
Changes in non-controlling interest
|
|
-
|
-
|
-
|
-
|
-
|
-
|
-
|
(372)
|
-
|
(372)
|
|
Balance as of December 31, 2019
|
|
499
|
3
|
8,555
|
9,324
|
81
|
327
|
1,309
|
1,021
|
(6,731)
|
14,388
|
The
accompanying notes are an integral part of these Unaudited
Condensed Interim Separate Financial Statements.
(i)
Includes Ps. 1 and
Ps. 1 of inflation adjustment of Treasury shares as of December 31,
2019 and June 30, 2019, respectively.
(ii)
Corresponding to General Resolution 609/12 of the National
Securities Commission.
(iii)
Group’s Other reserves at December 31, 2019 are comprised
as:
|
|
|
Cost of treasury shares
|
Changes in non-controlling interest
|
Reserve for currency translation adjustment
|
Other comprehensive income / (loss)
|
Reserve for share-based payments
|
Special reserves
|
Other subsidiary reserves
|
Reserve for the acquisition of securities issued by the
Company
|
Total Other reserves
|
|
Balance as of June 30, 2019
|
|
(1,465)
|
(2,953)
|
4,025
|
652
|
423
|
30,808
|
8
|
87
|
31,585
|
|
Other comprehensive income for the period
|
|
-
|
-
|
(624)
|
(89)
|
-
|
-
|
-
|
-
|
(713)
|
|
Total comprehensive income for the period
|
|
-
|
-
|
(624)
|
(89)
|
-
|
-
|
-
|
-
|
(713)
|
|
As provided by Ordinary and Extraordinary Shareholders´
Meeting held on October 30, 2019:
|
|
|
|
|
|
|
|
|
|
|
|
- Absorption of losses
|
|
-
|
-
|
-
|
-
|
-
|
(30,808)
|
-
|
-
|
(30,808)
|
|
- Treasury shares distribution
|
|
1,331
|
-
|
-
|
-
|
-
|
-
|
-
|
-
|
1,331
|
|
Reserve for share-based payments
|
|
-
|
-
|
-
|
-
|
-
|
-
|
(2)
|
-
|
(2)
|
|
Changes in non-controlling interest
|
|
-
|
(372)
|
-
|
-
|
-
|
-
|
-
|
-
|
(372)
|
|
Balance as of December 31, 2019
|
|
(134)
|
(3,325)
|
3,401
|
563
|
423
|
-
|
6
|
87
|
1,021
|
|
|
|
|
|
)
|
|
|
|
|
|
Alejandro
G. Elsztain
Vice
President II
acting
as President
|
3
Cresud Sociedad Anónima,
Comercial, Inmobiliaria, Financiera y Agropecuaria
Unaudited Condensed Interim Separate Statements of Changes in
Shareholders’ Equity
for the six-month period ended December 31, 2018
(All
amounts in millions, except as otherwise indicated)
Free
translation from the original prepared in Spanish for publication
in Argentina
|
|
|
Share capital
|
Treasury shares
|
Inflation adjustment of share capital and treasury
shares (i)
|
Share premium
|
Additional paid-in capital from treasury shares
|
Legal reserve
|
Special reserve RG 609/12 (ii)
|
Other reserves (iii)
|
Retained earnings
|
Total Shareholders' equity
|
|
Balance as of June 30, 2018
|
|
482
|
20
|
8,555
|
9,324
|
81
|
327
|
5,191
|
5,044
|
17,852
|
46,876
|
|
Adjustments previous periods (NIIF 9 y 15)
|
|
-
|
-
|
-
|
-
|
-
|
-
|
-
|
-
|
(186)
|
(186)
|
|
Adjusted balance as of June 30, 2018
|
|
482
|
20
|
8,555
|
9,324
|
81
|
327
|
5,191
|
5,044
|
17,666
|
46,690
|
|
Loss for the period
|
|
-
|
-
|
-
|
-
|
-
|
-
|
-
|
-
|
(6,250)
|
(6,250)
|
|
Other comprehensive loss for the period
|
|
-
|
-
|
-
|
-
|
-
|
-
|
-
|
769
|
-
|
769
|
|
Total comprehensive (loss) income for the period
|
-
|
-
|
-
|
-
|
-
|
-
|
-
|
769
|
(6,250)
|
(5,481)
|
|
|
As provided by Ordinary Shareholders’ Meeting held and
Extraordinary Shareholders’ Meeting held on October 29,
2018:
|
|
|
|
|
|
|
|
|
|
|
|
|
- Results distribution
|
|
-
|
-
|
-
|
-
|
-
|
-
|
-
|
28,638
|
(28,638)
|
-
|
|
- Treasury shares distribution
|
|
21
|
(21)
|
-
|
-
|
-
|
-
|
-
|
-
|
-
|
-
|
|
Reversal by sale of investment properties
|
|
-
|
-
|
-
|
-
|
-
|
-
|
-
|
(32)
|
32
|
-
|
|
Reserve for share-based payments
|
|
-
|
-
|
-
|
-
|
-
|
-
|
-
|
6
|
-
|
6
|
|
Changes in non-controlling interest
|
|
-
|
-
|
-
|
-
|
-
|
-
|
-
|
(779)
|
-
|
(779)
|
|
Changes in interest in subsidiaries
|
|
(6)
|
6
|
-
|
-
|
-
|
-
|
-
|
(435)
|
-
|
(435)
|
|
Balance as of December 31, 2018
|
|
497
|
5
|
8,555
|
9,324
|
81
|
327
|
5,191
|
33,211
|
(17,190)
|
40,001
|
The
accompanying notes are an integral part of these Unaudited
Condensed Interim Separate Financial Statements.
(i)
Includes Ps. 1 and
Ps. 1 of inflation adjustment of Treasury shares as of December 31
and June 30, 2018, respectively.
(ii)
Corresponding to General Resolution
609/12 of the National Securities Commission.
(iii)
Group’s Other
reserves at December 31, 2018 are comprised as:|
|
|
Cost of treasury shares
|
Changes in non-controlling interest
|
Reserve for currency translation adjustment
|
Other comprehensive income / (loss)
|
Reserve for share-based payments
|
Special reserves
|
Other subsidiary reserves
|
Reserve for the acquisition of securities issued by the
Company
|
Total Other reserves
|
|
Balance as of June 30, 2018
|
|
(1,687)
|
(2,194)
|
4,843
|
107
|
412
|
3,475
|
11
|
77
|
5,044
|
|
Adjustments previous periods (NIIF 9 y 15)
|
|
-
|
-
|
-
|
-
|
-
|
-
|
-
|
-
|
-
|
|
Adjusted balance as of June 30, 2018
|
|
(1,687)
|
(2,194)
|
4,843
|
107
|
412
|
3,475
|
11
|
77
|
5,044
|
|
Other comprehensive loss for the period
|
|
-
|
-
|
256
|
513
|
-
|
-
|
-
|
-
|
769
|
|
Total comprehensive loss for the period
|
|
-
|
-
|
256
|
513
|
-
|
-
|
-
|
-
|
769
|
|
As provided by Ordinary Shareholders’ Meeting held and
Extraordinary Shareholders’ Meeting held on October 29,
2018:
|
|
|
|
|
|
|
|
|
|
|
|
- Results distribution
|
|
-
|
-
|
-
|
-
|
-
|
28,638
|
-
|
-
|
28,638
|
|
- Treasury shares distribution
|
|
1,304
|
-
|
-
|
-
|
-
|
(1,304)
|
-
|
-
|
-
|
|
Reversal by sale of investment properties
|
|
-
|
-
|
-
|
(32)
|
-
|
-
|
-
|
-
|
(32)
|
|
Reserve for share-based payments
|
|
-
|
-
|
-
|
-
|
-
|
-
|
6
|
-
|
6
|
|
Changes in non-controlling interest
|
|
-
|
(779)
|
-
|
-
|
-
|
-
|
-
|
-
|
(779)
|
|
Changes in interest in subsidiaries
|
|
(435)
|
-
|
-
|
-
|
-
|
-
|
-
|
-
|
(435)
|
|
Balance as of December 31, 2018
|
|
(818)
|
(2,973)
|
5,099
|
588
|
412
|
30,809
|
17
|
77
|
33,211
|
|
|
|
|
|
)
|
|
|
|
|
|
Alejandro
G. Elsztain
Vice
President II
acting
as President
|
4
Cresud Sociedad Anónima,
Comercial, Inmobiliaria, Financiera y Agropecuaria
Unaudited Condensed Interim Separate Statements of Cash
Flows
for the six-month periods ended December 31, 2019 and
2018
(All
amounts in millions of Argentine Pesos, except as otherwise
indicated)
Free
translation from the original prepared in Spanish for publication
in Argentina
|
|
|
Note
|
|
12.31.19
|
|
12.31.18
|
|
Operating activities:
|
|
|
|
|
|
|
|
Cash generated from / (used in) operations
|
|
15
|
|
1,421
|
|
(2,844)
|
|
Net cash generated from / (used in) operating
activities
|
|
|
|
1,421
|
|
(2,844)
|
|
Investing activities:
|
|
|
|
|
|
|
|
Capital contribution to subsidiaries, associates and joint
ventures
|
|
6
|
|
(167)
|
|
(94)
|
|
Acquisition of property, plant and equipment
|
|
8
|
|
(133)
|
|
(111)
|
|
Proceeds from sale of property, plant and equipment
|
|
|
|
4
|
|
3
|
|
Acquisition of Intangible assets
|
|
9
|
|
(4)
|
|
-
|
|
Acquisition of investment in financial assets
|
|
|
|
(304)
|
|
(5,766)
|
|
Proceeds from disposals of investment in financial
assets
|
|
|
|
334
|
|
5,562
|
|
Loans granted to subsidiaries, associates and joint
ventures
|
|
|
|
(411)
|
|
-
|
|
Advance payments
|
|
|
|
(20)
|
|
(32)
|
|
Dividends received
|
|
|
|
206
|
|
304
|
|
Net cash used in investing activities
|
|
|
|
(495)
|
|
(134)
|
|
Financing activities:
|
|
|
|
|
|
|
|
Repurchase of non-convertible notes
|
|
|
|
(505)
|
|
(806)
|
|
Borrowings and issue ON
|
|
|
|
1,883
|
|
3,598
|
|
Payment of borrowings and ON
|
|
|
|
(360)
|
|
(1,549)
|
|
Obtaining of short term loans, net
|
|
|
|
(1,303)
|
|
2,994
|
|
Payments from derivative financial instruments
|
|
|
|
47
|
|
(72)
|
|
Purchase of treasury stock
|
|
|
|
-
|
|
(435)
|
|
Payment of seller financing
|
|
|
|
-
|
|
(3)
|
|
Interest paid
|
|
|
|
(598)
|
|
(324)
|
|
Net cash (used in) / generated from financing
activities
|
|
|
|
(836)
|
|
3,403
|
|
Net increase / (decrease) in cash and cash equivalents
|
|
|
|
90
|
|
425
|
|
Cash and cash equivalents at beginning of the period
|
|
|
|
128
|
|
376
|
|
Result from exposure to inflation on cash and cash
equivalents
|
|
|
|
3
|
|
2
|
|
Currency translation adjustment on cash and cash
equivalents
|
|
|
|
87
|
|
6
|
|
Cash and cash equivalents at the end of the period
|
|
|
|
308
|
|
809
|
|
|
|
|
|
)
|
|
|
|
|
|
Alejandro
G. Elsztain
Vice
President II
acting
as President
|
5
Cresud
Sociedad Anónima,
Comercial,
Inmobiliaria, Financiera y Agropecuaria
1.
General
information
Cresud
Sociedad Anónima, Comercial, Inmobiliaria, Financiera y
Agropecuaria (“Cresud” or the “Company”)
was founded in 1936 as a subsidiary of Credit Foncier, a Belgian
company primarily engaged in providing rural and urban loans in
Argentina and administering real estate holdings foreclosed by
Credit Foncier. Credit Foncier was liquidated in 1959, and as part
of such liquidation, the shares of Cresud were distributed to
Credit Foncier’s shareholders. From the 1960s through the end
of the 1970s, the business of Cresud shifted exclusively to
agricultural activities.
Cresud
is a company organized and domiciled in the Republic of Argentina.
The address of its registered office is Moreno 877, 23rd Floor,
Buenos Aires, Argentina.
These
Unaudited Condensed Interim Separate Financial Statements have been
approved for issue by the Board of Directors on February 10,
2020.
2.
Basis
of preparation of the Unaudited Condensed Interim Separate
Financial Statements
2.1.
Basis
of preparation
The
National Securities Commission (CNV), in Title IV "Periodic
Information Regime" - Chapter III "Rules relating to the
presentation and valuation of financial statements" - Article 1, of
its standards, has established the application of the Technical
Resolution No. 26 (RT 26) of the FACPCE and its amendments, which
adopt FRS, issued by the IASB, for certain companies included in
the public offering regime of Law No. 26,831, either because of its
stock or its non-convertible notes, or that have requested
authorization to be included in the aforementioned
regime.
For the
preparation of these solo financial statements, the Company has use
the option provided in IAS 34, and has prepared them in condensed
form. Therefore, these financial statements do not include all the
information required in a complete set of annual financial
statements and, consequently, their reading is recommended together
with the annual financial statements as of June 30,
2019.
In view
of what has been mentioned in the preceding paragraphs, the
management of the Company has prepared these financial statements
in accordance with the accounting principles established by the
CNV, which is based on the application of IFRS, in particular of
IAS 34.
Additionally, the
information required by the CNV indicated in article 1, Chapter
III, Title IV of RG N ° 622/13 has been included. This
information is included in a note to these solo financial
statements.
IAS 29
"Financial Reporting in Hyperinflationary Economies" requires that
the financial statements of an entity whose functional currency is
one of a hyperinflationary economy be expressed in terms of the
current unit of measurement at the closing date of the reporting
period, regardless of whether they are based on the historical cost
method or the current cost method. To do so, in general terms, the
inflation produced from the date of acquisition or from the
revaluation date, as applicable, must be calculated in the
non-monetary items. This requirement also includes the comparative
information of the financial statements.
In
order to conclude on whether an economy is categorized as high
inflation in the terms of IAS 29, the standard details a series of
factors to be considered, including the existence of an accumulated
inflation rate in three years that is Approximate or exceed 100%.
Accumulated inflation in three years is over 100%. It is for this
reason that, in accordance with IAS 29, the Argentine economy must
be considered as high inflation starting July 1, 2018.
6
Cresud
Sociedad Anónima,
Comercial,
Inmobiliaria, Financiera y Agropecuaria
In
addition, Law No. 27,468 (published in the Official Gazette on
December 4, 2018), amended Section 10 of Law No. 23,928, as
amended, and established that the derogation of all the laws or
regulations imposing or authorizing price indexation, monetary
restatement, cost variation or any other method for strengthening
debts, taxes, prices or rates of goods, works or services, does not
extend to financial statements, as to which the provisions of
Section 62 in fine of the General Companies Law No. 19,550 (1984
revision), as amended, shall continue to apply. Moreover, the
referred law repealed Decree No. 1269/2002 dated July 16, 2002, as
amended, and delegated to the Argentine Executive Branch the power
to establish, through its controlling agencies, the effective date
of the referred provisions in connection with the financial
statements filed with it. Therefore, under General Resolution
777/2018 (published in the Official Gazette on December 28, 2018)
the Argentine Securities Commission (CNV) ordered that issuers
subject to its supervision shall apply the inflation adjustment to
reflect the financial statements in terms of the current measuring
unit set forth in IAS 29 in their annual, interim and special
financial statements closed on or after December 31,
2018.
Pursuant to IAS 29,
the financial statements of an entity whose functional currency is
that of a high inflationary economy should be reported in terms of
the measuring unit current as of the date of the financial
statements. All the amounts included in the statement of financial
position which are not stated in terms of the measuring unit
current as of the date of the financial statements should be
restated applying the general price index. All items in the
statement of income should be stated in terms of the measuring unit
current as of the date of the financial statements, applying the
changes in the general price index occurred from the date on which
the revenues and expenses were originally recognized in the
financial statements.
Adjustment for
inflation in the initial balances has been calculated considering
the indexes reported by the Argentine Federation of Professional
Councils in Economic Sciences (FACPCE) based on the price indexes
published by the Argentine Institute of Statistics and Census
(INDEC).
The
principal inflation adjustment procedures are the
following:
- Monetary assets and
liabilities that are recorded in the current currency as of the
balance sheet’s closing date are not restated because they
are already stated in terms of the currency unit current as of the
date of the financial statements.
- Non-monetary assets
and liabilities are recorded at cost as of the balance sheet date,
and equity components are restated applying the relevant adjustment
ratios.
- All items in the
statement of income are restated applying the relevant conversion
factors.
- The effect of
inflation in the Company’s net monetary position is included
in the statement of income under Financial results, net, in the
item “Income / (loss) from exposure to changes in the
currency’s purchasing power”.
- Comparative figures
have been adjusted for inflation following the procedure explained
in the previous paragraphs.
Upon
initially applying inflation adjustment, the equity accounts were
restated as follows:
- Capital was
restated as from the date of subscription or the date of the most
recent inflation adjustment for accounting purposes, whichever is
later.
- The resulting
amount was included in the “Capital adjustment”
account.
- The conversion
difference was restated in real terms (as applicable).
- Other comprehensive
income / (loss) was restated as from each accounting
allocation.
The
other reserves in the statement of income were not restated as of
the initial application date, i.e., June 30, 2016.
7
Cresud
Sociedad Anónima,
Comercial,
Inmobiliaria, Financiera y Agropecuaria
2.2.
Accounting
policies
The
accounting policies applied in the preparation of these Unaudited
Condensed Interim Financial Statements are consistent with those
applied in the Annual Financial Statements as of June 30, 2019,
except as mentioned below:
As
described in Note 2.2 to the annual financial statements, the
Company has adapted IFRS 16: Leases and Modification to IAS 28
“Investment in associates and joint ventures” in the
current year applying the cumulative effect approach, therefore,
accumulated impact was recognized in retained earnings as of July
1, 2018. Comparative figures were not restated.
The
main changes were as follow:
IFRS 16: Leases
The
standard establishes the criteria for recognition and valuation of
leases for lessees and lessors. The changes incorporated mainly
impact the tenant's accounting. IFRS 16 provides that the lessee
recognizes an asset for the right of use and a liability at present
value with respect to those contracts that meet the definition of
lease agreements according to IFRS 16. In accordance with the
standard, a lease agreement is one that provides the right to
control the use of an identified asset for a specific period. In
order for a company to have control over the use of an identified
asset: a) it must have the right to obtain substantially all the
economic benefits of the identified asset and b) it must have the
right to direct the use of the identified asset.
The
standard allows to exclude the short-term contracts (under 12
months) and those in which the underlying asset has low
value.
The
impact of the implementation of this standard as of July 1, 2019 is
an increase in non-current assets due to the recognition of the
right to use assets and lease liabilities for Ps. 279 and a
decrease in investment in subsidiaries, associates and joint
ventures of Ps. 4 , due to the impact of the application of said
standard on our subsidiary IRSA Inversiones y Representaciones
S.A.
Modification to IAS 28 “Investment in associates and joint
ventures”
In
accordance with the amendment to IAS 28, an entity shall implement
the provisions of IFRS 9 to Long-term Investments that are
essentially part of the entity's net investment in the associate or
in the joint venture according to the definitions of said standard.
The provisions of IFRS 9 shall apply to such investments with
respect to the participation in the losses of an associate or a
joint venture, as well as with respect to the recognition of the
impairment of an investment in an associate or joint venture. In
addition, when applying IFRS 9 to such long-term investments, the
entity will make it prior to the adjustments made to the carrying
amount of the investment in accordance with IAS 28.
Additionally, the
Company opt for an accounting policy where the currency translation
adjustments arising from these loans will be recorded as part of
other comprehensive income.
2.3.
Comparative
information
The
balances as of June 30, 2019 and December 31, 2018, which are
disclosed for comparative purposes, arise from the financial
statements at such dates restated in accordance with IAS
29.
8
Cresud
Sociedad Anónima,
Comercial,
Inmobiliaria, Financiera y Agropecuaria
2.4.
Use
of estimates
The
preparation of financial statements at a certain date requires the
Management to make estimations and evaluations affecting the amount
of assets and liabilities recorded and contingent assets and
liabilities disclosed at such date, as well as income and expenses
recorded during the period. Future results might differ from the
estimates and evaluations made at the date of preparation of these
Unaudited Condensed Interim Separate Financial
Statements.
In the
preparation of these Unaudited Condensed Interim Separate Financial
Statements, the significant judgments made by Management in
applying the Company’s accounting policies and the main
sources of uncertainty were the same applied by the Company in the
preparation of the Separate Financial Statements for the fiscal
year ended June 30, 2019, described in Note 3 to them.
3.
Seasonal
effects on operations
The
operations of the Company are also subject to seasonal effects. The
harvests and sale of grains (corn, soybean and sunflower) generally
take place between January and September every year. Wheat is
generally harvested between November and February every year.
However, milk production is generally larger during the second
quarter, when conditions are more favorable. As a result, there may
be material fluctuations in the agricultural business results each
quarter.
4.
Acquisitions
and disposals
See
summary of acquisitions and additional disposals of the Company for
the six-month period ended December 31, 2019 in Note 4 to Unaudited
Condensed Interim Consolidated Financial Statements.
5.
Financial
risk management and fair value estimates
5.1.
Financial risk
The
Company’s activities are exposed to several financial risks,
market risk (including exchange rate risk, interest rate risk and
price risk), credit risk, liquidity risk and capital
risk.
The
Unaudited Condensed Interim Separate Financial Statements do not
include all the information and disclosures of the risk management,
so they should be read together with the Annual Separate Financial
Statements as of June 30, 2019. There have been no significant
changes in the risk management or risk management policies applied
by the Company since the fiscal year.
5.2.
Fair
value estimates
Since
June 30, 2019, to the balance sheet date, there have been no
significant changes in business or economic circumstances affecting
the fair value of the Company's financial assets, liabilities or
biological assets (either measured at fair value or amortized
cost). Nor there have been transfers between the several
hierarchies used in estimating the fair value of the
Company’s financial instruments, or reclassifications among
their respective categories.
9
Cresud
Sociedad Anónima,
Comercial,
Inmobiliaria, Financiera y Agropecuaria
6.
Information
about principal subsidiaries and associates
The
Company conducts its business through several subsidiaries and
associates.
As
stated in Note 1 to these consolidated condensed interim financial
statements, the Company indirectly participates through Tyrus in
IDBD and DIC. These companies have certain restrictions and
financial agreements in relation to their financial debt, including
their debentures and loans with banks and financial institutions.
Although the commitments and other restrictions resulting from the
indebtedness of IDBD and DIC do not have recursive effects against
our subsidiary IRSA, nor has IRSA guaranteed it with its assets,
except for commitments of capital contributions described in said
note; IRSA's financial risk related to this investment (IDBD and
DIC) is limited to the aforementioned capital contribution
commitments and the equity risk as of December 31, 2019, as a
result of the pledges granted on the shares of DIC, is limited to
the amount of the investment in said subsidiaries which amounts to
Ps. 6,069 as of December 31, 2019.
Set out
below are the changes in Company’s investment in subsidiaries
and associates for the six-month period ended December 31, 2019 and
for the fiscal year ended June 30, 2019:
|
|
|
12.31.19
|
|
06.30.19
|
|
Beginning of the period / year
|
|
36,066
|
|
58,906
|
|
Dividends in shares received from subsidiaries
|
|
301
|
|
1,448
|
|
Changes in non-controlling interest (i)
|
|
-
|
|
(759)
|
|
Capital contribution
|
|
167
|
|
94
|
|
Disposal of interest in subsidiaries
|
|
-
|
|
(1,653)
|
|
Share of profit of subsidiaries and associates
|
|
62
|
|
(19,765)
|
|
Foreign exchange gains
|
|
(624)
|
|
(817)
|
|
Others changes in subsidiaries’ and associates´
equity
|
|
36
|
|
22
|
|
Adjustments previous periods (IFRS 16 y IAS 28)
|
|
(637)
|
|
(179)
|
|
Other comprehensive loss
|
|
(89)
|
|
-
|
|
Share of changes in subsidiaries’ and associates´
equity
|
|
(372)
|
|
567
|
|
Reserve for share-based payments
|
|
(2)
|
|
11
|
|
Dividends distributed
|
|
(531)
|
|
(1,809)
|
|
End of the period / year
|
|
34,377
|
|
36,066
|
(i)
Includes the effect of
changes in subsidiaries as consequence of
repurchase of equity interes.
See
changes in Company’s investment in associates and joint
ventures for the six-month period ended December 31, 2019 in Note 7
to the Unaudited Condensed Interim Consolidated Financial
Statements and for the year ended June 30, 2019 in Note 8 to the
Annual Consolidated Financial Statements.
10
Cresud
Sociedad Anónima,
Comercial,
Inmobiliaria, Financiera y Agropecuaria
|
|
% of ownership interest
|
|
Registered value
|
|
Entity's interest in comprehensive income / (loss)
|
|
|
|
|
|
|
Last financial statement issued
|
|||||
|
Name of the entity
|
12.31.19
|
06.30.19
|
|
12.31.19
|
06.30.19
|
|
12.31.19
|
12.31.18
|
|
Market value as of 12.31.19
|
Place of business / country of incorporation
|
Main activity
|
Amount of common shares 1 vote
|
|
Common shares (nominal value)
|
Income /(loss) for the period
|
Shareholders' equity
|
|
Subsidiaries
|
|
|
|
|
|
|
|
|
|
|
|
|
|
|
|
|
|
|
Brasilagro Companhia Brasileira de Propriedades
Agrícolas
|
43.17%
|
43.29%
|
|
7,748
|
6,824
|
|
979
|
1,293
|
|
19.02
|
Brazil
|
Agricultural
|
23,291,500
|
|
875
|
812
|
14,239
|
|
Agropecuaria Santa Cruz de la Sierra S.A. (formerly Doneldon
S.A.)
|
100.00%
|
100.00%
|
|
1,440
|
1,267
|
|
169
|
89
|
|
Not publicly traded
|
Uruguay
|
Investment
|
269,729,872
|
|
270
|
14
|
1,440
|
|
Futuros y Opciones.Com S.A.
|
50.10%
|
50.10%
|
|
364
|
321
|
|
168
|
120
|
|
Not publicly traded
|
Argentina
|
Brokerage
|
817,683
|
|
2
|
339
|
727
|
|
Amauta Agro S.A. (formerly FyO Trading S.A.)
|
2.20%
|
2.20%
|
|
2
|
1
|
|
1
|
-
|
|
Not publicly traded
|
Argentina
|
Brokerage
|
11,264
|
|
1
|
27
|
88
|
|
FyO Acopio S.A. (formerly Granos Olavarría S.A.)
|
2.20%
|
2.20%
|
|
7
|
5
|
|
2
|
2
|
|
Not publicly traded
|
Argentina
|
Warehousing and Brokerage
|
506,440
|
|
23
|
104
|
311
|
|
Helmir S.A.
|
100.00%
|
100.00%
|
|
1,915
|
1,441
|
|
292
|
14
|
|
Not publicly traded
|
Uruguay
|
Investment
|
229,368,798
|
|
229
|
241
|
1,915
|
|
Sociedad Anómina Carnes Pampeanas S.A.
|
99.70%
|
99.70%
|
|
335
|
325
|
|
10
|
(41)
|
|
Not publicly traded
|
Argentina
|
Agroindustrial
|
496,050,301
|
|
498
|
10
|
336
|
|
IRSA Inversiones y Representaciones Sociedad
Anónima
|
61.95%
|
61.97%
|
|
21,536
|
25,130
|
|
(2,281)
|
(5,292)
|
|
50.80
|
Argentina
|
Real Estate
|
356,913,429
|
|
576
|
(1,421)
|
34,339
|
|
IRSA Propiedades Comerciales S.A.
|
2.62%
|
1.47%
|
|
680
|
407
|
|
(19)
|
-
|
|
287.50
|
Argentina
|
Real Estate
|
3,304,975
|
|
126
|
(382)
|
47,282
|
|
Total Subsidiaries
|
|
|
|
34,027
|
35,721
|
|
(679)
|
(3,815)
|
|
|
|
|
|
|
|
|
|
|
|
|
|
|
|
|
|
|
|
|
|
|
|
|
|
|
|
|
|
Associates
|
|
|
|
|
|
|
|
|
|
|
|
|
|
|
|
|
|
|
Agrouranga S.A.
|
35.72%
|
35.72%
|
|
281
|
285
|
|
20
|
1
|
|
Not publicly traded
|
Argentina
|
Agricultural
|
2,595,247
|
|
7
|
56
|
249
|
|
Uranga Trading S.A.
|
35.72%
|
35.72%
|
|
69
|
60
|
|
8
|
(5)
|
|
Not publicly traded
|
Argentina
|
Marketing, warehousing and processing
|
653,369
|
|
2
|
23
|
193
|
|
Total Associates
|
|
|
|
350
|
345
|
|
28
|
(4)
|
|
|
|
|
|
|
|
|
|
|
Total Investments in subsidiaries, associates and join
ventures
|
|
34,377
|
36,066
|
|
(651)
|
(3,819)
|
|
|
|
|
|
|
|
|
|
||
11
Cresud
Sociedad Anónima,
Comercial,
Inmobiliaria, Financiera y Agropecuaria
7.
Investment
properties
Changes
in Company’s investment properties for the six-month period
ended December 31, 2019 and for the fiscal year ended June 30, 2019
were as follows:
|
|
|
12.31.19
|
|
06.30.19
|
|
Beginning of the period / year
|
|
94
|
|
99
|
|
Changes in fair value
|
|
12
|
|
(5)
|
|
End of the period / year
|
|
106
|
|
94
|
During
the period ended December 31, 2019 and for the year ended June 30,
2019, there were no financial costs activated as there have been no
assets that qualify for capitalization. No investment property of
the Company has been mortgaged to guarantee some of the
Company´s loans.
The
amounts recognized in the statement of income and other
comprehensive income are not material for any of the exercises
analyzed.
As
described in Note 2.7 to the consolidated financial statements, the
Group uses the valuation made by qualified external appraisers to
determine the fair value of its investment properties. Fair values
are based on comparable values (Level 2 of the fair value
hierarchy). The sales prices of comparable land are adjusted taking
into account the specific aspects of each land, the most important
used premise being the price per hectare.
8.
Property,
plant and equipment
Changes
in Company’s property, plant and equipment for the six-month
period ended December 31, 2019 and for the fiscal year ended June
30, 2019 were as follows:
|
|
|
Owner occupied farmland (ii)
|
|
Others
|
|
Total as of 12.31.19
|
|
Total as of 06.30.19
|
|
|
|
|
|
|
|
|
|
|
|
Costs
|
|
5,831
|
|
314
|
|
6,145
|
|
5,830
|
|
Accumulated depreciation
|
|
(698)
|
|
(174)
|
|
(872)
|
|
(761)
|
|
Net book amount at the beginning of the period / year
|
|
5,133
|
|
140
|
|
5,273
|
|
5,069
|
|
Adjustments previous periods (AREA)
|
|
-
|
|
(6)
|
|
(6)
|
|
-
|
|
Additions
|
|
119
|
|
14
|
|
133
|
|
335
|
|
Disposals
|
|
(2)
|
|
(2)
|
|
(4)
|
|
(6)
|
|
Depreciation charge (i)
|
|
(40)
|
|
(18)
|
|
(58)
|
|
(125)
|
|
Balances at the end of the period / year
|
|
5,210
|
|
128
|
|
5,338
|
|
5,273
|
|
|
|
|
|
|
|
|
|
|
|
Costs
|
|
5,959
|
|
306
|
|
6,265
|
|
6,145
|
|
Accumulated depreciation
|
|
(749)
|
|
(178)
|
|
(927)
|
|
(872)
|
|
Net book amount at the end of the period / year
|
|
5,210
|
|
128
|
|
5,338
|
|
5,273
|
(i)
For the fiscal
years ended December 31, 2019 and June 30, 2019, the depreciation
expense of property, plant and equipment has been charged as
follows: Ps. 7 and Ps. 16 in "Costs"; Ps. 4 and Ps. 21 in
“General and administrative expenses” and Ps. - and Ps.
1 in “Selling expenses” in “the Statement of
Income and Other Comprehensive Income"; Ps. 82 and Ps. 98 were
capitalized as part of the biological assets costs.
(ii) Includes
farms, buildings and facilities of farmlands
properties.
12
Cresud
Sociedad Anónima,
Comercial,
Inmobiliaria, Financiera y Agropecuaria
9.
Intangible assets
Changes
in Company’s intangible assets for the six-month period ended
as of December 31, 2019 and for the fiscal year ended as of June
30, 2019 were as follows:
|
|
|
|
|
|
|
|
|
|
|
|
|
Computer software
|
|
Rights of use
|
|
Total as of 12.31.19
|
|
Total as of 06.30.19
|
|
Costs
|
|
14
|
|
290
|
|
304
|
|
301
|
|
Accumulated amortization
|
|
(9)
|
|
(111)
|
|
(120)
|
|
(107)
|
|
Net book amount at the beginning of the period / year
|
|
5
|
|
179
|
|
184
|
|
194
|
|
Additions
|
|
4
|
|
-
|
|
4
|
|
3
|
|
Amortization charges (i)
|
|
(2)
|
|
(5)
|
|
(7)
|
|
(13)
|
|
Balances at the end of the period / year
|
|
7
|
|
174
|
|
181
|
|
184
|
|
Costs
|
|
18
|
|
290
|
|
308
|
|
304
|
|
Accumulated amortization
|
|
(11)
|
|
(116)
|
|
(127)
|
|
(120)
|
|
Net book amount at the end of the period / year
|
|
7
|
|
174
|
|
181
|
|
184
|
(i)
Amortization
charges are included in “General and administrative
expenses” in the Statement of Income and Other Comprehensive
Income. There are no impairment charges for any of the years
presented.
10.
Right
of use assets
|
|
|
12.31.19
|
|
06.30.19
|
|
Non Current
|
|
|
|
|
|
Owner occupied farmland
|
|
454
|
|
-
|
|
Machines and equipment
|
|
4
|
|
-
|
|
Total Right-of-use assets
|
|
458
|
|
-
|
The
amortization charge of the right-of-use assets is detailed
below:
|
|
|
12.31.19
|
|
12.31.18
|
|
Owner occupied farmland
|
|
33
|
|
-
|
|
Machines and equipment
|
|
1
|
|
-
|
|
Total amortization of Right-of-use assets
|
|
34
|
|
-
|
11.
Biological
assets
Changes
in the Company’s biological assets for the six-month period
ended as of December 31, 2019 and for the fiscal year ended as of
June 30, 2019 were as follows:
|
|
|
|
|
|
|
|
|
|
|
|
|
|
|
|
|
|
|
Sown land-crops
|
|
Breeding cattle
|
|
Other cattle
|
|
Others
|
|
Total as of 12.31.19
|
|
Total as of 06.30.19
|
||
|
|
|
Level 1
|
|
Level 3
|
|
Level 2
|
|
Level 2
|
|
Level 1
|
|
|
||
|
Net book amount at the beginning of the period / year
|
|
83
|
|
1,231
|
|
1,568
|
|
27
|
|
30
|
|
2,939
|
|
2,018
|
|
Purchases
|
|
-
|
|
-
|
|
6
|
|
-
|
|
-
|
|
6
|
|
8
|
|
Changes by transformation
|
|
(52)
|
|
52
|
|
-
|
|
-
|
|
-
|
|
-
|
|
-
|
|
Initial recognition and changes in the fair value of biological
assets
|
|
-
|
|
(99)
|
|
(74)
|
|
(1)
|
|
-
|
|
(174)
|
|
882
|
|
Decrease due to harvest
|
|
-
|
|
(1,755)
|
|
-
|
|
-
|
|
-
|
|
(1,755)
|
|
(3,313)
|
|
Sales
|
|
-
|
|
-
|
|
(446)
|
|
(1)
|
|
-
|
|
(447)
|
|
(369)
|
|
Consumes
|
|
-
|
|
-
|
|
(2)
|
|
-
|
|
(3)
|
|
(5)
|
|
(7)
|
|
Costs for the period
|
|
876
|
|
672
|
|
394
|
|
-
|
|
2
|
|
1,944
|
|
3,720
|
|
Balances at the end of the period / year
|
|
907
|
|
101
|
|
1,446
|
|
25
|
|
29
|
|
2,508
|
|
2,939
|
|
|
|
|
|
|
|
|
|
|
|
|
|
|
|
|
|
Non-current (production)
|
|
-
|
|
-
|
|
1,108
|
|
20
|
|
29
|
|
1,157
|
|
1,264
|
|
Current (consumable)
|
|
907
|
|
101
|
|
338
|
|
5
|
|
-
|
|
1,351
|
|
1,675
|
|
Net book amount at the end of the period / year
|
|
907
|
|
101
|
|
1,446
|
|
25
|
|
29
|
|
2,508
|
|
2,939
|
13
Cresud
Sociedad Anónima,
Comercial,
Inmobiliaria, Financiera y Agropecuaria
During
the t six-month period ended December 31, 2019 and the year ended
June 30, 2019 there have been no transfers between the several
tiers used in estimating the fair value of the Company’s
biological assets, or reclassifications among their respective
categories.
See
information on valuation processes used by the entity in Note 13 to
the Consolidated Financial Statements as of June 30,
2019.
As of
December 31, 2019 and June 30, 2019, the better and maximum use of
biological assets shall not significantly differ from the current
use.
12.
Inventories
Breakdown of
Company’s inventories as of December 31, 2019 and June 30,
2019 are as follows:
|
|
|
12.31.19
|
|
06.30.19
|
|
Current
|
|
|
|
|
|
Crops
|
|
551
|
|
1,492
|
|
Materials and supplies
|
|
9
|
|
4
|
|
Seeds and fodders
|
|
1,122
|
|
804
|
|
Total inventories
|
|
1,682
|
|
2,300
|
As of
December 31, 2019 and June 30, 2019 the cost of inventories
recognized as expense amounted to Ps. 2,979 and Ps. 2,876,
respectively and they have been included in “Costs” in
the Unaudited Condensed Interim Separate Statement of Income and
Other Comprehensive Income.
13.
Financial
instruments by category
Determining fair values
See
determination of the fair value of the Company's financial
instruments in Note 15 to the Annual Consolidated Financial
Statements as of June 30, 2019.
The
following tables present the Company’s financial assets and
financial liabilities that are measured at fair value as of
December 31, 2019 and June 30, 2019 and their allocation to the
fair value hierarchy:
|
|
|
Financial assets at amortized cost
|
|
Financial assets at fair value through profit or
loss
|
|
Subtotal financial assets
|
|
Non-financial assets
|
|
Total
|
||
|
December 31, 2019
|
|
|
|
Level 1
|
|
Level 2
|
|
|
|
|
|
|
|
|
|
|
|
|
|
|
|
|
|
|
|
|
|
Assets as per statement of financial position
|
|
|
|
|
|
|
|
|
|
|
|
|
|
Trade
and other receivables (excluding the allowance for doubtful
accounts and other receivables) (Note 14)
|
|
2,454
|
|
-
|
|
-
|
|
2,454
|
|
654
|
|
3,108
|
|
Investment
in financial assets
|
|
|
|
|
|
|
|
|
|
|
|
|
|
-
Mutual funds
|
|
-
|
|
23
|
|
-
|
|
23
|
|
-
|
|
23
|
|
Derivative
financial instruments
|
|
|
|
|
|
|
|
|
|
|
|
|
|
-
Crops future contracts
|
|
-
|
|
9
|
|
-
|
|
9
|
|
-
|
|
9
|
|
-
Foreign-currency futures contracts
|
|
-
|
|
7
|
|
36
|
|
43
|
|
-
|
|
43
|
|
Cash
and cash equivalents
|
|
|
|
|
|
|
|
|
|
|
|
|
|
-
Cash on hand and at bank
|
|
270
|
|
-
|
|
-
|
|
270
|
|
-
|
|
270
|
|
-
Short-term investments
|
|
7
|
|
31
|
|
-
|
|
38
|
|
-
|
|
38
|
|
Total assets
|
|
2,731
|
|
70
|
|
36
|
|
2,837
|
|
654
|
|
3,491
|
14
Cresud
Sociedad Anónima,
Comercial,
Inmobiliaria, Financiera y Agropecuaria
|
|
|
Financial liabilities at amortized cost
|
|
Financial liabilities at fair value
|
|
Subtotal financial liabilities
|
|
Non-financial liabilities
|
|
Total
|
|
|
|
|
|
Level 1
|
|
|
|
|
|
|
|
Liabilities as per statement of financial position
|
|
|
|
|
|
|
|
|
|
|
|
Trade
and other payables (Note 16)
|
|
1,444
|
|
-
|
|
1,444
|
|
200
|
|
1,644
|
|
Borrowings
(Note 18)
|
|
28,479
|
|
-
|
|
28,479
|
|
-
|
|
28,479
|
|
Derivative
financial instruments
|
|
|
|
|
|
|
|
|
|
|
|
- Crops future contracts
|
|
-
|
|
9
|
|
9
|
|
-
|
|
9
|
|
Total liabilities
|
|
29,923
|
|
9
|
|
29,932
|
|
200
|
|
30,132
|
|
|
|
Financial assets at amortized cost
|
|
Financial assets at fair value through profit or
loss
|
Subtotal financial assets
|
|
Non-financial assets
|
|
Total
|
|
|
June 30, 2019
|
|
|
|
Level 1
|
|
|
|
|
|
|
|
|
|
|
|
|
|
|
|
|
|
|
|
Assets as per statement of financial position
|
|
|
|
|
|
|
|
|
|
|
|
Trade
and other receivables (excluding the allowance for doubtful
accounts and other receivables) (Note 13)
|
|
2,008
|
|
-
|
|
2,008
|
|
649
|
|
2,657
|
|
Investment
in financial assets
|
|
|
|
|
|
|
|
|
|
|
|
-
Mutual funds
|
|
-
|
|
54
|
|
54
|
|
-
|
|
54
|
|
Cash
and cash equivalents
|
|
|
|
|
|
|
|
|
|
|
|
-
Cash on hand and at bank
|
|
44
|
|
-
|
|
44
|
|
-
|
|
44
|
|
-
Short-term investments
|
|
-
|
|
84
|
|
84
|
|
-
|
|
84
|
|
Total assets
|
|
2,052
|
|
138
|
|
2,190
|
|
649
|
|
2,839
|
|
|
|
Financial liabilities at amortized cost
|
|
Financial liabilities at fair value
|
|
Subtotal financial liabilities
|
|
Non-financial liabilities
|
|
Total
|
|
|
|
|
|
Level 1
|
|
|
|
|
|
|
|
Liabilities as per statement of financial position
|
|
|
|
|
|
|
|
|
|
|
|
Trade
and other payables (Note 16)
|
|
1,001
|
|
-
|
|
1,001
|
|
120
|
|
1,121
|
|
Borrowings
(excluding finance lease liabilities) (Note 18)
|
|
24,602
|
|
-
|
|
24,602
|
|
-
|
|
24,602
|
|
Finance
lease obligations (Note 18)
|
|
6
|
|
-
|
|
6
|
|
-
|
|
6
|
|
Derivative
financial instruments
|
|
|
|
|
|
|
|
|
|
|
|
- Foreign-currency futures contracts
|
|
-
|
|
5
|
|
5
|
|
-
|
|
5
|
|
- Crops future contracts
|
|
-
|
|
23
|
|
23
|
|
-
|
|
23
|
|
Total liabilities
|
|
25,609
|
|
28
|
|
25,637
|
|
120
|
|
25,757
|
14.
Trade
and other receivables
Breakdown of the
Company’s trade and other receivables as of December 31, 2019
and June 30, 2019 are as follows:
|
|
|
12.31.19
|
|
06.30.19
|
|
Receivables from sale of properties (i)
|
|
923
|
|
809
|
|
Receivables from sale of agricultural products and
services
|
|
423
|
|
405
|
|
Debtors under legal proceedings
|
|
7
|
|
9
|
|
Less: allowance for doubtful accounts
|
|
(8)
|
|
(9)
|
|
Total trade receivables
|
|
1,345
|
|
1,214
|
|
Prepayments
|
|
332
|
|
418
|
|
Tax credits
|
|
269
|
|
218
|
|
Loans
|
|
20
|
|
25
|
|
Advance payments
|
|
32
|
|
15
|
|
Expenses to recover
|
|
8
|
|
8
|
|
Others
|
|
88
|
|
54
|
|
Total other receivables
|
|
749
|
|
738
|
|
Related parties (Note 24)
|
|
1,006
|
|
696
|
|
Total trade and other receivables
|
|
3,100
|
|
2,648
|
|
Non-current
|
|
765
|
|
700
|
|
Current
|
|
2,335
|
|
1,948
|
|
Total trade and other receivables
|
|
3,100
|
|
2,648
|
15
Cresud
Sociedad Anónima,
Comercial,
Inmobiliaria, Financiera y Agropecuaria
The
fair value of current trade and other receivables approximate their
respective carrying amounts because, due to their short-term
nature, as the impact of discounting is not considered significant.
Fair values are based on discounted cash flows (Level 2 of fair
value hierarchy).
The
carrying amounts of the Company’s trade and other receivables
denominated in foreign currencies are detailed in Note
28.
Trade
receivables are generally presented in the statement of financial
position net of allowances for doubtful receivables. Impairment
policies and procedures by type of receivables are discussed in
detail in Note 2.16 to the Consolidated Financial Statements as of
June 30, 2019.
Movements on the
Company’s allowance for doubtful accounts are as
follows:
|
|
|
12.31.19
|
|
06.30.19
|
|
Beginning of the period / year
|
|
9
|
|
18
|
|
Recovered
|
|
-
|
|
(4)
|
|
Inflation Adjustment
|
|
(1)
|
|
(5)
|
|
End of the period / year
|
|
8
|
|
9
|
The
addition and release of allowance for doubtful accounts have been
included in “Selling expenses” in the Unaudited
Condensed Interim Separate Statement of Income and Other
Comprehensive Income (Note 22). Amounts charged to the provision
account are generally written off when there is no expectation of
recovering additional cash.
15.
Cash
flow information
Following is a
detailed description of cash flows used in the Company’s
operations for the six-month periods ended as of December 31, 2019
and 2018:
|
|
|
12.31.19
|
|
12.31.18
|
|
Loss for the period
|
|
(4,774)
|
|
(6,250)
|
|
Adjustments for:
|
|
|
|
|
|
Income tax
|
|
323
|
|
(69)
|
|
Depreciation and amortization
|
|
17
|
|
23
|
|
Impairment of interest in subsidiaries
|
|
-
|
|
218
|
|
Unrealized (gain) / loss from derivative financial instruments of
commodities
|
|
(139)
|
|
(167)
|
|
Loss from derivative financial instruments (except
commodities)
|
|
-
|
|
37
|
|
Changes in fair value of financial assets at fair value through
profit or loss
|
|
(6)
|
|
5
|
|
Accrued interest, net
|
|
4,652
|
|
(661)
|
|
Unrealized initial recognition and changes in the fair value of
biological assets
|
|
(218)
|
|
(88)
|
|
Changes in net realizable value of agricultural products after
harvest
|
|
(465)
|
|
(89)
|
|
Provisions
|
|
75
|
|
(52)
|
|
Gain from repurchase of Non-convertible Notes
|
|
1
|
|
(2)
|
|
Share of profit in subsidiaries, associates and joint
ventures
|
|
(62)
|
|
4,588
|
|
Changes in fair value of investment properties
|
|
(12)
|
|
(3)
|
|
|
|
|
|
|
|
Changes in operating assets and liabilities:
|
|
|
|
|
|
Decrease / (Increase) in biological assets
|
|
731
|
|
(450)
|
|
Decrease in inventories
|
|
1,083
|
|
306
|
|
(Decrease) / Increase in trade and other receivables
|
|
19
|
|
(284)
|
|
Increase in restricted assets
|
|
(147)
|
|
-
|
|
Decrease / (Increase) in derivative financial
instruments
|
|
29
|
|
(3)
|
|
Decrease in provisions
|
|
(3)
|
|
-
|
|
Increase in trade and other payables
|
|
445
|
|
221
|
|
Decrease in payroll and social security liabilities
|
|
(128)
|
|
(124)
|
|
Net cash generated from / (used in) operating activities before
income tax paid
|
|
1,421
|
|
(2,844)
|
16
Cresud
Sociedad Anónima,
Comercial,
Inmobiliaria, Financiera y Agropecuaria
The
following table shows a detail of non-cash transactions occurred in
the six-month periods ended as of December 31, 2019 and
2018:
|
|
|
12.31.19
|
|
12.31.18
|
|
Non-cash activities
|
|
|
|
|
|
Dividends not collected
|
|
(28)
|
|
(6)
|
|
(Decrease) / increase of interest in subsidiaries, associates and
joint venture by exchange differences on translating foreign
operations
|
|
(623)
|
|
(256)
|
|
Increase of interest in subsidiaries, associates and joint ventures
by a decrease in trade and other receivables
|
|
-
|
|
(8)
|
|
Increase / (decrease) of interest in subsidiaries, associates and
joint ventures through reserve for share-based
compensation
|
|
(3)
|
|
6
|
|
Increase of interest in subsidiaries, associates and joint ventures
by a decrease in trade and other receivables
|
|
2
|
|
-
|
16.
Trade
and other payables
The
detail of the Company’s trade and other payables as of
December 31, 2019 and June 30, 2019 are as follows:
|
|
|
12.31.19
|
|
06.30.19
|
|
Trade payables
|
|
359
|
|
347
|
|
Provisions
|
|
878
|
|
586
|
|
Sales, rent and services payments received in advance
|
|
181
|
|
96
|
|
Total trade payables
|
|
1,418
|
|
1,029
|
|
Taxes payable
|
|
19
|
|
24
|
|
Others
|
|
-
|
|
3
|
|
Total other payables
|
|
19
|
|
27
|
|
Related parties (Note 25)
|
|
207
|
|
65
|
|
Total trade and other payables
|
|
1,644
|
|
1,121
|
|
Current
|
|
1,644
|
|
1,121
|
|
Total trade and other payables
|
|
1,644
|
|
1,121
|
The
fair value of trade and other payables approximate their respective
carrying amounts due to their short-term nature, as the impact of
discounting is considered as not significant. Fair values are based
on discounted cash flows (Level 2 of fair value
hierarchy).
Book
value of trade and other payables denominated in foreign currencies
are detailed in Note 28.
17.
Provisions
The
table below shows the movements in Company's provisions categorized
by type of provision:
|
|
|
Labor and tax claims and other claims
|
|
Total as of 12.31.19
|
|
Total as of 06.30.19
|
|
Beginning of period / year
|
|
15
|
|
15
|
|
23
|
|
Additions
|
|
1
|
|
1
|
|
1
|
|
Inflation Adjustment
|
|
(3)
|
|
(3)
|
|
(9)
|
|
End of period / year
|
|
13
|
|
13
|
|
15
|
|
|
|
|
|
|
|
|
|
Non-current
|
|
|
|
9
|
|
11
|
|
Current
|
|
|
|
4
|
|
4
|
|
Total
|
|
|
|
13
|
|
15
|
17
Cresud
Sociedad Anónima,
Comercial,
Inmobiliaria, Financiera y Agropecuaria
18.
Borrowings
The
detail of the Company’s borrowings as of December 31, 2019
and June 30, 2019 is as follows:
|
|
|
Book value
|
|
Fair Value
|
||||
|
|
|
12.31.19
|
|
06.30.19
|
|
12.31.19
|
|
06.30.19
|
|
Non-convertible notes
|
|
13,629
|
|
10,125
|
|
11,097
|
|
9,444
|
|
Bank loans and others
|
|
9,443
|
|
11,467
|
|
9,429
|
|
11,471
|
|
Related parties (Note 25)
|
|
2,335
|
|
2,236
|
|
2,106
|
|
2,252
|
|
Finance leases obligations
|
|
-
|
|
6
|
|
-
|
|
6
|
|
Bank overdrafts
|
|
3,072
|
|
774
|
|
3,072
|
|
774
|
|
Total borrowings
|
|
28,479
|
|
24,608
|
|
25,704
|
|
23,947
|
|
Non-current
|
|
11,850
|
|
12,206
|
|
|
|
|
|
Current
|
|
16,629
|
|
12,402
|
|
|
|
|
|
Total borrowings
|
|
28,479
|
|
24,608
|
|
|
|
|
19.
Taxation
The
detail of the provision for the Company’s income tax is as
follows:
|
|
|
12.31.19
|
|
12.31.18
|
|
Deferred income tax
|
|
(323)
|
|
69
|
|
Income tax
|
|
(323)
|
|
69
|
The
gross movements on the deferred income tax account were as
follows:
|
|
|
|
|
|
|
|
|
12.31.19
|
|
06.30.19
|
|
Beginning of the period / year
|
|
(2,822)
|
|
1,258
|
|
Charged to the Statement of Comprehensive Income
|
|
(323)
|
|
(4,080)
|
|
End of the period / year
|
|
(3,145)
|
|
(2,822)
|
The
Company´s income tax expense charge differs from the
theoretical amount that would arise using the weighted average tax
rate applicable to Company´s profit before income tax as
follows:
|
|
|
12.31.19
|
|
12.31.18
|
|
Tax calculated at the tax applicable tax rate in effect
(i)
|
|
1,335
|
|
1,896
|
|
Permanent differences:
|
|
|
|
|
|
Share of profit of subsidiaries, associates and joint
ventures
|
|
19
|
|
(1,480)
|
|
Income tax rate change (*)
|
|
(224)
|
|
(210)
|
|
Provision for unrecoverability of tax loss
carry-forwards
|
|
(1,609)
|
|
(642)
|
|
Tax Transparency
|
|
(2)
|
|
(48)
|
|
Low of interest in subsidiaries
|
|
-
|
|
(64)
|
|
Non-taxable results, non-deductible expenses and
others
|
|
(5)
|
|
15
|
|
Inflation adjustment for tax purposes
|
|
(1,179)
|
|
|
|
Inflation Adjustment
|
|
1,342
|
|
602
|
|
Income tax
|
|
(323)
|
|
69
|
(i)
The Income
Tax rate in effect in Argentina as of December 31, 2019 and 2018
was 30%. See Note 22 to the Annual Consolidated Financial
Statements.
18
Cresud
Sociedad Anónima,
Comercial,
Inmobiliaria, Financiera y Agropecuaria
20.
Revenues
|
|
|
12.31.19
|
|
12.31.18
|
|
Crops
|
|
3,834
|
|
1,571
|
|
Cattle
|
|
559
|
|
273
|
|
Supplies
|
|
-
|
|
17
|
|
Leases and agricultural services
|
|
43
|
|
62
|
|
Total revenues
|
|
4,436
|
|
1,923
|
21.
Costs
|
|
|
12.31.19
|
|
12.31.18
|
|
Crops
|
|
2,979
|
|
1,427
|
|
Cattle
|
|
447
|
|
217
|
|
Supplies
|
|
-
|
|
12
|
|
Leases and agricultural services
|
|
51
|
|
58
|
|
Other costs
|
|
12
|
|
18
|
|
Total costs
|
|
3,489
|
|
1,732
|
22.
Expenses
by nature
|
|
|
Costs (i)
|
|
Cost of Production
|
|
General and administrative expenses
|
|
Selling expenses
|
|
Total as of 12.31.19
|
|
Total as of 12.31.18
|
|
Supplies and labors
|
|
33
|
|
1,612
|
|
-
|
|
-
|
|
1,645
|
|
1,643
|
|
Leases and expenses
|
|
-
|
|
2
|
|
12
|
|
1
|
|
15
|
|
12
|
|
Amortization and depreciation
|
|
7
|
|
82
|
|
10
|
|
-
|
|
99
|
|
69
|
|
Doubtful accounts (charge and recovery)
|
|
-
|
|
-
|
|
-
|
|
-
|
|
-
|
|
(2)
|
|
Cost of sale of agricultural products and biological
assets
|
|
3,427
|
|
-
|
|
-
|
|
-
|
|
3,427
|
|
1,655
|
|
Advertising, publicity and other selling expenses
|
|
-
|
|
-
|
|
-
|
|
2
|
|
2
|
|
3
|
|
Maintenance and repairs
|
|
3
|
|
30
|
|
19
|
|
1
|
|
53
|
|
49
|
|
Payroll and social security liabilities
|
|
12
|
|
133
|
|
122
|
|
15
|
|
282
|
|
289
|
|
Fees and payments for services
|
|
2
|
|
12
|
|
16
|
|
22
|
|
52
|
|
43
|
|
Freights
|
|
2
|
|
37
|
|
-
|
|
526
|
|
565
|
|
217
|
|
Bank commissions and expenses
|
|
-
|
|
-
|
|
19
|
|
-
|
|
19
|
|
11
|
|
Travel expenses and stationery
|
|
2
|
|
15
|
|
9
|
|
1
|
|
27
|
|
35
|
|
Conditioning and clearance
|
|
-
|
|
-
|
|
-
|
|
113
|
|
113
|
|
54
|
|
Director’s fees
|
|
-
|
|
-
|
|
31
|
|
-
|
|
31
|
|
18
|
|
Taxes, rates and contributions
|
|
1
|
|
19
|
|
-
|
|
66
|
|
86
|
|
80
|
|
Others
|
|
-
|
|
-
|
|
-
|
|
-
|
|
-
|
|
7
|
|
Total expenses by nature as of 12.31.19
|
|
3,489
|
|
1,942
|
|
238
|
|
747
|
|
6,416
|
|
-
|
|
Total expenses by nature as of 12.31.18
|
|
1,732
|
|
1,900
|
|
232
|
|
319
|
|
|
|
4,183
|
(i)
Include Ps. 12 and
Ps. 18 of other agricultural operating costs as of December 31,
2019 and 2018, respectively.
19
Cresud
Sociedad Anónima,
Comercial,
Inmobiliaria, Financiera y Agropecuaria
23.
Other
operating results, net
|
|
|
12.31.19
|
|
12.31.18
|
|
Gain from commodity derivative financial instruments
|
|
26
|
|
236
|
|
Interests from operating assets
|
|
40
|
|
45
|
|
Gain from disposal of associates, subsidiaries and/or joint
ventures
|
|
-
|
|
(275)
|
|
Others
|
|
10
|
|
52
|
|
Total other operating results, net
|
|
76
|
|
58
|
24.
Financial
results, net
|
|
|
12.31.19
|
|
12.31.18
|
|
Financial income:
|
|
|
|
|
|
Interest income
|
|
7
|
|
5
|
|
Total financial income
|
|
7
|
|
5
|
|
|
|
|
|
|
|
Financial costs:
|
|
|
|
|
|
Interest expenses
|
|
(1,311)
|
|
(751)
|
|
Other financial costs
|
|
(100)
|
|
(90)
|
|
Total financial costs
|
|
(1,411)
|
|
(841)
|
|
|
|
|
|
|
|
Other financial results:
|
|
|
|
|
|
Exchange rate difference, net
|
|
(3,602)
|
|
(798)
|
|
Fair value gains of financial assets at fair value through profit
or loss
|
|
61
|
|
14
|
|
Loss from derivative financial instruments (except
commodities)
|
|
120
|
|
(195)
|
|
Gain from repurchase of NCN
|
|
(1)
|
|
2
|
|
Total other financial results
|
|
(3,422)
|
|
(977)
|
|
Inflation Adjustment
|
|
(37)
|
|
439
|
|
Total financial results, net
|
|
(4,863)
|
|
(1,374)
|
20
Cresud
Sociedad Anónima,
Comercial,
Inmobiliaria, Financiera y Agropecuaria
25.
Related
party transactions
See
description of the main transactions conducted with related parties
in Note 31 to the Consolidated Financial Statements as of June 30,
2019.
The
following is a summary of the balances with related parties as of
December 31, 2019 and June 30, 2019:
|
Items
|
|
12.31.19
|
|
06.30.19
|
|
Trade and other payables
|
|
(207)
|
|
(65)
|
|
Borrowings
|
|
(2,335)
|
|
(2,236)
|
|
Trade and other receivables
|
|
1,006
|
|
696
|
|
Total
|
|
(1,536)
|
|
(1,605)
|
|
Related party
|
|
12.31.19
|
|
06.30.19
|
|
Description of transaction
|
|
Item
|
|
IRSA Inversiones y Representaciones Sociedad
Anónima
|
|
49
|
|
31
|
|
Corporate services receivable
|
|
Trade and other receivables
|
|
|
|
(4)
|
|
(10)
|
|
Leases payable
|
|
Trade and other payables
|
|
|
|
5
|
|
14
|
|
Reimbursement of expenses receivable
|
|
Trade and other receivables
|
|
|
|
1
|
|
1
|
|
Share based payments
|
|
Trade and other receivables
|
|
|
|
1
|
|
1
|
|
Administration fees
|
|
Trade and other receivables
|
|
Brasilagro Companhia Brasileira de Propriedades
Agrícolas
|
|
(3)
|
|
(1)
|
|
Reimbursement of expenses payable
|
|
Trade and other payables
|
|
|
|
-
|
|
267
|
|
Dividends receivables
|
|
Trade and other receivables
|
|
|
|
8
|
|
6
|
|
Reimbursement of expenses receivable
|
|
Trade and other receivables
|
|
Sociedad Anónima Carnes Pampeanas S.A. (formerly
EAASA)
|
|
179
|
|
28
|
|
Sale of goods and/or services
|
|
Trade and other receivables
|
|
|
|
2
|
|
1
|
|
Reimbursement of expenses receivable
|
|
Trade and other receivables
|
|
Helmir S.A.
|
|
(556)
|
|
(482)
|
|
Borrowings
|
|
Borrowings
|
|
|
|
393
|
|
-
|
|
|
|
Trade and other receivables
|
|
Ombú Agropecuaria S.A.
|
|
2
|
|
4
|
|
Administration fees
|
|
Trade and other receivables
|
|
|
|
(5)
|
|
(6)
|
|
Reimbursement of expenses payable
|
|
Trade and other payables
|
|
Agropecuaria Acres del Sud S.A.
|
|
2
|
|
4
|
|
Administration fees
|
|
Trade and other receivables
|
|
|
|
1
|
|
-
|
|
Reimbursement of expenses
|
|
Trade and other receivables
|
|
Yatay Agropecuaria S.A.
|
|
2
|
|
3
|
|
Administration fees
|
|
Trade and other receivables
|
|
|
|
(340)
|
|
(296)
|
|
Borrowings
|
|
Borrowings
|
|
Yuchán Agropecuaria S.A.
|
|
2
|
|
3
|
|
Administration fees
|
|
Trade and other receivables
|
|
Futuros y Opciones.Com S.A.
|
|
278
|
|
174
|
|
Brokerage operations receivable
|
|
Trade and other receivables
|
|
|
|
1
|
|
-
|
|
Reimbursement of expenses receivable
|
|
Trade and other receivables
|
|
|
|
-
|
|
1
|
|
Administration fees
|
|
Trade and other receivables
|
|
|
|
(90)
|
|
(16)
|
|
MAT operations
|
|
Trade and other payables
|
|
Total Subsidiaries
|
|
(72)
|
|
(273)
|
|
|
|
|
|
Agro-Uranga S.A.
|
|
-
|
|
1
|
|
Dividends receivables
|
|
Trade and other receivables
|
|
|
|
-
|
|
9
|
|
Reimbursement of expenses receivable
|
|
Trade and other receivables
|
|
Total Associates
|
|
-
|
|
10
|
|
|
|
|
|
|
|
|
|
|
|
|
|
|
|
IRSA Propiedades Comerciales S.A.
|
|
13
|
|
34
|
|
Reimbursement of expenses receivable
|
|
Trade and other receivables
|
|
|
|
4
|
|
4
|
|
Share based payments
|
|
Trade and other receivables
|
|
|
|
(1,407)
|
|
(1,429)
|
|
Non-convertible notes
|
|
Borrowings
|
|
|
|
58
|
|
108
|
|
Corporate services
|
|
Trade and other receivables
|
|
Panamerican Mall S.A.
|
|
(32)
|
|
(29)
|
|
Non-convertible notes
|
|
Borrowings
|
|
Amauta Agro S.A. (formerly FyO Trading S.A.)
|
|
(71)
|
|
-
|
|
Purchase of goods and/or services
|
|
Trade and other payables
|
|
FyO Acopio S.A. (formerly Granos Olavarría S.A.)
|
|
2
|
|
-
|
|
Reimbursement of expenses payable
|
|
Trade and other receivables
|
|
FyO Acopio S.A. (continuadora de Granos Olavarría
S.A.)
|
|
(14)
|
|
(1)
|
|
Sale of goods and/or services
|
|
Trade and other payables
|
|
Total Subsidiaries of the subsidiaries
|
|
(1,447)
|
|
(1,313)
|
|
|
|
|
|
|
|
|
|
|
|
|
|
|
|
CAMSA and its subsidiaries
|
|
1
|
|
2
|
|
Management fees
|
|
Trade and other receivables
|
|
Estudio Zang, Bergel & Viñes
|
|
(2)
|
|
(1)
|
|
Legal services
|
|
Trade and other payables
|
|
Other Related parties
|
|
(1)
|
|
1
|
|
|
|
|
|
|
|
|
|
|
|
|
|
|
|
Inversiones Financieras del Sur S.A. (1)
|
|
2
|
|
-
|
|
Loans granted
|
|
Trade and other receivables
|
|
Total Parent Company
|
|
2
|
|
-
|
|
|
|
|
|
|
|
|
|
|
|
|
|
|
|
Directors and Senior Management
|
|
(18)
|
|
(30)
|
|
Director's fees
|
|
Trade and other payables
|
|
Total Directors and Senior Management
|
|
(18)
|
|
(30)
|
|
|
|
|
|
Total
|
|
(1,536)
|
|
(1,605)
|
|
|
|
|
21
Cresud
Sociedad Anónima,
Comercial,
Inmobiliaria, Financiera y Agropecuaria
The
following is a summary of the results with related parties for the
six-month period ended as of December 31, 2019 and
2018:
|
Related party
|
|
12.31.19
|
|
12.31.18
|
|
Description of transaction
|
|
IRSA Inversiones y Representaciones Sociedad
Anónima
|
|
(3)
|
|
(6)
|
|
Leases and/or rights of use
|
|
|
|
59
|
|
57
|
|
Corporate services
|
|
Futuros y Opciones.Com S.A.
|
|
(11)
|
|
(6)
|
|
Purchase of goods and/or services
|
|
|
|
1
|
|
2
|
|
Management fees
|
|
Sociedad Anónima Carnes Pampeanas S.A. (formerly
EAASA)
|
|
312
|
|
177
|
|
Sale of goods and/or services
|
|
Helmir S.A.
|
|
(87)
|
|
(121)
|
|
Financial operations
|
|
Total subsidiaries
|
|
271
|
|
103
|
|
|
|
|
|
|
|
|
|
|
|
Panamerican Mall S.A.
|
|
(5)
|
|
(3)
|
|
Financial operations
|
|
Yatay Agropecuaria S.A.
|
|
(8)
|
|
(6)
|
|
Financial operations
|
|
IRSA Propiedades Comerciales S.A.
|
|
(5)
|
|
(3)
|
|
Leases and/or rights of use
|
|
|
|
189
|
|
167
|
|
Corporate services
|
|
|
|
(241)
|
|
(48)
|
|
Financial operations
|
|
Amauta Agro S.A. (formerly FyO Trading S.A.)
|
|
(71)
|
|
(75)
|
|
Sale of goods and/or services
|
|
FyO Acopio S.A.
|
|
-
|
|
94
|
|
Sale of goods and/or services
|
|
|
|
-
|
|
14
|
|
Management fees
|
|
|
|
(44)
|
|
(48)
|
|
Purchase of goods and/or services
|
|
Total Subsidiaries of the subsidiaries
|
|
(185)
|
|
92
|
|
|
|
|
|
|
|
|
|
|
|
Estudio Zang, Bergel & Viñes
|
|
(2)
|
|
(2)
|
|
Legal services
|
|
Hamonet S.A.
|
|
(1)
|
|
-
|
|
Leases and/or rights of use
|
|
San Bernardo de Córdoba S.A.
|
|
(1)
|
|
-
|
|
Leases and/or rights of use
|
|
Isaac Elsztain e Hijos S.C.A.
|
|
(1)
|
|
(2)
|
|
Leases and/or rights of use
|
|
Other Related parties
|
|
(5)
|
|
(4)
|
|
|
|
|
|
|
|
|
|
|
|
Inversiones Financieras del Sur S.A.
|
|
2
|
|
-
|
|
Financial operations
|
|
Total Parent Company
|
|
2
|
|
-
|
|
|
|
|
|
|
|
|
|
|
|
Directores
|
|
(31)
|
|
(18)
|
|
Compensation of Directors
|
|
Senior Management
|
|
(12)
|
|
(6)
|
|
Compensation of Senior Management
|
|
Total Directors and Senior Management
|
|
(43)
|
|
(24)
|
|
|
|
Total
|
|
40
|
|
167
|
|
|
The
following is a summary of the transactions with related parties for
the six-month period ended as of December 31, 2019 and
2018:
|
Related party
|
|
12.31.19
|
|
12.31.18
|
|
Description of transaction
|
|
Agropecuarias Santa Cruz de la Sierra S.A.
|
|
3
|
|
3
|
|
Additional paid-in capital
|
|
Helmir S.A.
|
|
164
|
|
-
|
|
Additional paid-in capital
|
|
Sociedad Anónima Carnes Pampeanas S.A.
|
|
-
|
|
57
|
|
Additional paid-in capital
|
|
|
|
-
|
|
8
|
|
Capitalization of credits
|
|
Agropecuarias Santa Cruz de la Sierra S.A.
|
|
-
|
|
35
|
|
Additional paid-in capital
|
|
Total subsidiary contributions
|
|
167
|
|
103
|
|
|
|
IRSA Inversiones y Representaciones Sociedad
Anónima
|
|
322
|
|
1,448
|
|
Dividends received
|
|
IRSA Propiedades Comerciales S.A.
|
|
9
|
|
-
|
|
Dividends received
|
|
Brasilagro Companhia Brasileira de Propriedades Agrícolas
(“Brasilagro”)
|
|
52
|
|
71
|
|
Dividends received
|
|
Agro-Uranga S.A.
|
|
23
|
|
19
|
|
Dividends received
|
|
Futuros y Opciones.Com S.A.
|
|
125
|
|
31
|
|
Dividends received
|
|
Total dividends received
|
|
531
|
|
1,569
|
|
|
Stock loan granted
On
October 18, 2019, the Board of Directors of Cresud approved the
granting of a loan of 3,235,000 American Depositary Receipts
("ADRs") from IRSA Inversiones y Representaciones Sociedad
Anónima, owned by the Company to Inversiones Financieras del
Sur S.A., Company controlled by the president of our Company. The
loan has been guaranteed by Inversiones Financieras del Sur S.A.
with stocks of equivalent value.
22
Cresud
Sociedad Anónima,
Comercial,
Inmobiliaria, Financiera y Agropecuaria
26.
CNV
General Resolution N° 622/13
As
required by Section 1°, Chapter III, Title IV of CNV General
Resolution N° 622/13, below there is a detail of the notes to
the Unaudited Condensed Interim Separate Financial Statements that
disclosure the information required by the Resolution in
Exhibits.
|
Exhibit A - Property, plant and equipment
|
|
Note 7 – Investment properties
|
|
|
|
Note 8 – Property, plant and equipment
|
|
Exhibit B - Intangible assets
|
|
Note 9 – Intangible assets
|
|
Exhibit C - Equity investments
|
|
Note 6 - Investments in subsidiaries, associates and joint
ventures
|
|
Exhibit D - Other investments
|
|
Note 13 – Financial instruments by category
|
|
Exhibit E - Provisions
|
|
Note 14 – Trade and other receivables
|
|
|
|
Note 17 – Provisions
|
|
Exhibit F - Cost of sales and services
|
|
Note 27 – Cost of sales and services provided
|
|
Exhibit G - Foreign currency assets and liabilities
|
|
Note 28 – Foreign currency assets and
liabilities
|
|
Exhibit H - Exhibit of expenses
|
|
Note 22 – Expenses by nature
|
27.
Cost
of sales and services provided
|
Description
|
|
Biological assets (1)
|
Agricultural stock
|
Services and other operating costs
|
Total as of 12.31.19
|
Total as of 12.31.18
|
|
Beginning of the period / year
|
|
1,595
|
2,300
|
-
|
3,895
|
3,466
|
|
Initial recognition and changes in the fair value of biological
assets and agricultural products at the point of
harvest
|
|
(75)
|
-
|
-
|
(75)
|
(255)
|
|
Changes in the net realizable value of agricultural products after
harvest
|
|
-
|
465
|
-
|
465
|
89
|
|
Increase due to harvest
|
|
-
|
1,766
|
-
|
1,766
|
954
|
|
Acquisitions and classifications
|
|
6
|
1,251
|
-
|
1,257
|
1,276
|
|
Consume
|
|
(2)
|
(1,121)
|
-
|
(1,123)
|
(1,095)
|
|
Expenses incurred
|
|
394
|
-
|
51
|
445
|
401
|
|
Inventories
|
|
(1,471)
|
(1,682)
|
-
|
(3,153)
|
(3,123)
|
|
Cost as of 12.31.19
|
|
447
|
2,979
|
51
|
3,477
|
-
|
|
Cost as of 12.31.18
|
|
217
|
1,439
|
57
|
-
|
1,713
|
(1)
Corresponds to
breeding cattle movements and other cattle.
23
Cresud
Sociedad Anónima,
Comercial,
Inmobiliaria, Financiera y Agropecuaria
28.
Foreign
currency assets and liabilities
Book
amounts of foreign currency assets and liabilities as of December
31, 2019 and June 30, 2019 are as follows:
|
Items
|
|
Amount of foreign currency
|
|
Prevailing exchange rate (1)
|
|
Total as of 12.31.19
|
|
Total as of 06.30.19
|
|
Assets
|
|
|
|
|
|
|
|
|
|
Trade and other receivables
|
|
|
|
|
|
|
|
|
|
US Dollar
|
|
17
|
|
59.690
|
|
1,016
|
|
932
|
|
Receivables with related parties:
|
|
|
|
|
|
|
|
|
|
US Dollar
|
|
7
|
|
59.890
|
|
401
|
|
5
|
|
Brazilian Reais
|
|
-
|
|
-
|
|
-
|
|
265
|
|
Total trade and other receivables
|
|
|
|
|
|
1,417
|
|
1,202
|
|
|
|
|
|
|
|
|
|
|
|
Cash and cash equivalents
|
|
|
|
|
|
|
|
|
|
US Dollar
|
|
5
|
|
59.690
|
|
295
|
|
124
|
|
Brazilian Reais
|
|
-
|
|
-
|
|
-
|
|
1
|
|
Total Cash and cash equivalents
|
|
|
|
|
|
295
|
|
125
|
|
|
|
|
|
|
|
|
|
|
|
Liabilities
|
|
|
|
|
|
|
|
|
|
Trade and other payables
|
|
|
|
|
|
|
|
|
|
US Dollar
|
|
2
|
|
59.890
|
|
136
|
|
170
|
|
Payables with related parties:
|
|
|
|
|
|
|
|
|
|
US Dollar
|
|
1
|
|
59.890
|
|
77
|
|
-
|
|
Brazilian Reais
|
|
-
|
|
16.100
|
|
3
|
|
1
|
|
Bolivian Pesos
|
|
30
|
|
0.168
|
|
5
|
|
4
|
|
Total trade and other payables
|
|
|
|
|
|
221
|
|
175
|
|
|
|
|
|
|
|
|
|
|
|
Derivative financial instruments
|
|
|
|
|
|
|
|
|
|
US Dollar
|
|
-
|
|
59.890
|
|
9
|
|
23
|
|
Total derivative instruments
|
|
|
|
|
|
9
|
|
23
|
|
|
|
|
|
|
|
|
|
|
|
Lease Liabilities
|
|
|
|
|
|
|
|
|
|
US Dollar
|
|
-
|
|
59.890
|
|
4
|
|
-
|
|
Total Lease Liabilities
|
|
|
|
|
|
4
|
|
-
|
|
|
|
|
|
|
|
|
|
|
|
Borrowings
|
|
|
|
|
|
|
|
|
|
US Dollar
|
|
424
|
|
59.890
|
|
25,423
|
|
23,901
|
|
Total Borrowings
|
|
|
|
|
|
25,423
|
|
23,901
|
(1)
Exchange rate as of
December 31, 2019 according to Banco Nación Argentina
records.
29.
CNV
General Ruling N° 629/14 – Storage of
documentation
On
August 14, 2014, the CNV issued General Ruling N° 629 whereby
it introduced amendments to rules related to storage and
conservation of corporate books, accounting books and commercial
documentation. In this sense, it should be noted that the Company
has entrusted the storage of certain non-sensitive and old
information to the following providers:
|
Documentation storage provider
|
|
Location
|
|
Bank S.A.
|
|
Ruta Panamericana Km 37,5, Garín, Province of Buenos
Aires
|
|
|
|
Av. Fleming 2190, Munro, Province of Buenos Aires
|
|
|
|
Carlos Pellegrini 1401, Avellaneda, Province of Buenos
Aires
|
|
Iron Mountain Argentina S.A.
|
|
Av. Amancio Alcorta 2482, Autonomous City of Buenos
Aires
|
|
|
|
Pedro de Mendoza 2143, Autonomous City of Buenos Aires
|
|
|
|
Saraza 6135, Autonomous City of Buenos Aires
|
|
|
|
Azara 1245, Autonomous City of Buenos Aires
|
|
|
|
Polígono industrial Spegazzini, Autopista Ezeiza Km 45,
Cañuelas, Province of Buenos Aires
|
|
|
|
Cañada de Gomez 3825, Autonomous City of Buenos
Aires
|
24
Cresud
Sociedad Anónima,
Comercial,
Inmobiliaria, Financiera y Agropecuaria
It is
further noted that a detailed list of all documentation held in
custody by providers, as well as documentation required in section
5 a.3) of section I, Chapter V, Title II of the RULES (N.T. 2013 as
amended) are available at the registered office.
On
February 5, 2014 there was a widely known fire in Iron
Mountain’s warehouse, which is a supplier of the Company and
where Company’s documentation was being kept. Based on the
internal review carried out by the Company, duly reported to CNV on
February 12, 2014, the information kept at the Iron Mountain
premises that were on fire do not appear to be sensitive or capable
of affecting normal operations.
30.
Negative
working capital
At the end of the period, the Company carried a working capital
deficit of Ps. 12,929. The Company has issued during the
current fiscal year and after December 31, 2019 NCN for a total of
US$ 111 million. Also, within the framework of what was approved by
the Shareholders' Meeting held on October 30, 2019, the Company is
analyzing different financing alternatives to reduce its negative
working capital, either through the issuance of debt, equity and /
or from the sale of selected assets.
31.
Subsequent
events
See
others subsequent events in Note 35 to the Unaudited Condensed
Interim Consolidated Financial Statements.
25
Cresud
Sociedad Anónima,
Comercial,
Inmobiliaria, Financiera y Agropecuaria
Information required by Section 68 of the Buenos Aires Stock
Exchange Regulations
and Section 12, Chapter III, Title IV of Resolution
622/13
Unaudited
Condensed Interim Separate Statement of Financial Position as of
December
31, 2019
Stated
in millions of Argentine pesos
Free
translation from the original prepared in Spanish for publication
in Argentina
1.
Specific and significant legal systems
that imply contingent lapsing or rebirth of benefits envisaged by
such provisions.
2.
Significant changes in the
Company´s activities or other similar circumstances that
occurred during the fiscal years included in the financial
statements, which affect their comparison with financial statements
filed in previous fiscal years, or that could affect those to be
filed in future fiscal years.
3.
Receivables and liabilities by
maturity date.
|
|
|
Past due (Point 3 a.)
|
Without maturity (Point 3.b.)
|
Without maturity (Point 3.b.)
|
To be due (Point 3.c.)
|
|
||||||
|
Items
|
12.31.19
|
Current
|
Non-current
|
Up to 3 months
|
From 3 to 6 month
|
From 6 to 9 months
|
From 9 to 12 months
|
From 1 to 2 years
|
From 2 to 3 years
|
From 3 to 4 years
|
Total
|
|
|
Accounts receivables
|
Trade and other receivables
|
-
|
254
|
-
|
1,877
|
203
|
1
|
-
|
341
|
253
|
171
|
3,100
|
|
Income tax and minimum presumed income tax and deferred income
tax
|
-
|
-
|
38
|
-
|
-
|
-
|
-
|
-
|
-
|
-
|
38
|
|
|
Total
|
-
|
254
|
38
|
1,877
|
203
|
1
|
-
|
341
|
253
|
171
|
3,138
|
|
|
Liabilities
|
Trade and other payables
|
-
|
82
|
-
|
1,562
|
-
|
-
|
-
|
-
|
-
|
-
|
1,644
|
|
Borrowings
|
-
|
-
|
-
|
7,782
|
2,753
|
1,412
|
4,682
|
4,652
|
434
|
6,764
|
28,479
|
|
|
Lease liabilities
|
-
|
-
|
-
|
33
|
115
|
50
|
55
|
99
|
-
|
-
|
352
|
|
|
Payroll and social security liabilities
|
-
|
-
|
-
|
62
|
-
|
79
|
-
|
-
|
-
|
-
|
141
|
|
|
Provisions
|
-
|
-
|
-
|
-
|
-
|
4
|
-
|
9
|
-
|
-
|
13
|
|
|
Deferred income tax liabilities
|
-
|
-
|
3,145
|
-
|
-
|
-
|
-
|
-
|
-
|
-
|
3,145
|
|
|
|
Total
|
-
|
82
|
3,145
|
9,439
|
2,868
|
1,545
|
4,737
|
4,760
|
434
|
6,764
|
33,774
|
26
Cresud
Sociedad Anónima,
Comercial,
Inmobiliaria, Financiera y Agropecuaria
Information required by Section 68 of the Buenos Aires Stock
Exchange Regulations
and Section 12, Chapter III, Title IV of Resolution
622/13
Unaudited
Condensed Interim Separate Statement of Financial Position as of
December 31, 2019
Stated
in millions of Argentine pesos
Free
translation from the original prepared in Spanish for publication
in Argentina
4.a.
Breakdown of
accounts receivable and liabilities by currency and
maturity.
|
Items
|
Current
|
Non-current
|
Totals
|
|||||||
|
Local Currency
|
Foreign Currency
|
Total
|
Local Currency
|
Foreign Currency
|
Total
|
Local Currency
|
Foreign Currency
|
Total
|
||
|
Accounts receivables
|
Trade and other receivables
|
1,610
|
725
|
2,335
|
73
|
692
|
765
|
1,683
|
1,417
|
3,100
|
|
Income tax and minimum presumed income tax and deferred income
tax
|
-
|
-
|
-
|
38
|
-
|
38
|
38
|
-
|
38
|
|
|
Total
|
1,610
|
725
|
2,335
|
111
|
692
|
803
|
1,721
|
1,417
|
3,138
|
|
|
Liabilities
|
Trade and other payables
|
1,423
|
221
|
1,644
|
-
|
-
|
-
|
1,423
|
221
|
1,644
|
|
Borrowings
|
3,118
|
13,511
|
16,629
|
-
|
11,850
|
11,850
|
3,118
|
25,361
|
28,479
|
|
|
Lease liabilities
|
249
|
4
|
253
|
99
|
-
|
99
|
348
|
4
|
352
|
|
|
Payroll and social security liabilities
|
141
|
-
|
141
|
-
|
-
|
-
|
141
|
-
|
141
|
|
|
Provisions
|
4
|
-
|
4
|
9
|
-
|
9
|
13
|
-
|
13
|
|
|
Deferred income tax liabilities
|
-
|
-
|
-
|
3,145
|
-
|
3,145
|
3,145
|
-
|
3,145
|
|
|
|
Total
|
4,935
|
13,736
|
18,671
|
3,253
|
11,850
|
15,103
|
8,188
|
25,586
|
33,774
|
4.b.
Breakdown of
accounts receivable and liabilities by adjustment
clause.
On
December 31, 2019, there are no receivable and liabilities subject
to adjustment clause.
27
Cresud
Sociedad Anónima,
Comercial,
Inmobiliaria, Financiera y Agropecuaria
Information required by Section 68 of the Buenos Aires Stock
Exchange Regulations
and Section 12, Chapter III, Title IV of Resolution
622/13
Unaudited
Condensed Interim Separate Statement of Financial Position as of
December 31, 2019
Stated
in millions of Argentine pesos
Free
translation from the original prepared in Spanish for publication
in Argentina
4.c.
Breakdown of
accounts receivable and liabilities by interest
accrual.
|
|
|
Current
|
Non-Current
|
|
Non-accruing interest
|
|
||||||||
|
Items
|
Accruing interest
|
Non-accruing interest
|
|
Accruing interest
|
Non-accruing interest
|
|
Accruing interest
|
|
||||||
|
|
|
Fixed
|
Floating
|
Subtotal
|
Fixed
|
Floating
|
Subtotal
|
Fixed
|
Floating
|
Total
|
||||
|
Accounts receivables
|
Trade and other receivables
|
645
|
2
|
1,688
|
2,335
|
692
|
-
|
73
|
765
|
1,337
|
2
|
1,761
|
3,100
|
|
|
Income tax and minimum presumed income tax and deferred income
tax
|
-
|
-
|
-
|
-
|
-
|
-
|
38
|
38
|
-
|
-
|
38
|
38
|
||
|
Total
|
645
|
2
|
1,688
|
2,335
|
692
|
-
|
111
|
803
|
1,337
|
2
|
1,799
|
3,138
|
||
|
Liabilities
|
Trade and other payables
|
-
|
-
|
1,644
|
1,644
|
-
|
-
|
-
|
-
|
-
|
-
|
1,644
|
1,644
|
|
|
Borrowings
|
15,688
|
476
|
465
|
16,629
|
10,731
|
1,119
|
-
|
11,850
|
26,419
|
1,595
|
465
|
28,479
|
||
|
Lease liabilities
|
253
|
-
|
-
|
253
|
99
|
-
|
-
|
99
|
352
|
-
|
-
|
352
|
||
|
Payroll and social security liabilities
|
-
|
-
|
141
|
141
|
-
|
-
|
-
|
-
|
-
|
-
|
141
|
141
|
||
|
Provisions
|
-
|
-
|
4
|
4
|
-
|
-
|
9
|
9
|
-
|
-
|
13
|
13
|
||
|
Deferred income tax liabilities
|
-
|
-
|
-
|
-
|
-
|
-
|
3,145
|
3,145
|
-
|
-
|
3,145
|
3,145
|
||
|
|
Total
|
15,941
|
476
|
2,254
|
18,671
|
10,830
|
1,119
|
3,154
|
15,103
|
26,771
|
1,595
|
5,408
|
33,774
|
|
28
Cresud
Sociedad Anónima,
Comercial,
Inmobiliaria, Financiera y Agropecuaria
Information required by Section 68 of the Buenos Aires Stock
Exchange Regulations
and Section 12, Chapter III, Title IV of Resolution
622/13
Unaudited
Condensed Interim Separate Statement of Financial Position as of
December 31, 2019
Stated
in millions of Argentine pesos
Free
translation from the original prepared in Spanish for publication
in Argentina
5.
Companies under section 33 of law N°. 19,550 and other related
parties.
a.
Interest in
companies under section 33 of law N° 19,550. See Note
6.
b.
Companies under
section 33 of law N° 19,550 and other related parties debit /
credit balances. See Note 25.
6.
Loans to directors.
See
Note 25.
7.
Inventories.
The
Company conducts physical inventories once a fiscal year in its
most significant properties, covering all the assets they possess.
There is no relevant immobilization of inventory.
8.
Current values.
See
Note 2 to the Consolidated Financial Statements as of June 30, 2019
and 2018.
9.
Appraisal
revaluation of property, plant and equipment.
None.
10. Obsolete
unused property, plant and equipment.
None.
11.
Equity interest in other companies in excess of that permitted by
section 31 of law N°. 19,550.
None.
12. Recovery
values.
See
Note 2 to the Consolidated Financial Statements as of June 30, 2019
and 2018.
29
Cresud
Sociedad Anónima,
Comercial,
Inmobiliaria, Financiera y Agropecuaria
13. Insurances.
The
types of insurance used by the company were the
following:
|
Insured
property
|
Risk
covered
|
Amount
insured
Ps.
|
Book
value
Ps.
|
|
Buildings,
machinery, silos, installation and furniture and
equipment
|
Theft,
fire and technical insurance
|
2,624
|
4,714
|
|
Vehicles
|
Third
parties, theft, fire and civil liability
|
53
|
42
|
14.
Allowances and provisions that, taken individually or as a whole,
exceed 2% of the shareholder´s equity.
None.
15.
Contingent situations at the date of the financial statements which
probabilities are not remote and the effects on the Company´s
financial position have not been recognized.
Not
applicable.
16. Status of the
proceedings leading to the capitalization of irrevocable
contributions towards future subscriptions.
Not
applicable.
17. Unpaid accumulated
dividends on preferred shares.
None.
18.
Restrictions on distributions of
profits.
30
Free
Translation from the original prepared in Spanish for publication
in Argentina
REVIEW REPORT ON THE UNAUDITED CONDENSED
INTERIM SEPARATE FINANCIAL STATEMENTS
To the
Shareholders, President and Directors of
Cresud Sociedad Anónima, Comercial, Inmobiliaria, Financiera y
Agropecuaria
Legal
address: Moreno 877 – 23°floor
Autonomous
City Buenos Aires
Tax
Code No. 30-50930070-0
Introduction
We have
reviewed the unaudited condensed interim separate financial
statements of Cresud Sociedad Anónima, Comercial,
Inmobiliaria, Financiera y Agropecuaria (hereinafter “the
Company”) which included the unaudited condensed interim
separate statements of financial position as of December 31, 2019,
and the unaudited condensed interim separate statements of income
and other comprehensive income for the six and three-month period
ended December 31, 2019, the unaudited condensed interim separate
statements of changes in shareholders’ equity and the
unaudited condensed interim separate statements of cash flows for
the six-month period then ended and selected explanatory
notes.
The
balances and other information corresponding to the fiscal year
ended June 30, 2019 and the interim periods within that fiscal year
are an integral part of these financial statements and, therefore,
they should be considered in relation to those financial
statements.
Management responsibility
The
Board of Directors of the Company is responsible for the
preparation and presentation of these unaudited condensed interim
separate financial statements in accordance with the accounting
framework established by the National Securities Commission (CNV).
As indicated in Note 2.1 to the accompanying financial statements,
such accounting framework is based in the application of
International Financial Reporting Standards (IFRS) and, in
particular, of International Accounting Standard No 34 "Interim
Financial Reporting" (IAS 34). Those standards have been adopted by
the Argentine Federation of Professional Councils in Economic
Sciences (FACPCE), and were used for the preparation of these
unaudited condensed interim separate financial
statements.
Free
Translation from the original prepared in Spanish for publication
in Argentina
REVIEW REPORT ON THE UNAUDITED CONDENSED
INTERIM SEPARATE FINANCIAL STATEMENTS (Continued)
Scope of our review
Our
review was limited to the application of the procedures established
in the International Standard on Review Engagements ISRE 2410
"Review of interim financial information performed by the
independent auditor of the entity", which was adopted as a review
standard in Argentina in Technical Resolution No. 33 of the FACPCE,
without modification as approved by the International Auditing and
Assurance Standards Board (IAASB). A review of interim financial
information consists of making inquiries of persons responsible for
the preparation of the information included in the unaudited
condensed interim separate financial statements, and applying
analytical and other review procedures. A review is substantially
less in scope than an audit conducted in accordance with
International Standards on Auditing and consequently does not
enable us to obtain assurance that we would become aware of all
significant matters that might be identified in an audit.
Accordingly, we do not express an audit opinion on the separate
statements of financial position, the separate statements of income
and other comprehensive income and the separate statement of cash
flows of the Company.
Conclusion
Based
on our review, nothing has come to our attention that causes us to
believe that the accompanying unaudited condensed interim separate
financial information is not prepared, in all material respects, in
accordance with International Accounting Standard 34, 'Interim
financial reporting'.
Emphasis of paragraph
Without
qualifying our conclusion, we draw attention to Note 6 to these
unaudited condensed interim separate financial
statements.
Report on compliance with current regulations
In
accordance with current regulations, we report about Cresud
Sociedad Anónima, Comercial, Inmobiliaria, Financiera y
Agropecuaria that:
a)
the unaudited
condensed interim separate financial statements of Cresud Sociedad
Anónima, Comercial, Inmobiliaria, Financiera y Agropecuaria
are recorded in the "Inventory and Balance Sheet Book", and comply,
as regards those matters that are within our competence, with the
provisions set forth in the Commercial Companies Law and in the
corresponding resolutions of the National Securities
Commission;
Free
Translation from the original prepared in Spanish for publication
in Argentina
REVIEW REPORT ON THE UNAUDITED CONDENSED
INTERIM SEPARATE FINANCIAL STATEMENTS (Continued)
b)
the unaudited
condensed interim separate financial statements of Cresud Sociedad
Anónima, Comercial, Inmobiliaria, Financiera y Agropecuaria
arise from accounting records carried in all formal respects in
accordance with applicable legal provisions;
c)
we have read the
additional information to the notes to the unaudited condensed
interim separate statements required by section 12 of Chapter III
Title IV of the text of the National Securities Commission, on
which, as regards those matters that are within our competence, we
have no observations to make;
d)
at December 31,
2019, the debt of Cresud Sociedad Anónima, Comercial,
Inmobiliaria, Financiera y Agropecuaria owed in favor of the
Argentina Integrated Pension System which arises from accounting
records amounted to Ps. 19,718,032, which was not claimable at
that date.
Autonomous City of Buenos Aires, February 10, 2020.
|
PRICE WATERHOUSE & CO. S.R.L.
(Partner)
|
|
C.P.C.E.C.A.B.A. Tº 1 Fº 17
Dr. Mariano C. Tomatis
Public
Accountant (UBA)
C.P.C.E.C.A.B.A. Tº 241
Fº 118
|
Cresud Sociedad Anónima,
Comercial, Inmobiliaria, Financiera y
Agropecuaria
Summary as of
December 31, 2019
I. Brief comment on the
Company’s activities during the period, including references
to significant events occurred after the end of the
period.
Consolidated
Results
|
(In ARS
million)
|
6M 20
|
6M 19
|
YoY Var
|
|
Revenues
|
55,158
|
47,795
|
15.4%
|
|
Costs
|
-37,032
|
-31,624
|
17.1%
|
|
Initial recognition
and changes in the fair value of biological assets and agricultural
produce at the point of harvest
|
1,249
|
708
|
76.4%
|
|
Changes in the net
realizable value of agricultural produce after
harvest
|
422
|
52
|
711.5%
|
|
Gross
profit
|
19,797
|
16,931
|
16.9%
|
|
Net gain from fair
value adjustment on investment properties
|
3,623
|
-9,186
|
-
|
|
Gain from disposal
of farmlands
|
299
|
81
|
269.1%
|
|
General and
administrative expenses
|
-5,301
|
-5,331
|
-0.6%
|
|
Selling
expenses
|
-7,065
|
-6,042
|
16.9%
|
|
Other operating
results, net
|
-2,402
|
1,218
|
-297.2%
|
|
Result from
operations
|
8,951
|
-2,329
|
-
|
|
Depreciation and
Amortization
|
7,517
|
4,923
|
52.7%
|
|
EBITDA
(unaudited)
|
16,468
|
2,594
|
534.8%
|
|
Adjusted EBITDA
(unaudited)
|
14,227
|
12,733
|
11.7%
|
|
Loss from joint
ventures and associates
|
-1,502
|
-1,230
|
22.1%
|
|
Result from operations before
financing and taxation
|
7,449
|
-3,559
|
-
|
|
Financial results,
net
|
-19,325
|
-11,485
|
68.3%
|
|
Result before income
tax
|
-11,876
|
-15,044
|
-21.1%
|
|
Income tax
expense
|
-3,090
|
3,375
|
-191.6%
|
|
Result for the period from
continued operations
|
-14,966
|
-11,669
|
28.3%
|
|
Result from
discontinued operations after income tax
|
16,639
|
3,042
|
447.0%
|
|
Result for the
period
|
1,673
|
-8,627
|
-
|
|
|
|
|
|
|
Attributable
to
|
|
|
|
|
Equity holder of the
parent
|
-4,746
|
-6,027
|
-21.3%
|
|
Non-controlling
interest
|
6,419
|
-2,600
|
-
|
Consolidated revenues
increased by 15.4% in the first half of fiscal year 2020 compared
to the same period of 2019, while adjusted EBITDA reached ARS
14,227 million, 11.7% higher than in the same period of fiscal year
2019, of which ARS 2,601 million come from the agricultural
business due to higher productive results of sugarcane activity
offset by lower results from farmland sales and ARS 11,626 million
come from the urban properties and investments business
(IRSA).
Net result for the first
half of fiscal year 2020 recorded a gain of ARS 1,673 million
compared to a loss of ARS 8,627 million in the same period of
fiscal year 2019 mainly explained by higher results from changes in
the fair value of investment properties in the Argentine business
center and the result from the deconsolidation of Gav-Yam, due to
the loss of control, in the Israel business center through IRSA,
offset among other effects, by the loss from exchange rate
differences in Argentina. Net result attributable to the
controlling shareholder registered a loss of ARS 4,746 million
compared to a loss of ARS 6,027 million in the first half of
2019.
1
Cresud Sociedad Anónima,
Comercial, Inmobiliaria, Financiera y
Agropecuaria
Summary as of
December 31, 2019
Description of Operations by
Segment
|
|
6M 2020
|
|||||||
|
|
|
Urban Properties and
Investments
|
|
Variation
|
||||
|
|
Agribusiness
|
Argentina
|
Israel
|
Subtotal
|
Total
|
6M 20 vs. 6M
19
|
||
|
Revenues
|
12,821
|
6,531
|
34,767
|
41,298
|
54,119
|
16.6%
|
||
|
Costs
|
-10,841
|
-1,378
|
-23,498
|
-24,876
|
-35,717
|
19.2%
|
||
|
Initial recognition
and changes in the fair value of biological assets and agricultural
produce at the point of harvest
|
1,104
|
-
|
-
|
-
|
1,104
|
109.5%
|
||
|
Changes in the net
realizable value of agricultural produce after
harvest
|
422
|
-
|
-
|
-
|
422
|
711.5%
|
||
|
Gross
profit
|
3,506
|
5,153
|
11,269
|
16,422
|
19,928
|
16.9%
|
||
|
Net gain from fair
value adjustment on investment properties
|
12
|
4,028
|
-164
|
3,864
|
3,876
|
-
|
||
|
Gain from disposal
of farmlands
|
299
|
-
|
-
|
-
|
299
|
269.1%
|
||
|
General and
administrative expenses
|
-671
|
-1,133
|
-3,528
|
-4,661
|
-5,332
|
-0.5%
|
||
|
Selling
expenses
|
-1,291
|
-536
|
-5,229
|
-5,765
|
-7,056
|
16.7%
|
||
|
Other operating
results, net
|
149
|
-42
|
-2,594
|
-2,636
|
-2,487
|
-353.5%
|
||
|
Result from
operations
|
2,004
|
7,470
|
-246
|
7,224
|
9,228
|
-
|
||
|
Share of profit of
associates
|
155
|
-1,289
|
-563
|
-1,852
|
-1,697
|
63.5%
|
||
|
Segment
result
|
2,159
|
6,181
|
-809
|
5,372
|
7,531
|
-
|
||
|
|
6M 2019
|
||||
|
|
|
Urban Properties and
Investments
|
|
||
|
|
Agribusiness
|
Argentina
|
Israel
|
Subtotal
|
Total
|
|
Revenues
|
8,403
|
7,100
|
30,920
|
38,020
|
46,423
|
|
Costs
|
-6,978
|
-1,235
|
-21,744
|
-22,979
|
-29,957
|
|
Initial recognition
and changes in the fair value of biological assets and agricultural
produce at the point of harvest
|
527
|
-
|
-
|
-
|
527
|
|
Changes in the net
realizable value of agricultural produce after
harvest
|
52
|
-
|
-
|
-
|
52
|
|
Gross
profit
|
2,004
|
5,865
|
9,176
|
15,041
|
17,045
|
|
Net gain from fair
value adjustment on investment properties
|
-34
|
-9,641
|
487
|
-9,154
|
-9,188
|
|
Gain from disposal
of farmlands
|
81
|
-
|
-
|
-
|
81
|
|
General and
administrative expenses
|
-616
|
-1,311
|
-3,430
|
-4,741
|
-5,357
|
|
Selling
expenses
|
-749
|
-501
|
-4,797
|
-5,298
|
-6,047
|
|
Other operating
results, net
|
323
|
-308
|
966
|
658
|
981
|
|
Result from
operations
|
1,009
|
-5,896
|
2,402
|
-3,494
|
-2,485
|
|
Share of profit of
associates
|
-20
|
-396
|
-622
|
-1,018
|
-1,038
|
|
Segment
result
|
989
|
-6,292
|
1,780
|
-4,512
|
-3,523
|
Agricultural
Business
Period
Summary
The 2020 Campaign is
progressing with good weather conditions in the region, with all
the crops implanted, average yields and controlled costs can be
expected. Regarding commodities’ prices, the market is
expectant after the commercial agreement between the US and China,
hoping it will materialize in new businesses that define the
direction of the market.
Regarding farmland
sales, our subsidiary Brasilagro has completed in the first quarter
of FY 2020 the sale of a fraction of 1,134 hectares of the
“Jatobá” farm located in Jaborandi, State of
Bahia, Brazil for an amount of BRL 22.7 million and during the
second quarter, it has sold a small fraction of 85 hectares of its
“Alto Taquarí” farm, located in the State of Mato
Grosso, for BRL 5.5 million.
2
Cresud Sociedad Anónima,
Comercial, Inmobiliaria, Financiera y
Agropecuaria
Summary as of
December 31, 2019
Our
Portfolio
Our portfolio under
management, as of December 31, 2019, was composed of 730,481
hectares, of which 289,538 are in operation and 440,943 are land
reserves distributed among the four countries in the region where
we operate: Argentina, with a mixed model combining land
development and agricultural production; Bolivia, with a productive
model in Santa Cruz de la Sierra; and through our subsidiary
BrasilAgro, Brazil and Paraguay, where the strategy is mainly
focused on the development of lands.
As a subsequent
event, BrasilAgro has added 28,930 hectares to its portfolio as a
result of the merge with Agrifirma (see “Material events of
the quarter and subsequent events”)
Breakdown of
Hectares
Own and under
Concession (*) (**)
(***)
|
|
Productive
Lands
|
Land
Reserves
|
Total
|
|||
|
|
Agricultural
|
Cattle
|
Under
Development Phase 1
|
Under
Development Phase 2
|
Reserved
|
|
|
Argentina
|
64,780
|
147,657
|
9,170
|
2,946
|
312,040
|
536,593
|
|
Brazil
|
43,478
|
10,657
|
200
|
4,442
|
65,660
|
124,438
|
|
Bolivia
|
8,858
|
-
|
-
|
-
|
1,017
|
9,875
|
|
Paraguay
|
11,907
|
3,064
|
3,000
|
-
|
41,519
|
59,490
|
|
Total
|
129,023
|
161,379
|
12,370
|
7,388
|
420,236
|
730,396
|
(*) Includes Brazil,
Paraguay, Agro-Uranga S.A. at 35.723% and 132,000 hectares under
Concession.
(**) Includes 85,000
hectares intended for sheep breeding
(***) Excludes double
crops.
Leased (*)
|
|
Agricultural
|
Cattle
|
Other
|
Total
|
|
Argentina
|
59,535
|
12,635
|
450
|
72,620
|
|
Brazil
|
50,878
|
-
|
2,317
|
53,195
|
|
Bolivia
|
1,017
|
-
|
-
|
1,017
|
|
Total
|
111,430
|
12,635
|
2,767
|
126,832
|
(*) Excludes double
crops.
Segment Income –
Agricultural Business
I)
Land Development,
Transformation and Sales
We periodically sell
properties that have reached a considerable appraisal to reinvest
in new farms with higher appreciation potential. We analyze the
possibility of selling based on a number of factors, including the
expected future yield of the farmland for continued agricultural
and livestock exploitation, the availability of other investment
opportunities and cyclical factors that have a bearing on the
global values of farmlands.
During the first
quarter of fiscal year 2020 Brasilagro completed the sale of a
fraction of 1,134 hectares of the “Jatobá” farm
located in Jaborandi, State of Bahia, Brazil for an amount of BRL
22.7 million (BRL / ha 20,018). The farm was valued in books at BRL
1.7 million and the internal rate of return in dollars reached
7.0%.
In October 2019, it
has sold a small fraction of 85 hectares of its “Alto
Taquarí” farm, located in the State of Mato Grosso, for
BRL 5.5 million. The farm was valued in the books at BRL 1.2
million and the internal rate of return in dollars was
13.0%.
3
Cresud Sociedad Anónima,
Comercial, Inmobiliaria, Financiera y
Agropecuaria
Summary as of
December 31, 2019
|
in ARS
million
|
6M 20
|
6M 19
|
YoY Var
|
|
Revenues
|
-
|
-
|
-
|
|
Costs
|
-12
|
-15
|
-20.0%
|
|
Gross
loss
|
-12
|
-15
|
-20.0%
|
|
Net gain from fair
value adjustment on investment properties
|
12
|
-34
|
-
|
|
Gain from disposal
of farmlands
|
299
|
81
|
269.1%
|
|
General and
administrative expenses
|
-1
|
-2
|
-50.0%
|
|
Selling
expenses
|
-
|
-2
|
-100.0%
|
|
Other operating
results, net
|
-49
|
43
|
-
|
|
Profit from
operations
|
249
|
71
|
252.1%
|
|
Segment
profit
|
249
|
71
|
252.1%
|
|
EBITDA
|
252
|
80
|
215.0%
|
|
Adjusted
EBITDA
|
239
|
1,468
|
-83.7%
|
|
Area under Development
(hectares)
|
Projected for
2019/2020
|
|
Argentina
|
2,946
|
|
Brasil
|
4,442
|
|
Paraguay
|
-
|
|
Total
|
7,388
|
During this
campaign, we expect to transform 7,388 in the region: 2,946
hectares in Argentina and 4,442 hectares in
Brazil.
II)
Agricultural
Production
The result of the
Farming segment increased by ARS 826 million, from ARS 716 million
gain during the first half of fiscal year 2019 to ARS 1,542 million
gain during the same period of 2020.
|
in ARS
million
|
6M 20
|
6M 19
|
YoY Var
|
|
Revenues
|
8,347
|
4,739
|
76.1%
|
|
Costs
|
-7,102
|
-4,057
|
75.1%
|
|
Initial recognition
and changes in the fair value of biological assets and agricultural
produce at the point of harvest
|
1,085
|
551
|
96.9%
|
|
Changes in the net
realizable value of agricultural produce after
harvest
|
422
|
52
|
711.5%
|
|
Gross
profit
|
2,752
|
1,285
|
114.2%
|
|
General and
administrative expenses
|
-434
|
-381
|
13.9%
|
|
Selling
expenses
|
-913
|
-441
|
107.0%
|
|
Other operating
results, net
|
109
|
255
|
-57.3%
|
|
Profit from
operations
|
1,514
|
718
|
110.9%
|
|
Profit from
associates
|
28
|
-2
|
-
|
|
Segment
profit
|
1,542
|
716
|
115.4%
|
|
EBITDA
|
2,083
|
982
|
112.1%
|
|
Adjusted
EBITDA
|
2,083
|
982
|
112.1%
|
4
Cresud Sociedad Anónima,
Comercial, Inmobiliaria, Financiera y
Agropecuaria
Summary as of
December 31, 2019
II.a) Crops and
Sugarcane
Crops
|
in ARS
million
|
6M 20
|
6M 19
|
YoY Var
|
|
Revenues
|
5,290
|
2,552
|
107.3%
|
|
Costs
|
-4,349
|
-2,304
|
88.8%
|
|
Initial
recognition and changes in the fair value of biological assets and
agricultural produce at the point of harvest
|
88
|
459
|
-80.8%
|
|
Changes
in the net realizable value of agricultural produce after
harvest
|
422
|
52
|
711.5%
|
|
Gross
profit
|
1,451
|
759
|
91.2%
|
|
General
and administrative expenses
|
-254
|
-196
|
29.6%
|
|
Selling
expenses
|
-784
|
-338
|
132.0%
|
|
Other
operating results, net
|
108
|
262
|
-58.8%
|
|
Profit from
operations
|
521
|
487
|
7.0%
|
|
Share of
loss of associates
|
28
|
-2
|
-
|
|
Segment
profit
|
549
|
485
|
13.2%
|
Sugarcane
|
in ARS
million
|
6M 20
|
6M 19
|
YoY Var
|
|
Revenues
|
2,180
|
1,672
|
30.4%
|
|
Costs
|
-2,039
|
-1,356
|
50.4%
|
|
Initial
recognition and changes in the fair value of biological assets and
agricultural produce at the point of harvest
|
1,071
|
335
|
219.7%
|
|
Gross
profit
|
1,212
|
651
|
86.2%
|
|
General
and administrative expenses
|
-108
|
-112
|
-3.6%
|
|
Selling
expenses
|
-61
|
-48
|
27.1%
|
|
Other
operating results, net
|
-1
|
-3
|
-66.7%
|
|
Profit from
operations
|
1,042
|
488
|
113.5%
|
|
Segment
profit
|
1,042
|
488
|
113.5%
|
Operations
|
Production Volume1)
|
6M20
|
6M19
|
6M18
|
6M17
|
6M16
|
|
Corn
|
286,685
|
108,173
|
257,650
|
227,042
|
174,105
|
|
Soybean
|
14,077
|
13,178
|
11,088
|
4,649
|
12,064
|
|
Wheat
|
35,590
|
31,074
|
31,193
|
29,360
|
14,798
|
|
Sorghum
|
3,229
|
1,049
|
606
|
732
|
448
|
|
Sunflower
|
-
|
951
|
2,181
|
55
|
-
|
|
Cotton
|
3,236
|
-
|
-
|
-
|
-
|
|
Others
|
3,840
|
1,947
|
1,171
|
2,150
|
5,284
|
|
Total Crops
(tons)
|
346,657
|
156,372
|
303,889
|
263,988
|
206,699
|
|
Sugarcane
(tons)
|
1,634,521
|
1,431,109
|
911,759
|
554,260
|
877,396
|
(1)
Includes Brasilagro,
Acres del Sud, Ombú, Yatay and Yuchán. Excludes
Agro-Uranga.
|
Volume of
|
6M20
|
6M19
|
6M18
|
6M17
|
6M16
|
||||||||||
|
Sales (1)
|
D.M
|
F.M
|
Total
|
D.M
|
F.M
|
Total
|
D.M
|
F.M
|
Total
|
D.M
|
F.M
|
Total
|
D.M
|
F.M
|
Total
|
|
Corn
|
238.4
|
54.3
|
292.7
|
113.0
|
-
|
113.0
|
206.0
|
6.0
|
212.0
|
196.1
|
-
|
196.1
|
93.7
|
37.9
|
131.6
|
|
Soybean
|
117.0
|
42.3
|
159.3
|
53.0
|
42.6
|
95.6
|
69.8
|
5.8
|
75.6
|
53.1
|
-
|
53.1
|
86.9
|
8.5
|
95.4
|
|
Wheat
|
19.7
|
-
|
19.7
|
13.4
|
-
|
13.4
|
23.4
|
-
|
23.4
|
1.2
|
1.0
|
2.2
|
6.2
|
28.9
|
35.1
|
|
Sorghum
|
-
|
-
|
-
|
0.2
|
-
|
0.2
|
-
|
-
|
-
|
0.7
|
-
|
0.7
|
0.3
|
-
|
0.3
|
|
Sunflower
|
5.8
|
-
|
5.8
|
2.1
|
-
|
2.1
|
0.5
|
-
|
0.5
|
0.6
|
-
|
0.6
|
4.7
|
-
|
4.7
|
|
Cotton
|
1.8
|
1.4
|
3.2
|
-
|
-
|
-
|
-
|
-
|
-
|
-
|
-
|
-
|
-
|
-
|
-
|
|
Others
|
2.1
|
-
|
2.1
|
0.2
|
-
|
0.2
|
0.8
|
-
|
0.8
|
2.1
|
-
|
2.1
|
2.7
|
-
|
2.7
|
|
Total Crops (thousands of
tons)
|
384.8
|
98.0
|
482.8
|
181.9
|
42.6
|
224.5
|
300.5
|
11.8
|
312.3
|
253.8
|
1.0
|
254.8
|
194.5
|
75.3
|
269.8
|
|
Sugarcane (thousands of
tons)
|
1,572.8
|
-
|
1,572.8
|
1,414.6
|
-
|
1,414.6
|
1,234.8
|
-
|
1,234.8
|
554,1
|
-
|
554,1
|
827,3
|
-
|
827,3
|
D.M.:
Domestic market
F.M.:
Foreign market
(1) Includes
Brasilagro, CRESCA at 50%, Acres del Sud, Ombú, Yatay and
Yuchán. Excludes Agro-Uranga.
5
Cresud Sociedad Anónima,
Comercial, Inmobiliaria, Financiera y
Agropecuaria
Summary as of
December 31, 2019
The result of the
Grains activity decreased ARS 64 million, from ARS 485 million gain
during the first half of 2019 to ARS 549 million gain during the
same period of 2020, mainly as a result of:
●
Better results in
Argentina due to the price increase generated by the peso
devaluation, boosted by greater grain stocks from 18-19 campaign,
which impacts as a higher gain both in the holding result an in the
gross sales margin.
●
The mentioned
results are partially offset by lower results obtained in Brazil
due to the lower progress in soybean and the increase in
administrative expenses assigned to the segment, as well as a
negative variation in the productive result from Bolivia, mainly
due to lower prices, yields and cultivated hectares of soybean,
slightly offset by higher prices and cultivated hectares of
corn.
The result of the
Sugarcane activity increased ARS 554 million, from a ARS 488
million gain in the first half of 2019 to ARS 1,042 million gain in
the same period of 2020. This is mainly due to a higher profit in
Brazil as a result of an increase in productive result due to
better yields, higher total sugar obtained and better
prices.
|
Area in Operation (hectares)
(1)
|
As of
12/31/19
|
As of
12/31/18
|
YoY Var
|
|
Own
farms
|
103,548
|
97,658
|
6.0%
|
|
Leased
farms
|
136,997
|
139,159
|
-1.6%
|
|
Farms under
concession
|
25,609
|
21,801
|
17.5%
|
|
Own farms leased to
third parties
|
13,837
|
14,325
|
-3.4%
|
|
Total Area Assigned to
Production
|
279,991
|
272,943
|
2.6%
|
The area in
operation assigned to the crops and sugarcane activity increased by
2.6% as compared to the same period of the previous fiscal
year.
II.b) Cattle
Production
|
Production Volume (1)
|
6M20
|
6M19
|
6M18
|
6M17
|
6M16
|
|
Cattle herd
(tons)
|
5,354
|
5,467
|
4,731
|
4,448
|
3,717
|
|
Milking cows
(tons)
|
-
|
-
|
186
|
258
|
311
|
|
Cattle
(tons)
|
5,354
|
5,467
|
4,917
|
4,706
|
4,028
|
(1)
Includes Carnes
Pampeanas
|
Volume of
|
6M20
|
6M19
|
6M18
|
6M17
|
6M16
|
||||||||||
|
Sales (1)
|
D.M
|
F.M
|
Total
|
D.M
|
F.M
|
Total
|
D.M
|
F.M
|
Total
|
D.M
|
F.M
|
Total
|
D.M
|
F.M
|
Total
|
|
Cattle
herd
|
9.3
|
-
|
9.3
|
4.9
|
-
|
4.9
|
5.5
|
-
|
5.5
|
4.3
|
-
|
4.3
|
5.7
|
-
|
5.7
|
|
Milking
cows(2)
|
-
|
-
|
-
|
-
|
-
|
-
|
1.3
|
-
|
1.3
|
0.7
|
-
|
0.7
|
0.3
|
-
|
0.3
|
|
Cattle (thousands of
tons)
|
9.3
|
-
|
9.3
|
4.9
|
-
|
4.9
|
6.8
|
-
|
6.8
|
5.0
|
-
|
5.0
|
6.0
|
-
|
6.0
|
D.M.:
Domestic market
F.M.:
Foreign market
(1)
Includes Carnes
Pampeanas
6
Cresud Sociedad Anónima,
Comercial, Inmobiliaria, Financiera y
Agropecuaria
Summary as of December 31,
2019
Cattle
|
In ARS
Million
|
6M 20
|
6M 19
|
YoY Var
|
|
Revenues
|
766
|
395
|
93.9%
|
|
Costs
|
-654
|
-339
|
92.9%
|
|
Initial recognition
and changes in the fair value of biological assets and agricultural
produce
|
-74
|
-243
|
-69.5%
|
|
Gross gain /
(loss)
|
38
|
-187
|
-
|
|
General and
administrative expenses
|
-44
|
-41
|
7.3%
|
|
Selling
expenses
|
-56
|
-40
|
40.0%
|
|
Other operating
results, net
|
2
|
-2
|
-
|
|
Loss from
operations
|
-60
|
-270
|
-77.8%
|
|
Segment
loss
|
-60
|
-270
|
-77.8%
|
|
Area in operation –
Cattle (hectares) (1)
|
As of
12/31/19
|
As of
12/31/18
|
YoY Var
|
|
Own
farms
|
72,061
|
79,071
|
-8.9%
|
|
Leased
farms
|
12,635
|
14,135
|
-10.6%
|
|
Farms under
concession
|
2,993
|
2,703
|
10.7%
|
|
Own farms leased to
third parties
|
1,775
|
1,775
|
-
|
|
Total Area Assigned to Cattle
Production
|
89,464
|
97,684
|
-8.4%
|
(1)
Includes AgroUranga, Brazil and Paraguay,
|
Stock of Cattle
Heard
|
As of
12/31/19
|
As of
12/31/18
|
YoY Var
|
|
Breeding
stock
|
85,423
|
88,755
|
-3.8%
|
|
Winter grazing
stock
|
16,860
|
18,502
|
-8.9%
|
|
Sheep
stock
|
11,071
|
10,402
|
6.4%
|
|
Total Stock
(heads)
|
113,354
|
117,659
|
-3.7%
|
The result of the
Cattle activity increased by ARS 210 million: from a ARS 270
million loss during the first half of fiscal year 2019 to a ARS 60
million loss in the same period of 2020, as a result of a positive
variation in the holding result as well as selling results of live
cattle, because prices for this fiscal year raised at a higher pace
than inflation.
II.c) Agricultural Rental and
Services
|
in ARS
million
|
6M 20
|
6M 19
|
YoY Var
|
|
Revenues
|
111
|
120
|
-7.5%
|
|
Costs
|
-60
|
-58
|
3.4%
|
|
Gross
profit
|
51
|
62
|
-17.7%
|
|
General and
Administrative expenses
|
-28
|
-32
|
-12.5%
|
|
Selling
expenses
|
-12
|
-15
|
-20.0%
|
|
Other operating
results, net
|
-
|
-2
|
-100.0%
|
|
Profit from
operations
|
11
|
13
|
-15.4%
|
|
Segment
profit
|
11
|
13
|
-15.4%
|
The result of the
activity decreased by ARS 2 million, from a ARS 13 million gain in
the first half of 2019 to a ARS 11 million gain in the same period
of 2020.
III) Other
Segments
We include within
"Others" the results coming from our Agroindustrial activity,
developed in our meatpacking facility in La Pampa and our
investment in FyO.
7
Cresud Sociedad Anónima,
Comercial, Inmobiliaria, Financiera y
Agropecuaria
Summary as of
December 31, 2019
The result of the
segment increased by ARS 158 million, going from an ARS 311 million
gain for the first half of fiscal year 2019 to a gain of ARS 469
million for the same period of 2020 mainly due
to:
●
A higher gain from
the meatpacking facility as a result of the growth of external
market sales over total sales (20% in 1H19 vs. 40% in 1H20) along
with the positive impact of the exchange rate depreciation,
additionally local market sales decreased but their prices remained
slightly above inflation. Additionally, during this period, the
fattening of own live cattle generated a gain due to the price
increase although the volume was lower in number of
heads.
●
A positive variation
in associates results related to the capital increase in Agrofy
S.A.
●
The abovementioned
effects are partially offset by a lower profit from FyO grain
trading operations due to the fact that in this year lower margins
were obtained in the collection positions, although offset by the
financial results generated by the effect of exchange rate
variations and rates in these positions that are not captured at
the level of the operating result. Additionally, sales gross margin
of inputs was reduced as a result of the increase in intermediation
costs generated by the expansion strategy initiated in December
2018. Likewise, this trend in the operating result was partially
offset by better results of the commissions of brokerage of grains,
product of the greater volumes transacted.
|
In ARS
million
|
6M 20
|
6M 19
|
YoY Var
|
|
Revenues
|
4,474
|
3,664
|
22.1%
|
|
Costs
|
-3,727
|
-2,906
|
28.3%
|
|
Initial recognition
and changes in the fair value of biological assets and agricultural
produce at the point of harvest
|
19
|
-24
|
-
|
|
Gross
profit
|
766
|
734
|
4.4%
|
|
General and
administrative expenses
|
-135
|
-124
|
8.9%
|
|
Selling
expenses
|
-378
|
-306
|
23.5%
|
|
Other operating
results, net
|
89
|
25
|
256.0%
|
|
Profit from
operations
|
342
|
329
|
4.0%
|
|
Profit from
associates
|
127
|
-18
|
-
|
|
Segment
Profit
|
469
|
311
|
50.8%
|
|
EBITDA
|
372
|
352
|
5.7%
|
|
Adjusted
EBITDA
|
372
|
352
|
5.7%
|
IV) Corporate
Segment
The negative result
of the segment increased by ARS 7 million, going from a loss of ARS
107 million in the first half of 2019 to a loss of ARS 100 million
for the same period of 2020.
|
In ARS
million
|
6M 20
|
6M 19
|
YoY Var
|
|
General and
administrative expenses
|
-101
|
-109
|
-7.3%
|
|
Loss from
operations
|
-101
|
-109
|
-7.3%
|
|
Segment
loss
|
-101
|
-109
|
-7.3%
|
|
EBITDA
|
-100
|
-107
|
-6.5%
|
|
Adjusted
EBITDA
|
-100
|
-107
|
-6.5%
|
8
Cresud Sociedad Anónima,
Comercial, Inmobiliaria, Financiera y
Agropecuaria
Summary as of
December 31, 2019
Urban Properties and
Investments Business (through our subsidiary IRSA Inversiones y
Representaciones Sociedad Anónima)
We develop our Urban
Properties and Investments segment through our subsidiary IRSA. As
of December 31, 2019, our direct and indirect equity interest in
IRSA was 62.4% over stock capital.
Consolidated Results of our
Subsidiary IRSA Inversiones y Representaciones
S,A,
|
In
ARS million
|
6M
20
|
6M
19
|
YoY
Var
|
|
Revenues
|
42,773
|
39,719
|
7.7%
|
|
Profit / (loss) from
operations
|
6,939
|
-3,335
|
-
|
|
EBITDA
|
13,854
|
1,303
|
963.2%
|
|
Adjusted
EBITDA
|
11,625
|
10,050
|
15.7%
|
|
Segment
Result
|
5,372
|
-4,512
|
-
|
Consolidated revenues
from sales, rentals and services increased by 7.7% in the first
half of fiscal year 2020 compared to the same period in 2019, while
adjusted EBITDA, which excludes the effect of the result from
changes in the unrealized fair value of investment properties
reached ARS 11,625 million, 15.7% higher than the same period of
fiscal year 2019.
Argentina Business
Center
|
In
ARS million
|
6M
20
|
6M
19
|
YoY
Var
|
|
Revenues
|
8,006
|
8,799
|
-9.0%
|
|
Profit / (loss) from
operations
|
7,185
|
-5,737
|
-
|
|
EBITDA
|
7,425
|
-5,584
|
-
|
|
Adjusted
EBITDA
|
3,411
|
3,651
|
-6.6%
|
Israel Business
Center
|
In
ARS million
|
6M
20
|
6M
19
|
YoY
Var
|
|
Revenues
|
34,767
|
30,920
|
12.4%
|
|
(Loss) / profit from
operations
|
-246
|
2,402
|
-110.2%
|
|
EBITDA
|
6,429
|
6,887
|
-6.7%
|
|
Adjusted
EBITDA
|
8,214
|
6,399
|
28.4%
|
Financial Indebtedness and
Other
The following tables
contain a breakdown of company’s
indebtedness:
Agricultural
Business
|
Description
|
Currency
|
Amount (2)
|
Interest
Rate
|
Maturity
|
|
Bank
overdrafts
|
ARS
|
50.0
|
Variable
|
< 30
days
|
|
Cresud 2020 NCN,
Series XXIV
|
USD
|
73.6
|
9.00%
|
Nov-20
|
|
Cresud 2020 NCN,
Series XXV
|
USD
|
59.6
|
9.00%
|
Jul-21
|
|
Cresud 2023 NCN,
Series XXIII (1)
|
USD
|
113.0
|
6.50%
|
Feb-23
|
|
Other
debt
|
USD
|
152.4
|
-
|
-
|
|
CRESUD’s Total Debt
(3)
|
|
448.6
|
|
|
|
Cash and cash equivalents
(3)
|
|
5.5
|
|
|
|
Total Net
Debt
|
|
443.1
|
|
|
|
Brasilagro’s Total Net
Debt
|
|
44.9
|
|
|
(1) Net
of repurchases
(2)
Principal amount stated in USD (million) at an exchange rate of
59.89 ARS/USD and 4.023 BRL/USD, without considering accrued
interest or elimination of balances with
subsidiaries.
(3)
CRESUD stand-alone.
9
Cresud Sociedad Anónima,
Comercial, Inmobiliaria, Financiera y
Agropecuaria
Summary as of
December 31, 2019
Urban Properties and
Investments Business
Operations Center in
Argentina
The following table
describes our total debt as of December 31,
2019:
|
Description
|
Currency
|
Amount (1)
|
Interest
Rate
|
Maturity
|
|
Bank
overdrafts
|
ARS
|
20.7
|
Floating
|
< 360
days
|
|
Series II
Non-Convertible Notes (USD)
|
USD
|
71.4
|
11.50%
|
Jul-20
|
|
Series II
Non-Convertible Notes (CLP)
|
CLP
|
42.1
|
10.50%
|
Aug-20
|
|
Series I
Non-Convertible Notes
|
USD
|
181.5
|
10.00%
|
Nov-20
|
|
Loan with IRSA
CP
|
USD
|
26.5
|
-
|
Nov-22
|
|
Other
debt
|
USD
|
26.5
|
-
|
Feb-22
|
|
IRSA’s Total
Debt
|
|
368.7
|
|
|
|
Cash & Cash
Equivalents + Investments (3)
|
USD
|
1.2
|
|
|
|
IRSA’s Net
Debt
|
USD
|
367.5
|
|
|
|
Bank
overdrafts
|
ARS
|
7.9
|
-
|
< 360
d
|
|
IRCP NCN Class
IV(2)
|
USD
|
133.9
|
5.0%
|
Sep-20
|
|
PAMSA
loan
|
USD
|
35.0
|
Fixed
|
Feb-23
|
|
IRSA CP NCN Class
II
|
USD
|
360.0
|
8.75%
|
Mar-23
|
|
IRSA CP’s Total
Debt
|
|
536.8
|
|
|
|
Cash & Cash
Equivalents + Investments (3)
|
|
189.9
|
|
|
|
IRSA CP’S Net
Debt
|
|
346.9
|
|
|
(1) Principal amount in USD (million) at an
exchange rate of Ps. 59.89 ARS /USD, without considering accrued
interest or eliminations of balances with
subsidiaries.
(2) Net of repurchase.
(3) “Cash & Cash Equivalents plus
Investments” includes Cash & Cash Equivalents and
Investments in Current Financial Assets.
Israel Business
Center
Financial debt as of
December 31, 2019:
|
Indebtedness(1)
|
Net
(NIS million)
|
|
IDBD’s Total
Debt
|
1,817
|
|
DIC’s Total
Debt
|
2,875
|
Comparative Summary
Consolidated Balance Sheet Data
|
In ARS
million
|
Dec-19
|
Jun-19
|
|
Current
assets
|
193,970
|
192,579
|
|
Non-current
assets
|
354,597
|
446,572
|
|
Total
assets
|
548,567
|
639,151
|
|
Current
liabilities
|
132,795
|
112,737
|
|
Non-current
liabilities
|
332,132
|
414,434
|
|
Total
liabilities
|
464,927
|
527,171
|
|
Total capital and
reserves attributable to the shareholders of the controlling
company
|
14,951
|
21,163
|
|
Minority
interests
|
68,689
|
90,817
|
|
Shareholders’
equity
|
83,640
|
111,980
|
|
Total liabilities
plus minority interests plus shareholders’
equity
|
548,567
|
639,151
|
10
Cresud Sociedad Anónima,
Comercial, Inmobiliaria, Financiera y
Agropecuaria
Summary as of
December 31, 2019
Comparative Summary
Consolidated Statement of Income Data
|
In ARS
million
|
Dec-19
|
Dec-18
|
|
Gross
profit
|
19,797
|
16,931
|
|
Profit from
operations
|
8,951
|
-2,329
|
|
Share of profit of
associates and joint ventures
|
-1,502
|
-1,230
|
|
Profit / (loss) from
operations before financing and taxation
|
7,449
|
-3,559
|
|
Financial results,
net
|
-19,325
|
-11,485
|
|
Loss before income
tax
|
-11,876
|
-15,044
|
|
Income tax
expense
|
-3,090
|
3,375
|
|
Loss of the period
of continuous operations
|
-14,966
|
-11,669
|
|
Profit of
discontinued operations after taxes
|
16,639
|
3,042
|
|
Profit / (loss) for
the period
|
1,673
|
-8,627
|
|
Controlling
company’s shareholders
|
-4,746
|
-6,027
|
|
Non-controlling
interest
|
6,419
|
-2,600
|
Comparative Summary
Consolidated Statement of Cash Flow Data
|
In ARS
million
|
Dec-19
|
Dec-18
|
|
Net cash generated
by operating activities
|
19,465
|
8,077
|
|
Net cash generated
by / (used in) investment activities
|
13,584
|
-293
|
|
Net cash (used in) /
generated by financing activities
|
-48,086
|
3,986
|
|
Total net cash (used in) /
generated during the fiscal period
|
-15,037
|
11,770
|
Ratios
|
In ARS
million
|
Dec-19
|
Dec-18
|
|
Liquidity
(1)
|
1.461
|
1.708
|
|
Solvency
(2)
|
0.180
|
0.212
|
|
Restricted capital
(3)
|
0.646
|
0.699
|
(1)
Current Assets / Current Liabilities
(2) Total
Shareholders’ Equity/Total Liabilities
(3)
Non-current Assets/Total Assets
Material events of the
quarter and subsequent events
October 2019: Loan to
Inversiones Financieras del Sur S.A.
By letter dated
October 18, 2019, the Board of Directors of the company has
approved the granting of a loan of 3,235,000 American Depositary
Receipts (ADRs) of IRSA Inversiones y Representaciones Sociedad
Anónima, held by the Company, to Inversiones Financieras del
Sur S.A., a company controlled by the Company’s president.
The loan has been guaranteed by Inversiones Financieras del Sur
S.A. with shares of equivalent value.
Having consulted the
Audit Committee in the terms of Chapter III of the Rules of the
National Securities Commission, as well as articles 72 and 110 Inc.
h) Section IV of the Capital Market Law Nº26.831, it has
issued an opinion without objections to be made regarding the
transaction above mentioned. Such opinion is at disposal of the
Shareholders in the corporate headquarters.
October 2019: General
Ordinary and Extraordinary Shareholders’
Meeting
On October 30, 2019,
our General Ordinary and Extraordinary Shareholders’ Meeting
was held. The following matters. inter alia, were resolved by
majority of votes:
●
Absorb accumulated
losses as of June 30, 2019 with the special reserve and the special
reserve RG 609/12
●
Distribution of
treasury own shares for up to 13.000.000.
●
Designation of board
members.
●
Compensations to the
Board of Directors for the fiscal year ended June 30,
2019
11
Cresud Sociedad Anónima, Comercial, Inmobiliaria, Financiera y
Agropecuaria
Summary
as of December 31, 2019
●
Capital increase for
up to the sum of nominal value ARS 180,000,000, by issuing up to
180,000,000 ordinary shares of ARS 1 Nominal Value each and one
vote per share equivalent to 33.49% of the current Capital
Stock.
●
Incentive plan for
employees. management and directors to be integrated without
premium for up to 1% of the Capital Stock.
November 2019: Distribution
of treasury shares
On November 14,
2019, the company distributed own treasury shares for a total of
13,000,000 ordinary shares. The distribution constitutes
0.02660982197 shares per ordinary share and 0.2660982197 per ADR,
which represents a percentage of 2.591485395% of the stock capital
of ARS 501.642.804.- and 2.660982197% of the stock capital net of
treasury shares.
January 2020:
BrasilAgro’s shares partial sale
As a subsequent
event, on January 20, 2020, the Company sold in the market
3,400,000 shares of its subsidiary BrasilAgro representatives of
5.98% of the share capital for an amount of USD 15.6
million.
November 2019 and January
2020: BrasilAgro’s merge with Agrifirma
As a subsequent
event, on January 27, 2020, and in accordance with the terms and
conditions established in the Merger Agreement signed on November
22, 2019, Agrifirma Holding was merged by BrasilAgro and
extinguished for all legal purposes, becoming BrasilAgro the
controlling shareholder of Agrifirma Agropecuária owning 100%
of the total voting share capital. The capital of BrasilAgro
increased by BRL 115,586,579.79 from BRL 584,224,000 to BRL
699,810,579.79, through the issuance of 5,215,385 new common,
registered, book-entry shares with no par value, which were
subscribed and paid-up by the shareholders of Agrifirma Holding, in
such manner that the share capital of BrasilAgro increased to
62,104,301 shares.
A subscription
warrant was also issued in favor of AB Holdings, a shareholder of
Agrifirma Holding, which will entitle AB Holding (or its permitted
successors and assigns) to subscribe up to 654,487 new ordinary
shares, registered with no par value of BrasilAgro, subject to the
terms and conditions established in the Merger
Agreement.
The merger was made
upon exchange of shares and the initial exchange rate was BRL 31.50
per share of BrasilAgro based on the net worth of BrasilAgro and
Agrifirma Holding, as of June 30, 2019 (taken into consideration,
especially, the properties owned by BrasilAgro and Agrifirma
Holding) as per the appraisal made by Deloitte Touche Tohmatsu
Consultores Ltda., adjusted in view of the negotiations between the
parties, in accordance with the Merger
Agreement.
As a result of
this transaction, Cresud' stake in BrasilAgro, net of treasury
shares, was reduced to approximately 33.6%.
January 2020: Notes
issuance
As a subsequent
event, on January 30, 2020, the Company issued in the local market
USD 51.4 million through the following Notes:
●
Series XXVI:
denominated and payable in ARS for ARS 1,095 million (equivalent to
USD 18.2 million) at a variable rate (private BADLAR + 6.5%) with
quarterly payments and principal expiring on January 30,
2021.
●
Series XXVII:
denominated in USD and payable in ARS at the applicable exchange
rate for USD 5.7 million at a fixed rate of 7.45%, with quarterly
payments and principal expiring on July 30,
2021
●
Series XXVIII:
denominated and payable in USD for USD 27.5 million at a fixed rate
of 9.0%, with quarterly payments and principal expiring on April
30, 2021.
12
Cresud Sociedad Anónima,
Comercial, Inmobiliaria, Financiera y
Agropecuaria
Summary as of
December 31, 2019
EBITDA
Reconciliation
In this summary
report, we present EBITDA and Adjusted EBITDA. We define EBITDA as
profit for the period excluding: (i) result of discontinued
operations, (ii) income tax expense, (iii) financial results, net
iv) results from participation in associates and joint ventures;
and (v) depreciation and amortization. We define Adjusted EBITDA as
EBITDA minus net profit from changes in the fair value of
investment properties, not realized, excluding barter agreement
results and devaluation of Mehadrin shares.
EBITDA
and Adjusted EBITDA are non-IFRS financial measures that do not
have standardized meanings prescribed by IFRS. We present EBITDA
and adjusted EBITDA because we believe they provide investors
supplemental measures of our financial performance that may
facilitate period-to-period comparisons on a consistent basis. Our
management also uses EBITDA and Adjusted EBITDA from time to time,
among other measures, for internal planning and performance
measurement purposes. EBITDA and Adjusted EBITDA should not be
construed as an alternative to profit from operations, as an
indicator of operating performance or as an alternative to cash
flow provided by operating activities, in each case, as determined
in accordance with IFRS. EBITDA and Adjusted EBITDA, as calculated
by us, may not be comparable to similarly titled measures reported
by other companies. The table below presents a reconciliation of
profit for the relevant period to EBITDA and Adjusted EBITDA for
the periods indicated:
|
For
the six-month period ended December 31 (in ARS
million)
|
||
|
|
2019
|
2018
|
|
Result for the
period
|
1.673
|
-8.627
|
|
Result from
discontinued operations
|
-16.639
|
-3.042
|
|
Income tax
expense
|
3.090
|
-3.375
|
|
Net financial
results
|
19.325
|
11.485
|
|
Share of profit of
associates and joint ventures
|
1.502
|
1.230
|
|
Depreciation and
amortization
|
7.517
|
4.923
|
|
EBITDA
(unaudited)
|
16.468
|
2.594
|
|
Unrealized loss/gain
from fair value of investment properties
|
-3,623
|
9,186
|
|
Realized gain from
fair value of investment properties -
Agribusiness
|
-
|
1,356
|
|
Depreciation of
associates and joint ventures
|
1,621
|
-
|
|
Barter Agreements
result
|
-239
|
-403
|
|
Adjusted EBITDA
(unaudited)
|
14,227
|
12,733
|
13
Cresud Sociedad Anónima,
Comercial, Inmobiliaria, Financiera y
Agropecuaria
Summary as of
December 31, 2019
Prospects for next
quarter
This fiscal year
presents challenges in Argentina, the region and the world. The
appreciation of international markets with respect to Argentina has
become unstable as a result of the country's economic crisis and
has influenced development expectations. Globally, we find the
existence of trade conflicts between different countries and a
slowdown in global growth that also has a negative impact on Latin
America. To this is added the situation in the region with some
political and economic instability.
Regarding
agribusiness, the 2020 Campaign is moving forward with good
climatic conditions in the region, finding all the crops planted
and expecting a good level of production, average yields and
controlled costs. In relation to commodity prices, the market is
expectant after the trade agreement reached between the US and
China, hoping it will materialize in new businesses that will
define the direction of the market. On the other hand, the
appearance in China of an infectious focus caused by the
Coronavirus virus could impact the demand of that country
generating volatility in the markets.
Regarding livestock
activity, prices were positively boosted in the second quarter of
the year due to the growth of meat exports to the Asian giant. We
will continue to focus on improving productivity and controlling
costs, working efficiently to achieve the highest possible
operating margins. We will continue to concentrate our production
in our own fields, mainly in the Northwest of Argentina and
consolidating our activity in Brazil.
Regarding Farmland
development, we hope to get the permits to increase the area under
development and migrate from livestock to agricultural hectares,
whose business is mainly for export, with more technology and
greater price predictability. Likewise, as part of our business
strategy, we will continue selling the farms that have reached
their maximum level of appreciation.
In relation to our
urban properties and investment segment, we expect that the
businesses from our subsidiary IRSA reflect good results in its two
operations centers: Argentina and Israel.
On the national and
international framework above mentioned, the Board of Directors of
the Company will continue evaluating financial, economic and / or
corporate tools that allow the Company to improve its position in
the market in which it operates and have the necessary liquidity to
meet its obligations. Within the framework of this analysis, the
indicated tools may be linked to corporate reorganization processes
(merger, spin-off or a combination of both), disposal of assets in
public and / or private form that may include real estate as well
as negotiable securities owned by the Company, incorporation of
shareholders through capital increases through the public offering
of shares to attract new capital -as it was approved in the
Shareholders’ Meeting that took place on October 30, 2019-,
repurchase of shares and instruments similar to those described
that are useful to the proposed objectives.
We believe that
Cresud, owner of a diversified rural and urban real estate
portfolio, with a management of many years of experience in the
sector and a great track record in accessing to the capital market,
will have great possibilities to take advantage of the best
opportunities that occur in the market.
Alejandro
G. Elsztain
CEO
14