f
UNITED STATES
SECURITIES AND EXCHANGE COMMISSION
Washington, D.C. 20549
FORM
(Mark One)
ANNUAL REPORT PURSUANT TO SECTION 13 OR 15(d) OF THE SECURITIES EXCHANGE ACT OF 1934 |
For the fiscal year ended
OR
TRANSITION REPORT PURSUANT TO SECTION 13 OR 15(d) OF THE SECURITIES EXCHANGE ACT OF 1934 |
Commission file number
(Exact Name of Registrant as Specified in Its Charter)
(State or Other Jurisdiction of Incorporation or Organization) | (I.R.S. Employer Identification No.) |
(Address of Principal Executive Offices) | (Zip Code) |
Registrant’s telephone number, including area code:
(
Securities registered pursuant to Section 12(b) of the Act:
Title of each class | Trading Symbol(s) | Name of each exchange on which registered |
The |
Securities registered pursuant to Section 12(g) of the Act: None
Indicate by check mark if the registrant is a well-known seasoned issuer, as defined in Rule 405 of the Securities Act.
Indicate by check mark if the registrant is not required to file reports pursuant to Section 13 or Section 15(d) of the Act. Yes ☐
Indicate by check mark whether the registrant (1) has filed all reports required to be filed by Section 13 or 15(d) of the Securities Exchange Act of 1934 during the preceding 12 months (or for such shorter period that the registrant was required to file such reports), and (2) has been subject to such filing requirements for the past 90 days.
Indicate by check mark whether the registrant has submitted electronically every Interactive Data File required to be submitted pursuant to Rule 405 of Regulation S-T (§232.405 of this chapter) during the preceding 12 months (or for such shorter period that the registrant was required to submit such files).
Indicate by check mark whether the Registrant is a large accelerated filer, an accelerated filer, a non-accelerated filer, smaller reporting company, or an emerging growth company. See the definitions of “large accelerated filer,” “accelerated filer,” “smaller reporting company,” and “emerging growth company” in Rule 12b-2 of the Exchange Act.
Accelerated filer ☐ | Emerging growth company | |||
Non-accelerated filer ☐ | Smaller reporting company |
If an emerging growth company, indicate by check mark if the registrant has elected not to use the extended transition period for complying with any new or revised financial accounting standards provided pursuant to Section 13(a) of the Exchange Act. ☐
Indicate by check mark whether the Registrant is a shell company (as defined in Rule 12b-2 of the Act).
Indicate by check mark whether the registrant has filed a report on and attestation to its management’s assessment of the effectiveness of its internal control over financial reporting under Section 404(b) of the Sarbanes-Oxley Act (15 U.S.C. 7262(b)) by the registered public accounting firm that prepared or issued its audit report.
If securities are registered pursuant to Section 12(b) of the Act, indicate by check mark whether the financial statements of the registrant included in the filing reflect the correction of an error to previously issued financial statements.
Indicate by check mark whether any of those error corrections are restatements that required a recovery analysis of incentive-based compensation received by any of the registrant’s executive officers during the relevant recovery period pursuant to §240.10D-1(b). ☐
The aggregate market value of the common stock held by non-affiliates of the registrant at June 30, 2023 (the last business day of the registrant’s most recently completed second quarter) was $
As of February 13, 2024, there were
DOCUMENTS INCORPORATED BY REFERENCE
Certain portions of the definitive Proxy Statement to be used in connection with the Registrant’s 2024 Annual Meeting of Stockholders are incorporated by reference into Part III of this Form 10-K.
VEECO INSTRUMENTS INC.
INDEX
2
This Annual Report on Form 10-K (“Form 10-K”) contains certain forward-looking statements within the meaning of the safe harbor provisions of the U.S. Private Securities Litigation Reform Act of 1995, as amended, relating to Veeco Instruments Inc. (together with its consolidated subsidiaries, “Veeco,” the “Company,” “Registrant,” “we,” “our,” or “us,” unless the context indicates otherwise) that are based on management’s expectations, estimates, projections, and assumptions. When used in this Form 10-K, words such as “expects,” “anticipates,” “plans,” “believes,” “scheduled,” “estimates,” and variations of these words and similar expressions are intended to identify forward-looking statements. Discussions containing such forward-looking statements may be found in Part I, Items 1 and 3, Part II, Items 7 and 7A hereof, as well as within this Form 10-K generally. Forward-looking statements in this discussion include, but are not limited to, those regarding anticipated growth and trends in our businesses and markets, industry outlooks and demand drivers, our investment and growth strategies, our development of new products and technologies, our business outlook for the current and future periods, our ongoing transformation initiative and the effects thereof on our operations and financial results, and other statements that are not historical facts. These statements and their underlying assumptions are subject to risks and uncertainties and are not guarantees of future performance. Factors that could cause actual results to differ materially from those expressed or implied by such statements include, without limitation:
Risks Related to Our Business and Industry
● | Unfavorable market conditions have adversely affected, and may continue to adversely affect, our operating results; |
● | We face significant competition; |
● | We operate in industries characterized by rapid technological change; |
● | Certain of our sales are dependent on the demand for consumer electronic products and automobiles, which can experience significant volatility; |
● | We have a concentrated customer base, located primarily in a limited number of regions, which operates in highly concentrated industries; |
● | The cyclicality of the industries we serve directly affects our business; |
● | Our failure to estimate customer demand accurately could result in inventory obsolescence, liabilities to our suppliers for products no longer needed, and manufacturing interruptions or delays which could affect our ability to meet customer demand; |
● | We rely on a limited number of suppliers, some of whom are our sole source for particular components; |
● | Our failure to successfully manage our outsourcing activities or failure of our outsourcing partners to perform as anticipated could adversely affect our results of operations; |
● | The timing of our orders, shipments, and revenue recognition may cause our quarterly operating results to fluctuate significantly; |
● | Our sales cycle is long and unpredictable; |
● | Our backlog is subject to customer cancellation or modification which could result in decreased sales, increased inventory obsolescence, and liabilities to our suppliers for products no longer needed; |
● | We are exposed to risks associated with business combinations, acquisitions, strategic investments and divestitures; |
Risks Associated with Operating a Global Business
● | We are exposed to risks of operating businesses outside the United States; |
3
● | Changes in U.S. trade policy and export controls and ongoing trade disputes between the U.S. and China have adversely affected, and may continue to adversely affect, our business, results of operations, and financial condition; |
● | We may be unable to obtain required export licenses for the sale of our products; |
● | We are exposed to various risks associated with global regulatory requirements; |
Risks Related to Intellectual Property and Cybersecurity
● | Disruptions in our information technology systems or data security incidents could result in significant financial, legal, regulatory, business, and reputational harm to us; |
● | We may be unable to effectively enforce and protect our intellectual property rights; |
● | We may be subject to claims of intellectual property infringement by others; |
Financial, Accounting and Capital Market Risks
● | Our operating results may be adversely affected by tightening credit markets; |
● | We are subject to foreign currency exchange risks; |
● | We may be required to take impairment charges on assets; |
● | Changes in accounting pronouncements or taxation rules, practices, or rates may adversely affect our financial results; |
● | Our current debt facilities may contain certain restrictions, covenants and repurchase provisions that may limit our ability to raise the funds necessary to meet our working capital needs, which may include the cash conversion of the Notes or repurchase of the Notes for cash upon a fundamental change; |
● | Issuance of our common stock, if any, upon conversion of the Notes, as well as the capped call transactions and the hedging activities of the option counterparties, may impair or reduce our ability to utilize our research and development credits carryforwards in the future; |
● | The capped call transactions may affect the value of the 2027 Notes and our common stock; |
General Risk Factors
● | The price of our common shares is volatile and could decrease; |
● | Our inability to attract, retain, and motivate employees could have a material adverse effect on our business; |
● | We are subject to risks of non-compliance with environmental, health, and safety regulations; |
● | We are exposed to risks associated with the increased attention by our stakeholders to environmental, social and governance (“ESG”) matters; and |
● | We have adopted certain measures that may have anti-takeover effects which may make an acquisition of our Company by another company more difficult. |
4
All forward-looking statements speak only to management’s expectations, estimates, projections and assumptions as of the date of this filing or, in the case of any document referenced herein or incorporated by reference, the date of that document. The Company does not undertake any obligation to update or publicly revise any forward-looking statements to reflect events, circumstances or changes in expectations after the date of this filing.
PART I
Item 1. Business
Business Description and Overview
Headquartered in Plainview, New York, we were organized as a Delaware corporation in 1989. We are a manufacturer of advanced semiconductor process equipment that solves an array of challenging materials engineering problems for our customers. Our comprehensive collection of ion beam, laser annealing, metal organic chemical vapor deposition (“MOCVD”), chemical vapor deposition (“CVD”), advanced packaging lithography, single wafer wet processing, molecular beam epitaxy (“MBE”), and atomic layer deposition (“ALD”) technologies play an integral role in the fabrication of key devices that are enabling the 4th industrial revolution of all things connected. Such devices include leading advanced node application processors for AI chips, mobile devices, high-speed data communications, and radio frequency (“RF”) filters and power amplifiers for fifth generation (“5G”) networks and mobile electronics, photonics devices for 3D sensing, advanced displays, and thin film magnetic heads for hard disk drives in data storage. In close partnership with our customers, we combine decades of applications and materials know-how with leading-edge systems engineering to deliver high-volume manufacturing solutions with competitive cost of ownership. Serving a global and highly interconnected customer base, we have comprehensive sales and service operations across the Asia-Pacific, Europe, and North America regions to ensure real-time close collaboration and responsiveness.
Markets
Our products are purchased by customers in the following four end-markets: 1) Semiconductor; 2) Compound Semiconductor; 3) Data Storage; and 4) Scientific & Other.
Our array of process equipment systems are used in the production of a broad range of microelectronic components, including logic, dynamic random-access memory (“DRAM”), photonics devices (including laser diodes and micro-LEDs), power electronics, RF filters and amplifiers, magnetic heads for hard disk drives, and other semiconductor devices. Many of our systems are used to deposit advanced materials critical to the operation of the device and some of our systems are used in cleaning and surface preparation as well as the precise removal of critical materials. We are also a leader in systems used in the advanced packaging process flow of microelectronic components such as flip chip, fan-out wafer level packaging (“FOWLP”), and other wafer level packaging approaches used in the modern integration of diverse semiconductor products, especially in consumer electronics. In general, our customers purchase our systems to both produce current-generation devices in volume and to develop next-generation products which deliver more efficient, cost-effective, and advanced technological solutions. We operate in several highly cyclical business environments, and our customers’ buying patterns are dependent upon industry trends and buying patterns for consumer electronics. As our products are sold into multiple markets, the following table describes these markets and the applicable Veeco technologies.
Markets | Description | Applicable Veeco Technologies |
Semiconductor | The Semiconductor market refers to process steps in logic and memory applications where silicon wafers are processed. There are many different wafer level process steps in forming patterned wafers, such as deposition, etching, masking, and doping. As device architectures continue to shrink with advanced nodes, more precise process control is paramount to achieving high yields and competitive cost. One such process step is called Laser Annealing, | ● Laser Annealing ● Ion Beam Deposition (“IBD”)
● Ion Beam Etch (“IBE”) ● Wet Processing ● Advanced Packaging Lithography |
5
which uses a very precise method to activate dopants, reduce contact resistance and modify material grain structure. The Veeco laser annealing technology enables our customers to have a lower thermal budget by annealing at higher temperatures over a shorter period of time. This market also includes mask blank production for extreme ultraviolet (“EUV”) lithography, where Veeco’s Ion Beam Deposition technology is used for deposition of the multi-layer EUV reflective coating. Veeco’s Ion Beam technology is also under evaluation for deposition of low resistivity metals for 300mm front end applications. Veeco’s Advanced Packaging technologies include a portfolio of wafer-level assembly technologies that enable improved performance of electronic products, such as smartphones, high-end servers, and graphical processors. Demand for higher performance, smaller form factors, and lower power consumption in applications such as artificial intelligence, mobile devices, consumer electronics, and high-performance computing is driving the adoption of advanced packaging technologies. Veeco serves the advanced packaging market with lithography as well as wet processing equipment. |
6
Compound Semiconductor | The Compound Semiconductor market includes Power Electronics, Photonics, RF Filters and Amplifiers, and Solar power applications. Power Electronics refers to semiconductor devices used in the control and conversion of electric power in growing applications such as wireless charging of consumer electronics and automotive applications. The power electronics market has historically been dominated by silicon devices. However, demand has been rapidly growing for applications in automotive driven by adoption of electric vehicles (“EV”), energy and industrial end-markets which require compound semiconductor devices such as those made from gallium nitride and silicon carbide to address higher voltages and higher power requirements. Photonics refers to light source technologies and laser-based solutions for 3D sensing, datacom and telecom applications. This includes micro-LED, laser diodes, edge emitting lasers and vertical cavity surface emitting lasers (“VCSELs”). Micro-LEDs may be used for next generation advanced displays. A micro-LED display is a self-emissive display that offers improved resolution, contrast, and brightness versus conventional technologies. Micro-LEDs will be used in a number of applications from televisions, smartwatches, to augmented reality headsets. RF power amplifiers and filters (including surface acoustic wave (“SAW”) and bulk acoustic wave (“BAW”) filters) are used in 5G communications infrastructure, smartphones, tablets, and mobile devices. They make use of radio waves for wireless broadcasting and/or communications. Solar power or photovoltaic technology refers to power obtained by harnessing the energy of the sun through the use of compound semiconductor devices such as photovoltaics. | ● Gallium Nitride (“GaN”) MOCVD ● Arsenides/ Phosphides (“As/P”) MOCVD ● Wet Processing ● MBE ● ALD ● IBE ● SiC Chemical Vapor Deposition (“CVD”) |
Data Storage | Data Storage refers to the Hard Disk Drives (“HDD”) market which provides significant value for mass storage and is an important part of large capacity storage applications such as Data Centers. Our systems enable customers to manufacture the magnetic heads for hard disk drives. | ● IBD ● IBE ● Physical Vapor Deposition ● Mechanical (Lapping and Dicing) ● Diamond Like Carbon Deposition ● Wet Processing |
7
Scientific & Other | Scientific & Other refers to advanced materials and device research such as quantum computing, and a range of manufacturing applications including optical devices (lasers, mirrors, optical filters, and anti-reflective coatings). | ● Ion Beam Sputtering for optical coatings ● MBE for specialized laser and sensor devices ● Wet Processing for sensors ● ALD for a variety of applications |
System Products
Laser Annealing Systems
Our laser annealing systems meet the industry demand for ultra-short time-scale “millisecond” annealing, heating the wafer up to temperatures just below the silicon melting point, enabling thermal annealing solutions at the most advanced semiconductor process nodes. This unique annealing technology provides a solution to the difficult challenge of fabricating ultra-shallow junctions and highly activated source/drain contacts at advanced logic nodes. In addition, our proprietary hardware design enables outstanding temperature uniformity across the wafer and die, by minimizing the pattern-density effect, thus reducing absorption variations.
Our next generation nanosecond annealing technology targets annealing advanced logic devices and memory devices at advanced nodes. As devices scale, achieving performance targets has become a challenge. To continue the roadmap, the industry is looking at new materials and the use of thermal processes that require nanosecond time-scale thermal annealing with temperatures exceeding the melting point. We believe that our nanosecond annealing will be required to meet the device targets at future nodes and complements our millisecond annealing solutions.
Ion Beam Deposition and Etch Systems
Our NEXUS® Ion Beam systems and IBD300 systems are used to deposit and etch thin film layers for multiple end applications in the Semiconductor, Data Storage, RF and other various emerging markets. Our NEXUS® IBD system has a leading position in multiple markets including EUV mask blank manufacturing in which it enables our customers to deposit multilayers with high precision and ultra-low defects which is essential for EUV lithography. Our IBD300 system is being evaluated for 300mm front end semiconductor applications where low resistivity metals like tungsten, ruthenium and molybdenum are critical. The IBD systems are also critical in the manufacture of hard disk drive magnetic heads where they are used to deposit various magnetic and oxide layers and deliver best-in-class film properties. Our NEXUS® IBE systems are used to precisely etch complex features on materials which are challenging to pattern by traditional reactive ion etching techniques. These systems are widely used in the data storage industry for patterning of magnetic and oxide materials and are essential for forming the precise shape of the magnetic head. The NEXUS® systems may be included on our cluster system platform to allow either parallel or sequential deposition/etch processes.
Our SPECTOR® Ion Beam Sputtering system was developed for high precision optical coatings and offers manufacturers state of the art optical thickness monitoring, improved productivity, and target material utilization, for cutting-edge optical interference coating applications. We also provide a broad array of ion beam sources.
8
Advanced Packaging Lithography
Our lithography equipment is used in the Advanced Packaging market for applications such as FOWLP, Flip Chip (including Copper Pillar), Fan In Wafer Lever Packaging, 3D stacking, interposers and embedded die. The Advanced Packaging market is driven by the need for improved performance, reduced power consumption, and the ability to image smaller geometries for mobile and automotive applications. These applications continue to demand increasingly complex packaging techniques and heterogeneous device integration from integrated device manufacturers (“IDMs,”), Foundries, and outsourced semiconductor assembly and test (“OSAT”) companies. Our Advanced Packaging tools are designed to optimize productivity for leading-edge 200mm and 300mm Advanced Packaging applications by delivering proven reliability and low cost of ownership in high-volume manufacturing environments. Our products are known for best-in-class yield coupled with outstanding resolution and depth of focus.
Single Wafer Wet Processing
We offer single wafer wet processing, and surface preparation systems which target growth opportunities in advanced packaging applications in the Semiconductor market as well as RF filters and amplifiers in the Compound Semiconductor market. The WaferStorm® platform is based on our unique ImmJET™ technology, which provides improved performance at a lower cost of ownership than conventional wet bench-only or spray-only approaches. This highly flexible platform targets solvent-based cleaning applications that require a significant level of process control and flexibility. The WaferEtch® platform provides highly uniform, selective etching with onboard end-point detection for improved process control and yield in bumping applications. In addition, we have developed a state-of-the-art solution with the WaferEtch® platform to address the requirements of wafer thinning.
Metal Organic Chemical Vapor Deposition Systems and Chemical Vapor Deposition Systems
MOCVD production systems are used to make GaN and As/P-based devices for applications including power electronics, RF devices, specialty LED, display, and many other photonics applications. Our proven TurboDisc® technology is at the heart of our MOCVD systems and is the key to enabling best-in-class deposition uniformity, yield performance and cost per wafer savings for our customers with a combined advantage of high operating uptime and low maintenance costs. Our Lumina® platform is used for As/P deposition, and features long campaigns and low defectivity for exceptional yield and flexibility. Our Propel® series enables the development of highly-efficient GaN-based power electronics, RF devices and advanced GaN-on-silicon micro-LEDs. The Propel® system offers 200mm and fully-automated 300mm technology and incorporates single-wafer reactor technology for outstanding film uniformity, yield, and device performance. Our SiC CVD system has a base single wafer reactor concept based on a time-tested industry validated architecture and is used for SiC power electronics applications primarily driven by adoption of electric vehicles.
Molecular Beam Epitaxy Systems
MBE is the process of precisely depositing atomically-thin epitaxial crystalline layers, or epilayers, of elemental materials onto a substrate in an ultra-high vacuum environment. We are a leading supplier of MBE systems worldwide.
Our MBE systems, sources, and components are used to develop and manufacture compound semiconductor devices in a wide variety of applications such as quantum computing, high-power fiber lasers, infrared detectors, mobile phones, radar systems, high efficiency solar cells, and advanced materials science research in academic, governmental, and industrial organizations. The GENxplor® MBE system creates high quality epitaxial layers and is ideal for cutting-edge research on a wide variety of materials including III-V GaAs, nitride, and oxide, materials on substrates up to 3” diameter.
9
Atomic Layer Deposition Systems
ALD is a thin-film deposition method in which a film is deposited on a substrate uniformly with precise control down to the atomic scale. Veeco offers a full suite of ALD systems for non-semiconductor front-end production applications across a wide range of markets and applications such as Quantum Computing, optical, electronics, micro-electro mechanical systems (“MEMS”), nanostructures, and biomedical.
Other Systems
We have other deposition systems including Physical Vapor Deposition, Diamond-Like Carbon Deposition, and Chemical Vapor Deposition Systems primarily sold to the data storage market. In addition, we have mechanical systems such as saws and lappers for the data storage industry as well as the power semiconductor market. Finally, we have Gas-mixing systems primarily sold to the semiconductor market. We also continue to focus on penetrating adjacent markets with organically developed and acquired technology.
Sales and Service
We sell our products and services worldwide through various strategically located facilities in the United States, Europe, and the Asia-Pacific region. We believe that our customer service organization is a significant factor in our success. We provide service and support on a warranty, service contract, and an individual service-call basis. We believe that offering timely support creates stronger relationships with customers. Revenue from the sales of parts, upgrades, service, and support represented approximately 22%, 24%, and 28% of our net sales for the years ended December 31, 2023, 2022, and 2021, respectively. Parts and upgrade sales represented approximately 17%, 18%, and 21% of our net sales for those years, respectively, and service and support sales were 5%, 6%, and 7% respectively.
Customers
We sell our products to many of the world’s semiconductor IDMs and Foundries, OSAT, HDD, and photonics manufacturers, as well as research centers and universities. We rely on certain principal customers for a significant portion of our sales. If these principal customers discontinue their relationships with us or suffer economic difficulties, our business prospects, financial condition, and operating results could be materially and adversely affected.
Research and Development
Our research and development functions are focused on the timely creation of new products and enhancements to existing products, both of which are necessary to maintain our competitive position. We collaborate with our customers to align our technology and product roadmaps to customer requirements. Our research and development activities take place at our facilities in San Jose, California; Plainview, New York; Horsham, Pennsylvania; Somerset, New Jersey; St. Paul, Minnesota; Waltham, Massachusetts; and Solvegatan, Sweden.
Suppliers
We outsource certain functions to third parties, including the manufacture of several of our systems. While we rely on our outsourcing partners to perform their contracted functions, we maintain some level of internal manufacturing capability for these systems. Refer to Item 1A, “Risk Factors,” for a description of risks associated with our reliance on suppliers and outsourcing partners.
Backlog
Our backlog consists of orders for which we received a firm purchase order, a customer-confirmed shipment date generally within twelve months, and a deposit, when required. Our backlog was $490.7 million and $499.9 million at December 31, 2023 and 2022, respectively.
10
Competition
In each of the markets that we serve, we face competition from established competitors, some of which have greater financial, engineering, and marketing resources than we do, as well as from smaller competitors. In addition, many of our products face competition from alternative technologies, some of which are more established than those used in our products. Significant factors for customer selection of our tools include system performance, accuracy, repeatability, ease of use, reliability, cost of ownership, and technical service and support. None of our competitors compete with us across all of our product lines.
Our principal competitors include: Aixtron; Applied Materials; Canon; Grand Plastics Technology; Mattson; Screen Semiconductor Solutions; Shanghai Micro Electronics Equipment; and Suss MicroTec.
Intellectual Property
Our success depends, in part, on our proprietary technology, and we have over 350 patents in the United States and other countries.
We have patents and exclusive and non-exclusive licenses to patents owned by others covering certain of our products, which we believe provide us with a competitive advantage. We have a policy of seeking patents on inventions concerning new products and improvements as part of our ongoing research, development, and manufacturing activities. We believe that there is no single patent or exclusive or non-exclusive license to patents owned by others that is critical to our operations, as the success of our business depends primarily on the technical expertise, innovation, customer satisfaction, and experience of our employees. Refer to Item 1A, “Risk Factors,” for a description of risks associated with intellectual property.
Human Capital Resources
Veeco’s global workforce spans twelve countries around the world. At the end of 2023, we had 1,215 employees with 267 located in the Asia-Pacific region, 58 in the EMEA region, and 890 in the United States. Approximately 25% of our employees are involved in research and development; 56% in operations, manufacturing, service, and quality assurance; and 19% in sales, order administration, marketing, finance, information technology, general management, and other administrative functions. Our success depends on our ability to attract, retain, and motivate employees. We compete for talent with other companies and organizations. We consider our relations with the Veeco United Team to be favorable. We are subject to various federal, state, and local regulations, and regularly monitor all key employment activities, such as hiring, termination, pay and working practices to ensure compliance with such regulations. In addition, we may supplement the Veeco United Team with contractors and other temporary workers.
Our Core Values
All Veeco employees are expected to honor our Core Values, which define the way we conduct our business in everyday actions and choices and form the foundation of our culture:
● | We will always put our CUSTOMERS first |
● | We will never compromise on SAFETY |
● | We will always demonstrate RESPECT |
● | We will never stop IMPROVING |
● | We will always be ACCOUNTABLE |
● | We will never forget that DIVERSITY and INCLUSION makes us stronger |
11
Employment, Recruitment and Development
Our recruitment programs are regionally focused. Hiring is done at a local level to ensure compliance with applicable regulations. We advertise job openings and source candidates broadly to attract a diverse candidate pool. As a leader in our industry, we can attract a strong candidate pool and have successfully filled vacancies. In fiscal 2023, we hired 106 employees, 74 within the United States, 13 in the Asia-Pacific region, and 19 in the EMEA region.
We track and report key talent metrics, including workforce demographics, talent pipeline and diversity. We invest in professional development programs to provide opportunities for individuals to advance their careers in either technical/individual contributor or leadership tracks. We offer many of our training and development programs virtually to benefit employees worldwide. We emphasize the development of future leaders and utilize a talent review process to assess high-potential and high-performing employees for future leadership roles as part of our succession management process. We monitor turnover statistics carefully since turnover is an essential indicator of employee satisfaction. Our 12-month rolling average for voluntary turnover on December 31, 2023 was approximately 7.2%. Our employee average tenure is more than 8 years.
Employee Engagement
The engagement and satisfaction of the Veeco United Team are critical to our culture and our success. In 2019, we conducted a formal employee survey designed to assess global employee engagement, leadership, work environment and culture. Over 90% of our employees participated in the survey, itself an indicator of high employee engagement. Participants provided over 2,000 responses to open-ended questions. The findings from this survey established an agenda for various initiatives designed to strengthen our Company. In 2021, we conducted a second formal employee survey using the same survey instrument. Approximately 90% of employees again participated in the survey and, again, nearly 2,000 responses were provided to open-ended questions. We saw significant improvements across all survey areas. In 2023, we conducted our third formal employee survey using the same survey instrument. Even with a much larger employee population, we maintained a high participation rate of 90% and over 2,000 responses to open-ended questions. Overall survey results were similar to 2021 results. We remain committed to working with employees to strengthen the Company’s culture. Our executives conduct regular meetings with our global workforce, providing employees with opportunities to engage with senior leaders and ask questions in open Q&A sessions. Finally, we maintain and regularly remind our employees about our confidential third-party hotline service that can be utilized to share their concerns.
Compensation Philosophy
Our compensation philosophy is targeted to support our employees’ financial, physical, and mental health and well-being. We utilize independent surveys to ensure that our total compensation packages are competitive. We help employees share in the Company’s success through various programs, including profit sharing and bonus plans, equity awards, and an Employee Stock Purchase Plan (“ESPP”). In addition to providing our employees with competitive compensation packages, we offer benefits designed to meet the needs of employees and their families, including paid time off, medical, dental and vision coverage, disability income protection, life insurance, retirement savings contributions, and more. Veeco pays the majority or all of the costs for many of these benefits.
Diversity and Inclusion
We are committed to building and sustaining a culture of diversity and inclusion where our people can be their authentic selves and are encouraged to reach their full potential. Our Veeco team, like the technologies we enable, is a rich combination of diverse individuals coming together as Veeco United to make a material difference for our people, our customers, and the world. As a global technology company, we recognize that a diverse employee population makes Veeco stronger, more innovative, and a more engaging place to work. We are always striving to attract talented individuals from a global candidate pool.
12
In the second quarter of 2021, Veeco established a Diversity and Inclusion Council. The Council, composed of Veeco colleagues from many different parts of the Company, represents Veeco’s ongoing commitment to inclusion of all genders, sexual orientations, races, ethnic origins, religions, and diversity of thought. The team recently established Veeco’s Diversity and Inclusion Mission Statement and Charter. The charter affirms our commitment to building awareness, enhancing community partnerships, addressing diversity in our recruiting and hiring practices, empowering employees to promote D&I initiatives, and identifying opportunities to have meaningful engagements with peers and the leadership team. We are excited to continue developing initiatives to promote and celebrate diversity at Veeco.
Employee Health and Safety, Pandemic Response
We are committed to providing a safe and healthy workplace for all employees. We accomplish this through strict compliance with applicable laws and regulations regarding workplace safety, including recognition and control of workplace hazards, tracking injury and illness rates, utilizing a global travel health program, and maintaining detailed emergency and disaster recovery plans.
Our highest priorities throughout the pandemic were, and continue to be, the health and well-being of our employees, customers, suppliers, and stakeholders. From the beginning of the pandemic, through the recent challenges posed by the acceleration of coronavirus variants, we have taken precautions to protect employees, visitors, and customers while minimizing disruption to our business. Our facilities remained operational as an “essential business” throughout the pandemic. To keep our teams safe and the Company strong, we implemented rigorous health and safety protocols at our manufacturing facilities, including extensively and frequently disinfecting our facilities, limiting access to our facilities, checking temperatures of individuals entering our facilities, staggering shifts to minimize employee overlap in gowning areas, and providing protective equipment to minimize the risks to our employees. In addition, we required many of our employees to work from home wherever possible. We protected employees, customers, and stakeholders by providing remote meetings, demos, and service, whenever possible. While the COVID-19 public health emergency has ended, our Veeco United Team remains flexible and responsive to potential health risks and has developed robust response capability through this experience. We continue to carefully monitor and respond to local, state, and federal public health guidance. We continue to use our COVID-19 Pledge to describe all the measures we implemented in our facilities to keep employees working on-site safe throughout the pandemic and beyond.
Available Information
Our corporate website address is www.veeco.com. All filings we make with the Securities and Exchange Commission (“SEC”), including our Annual Report on Form 10-K, our Quarterly Reports on Form 10-Q, our Current Reports on Form 8-K, our proxy statements and any amendments thereto filed or furnished pursuant to Section 13(a) or 15(d) of the Securities Exchange Act of 1934, as amended, are available for free in the Investor Relations section of our website as soon as reasonably practicable after they are filed with or furnished to the SEC. The reference to our website address does not constitute inclusion or incorporation by reference of the information contained on our website in this Form 10-K or other filings with the SEC, and the information contained on our website is not part of this document.
Item 1A. Risk Factors
Key Risk Factors That May Impact Future Results
Stockholders should carefully consider the risk factors described below when evaluating the Company. Any of these factors, many of which are beyond our control, could materially and adversely affect our business, financial condition, operating results, cash flow, and stock price.
Risks Related to Our Business and Industry
Unfavorable market conditions have adversely affected, and may continue to adversely affect, our operating results.
Conditions of the markets in which we operate are volatile and may experience significant deterioration. Changing market conditions require that we continuously monitor and reassess our strategic resource allocation decisions. If we
13
fail to properly adapt to changing business environments, we may lack the infrastructure and resources necessary to scale up our businesses to successfully compete during periods of growth, or we may incur excess fixed costs during periods of decreasing demand. Adverse market conditions relative to our products may result in:
● | reduced demand for our products, or the rescheduling or cancellation of orders for our products which may result in negative backlog adjustments; |
● | asset impairments, including the impairment of goodwill and other intangible assets; |
● | unfavorable changes in customer mix and product mix; |
● | increased price competition for our products, or increased competition from sellers of used equipment or lower-priced alternatives to our products, which could lead to lower profit margins for our products; |
● | increased inventory obsolescence; |
● | disruptions in our supply chain; |
● | higher operating costs, caused by matters such as rising inflation and interest rates in various regions, which the Company experienced in 2023 and may continue to do so in the future; and |
● | an increase in uncollectable amounts due from our customers resulting in increased reserves for doubtful accounts and write-offs of accounts receivable. |
If the markets in which we participate experience deteriorations or downturns, this could negatively impact our sales and revenue generation, margins, operating expenses, and profitability.
We face significant competition.
We face significant competition throughout the world, which may increase as certain markets in which we operate continue to evolve. Some of our competitors have greater financial, engineering, manufacturing, and marketing resources than us. Other competitors are located in regions with lower labor costs and other reduced costs of operation. In addition, our ability to compete in foreign countries against local manufacturers may be hampered by nationalism, social attitudes, laws, regulations, and policies within such countries that favor local companies over U.S. companies or that are otherwise designed to promote the development and growth of local competitors. Furthermore, we face competition from smaller emerging equipment companies whose strategy is to provide a portion of the products and services we offer, with a focused approach on innovative technology for specialized markets. New product introductions or enhancements by us or our competitors could cause a decline in sales or loss of market acceptance of our existing or prior generation products. Increased competitive pressure could also lead to intensified price competition resulting in lower profit margins.
We operate in industries characterized by rapid technological change.
Each of the industries in which we operate is subject to rapid technological change. Our ability to remain competitive depends on our ability to enhance existing products and develop and manufacture new products in a timely and cost effective manner and to accurately predict technology transitions. Our performance may be adversely affected if we are unable to accurately predict evolving market trends and related customer needs and to effectively allocate our resources among new and existing products and technologies.
The semiconductor industry, characterized by a high frequency and complexity of technology transitions and inflections, poses unique risks and challenges. Our ability to successfully compete in this market will depend on our ability to address and manage a number of industry-specific risks, including without limitation the following:
● | the heightened cost of research and development, associated with matters such as shrinking geometries, complex device structures, multiple applications and process steps, and the use of new materials; |
● | customer demands for shorter cycle times between order placements and product shipments, which will necessitate accurate forecasting of customer investment; |
● | customer demands for continuous reductions in the total cost of manufacturing system ownership, together with challenging equipment service demands and the resulting need for us to properly allocate our service resources; |
● | the number of types and varieties of semiconductors and number of applications across multiple substrate sizes; |
14
● | the need to reduce product development time, despite increasingly difficult technical challenges; |
● | our customers’ ability to reconfigure and re-use our equipment, resulting in reduced demand for new equipment or services from us; and |
● | the importance of establishing market positions in segments with growing demand. |
If we fail to properly allocate appropriate resources, successfully develop and commercialize products to meet customer demand, and effectively anticipate industry trends, our business and results of operations may be adversely impacted.
In addition, the semiconductor industry has experienced, and may continue to experience, significant consolidation, among both semiconductor manufacturers and manufacturing equipment suppliers. Larger competitors resulting from consolidations may have certain advantages over us, including but not limited to more efficient cost structures, substantially greater financial and other resources, greater presence in key markets, and greater name recognition. Consolidation among our competitors and integration among our customers could erode our market share, negatively impact our ability to compete, and have a material adverse effect on our business.
Whether in connection with the semiconductor industry or otherwise, we are also exposed to potential risks associated with unexpected product performance issues. Our product designs and manufacturing processes are complex and could contain unexpected product defects, especially when products are first introduced. Unexpected product performance issues could result in significant costs and damages, including increased service and warranty expenses, the need to provide product replacements or modifications, reimbursement for damages caused by our products, product recalls, related litigation, product write-offs, and disposal costs. Product defects could also result in personal injury or property damage, claims for which may exceed our existing insurance coverages (as may other claims, notwithstanding our efforts to maintain a program of insurance coverage for a variety of property, casualty and other risks). These and other costs could be substantial and our reputation could be harmed, resulting in a reduced demand for our products and a negative effect on our business.
In addition, our success is also subject to the risk of future disruptive technologies, including machine learning and artificial intelligence (“AI”). While such technologies offer significant opportunities, they also pose complex and novel risks, including operational risks (such as factual errors or inaccuracies in work product developed using AI), the unintended release of proprietary information, costs of compliance associated with evolving AI laws, regulations and standards, privacy concerns with respect to data dissemination, risks related to intellectual property rights (with respect to both the inputs to the program and ownership rights to AI work product), and risks related to AI’s impact on the workforce. While it is not possible at this point to accurately identify or predict all of the risks related to the use of AI technologies, our failure to properly anticipate and timely respond to AI-related developments could adversely affect our business, financial condition, and results of operations.
Certain of our sales are dependent on the demand for consumer electronic products and automobiles, which can experience significant volatility.
The demand for semiconductors, HDDs and other devices is highly dependent on sales of consumer electronic products, such as smartphones, laptops, tablets and wearable devices. In addition, as a result of the growing automotive semiconductor market, semiconductor demand is also heavily influenced by the demand for automobiles. Factors that could affect the levels of spending on consumer electronic products and automobiles include consumer confidence, access to credit, volatility in fuel and other energy costs, conditions in the residential real estate and mortgage markets, labor and healthcare costs, and other macroeconomic factors affecting consumer spending behavior. The emergence of new or competing technologies may also affect demand for consumer electronic products. These and other factors have had and could continue to have an adverse effect on the demand for our customers’ products and, in turn, on our customers’ demand for our products and services. Furthermore, in the past, some of our customers have overestimated their potential for market share growth. If this growth is overestimated, we may experience cancellations of orders in backlog, rescheduling of customer deliveries, obsolete inventory, and liabilities to our suppliers for products no longer needed. Alternatively, changes that result in sudden increases in demand for consumer electronic products and automobiles may result in a shortage of parts and materials needed to manufacture our products, and attendant shipping delays (both to us and to our customers) and/or the cancellation of orders placed by our customers.
15
We have a concentrated customer base, located primarily in a limited number of regions, which operates in highly concentrated industries.
Our customer base continues to be highly concentrated. Orders from a relatively limited number of customers have accounted for, and likely will continue to account for, a substantial portion of our net sales, which may allow customers to demand pricing and other terms less favorable to us (including extended warranties, indemnification commitments, and the obligation to continue production of older products). Customer consolidation activity involving some of our largest customers could result in an even greater concentration of our sales in the future. Management changes at key customer accounts could result in a loss of future sales due to vendor preferences or other reasons and may introduce new challenges in managing customer relationships.
If these principal customers discontinue their relationship with us or suffer economic setbacks, our business, financial condition, and operating results could be materially and adversely affected. Our ability to increase sales in the future will depend in part upon our ability to obtain orders from new customers and we cannot be certain that we will be successful in these efforts. In addition, because a relatively small number of large manufacturers, many of whom are our customers, dominate the industries in which they operate, it may be especially difficult for us to replace these customers if we lose their business. A significant portion of orders in our backlog are orders from our principal customers.
In addition, a substantial investment is required by customers to install and integrate capital equipment into a production line. As a result, once a manufacturer has selected a particular vendor to supply capital equipment, the manufacturer will often attempt to consolidate its other capital equipment requirements with the same vendor. Accordingly, if a customer selects a competitor’s product over ours, we could experience difficulty selling to that customer for a significant period of time. Furthermore, we typically do not have long-term contracts with our customers. As a result, our agreements with our customers do not provide assurance of future sales, and we are exposed to competitive price pressures on new orders we attempt to obtain.
Our customer base is also highly concentrated in terms of geography, and the majority of our sales are to customers located in a limited number of countries. Dependence upon sales emanating from a limited number of regions increases our risk of exposure to local difficulties and challenges, such as those associated with regional economic downturns, political instability, trade wars and other trade disruptions, fluctuating currency exchange rates, natural disasters, social unrest, pandemics such as COVID-19, terrorism, and acts of war. Our reliance upon customer demand arising primarily from a limited number of countries could materially and adversely impact our future results of operations.
The cyclicality of the industries we serve directly affects our business.
Our business depends in large part upon the capital expenditures of manufacturers in our four end-markets: Semiconductor; Compound Semiconductor; Data Storage; and Scientific & Other. We are subject to the business cycles of these industries, the timing, length, and volatility of which are difficult to predict. These industries have historically been highly cyclical and have experienced significant economic downturns in the last decade. As a capital equipment provider, our revenue depends in large part on the spending patterns of these customers, who often delay expenditures or cancel or reschedule orders in reaction to variations in their businesses or general economic conditions. In downturns, we must be able to quickly and effectively align our costs with prevailing market conditions, as well as motivate and retain key employees. However, because a portion of our costs are fixed, our ability to reduce expenses quickly in response to revenue shortfalls may be limited. Downturns in one or more of these industries have had, and will likely have, a material adverse effect on our business, financial condition, and operating results. Alternatively, during periods of rapid growth, we must be able to acquire and develop sufficient manufacturing capacity to meet customer demand and attract, hire, assimilate, and retain a sufficient number of qualified people. Our net sales and operating results may be negatively affected if we fail to accurately predict and effectively respond.
Our failure to estimate customer demand accurately could result in inventory obsolescence, liabilities to our suppliers for products no longer needed, and manufacturing interruptions or delays which could affect our ability to meet customer demand.
The success of our business depends in part on our ability to accurately forecast and supply equipment and services that
16
meet the rapidly changing technical and volume requirements of our customers. To meet these demands, we depend on the timely delivery of parts, components, and subassemblies from our suppliers. Uncertain worldwide economic conditions and market instabilities make it difficult for us (and our customers) to accurately forecast future product demand. If actual demand for our products is different than expected, we may purchase more or fewer parts than necessary or incur costs for canceling, postponing, or expediting delivery of parts. If we overestimate the demand for our products, excess inventory could result which could be subject to heavy price discounting, which could become obsolete, and which could subject us to liabilities to our suppliers for products no longer needed. Similarly, we may be harmed in the event that our competitors overestimate the demand for their products and engage in heavy price discounting practices as a result. In addition, the volatility of demand for capital equipment poses risks for companies in our supply chain, including challenges associated with inventory management and fluctuating working capital requirements.
Furthermore, certain key parts may be subject to long lead-times or may be obtainable only from a single supplier or limited group of suppliers, and some sourcing and assembly is provided by suppliers located in countries other than the United States. We may experience significant interruptions in our manufacturing operations, delays in our ability to timely deliver products or services, increased costs, or customer order cancellations as a result of:
● | the failure or inability of our suppliers to timely deliver quality parts; |
● | volatility in the availability and cost of materials; |
● | difficulties or delays in obtaining required import or export approvals; |
● | information technology or infrastructure failures; |
● | natural disasters and other events beyond our control, such as earthquakes, tsunamis, fires, floods, storms, power outages and potential impacts of climate change; or |
● | other causes such as regional or global economic downturns or recessions, international trade disruptions, pandemics such as COVID-19, political instability, terrorism, or acts of war, which could result in delayed deliveries, manufacturing inefficiencies, increased costs, or order cancellations. |
In addition, in the event of an unanticipated increase in demand for our products, our need to rapidly increase our business and manufacturing capacity may be limited by our working capital constraints and those of our suppliers, which may cause or exacerbate interruptions in our manufacturing and supply chain operations. Any or all of these factors could materially and adversely affect our business, financial condition, and results of operations.
We rely on a limited number of suppliers, some of whom are our sole source for particular components.
Certain of the parts, components, and sub-assemblies included in our products are obtained from a single source or a limited group of suppliers. Our inability to develop alternative sources, as necessary, could result in a prolonged interruption in our ability to supply related products, a failure on our part to meet the demands our customers, and a significant increase in the price of related products, which could adversely affect our business, financial condition, and results of operations.
Our failure to successfully manage our outsourcing activities or failure of our outsourcing partners to perform as anticipated could adversely affect our results of operations.
To better align our costs with market conditions, increase the percentage of variable costs relative to total costs, and to increase productivity and operational efficiency, we have outsourced certain functions to third parties, including the manufacture of several of our systems. While we maintain some level of internal manufacturing capability for these systems, we rely on our outsourcing partners to perform their contracted functions to allow us flexibility to adapt to changing market conditions, including periods of significantly diminished order volumes. If our outsourcing partners do not perform as required, or if our outsourcing efforts do not allow us to realize the intended cost savings and flexibility, our results of operations (and those of our third-party providers) may be adversely affected. Disputes and possibly litigation involving third party providers could result and we could suffer damage to our reputation. Dependence on outsourcing may also adversely affect our ability to bring new products to market. Although we attempt to select reputable providers, one or more of these providers could fail to perform as we expect. If we do not effectively manage our outsourcing efforts or if third party providers do not perform as anticipated, we may not realize the benefits of productivity improvements and we may experience operational difficulties, increased costs, manufacturing and
17
installation interruptions or delays, inefficiencies in the structure and operation of our supply chain, loss of intellectual property rights, quality issues, increased product time-to-market, and an inefficient allocation of our human resources, any or all of which could materially and adversely affect our business, financial condition, and results of operations.
The timing of our orders, shipments, and revenue recognition may cause our quarterly operating results to fluctuate significantly.
We derive a substantial portion of our net sales in any fiscal period from the sale of a relatively small number of high-priced systems. As a result, the timing for the recognition of revenue for a single transaction could have a material effect on our sales and operating results for a particular fiscal period. As is typical in our industry, orders and shipments often occur during the last few weeks of a quarter. As a result, a delay of only a week or two can impact which period revenue is reported and can cause volatility in our revenue for a given reporting period. Our quarterly results have fluctuated significantly in the past and we expect this trend to continue.
Our sales cycle is long and unpredictable.
Historically, we have experienced long and unpredictable sales cycles (the period between our initial contact with a potential customer and the time that we recognize revenue from resulting sales to that customer). It is not uncommon for our sales cycle to exceed twelve months. The timing of an order often depends on our customer’s capital expenditure budget, over which we have no control. In addition, the time it takes us to procure and build a product to customer specifications typically ranges from three to twelve months. When coupled with the fluctuating amount of time required for shipment and installation, our sales cycles often vary widely, and these variations can cause fluctuations in our operating results. As a result of our lengthy sales cycles, we may incur significant research and development, selling, general, and administrative expenses before we generate revenue for these products. We may never generate the anticipated revenue if a customer cancels or otherwise changes its purchase plans, or if our evaluation systems do not satisfy customer requirements (which could result in working capital constraints, excess inventory or inventory obsolescence, and other harm to the Company). These risks are particularly prevalent in the semiconductor market, which is often characterized by long customer qualification times, typically twelve to eighteen months. Once qualified, the ramp to volume production can take an additional extended period of time, often twelve to twenty-four months. During these periods, little to no revenue will be recognized by us, while we will continue to incur research and development costs. Despite our efforts, our products may never be qualified and may never achieve design-tool-of-record (“DTOR”) or production-tool-of-record (“PTOR”) status, and our financial condition and results of operations may be materially and adversely affected.
Our backlog is subject to customer cancellation or modification which could result in decreased sales, increased inventory obsolescence, and liabilities to our suppliers for products no longer needed.
Customer purchase orders may be cancelled or rescheduled by the customer, sometimes with limited or no penalties, which may result in increased or unrecoverable costs for the Company. We adjust our backlog for such cancellations and contract modifications, among other items. A downturn in one or more of our businesses could result in an increase in order cancellations and postponements.
We write-off excess and obsolete inventory based on historical trends, future usage forecasts, and other factors including the amount of backlog we have on hand. If our backlog is canceled or modified, our estimates of future product demand may prove to be inaccurate, in which case we may have understated the write-off required for excess and obsolete inventory. In the future, if we determine that our inventory is overvalued, we will be required to recognize associated costs in our financial statements at the time of such determination. In addition, we place orders with our suppliers based on our customers’ orders. If our customers cancel their orders with us, we may not be able to cancel our orders with our suppliers. Resulting charges could have a material adverse effect on our results of operations and financial condition.
We are exposed to risks associated with business combinations, acquisitions, strategic investments and divestitures.
We have completed several significant acquisitions and investments in the past (including our recent acquisition of Epiluvac AB, a producer of SiC-based products and technology), and we will consider new opportunities in the future. Acquisitions,
18
investments and other business combinations involve numerous risks, many of which are unpredictable and beyond our control, including the following:
● | the failure of the transaction to advance our business strategies and the failure of its anticipated benefits to materialize; |
● | difficulties and costs, including the diversion of management’s attention, in integrating new personnel, operations, technologies, and products; |
● | the inability to complete the proposed transaction in a timely manner, if at all, due to our inability to obtain required government or other approvals without burdensome conditions, or due to other reasons, resulting in obligations to pay professional and other expenses, including any applicable termination fees; |
● | unknown, underestimated, and undisclosed commitments or liabilities; |
● | increased amortization expenses relating to intangible assets; and |
● | other adverse effects on our business, including the potential impairment and write-down of amounts capitalized as intangible assets and goodwill as part of the transaction, as a result of such matters as technological advancements or worse-than-expected performance by an acquired company. |
If we issue equity securities to pay for an acquisition or investment, the ownership percentage of our then-current shareholders would be reduced and the value of the shares held by these shareholders could be diluted, which could adversely affect the price of our stock. If we use cash to pay for an acquisition or investment, the payment could significantly reduce the cash that would be available to fund our operations, pay our indebtedness, or be used for other purposes, which could have a negative effect on our business.
In addition, we continually assess the strategic fit of our businesses and may from time to time seek to divest portions of our Company that no longer fit our strategic plan. Divestitures involve significant risks and uncertainties, including the ability to sell such businesses at satisfactory prices, on acceptable terms, and in a timely manner. Divestitures may also disrupt other parts of our businesses, distract the attention of our management, result in a loss of key employees or customers, and require that we allocate internal resources that would otherwise be devoted to operating our existing businesses. Divestitures may expose us to unanticipated liabilities (including those arising from representations and warranties made to a buyer regarding the businesses) and to ongoing obligations to support the businesses following such divestitures, any and all of which could adversely affect our financial condition and results of operations.
As a general principle, we seek to invest our capital in areas that we believe best align with our business strategy and will help optimize future returns. Our capital investments may not generate the expected returns or hoped-for results. We may not be able to obtain necessary grants, investment tax credits, or other governmental incentives, including funding through the U.S. CHIPS and Science Act of 2022. Significant judgment is required when assessing and selecting capital investments, and we could invest in projects that are ultimately less profitable than other projects which we do not select, ultimately harming our business, results of operations and financial condition.
Risks Associated with Operating a Global Business
We are exposed to risks of operating businesses outside the United States.
A majority of our sales are to customers, and significant elements of our supply chain are from suppliers, who are located outside of the United States, which we expect to continue. Our percentage revenue from the sale of products and the provision of services to non-U.S. customers was 76%, 69% and 62% for fiscal years 2023, 2022 and 2021, respectively. Our non-U.S. sales and operations are subject to risks inherent in conducting business outside the United States, many of which are beyond our control including:
● | political and social attitudes, laws, rules, regulations, and policies within countries that favor local companies over U.S. companies, including government-supported efforts to promote local competitors; |
● | global trade issues and uncertainties with respect to trade policies, including tariffs, trade sanctions, and international trade disputes, and the ability to obtain required import and export licenses; |
● | differing legal systems and standards of trade which may not honor our intellectual property rights and which may place us at a competitive disadvantage; |
19
● | pressures from foreign customers and foreign governments for us to increase our operations and sourcing in the foreign country, which may necessitate the sharing of sensitive information and intellectual property rights; |
● | multiple conflicting and changing governmental laws and regulations, including varying labor laws and tax regulations; |
● | reliance on various information systems and information technology to conduct our business, making us vulnerable to cyberattacks by third parties or breaches due to employee error, misuse, or other causes, that could result in business disruptions, loss of or damage to our intellectual property and confidential information (and that of our customers and other business partners), reputational harm, transaction errors, processing inefficiencies, or other adverse consequences; |
● | regional or global economic downturns or recessions, varying foreign government support, unstable political environments, and other changes in foreign economic conditions; |
● | the impact of public health epidemics, such as the COVID-19 pandemic, on employees, suppliers, customers and the global economy; |
● | difficulties in managing a global enterprise, including staffing, managing distributors and representatives, and repatriating cash; |
● | longer sales cycles and difficulties in collecting accounts receivable; and |
● | different customs and ways of doing business. |
To date, our operations have not been materially adversely affected by global conflicts including Russia’s invasion of Ukraine, the current Israel/Palestine conflict, or the recent attacks on merchant ships in the Red Sea. However, further escalation of these or other conflicts could result in, among other negative consequences, a disruption to the global economy and supply chain leading to a shortage of parts, materials and services needed to manufacture and timely deliver our products (and we note that the Ukraine-Russia geographic region is a significance source of critical raw materials, including neon and palladium, used for semiconductor manufacturing). Any such shortages could negatively impact our suppliers’ ability to meet our demand requirements and, in turn, our ability to satisfy our customer demand. Parts shortages may and have required, and may continue to require, that we plan ahead further than usual, and increase our purchase commitments to secure critical components in a timely manner. These challenges, together with other challenges associated with operating an international business, may adversely affect our ability to recognize revenue, our gross margins on the revenue we do recognize, and our other operating results.
Changes in U.S. trade policy and export controls and ongoing trade disputes between the U.S. and China have adversely affected, and may continue to adversely affect, our business, results of operations, and financial condition.
The U.S. government has implemented, and may continue to implement, changes in trade policy which have adversely affected and could continue to adversely affect the Company’s ability to sell and service its products to and for customers located in China and in certain other countries.
On October 7, 2022, the U.S. Commerce Department, Bureau of Industry and Security (“BIS”) announced new rules aimed in part at restricting China’s ability to obtain advanced computing chips and manufacture advanced semiconductors. Previous changes in trade policy by BIS have included, without limitation, the elimination of license exception CIV, the implementation of new regulations governing the sale of equipment to defined “Military End Users” and for defined “Military End Uses”, the addition of several companies to the U.S. Commerce Department’s Unverified List and Entity List (including Semiconductor Manufacturing International Corporation and certain related entities), and the expansion of the “foreign direct product rule” to restrict the sale of certain products if Huawei Technologies Co., Ltd. or its affiliates are parties to a transaction involving the products.
The effect of these changes, among others, is that U.S. companies are now required to obtain export licenses – now at times with a presumption of denial -- before providing commodities, software, and technology (which are subject to the regulations) to customers for whom licensing requirements did not previously apply. These changes have had, and will likely continue to have, a negative effect on our ability to sell and service certain equipment in China. The heightened export restrictions may also result in shipping delays, as the new regulations are interpreted and applied, and may inhibit technical discussions with existing or prospective customers, negatively impacting our ability to pursue sales opportunities. The administrative processing, attendant delays and risk of ultimately not obtaining required export approvals pose a particular disadvantage to the Company relative to our non-U.S. competitors who are not required to comply with U.S.
20
export controls. This difficulty and uncertainty has adversely affected our ability to compete for and win business from customers in China. Foreign customers affected by these and future U.S. government sanctions or threats of sanctions may respond by developing their own solutions to replace our products or by utilizing our foreign competitors’ products. This “trade war” with China, together with the prospect of additional governmental action related to export controls restrictions, international sanctions, and/or tariffs, has adversely affected, and is likely to continue to adversely affect, demand for our products and the results of our operations.
The changes in U.S. trade policy and export controls, as well as sanctions imposed by the U.S. against certain Chinese companies, have triggered retaliatory action by China and could trigger further retaliation (including the possible escalation of geopolitical tensions between China and Taiwan). In addition, China has provided, and is expected to continue to provide, significant assistance, financial and otherwise, to its domestic industries, including some of our competitors. We face increasing competition as a result of significant investment in the semiconductor industry by the Chinese government and various state-owned or affiliated entities that is intended to advance China’s stated national policy objectives (including a heightened focus on the production of legacy node and mature chips in response to U.S. and foreign government regulation impeding the production of advanced node chips). In addition, the Chinese government may restrict us from participating in the China market or may prevent us from competing effectively with Chinese companies.
Further, we hold inventory of products that may be affected by the recent U.S. government actions, including potential order cancellations. While we continue to take steps to mitigate our exposure to this developing situation, if the sale of these products is delayed or we are unable to return or dispose of our inventory on favorable economic terms, we may incur additional carrying costs for the inventory or otherwise record charges associated with this inventory.
We may be unable to obtain required export licenses for the sale of our products.
Whether with respect to sales to customers located in China or otherwise, products which (i) are manufactured in the United States, (ii) incorporate controlled U.S. origin parts, technology, or software, or (iii) are based on U.S. technology, are subject to the U.S. Export Administration Regulations (“EAR”) when exported to and re-exported from international jurisdictions, in addition to the local jurisdiction’s export regulations applicable to individual shipments. Currently, our laser annealing, MOCVD, MBE, SiC and certain other systems and products are controlled for export under the EAR. Licenses or proper license exceptions may be required for the shipment of our products to certain customers or countries. Obtaining an export license or determining whether an export license exception exists often requires considerable effort by us and cooperation from the customer, which can add time to the order fulfillment process. We may be unable to obtain required export licenses or qualify for export license exceptions and, as a result, we may be unable to export products to our customers and/or meet their servicing needs (requiring us to refund customer prepayments for products we are unable to ship). Non-compliance with the EAR or other applicable export regulations could result in a wide range of penalties including the denial of export privileges, fines, criminal penalties, and the seizure of commodities. In the event that an export regulatory body determines that any of our shipments violate applicable export regulations, we could be fined significant sums and our export capabilities could be restricted, which could have a material adverse impact on our business and reputation.
We are exposed to various risks associated with global regulatory requirements.
As a public company with global operations, we are subject to the laws of the United States and multiple foreign jurisdictions, and the rules and regulations of various governing bodies, which may differ among jurisdictions. We are required to comply with legal and regulatory requirements pertaining to such matters as data privacy (including the European Union General Data Protection Regulation and similar laws), anti-corruption (such as the Foreign Corrupt Practices Act and other local laws prohibiting improper payments to governmental officials), labor laws, immigration, customs, trade, taxes, corporate governance, conflict minerals, and antitrust regulations, among others. In addition, we are required to comply with laws and regulations pertaining to carbon emissions, and other regulatory requirements addressing climate change concerns. These laws and regulations, which are ever-evolving and at times complex and inconsistent, impose costs on our business and divert management time and attention from revenue-generating activities. Changes to or ambiguities in these laws and regulations may create uncertainty regarding our compliance requirements. While we intend to comply with these regulatory requirements, if we are found by a court or regulatory agency to have failed in these efforts, our business, financial condition, and results of operations could be adversely affected.
21
Risks Related to Intellectual Property and Cybersecurity
Disruptions in our information technology systems or data security incidents could result in significant financial, legal, regulatory, business, and reputational harm to us.
We are increasingly dependent on information technology systems and infrastructure, including mobile technologies, to operate our business. In the ordinary course of our business, we collect, store, process and transmit significant amounts of sensitive information, including intellectual property, proprietary business information, personally-identifiable information of individuals, and other confidential information, including that of our customers and other business partners. It is critical that we do so in a secure manner to maintain the confidentiality, integrity, and availability of this sensitive information. We have also outsourced elements of our operations (including elements of our information technology infrastructure) to third parties, and as a result, we manage a number of third-party vendors who have access to our computer networks and our confidential information.
All information systems are subject to breach and disruption. Potential vulnerabilities can be exploited from inadvertent or intentional actions of our employees, third-party vendors, business partners, or by malicious third parties. Attacks of this nature are increasing in their frequency, levels of persistence, sophistication, and intensity, and are being conducted by sophisticated and organized groups and individuals with a wide range of expertise and motives (including industrial espionage), including organized criminal groups, nation states, and others. In addition to the extraction of sensitive information, attacks could include the deployment of harmful malware, ransomware, or other means which could affect service reliability and threaten the confidentiality, integrity, and availability of information. These risks have been exacerbated by an increase in employees working from home, ongoing geopolitical tensions and conflicts, and by the possible use of artificial intelligence (“AI”) to directly attack information systems with greater speed and efficiency than human bad actors.
We have experienced, and our third-party providers have experienced, cybersecurity attacks, some of which have been, and may continue to be, successful. Significant disruptions in our information technology systems (or those of our key suppliers, contract manufacturers, distributors, sales agents and other partners) or other data security incidents could adversely affect our business operations and result in the loss or misappropriation of, and unauthorized access to, sensitive information. Future or ongoing disruptions or incidents, whether from attacks on our technology environment or from computer viruses, natural disasters, terrorism, war or other causes, could result in a material disruption in our business operations, force us to incur significant costs and engage in litigation, harm our reputation, and subject us to liability under laws, regulations, and contractual obligations.
We may be unable to effectively enforce and protect our intellectual property rights.
Our success as a company depends in part upon the protection of our intellectual property rights. We rely primarily on patent, copyright, trademark, and trade secret laws, as well as nondisclosure and confidentiality agreements and other methods, to protect our proprietary information, technologies, processes, and brand identity. We own various U.S. and international patents and have additional pending patent applications relating to certain of our products and technologies. The process of seeking patent protection is lengthy and expensive, and we cannot be certain that pending or future applications will result in issued patents or in patents which provide meaningful protection or commercial advantage. In addition, our intellectual property rights may be circumvented, invalidated, or rendered obsolete by the rapid pace of technological change, or through efforts by others to reverse engineer our products or design around patents that we own. Policing unauthorized use of our products and technologies is difficult and time consuming and the laws of other countries may not protect our proprietary rights as fully or as readily as U.S. laws. Given these limitations, our success will depend in part upon our ability to innovate ahead of our competitors.
In addition, our outsourcing efforts require that we share certain portions of our technology with our outsourcing partners, which poses additional risks of infringement and trade secret misappropriation. Infringement of our rights by a third party, possibly for purposes of developing and selling competing products, could result in uncompensated lost market and revenue opportunities. Similar exposure could result in the event that former employees seek to compete with us through their unauthorized use of our intellectual property and proprietary information. We cannot be certain that
22
the protective steps and measures we have taken will prevent the misappropriation or unauthorized use of our proprietary information and technologies, nor can we be certain that applicable intellectual property laws, regulations, and policies will not be changed in a manner detrimental to the sale or use of our products.
Litigation has been required in the past, and may be required in the future, to enforce our intellectual property rights, protect our trade secrets, and to determine the validity and scope of proprietary rights of others. As a result of any such litigation, we could lose our ability to enforce one or more patents, incur substantial costs, and jeopardize relationships with current or prospective customers or suppliers. Any action we take to enforce or defend our intellectual property rights could absorb significant management time and attention, and could otherwise negatively impact our operating results.
We may be subject to claims of intellectual property infringement by others.
We receive communications from time to time from other parties asserting the existence of patent or other rights which they believe cover certain of our products. We also periodically receive notices from customers who believe that we are required to indemnify them for damages they may incur related to infringement claims made against these customers by third parties. Our customary practice is to evaluate such assertions and to consider the available alternatives, including whether to seek a license, if appropriate. However, we cannot ensure that licenses can be obtained or, if obtained, will be on acceptable terms or that costly litigation or other administrative proceedings will not occur. If we are not able to resolve a claim, negotiate a settlement of the matter, obtain necessary licenses on commercially reasonable terms, or successfully prosecute and defend our position, our business, financial condition, and results of operations could be materially and adversely affected.
Financial, Accounting and Capital Market Risks
Our operating results may be adversely affected by tightening credit markets.
As a global company with worldwide operations, we are subject to volatility and adverse consequences associated with economic downturns and recessions in different parts of the world. In the event of a downturn, many of our customers may delay or reduce their purchases of our products and services. If negative conditions in the credit markets, including a recommencement of increases in interest rates, prevent our customers from obtaining credit or necessary financing, product orders in these channels may decrease, which could result in lower revenue. In addition, we may experience cancellations of orders in backlog, rescheduling of customer deliveries, and attendant pricing pressures. If our suppliers face challenges in obtaining credit, in selling their products, or otherwise in operating their businesses, their ability to continue to supply materials to us may be negatively affected.
In addition, we finance some of our sales through trade credit. In addition to ongoing credit evaluations of our customers’ financial condition, we seek to mitigate our credit risk by obtaining deposits and letters of credit on certain of our sales arrangements. We could suffer significant losses if a customer whose accounts receivable we have not secured fails or is otherwise unable to pay us, or if financial institutions providing letters of credit become insolvent. A loss in collections on our accounts receivable would have a negative impact on our financial condition and results of operations.
We are subject to foreign currency exchange risks.
We are exposed to foreign currency exchange rate risks that are inherent in our anticipated sales, purchase commitments, and assets and liabilities that are denominated in currencies other than the U.S. dollar. Although we attempt to mitigate our exposure to fluctuations in currency exchange rates, hedging activities may not always be available or adequate to mitigate the impact of our exchange rate exposure. Failure to sufficiently hedge or otherwise manage foreign currency risks properly could materially and adversely affect our financial condition, results of operations, and liquidity.
We may be required to take impairment charges on assets.
We are required to assess goodwill and indefinite-lived intangible assets annually for impairment, or on an interim basis whenever certain events occur or circumstances change, such as an adverse change in business climate or a decline in the
23
overall industry, that would more likely than not reduce the fair value below its carrying amount.
As part of our long term strategy, we may pursue future acquisitions of, or investments in, other companies or assets which could potentially increase our assets. We are required to test certain of our assets, including acquired intangible assets, property, plant, and equipment, and equity investments without readily observable market prices, for recoverability and impairment whenever there are indicators of impairment such as an adverse change in business climate. Adverse changes in business conditions or worse-than-expected performance by these acquired companies could negatively impact our estimates of future operations and result in impairment charges to these assets.
Changes in accounting pronouncements or taxation rules, practices, or rates may adversely affect our financial results.
Changes in, or newly enacted, accounting pronouncements or taxation rules, practices or rates can materially affect our revenue recognition practices, effective tax rates, results of operations, and our financial condition. In addition, varying interpretations of accounting pronouncements or taxation practices, and the questioning of our current or past practices, may adversely affect our reported financial results.
The “Tax Relief for American Families and Workers Act of 2024” is currently under Senate consideration. The passage of this bill as proposed would have a material impact to our income tax provision, specifically due to the immediate expensing of Sec 174 R&D expenses, which will lower our Foreign-Derived Intangible Income (“FDII”) deductions and thus increase our effective tax rate. Additionally, recommendations made pursuant to the Organization for Economic Cooperation and Development’s (“OECD”) Base Erosion and Profit Shifting (“BEPS”) project have led to changes in tax laws in numerous countries and could increase our tax obligations in countries where we do business. As part of BEPS 2.0, the OECD has focused on ensuring multinational businesses with consolidated global revenues in excess of 750 million euros pay their tax in the 'right place' (Pillar 1) and at least at a 'minimum rate' (Pillar 2), including ensuring that multinational enterprises are paying tax at an effective rate of 15% or higher in every jurisdiction in which they operate, regardless of the local headline tax rate or the impact of local tax reliefs. We may be subject to the Pillar Two requirements in the future should our global revenues exceed the Pillar Two thresholds. While we do not currently expect Pillar Two to have a material impact on our effective tax rate, we are in the process of assessing and monitoring potential impacts and developments. These and other developments or changes in federal or international tax laws, rules, practices or rates (including future changes or modifications to existing practices) could have an adverse material impact on our ability to utilize our deferred tax attributes, our effective tax rate and results of operations including cash flows and financial position.
In addition, as of each reporting date, we evaluate the realizability of our deferred tax assets which may result in the recognition and/or release of a valuation allowance. Any changes in the valuation allowance will have a direct impact on our effective tax rate. The realization of net deferred tax assets relies on our ability to generate future taxable income, and, as such, if the Company is unable to generate sufficient future taxable income, we may not obtain the full benefit of these deferred tax assets.
Finally, we are subject to income tax on a jurisdictional or legal entity basis and significant judgment is required in certain instances to allocate our taxable income to a jurisdiction and to determine the related income tax expense and benefits. Losses in one jurisdiction generally may not be used to offset profits in other jurisdictions. As a result, changes in the mix of our earnings (or losses) between jurisdictions, among other factors, could alter our overall effective income tax rate, possibly resulting in significant tax rate increases. Furthermore, we are regularly audited by various tax authorities, and these audits may result in increased tax provisions which could negatively affect our operating results in the periods in which such determinations are made or changes occur.
Our current debt facilities may contain certain restrictions, covenants and repurchase provisions that may limit our ability to raise the funds necessary to meet our working capital needs, which may include the cash conversion of the Notes or repurchase of the Notes for cash upon a fundamental change.
As of December 31, 2023, we had $26.5 million in principal amounts outstanding in 2025 Notes, $25.0 million in principal amounts outstanding in 2027 Notes, and $230.0 million in principal amounts outstanding in 2029 Notes
24
(together, the “Notes”). In addition, as of December 31, 2023, we had an undrawn senior secured revolving credit facility (the “Credit Facility”) in an aggregate principal amount of $150.0 million, including a $15.0 million letter of credit sublimit.
These debt facilities (collectively, the “Debt Facilities”), contain certain covenant and other restrictions that may limit our ability to, among other things, incur additional debt or create liens, sell certain assets, and merge or consolidate with third parties, which may, in turn, preclude us from responding to changes in business and economic conditions, engaging in transactions that might otherwise be beneficial to us. Our ability to comply with some of these covenants is dependent on our future performance, which will be subject to many factors, some of which are beyond our control such as prevailing economic conditions. In addition, our failure to comply with these covenants could result in a default under the Debt Facilities, which could accelerate the debt. If any of our debt is accelerated, we may not have sufficient funds available to repay such debt, which could materially and negatively affect our financial condition and results of operation.
In addition, our ability to repurchase or to pay cash upon conversion of the Notes, or maturity of the Credit Facility, may be limited by law, by regulatory authority or by agreements governing our indebtedness that exist at the time of repurchase, conversion, or maturity. Our failure to settle the debt as required would constitute a default under the applicable debt facility and may lead to a default under the other debt facilities. If the payment of the related indebtedness were to be accelerated after any applicable notice or grace periods, we may not have sufficient funds to repay the indebtedness.
Finally, holders of the Notes will have the right to require us to repurchase all or any portion of their Notes upon the occurrence of a fundamental change before the maturity date. Additionally, in the event the conditional conversion features of the Notes are triggered (as is currently the case for the 2027 Notes through March 31, 2024), holders of Notes will be entitled to convert the Notes at any time during specified periods at their option. If one or more holders elect to convert the Notes, or if a fundamental change occurs before maturity, unless we elect to deliver solely shares of our common stock to settle such conversion (other than paying cash in lieu of delivering any fractional share), we will be required to make cash payments in respect of the Notes being converted, which could adversely impact our liquidity. Additionally, we may not have enough available cash or be able to obtain financing at the time we are required to make repurchases of the Notes surrendered therefor or pay cash with respect to the Notes being converted. In addition, even if holders do not elect to convert the Notes, we could be required under applicable accounting rules to reclassify all or a portion of the outstanding principal of the Notes as a current rather than long-term liability, which could result in a material reduction of our net working capital.
Issuance of our common stock, if any, upon conversion of the Notes, as well as the capped call transactions and the hedging activities of the option counterparties, may impair or reduce our ability to utilize our foreign tax credits or our research and development credits carryforwards in the future.
Pursuant to U.S. federal and state tax rules, a corporation is generally permitted to deduct from taxable income in any year net operating losses (“NOLs”) carried forward from prior years and to reduce from tax liabilities in any year foreign tax credits and R&D credits carried forward from prior years.
As of December 31, 2023, we had U.S. federal R&D credits carryforwards of approximately $34.9 million expiring in varying amounts between 2030 and 2043. If we were to experience a “change in ownership” under Section 382 of the Internal Revenue Code (“Section 382”), the federal credits carry forward limitation under Section 383 of the Internal Revenue Code would impose an annual limit on the amount of tax liabilities that may be offset by R&D credits generated prior to the change in ownership. If an ownership change were to occur, we may be unable to use a significant portion of our R&D credit carryforwards to offset future tax liabilities.
The shares of common stock, if any, issued upon conversion of the Notes will, upon such issuance, be taken into account when determining the cumulative change in our ownership for Section 382 purposes. As a result, any conversion of the Notes that we elect to settle in shares may materially increase the risk that we could experience an ownership change for these purposes in the future.
25
The capped call transactions may affect the value of the 2027 Notes and our common stock.
With respect to the 2027 Notes, we have entered into capped call transactions with certain option counterparties. The capped call transactions were expected generally to reduce the potential dilution upon conversion of the 2027 Notes and/or offset any cash payments we are required to make in excess of the principal amount of converted 2027 Notes, as the case may be, with such reduction and/or offset subject to a cap.
The option counterparties or their affiliates may enter into or modify hedge positions by entering into or unwinding various derivatives with respect to our common stock and/or purchasing or selling our common stock or other securities of ours in secondary market transactions prior to the maturity of the 2027 Notes (and are likely to do so during any observation period related to a conversion of the 2027 Notes). This activity could also cause fluctuations in the market price of our common stock and the 2027 Notes, which could affect the ability of the noteholders to convert the 2027 Notes and, to the extent the activity occurs during any observation period related to a conversion of the 2027 Notes, it could affect the number of shares and value of the consideration that noteholders will receive upon conversion of the 2027 Notes.
General Risk Factors
The price of our common shares is volatile and could decrease.
The stock market in general and the market for technology stocks in particular has experienced significant volatility. The trading price of our common shares has fluctuated significantly and could decline independent of the overall market, and shareholders could lose all or a substantial part of their investment. For example, in 2023 our stock price ranged from a closing high of $31.65 to a closing low of $17.81. The market price of our common shares could continue to fluctuate in response to several factors, including among others:
● | difficult macroeconomic conditions, economic recessions, international trade disputes, unfavorable geopolitical events, and general stock market uncertainties, such as those occasioned by a global liquidity crisis and a failure of large financial institutions; |
● | actual or anticipated variations in our results of operations; |
● | issues associated with the performance of our products, or the performance of our internal systems such as our customer relationship management (“CRM”) system or our enterprise resource planning (“ERP”) system; |
● | announcements of financial developments or technological innovations; |
● | our failure to meet the performance estimates of investment research analysts; |
● | changes in recommendations and financial estimates by investment research analysts, and decisions by investment research analysts to cease coverage of our Company; |
● | margin trading, short sales, hedging and derivative transactions involving our common stock; |
● | our failure to successfully implement cost reduction initiatives and restructuring activities, if and when required; |
● | our failure to maintain an effective system of disclosure controls and internal control over financial reporting, which may result in our inability to timely and accurately report our financial results or difficulties in satisfying internal control evaluations and attestation requirements of Section 404 of the Sarbanes Oxley Act of 2002; |
● | the commencement of, and rulings on, litigation and legal proceedings; and |
● | the occurrence of major catastrophic events. |
Securities class action litigation is often brought against a company following periods of volatility in the market price of its securities. These lawsuits, if and when brought, can result in substantial costs and a diversion of management’s attention and resources, which can adversely affect our financial condition, results of operations, and liquidity.
Our inability to attract, retain, and motivate employees could have a material adverse effect on our business.
26
Our success depends largely on our ability to attract, retain, and motivate employees, including those in executive, managerial, engineering and marketing positions, as well as highly skilled and qualified technical personnel. Competition for qualified design and technical personnel is intense, particularly in the semiconductor industry and especially when business cycles are improving. Competitors may try to recruit, and may succeed in recruiting, our most valuable technical employees. To attract and retain key employees, we must provide competitive compensation packages, including cash and stock-based compensation, among other benefits. If the value of our stock-based incentive awards decreases, or if our total compensation packages are not viewed as competitive, our ability to attract and retain key employees could suffer. We do not have key person life insurance on any of our executives, and we may not be able to readily replace key departed employees. Our inability to attract, retain, and motivate key personnel could have a significant negative effect on our business, financial condition, and results of operations.
We are subject to risks of non-compliance with environmental, health, and safety regulations.
We are subject to environmental, health, and safety regulations in connection with our business operations, including but not limited to regulations relating to the development, manufacture and use of our products, recycling and disposal of related materials, and the operation and use of our facilities and real property. Failure or inability to comply with existing or future environmental, health and safety regulations – including, for example, those relating to carbon emissions, climate change, and the use and sale of products containing per- and polyfluoroalkyl substances (“PFAS”) -- could result in significant remediation liabilities, the imposition of fines, the suspension or termination of research, development, or use of certain of our products, and other harm to the Company, which could have a material adverse effect on our business, financial condition, and results of operations.
In addition, changes in environmental laws and regulations, including those relating to greenhouse gas emissions and other climate change matters, could require us (and/or our key suppliers, contract manufacturers and other partners) to install new equipment, alter operations to incorporate new technologies, or implement new processes, among other measures, which may cause us to incur significant costs and divert management attention.
We are committed to ensuring safe working conditions, treating our employees with dignity and respect, and sourcing, manufacturing, and distributing our products in a responsible and environmentally friendly manner, and any failure on our part to do so may cause reputational and other harm for the Company. Furthermore, some of our operations involve the storage, handling, and use of hazardous materials that may pose a risk of fire, explosion, or environmental release. Such events could result from acts of terrorism, natural disasters, or operational failures and may result in injury or loss of life to our employees and others, local environmental contamination, and property damage. These events may cause a temporary shutdown of an affected facility, or portion thereof, and we could be subject to penalties or claims as a result. Each of these events could have a material adverse effect on our business, financial condition, and results of operations.
We are exposed to risks associated with the increased attention by our stakeholders to environmental, social and governance (“ESG”) matters.
Our stakeholders, including customers, investors, advisory firms, employees, and suppliers, among others, have increasingly focused on our ESG initiatives, including those regarding climate change, human rights, inclusion and diversity, among others. These expectations can extend, and have extended, to our corporate practices, initiatives, and disclosures, as well as stakeholder standards or preferences for investments or doing business. Third-party rating agencies have also established standards for a range of ESG-related factors, which may be inconsistent and are subject to change. These expectations and stakeholder requirements may impact the attractiveness of our business, the manner in which we do business, our reputation, the costs of doing business, and the willingness of our stakeholders to engage with, invest in, or retain us. We may be further impacted by the adoption of ESG-related regulation and legislation in the jurisdictions in which we do business – including, for example, the SEC’s proposed rule published in March of 2022 which would require companies to include significantly enhanced climate-related disclosures in their Reports on Form 10-K -- which could result in increased compliance, operational, and other costs.
From time to time the Company communicates its strategies, commitments and targets relating to ESG matters. These strategies, commitments and targets reflect our current plans and aspirations, and we may be unable to achieve them. In
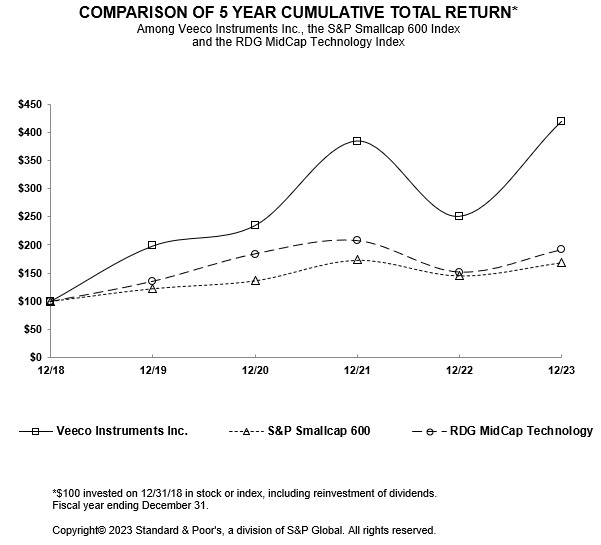
27
addition, the standards for measuring and reporting sustainability metrics may change over time and could result in significant revisions to our strategies, commitments and targets, or our ability to achieve them. Any failure to satisfy or achieve ESG-related requirements or targets could adversely impact the demand for our products, subject us to significant costs and liabilities, cause our stock price to decline, and result in reputational harm.
We have adopted certain measures that may have anti-takeover effects, which may make an acquisition of our Company by another company more difficult.
We have adopted, and may in the future adopt, certain measures that may have the effect of delaying, deferring, or preventing a takeover or other change in control of our Company, which a holder of our common stock may not consider to be in the holder’s best interest. For example, our board of directors has the authority to issue up to 500,000 shares of preferred stock and to fix the rights (including voting rights), preferences and privileges of these shares (“blank check” preferred stock). Such preferred stock may have rights, including economic rights, senior to our common stock. As a result, the issuance of the preferred stock could have a material adverse effect on the price of our common stock and could make it more difficult for a third party to acquire a majority of our outstanding common stock.
In addition, our board of directors is divided into three classes with each class serving a staggered three-year term. The existence of a classified board makes it more difficult for our shareholders to change the composition of our board of directors, and therefore the Company’s policies, in a relatively short period of time. Furthermore, we have adopted certain certificate of incorporation and bylaws provisions which have anti-takeover effects. These include: (a) requiring certain actions to be taken at a meeting of shareholders rather than by written consent, (b) requiring a super-majority of shareholders to approve certain amendments to our bylaws, (c) limiting the maximum number of directors, and (d) providing that directors may be removed only for cause. These measures and those described above may have the effect of delaying, deferring, or preventing a takeover or other change in control of our Company that a holder of our common stock may not consider to be in the holder’s best interest. In addition, we are subject to the provisions of Section 203 of the General Corporation Law of the State of Delaware, which prohibits a Delaware corporation from engaging in any business combination, including mergers and asset sales, with an interested stockholder (generally, a 15% or greater stockholder) for a period of three years after the date of the transaction in which the person became an interested stockholder, unless the business combination is approved in a prescribed manner. The operation of Section 203 may have anti-takeover effects, which could delay, defer, or prevent a takeover attempt that a holder of our common stock may not consider to be in the holder’s best interest.
Despite the above measures, an activist shareholder could undertake action to implement governance, strategic, or other changes to the Company which a holder of our common stock may not consider to be in the holder’s best interest. Such activities could interfere with our ability to execute our strategic plans, be costly and time consuming, disrupt our operations, and divert the attention of management and our employees.
Item 1B. Unresolved Staff Comments
None.
ITEM 1C. Cybersecurity
Cybersecurity represents a critical component of the Company’s overall approach to risk management. Our cybersecurity practices are integrated into the Company’s enterprise risk management (“ERM”) approach, and cybersecurity risks are among the core enterprise risks identified for oversight by our Board of Directors and the Board’s Audit Committee through our annual ERM assessment. Our cybersecurity policies and practices follow the cybersecurity framework of the National Institute of Standards and Technology and other applicable industry standards. We generally approach cybersecurity threats through a cross-functional, multi-layered approach, with the specific goals of: (i) identifying, preventing and mitigating cybersecurity threats to the Company; (ii) maintaining the confidence of our customers, clients and business partners; (iii) preserving the confidentiality of our employee’s information; and (iv) protecting the Company’s intellectual property.
Consistent with the Company’s overall ERM practices, our cybersecurity program focuses on the following areas:
28
● | Vigilance: The Company maintains a global presence, with cybersecurity threat operations operating 24/7 around the world with a specific goal of detecting, containing and responding to cybersecurity threats and incidents. |
● | Collaboration: The Company has established collaboration mechanisms with public and private entities, including intelligence and enforcement agencies, industry groups and third-party service providers to identify and assess cybersecurity risks. |
● | Systems Safeguards: The Company deploys technical safeguards that are designed to protect the Company’s information systems from cybersecurity threats, including firewalls, intrusion prevention and detection systems, anti-malware functionality, access controls and ongoing vulnerability assessments. |
● | Third-Party Management: The Company maintains a comprehensive, risk-based approach to identifying and overseeing cybersecurity risks presented by third parties, such as vendors, service providers and other users of the Company’s systems. |
● | Education: The Company provides periodic training for personnel regarding cybersecurity threats, with such training scaled to reflect the roles, responsibilities, and access of the relevant Company personnel. |
● | Incident Response Planning: The Company has established and maintains incident response plans that address the Company’s response to a cybersecurity incident, and such plans are tested on an ongoing basis. |
● | Communication and Coordination: The Company utilizes a cross-functional approach to address the risk from cybersecurity threats and has formed an Information Security Leadership Group which includes management personnel from information technology, operations, legal, internal audit and other key business functions. The Information Security Leadership Group typically meets on a monthly basis, and more frequently as necessary. |
● | Governance: Pursuant to the Company’s ERM practices, oversight of cybersecurity risk management has been assigned to the full Board and to the Board’s Audit Committee. Quarterly updates are provided by Company management, including the Company’s Chief Information Security Officer, to the Audit Committee (three times per year) and the full Board (annually), to help ensure an ongoing dialogue regarding the Company’s cybersecurity initiatives, threats and incidents. |
A key part of the Company’s strategy for managing risks from cybersecurity threats is the ongoing assessment and testing of the Company’s processes and practices through auditing, assessments, tabletop exercises and other exercises focused on evaluating effectiveness. The Company regularly engages third parties to perform assessments on our cybersecurity measures, including information security maturity assessments and independent reviews of our information security control environment and operating effectiveness and adjusts its cybersecurity processes and practices as necessary.
The Audit Committee oversees the management of risks from cybersecurity threats, including the policies, processes and practices that the Company’s management implements to address risks from cybersecurity threats. Management’s quarterly presentations include reports on a wide range of topics including, for example, recent developments, evolving standards, vulnerability assessments, third-party and independent reviews, the threat environment, technological trends and information security considerations arising with respect to the Company’s peers and vendors. The Board also receives prompt and timely information regarding any cybersecurity incident that could pose a significant risk to the Company and receives ongoing updates regarding such incident until it has been addressed. At least once each year, and more frequently as required, the Board discusses the Company’s approach to cybersecurity risk management with the Company’s Chief Information Security Officer.
The Company’s Chief Information Security Officer is the member of the Company’s management that is principally responsible for overseeing the Company’s cybersecurity risk management program, in partnership with other members of the Information Security Leadership Group. Our Chief Information Security Officer has served in various roles in information technology and information security for over twenty years. Our Chief Information Security Officer holds graduate degrees in cybersecurity and business administration and has attained multiple professional certifications including CISSP, CISA and CISM.
29
The Company’s Chief Information Security Officer, in coordination with the Information Security Leadership Group, works collaboratively across the Company to implement a program designed to protect the Company’s information systems from cybersecurity threats and to promptly respond to any cybersecurity incidents. To facilitate the success of this program, multi-disciplinary teams throughout the Company are deployed to address cybersecurity threats and to respond to cybersecurity incidents in accordance with the Company’s incident response plan. Through ongoing communications with these teams, the Chief Information Security Officer and the Information Security Leadership Group monitor the prevention, detection, mitigation and remediation of cybersecurity incidents in real time, and report such incidents to the Board when appropriate, as addressed above.
While we and our third-party providers have in the past experienced cybersecurity incidents, we are not aware of any current incidents or new types of threats which have materially affected or are reasonably likely to materially affect the Company, including its business strategy, results of operations, or financial condition.
Item 2. Properties
Our corporate headquarters and principal research and development, manufacturing, and sales and service facilities as of December 31, 2023 are as follows:
| Approximate |
|
| |
Owned Facilities Location | Size (sq. ft.) | Use | ||
Plainview, NY |
| 80,000 |
| Corporate Headquarters; R&D; Sales & Service; Administration |
Somerset, NJ |
| 80,000 |
| R&D; Manufacturing; Sales & Service; Administration |
St. Paul, MN |
| 43,000 |
| R&D; Manufacturing; Sales & Service; Administration |
Somerset, NJ |
| 38,000 |
| R&D; Sales & Service; Administration |
| Approximate |
|
|
| Lease | |
Leased Facilities Location | Size (sq. ft.) | Use | Expiration | |||
San Jose, CA |
| 100,000 |
| R&D; Manufacturing; Sales & Service; Administration |
| 2037 |
Somerset, NJ |
| 57,000 |
| Warehouse |
| 2027 |
Horsham, PA |
| 49,000 |
| R&D; Manufacturing; Sales & Service; Administration |
| 2024 |
Waltham, MA |
| 17,000 |
| R&D; Sales & Service; Administration |
| 2030 |
Solvegatan, Sweden |
| 4,000 |
| R&D; Manufacturing; Sales & Service; Administration |
| 2025 |
In addition to the above, our foreign sales and service subsidiaries lease office space in China, Germany, Japan, Malaysia, Philippines, Singapore, South Korea, Thailand, Taiwan and the United Kingdom. We believe our facilities are adequate to meet our current needs.
Item 3. Legal Proceedings
The discussion under the heading Legal Proceedings within Note 10, “Commitments and Contingencies” to the Consolidated Financial Statements is incorporated herein by reference.
Item 4. Mine Safety Disclosures
Not Applicable.
30
PART II
Item 5. Market for Registrant’s Common Equity, Related Stockholder Matters and Issuer Purchases of Equity Securities
Our common stock is quoted on The NASDAQ Global Select Market under the symbol “VECO.” As of February 13, 2024, there were approximately 122 stockholders of record of our common stock. Because many of our shares of common stock are held by brokers and other institutions on behalf of stockholders, we are unable to estimate the total number of stockholders represented by these record holders. We have not paid dividends on our common stock. The Board of Directors will determine future dividend policy based on our consolidated results of operations, financial condition, capital requirements, and other circumstances.
31
Stock Performance Graph
ASSUMES $100 INVESTED ON DEC. 31, 2018
ASSUMES DIVIDENDS REINVESTED
FISCAL YEAR ENDING DEC. 31
| 2018 |
| 2019 |
| 2020 |
| 2021 |
| 2022 |
| 2023 | |
Veeco Instruments Inc. |
| 100.00 |
| 198.18 |
| 234.28 |
| 384.21 |
| 250.74 |
| 418.76 |
S&P Smallcap 600 |
| 100.00 |
| 122.78 |
| 136.64 |
| 173.29 |
| 145.39 |
| 168.73 |
RDG MidCap Technology |
| 100.00 |
| 135.47 |
| 183.68 |
| 207.06 |
| 151.73 |
| 190.98 |
Item 6. [Reserved]
32
Item 7. Management’s Discussion and Analysis of Financial Condition and Results of Operations
Executive Summary
We are an innovative manufacturer of semiconductor process equipment. Our proven ion beam, laser annealing, lithography, MOCVD, CVD, and single wafer wet processing technologies play an integral role in the fabrication and packaging of advanced semiconductor devices. With equipment designed to optimize performance, yield and cost of ownership, Veeco holds leading technology positions in the markets we serve. To learn more about Veeco’s systems and service offerings, visit www.veeco.com.
The Veeco United team executed well during 2023, accomplishing a number of milestones, including:
● | Solidly executing our multi-year growth strategy, with progress made towards advancing our product roadmaps for the Semiconductor and Compound Semiconductor markets, including shipment of two next generation nanosecond annealing evaluation systems to Tier 1 logic customers, shipment of two IBD300 evaluation systems to Tier 1 memory customers, and the continued development of our CVD SiC technology; |
● | Achieved year-on-year revenue growth for the Company, including record revenue in the Semiconductor market, which grew 12% year-on-year despite a decline in Wafer Fabrication Equipment (“WFE”) spending; |
● | Shipped multiple Laser Annealing systems to a new Tier 1 logic customer and a new Tier 1 memory customer, and expanded adoption of Laser Annealing systems with mature node customers; |
● | Gross margin improvement enabled 16% growth in operating income year-over-year; |
● | Successfully refinanced a portion of our convertible notes in order to strengthen our balance sheet and financial profile by extending the average maturity of our notes, reducing future annual cash interest payments, and lowering share dilution; |
● | Capital allocation toward organic growth initiatives in the Semiconductor and Compound Semiconductor markets remained a top priority, including strategic R&D investment and investment in our evaluation program. |
We believe these accomplishments enabled us to exit 2023 well positioned to execute on our growth plans for 2024.
Business Update
Macroeconomic challenges across the industry have been well publicized, including an inflationary and high-interest rate environment, heightened China export regulations, uncertainty in the banking industry, and an uncertain outlook in the semiconductor and related markets due to softness in consumer, smartphone and PC applications, all of which are contributing to increased uncertainty.
Furthermore, on October 17, 2023, the US Department of Commerce, Bureau of Industry and Security (“BIS”), issued an update to export regulations previously issued on October 7, 2022, to modify and reinforce the prior restrictions while placing additional entities on the BIS Entity List. While these new regulations have not had a material impact to our business, the export regulation landscape is fluid and evolving, and it is possible that the issuance of additional export controls could further restrict our ability to sell to customers in China and lead to future revenue loss. If we are not able to replace these sales with sales to other customers, it could have a material adverse impact on our business and financial position.
33
Finally, we continue to see reduced demand for certain products such as advanced packaging lithography, spare parts, and upgrades due to low customer utilization rates, as well as instances where customers have requested order cancellations, delayed shipments, or delayed payments. Consequently, we are monitoring the situation very closely and have been taking early actions to limit the pace at which we increase spending while maintaining our growth trajectory. We also have seen improvements in our supply chain, as evidenced by a significant decline in lead times and a further improvement to suppliers on time deliveries. Material lead times have improved significantly and have generally returned to pre-pandemic levels. We will continue to work with our suppliers to identify and mitigate potential gaps in an effort to ensure continuity of supply, as well as continue to focus our efforts on cost containment initiatives.
While we work to overcome these macroeconomic challenges, we continue to serve our customers in the following four end markets: Semiconductor; Compound Semiconductor; Data Storage; and Scientific & Other.
Sales in the Semiconductor market grew 12% in 2023, driven by our laser annealing systems for both advanced and mature node devices. While our growth strategy is predominately focused on advanced node logic and memory applications, 2023 revenue has been strong for mature node applications in China. We continue to build momentum for our laser annealing solutions in advanced node logic by winning application steps and new customers. In 2023, we penetrated our 3rd Tier 1 logic customer and shipped multiple systems to this customer. As it relates to the memory market, we announced that a Tier 1 memory customer placed several LSA orders for high volume production of High Bandwidth Memory (“HBM”) and advanced DRAM devices following a successful evaluation program, and we shipped several systems to this customer in 2023. Our Laser Annealing roadmap reached a key milestone during the fourth quarter upon shipment of our first two Nanosecond Annealing evaluation systems to Tier 1 logic customers. Nanosecond annealing provides Veeco with an opportunity to expand laser annealing adoption for new advanced node applications. The ongoing adoption of EUV Lithography for advanced node semiconductor manufacturing continues to drive demand for our Ion Beam mask blank deposition systems. We reached another significant milestone in the fourth quarter upon shipment of our first two IBD300 evaluation systems to Tier 1 memory customers for 300mm front end semiconductor applications. Additionally, our lithography systems for Advanced Packaging are used for packaging approaches such as fan out wafer level packaging and other advanced packaging applications, while our wet processing systems are used for Photoresist Strip, Solvent Cleans, and flux removal. Overall, our technology and market strategy are well aligned with trends such as artificial intelligence, mobile connectivity and high-performance computing that drive the Semiconductor market. Given our current backlog and visibility, we expect Semiconductor revenue to be up in 2024.
We address the Compound Semiconductor market with a broad portfolio of technologies, including Wet Processing and MOCVD, along with MBE and Ion Beam, in emerging applications such as 5G driven RF device/filter manufacturing, GaN power electronics, and photonics applications including edge-emitting lasers, specialty LEDs and micro-LEDs. Sales in the Compound Semiconductor market declined by 28% in 2023, driven by a decline in systems for 5G driven RF device/filter manufacturing. We continue to invest for future growth in the Compound Semiconductor market in areas like Power Electronics and Micro-LED. Power Electronics markets are served by GaN equipment, and also by SiC epitaxy equipment. We are working to penetrate the GaN power market, which is driven by applications such as wireless charging in consumer electronics. In addition to our GaN system offerings, on January 31, 2023 Veeco acquired SiC technology to address the high-growth SiC power epitaxy equipment market, which is primarily driven by adoption of electric vehicles. With this acquisition, Veeco is accelerating its entry into this market. We expect revenue in the Compound Semi market to grow in 2024.
Sales in the Data Storage market increased slightly in 2023. Demand for our Ion Beam products is driven by cloud-based storage. As reported, the hard disk drive industry experienced contraction in exabyte shipments in 2022 and 2023 with uncertainty as to the timing of a recovery; however, recent analyst and industry forecasts predict nearline hard disk drive exabyte shipments to grow at an approximate 20% CAGR over the coming years from a lower base in 2023 due to long-term growth in the cloud. Despite current industry challenges, we expect revenue in the Data Storage market to be flat to up in 2024.
Sales in the Scientific & Other market are largely driven by sales to governments, universities, and research institutions. We address the Scientific & Other market with several technologies, including MBE, ALD, MOCVD, Wet Processing, & IBD/IBE, which support scientific, optical coating and other applications, such as Micro-Electromechanical Systems
34
(MEMS) applications. Sales in this market increased as compared to the prior quarter and the prior year quarter. We expect sales in this market to grow in the long run, in line with GDP.
Results of Operations
Years Ended December 31, 2023 and 2022
The following table presents revenue and expense line items reported in our Consolidated Statements of Operations for 2023 and 2022 and the period-over-period dollar and percentage changes for those line items. Our results of operations are reported as one business segment, represented by our single operating segment.
For the year ended December 31, | Change |
| |||||||||||
2023 | 2022 | Period to Period |
| ||||||||||
(dollars in thousands) |
| ||||||||||||
Net sales |
| $ | 666,435 | 100 | % | $ | 646,137 | 100 | % | $ | 20,298 | 3 | % |
Cost of sales |
| 381,376 | 57 | % |
| 382,989 | 59 | % |
| (1,613) | (0) | % | |
Gross profit |
| 285,059 | 43 | % |
| 263,148 | 41 | % |
| 21,911 | 8 | % | |
Operating expenses, net: |
|
|
|
|
|
|
| ||||||
Research and development |
| 112,853 | 17 | % |
| 103,565 | 16 | % |
| 9,288 | 9 | % | |
Selling, general, and administrative |
| 92,756 | 14 | % |
| 88,952 | 14 | % |
| 3,804 | 4 | % | |
Amortization of intangible assets |
| 8,481 | 1 | % |
| 10,018 | 2 | % |
| (1,537) | (15) | % | |
Other operating expense (income), net |
| 1,029 | — | % |
| 317 | — | % |
| 712 | 225 | % | |
Total operating expenses, net |
| 215,119 | 32 | % |
| 202,852 | 31 | % |
| 12,267 | 6 | % | |
Operating income (loss) |
| 69,940 | 10 | % |
| 60,296 | 9 | % |
| 9,644 | 16 | % | |
Interest income (expense), net |
| (1,187) | (0) | % |
| (9,311) | (1) | % |
| 8,124 | (87) | % | |
Other income (expense), net | (97,091) | (15) | % | — | — | % | (97,091) | * | |||||
Income (loss) before income taxes |
| (28,338) | (4) | % |
| 50,985 | 8 | % |
| (79,323) | * | ||
Income tax expense (benefit) |
| 2,030 | — | % |
| (115,957) | — | % |
| 117,987 | * | ||
Net income (loss) | $ | (30,368) | (5) | % | $ | 166,942 | 26 | % | $ | (197,310) | * |
* | Not meaningful |
Net Sales
The following is an analysis of sales by end-market and by region:
Year ended December 31, | Change |
| |||||||||||
2023 | 2022 | Period to Period |
| ||||||||||
(dollars in thousands) |
| ||||||||||||
Sales by end-market |
|
|
|
|
|
|
|
|
| ||||
Semiconductor | $ | 412,724 | 62 | % | $ | 369,369 | 57 | % | $ | 43,355 | 12 | % | |
Compound Semiconductor |
| 87,258 | 13 | % |
| 121,194 | 19 | % |
| (33,936) | (28) | % | |
Data Storage |
| 88,473 | 13 | % |
| 87,544 | 13 | % |
| 929 | 1 | % | |
Scientific & Other |
| 77,980 | 12 | % |
| 68,030 | 11 | % |
| 9,950 | 15 | % | |
Total | $ | 666,435 | 100 | % | $ | 646,137 | 100 | % | $ | 20,298 | 3 | % | |
Sales by geographic region |
|
|
|
|
|
|
|
|
| ||||
United States | $ | 162,790 | 24 | % | $ | 197,433 | 31 | % | $ | (34,643) | (18) | % | |
EMEA |
| 76,697 | 12 | % |
| 87,837 | 14 | % |
| (11,140) | (13) | % | |
China | 217,942 | 33 | % | 123,703 | 19 | % | 94,239 | 76 | % | ||||
Rest of APAC |
| 208,693 | 31 | % |
| 235,735 | 36 | % |
| (27,042) | (11) | % | |
Rest of World |
| 313 | — | % |
| 1,429 | — | % |
| (1,116) | (78) | % | |
Total | $ | 666,435 | 100 | % | $ | 646,137 | 100 | % | $ | 20,298 | 3 | % |
35
Total sales increased for the year ended December 31, 2023 against the comparable prior year period in the Semiconductor and Scientific & Other markets, partially offset by a decline in the Compound Semiconductor market. By geography, sales increased in the China region, partially offset by a decrease in the United States, EMEA, and Rest of APAC regions. Included within the Rest of APAC region for the year ended December 31, 2023 were sales in Japan, Taiwan, and Singapore of $74.7 million, $62.7 million, and $32.2 million, respectively, while sales within Rest of APAC region for the year ended December 31, 2022 included sales in sales in Taiwan, South Korea, Singapore, and Japan of $105.0 million, $40.3 million, $38.4 million, and $30.8 million, respectively. We expect there will continue to be year-to-year variations in our future sales distribution across markets and geographies. In light of the global nature of our business, we are impacted by conditions in the various countries in which we and our customers operate.
Gross Profit
In 2023, gross profit increased compared to 2022 primarily due to an increase in sales volume and higher gross margins. Gross margins increased due to product mix of sales in the period, as well as favorable service spending. We expect our gross margins to fluctuate each period due to product mix and other factors.
Research and Development
The markets we serve are characterized by continuous technological development and product innovation, and we invest in various research and development initiatives to maintain our competitive advantage and achieve our growth objectives. Research and development expenses increased in 2023 compared to 2022 primarily due to personnel-related expenses as we invest in new research and development and additional applications for our technology in order to be well-positioned to capitalize on emerging global megatrends and support longer term growth in Semiconductor and Compound Semiconductor markets.
Selling, General, and Administrative
Selling, general, and administrative expenses increased slightly in 2023 compared to 2022. However, expenses as a percentage of revenue have remained flat when compared to the prior period. Given the uncertainty regarding the impacts on our business resulting from the general macroeconomic environment, we are focused on the proactive management of expenses.
Amortization Expense
Amortization expense decreased in 2023 compared to 2022 primarily due to changes in amortization expense to reflect expected cash flows of certain intangible assets, as well as certain other intangible assets becoming fully amortized in 2022.
Interest Income (Expense)
For the year ended December 31, 2023, we recorded net interest expense of $1.2 million, compared to $9.3 million for the comparable prior period. The decrease in net interest expense was primarily related to an increase of interest income of approximately $8.4 million due to higher interest rates for 2023 compared to 2022.
Other Income (Expense)
On May 19, 2023, in connection with the completion of a private offering of $230.0 million aggregate principal amount of 2.875% convertible senior notes, we repurchased and retired approximately $106.0 million in aggregate principal amount of our outstanding 2025 Notes, with a carrying amount of $105.4 million, for approximately $106.0 million of cash and 0.7 million shares of our common stock for the 2025 Notes. Also, we repurchased and retired approximately $100.0 million in aggregate principal amount of our outstanding 2027 Notes with a carrying amount of $98.5 million, for approximately $92.8 million of cash and 3.8 million shares of our common stock for the 2027 Notes. We accounted for the partial settlement of the 2025 Notes and 2027 Notes as an extinguishment, and as such, recorded a loss on extinguishment of approximately $16.5 million and $80.6 million, respectively, for the year ended December 31, 2023.
36
Income Taxes
At each reporting date, we consider new evidence, both positive and negative, that could affect our view of the future realization of our deferred tax assets. As of December 31, 2023, we achieved three years of cumulative pretax income for our United States (“domestic”) operations. In addition, we evaluated additional positive evidence and concluded that it is more likely than not our deferred tax assets are realizable on a more likely than not basis with the exception of certain state tax attributes.
The 2023 income tax expense of $2.0 million was primarily comprised of 1) a $16.2 million income tax expense on pre-tax income from operations; and 2) a $2.0 million income tax expense related to share-based compensation, partially offset by 3) a $7.5 million tax benefit related to Foreign-Derived Intangible Income; 4) a $7.7 million tax benefit associated with research and development tax credits; and 5) a $1.0 million tax benefit associated with the loss on extinguishment of convertible notes under Section 249 of the Internal Revenue Code of 1986, as amended (Section 249).
The 2022 income tax benefit of $116.0 million was primarily comprised of a $117.0 million domestic tax benefit primarily in connection with release of $105.5 million valuation allowance, partially offset by a $1.0 million income tax expense related to our foreign operations.
Years Ended December 31, 2022 and 2021
See Part II, Item 7 of our Annual Report on Form 10-K for the fiscal year ended December 31, 2022, filed with the SEC on February 22, 2023, for Management’s Discussions and Analysis of Financial Condition and Results of Operations for the fiscal year ended December 31, 2021.
Liquidity and Capital Resources
Our cash and cash equivalents, restricted cash, and short-term investments are as follows:
December 31, | December 31, | |||||
| 2023 |
| 2022 | |||
(in thousands) | ||||||
Cash and cash equivalents | $ | 158,781 | $ | 154,925 | ||
Restricted cash |
| 339 |
| 547 | ||
Short-term investments |
| 146,664 |
| 147,488 | ||
Total | $ | 305,784 | $ | 302,960 |
A portion of our cash and cash equivalents is held by our subsidiaries throughout the world, frequently in each subsidiary’s respective functional currency, which is typically the U.S. dollar. At December 31, 2023 and 2022, cash and cash equivalents of $46.8 million and $28.4 million, respectively, were held outside the United States. As of December 31, 2023, we had $22.0 million of accumulated undistributed earnings generated by our non-U.S. subsidiaries for which the U.S. repatriation tax has been provided. Approximately $7.7 million of undistributed earnings would be subject to foreign withholding taxes if distributed back to the United States. We believe that our projected cash flow from operations, combined with our cash and short-term investments, will be sufficient to meet our projected working capital requirements, contractual obligations, and other cash flow needs for the next twelve months, including scheduled interest payments on our convertible senior notes.
37
A summary of the cash flow activity for the year ended December 31, 2023 and 2022 is as follows:
Cash Flows from Operating Activities
| For the year ended December 31, | |||||
| 2023 |
| 2022 | |||
(in thousands) | ||||||
Net income (loss) | $ | (30,368) | $ | 166,942 | ||
Non-cash items: | ||||||
Depreciation and amortization |
| 24,966 |
| 25,645 | ||
Non-cash interest expense |
| 1,118 |
| 962 | ||
Deferred income taxes |
| (2,211) |
| (118,040) | ||
Share-based compensation expense |
| 28,558 |
| 22,994 | ||
Loss on extinguishment of debt | 97,091 | — | ||||
Provision for bad debts | 316 | — | ||||
Change in contingent consideration |
| 701 |
| — | ||
Changes in operating assets and liabilities |
| (58,497) |
| 9,980 | ||
Net cash provided by (used in) operating activities | $ | 61,674 | $ | 108,483 |
Net cash provided by operating activities was $61.7 million for the year ended December 31, 2023 and was due to net loss of $30.4 million and adjustments for non-cash items of $150.5 million, partially offset by a decrease in cash flow from changes in operating assets and liabilities of $58.5 million. The changes in operating assets and liabilities were largely attributable to increases in inventories largely related to evaluation systems at customer facilities, contract assets, prepaid expenses and other current assets, and decreases in accounts payable, and contract liabilities.
Net cash provided by operating activities was $108.5 million for the year ended December 31, 2022 and was due to net income of $166.9 million and an increase in cash flow from operating activities due to changes in operating assets and liabilities of $10.0 million, partially offset by adjustments for non-cash items of $68.5 million. The changes in operating assets and liabilities was largely attributable to an increase in contract liabilities, partially offset by an increase in inventories and accounts receivables.
Cash Flows from Investing Activities
For the year ended December 31, | ||||||
| 2023 |
| 2022 | |||
(in thousands) | ||||||
Acquisitions of businesses, net of cash acquired | $ | (30,373) | $ | — | ||
Capital expenditures | (27,930) | (24,604) | ||||
Changes in investments, net |
| 4,973 |
| (44,276) | ||
Net cash provided by (used in) investing activities | $ | (53,330) | $ | (68,880) |
The cash used in investing activities during the year ended December 31, 2023 was primarily attributable to net cash used in the acquisition of Epiluvac, and capital expenditures, partially offset by changes in net investment activity. The cash used in investing activities during the year ended December 31, 2022 was attributable to the net change in investments, as well as capital expenditures.
38
Cash Flows from Financing Activities
For the year ended December 31, | ||||||
| 2023 |
| 2022 | |||
(in thousands) | ||||||
Proceeds from issuance of 2029 Notes, net of issuance costs | $ | 223,202 | $ | — | ||
Extinguishment of Convertible Notes | (218,991) | — | ||||
Contingent consideration payment | (2,500) | — | ||||
Settlement of equity awards, net of withholding taxes | (6,391) | (4,550) | ||||
Net cash provided by (used in) financing activities | $ | (4,680) | $ | (4,550) |
The cash used in financing activities for the year ended December 31, 2023 was related to the partial repurchase of the 2025 Notes and 2027 Notes, repayment of the 2023 Notes, contingent consideration payment related to the Epiluvac acquisition, as well as cash used to settle taxes related to employee equity programs, partially offset by proceeds from issuance of the 2029 Notes. The net cash used in financing activities for the year ended December 31, 2022 was primarily related to the settlement of equity awards.
Convertible Senior Notes and Revolving Credit Facility
We have $26.5 million outstanding principal balance of 3.50% convertible senior notes that bear interest at a rate of 3.50% per year, payable semiannually in arrears on January 15 and July 15 of each year, and mature on January 15, 2025, unless earlier purchased by the Company, redeemed, or converted. In addition, we have $25.0 million outstanding principal balance of 3.75% convertible senior notes that bear interest at a rate of 3.75% per year, payable semiannually in arrears on June 1 and December 1 of each year, and mature on June 1, 2027, unless earlier purchased by the Company, redeemed, or converted. The 2027 Notes are currently convertible by shareholders until March 31, 2024. In addition, we have $230.0 million outstanding principal balance of 2.875% convertible senior notes that bear interest at a rate of 2.875% per year, payable semiannually in arrears on June 1 and December 1 of each year, and mature on June 1, 2029, unless earlier purchased by the Company, redeemed, or converted.
We believe that we have sufficient capital resources and cash flows from operations to support scheduled interest payments on these debts. In addition, we have access to a $150.0 million revolving credit facility (including an ability to request an additional $75.0 million, for a total commitment of no more than $225.0 million) to provide for our working capital needs and reimburse drawings under letters of credit and for other general corporate purposes. The Company has no immediate plans to draw down on the facility, which expires in December of 2026. Interest under the Facility is variable based on the Company’s secured net leverage ratio and is expected to bear interest based on SOFR plus a range of 150 to 225 basis points, if drawn. There is a yearly commitment fee of 25 to 35 basis points, based on the Company’s secured net leverage ratio, charged on the unused portion of the Facility.
Contractual Obligations and Commitments
We have commitments under certain contractual arrangements to make future payments for goods and services. These contractual arrangements secure the rights to various assets and services to be used in the future in the normal course of business. We expect to fund these contractual arrangements with cash generated from operations in the normal course of business, as well as existing cash and cash equivalents and short-term investments. In addition, we have bank guarantees and letters of credit issued by a financial institution on our behalf as needed. At December 31, 2023, outstanding bank guarantees and letters of credit totaled $19.6 million and unused bank guarantees and letters of credit of $13.0 million were available to be drawn upon.
39
The following table summarizes our contractual arrangements at December 31, 2023 and the timing and effect that those commitments are expected to have on our liquidity and cash flow in future periods.
Payments due by period | |||||||||||||||
Less than | 1 – 3 | 3 – 5 | More than | ||||||||||||
| Total |
| 1 year |
| years |
| years |
| 5 years | ||||||
(in thousands) | |||||||||||||||
Principal payments on long-term debt | $ | 281,500 | $ | — | $ | 26,500 | $ | 25,000 | $ | 230,000 | |||||
Cash interest on debt |
| 41,042 |
| 8,478 |
| 15,564 |
| 13,694 |
| 3,306 | |||||
Operating leases |
| 49,794 |
| 3,692 |
| 8,217 |
| 7,061 |
| 30,824 | |||||
Purchase commitments(1) |
| 200,425 |
| 177,026 |
| 23,399 |
| — |
| — | |||||
Total | $ | 572,761 | $ | 189,196 | $ | 73,680 | $ | 45,755 | $ | 264,130 |
(1) | Purchase commitments are generally for inventory used in the manufacturing of our products, as well as equipment and project materials used to support research and development activities. We generally do not enter into purchase commitments extending beyond one year. However, material shortages and supply chain challenges have caused some of these commitments to extend beyond one year. At December 31, 2023, we have $19.4 million of offsetting supplier deposits that will be applied against these purchase commitments. |
Critical Accounting Policies and Estimates
Our discussion and analysis of our financial condition and results of operations are based upon our Consolidated Financial Statements, which have been prepared in accordance with accounting principles generally accepted in the United States. The preparation of these financial statements requires a high degree of judgment, either in the application and interpretation of existing accounting literature or in the development of estimates that affect the reported amounts of assets, liabilities, revenues, and expenses. We continuously evaluate our estimates and judgments based on historical experience, as well as other factors that we believe to be reasonable under the circumstances. The results of our evaluation form the basis for making judgments about the carrying values of assets and liabilities that are not readily apparent from other sources. These estimates may change in the future if underlying assumptions or factors change, and actual results may differ from these estimates.
We consider the following significant accounting policies to be critical because of their complexity and the high degree of judgment involved in maintaining them.
Revenue Recognition
We recognize revenue upon the transfer of control of the promised product or service to the customer in an amount that reflects the consideration we expect to receive in exchange for such product or service. We perform the following five steps to determine when to recognize revenue: (1) identification of the contract(s) with customers, (2) identification of the performance obligations in the contract, (3) determination of the transaction price, (4) allocation of the transaction price to the performance obligations in the contract, and (5) recognition of revenue when, or as, a performance obligation is satisfied. Judgment is used in the following areas in the determination of when to recognize revenue:
● | Identification of performance obligations and allocation of contract price: Our contracts with customers frequently contain multiple deliverables, such as systems, upgrades, components, spare parts, installation, maintenance, and service plans. We allocate revenue to each performance obligation on a relative stand-alone selling price basis. The stand-alone selling prices are determined based on the prices at which we separately sell the systems, upgrades, components, spare parts, installation, maintenance, and service plans. For items that are not sold separately, we estimate stand-alone selling prices generally using an expected cost plus margin approach. Judgment is required to properly identify the performance obligations within a contract and to determine how the revenue should be allocated among the performance obligations. |
40
● | Combination of contracts: Judgment is required when evaluating whether multiple transactions with the same customer or related parties should be considered part of a single contract. This evaluation includes an assessment of whether the contracts or agreements are negotiated or executed within a short time frame of each other or if there are indicators that the contracts are negotiated in contemplation of one another. |
● | Variable consideration: Our contracts with customers generally do not contain variable consideration. In the rare instances where variable consideration is included, we estimate the amount of variable consideration and determine what portion of that, if any, has a high probability of significant subsequent revenue reversal, and if so, that amount is excluded from the transaction price. |
● | Transfer of control: Judgment may be required in the determination of when transfer of control occurs. This judgment may include the interpretation of commercial terms and consideration of the customer’s post-delivery acceptance provisions. Our system sales arrangements, including certain upgrades, generally include field acceptance provisions that may include functional or mechanical test procedures. When we objectively demonstrate that the criteria specified in the contractual acceptance provisions are achieved prior to delivery either through customer testing or our historical experience of our tools meeting specifications, transfer of control of the product to the customer is considered to have occurred and revenue is recognized upon system delivery since there is no substantive contingency remaining related to the acceptance provisions at that date. For new products, new applications of existing products, or for products with substantive customer acceptance provisions where we cannot objectively demonstrate that the criteria specified in the contractual acceptance provisions have been achieved prior to delivery, revenue and the associated costs are deferred. We recognize such revenue and costs upon obtaining objective evidence that the acceptance provisions can be achieved, assuming all other revenue recognition criteria have been met. |
Any material changes in the identification of performance obligations, determination and allocation of the transaction price to performance obligations, and determination of when transfer of control occurs to the customer, could impact the timing and amount of revenue recognition, which could have a material effect on our financial condition and results of operations.
Inventory Valuation
Inventories are stated at the lower of cost or net realizable value, with cost determined on a first-in, first-out basis. Each quarter we assess the valuation and recoverability of all inventories: materials (raw materials, spare parts, and service inventory); work-in-process; finished goods; and evaluation inventory at customer facilities. Obsolete inventory or inventory in excess of our estimated usage requirements is written down to its estimated net realizable value if less than cost. We evaluate usage requirements by analyzing historical usage, anticipated demand, alternative uses of materials, and other qualitative factors. Unanticipated changes in demand for our products may require a write down of inventory that could materially affect our operating results.
Goodwill and Intangible Assets
Goodwill is tested for impairment at least annually in the beginning of the fourth quarter of our fiscal year, which may require significant judgment. We may first perform a qualitative assessment of whether it is more likely than not that the reporting unit’s fair value is less than its carrying amount, and, if so, we then quantitatively compare the fair value of our reporting unit to its carrying amount. If the fair value of the reporting unit exceeds its carrying amount, goodwill is not impaired. If the carrying amount of the reporting unit exceeds its fair value, we then record an impairment loss equal to the difference, up to the carrying value of goodwill.
We determine the fair value of our reporting unit based on a reconciliation of the aggregate fair value of our reporting unit to our adjusted market capitalization. The adjusted market capitalization is calculated by multiplying the average share price of our common stock for the last ten trading days prior to the measurement date by the number of outstanding common shares and adding a control premium. The determination of a reasonable control premium may require significant judgment and is estimated using historical transactions in similar industries.
41
The carrying values of long-lived assets, including identifiable intangible assets, are reviewed for impairment whenever events or changes in circumstances indicate that the carrying amount of an asset may not be recoverable. If circumstances require a long-lived asset or asset group be tested for possible impairment, a recoverability test is performed utilizing undiscounted cash flows expected to be generated by that asset or asset group compared to its carrying amount. If the carrying amount of the long-lived asset or asset group is not recoverable on an undiscounted cash flow basis, impairment is recognized to the extent the carrying amount exceeds its fair value. Fair value is determined through various valuation techniques including discounted cash flow models or, when available, quoted market values and third-party appraisals. It is not possible for us to predict the likelihood of any possible future impairments or, if such an impairment were to occur, the magnitude of any impairment.
Intangible assets with finite useful lives, including purchased technology, customer-related intangible assets, patents, trademarks, backlog, and software licenses, are subject to amortization over the expected period of economic benefit to us. We evaluate whether events or circumstances have occurred that warrant a revision to the remaining useful lives of intangible assets. In cases where a revision is deemed appropriate, the remaining carrying amounts of the intangible assets are amortized over the revised remaining useful life.
Intangible assets related to in-process research and development (“IPR&D”) projects are considered to be indefinite-lived until the completion or abandonment of the associated R&D efforts. If and when development is complete, the associated assets would be deemed long-lived and would then be amortized based on their respective estimated useful lives at that point in time. Indefinite-lived intangible assets are tested for impairment at least annually in the beginning of the fourth quarter of our fiscal year. In testing indefinite-lived intangible assets for impairment, we may first perform a qualitative assessment of whether it is more likely than not that the fair value of the indefinite-lived intangible asset is less than its carrying amount, and, if so, we then quantitatively compare the fair value of the indefinite-lived intangible asset to its carrying amount. We determine the fair value of our indefinite-lived intangible assets using a discounted cash flow method.
Accounting for Business Combinations
We allocate the fair value of the purchase price of our acquisitions to the tangible assets acquired, liabilities assumed, and intangible assets acquired based on their fair value at acquisition date. The excess of the fair value of the purchase price over the fair value of these net tangible and intangible assets acquired is recorded as goodwill. Management’s estimates of fair value are based on assumptions believed to be reasonable, but such estimates and assumptions are inherently uncertain and subject to refinement. We believe assumptions and estimates we have made in the past have been reasonable and appropriate, they are based, in part, on historical experience and information obtained from management of the acquired companies, and inherently uncertain. The Company uses a discounted cash flow model to estimate the fair value of acquired intangible assets. Additionally, the Company estimates the fair value of contingent consideration included as part of the purchase price by assigning probabilities and discount factors to each of the various defined performance milestones, while using a Monte-Carlo simulation model to determine the most likely outcome for payments to be based on value of orders received. These valuation models utilize critical estimates, including, but not limited to, estimates of future revenues, gross margins, operating expenses, and cash flows, as well as discount rates that reflect the risk factors associated with the projected cash flows. Unanticipated events and circumstances may occur that could affect either the accuracy or validity of such assumptions, estimates or actuals results.
Income Taxes
We estimate our income taxes in each of the jurisdictions in which we operate. Deferred income taxes reflect the net tax effect of temporary differences between the asset and liability balances recognized for financial reporting purposes and the balances used for income tax purposes, as well as the tax effect of carry forwards. We record a valuation allowance to reduce our deferred tax assets to the amount that is more likely than not to be realized. Realization of our net deferred tax assets is dependent on future taxable income.
42
We recognize the effect of income tax positions for only those positions which are estimated to more likely than not be sustained if challenged. We reflect changes in recognition or measurement in the period in which our change in judgment occurs. We record interest and penalties related to uncertain tax positions in income tax expense. Income taxes related to the global intangible low-taxed income (“GILTI”) rules are expensed as incurred.
Recent Accounting Pronouncements
We adopted ASU 2020-06 effective January 1, 2022. We are also evaluating other pronouncements recently issued but not yet adopted, including ASU 2023-09. The adoption of these pronouncements is not expected to have a material impact on our consolidated financial statements. Refer to Note 1, “Significant Accounting Policies,” for additional information.
Item 7A. Quantitative and Qualitative Disclosures about Market Risk
Interest Rate Risk
Our exposure to market rate risk for changes in interest rates primarily relates to our investment portfolio. We centrally manage our investment portfolios considering investment opportunities and risks, tax consequences, and overall financing strategies. Our investment portfolio includes fixed-income securities with a fair value of approximately $146.7 million at December 31, 2023. These securities are subject to interest rate risk and, based on our investment portfolio at December 31, 2023, a 100 basis point increase in interest rates would result in a decrease in the fair value of the portfolio of $0.8 million. While an increase in interest rates may reduce the fair value of the investment portfolio, we will not realize the losses in the Consolidated Statements of Operations unless the individual fixed-income securities are sold prior to recovery or the loss is determined to be other-than-temporary.
Currency Exchange Risk
We conduct business on a worldwide basis and, as such, a portion of our revenues, earnings, and net investments in foreign affiliates is exposed to changes in currency exchange rates. The economic impact of currency exchange rate movements is complex because such changes are often linked to variability in real growth, inflation, interest rates, governmental actions, and other factors. These changes, if material, could cause us to adjust our financing and operating strategies. Consequently, isolating the effect of changes in currency does not incorporate these other important economic factors.
Changes in currency exchange rates could affect our foreign currency denominated monetary assets and liabilities and forecasted cash flows. We may enter into monthly forward derivative contracts with the intent of mitigating a portion of this risk. We only use derivative financial instruments in the context of hedging and not for speculative purposes and have not designated our foreign exchange derivatives as hedges. Accordingly, changes in fair value from these contracts are included in “Other operating expense (income), net” in our Consolidated Statements of Operations. We execute derivative transactions with highly rated financial institutions to mitigate counterparty risk.
Our net sales to customers located outside of the United States represented approximately 76%, 69%, and 62% of our total net sales in 2023, 2022, and 2021, respectively. We expect that net sales to customers outside the United States will continue to represent a large percentage of our total net sales. Our net sales denominated in currencies other than the U.S. dollar represented approximately 4%, 3%, and 3% of total net sales in 2023, 2022, and 2021, respectively.
A 10% change in foreign exchange rates would have an immaterial impact on the consolidated results of operations since most of our sales outside the United States are denominated in U.S. dollars.
Item 8. Financial Statements and Supplementary Data
Our Consolidated Financial Statements are listed in the Index to Consolidated Financial Statements and Financial Statement Schedule filed as part of this Form 10-K.
43
Item 9. Changes in and Disagreements with Accountants on Accounting and Financial Disclosure
None.
Item 9A. Controls and Procedures
Management’s Report on Internal Control over Financial Reporting
Our principal executive and financial officers have evaluated and concluded that our disclosure controls and procedures are effective as of December 31, 2023. The disclosure controls and procedures are designed to ensure that the information required to be disclosed in this report filed under the Securities Exchange Act of 1934 is recorded, processed, summarized, and reported within the time periods specified in the Securities and Exchange Commission’s rules and forms and is accumulated and communicated to our principal executive and financial officers as appropriate to allow timely decisions regarding required disclosure.
Our principal executive and financial officers are responsible for establishing and maintaining adequate internal control over financial reporting, which is a process designed and put into effect to provide reasonable assurance regarding the reliability of financial reporting and the preparation of financial statements for external purposes in accordance with generally accepted accounting principles. Using the criteria established in the Internal Control — Integrated Framework (2013) published by the Committee of Sponsoring Organizations of the Treadway Commission (“COSO”), Management has evaluated, assessed, and concluded that internal control over financial reporting is effective as of December 31, 2023.
KPMG LLP, an independent registered public accounting firm, has audited the consolidated financial statements included in this Annual Report on Form 10-K and, as part of their audit, has issued their report, included herein, on the effectiveness of our internal control over financial reporting.
Changes in Internal Control over Financial Reporting
During the quarter ended December 31, 2023, there were no changes in internal control that have materially affected or are reasonably likely to materially affect internal control over financial reporting.
44
Report of Independent Registered Public Accounting Firm
To the Stockholders and Board of Directors
Veeco Instruments Inc.:
Opinion on Internal Control Over Financial Reporting
We have audited Veeco Instruments Inc. and subsidiaries' the (Company) internal control over financial reporting as of December 31, 2023, based on criteria established in Internal Control – Integrated Framework (2013) issued by the Committee of Sponsoring Organizations of the Treadway Commission. In our opinion, the Company maintained, in all material respects, effective internal control over financial reporting as of December 31, 2023, based on criteria established in Internal Control – Integrated Framework (2013) issued by the Committee of Sponsoring Organizations of the Treadway Commission.
We also have audited, in accordance with the standards of the Public Company Accounting Oversight Board (United States) (PCAOB), the consolidated balance sheets of the Company as of December 31, 2023 and December 31, 2022, the related consolidated statements of operations, comprehensive income (loss), stockholders’ equity, and cash flows for each of the years in the three-year period ended December 31, 2023, and the related notes and financial statement schedule II - valuation and qualifying accounts (collectively, the consolidated financial statements), and our report dated February 16, 2024 expressed an unqualified opinion on those consolidated financial statements.
Basis for Opinion
The Company’s management is responsible for maintaining effective internal control over financial reporting and for its assessment of the effectiveness of internal control over financial reporting, included in the accompanying Management’s Report on Internal Control over Financial Reporting. Our responsibility is to express an opinion on the Company’s internal control over financial reporting based on our audit. We are a public accounting firm registered with the PCAOB and are required to be independent with respect to the Company in accordance with the U.S. federal securities laws and the applicable rules and regulations of the Securities and Exchange Commission and the PCAOB.
We conducted our audit in accordance with the standards of the PCAOB. Those standards require that we plan and perform the audit to obtain reasonable assurance about whether effective internal control over financial reporting was maintained in all material respects. Our audit of internal control over financial reporting included obtaining an understanding of internal control over financial reporting, assessing the risk that a material weakness exists, and testing and evaluating the design and operating effectiveness of internal control based on the assessed risk. Our audit also included performing such other procedures as we considered necessary in the circumstances. We believe that our audit provides a reasonable basis for our opinion.
Definition and Limitations of Internal Control Over Financial Reporting
A company’s internal control over financial reporting is a process designed to provide reasonable assurance regarding the reliability of financial reporting and the preparation of financial statements for external purposes in accordance with generally accepted accounting principles. A company’s internal control over financial reporting includes those policies and procedures that (1) pertain to the maintenance of records that, in reasonable detail, accurately and fairly reflect the transactions and dispositions of the assets of the company; (2) provide reasonable assurance that transactions are recorded as necessary to permit preparation of financial statements in accordance with generally accepted accounting principles, and that receipts and expenditures of the company are being made only in accordance with authorizations of management and directors of the company; and (3) provide reasonable assurance regarding prevention or timely detection of unauthorized acquisition, use, or disposition of the company’s assets that could have a material effect on the financial statements.
Because of its inherent limitations, internal control over financial reporting may not prevent or detect misstatements. Also, projections of any evaluation of effectiveness to future periods are subject to the risk that controls may become inadequate because of changes in conditions, or that the degree of compliance with the policies or procedures may deteriorate.
/s/ KPMG LLP
Santa Clara, California
February 16, 2024
45
Item 9B. Other Information
PART III
Item 10. Directors, Executive Officers and Corporate Governance
Information required by this Item that will appear under the headings “Governance,” “Executive Officers,” and “Delinquent Section 16(a) Reports” in the definitive proxy statement to be filed with the SEC relating to our 2024 Annual Meeting of Stockholders is incorporated herein by reference.
We have adopted a Code of Ethics for Senior Officers (the “Code”) which applies to our principal executive officer, principal financial officer, principal accounting officer or controller, or persons performing similar functions. A copy of the Code can be found on our website (www.veeco.com). We intend to disclose on our website the nature of any future amendments to and waivers of the Code that apply to the chief executive officer, principal financial officer, principal accounting officer, or persons performing similar functions. We have also adopted a Code of Conduct which applies to all of our employees, including those listed above, as well as to our directors. A copy of the Code of Conduct can be found on our website (www.veeco.com). The website address above is intended to be an inactive, textual reference only. None of the material on this website is part of this report.
Item 11. Executive Compensation
Information required by this Item that will appear under the heading “Compensation” in the definitive proxy statement to be filed with the SEC relating to our 2024 Annual Meeting of Stockholders is incorporated herein by reference.
Item 12. Security Ownership of Certain Beneficial Owners and Management and Related Stockholder Matters
Information required by this Item that will appear under the headings “Security Ownership of Certain Beneficial Owners and Management” and “Equity Compensation Plan Information” in the definitive proxy statement to be filed with the SEC relating to our 2024 Annual Meeting of Stockholders is incorporated herein by reference.
Item 13. Certain Relationships and Related Transactions, and Director Independence
Information required by this Item that will appear under the headings “Certain Relationships and Related Transactions” and “Independence of Board” in the definitive proxy statement to be filed with the SEC relating to our 2024 Annual Meeting of Stockholders is incorporated herein by reference.
Item 14. Principal Accounting Fees and Services
Information required by this Item that will appear under the heading “Independent Auditor Fees and Other Matters” in the definitive proxy statement to be filed with the SEC relating to our 2024 Annual Meeting of Stockholders is incorporated herein by reference.
46
PART IV
Item 15. Exhibits, Financial Statement Schedules
(a) (1) The Registrant’s financial statements together with a separate table of contents are annexed hereto
(2) Financial Statement Schedules are listed in the separate table of contents annexed hereto.
(3) Exhibits
Unless otherwise indicated, each of the following exhibits has been previously filed with the Securities and Exchange Commission by the Company under File No. 0-16244.
Filed or | ||||||||||
---|---|---|---|---|---|---|---|---|---|---|
Exhibit | Incorporated by Reference | Furnished | ||||||||
Number |
| Exhibit Description |
| Form |
| Exhibit |
| Filing Date |
| Herewith |
1.1 |
| SD |
| 1.01 |
| 5/30/2023 | ||||
3.1 | 10-Q | 3.1 | 8/14/1997 | |||||||
3.2 | Amendment to Certificate of Incorporation of Veeco dated May 29, 1998. | 10-K | 3.2 | 3/14/2001 | ||||||
3.3 | Amendment to Certificate of Incorporation of Veeco dated May 5, 2000. | 10-Q | 3.1 | 8/14/2000 | ||||||
3.4 | Amendment to Certificate of Incorporation of Veeco dated May 16, 2002. | 10-Q | 3.1 | 10/26/2009 | ||||||
3.5 | Amendment to Certificate of Incorporation of Veeco dated May 18, 2010. | 10-K | 3.8 | 2/24/2011 | ||||||
3.6 | Seventh Amended and Restated Bylaws of Veeco effective January 9, 2023. | 8-K | 3.1 | 1/10/2023 | ||||||
3.7 | 10-Q | 3.1 | 5/9/2001 | |||||||
4.1 | 8-K | 4.1 | 1/18/2017 | |||||||
4.2 | 8-K | 4.2 | 1/18/2017 | |||||||
4.3 | 8-K | 4.1 | 5/18/2020 | |||||||
4.4 | 8-K | 4.1 | 5/18/2020 | |||||||
4.5 | 8-K | 4.1 | 11/17/2020 | |||||||
4.6 | 8-K | 4.1 | 11/17/2020 | |||||||
4.7 | 10-Q | 4.1 | 8/7/2023 | |||||||
4.8 | 10-Q | 4.2 | 8/7/2023 |
47
Filed or | ||||||||||
---|---|---|---|---|---|---|---|---|---|---|
Exhibit | Incorporated by Reference | Furnished | ||||||||
Number |
| Exhibit Description |
| Form |
| Exhibit |
| Filing Date |
| Herewith |
4.9 | 10-K | 4.3 | 2/21/2020 | |||||||
10.1 | Lease dated February 18, 2021 between Veeco Instruments Inc. and Trimble-Junction Ventures LLC. | 8-K | 10.1 | 2/24/2021 | ||||||
10.2* | 10-K | 10.1 | 2/22/2021 | |||||||
10.3* | Veeco Amended and Restated 2010 Stock Incentive Plan, effective May 5, 2016. | S-8 | 10.1 | 6/2/2016 | ||||||
10.4* | Veeco Amended and Restated 2010 Stock Incentive Plan, effective March 3, 2017. | 10-Q | 10.1 | 11/3/2017 | ||||||
10.5* |
|
| S-8 |
| 10.1 |
| 5/7/2019 |
| ||
10.6* | Amendment No. 1 to the Veeco Instruments Inc.2019 Stock Incentive Plan. | S-8 | 4.8 | 5/20/2022 | ||||||
10.7 | Ultratech, Inc. 1993 Stock Option/Stock Issuance Plan (as Amended and Restated as of May 31, 2011) | S-8 | 10.1 | 5/26/2017 | ||||||
10.8 | 8-K | 10.1 | 5/18/2020 | |||||||
10.9 | 8-K | 10.1 | 11/17/2020 | |||||||
10.10 | 8-K | 10.1 | 11/8/2021 | |||||||
10.11 | 8-K | 10.1 | 12/20/2021 | |||||||
10.12 | 8-K | 10.2 | 12/20/2021 | |||||||
10.13 | 10-Q | 10.1 | 8/7/2023 | |||||||
10.14* | 10-Q |
| 10.1 |
| 5/7/2019 | |||||
10.15* | 10-Q |
| 10.2 |
| 5/7/2019 |
48
Filed or | ||||||||||
---|---|---|---|---|---|---|---|---|---|---|
Exhibit | Incorporated by Reference | Furnished | ||||||||
Number |
| Exhibit Description |
| Form |
| Exhibit |
| Filing Date |
| Herewith |
10.16* | 10-Q |
| 10.3 |
| 5/7/2019 | |||||
10.17* | 10-K | 10.16 | 2/22/2021 | |||||||
10.18* | 10-K | 10.17 | 2/22/2021 | |||||||
10.19* | 10-Q | 10.1 | 5/4/2021 | |||||||
10.20* | 10-Q | 10.2 | 5/4/2021 | |||||||
10.21* | 10-Q | 10.1 | 5/9/2022 | |||||||
10.22* | 10-Q | 10.2 | 5/9/2022 | |||||||
10.23* | 10-Q | 10.1 | 5/8/2023 | |||||||
10.24* | 10-Q | 10.2 | 5/8/2023 | |||||||
10.25* | Veeco 2013 Inducement Stock Incentive Plan, effective September 26, 2013. | 10-Q | 10.1 | 11/4/2013 | ||||||
10.26* | S-8 | 10.9 | 6/2/2016 | |||||||
10.27* | First Amendment to Veeco Instruments Inc. 2016 Employee Stock Purchase Plan. | S-8 | 10.11 | 5/7/2019 | ||||||
10.28* | Second Amendment to Veeco Instruments Inc. 2016 Employee Stock Purchase Plan. | S-8 | 10.1 | 5/11/2021 | ||||||
10.29* | 10-Q | 10.2 | 8/3/2017 | |||||||
10.30* | 10-K | 10.22 | 2/28/2014 | |||||||
10.31* | Letter Agreement dated January 30, 2012 between Veeco and Dr. William J. Miller. | 10-K | 10.30 | 2/22/2012 | ||||||
10.32* | Letter Agreement dated August 29, 2018 between Veeco and Dr. William J. Miller. | 8-K | 10.2 | 9/4/2018 |
49
Filed or | ||||||||||
---|---|---|---|---|---|---|---|---|---|---|
Exhibit | Incorporated by Reference | Furnished | ||||||||
Number |
| Exhibit Description |
| Form |
| Exhibit |
| Filing Date |
| Herewith |
10.33* |
| Amendment dated March 22, 2019 to the Letter Agreement between Veeco and William J. Miller, Ph.D. | 10-Q | 10.4 |
| 5/7/2019 | ||||
10.34* | Letter Agreement dated January 21, 2004 between Veeco and John P. Kiernan. | 10-K | 10.38 | 3/12/2004 | ||||||
10.35* | Amendment effective June 9, 2006 to Letter Agreement between Veeco and John P. Kiernan. | 10-Q | 10.3 | 8/4/2006 | ||||||
10.36* | Amendment effective December 31, 2008 to Letter Agreement between Veeco and John P. Kiernan. | 10-K | 10.40 | 3/2/2009 | ||||||
10.37* |
| 8-K | 99.2 | 1/2/2020 |
| |||||
10.38* | Letter Agreement dated March 20, 2019 between Veeco and Adrian Devasahayam. | 10-K | 10.30 | 2/22/2021 | ||||||
10.39* | Letter Agreement dated August 4, 2017 between Veeco and Peter Porshnev. | 10-K | 10.31 | 2/22/2021 | ||||||
10.40* | Letter Agreement dated March 9, 2020 between Veeco and Susan Wilkerson. | 10-K | 10.32 | 2/22/2021 | ||||||
21.1 | X | |||||||||
23.1 | X | |||||||||
31.1 | X | |||||||||
31.2 | Certification of Chief Financial Officer pursuant to Rule 13a—14(a) or Rule 15d—14(a) of the Securities and Exchange Act of 1934. | X | ||||||||
32.1 | X | |||||||||
32.2 | X | |||||||||
97 | X | |||||||||
101.INS | XBRL Instance Document – the instance document does not appear in the Interactive Data File because its XBRL tags are embedded within the Inline. XBRL document. | ** | ||||||||
101.XSD | XBRL Schema. | ** | ||||||||
101.PRE | XBRL Presentation. | ** | ||||||||
101.CAL | XBRL Calculation. | ** | ||||||||
101.DEF | XBRL Definition. | ** | ||||||||
101.LAB | XBRL Label. | ** | ||||||||
104 | Cover Page Interactive Data File (formatted as Inline XBRL and contained in Exhibit 101). | ** |
* Indicates a management contract or compensatory plan or arrangement, as required by Item 15(a) (3) of Form 10-K.
** Filed herewith electronically
50
SIGNATURES
Pursuant to the requirements of Section 13 or 15(d) of the Securities Exchange Act of 1934, as amended, the Registrant has duly caused this report to be signed on its behalf by the undersigned, thereunto duly authorized, on February 16, 2024.
Veeco Instruments Inc. | ||
By: | /s/ WILLIAM J. MILLER, Ph.D. | |
William J. Miller, Ph.D. | ||
Chief Executive Officer |
Pursuant to the requirements of the Securities Exchange Act of 1934, as amended, this report has been signed below by the following persons on behalf of the Registrant and in the capacities indicated, on February 16, 2024.
Signature |
| Title |
/s/ WILLIAM J. MILLER, Ph.D. | Chief Executive Officer and Director | |
William J. Miller, Ph.D. | (principal executive officer) | |
/s/ JOHN P. KIERNAN | Senior Vice President and Chief Financial Officer | |
John P. Kiernan | (principal financial & accounting officer) | |
/s/ RICHARD A. D’AMORE | Chairman | |
Richard A. D’Amore | ||
/s/ KATHLEEN A. BAYLESS | Director | |
Kathleen A. Bayless | ||
/s/ SUJEET CHAND, Ph.D. Sujeet Chand, Ph.D. | Director | |
/s/ GORDON HUNTER | Director | |
Gordon Hunter | ||
/s/ KEITH D. JACKSON | Director | |
Keith D. Jackson | ||
/s/ LENA NICOLAIDES, Ph.D. | Director | |
Lena Nicolaides, Ph.D. | ||
/s/ MARY JANE RAYMOND | Director | |
Mary Jane Raymond | ||
/s/ THOMAS ST. DENNIS | Director | |
Thomas St. Dennis |
51
Veeco Instruments Inc. and Subsidiaries
Index to Consolidated Financial Statements and Financial Statement Schedule
11
F-1
Report of Independent Registered Public Accounting Firm
To the Stockholders and Board of Directors
Veeco Instruments Inc.:
Opinion on the Consolidated Financial Statements
We have audited the accompanying consolidated balance sheets of Veeco Instruments Inc. and subsidiaries (the Company) as of December 31, 2023 and December 31, 2022, the related consolidated statements of operations, comprehensive income (loss), stockholders’ equity, and cash flows for each of the years in the three-year period ended December 31, 2023, and the related notes and financial statement schedule II - valuation and qualifying accounts (collectively, the consolidated financial statements). In our opinion, the consolidated financial statements present fairly, in all material respects, the financial position of the Company as of December 31, 2023 and December 31, 2022, and the results of its operations and its cash flows for each of the years in the three-year period ended December 31, 2023, in conformity with U.S. generally accepted accounting principles.
We also have audited, in accordance with the standards of the Public Company Accounting Oversight Board (United States) (PCAOB), the Company’s internal control over financial reporting as of December 31, 2023, based on criteria established in Internal Control – Integrated Framework (2013) issued by the Committee of Sponsoring Organizations of the Treadway Commission, and our report dated February 16, 2024 expressed an unqualified opinion on the effectiveness of the Company’s internal control over financial reporting.
As discussed in Note 1 to the consolidated financial statements, the Company has changed its method of accounting for the convertible senior notes as of January 1, 2022 due to the adoption of Accounting Standards Update No. 2020-06: Debt – Debt with Conversion and Other Options (Subtopic 470-20) and Derivatives and Hedging – Contracts in Entity’s Own Equity (Subtopic 815-40): Accounting for Convertible Instruments and Contracts in an Entity’s Own Equity, using the modified retrospective method.
Basis for Opinion
These consolidated financial statements are the responsibility of the Company’s management. Our responsibility is to express an opinion on these consolidated financial statements based on our audits. We are a public accounting firm registered with the PCAOB and are required to be independent with respect to the Company in accordance with the U.S. federal securities laws and the applicable rules and regulations of the Securities and Exchange Commission and the PCAOB.
We conducted our audits in accordance with the standards of the PCAOB. Those standards require that we plan and perform the audit to obtain reasonable assurance about whether the consolidated financial statements are free of material misstatement, whether due to error or fraud. Our audits included performing procedures to assess the risks of material misstatement of the consolidated financial statements, whether due to error or fraud, and performing procedures that respond to those risks. Such procedures included examining, on a test basis, evidence regarding the amounts and disclosures in the consolidated financial statements. Our audits also included evaluating the accounting principles used and significant estimates made by management, as well as evaluating the overall presentation of the consolidated financial statements. We believe that our audits provide a reasonable basis for our opinion.
Critical Audit Matters
The critical audit matters communicated below are matters arising from the current period audit of the consolidated financial statements that were communicated or required to be communicated to the audit committee and that: (1) relate to accounts or disclosures that are material to the consolidated financial statements and (2) involved our especially challenging, subjective, or complex judgments. The communication of critical audit matters does not alter in any way our opinion on the consolidated financial statements, taken as a whole, and we are not, by communicating the critical audit matters below, providing separate opinions on the critical audit matters or on the accounts or disclosures to which they relate.
F-2
Assessment of the value of excess and obsolete inventory
As discussed in Note 1 of the consolidated financial statements, the Company assesses the valuation of its inventories, including materials, work-in-process, and finished goods, each reporting period. Obsolete inventory or inventory in excess of the Company’s estimated usage requirement is written down to its estimated net realizable value if less than cost. Estimates of usage include the Company’s analysis of anticipated demand, possible alternative uses of its inventory, as well as other qualitative factors. As of December 31, 2023, the Company’s inventories totaled $237.6 million.
We identified the assessment of the value of excess and obsolete inventory as a critical audit matter. Subjective auditor judgement was required to evaluate the Company’s estimates of anticipated demand, which can be affected by market and economic conditions outside the Company’s control.
The following are the primary procedures we performed to address this critical audit matter. We evaluated the design and tested the operating effectiveness of certain internal controls related to the Company’s inventory valuation process. This included controls related to the development of estimates of anticipated demand of inventory. We evaluated current year estimates of anticipated demand used to assess the value of excess and obsolete inventory when they differed significantly from historical sales volumes. For certain inventory items, we compared the prior year estimate of anticipated demand to actual results to assess the Company’s ability to accurately forecast.
Acquisition-date fair value of a developed technology intangible asset and contingent consideration in the acquisition of Epiluvac AB
As discussed in Note 5 to the consolidated financial statements, on January 31, 2023, the Company acquired Epiluvac AB (Epiluvac) in a business combination for total purchase consideration of $56.4 million, including contingent consideration. In connection with the transaction, the purchase price was allocated to the assets and liabilities assumed by the Company based on their fair values as of the acquisition date, primarily comprised of developed technology with the estimated fair value of $28.0 million. The acquisition date fair value of the contingent consideration was approximately $26.1 million, which includes payments up to $15.0 million based on the timely completion of certain defined milestones tied to strategic targets, and up to $20.0 million based on the percentage of orders received during the defined earn-out period. The Company estimated the fair value of the developed technology based on a discounted cash flow model. The Company estimated the fair value of the contingent consideration by assigning probabilities and discount factors to each of the various defined performance milestones, while using a Monte-Carlo simulation model to determine the most likely outcome for payments to be based on value of orders received.
We identified the evaluation of the acquisition-date fair value of developed technology and the acquisition-date fair value of the contingent consideration related to the orders received during the defined earn-out period as a critical audit matter. A higher degree of auditor judgment was required to evaluate the Company’s determination of certain projected revenues used in the fair value of the developed technology and the fair value of the contingent consideration because there was limited observable market information. Additionally, specialized skills and knowledge were required to evaluate the discount rates used to determine in the fair value of the developed technology and the fair value of the contingent consideration. Changes in certain projected revenues and discount rates could have a significant impact on the fair value of the acquired developed technology and the contingent consideration liability.
The following are the primary procedures we performed to address the critical audit matter. We evaluated the design and tested the operating effectiveness of certain internal controls related to the Company’s acquisition-date valuation process, including controls over the determination of certain projected revenues and discount rates. We evaluated the Company’s determination of certain projected revenues by (1) inquiring of individuals outside of the accounting function about the underlying assumptions used to determine certain projected revenues and the process used to develop them, (2) comparing the underlying assumptions to relevant industry reports, (3) and comparing the underlying assumptions to relevant competitor investor presentation materials. In addition, we involved valuation professionals with specialized skills and knowledge who assisted in:
F-3
● | evaluating the discount rate applied to the developed technology intangible asset by reconciling it to the weighted average cost of capital that was calculated using publicly available market data |
● | evaluating the discount rate applied to the contingent consideration by comparing it to a discount rate that was independently developed using publicly available market data |
● | developing a fair value estimate of the contingent consideration using a parallel Monte-Carlo simulation and comparing it to the Company’s estimate. |
/s/
We have served as the Company’s auditor since 2015.
February 16, 2024
F-4
Veeco Instruments Inc. and Subsidiaries
Consolidated Balance Sheets
(in thousands, except share amounts)
December 31, | December 31, | |||||
| 2023 |
| 2022 | |||
Assets | ||||||
Current assets: | ||||||
Cash and cash equivalents | $ | | $ | | ||
Restricted cash | | | ||||
Short-term investments |
| |
| | ||
Accounts receivable, net |
| |
| | ||
Contract assets | | | ||||
Inventories |
| |
| | ||
Prepaid expenses and other current assets | | | ||||
Total current assets |
| |
| | ||
Property, plant, and equipment, net |
| |
| | ||
Operating lease right-of-use assets | | | ||||
Intangible assets, net | | | ||||
Goodwill |
| |
| | ||
Deferred income taxes | | | ||||
Other assets |
| |
| | ||
Total assets | $ | | $ | | ||
Liabilities and stockholders' equity | ||||||
Current liabilities: | ||||||
Accounts payable | $ | | $ | | ||
Accrued expenses and other current liabilities |
| |
| | ||
Contract liabilities |
| |
| | ||
Income taxes payable |
| — |
| | ||
Current portion of long-term debt |
| — |
| | ||
Total current liabilities |
| |
| | ||
Deferred income taxes |
| |
| | ||
Long-term debt |
| |
| | ||
Long-term operating lease liabilities | | | ||||
Other liabilities |
| |
| | ||
Total liabilities |
| |
| | ||
Stockholders' equity: | ||||||
Preferred stock, $ |
| |||||
Common stock, $ |
| |
| | ||
Additional paid-in capital |
| |
| | ||
Accumulated deficit |
| ( |
| ( | ||
Accumulated other comprehensive income |
| |
| | ||
Total stockholders' equity |
| |
| | ||
Total liabilities and stockholders' equity | $ | | $ | |
See accompanying Notes to the Consolidated Financial Statements.
F-5
Veeco Instruments Inc. and Subsidiaries
Consolidated Statements of Operations
(in thousands, except per share amounts)
For the year ended December 31, | ||||||||||
|
| 2023 |
| 2022 |
| 2021 | ||||
Net sales | $ | | $ | | $ | | ||||
Cost of sales |
| |
| |
| | ||||
Gross profit |
| |
| |
| | ||||
Operating expenses, net: | ||||||||||
Research and development |
| |
| |
| | ||||
Selling, general, and administrative |
| |
| |
| | ||||
Amortization of intangible assets |
| |
| |
| | ||||
Other operating expense (income), net | | | | |||||||
Total operating expenses, net | | | | |||||||
Operating income |
| |
| |
| | ||||
Interest income |
| |
| |
| | ||||
Interest expense |
| ( |
| ( |
| ( | ||||
Other income (expense), net | ( | — | ( | |||||||
Income (loss) before income taxes |
| ( |
| |
| | ||||
Income tax expense (benefit) |
| |
| ( |
| ( | ||||
Net income (loss) | $ | ( | $ | | $ | | ||||
Income (loss) per common share: | ||||||||||
Basic | $ | ( | $ | | $ | | ||||
Diluted | $ | ( | $ | | $ | | ||||
Weighted average number of shares: | ||||||||||
Basic |
| |
| |
| | ||||
Diluted |
| |
| |
| |
See accompanying Notes to the Consolidated Financial Statements.
F-6
Veeco Instruments Inc. and Subsidiaries
Consolidated Statements of Comprehensive Income (Loss)
(in thousands)
For the year ended December 31, | ||||||||||
|
| 2023 |
| 2022 |
| 2021 | ||||
Net income (loss) | $ | ( | $ | | $ | | ||||
Other comprehensive income (loss), net of tax: | ||||||||||
Available-for-sale securities: | ||||||||||
Change in net unrealized gains or losses |
| |
| ( |
| ( | ||||
Unrealized gain (loss) on available-for-sale securities |
| |
| ( | ( | |||||
Currency translation adjustments: | ||||||||||
Change in currency translation adjustments |
| ( |
| ( |
| ( | ||||
Net changes related to currency translation adjustments |
| ( |
| ( |
| ( | ||||
Total other comprehensive income (loss), net of tax |
| |
| ( |
| ( | ||||
Total comprehensive income (loss) | $ | ( | $ | | $ | |
See accompanying Notes to the Consolidated Financial Statements.
F-7
Veeco Instruments Inc. and Subsidiaries
Consolidated Statements of Stockholders' Equity
(in thousands)
|
|
|
|
| Accumulated |
| |||||||||||
Additional | Other | ||||||||||||||||
Common Stock | Paid-in | Accumulated | Comprehensive | ||||||||||||||
Shares | Amount | Capital | Deficit | Income | Total | ||||||||||||
Balance at December 31, 2020 |
| | $ | | $ | | $ | ( | $ | | $ | | |||||
Net income (loss) |
| — |
| — |
| — |
| |
| — |
| | |||||
Other comprehensive income (loss), net of tax |
| — |
| — |
| — |
| — |
| ( |
| ( | |||||
Share-based compensation expense |
| — | — | |
| — |
| — |
| | |||||||
Net issuance under employee stock plans | | | ( | — | — | ( | |||||||||||
Extinguishment of equity component of repurchased/exchanged 2023 Notes | — | — | ( | — | — | ( | |||||||||||
Balance at December 31, 2021 |
| | | | ( | | | ||||||||||
Cumulative effect of change in accounting principle - adoption of ASU 2020-06 | — | — | ( | | — | ( | |||||||||||
Net income (loss) |
| — | — | — | | — |
| | |||||||||
Other comprehensive income (loss), net of tax |
| — | — | — | — | ( |
| ( | |||||||||
Share-based compensation expense |
| — | — | | — | — |
| | |||||||||
Net issuance under employee stock plans | | | ( | — | — | ( | |||||||||||
Balance at December 31, 2022 |
| | | | ( | | | ||||||||||
Net income (loss) |
| — | — | — | ( | — |
| ( | |||||||||
Other comprehensive income (loss), net of tax |
| — | — | — | — | |
| | |||||||||
Share-based compensation expense |
| — | — | | — | — |
| | |||||||||
Net issuance under employee stock plans | | | ( | — | — | ( | |||||||||||
Partial extinguishment of 2025 and 2027 Notes | | | | | |||||||||||||
Balance at December 31, 2023 |
| | $ | | $ | | $ | ( | $ | | $ | |
See accompanying Notes to the Consolidated Financial Statements.
F-8
Veeco Instruments Inc. and Subsidiaries
Consolidated Statements of Cash Flows
(in thousands)
For the year ended December 31, | |||||||||
| 2023 |
| 2022 |
| 2021 | ||||
Cash Flows from Operating Activities | |||||||||
Net income (loss) | $ | ( | $ | | $ | | |||
Adjustments to reconcile net income (loss) to net cash provided by (used in) operating activities: | |||||||||
Depreciation and amortization |
| |
| |
| | |||
Non-cash interest expense | | | | ||||||
Deferred income taxes |
| ( |
| ( |
| ( | |||
Share-based compensation expense |
| |
| |
| | |||
Loss on extinguishment of debt | | — | | ||||||
Impairment of equity investments | — | — | | ||||||
Provision for bad debts | | — | — | ||||||
Change in contingent consideration | | — | — | ||||||
Changes in operating assets and liabilities: | |||||||||
Accounts receivable and contract assets |
| |
| ( |
| ( | |||
Inventories |
| ( |
| ( |
| ( | |||
Prepaid expenses and other current assets |
| ( |
| |
| | |||
Accounts payable and accrued expenses |
| ( |
| ( |
| | |||
Contract liabilities |
| ( |
| |
| ( | |||
Income taxes receivable and payable, net |
| ( |
| |
| | |||
Other, net |
| ( |
| |
| | |||
Net cash provided by (used in) operating activities |
| |
| |
| | |||
Cash Flows from Investing Activities | |||||||||
Capital expenditures |
| ( |
| ( |
| ( | |||
Acquisition of businesses, net of cash acquired | ( | — | — | ||||||
Proceeds from the sale of investments |
| |
| |
| | |||
Payments for purchases of investments |
| ( |
| ( |
| ( | |||
Proceeds from held for sale assets, net of costs to sell |
| — |
| — |
| | |||
Net cash provided by (used in) investing activities | ( | ( | | ||||||
Cash Flows from Financing Activities | |||||||||
Proceeds from issuance of 2029 Notes, net of issuance costs | | — | — | ||||||
Extinguishment of Convertible Notes | ( | — | ( | ||||||
Debt issuance costs | — | — | ( | ||||||
Contingent consideration payment | ( | — | — | ||||||
Proceeds (net of tax withholdings) from option exercises and employee stock purchase plan |
| |
| |
| | |||
Restricted stock tax withholdings |
| ( |
| ( |
| ( | |||
Net cash provided by (used in) financing activities |
| ( |
| ( |
| ( | |||
Effect of exchange rate changes on cash and cash equivalents |
| ( |
| ( |
| ( | |||
Net increase (decrease) in cash, cash equivalents, and restricted cash |
| |
| |
| ( | |||
Cash, cash equivalents, and restricted cash - beginning of period |
| |
| |
| | |||
Cash, cash equivalents, and restricted cash - end of period | $ | | $ | | $ | | |||
Supplemental Disclosure of Cash Flow Information | |||||||||
Interest paid | $ | | $ | | $ | | |||
Income taxes paid (refunds received) | | | ( | ||||||
Non-cash activities | |||||||||
Capital expenditures included in accounts payable and accrued expenses | | | | ||||||
Net transfer of inventory to property, plant and equipment | | | ( | ||||||
Right-of-use assets obtained in exchange for lease obligations | | | |
See accompanying Notes to the Consolidated Financial Statements.
F-9
Note 1 — Significant Accounting Policies
(a) Description of Business
Veeco Instruments Inc. (together with its consolidated subsidiaries, “Veeco,” or the “Company”) operates in a segment: the development, manufacture, sales, and support of semiconductor and thin film process equipment primarily sold to make electronic devices.
(b) Basis of Presentation
The accompanying audited Consolidated Financial Statements of the Company have been prepared in accordance with United States generally accepted accounting principles (“GAAP”). The Company reports interim quarters on a
(c) Use of Estimates
The preparation of financial statements in conformity with GAAP requires management to make estimates and assumptions that affect the amounts reported in the financial statements and accompanying notes. Although these estimates are based on management’s knowledge of current events and actions it may undertake in the future, these estimates may ultimately differ from actual results. Significant items subject to such estimates and assumptions include: (i) stand-alone selling prices for the Company’s products and services; (ii) allowances for doubtful accounts; (iii) inventory obsolescence; (iv) the useful lives and expected future cash flows of property, plant, and equipment and identifiable intangible assets; (v) the fair value of the Company’s reporting unit and related goodwill; (vi) investment valuations and the valuation of derivatives, deferred tax assets, and assets acquired in business combinations; (vii) the recoverability of long-lived assets; (viii) liabilities for product warranty and legal contingencies; (ix) share-based compensation; (x) lease term and incremental borrowing rates used in determining operating lease assets and liabilities; (xi) income tax uncertainties; (xii) purchase accounting estimates; and (xiii) contingent consideration estimates.
(d) Principles of Consolidation
The Consolidated Financial Statements include the accounts of the Company and its subsidiaries. Intercompany balances and transactions have been eliminated in consolidation. Companies acquired during each reporting period are reflected in the results of the Company effective from their respective dates of acquisition through the end of the reporting period.
(e) Foreign Currencies
Assets and liabilities of the Company’s foreign subsidiaries that operate using functional currencies other than the U.S. dollar are translated using the exchange rates in effect at the balance sheet date. Results of operations are translated using monthly average exchange rates. Adjustments arising from the translation of the foreign currency financial statements of the Company’s subsidiaries into U.S. dollars, including intercompany transactions of a long-term nature, are reported as currency translation adjustments in “Accumulated other comprehensive income” in the Consolidated Balance Sheets. Foreign currency transaction gains or losses are included in “Other operating expense (income), net” in the Consolidated Statements of Operations.
F-10
Veeco Instruments Inc. and Subsidiaries
Notes to Consolidated Financial Statements (Continued)
(f) Revenue Recognition
Revenue is recognized upon the transfer of control of the promised product or service to the customer in an amount that reflects the consideration the Company expects to receive in exchange for such product or service. The Company’s contracts with customers generally do not contain variable consideration. In the rare instances where variable consideration is included, the Company estimates the amount of variable consideration and determines what portion of that, if any, has a high probability of significant subsequent revenue reversal, and if so, that amount is excluded from the transaction price. The Company’s contracts with customers frequently contain multiple deliverables, such as systems, upgrades, components, spare parts, installation, maintenance, and service plans. Judgment is required to properly identify the performance obligations within a contract and to determine how the revenue should be allocated among the performance obligations. The Company also evaluates whether multiple transactions with the same customer or related parties should be considered part of a single contract based on an assessment of whether the contracts or agreements are negotiated or executed within a short time frame of each other or if there are indicators that the contracts are negotiated in contemplation of one another.
When there are separate units of accounting, the Company allocates revenue to each performance obligation on a relative stand-alone selling price basis. The stand-alone selling prices are determined based on the prices at which the Company separately sells the systems, upgrades, components, spare parts, installation, maintenance, and service plans. For items that are not sold separately, the Company estimates stand-alone selling prices generally using an expected cost plus margin approach.
Most of the Company’s revenue is recognized at a point in time when the performance obligation is satisfied. The Company considers many facts when evaluating each of its sales arrangements to determine the timing of revenue recognition, including its contractual obligations and the nature of the customer’s post-delivery acceptance provisions. The Company’s system sales arrangements, including certain upgrades, generally include field acceptance provisions that may include functional or mechanical test procedures. For many of these arrangements, a customer source inspection of the system is performed in the Company’s facility, test data is sent to the customer documenting that the system is functioning to the agreed upon specifications prior to delivery, or other quality assurance testing is performed internally to ensure system functionality prior to shipment. Historically, such source inspection or test data replicates the field acceptance provisions that are performed at the customer’s site prior to final acceptance of the system. When the Company objectively demonstrates that the criteria specified in the contractual acceptance provisions are achieved prior to delivery either through customer testing or the Company’s historical experience of its tools meeting specifications, transfer of control of the product to the customer is considered to have occurred and revenue is recognized upon system delivery since there is no substantive contingency remaining related to the acceptance provisions at that date. For new products, new applications of existing products, or for products with substantive customer acceptance provisions where the Company cannot objectively demonstrate that the criteria specified in the contractual acceptance provisions have been achieved prior to delivery, revenue and the associated costs are deferred. The Company recognizes such revenue and costs upon obtaining objective evidence that the acceptance provisions can be achieved, assuming all other revenue recognition criteria have been met.
In certain cases, the Company’s contracts with customers contain a billing retention, which is billed by the Company and payable by the customer when field acceptance provisions are completed. Revenue recognized in advance of the amount that has been billed is recorded as a contract asset on the Consolidated Balance Sheets.
The Company recognizes revenue related to maintenance and service contracts over time based upon the respective contract term. Installation revenue is recognized over time as the installation services are performed. The Company recognizes revenue from the sales of components, spare parts, and specified service engagements at a point in time, which is typically consistent with the time of delivery in accordance with the terms of the applicable sales arrangement.
F-11
Veeco Instruments Inc. and Subsidiaries
Notes to Consolidated Financial Statements (Continued)
The Company may receive advanced payments on system transactions. The timing of the transfer of goods or services related to the advanced payments is either at the discretion of the customer or expected to be within one year from the advanced receipt. As such, the Company does not adjust transaction prices for the time value of money. Incremental direct costs incurred related to the acquisition of a customer contract, such as sales commissions, are expensed as incurred since the expected performance period is
The Company has elected to treat shipping and handling costs, including those costs incurred to move, package, and prepare the Company’s products for shipment and to move the products to a customer’s designated location, as a fulfillment activity, and the Company includes such costs in “Cost of sales” in the Consolidated Statements of Operations as incurred. These costs are generally comprised of payments to third-party shippers. Taxes assessed by governmental authorities that are collected by the Company from a customer are excluded from revenue.
(g) Warranty Costs
The Company typically provides standard warranty coverage on its systems for
(h) Research and Development Costs
Research and development costs are expensed as incurred and include charges for the development of new technology and the transition of existing technology into new products or services.
(i) Advertising Expense
The cost of advertising is expensed as incurred and totaled $
(j) Accounting for Share-based Compensation
Share-based awards exchanged for employee services are accounted for under the fair value method. Accordingly, share-based compensation cost is measured at the grant date based on the estimated fair value of the award. The expense for awards is recognized over the employee’s requisite service period (generally the vesting period of the award). The Company has elected to treat awards with only service conditions and with graded vesting as
In addition to stock options, restricted share awards (“RSAs”) and restricted stock units (“RSUs”) with time-based vesting, the Company grants performance share units and awards (“PSUs” and “PSAs”) that have either performance or market conditions. Compensation cost for PSUs and PSAs with performance conditions is recognized over the requisite service period based on the timing and expected level of achievement of the performance targets. A change in the assessment of performance attainment prior to the conclusion of the performance period is recognized in the period of the change in estimate. Compensation cost for PSUs and PSAs with market conditions is recognized over the requisite service period regardless of the expected level of achievement. For all PSUs and PSAs, the number of shares issued to the employee at the conclusion of the service period may vary from the original target based upon the level of attainment of the performance or market conditions.
F-12
Veeco Instruments Inc. and Subsidiaries
Notes to Consolidated Financial Statements (Continued)
The Company uses the Black-Scholes option-pricing model to compute the estimated fair value of option awards and purchase rights under the Employee Stock Purchase Plan. The Company uses a Monte Carlo simulation to compute the estimated fair value of awards with market conditions. The Black-Scholes model and Monte Carlo simulation include assumptions regarding dividend yields, expected volatility, expected option term, and risk-free interest rates. See Note 13, “Stock Plans,” for additional information.
(k) Income Taxes
Income taxes are accounted for under the asset and liability method. Deferred tax assets and liabilities are recognized for the future tax consequences attributable to differences between the financial statement carrying amounts of existing assets and liabilities and their respective tax bases and operating loss and tax credit carryforwards. Deferred tax assets and liabilities are measured using enacted tax rates expected to apply to taxable income in the years in which those temporary differences are expected to be recovered or settled. The effect on deferred tax assets and liabilities from a change in tax rate is recognized in income in the period that includes the enactment date. A valuation allowance is provided for deferred tax assets if it is more likely than not that these items will not be realized, which is dependent upon the generation of future taxable income.
(l) Concentration of Credit Risk
Financial instruments that potentially subject the Company to concentrations of credit risk consist primarily of cash and cash equivalents, investments, derivative financial instruments used in hedging activities, and accounts receivable. The Company invests in a variety of financial instruments and, by policy, limits the amount of credit exposure with any one financial institution or commercial issuer. Historically, the Company has not experienced any material credit losses on its investments.
The Company maintains an allowance reserve for potentially uncollectible accounts for estimated losses resulting from the inability of its customers to make required payments. The Company evaluates its allowance for doubtful accounts based on a combination of factors. In circumstances where specific invoices are deemed to be uncollectible, the Company provides a specific allowance for bad debt against the amount due to reduce the net recognized receivable to the amount reasonably expected to be collected. The Company also provides allowances based on its write-off history. Finally, the Company also considers its current expectations of future economic conditions, when estimating its allowance for doubtful accounts. The allowance for doubtful accounts totaled $
To further mitigate the Company’s exposure to uncollectable accounts, the Company may request certain customers provide a negotiable irrevocable letter of credit drawn on a reputable financial institution. These irrevocable letters of credit are typically issued to mature between and
(m) Fair Value of Financial Instruments
The carrying amounts of financial instruments, including cash equivalents, accounts receivable, accounts payable, and accrued expenses reflected in the consolidated financial statements approximate fair value due to their short-term maturities. The fair value of debt for footnote disclosure purposes, including current maturities, if any, is estimated using recently quoted market prices of the instrument, or if not available, a discounted cash flow analysis based on the estimated current incremental borrowing rates for similar types of instruments.
F-13
Veeco Instruments Inc. and Subsidiaries
Notes to Consolidated Financial Statements (Continued)
(n) Cash, Cash Equivalents, and Short-term Investments
All financial instruments purchased with an original maturity of three months or less at the time of purchase are considered cash equivalents. Such items may include liquid money market funds, certificate of deposit and time deposit accounts, U.S. treasuries, government agency securities, and corporate debt. Investments that are classified as cash equivalents are carried at cost, which approximates fair value. The Company’s cash and cash equivalents includes $
A portion of the Company’s cash and cash equivalents is held by its subsidiaries throughout the world, frequently in each subsidiary’s respective functional currency, which is typically the U.S. dollar. Approximately
Short-term investments consist of marketable debt securities, and are generally classified as available-for-sale for use in current operations, if required, and are reported at fair value, with unrealized gains and losses, net of tax, presented as a separate component of stockholders’ equity under the caption “Accumulated other comprehensive income” on the Consolidated Balance Sheets. These securities can include U.S. treasuries, government agency securities, corporate debt, and commercial paper, all with maturities of greater than three months when purchased. All realized gains and losses and unrealized losses resulting from declines in fair value that are other than temporary are included in “Other operating expense (income), net” in the Consolidated Statements of Operations. The specific identification method is used to determine the realized gains and losses on investments.
Non-marketable equity securities are equity securities without readily observable market prices and are included in “Other assets” in the Consolidated Balance Sheets. Non-marketable securities are measured at cost, adjusted for changes in observable prices minus impairment. Changes in fair value and impairment charges are included in “Other income (expense), net” in the Consolidated Statements of Operations.
(o) Inventories
Inventories are stated at the lower of cost or net realizable value, with cost determined on a first-in, first-out basis. Each quarter the Company assesses the valuation and recoverability of all inventories: materials (raw materials, spare parts, and service inventory); work-in-process; finished goods; and evaluation inventory at customer facilities. Obsolete inventory or inventory in excess of management’s estimated usage requirement is written down to its estimated net realizable value if less than cost. The Company evaluates usage requirements by analyzing historical usage, anticipated demand, alternative uses of materials, and other qualitative factors. Unanticipated changes in demand for the Company’s products may require a write down of inventory, which would be reflected in cost of sales in the period the revision is made. Inventory acquired as part of a business combination is recorded at fair value on the date of acquisition.
(p) Business Combinations
The Company allocates the fair value of the purchase consideration of the Company’s acquisitions to the tangible assets, intangible assets, including in-process research and development (“IPR&D”), if any, and liabilities assumed, based on estimated fair values. The excess of the fair value of purchase consideration over the fair values of these identifiable assets and liabilities is recorded as goodwill. Acquisition-related expenses are recognized separately from the business combination and are expensed as incurred. Additionally, the Company estimates the fair value of contingent consideration included as part of the purchase price by assigning probabilities and discount factors to each of the various defined performance milestones, while using a Monte-Carlo simulation model to determine the most likely outcome for payments to be based on value of orders received.
F-14
Veeco Instruments Inc. and Subsidiaries
Notes to Consolidated Financial Statements (Continued)
(q) Goodwill and Indefinite-Lived Intangible Assets
Goodwill is an asset representing the future economic benefits arising from assets acquired in a business combination that are not individually identified and separately recognized. Goodwill is measured as the excess of the consideration transferred over the net fair value of identifiable assets acquired and liabilities assumed. Intangible assets with indefinite useful lives are measured at their respective fair values on the acquisition date. Intangible assets related to IPR&D projects are considered to be indefinite-lived until the completion or abandonment of the associated research and development (“R&D”) efforts. If and when development is complete, the associated assets would be deemed long-lived and would then be amortized based on their respective estimated useful lives at that point in time. Goodwill and indefinite-lived intangibles are not amortized into results of operations but instead are evaluated for impairment. The Company performs the evaluation in the beginning of the fourth quarter of each year or more frequently if impairment indicators arise.
In testing goodwill for impairment, the Company may first perform a qualitative assessment of whether it is more likely than not that the reporting unit’s fair value is less than its carrying amount, and, if so, the Company then quantitatively compares the fair value of the reporting unit to its carrying amount. If the fair value exceeds the carrying amount, goodwill is not impaired. If the carrying amount exceeds fair value, the Company then records an impairment loss equal to the difference, up to the carrying value of goodwill.
The Company determines the fair value of its reporting unit based on a reconciliation of the fair value of the reporting unit to the Company’s adjusted market capitalization. The adjusted market capitalization is calculated by multiplying the average share price of the Company’s common stock for the last trading days prior to the measurement date by the number of outstanding common shares and adding a control premium. The control premium is estimated using historical transactions in similar industries.
In testing indefinite-lived intangible assets for impairment, the Company may first perform a qualitative assessment of whether it is more likely than not that the fair value of the indefinite-lived intangible asset is less than its carrying amount, and, if so, the Company then quantitatively compares the fair value of the indefinite-lived intangible asset to its carrying amount. The Company determines the fair value of its indefinite-lived intangible assets using a discounted cash flow method.
(r) Long-lived Assets
Long-lived intangible assets consist of purchased technology, customer relationships, patents, trademarks and tradenames, and backlog and are initially recorded at fair value. Long-lived intangible assets are amortized over their estimated useful lives in a method reflecting the pattern in which the economic benefits are consumed or straight-lined if such pattern cannot be reliably determined.
Property, plant, and equipment are recorded at cost. Depreciation expense is calculated based on the estimated useful lives of the assets by using the straight-line method. Amortization of leasehold improvements is recognized using the straight-line method over the shorter of the remaining lease term or the estimated useful lives of the improvements.
Long-lived assets are reviewed for impairment whenever events or changes in circumstances indicate that the carrying amount of an asset may not be recoverable. If circumstances require a long-lived asset or asset group be tested for possible impairment, a recoverability test is performed utilizing undiscounted cash flows expected to be generated by that asset or asset group compared to its carrying amount. If the carrying amount of the long-lived asset or asset group is not recoverable on an undiscounted cash flow basis, impairment is recognized to the extent the carrying amount exceeds its fair value. Fair value is determined through various valuation techniques including discounted cash flow models or, when available, quoted market values and third-party appraisals.
F-15
Veeco Instruments Inc. and Subsidiaries
Notes to Consolidated Financial Statements (Continued)
(s) Leases
The Company determines at contract inception if an arrangement is a lease, or contains a lease, of an identified asset for which the Company has the right to obtain substantially all of the economic benefits from its use and the right to direct its use. Right-of-use (“ROU”) assets represent the Company’s right to use an underlying asset for the lease term, while lease liabilities represent the Company’s obligation to make lease payments arising from the lease. Operating lease ROU assets and liabilities are recognized at lease commencement date based on the present value of lease payments over the lease term. The implicit discount rate in the Company’s leases generally cannot readily be determined, and therefore the Company uses its incremental borrowing rate based on information available at lease commencement date in determining the present value of future payments. The Company has options to renew or terminate certain leases. These options are included in the determination of lease term when it is reasonably certain that the Company will exercise such options. The Company does not separate lease and non-lease components in determining ROU assets or lease liabilities for real estate leases. Additionally, the Company does not recognize ROU assets or lease liabilities for leases with original terms or renewals of one year or less.
(t) Recently Adopted Accounting Standards
The Company
The adoption of ASU 2020-06 resulted in the following adjustments to the Consolidated Balance Sheets:
December 31, 2021 | Adoption of | January 1, 2022 | |||||||
(in thousands) | |||||||||
Balance Sheet line item: | |||||||||
Long-term debt | $ | | $ | | $ | | |||
Additional paid-in capital | |
| ( |
| | ||||
Accumulated deficit | ( |
| |
| ( |
(u) Recent Accounting Pronouncements Not Yet Adopted
In December 2023, the FASB issued ASU 2023-09, “Income Taxes (Topic 740): Improvements to Income Tax Disclosures,” which requires public entities to disclose consistent categories and greater disaggregation of information in the rate reconciliation and for income taxes paid. It also includes certain other amendments to improve the effectiveness of income tax disclosures. The guidance is effective for financial statements issued for annual periods beginning after December 15, 2024, with early adoption permitted. The Company is currently in the process of evaluating the impact of adoption on its consolidated financial statements.
The Company is evaluating other pronouncements recently issued but not yet adopted. The adoption of these pronouncements is not expected to have a material impact on our consolidated financial statements.
F-16
Veeco Instruments Inc. and Subsidiaries
Notes to Consolidated Financial Statements (Continued)
Note 2 — Income (Loss) Per Share
Basic income (loss) per share is calculated by dividing net income (loss) by the weighted average number of shares outstanding during the period. Diluted income per share is calculated by dividing net income by the weighted average number of shares used to calculate basic income per share plus the weighted average number of common share equivalents outstanding during the period. The dilutive effect of outstanding options to purchase common stock and non-participating share-based awards is considered in diluted income per share by application of the treasury stock method. The dilutive effect of performance share units is included in diluted income per common share in the periods the performance targets have been achieved, or would have been achieved if the reporting date was the end of the contingency period. Upon the adoption of ASU 2020-06 on January 1, 2022, the Company includes the dilutive effect of shares issuable upon conversion of its Notes in the calculation of diluted income per share using the if-converted method. The Company has the option for the 2025 and 2027 Notes to settle the conversion value in any combination of cash or shares, and as such, the maximum number of shares issuable are included in the dilutive share count if the effect would be dilutive. The Company must settle the principal amount of the 2029 Notes in cash, and has the option to settle any excess of the conversion value over the principal amount in any combination of cash or shares. As such, the Company only includes the excess shares that may be issuable above the principal amount of the 2029 Notes in the dilutive share count, if the effect would be dilutive. Prior to the adoption of ASU 2020-06, based on the Company’s ability and intent to settle the principal amount of its convertible senior notes in cash, and the excess of the principal portion in shares of its common stock, the Company accounted for the conversion spread using the treasury stock method, and the shares issuable upon conversion of the Notes were not included in the calculation of diluted earnings per share except to the extent that the conversion value of the Notes exceeds their principal amount and if the effect would be dilutive.
The computations of basic and diluted income (loss) per share for the years ended December 31, 2023, 2022, and 2021 are as follows:
F-17
Veeco Instruments Inc. and Subsidiaries
Notes to Consolidated Financial Statements (Continued)
For the year ended December 31, | ||||||||||
|
| 2023 |
| 2022 |
| 2021 | ||||
(in thousands, except per share amounts) | ||||||||||
Numerator: | ||||||||||
Net income (loss) | $ | ( | $ | | $ | | ||||
Interest expense associated with convertible notes | — | | — | |||||||
Net income (loss) available to common shareholders | $ | ( | $ | | $ | | ||||
Denominator: | ||||||||||
Basic weighted average shares outstanding |
| |
| |
| | ||||
Effect of potentially dilutive share-based awards |
| — | | | ||||||
Dilutive effect of convertible notes |
| — |
| |
| | ||||
Diluted weighted average shares outstanding |
| |
| |
| | ||||
Net income per common share: | ||||||||||
Basic | $ | ( | $ | | $ | | ||||
Diluted | $ | ( | $ | | $ | | ||||
Unvested participating shares excluded from basic weighted average shares outstanding since the securityholders are not obligated to fund losses | — | — | | |||||||
Common share equivalents excluded from the diluted weighted average shares outstanding since the Company incurred a net loss and their effect would be antidilutive | | — | — | |||||||
Potentially dilutive shares excluded from the diluted calculation as their effect would be antidilutive | | | | |||||||
Potential shares to be issued for settlement of the convertible notes excluded from the diluted calculation as their effect would be antidilutive | | — | |
Note 3 — Fair Value Measurements
Fair value is the price that would be received for an asset or the amount paid to transfer a liability in an orderly transaction between market participants. The Company is required to classify certain assets and liabilities based on the following fair value hierarchy:
● | Level 1: Quoted prices in active markets that are unadjusted and accessible at the measurement date for identical, unrestricted assets or liabilities; |
● | Level 2: Quoted prices for identical assets and liabilities in markets that are not active, quoted prices for similar assets and liabilities in active markets or financial instruments for which significant inputs are observable, either directly or indirectly; and |
● | Level 3: Prices or valuations that require inputs that are both significant to the fair value measurement and unobservable. |
A financial instrument’s level within the fair value hierarchy is based on the lowest level of any input that is significant to the fair value measurement. The Company has evaluated the estimated fair value of financial instruments using available market information and valuations as provided by third-party sources. The use of different market assumptions or estimation methodologies could have a significant effect on the estimated fair value amounts.
F-18
Veeco Instruments Inc. and Subsidiaries
Notes to Consolidated Financial Statements (Continued)
The following table presents the Company’s assets that were measured at fair value on a recurring basis at December 31, 2023 and 2022:
| Level 1 |
| Level 2 |
| Level 3 |
| Total | |||||
(in thousands) | ||||||||||||
December 31, 2023 | ||||||||||||
Cash equivalents | ||||||||||||
Certificate of deposits and time deposits | $ | | $ | — | $ | — | $ | | ||||
Corporate debt | — | | — | | ||||||||
Money market cash | | — | — | | ||||||||
Total | $ | | $ | | $ | — | $ | | ||||
Short-term investments | ||||||||||||
U.S. treasuries | $ | | $ | — | $ | — | $ | | ||||
Government agency securities | — | | — | | ||||||||
Corporate debt | — | | — | | ||||||||
Commercial paper | — | | — | | ||||||||
Total | $ | | $ | | $ | — | $ | | ||||
December 31, 2022 | ||||||||||||
Cash equivalents | ||||||||||||
Certificate of deposits and time deposits | $ | | $ | — | $ | — | $ | | ||||
Money market cash | | — | — | | ||||||||
Total | $ | | $ | — | $ | — | $ | | ||||
Short-term investments | ||||||||||||
U.S. treasuries | $ | | $ | — | $ | — | $ | | ||||
Government agency securities | — | | — | | ||||||||
Corporate debt | — | | — | | ||||||||
Commercial paper | — | | — | | ||||||||
Total | $ | | $ | | $ | — | $ | |
The Company’s investments classified as Level 1 are based on quoted prices that are available in active markets, as well as certificates of deposits and time deposits that are classified as Level 1 due to their short-term nature. The Company’s investments classified as Level 2 are valued using observable inputs to quoted market prices, benchmark yields, reported trades, broker/dealer quotes, or alternative pricing sources with reasonable levels of price transparency.
F-19
Veeco Instruments Inc. and Subsidiaries
Notes to Consolidated Financial Statements (Continued)
Note 4 — Investments
At December 31, 2023 and 2022 the amortized cost and fair value of marketable securities, which are included in “Short-term investments” on the Consolidated Balance Sheets, were as follows:
|
| Gross |
| Gross |
| |||||||
Amortized | Unrealized | Unrealized | Estimated | |||||||||
Cost | Gains | Losses | Fair Value | |||||||||
(in thousands) | ||||||||||||
December 31, 2023 | ||||||||||||
U.S. treasuries | $ | | $ | | $ | ( | $ | | ||||
Government agency securities | | | ( | | ||||||||
Corporate debt | | | ( | | ||||||||
Commercial paper | | — | — | | ||||||||
Total | $ | | $ | | $ | ( | $ | | ||||
December 31, 2022 | ||||||||||||
U.S. treasuries | $ | | $ | — | $ | ( | $ | | ||||
Government agency securities | | — | ( | | ||||||||
Corporate debt |
| | — | ( |
| | ||||||
Commercial paper | | — | — | | ||||||||
Total | $ | | $ | — | $ | ( | $ | |
Available-for-sale securities in a loss position at December 31, 2023 and 2022 were as follows:
Continuous Loss Position | Continuous Loss Position | |||||||||||
for Less than 12 Months | for 12 Months or More | |||||||||||
|
| Gross |
|
| Gross | |||||||
Estimated | Unrealized | Estimated | Unrealized | |||||||||
Fair Value | Losses | Fair Value | Losses | |||||||||
(in thousands) | ||||||||||||
December 31, 2023 | ||||||||||||
U.S. treasuries | $ | | $ | ( | $ | — | $ | — | ||||
Government agency securities | | ( | — | — | ||||||||
Corporate debt |
| |
| ( |
| |
| ( | ||||
Total | $ | | $ | ( | $ | | $ | ( | ||||
December 31, 2022 | ||||||||||||
U.S. treasuries | $ | | $ | ( | $ | | $ | ( | ||||
Government agency securities | | ( | | ( | ||||||||
Corporate debt |
| |
| ( |
| |
| ( | ||||
Total | $ | | $ | ( | $ | | $ | ( |
F-20
Veeco Instruments Inc. and Subsidiaries
Notes to Consolidated Financial Statements (Continued)
The contractual maturities of securities classified as available-for-sale at December 31, 2023 were as follows:
December 31, 2023 | ||||||
Amortized | Estimated | |||||
Cost | Fair Value | |||||
(in thousands) | ||||||
Due in one year or less | $ | | $ | | ||
Due after one year through two years | |
| | |||
Total | $ | | $ | |
Actual maturities may differ from contractual maturities because borrowers may have the right to call or prepay obligations with or without call or prepayment penalties. The realized gains or losses for the years ended December 31, 2023, 2022, and 2021 were immaterial.
Other Investments
Veeco has an ownership interest of less than
Note 5 — Business Combination
Epiluvac
On January 31, 2023, the Company acquired Epiluvac AB, a privately held manufacturer of chemical vapor deposition (CVD) epitaxy systems that enable silicon carbide (SiC) applications in the electric vehicle market. This acquisition is expected to accelerate penetration into the emerging, high-growth SiC equipment market. The results of Epiluvac’s operations have been included in the consolidated financial statements since the date of acquisition.
The acquisition date fair value of the consideration totaled $
| Acquisition Date | ||
(January 31, 2023) | |||
(in thousands) | |||
Cash paid, net of cash acquired | $ | | |
Contingent consideration | | ||
Acquisition date fair value | $ | |
F-21
Veeco Instruments Inc. and Subsidiaries
Notes to Consolidated Financial Statements (Continued)
The purchase agreement included performance milestones that, if achieved, could trigger additional payments to the original selling shareholders. The contingent arrangements include payments up to $
The Company estimated the fair value of the contingent consideration by assigning probabilities and discount factors to each of the various defined performance milestones, while using a Monte-Carlo simulation model to determine the most likely outcome for payments to be based on value of orders received. These fair value measurements are based on significant inputs not observable in the market and thus represent a Level 3 measurement as defined in ASC 820. The used was
The Company updates its estimate of fair value of the contingent consideration each reporting period, utilizing the same methodologies described above. During the year ended December 31, 2023, the Company recognized approximately $
The following table summarizes the estimated fair values of the assets acquired and liabilities assumed at the acquisition date:
| Acquisition Date | ||
(January 31, 2023) | |||
(in thousands) | |||
Accounts receivable | $ | | |
Inventories |
| | |
Prepaid expense and other current assets |
| | |
Property, plant, and equipment |
| | |
Intangible assets | | ||
Total identifiable assets acquired |
| | |
Accounts payable and accrued expenses | | ||
Contract liabilities | | ||
Deferred income taxes | | ||
Other liabilities | | ||
Total liabilities assumed |
| | |
Net identifiable assets acquired |
| | |
Goodwill |
| | |
Net assets acquired | $ | |
F-22
Veeco Instruments Inc. and Subsidiaries
Notes to Consolidated Financial Statements (Continued)
The gross contractual value of the acquired accounts receivable is the amount expected to be collected by the Company, and therefore is also considered its fair value. Goodwill generated from the acquisition is primarily attributed to expected synergies from future growth and strategic advantages provided through the expansion of product offerings as well as assembled workforce and is not expected to be deductible for income tax purposes.
The classes of intangible assets acquired, and the estimated useful life of each class is presented in the table below:
Acquisition Date | ||||||
(January 31, 2023) | ||||||
| Amount |
| Useful life | |||
(in thousands) | ||||||
Technology | $ | |
| years | ||
Customer relationships |
| |
| years | ||
Backlog | | years | ||||
Intangible assets acquired | $ | |
The Company determined the estimated fair value of the identifiable intangible assets based on various factors including cost, discounted cash flow, income method, loss-of-revenue/income method, and relief-from-royalty method in determining the purchase price allocation.
For the year ended December 31, 2023, the Company incurred approximately $
Note 6 — Inventories
Inventories are stated at the lower of cost or net realizable value, with cost determined on a first-in, first-out basis. Inventories consist of the following:
December 31, | December 31, | |||||
| 2023 |
| 2022 | |||
(in thousands) | ||||||
Materials | $ | | $ | | ||
Work-in-process |
| |
| | ||
Finished goods |
| |
| | ||
Evaluation inventory | | | ||||
Total | $ | | $ | |
F-23
Veeco Instruments Inc. and Subsidiaries
Notes to Consolidated Financial Statements (Continued)
Note 7 — Property, Plant, and Equipment
Property, plant, and equipment, net, consist of the following:
December 31, | December 31, | ||||||
| 2023 |
| 2022 | Average Useful Life | |||
(in thousands) | |||||||
Land | $ | | $ | | N/A | ||
Building and improvements |
| |
| | |||
Machinery and equipment (1) |
| |
| | |||
Leasehold improvements |
| |
| | |||
Gross property, plant, and equipment |
| |
| | |||
Less: accumulated depreciation and amortization |
| |
| | |||
Net property, plant, and equipment | $ | | $ | |
(1) | Machinery and equipment also includes software, furniture, and fixtures |
Depreciation expense was $
Note 8 — Goodwill and Intangible Assets
Goodwill represents the future economic benefits arising from assets acquired in a business combination that are not individually identified and separately recognized. The following table presents the changes in goodwill balances for the year ending December 31, 2023:
| Gross carrying |
| Accumulated |
| |||||
amount | impairment | Net amount | |||||||
| (in thousands) | ||||||||
Balance at December 31, 2022 | $ | | $ | | $ | | |||
Acquisition | | — | | ||||||
Balance at December 31, 2023 | $ | | $ | | $ | |
The Company performs its annual goodwill impairment test at the beginning of the fourth quarter each year. As the Company maintains a single goodwill reporting unit, it determines the fair value of its reporting unit based upon the Company’s adjusted market capitalization. The annual test performed at the beginning of the fourth quarter of fiscal 2023, 2022, and 2021 did not result in any potential impairment as the fair value of the reporting unit was determined to exceed the carrying amount of the reporting unit.
The valuation of goodwill will continue to be subject to changes in the Company’s market capitalization and observable market control premiums. This analysis is sensitive to changes in the Company’s stock price and absent other qualitative factors, the Company may be required to record goodwill impairment charges in future periods if the stock price declines and remains depressed for an extended period of time.
F-24
Veeco Instruments Inc. and Subsidiaries
Notes to Consolidated Financial Statements (Continued)
The components of purchased intangible assets were as follows:
December 31, 2023 | December 31, 2022 | |||||||||||||||||||
Average | Accumulated | Accumulated | ||||||||||||||||||
| Remaining |
| Gross |
| Amortization |
|
| Gross |
| Amortization |
| |||||||||
Amortization | Carrying | and | Net | Carrying | and | Net | ||||||||||||||
Period | Amount | Impairment | Amount | Amount | Impairment | Amount | ||||||||||||||
(in years) | (in thousands) | |||||||||||||||||||
Technology | $ | | $ | | $ | | $ | | $ | | $ | | ||||||||
Customer relationships | | | | | | | ||||||||||||||
Trademarks and tradenames | | | | | | | ||||||||||||||
Other |
| |
| |
| |
| |
| |
| — | ||||||||
Total | $ | | $ | | $ | | $ | | $ | | $ | |
Other intangible assets primarily consist of patents, licenses, and backlog.
Based on the intangible assets recorded at December 31, 2023, and assuming no subsequent additions to or impairment of the underlying assets, the remaining estimated annual amortization expense, is expected to be as follows:
Amortization | |||
| (in thousands) | ||
2024 | $ | | |
2025 |
| | |
2026 |
| | |
2027 |
| | |
2028 |
| | |
Thereafter | | ||
Total | $ | |
Note 9 — Accrued Expenses and Other Liabilities
The components of accrued expenses and other current liabilities were as follows:
December 31, | December 31, | |||||
| 2023 |
| 2022 | |||
(in thousands) | ||||||
Payroll and related benefits | $ | | $ | | ||
Warranty | | | ||||
| | |||||
Interest | | | ||||
Professional fees | | | ||||
Sales, use, and other taxes |
| |
| | ||
Contingent consideration | | — | ||||
Other |
| |
| | ||
Total | $ | | $ | |
Contract Liabilities and Performance Obligations
Contract liabilities consist of unsatisfied performance obligations related to advanced payments received and billing in excess of revenue recognized. The contract liability balance as of December 31, 2022 was approximately $
F-25
Veeco Instruments Inc. and Subsidiaries
Notes to Consolidated Financial Statements (Continued)
This reduction in contract liabilities was offset by new billings for products and services which were unsatisfied performance obligations to customers and revenue had not yet been recognized as of December 31, 2023.
As of December 31, 2023, the Company has approximately $
Other liabilities
Other Liabilities at December 31, 2023 was approximately $
Note 10 — Commitments and Contingencies
Warranty
Changes in the Company’s product warranty reserves were as follows:
December 31, | |||||||||
| 2023 |
| 2022 |
| 2021 | ||||
(in thousands) | |||||||||
Balance - beginning of the year | $ | | $ | | $ | | |||
Warranties issued |
| |
| |
| | |||
Addition from Epiluvac acquisition | | — | — | ||||||
Consumption of reserves |
| ( |
| ( |
| ( | |||
Changes in estimate |
| |
| ( |
| | |||
Balance - end of the year | $ | | $ | | $ | |
Minimum Lease Commitments
The Company’s operating leases primarily include real estate leases for properties used for manufacturing, R&D activities, sales and service, and administration, as well as certain equipment leases. Some leases may include options to renew for a period of up to
F-26
Veeco Instruments Inc. and Subsidiaries
Notes to Consolidated Financial Statements (Continued)
The following table provides the maturities of lease liabilities at December 31, 2023:
Operating | |||
| Leases | ||
(in thousands) | |||
Payments due by period: | |||
2024 | $ | | |
2025 | | ||
2026 | | ||
2027 | | ||
2028 | | ||
Thereafter | | ||
Total future minimum lease payments | | ||
Less: Imputed interest | ( | ||
Total | $ | | |
Reported as of December 31, 2023 | |||
$ | | ||
Long-term operating lease liabilities | | ||
$ | |
Operating lease cost for the years ended December 31, 2023, 2022, and 2021 was $
Legal Proceedings
The Company is involved in various legal proceedings arising in the normal course of business. The Company does not believe that the ultimate resolution of these matters will have a material adverse effect on its consolidated financial position, results of operations, or cash flows.
Concentrations of Credit Risk
The Company depends on purchases from its
F-27
Veeco Instruments Inc. and Subsidiaries
Notes to Consolidated Financial Statements (Continued)
Customers who accounted for more than 10% of net accounts receivable or net sales are as follows:
Accounts Receivable | Net Sales |
| |||||||||
December 31, | For the Year Ended December 31, |
| |||||||||
Customer |
| 2023 |
| 2022 |
| 2023 |
| 2022 |
| 2021 |
|
Customer A | * | * | | % | * | * | |||||
Customer B | | % | * | * | * | | % | ||||
Customer C | | % | * | * | * | * | |||||
Customer D | * | | % | * | * | * | |||||
Customer E |
| * | * | * | * | | % |
* | Less than 10% of aggregate accounts receivable or net sales |
The Company manufactures and sells its products to companies in different geographic locations. Refer to Note 16, “Segment Reporting and Geographic Information,” for additional information. In certain instances, the Company requires deposits from its customers for a portion of the sales price in advance of shipment and performs periodic credit evaluations on its customers. Where appropriate, the Company requires letters of credit on certain non-U.S. sales arrangements. Receivables generally are due within
Receivable Purchase Agreement
The Company entered into a receivable purchase agreement with a financial institution to sell certain of its trade receivables from customers without recourse, up to $
Suppliers
The Company outsources certain functions to third parties, including the manufacture of several of its systems. While the Company relies on its outsourcing partners to perform their contracted functions, the Company maintains some level of internal manufacturing capability for these systems. In addition, certain of the components and sub-assemblies included in the Company’s products are obtained from a single source or a limited group of suppliers. The failure of the Company’s present outsourcing partners and suppliers to meet their contractual obligations and the Company’s inability to make alternative arrangements or resume the manufacture of these systems could have a material adverse effect on the Company’s revenues, profitability, cash flows, and relationships with its customers.
The Company had deposits with its suppliers of $
Purchase Commitments
The Company had purchase commitments of $
F-28
Veeco Instruments Inc. and Subsidiaries
Notes to Consolidated Financial Statements (Continued)
Bank Guarantees
The Company has bank guarantees and letters of credit issued by a financial institution on its behalf as needed. At December 31, 2023, outstanding bank guarantees and letters of credit totaled $
Note 11 — Debt
Convertible Senior Notes
2023 Notes
On January 10, 2017, the Company issued $
On May 18, 2020, in connection with the completion of a private offering of $
Additionally, on November 11, 2020, the Company entered into a privately negotiated exchange agreement with a holder of its outstanding 2023 Notes, under which the Company agreed to retire $
Finally, on November 5, 2021, the Company entered into a privately negotiated note purchase agreement with a holder of its outstanding 2023 Notes, under which the Company agreed to repurchase and retire approximately $
The 2023 notes that remained outstanding matured on January 15, 2023 and were paid in cash and settled by the Company at that time.
2025 Notes
On November 17, 2020, as part of the privately negotiated exchange agreement described above, the Company issued $
F-29
Veeco Instruments Inc. and Subsidiaries
Notes to Consolidated Financial Statements (Continued)
On May 19, 2023, in connection with the completion of a private offering of $
2027 Notes
On May 18, 2020, the Company completed a private offering of $
On May 19, 2023, in connection with the completion of a private offering of $
2029 Notes
On May 19, 2023, the Company completed a private offering of $
The 2025 Notes, 2027 Notes, and 2029 Notes (collectively, the “Notes”) are unsecured obligations of Veeco and rank senior in right of payment to any of Veeco’s subordinated indebtedness; equal in right of payment to all of Veeco’s unsecured indebtedness that is not subordinated; effectively subordinated in right of payment to any of Veeco’s secured indebtedness to the extent of the value of the assets securing such indebtedness; and structurally subordinated to all indebtedness and other liabilities (including trade payables) of Veeco’s subsidiaries.
The Notes are convertible at the option of the holders upon the satisfaction of specified conditions and during certain periods as described below. The initial conversion rates are
F-30
Veeco Instruments Inc. and Subsidiaries
Notes to Consolidated Financial Statements (Continued)
Holders may convert all or any portion of their notes, in multiples of
(i) | During any calendar quarter (and only during such calendar quarter), if the last reported sale price of the common stock for at least |
(ii) | During the five consecutive business day period after any |
(iii) | If the Company calls any or all of applicable series of the Notes for redemption at any time prior to the close of business on the scheduled trading day immediately preceding the redemption date; or |
(iv) | Upon the occurrence of specified corporate events. |
For the calendar quarter ended December 31, 2023, the last reported sales price of common stock during the
Holders may convert their notes at any time, regardless of the foregoing circumstances, on or after October 15, 2024 with respect to the 2025 Notes, October 1, 2026 with respect to the 2027 Notes, and February 1, 2029 with respect to the 2029 Notes, until the close of business on the business day immediately preceding the respective maturity date.
Accounting for the Notes after the adoption of ASU 2020-06
The Company adopted ASU 2020-06 on January 1, 2022 as further described in Note 1, “Basis of Presentation”. Following the adoption of ASU 2020-06, the Notes are recorded as a single unit within liabilities in the consolidated balance sheets as the conversion features within the Notes are not derivatives that require bifurcation and the Notes do not involve a substantial premium. Transaction costs of $
Accounting for the Notes prior to the adoption of ASU 2020-06
With respect to the 2023 Notes, 2025 Notes, and 2027 Notes, upon conversion by the holders, the Company may elect to settle such conversion in shares of its common stock, cash, or a combination thereof. As a result of its cash conversion options, prior to the adoption of ASU 2020-06, the Company segregated the liability component of the instruments from the equity components. The liability components were measured by estimating the fair value of a non-convertible debt instrument that is similar in its terms to the Notes. The calculation of the fair value of the debt components required the use of Level 3 inputs, including utilization of convertible investors’ credit assumptions and high yield bond indices. Fair value was estimated through discounting future interest and principal payments, an income approach, due under the Notes at a discount rate equal to the estimated borrowing rate for similar non-convertible debt, or
F-31
Veeco Instruments Inc. and Subsidiaries
Notes to Consolidated Financial Statements (Continued)
an increase to additional paid-in capital and were to be amortized over the expected lives of the Notes using the effective interest rate method. Amortization of the debt discounts were recognized as non-cash interest expense.
The transaction costs of $
The carrying values of the Notes are as follows:
December 31, 2023 | December 31, 2022 | |||||||||||||||||
| Principal Amount |
| Unamortized |
| Net carrying value |
| Principal Amount |
| Unamortized |
| Net carrying value | |||||||
(in thousands) | ||||||||||||||||||
2023 Notes | $ | — | $ | — | $ | — | $ | | $ | ( | $ | | ||||||
2025 Notes |
| |
| ( |
| |
| |
| ( |
| | ||||||
2027 Notes | | ( | | | ( | | ||||||||||||
2029 Notes | | ( | | — | — | — | ||||||||||||
Net carrying value | $ | | $ | ( | $ | | $ | | $ | ( | $ | |
Total interest expense related to the Notes is as follows:
For the year ended December 31, | ||||||||||
| 2023 | 2022 | 2021 | |||||||
| (in thousands) | |||||||||
Cash Interest Expense |
|
|
| |||||||
Coupon interest expense - 2023 Notes | $ | | $ | | $ | | ||||
Coupon interest expense - 2025 Notes | | | | |||||||
Coupon interest expense - 2027 Notes | | | | |||||||
Coupon interest expense - 2029 Notes | | — | — | |||||||
Non-cash Interest Expense |
|
|
| |||||||
Amortization of debt discount/transaction costs- 2023 Notes |
| |
| |
| | ||||
Amortization of debt discount/transaction costs- 2025 Notes | | | | |||||||
Amortization of debt discount/transaction costs- 2027 Notes | | | | |||||||
Amortization of debt discount/transaction costs- 2029 Notes | | — | — | |||||||
Total Interest Expense | $ | | $ | | $ | |
The Company determined the , , and are Level 2 liabilities in the fair value hierarchy and had estimated fair values at December 31, 2023 of $
Capped Call Transactions
In connection with the offering of the 2027 Notes, on May 13, 2020, the Company entered into privately negotiated capped call transactions (the “Capped Call Transactions”), pursuant to capped call confirmations, covering the total principal amount of the 2027 Notes for an aggregate premium of $
F-32
Veeco Instruments Inc. and Subsidiaries
Notes to Consolidated Financial Statements (Continued)
of the Capped Call Transactions. The Capped Call Transactions exercise price is equal to the initial conversion price of the 2027 Notes, and the capped price of the Capped Call Transactions is approximately $
The Capped Call Transactions are separate transactions entered into by the Company with the capped call counterparties, are not part of the terms of the 2027 Notes and do not change the holders’ rights under the 2027 Notes. Holders of the 2027 Notes do not have any rights with respect to the Capped Call Transactions. The cost of the Capped Call Transactions is not expected to be tax-deductible as the Company did not elect to integrate the Capped Call Transactions into the 2027 Notes for tax purposes. The Company used a portion of the net proceeds from the offering of the 2027 Notes to pay for the Capped Call Transactions, and the cost of the Capped Call Transactions was recorded as a reduction of the Company’s additional paid-in capital in the accompanying consolidated financial statements.
Revolving Credit Facility
On December 16, 2021, the Company entered into a loan and security agreement providing for a senior secured revolving credit facility in an aggregate principal amount of $
Borrowings will bear interest at a floating rate which can be, at the Company’s option, either (a) an alternate base rate plus an applicable rate ranging from
The Loan and Security Agreement contains customary affirmative covenants for transactions of this type, including, among others, the provision of financial and other information to the administrative agent, notice to the administrative agent upon the occurrence of certain material events, preservation of existence, maintenance of properties and insurance, compliance with laws, including environmental laws, the provision of additional guarantees, and an affiliate transactions covenant, subject to certain exceptions. The Loan and Security Agreement contains customary negative covenants, including, among others, restrictions on the ability to merge and consolidate with other companies, incur indebtedness, refinance our existing convertible notes, grant liens or security interests on assets, make investments, acquisitions, loans, or advances, pay dividends, and sell or otherwise transfer assets.
F-33
Veeco Instruments Inc. and Subsidiaries
Notes to Consolidated Financial Statements (Continued)
The Loan and Security Agreement contains financial maintenance covenants that require the Borrower to maintain an Interest Coverage Ratio (as defined in the Loan and Security Agreement) of not less than
Note 12 — Stockholders’ Equity
Accumulated Other Comprehensive Income (“AOCI”)
The following table presents the changes in the balances of each component of AOCI, net of tax:
Unrealized | |||||||||
Gains (Losses) | |||||||||
Foreign | on Available | ||||||||
Currency | for Sale | ||||||||
| Translation |
| Securities |
| Total | ||||
(in thousands) | |||||||||
Balance - December 31, 2020 | $ | | $ | ( | $ | | |||
Other comprehensive income (loss) | ( | ( | ( | ||||||
Balance - December 31, 2021 | | ( | | ||||||
Other comprehensive income (loss) | ( | ( | ( | ||||||
Balance - December 31, 2022 | $ | | $ | ( | $ | | |||
Other comprehensive income (loss) |
| ( |
| |
| | |||
Balance - December 31, 2023 | $ | | $ | ( | $ | |
The Company did not allocate additional tax expense (benefit) to other comprehensive income (loss) for the years ended December 31, 2021, as the Company was in a full valuation allowance position such that a deferred tax asset related to amounts recognized in other comprehensive income was not regarded as realizable on a more-likely-than-not basis. The Company allocated an immaterial amount of additional tax benefit to other comprehensive income (loss) for the year ended December 31, 2022, as the Company is no longer in a full valuation allowance position. The Company allocated an immaterial amount of additional tax expense to other comprehensive income (loss) for the year ended December 31, 2023.
Preferred Stock
The Board of Directors has authority under the Company’s Certificate of Incorporation to issue shares of preferred stock, par value $
F-34
Veeco Instruments Inc. and Subsidiaries
Notes to Consolidated Financial Statements (Continued)
Note 13 — Stock Plans
Share-based incentive awards are provided to employees under the terms of the Company’s equity incentive compensation plans (the “Plans”), which are administered by the Compensation Committee of the Board of Directors. The 2019 Plan originated as the 2010 Stock Incentive Plan and was originally approved by the Company’s shareholders in May 2010. This Plan was subsequently amended, as approved by shareholders, in 2013, 2016, 2019 (at which time the Plan was renamed the 2019 Stock Incentive Plan), and 2022 (as amended to date, the “2019 Plan”). The Company’s employees, non-employee directors, and consultants are eligible to receive awards under the 2019 Plan, which can include non-qualified stock options, incentive stock options, RSAs, RSUs, PSAs, PSUs, share appreciation rights, dividend equivalent rights, or any combination thereof.
The Company is authorized to issue up to
Shares Reserved for Future Issuance
At December 31, 2023, the Company has
Share-Based Compensation
The Company recognized share-based compensation in the following line items in the Consolidated Statements of Operations for the periods indicated:
For the year ended December 31, | ||||||||||
|
| 2023 |
| 2022 |
| 2021 | ||||
(in thousands) | ||||||||||
Cost of sales |
|
| $ | |
| $ | |
| $ | |
Research and development | | | | |||||||
Selling, general, and administrative | | | | |||||||
Total | $ | | $ | | $ | |
The Company did not realize any tax benefits associated with share-based compensation for the year ended December 31, 2021 due to the full valuation allowance on its U.S. deferred tax assets. See Note 15, “Income Taxes” for additional information. The Company recognized a tax benefit of approximately $
F-35
Veeco Instruments Inc. and Subsidiaries
Notes to Consolidated Financial Statements (Continued)
Unrecognized share-based compensation costs at December 31, 2023 are summarized below:
| Unrecognized |
| Weighted | ||
Share-Based | Average Period | ||||
Compensation | Expected to be | ||||
Costs | Recognized | ||||
(in thousands) | (in years) | ||||
Restricted stock units | $ | | |||
Restricted stock awards |
| | |||
Performance share units |
| | |||
Total unrecognized share-based compensation cost |
| $ | |
Stock Option Awards
Stock options are awards issued to employees that entitle the holder to purchase shares of the Company’s stock at a fixed price. The following table summarizes the equity activity related to stock options:
Weighted | |||||
Number of | Average | ||||
| Shares |
| Exercise Price | ||
(in thousands) | |||||
Balance - December 31, 2020 | | $ | | ||
Exercised | ( |
| | ||
Expired | ( | | |||
Balance - December 31, 2021 | | | |||
Expired | ( | | |||
Balance - December 31, 2022 | | | |||
Exercised | ( | | |||
Expired | ( | | |||
Balance - December 31, 2023 | | $ | |
At December 31, 2023, stock option shares outstanding had a weighted average remaining contractual life of
The following table summarizes information on options exercised for the periods indicated:
Year ended December 31, | |||||||||
| 2023 |
| 2022 |
| 2021 | ||||
(in thousands) | |||||||||
Cash received from options exercised | $ | | $ | — | $ | | |||
Intrinsic value of options exercised | $ | | $ | — | $ | |
RSAs, RSUs, PSAs, PSUs
RSAs are stock awards issued to employees and directors that are subject to specified restrictions and a risk of forfeiture. RSUs are stock awards issued to employees that entitle the holder to receive shares of common stock as the awards vest. PSAs and PSUs are awards that result in an issuance of shares of common stock to employees if certain performance or market conditions are achieved. All of these awards typically vest over to
F-36
Veeco Instruments Inc. and Subsidiaries
Notes to Consolidated Financial Statements (Continued)
The following table summarizes the equity activity of non-vested restricted shares and performance shares:
|
| Weighted | |||
Average | |||||
Number of | Grant Date | ||||
Shares | Fair Value | ||||
(in thousands) | |||||
Balance - December 31, 2020 |
| | $ | | |
Granted |
| | | ||
Performance award adjustments | | | |||
Vested |
| ( | | ||
Forfeited | ( | | |||
Balance - December 31, 2021 | | | |||
Granted | | | |||
Performance award adjustments | | | |||
Vested | ( | | |||
Forfeited | ( | | |||
Balance - December 31, 2022 | | | |||
Granted | | | |||
Performance award adjustments | | | |||
Vested | ( | | |||
Forfeited | ( | | |||
Balance - December 31, 2023 | | $ | |
The total fair value of shares that vested during the years ended December 31, 2023, 2022, and 2021 was $
The fair value of performance awards with market conditions is estimated on the date of grant using a Monte Carlo simulation. Estimates of fair value are not intended to predict actual future events or the value ultimately realized by employees who receive these awards. The weighted average fair value and the assumptions used in calculating such values during fiscal years 2023, 2022, and 2021 for performance awards with market conditions were based on estimates at the date of grant as follows:
Year ended December 31, | ||||||||||
2023 |
| 2022 |
| 2021 | ||||||
Weighted average fair value | $ | | $ | | $ | | ||||
Dividend yield | | % | | % | | % | ||||
Expected volatility factor(1) | | % | | % | | % | ||||
Risk-free interest rate(2) | | % | | % | | % | ||||
Expected life (in years)(3) |
|
|
(1) | Expected volatility is measured using historical daily price changes of the Company’s stock over the respective expected term. |
(2) | The risk-free rate for periods within the contractual term is based on the U.S. Treasury yield curve in effect at the time of grant. |
(3) | The expected life is the number of years the Company estimates that the awards will be outstanding prior to exercise. |
F-37
Veeco Instruments Inc. and Subsidiaries
Notes to Consolidated Financial Statements (Continued)
Employee Stock Purchase Plan
For the years ended December 31, 2023, 2022, and 2021 the Company received cash proceeds of $
Year ended December 31, |
| |||||||||
2023 |
| 2022 |
| 2021 |
| |||||
Weighted average fair value | $ | | $ | | $ | | ||||
Dividend yield | | % | | % | | % | ||||
Expected volatility factor(1) | | % | | % | | % | ||||
Risk-free interest rate(2) | | % | | % | | % | ||||
Expected life (in years)(3) |
|
|
(1) | Expected volatility is measured using historical daily price changes of the Company’s stock over the respective expected term. |
(2) | The risk-free rate for periods within the contractual term is based on the U.S. Treasury yield curve in effect at the time of grant. |
(3) | The expected life is the number of years the Company estimates that the purchase rights will be outstanding prior to exercise. |
Note 14 — Retirement Plans
The Company maintains a defined contribution plan for the benefit of its U.S. employees. The plan is intended to be tax qualified and contains a qualified cash or deferred arrangement as described under Section 401(k) of the Internal Revenue Code. Eligible participants may elect to contribute a percentage of their base compensation, and the Company may make matching contributions, generally equal to
Note 15 — Income Taxes
The amounts of income (loss) before income taxes attributable to domestic and foreign operations were as follows:
Year ended December 31, | |||||||||
| 2023 |
| 2022 |
| 2021 | ||||
(in thousands) | |||||||||
Domestic | $ | ( | $ | | $ | | |||
Foreign |
| |
| |
| | |||
Total | $ | ( | $ | | $ | | |||
F-38
Veeco Instruments Inc. and Subsidiaries
Notes to Consolidated Financial Statements (Continued)
Significant components of the expense (benefit) for income taxes consisted of the following:
Year ended December 31, | |||||||||
| 2023 |
| 2022 |
| 2021 | ||||
(in thousands) | |||||||||
Current: | |||||||||
Federal | $ | | $ | — | $ | — | |||
Foreign |
| |
| |
| | |||
State and local |
| ( |
| |
| | |||
Total current expense (benefit) for income taxes |
| |
| |
| | |||
Deferred: | |||||||||
Federal |
| ( |
| ( |
| | |||
Foreign |
| |
| ( |
| ( | |||
State and local |
| |
| ( |
| ( | |||
Total deferred expense (benefit) for income taxes |
| ( |
| ( |
| ( | |||
Total expense (benefit) for income taxes | $ | | $ | ( | $ | ( |
The income tax expense (benefit) was reconciled to the tax expense computed at the U.S. federal statutory tax rate as follows:
Year ended December 31, | |||||||||
| 2023 |
| 2022 |
| 2021 | ||||
(in thousands) | |||||||||
Income tax expense (benefit) at U.S. statutory rates | $ | ( | $ | | $ | | |||
State taxes, net of U.S. federal impact |
| |
| |
| ( | |||
Effect of international operations |
| ( |
| ( |
| | |||
Research and development tax credit |
| ( |
| ( |
| ( | |||
Net change in valuation allowance |
| |
| ( |
| ( | |||
Change in accrual for unrecognized tax benefits |
| ( |
| |
| | |||
Share-based compensation | | | | ||||||
Extinguishment of debt | | — | ( | ||||||
Adoption of new accounting standard | — | ( | — | ||||||
Other |
| |
| |
| | |||
Total expense (benefit) for income taxes | $ | | $ | ( | $ | ( |
F-39
Veeco Instruments Inc. and Subsidiaries
Notes to Consolidated Financial Statements (Continued)
Deferred income taxes reflect the effect of temporary differences between the carrying amounts of assets and liabilities recognized for financial reporting purposes and the amounts recognized for tax purposes. The tax effects of the temporary differences were as follows:
December 31, | ||||||
| 2023 |
| 2022 | |||
(in thousands) | ||||||
Deferred tax assets: | ||||||
Inventory valuation |
| $ | | $ | | |
Net operating losses | |
| | |||
Credit carry forwards | | | ||||
Warranty and installation accruals | |
| | |||
Share-based compensation | |
| | |||
Contract liabilities | | | ||||
Operating leases | | | ||||
Research and experimental ("R&E") capitalization | | | ||||
Other | |
| | |||
Total deferred tax assets | |
| | |||
Valuation allowance | ( |
| ( | |||
Net deferred tax assets | |
| | |||
Deferred tax liabilities: | ||||||
Purchased intangible assets | |
| | |||
Convertible Senior Notes | — | ( | ||||
Operating leases | | | ||||
Depreciation | ( |
| | |||
Total deferred tax liabilities | |
| | |||
Net deferred taxes |
| $ | | $ | |
The Company does not permanently reinvest its earnings from certain foreign jurisdictions and has accrued for foreign tax withholdings of $
During the year ended December 31, 2023, income tax expense of $
At December 31, 2023, the Company had U.S. federal research and development credits of $
F-40
Veeco Instruments Inc. and Subsidiaries
Notes to Consolidated Financial Statements (Continued)
A roll-forward of the Company’s uncertain tax positions for all U.S. federal, state, and foreign tax jurisdictions was as follows:
December 31, | |||||||||
| 2023 |
| 2022 |
| 2021 | ||||
(in thousands) | |||||||||
Balance at beginning of year | $ | | $ | | $ | | |||
Additions for tax positions related to current year |
| |
| |
| | |||
Additions for tax positions related to prior years |
| |
| — |
| | |||
Reductions for tax positions related to prior years |
| ( |
| ( |
| ( | |||
Settlements |
| — |
| ( |
| ( | |||
Balance at end of year | $ | | $ | | $ | |
If the amount of unrecognized tax benefits at December 31, 2023 were recognized, the Company’s income tax provision would decrease by $
The Company, or one of its subsidiaries, files income tax returns in the United States federal jurisdiction, and various state, local, and foreign jurisdictions. All material consolidated federal income tax matters have been concluded for years through 2017 subject to subsequent utilization of NOLs generated in such years. All material state and local income tax matters have been reviewed through 2012. The majority of the Company’s foreign jurisdictions have been reviewed through 2015. The Company’s major foreign jurisdictions’ statutes of limitation remain open with respect to the tax years 2016 through 2022 for Germany, 2017 through 2022 for China, 2022 for Taiwan, and 2020 through 2022 for Singapore. The Company does not anticipate that its uncertain tax position will change significantly within the next twelve months subject to the completion of the ongoing tax audits and any resultant settlement.
Note 16 — Segment Reporting and Geographic Information
The Company operates and measures its results in
Sales by end-market is as follows:
For the year ended December 31, | ||||||||||
|
| 2023 |
| 2022 |
| 2021 | ||||
(in thousands) | ||||||||||
Sales by end-market | ||||||||||
Semiconductor | $ | | $ | | $ | | ||||
Compound Semiconductor | | | | |||||||
Data Storage |
| |
| |
| | ||||
Scientific & Other |
| |
| |
| | ||||
Total | $ | | $ | | $ | |
The Company’s significant operations outside the United States include sales and service offices in China, Europe, and Rest of APAC. For geographic reporting, sales are attributed to the location in which the customer facility is located.
F-41
Veeco Instruments Inc. and Subsidiaries
Notes to Consolidated Financial Statements (Continued)
Sales and long-lived tangible assets by geographic region are as follows:
Net Sales to Unaffiliated Customers | Long-lived Tangible Assets | |||||||||||||||||
| 2023 |
| 2022 |
| 2021 |
| 2023 |
| 2022 |
| 2021 | |||||||
(in thousands) | ||||||||||||||||||
United States | $ | | $ | | $ | | $ | | $ | | $ | | ||||||
EMEA(1) |
| |
| |
| |
| |
| |
| | ||||||
China | | | | | | | ||||||||||||
Rest of APAC | | | | | | | ||||||||||||
Rest of World |
| |
| |
| |
| — |
| — |
| — | ||||||
Total | $ | | $ | | $ | | $ | | $ | | $ | |
(1) | EMEA consists of Europe, the Middle East, and Africa |
F-42
Schedule II — Valuation and Qualifying Accounts
Additions | |||||||||||||||
Charged | |||||||||||||||
| Balance at |
| (Credited) |
| Charged to |
|
| Balance at | |||||||
Beginning | to Costs and | Other | End of | ||||||||||||
Deducted from asset accounts: | of Period | Expenses | Accounts | Deductions | Period | ||||||||||
(in thousands) | |||||||||||||||
Year ended December 31, 2023 | |||||||||||||||
Allowance for doubtful accounts | $ | | $ | | $ | — | $ | ( | $ | | |||||
Valuation allowance in net deferred tax assets |
| |
| |
| — |
| — |
| | |||||
$ | | $ | | $ | — | $ | ( | $ | | ||||||
Year ended December 31, 2022 | |||||||||||||||
Allowance for doubtful accounts | $ | | $ | — | $ | — | $ | — | $ | | |||||
Valuation allowance in net deferred tax assets |
| |
| ( |
| — |
|
| | ||||||
$ | | $ | ( | $ | — | $ | — | $ | | ||||||
Year ended December 31, 2021 | |||||||||||||||
Allowance for doubtful accounts | $ | | $ | — | $ | — | $ | — | $ | | |||||
Valuation allowance in net deferred tax assets |
| |
| — |
| — |
| ( |
| | |||||
$ | | $ | — | $ | — | $ | ( | $ | |
S-1