| Q3 2023 Financial Results Conference Call Copyright © 2023 Veeco Instruments Inc. All Rights Reserved. 1 Veeco Instruments Q3 2023 Financial Results Conference Call - November 6th, 2023 |
| Q3 2023 Financial Results Conference Call Copyright © 2023 Veeco Instruments Inc. All Rights Reserved. 2 Safe Harbor This presentation contains “forward-looking statements”, within the meaning of the safe harbor provisions of the U.S. Private Securities Litigation Reform Act of 1995, as amended, that are based on management’s expectations, estimates, projections and assumptions. Words such as “expects,” “anticipates,” “plans,” “believes,” “scheduled,” “estimates” and variations of these words and similar expressions are intended to identify forward-looking statements. Forward-looking statements include, but are not limited to, those regarding anticipated growth and trends in our businesses and markets, industry outlooks and demand drivers, our investment and growth strategies, our development of new products and technologies, our business outlook for current and future periods, our ongoing transformation initiative and the effects thereof on our operations and financial results; and other statements that are not historical facts. These statements and their underlying assumptions are subject to risks and uncertainties and are not guarantees of future performance. Factors that could cause actual results to differ materially from those expressed or implied by such statements include, without limitation: global trade issues, including the ongoing trade disputes between the U.S. and China, and changes in trade and export license policies; the level of demand for our products; global economic and industry conditions; our dependency on third-party suppliers and outsourcing partners; the timing of customer orders; our ability to develop, deliver and support new products and technologies; our ability to expand our current markets, increase market share and develop new markets; the concentrated nature of our customer base; our ability to obtain and protect intellectual property rights in key technologies; the effects of regional or global health epidemics, including the effects of the COVID-19 pandemic on the Company’s operations and on those of our customers and suppliers; our ability to achieve the objectives of operational and strategic initiatives and attract, motivate and retain key employees; the variability of results among products and end-markets, and our ability to accurately forecast future results, market conditions, and customer requirements; the impact of our indebtedness, including our convertible senior notes and our capped call transactions; and other risks and uncertainties described in our SEC filings on Forms 10-K, 10-Q and 8-K, and from time-to-time in our other SEC reports. All forward-looking statements speak only to management’s expectations, estimates, projections and assumptions as of the date of this presentation. The Company does not undertake any obligation to update or publicly revise any forward-looking statements to reflect events, circumstances or changes in expectations after the date of this presentation. |
| Q3 2023 Financial Results Conference Call Copyright © 2023 Veeco Instruments Inc. All Rights Reserved. 3 Bill Miller, Ph.D. CEO Overview and Business Update |

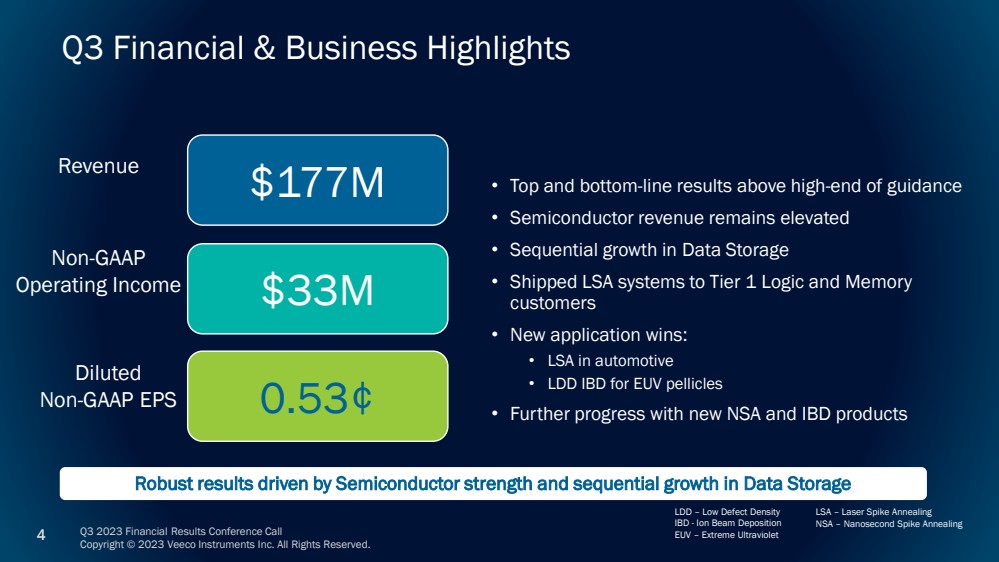
| Q3 2023 Financial Results Conference Call Copyright © 2023 Veeco Instruments Inc. All Rights Reserved. 4 Q3 Financial & Business Highlights $177M $33M 0.53¢ Revenue Non-GAAP Operating Income Diluted Non-GAAP EPS • Top and bottom-line results above high-end of guidance • Semiconductor revenue remains elevated • Sequential growth in Data Storage • Shipped LSA systems to Tier 1 Logic and Memory customers • New application wins: • LSA in automotive • LDD IBD for EUV pellicles • Further progress with new NSA and IBD products Robust results driven by Semiconductor strength and sequential growth in Data Storage LSA – Laser Spike Annealing NSA – Nanosecond Spike Annealing LDD – Low Defect Density IBD - Ion Beam Deposition EUV – Extreme Ultraviolet |
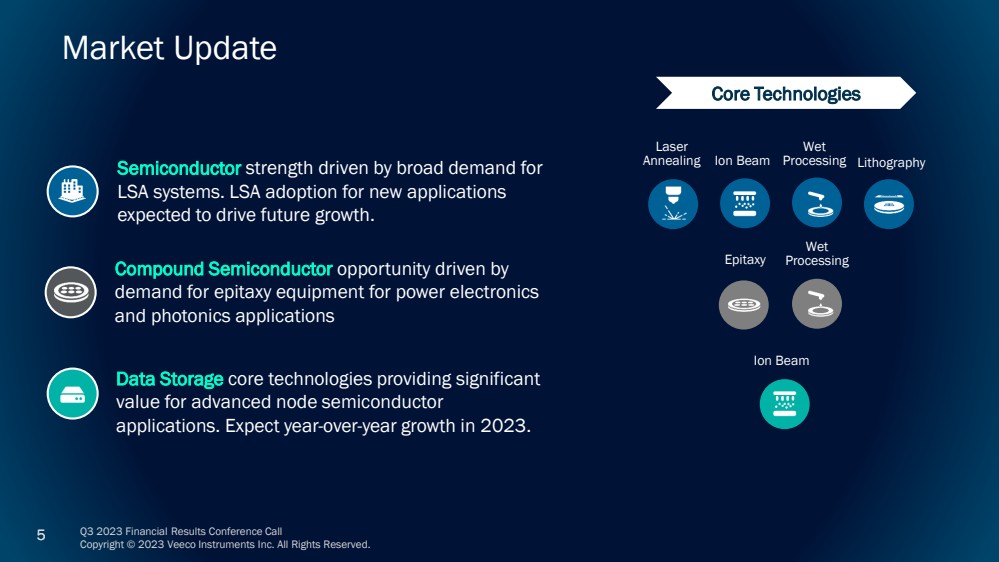
| Q3 2023 Financial Results Conference Call Copyright © 2023 Veeco Instruments Inc. All Rights Reserved. 5 Market Update Core Technologies Laser Annealing Ion Beam Lithography Wet Epitaxy Processing Ion Beam Data Storage core technologies providing significant value for advanced node semiconductor applications. Expect year-over-year growth in 2023. Compound Semiconductor opportunity driven by demand for epitaxy equipment for power electronics and photonics applications Semiconductor strength driven by broad demand for LSA systems. LSA adoption for new applications expected to drive future growth. Wet Processing |
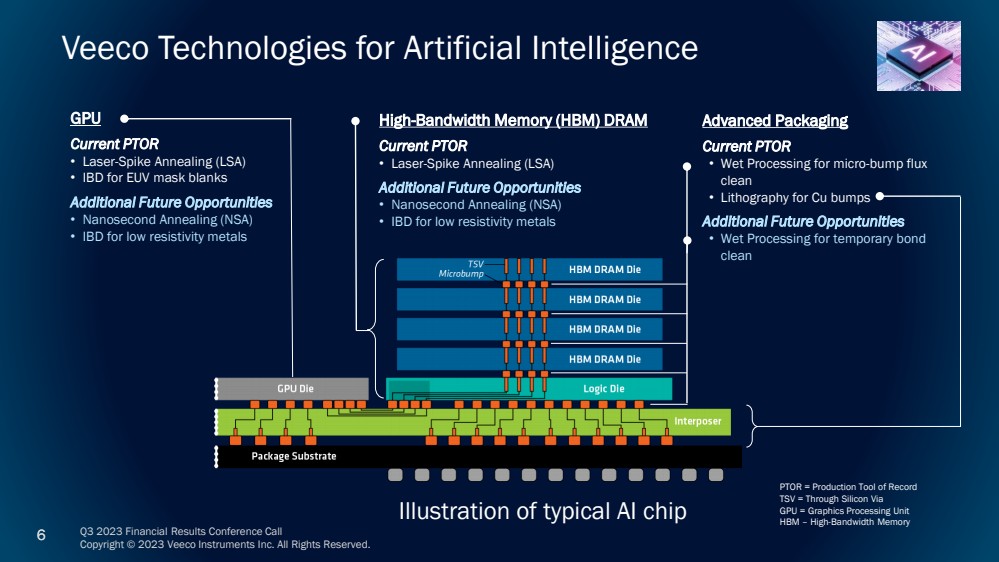
| Q3 2023 Financial Results Conference Call Copyright © 2023 Veeco Instruments Inc. All Rights Reserved. 6 Veeco Technologies for Artificial Intelligence Advanced Packaging Current PTOR • Wet Processing for micro-bump flux clean • Lithography for Cu bumps Additional Future Opportunities • Wet Processing for temporary bond clean GPU Current PTOR • Laser-Spike Annealing (LSA) • IBD for EUV mask blanks Additional Future Opportunities • Nanosecond Annealing (NSA) • IBD for low resistivity metals High-Bandwidth Memory (HBM) DRAM Current PTOR • Laser-Spike Annealing (LSA) Additional Future Opportunities • Nanosecond Annealing (NSA) • IBD for low resistivity metals Illustration of typical AI chip PTOR = Production Tool of Record TSV = Through Silicon Via GPU = Graphics Processing Unit HBM – High-Bandwidth Memory |
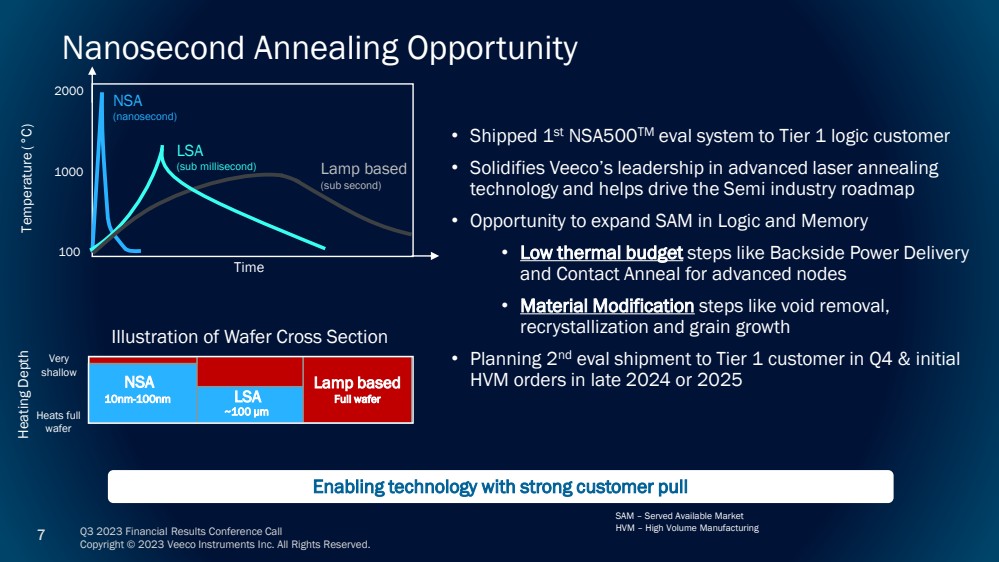
| Q3 2023 Financial Results Conference Call Copyright © 2023 Veeco Instruments Inc. All Rights Reserved. 7 Nanosecond Annealing Opportunity Enabling technology with strong customer pull • Shipped 1st NSA500TM eval system to Tier 1 logic customer • Solidifies Veeco’s leadership in advanced laser annealing technology and helps drive the Semi industry roadmap • Opportunity to expand SAM in Logic and Memory • Low thermal budget steps like Backside Power Delivery and Contact Anneal for advanced nodes • Material Modification steps like void removal, recrystallization and grain growth • Planning 2 nd eval shipment to Tier 1 customer in Q4 & initial HVM orders in late 2024 or 2025 Temperature (°C) Time SAM – Served Available Market HVM – High Volume Manufacturing NSA (nanosecond) 1000 2000 LSA (sub millisecond) 100 NSA LSA Heating Depth 10nm-100nm ~100 μm Very shallow Heats full wafer Lamp based (sub second) Lamp based Full wafer Illustration of Wafer Cross Section |
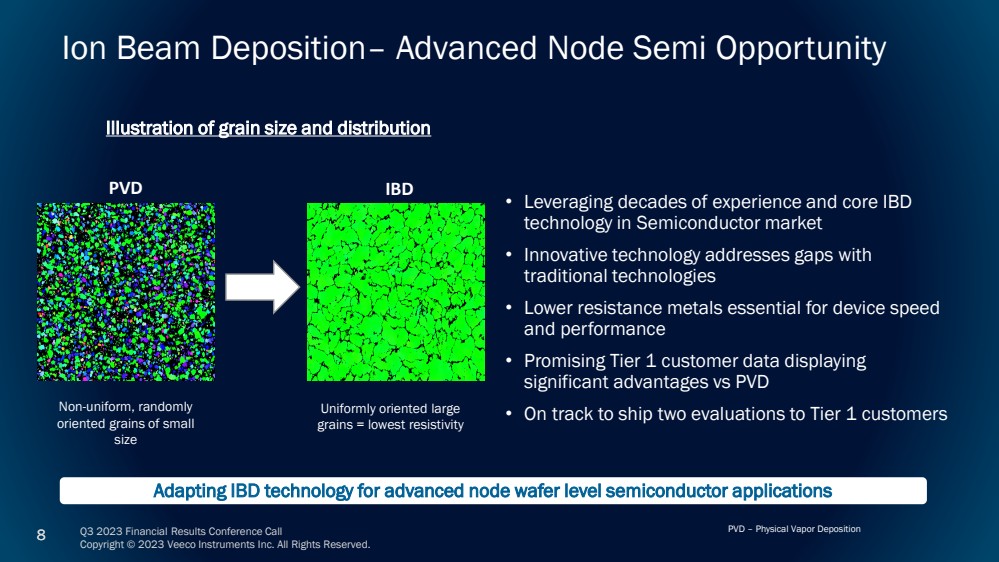
| Q3 2023 Financial Results Conference Call Copyright © 2023 Veeco Instruments Inc. All Rights Reserved. 8 Ion Beam Deposition– Advanced Node Semi Opportunity Adapting IBD technology for advanced node wafer level semiconductor applications • Leveraging decades of experience and core IBD technology in Semiconductor market • Innovative technology addresses gaps with traditional technologies • Lower resistance metals essential for device speed and performance • Promising Tier 1 customer data displaying significant advantages vs PVD • On track to ship two evaluations to Tier 1 customers PVD IBD Illustration of grain size and distribution Uniformly oriented large grains = lowest resistivity Non-uniform, randomly oriented grains of small size PVD – Physical Vapor Deposition |
| Q3 2023 Financial Results Conference Call Copyright © 2023 Veeco Instruments Inc. All Rights Reserved. 9 John Kiernan CFO Financial Review |

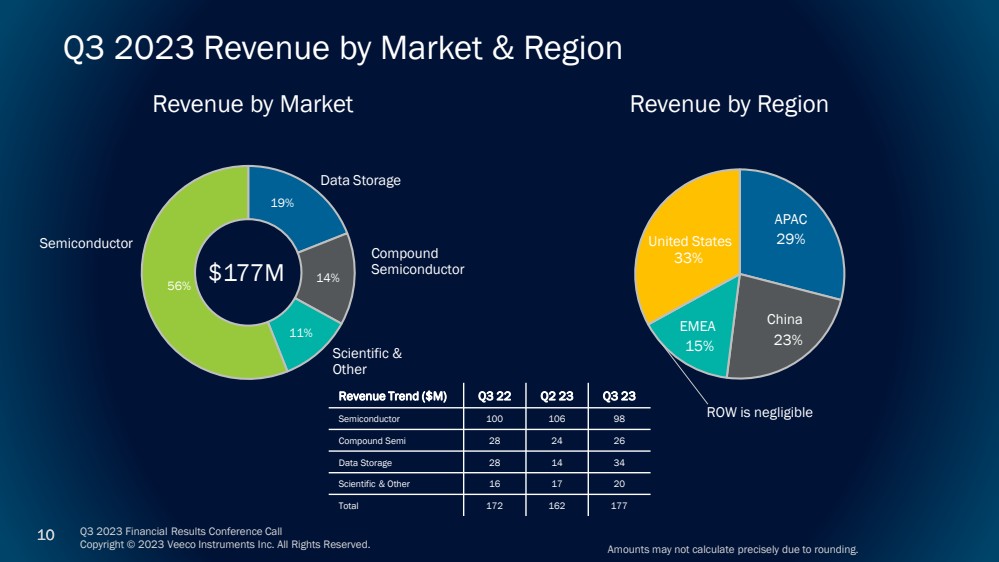
| Q3 2023 Financial Results Conference Call Copyright © 2023 Veeco Instruments Inc. All Rights Reserved. 10 Q3 2023 Revenue by Market & Region 56% 14% 11% 19% Revenue by Market Revenue by Region Scientific & Other Semiconductor Compound Semiconductor Data Storage 29% 23% 15% 33% EMEA APAC China United States $177M Revenue Trend ($M) Q3 22 Q2 23 Q3 23 Semiconductor 100 106 98 Compound Semi 28 24 26 Data Storage 28 14 34 Scientific & Other 16 17 20 Total 172 162 177 Amounts may not calculate precisely due to rounding. ROW is negligible |
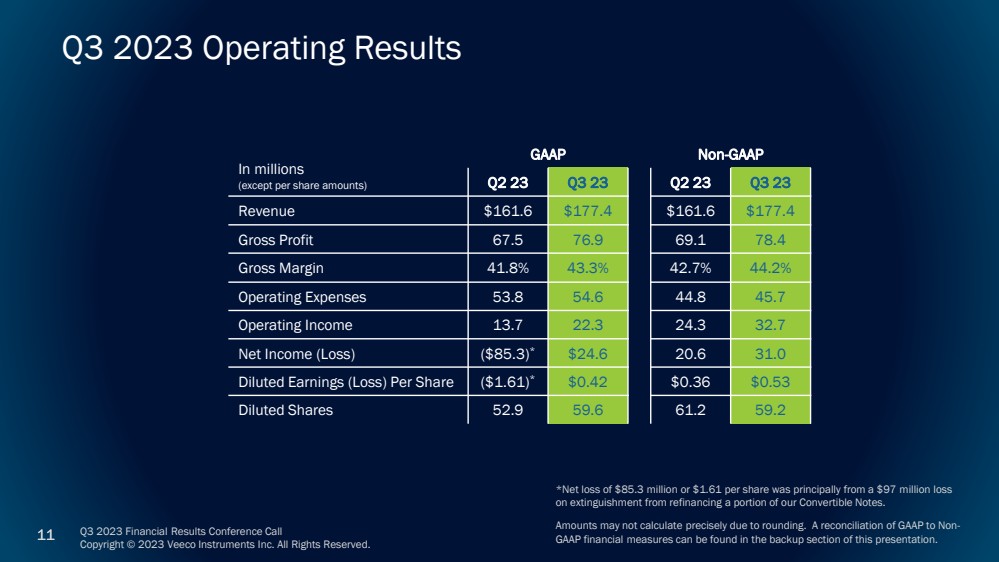
| Q3 2023 Financial Results Conference Call Copyright © 2023 Veeco Instruments Inc. All Rights Reserved. 11 Q3 2023 Operating Results In millions (except per share amounts) GAAP Non-GAAP Q2 23 Q3 23 Q2 23 Q3 23 Revenue $161.6 $177.4 $161.6 $177.4 Gross Profit 67.5 76.9 69.1 78.4 Gross Margin 41.8% 43.3% 42.7% 44.2% Operating Expenses 53.8 54.6 44.8 45.7 Operating Income 13.7 22.3 24.3 32.7 Net Income (Loss) ($85.3)* $24.6 20.6 31.0 Diluted Earnings (Loss) Per Share ($1.61)* $0.42 $0.36 $0.53 Diluted Shares 52.9 59.6 61.2 59.2 *Net loss of $85.3 million or $1.61 per share was principally from a $97 million loss on extinguishment from refinancing a portion of our Convertible Notes. Amounts may not calculate precisely due to rounding. A reconciliation of GAAP to Non-GAAP financial measures can be found in the backup section of this presentation. |
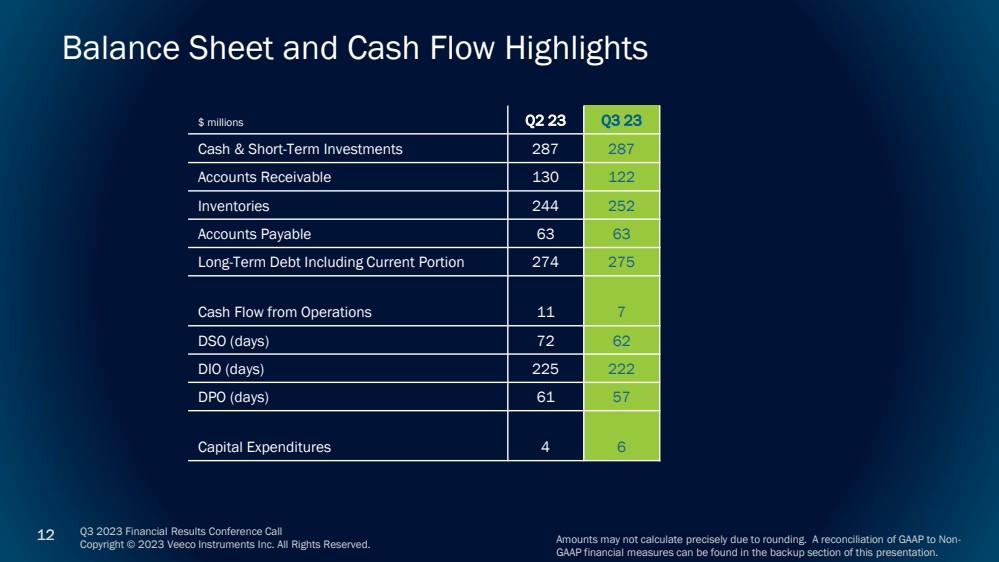
| Q3 2023 Financial Results Conference Call Copyright © 2023 Veeco Instruments Inc. All Rights Reserved. 12 Balance Sheet and Cash Flow Highlights $ millions Q2 23 Q3 23 Cash & Short-Term Investments 287 287 Accounts Receivable 130 122 Inventories 244 252 Accounts Payable 63 63 Long-Term Debt Including Current Portion 274 275 Cash Flow from Operations 11 7 DSO (days) 72 62 DIO (days) 225 222 DPO (days) 61 57 Capital Expenditures 4 6 Amounts may not calculate precisely due to rounding. A reconciliation of GAAP to Non-GAAP financial measures can be found in the backup section of this presentation. |
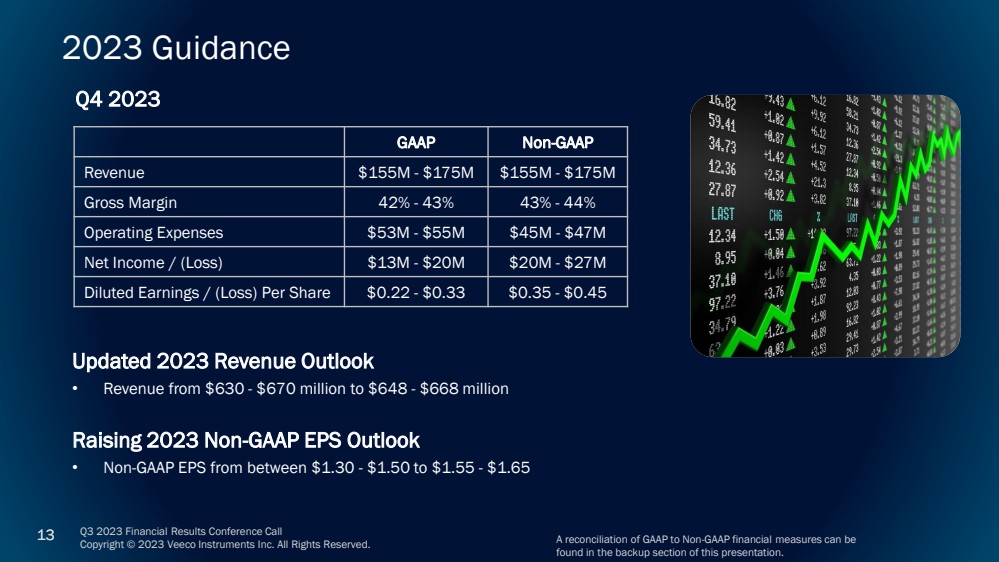
| Q3 2023 Financial Results Conference Call Copyright © 2023 Veeco Instruments Inc. All Rights Reserved. 13 2023 Guidance A reconciliation of GAAP to Non-GAAP financial measures can be found in the backup section of this presentation. Q4 2023 Updated 2023 Revenue Outlook • Revenue from $630 - $670 million to $648 - $668 million Raising 2023 Non-GAAP EPS Outlook • Non-GAAP EPS from between $1.30 - $1.50 to $1.55 - $1.65 GAAP Non-GAAP Revenue $155M - $175M $155M - $175M Gross Margin 42% - 43% 43% - 44% Operating Expenses $53M - $55M $45M - $47M Net Income / (Loss) $13M - $20M $20M - $27M Diluted Earnings / (Loss) Per Share $0.22 - $0.33 $0.35 - $0.45 |
| Q3 2023 Financial Results Conference Call Copyright © 2023 Veeco Instruments Inc. All Rights Reserved. 14 CEO Closing Remarks |

| Q3 2023 Financial Results Conference Call Copyright © 2023 Veeco Instruments Inc. All Rights Reserved. 15 Thank You Q&A |

| Q3 2023 Financial Results Conference Call Copyright © 2023 Veeco Instruments Inc. All Rights Reserved. 16 Backup and Financial Tables |

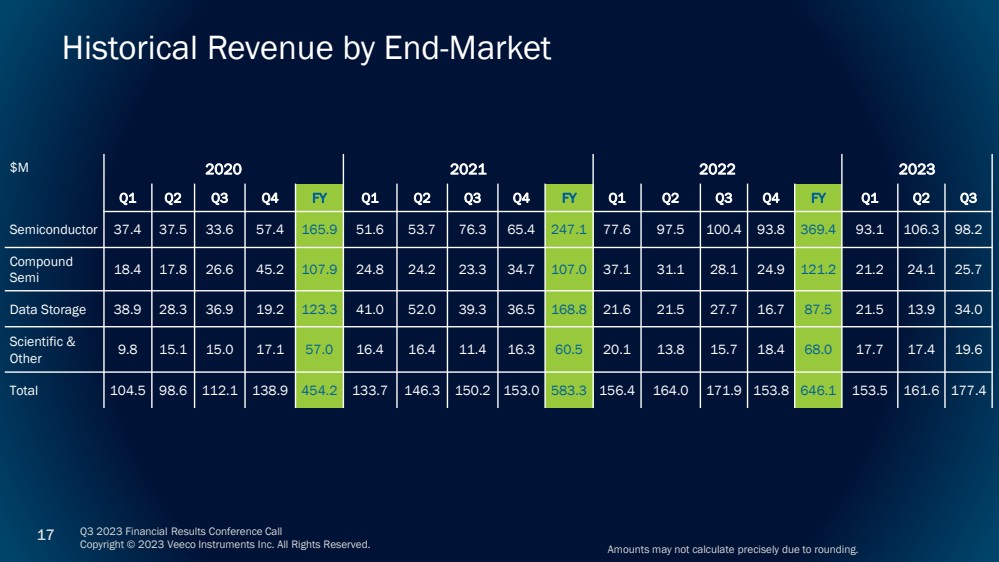
| Q3 2023 Financial Results Conference Call Copyright © 2023 Veeco Instruments Inc. All Rights Reserved. 17 Historical Revenue by End-Market $M 2020 2021 2022 2023 Q1 Q2 Q3 Q4 FY Q1 Q2 Q3 Q4 FY Q1 Q2 Q3 Q4 FY Q1 Q2 Q3 Semiconductor 37.4 37.5 33.6 57.4 165.9 51.6 53.7 76.3 65.4 247.1 77.6 97.5 100.4 93.8 369.4 93.1 106.3 98.2 Compound Semi 18.4 17.8 26.6 45.2 107.9 24.8 24.2 23.3 34.7 107.0 37.1 31.1 28.1 24.9 121.2 21.2 24.1 25.7 Data Storage 38.9 28.3 36.9 19.2 123.3 41.0 52.0 39.3 36.5 168.8 21.6 21.5 27.7 16.7 87.5 21.5 13.9 34.0 Scientific & Other 9.8 15.1 15.0 17.1 57.0 16.4 16.4 11.4 16.3 60.5 20.1 13.8 15.7 18.4 68.0 17.7 17.4 19.6 Total 104.5 98.6 112.1 138.9 454.2 133.7 146.3 150.2 153.0 583.3 156.4 164.0 171.9 153.8 646.1 153.5 161.6 177.4 Amounts may not calculate precisely due to rounding. |
| Q3 2023 Financial Results Conference Call Copyright © 2023 Veeco Instruments Inc. All Rights Reserved. 18 Note on Reconciliation Tables These tables include financial measures adjusted for the impact of certain items; these financial measures are therefore not calculated in accordance with U.S. generally accepted accounting principles (“GAAP”). These Non-GAAP financial measures exclude items such as: share-based compensation expense; charges relating to restructuring initiatives; non-cash asset impairments; certain other non-operating gains and losses; and acquisition-related items such as transaction costs, non-cash amortization of acquired intangible assets, incremental transaction-related compensation, and certain integration costs. These Non-GAAP financial measures may be different from Non-GAAP financial measures used by other companies. Non-GAAP financial measures should not be considered a substitute for, or superior to, measures of financial performance prepared in accordance with GAAP. By excluding these items, Non-GAAP financial measures are intended to facilitate meaningful comparisons to historical operating results, competitors' operating results, and estimates made by securities analysts. Management is evaluated on key performance metrics including Non-GAAP Operating Income, which is used to determine management incentive compensation as well as to forecast future periods. These Non-GAAP financial measures may be useful to investors in allowing for greater transparency of supplemental information used by management in its financial and operational decision-making. In addition, similar Non-GAAP financial measures have historically been reported to investors; the inclusion of comparable numbers provides consistency in financial reporting. Investors are encouraged to review the reconciliation of the Non-GAAP financial measures used in this news release to their most directly comparable GAAP financial measures. |
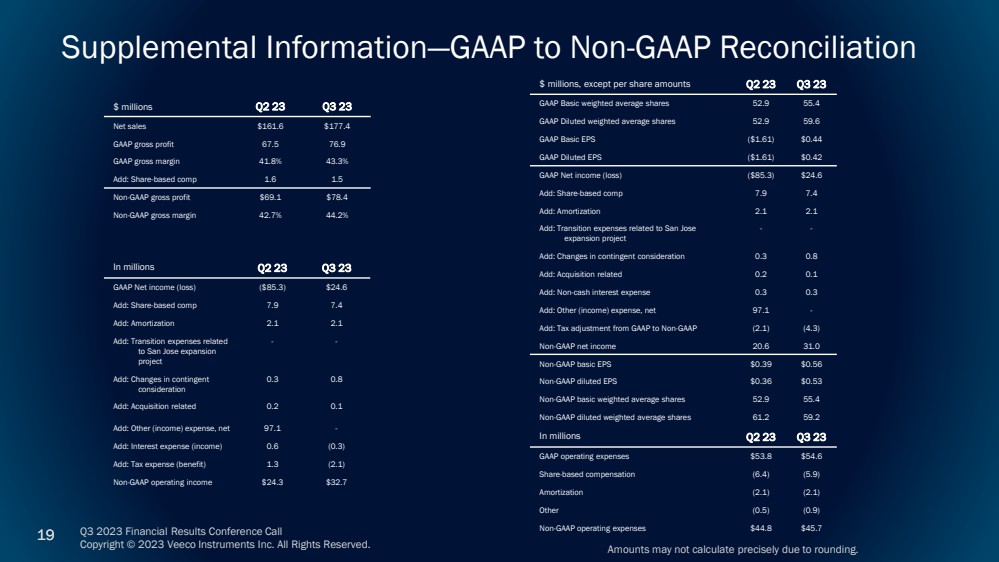
| Q3 2023 Financial Results Conference Call Copyright © 2023 Veeco Instruments Inc. All Rights Reserved. 19 Supplemental Information—GAAP to Non-GAAP Reconciliation Amounts may not calculate precisely due to rounding. $ millions Q2 23 Q3 23 Net sales $161.6 $177.4 GAAP gross profit 67.5 76.9 GAAP gross margin 41.8% 43.3% Add: Share-based comp 1.6 1.5 Non-GAAP gross profit $69.1 $78.4 Non-GAAP gross margin 42.7% 44.2% In millions Q2 23 Q3 23 GAAP Net income (loss) ($85.3) $24.6 Add: Share-based comp 7.9 7.4 Add: Amortization 2.1 2.1 Add: Transition expenses related to San Jose expansion project - - Add: Changes in contingent consideration 0.3 0.8 Add: Acquisition related 0.2 0.1 Add: Other (income) expense, net 97.1 - Add: Interest expense (income) 0.6 (0.3) Add: Tax expense (benefit) 1.3 (2.1) Non-GAAP operating income $24.3 $32.7 $ millions, except per share amounts Q2 23 Q3 23 GAAP Basic weighted average shares 52.9 55.4 GAAP Diluted weighted average shares 52.9 59.6 GAAP Basic EPS ($1.61) $0.44 GAAP Diluted EPS ($1.61) $0.42 GAAP Net income (loss) ($85.3) $24.6 Add: Share-based comp 7.9 7.4 Add: Amortization 2.1 2.1 Add: Transition expenses related to San Jose expansion project - - Add: Changes in contingent consideration 0.3 0.8 Add: Acquisition related 0.2 0.1 Add: Non-cash interest expense 0.3 0.3 Add: Other (income) expense, net 97.1 - Add: Tax adjustment from GAAP to Non-GAAP (2.1) (4.3) Non-GAAP net income 20.6 31.0 Non-GAAP basic EPS $0.39 $0.56 Non-GAAP diluted EPS $0.36 $0.53 Non-GAAP basic weighted average shares 52.9 55.4 Non-GAAP diluted weighted average shares 61.2 59.2 In millions Q2 23 Q3 23 GAAP operating expenses $53.8 $54.6 Share-based compensation (6.4) (5.9) Amortization (2.1) (2.1) Other (0.5) (0.9) Non-GAAP operating expenses $44.8 $45.7 |
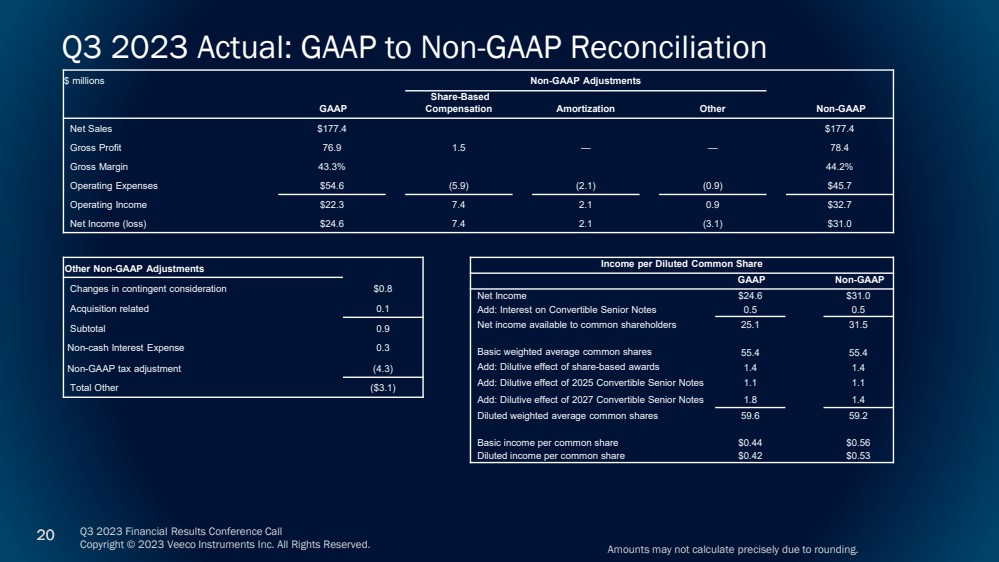
| Q3 2023 Financial Results Conference Call Copyright © 2023 Veeco Instruments Inc. All Rights Reserved. 20 $ millions Non-GAAP Adjustments GAAP Share-Based Compensation Amortization Other Non-GAAP Net Sales $177.4 $177.4 Gross Profit 76.9 1.5 — — 78.4 Gross Margin 43.3% 44.2% Operating Expenses $54.6 (5.9) (2.1) (0.9) $45.7 Operating Income $22.3 7.4 2.1 0.9 $32.7 Net Income (loss) $24.6 7.4 2.1 (3.1) $31.0 Q3 2023 Actual: GAAP to Non-GAAP Reconciliation Amounts may not calculate precisely due to rounding. Income per Diluted Common Share GAAP Non-GAAP Net Income $24.6 $31.0 Add: Interest on Convertible Senior Notes 0.5 0.5 Net income available to common shareholders 25.1 31.5 Basic weighted average common shares 55.4 55.4 Add: Dilutive effect of share-based awards 1.4 1.4 Add: Dilutive effect of 2025 Convertible Senior Notes 1.1 1.1 Add: Dilutive effect of 2027 Convertible Senior Notes 1.8 1.4 Diluted weighted average common shares 59.6 59.2 Basic income per common share $0.44 $0.56 Diluted income per common share $0.42 $0.53 Other Non-GAAP Adjustments Changes in contingent consideration $0.8 Acquisition related 0.1 Subtotal 0.9 Non-cash Interest Expense 0.3 Non-GAAP tax adjustment (4.3) Total Other ($3.1) |
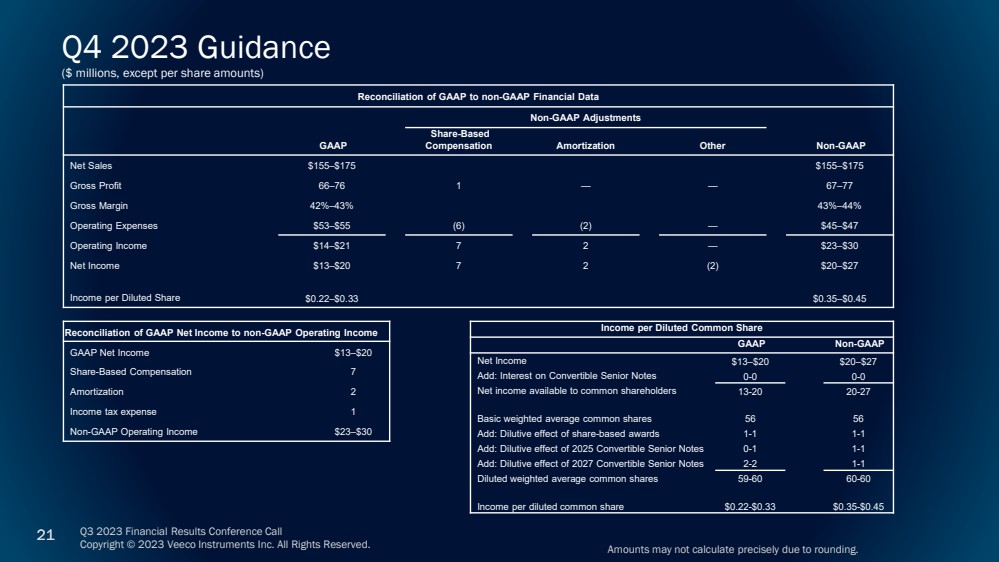
| Q3 2023 Financial Results Conference Call Copyright © 2023 Veeco Instruments Inc. All Rights Reserved. 21 Reconciliation of GAAP to non-GAAP Financial Data Non-GAAP Adjustments GAAP Share-Based Compensation Amortization Other Non-GAAP Net Sales $155–$175 $155–$175 Gross Profit 66–76 1 — — 67–77 Gross Margin 42%–43% 43%–44% Operating Expenses $53–$55 (6) (2) — $45–$47 Operating Income $14–$21 7 2 — $23–$30 Net Income $13–$20 7 2 (2) $20–$27 Income per Diluted Share $0.22–$0.33 $0.35–$0.45 Q4 2023 Guidance ($ millions, except per share amounts) Amounts may not calculate precisely due to rounding. Income per Diluted Common Share GAAP Non-GAAP Net Income $13–$20 $20–$27 Add: Interest on Convertible Senior Notes 0-0 0-0 Net income available to common shareholders 13-20 20-27 Basic weighted average common shares 56 56 Add: Dilutive effect of share-based awards 1-1 1-1 Add: Dilutive effect of 2025 Convertible Senior Notes 0-1 1-1 Add: Dilutive effect of 2027 Convertible Senior Notes 2-2 1-1 Diluted weighted average common shares 59-60 60-60 Income per diluted common share $0.22-$0.33 $0.35-$0.45 Reconciliation of GAAP Net Income to non-GAAP Operating Income GAAP Net Income $13–$20 Share-Based Compensation 7 Amortization 2 Income tax expense 1 Non-GAAP Operating Income $23–$30 |