UNITED STATES
SECURITIES AND EXCHANGE COMMISSION
Washington, D.C. 20549
FORM
CURRENT REPORT
PURSUANT TO SECTION 13 OR 15(d) OF THE
SECURITIES EXCHANGE ACT OF 1934
Date of Report (Date of earliest event reported):
(Exact name of registrant as specified in its charter)
|
|
|
(Address of principal executive offices)
(
(Registrant’s telephone number, including area code)
Not applicable
(Former name or former address, if changed since last report)
Check the appropriate box below if the Form 8-K filing is intended to simultaneously satisfy the filing obligation of the registrant under any of the following provisions (see General Instruction A.2. below):
Securities registered pursuant to Section 12(b) of the Act:
Title of each class | Trading Symbol(s) | Name of each exchange on which registered |
Indicate by check mark whether the registrant is an emerging growth company as defined in Rule 405 of the Securities Act of 1933 (§230.405 of this chapter) or Rule 12b-2 of the Securities Exchange Act of 1934 (§240.12b-2 of this chapter).
Emerging growth company
If an emerging growth company, indicate by check mark if the registrant has elected not to use the extended transition period for complying with any new or revised financial accounting standards provided pursuant to Section 13(a) of the Exchange Act. ☐
Item 2.02 Results of Operations and Financial Condition.
On February 15, 2023, Veeco Instruments Inc. issued a press release announcing its financial results for the quarter and year ended December 31, 2022. In connection with the release and the related conference call, Veeco posted a presentation relating to its fourth quarter and FY 2022 financial results on its website (www.veeco.com). Copies of the press release and presentation are furnished as Exhibit 99.1 and Exhibit 99.2 to this report.
Item 9.01 Financial Statements and Exhibits.
(d) Exhibits.
EXHIBIT INDEX
Exhibit |
| Description |
99.1 | ||
99.2 | Veeco Q4 & FY 2022 Conference Call Presentation February 15, 2023 | |
104 | Cover Page Interactive Data File (formatted as inline XBRL). |
Limitation on Incorporation by Reference
In accordance with general instruction B.2 of Form 8-K, the information in this report, including exhibits, is furnished pursuant to Items 2.02 and 9.01 and shall not be deemed “filed” for purposes of Section 18 of the Securities Exchange Act of 1934, as amended (the “Exchange Act”), or otherwise subject to the liability of that section, nor shall this information or exhibits be deemed to be incorporated by reference into any filing under the Securities Act of 1933, as amended, or the Exchange Act, except as expressly set forth by specific reference in such a filing.
SIGNATURES
Pursuant to the requirements of the Securities Exchange Act of 1934, the registrant has duly caused this report to be signed on its behalf by the undersigned hereunto duly authorized.
February 15, 2023 | VEECO INSTRUMENTS INC. | |
By: | /s/ Kirk Mackey | |
Name: Kirk Mackey | ||
Title: Vice President, General Counsel |
2
EXHIBIT 99.1
VEECO REPORTS FOURTH QUARTER AND FISCAL YEAR 2022 FINANCIAL RESULTS
Fourth Quarter 2022 Highlights:
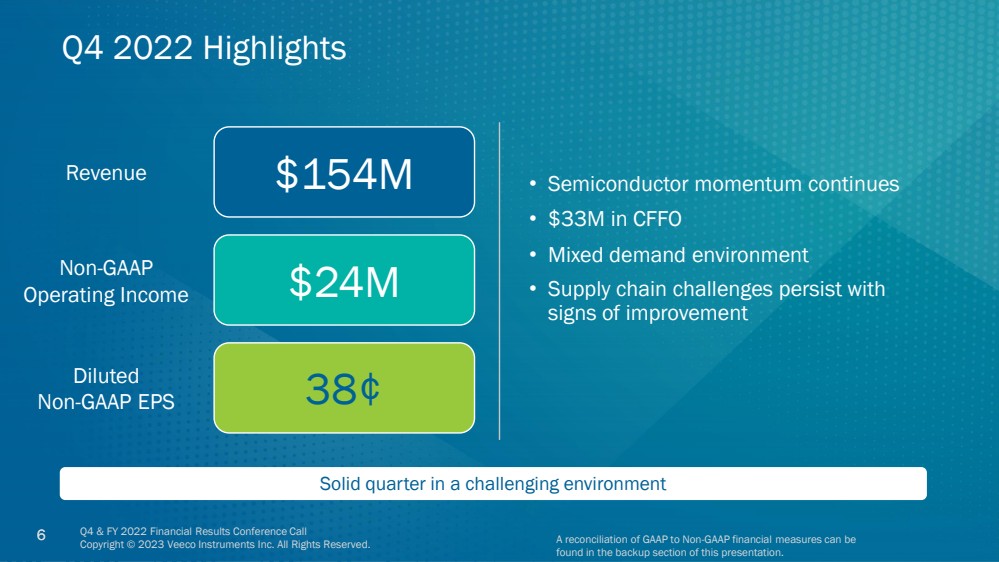
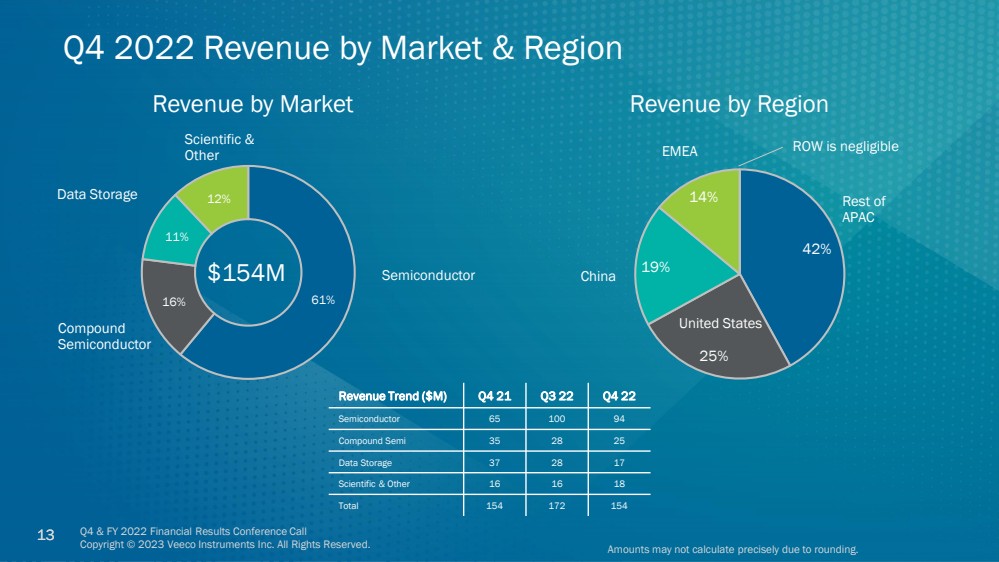
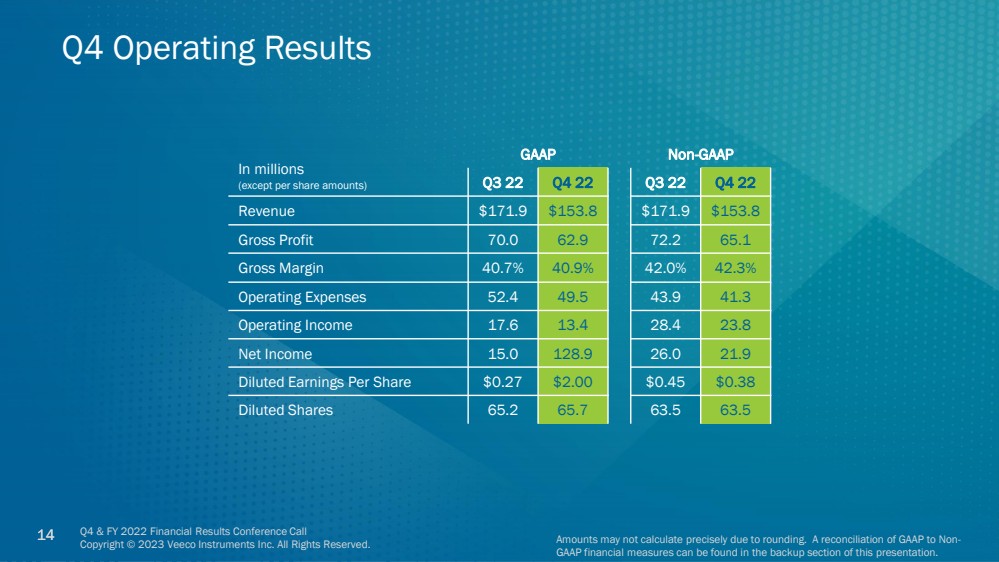
● | Revenues of $153.8 million, compared with $153.0 million in the same period last year |
● | GAAP net income of $128.9 million, or $2.00 per diluted share, compared with $8.2 million, or $0.15 per diluted share in the same period last year |
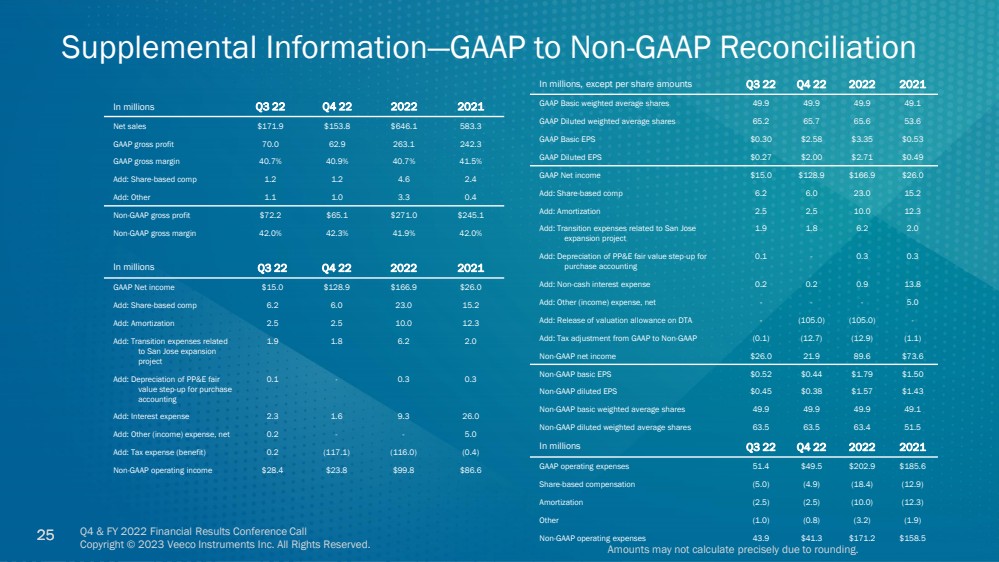
● | Non-GAAP net income of $21.9 million, or $0.38 per diluted share, compared with $22.6 million, or $0.43 per diluted share in the same period last year |
Fiscal Year 2022 Highlights:
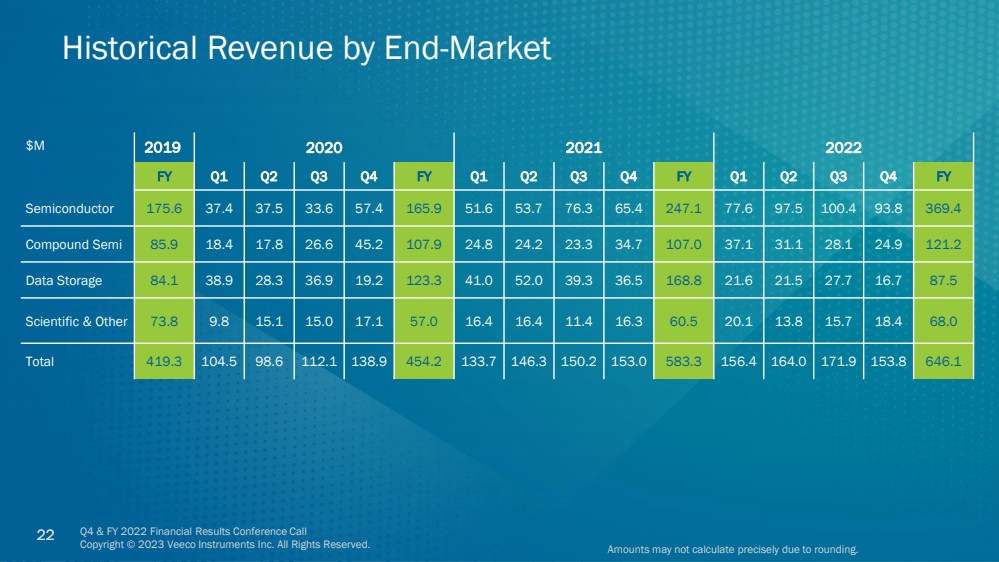
● | Revenues of $646.1 million, compared with $583.3 million in the same period last year |
● | GAAP net income of $166.9 million, or $2.71 per diluted share, compared with $26.0 million, or $0.49 per diluted share in the same period last year |
● | Non-GAAP net income of $89.6 million, or $1.57 per diluted share, compared with $73.6 million, or $1.43 per diluted share in the same period last year |
Plainview, N.Y., February 15, 2023 -- Veeco Instruments Inc. (Nasdaq: VECO) today announced financial results for its fourth quarter and fiscal year ended December 31, 2022. Results are reported in accordance with U.S. generally accepted accounting principles (“GAAP”) and are also reported adjusting for certain items (“Non-GAAP”). A reconciliation between GAAP and Non-GAAP operating results is provided at the end of this press release.
U.S. Dollars in millions, except per share data |
| | 4th Quarter | | Full Year | ||||||||
GAAP Results |
| Q4 '22 | | Q4 '21 | | 2022 |
| 2021 | ||||
Revenue | | $ | 153.8 | | $ | 153.0 | | $ | 646.1 | | $ | 583.3 |
Net income | | $ | 128.9 | | $ | 8.2 | | $ | 166.9 | | $ | 26.0 |
Diluted earnings per share | | $ | 2.00 | | $ | 0.15 | | $ | 2.71 | | $ | 0.49 |
| | 4th Quarter | | Full Year | ||||||||
Non-GAAP Results |
| Q4 '22 | | Q4 '21 | | 2022 | | 2021 | ||||
Operating income | | $ | 23.8 | | $ | 24.9 | | $ | 99.8 | | $ | 86.6 |
Net income | | $ | 21.9 | | $ | 22.6 | | $ | 89.6 | | $ | 73.6 |
Diluted earnings per share | | $ | 0.38 | | $ | 0.43 | | $ | 1.57 | | $ | 1.43 |
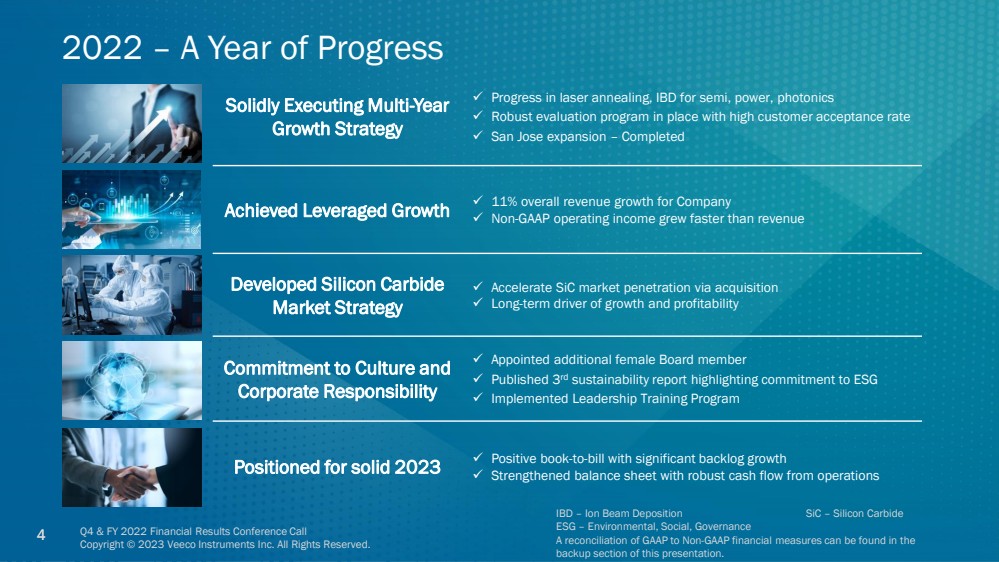
“2022 was another year of growth for Veeco,” commented Bill Miller, Ph.D., Veeco’s Chief Executive Officer. “We achieved record revenue with our semiconductor products led by increased traction in laser annealing for both advanced and trailing nodes. We grew our backlog with strong order activity while also strengthening our balance sheet with robust cashflow from operations.”
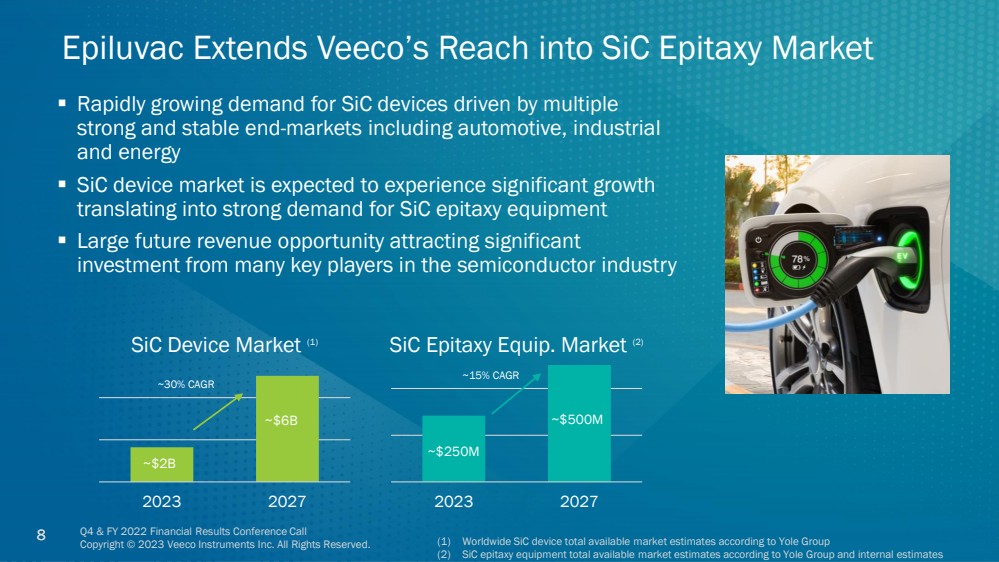
“We enter 2023 cautiously optimistic,” continued Dr. Mr. Miller. “We’re focused on investing R&D in our product roadmaps and integrating our recently acquired silicon carbide epitaxy business. We expect to outperform the wafer fab equipment market with our semiconductor products, grow in the data storage market and maintain profitability during the current macroeconomic challenges.”
1
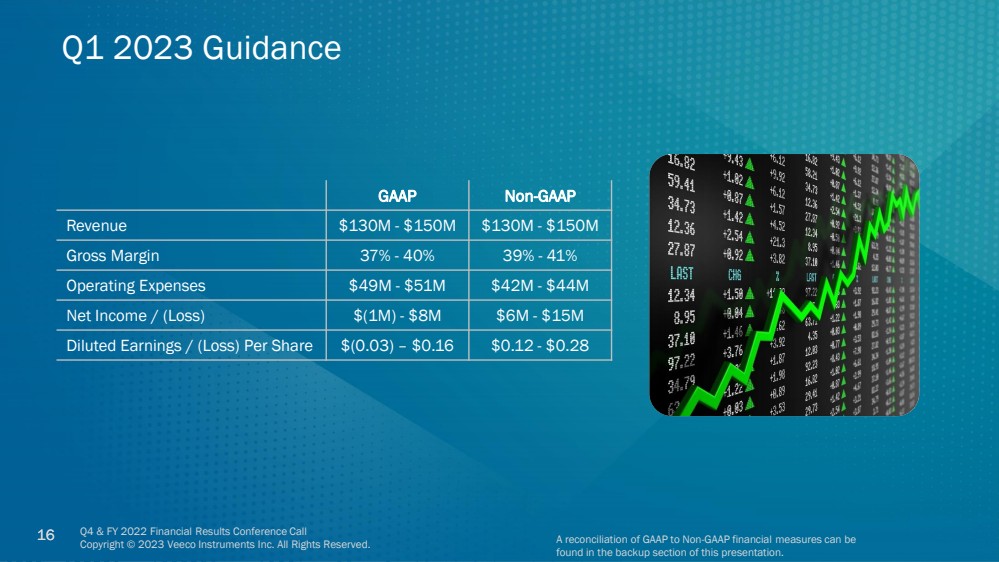
Guidance and Outlook
The following guidance is provided for Veeco’s first quarter 2023:
● | Revenue is expected in the range of $130 million to $150 million |
● | GAAP diluted earnings (loss) per share are expected in the range of $(0.03) to $0.16 |
● | Non-GAAP diluted earnings per share are expected in the range of $0.12 to $0.28 |
Conference Call Information
A conference call reviewing these results has been scheduled for today, February 15, 2023 starting at 5:00pm ET. To join the call, dial 1-877-407-8029 (toll free) or 1-201-689-8029. Participants may also access a live webcast of the call by visiting the investor relations section of Veeco's website at ir.veeco.com. A replay of the webcast will be made available on the Veeco website that evening. We will post an accompanying slide presentation to our website prior to the beginning of the call.
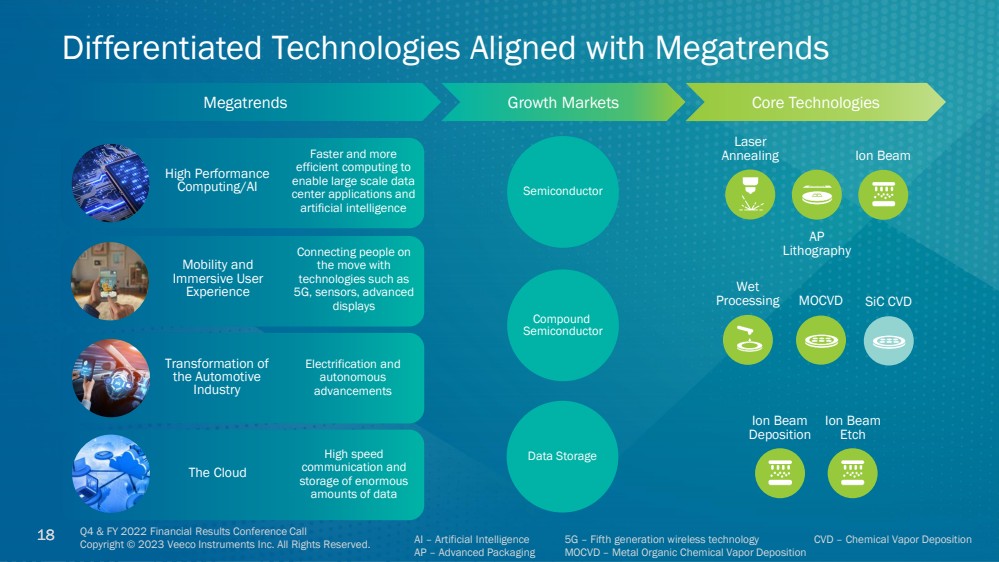
About Veeco
Veeco (NASDAQ: VECO) is an innovative manufacturer of semiconductor process equipment. Our proven ion beam, laser annealing, lithography, MOCVD, and single wafer etch & clean technologies play an integral role in the fabrication and packaging of advanced semiconductor devices. With equipment designed to optimize performance, yield and cost of ownership, Veeco holds leading technology positions in the markets we serve. To learn more about Veeco’s systems and service offerings, visit www.veeco.com.
Forward-looking Statements
This press release contains “forward-looking statements”, within the meaning of the safe harbor provisions of the U.S. Private Securities Litigation Reform Act of 1995, as amended, that are based on management’s expectations, estimates, projections and assumptions. Words such as “expects,” “anticipates,” “plans,” “believes,” “scheduled,” “estimates” and variations of these words and similar expressions are intended to identify forward-looking statements. Forward-looking statements include, but are not limited to, those regarding anticipated growth and trends in our businesses and markets, industry outlooks and demand drivers, our investment and growth strategies, our development of new products and technologies, our business outlook for current and future periods, the impact of the COVID-19 pandemic, our ongoing transformation initiative and the effects thereof on our operations and financial results; and other statements that are not historical facts. These statements and their underlying assumptions are subject to risks and uncertainties and are not guarantees of future performance. Factors that could cause actual results to differ materially from those expressed or implied by such statements include, without limitation: the level of demand for our products; global economic and industry conditions; the effects of regional or global health epidemics, including the effects of the COVID-19 pandemic on the Company’s operations and on those of our customers and suppliers; global trade issues, including the ongoing trade disputes between the U.S. and China, and changes in trade and export license policies; our dependency on third-party suppliers and outsourcing partners; the timing of customer orders; our ability to develop, deliver and support new products and technologies; our ability to expand our current markets, increase market share and develop new markets; the concentrated nature of our customer base; our ability to obtain and protect intellectual property rights in key technologies; our ability to achieve the objectives of operational and strategic initiatives and attract, motivate and retain key employees; the variability of results among products and end-markets, and our ability to accurately forecast future results, market conditions, and customer requirements; the impact of our indebtedness, including our convertible senior notes and our capped call transactions; and other risks and uncertainties described in our SEC filings on Forms 10-K, 10-Q and 8-K, and from time-to-time in our other SEC reports. All forward-looking statements speak only to management’s expectations, estimates, projections and assumptions as of the date of this press release or, in the case of any document referenced herein or incorporated by reference, the date of that document. The Company does not undertake any obligation to update or publicly revise any forward-looking statements to reflect events, circumstances or changes in expectations after the date of this press release.
-financial tables attached-
Veeco Contacts:
Investors:Anthony Bencivenga (516) 252-1438abencivenga@veeco.com
Media:Kevin Long (516) 714-3978klong@veeco.com
2
Veeco Instruments Inc. and Subsidiaries
Condensed Consolidated Statements of Operations
(in thousands, except per share amounts)
(unaudited)
| | Three months ended December 31, | | Year ended December 31, |
| ||||||||
|
| 2022 |
| 2021 |
| 2022 |
| 2021 |
| ||||
Net sales |
| $ | 153,799 |
| $ | 152,972 |
| $ | 646,137 |
| $ | 583,277 | |
Cost of sales | |
| 90,881 | |
| 88,949 | |
| 382,989 | |
| 341,003 | |
Gross profit | |
| 62,918 | |
| 64,023 | |
| 263,148 | |
| 242,274 | |
Operating expenses, net: | | | | | | | | | | | | | |
Research and development | |
| 26,327 | |
| 22,283 | |
| 103,565 | |
| 88,680 | |
Selling, general, and administrative | |
| 20,965 | |
| 21,211 | |
| 88,952 | |
| 84,536 | |
Amortization of intangible assets | |
| 2,505 | |
| 2,974 | |
| 10,018 | |
| 12,280 | |
Other operating expense (income), net | |
| (271) | |
| (71) | |
| 317 | |
| 68 | |
Total operating expenses, net | |
| 49,526 | |
| 46,397 | |
| 202,852 | |
| 185,564 | |
Operating income | |
| 13,392 | |
| 17,626 | |
| 60,296 | |
| 56,710 | |
Interest expense, net | |
| (1,558) | |
| (5,799) | |
| (9,311) | |
| (26,020) | |
Other income (expense), net | | | — | | | (5,010) | | | — | | | (5,010) | |
Income before income taxes | |
| 11,834 | |
| 6,817 | |
| 50,985 | |
| 25,680 | |
Income tax expense (benefit) | |
| (117,081) | |
| (1,387) | |
| (115,957) | |
| (358) | |
Net income |
| $ | 128,915 |
| $ | 8,204 |
| $ | 166,942 |
| $ | 26,038 | |
| | | | | | | | | | | | | |
Income per common share: | | | | | | | | | | | | | |
Basic |
| $ | 2.58 |
| $ | 0.17 |
| $ | 3.35 |
| $ | 0.53 | |
Diluted |
| $ | 2.00 |
| $ | 0.15 |
| $ | 2.71 |
| $ | 0.49 | |
| | | | | | | | | | | | | |
Weighted average number of shares: | | | | | | | | | | | | | |
Basic | |
| 49,912 | |
| 49,187 | |
| 49,906 | |
| 49,073 | |
Diluted | |
| 65,684 | |
| 54,931 | |
| 65,607 | |
| 53,643 | |
3
Veeco Instruments Inc. and Subsidiaries
Condensed Consolidated Balance Sheets
(in thousands)
| | December 31, | | December 31, | ||
|
| 2022 |
| 2021 | ||
| | (unaudited) | | | | |
Assets | | | | | | |
Current assets: | | | | | | |
Cash and cash equivalents | | $ | 154,925 | | $ | 119,747 |
Restricted cash | |
| 547 | |
| 725 |
Short-term investments | |
| 147,488 | |
| 104,181 |
Accounts receivable, net | |
| 124,221 | |
| 109,609 |
Contract assets | |
| 16,507 | |
| 18,293 |
Inventories | |
| 206,908 | |
| 170,858 |
Prepaid expenses and other current assets | |
| 18,305 | |
| 25,974 |
Total current assets | |
| 668,901 | |
| 549,387 |
Property, plant and equipment, net | |
| 107,281 | |
| 99,743 |
Operating lease right-of-use assets | | | 26,467 | |
| 28,813 |
Intangible assets, net | |
| 23,887 | |
| 33,905 |
Goodwill | |
| 181,943 | |
| 181,943 |
Deferred income taxes | |
| 116,349 | |
| 1,639 |
Other assets | |
| 3,355 | |
| 3,546 |
Total assets | | $ | 1,128,183 | | $ | 898,976 |
| | | | | | |
Liabilities and stockholders’ equity | | | | | | |
Current liabilities: | | | | | | |
Accounts payable | | $ | 52,049 | | $ | 44,456 |
Accrued expenses and other current liabilities | |
| 56,031 | |
| 79,752 |
Customer deposits and deferred revenue | |
| 127,223 | |
| 63,136 |
Income taxes payable | |
| 2,432 | |
| 1,860 |
Current portion of long-term debt | | | 20,169 | | | — |
Total current liabilities | |
| 257,904 | |
| 189,204 |
Deferred income taxes | |
| 1,285 | |
| 4,792 |
Long-term debt | |
| 254,491 | |
| 229,438 |
Long-term operating lease liabilities | | | 33,581 | |
| 32,834 |
Other liabilities | |
| 3,098 | |
| 5,080 |
Total liabilities | |
| 550,359 | |
| 461,348 |
| | | | | | |
Total stockholders’ equity | |
| 577,824 | |
| 437,628 |
Total liabilities and stockholders’ equity | | $ | 1,128,183 | | $ | 898,976 |
Note on Reconciliation Tables
The below tables include financial measures adjusted for the impact of certain items; these financial measures are therefore not calculated in accordance with U.S. generally accepted accounting principles (“GAAP”). These Non-GAAP financial measures exclude items such as: share-based compensation expense; charges relating to restructuring initiatives; non-cash asset impairments; certain other non-operating gains and losses; and acquisition-related items such as transaction costs, non-cash amortization of acquired intangible assets, and certain integration costs.
These Non-GAAP financial measures may be different from Non-GAAP financial measures used by other companies. Non-GAAP financial measures should not be considered a substitute for, or superior to, measures of financial performance prepared in accordance with GAAP. By excluding these items, Non-GAAP financial measures are intended to facilitate meaningful comparisons to historical operating results, competitors’ operating results, and estimates made by securities analysts. Management is evaluated on key performance metrics including Non-GAAP Operating income (loss), which is used to determine management incentive compensation as well as to forecast future periods. These Non-GAAP financial measures may be useful to investors in allowing for greater transparency of supplemental information used by management in its financial and operational decision-making. In addition, similar Non-GAAP financial measures have historically been reported to investors; the inclusion of comparable numbers provides consistency in financial reporting. Investors are encouraged to review the reconciliation of the Non-GAAP financial measures used in this news release to their most directly comparable GAAP financial measures.
4
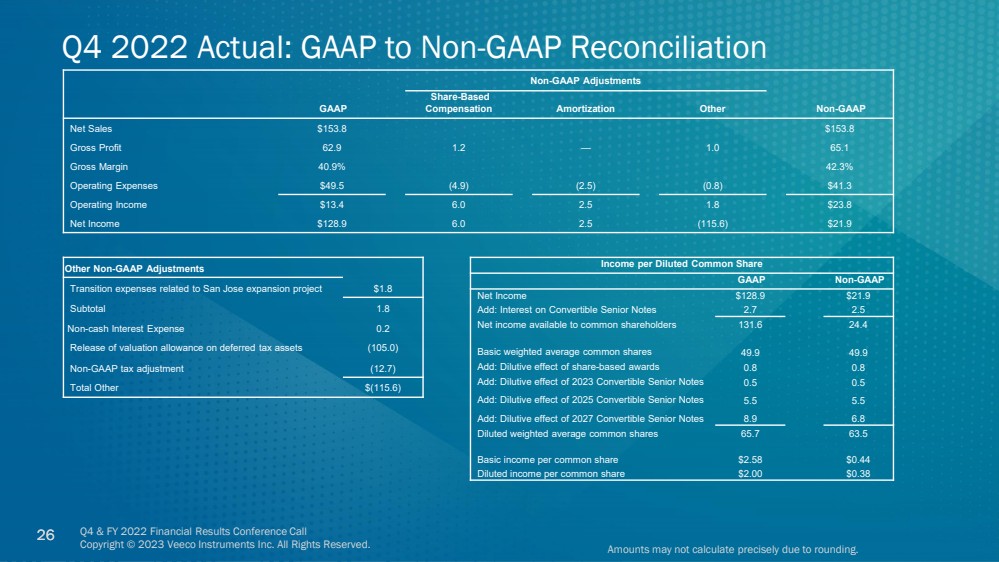
Reconciliation of GAAP to Non-GAAP Financial Data (Q4 2022)
(in thousands)
(unaudited)
| | | | | Non-GAAP Adjustments | | | |
| ||||
| | | | | Share-Based | | | | | | | |
|
Three months ended December 31, 2022 |
| GAAP |
| Compensation |
| Amortization |
| Other |
| Non-GAAP |
| ||
Net sales | | $ | 153,799 | | | | | | | | $ | 153,799 |
|
Gross profit |
| | 62,918 |
| 1,167 | | |
| 1,011 |
| | 65,096 | |
Gross margin |
| | 40.9 | % | | | | | |
| | 42.3 | % |
Operating expenses |
| | 49,526 |
| (4,858) | | (2,505) | | (821) | | | 41,342 | |
Operating income |
| | 13,392 |
| 6,025 | | 2,505 |
| 1,832 | ^ | | 23,754 | |
Net income |
| | 128,915 |
| 6,025 |
| 2,505 |
| (115,554) | ^ | | 21,891 | |
^ | - See table below for additional details. |
Other Non-GAAP Adjustments (Q4 2022)
(in thousands)
(unaudited)
Three months ended December 31, 2022 |
| |
Transition expenses related to San Jose expansion project | $ | 1,788 |
Depreciation of PP&E fair value step-up associated with the Ultratech purchase accounting | | 44 |
Subtotal | | 1,832 |
Non-cash interest expense |
| 244 |
Release of valuation allowance on deferred tax assets | | (104,971) |
Non-GAAP tax adjustment * |
| (12,659) |
Total Other | $ | (115,554) |
* | - The ‘with or without’ method is utilized to determine the income tax effect of all Non-GAAP adjustments. |
Net Income per Common Share (Q4 2022)
(in thousands, except per share amounts)
(unaudited)
| | Three months ended December 31, 2022 | ||||
| | GAAP | | Non-GAAP | ||
Numerator: | | | | | | |
Net income |
| $ | 128,915 |
| $ | 21,891 |
Interest expense associated with convertible notes | |
| 2,712 |
|
| 2,467 |
Net income available to common shareholders | | $ | 131,627 | | $ | 24,358 |
| | | | | | |
Denominator: | | | | | | |
Basic weighted average shares outstanding | | | 49,912 | | | 49,912 |
Effect of potentially dilutive share-based awards | | | 805 | | | 805 |
Dilutive effect of 2023 Convertible Senior Notes | | | 504 | | | 504 |
Dilutive effect of 2025 Convertible Senior Notes | | | 5,521 | | | 5,521 |
Dilutive effect of 2027 Convertible Senior Notes (1) | |
| 8,942 |
|
| 6,771 |
Diluted weighted average shares outstanding | | | 65,684 | | | 63,513 |
| | | | | | |
Net income per common share: | | | | | | |
Basic | | $ | 2.58 | | $ | 0.44 |
Diluted | | $ | 2.00 | | $ | 0.38 |
(1) - The non-GAAP incremental dilutive shares includes the impact of the Company’s capped call transaction issued concurrently with our 2027 Notes, and as such, an effective conversion price of $18.46 is used when determining incremental shares to add to the dilutive share count. The GAAP incremental dilutive shares does not include the impact of the Company’s capped call transaction, and as such, an effective conversion price of $13.98 is used when determining incremental shares to add to the dilutive share count.
5
Reconciliation of GAAP to Non-GAAP Financial Data (Q4 2021)
(in thousands, except per share amounts)
(unaudited)
| | | | | Non-GAAP Adjustments | |
| | | ||||
| | | | | Share-based | | | | | | | | |
Three months ended December 31, 2021 |
| | GAAP |
| Compensation |
| Amortization |
| Other |
| Non-GAAP | | |
Net sales | | $ | 152,972 | | | | | | | | $ | 152,972 | |
Gross profit | |
| 64,023 |
| 608 | | |
| 235 | |
| 64,866 | |
Gross margin | |
| 41.9 | % | | | | | | | | 42.4 | % |
Operating expenses | |
| 46,397 |
| (2,906) | | (2,974) | | (537) | | | 39,980 | |
Operating income | |
| 17,626 |
| 3,514 | | 2,974 |
| 772 | ^ | | 24,886 | |
Net income | |
| 8,204 |
| 3,514 |
| 2,974 |
| 7,950 | ^ | | 22,642 | |
| | | | | | | | | | | | | |
Income per common share: | | | | | | | | | | | | | |
Basic | | $ | 0.17 | | | | | | | | $ | 0.46 | |
Diluted | |
| 0.15 | | | | | | | | | 0.43 | |
Weighted average number of shares: | | | | | | | | | | | | | |
Basic | |
| 49,187 | | | | | | | | | 49,187 | |
Diluted (1) | |
| 54,931 | | | | | | | | | 52,761 | |
^ | - See table below for additional details. |
(1) - The non-GAAP incremental dilutive shares includes the impact of the Company’s capped call transaction issued concurrently with our 2027 Notes, and as such, no incremental shares are added to the dilutive share count in periods in which the average stock price per share is below $18.46. The GAAP incremental dilutive shares does not include the impact of the Company’s capped call transaction, and as such, incremental shares are added to the dilutive share count in periods in which the average stock price per share is above $13.98, and the Company is in a net income position. The average stock price for the three months ended December 31, 2021 was $25.53, and therefore 1.9 million shares were included in the non-GAAP diluted share count, and 4.0 million shares were included in the GAAP diluted share count related to the 2027 Notes.
Other Non-GAAP Adjustments (Q4 2021)
(in thousands)
(unaudited)
Three months ended December 31, 2021 | | |
Transition expenses related to San Jose expansion project | $ | 698 |
Depreciation of PP&E fair value step-up associated with the Ultratech purchase accounting | | 74 |
Subtotal | | 772 |
Non-cash interest expense |
| 3,057 |
Other (income) expense, net | | 5,010 |
Non-GAAP tax adjustment * |
| (889) |
Total Other | $ | 7,950 |
* | - The ‘with or without’ method is utilized to determine the income tax effect of all Non-GAAP adjustments. |
6
Reconciliation of GAAP Net Income to Non-GAAP Operating Income (Q4 2022 and 2021)
(in thousands)
(unaudited)
|
| Three months ended |
| Three months ended | ||
| | December 31, 2022 | | December 31, 2021 | ||
GAAP Net income | | $ | 128,915 | | $ | 8,204 |
Share-based compensation | |
| 6,025 | |
| 3,514 |
Amortization | |
| 2,505 | |
| 2,974 |
Transition expenses related to San Jose expansion project | |
| 1,788 | |
| 698 |
Depreciation of PP&E fair value step-up associated with the Ultratech purchase accounting | |
| 44 | |
| 74 |
Interest (income) expense, net | |
| 1,558 | |
| 5,799 |
Other (income) expense, net | | | — | | | 5,010 |
Income tax expense (benefit) | |
| (117,081) | |
| (1,387) |
Non-GAAP Operating income | | $ | 23,754 | | $ | 24,886 |
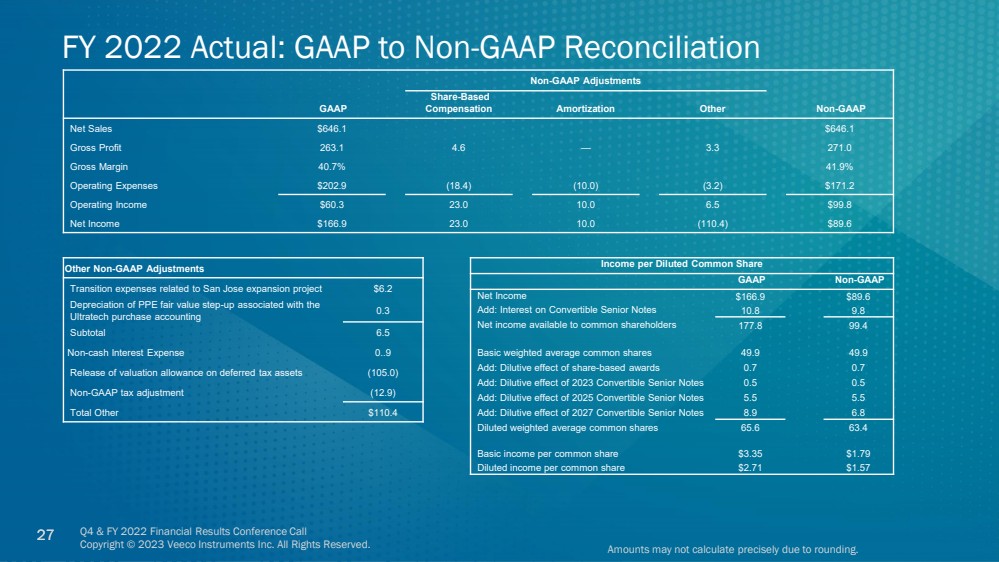
Reconciliation of GAAP to Non-GAAP Financial Data (FY 2022)
(in thousands)
(unaudited)
| | | | | Non-GAAP Adjustments | |
| | | ||||
| | | | | Share-based | | | | | | | | |
For the year ended December 31, 2022 |
| | GAAP |
| Compensation |
| Amortization |
| Other |
| Non-GAAP | | |
Net sales | | $ | 646,137 | | | | | | | | $ | 646,137 | |
Gross profit | |
| 263,148 |
| 4,551 | | |
| 3,300 | |
| 270,999 | |
Gross margin | |
| 40.7 | % | | | | | | | | 41.9 | % |
Operating expenses | |
| 202,852 |
| (18,443) | | (10,018) | | (3,212) | | | 171,179 | |
Operating income (loss) | |
| 60,296 |
| 22,994 | | 10,018 |
| 6,512 | ^ | | 99,820 | |
Net income (loss) | |
| 166,942 |
| 22,994 |
| 10,018 |
| (110,379) | ^ | | 89,575 | |
^ | - See table below for additional details. |
Other Non-GAAP Adjustments (FY 2022)
(in thousands)
(unaudited)
For the year ended December 31, 2022 |
| |
Transition expenses related to San Jose expansion project | $ | 6,202 |
Depreciation of PP&E fair value step-up associated with the Ultratech purchase accounting |
| 310 |
Subtotal | | 6,512 |
Non-cash interest expense |
| 962 |
Release of valuation allowance on deferred tax assets | | (104,971) |
Non-GAAP tax adjustment * |
| (12,882) |
Total Other | $ | (110,379) |
* | - The ‘with or without’ method is utilized to determine the income tax effect of all Non-GAAP adjustments. |
7
Net Income per Common Share (FY 2022)
(in thousands, except per share amounts)
(unaudited)
| | Year ended December 31, 2022 | ||||
| | GAAP | | Non-GAAP | ||
Numerator: | | | | | | |
Net income |
| $ | 166,942 |
| $ | 89,575 |
Interest expense associated with convertible notes | |
| 10,832 |
|
| 9,870 |
Net income available to common shareholders | | $ | 177,774 | | $ | 99,445 |
| | | | | | |
Denominator: | | | | | | |
Basic weighted average shares outstanding | | | 49,906 | | | 49,906 |
Effect of potentially dilutive share-based awards | | | 734 | | | 734 |
Dilutive effect of 2023 Convertible Senior Notes | | | 504 | | | 504 |
Dilutive effect of 2025 Convertible Senior Notes | | | 5,521 | | | 5,521 |
Dilutive effect of 2027 Convertible Senior Notes (1) | |
| 8,942 |
|
| 6,771 |
Diluted weighted average shares outstanding | | | 65,607 | | | 63,436 |
| | | | | | |
Net income per common share: | | | | | | |
Basic | | $ | 3.35 | | $ | 1.79 |
Diluted | | $ | 2.71 | | $ | 1.57 |
(1) - The non-GAAP incremental dilutive shares includes the impact of the Company’s capped call transaction issued concurrently with our 2027 Notes, and as such, an effective conversion price of $18.46 is used when determining incremental shares to add to the dilutive share count. The GAAP incremental dilutive shares does not include the impact of the Company’s capped call transaction, and as such, an effective conversion price of $13.98 is used when determining incremental shares to add to the dilutive share count.
Reconciliation of GAAP to Non-GAAP Financial Data (FY 2021)
(in thousands, except per share amounts)
(unaudited)
| | | | | Non-GAAP Adjustments | |
| | | ||||
| | | | | Share-based | | | | | | | | |
For the year ended December 31, 2021 |
| | GAAP |
| Compensation |
| Amortization |
| Other |
| Non-GAAP | | |
Net sales | | $ | 583,277 | | | | | | | | $ | 583,277 | |
Gross profit | |
| 242,274 |
| 2,373 | | |
| 448 | |
| 245,095 | |
Gross margin | |
| 41.5 | % | | | | | | | | 42.0 | % |
Operating expenses | |
| 185,564 |
| (12,876) | | (12,280) | | (1,918) | | | 158,490 | |
Operating income (loss) | |
| 56,710 |
| 15,249 | | 12,280 |
| 2,366 | ^ | | 86,605 | |
Net income (loss) | |
| 26,038 |
| 15,249 |
| 12,280 |
| 20,082 | ^ | | 73,649 | |
| | | | | | | | | | | | | |
Income (loss) per common share: | | | | | | | | | | | | | |
Basic | | $ | 0.53 | | | | | | | | $ | 1.50 | |
Diluted | |
| 0.49 | | | | | | | | | 1.43 | |
Weighted average number of shares: | | | | | | | | | | | | | |
Basic | |
| 49,073 | | | | | | | | | 49,073 | |
Diluted | |
| 53,643 | | | | | | | | | 51,472 | |
^ | - See table below for additional details. |
8
Other Non-GAAP Adjustments (FY 2021)
(in thousands)
(unaudited)
For the year ended December 31, 2021 | | |
Transition expenses related to San Jose expansion project | $ | 2,021 |
Depreciation of PP&E fair value step-up associated with the Ultratech purchase accounting | | 345 |
Subtotal | | 2,366 |
Non-cash interest expense | | 13,819 |
Other (income) expense, net | | 5,010 |
Non-GAAP tax adjustment * |
| (1,113) |
Total Other | $ | 20,082 |
* | - The ‘with or without’ method is utilized to determine the income tax effect of all Non-GAAP adjustments. |
Reconciliation of GAAP Net Income to Non-GAAP Operating Income (FY 2022 and 2021)
(in thousands)
(unaudited)
|
| Year ended |
| Year ended | ||
| | December 31, 2022 | | December 31, 2021 | ||
GAAP Net income (loss) | | $ | 166,942 | | $ | 26,038 |
Share-based compensation | |
| 22,994 | |
| 15,249 |
Amortization | |
| 10,018 | |
| 12,280 |
Transition expenses related to San Jose expansion project | | | 6,202 | | | 2,021 |
Depreciation of PP&E fair value step-up associated with the Ultratech purchase accounting | |
| 310 | |
| 345 |
Interest (income) expense, net | |
| 9,311 | |
| 26,020 |
Other (income) expense, net | | | — | | | 5,010 |
Income tax expense (benefit) | |
| (115,957) | |
| (358) |
Non-GAAP Operating income (loss) | | $ | 99,820 | | $ | 86,605 |
Reconciliation of GAAP to Non-GAAP Financial Data (Q1 2023)
(in millions, except per share amounts)
(unaudited)
| | | | | | | | | | Non-GAAP Adjustments | | | | | | | | |
| ||||
Guidance for the three months ending | | | | | | | | | | Share-based | | | | | | | | | | | | |
|
March 31, 2023 | | GAAP | | Compensation | | Amortization | | Other | | Non-GAAP |
| ||||||||||||
Net sales |
| $ | 130 |
| - |
| $ | 150 |
| |
| |
| |
| $ | 130 |
| - |
| $ | 150 | |
Gross profit | |
| 48 |
| - | |
| 61 |
| 1 |
| — |
| — | |
| 49 |
| - | |
| 62 | |
Gross margin | |
| 37% | | - | |
| 40% | | |
| |
| | |
| 39% | | - | |
| 41% | |
Operating expenses | | | 49 |
| - | |
| 51 | | (5) | | (2) | | (1) | | | 42 |
| - | |
| 44 | |
Operating income (loss) | | | (1) | | - | | | 10 | | 6 | | 2 | | 1 | | | 8 | | - | | | 19 | |
Net income (loss) | | $ | (1) |
| - | | $ | 8 |
| 6 |
| 2 | | (1) | | $ | 6 |
| - | | $ | 15 | |
| | | | | | | | | | | | | | | | | | | | | | | |
Income (loss) per diluted common share | | $ | (0.03) |
| - | | $ | 0.16 |
|
|
|
|
|
| | $ | 0.12 |
| - | | $ | 0.28 | |
9
Income per Diluted Common Share (Q1 2023)
(in millions, except per share amounts)
(unaudited)
Guidance for the three months ending March 31, 2023 | | GAAP | | Non-GAAP | ||||||||||||
Numerator: | | | | | | | | | | | | | | | | |
Net income (loss) |
| $ | (1) |
| - |
| $ | 8 |
| $ | 6 |
| - |
| $ | 15 |
Interest expense associated with convertible notes | |
| — |
| | |
| 1 |
|
| — |
| | |
| 2 |
Net income (loss) available to common shareholders | | $ | (1) | | - | | $ | 9 | | $ | 6 | | - | | $ | 17 |
| | | | | | | | | | | | | | | | |
Denominator: | | | | | | | | | | | | | | | | |
Basic weighted average shares outstanding | | | 50 | | | | | 50 | | | 50 | | | | | 50 |
Effect of potentially dilutive share-based awards | | | 1 |
| | | | 1 | | | 1 |
| | | | 1 |
Dilutive effect of 2023 Convertible Senior Notes | | | — | | | | | — | | | — | | | | | — |
Dilutive effect of 2025 Convertible Senior Notes | | | — |
| | | | — |
| | — |
| | | | 6 |
Dilutive effect of 2027 Convertible Senior Notes (1) | |
| — | | | |
| 9 |
|
| — | | | |
| 7 |
Diluted weighted average shares outstanding | | | 51 | | | | | 60 | | | 51 | | | | | 64 |
| | | | | | | | | | | | | | | | |
Net income (loss) per common share: | | | | | | | | | | | | | | | | |
Income (loss) per diluted common share | | $ | (0.03) | | - | | $ | 0.16 | | $ | 0.12 | | - | | $ | 0.28 |
(1) - The non-GAAP incremental dilutive shares includes the impact of the Company’s capped call transaction issued concurrently with our 2027 Notes, and as such, an effective conversion price of $18.46 is used when determining incremental shares to add to the dilutive share count. The GAAP incremental dilutive shares does not include the impact of the Company’s capped call transaction, and as such, an effective conversion price of $13.98 is used when determining incremental shares to add to the dilutive share count.
Reconciliation of GAAP Net Income to Non-GAAP Operating Income (Q1 2023)
(in millions)
(unaudited)
Guidance for the three months ending March 31, 2023 |
| | |
| |
| | |
GAAP Net income (loss) | | $ | (1) |
| - | | $ | 8 |
Share-based compensation | |
| 6 |
| - | |
| 6 |
Amortization | |
| 2 |
| - | |
| 2 |
Interest expense, net | |
| 1 |
| - | |
| 1 |
Income tax expense (benefit) | | | — | | - | | | 1 |
Other | |
| — |
| - | | | 1 |
Non-GAAP Operating income | | $ | 8 |
| - | | $ | 19 |
Note: Amounts may not calculate precisely due to rounding.
10
Q4 & FY 2022 Financial Results Conference Call Copyright © 2023 Veeco Instruments Inc. All Rights Reserved. 1 Veeco (Nasdaq: VECO) February 15, 2023 Q4 & FY 2022 Financial Results Conference Call |
Q4 & FY 2022 Financial Results Conference Call Copyright © 2023 Veeco Instruments Inc. All Rights Reserved. 2 Safe Harbor This presentation contains “forward-looking statements”, within the meaning of the safe harbor provisions of the U.S. Private Securities Litigation Reform Act of 1995, as amended, that are based on management’s expectations, estimates, projections and assumptions. Words such as “expects,” “anticipates,” “plans,” “believes,” “scheduled,” “estimates” and variations of these words and similar expressions are intended to identify forward-looking statements. Forward-looking statements include, but are not limited to, those regarding anticipated growth and trends in our businesses and markets, industry outlooks and demand drivers, our investment and growth strategies, our development of new products and technologies, our business outlook for current and future periods, the impact of the COVID-19 pandemic, our ongoing transformation initiative and the effects thereof on our operations and financial results; and other statements that are not historical facts. These statements and their underlying assumptions are subject to risks and uncertainties and are not guarantees of future performance. Factors that could cause actual results to differ materially from those expressed or implied by such statements include, without limitation: the level of demand for our products; global economic and industry conditions; the effects of regional or global health epidemics, including the effects of the COVID-19 pandemic on the Company’s operations and on those of our customers and suppliers; global trade issues, including the ongoing trade disputes between the U.S. and China, and changes in trade and export license policies; our dependency on third-party suppliers and outsourcing partners; the timing of customer orders; our ability to develop, deliver and support new products and technologies; our ability to expand our current markets, increase market share and develop new markets; the concentrated nature of our customer base; our ability to obtain and protect intellectual property rights in key technologies; our ability to achieve the objectives of operational and strategic initiatives and attract, motivate and retain key employees; the variability of results among products and end-markets, and our ability to accurately forecast future results, market conditions, and customer requirements; the impact of our indebtedness, including our convertible senior notes and our capped call transactions; and other risks and uncertainties described in our SEC filings on Forms 10-K, 10-Q and 8-K, and from time-to-time in our other SEC reports. All forward-looking statements speak only to management’s expectations, estimates, projections and assumptions as of the date of this presentation. The Company does not undertake any obligation to update or publicly revise any forward-looking statements to reflect events, circumstances or changes in expectations after the date of this presentation. |
Q4 & FY 2022 Financial Results Conference Call Copyright © 2023 Veeco Instruments Inc. All Rights Reserved. 3 CEO Overview Bill Miller, Ph.D. |
Q4 & FY 2022 Financial Results Conference Call Copyright © 2023 Veeco Instruments Inc. All Rights Reserved. 4 2022 – A Year of Progress Solidly Executing Multi-Year Growth Strategy ✓ Progress in laser annealing, IBD for semi, power, photonics ✓ Robust evaluation program in place with high customer acceptance rate ✓ San Jose expansion – Completed Achieved Leveraged Growth ✓ 11% overall revenue growth for Company ✓ Non-GAAP operating income grew faster than revenue Developed Silicon Carbide Market Strategy ✓ Accelerate SiC market penetration via acquisition ✓ Long-term driver of growth and profitability Commitment to Culture and Corporate Responsibility ✓ Appointed additional female Board member ✓ Published 3rd sustainability report highlighting commitment to ESG ✓ Implemented Leadership Training Program Positioned for solid 2023 ✓ Positive book-to-bill with significant backlog growth ✓ Strengthened balance sheet with robust cash flow from operations IBD – Ion Beam Deposition SiC – Silicon Carbide ESG – Environmental, Social, Governance A reconciliation of GAAP to Non-GAAP financial measures can be found in the backup section of this presentation. |
Q4 & FY 2022 Financial Results Conference Call Copyright © 2023 Veeco Instruments Inc. All Rights Reserved. 5 FY 2022 Highlights $646M $100M $1.57 Revenue Non-GAAP Operating Income Diluted Non-GAAP EPS • 11% YoY revenue growth • Record year of semiconductor revenue • Up 50% YoY • Led by Laser Annealing • Backlog grew by $60M to $500M • $108M in CFFO • Mixed demand environment • Supply chain challenges persist Solid performance in a challenging environment A reconciliation of GAAP to Non-GAAP financial measures can be found in the backup section of this presentation. |
Q4 & FY 2022 Financial Results Conference Call Copyright © 2023 Veeco Instruments Inc. All Rights Reserved. 6 Q4 2022 Highlights $154M $24M 38¢ Revenue Non-GAAP Operating Income Diluted Non-GAAP EPS • Semiconductor momentum continues • $33M in CFFO • Mixed demand environment • Supply chain challenges persist with signs of improvement Solid quarter in a challenging environment A reconciliation of GAAP to Non-GAAP financial measures can be found in the backup section of this presentation. |
Q4 & FY 2022 Financial Results Conference Call Copyright © 2023 Veeco Instruments Inc. All Rights Reserved. 7 Veeco Acquires Epiluvac – Deal Rationale • Veeco to enter SiC market faster • Epiluvac’s team along with Veeco’s capability will fast-track product roadmap execution • Epiluvac’s system achieves high productivity, is easy to maintain and has superior process control • Veeco’s supply chain, manufacturing and go-to-market capabilities will facilitate product ramp and accelerate market penetration 2 3 1 • Veeco expects meaningful value creation resulting from expansion into the SiC epitaxy equipment market Accelerated Access to High-Growth SiC Markets Complementary Technology and Capabilities Long-Term Driver of Growth and Profitability |
Q4 & FY 2022 Financial Results Conference Call Copyright © 2023 Veeco Instruments Inc. All Rights Reserved. 8 Epiluvac Extends Veeco’s Reach into SiC Epitaxy Market ▪ Rapidly growing demand for SiC devices driven by multiple strong and stable end-markets including automotive, industrial and energy ▪ SiC device market is expected to experience significant growth translating into strong demand for SiC epitaxy equipment ▪ Large future revenue opportunity attracting significant investment from many key players in the semiconductor industry (1) Worldwide SiC device total available market estimates according to Yole Group (2) SiC epitaxy equipment total available market estimates according to Yole Group and internal estimates 2023 2027 2023 2027 ~15% CAGR ~30% CAGR SiC Epitaxy Equip. Market (2) SiC Device Market (1) ~$2B ~$6B ~$250M ~$500M |
Q4 & FY 2022 Financial Results Conference Call Copyright © 2023 Veeco Instruments Inc. All Rights Reserved. 9 Veeco Acquires Epiluvac – Transaction Overview ▪ Veeco acquired Epiluvac AB, a privately held Swedish manufacturer of Silicon Carbide (SiC) epitaxy systems ▪ Purchase price is $30 million of cash upfront from Veeco’s balance sheet ▪ Additional performance based earn-outs up to $35 million ▪ Transaction closed on January 31, 2023 ▪ Epiluvac is an early-stage revenue company with 11 employees ▪ Impact to Veeco’s Non-GAAP financial results is not expected to be material in 2023 ▪ Revenue expected in 2024 ▪ Deal is expected to be slightly accretive to Non-GAAP EPS in 2024 |
Q4 & FY 2022 Financial Results Conference Call Copyright © 2023 Veeco Instruments Inc. All Rights Reserved. 10 CFO Financial Review John Kiernan |
Q4 & FY 2022 Financial Results Conference Call Copyright © 2023 Veeco Instruments Inc. All Rights Reserved. 11 FY 2022 Revenue by Market & Region 57% 19% 13% 11% Revenue by Market Revenue by Region Scientific & Other Semiconductor Compound Semiconductor Data Storage 36% 31% 19% 14% EMEA China United States Rest of APAC $646M Revenue Trend ($M) FY 20 FY 21 FY 22 Semiconductor 166 247 369 Compound Semi 108 107 121 Data Storage 123 169 88 Scientific & Other 57 60 68 Total 454 583 646 Amounts may not calculate precisely due to rounding. ROW is negligible |
Q4 & FY 2022 Financial Results Conference Call Copyright © 2023 Veeco Instruments Inc. All Rights Reserved. 12 FY Operating Results In millions (except per share amounts) GAAP Non-GAAP FY 21 FY 22 FY 21 FY 22 Revenue $583.3 $646.1 $583.3 $646.1 Gross Profit 242.3 263.1 245.1 271.0 Gross Margin 41.5% 40.7% 42.0% 41.9% Operating Expenses 185.6 202.9 158.5 171.2 Operating Income 56.7 60.3 86.6 99.8 Net Income 26.0 166.9 73.6 89.6 Diluted Earnings Per Share $0.49 $2.71 $1.43 $1.57 Diluted Shares 53.6 65.6 51.5 63.4 Amounts may not calculate precisely due to rounding. A reconciliation of GAAP to Non-GAAP financial measures can be found in the backup section of this presentation. |
Q4 & FY 2022 Financial Results Conference Call Copyright © 2023 Veeco Instruments Inc. All Rights Reserved. 13 Q4 2022 Revenue by Market & Region 16% 61% 11% 12% Revenue by Market Revenue by Region Scientific & Other Semiconductor Compound Semiconductor Data Storage 42% 25% 19% 14% EMEA China United States Rest of APAC $154M Revenue Trend ($M) Q4 21 Q3 22 Q4 22 Semiconductor 65 100 94 Compound Semi 35 28 25 Data Storage 37 28 17 Scientific & Other 16 16 18 Total 154 172 154 Amounts may not calculate precisely due to rounding. ROW is negligible |
Q4 & FY 2022 Financial Results Conference Call Copyright © 2023 Veeco Instruments Inc. All Rights Reserved. 14 Q4 Operating Results In millions (except per share amounts) GAAP Non-GAAP Q3 22 Q4 22 Q3 22 Q4 22 Revenue $171.9 $153.8 $171.9 $153.8 Gross Profit 70.0 62.9 72.2 65.1 Gross Margin 40.7% 40.9% 42.0% 42.3% Operating Expenses 52.4 49.5 43.9 41.3 Operating Income 17.6 13.4 28.4 23.8 Net Income 15.0 128.9 26.0 21.9 Diluted Earnings Per Share $0.27 $2.00 $0.45 $0.38 Diluted Shares 65.2 65.7 63.5 63.5 Amounts may not calculate precisely due to rounding. A reconciliation of GAAP to Non-GAAP financial measures can be found in the backup section of this presentation. |
Q4 & FY 2022 Financial Results Conference Call Copyright © 2023 Veeco Instruments Inc. All Rights Reserved. 15 Balance Sheet and Cash Flow Highlights $ millions Q4 21 Q3 22 Q4 22 Cash & Short-Term Investments 225 272 303 Accounts Receivable 110 143 124 Inventories 171 188 207 Accounts Payable 44 51 52 Long-Term Debt Including Current Portion 229 274 275 Cash Flow from Operations 17 47 33 DSO (days) 64 75 73 DIO 173 161 196 DPO 46 46 52 Capital Expenditures 9 6 3 Amounts may not calculate precisely due to rounding. A reconciliation of GAAP to Non-GAAP financial measures can be found in the backup section of this presentation. |
Q4 & FY 2022 Financial Results Conference Call Copyright © 2023 Veeco Instruments Inc. All Rights Reserved. 16 Q1 2023 Guidance GAAP Non-GAAP Revenue $130M - $150M $130M - $150M Gross Margin 37% - 40% 39% - 41% Operating Expenses $49M - $51M $42M - $44M Net Income / (Loss) $(1M) - $8M $6M - $15M Diluted Earnings / (Loss) Per Share $(0.03) – $0.16 $0.12 - $0.28 A reconciliation of GAAP to Non-GAAP financial measures can be found in the backup section of this presentation. |
Q4 & FY 2022 Financial Results Conference Call Copyright © 2023 Veeco Instruments Inc. All Rights Reserved. 17 Market Update Bill Miller, Ph.D. |
Q4 & FY 2022 Financial Results Conference Call Copyright © 2023 Veeco Instruments Inc. All Rights Reserved. 18 Mobility and Immersive User Experience Connecting people on the move with technologies such as 5G, sensors, advanced displays The Cloud High speed communication and storage of enormous amounts of data Differentiated Technologies Aligned with Megatrends Compound Semiconductor Semiconductor Megatrends Growth Markets Core Technologies Laser Annealing AP Lithography Ion Beam Wet Processing MOCVD Transformation of the Automotive Industry Electrification and autonomous advancements High Performance Computing/AI Faster and more efficient computing to enable large scale data center applications and artificial intelligence Data Storage Ion Beam Deposition Ion Beam Etch AI – Artificial Intelligence 5G – Fifth generation wireless technology CVD – Chemical Vapor Deposition AP – Advanced Packaging MOCVD – Metal Organic Chemical Vapor Deposition SiC CVD |
Q4 & FY 2022 Financial Results Conference Call Copyright © 2023 Veeco Instruments Inc. All Rights Reserved. 19 2023 Priorities – Executing Our Growth Strategy Protect ▪ Product Development ▪ Advance evaluation program ▪ SiC market penetration ▪ Safety ▪ Culture ▪ Outperform WFE in Semiconductor revenue ▪ Revenue growth in Data Storage ▪ Maintain profitability ▪ Supply chain ▪ Customer satisfaction Growth & Profitability Committed to our strategy through a challenging macro environment Execute Innovate & Invest Strategy Execution |
Q4 & FY 2022 Financial Results Conference Call Copyright © 2023 Veeco Instruments Inc. All Rights Reserved. 20 Thank You Q&A |
Q4 & FY 2022 Financial Results Conference Call Copyright © 2023 Veeco Instruments Inc. All Rights Reserved. 21 Backup and Financial Tables |
Q4 & FY 2022 Financial Results Conference Call Copyright © 2023 Veeco Instruments Inc. All Rights Reserved. 22 Historical Revenue by End-Market $M 2019 2020 2021 2022 FY Q1 Q2 Q3 Q4 FY Q1 Q2 Q3 Q4 FY Q1 Q2 Q3 Q4 FY Semiconductor 175.6 37.4 37.5 33.6 57.4 165.9 51.6 53.7 76.3 65.4 247.1 77.6 97.5 100.4 93.8 369.4 Compound Semi 85.9 18.4 17.8 26.6 45.2 107.9 24.8 24.2 23.3 34.7 107.0 37.1 31.1 28.1 24.9 121.2 Data Storage 84.1 38.9 28.3 36.9 19.2 123.3 41.0 52.0 39.3 36.5 168.8 21.6 21.5 27.7 16.7 87.5 Scientific & Other 73.8 9.8 15.1 15.0 17.1 57.0 16.4 16.4 11.4 16.3 60.5 20.1 13.8 15.7 18.4 68.0 Total 419.3 104.5 98.6 112.1 138.9 454.2 133.7 146.3 150.2 153.0 583.3 156.4 164.0 171.9 153.8 646.1 Amounts may not calculate precisely due to rounding. |
Q4 & FY 2022 Financial Results Conference Call Copyright © 2023 Veeco Instruments Inc. All Rights Reserved. 23 Convertible Notes as of December 31, 2022 (1) Conversion price for 2027 Convertible Notes includes the effect of the Capped Call transaction (2) Weighted average (3) Reflects the adoption of ASU 2020-06, effective January 1, 2022 (4) In January 2023, our $20.2 million dollars of outstanding 2.70% convertible senior notes matured and were fully settled by payment in cash. Amounts may not calculate precisely due to rounding. Convertible Debt Principal Amount Carrying Value Coupon Annual Cash Interest Annual Non-Cash Interest3 Initial Conversion Price Convertible Notes Due Jan 2023 $20M $20M 2.7% $0.5M $0.1M $40.03 Convertible Notes Due Jan 2025 $133M $131M 3.5% $4.6M $0.5M $24.00 Convertible Notes Due June 2027 $125M $123M 3.75% $4.7M $0.4M $18.461 Total Convertible Debt $278M $274M 3.6%2 $9.8M $0.9M Total Convertible Debt as of January 15, 20234 $258M $254M 3.6%2 $9.3M $0.9M |
Q4 & FY 2022 Financial Results Conference Call Copyright © 2023 Veeco Instruments Inc. All Rights Reserved. 24 Note on Reconciliation Tables These tables include financial measures adjusted for the impact of certain items; these financial measures are therefore not calculated in accordance with U.S. generally accepted accounting principles (“GAAP”). These Non-GAAP financial measures exclude items such as: share-based compensation expense; charges relating to restructuring initiatives; non-cash asset impairments; certain other non-operating gains and losses; and acquisition-related items such as transaction costs, non-cash amortization of acquired intangible assets, incremental transaction-related compensation, and certain integration costs. These Non-GAAP financial measures may be different from Non-GAAP financial measures used by other companies. Non-GAAP financial measures should not be considered a substitute for, or superior to, measures of financial performance prepared in accordance with GAAP. By excluding these items, Non-GAAP financial measures are intended to facilitate meaningful comparisons to historical operating results, competitors' operating results, and estimates made by securities analysts. Management is evaluated on key performance metrics including Non-GAAP Operating Income, which is used to determine management incentive compensation as well as to forecast future periods. These Non-GAAP financial measures may be useful to investors in allowing for greater transparency of supplemental information used by management in its financial and operational decision-making. In addition, similar Non-GAAP financial measures have historically been reported to investors; the inclusion of comparable numbers provides consistency in financial reporting. Investors are encouraged to review the reconciliation of the Non-GAAP financial measures used in this news release to their most directly comparable GAAP financial measures. |
Q4 & FY 2022 Financial Results Conference Call Copyright © 2023 Veeco Instruments Inc. All Rights Reserved. 25 Supplemental Information—GAAP to Non-GAAP Reconciliation Amounts may not calculate precisely due to rounding. In millions Q3 22 Q4 22 2022 2021 Net sales $171.9 $153.8 $646.1 583.3 GAAP gross profit 70.0 62.9 263.1 242.3 GAAP gross margin 40.7% 40.9% 40.7% 41.5% Add: Share-based comp 1.2 1.2 4.6 2.4 Add: Other 1.1 1.0 3.3 0.4 Non-GAAP gross profit $72.2 $65.1 $271.0 $245.1 Non-GAAP gross margin 42.0% 42.3% 41.9% 42.0% In millions Q3 22 Q4 22 2022 2021 GAAP Net income $15.0 $128.9 $166.9 $26.0 Add: Share-based comp 6.2 6.0 23.0 15.2 Add: Amortization 2.5 2.5 10.0 12.3 Add: Transition expenses related to San Jose expansion project 1.9 1.8 6.2 2.0 Add: Depreciation of PP&E fair value step-up for purchase accounting 0.1 - 0.3 0.3 Add: Interest expense 2.3 1.6 9.3 26.0 Add: Other (income) expense, net 0.2 - - 5.0 Add: Tax expense (benefit) 0.2 (117.1) (116.0) (0.4) Non-GAAP operating income $28.4 $23.8 $99.8 $86.6 In millions, except per share amounts Q3 22 Q4 22 2022 2021 GAAP Basic weighted average shares 49.9 49.9 49.9 49.1 GAAP Diluted weighted average shares 65.2 65.7 65.6 53.6 GAAP Basic EPS $0.30 $2.58 $3.35 $0.53 GAAP Diluted EPS $0.27 $2.00 $2.71 $0.49 GAAP Net income $15.0 $128.9 $166.9 $26.0 Add: Share-based comp 6.2 6.0 23.0 15.2 Add: Amortization 2.5 2.5 10.0 12.3 Add: Transition expenses related to San Jose expansion project 1.9 1.8 6.2 2.0 Add: Depreciation of PP&E fair value step-up for purchase accounting 0.1 - 0.3 0.3 Add: Non-cash interest expense 0.2 0.2 0.9 13.8 Add: Other (income) expense, net - - - 5.0 Add: Release of valuation allowance on DTA - (105.0) (105.0) - Add: Tax adjustment from GAAP to Non-GAAP (0.1) (12.7) (12.9) (1.1) Non-GAAP net income $26.0 21.9 89.6 $73.6 Non-GAAP basic EPS $0.52 $0.44 $1.79 $1.50 Non-GAAP diluted EPS $0.45 $0.38 $1.57 $1.43 Non-GAAP basic weighted average shares 49.9 49.9 49.9 49.1 Non-GAAP diluted weighted average shares 63.5 63.5 63.4 51.5 In millions Q3 22 Q4 22 2022 2021 GAAP operating expenses 51.4 $49.5 $202.9 $185.6 Share-based compensation (5.0) (4.9) (18.4) (12.9) Amortization (2.5) (2.5) (10.0) (12.3) Other (1.0) (0.8) (3.2) (1.9) Non-GAAP operating expenses 43.9 $41.3 $171.2 $158.5 |
Q4 & FY 2022 Financial Results Conference Call Copyright © 2023 Veeco Instruments Inc. All Rights Reserved. 26 Non-GAAP Adjustments GAAP Share-Based Compensation Amortization Other Non-GAAP Net Sales $153.8 $153.8 Gross Profit 62.9 1.2 — 1.0 65.1 Gross Margin 40.9% 42.3% Operating Expenses $49.5 (4.9) (2.5) (0.8) $41.3 Operating Income $13.4 6.0 2.5 1.8 $23.8 Net Income $128.9 6.0 2.5 (115.6) $21.9 Q4 2022 Actual: GAAP to Non-GAAP Reconciliation Amounts may not calculate precisely due to rounding. Income per Diluted Common Share GAAP Non-GAAP Net Income $128.9 $21.9 Add: Interest on Convertible Senior Notes 2.7 2.5 Net income available to common shareholders 131.6 24.4 Basic weighted average common shares 49.9 49.9 Add: Dilutive effect of share-based awards 0.8 0.8 Add: Dilutive effect of 2023 Convertible Senior Notes 0.5 0.5 Add: Dilutive effect of 2025 Convertible Senior Notes 5.5 5.5 Add: Dilutive effect of 2027 Convertible Senior Notes 8.9 6.8 Diluted weighted average common shares 65.7 63.5 Basic income per common share $2.58 $0.44 Diluted income per common share $2.00 $0.38 Other Non-GAAP Adjustments Transition expenses related to San Jose expansion project $1.8 Subtotal 1.8 Non-cash Interest Expense 0.2 Release of valuation allowance on deferred tax assets (105.0) Non-GAAP tax adjustment (12.7) Total Other $(115.6) |
Q4 & FY 2022 Financial Results Conference Call Copyright © 2023 Veeco Instruments Inc. All Rights Reserved. 27 FY 2022 Actual: GAAP to Non-GAAP Reconciliation Amounts may not calculate precisely due to rounding. Income per Diluted Common Share GAAP Non-GAAP Net Income $166.9 $89.6 Add: Interest on Convertible Senior Notes 10.8 9.8 Net income available to common shareholders 177.8 99.4 Basic weighted average common shares 49.9 49.9 Add: Dilutive effect of share-based awards 0.7 0.7 Add: Dilutive effect of 2023 Convertible Senior Notes 0.5 0.5 Add: Dilutive effect of 2025 Convertible Senior Notes 5.5 5.5 Add: Dilutive effect of 2027 Convertible Senior Notes 8.9 6.8 Diluted weighted average common shares 65.6 63.4 Basic income per common share $3.35 $1.79 Diluted income per common share $2.71 $1.57 Other Non-GAAP Adjustments Transition expenses related to San Jose expansion project $6.2 Depreciation of PPE fair value step-up associated with the Ultratech purchase accounting 0.3 Subtotal 6.5 Non-cash Interest Expense 0..9 Release of valuation allowance on deferred tax assets (105.0) Non-GAAP tax adjustment (12.9) Total Other $110.4 Non-GAAP Adjustments GAAP Share-Based Compensation Amortization Other Non-GAAP Net Sales $646.1 $646.1 Gross Profit 263.1 4.6 — 3.3 271.0 Gross Margin 40.7% 41.9% Operating Expenses $202.9 (18.4) (10.0) (3.2) $171.2 Operating Income $60.3 23.0 10.0 6.5 $99.8 Net Income $166.9 23.0 10.0 (110.4) $89.6 |
Q4 & FY 2022 Financial Results Conference Call Copyright © 2023 Veeco Instruments Inc. All Rights Reserved. 28 Reconciliation of GAAP to non-GAAP Financial Data Non-GAAP Adjustments GAAP Share-Based Compensation Amortization Other Non-GAAP Net Sales $130–$150 $130–$150 Gross Profit 48–61 1 — — 49–62 Gross Margin 37%–40% 39%–41% Operating Expenses $49–$51 (5) (2) (1) $42–$44 Operating Income $(1)–$10 6 2 1 $8–$19 Net Income $(1)–$8 6 2 (1) $6–$15 Income per Diluted Share $(0.03)–$0.16 $0.12–$0.28 Q1 2023 Guidance (in millions, except per share amounts) Amounts may not calculate precisely due to rounding. Income per Diluted Common Share GAAP Non-GAAP Net Income $(1)–$8 $6–$15 Add: Interest on Convertible Senior Notes 0-1 0-2 Net income available to common shareholders (1)-9 6-17 Basic weighted average common shares 50 50 Add: Dilutive effect of share-based awards 1 1 Add: Dilutive effect of 2023 Convertible Senior Notes - - Add: Dilutive effect of 2025 Convertible Senior Notes - 0-6 Add: Dilutive effect of 2027 Convertible Senior Notes 0-9 0-7 Diluted weighted average common shares 51-60 51-64 Income per diluted common share $(0.03)-$0.16 $0.12-$0.28 Reconciliation of GAAP Net Income to non-GAAP Operating Income GAAP Net Income $(1)–$8 Share-Based Compensation 6 Amortization 2 Interest Expense, Net 1 Income tax expense (benefit) 0-1 Other 0–1 Non-GAAP Operating Income $8–$19 |
E=KA2/NFN9U#3AI]V)"A:V8Y
M''3VKEP\DFXL\'*:\8MTI==44;B42S%U7:..*?/>O-MRH7;^M1SNCSED7"]A
M3[NY%SMVIMVUV]CZAO=W+*WDDEN$(VIZXJ:RFN[9EEM7:-HV#AU."I'((]ZI
M-
O'>JY+$$8XJ5%W G\CZTW)Y_NTDA_,@/RJ1@'WQ3 PY!&:F89RH( ZDFHB
MO!V_,2<"J$]$-#=CVILGR\DX[T_!(.1]#3&X^\*3&M3USPE)>SV.DPVLMPAD
MA^80MC<0QQ5B7Q!J=O=3QRW3231L8V,A)P/3!JK\)_BOHO@ZR\O4;*22Y0;8
MY%P5 ))YJ:_U[P_K^J75]]O56G; ^.M1V\1FE8JVT=>.M!*Z!(GV:X^7YL<@4MS,\I&]"GM2
M.#;W'7>0<_6J^J:GNPBC#CJ3VHCJ'D2:C/;PVX";3)VQU_&L^))WA9A)P>WK
M2W4$20!PV6/OUIL(G6W)7_5X_&MDDD:K1BVESY!8;2^?[M%%E=)!N#CKSD44
MBD]-SQK66#[5!Y S6,!A6+ [NV*O:E,OVF7)R%X%5(;L!2'0'T(KY=*RLC]T
MDR*.8HC#&2?TJ:":;& 0012HT9W '/J.E.A0[LQD<]>*D$PDE 5MW0#IFB&
M.*4$DC)Z"JMS;M(\ASA1V]:=$43JISV(H&37$RVEN8E'S2?H*=IEF]S*J*,#
M^+VJ$1F?S'4EFQW%=)H>G?9;9I'.)'&<5E(KH:$*(B+'C:L?IWJ"]E>39;Q\
MF3[Q]!5G N*()VBC8 #:>_I2<4UL7[6:M[STV+MGJ=V]
ME]@#0#$>9;QNZ9Z[7*EE_ BIK#Q+JFD7;-#?RP%K5[!V0_>@8$-&?]D@FL
MRWB>1_W9P0.3G%.6,&8*[8YP2:32U5A*I-6:;N:R>)M0T^R^PVURAM0'V+)"
MDAB+C#&-F!,9( R5(S4$_B&ZETV.Q986@12JEX(V=1DG"N5W*,DG@]SZU1G1
M8WPIR,4ZYN$F5 $P1UI**[%>UJ.ZYO(%AE-L6S^[],TMK%$ZL9&Y]":13,L&
M.?*Z=*=;6R3*Q9MN*9FMQD+^3)N W#I1(QGGX&"3@"EMY!!+N(W#I0[&:X)0
M;23P!Q30=$+<0-$1O;=D5),86@ 4?-]*9.LBN/-.X]C4LZ0B)2ARU2&U[#(S
M.L#;!^[]:6TACE+&0].@SBA)I%@*A?DZ9QTI;2W6 K5VXC(R"3G'2H@H9T7(#9X'
M>L+&J>A9EQ&BHORLW&0:V-%@"H9&FZC( UH[;@IR,X]J]=^&'Q7\#^*OBM?Z'/X
M5L=)U>&>06MY(H/G2!N?H:\4_:EU7Q8_Q2A@\0A%LH'4V)B&$,>[K]?6A+J3
M%N3L==^U5\-?#7@[X>^&M1T728+&]NI8Q(\0QNRF:\Q_9F^'NC?$SX@OI.N1
M236;6K2@1N5.>*]__:LTJ[\2_ [PU>Z;"]VENT,[^6NXA-F,\=J\D_8JL;H?
M%[S1%*($LY-S[#@9(XS^='+J-2LFF07?P.T>Z_:*G\"6\]Q9Z6>8WW;W'RY'
M6J'[0'[/LGP8?3[JVNY=1TJZRIFD0 QR>AQZUZAJEPD7[;-JR-E7*@D?[M>M
M>/SI_P 8)O&'PWO0L6IP6ZW5DY[D@X;Z@@?G3Y0Y^4^ ?#^@7WBO6;72M,@:
MYO;IMD<:]S5OQI\-_$OP[N$C\0:7/I_G$B,R