EXHIBIT 99.1
|
|
NEWS
|
|
VEECO REPORTS SECOND QUARTER 2016 FINANCIAL RESULTS
Second Quarter 2016 Results Summary:
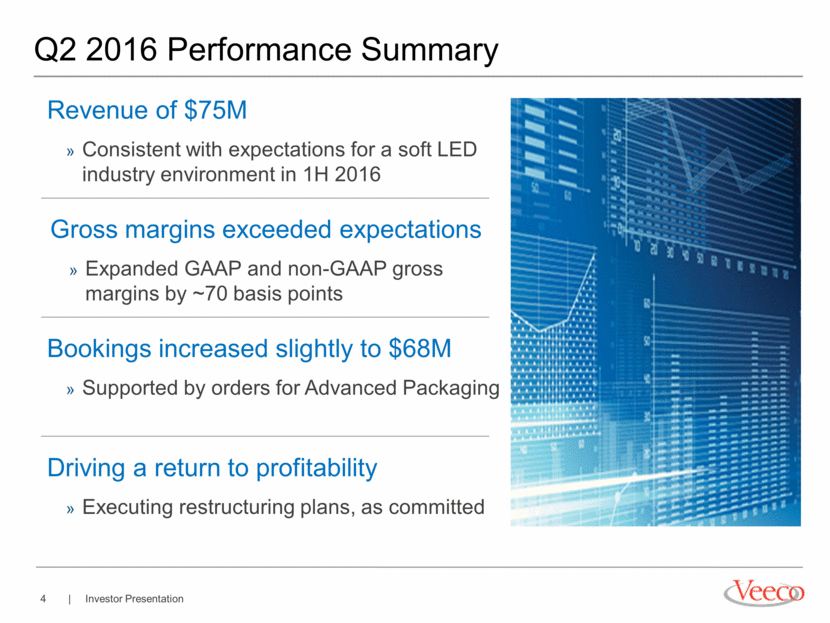
· Revenues of $75.3 million
· GAAP net loss per share of $0.82, includes a pre-tax charge of ~$16 million associated with the restructuring plans
· Non-GAAP net loss per share of $0.19
· Non-GAAP adjusted EBITDA of negative $2.8 million
Plainview, N.Y., August 1, 2016 — Veeco Instruments Inc. (Nasdaq: VECO) today announced financial results for its second fiscal quarter ended June 30, 2016. Results are reported in accordance with U.S. generally accepted accounting principles (“GAAP”) and are also reported adjusting for certain items (“Non-GAAP”). A reconciliation between GAAP and Non-GAAP operating results is provided at the end of this press release.
|
U.S. dollars in millions, except per share data | |||||||
|
|
|
|
|
|
| ||
|
GAAP Results |
|
Q2 ‘16 |
|
Q2 ‘15 |
| ||
|
Revenue |
|
$ |
75.3 |
|
$ |
131.4 |
|
|
Net income (loss) |
|
$ |
(32.1 |
) |
$ |
(8.4 |
) |
|
Diluted earnings (loss) per share |
|
$ |
(0.82 |
) |
$ |
(0.21 |
) |
|
Non-GAAP Results |
|
Q2 ‘16 |
|
Q2 ‘15 |
| ||
|
Net income (loss) |
|
$ |
(7.6 |
) |
$ |
8.4 |
|
|
Adjusted EBITDA |
|
$ |
(2.8 |
) |
$ |
12.8 |
|
|
Diluted earnings (loss) per share |
|
$ |
(0.19 |
) |
$ |
0.20 |
|
“Veeco closed out a difficult first half of 2016 delivering second quarter results which were in line with our expectations and underscore our focus on operational execution,” commented John R. Peeler, Chairman and Chief Executive Officer.
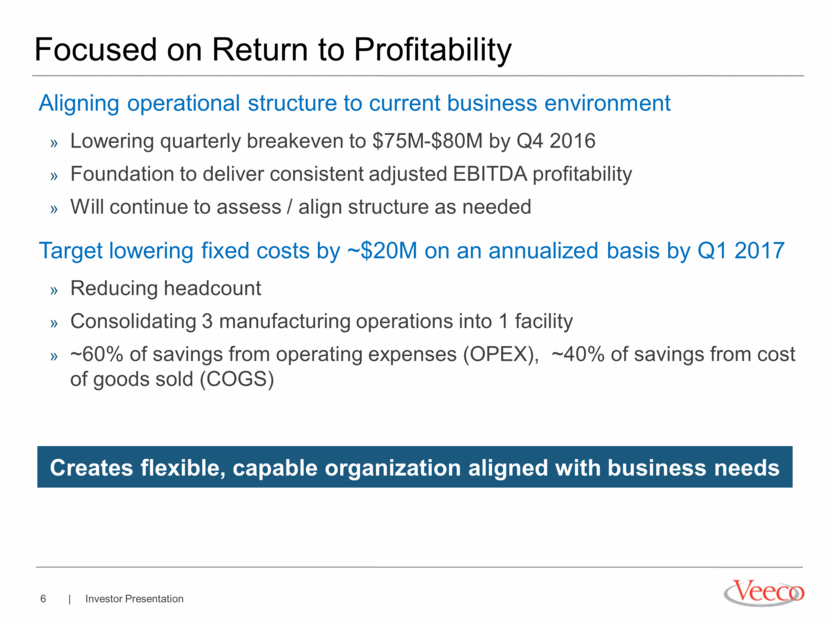
“As previously communicated, we have taken decisive steps aimed at improving our through-cycle profitability by reducing fixed costs and streamlining our operations. This plan will enable us to lower our quarterly adjusted EBITDA breakeven level to between $75 and $80 million in revenue, without compromising our ability to capitalize on growth opportunities. Looking ahead, we see positive indications that should lead to a pick-up in demand for our Metal Organic Chemical Vapor Deposition (“MOCVD”) equipment over the near term,” Mr. Peeler concluded.
The restructuring plan involves the consolidation of three manufacturing operations and streamlining of field and administrative functions. The plan is expected to be substantially completed by the end of 2016 and to result in annualized savings of approximately $20 million starting in the first quarter of 2017. As a result of these actions, the company recorded a pre-tax charge of approximately $16 million in the second quarter.
Guidance and Outlook
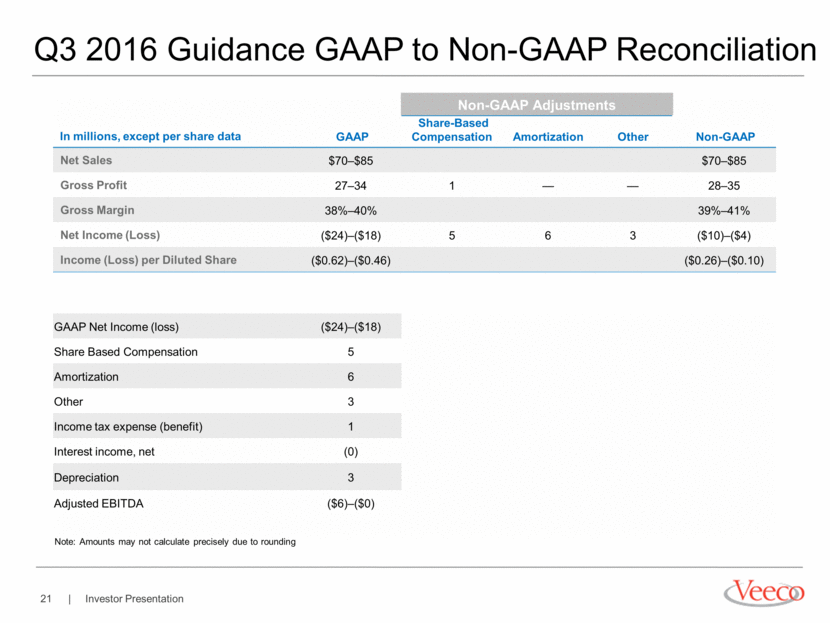
The following guidance is provided for Veeco’s third quarter 2016:
· Revenue is expected to be in the range of $70 million to $85 million
· GAAP Net Income (loss) is expected to be in the range of ($24) million to ($18) million and earnings (loss) per share is expected to be in the range of ($0.62) to ($0.46)
· Non-GAAP Net Income (loss) is expected to be in the range of ($10) million to ($4) million and earnings (loss) per share is expected to be in the range of ($0.26) to ($0.10)
· Adjusted EBITDA (loss) is expected to be in the range of ($6) million to breakeven
Please refer to the tables at the end of this press release for further details.
Conference Call Information
A conference call reviewing these results has been scheduled for today, August 1, 2016 starting at 5:00pm ET. To join the call, dial 1-888-455-2296 (toll free) or 1-719-325-2454 and use passcode 7244577. The call will also be webcast live on the Veeco website at ir.veeco.com. A replay of the webcast will be made available on the Veeco website beginning at 8:00pm ET this evening. We will post an accompanying slide presentation to our website prior to the beginning of the call.
About Veeco
Veeco’s process equipment solutions enable the manufacture of LEDs, displays, power electronics, compound semiconductors, hard disk drives, semiconductors, MEMS and wireless chips. We are the leader in MOCVD, MBE, Ion Beam, Wet Etch single wafer processing and other advanced thin film process technologies. Our high performance systems drive innovation in energy efficiency, consumer electronics and network storage and allow our customers to maximize productivity and achieve lower cost of ownership. For information on our company, products and worldwide service and support, please visit www.veeco.com.
To the extent that this news release discusses expectations or otherwise makes statements about the future, such statements are forward-looking and are subject to a number of risks and uncertainties that could cause actual results to differ materially from the statements made. These factors include the risks discussed in the Business Description and Management’s Discussion and Analysis sections of Veeco’s Annual Report on Form 10-K for the year ended December 31, 2015 and in our subsequent quarterly reports on Form 10-Q, current reports on Form 8-K and press releases. Veeco does not undertake any obligation to update any forward-looking statements to reflect future events or circumstances after the date of such statements.
-financial tables attached-
|
Veeco Contacts: |
|
|
|
|
|
Investors: |
Media: |
|
Shanye Hudson 516-677-0200 x1272 |
Jeffrey Pina 516-677-0200 x1222 |
|
shudson@veeco.com |
jpina@veeco.com |
Veeco Instruments Inc. and Subsidiaries
Condensed Consolidated Statements of Operations
(in thousands, except per share amounts)
(unaudited)
|
|
|
Three months ended June 30, |
|
Six months ended June 30, |
| ||||||||
|
|
|
2016 |
|
2015 |
|
2016 |
|
2015 |
| ||||
|
Net sales |
|
$ |
75,348 |
|
$ |
131,410 |
|
$ |
153,359 |
|
$ |
229,751 |
|
|
Cost of sales |
|
43,909 |
|
82,341 |
|
89,964 |
|
145,545 |
| ||||
|
Gross profit |
|
31,439 |
|
49,069 |
|
63,395 |
|
84,206 |
| ||||
|
Operating expenses, net: |
|
|
|
|
|
|
|
|
| ||||
|
Selling, general, and administrative |
|
19,995 |
|
24,365 |
|
39,834 |
|
47,247 |
| ||||
|
Research and development |
|
21,543 |
|
20,119 |
|
43,653 |
|
38,704 |
| ||||
|
Amortization |
|
5,273 |
|
7,979 |
|
10,524 |
|
15,941 |
| ||||
|
Restructuring |
|
2,095 |
|
683 |
|
2,195 |
|
3,040 |
| ||||
|
Asset impairment |
|
13,627 |
|
— |
|
13,627 |
|
126 |
| ||||
|
Other, net |
|
159 |
|
(51 |
) |
88 |
|
(1,002 |
) | ||||
|
Total operating expenses, net |
|
62,692 |
|
53,095 |
|
109,921 |
|
104,056 |
| ||||
|
Operating income (loss) |
|
(31,253 |
) |
(4,026 |
) |
(46,526 |
) |
(19,850 |
) | ||||
|
Interest income, net |
|
185 |
|
119 |
|
453 |
|
280 |
| ||||
|
Income (loss) before income taxes |
|
(31,068 |
) |
(3,907 |
) |
(46,073 |
) |
(19,570 |
) | ||||
|
Income tax expense (benefit) |
|
1,014 |
|
4,479 |
|
1,542 |
|
7,926 |
| ||||
|
Net income (loss) |
|
$ |
(32,082 |
) |
$ |
(8,386 |
) |
$ |
(47,615 |
) |
$ |
(27,496 |
) |
|
|
|
|
|
|
|
|
|
|
| ||||
|
Income (loss) per common share: |
|
|
|
|
|
|
|
|
| ||||
|
Basic |
|
$ |
(0.82 |
) |
$ |
(0.21 |
) |
$ |
(1.22 |
) |
$ |
(0.69 |
) |
|
Diluted |
|
$ |
(0.82 |
) |
$ |
(0.21 |
) |
$ |
(1.22 |
) |
$ |
(0.69 |
) |
|
|
|
|
|
|
|
|
|
|
| ||||
|
Weighted average number of shares: |
|
|
|
|
|
|
|
|
| ||||
|
Basic |
|
38,965 |
|
39,693 |
|
39,035 |
|
39,666 |
| ||||
|
Diluted |
|
38,965 |
|
39,693 |
|
39,035 |
|
39,666 |
| ||||
Veeco Instruments Inc. and Subsidiaries
Condensed Consolidated Balance Sheets
(in thousands)
|
|
|
June 30, 2016 |
|
December 31, 2015 |
| ||
|
|
|
(unaudited) |
|
|
| ||
|
Assets |
|
|
|
|
| ||
|
Current assets: |
|
|
|
|
| ||
|
Cash and cash equivalents |
|
$ |
257,641 |
|
$ |
269,232 |
|
|
Short-term investments |
|
73,211 |
|
116,050 |
| ||
|
Accounts receivable, net |
|
41,695 |
|
49,524 |
| ||
|
Inventories |
|
90,771 |
|
77,469 |
| ||
|
Deferred cost of sales |
|
2,590 |
|
2,100 |
| ||
|
Prepaid expenses and other current assets |
|
20,356 |
|
22,760 |
| ||
|
Assets held for sale |
|
11,177 |
|
5,000 |
| ||
|
Total current assets |
|
497,441 |
|
542,135 |
| ||
|
Property, plant and equipment, net |
|
62,981 |
|
79,590 |
| ||
|
Intangible assets, net |
|
121,380 |
|
131,674 |
| ||
|
Goodwill |
|
114,908 |
|
114,908 |
| ||
|
Deferred income taxes |
|
1,384 |
|
1,384 |
| ||
|
Other assets |
|
21,056 |
|
21,098 |
| ||
|
Total assets |
|
$ |
819,150 |
|
$ |
890,789 |
|
|
|
|
|
|
|
| ||
|
Liabilities and stockholders’ equity |
|
|
|
|
| ||
|
Current liabilities: |
|
|
|
|
| ||
|
Accounts payable |
|
$ |
34,883 |
|
$ |
30,074 |
|
|
Accrued expenses and other current liabilities |
|
35,113 |
|
49,393 |
| ||
|
Customer deposits and deferred revenue |
|
65,753 |
|
76,216 |
| ||
|
Income taxes payable |
|
654 |
|
6,208 |
| ||
|
Current portion of long-term debt |
|
354 |
|
340 |
| ||
|
Total current liabilities |
|
136,757 |
|
162,231 |
| ||
|
Deferred income taxes |
|
13,014 |
|
11,211 |
| ||
|
Long-term debt |
|
1,013 |
|
1,193 |
| ||
|
Other liabilities |
|
6,141 |
|
1,539 |
| ||
|
Total liabilities |
|
156,925 |
|
176,174 |
| ||
|
|
|
|
|
|
| ||
|
Total stockholders’ equity |
|
662,225 |
|
714,615 |
| ||
|
|
|
|
|
|
| ||
|
Total liabilities and stockholders’ equity |
|
$ |
819,150 |
|
$ |
890,789 |
|
Veeco Instruments Inc. and Subsidiaries
Reconciliation of GAAP to Non-GAAP Financial Data
(in thousands, except per share amounts)
(unaudited)
|
|
|
|
|
Non-GAAP Adjustments |
|
|
| ||||||
|
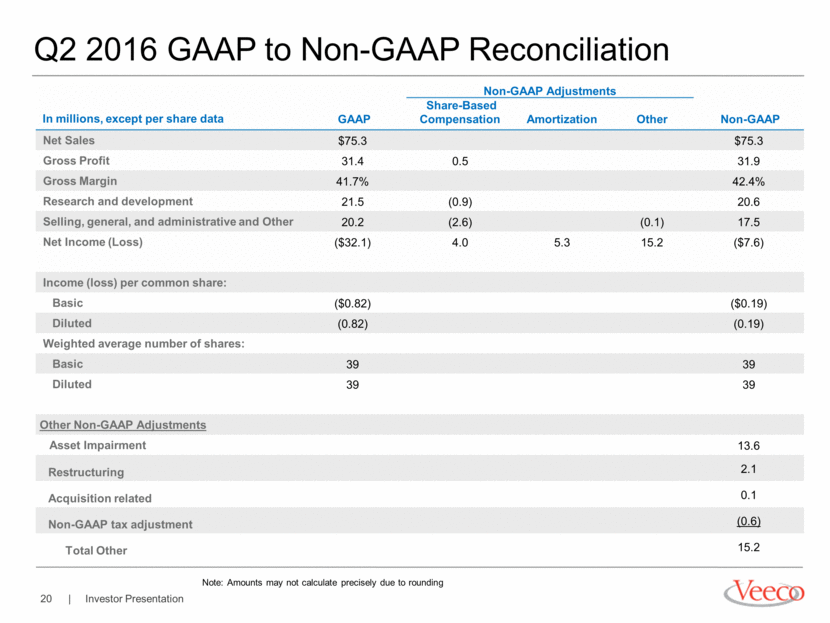
Three months ended June 30, 2016 |
|
GAAP |
|
Share-based |
|
Amortization |
|
Other |
|
Non-GAAP |
| ||
|
Net sales |
|
$ |
75,348 |
|
|
|
|
|
|
|
$ |
75,348 |
|
|
Gross profit |
|
31,439 |
|
486 |
|
|
|
|
|
31,925 |
| ||
|
Gross margin |
|
41.7 |
% |
|
|
|
|
|
|
42.4 |
% | ||
|
Selling, general, and administrative and Other |
|
20,154 |
|
(2,576 |
) |
|
|
(62 |
) |
17,516 |
| ||
|
Research and development |
|
21,543 |
|
(940 |
) |
|
|
|
|
20,603 |
| ||
|
Net income (loss) |
|
(32,082 |
) |
4,002 |
|
5,273 |
|
15,222 |
|
(7,585 |
) | ||
|
|
|
|
|
|
|
|
|
|
|
|
| ||
|
Income (loss) per common share: |
|
|
|
|
|
|
|
|
|
|
| ||
|
Basic |
|
$ |
(0.82 |
) |
|
|
|
|
|
|
$ |
(0.19 |
) |
|
Diluted |
|
(0.82 |
) |
|
|
|
|
|
|
(0.19 |
) | ||
|
Weighted average number of shares: |
|
|
|
|
|
|
|
|
|
|
| ||
|
Basic |
|
38,965 |
|
|
|
|
|
|
|
38,965 |
| ||
|
Diluted |
|
38,965 |
|
|
|
|
|
|
|
38,965 |
| ||
Veeco Instruments Inc. and Subsidiaries
Other Non-GAAP Adjustments
(in thousands)
(unaudited)
|
Three months ended June 30, 2016 |
|
|
|
|
Asset impairment |
|
13,627 |
|
|
Restructuring |
|
2,095 |
|
|
Acquisition related |
|
62 |
|
|
Non-GAAP tax adjustment * |
|
(562 |
) |
|
Total Other |
|
15,222 |
|
* - The ‘with or without’ method is utilized to determine the income tax effect of all non-GAAP adjustments.
These table includes financial measures adjusted for the impact of certain items; these financial measures are therefore not calculated in accordance with U.S. generally accepted accounting principles (“GAAP”). These Non-GAAP financial measures exclude items such as: share-based compensation expense; charges relating to restructuring initiatives; non-cash asset impairments; certain other non-operating gains and losses; and acquisition-related items such as transaction costs, non-cash amortization of acquired intangible assets, and incremental transaction-related compensation.
These Non-GAAP financial measures may be different from Non-GAAP financial measures used by other companies. Non-GAAP financial measures should not be considered a substitute for, or superior to, measures of financial performance prepared in accordance with GAAP. By excluding these items, Non-GAAP financial measures are intended to facilitate meaningful comparisons to historical operating results, competitors’ operating results, and estimates made by securities analysts. Management is evaluated on key performance metrics including adjusted EBITDA, which is used to determine management incentive compensation as well as to forecast future periods. These Non-GAAP financial measures may be useful to investors in allowing for greater transparency of supplemental information used by management in its financial and operational decision-making. In addition, similar Non-GAAP financial measures have historically been reported to investors; the inclusion of comparable numbers provides consistency in financial reporting. Investors are encouraged to review the reconciliation of the Non-GAAP financial measures used in this news release to their most directly comparable GAAP financial measures.
Veeco Instruments Inc. and Subsidiaries
Reconciliation of GAAP to Non-GAAP Financial Data
(in thousands, except per share amounts)
(unaudited)
|
|
|
|
|
Non-GAAP Adjustments |
|
|
| ||||||
|
Three months ended June 30, 2015 |
|
GAAP |
|
Share-based |
|
Amortization |
|
Other |
|
Non-GAAP |
| ||
|
Net sales |
|
$ |
131,410 |
|
|
|
|
|
|
|
$ |
131,410 |
|
|
Gross profit |
|
49,069 |
|
713 |
|
|
|
|
|
49,782 |
| ||
|
Gross margin |
|
37.3 |
% |
|
|
|
|
|
|
37.9 |
% | ||
|
Selling, general, and administrative and Other |
|
24,314 |
|
(3,112 |
) |
|
|
(188 |
) |
21,014 |
| ||
|
Research and development |
|
20,119 |
|
(1,096 |
) |
|
|
|
|
19,023 |
| ||
|
Net income (loss) |
|
(8,386 |
) |
4,921 |
|
7,979 |
|
3,867 |
|
8,381 |
| ||
|
|
|
|
|
|
|
|
|
|
|
|
| ||
|
Income (loss) per common share: |
|
|
|
|
|
|
|
|
|
|
| ||
|
Basic |
|
$ |
(0.21 |
) |
|
|
|
|
|
|
$ |
0.21 |
|
|
Diluted |
|
(0.21 |
) |
|
|
|
|
|
|
0.20 |
| ||
|
Weighted average number of shares: |
|
|
|
|
|
|
|
|
|
|
| ||
|
Basic |
|
39,693 |
|
|
|
|
|
|
|
40,790 |
| ||
|
Diluted |
|
39,693 |
|
|
|
|
|
|
|
40,960 |
| ||
Veeco Instruments Inc. and Subsidiaries
Other Non-GAAP Adjustments
(in thousands)
(unaudited)
|
Three months ended June 30, 2015 |
|
|
|
|
Restructuring |
|
683 |
|
|
Acquisition related |
|
188 |
|
|
Non-GAAP tax adjustment * |
|
2,996 |
|
|
Total Other |
|
3,867 |
|
* - The ‘with or without’ method is utilized to determine the income tax effect of all non-GAAP adjustments.
These table includes financial measures adjusted for the impact of certain items; these financial measures are therefore not calculated in accordance with U.S. generally accepted accounting principles (“GAAP”). These Non-GAAP financial measures exclude items such as: share-based compensation expense; charges relating to restructuring initiatives; non-cash asset impairments; certain other non-operating gains and losses; and acquisition-related items such as transaction costs, non-cash amortization of acquired intangible assets, and incremental transaction-related compensation.
These Non-GAAP financial measures may be different from Non-GAAP financial measures used by other companies. Non-GAAP financial measures should not be considered a substitute for, or superior to, measures of financial performance prepared in accordance with GAAP. By excluding these items, Non-GAAP financial measures are intended to facilitate meaningful comparisons to historical operating results, competitors’ operating results, and estimates made by securities analysts. Management is evaluated on key performance metrics including adjusted EBITDA, which is used to determine management incentive compensation as well as to forecast future periods. These Non-GAAP financial measures may be useful to investors in allowing for greater transparency of supplemental information used by management in its financial and operational decision-making. In addition, similar Non-GAAP financial measures have historically been reported to investors; the inclusion of comparable numbers provides consistency in financial reporting. Investors are encouraged to review the reconciliation of the Non-GAAP financial measures used in this news release to their most directly comparable GAAP financial measures.
Veeco Instruments Inc. and Subsidiaries
Reconciliation of GAAP Net Income (loss) to Adjusted EBITDA
(in thousands)
(unaudited)
|
|
|
Three months ended |
|
Three months ended |
| ||
|
|
|
June 30, 2016 |
|
June 30, 2015 |
| ||
|
GAAP Net income (loss) |
|
$ |
(32,082 |
) |
$ |
(8,386 |
) |
|
Share-based compensation |
|
4,002 |
|
4,921 |
| ||
|
Amortization |
|
5,273 |
|
7,979 |
| ||
|
Asset impairment |
|
13,627 |
|
— |
| ||
|
Restructuring |
|
2,095 |
|
683 |
| ||
|
Acquisition related |
|
62 |
|
188 |
| ||
|
Interest (income) expense |
|
(185 |
) |
(119 |
) | ||
|
Depreciation |
|
3,424 |
|
3,022 |
| ||
|
Income tax expense (benefit) |
|
1,014 |
|
4,479 |
| ||
|
Adjusted EBITDA |
|
$ |
(2,770 |
) |
$ |
12,767 |
|
This table includes financial measures adjusted for the impact of certain items; these financial measures are therefore not calculated in accordance with U.S. generally accepted accounting principles (“GAAP”). These Non-GAAP financial measures exclude items such as: share-based compensation expense; charges relating to restructuring initiatives; non-cash asset impairments; certain other non-operating gains and losses; and acquisition-related items such as transaction costs, non-cash amortization of acquired intangible assets, and incremental transaction-related compensation.
These Non-GAAP financial measures may be different from Non-GAAP financial measures used by other companies. Non-GAAP financial measures should not be considered a substitute for, or superior to, measures of financial performance prepared in accordance with GAAP. By excluding these items, Non-GAAP financial measures are intended to facilitate meaningful comparisons to historical operating results, competitors’ operating results, and estimates made by securities analysts. Management is evaluated on key performance metrics including adjusted EBITDA, which is used to determine management incentive compensation as well as to forecast future periods. These Non-GAAP financial measures may be useful to investors in allowing for greater transparency of supplemental information used by management in its financial and operational decision-making. In addition, similar Non-GAAP financial measures have historically been reported to investors; the inclusion of comparable numbers provides consistency in financial reporting. Investors are encouraged to review the reconciliation of the Non-GAAP financial measures used in this news release to their most directly comparable GAAP financial measures.
Veeco Instruments Inc. and Subsidiaries
Reconciliation of GAAP to Non-GAAP Financial Data
(in millions, except per share amounts)
(unaudited)
|
|
|
|
|
|
|
Non-GAAP Adjustments |
|
|
|
|
| ||||||||
|
Guidance for the three months ended September 30, 2016 |
|
GAAP |
|
Share-based |
|
Amortization |
|
Other |
|
Non-GAAP |
| ||||||||
|
Net sales |
|
$ |
70 |
- |
$ |
85 |
|
|
|
|
|
|
|
$ |
70 |
- |
$ |
85 |
|
|
|
|
|
|
|
|
|
|
|
|
|
|
|
|
|
| ||||
|
Gross profit |
|
27 |
- |
34 |
|
1 |
|
— |
|
— |
|
28 |
- |
35 |
| ||||
|
Gross margin |
|
38% |
- |
40% |
|
|
|
|
|
|
|
39% |
- |
41% |
| ||||
|
|
|
|
|
|
|
|
|
|
|
|
|
|
|
|
| ||||
|
Net income (loss) |
|
$ |
(24 |
) - |
$ |
(18 |
) |
5 |
|
6 |
|
3 |
|
(10 |
) - |
(4 |
) | ||
|
|
|
|
|
|
|
|
|
|
|
|
|
|
|
|
| ||||
|
Income (loss) per diluted common share |
|
$ |
(0.62 |
) - |
$ |
(0.46 |
) |
|
|
|
|
|
|
$ |
(0.26 |
) - |
$ |
(0.10 |
) |
|
Weighted average number of shares |
|
39 |
|
39 |
|
|
|
|
|
|
|
39 |
|
39 |
| ||||
Veeco Instruments Inc. and Subsidiaries
Reconciliation of GAAP Net Income (loss) to Adjusted EBITDA
(in millions)
(unaudited)
|
Guidance for the three months ended September 30, 2016 |
|
|
|
|
| ||
|
GAAP Net income (loss) |
|
$ |
(24 |
) - |
$ |
(18 |
) |
|
Share-based compensation |
|
5 |
- |
5 |
| ||
|
Amortization |
|
6 |
- |
6 |
| ||
|
Other * |
|
3 |
- |
3 |
| ||
|
Interest (income) expense |
|
0 |
- |
0 |
| ||
|
Depreciation |
|
3 |
- |
3 |
| ||
|
Income tax expense (benefit) ** |
|
1 |
- |
1 |
| ||
|
Adjusted EBITDA |
|
$ |
(6 |
) - |
$ |
— |
|
Note: Amounts may not calculate precisely due to rounding.
* - Other includes expenses associated with the termination of a defined benefit plan and the restructuring plan.
** - The ‘with or without’ method is utilized to determine the income tax effect of all non-GAAP adjustments.
These table includes financial measures adjusted for the impact of certain items; these financial measures are therefore not calculated in accordance with U.S. generally accepted accounting principles (“GAAP”). These Non-GAAP financial measures exclude items such as: share-based compensation expense; charges relating to restructuring initiatives; non-cash asset impairments; certain other non-operating gains and losses; and acquisition-related items such as transaction costs, non-cash amortization of acquired intangible assets, and incremental transaction-related compensation.
These Non-GAAP financial measures may be different from Non-GAAP financial measures used by other companies. Non-GAAP financial measures should not be considered a substitute for, or superior to, measures of financial performance prepared in accordance with GAAP. By excluding these items, Non-GAAP financial measures are intended to facilitate meaningful comparisons to historical operating results, competitors’ operating results, and estimates made by securities analysts. Management is evaluated on key performance metrics including adjusted EBITDA, which is used to determine management incentive compensation as well as to forecast future periods. These Non-GAAP financial measures may be useful to investors in allowing for greater transparency of supplemental information used by management in its financial and operational decision-making. In addition, similar Non-GAAP financial measures have historically been reported to investors; the inclusion of comparable numbers provides consistency in financial reporting. Investors are encouraged to review the reconciliation of the Non-GAAP financial measures used in this news release to their most directly comparable GAAP financial measures.


