EXHIBIT 99.1
|
|
NEWS |

Veeco Instruments Inc., 1 Terminal Drive, Plainview, NY 11803 Tel. 516-677-0200 Fax. 516-677-0380
FOR IMMEDIATE RELEASE
Financial Contact: Debra Wasser, SVP Investor Relations & Corporate Communications, 516-677-0200 x1472
Media Contact: Fran Brennen, Senior Director Marcom, 516-677-0200 x1222
VEECO REPORTS SECOND QUARTER 2012 FINANCIAL RESULTS
Plainview, NY, July 26, 2012 — Veeco Instruments Inc. (Nasdaq: VECO) announced its financial results for the second quarter ended June 30, 2012. Veeco reports its results on a U.S. generally accepted accounting principles (“GAAP”) basis, and also provides results excluding certain items. Please refer to the attached table for details of the reconciliation between GAAP operating results and Non-GAAP operating results. All results presented herein are for Veeco’s “Continuing Operations.”
GAAP Results ($M except EPS)
|
|
|
Q2 ‘12 |
|
Q2 ‘11 |
| ||
|
Revenues |
|
$ |
136.5 |
|
$ |
264.8 |
|
|
Net income |
|
$ |
11.0 |
|
$ |
56.3 |
|
|
EPS (diluted) |
|
$ |
0.28 |
|
$ |
1.31 |
|
Non-GAAP Results ($M except EPS)
|
|
|
Q2 ‘12 |
|
Q2 ‘11 |
| ||
|
Net income |
|
$ |
14.5 |
|
$ |
63.4 |
|
|
EPS (diluted) |
|
$ |
0.37 |
|
$ |
1.47 |
|
Second Quarter 2012 Results
John R. Peeler, Veeco’s Chairman and Chief Executive Officer, commented, “Veeco continues to deliver solid results in a soft market. Second quarter revenue was $137 million, and adjusted EBITA and non-GAAP earnings per share were $20 million and $0.37, respectively, with gross margins of 45%. Veeco generated about $19 million in cash flow from operations, ending the quarter with $540 million in cash and short term investments.” Second quarter LED & Solar revenues were $87 million, including $75 million in MOCVD and $12 million in MBE. Data Storage revenues were $50 million.
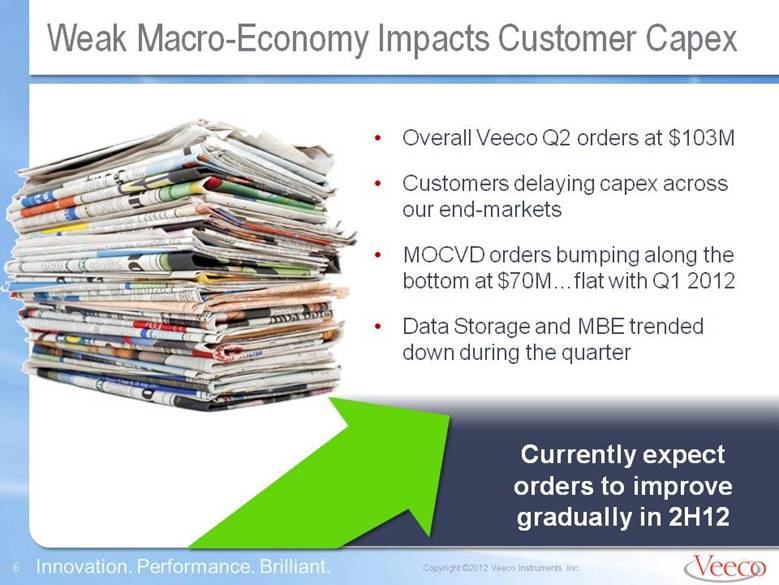
“As anticipated, we experienced a challenging bookings environment in Q2, with total orders of approximately $103 million,” continued Mr. Peeler. “Across our markets, macro-economic concerns and weakness in TV, PC and consumer electronics sales are delaying customers’ capex purchases.” Veeco’s LED & Solar orders totaled $77 million, with MOCVD flat sequentially at $70 million and MBE declining 50% to $7 million. Data Storage bookings remained weak at $25 million. Veeco’s book-to-bill ratio was 0.75 to 1 and quarter-end backlog, after a $30 million adjustment, was $241 million.
Third Quarter 2012 Guidance & Outlook
Veeco’s third quarter 2012 revenue is currently forecasted to be between $120 million and $140 million. Earnings per share are currently forecasted to be between $0.12 to $0.29 on a GAAP basis, and $0.22 to $0.38 on a non-GAAP basis. Please refer to the attached financial table for more details.
Mr. Peeler commented, “We are executing on our plan to deliver solid profitability in a down revenue year while investing for future growth. At the mid-point of the year, we are tightening our 2012 revenue guidance to between $520 and $560 million. Assuming macro-economic conditions do not worsen, we currently anticipate a gradual order recovery in the second half of 2012.”
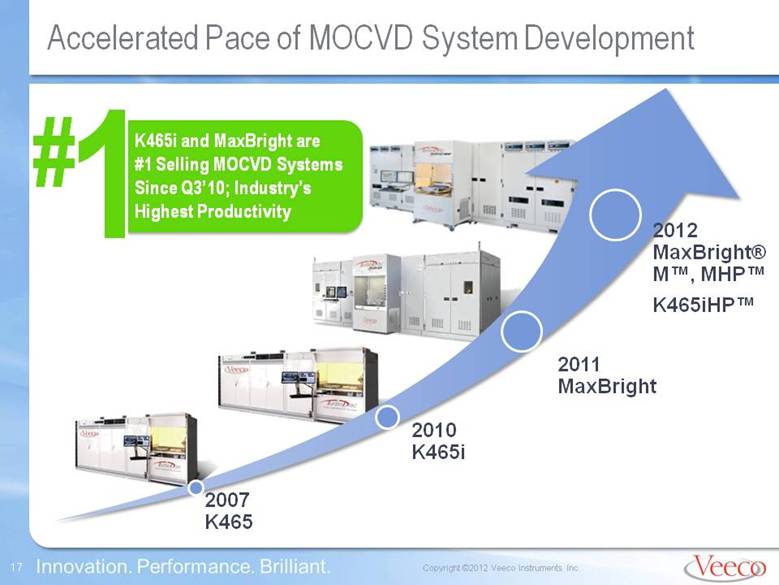
Mr. Peeler continued, “MOCVD orders appear to be bumping along the bottom and we have not yet seen a meaningful inflection in customer buying. However, utilization rates are up at key customer facilities in China, Taiwan and Korea, and we have seen a pick-up in quoting activity as customers plan future capacity expansions to ensure their position in LED lighting for 2013 and beyond. We continue to win in the market due to our low cost of ownership solutions that drive customers’ yield and productivity, most recently through our new TurboDisc® ‘M’ and ‘HP’ product suite.”
Conference Call Information
A conference call reviewing these results has been scheduled for 5:00pm ET today at 1-877-419-6594 (toll free) or 1-719-325-4768 using passcode 4807787. The call will also be webcast live on the Veeco website at www.veeco.com. A replay of the call will be available beginning at 8:00pm ET tonight through midnight on August 9, 2012 at 888-203-1112 or 719-457-0820, using passcode 4807787, or on the Veeco website. Please follow along with our slide presentation also posted on the website.
About Veeco
Veeco’s process equipment solutions enable the manufacture of LEDs, power electronics, hard drives, MEMS and wireless chips. We are the market leader in MOCVD, MBE, Ion Beam and other advanced thin film process technologies. Our high performance systems drive innovation in energy efficiency, consumer electronics and network storage and allow our customers to maximize productivity and achieve lower cost of ownership. For information on our company, products and worldwide service and support, please visit www.veeco.com.
To the extent that this news release discusses expectations or otherwise makes statements about the future, such statements are forward-looking and are subject to a number of risks and uncertainties that could cause actual results to differ materially from the statements made. These factors include the risks discussed in the Business Description and Management’s Discussion and Analysis sections of Veeco’s Annual Report on Form 10-K for the year ended December 31, 2011 and in our subsequent quarterly reports on Form 10-Q, current reports on Form 8-K and press releases. Veeco does not undertake any obligation to update any forward-looking statements to reflect future events or circumstances after the date of such statements.
-financial tables attached-
Veeco Instruments Inc. and Subsidiaries
Condensed Consolidated Statements of Income
(In thousands, except per share data)
(Unaudited)
|
|
|
Three months ended |
|
Six months ended |
| ||||||||
|
|
|
June 30, |
|
June 30, |
| ||||||||
|
|
|
2012 |
|
2011 |
|
2012 |
|
2011 |
| ||||
|
|
|
|
|
|
|
|
|
|
| ||||
|
Net sales |
|
$ |
136,547 |
|
$ |
264,815 |
|
$ |
276,456 |
|
$ |
519,491 |
|
|
Cost of sales |
|
75,293 |
|
129,466 |
|
149,934 |
|
253,179 |
| ||||
|
Gross profit |
|
61,254 |
|
135,349 |
|
126,522 |
|
266,312 |
| ||||
|
|
|
|
|
|
|
|
|
|
| ||||
|
Operating expenses (income): |
|
|
|
|
|
|
|
|
| ||||
|
Selling, general and administrative |
|
20,893 |
|
27,461 |
|
40,666 |
|
50,397 |
| ||||
|
Research and development |
|
23,910 |
|
23,652 |
|
47,216 |
|
43,523 |
| ||||
|
Amortization |
|
1,185 |
|
1,334 |
|
2,400 |
|
2,242 |
| ||||
|
Restructuring |
|
— |
|
— |
|
63 |
|
— |
| ||||
|
Other, net |
|
146 |
|
(68 |
) |
111 |
|
(28 |
) | ||||
|
Total operating expenses |
|
46,134 |
|
52,379 |
|
90,456 |
|
96,134 |
| ||||
|
|
|
|
|
|
|
|
|
|
| ||||
|
Operating income |
|
15,120 |
|
82,970 |
|
36,066 |
|
170,178 |
| ||||
|
|
|
|
|
|
|
|
|
|
| ||||
|
Interest (income) expense, net |
|
(329 |
) |
86 |
|
(532 |
) |
1,385 |
| ||||
|
Loss on extinguishment of debt |
|
— |
|
3,045 |
|
— |
|
3,349 |
| ||||
|
|
|
|
|
|
|
|
|
|
| ||||
|
Income from continuing operations before income taxes |
|
15,449 |
|
79,839 |
|
36,598 |
|
165,444 |
| ||||
|
Income tax provision |
|
4,438 |
|
23,521 |
|
9,125 |
|
51,147 |
| ||||
|
Income from continuing operations |
|
11,011 |
|
56,318 |
|
27,473 |
|
114,297 |
| ||||
|
|
|
|
|
|
|
|
|
|
| ||||
|
Income (loss) from discontinued operations, net of tax |
|
807 |
|
(37,112 |
) |
757 |
|
(42,449 |
) | ||||
|
|
|
|
|
|
|
|
|
|
| ||||
|
Net income |
|
$ |
11,818 |
|
$ |
19,206 |
|
$ |
28,230 |
|
$ |
71,848 |
|
|
|
|
|
|
|
|
|
|
|
| ||||
|
Income (loss) per common share: |
|
|
|
|
|
|
|
|
| ||||
|
Basic: |
|
|
|
|
|
|
|
|
| ||||
|
Continuing operations |
|
$ |
0.29 |
|
$ |
1.37 |
|
$ |
0.72 |
|
$ |
2.83 |
|
|
Discontinued operations |
|
0.02 |
|
(0.90 |
) |
0.02 |
|
(1.05 |
) | ||||
|
Income |
|
$ |
0.31 |
|
$ |
0.47 |
|
$ |
0.74 |
|
$ |
1.78 |
|
|
|
|
|
|
|
|
|
|
|
| ||||
|
Diluted: |
|
|
|
|
|
|
|
|
| ||||
|
Continuing operations |
|
$ |
0.28 |
|
$ |
1.31 |
|
$ |
0.71 |
|
$ |
2.67 |
|
|
Discontinued operations |
|
0.02 |
|
(0.86 |
) |
0.02 |
|
(0.99 |
) | ||||
|
Income |
|
$ |
0.30 |
|
$ |
0.45 |
|
$ |
0.73 |
|
$ |
1.68 |
|
|
|
|
|
|
|
|
|
|
|
| ||||
|
Weighted average shares outstanding: |
|
|
|
|
|
|
|
|
| ||||
|
Basic |
|
38,370 |
|
40,998 |
|
38,315 |
|
40,433 |
| ||||
|
Diluted |
|
38,988 |
|
43,002 |
|
38,925 |
|
42,780 |
| ||||
Veeco Instruments Inc. and Subsidiaries
Condensed Consolidated Balance Sheets
(In thousands)
|
|
|
June 30, |
|
December 31, |
| ||
|
|
|
2012 |
|
2011 |
| ||
|
|
|
(Unaudited) |
|
|
| ||
|
ASSETS |
|
|
|
|
| ||
|
Current assets: |
|
|
|
|
| ||
|
Cash and cash equivalents |
|
$ |
317,047 |
|
$ |
217,922 |
|
|
Short-term investments |
|
221,832 |
|
273,591 |
| ||
|
Restricted cash |
|
851 |
|
577 |
| ||
|
Accounts receivable, net |
|
95,125 |
|
95,038 |
| ||
|
Inventories, net |
|
90,729 |
|
113,434 |
| ||
|
Prepaid expenses and other current assets |
|
28,577 |
|
40,756 |
| ||
|
Assets of discontinued segment held for sale |
|
— |
|
2,341 |
| ||
|
Deferred income taxes, current |
|
10,298 |
|
10,885 |
| ||
|
Total current assets |
|
764,459 |
|
754,544 |
| ||
|
|
|
|
|
|
| ||
|
Property, plant and equipment, net |
|
97,068 |
|
86,067 |
| ||
|
Goodwill |
|
55,828 |
|
55,828 |
| ||
|
Other assets, net |
|
32,620 |
|
39,624 |
| ||
|
Total assets |
|
$ |
949,975 |
|
$ |
936,063 |
|
|
|
|
|
|
|
| ||
|
LIABILITIES AND EQUITY |
|
|
|
|
| ||
|
Current liabilities: |
|
|
|
|
| ||
|
Accounts payable |
|
$ |
32,652 |
|
$ |
40,398 |
|
|
Accrued expenses and other current liabilities |
|
95,168 |
|
107,656 |
| ||
|
Deferred profit |
|
10,301 |
|
10,275 |
| ||
|
Income taxes payable |
|
1,350 |
|
3,532 |
| ||
|
Liabilities of discontinued segment held for sale |
|
5,359 |
|
5,359 |
| ||
|
Current portion of long-term debt |
|
258 |
|
248 |
| ||
|
Total current liabilities |
|
145,088 |
|
167,468 |
| ||
|
|
|
|
|
|
| ||
|
Deferred income taxes |
|
5,023 |
|
5,029 |
| ||
|
Long-term debt |
|
2,275 |
|
2,406 |
| ||
|
Other liabilities |
|
324 |
|
640 |
| ||
|
Total liabilities |
|
152,710 |
|
175,543 |
| ||
|
|
|
|
|
|
| ||
|
Equity |
|
797,265 |
|
760,520 |
| ||
|
|
|
|
|
|
| ||
|
Total liabilities and equity |
|
$ |
949,975 |
|
$ |
936,063 |
|
Veeco Instruments Inc. and Subsidiaries
Reconciliation of GAAP to non-GAAP results
(In thousands, except per share data)
(Unaudited)
|
|
|
Three months ended |
|
Six months ended |
| ||||||||
|
|
|
June 30, |
|
June 30, |
| ||||||||
|
|
|
2012 |
|
2011 |
|
2012 |
|
2011 |
| ||||
|
Adjusted EBITA |
|
|
|
|
|
|
|
|
| ||||
|
|
|
|
|
|
|
|
|
|
| ||||
|
Operating income |
|
$ |
15,120 |
|
$ |
82,970 |
|
$ |
36,066 |
|
$ |
170,178 |
|
|
|
|
|
|
|
|
|
|
|
| ||||
|
Adjustments: |
|
|
|
|
|
|
|
|
| ||||
|
|
|
|
|
|
|
|
|
|
| ||||
|
Amortization |
|
1,185 |
|
1,334 |
|
2,400 |
|
2,242 |
| ||||
|
Equity-based compensation |
|
4,014 |
|
3,717 |
|
7,144 |
|
6,517 |
| ||||
|
Restructuring |
|
— |
|
— |
|
63 |
(1) |
— |
| ||||
|
|
|
|
|
|
|
|
|
|
| ||||
|
Earnings from continuing operations before interest, income taxes and amortization excluding certain items (“Adjusted EBITA”) |
|
$ |
20,319 |
|
$ |
88,021 |
|
$ |
45,673 |
|
$ |
178,937 |
|
|
|
|
|
|
|
|
|
|
|
| ||||
|
Non-GAAP Net Income |
|
|
|
|
|
|
|
|
| ||||
|
|
|
|
|
|
|
|
|
|
| ||||
|
Net income from continuing operations (GAAP basis) |
|
$ |
11,011 |
|
$ |
56,318 |
|
$ |
27,473 |
|
$ |
114,297 |
|
|
|
|
|
|
|
|
|
|
|
| ||||
|
Non-GAAP adjustments: |
|
|
|
|
|
|
|
|
| ||||
|
|
|
|
|
|
|
|
|
|
| ||||
|
Amortization |
|
1,185 |
|
1,334 |
|
2,400 |
|
2,242 |
| ||||
|
Equity-based compensation |
|
4,014 |
|
3,717 |
|
7,144 |
|
6,517 |
| ||||
|
Restructuring |
|
— |
|
— |
|
63 |
(1) |
— |
| ||||
|
Loss on extinguishment of debt |
|
— |
|
3,045 |
|
— |
|
3,349 |
| ||||
|
Non-cash portion of interest expense |
|
— |
|
490 |
(2) |
— |
|
1,259 |
(2) | ||||
|
Income tax effect of non-GAAP adjustments |
|
(1,718 |
)(3) |
(1,492 |
)(3) |
(3,628 |
)(3) |
(2,943 |
)(3) | ||||
|
|
|
|
|
|
|
|
|
|
| ||||
|
Non-GAAP Net Income |
|
$ |
14,492 |
|
$ |
63,412 |
|
$ |
33,452 |
|
$ |
124,721 |
|
|
|
|
|
|
|
|
|
|
|
| ||||
|
Non-GAAP earnings per diluted share excluding certain items (“Non-GAAP EPS”) |
|
$ |
0.37 |
|
$ |
1.47 |
|
$ |
0.86 |
|
$ |
2.92 |
|
|
|
|
|
|
|
|
|
|
|
| ||||
|
Diluted weighted average shares outstanding |
|
38,988 |
|
43,002 |
|
38,925 |
|
42,780 |
| ||||
(1) During the first quarter of 2012, we recorded restructuring charges totaling $0.1 million related to a company-wide reorganization executed during the second half of 2011.
(2) Adjustment to exclude non-cash interest expense on convertible subordinated notes.
(3) The Company utilized the with and without method to determine the income tax effect of non-GAAP adjustments.
NOTE - This reconciliation is not in accordance with, or an alternative method for, generally accepted accounting principles in the United States, and may be different from similar measures presented by other companies. Management of the Company evaluates performance of its business units based on adjusted EBITA, which is the primary indicator used to plan and forecast future periods. The presentation of this financial measure facilitates meaningful comparison with prior periods, as management of the Company believes adjusted EBITA reports baseline performance and thus provides useful information.
Veeco Instruments Inc. and Subsidiaries
Reconciliation of GAAP to non-GAAP results
(In thousands, except per share data)
(Unaudited)
|
|
|
Guidance for |
| ||||
|
|
|
the three months ending |
| ||||
|
|
|
LOW |
|
HIGH |
| ||
|
Adjusted EBITA |
|
|
|
|
| ||
|
|
|
|
|
|
| ||
|
Operating income |
|
$ |
6,317 |
|
$ |
15,103 |
|
|
|
|
|
|
|
| ||
|
Adjustments: |
|
|
|
|
| ||
|
|
|
|
|
|
| ||
|
Amortization |
|
1,264 |
|
1,264 |
| ||
|
Equity-based compensation |
|
4,238 |
|
4,238 |
| ||
|
|
|
|
|
|
| ||
|
Earnings from continuing operations before interest, income taxes and amortization excluding certain items (“Adjusted EBITA”) |
|
$ |
11,819 |
|
$ |
20,605 |
|
|
|
|
|
|
|
| ||
|
Non-GAAP Net Income |
|
|
|
|
| ||
|
|
|
|
|
|
| ||
|
Net income from continuing operations (GAAP basis) |
|
$ |
4,781 |
|
$ |
11,411 |
|
|
|
|
|
|
|
| ||
|
Non-GAAP adjustments: |
|
|
|
|
| ||
|
|
|
|
|
|
| ||
|
Amortization |
|
1,264 |
|
1,264 |
| ||
|
Equity-based compensation |
|
4,238 |
|
4,238 |
| ||
|
Income tax effect of non-GAAP adjustments |
|
(1,708 |
)(1) |
(1,973 |
)(1) | ||
|
|
|
|
|
|
| ||
|
Non-GAAP Net Income |
|
$ |
8,575 |
|
$ |
14,940 |
|
|
|
|
|
|
|
| ||
|
Non-GAAP earnings per diluted share excluding certain items (“Non-GAAP EPS”) |
|
$ |
0.22 |
|
$ |
0.38 |
|
|
|
|
|
|
|
| ||
|
Diluted weighted average shares outstanding |
|
39,000 |
|
39,000 |
| ||
(1) The Company utilizes the with and without method to determine the income tax effect of non-GAAP adjustments.
NOTE - This reconciliation is not in accordance with, or an alternative method for, generally accepted accounting principles in the United States, and may be different from similar measures presented by other companies. Management of the Company evaluates performance of its business units based on adjusted EBITA, which is the primary indicator used to plan and forecast future periods. The presentation of this financial measure facilitates meaningful comparison with prior periods, as management of the Company believes adjusted EBITA reports baseline performance and thus provides useful information.
Veeco Instruments Inc. and Subsidiaries
Segment Bookings, Revenues, and Reconciliation
of Operating Income (Loss) to Adjusted EBITA (Loss)
(In thousands)
(Unaudited)
|
|
|
Three months ended |
|
Six months ended |
| ||||||||
|
|
|
June 30, |
|
June 30, |
| ||||||||
|
|
|
2012 |
|
2011 |
|
2012 |
|
2011 |
| ||||
|
LED & Solar |
|
|
|
|
|
|
|
|
| ||||
|
Bookings |
|
$ |
77,294 |
|
$ |
273,282 |
|
$ |
161,923 |
|
$ |
471,527 |
|
|
|
|
|
|
|
|
|
|
|
| ||||
|
Revenues |
|
$ |
86,778 |
|
$ |
219,135 |
|
$ |
182,352 |
|
$ |
433,833 |
|
|
|
|
|
|
|
|
|
|
|
| ||||
|
Operating income |
|
$ |
7,630 |
|
$ |
77,207 |
|
$ |
23,189 |
|
$ |
157,018 |
|
|
Amortization |
|
861 |
|
953 |
|
1,724 |
|
1,440 |
| ||||
|
Equity-based compensation |
|
1,096 |
|
892 |
|
2,102 |
|
1,571 |
| ||||
|
Restructuring |
|
— |
|
— |
|
58 |
|
— |
| ||||
|
Adjusted EBITA |
|
$ |
9,587 |
|
$ |
79,052 |
|
$ |
27,073 |
|
$ |
160,029 |
|
|
|
|
|
|
|
|
|
|
|
| ||||
|
Data Storage |
|
|
|
|
|
|
|
|
| ||||
|
Bookings |
|
$ |
25,239 |
|
$ |
37,546 |
|
$ |
54,008 |
|
$ |
70,161 |
|
|
|
|
|
|
|
|
|
|
|
| ||||
|
Revenues |
|
$ |
49,769 |
|
$ |
45,680 |
|
$ |
94,104 |
|
$ |
85,658 |
|
|
|
|
|
|
|
|
|
|
|
| ||||
|
Operating income |
|
$ |
11,372 |
|
$ |
12,342 |
|
$ |
19,557 |
|
$ |
23,902 |
|
|
Amortization |
|
324 |
|
356 |
|
676 |
|
719 |
| ||||
|
Equity-based compensation |
|
440 |
|
352 |
|
851 |
|
660 |
| ||||
|
Restructuring |
|
— |
|
— |
|
5 |
|
— |
| ||||
|
Adjusted EBITA |
|
$ |
12,136 |
|
$ |
13,050 |
|
$ |
21,089 |
|
$ |
25,281 |
|
|
|
|
|
|
|
|
|
|
|
| ||||
|
Unallocated Corporate |
|
|
|
|
|
|
|
|
| ||||
|
Operating loss |
|
$ |
(3,882 |
) |
$ |
(6,579 |
) |
$ |
(6,680 |
) |
$ |
(10,742 |
) |
|
Amortization |
|
— |
|
25 |
|
— |
|
83 |
| ||||
|
Equity-based compensation |
|
2,478 |
|
2,473 |
|
4,191 |
|
4,286 |
| ||||
|
Adjusted loss |
|
$ |
(1,404 |
) |
$ |
(4,081 |
) |
$ |
(2,489 |
) |
$ |
(6,373 |
) |
|
|
|
|
|
|
|
|
|
|
| ||||
|
Total |
|
|
|
|
|
|
|
|
| ||||
|
Bookings |
|
$ |
102,533 |
|
$ |
310,828 |
|
$ |
215,931 |
|
$ |
541,688 |
|
|
|
|
|
|
|
|
|
|
|
| ||||
|
Revenues |
|
$ |
136,547 |
|
$ |
264,815 |
|
$ |
276,456 |
|
$ |
519,491 |
|
|
|
|
|
|
|
|
|
|
|
| ||||
|
Operating income |
|
$ |
15,120 |
|
$ |
82,970 |
|
$ |
36,066 |
|
$ |
170,178 |
|
|
Amortization |
|
1,185 |
|
1,334 |
|
2,400 |
|
2,242 |
| ||||
|
Equity-based compensation |
|
4,014 |
|
3,717 |
|
7,144 |
|
6,517 |
| ||||
|
Restructuring |
|
— |
|
— |
|
63 |
|
— |
| ||||
|
Adjusted EBITA |
|
$ |
20,319 |
|
$ |
88,021 |
|
$ |
45,673 |
|
$ |
178,937 |
|