EXHIBIT 99.1
 NEWS
NEWS
Veeco Instruments Inc., Terminal Drive, Plainview, NY 11803 Tel. 516-677-0200 Fax. 516-677-0380
FOR IMMEDIATE RELEASE
Financial Contact: Debra Wasser, SVP Investor Relations & Corporate Communications, 516-677-0200 x1472
Media Contact: Fran Brennen, Senior Director Marcom, 516-677-0200 x1222
VEECO REPORTS FIRST QUARTER 2012 FINANCIAL RESULTS
Plainview, NY, April 30, 2012 — Veeco Instruments Inc. (Nasdaq: VECO) announced its financial results for the first quarter ended March 31, 2012. Veeco reports its results on a U.S. generally accepted accounting principles (“GAAP”) basis, and also provides results excluding certain items. Please refer to the attached table for details of the reconciliation between GAAP operating results and Non-GAAP operating results. All results presented herein are for Veeco’s “Continuing Operations.”
GAAP Results ($M except EPS)
|
|
|
Q1 ‘12 |
|
Q1 ‘11 |
| ||
|
Revenues |
|
$ |
139.9 |
|
$ |
254.7 |
|
|
Net income |
|
$ |
16.5 |
|
$ |
58.0 |
|
|
EPS (diluted) |
|
$ |
0.42 |
|
$ |
1.36 |
|
Non-GAAP Results ($M except EPS)
|
|
|
Q1 ‘12 |
|
Q1 ‘11 |
| ||
|
Net income |
|
$ |
19.0 |
|
$ |
61.3 |
|
|
EPS (diluted) |
|
$ |
0.49 |
|
$ |
1.44 |
|
First Quarter 2012 Results
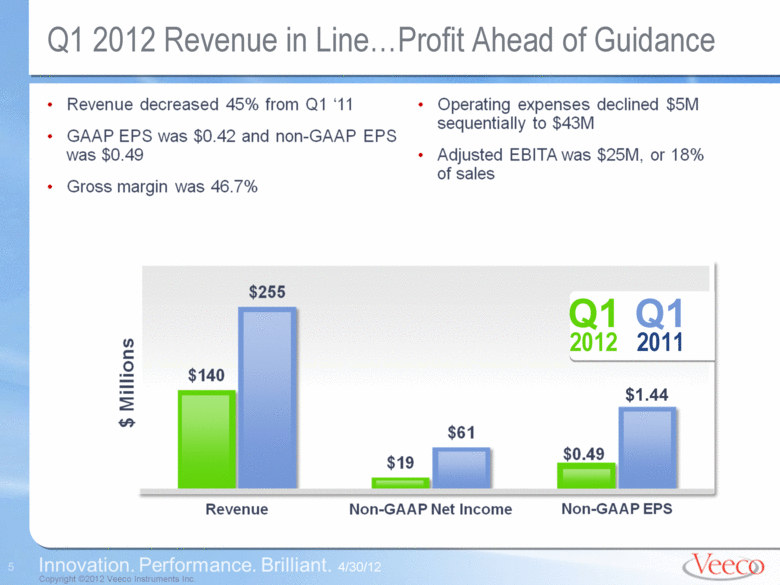
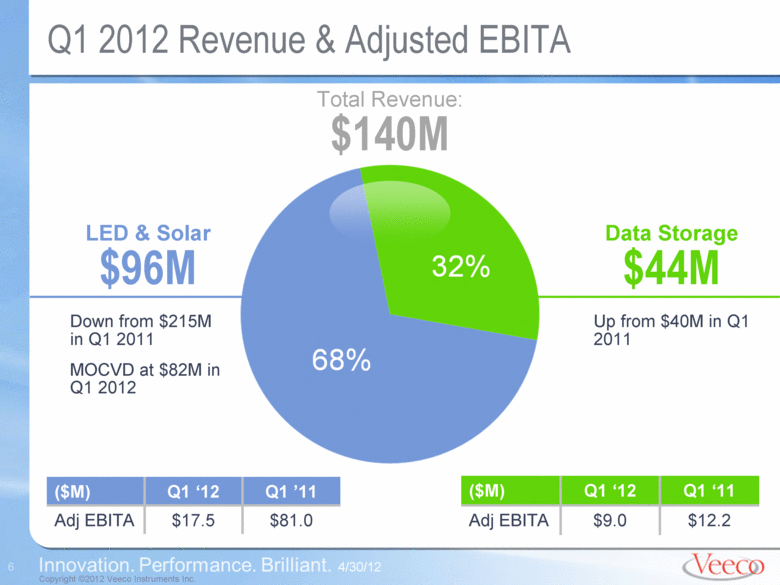
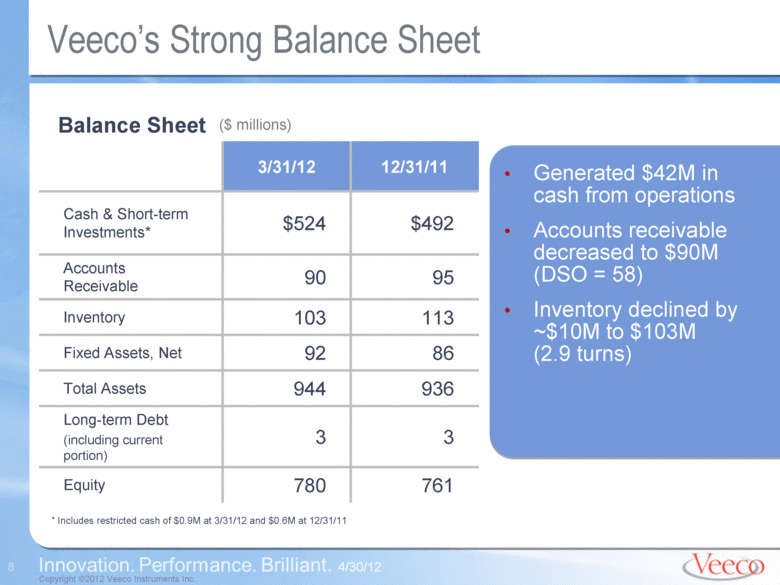
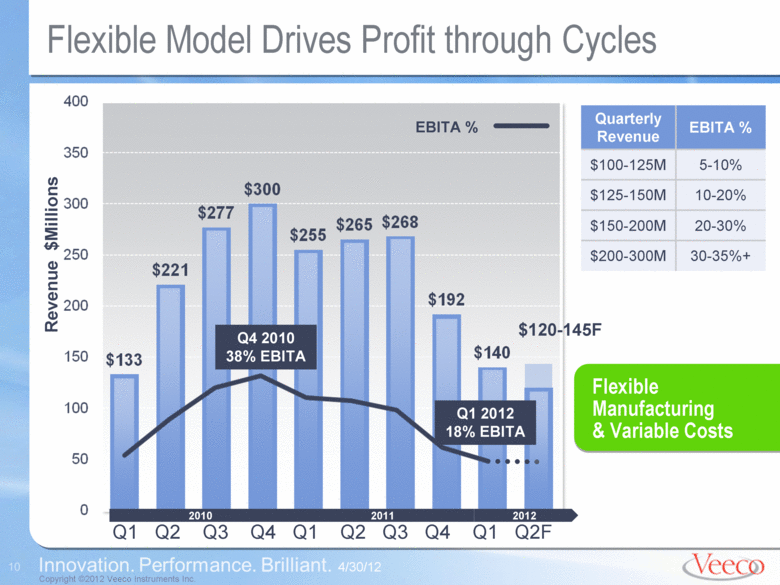
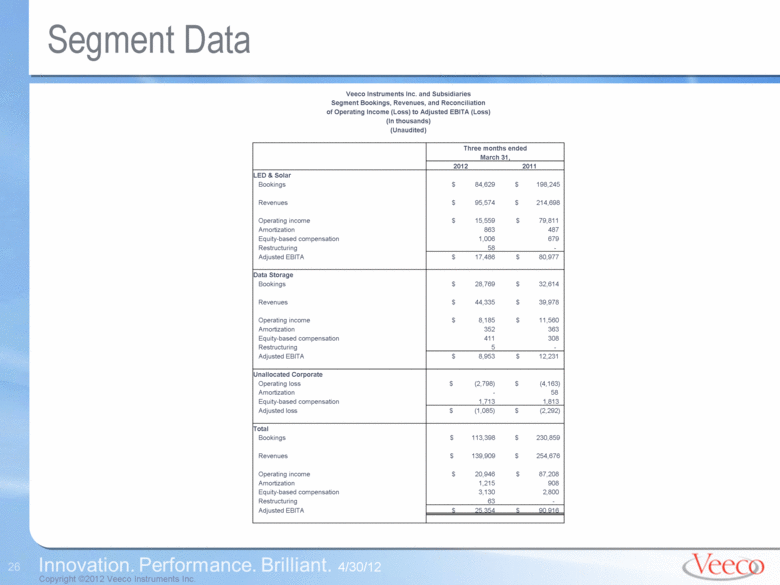
John R. Peeler, Veeco’s Chief Executive Officer, commented, “We are executing well during the downturn in MOCVD demand. Veeco’s first quarter revenue reached the top of our guidance at $140 million. Adjusted EBITA and non-GAAP earnings per share were $25 million and $0.49, respectively, on strong performance on the gross margin line and good expense management.” Veeco generated about $42 million in cash flow from operations, ending the quarter with $524 million in cash and short term investments. First quarter LED & Solar revenues were $96 million, including $82 million in MOCVD and $14 million in MBE. Data Storage revenues were $44 million.
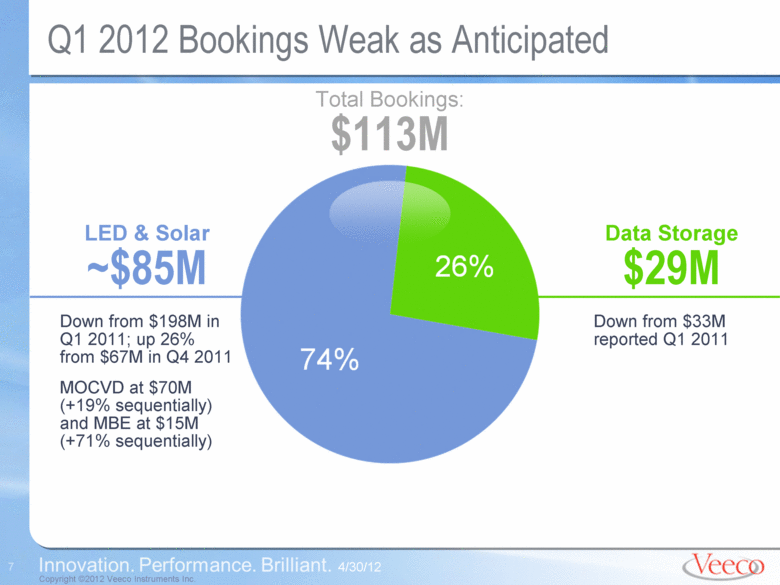
“As anticipated, we experienced a weak bookings environment in Q1, with total orders of approximately $113 million,” continued Mr. Peeler. “LED & Solar orders totaled $85 million, with $70 million in MOCVD and $15 million in MBE. MOCVD orders increased 19% sequentially, with system orders from customers in Korea, China, Taiwan, Japan and North America. MBE orders increased 71% sequentially on production orders from wireless customers. Data Storage bookings declined 62% sequentially to $29 million as customer consolidation activity temporarily stalled capacity investments.” Veeco’s book-to-bill ratio was 0.81 to 1 and quarter-end backlog was $305 million.
Second Quarter 2012 Guidance & Outlook
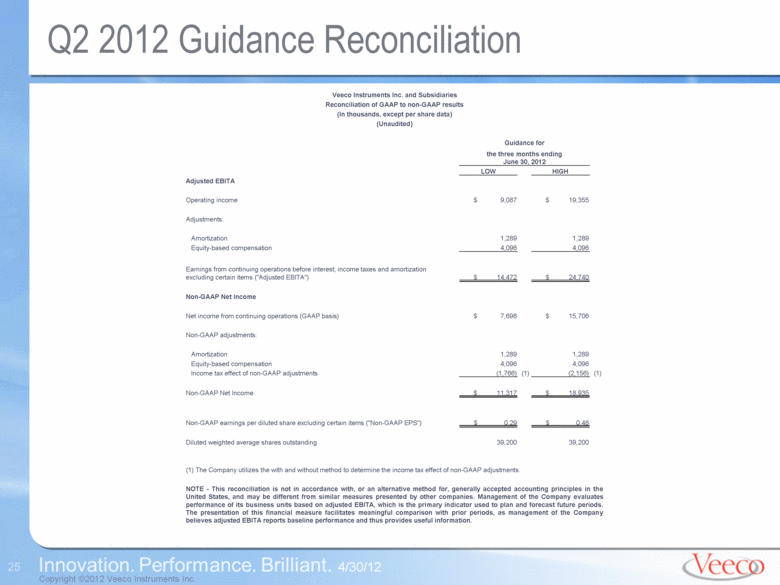
Veeco’s second quarter 2012 revenue is currently forecasted to be between $120 million and $145 million. Earnings per share are currently forecasted to be between $0.20 to $0.40 on a GAAP basis, and $0.29 to $0.48 on a non-GAAP basis. Please refer to the attached financial table for more details.
Mr. Peeler commented, “I am proud of our team’s ability to execute, stay nimble and deliver solid profitability in a tough year. We are experiencing growth in our Data Storage and MBE businesses, as well as in Services across all of our technologies. Veeco is focused on keeping our infrastructure lean and
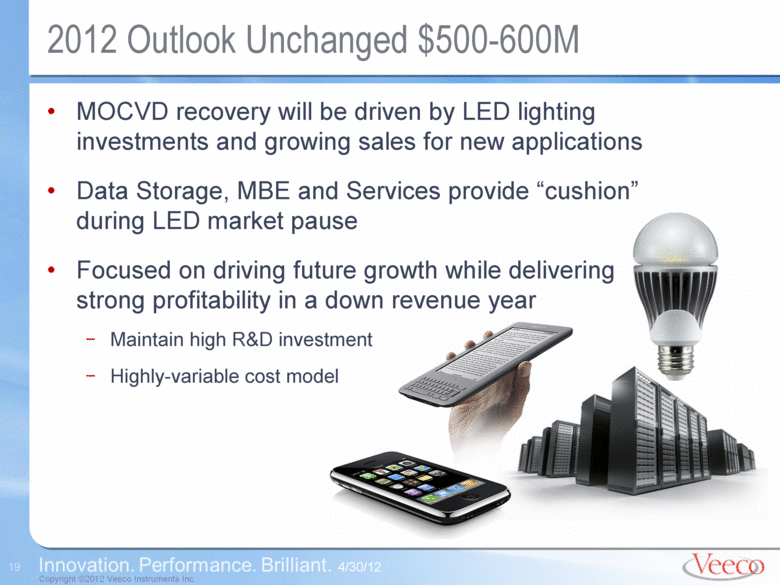
discretionary costs low, while at the same time developing next-generation technology solutions to drive future growth. We are on track to deliver 2012 revenue of $500-600 million.”
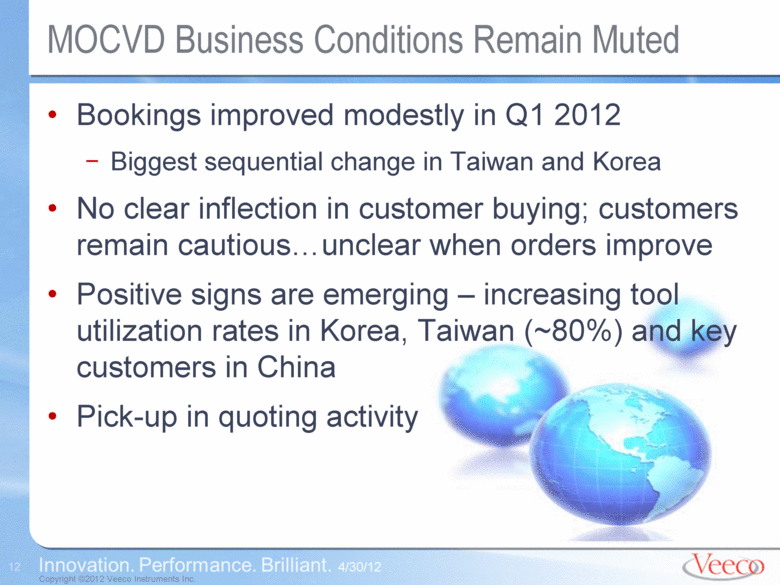
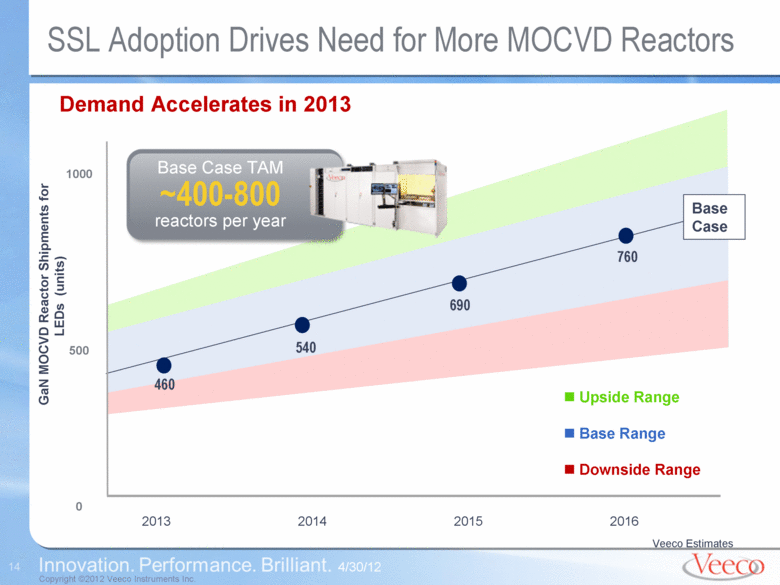
Mr. Peeler continued, “While MOCVD bookings grew modestly in the first quarter, we have not yet seen a clear inflection in customer buying patterns. LED customers remain cautious about capacity investment plans and it is still unclear when the MOCVD market will recover. Some positive signs are emerging, including increasing tool utilization rates in Korea, Taiwan and China, and a pick-up in customer quoting activity.”
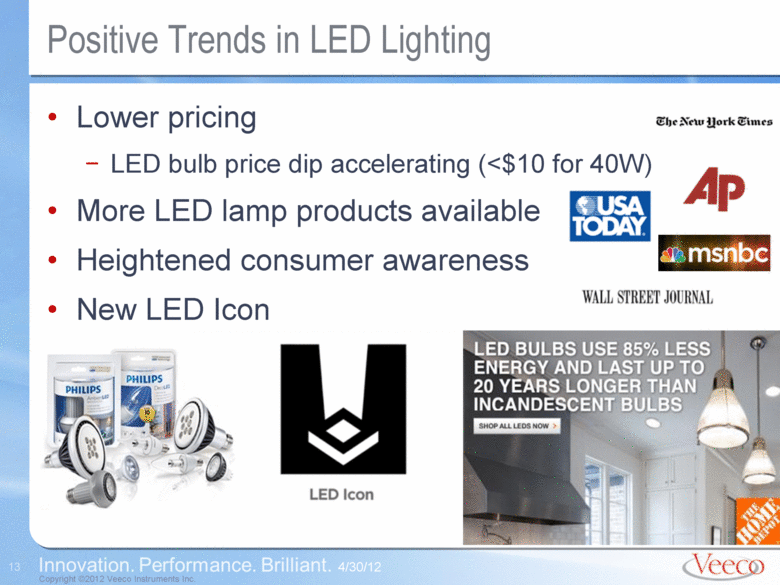
“Overall, we are seeing positive trends in LED lighting — lower prices, more LED lamp products, and heightened consumer awareness. LED manufacturers are focused on how to position their businesses for growth as LEDs become the dominant lighting technology. Despite the business decline in 2012, we firmly believe that the future MOCVD market opportunity will be larger than what we have experienced so far. With leading market share, strong LED customer relationships, technology leadership, and lowest cost of ownership production systems, Veeco is poised for substantive long term growth in LED lighting,” concluded Mr. Peeler.
Conference Call Information
A conference call reviewing these results has been scheduled for 5:00pm ET today at 1-877-419-6590 (toll free) or 1-719-325-4834 using passcode 8772364. The call will also be webcast live on the Veeco website at www.veeco.com. A replay of the call will be available beginning at 8:00pm ET tonight through midnight on May 14, 2012 at 888-203-1112 or 719-457-0820, using passcode 8772364, and on the Veeco website. Please follow along with our slide presentation also posted on the website.
About Veeco
Veeco makes equipment to develop and manufacture LEDs, solar cells, hard disk drives and other devices. We support our customers through product development, manufacturing, sales and service sites in the U.S., Korea, Taiwan, China, Singapore, Japan, Europe and other locations. Please visit us at www.veeco.com.
To the extent that this news release discusses expectations or otherwise makes statements about the future, such statements are forward-looking and are subject to a number of risks and uncertainties that could cause actual results to differ materially from the statements made. These factors include the risks discussed in the Business Description and Management’s Discussion and Analysis sections of Veeco’s Annual Report on Form 10-K for the year ended December 31, 2011 and in our subsequent quarterly reports on Form 10-Q, current reports on Form 8-K and press releases. Veeco does not undertake any obligation to update any forward-looking statements to reflect future events or circumstances after the date of such statements.
-financial tables attached-
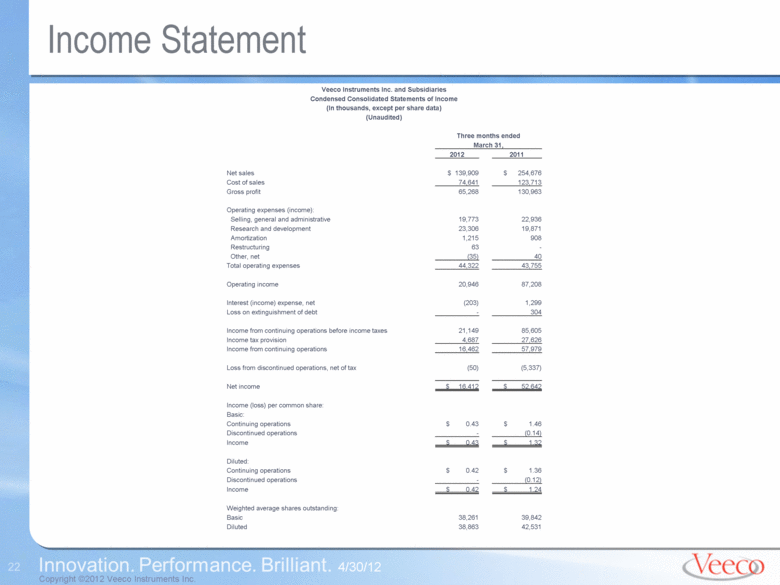
Veeco Instruments Inc. and Subsidiaries
Condensed Consolidated Statements of Income
(In thousands, except per share data)
(Unaudited)
|
|
|
Three months ended |
| ||||
|
|
|
March 31, |
| ||||
|
|
|
2012 |
|
2011 |
| ||
|
|
|
|
|
|
| ||
|
Net sales |
|
$ |
139,909 |
|
$ |
254,676 |
|
|
Cost of sales |
|
74,641 |
|
123,713 |
| ||
|
Gross profit |
|
65,268 |
|
130,963 |
| ||
|
|
|
|
|
|
| ||
|
Operating expenses (income): |
|
|
|
|
| ||
|
Selling, general and administrative |
|
19,773 |
|
22,936 |
| ||
|
Research and development |
|
23,306 |
|
19,871 |
| ||
|
Amortization |
|
1,215 |
|
908 |
| ||
|
Restructuring |
|
63 |
|
— |
| ||
|
Other, net |
|
(35 |
) |
40 |
| ||
|
Total operating expenses |
|
44,322 |
|
43,755 |
| ||
|
|
|
|
|
|
| ||
|
Operating income |
|
20,946 |
|
87,208 |
| ||
|
|
|
|
|
|
| ||
|
Interest (income) expense, net |
|
(203 |
) |
1,299 |
| ||
|
Loss on extinguishment of debt |
|
— |
|
304 |
| ||
|
|
|
|
|
|
| ||
|
Income from continuing operations before income taxes |
|
21,149 |
|
85,605 |
| ||
|
Income tax provision |
|
4,687 |
|
27,626 |
| ||
|
Income from continuing operations |
|
16,462 |
|
57,979 |
| ||
|
|
|
|
|
|
| ||
|
Loss from discontinued operations, net of tax |
|
(50 |
) |
(5,337 |
) | ||
|
|
|
|
|
|
| ||
|
Net income |
|
$ |
16,412 |
|
$ |
52,642 |
|
|
|
|
|
|
|
| ||
|
Income (loss) per common share: |
|
|
|
|
| ||
|
Basic: |
|
|
|
|
| ||
|
Continuing operations |
|
$ |
0.43 |
|
$ |
1.46 |
|
|
Discontinued operations |
|
— |
|
(0.14 |
) | ||
|
Income |
|
$ |
0.43 |
|
$ |
1.32 |
|
|
|
|
|
|
|
| ||
|
Diluted: |
|
|
|
|
| ||
|
Continuing operations |
|
$ |
0.42 |
|
$ |
1.36 |
|
|
Discontinued operations |
|
— |
|
(0.12 |
) | ||
|
Income |
|
$ |
0.42 |
|
$ |
1.24 |
|
|
|
|
|
|
|
| ||
|
Weighted average shares outstanding: |
|
|
|
|
| ||
|
Basic |
|
38,261 |
|
39,842 |
| ||
|
Diluted |
|
38,863 |
|
42,531 |
| ||
Veeco Instruments Inc. and Subsidiaries
Condensed Consolidated Balance Sheets
(In thousands)
|
|
|
March 31, |
|
December 31, |
| ||
|
|
|
2012 |
|
2011 |
| ||
|
|
|
(Unaudited) |
|
|
| ||
|
ASSETS |
|
|
|
|
| ||
|
Current assets: |
|
|
|
|
| ||
|
Cash and cash equivalents |
|
$ |
275,332 |
|
$ |
217,922 |
|
|
Short-term investments |
|
247,826 |
|
273,591 |
| ||
|
Restricted cash |
|
852 |
|
577 |
| ||
|
Accounts receivable, net |
|
90,341 |
|
95,038 |
| ||
|
Inventories, net |
|
103,276 |
|
113,434 |
| ||
|
Prepaid expenses and other current assets |
|
27,948 |
|
40,756 |
| ||
|
Assets held for sale |
|
2,341 |
|
2,341 |
| ||
|
Deferred income taxes, current |
|
10,222 |
|
10,885 |
| ||
|
Total current assets |
|
758,138 |
|
754,544 |
| ||
|
|
|
|
|
|
| ||
|
Property, plant and equipment, net |
|
91,998 |
|
86,067 |
| ||
|
Goodwill |
|
55,828 |
|
55,828 |
| ||
|
Other assets, net |
|
38,388 |
|
39,624 |
| ||
|
Total assets |
|
$ |
944,352 |
|
$ |
936,063 |
|
|
|
|
|
|
|
| ||
|
LIABILITIES AND EQUITY |
|
|
|
|
| ||
|
Current liabilities: |
|
|
|
|
| ||
|
Accounts payable |
|
$ |
38,243 |
|
$ |
40,398 |
|
|
Accrued expenses and other current liabilities |
|
103,219 |
|
107,656 |
| ||
|
Deferred profit |
|
7,612 |
|
10,275 |
| ||
|
Income taxes payable |
|
1,888 |
|
3,532 |
| ||
|
Liabilities of discontinued segment held for sale |
|
5,359 |
|
5,359 |
| ||
|
Current portion of long-term debt |
|
253 |
|
248 |
| ||
|
Total current liabilities |
|
156,574 |
|
167,468 |
| ||
|
|
|
|
|
|
| ||
|
Deferred income taxes |
|
5,023 |
|
5,029 |
| ||
|
Long-term debt |
|
2,341 |
|
2,406 |
| ||
|
Other liabilities |
|
436 |
|
640 |
| ||
|
Total liabilities |
|
164,374 |
|
175,543 |
| ||
|
|
|
|
|
|
| ||
|
Equity |
|
779,978 |
|
760,520 |
| ||
|
|
|
|
|
|
| ||
|
Total liabilities and equity |
|
$ |
944,352 |
|
$ |
936,063 |
|
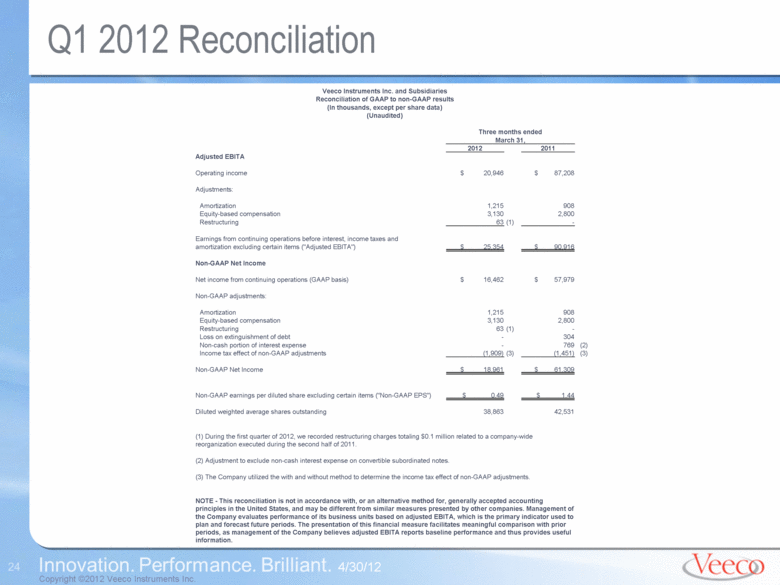
Veeco Instruments Inc. and Subsidiaries
Reconciliation of GAAP to non-GAAP results
(In thousands, except per share data)
(Unaudited)
|
|
|
Three months ended |
| ||||
|
|
|
March 31, |
| ||||
|
|
|
2012 |
|
2011 |
| ||
|
Adjusted EBITA |
|
|
|
|
| ||
|
|
|
|
|
|
| ||
|
Operating income |
|
$ |
20,946 |
|
$ |
87,208 |
|
|
|
|
|
|
|
| ||
|
Adjustments: |
|
|
|
|
| ||
|
|
|
|
|
|
| ||
|
Amortization |
|
1,215 |
|
908 |
| ||
|
Equity-based compensation |
|
3,130 |
|
2,800 |
| ||
|
Restructuring |
|
63 |
(1) |
— |
| ||
|
|
|
|
|
|
| ||
|
Earnings from continuing operations before interest, income taxes and amortization excluding certain items (“Adjusted EBITA”) |
|
$ |
25,354 |
|
$ |
90,916 |
|
|
|
|
|
|
|
| ||
|
Non-GAAP Net Income |
|
|
|
|
| ||
|
|
|
|
|
|
| ||
|
Net income from continuing operations (GAAP basis) |
|
$ |
16,462 |
|
$ |
57,979 |
|
|
|
|
|
|
|
| ||
|
Non-GAAP adjustments: |
|
|
|
|
| ||
|
|
|
|
|
|
| ||
|
Amortization |
|
1,215 |
|
908 |
| ||
|
Equity-based compensation |
|
3,130 |
|
2,800 |
| ||
|
Restructuring |
|
63 |
(1) |
— |
| ||
|
Loss on extinguishment of debt |
|
— |
|
304 |
| ||
|
Non-cash portion of interest expense |
|
— |
|
769 |
(2) | ||
|
Income tax effect of non-GAAP adjustments |
|
(1,909 |
)(3) |
(1,451 |
)(3) | ||
|
|
|
|
|
|
| ||
|
Non-GAAP Net Income |
|
$ |
18,961 |
|
$ |
61,309 |
|
|
|
|
|
|
|
| ||
|
Non-GAAP earnings per diluted share excluding certain items (“Non-GAAP EPS”) |
|
$ |
0.49 |
|
$ |
1.44 |
|
|
|
|
|
|
|
| ||
|
Diluted weighted average shares outstanding |
|
38,863 |
|
42,531 |
| ||
(1) During the first quarter of 2012, we recorded restructuring charges totaling $0.1 million related to a company-wide reorganization executed during the second half of 2011.
(2) Adjustment to exclude non-cash interest expense on convertible subordinated notes.
(3) The Company utilized the with and without method to determine the income tax effect of non-GAAP adjustments.
NOTE - This reconciliation is not in accordance with, or an alternative method for, generally accepted accounting principles in the United States, and may be different from similar measures presented by other companies. Management of the Company evaluates performance of its business units based on adjusted EBITA, which is the primary indicator used to plan and forecast future periods. The presentation of this financial measure facilitates meaningful comparison with prior periods, as management of the Company believes adjusted EBITA reports baseline performance and thus provides useful information.
Veeco Instruments Inc. and Subsidiaries
Reconciliation of GAAP to non-GAAP results
(In thousands, except per share data)
(Unaudited)
|
|
|
Guidance for |
| ||||
|
|
|
the three months ending |
| ||||
|
|
|
LOW |
|
HIGH |
| ||
|
Adjusted EBITA |
|
|
|
|
| ||
|
|
|
|
|
|
| ||
|
Operating income |
|
$ |
9,087 |
|
$ |
19,355 |
|
|
|
|
|
|
|
| ||
|
Adjustments: |
|
|
|
|
| ||
|
|
|
|
|
|
| ||
|
Amortization |
|
1,289 |
|
1,289 |
| ||
|
Equity-based compensation |
|
4,096 |
|
4,096 |
| ||
|
|
|
|
|
|
| ||
|
Earnings from continuing operations before interest, income taxes and amortization excluding certain items (“Adjusted EBITA”) |
|
$ |
14,472 |
|
$ |
24,740 |
|
|
|
|
|
|
|
| ||
|
Non-GAAP Net Income |
|
|
|
|
| ||
|
|
|
|
|
|
| ||
|
Net income from continuing operations (GAAP basis) |
|
$ |
7,698 |
|
$ |
15,706 |
|
|
|
|
|
|
|
| ||
|
Non-GAAP adjustments: |
|
|
|
|
| ||
|
|
|
|
|
|
| ||
|
Amortization |
|
1,289 |
|
1,289 |
| ||
|
Equity-based compensation |
|
4,096 |
|
4,096 |
| ||
|
Income tax effect of non-GAAP adjustments |
|
(1,766 |
)(1) |
(2,156 |
)(1) | ||
|
|
|
|
|
|
| ||
|
Non-GAAP Net Income |
|
$ |
11,317 |
|
$ |
18,935 |
|
|
|
|
|
|
|
| ||
|
Non-GAAP earnings per diluted share excluding certain items (“Non-GAAP EPS”) |
|
$ |
0.29 |
|
$ |
0.48 |
|
|
|
|
|
|
|
| ||
|
Diluted weighted average shares outstanding |
|
39,200 |
|
39,200 |
| ||
(1) The Company utilizes the with and without method to determine the income tax effect of non-GAAP adjustments.
NOTE - This reconciliation is not in accordance with, or an alternative method for, generally accepted accounting principles in the United States, and may be different from similar measures presented by other companies. Management of the Company evaluates performance of its business units based on adjusted EBITA, which is the primary indicator used to plan and forecast future periods. The presentation of this financial measure facilitates meaningful comparison with prior periods, as management of the Company believes adjusted EBITA reports baseline performance and thus provides useful information.
Veeco Instruments Inc. and Subsidiaries
Segment Bookings, Revenues, and Reconciliation
of Operating Income (Loss) to Adjusted EBITA (Loss)
(In thousands)
(Unaudited)
|
|
|
Three months ended |
| ||||
|
|
|
March 31, |
| ||||
|
|
|
2012 |
|
2011 |
| ||
|
LED & Solar |
|
|
|
|
| ||
|
Bookings |
|
$ |
84,629 |
|
$ |
198,245 |
|
|
|
|
|
|
|
| ||
|
Revenues |
|
$ |
95,574 |
|
$ |
214,698 |
|
|
|
|
|
|
|
| ||
|
Operating income |
|
$ |
15,559 |
|
$ |
79,811 |
|
|
Amortization |
|
863 |
|
487 |
| ||
|
Equity-based compensation |
|
1,006 |
|
679 |
| ||
|
Restructuring |
|
58 |
|
— |
| ||
|
Adjusted EBITA |
|
$ |
17,486 |
|
$ |
80,977 |
|
|
|
|
|
|
|
| ||
|
Data Storage |
|
|
|
|
| ||
|
Bookings |
|
$ |
28,769 |
|
$ |
32,614 |
|
|
|
|
|
|
|
| ||
|
Revenues |
|
$ |
44,335 |
|
$ |
39,978 |
|
|
|
|
|
|
|
| ||
|
Operating income |
|
$ |
8,185 |
|
$ |
11,560 |
|
|
Amortization |
|
352 |
|
363 |
| ||
|
Equity-based compensation |
|
411 |
|
308 |
| ||
|
Restructuring |
|
5 |
|
— |
| ||
|
Adjusted EBITA |
|
$ |
8,953 |
|
$ |
12,231 |
|
|
|
|
|
|
|
| ||
|
Unallocated Corporate |
|
|
|
|
| ||
|
Operating loss |
|
$ |
(2,798 |
) |
$ |
(4,163 |
) |
|
Amortization |
|
— |
|
58 |
| ||
|
Equity-based compensation |
|
1,713 |
|
1,813 |
| ||
|
Adjusted loss |
|
$ |
(1,085 |
) |
$ |
(2,292 |
) |
|
|
|
|
|
|
| ||
|
Total |
|
|
|
|
| ||
|
Bookings |
|
$ |
113,398 |
|
$ |
230,859 |
|
|
|
|
|
|
|
| ||
|
Revenues |
|
$ |
139,909 |
|
$ |
254,676 |
|
|
|
|
|
|
|
| ||
|
Operating income |
|
$ |
20,946 |
|
$ |
87,208 |
|
|
Amortization |
|
1,215 |
|
908 |
| ||
|
Equity-based compensation |
|
3,130 |
|
2,800 |
| ||
|
Restructuring |
|
63 |
|
— |
| ||
|
Adjusted EBITA |
|
$ |
25,354 |
|
$ |
90,916 |
|