UNITED STATES
SECURITIES AND EXCHANGE COMMISSION
Washington, D.C. 20549
FORM 8-K
CURRENT REPORT
PURSUANT TO SECTION 13 OR 15(d) OF THE
SECURITIES EXCHANGE ACT OF 1934
Date of Report (Date of earliest event reported): February 6, 2012
VEECO INSTRUMENTS INC.
(Exact name of registrant as specified in its charter)
Delaware |
|
0-16244 |
|
11-2989601 |
Terminal Drive, Plainview, New York 11803
(Address of principal executive offices)
(516) 677-0200
(Registrants telephone number, including area code)
Not applicable
(Former name or former address, if changed since last report)
Check the appropriate box below if the Form 8-K filing is intended to simultaneously satisfy the filing obligation of the registrant under any of the following provisions (see General Instruction A.2. below):
o Written communications pursuant to Rule 425 under the Securities Act (17 CFR 230.425)
o Soliciting material pursuant to Rule 14a-12 under the Exchange Act (17 CFR 240.14a-12)
o Pre-commencement communications pursuant to Rule 14d-2(b) under the Exchange Act (17 CFR 240.14d-2(b))
o Pre-commencement communications pursuant to Rule 13e-4(c) under the Exchange Act (17 CFR 240.13e-4(c))
Item 2.02 Results of Operations and Financial Condition.
On February 6, 2012, Veeco Instruments Inc. (Veeco or the Company) issued a press release announcing its financial results for the quarter and year ended December 31, 2011. In connection with the release and the related conference call, Veeco posted a presentation relating to its fourth quarter and full-year 2012 financial results on its website (www.veeco.com). Copies of the press release and presentation are furnished as Exhibit 99.1 and Exhibit 99.2 to this report.
Item 9.01 Financial Statements and Exhibits.
(d) Exhibits.
Exhibit |
|
Description |
|
|
|
99.1 |
|
Press release issued by Veeco dated February 6, 2012 |
|
|
|
99.2 |
|
Veeco Q4 and Full-Year 2011 Highlights, Earnings Conference Call 2/6/12 |
The information in this report, including the exhibits, shall not be deemed filed for purposes of Section 18 of the Securities Exchange Act of 1934, as amended (the Exchange Act), or otherwise subject to the liabilities under that Section, nor shall this information or these exhibits be deemed to be incorporated by reference into any filing under the Securities Act of 1933, as amended, or the Exchange Act, except as expressly set forth by specific reference in such a filing.
SIGNATURES
Pursuant to the requirements of the Securities Exchange Act of 1934, the registrant has duly caused this report to be signed on its behalf by the undersigned hereunto duly authorized.
February 6, 2012 |
VEECO INSTRUMENTS INC. | ||
|
| ||
|
By: |
/s/ Gregory A. Robbins | |
|
Name: |
Gregory A. Robbins | |
|
Title: |
Senior Vice President and General Counsel | |
EXHIBIT INDEX
Exhibit |
|
Description |
|
|
|
99.1 |
|
Press release issued by Veeco dated February 6, 2012 |
|
|
|
99.2 |
|
Veeco Q4 and Full-Year 2011 Highlights, Earnings Conference Call 2/6/12 |
EXHIBIT 99.1
NEWS
Veeco Instruments Inc., Terminal Drive, Plainview, NY 11803 Tel. 516-677-0200 Fax. 516-677-0380
FOR IMMEDIATE RELEASE
Financial Contact: Debra Wasser, SVP Investor Relations & Corporate Communications, 516-677-0200 x1472
Media Contact: Fran Brennen, Senior Director Marcom, 516-677-0200 x1222
VEECO REPORTS FOURTH QUARTER AND FULL YEAR 2011 FINANCIAL RESULTS
Plainview, NY, February 6, 2012 Veeco Instruments Inc. (Nasdaq: VECO) announced its financial results for the fourth quarter and year ended December 31, 2011. Veeco reports its results on a U.S. generally accepted accounting principles (GAAP) basis, and also provides results excluding certain items. Please refer to the attached table for details of the reconciliation between GAAP operating results and Non-GAAP operating results. All results presented herein are for Veecos Continuing Operations which excludes the Metrology business sold to Bruker Corporation on October 7, 2010 and reflects the discontinuation of Veecos CIGS Solar Systems business in the third quarter of 2011.
GAAP Results ($M except EPS)
|
|
Q4 11 |
|
Q4 10 |
| ||
Revenues |
|
$ |
191.7 |
|
$ |
299.8 |
|
Net income |
|
$ |
23.6 |
|
$ |
103.4 |
|
EPS (diluted) |
|
$ |
0.61 |
|
$ |
2.46 |
|
Non-GAAP Results ($M except EPS)
|
|
Q4 11 |
|
Q4 10 |
| ||
Net income |
|
$ |
28.1 |
|
$ |
73.5 |
|
EPS (diluted) |
|
$ |
0.72 |
|
$ |
1.75 |
|
Fourth Quarter 2011 Results in Line with Guidance
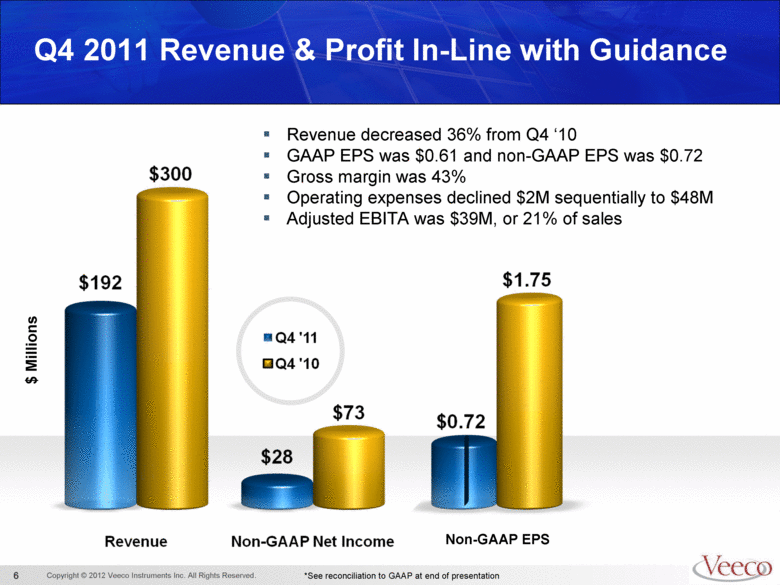
John R. Peeler, Veecos Chief Executive Officer, commented, Veecos fourth quarter performance was within our guidance range with revenue of $192 million and non-GAAP earnings per share of $0.72. Business conditions in LED remained weak, as expected, with some customer-driven rescheduling of tool shipments. Fourth quarter LED & Solar revenues were $160 million, including $150 million in MOCVD. Data Storage revenues were $32 million.
We are proud of our 2011 performance as we continued to execute in a challenging overall business environment, achieving a record $979 million in revenue, 48% gross margin and non-GAAP earnings per share of $5.01, continued Mr. Peeler. Some of our key accomplishments for the year included the launch of the industrys first multi-chamber MOCVD system which contributed to dramatic market share gains, close connectivity to our hard drive customers as we support them in the aftermath of the Thailand flood, and significant expansion of our Asian customer support infrastructure. We were able to respond quickly to customers changing business plans and remained nimble through both the up and down cycles of our business.
Veecos fourth quarter 2011 bookings totaled $143 million, up 8% sequentially. LED business conditions deteriorated during the quarter, with LED and Solar bookings declining 40% sequentially to $67 million ($59 million in MOCVD). Data Storage bookings were a record $76 million, a 258% sequential increase, with Veeco equipment being ordered by key hard drive customers to rebuild or expand manufacturing
capacity. The Companys Q4 2011 book-to-bill ratio was .75 to 1 and quarter-end backlog was $333 million.
First Quarter 2012 Guidance & Outlook
Veecos first quarter 2012 revenue is currently forecasted to be between $115 million and $140 million. Earnings per share are currently forecasted to be between $0.04 to $0.25 on a GAAP basis, and $0.13 to $0.34 on a non-GAAP basis. Please refer to the attached financial table for more details.
Mr. Peeler commented, We dont see signs of near-term improvement in the LED environment and the current overcapacity situation could mean that MOCVD orders remain at these depressed levels for multiple quarters. In Data Storage, while overall market conditions are healthy, the continued consolidation of our customer base will likely mean that order patterns will fluctuate from quarter to quarter.
While consumer electronics has been the dominant end market for LED technology over the past decade, and for which most MOCVD capacity was installed, these applications are expected to reach saturation in the next few years, added Mr. Peeler. Conversely, the LED general lighting market is in its infancy. We believe that after a transition year in 2012, demand for MOCVD tools will reaccelerate, driving demand for thousands of additional next-generation reactors to make lower-cost, higher efficiency, brighter LEDs for lighting applications. While estimates vary, LEDs are expected to represent more than 25% of the global lighting market by 2015 and the majority of the market by 2020, a dramatic increase from todays penetration of less than 5%.
Mr. Peeler concluded, We remain focused on driving next-generation product development to secure our MOCVD technology leadership position for the lighting wave. With nearly $500 million in cash at the end of 2011, virtually no debt and leading market share in all our core technologies, we can invest through this downturn and emerge even stronger when the market returns. We currently forecast 2012 revenue in the range of $500-$600 million. We believe that, with the work that has been done over the past three years to outsource our manufacturing and utilize variable costs where possible, we will maintain a reasonable level of profitability and generate cash through this temporary pause in the LED market.
Conference Call Information
A conference call reviewing these results has been scheduled for 5:00pm ET today at 1-877-857-6176 (toll free) or 1-719-325-4907 and use passcode 2749163. The call will also be webcast live on the Veeco website at www.veeco.com. A replay of the call will be available beginning at 8:00pm ET tonight through 8:00pm ET on February 20, 2012 at 888-203-1112 or 719-457-0820, using passcode 2749163, and on the Veeco website. Please follow along with our slide presentation also posted on the website.
About Veeco
Veeco makes equipment to develop and manufacture LEDs, solar cells, hard disk drives and other devices. We support our customers through product development, manufacturing, sales and service sites in the U.S., Korea, Taiwan, China, Singapore, Japan, Europe and other locations. Please visit us at www.veeco.com.
To the extent that this news release discusses expectations or otherwise makes statements about the future, such statements are forward-looking and are subject to a number of risks and uncertainties that could cause actual results to differ materially from the statements made. These factors include the risks discussed in the Business Description and Managements Discussion and Analysis sections of Veecos Annual Report on Form 10-K for the year ended December 31, 2010 and in our subsequent quarterly reports on Form 10-Q, current reports on Form 8-K and press releases. Veeco does not undertake any obligation to update any forward-looking statements to reflect future events or circumstances after the date of such statements.
-financial tables attached-
Veeco Instruments Inc. and Subsidiaries
Condensed Consolidated Statements of Income
(In thousands, except per share data)
(Unaudited)
|
|
Three months ended |
|
Year ended |
| ||||||||
|
|
December 31, |
|
December 31, |
| ||||||||
|
|
2011 |
|
2010 |
|
2011 |
|
2010 |
| ||||
|
|
|
|
|
|
|
|
|
| ||||
Net sales |
|
$ |
191,685 |
|
$ |
299,762 |
|
$ |
979,135 |
|
$ |
930,892 |
|
Cost of sales |
|
108,597 |
|
144,579 |
|
504,801 |
|
481,407 |
| ||||
Gross profit |
|
83,088 |
|
155,183 |
|
474,334 |
|
449,485 |
| ||||
|
|
|
|
|
|
|
|
|
| ||||
Operating expenses (income): |
|
|
|
|
|
|
|
|
| ||||
Selling, general and administrative |
|
21,168 |
|
27,924 |
|
95,134 |
|
87,250 |
| ||||
Research and development |
|
26,669 |
|
17,827 |
|
96,596 |
|
56,948 |
| ||||
Amortization |
|
1,215 |
|
918 |
|
4,734 |
|
3,703 |
| ||||
Restructuring |
|
1,288 |
|
|
|
1,288 |
|
(179 |
) | ||||
Asset impairment |
|
584 |
|
|
|
584 |
|
|
| ||||
Other, net |
|
(34 |
) |
(1,674 |
) |
(261 |
) |
(1,490 |
) | ||||
Total operating expenses |
|
50,890 |
|
44,995 |
|
198,075 |
|
146,232 |
| ||||
|
|
|
|
|
|
|
|
|
| ||||
Operating income |
|
32,198 |
|
110,188 |
|
276,259 |
|
303,253 |
| ||||
|
|
|
|
|
|
|
|
|
| ||||
Interest (income) expense, net |
|
(317 |
) |
1,390 |
|
824 |
|
6,572 |
| ||||
Loss on extinguishment of debt |
|
|
|
|
|
3,349 |
|
|
| ||||
|
|
|
|
|
|
|
|
|
| ||||
Income from continuing operations before income taxes |
|
32,515 |
|
108,798 |
|
272,086 |
|
296,681 |
| ||||
Income tax provision |
|
8,927 |
|
5,375 |
|
81,584 |
|
19,505 |
| ||||
Income from continuing operations |
|
23,588 |
|
103,423 |
|
190,502 |
|
277,176 |
| ||||
|
|
|
|
|
|
|
|
|
| ||||
(Loss) income from discontinued operations, net of tax |
|
(3,312 |
) |
93,737 |
|
(62,515 |
) |
84,584 |
| ||||
|
|
|
|
|
|
|
|
|
| ||||
Net income |
|
$ |
20,276 |
|
$ |
197,160 |
|
$ |
127,987 |
|
$ |
361,760 |
|
|
|
|
|
|
|
|
|
|
| ||||
Income (loss) per common share: |
|
|
|
|
|
|
|
|
| ||||
Basic: |
|
|
|
|
|
|
|
|
| ||||
Continuing operations |
|
$ |
0.62 |
|
$ |
2.62 |
|
$ |
4.80 |
|
$ |
7.02 |
|
Discontinued operations |
|
(0.09 |
) |
2.38 |
|
(1.57 |
) |
2.14 |
| ||||
Income |
|
$ |
0.53 |
|
$ |
5.00 |
|
$ |
3.23 |
|
$ |
9.16 |
|
|
|
|
|
|
|
|
|
|
| ||||
Diluted: |
|
|
|
|
|
|
|
|
| ||||
Continuing operations |
|
$ |
0.61 |
|
$ |
2.46 |
|
$ |
4.63 |
|
$ |
6.52 |
|
Discontinued operations |
|
(0.09 |
) |
2.24 |
|
(1.52 |
) |
1.99 |
| ||||
Income |
|
$ |
0.52 |
|
$ |
4.70 |
|
$ |
3.11 |
|
$ |
8.51 |
|
|
|
|
|
|
|
|
|
|
| ||||
Weighted average shares outstanding: |
|
|
|
|
|
|
|
|
| ||||
Basic |
|
38,212 |
|
39,453 |
|
39,658 |
|
39,499 |
| ||||
Diluted |
|
38,771 |
|
41,972 |
|
41,155 |
|
42,514 |
|
Veeco Instruments Inc. and Subsidiaries
Condensed Consolidated Balance Sheets
(In thousands)
|
|
December 31, |
|
December 31, |
| ||
|
|
2011 |
|
2010 |
| ||
|
|
(Unaudited) |
|
|
| ||
ASSETS |
|
|
|
|
| ||
Current assets: |
|
|
|
|
| ||
Cash and cash equivalents |
|
$ |
217,922 |
|
$ |
245,132 |
|
Short-term investments |
|
273,591 |
|
394,180 |
| ||
Restricted cash |
|
577 |
|
76,115 |
| ||
Accounts receivable, net |
|
95,038 |
|
150,528 |
| ||
Inventories, net |
|
113,434 |
|
108,487 |
| ||
Prepaid expenses and other current assets |
|
40,756 |
|
34,328 |
| ||
Assets held for sale |
|
2,341 |
|
|
| ||
Deferred income taxes, current |
|
10,885 |
|
13,803 |
| ||
Total current assets |
|
754,544 |
|
1,022,573 |
| ||
|
|
|
|
|
| ||
Property, plant and equipment, net |
|
86,067 |
|
42,320 |
| ||
Goodwill |
|
55,828 |
|
52,003 |
| ||
Deferred income taxes |
|
|
|
9,403 |
| ||
Other assets, net |
|
39,624 |
|
21,735 |
| ||
Total assets |
|
$ |
936,063 |
|
$ |
1,148,034 |
|
|
|
|
|
|
| ||
LIABILITIES AND EQUITY |
|
|
|
|
| ||
Current liabilities: |
|
|
|
|
| ||
Accounts payable |
|
$ |
40,398 |
|
$ |
32,220 |
|
Accrued expenses and other current liabilities |
|
107,656 |
|
183,010 |
| ||
Deferred profit |
|
10,275 |
|
4,109 |
| ||
Income taxes payable |
|
3,532 |
|
56,369 |
| ||
Liabilities of discontinued segment held for sale |
|
5,359 |
|
5,359 |
| ||
Current portion of long-term debt |
|
248 |
|
101,367 |
| ||
Total current liabilities |
|
167,468 |
|
382,434 |
| ||
|
|
|
|
|
| ||
Deferred income taxes |
|
5,029 |
|
|
| ||
Long-term debt |
|
2,406 |
|
2,654 |
| ||
Other liabilities |
|
640 |
|
434 |
| ||
Total liabilities |
|
175,543 |
|
385,522 |
| ||
|
|
|
|
|
| ||
Equity |
|
760,520 |
|
762,512 |
| ||
|
|
|
|
|
| ||
Total liabilities and equity |
|
$ |
936,063 |
|
$ |
1,148,034 |
|
Veeco Instruments Inc. and Subsidiaries
Reconciliation of GAAP to non-GAAP results
(In thousands, except per share data)
(Unaudited)
|
|
Three months ended |
|
Year ended |
| ||||||||
|
|
December 31, |
|
December 31, |
| ||||||||
|
|
2011 |
|
2010 |
|
2011 |
|
2010 |
| ||||
Adjusted EBITA |
|
|
|
|
|
|
|
|
| ||||
|
|
|
|
|
|
|
|
|
| ||||
Operating income |
|
$ |
32,198 |
|
$ |
110,188 |
|
$ |
276,259 |
|
$ |
303,253 |
|
|
|
|
|
|
|
|
|
|
| ||||
Adjustments: |
|
|
|
|
|
|
|
|
| ||||
|
|
|
|
|
|
|
|
|
| ||||
Amortization |
|
1,215 |
|
918 |
|
4,734 |
|
3,703 |
| ||||
Equity-based compensation |
|
3,335 |
|
2,547 |
|
12,807 |
|
8,769 |
| ||||
Restructuring |
|
1,288 |
(1) |
|
|
1,288 |
(1) |
(179 |
)(1) | ||||
Asset impairment |
|
584 |
(2) |
|
|
584 |
(2) |
|
| ||||
Inventory write-off |
|
758 |
(3) |
|
|
758 |
(3) |
|
| ||||
|
|
|
|
|
|
|
|
|
| ||||
Earnings from continuing operations before interest, income taxes and amortization excluding certain items (Adjusted EBITA) |
|
$ |
39,378 |
|
$ |
113,653 |
|
$ |
296,430 |
|
$ |
315,546 |
|
|
|
|
|
|
|
|
|
|
| ||||
Non-GAAP Net Income |
|
|
|
|
|
|
|
|
| ||||
|
|
|
|
|
|
|
|
|
| ||||
Net income from continuing operations (GAAP basis) |
|
$ |
23,588 |
|
$ |
103,423 |
|
$ |
190,502 |
|
$ |
277,176 |
|
|
|
|
|
|
|
|
|
|
| ||||
Non-GAAP adjustments: |
|
|
|
|
|
|
|
|
| ||||
|
|
|
|
|
|
|
|
|
| ||||
Amortization |
|
1,215 |
|
918 |
|
4,734 |
|
3,703 |
| ||||
Equity-based compensation |
|
3,335 |
|
2,547 |
|
12,807 |
|
8,769 |
| ||||
Restructuring |
|
1,288 |
(1) |
|
|
1,288 |
(1) |
(179 |
)(1) | ||||
Loss on extinguishment of debt |
|
|
|
|
|
3,349 |
|
|
| ||||
Asset impairment |
|
584 |
(2) |
|
|
584 |
(2) |
|
| ||||
Inventory write-off |
|
758 |
(3) |
|
|
758 |
(3) |
|
| ||||
Non-cash portion of interest expense |
|
|
|
788 |
(4) |
1,259 |
(4) |
3,058 |
(4) | ||||
Income tax effect of non-GAAP adjustments |
|
(2,667 |
)(5) |
(34,193 |
)(5) |
(9,108 |
)(5) |
(89,706 |
)(5) | ||||
|
|
|
|
|
|
|
|
|
| ||||
Non-GAAP Net Income |
|
$ |
28,101 |
|
$ |
73,483 |
|
$ |
206,173 |
|
$ |
202,821 |
|
|
|
|
|
|
|
|
|
|
| ||||
Non-GAAP earnings per diluted share excluding certain items (Non-GAAP EPS) |
|
$ |
0.72 |
|
$ |
1.75 |
|
$ |
5.01 |
|
$ |
4.77 |
|
|
|
|
|
|
|
|
|
|
| ||||
Diluted weighted average shares outstanding |
|
38,771 |
|
41,972 |
|
41,155 |
|
42,514 |
|
(1) During the fourth quarter of 2011, we recorded a restructuring expense of $1.3 million related to a company-wide reorganization. During the first quarter of 2010, we recorded a restructuring credit of $0.2 million associated with a change in estimate.
(2) During the fourth quarter of 2011, we recorded a $0.6 million asset impairment charge associated with the discontinuance of a certain product line in our LED & Solar Segment.
(3) During the fourth quarter of 2011, we recorded an inventory write-off of $0.8 million as a result of the discontinuance of a certain product line in our LED & Solar segment, which is included in cost of sales in the GAAP statement of income.
(4) Adjustment to exclude non-cash interest expense on convertible subordinated notes.
(5) By the end of 2010, the Company had fully utilized all prior NOL and tax credit carryfowards. As a result, beginning in 2011, the Company utilized the with and without method to determine the income tax effect of non-GAAP adjustments. During 2010 we provided for income taxes at a 35% statutory rate to determine income taxes on non-GAAP income.
NOTE - This reconciliation is not in accordance with, or an alternative method for, generally accepted accounting principles in the United States, and may be different from similar measures presented by other companies. Management of the Company evaluates performance of its business units based on adjusted EBITA, which is the primary indicator used to plan and forecast future periods. The presentation of this financial measure facilitates meaningful comparison with prior periods, as management of the Company believes adjusted EBITA reports baseline performance and thus provides useful information.
Veeco Instruments Inc. and Subsidiaries
Reconciliation of GAAP to non-GAAP results
(In thousands, except per share data)
(Unaudited)
|
|
Guidance for |
| ||||
|
|
the three months ending |
| ||||
|
|
LOW |
|
HIGH |
| ||
Adjusted EBITA |
|
|
|
|
| ||
|
|
|
|
|
| ||
Operating income |
|
$ |
2,343 |
|
$ |
13,150 |
|
|
|
|
|
|
| ||
Adjustments: |
|
|
|
|
| ||
|
|
|
|
|
| ||
Amortization |
|
1,298 |
|
1,298 |
| ||
Equity-based compensation |
|
3,530 |
|
3,530 |
| ||
|
|
|
|
|
| ||
Earnings from continuing operations before interest, income taxes and amortization excluding certain items (Adjusted EBITA) |
|
$ |
7,171 |
|
$ |
17,978 |
|
|
|
|
|
|
| ||
Non-GAAP Net Income |
|
|
|
|
| ||
|
|
|
|
|
| ||
Net income from continuing operations (GAAP basis) |
|
$ |
1,662 |
|
$ |
9,659 |
|
|
|
|
|
|
| ||
Non-GAAP adjustments: |
|
|
|
|
| ||
|
|
|
|
|
| ||
Amortization |
|
1,298 |
|
1,298 |
| ||
Equity-based compensation |
|
3,530 |
|
3,530 |
| ||
Income tax effect of non-GAAP adjustments |
|
(1,255 |
)(1) |
(1,255 |
)(1) | ||
|
|
|
|
|
| ||
Non-GAAP Net Income |
|
$ |
5,235 |
|
$ |
13,232 |
|
|
|
|
|
|
| ||
Non-GAAP earnings per diluted share excluding certain items (Non-GAAP EPS) |
|
$ |
0.13 |
|
$ |
0.34 |
|
|
|
|
|
|
| ||
Diluted weighted average shares outstanding |
|
38,900 |
|
38,900 |
|
(1) The Company utilizes the with and without method to determine the income tax effect of non-GAAP adjustments.
NOTE - This reconciliation is not in accordance with, or an alternative method for, generally accepted accounting principles in the United States, and may be different from similar measures presented by other companies. Management of the Company evaluates performance of its business units based on adjusted EBITA, which is the primary indicator used to plan and forecast future periods. The presentation of this financial measure facilitates meaningful comparison with prior periods, as management of the Company believes adjusted EBITA reports baseline performance and thus provides useful information.
Veeco Instruments Inc. and Subsidiaries
Segment Bookings, Revenues, and Reconciliation
of Operating Income (Loss) to Adjusted EBITA (Loss)
(In thousands)
(Unaudited)
|
|
Three months ended |
|
Year ended |
| ||||||||
|
|
December 31, |
|
December 31, |
| ||||||||
|
|
2011 |
|
2010 |
|
2011 |
|
2010 |
| ||||
LED & Solar |
|
|
|
|
|
|
|
|
| ||||
Bookings |
|
$ |
67,184 |
|
$ |
252,912 |
|
$ |
650,608 |
|
$ |
968,143 |
|
|
|
|
|
|
|
|
|
|
| ||||
Revenues |
|
$ |
160,100 |
|
$ |
257,902 |
|
$ |
827,797 |
|
$ |
795,565 |
|
|
|
|
|
|
|
|
|
|
| ||||
Operating income |
|
$ |
30,896 |
|
$ |
106,328 |
|
$ |
258,813 |
|
$ |
296,599 |
|
Amortization |
|
863 |
|
487 |
|
3,227 |
|
1,948 |
| ||||
Equity-based compensation |
|
906 |
|
826 |
|
3,473 |
|
1,764 |
| ||||
Restructuring |
|
204 |
|
|
|
204 |
|
|
| ||||
Asset impairment |
|
584 |
|
|
|
584 |
|
|
| ||||
Inventory write-off |
|
758 |
|
|
|
758 |
|
|
| ||||
Adjusted EBITA |
|
$ |
34,211 |
|
$ |
107,641 |
|
$ |
267,059 |
|
$ |
300,311 |
|
|
|
|
|
|
|
|
|
|
| ||||
Data Storage |
|
|
|
|
|
|
|
|
| ||||
Bookings |
|
$ |
75,899 |
|
$ |
42,037 |
|
$ |
167,249 |
|
$ |
153,406 |
|
|
|
|
|
|
|
|
|
|
| ||||
Revenues |
|
$ |
31,585 |
|
$ |
41,860 |
|
$ |
151,338 |
|
$ |
135,327 |
|
|
|
|
|
|
|
|
|
|
| ||||
Operating income |
|
$ |
4,377 |
|
$ |
11,796 |
|
$ |
35,464 |
|
$ |
31,427 |
|
Amortization |
|
352 |
|
373 |
|
1,424 |
|
1,522 |
| ||||
Equity-based compensation |
|
459 |
|
359 |
|
1,458 |
|
1,140 |
| ||||
Restructuring |
|
12 |
|
|
|
12 |
|
(179 |
) | ||||
Adjusted EBITA |
|
$ |
5,200 |
|
$ |
12,528 |
|
$ |
38,358 |
|
$ |
33,910 |
|
|
|
|
|
|
|
|
|
|
| ||||
Unallocated Corporate |
|
|
|
|
|
|
|
|
| ||||
Operating loss |
|
$ |
(3,075 |
) |
$ |
(7,936 |
) |
$ |
(18,018 |
) |
$ |
(24,773 |
) |
Amortization |
|
|
|
58 |
|
83 |
|
233 |
| ||||
Equity-based compensation |
|
1,970 |
|
1,362 |
|
7,876 |
|
5,865 |
| ||||
Restructuring |
|
1,072 |
|
|
|
1,072 |
|
|
| ||||
Adjusted loss |
|
$ |
(33 |
) |
$ |
(6,516 |
) |
$ |
(8,987 |
) |
$ |
(18,675 |
) |
|
|
|
|
|
|
|
|
|
| ||||
Total |
|
|
|
|
|
|
|
|
| ||||
Bookings |
|
$ |
143,083 |
|
$ |
294,949 |
|
$ |
817,857 |
|
$ |
1,121,549 |
|
|
|
|
|
|
|
|
|
|
| ||||
Revenues |
|
$ |
191,685 |
|
$ |
299,762 |
|
$ |
979,135 |
|
$ |
930,892 |
|
|
|
|
|
|
|
|
|
|
| ||||
Operating income |
|
$ |
32,198 |
|
$ |
110,188 |
|
$ |
276,259 |
|
$ |
303,253 |
|
Amortization |
|
1,215 |
|
918 |
|
4,734 |
|
3,703 |
| ||||
Equity-based compensation |
|
3,335 |
|
2,547 |
|
12,807 |
|
8,769 |
| ||||
Restructuring |
|
1,288 |
|
|
|
1,288 |
|
(179 |
) | ||||
Asset impairment |
|
584 |
|
|
|
584 |
|
|
| ||||
Inventory write-off |
|
758 |
|
|
|
758 |
|
|
| ||||
Adjusted EBITA |
|
$ |
39,378 |
|
$ |
113,653 |
|
$ |
296,430 |
|
$ |
315,546 |
|
Exhibit 99.2
Earnings Conference Call 2/6/12 |
Introduction Debra A. Wasser, SVP, Investor Relations |
Safe Harbor Statement To the extent that this presentation discusses expectations or otherwise makes statements about the future, such statements are forward-looking and are subject to a number of risks and uncertainties that could cause actual results to differ materially from the statements made. These items include the risk factors discussed in the Business Description and Management's Discussion and Analysis sections of Veeco's Annual Report on Form 10-K for the year ended December 31, 2010 and subsequent Quarterly Reports on Form 10-Q and current reports on Form 8-K. Veeco does not undertake any obligation to update any forward-looking statements to reflect future events or circumstances after the date of such statements. In addition, this presentation includes non-GAAP financial measures. For GAAP reconciliation, please refer to the reconciliation section in this presentation as well as Veecos financial press releases and 10-K and 10-Q filings available on www.veeco.com. Note: All results presented herein are for Veecos Continuing Operations which excludes the Metrology business sold to Bruker Corporation on October 7, 2010 and reflects the discontinuation of Veecos CIGS Solar Systems Business in the third quarter. |
Introduction John Peeler, CEO |
Q4 2011 Results David D. Glass, CFO |
Q4 2011 Revenue & Profit In-Line with Guidance *See reconciliation to GAAP at end of presentation $ Millions Revenue decreased 36% from Q4 10 GAAP EPS was $0.61 and non-GAAP EPS was $0.72 Gross margin was 43% Operating expenses declined $2M sequentially to $48M Adjusted EBITA was $39M, or 21% of sales Non-GAAP EPS Non-GAAP Net Income |
Q4 2011 Revenue & Adjusted EBITA Data Storage $32M Down from $42M in Q4 2010 and $34M in Q3 2011 LED & Solar $160M Down from $258M in Q4 2010 and $234M Q3 2011 MOCVD at $150M in Q4 2011 ($M) Q4 11 Q4 10 Adj EBITA $34.2 $107.6 ($M) Q4 11 Q4 10 Adj EBITA $5.2 $12.5 See reconciliation to GAAP at end of presentation Total Revenue: $192M |
Q4 2011 Bookings: Weak in LED; Strong in Data Storage Data Storage $76M Thailand rebuild and capacity expansions drive record orders, up 258% sequentially Total Bookings: $143M LED & Solar $67M Down from $253M in Q4 2010 and $112M in Q3 2011 Q4 2011 MOCVD $59M & MBE $8M Book to Bill = .75 to 1; Backlog $333M |
Veecos Strong Balance Sheet 12/31/2011 09/30/2011 Cash & Short-term Investments* $492 $449 Accounts Receivable 95 115 Inventory 113 128 Fixed Assets, Net 86 76 Total Assets 936 934 Long-term Debt (including current portion) 3 3 Equity 761 735 * Includes restricted cash of $0.6M at 12/31/11 and $22.9M at 9/30/11 ($ millions) Generated $57M cash from operations in Q4 Accounts receivable decreased to $95M (DSO = 45) Inventory declined by ~$14M to $113M (3.8 turns) Balance Sheet |
Full-Year 2011 Highlights |
Solid 2011 Performance *See reconciliation to GAAP at end of presentation $ Millions Non-GAAP EPS Record 2011 revenue $979M $296 million in adjusted EBITA Record Non-GAAP EPS of $5.01 Gross margins 48% Non-GAAP Net Income $931 Revenue |
Strong Execution in a Dynamic Year Gained dramatic market share in LED as K465i and MaxBright systems penetrated top tier accounts and new LED players around the world Supported rapid expansion of new, emerging LED customer base in China Well-aligned with Data Storage customers to support rebuilding and expansion effort Expanded outsourced manufacturing partner relationships to flex capacity Established new China and Taiwan customer support sites Broke ground on new Korea R&D site to be open mid-2012 |
Business Update and Outlook |
Short-Term LED Market Dynamics Remain Muted LED Backlighting Demand Remains Weak Despite BLU rush orders for new TV models in Q4 Factory utilization rates remain low 50-70% in Korea and Taiwan Customers cautious Global LED TV penetration rate in 2011 was ~40%; expect ~60-70% in 2012 Near-Term MOCVD Equipment Orders & Shipments to Remain Slow China MOCVD investment cycle continues to wind down Orders from Taiwan/China LED JVs are being delayed... Korea still quiet |
LED Lighting Market is in its Infancy CHINA Expands LED Streetlight Replacements; China to release its LED incentive policy for the 12th 5-year plan LED Lighting Prices Approaching Mainstream Adoption Levels KOREA 20-60 Plan targeting 60% penetration of lighting by 2020 JAPAN Basic Energy Plan: specific goals for Energy Efficient Lighting < 5% of Worlds Lighting is LED TAIWAN To replace 250,000 HID Streetlights with LEDs in 2012 |
Tier 1 LED Lighting & Chip Companies Position for Growth Philips to set up LED lighting plant in Chengdu, China Samsung EC merging with Samsung LED to accelerate LED lighting business Panasonic targets LED lighting sales >50% by 2016 New Energy-Star Toshiba LEDs installed at Louvre and Smithsonian Epistar forms strategic alliance with Asias largest CFL bulb maker LEDs for Less The passing of Edison's bulb has already been decreed, and which of the two alternatives will replace it is at last becoming clear. It will be the LED. - IEEE Spectrum |
LED Lighting Market: Veeco Roadmap Drives Multi-Billion Dollar MOCVD Opportunity in LED Lighting After a 2012 Transition Year, MOCVD Demand Will Reaccelerate.. Thousands of Additional Tools Will Be Needed Over the Next Few Years to Satisfy Lighting Market 1) LED TV Revenue 2009 to 2011 IMS Research; 2) LED Lighting Revenue 2013 to 2015 IMS Research K465i Focus on Yield Improvement MaxBright Industry-first Multi-chamber System; 500% Productivity Increase Veeco Roadmap Will Drive ~3X Epi Cost Reduction: Yield, Process Capability & Architecture $13.3B2 |
R&D to Production MOCVD Growth Opportunities Vast supply of low cost, high quality large diameter Si wafers Leveraging existing depreciated Si semiconductor fabs & wafer level packaging process Enables lower LED cost Veeco engaged in top customer programs Power Electronics device market forecasted to be $25B by 20151 Growth from Solar, Wind and other clean energy applications Higher efficiency & switching speed than traditional Si Veeco winning at key global R&D players 1) Yole GaN-on-Si LED GaN Power Electronics Wind Mills Solar UPS Automobile |
Growing Services Business Services business grew to nearly $100M in 2011, up >40% Broad range of spare parts, consumables, upgrades that drive tool performance 400 MOCVD reactors go off-warranty this year sell extended plans Asia centers ideal for customer training and process development support New VCE business resells refurbished Data Storage tools with Veeco warranty |
|
Foundation Businesses Balance MOCVD Cycles Data Storage and MBE provide: Customer and capital investment cycle diversity Exposure to hard drive, optical coating, wireless market growth Regional diversity (<10% revenues China, Korea, Taiwan) Consistent quarterly EBITA 10-30%1 Expect similar growth in 2012 on backlog tailwind Provide Growth, Earnings and Consistency Through MOCVD Cycles Data Storage and MBE Revenue CAGR 25% 2012 1) Quarterly adjusted EBITA for Data Storage and MBE Combined 2010-2011 $127M $181M $198M 2009 2010 2011 |
Q1 2012 Guidance Note: Guidance is for Veecos Continuing Operations See reconciliation to GAAP at end of presentation Q1 2012 Revenue $115 - $140M Gross Margins 43-45% Operating Spending $46-$49M Adjusted EBITA 6-13% GAAP EPS $0.04-$0.25 Non-GAAP EPS $0.13-$0.34 |
2012 Outlook See no signs of near-term improvement in MOCVD orders recovery will be driven by LED lighting investments Data Storage, MBE and Services provide cushion during LED market pause Focused on driving future growth while delivering reasonable profitability in a down revenue year Maintain high R&D investment Highly-variable cost model Currently forecast annual revenue $500-$600 million NEW GRAPHIC TO COME |
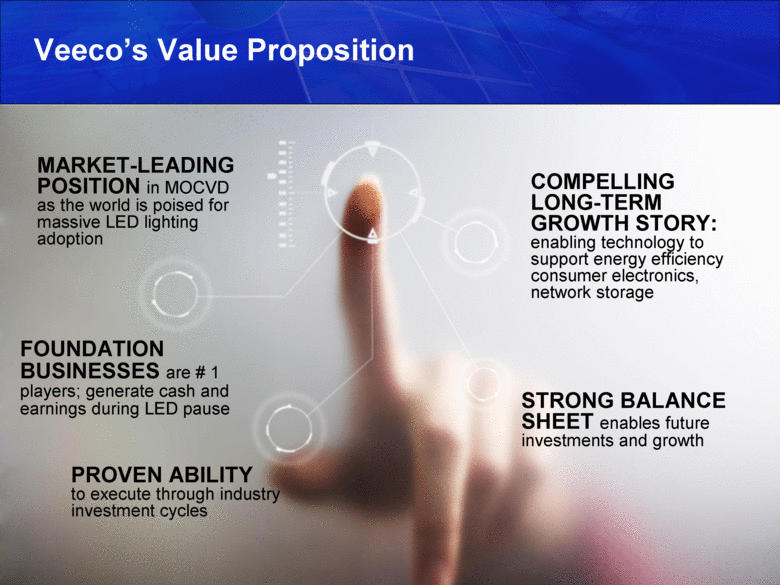
Veecos Value Proposition PROVEN ABILITY to execute through industry investment cycles COMPELLING LONG-TERM GROWTH STORY: enabling technology to support energy efficiency consumer electronics, network storage MARKET-LEADING POSITION in MOCVD as the world is poised for massive LED lighting adoption FOUNDATION BUSINESSES are # 1 players; generate cash and earnings during LED pause STRONG BALANCE SHEET enables future investments and growth |
Q&A Session |
Financial Tables |
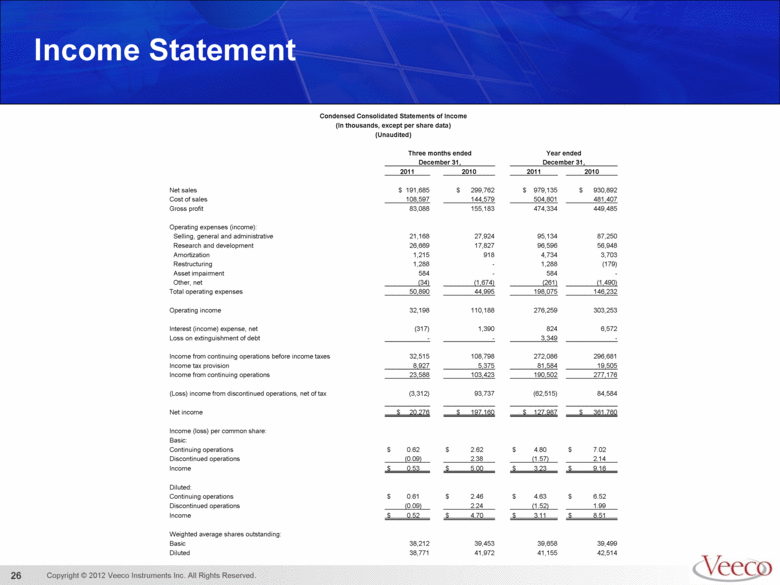
Income Statement Condensed Consolidated Statements of Income (In thousands, except per share data) (Unaudited) Three months ended Year ended December 31, December 31, 2011 2010 2011 2010 Net sales $ 191,685 $ 299,762 $ 979,135 $ 930,892 Cost of sales 108,597 144,579 504,801 481,407 Gross profit 83,088 155,183 474,334 449,485 Operating expenses (income): Selling, general and administrative 21,168 27,924 95,134 87,250 Research and development 26,669 17,827 96,596 56,948 Amortization 1,215 918 4,734 3,703 Restructuring 1,288 - 1,288 (179) Asset impairment 584 - 584 - Other, net (34) (1,674) (261) (1,490) Total operating expenses 50,890 44,995 198,075 146,232 Operating income 32,198 110,188 276,259 303,253 Interest (income) expense, net (317) 1,390 824 6,572 Loss on extinguishment of debt - - 3,349 - Income from continuing operations before income taxes 32,515 108,798 272,086 296,681 Income tax provision 8,927 5,375 81,584 19,505 Income from continuing operations 23,588 103,423 190,502 277,176 (Loss) income from discontinued operations, net of tax (3,312) 93,737 (62,515) 84,584 Net income $ 20,276 $ 197,160 $ 127,987 $ 361,760 Income (loss) per common share: Basic: Continuing operations $ 0.62 $ 2.62 $ 4.80 $ 7.02 Discontinued operations (0.09) 2.38 (1.57) 2.14 Income $ 0.53 $ 5.00 $ 3.23 $ 9.16 Diluted: Continuing operations $ 0.61 $ 2.46 $ 4.63 $ 6.52 Discontinued operations (0.09) 2.24 (1.52) 1.99 Income $ 0.52 $ 4.70 $ 3.11 $ 8.51 Weighted average shares outstanding: Basic 38,212 39,453 39,658 39,499 Diluted 38,771 41,972 41,155 42,514 |
Balance Sheets Condensed Consolidated Balance Sheets (In thousands) December 31, December 31, 2011 2010 (Unaudited) ASSETS Current assets: Cash and cash equivalents $ 217,922 $ 245,132 Short-term investments 273,591 394,180 Restricted cash 577 76,115 Accounts receivable, net 95,038 150,528 Inventories, net 113,434 108,487 Prepaid expenses and other current assets 40,756 34,328 Assets held for sale 2,341 - Deferred income taxes, current 10,885 13,803 Total current assets 754,544 1,022,573 Property, plant and equipment, net 86,067 42,320 Goodwill 55,828 52,003 Deferred income taxes - 9,403 Other assets, net 39,624 21,735 Total assets $ 936,063 $ 1,148,034 LIABILITIES AND EQUITY Current liabilities: Accounts payable $ 40,398 $ 32,220 Accrued expenses and other current liabilities 107,656 183,010 Deferred profit 10,275 4,109 Income taxes payable 3,532 56,369 Liabilities of discontinued segment held for sale 5,359 5,359 Current portion of long-term debt 248 101,367 Total current liabilities 167,468 382,434 Deferred income taxes 5,029 - Long-term debt 2,406 2,654 Other liabilities 640 434 Total liabilities 175,543 385,522 Equity 760,520 762,512 Total liabilities and equity $ 936,063 $ 1,148,034 |
Q411 and 2011 Reconciliation Reconciliation of GAAP to non-GAAP results (In thousands, except per share data) (Unaudited) Three months ended Year ended December 31, December 31, 2011 2010 2011 2010 Adjusted EBITA Operating income $ 32,198 $ 110,188 $ 276,259 $ 303,253 Adjustments: Amortization 1,215 918 4,734 3,703 Equity-based compensation 3,335 2,547 12,807 8,769 Restructuring 1,288 (1) - 1,288 (1) (179) (1) Asset impairment 584 (2) - 584 (2) - Inventory write-off 758 (3) - 758 (3) - Earnings from continuing operations before interest, income taxes and amortization excluding certain items ("Adjusted EBITA") $ 39,378 $ 113,653 $ 296,430 $ 315,546 Non-GAAP Net Income Net income from continuing operations (GAAP basis) $ 23,588 $ 103,423 $ 190,502 $ 277,176 Non-GAAP adjustments: Amortization 1,215 918 4,734 3,703 Equity-based compensation 3,335 2,547 12,807 8,769 Restructuring 1,288 (1) - 1,288 (1) (179) (1) Loss on extinguishment of debt - - 3,349 - Asset impairment 584 (2) - 584 (2) - Inventory write-off 758 (3) - 758 (3) - Non-cash portion of interest expense - 788 (4) 1,259 (4) 3,058 (4) Income tax effect of non-GAAP adjustments (2,667) (5) (34,193) (5) (9,108) (5) (89,706) (5) Non-GAAP Net Income $ 28,101 $ 73,483 $ 206,173 $ 202,821 Non-GAAP earnings per diluted share excluding certain items ("Non-GAAP EPS") $ 0.72 $ 1.75 $ 5.01 $ 4.77 Diluted weighted average shares outstanding 38,771 41,972 41,155 42,514 (1) During the fourth quarter of 2011, we recorded a restructuring expense of $1.3 million related to a company-wide reorganization. During the first quarter of 2010, we recorded a restructuring credit of $0.2 million associated with a change in estimate. (2) During the fourth quarter of 2011, we recorded a $0.6 million asset impairment charge associated with the discontinuance of a certain product line in our LED & Solar Segment. (3) During the fourth quarter of 2011, we recorded an inventory write-off of $0.8 million as a result of the discontinuance of a certain product line in our LED & Solar segment, which is included in cost of sales in the GAAP statement of income. (4) Adjustment to exclude non-cash interest expense on convertible subordinated notes. (5) By the end of 2010, the Company had fully utilized all prior NOL and tax credit carryfowards. As a result, beginning in 2011, the Company utilized the with and without method to determine the income tax effect of non-GAAP adjustments. During 2010 we provided for income taxes at a 35% statutory rate to determine income taxes on non-GAAP income. NOTE - This reconciliation is not in accordance with, or an alternative method for, generally accepted accounting principles in the United States, and may be different from similar measures presented by other companies. Management of the Company evaluates performance of its business units based on adjusted EBITA, which is the primary indicator used to plan and forecast future periods. The presentation of this financial measure facilitates meaningful comparison with prior periods, as management of the Company believes adjusted EBITA reports baseline performance and thus provides useful information. |
Q1 2012 Guidance Reconciliation Reconciliation of GAAP to non-GAAP results (In thousands, except per share data) (Unaudited) Guidance for the three months ending March 31, 2012 LOW HIGH Adjusted EBITA Operating income $ 2,343 $ 13,150 Adjustments: Amortization 1,298 1,298 Equity-based compensation 3,530 3,530 Earnings from continuing operations before interest, income taxes and amortization excluding certain items ("Adjusted EBITA") $ 7,171 $ 17,978 Non-GAAP Net Income Net income from continuing operations (GAAP basis) $ 1,662 $ 9,659 Non-GAAP adjustments: Amortization 1,298 1,298 Equity-based compensation 3,530 3,530 Income tax effect of non-GAAP adjustments (1,255) (1) (1,255) (1) Non-GAAP Net Income $ 5,235 $ 13,232 Non-GAAP earnings per diluted share excluding certain items ("Non-GAAP EPS") $ 0.13 $ 0.34 Diluted weighted average shares outstanding 38,900 38,900 (1) The Company utilizes the with and without method to determine the income tax effect of non-GAAP adjustments. NOTE - This reconciliation is not in accordance with, or an alternative method for, generally accepted accounting principles in the United States, and may be different from similar measures presented by other companies. Management of the Company evaluates performance of its business units based on adjusted EBITA, which is the primary indicator used to plan and forecast future periods. The presentation of this financial measure facilitates meaningful comparison with prior periods, as management of the Company believes adjusted EBITA reports baseline performance and thus provides useful information. |
Segment Data Segment Bookings, Revenues, and Reconciliation of Operating Income (Loss) to Adjusted EBITA (Loss) (In thousands) (Unaudited) Three months ended Year ended December 31, December 31, 2011 2010 2011 2010 LED & Solar Bookings $ 67,184 $ 252,912 $ 650,608 $ 968,143 Revenues $ 160,100 $ 257,902 $ 827,797 $ 795,565 Operating income $ 30,896 $ 106,328 $ 258,813 $ 296,599 Amortization 863 487 3,227 1,948 Equity-based compensation 906 826 3,473 1,764 Restructuring 204 - 204 - Asset impairment 584 - 584 - Inventory write-off 758 - 758 - Adjusted EBITA $ 34,211 $ 107,641 $ 267,059 $ 300,311 Data Storage Bookings $ 75,899 $ 42,037 $ 167,249 $ 153,406 Revenues $ 31,585 $ 41,860 $ 151,338 $ 135,327 Operating income $ 4,377 $ 11,796 $ 35,464 $ 31,427 Amortization 352 373 1,424 1,522 Equity-based compensation 459 359 1,458 1,140 Restructuring 12 - 12 (179) Adjusted EBITA $ 5,200 $ 12,528 $ 38,358 $ 33,910 Unallocated Corporate Operating loss $ (3,075) $ (7,936) $ (18,018) $ (24,773) Amortization - 58 83 233 Equity-based compensation 1,970 1,362 7,876 5,865 Restructuring 1,072 - 1,072 - Adjusted loss $ (33) $ (6,516) $ (8,987) $ (18,675) Total Bookings $ 143,083 $ 294,949 $ 817,857 $ 1,121,549 Revenues $ 191,685 $ 299,762 $ 979,135 $ 930,892 Operating income $ 32,198 $ 110,188 $ 276,259 $ 303,253 Amortization 1,215 918 4,734 3,703 Equity-based compensation 3,335 2,547 12,807 8,769 Restructuring 1,288 - 1,288 (179) Asset impairment 584 - 584 - Inventory write-off 758 - 758 - Adjusted EBITA $ 39,378 $ 113,653 $ 296,430 $ 315,546 |
Earnings Conference Call 2/6/12 |
B"
M2**].K6()+2F"HE4D+AZU*RW1G(*JZ=6PBDJF6#EB2F??%(@*`:$"BI77H_"
MM=:EGGKI*9FBJDE6KZIZ*ZN8U(+VJT>M6E6MKAQ-"=6RF*W*@`+FLLNFN\;-
M*["%`(,HL%T+8PR$P]JE#`7)(',L!'A1T`RV?/&M5S,62"/M`PU7*RU#W5R8
MK87<%F:A-N.*@_B%XHXS;KGEF.L"X^?@H^,.C[,;Y(^00Q8Y$/$`"21ED\ 1,BLC.DXO28O/T6%3RF706<(#I4M?*0;^%*PBA[J$]6UI>/N53
MS@3F4^@"OJJXCUG1E>Y(DE63VZX$TKC%;4YPM2N?#*57T_,54I"KE.2".M3A
MR_1%.!N\4F%ZNMR*5K5JW3J0L-,MKML67.1R/_..ZR%]80BZ_L>`?[Z+@/*E
MC&4ZPP%Y<:`Q$=Q70NU+F]Q(U-L&P^!M'&;5%"J,.+21&,4 3S+KL$29ZQ11$O
M=,UH]^`C8$``(=!9/XC]@T`!J:>F+D#J&-`NN_9BZY#HH84..V89AP::PMEJ
M,Z!H"[T+,42NC7:[Q1]UU%$V),$V#VP7R=-[QQ-3!))N'('L47`@M\YN@22-
M9'P!#1B($@3)U0HAA:,$ZA(%#E!P`4PY72+SS#+!;+,%;>7\P@@ZN7+ISC'&
M**-5A_HLE%$_&[T=440GW;U11?^0]`Y*B< P2'[@-B2R-KL@#: #"4#MBI*O_S%E`8$["E0.=A6#+:5*W8EBUD4
MV5HP9A:(>;&+&0N9Q3BVE[.0!61BD4O'1F87`+`Q+G=I"\H^,((ZONPOC&$,
M'E\FLS\6AC*5(0YGN&8 2?`"#/^YDBC`&<*,$N"Z=P,/5[>IA#GP0#!]S
M4!ZQN*"%*#VO>52*WL6HYX4OK MSK5^60V*9<=
M&\C4)C9HYN$^])YL)L`!]53*,MG+MW'T)Q_$Z(#F:E(/`74'OP5:4(=(]Z$4
MM9.%->'',I]I(,@R11W_`_V@/(!Q(P/T[BO`LRK!D%09)QD$HE0ZJ@2U(#V4
MZ.,:X%N3^ N0.@.=+3CB`QQ!R@BQ1X5H* J`#T9@4*12E .AI$-CR>,A"$
M,LAC/1X$PDP>CM&"YO6%V:P9$'`>B:D>Z(%>V+03Z+V9.>G%B-%+E`T>7#3?
M7J!9)$5$Q4C,6N"1M?1>+%A+WW486VA,%20"4N",YNW$ZND%$(R-$`!!$/2`
M$-@%3$(?2PX!$/Q`V?B%8"0?3,;D$MC%71#&8-S%V"3_'RW2HF.\367@C=R`
MQFCPWZ=)SJ,=CFS87Q2P7_T=#OO=7T,)T*6!AJ515,AA)2+,0*>-6WX$1Q=\
M`7*HI:DQQZHAX`*"X(9@1WA4`@3.6@5N1P7.6DS)5.RX3J^I#G=PR'S$6B'8
M@44AF[$!U0HZV[,,PF/V@?+$X"!06R%<"%1AB.FT08CPH!H`(>*HQN3\'R.@
M`L"Q"'"]S[K)6RN\R/M((;N!2ROHPBM8H1;FSRYTX2Y\81@6`\"9H0"9(2(H
MD:8T4#I8D,>UR0S$`=#=B#G(8<>5I6L@S@^.FV^H[OBFFOQ0[X9(2BH#K(L#3W_[\MQ=GJDN``US,NRCSP'DU)EZB
M20&^]B49W/PK@Z;A8(94X]#&`B
M'81:XZ0J=:E+O>(6&R1DJOZFR+R)C0F0W-4/A,!#'DJ2X\`&V$=FZ9!8TF.0
MXCKS(LG5287$THF@Y/(7L6BOD=S27Q=[(@C
=*5A4C1;HA1(B4B$F$A,&;S]0<*E
M+(L`3<\H=!8KS+N:*!9P$KR7K"9JZI4N7(!>R4(QG,EHVI_.^C7TD27(,T,U
M/%#M*@EXVDD"/;QEN2ZAO`A9P2?.$Z9\N@N%^$-E\Z=_ZE!XH3;[ZM9%U`P5
MV!<4\$HNX(*OO`W8($O3C`T,NM*':=%T6R'GD+=6O%&4.L4:F@Y\U5<:F@X-
MVR'#_+[`+%(CI<6_',SM$]):Y+[LD!D[:"$R^A?_UH"HU0`ACJ(J(W":(T`"
M(G`:G6$:8[R/"9,:!YD0J0D.X"!-D%O1-$(-PMK-#YB`X,S'/XU'*@$2N-G3
MN7E'++DR,N.;V#1!QWD332I:%$1:E0O'?XR`$Z!!R9)4TH$LJD.=JB6T5G*`
MF-@Z3_VL6<*(BA1"L"TM3A4`95-"\IP(/506!96NPE/5AW0>FG@(EW#/*^RF
MI;C57?F)4J,F+[1/8'')84')F7A(6F.\!=5)B+PU!7VG6QM*MD6F=DH)>=(\
M;\$?:I50IK36LUNO=7&OJC1$!JHV"2)=?=$,R>A*%SA7L`P-%#5-`20W=.NH
M:VPPXPBI+\!=N-P8ZAM%_QS55X_Y5WV5CE;T`QNZOKXL."
9Q=I"7*.+Z`.Y`WPROR#;S^$1J!P>-_2CD&/GEY,BR,$$!\%
M:2OXXXBR!
M<*0K_@,@`+%5P&RE)2X*!)<*CBR7(%:4"R/^*`4)T]'RE,?AH*&,S4"#KWQI
MYN(VH\R_GDB:-*.&Q2V&X4QC7%7<]";(F)"$#_W"8WQ%9Q1#YMAN`.&'+XCL
M7"[\0Y,S<8A0<#43I2A$'19#A];0P3M&V,/0A9Z)/<357NP)6B!84U8J>GDT
M_^+9FD^S&3H,)BW_@=`:02X9QU"878EYD'_\D[4]3^@_@MYC'@&)HD+R?>^!
MMA'@+XLDP#>2LS\:/*8YFUG2BH`"IJU`Y"R`VD]+_R#4GN92EU#-.=EZ1-CD
M'5WH9@UK\_I6]&PJ?9NRB>WJ50^8X45)/(EYOG-^,U7((RZSF>TGW2O@`==5
MB*:J"_SH04_7G1)N-U%US.S5*ISM$Z\P:=^[G7S;G+YJ25&RGU[GIQLJ^\2*
M]\.?[V:1'Z`%]3>!RW)@!0\\!'-9X`+E@@*:EFI2:VQ"45D
M4R82UZ`8`#(=9J\H9NT!$RD2%_)%ST)X``,`B9QJRIQ"@`?0Z:5$$V=VXI]2
M'Z*V#OB@SY^29MKVJ2W6HGHAZM!VGZ/R4["`7TC4#[YEA8!-JE9TA8`5%`!I
M0%B4!9!<8S;6Q:I6'Z$@@UX`"`"2?:BA720,
M.!M6.*4@#?1%()YP"'60&C`#)"H`%>F6#?&:!G$&*ZI=F=RFD>G>5ZYB/;'JFAZFDZJE?-1*<>'BAVXDXQ*NV
M.2\IE)N&%LFAC%;>8JJUN\HJX
;P'[UVT>U8A5*+*9RB0@A1^Z:M42C$Q"D_$%:8QT10I3K%#F>0O
M?]*@Z2DPP297^<$+.2S%+G[_FE2FFL*#EY!$FRMQB4X<:U[2*$@ITO622Q'P
M5WLV!2"XH%4[7%#%5/*#1H)%JRL++!!^$(,7QM#6+TABAJ.JJ:U$`0@@XC4`
M^,+772@RP[_^E;!'0>(2HXB4J#BEB@][&`;5@(
B43:F?`H=#YY=#:
^'N8P`QAD`BG)KH`(U`01>=4X\%RYA8-1:,"Z
M&84#.$53C)8#((`!!MZ\847#-$S"W)9:C,QMP9$';J"_B>`(VH5;&%P)H"`*
MAL#"(5<(,`9RM8QC-!=E"(9A9`;.B-+.A$9ND,9V7#-W%08,OE-&V)3?%23>3Q(>=RA-S5(.)'3'SJ(
M'R8(Y\B!%KZ=')#(Z)2(C]63ZMR3&.@=%U*BX%V#X1F>D-"![@3)[0B)0A')
M'UA4(5@)\Q0/+M`#_FE#15C/F'!#Y>D7/.HI4Z0R0O/(D>.G
MC*2PZ?-WTE^_?@Y%>6KIR1.G&EN7/(URNL"4%*4
MLFV8[LT]\,T`#F`M/K`(E4($,2``G!(#HA+[#N#D\JUR("P=',`^W*,!PJ$_
M[D$8""0')>S`/(2<0F=`/,1`QHD`_NLJLM+BV(\8EI*,T$/C$L!42*P?TD&^
M!&!WA&%DK"(>(N>?;@0$?T+`,D`Q06`%K@'"_`$?Y.#$FO^G[IS'>5A,@E0@
MZ.A,U,X`H\)$#6K1#Z_.ZO9@$`)!Z[PI%$(A$Q[A$4J!R?C%[\PNRDY!&J@L
M5R0%4Z:!$C4(&D1!$S_Q$XWJ$YE'"^9@^
3)URI3;
M?_W<05LMRM.FR3GK82/5J1,I4M!PW^Y4R38F0%PXH/`R292IMY7,@4("#!408X0`#"&`A`!92F*&%
M`D38X8<(,4EGA87LVN=+788)!!QHYIN9ZVF#332+,:-_24UA!.`6^,
MFCO19!(((&-X8HA*9V,0E
M+@$*HH-"$I-@!"4$,0E*B.&Y5Q^#&M20=3!$=PMG4(,9M&X&+X!!"V:GP1;,
M<%Y-;0J]Z!V5J-9B2@TDL54HR=:%4T*08&7$6;E"L(`G8N`L'FN,`-X51$;B
M7PFGL21L-$!'K/7&R,>Q6QW&_%<.!N(F9T#)3&;R!SS@$A*[)#\\@`&*H4*U$A<+5[F2_?N=`@0H%*JY;47'_
M_MWUU]0N4X=%13,5C50G0%X`8;IT:=(D2MRB^I,'2E(G_VC0I$6#%FU:-&G0
M2HOV1'K:-%*`.&``$``#G''MGDU^'#L`[2V>IGT6?GHT<="?HYE6+NV9Z6>A
M$1\>/#WP7URBKIL*A3TN+K?>O;L5KU>O][R@<(%BI/X0*$'K&3$Z="C^(4'V
MOW[Q\V6,'?]?[/##CB^X<,$%+A!\X<`NNF!*J0>7\H^..^JX@ZD[,+2#0@PK
MY)#"A3:L<*&%E$J(Q(2,4(@.(PQBD246B2"B)1EC%,@E@4QHP80=>>2Q!!-*
M&,&$$48@H0022.AQAR5-Z&%))I&,<@<2+HB2!`I&.(&$'"XX(0
<9FA$T?TA*3O=T31=U
MA4B(D#`:L`1@K:$UQ]%USI$$86-VQ90$%]9A;0,%&B8%3O`=3I")D_-A;N=V
M4)")H@@XTX1X0$"*JCA.XU0?0F8=XV0W4-`WI#@YXV&+Q=0$%6:)9W>+:@<>
MU:%V:E<>]E%.0P`!'@`!RQ@!1@8@_F$B'R*-)@(_1X5I=3)Z-P(#_'0@W6AZ
MIO<[%/_E90]%42;P!+07!>P_U
M&
MEDAHA4IUD8LV<4>3`A)E&'#M``$&B@I
.G^;.`3GW
M,V8Z=>G-)4FZI+W3)4Z2*%7*KGW\>$F