Exhibit 99.1

100 Enterprise Dr.
Rockaway, NJ 07866
SUSSEX BANCORP REPORTS A 28% INCREASE
IN NET INCOME DRIVEN BY LOAN AND DEPOSIT
GROWTH FOR THE FIRST QUARTER 2017
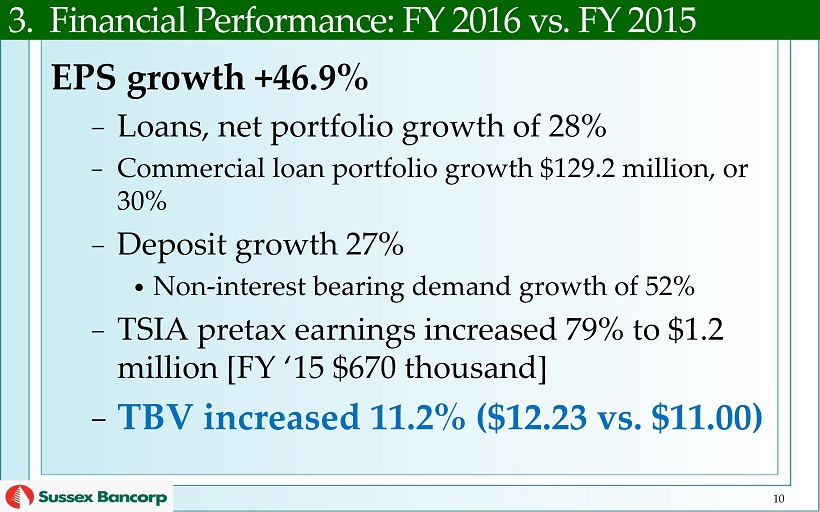
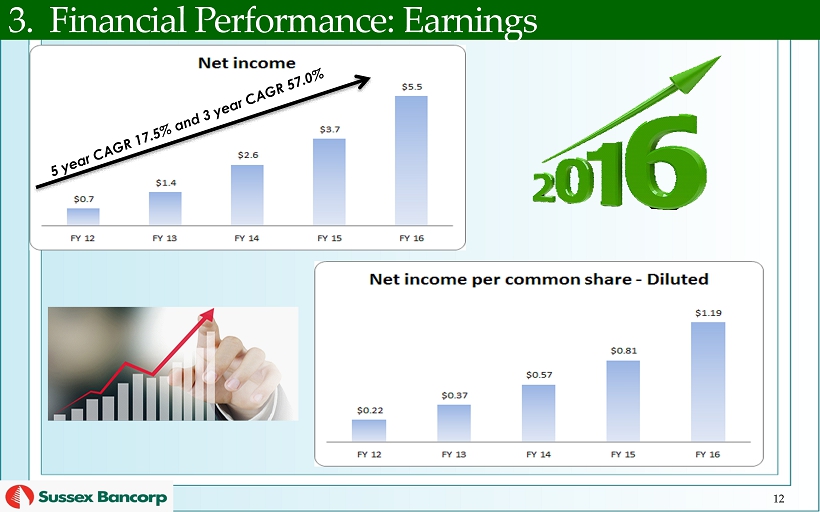
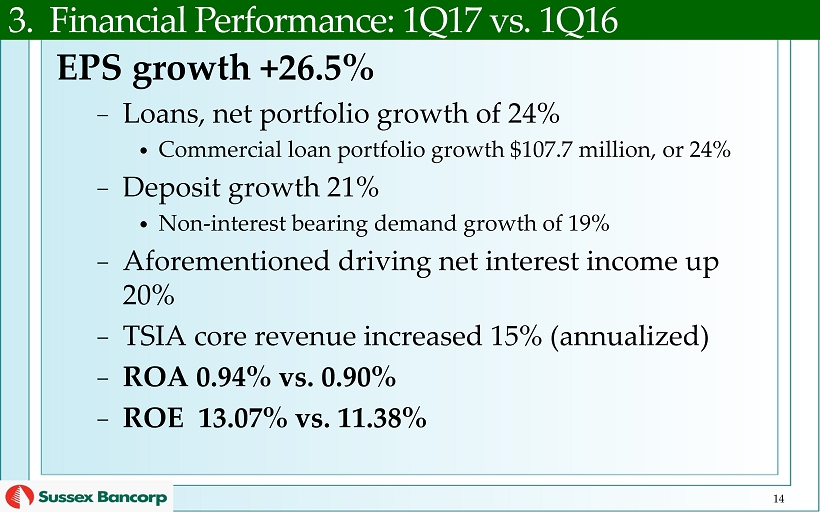
ROCKAWAY, NEW JERSEY – April 26, 2017 – Sussex Bancorp (the “Company”) (Nasdaq: SBBX), the holding company for Sussex Bank (the “Bank”), today announced a 27.8% increase in net income to $2.0 million, or $0.43 per basic and diluted common share, for the quarter ended March 31, 2017, as compared to $1.6 million, or $0.34 per basic and diluted share, for the same period last year. The improvement for the first quarter of 2017 as compared to the same period last year was mostly driven by a 19.5% increase in net interest income as a result of strong growth in average loans and deposits, which increased $142.0 million, or 25.4%, and $100.6 million, or 22.1%, respectively. The aforementioned increases in net interest income were partly offset by higher interest expenses resulting mostly from the private placement of $15 million of subordinated notes completed in the fourth quarter of 2016 and an increase in interest bearing deposits.
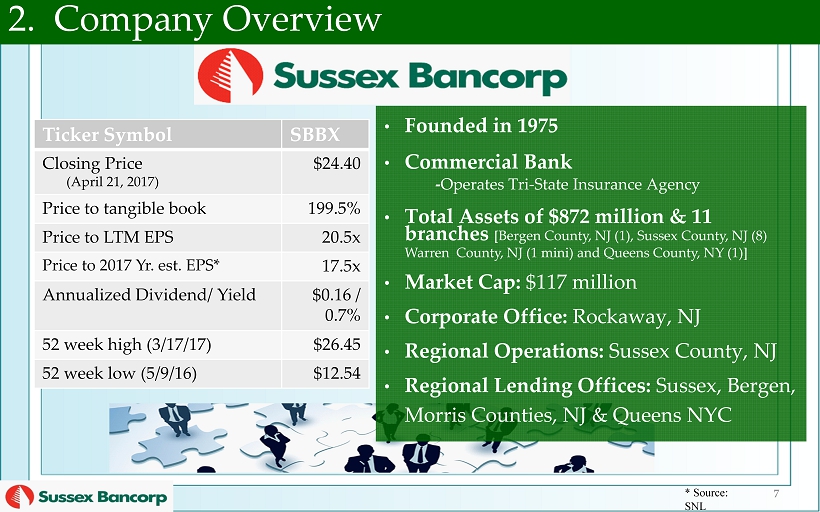
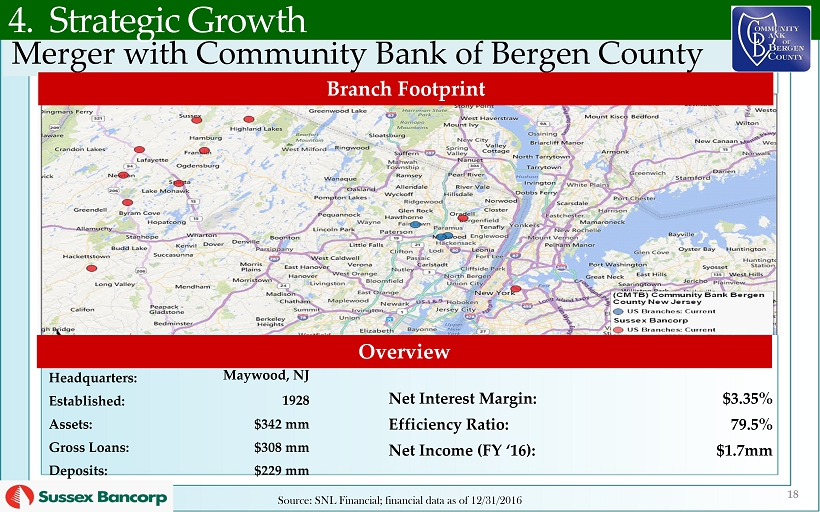
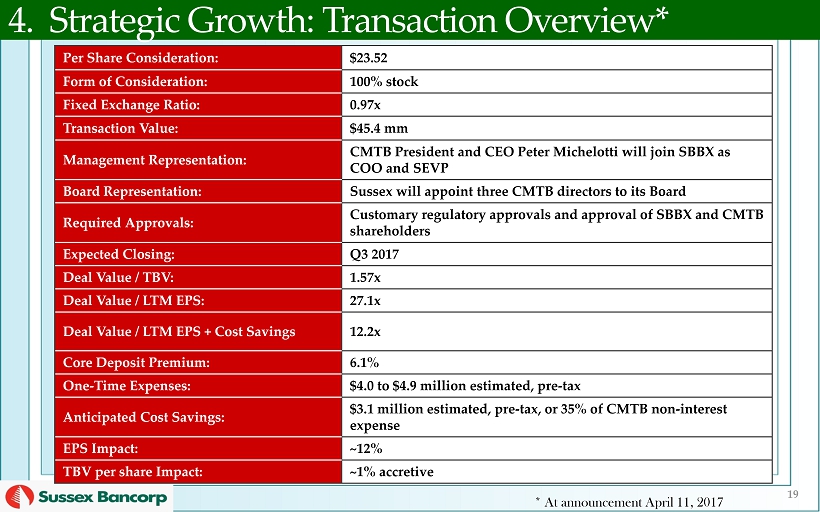
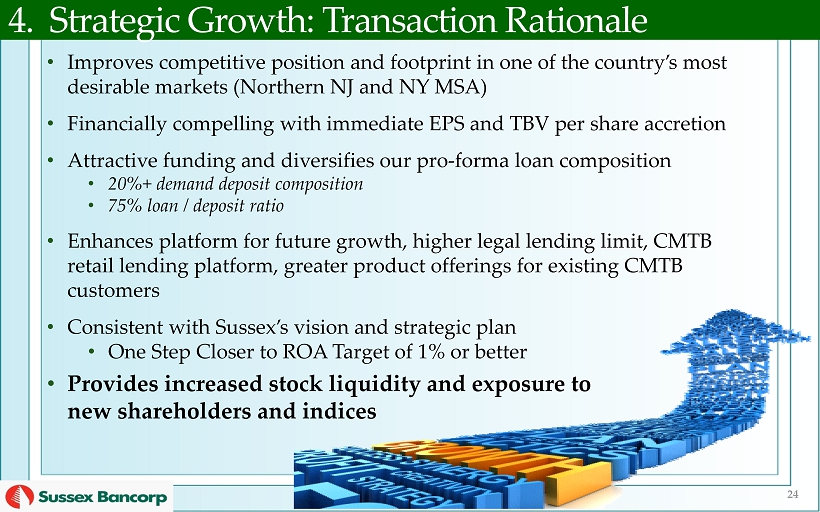
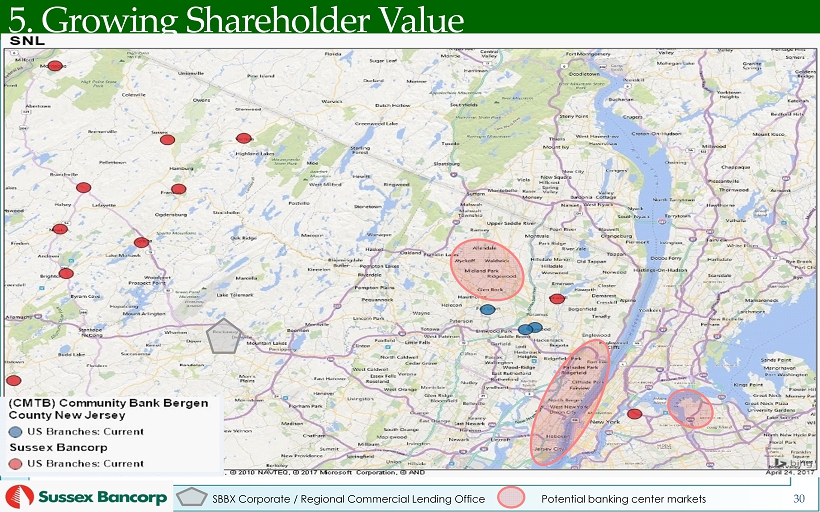
On April 11, 2017, the Company announced the signing of a definitive agreement and plan of merger pursuant to which the Company will acquire Community Bank of Bergen County, NJ (“Community”) in an all-stock transaction valued at $45.4 million (the “Merger”). Community will merge with and into Sussex Bank and each outstanding share of Community common stock will be exchanged for 0.97 shares of the Company’s common stock. Based on financials as of December 31, 2016, the combined company will have approximately $1.2 billion in assets, $925 million in gross loans and $965 million in deposits upon completion of the Merger. The Merger is expected to be completed in the third quarter of 2017. The consummation of the Merger is subject to receipt of the requisite approval of the Company's shareholders and Community`s shareholders, receipt of all required regulatory approvals, and other customary closing conditions.
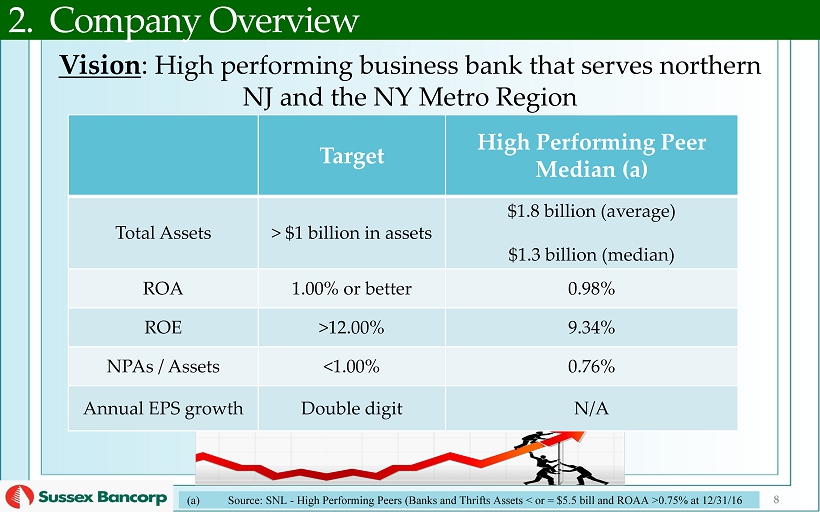
“I am very excited to report another quarter of strong financial performance for Sussex Bancorp as our business lines continue to produce outstanding results. Our growth continues to be organically generated and our production pipelines remain robust, which support future targeted growth expectations,” said Anthony Labozzetta, President and Chief Executive Officer of Sussex Bank. Mr. Labozzetta also stated, "We continue to make great progress on our journey to becoming a high performing company and with the recently announced merger of Community Bank of Bergen County, NJ, our progression should be faster."
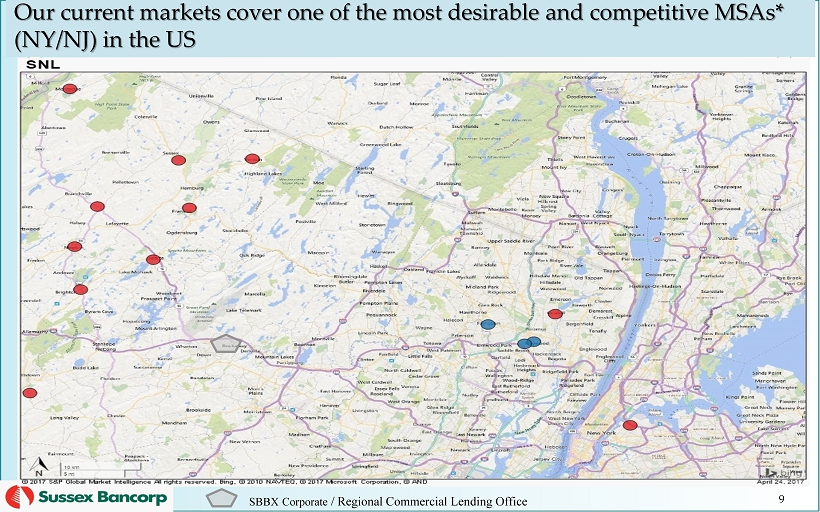
“We are looking forward to our partnership with Peter Michelotti and Community Bank of Bergen County, NJ as we continue our growth, in one of the most desirable markets in the country, and create value for all our stakeholders,” stated Mr. Labozzetta.
Financial Performance
Net Income. For the quarter ended March 31, 2017, the Company reported net income of $2.0 million, or $0.43 per basic and diluted share, as compared to net income of $1.6 million, or $0.34 per basic and diluted share, for the same period last year. The increase in net income for the quarter ended March 31, 2017 was driven by a $1.1 million, or 19.5%, increase in net interest income resulting from strong loan and deposit growth of 23.9% and 21.1%, respectively, partially offset by a $215 thousand increase in interest expense related to the $15.0 million in a private placement subordinated note entered into during the fourth quarter of 2016. The aforementioned was partly offset by an increase in non-interest expenses of $367 thousand mostly due to costs to support the Company’s growth and an increase in the provision for loan losses of $196 thousand.
The Company’s income before income taxes, including Tri-State Insurance Agency, increased $493 thousand, or 21.0%, to $2.8 million for the quarter ended March 31, 2017 as compared to $2.3 million for the same period last year. The Company’s income before income taxes, excluding Tri-State Insurance Agency, increased $508 thousand, or 33.6%.
Net Interest Income. Net interest income on a fully tax equivalent basis increased $1.2 million, or 20.2%, to $6.9 million for the first quarter of 2017, as compared to $5.7 million for the same period in 2016. The increase in net interest income was largely due to a $156.4 million, or 23.4%, increase in average interest earning assets, principally loans receivable, which increased $142.0 million, or 25.4%. Included in the increase in net interest income was $234 thousand in prepayment penalties on $14.7 million of commercial loans. The improvement in net interest income was partly offset by a decline in the net interest margin of 7 basis points to 3.39% for the first quarter of 2017, as compared to the same period in 2016. The net interest margin decrease was mostly attributed to higher interest expense related to the $15.0 million subordinated note entered into in the fourth quarter of 2016 and an increase in interest rate paid on money market deposits.
Provision for Loan Losses. Provision for loan losses increased $196 thousand to $407 thousand for the first quarter of 2017, as compared to the same period in 2016.
Non-interest Income. Non-interest income decreased $47 thousand, or 1.9%, to $2.5 million for the first quarter of 2017, as compared to the same period last year.
Non-interest Expense. The Company’s non-interest expenses increased $367 thousand, or 6.5%, to $6.0 million for the first quarter of 2017, as compared to the same period last year. The increase for the first quarter of 2017, as compared to the same period in 2016, was largely due to increases in salaries and employee benefits of $205 thousand and professional fees of $103 thousand.
The increase in salaries and employee benefits for the three months ended March 31, 2017 as compared to the same periods in 2016 was largely due to an increase in personnel to support our growth. The increase in professional fees was largely due to an increase in legal fees related to various projects.
Financial Condition
At March 31, 2017, the Company’s total assets were $872.3 million, an increase of $23.6 million, or 2.8%, as compared to total assets of $848.7 million at December 31, 2016. The increase in total assets was largely driven by growth in loans receivable of $23.5 million, or 3.4%.
Total loans receivable, net of unearned income, increased $23.5 million, or 3.4%, to $718.8 million at March 31, 2017, as compared to $695.3 million at December 31, 2016. During the three months ended March 31, 2017, the Company had $45.1 million in commercial loan production, which was partly offset by $14.7 million in commercial loan payoffs.
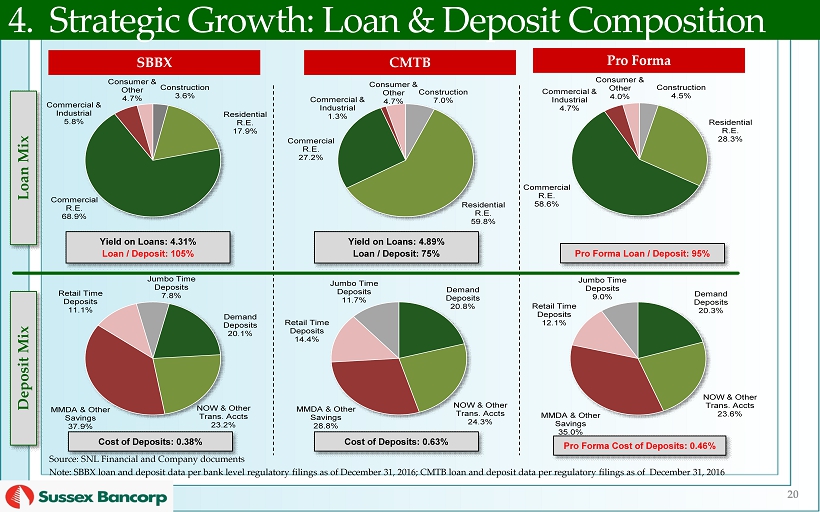
The Company’s total deposits increased $35.7 million, or 5.4%, to $696.6 million at March 31, 2017, from $660.9 million at December 31, 2016. The growth in deposits was due to increases in interest bearing deposits of $38.0 million, or 7.2%, at March 31, 2017, as compared to December 31, 2016. Included in the aforementioned deposit total is $82.6 million in deposit balances with a cost of 0.65% attributed to our branch in Oradell, New Jersey, which opened in the beginning of March 2016.
At March 31, 2017, the Company’s total stockholders’ equity was $62.4 million, an increase of $2.4 million when compared to December 31, 2016. The increase was largely due to net income for the three months ended March 31, 2017. At March 31, 2017, the leverage, Tier I risk-based capital, total risk-based capital and common equity Tier I capital ratios for the Bank were 10.41%, 12.93%, 13.91% and 12.93%, respectively, all in excess of the ratios required to be deemed “well-capitalized.”
Asset and Credit Quality
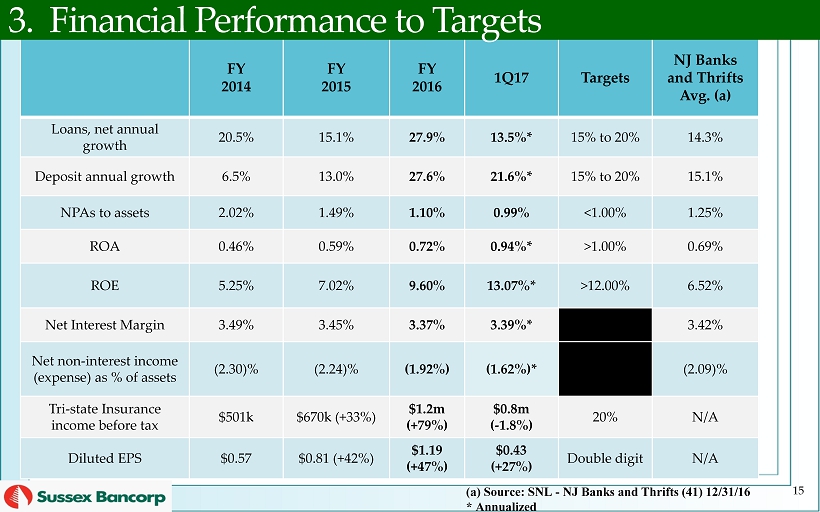
The ratio of NPAs, which include non-accrual loans, loans 90 days past due and still accruing, troubled debt restructured loans currently performing in accordance with renegotiated terms and foreclosed real estate, to total assets improved to 0.99% at March 31, 2017 from 1.10% at December 31, 2016. NPAs decreased $744 thousand, or 8.0%, to $8.6 million at March 31, 2017, as compared to $9.3 million at December 31, 2016. Non-accrual loans decreased $385 thousand, or 6.6%, to $5.4 million at March 31, 2017, as compared to $5.8 million at December 31, 2016. Loans past due 30 to 89 days totaled $2.2 million at March, 31 2017, representing an increase of $326 thousand, or 17.7%, as compared to $1.8 million at December 31, 2016. The top five non-accrual loan relationships total $3.4 million, which equates to 61.9% of total non-accrual loans and 39.1% of total NPAs at March 31, 2017. The remaining non-accrual loans at March 31, 2017 have an average loan balance of $94 thousand.
The Company continues to actively market its foreclosed real estate properties, which increased $97 thousand with the addition of one new property at $133 thousand offset by $36 thousand in write-downs to $2.5 million at March 31, 2017, as compared to $2.4 million at December 31, 2016. At March 31, 2017, the Company’s foreclosed real estate properties had an average carrying value of approximately $308 thousand per property.
The allowance for loan losses increased by $101 thousand, or 1.5%, to $6.8 million, or 0.95% of total loans, at March 31, 2017, compared to $6.7 million, or 0.96% of total loans, at December 31, 2016. The Company recorded $407 thousand in provision for loan losses for the three months ended March 31, 2017. Additionally, the Company recorded net charge-offs of $306 thousand for the quarter ended March 31, 2017, as compared to $11 thousand in net recoveries for the quarter ended March 31, 2016. The allowance for loan losses as a percentage of non-accrual loans increased to 124.8% at March 31, 2017 from 114.8% at December 31, 2016.
About Sussex Bancorp
Sussex Bancorp is the holding company for Sussex Bank, which operates through its regional offices and corporate centers in Wantage and Rockaway, New Jersey, its eleven branch offices located in Andover, Augusta, Franklin, Hackettstown, Newton, Montague, Sparta, Vernon, Oradell and Wantage, New Jersey, and Astoria, New York, and a loan production office in Oradell, New Jersey, and for the Tri-State Insurance Agency, Inc., a full service insurance agency with locations in Augusta and Oradell, New Jersey. In November 2016, SBBX earned the honor of being named one of the 50 Fastest Growing Companies in New Jersey by NJBIZ Magazine and was the highest ranked bank on the list. Anthony Labozzetta, President and Chief Executive Officer of SBBX, was named American Banker’s Community Banker of the Year in 2016 and in February 2017, was recognized by Forbes magazine as one of America’s Business Leaders in Banking. For additional information, please visit the Company’s website at www.sussexbank.com.
Forward-Looking Statements
This press release contains statements that are forward looking and are made pursuant to the “safe-harbor” provisions of the Private Securities Litigation Reform Act of 1995. Such statements may be identified by the use of words such as "expect," "estimate," “assume,” "believe," "anticipate," "will," "forecast," "plan," "project" or similar words. Such statements are based on the Company’s current expectations and are subject to certain risks and uncertainties that could cause actual results to differ materially from those projected. Factors that may cause actual results to differ materially from those contemplated by such forward-looking statements include, among others, changes to interest rates, the ability to control costs and expenses, general economic conditions, the success of the Company’s efforts to diversify its revenue base by developing additional sources of non-interest income while continuing to manage its existing fee-based business, risks associated with the quality of the Company’s assets and the ability of its borrowers to comply with repayment terms. Further information about these and other relevant risks and uncertainties may be found in the Company’s Annual Report on Form 10-K for the fiscal year ended December 31, 2016 and in subsequent filings with the Securities and Exchange Commission. The Company undertakes no obligation to publicly release the results of any revisions to those forward looking statements that may be made to reflect events or circumstances after this date or to reflect the occurrence of unanticipated events.
| Contacts: | Anthony Labozzetta, President/CEO |
Steven Fusco, SEVP/CFO
844-256-7328
SUSSEX BANCORP
SUMMARY FINANCIAL HIGHLIGHTS
(In Thousands, Except Percentages and Per Share Data)
(Unaudited)
| 3/31/2017 VS. | ||||||||||||||||||||
| 3/31/2017 | 12/31/2016 | 3/31/2016 | 3/31/2016 | 12/31/2016 | ||||||||||||||||
| BALANCE SHEET HIGHLIGHTS - Period End Balances | ||||||||||||||||||||
| Total securities | $ | 108,427 | $ | 100,229 | $ | 93,339 | 16.2 | % | 8.2 | % | ||||||||||
| Total loans | 718,800 | 695,257 | 580,051 | 23.9 | % | 3.4 | % | |||||||||||||
| Allowance for loan losses | (6,797 | ) | (6,696 | ) | (5,812 | ) | 16.9 | % | 1.5 | % | ||||||||||
| Total assets | 872,282 | 848,728 | 716,772 | 21.7 | % | 2.8 | % | |||||||||||||
| Total deposits | 696,576 | 660,921 | 575,300 | 21.1 | % | 5.4 | % | |||||||||||||
| Total borrowings and junior subordinated debt | 108,641 | 123,645 | 80,317 | 35.3 | % | (12.1 | )% | |||||||||||||
| Total shareholders' equity | 62,422 | 60,072 | 55,682 | 12.1 | % | 3.9 | % | |||||||||||||
| FINANCIAL DATA - QUARTER ENDED: | ||||||||||||||||||||
| Net interest income (tax equivalent) (a) | $ | 6,906 | $ | 6,704 | $ | 5,745 | 20.2 | % | 3.0 | % | ||||||||||
| Provision for loan losses | 407 | 237 | 211 | 92.9 | % | 71.7 | % | |||||||||||||
| Total other income | 2,477 | 1,705 | 2,524 | (1.9 | )% | 45.3 | % | |||||||||||||
| Total other expenses | 5,977 | 5,726 | 5,610 | 6.5 | % | 4.4 | % | |||||||||||||
| Income before provision for income taxes (tax equivalent) | 2,999 | 2,446 | 2,448 | 22.5 | % | 22.6 | % | |||||||||||||
| Provision for income taxes | 831 | 806 | 775 | 7.2 | % | 3.1 | % | |||||||||||||
| Taxable equivalent adjustment (a) | 157 | 117 | 99 | 58.6 | % | 34.2 | % | |||||||||||||
| Net income | $ | 2,011 | $ | 1,523 | $ | 1,574 | 27.8 | % | 32.0 | % | ||||||||||
| Net income per common share - Basic | $ | 0.43 | $ | 0.33 | $ | 0.34 | 26.5 | % | 30.3 | % | ||||||||||
| Net income per common share - Diluted | $ | 0.43 | $ | 0.32 | $ | 0.34 | 26.5 | % | 34.4 | % | ||||||||||
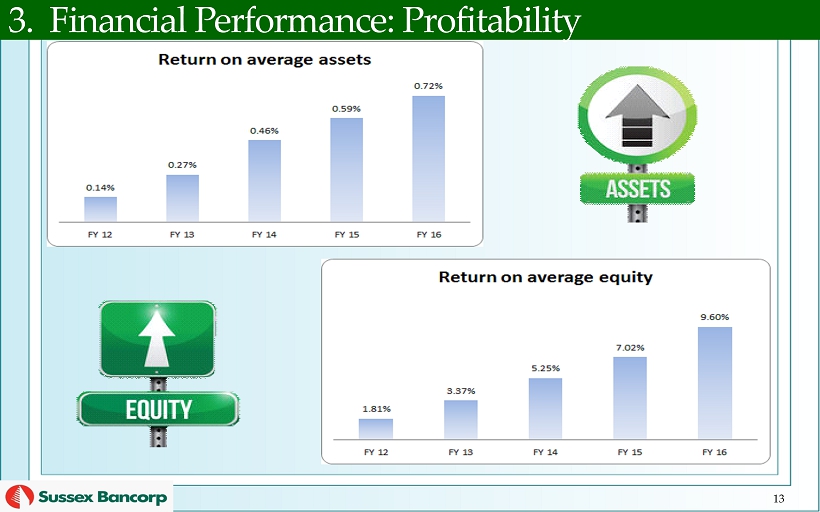
| Return on average assets | 0.94 | % | 0.74 | % | 0.90 | % | 4.3 | % | 27.3 | % | ||||||||||
| Return on average equity | 13.07 | % | 10.14 | % | 11.38 | % | 14.8 | % | 28.9 | % | ||||||||||
| Efficiency ratio (b) | 64.78 | % | 69.05 | % | 68.67 | % | (5.7 | )% | (6.2 | )% | ||||||||||
| Net interest margin (tax equivalent) | 3.39 | % | 3.35 | % | 3.46 | % | (2.0 | )% | 1.2 | % | ||||||||||
| Avg. interest earning assets/Avg. interest bearing liabilities | 1.23 | 1.25 | 1.23 | 0.2 | % | (1.7 | )% | |||||||||||||
| SHARE INFORMATION: | ||||||||||||||||||||
| Book value per common share | $ | 13.04 | $ | 12.67 | $ | 11.91 | 9.5 | % | 3.0 | % | ||||||||||
| Tangible book value per common share | 12.46 | 12.08 | 11.31 | 10.2 | % | 3.1 | % | |||||||||||||
| Outstanding shares- period ending | 4,785,159 | 4,741,068 | 4,675,976 | 2.3 | % | 0.9 | % | |||||||||||||
| Average diluted shares outstanding (year to date) | 4,727,333 | 4,651,108 | 4,606,426 | 2.6 | % | 1.6 | % | |||||||||||||
| CAPITAL RATIOS: | ||||||||||||||||||||
| Total equity to total assets | 7.16 | % | 7.08 | % | 7.77 | % | (7.9 | )% | 1.1 | % | ||||||||||
| Leverage ratio (c) | 10.41 | % | 10.41 | % | 9.18 | % | 13.4 | % | - | % | ||||||||||
| Tier 1 risk-based capital ratio (c) | 12.93 | % | 12.87 | % | 11.29 | % | 14.5 | % | 0.5 | % | ||||||||||
| Total risk-based capital ratio (c) | 13.91 | % | 13.86 | % | 12.31 | % | 13.0 | % | 0.4 | % | ||||||||||
| Common equity Tier 1 capital ratio (c) | 12.93 | % | 12.87 | % | 11.29 | % | 14.5 | % | 0.5 | % | ||||||||||
| ASSET QUALITY: | ||||||||||||||||||||
| Non-accrual loans | $ | 5,448 | $ | 5,833 | $ | 5,353 | 1.8 | % | (6.6 | )% | ||||||||||
| Loans 90 days past due and still accruing | 104 | 468 | - | - | % | (77.8 | )% | |||||||||||||
| Troubled debt restructured loans ("TDRs") (d) | 587 | 679 | 1,268 | (53.7 | )% | (13.5 | )% | |||||||||||||
| Foreclosed real estate | 2,464 | 2,367 | 3,328 | (26.0 | )% | 4.1 | % | |||||||||||||
| Non-performing assets ("NPAs") | $ | 8,603 | $ | 9,347 | $ | 9,949 | (13.5 | )% | (8.0 | )% | ||||||||||
| Foreclosed real estate, criticized and classified assets | $ | 20,494 | $ | 20,450 | $ | 20,433 | 0.3 | % | 0.2 | % | ||||||||||
| Loans past due 30 to 89 days | $ | 2,166 | $ | 1,840 | $ | 4,841 | (55.3 | )% | 17.7 | % | ||||||||||
| (Recoveries) Charge-offs, net (quarterly) | $ | 306 | $ | (128 | ) | $ | (11 | ) | (2,881.8 | )% | (339.1 | )% | ||||||||
| (Recoveries) Charge-offs, net as a % of average loans (annualized) | 0.17 | % | (0.08 | )% | (0.01 | )% | (2,319.1 | )% | (331.6 | )% | ||||||||||
| Non-accrual loans to total loans | 0.76 | % | 0.84 | % | 0.92 | % | (17.9 | )% | (9.7 | )% | ||||||||||
| NPAs to total assets | 0.99 | % | 1.10 | % | 1.39 | % | (28.9 | )% | (10.4 | )% | ||||||||||
| NPAs excluding TDR loans (d) to total assets | 0.92 | % | 1.02 | % | 1.21 | % | (24.1 | )% | (10.0 | )% | ||||||||||
| Non-accrual loans to total assets | 0.62 | % | 0.69 | % | 0.75 | % | (16.4 | )% | (9.1 | )% | ||||||||||
| Allowance for loan losses as a % of non-accrual loans | 124.76 | % | 114.80 | % | 108.57 | % | 14.9 | % | 8.7 | % | ||||||||||
| Allowance for loan losses to total loans | 0.95 | % | 0.96 | % | 1.00 | % | (5.6 | )% | (1.8 | )% | ||||||||||
| (a) | Full taxable equivalent basis, using a 39% effective tax rate and adjusted for TEFRA (Tax and Equity Fiscal Responsibility Act) interest expense disallowance | |
| (b) | Efficiency ratio calculated non-interest expense divided by net interest income plus non-interest income | |
| (c) | Sussex Bank capital ratios | |
| (d) | Troubled debt restructured loans currently performing in accordance with renegotiated terms |
SUSSEX BANCORP
CONSOLIDATED BALANCE SHEETS
(Dollars In Thousands)
| ASSETS | March 31, 2017 | December 31, 2016 | ||||||
| Cash and due from banks | $ | 3,051 | $ | 2,847 | ||||
| Interest-bearing deposits with other banks | 4,637 | 11,791 | ||||||
| Cash and cash equivalents | 7,688 | 14,638 | ||||||
| Interest bearing time deposits with other banks | 100 | 100 | ||||||
| Securities available for sale, at fair value | 99,797 | 88,611 | ||||||
| Securities held to maturity | 8,630 | 11,618 | ||||||
| Federal Home Loan Bank Stock, at cost | 4,269 | 5,106 | ||||||
| Loans receivable, net of unearned income | 718,800 | 695,257 | ||||||
| Less: allowance for loan losses | 6,797 | 6,696 | ||||||
| Net loans receivable | 712,003 | 688,561 | ||||||
| Foreclosed real estate | 2,464 | 2,367 | ||||||
| Premises and equipment, net | 8,505 | 8,728 | ||||||
| Accrued interest receivable | 2,006 | 2,058 | ||||||
| Goodwill | 2,820 | 2,820 | ||||||
| Bank-owned life insurance | 16,638 | 16,532 | ||||||
| Other assets | 7,362 | 7,589 | ||||||
| Total Assets | $ | 872,282 | $ | 848,728 | ||||
| LIABILITIES AND STOCKHOLDERS' EQUITY | ||||||||
| Liabilities: | ||||||||
| Deposits: | ||||||||
| Non-interest bearing | $ | 130,130 | $ | 132,434 | ||||
| Interest bearing | 566,446 | 528,487 | ||||||
| Total Deposits | 696,576 | 660,921 | ||||||
| Borrowings | 80,800 | 95,805 | ||||||
| Accrued interest payable and other liabilities | 4,643 | 4,090 | ||||||
| Subordinated debentures | 27,841 | 27,840 | ||||||
| Total Liabilities | 809,860 | 788,656 | ||||||
| Total Stockholders' Equity | 62,422 | 60,072 | ||||||
| Total Liabilities and Stockholders' Equity | $ | 872,282 | $ | 848,728 | ||||
SUSSEX BANCORP
CONSOLIDATED STATEMENTS OF INCOME AND COMPREHENSIVE INCOME
(Dollars In Thousands Except Per Share Data)
(Unaudited)
| Three Months Ended March 31, | ||||||||
| 2017 | 2016 | |||||||
| INTEREST INCOME | ||||||||
| Loans receivable, including fees | $ | 7,598 | $ | 6,145 | ||||
| Securities: | ||||||||
| Taxable | 341 | 376 | ||||||
| Tax-exempt | 313 | 201 | ||||||
| Interest bearing deposits | 16 | 4 | ||||||
| Total Interest Income | 8,268 | 6,726 | ||||||
| INTEREST EXPENSE | ||||||||
| Deposits | 717 | 575 | ||||||
| Borrowings | 481 | 437 | ||||||
| Junior subordinated debentures | 321 | 68 | ||||||
| Total Interest Expense | 1,519 | 1,080 | ||||||
| Net Interest Income | 6,749 | 5,646 | ||||||
| PROVISION FOR LOAN LOSSES | 407 | 211 | ||||||
| Net Interest Income after Provision for Loan Losses | 6,342 | 5,435 | ||||||
| OTHER INCOME | ||||||||
| Service fees on deposit accounts | 253 | 225 | ||||||
| ATM and debit card fees | 180 | 187 | ||||||
| Bank owned life insurance | 106 | 76 | ||||||
| Insurance commissions and fees | 1,747 | 1,721 | ||||||
| Investment brokerage fees | 3 | 27 | ||||||
| Gain on securities transactions | 107 | 167 | ||||||
| (Loss) on disposal of fixed assets | - | (13 | ) | |||||
| Other | 81 | 134 | ||||||
| Total Other Income | 2,477 | 2,524 | ||||||
| OTHER EXPENSES | ||||||||
| Salaries and employee benefits | 3,558 | 3,353 | ||||||
| Occupancy, net | 500 | 424 | ||||||
| Data processing | 557 | 549 | ||||||
| Furniture and equipment | 240 | 233 | ||||||
| Advertising and promotion | 106 | 105 | ||||||
| Professional fees | 277 | 174 | ||||||
| Director fees | 107 | 59 | ||||||
| FDIC assessment | 51 | 120 | ||||||
| Insurance | 66 | 73 | ||||||
| Stationary and supplies | 32 | 52 | ||||||
| Loan collection costs | 24 | 32 | ||||||
| Expenses and write-downs related to foreclosed real estate | 45 | 75 | ||||||
| Other | 414 | 361 | ||||||
| Total Other Expenses | 5,977 | 5,610 | ||||||
| Income before Income Taxes | 2,842 | 2,349 | ||||||
| INCOME TAX EXPENSE | 831 | 775 | ||||||
| Net Income | $ | 2,011 | $ | 1,574 | ||||
| OTHER COMPREHENSIVE INCOME (LOSS): | ||||||||
| Unrealized gains on available for sale securities arising during the period | $ | 676 | $ | 985 | ||||
| Fair value adjustments on derivatives | 40 | (400 | ) | |||||
| Reclassification adjustment for net gain on securities transactions included in net income | (107 | ) | (167 | ) | ||||
| Income tax related to items of other comprehensive income (loss) | (244 | ) | (167 | ) | ||||
| Other comprehensive income, net of income taxes | 365 | 251 | ||||||
| Comprehensive income | $ | 2,376 | $ | 1,825 | ||||
| EARNINGS PER SHARE | ||||||||
| Basic | $ | 0.43 | $ | 0.34 | ||||
| Diluted | $ | 0.43 | $ | 0.34 | ||||
SUSSEX BANCORP
COMPARATIVE AVERAGE BALANCES AND AVERAGE INTEREST RATES
(Dollars In Thousands)
(Unaudited)
| Three Months Ended March 31, | ||||||||||||||||||||||||
| 2017 | 2016 | |||||||||||||||||||||||
| Average | Average | Average | Average | |||||||||||||||||||||
| Balance | Interest | Rate (2) | Balance | Interest | Rate (2) | |||||||||||||||||||
| Earning Assets: | ||||||||||||||||||||||||
| Securities: | ||||||||||||||||||||||||
| Tax exempt (3) | $ | 47,443 | $ | 470 | 4.02 | % | $ | 30,236 | $ | 300 | 3.99 | % | ||||||||||||
| Taxable | 62,767 | 341 | 2.20 | % | 69,870 | 376 | 2.16 | % | ||||||||||||||||
| Total securities | 110,210 | 811 | 2.98 | % | 100,106 | 676 | 2.72 | % | ||||||||||||||||
| Total loans receivable (1) (4) | 701,862 | 7,598 | 4.39 | % | 559,879 | 6,145 | 4.41 | % | ||||||||||||||||
| Other interest-earning assets | 12,940 | 16 | 0.50 | % | 8,638 | 4 | 0.19 | % | ||||||||||||||||
| Total earning assets | 825,012 | 8,425 | 4.14 | % | 668,623 | 6,825 | 4.11 | % | ||||||||||||||||
| Non-interest earning assets | 41,062 | 38,701 | ||||||||||||||||||||||
| Allowance for loan losses | (6,723 | ) | (5,659 | ) | ||||||||||||||||||||
| Total Assets | $ | 859,351 | $ | 701,665 | ||||||||||||||||||||
| Sources of Funds: | ||||||||||||||||||||||||
| Interest bearing deposits: | ||||||||||||||||||||||||
| NOW | $ | 177,107 | $ | 119 | 0.27 | % | $ | 140,031 | $ | 71 | 0.20 | % | ||||||||||||
| Money market | 73,935 | 124 | 0.68 | % | 29,951 | 28 | 0.38 | % | ||||||||||||||||
| Savings | 137,742 | 71 | 0.21 | % | 138,528 | 70 | 0.20 | % | ||||||||||||||||
| Time | 166,670 | 403 | 0.98 | % | 146,344 | 406 | 1.12 | % | ||||||||||||||||
| Total interest bearing deposits | 555,454 | 717 | 0.52 | % | 454,854 | 575 | 0.51 | % | ||||||||||||||||
| Borrowed funds | 85,919 | 481 | 2.27 | % | 75,965 | 437 | 2.31 | % | ||||||||||||||||
| Subordinated debentures | 27,840 | 321 | 4.68 | % | 12,887 | 68 | 2.12 | % | ||||||||||||||||
| Total interest bearing liabilities | 669,213 | 1,519 | 0.92 | % | 543,706 | 1,080 | 0.80 | % | ||||||||||||||||
| Non-interest bearing liabilities: | ||||||||||||||||||||||||
| Demand deposits | 124,991 | 98,264 | ||||||||||||||||||||||
| Other liabilities | 3,591 | 4,381 | ||||||||||||||||||||||
| Total non-interest bearing liabilities | 128,582 | 102,645 | ||||||||||||||||||||||
| Stockholders' equity | 61,556 | 55,314 | ||||||||||||||||||||||
| Total Liabilities and Stockholders' Equity | $ | 859,351 | $ | 701,665 | ||||||||||||||||||||
| Net Interest Income and Margin (5) | 6,906 | 3.39 | % | 5,745 | 3.46 | % | ||||||||||||||||||
| Tax-equivalent basis adjustment | (157 | ) | (99 | ) | ||||||||||||||||||||
| Net Interest Income | $ | 6,749 | $ | 5,646 | ||||||||||||||||||||
| (1) | Includes loan fee income | |
| (2) | Average rates on securities are calculated on amortized costs | |
| (3) | Full taxable equivalent basis, using a 39% effective tax rate and adjusted for TEFRA (Tax and Equity Fiscal Responsibility Act) interest expense disallowance | |
| (4) | Loans outstanding include non-accrual loans | |
| (5) | Represents the difference between interest earned and interest paid, divided by average total interest-earning assets |
SUSSEX BANCORP
Segment Reporting
(Dollars In Thousands)
(Unaudited)
| Three Months Ended March 31, 2017 | Three Months Ended March 31, 2016 | |||||||||||||||||||||||
| Banking and | Banking and | |||||||||||||||||||||||
| Financial | Insurance | Financial | Insurance | |||||||||||||||||||||
| Services | Services | Total | Services | Services | Total | |||||||||||||||||||
| Net interest income from external sources | $ | 6,749 | $ | - | $ | 6,749 | $ | 5,646 | $ | - | $ | 5,646 | ||||||||||||
| Other income from external sources | 730 | 1,747 | 2,477 | 786 | 1,738 | 2,524 | ||||||||||||||||||
| Depreciation and amortization | 266 | 6 | 272 | 252 | 6 | 258 | ||||||||||||||||||
| Income before income taxes | 2,022 | 820 | 2,842 | 1,514 | 835 | 2,349 | ||||||||||||||||||
| Income tax expense (1) | 503 | 328 | 831 | 441 | 334 | 775 | ||||||||||||||||||
| Total assets | 865,832 | 6,450 | 872,282 | 709,893 | 6,879 | 716,772 | ||||||||||||||||||
| (1) | Calculated at statutory tax rate of 40% for the insurance services segment |


